appendix d st. louis air quality management plan
TRANSCRIPT

Appendix D
St. Louis Air Quality Management Plan
1
St. Louis
Air Quality Management Plan
May 14, 2010
Missouri Department of Natural Resources
Illinois Environmental Protection Agency
2
Air Quality Management Plan
For the St. Louis area - Missouri and Illinois 5/14/10
Table of Contents
Executive Summary 3
Section 1 Overview 6
Section 2 Air Quality Goals/Community Outreach 9
Section 3 Air Quality Issues/NAAQS/Air Toxics 14
Section 4 Current Emissions Assessment/Existing Control Strategies 26
Section 5 Local Activities in Support of Air Quality 30
Section 6 Strategies for Managing Future Emissions 31
Section 7 Implementation 34
Section 8 Human Health Indicators/Re-evaluation of AQMP Process 39
Section 9 Looking Beyond Current Requirements 42
Appendix 1 Inventory of Local Activities in Support of Air Quality 44
Figures
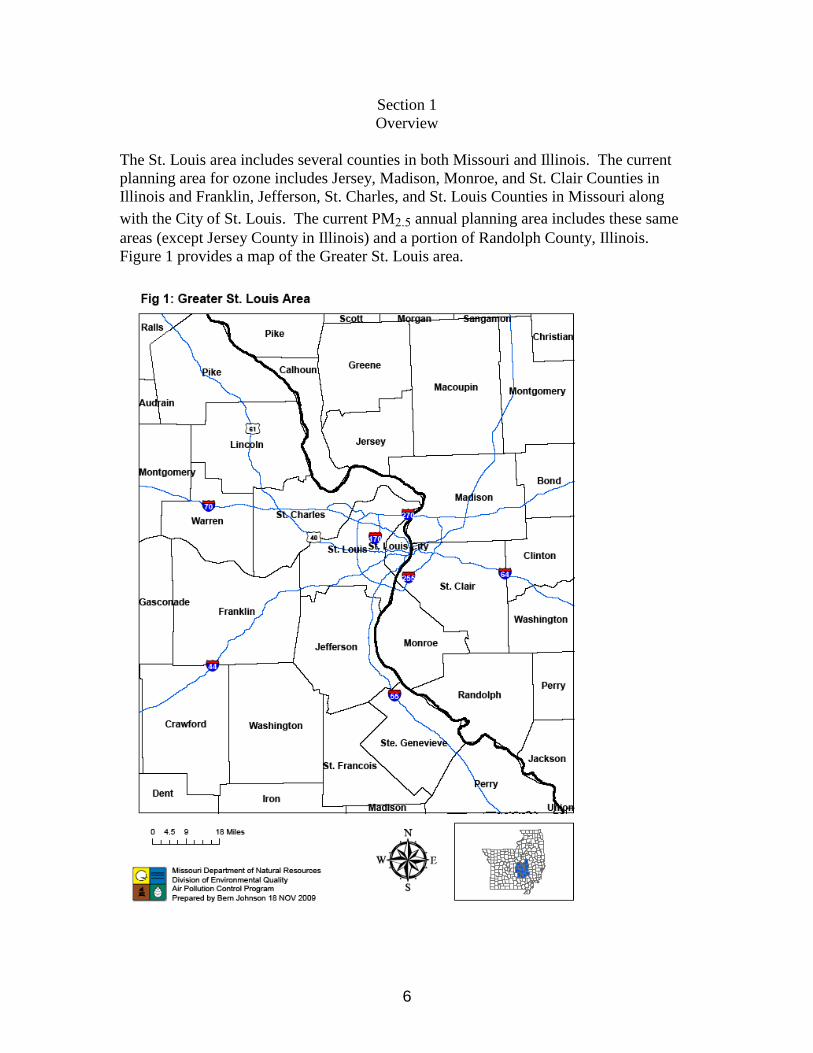
Figure 1 Map of Greater St. Louis Area
Figure 2 East-West Gateway Environmental Justice Map
Figure 3 St Louis Core Environmental Justice Map
Figure 4 Nonattainment Area for Ozone and PM 2.5
Figure 5 St. Louis Ozone Monitoring Sites
Figure 6 Ozone Design Values – 2000-2009
Figure 7 St. Louis Lead Nonattainment Areas
Figure 8 St. Louis Area Air Toxics Monitoring Sites
Figure 9 St. Louis 1997 8-hour Ozone Modeling Grid Domains
Figure 10 St. Louis Annual PM2.5 Modeling Grid Domains
List of Tables
Table 1 Health Effects
Table 2 2002 St. Louis Area Emission Inventory
Table 3 2009 St. Louis Area Emission Inventory
Table 4 Ongoing NAAQS Reviews
Table 5 Select Counties; Number of Days with Maximum 8-hour average Ozone
Concentration Over the 1997 NAAQS during 2004-2006
Table 6 Select Counties; Number of Days with PM2.5 Levels over the NAAQS
during 2004-2006
Table 7 Select Missouri Counties; Number of Asthma Hospitalizations during
2003-2005
Table 8 Select Missouri Counties; Number of Heart Attack Hospitalizations during
2003-2005
3
Executive Summary
The Missouri Department of Natural Resources and the Illinois Environmental Protection
Agency have committed to implement an innovative air quality management paradigm
for the St. Louis area. The two agencies have agreed to continue to work with the East-
West Gateway Council of Government’s (EWGCOG) Air Quality Advisory Committee,
comprising a partnership of “3”. This new philosophy involves the creation of this Air
Quality Management Plan (AQMP3 – to reflect the three partners) document to use as the
mechanism for the development of state-specific control plans in the future. The St.
Louis AQMP3 process is designed to address air quality goals including nonattainment
and maintenance of criteria pollutant standards and risk reductions of certain air toxic
pollutants with an emphasis on community involvement in the processes for both states.
The focus of the AQMP3 is to move away from single-pollutant planning towards multi-
pollutant strategies to address all future air quality needs. In the past, both states have
worked together to produce technical information necessary to develop air quality control
plans for ground-level ozone and fine particulates, separately. These combined efforts
have focused on the creation of air quality emission inventory and modeling analyses to
better inform control strategy decisions for the area. The coordination of this formal
workgroup process has been conducted by the EWGCOG (the metropolitan planning
organization for St. Louis). The AQMP3 envisions local community involvement will
continue to occur through the current workgroup process.
The goals of this St. Louis AQMP3 are:
(1) the completion of all required Clean Air Act submittals for compliance with
the National Ambient Air Quality Standards (NAAQS) in St. Louis preferably
using one air quality planning exercise for multiple pollutants under a combined
State Implementation Plan (SIP);
(2) the inclusion of air toxics exposure as an important metric for consideration of
alternative control requirements for all NAAQS;
(3) the incorporation of environmental justice and extensive community
involvement in the decision-making process including the regulated and
environmental communities; and
(4) consideration of other ancillary air quality issues in the development of the
SIP including smart growth/transportation, energy issues, and climate change.
The participants in the development of the St. Louis AQMP3 agree that multi-pollutant
planning has several benefits over the current approach. These include the formal
consideration of co-benefits for all pollutants from specific control strategies, more
efficient use of the limited human resources to perform the complex air quality analyses
and rulemakings necessary for the airshed, increased consideration of the ancillary issues
above in the decision-making process, quicker improvements in overall air quality, and
increased certainty for the regulated community when dealing with multiple pollutant
controls.
4
However, there are several issues that need to be addressed as part of the AQMP3 to
ensure successful implementation of the plan. To address the ever-changing nature of air
quality standards and goals, the AQMP3 includes a mechanism to address changing
pollutants of interest and attempt to adapt to changes in plan requirements through a
process called adaptive management. In general, adaptive management provides a
framework for setting goals, developing priorities, implementing management actions,
evaluating results and adjusting to lessons learned in an iterative manner.
One of the most significant issues is the prioritization of air quality problems to address
and the manner in which “trade offs” are evaluated. After identification of the current air
quality problems in St. Louis and with an understanding of potential future air quality
goals and community initiatives, the AQMP3 includes an approach to prioritization and
the mechanism each state will use to identify necessary emission reductions to fulfill St.
Louis air quality goals. In some instances, trade offs may occur due to confounding
emission reduction strategies (e.g. increased NOx emissions when controlling VOC
emissions through incineration). The decisions related to trade offs are an important
component of the AQMP3 and the strategy for this issue is addressed in the plan.
Another important issue is flexibility from USEPA to administer this new approach. Due
to the statutory timeframes mandated in the Clean Air Act, the pollutant-specific plans
have very tight submittal deadlines. This new multi-pollutant approach could require
additional development time to ensure all pollutants are addressed appropriately. At this
time, the deadlines for submittal of any new plans are unknown and this issue may or
may not be important for St. Louis. However, it is important to recognize this important
problem as both states approach implementation of the AQMP3.
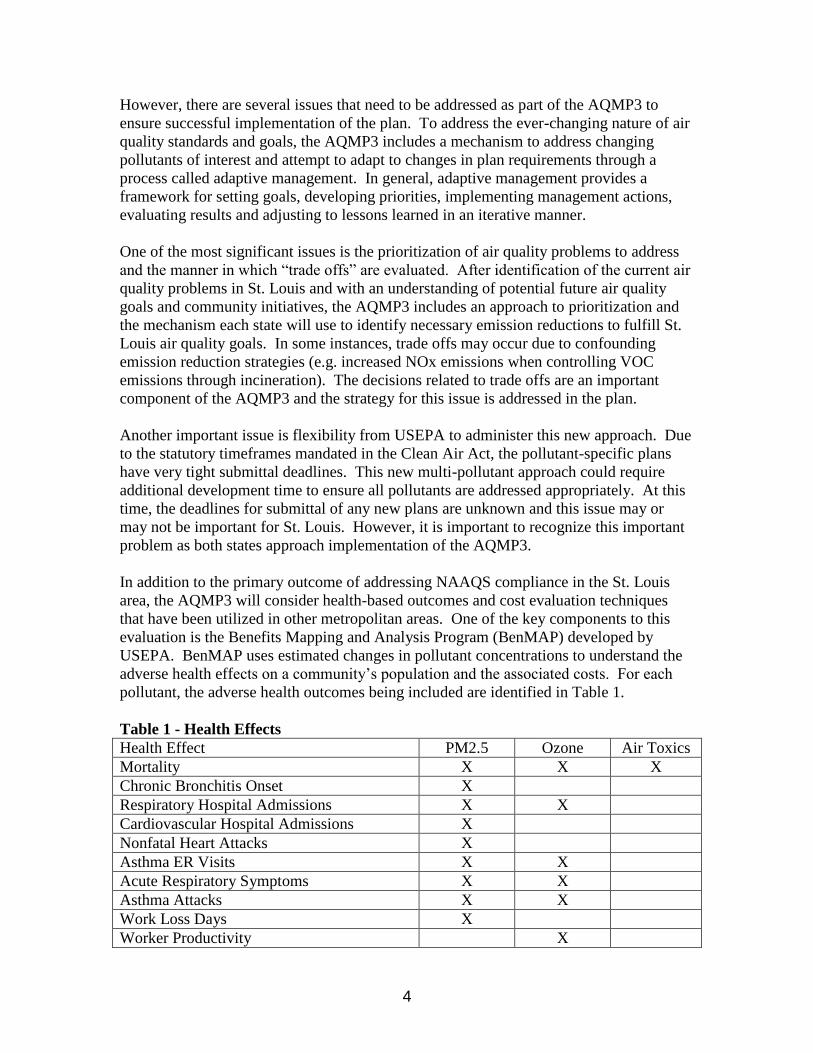
In addition to the primary outcome of addressing NAAQS compliance in the St. Louis
area, the AQMP3 will consider health-based outcomes and cost evaluation techniques
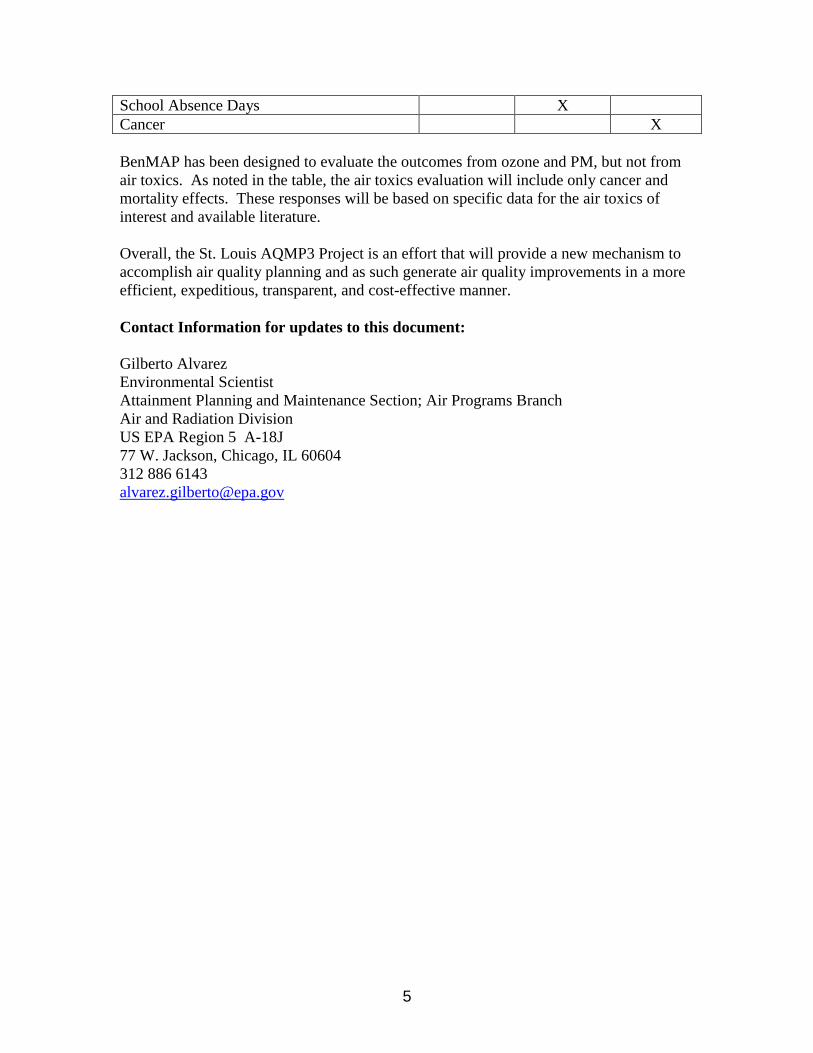
that have been utilized in other metropolitan areas. One of the key components to this
evaluation is the Benefits Mapping and Analysis Program (BenMAP) developed by
USEPA. BenMAP uses estimated changes in pollutant concentrations to understand the
adverse health effects on a community’s population and the associated costs. For each
pollutant, the adverse health outcomes being included are identified in Table 1.
Table 1 - Health Effects
Health Effect PM2.5 Ozone Air Toxics
Mortality X X X
Chronic Bronchitis Onset X
Respiratory Hospital Admissions X X
Cardiovascular Hospital Admissions X
Nonfatal Heart Attacks X
Asthma ER Visits X X
Acute Respiratory Symptoms X X
Asthma Attacks X X
Work Loss Days X
Worker Productivity X
5
School Absence Days X
Cancer X
BenMAP has been designed to evaluate the outcomes from ozone and PM, but not from
air toxics. As noted in the table, the air toxics evaluation will include only cancer and
mortality effects. These responses will be based on specific data for the air toxics of
interest and available literature.
Overall, the St. Louis AQMP3 Project is an effort that will provide a new mechanism to
accomplish air quality planning and as such generate air quality improvements in a more
efficient, expeditious, transparent, and cost-effective manner.
Contact Information for updates to this document:
Gilberto Alvarez
Environmental Scientist
Attainment Planning and Maintenance Section; Air Programs Branch
Air and Radiation Division
US EPA Region 5 A-18J
77 W. Jackson, Chicago, IL 60604
312 886 6143
6
Section 1
Overview
The St. Louis area includes several counties in both Missouri and Illinois. The current
planning area for ozone includes Jersey, Madison, Monroe, and St. Clair Counties in
Illinois and Franklin, Jefferson, St. Charles, and St. Louis Counties in Missouri along
with the City of St. Louis. The current PM2.5 annual planning area includes these same
areas (except Jersey County in Illinois) and a portion of Randolph County, Illinois.
Figure 1 provides a map of the Greater St. Louis area.
7
According to a 2007 public opinion survey of St. Louis area residents by the local chapter
of the American Lung Association, 68% of the respondents replied that poor air quality
was a “very serious” or “mostly serious” problem. Additionally, 64% of survey
participants agreed that air quality has a negative health impact, especially on people with
respiratory problems. The Clean Air Act is intended to address the negative impacts of
air pollution.
Implementation of Clean Air Act regulations is primarily the responsibility of air
programs within state environmental agencies, working with the United States
Environmental Protection Agency (USEPA). The respective air programs within the
Missouri Department of Natural Resources and the Illinois Environmental Protection
Agency have been working together for years to address air quality issues in the St. Louis
area.
Based in part on recommendations from the 2004 National Research Council report “Air
Quality Management in the United States”, a coalition of state and local officials,
working with their federal counterparts and the East-West Gateway Council of
Governments (EWGCOG) have attempted to consolidate and improve the traditional
approach towards air quality management within the St. Louis area. The result of these
collaborations over a two year period (2007-2009) is this Air Quality Management Plan
(the AQMP3) for St. Louis.
The focus of the AQMP3 is to move away from single-pollutant planning towards multi-
pollutant strategies to assess all future air quality needs. It is designed to address air
quality goals including nonattainment and maintenance of criteria pollutant standards and
risk reductions of certain Air Toxics with an emphasis on community involvement in the
processes for both Missouri and Illinois.
A St. Louis-specific team was formed as a part of a pilot project initiated by the USEPA
(additional pilot areas include North Carolina and New York). After an initial pilot kick
off meeting involving all three pilot areas hosted by USEPA in Research Triangle Park,
North Carolina in September, 2007, the team began meeting in October, 2007.
Information and ideas were exchanged mainly via conference calls, but also by attending
various EWGCOG Air Quality Advisory Committee meetings to seek input. The original
St. Louis AQMP3 Team has changed since the project started in the fall of 2007. The
current make up of the team is listed below.
St. Louis Area Air Quality Management Plan Pilot Project (AQMP3) Team:
Jeff Bennett Missouri Department of Natural Resources
Rob Kaleel Illinois Environmental Protection Agency
Jeff Sprague Illinois Environmental Protection Agency
Mike Coulson East-West Gateway Council of Governments – St. Louis, MO-IL
Carol Lawrence East-West Gateway Council of Governments – St. Louis, MO-IL
Tyler Harris City of St. Louis Air Pollution Control
8
Susannah Fuchs American Lung Association of the Central States
Tom Rosendahl USEPA Office of Air Quality Planning and Standards
Gwen Yoshimura USEPA Region 7
Randy Robinson USEPA Region 5
Gilberto Alvarez USEPA Region 5
The team produced a number of “milestone” documents in support of the pilot project.
These include the AQMP3 Workplan [2/27/08], Current Status of Air Quality and Air
Quality Management in the St. Louis Area (AQMP Lay of the Land Document),
Missouri’s State Innovation Grant Workplan, and AQMP3 Conceptual Model [5/29/09].
The Lay of the Land and Conceptual model documents can be found on the USEPA
Office of Air Quality Planning and Standards (OAQPS) web site.
http://www.epa.gov/air/aqmp/
9
Section 2
Air Quality Goals/Community Outreach
The ultimate goal of this process is the development and implementation of an Air
Quality Management Plan for the St. Louis area. The AQMP3 is a new mechanism for
multi-pollutant air quality planning to be utilized in a bi-state metropolitan complex.
These cooperative new plans (one for Missouri and one for Illinois) that will grow out of
this process will be used to develop the SIPs for criteria pollutants in violation of
NAAQS while considering air toxics exposure to the public and other community
concerns. Alternatively, as the AQMP3 implementation occurs, it could someday lead to
the submission of a single plan for multiple pollutants (e.g. ozone and PM2.5) that have
similar sources and timelines. The AQMP3 will not replace existing permitting,
enforcement or SIP requirements.
This single plan outcome would be a significant step forward in the AQMP3 process and
needs to be coordinated closely with the USEPA OAQPS and the respective regional
offices. Based on this new paradigm, the states will continue to work closely with
stakeholders (industry, environmental groups, local air agencies, the metropolitan
planning organization, and concerned citizens) to ensure a transparent and informed
public process for air quality management including control strategy decisions. The
current Air Quality Advisory Committee inside the EWGCOC (local MPO) has served as
the primary means for this interaction. Meetings of this group will continue as part of the
AQMP3 development and implementation process along with enhanced outreach to the
community. This outreach will include a series of meetings to identify air quality
priorities for the area including input from stakeholders regarding any policy-related
issues, community developments, and/or environmental justice issues.
The AQMP3 will address criteria air pollutants that have been or, in the future, will be
nonattainment for counties in the St. Louis area along with toxic exposure to pollutants
identified in the St. Louis Community Air Project Air Toxics Risk Characterization (e.g.,
USEPA June 2005). This report was a direct result of the region’s attempt to address
environmental concerns related to air toxics in St. Louis. This report identified the
following air toxics pollutants of concern for the St. Louis area: acetaldehyde, arsenic
compounds, benzene, chromium compounds, formaldehyde, and diesel particulate matter.
These pollutants will be specifically addressed in planning activities under the AQMP.
The overall goal will be to reduce exposure to these toxics when control decisions are
reached for the relevant criteria pollutants. In addition, consideration of ancillary air
quality issues including environmental justice, smart growth, and climate change will be
documented throughout the SIP process. The AQMP3 will not replace existing
permitting, enforcement, or SIP requirements. It will emphasize those air pollutants most
important to the local community while working toward compliance for all NAAQS and
reductions in air toxics exposure to the community.
The AQMP3 will provide a timeline with respect to criteria pollutants of interest for both
states’ regulatory process along with interim milestones for the technical air quality
analysis that is necessary for development of the SIP(s). It should be noted that the
10
AQMP3 will change as air quality goals are met and new goals are developed (including
revised air quality standards). The current NAAQS pollutants will include ozone, PM2.5,
and lead for the St. Louis area based on revised standards promulgated by USEPA during
the last two years. Federal review is underway for the NO2, SO2, and CO NAAQS (see
Table 4) and the AQMP3 will be flexible enough to respond to these changing air quality
standards. The technical milestones will include the generation of a base-year, model-
ready air toxics inventory in conjunction with the appropriate criteria pollutant inventory,
a photochemical modeling exercise to evaluate certain air toxics along with PM2.5 and
ozone, future-year inventory development including control strategies that account for a
variety of multi-pollutant strategies, and a site-specific lead analysis for one site in
Missouri and another site in Illinois. It is the intention of the AQMP3 effort to focus air
toxics evaluations on the St. Louis urban core (the areas identified in the previous air
toxics evaluation) and utilize available resources to address inventory and other
refinements within this area.
Environmental Justice
Both states are concerned with ensuring clean air for all citizens and the primary goal of
this project is to bring areas not in compliance with air quality standards back into
compliance. As part of this process, environmental justice areas will be evaluated to
ensure consistent protection for all areas of the community.
The USEPA defines environmental justice (EJ) as “the fair treatment and meaningful
involvement of all people regardless of race, color, national origin, or income with
respect to the development, implementation, and enforcement of environmental laws,
regulations, and policies.”1 As part of the community’s on-going efforts for EJ, East West
Gateway (EWG) established a precise definition of the EJ area in the St. Louis region.2
Figures 2 and 3 display the EJ areas in the St. Louis area. Figure 2 provides the EJ area
for the entirety of the EWG jurisdiction and Figure 3 provides a close-up view of areas in
the core metropolitan area (the City of St. Louis and East St. Louis, IL) along with a
breakdown of the EJ category.
Minorities compose 23.3 percent of the St. Louis region’s population. In terms of
regional minority composition, St. Louis County is home to 44.1 percent of the region’s
minorities, the largest concentration in the region, followed by St. Louis City with 31.2
percent, and St. Clair County with 15.9 percent. This minority composition mirrors the
boundary determined for the regional EJ area, which is predominately located in St.
Louis City, St. Louis County, and St. Clair County. The areas were once home to various
1 http://www.epa.gov/compliance/environmentaljustice
2 Definition of EJ Area: In identifying the EJ area, the 2000 Census was used by EWG as its block-level
data source. The criteria included minority (non-white) populations, working age (16 or older) persons with
incomes below the poverty standard ($8,240 in 1999), disabled populations, zero car households and
senior-headed (65 years of age or older) households with no cars. The threshold for inclusion into the EJ
area was set at two standard deviations above the median of population subcategory concentrations within
the region’s block groups. The final EJ area is the union of each population subcategory. The result of the
evaluation of sensitive population groups yielded the boundary shown in the Environmental Justice map.

11
industries (with associated legacy contamination), dominated by aging housing and
infrastructure, and home to a multitude of brownfield sites. As part of the AQMP3, the
population exposure metrics for each portion of the community will be examined and this
will allow for consideration of EJ issues at that time. We discuss a set of proposed
Human Health indicators in Section 8. The goal will be to engage community
representatives as part of the public outreach efforts of the AQMP3.
Figure 2 – East-West Gateway Environmental Justice Map

12
Figure 3 – St. Louis Core Environmental Justice Map
AQMP3Benefits

13
The AQMP3 is being designed to provide regulatory efficiencies in the development of
SIPs by using limited state/federal resources to provide the maximum air quality benefit
in the quickest fashion possible while expending the least amount of resources from the
citizenry and industry. It is also an effort by all the regulatory agencies to provide more
transparent and timely decision-making for overall air quality management in the St.
Louis area. The ultimate goal of the St. Louis AQMP3 is to improve human health and
the environment. The on-going technical efforts designed as part of the AQMP3 will be
flexible enough to allow for consideration of “new” pollutant goals and potential removal
of “old” or achieved pollutant goals. These future changes to the plan are critical to on-
going air quality management in the region with the necessary emphasis on applicable air
quality goals. Also, the AQMP3 will help provide additional certainty to the regulated
community due to the consideration of multiple air quality goals in the same planning
cycle instead of the current pollutant-specific approach. Further, ancillary air quality
issues (e.g. smart growth, energy conservation, GHG reductions and climate change) will
be evaluated in the state planning documents where applicable. In Section 5, we discuss
examples of local activities to support air quality.
Other Impacts of the AQMP3
The AQMP3 will provide additional efficiency to allow for ever-shrinking resources to
complete the Clean Air Act required analyses for the St. Louis area. However, when
compared to the old pollutant-specific approach, there will be increased effort to evaluate
control decisions for all pollutants simultaneously (including air toxics). While these
efforts are necessary and will ultimately provide better air quality decisions for St. Louis,
additional technical efforts will need to be completed to provide the necessary data for
this type of collective decision-making. The outreach component of the AQMP is
designed to allow meaningful discussion between the agencies and interested
stakeholders pertaining to air quality goals and the community’s perspective on different
air quality problems.
14
Section 3
Air Quality Issues/NAAQS/Air Toxics
Currently, the St. Louis metropolitan area is designated nonattainment for the 1997 8-
hour ozone standard (moderate) and the annual PM2.5 NAAQS. The St. Louis ozone
nonattainment area is composed of the following counties: Illinois – Madison, St. Clair,
Monroe, and Jersey; and Missouri – St. Louis, St. Charles, Jefferson, Franklin, and the
City of St. Louis. The St. Louis fine particulate nonattainment area is composed of
Franklin, Jefferson, St. Charles and St. Louis counties and the City of St. Louis in
Missouri and Madison, Monroe and St. Clair counties in Illinois. Baldwin Township in
Randolph County, Illinois is also part of the fine particulates nonattainment area. Figure
4 illustrates the current nonattainment boundaries for both the 1997 8-hour ozone and
annual fine particulate standards.
In March 2008, USEPA issued a revision to the NAAQS for ozone. This standard had
the same form as the 1997 standard (3-year average of the 4th
highest value at any
monitor), but changed the level of the standard to 75 parts per billion (ppb) from 84 ppb.
Both states submitted the required designation recommendations and the state of
Missouri included one additional county in the revised St. Louis nonattainment area.
Lincoln County to the north-northwest of the current nonattainment area was included
because of a monitored violation at the Foley monitor in 2006-08. This violation was due
to ozone and precursor transport from the metropolitan area. NOTE: The Foley monitor
is in compliance with the 2008 standard using 2007-09 data.
In September 2009, USEPA determined that the 2008 ozone standard would be
reconsidered. This decision and corresponding USEPA actions “put on hold” the
designation process for the 2008 standard. Further, the 2007-09 monitoring data for the
St. Louis area demonstrates that the area is in compliance with the 1997 standard (design
value of 78 ppb).
In October 2009, USEPA designated the St. Louis area as attainment for the 2006 PM2.5
24-hour NAAQS. This standard is now 35 g/m3, reduced from 65 g/m
3, and the St.
Louis area design value is 34.7 g/m3 at the Granite City, Illinois site (2006-08 data).
However, the St. Louis area is still violating the 1997 annual PM standard with a design
value of 15.7 g/m3 at the Granite City site using 2006-08 monitoring data. All other
monitors in the St. Louis area (Missouri and Illinois) are in compliance with both
standards.

15
Figure 4 – Nonattainment Area for Ozone and PM 2.5

16
Ozone
Ozone History
Under the 1990 Clean Air Act Amendments (CAAA), St. Louis was classified as a
moderate ozone nonattainment area for the 1-hour standard. The CAAA included very
specific requirements for areas under each classification. The most important requirement
for moderate areas was achieving attainment by 1996. Under the Amendments, failure to
attain by the attainment date would result in reclassification (or “bump up”) to the more
demanding classification of “serious.” Serious areas were subject to an additional set of
mandatory requirements.
The St. Louis area was required to achieve a minimum of 15 percent reduction in
emissions of volatile organic compounds (VOCs), and submit these Rate of Progress
(ROP) plans for achieving that reduction. Missouri and Illinois submitted initial ROP
plans in 1993 to the USEPA.
Subsequent amendments to the original ROP plan were made in 1994, 1995, and 1996 by
the state of Missouri. These amendments were the result of refinements to inventory
calculations and improvements in the documents. Ultimately, the Missouri plan included
an enhanced inspection and maintenance program for the nonattainment area, a myriad of
industrial VOC regulations for major sources, a Stage I and II gasoline vapor recovery
program, and a reduced Reid Vapor Pressure regulation (later reformulated gasoline -
RFG). An Illinois plan included similar provisions, including an enhanced inspection and
maintenance program, Reasonably Available Control Technology (RACT) on major
industrial VOC sources, and a reduced Reid Vapor Pressure regulation (and more
recently RFG).
Although the ROP requirement was one of the key obligations of the CAAA, the primary
obligation was a plan to achieve the national ozone standard for the St. Louis region. This
obligation is referred to as an attainment demonstration. An attainment demonstration
was prepared and submitted in 1995, which showed that the area would attain the
standard by 1996. The St. Louis area, however, was not able to attain the 1-hour ozone
standard by 1996. The States of Missouri and Illinois proceeded with a request to USEPA
to extend the attainment deadline. To qualify for this extension the states had to
demonstrate that the area was significantly affected by ozone or ozone precursors
transported from upwind sources, that all necessary local control measures have been
implemented, and that the states had made the necessary administrative submittals. As
part of this attainment date extension, additional photochemical grid modeling was
conducted. This modeling included a number of regional control measures, in addition to
the 15 percent ROP controls such as RFG and the enhanced I/M programs.
The attainment demonstration submitted as part of the 1-hour extension request focused
on the evaluation of emission reductions that were expected from electric generating
utilities resulting from USEPA’s regional oxides of Nitrogen (NOx) control SIP call. The
SIP call applied to twenty-two states in the eastern United States, and included emission
17
reductions from sources located in the eastern one-third of Missouri and the entire state of
Illinois. The study showed that both regional NOx controls and local VOC controls were
necessary for attainment of the 1-hour standard, and that St. Louis was significantly
affected by ozone transport and emissions from other states, and therefore, qualified for
the attainment date extension. Missouri and Illinois were granted the extension and
subsequently attained the 1-hour ozone standard in 2002.
On April 15, 2004, USEPA designated the St. Louis metropolitan area as a moderate
nonattainment area for the 1997 eight-hour ozone standard. This area includes the
following counties: Illinois - Jersey, Madison, Monroe, and St. Clair; and Missouri - St.
Louis, St. Charles, Jefferson, Franklin and the City of St. Louis. The eight-hour ozone
SIP submittal deadline was June 15, 2007, and both the state of Missouri and the state of
Illinois submitted a plan revision that demonstrates the St. Louis non-attainment area will
reach attainment of the 1997 8-hour ozone standard beginning in 2009. St. Louis has
attained the standard based on current monitoring data. See Figure 5 for the current map
showing locations of ozone and PM2.5 monitoring sites.
The latest plan revision for the region requires a decentralized On-Board Diagnostic
inspection and maintenance program, continued use of Phase II reformulated gasoline,
new federal motor vehicle requirements (Tier 2/Tier 4), the NOx emission reductions
from the NOx SIP call and scheduled NOx reductions for utilities in the Clean Air
Interstate Rule (CAIR), and continued compliance with industrial VOC and NOx RACT
regulations.
18
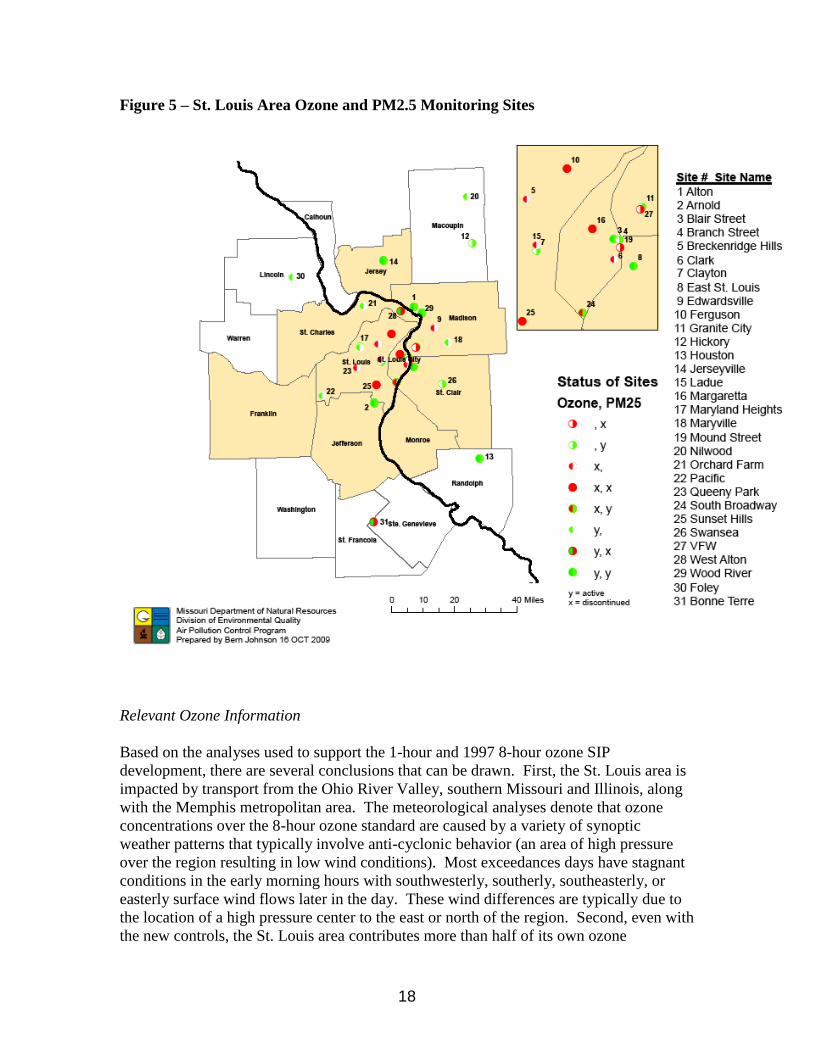
Figure 5 – St. Louis Area Ozone and PM2.5 Monitoring Sites
Relevant Ozone Information
Based on the analyses used to support the 1-hour and 1997 8-hour ozone SIP
development, there are several conclusions that can be drawn. First, the St. Louis area is
impacted by transport from the Ohio River Valley, southern Missouri and Illinois, along
with the Memphis metropolitan area. The meteorological analyses denote that ozone
concentrations over the 8-hour ozone standard are caused by a variety of synoptic
weather patterns that typically involve anti-cyclonic behavior (an area of high pressure
over the region resulting in low wind conditions). Most exceedances days have stagnant
conditions in the early morning hours with southwesterly, southerly, southeasterly, or
easterly surface wind flows later in the day. These wind differences are typically due to
the location of a high pressure center to the east or north of the region. Second, even with
the new controls, the St. Louis area contributes more than half of its own ozone
19
concentrations. These results are based on CAMx Anthropogenic Precursor Culpability
Assessment analyses conducted for 2009 emissions in St. Louis. Third, the large amount
of biogenic VOC emissions to the south and southwest of the nonattainment area also
contribute significantly to the formation of ozone in St. Louis. These emissions are
generated from the large oak and pine forests of south-central and southeastern Missouri.
Fourth, the nature of ozone formation in St. Louis has changed slightly over the years.
Prior to the 1-hour ozone SIP development, the area’s ozone formed under a mixture of
VOC- and NOx-limited conditions depending on the meteorological conditions (e.g. wind
direction) for that episode. Under NOx-limited conditions, reductions in NOx emissions
provide greater corresponding ozone reduction than VOC emission reductions. Recently,
St. Louis has shifted to more NOx-limited conditions, but with some days that are VOC-
limited. This pattern follows the overall trend of significant VOC emission reductions in
the high emission density areas near downtown St. Louis.
Also, presented below is Figure 6 which illustrates the recent history of ozone design
values at several critical sites in and around the St. Louis area. This figure illustrates a
slight downward trend in concentrations influenced by previous SIP submittals from both
Missouri and Illinois. Further, there is considerable year-to-year fluctuation in 4th
highest concentration that reflects the strong meteorological variability seen not only in
St. Louis but throughout the Midwest. To be clear, based on the recent 8-hour ozone SIP
submittals of Missouri and Illinois, the area should see a sizable reduction in ozone
concentrations due to the federal mobile source measures, continued implementation of
utility NOx controls, and other local measures in the next few years.

20
Figure 6 - Ozone Design Values 2000-2009
A mix of emission sources continues to influence ozone concentrations in the St. Louis
area. The average of the biogenic VOC emissions for all the episodes in the attainment
demonstration from the nonattainment area is: Missouri NAA = 309.53 tons per day
(TPD), Illinois NAA = 135.73 TPD totaling of 445.26 TPD. Sixty percent of the
biogenic emissions in the nonattainment area are emitted from Franklin and Jefferson
counties, Missouri (south and west of the downtown area). In addition, the outlying
Missouri counties to the south and west have substantially more biogenic VOC
emissions. Over 90 percent of the total 2002 stationary point source NOx emissions in
the Missouri portion of the nonattainment area were emitted by the four Ameren electric
generating facilities, a cement kiln, and a group of industrial boilers. Two of the Ameren
facilities have computer-controlled staged combustion and overfire air NOx measures
(less than 0.15 lb/MMBTU) and all four are in compliance with the NOx SIP call
requirements and are included in the Clean Air Interstate Rule program. In Illinois, there
were two large non-utility point sources that emitted considerable NOx in 2002:
Toscopetro and US Steel – Granite City Works. The 2002 point source VOC emissions

21
in the Missouri portion of St. Louis were dominated by an aluminum foil pack
manufacturer (JW Aluminum) and four automobile manufacturing facilities (GM,
Chrysler (2), and Ford which is shut down as are both Chrysler plants).
Particulate Matter
PM History
The St. Louis metropolitan area was designated nonattainment for the annual PM2.5
NAAQS on April 5, 2005. The St. Louis annual PM2.5 nonattainment area is composed
of the following counties: Illinois – Madison, St. Clair, Monroe, and Baldwin Township
in Randolph County; and Missouri – St. Louis, St. Charles, Jefferson, Franklin, and the
City of St. Louis. The highest observational data in the St. Louis area exhibit a consistent
pattern of organic compounds contributing at or near the majority of the total PM mass,
with typical seasonal variations of sulfate and nitrate contributing to a large extent as well
(summer sulfate, winter nitrate).
Missouri submitted its portion of the PM2.5 SIP in October 2009. The Illinois portion is
currently under development. There is only one monitor that violates the annual standard
based on 2006-2008 data. The Granite City, IL monitor located north-northeast of the
downtown area is the violating monitor. The geographic pattern of ambient
concentrations is higher concentrations in the downtown and East St. Louis/Granite City
areas and slightly lower annual concentrations in the suburban and rural sites around the
area. This leads to the conclusion that there is a contribution to these monitors from local
sources in the area along with a sizable component that is transported into the area. This
is especially true regarding concentrations at the Granite City monitor due to very nearby
sources that impact that monitor.
Relevant PM Information
The St. Louis area is one of the few urban areas in the nation that is unable to
demonstrate compliance with the annual PM2.5 standard using 2009 “on-the-books”
control. Therefore, as part of the SIP submittal, Missouri has and Illinois will be
applying for an attainment date extension to 2012 to allow for additional controls to be
implemented. In 2006 and 2007, the State of Illinois promulgated the Multi-Pollutant
Standard (35 IAC Part 225, Subpart B) and Combined Pollutant Standard (35 IAC Part
225, Subpart F), respectively, to achieve significant reductions in SO2, NOx, and
mercury emissions from coal-fired electrical generating units. These rulemakings are
anticipated to result in the elimination of 201,233 tons/year of SO2 emissions by 2015
and 233,600 tons/year by 2019. They are also expected to result in the elimination of
NOx emissions of 61,434 tons/year by 2012. As of July 1, 2009, the affected power
plants were to achieve 90% mercury capture or, alternatively, attain an output-based
standard of 0.0080 lbs mercury per gigawatt-hour. In addition, two SO2 RACT control
regulations in Missouri for primary lead smelting and industrial boilers have been
finalized that limit emissions of impacted sources in 2012 and 2011, respectively. Illinois
22
has committed to conclude their necessary rulemakings and have anticipated compliance
dates in the 2012 timeframe for the annual PM2.5 plan.
Lead
History
The city of Herculaneum, Missouri in Jefferson County contains a primary lead smelting
operation (Doe Run Company) and is currently in violation of the 0.15 g/m3 rolling
three month average lead NAAQS (finalized in October 2008). In Spring, 2007 the state
of Missouri submitted a SIP revision to address the most recent violations of the 1978
lead standard (1978 standard was 1.5 g/m3) near the facility in spring 2007 and USEPA
Region 7 is preparing a rulemaking on that revision. The Doe Run Company is, also, the
single largest non-utility source of sulfur dioxide in the PM2.5 nonattainment area at
around 40,000 tons per year. These SO2 emissions are being controlled as part of the
2009 PM2.5 SIP submittal by Missouri. Based on the new lead NAAQS, considerable
additional effort will be necessary for lead attainment in Herculaneum. Also, the state of
Illinois has recommended the Granite City, IL city limits for designation as
nonattainment. These areas include all monitors that are not in compliance with the 2008
lead standard.

23
Figure 7 – St. Louis Lead Nonattainment Areas
Air Toxics

24
St. Louis is impacted by most of the urban air toxics typical of larger cities. In June
2005, USEPA Region 7 - working with local officials - completed a St. Louis-specific air
toxics study. The study produced a report titled “St. Louis Community Air Project Air
Toxics Risk Characterization” (CAP Report). The CAP Report was a direct result of the
region’s attempt to address environmental concerns expressed by residents, workers and
business owners in St. Louis. Specific air toxics of concern to the community cited in the
report included five “priority air toxics of concern”: acetaldehyde, arsenic compounds,
benzene, chromium compounds and formaldehyde. It also listed a concern with diesel
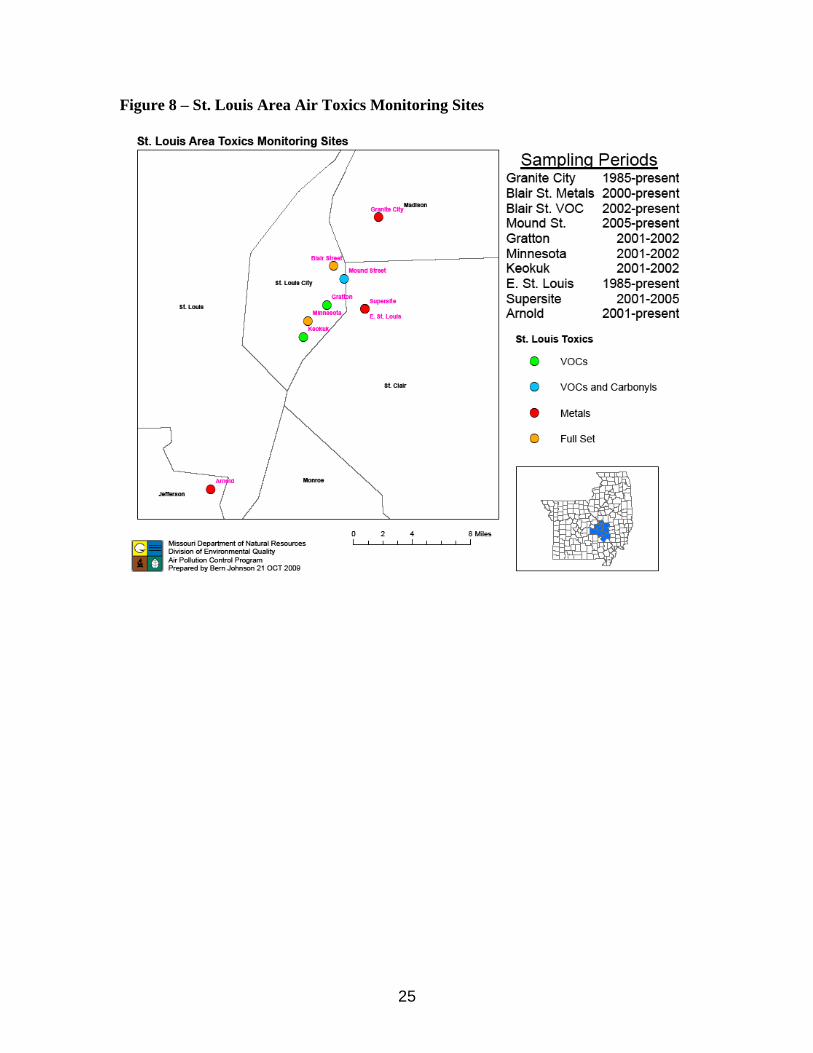
particulate matter. In addition to the CAP report, Missouri has continued to monitor for
specific toxics in the area. Figure 9 shows the current air toxics monitoring sites and
sampling periods in the St. Louis area. The AQMP3 analytical and control selection
process will allow more knowledge of these urban air toxics to be considered in
addressing multi-pollutant control strategies. The additional monitoring includes data
collected at the National Air Toxics Trend Station on Blair St. near downtown St. Louis.
A review of the data collected during 2005-08 has determined that the St. Louis area still
contains air toxics compounds which contribute to risk above one additional cancer in a
million exposed threshold. Consistently, the largest cancer risk was attributed to
formaldehyde exposure in St. Louis (40-60 times over the threshold) with the following
other pollutants indicating risk well above the one in a million threshold: arsenic
compounds, benzene, acetaldehyde, and carbon tetrachloride. The “air toxics of concern”
have not changed markedly since the 2002 CAP Study and, therefore, the initial AQMP3
evaluation of air toxics will include the original toxics of concern from the CAP study.
25
Figure 8 – St. Louis Area Air Toxics Monitoring Sites
26
Section 4
Current Emissions Assessment/Existing Control Strategies
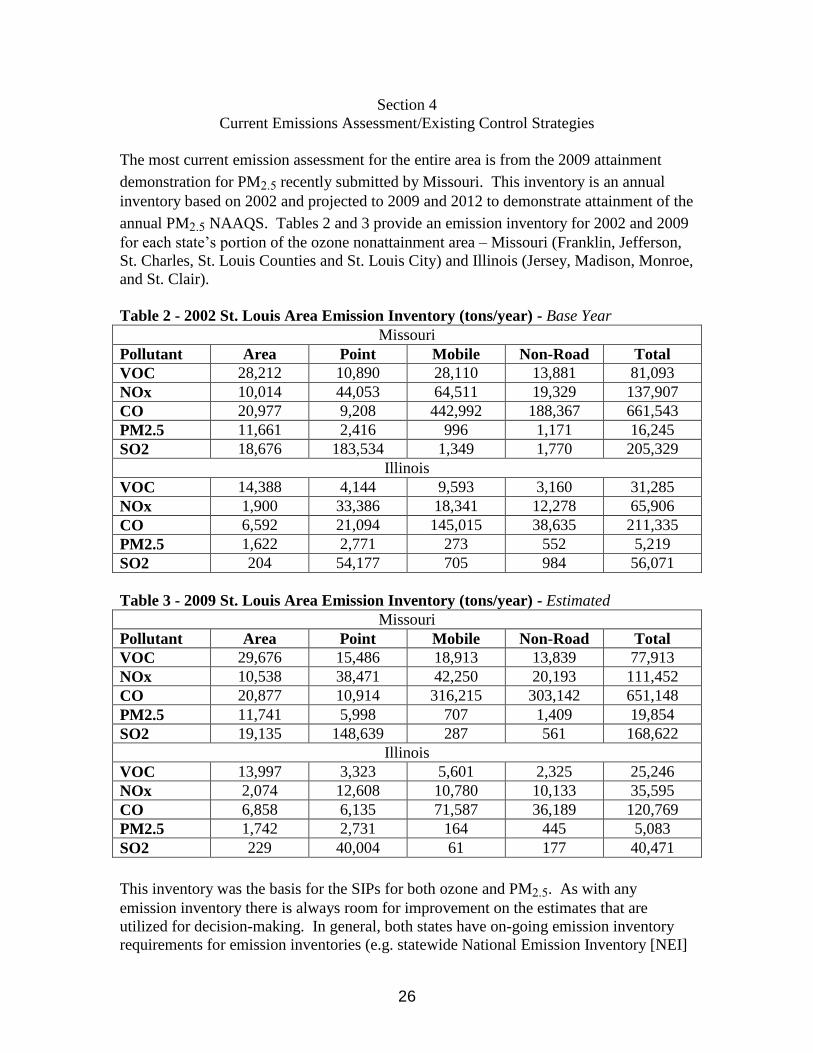
The most current emission assessment for the entire area is from the 2009 attainment
demonstration for PM2.5 recently submitted by Missouri. This inventory is an annual
inventory based on 2002 and projected to 2009 and 2012 to demonstrate attainment of the
annual PM2.5 NAAQS. Tables 2 and 3 provide an emission inventory for 2002 and 2009
for each state’s portion of the ozone nonattainment area – Missouri (Franklin, Jefferson,
St. Charles, St. Louis Counties and St. Louis City) and Illinois (Jersey, Madison, Monroe,
and St. Clair).
Table 2 - 2002 St. Louis Area Emission Inventory (tons/year) - Base Year
Missouri
Pollutant Area Point Mobile Non-Road Total
VOC 28,212 10,890 28,110 13,881 81,093
NOx 10,014 44,053 64,511 19,329 137,907
CO 20,977 9,208 442,992 188,367 661,543
PM2.5 11,661 2,416 996 1,171 16,245
SO2 18,676 183,534 1,349 1,770 205,329
Illinois
VOC 14,388 4,144 9,593 3,160 31,285
NOx 1,900 33,386 18,341 12,278 65,906
CO 6,592 21,094 145,015 38,635 211,335
PM2.5 1,622 2,771 273 552 5,219
SO2 204 54,177 705 984 56,071
Table 3 - 2009 St. Louis Area Emission Inventory (tons/year) - Estimated
Missouri
Pollutant Area Point Mobile Non-Road Total
VOC 29,676 15,486 18,913 13,839 77,913
NOx 10,538 38,471 42,250 20,193 111,452
CO 20,877 10,914 316,215 303,142 651,148
PM2.5 11,741 5,998 707 1,409 19,854
SO2 19,135 148,639 287 561 168,622
Illinois
VOC 13,997 3,323 5,601 2,325 25,246
NOx 2,074 12,608 10,780 10,133 35,595
CO 6,858 6,135 71,587 36,189 120,769
PM2.5 1,742 2,731 164 445 5,083
SO2 229 40,004 61 177 40,471
This inventory was the basis for the SIPs for both ozone and PM2.5. As with any
emission inventory there is always room for improvement on the estimates that are
utilized for decision-making. In general, both states have on-going emission inventory
requirements for emission inventories (e.g. statewide National Emission Inventory [NEI]
27
reporting for all source categories, statewide annual emission inventory submittals from
industrial sources, mobile source conformity budget development/compliance in St.
Louis, statewide Toxic Release Inventory [TRI] requirements). As with all inventories
used for planning or control purposes, these core inventories serve as the basis for the
development of the modeling inventory database. A modeling inventory is an ever-
improving product that utilizes the best available information at the time of its
development. For the AQMP3, the ozone and PM modeling databases have been through
a series of revisions and improvements related to updating emission rates, stack
parameters, and other relevant information. However, for the toxics modeling inventories
being planned as part of the AQMP3, there has been little quality assurance because it has
never been utilized in state-specific planning analyses. Therefore, one of the significant
technical components for AQMP3 implementation will be the development of a “model-
ready” toxics inventory as part of the AQMP3 and SIP analyses.
Each state’s on-going inventory efforts will continue to be utilized for the core emission
products that drive control strategy decisions. Future inventory development will be
based on the requirements for the relevant air quality standards (e.g. ozone and/or PM)
with an emphasis on utilizing the highest quality data available.
Existing Control Strategies
Both states submitted SIPs for the St. Louis, Missouri and Metro-East (IL) portions of the
St. Louis 8-hour ozone nonattainment area. These plans incorporated “on-the-books”
controls for demonstrating attainment of the 1997 ozone NAAQS by 2009. These
controls encompass the spectrum of anthropogenic emission sources---onroad mobile,
offroad mobile, point, area. In Illinois, the reductions amount to approximately 20 tons
VOC/day and 42 tons NOx/day and in Missouri, the emission reductions for this plan
amount to 33 tons VOC/day and 79 tons NOx/day, when compared to the 2002 base year.
In large measure, the emission controls are directly or indirectly the result of federal
rulemakings, federal enforcement actions, or statutory requirements imposed by the
Clean Air Act Amendments of 1990. The “on-the-books” control measures, however,
also reflect both state’s rulemaking efforts and other controls related to enforcement
actions. The following list identifies the principal “on-the-books” control programs:
Tier 2 Light Duty Vehicle Standards and Gasoline Sulfur Control
Requirements (65 FR 6697)
Heavy-Duty Diesel Engine Standards / Low-Sulfur Diesel (66 FR 5002)
Tier 4 Nonroad Diesel Engines / Diesel Fuel Sulfur Content (69 FR 38957)
Vehicle Inspection & Maintenance Program (CAAA) – Missouri and Illinois
utilize enhanced I/M programs in the St. Louis area
Reformulated Gas (71 FR 77690) – required in Missouri since 1999 (Phase II
in 2000); both states had to “opt-in” to RFG because St. Louis was not
classified as a serious ozone nonattainment area. Illinois “opt-in” since 2007.
o Low Reid Vapor Pressure Gas (starting at 7.8 and ending at 7.0 pounds
per square inch) was utilized from 1992 until RFG was required
28
NOx SIP Call (63 FR 57355)
o Missouri Statewide NOx trading program – implemented in 2004;
required emission limits on all electric generating units above 25 MW
in Missouri through a trading program (this program supplemented the
NOx SIP call because only the eastern 1/3 of Missouri utilities were in
the SIP call)
New Source Performance Standards (NSPS)
National Emission Standards for Hazardous Air Pollutants (MACT)
Locomotive Engine Standards (63 FR 18977)
Marine Compression-Ignition Engine Standards (64 FR 73299)
State-specific measures in the St. Louis area:
Illinois
Consent Decree---Dynegy Midwest Generation (Consent Decree entered May
27, 2005 by U.S. District Court for the Southern District of Illinois)
Consent Decree---ConocoPhillips (Consent Decree filed January 27, 2005 by
U.S. District Court for the Southern District in Texas)
Control of Emissions from Consumer and Commercial Products
Control of Emissions from Architectural and Industrial Maintenance (AIM)
Coatings
Control of Emissions from Rotogravure and Flexographic Printing Facilities
Control of Emissions from Lithographic Printing
Control of Emissions from Pavement Painting Operations
Control of Emissions from Wood Furniture Manufacturing Operations
Control of Emissions from Solvent Cleanup Operations
Control of Emissions from Volatile Organic Liquid Storage
Control of Emissions from Batch Process Operations
Control of Petroleum Liquid Storage, Loading, and Transfer (Stage I)
Missouri
Open Burning Restrictions
Control of Emissions from Aerospace Manufacture and Rework Facilities
Control of Emissions from Rotogravure and Flexographic Printing Facilities
Control of Emissions from Bakery Ovens
Control of Emissions from Lithographic Printing
Control of Emissions from Traffic Coatings
Control of Emissions from Aluminum Foil Rolling
Control of Emissions from Wood Furniture Manufacturing Operations
Control of Emissions from Solvent Cleanup Operations
Control of Emissions from Volatile Organic Liquid Storage
Control of Emissions from Batch Process Operations
Control of Petroleum Liquid Storage, Loading, and Transfer (Stage I)
Stage II Vapor Recovery (Automobile refueling control)
NOx RACT controls - Missouri
29
Additionally, recent promulgation of the following federal and state control measures is
expected to contribute to further air quality improvements:
Portable Fuel Containers (72 FR 8427)
VOC Coatings and Solvent Categories (63 FR 48819; 63 FR 48848; 73 FR
15421)
NOx RACT Controls – Illinois
VOC RACT Controls – Group II Consumer & Commercial Products:
Lithographic Printing, Letterpress Printing, Flexible Package Printing, Flat
Wood Paneling Coating, and Industrial Cleaning Operations.
VOC RACT Controls – Group III Consumer & Commercial Products: Paper,
Film and Foil Coatings, Large Appliance Coatings, and Metal Furniture
Coatings.
VOC RACT Controls – Group IV Consumer & Commercial Products:
Miscellaneous Metal and Plastic Parts Coatings, Automobile and Light-Duty
Truck Assembly Coatings, Industrial Adhesives, and Fiberglass Boat
Manufacturing Materials.
The current fine particulate matter (PM2.5) annual NAAQS SIP development effort for the
St. Louis nonattainment area also benefits from many of the above-listed emission
control measures. In addition to those measures, the Clean Air Interstate Rule (CAIR) in
Missouri and the Multi-pollutant Standards (MPS) and Combined Pollutant Standard
(CPS) in Illinois will provide substantial PM precursor reductions. Also, in its October
2009 SIP submittal, Missouri added two new regulations that control sulfur dioxide
(SO2). These two regulations control industrial boilers in the St. Louis area and the
primary lead smelting operation in the area. The amount of emission reductions will
exceed 40,000 tons of SO2 per year when fully realized (in 2017) when compared to
current conditions. The emission limitations under these rules will start to be
implemented in 2011.
The St. Louis metropolitan area is currently designated as a nonattainment area for the
annual PM2.5 NAAQS, although current monitoring data shows that only one monitor in
the area is violating the air quality standard. Elevated ambient PM2.5 concentrations in
Granite City, Illinois are largely attributable to local iron and steel-making operations. A
refined modeling assessment (Local Area Analysis) is currently being completed by the
IEPA for the Granite City area to augment the regional modeling analyses. This technical
assessment is expected to result in further primary particulate matter reductions in order
to demonstrate attainment of the annual PM2.5 NAAQS.
30
Section 5
Local Activities in Support of Air Quality
In the St. Louis area, there are many local activities that coincide with or support the air
quality management goals of this plan. These include:
Energy efficiency programs,
Local air pollution control programs - City of St. Louis and St. Louis County,
Renewable energy programs,
Anti-idling programs,
Clean diesel programs,
Vehicle miles traveled reduction program,
Green Buildings program,
Local transportation planning,
Air quality alerts,
Biking and walking program,
Regional water quality protection,
St. Louis City Forestry Program,
Sustainability, and
Greenhouse gas reduction program.
With respect to greenhouse gases, it is generally understood by air quality management
officials that there is a correlation between efforts to reduce greenhouse gas emissions
and improvements in air quality. There is ongoing research that will attempt to better
quantify this relationship and as the AQMP3 for the St. Louis area evolves, the results of
this research should inform that process. However, what air quality scientists recognize
now is that higher temperatures lead to increased concentrations of ozone precursors and
higher, more sustained ozone concentrations. Human Health effects research shows a
clear link between higher ozone levels and increased adverse human health and
ecological impacts.
As the national debate continues on how to structure a greenhouse gas reduction program,
there are already many efforts underway at the local level to reduce emissions. These
efforts address energy efficiency, renewable portfolio standards, land use, transportation
and regional growth planning. As these efforts grow, there will likely be a corresponding
effort on the part of the USEPA to quantify improvements such that credits can be
incorporated into SIPs. The AQMP3 for the St. Louis area recognizes this possibility.
The AQMP3 team has assembled the current activities taking place within the St. Louis
area. The team recognizes that this list may be incomplete, and looks forward to working
with local partners to enhance this current list that contribute towards improving air
quality in the St. Louis area. All these activities are summarized in table form as
Appendix 1.

31
Section 6
Strategies for Managing Future Emissions
The AQMP3 will utilize a new paradigm for evaluating control strategies. Each strategy
will be evaluated for all pollutants of concern in the St. Louis area including the air toxics
identified in this document. This differs from the previous SIPs that have been developed
in St. Louis where each pollutant was considered separately or with a very narrow review
of any other pollutant co-benefits or emission increases. The process of evaluating
multiple pollutants will require more effort during the control strategy development
exercise. However, these efforts will be beneficial in developing emission reductions for
several pollutants simultaneously to achieve all the air quality goals in the St. Louis area.
At this time, the primary pollutants of concern for St. Louis are ozone, particulate matter,
and certain air toxics. The air quality goal for ozone is likely to change in the near future
to a more strict standard than the 1997 8-hour standard currently in place for St. Louis
(0.08 parts per million). The St. Louis area was recently designated an attainment area
under the 2006 24-hour PM2.5 standard due to “clean” air quality monitoring data for
2007-09, but is still nonattainment for the annual PM2.5 standard. Based on information
from USEPA OAQPS, the revised ozone standard will be proposed in December 2009
and finalized in August 2010. The next PM standard review will be complete in 2011.
Also, due to the recent release of a technical draft under the nitrogen dioxide (NO2)
standard review, USEPA has suggested a “near-roadway” form of the standard that could
potentially impact the St. Louis area. Further, the SO2 NAAQS review may propose a
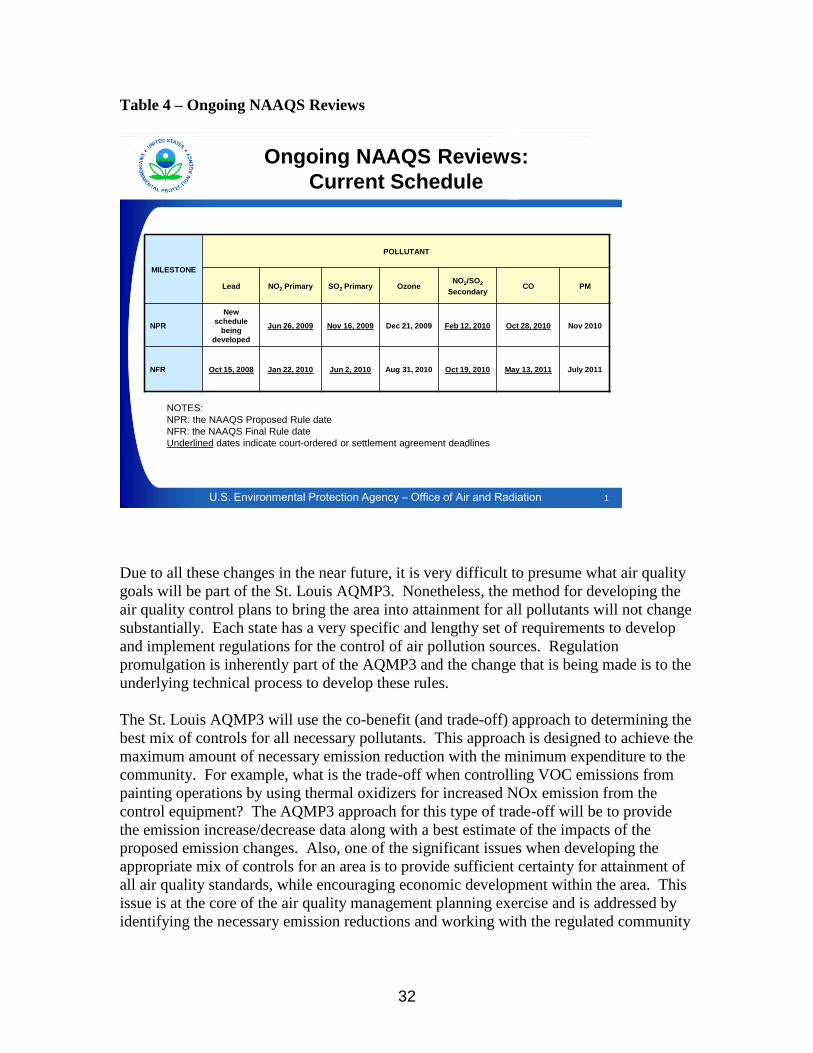
standard that may impact large SO2 sources in the area. Table 4 lists the ongoing
NAAQS reviews and current schedule.
32
Table 4 – Ongoing NAAQS Reviews
1U.S. Environmental Protection Agency – Office of Air and Radiation
Ongoing NAAQS Reviews:
Current Schedule
MILESTONE
POLLUTANT
Lead NO2 Primary SO2 Primary OzoneNO2/SO2
SecondaryCO PM
NPR
New
schedule
being
developed
Jun 26, 2009 Nov 16, 2009 Dec 21, 2009 Feb 12, 2010 Oct 28, 2010 Nov 2010
NFR Oct 15, 2008 Jan 22, 2010 Jun 2, 2010 Aug 31, 2010 Oct 19, 2010 May 13, 2011 July 2011
NOTES:
NPR: the NAAQS Proposed Rule date
NFR: the NAAQS Final Rule date
Underlined dates indicate court-ordered or settlement agreement deadlines
Due to all these changes in the near future, it is very difficult to presume what air quality
goals will be part of the St. Louis AQMP3. Nonetheless, the method for developing the
air quality control plans to bring the area into attainment for all pollutants will not change
substantially. Each state has a very specific and lengthy set of requirements to develop
and implement regulations for the control of air pollution sources. Regulation
promulgation is inherently part of the AQMP3 and the change that is being made is to the
underlying technical process to develop these rules.
The St. Louis AQMP3 will use the co-benefit (and trade-off) approach to determining the
best mix of controls for all necessary pollutants. This approach is designed to achieve the
maximum amount of necessary emission reduction with the minimum expenditure to the
community. For example, what is the trade-off when controlling VOC emissions from
painting operations by using thermal oxidizers for increased NOx emission from the
control equipment? The AQMP3 approach for this type of trade-off will be to provide
the emission increase/decrease data along with a best estimate of the impacts of the
proposed emission changes. Also, one of the significant issues when developing the
appropriate mix of controls for an area is to provide sufficient certainty for attainment of
all air quality standards, while encouraging economic development within the area. This
issue is at the core of the air quality management planning exercise and is addressed by
identifying the necessary emission reductions and working with the regulated community
33
and/or the community at-large to implement the least-cost method for achieving those
reductions.
The potential variations are too numerous to consider here. However, the outcome of this
exercise will be to select the most beneficial control for all pollutants of interest. This
means inevitably that prioritization will have to occur between pollutants of concern (e.g.
ozone and PM). Based on the stringency of the new standards, the difficulties the area
will have in meeting each of the new standards, and the overall health/economic impact
estimated from a program like Benefits Mapping and Analysis (BenMAP), the necessary
decisions will be driven by the maximum amount of beneficial health impacts when
considering the overall costs. This mirrors the current practice for individual pollutants,
but these decisions will be informed by new information that allows a better
understanding of the economic impacts of increased pollution to the public.
The overall goals of pollutant prioritization will be to ensure the attainment of all criteria
air pollutants for the St. Louis area in the most expeditious fashion. In addition, the
AQMP3 will strive to reduce air toxics exposure in the St. Louis community. With
unknown air quality goals and deadlines at this time, it is impossible to determine the
initial prioritization of pollutants in the St. Louis area. Nonetheless, the basic principle
for this prioritization will be based on human health impacts from each pollutant. As an
example, if the “new” ozone standard is 65 parts per billion (ppb), the analysis illustrates
that half a million people are exposed to levels of over 80 ppb. Further, this level of
exposure is projected to bring 1,000 additional hospital admissions. In comparison, with
an annual PM2.5 standard of 15 micrograms/cubic meter (g/m3), 30,000 people would
have exposure to 15.5 g/m3. The increased risks are estimated as 10 additional hospital
admissions. Therefore, given a finite set of economic and technical resources, both air
quality problems will be addressed but the priority would be given to ozone reduction
strategies. This type of prioritization will provide more benefit to the citizenry and
establish a hierarchy for management of air pollution in St. Louis.
It is impossible to predict the level of control necessary for attainment of all the new
standards at this time (either within the St. Louis area or of regional origin). However, the
proposals for the new ozone standard could require controls on “smaller” industry in St.
Louis and substantial industrial, area, or mobile source control throughout the eastern
United States to achieve the standards being discussed (e.g. 60-70 ppb). During the last
ozone plan development, both states identified the St. Louis area as being more NOx-
limited during times of maximum ozone formation. This finding and the fact that ozone
concentration continue to decline in the St. Louis area lead to the conclusion that VOC
controls in the area have been very effective in reducing ozone concentration along with
the regional NOx SIP calls controls. It will be important to consider both additional VOC
and NOx controls in the area during control strategy development for ozone in St. Louis.
For air toxics, the co-benefits of certain ozone and/or PM control will be evaluated as part
of the AQMP3 process. The focus will be to reduce the relevant air toxics exposure in
conjunction with the reductions in criteria pollutant concentrations.
34
Section 7
Implementation
To develop the technical approach to achieve the goals of the AQMP3, an evaluation of
the current status of air quality management was necessary. This air quality management
evaluation included a review of the current attainment status of the St. Louis area for each
of the criteria pollutants and a review of the air toxics exposure issues in the area. The
evaluation included a review of the previous SIPs submitted by both states for ozone and
PM2.5 (Missouri only at this time). Also, the previous air toxics evaluation was analyzed
to better understand the air toxics of concern for the area. The evaluation also included a
review of the state agency efforts for community outreach and cooperative efforts for
development of the respective plans.
After that evaluation, the “new” tasks have been identified and reviewed for level of
effort, workability of concept, continued functionality of the State coordination efforts,
appraisal by State Management, and manpower/budget issues Both states have much
expertise in developing SIPs and supporting technical analyses for ozone and PM2.5. The
primary new technical task is the use of air toxics exposure as a planning metric for the
St. Louis area and simultaneous analysis of multiple pollutants. This will require the
evaluation of tools developed by USEPA during the recent multi-pollutant air quality
studies that include air toxics. This transfer of knowledge has been largely completed and
the St. Louis team is intent on using the expertise gained by OAQPS staff to assist in
making decisions about specific technical details. For example, the OAQPS project
included the use of two different modeling systems for control strategy evaluation. This
was very cumbersome and required the creation of hybrid modeling output files. The St.
Louis team has decided against this approach for ozone and/or PM2.5 due to the excessive
effort required for very limited benefit. As the AQMP3 is implemented, the St. Louis
team will continue to work with USEPA technical staff to ensure valid scientific choices
are made at each decision point in the process and any new advances developed by
USEPA will be considered for inclusion.
The use of other “new” tools will be necessary including the cost functionality that will
help communicate the findings to the public and stakeholders. The overall technical
process will strongly resemble the current SIP development process and include base-
year inventory development (including emissions modeling), meteorological modeling,
initial base-case modeling (including model performance evaluations), iterative revisions
to modeling inputs as a result of findings, approval of base-case inputs/results, growth of
emissions to a future year, inclusion of “on-the-books” controls for all pollutants, and
subsequent control strategy iterations. The new aspects for the St. Louis area will include
the use of BenMAP to evaluate benefits on risk/exposure for changes in ozone and/or PM
concentrations, the inclusion of air toxics in the modeling activities and monitoring data
evaluations, a prioritization of control based on air quality/health/quality of living
priorities in St. Louis, and an evaluation of issues linked to air quality like smart growth,
transportation planning, and environmental justice within the St. Louis area.

35
As discussed previously, there are at least two significant problems with the
implementation of the AQMP3. The first was discussed previously and is the uncertainty
of the air quality goals driven primarily by USEPA’s air quality standards review. The
current lack of clear goals for ozone and PM precludes some of the initial planning that
could be conducted for implementation of the plan. This is an obstacle that can be
overcome given the flexible planning mechanism presented in Sections 8 and 9. The
second problem involves the deadlines for air quality planning on a pollutant-specific
basis in the Clean Air Act. The comprehensive planning and technical requirements
under the AQMP3 were never considered as part of the 1990 Clean Air Act
Amendments. Therefore, both states may need some measure of flexibility to conduct
the multi-pollutant planning exercises including the local-scale toxics evaluation and
regional-scale criteria pollutant analyses.
The current technical tools recommended by USEPA to conduct the necessary local-scale
toxics and regional-scale criteria pollutant modeling analyses are as follows:
Meteorological Models
MM-5 or WRF meteorological model
Emission Data/Tools/Models
Point source inventories (USEPA, RPOs, state-provided)
Area source inventories (USEPA, RPOs, state-provided)
BEIS3 biogenic model
MEGAN
Vehicle Miles Traveled (VMT) estimates (RPOs, state DOT)
MOBILE 6.2 or MOVES mobile emission factor model
NONROAD or MOVES nonroad emission factor model
SMOKE or CONCEPT emissions model for preparing emissions to
be used in the air quality model
EGAS growth factor model or similar tool
Air Quality Models/Tools
CMAQ and/or CAMx air quality model
PAVE or other visualization program for model outputs
AERMOD for local scale analysis (i.e. lead NAAQS)
Supplemental Tools
BenMAP to illustrate PM and Ozone exposure/risk
AirControlNet and any other multi-pollutant control strategy
development tools
EJSEAT Graphics
36
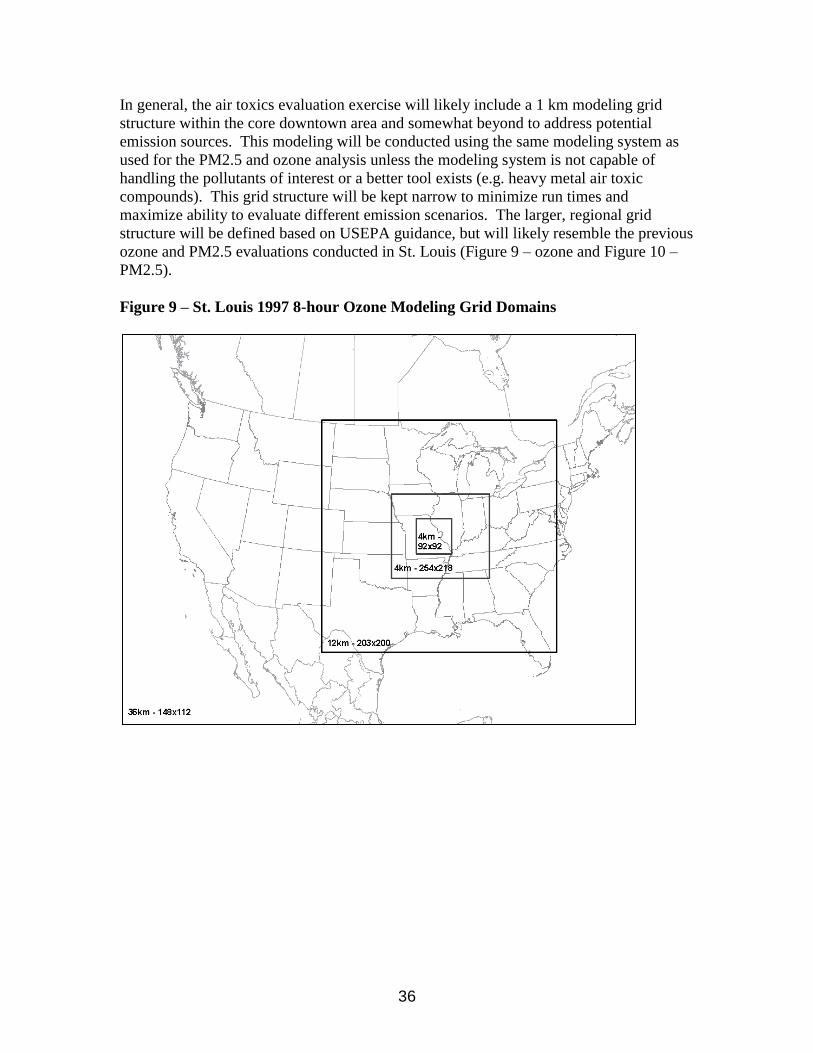
In general, the air toxics evaluation exercise will likely include a 1 km modeling grid
structure within the core downtown area and somewhat beyond to address potential
emission sources. This modeling will be conducted using the same modeling system as
used for the PM2.5 and ozone analysis unless the modeling system is not capable of
handling the pollutants of interest or a better tool exists (e.g. heavy metal air toxic
compounds). This grid structure will be kept narrow to minimize run times and
maximize ability to evaluate different emission scenarios. The larger, regional grid
structure will be defined based on USEPA guidance, but will likely resemble the previous
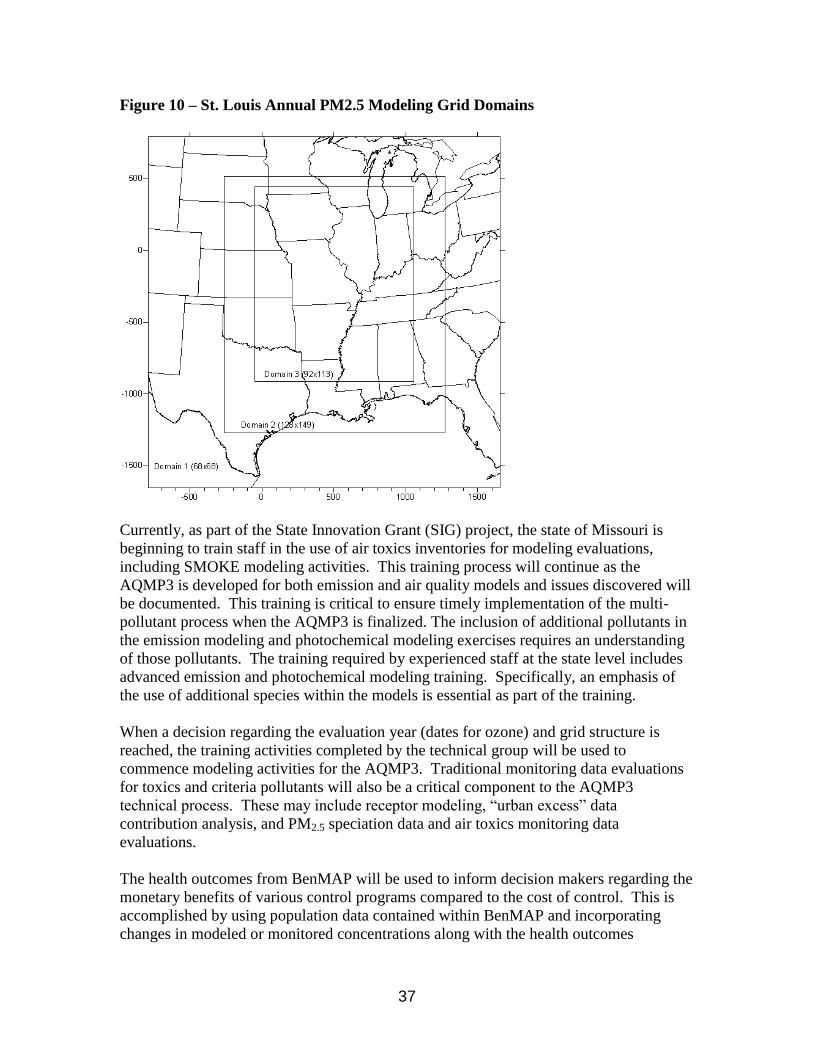
ozone and PM2.5 evaluations conducted in St. Louis (Figure 9 – ozone and Figure 10 –
PM2.5).
Figure 9 – St. Louis 1997 8-hour Ozone Modeling Grid Domains
37
Figure 10 – St. Louis Annual PM2.5 Modeling Grid Domains
Currently, as part of the State Innovation Grant (SIG) project, the state of Missouri is
beginning to train staff in the use of air toxics inventories for modeling evaluations,
including SMOKE modeling activities. This training process will continue as the
AQMP3 is developed for both emission and air quality models and issues discovered will
be documented. This training is critical to ensure timely implementation of the multi-
pollutant process when the AQMP3 is finalized. The inclusion of additional pollutants in
the emission modeling and photochemical modeling exercises requires an understanding
of those pollutants. The training required by experienced staff at the state level includes
advanced emission and photochemical modeling training. Specifically, an emphasis of
the use of additional species within the models is essential as part of the training.
When a decision regarding the evaluation year (dates for ozone) and grid structure is
reached, the training activities completed by the technical group will be used to
commence modeling activities for the AQMP3. Traditional monitoring data evaluations
for toxics and criteria pollutants will also be a critical component to the AQMP3
technical process. These may include receptor modeling, “urban excess” data
contribution analysis, and PM2.5 speciation data and air toxics monitoring data
evaluations.
The health outcomes from BenMAP will be used to inform decision makers regarding the
monetary benefits of various control programs compared to the cost of control. This is
accomplished by using population data contained within BenMAP and incorporating
changes in modeled or monitored concentrations along with the health outcomes

38
associated with those concentration changes. This data will be utilized in conjunction
with the traditional SIP tests (attainment demonstrations, exceedance days per year,
overall concentration reductions, monitoring trend analyses, etc.) to gauge the
effectiveness of control scenarios for all pollutants. As a part of the collaborative effort
for the AQMP3, the Lake Michigan Air Directors Consortium has expressed an interest
and willingness to participate in the BenMAP analysis portion for the St. Louis area.
Other critical components to the implementation of the AQMP3 are the public outreach
component to the plan and the ultimate decision-making necessary for attainment of the
air quality standards under the plan. The public outreach component will be primarily
conducted as part of the on-going Air Quality Advisory Committee (AQAC) through the
East-West Gateway Council of Governments. During the development of SIPs in both
states, the AQAC has been utilized to communicate technical information and policy
decisions to stakeholders including environmental and industry groups. Meetings of this
committee and subcommittees developed to enhance technical information development
are held regularly.
As with any control strategies contemplated under the Clean Air Act, the state agencies
will be required to develop and implement those strategies to bring the St. Louis area into
attainment of the air quality standards. This fact will not change because of the AQMP3,
but the information generated as part of the plan is designed to better inform the decision-
making process. More “public-friendly” air quality metrics will be developed, like
avoided costs of air pollution along with potential reduction in hospital admissions and
cancer exposure risks. This type of cost and health impact information has been utilized
in other areas of the country to simplify the typical air quality metrics such as the
reduction of emissions measured in parts per billion in a 4 kilometer x 4 kilometer
modeled grid cell. It has been the experience of the states that this type of data is not well
understood even with extensive outreach.
39
Section 8
Human Health Indicators/Re-Evaluation of AQMP Process
The AQMP3 will set goals based on NAAQS requirements, air toxics emission
reductions, community health and economic factors. Ambient air monitoring will be
used to determine progress in meeting NAAQS standards. Annual emissions reporting,
vehicle miles traveled, and continued ambient monitoring data will be used to evaluate
progress in reducing air toxics emissions and exposure to the public. Human health
benefits will be calculated based on reductions in exposure to criteria and toxic air
pollution. Economic benefits will be evaluated based on correlations with human health
benefits. However, additional information concerning the costs of implemented controls
and other emission reduction measures will be scrutinized to estimate a ratio of economic
benefit to cost.
Human Health Benefits Tracking
The ultimate goal of the St. Louis AQMP3 is to improve human health and the
environment. One key measure of the success of an AQMP3 is whether the area meets
the NAAQS (attainment). Since the standards are set based on health effects, by default,
this will translate into improved health benefits for a given area.
However, beyond the goal of attainment, the St. Louis AQMP3 team wanted to develop
additional criteria for determining the success of the AQMP3. Since the plan considers
multi-pollutant improvements, as opposed to a single pollutant by pollutant approach, the
challenge is to set a series of reliable, easy to understand public health indicators for a
baseline that can be established prior to implementation of an AQMP3 process. The
indicators must also be readily tracked over time to determine if there is measured
improvement.
To this end, the team evaluated several methods to track the observable public health
benefits from instituting a multipollutant planning approach in the St. Louis area.
Establishing site specific health indicators on such a small scale proved to be too
cumbersome. Instead, the team agreed it would make more sense to use an existing
health tracking network created by the Center for Disease Control (CDC). The CDC’s
National Environmental Public Health Tracking Network was launched in 2009 and can
be accessed at: http://ephtracking.cdc.gov/showHome.action .
The Tracking Network is a multimedia system of integrated health, exposure, and hazard
information and data from a variety of national, state, and city sources. It is designed to
track how environmental contaminants affect public health and provides information on a
host of environmental problems and health issues. The network is an interactive, Internet-
based system that tracks and reports environmental hazards and the health problems that
may be related to them. It currently provides information from health departments in 16
states and one city, which were involved in a pilot program to build local tracking
networks. Missouri is currently a participant and there are plans to include Illinois,
although there is currently no data from the Illinois side of the St. Louis area. Our team
40
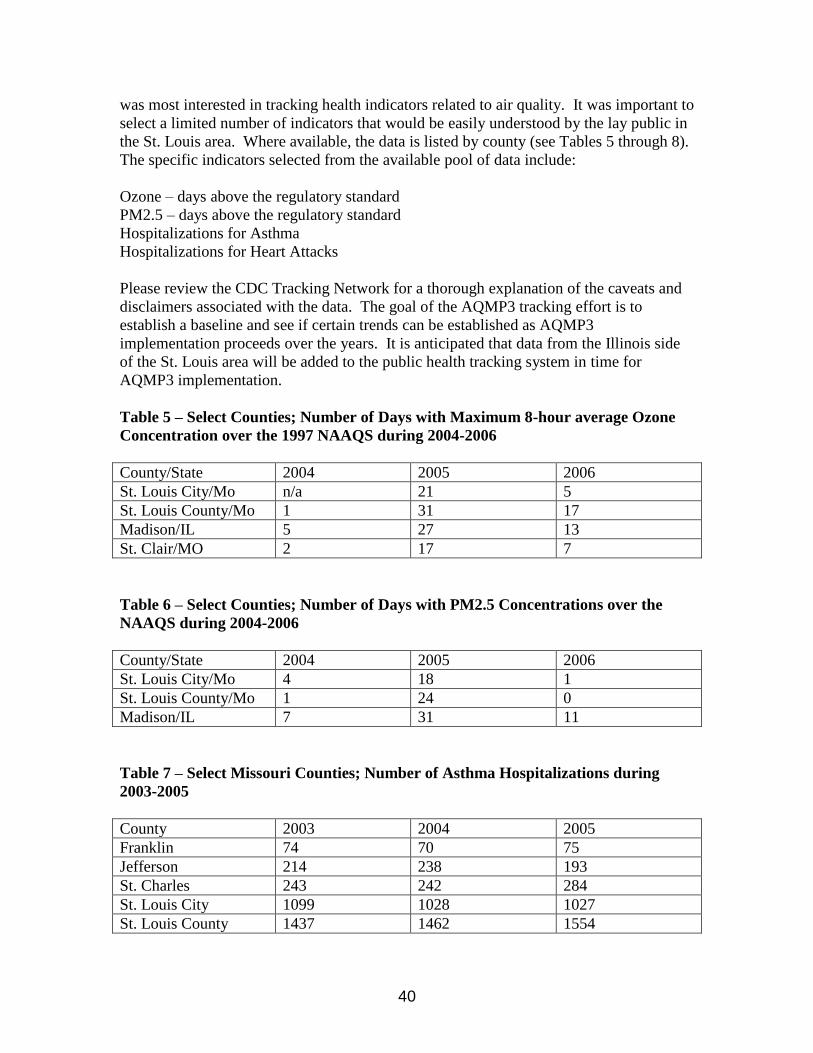
was most interested in tracking health indicators related to air quality. It was important to
select a limited number of indicators that would be easily understood by the lay public in
the St. Louis area. Where available, the data is listed by county (see Tables 5 through 8).
The specific indicators selected from the available pool of data include:
Ozone – days above the regulatory standard
PM2.5 – days above the regulatory standard
Hospitalizations for Asthma
Hospitalizations for Heart Attacks
Please review the CDC Tracking Network for a thorough explanation of the caveats and
disclaimers associated with the data. The goal of the AQMP3 tracking effort is to
establish a baseline and see if certain trends can be established as AQMP3
implementation proceeds over the years. It is anticipated that data from the Illinois side
of the St. Louis area will be added to the public health tracking system in time for
AQMP3 implementation.
Table 5 – Select Counties; Number of Days with Maximum 8-hour average Ozone
Concentration over the 1997 NAAQS during 2004-2006
County/State 2004 2005 2006
St. Louis City/Mo n/a 21 5
St. Louis County/Mo 1 31 17
Madison/IL 5 27 13
St. Clair/MO 2 17 7
Table 6 – Select Counties; Number of Days with PM2.5 Concentrations over the
NAAQS during 2004-2006
County/State 2004 2005 2006
St. Louis City/Mo 4 18 1
St. Louis County/Mo 1 24 0
Madison/IL 7 31 11
Table 7 – Select Missouri Counties; Number of Asthma Hospitalizations during
2003-2005
County 2003 2004 2005
Franklin 74 70 75
Jefferson 214 238 193
St. Charles 243 242 284
St. Louis City 1099 1028 1027
St. Louis County 1437 1462 1554
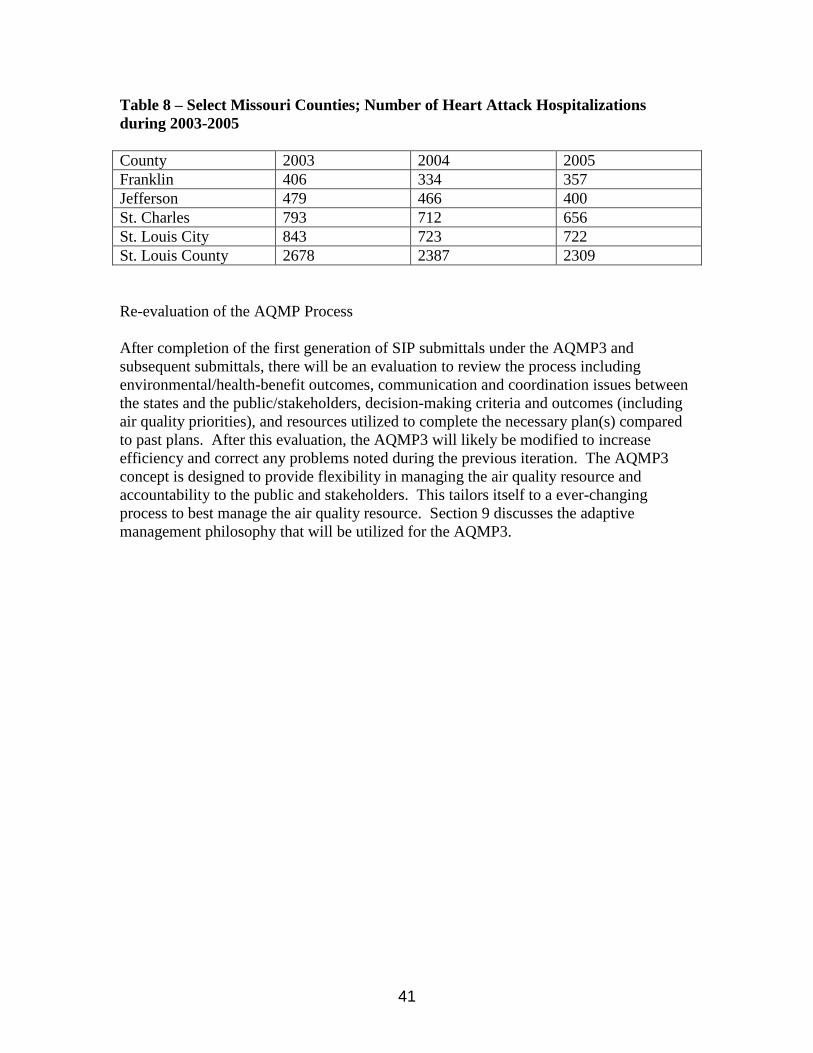
41
Table 8 – Select Missouri Counties; Number of Heart Attack Hospitalizations
during 2003-2005
County 2003 2004 2005
Franklin 406 334 357
Jefferson 479 466 400
St. Charles 793 712 656
St. Louis City 843 723 722
St. Louis County 2678 2387 2309
Re-evaluation of the AQMP Process
After completion of the first generation of SIP submittals under the AQMP3 and
subsequent submittals, there will be an evaluation to review the process including
environmental/health-benefit outcomes, communication and coordination issues between
the states and the public/stakeholders, decision-making criteria and outcomes (including
air quality priorities), and resources utilized to complete the necessary plan(s) compared
to past plans. After this evaluation, the AQMP3 will likely be modified to increase
efficiency and correct any problems noted during the previous iteration. The AQMP3
concept is designed to provide flexibility in managing the air quality resource and
accountability to the public and stakeholders. This tailors itself to a ever-changing
process to best manage the air quality resource. Section 9 discusses the adaptive
management philosophy that will be utilized for the AQMP3.
42
Section 9
Looking Beyond Current Requirements
The AQMP3 team agreed that the AQMP3 must be designed to be flexible enough to
incorporate changing laws, regulations and air quality realities. Adaptive Management is
a decision process that promotes flexible decision making that can be adjusted in the face
of uncertainties as outcomes from management actions and other events become better
understood3. Adaptive Management provides a framework for setting goals, developing
priorities, implementing management actions, evaluating results and adjusting to lessons
learned. The United States Department of Interior has published a technical guide to
define adaptive management and guide its implementation in natural resources
management4; the AQMP3 will incorporate this approach to address changing conditions
in air issues/goals and community health and wellness results.
The AQMP3 has incorporated adaptive management concepts in its implementation and
evaluation of technical achievements. The steps are:
1) Stakeholder involvement – This process has been key to the development of the
AQMP3 and will continue throughout its implementation as described in various
sections throughout this document.
2) Objectives – The objectives of the AQMP3 are driven by achieving compliance
with all the NAAQS, reduction in air toxics exposure when identifying control
strategies for NAAQS compliance and secondary evaluation metrics such as
environmental justice, “smart” growth/transportation planning, and greenhouse
gas emission reduction goals. The primary objectives are specific, measurable,
achievable, results-oriented and time-fixed.
3) Management actions – The AQMP3 will have a wide variety of management
actions available, which will need to be evaluated based on models and outcomes
for effectiveness. The fundamental issues with “management actions” are the
policy ramifications and outcomes of specific actions recommended by the
AQMP3 technical analyses.
4) Models – Models are inherent to the air quality management process and specific
models that will be used on the AQMP3 are identified in Sections 6 and 8.
5) Monitoring plans – The existing (and future) air quality monitoring networks in
both Missouri and Illinois will be used to assess the impacts of management
actions. These plans include on-going air toxics sampling in the metropolitan
area and potentially increased sampling for NO2 and SO2 under the “new”
standards.
6) Decision making – Decisions will be made based on the objectives and technical
analyses, including air quality modeling and monitoring data, with stakeholder
input. As additional monitoring data is collected, decisions will be re-evaluated
for effectiveness.
3 Department of the Interior manual #3786 dated 2/1/08
4 Williams, B. K., R. C. Szaro, and C. D. Shapiro. 2009. Adaptive Management: The U.S. Department of
the Interior Technical Guide. Adaptive Management Working Group, U.S. Department of the Interior,
Washington, DC.
43
7) Follow-up monitoring and human health metric analyses – Air quality monitoring
will continue throughout the AQMP3 implementation. As discussed in Section 8,
Human health and economic indicators will also be used to evaluate the
effectiveness of the management actions and their impacts on the community as a
whole.
8) Assessment – Assessment of the effectiveness of the AQMP3 approach and
decisions made in the process will be conducted as described in Sections 6, 7 and
8. This assessment will include an evaluation of the complex technical analyses
under the AQMP3, but also the outreach component and decision-making
components of the plan. This assessment will generate a formal report on the
AQMP3 process including its benefits and remaining issues/problems.
9) Iteration – The iterative nature of adaptive management will allow the
management actions to be regularly evaluated and adjusted as necessary to
achieve the goals. It also provides the flexibility to revise the goals based on new
NAAQS, new air toxics data, or other priorities such as energy efficiency, smart
growth, and greenhouse gas emissions.
Executive state and local leadership must be committed to the use of this AQMP3
approach and accept the inherent acknowledgement of uncertainty and culture of
experimentation, innovation and learning that are required. Other stakeholders must be
actively involved and committed to the adaptive management approach. At the same
time, the adaptive management process must remain in compliance with specific legal
State and Federal requirements. Of course, the ultimate measure of success is
achievement of the management objectives, in this case attainment of NAAQS standards,
reductions in air toxics exposure and the resulting human health and ecosystem benefits.
Next Steps
The three partners, Missouri, Illinois and EWGCOG, will continue to work towards
implementation of the concepts contained within this AQMP3. The Air Quality Advisory
Committee will serve as the mechanism to allow stakeholder input and discussion of the
most effective strategies to attain NAAQS, reduce public exposure to air toxics and
improve human health and environmental quality in the St. Louis area. As this process
proceeds, AQMP3 specific materials will be posted on the EWGCOG web site as needed
at http://www.ewgateway.org/environment/aq/aq.htm.

44
Appendix 1
Inventory of Local Activities in Support of Air Quality
Introduction
This table lists community based activities that support air quality improvement
efforts in the St. Louis AQMP3 area. For the purposes of the AQMP3, this area
encompasses an eight county, bi-state area represented by the East-West Gateway
Council of Governments. In Missouri, these counties include: Franklin, Jefferson,
St. Charles, St. Louis and the City of St. Louis. In Illinois, the counties include:
Madison, Monroe and St. Clair. The entire metropolitan statistical area contains a
population of approximately 2.7 million people. These voluntary - and in some
cases mandatory - programs help to reduce emissions which can contribute to
overall air quality improvement in the area.
Activity Description Contact/email Website(s) Impact on local Air Quality
1 Local Air Pollution Control Programs
The City of St. Louis operates a local Air Pollution Control Program that has lower thresholds for permitting and regulated activities as well as the ability to impose stricter emission limitations on stationary sources. The Program also conducts outreach and compliance assistance visits. St. Louis County operates a local Air Pollution Control Program that has lower thresholds for permitting and regulated activities as well as the ability to impose stricter emission limitations on stationary sources.
Katina Stewart <[email protected]> Kathrina Donegan [email protected]
http://stlouis.missouri.org/citygov/airpollution/ http://www.stlouisco.com/DOH/environ/airpollut.html
2 Renewable Energy Programs
A number of businesses and local governments in the area participate in the “PURE Power” Program - a renewable energy program run by a local utility company, AmerenUE. The program allows customers to purchase renewable energy credits via their monthly bills. The tracking system ensures that renewable energy is purchased according to the amounts specified by the consumer. This program is “Green-e” certified. Combined Heat and Power (CHP) systems use on site engineering designs that maximize the use of exhaust streams at commercial facilities. CHP systems reduce energy costs and increase efficiencies. There are a total of 18 combined heat and power systems installed in Missouri. There are 139 in Illinois.
n/a
http://www.ameren.com/sites/aue/Environment/PurePower/Pages/PurePower.aspx http://www.green-e.org/ http://www.chpcentermw.org/home.html
Renewable energy purchases include: wind, solar, geothermal, biomass, and hydroelectric. Use of renewable energy results in fewer emissions as compared to traditional sources. NOTE: CHP system installations reflect statewide totals and are not quantified for the St. Louis area.
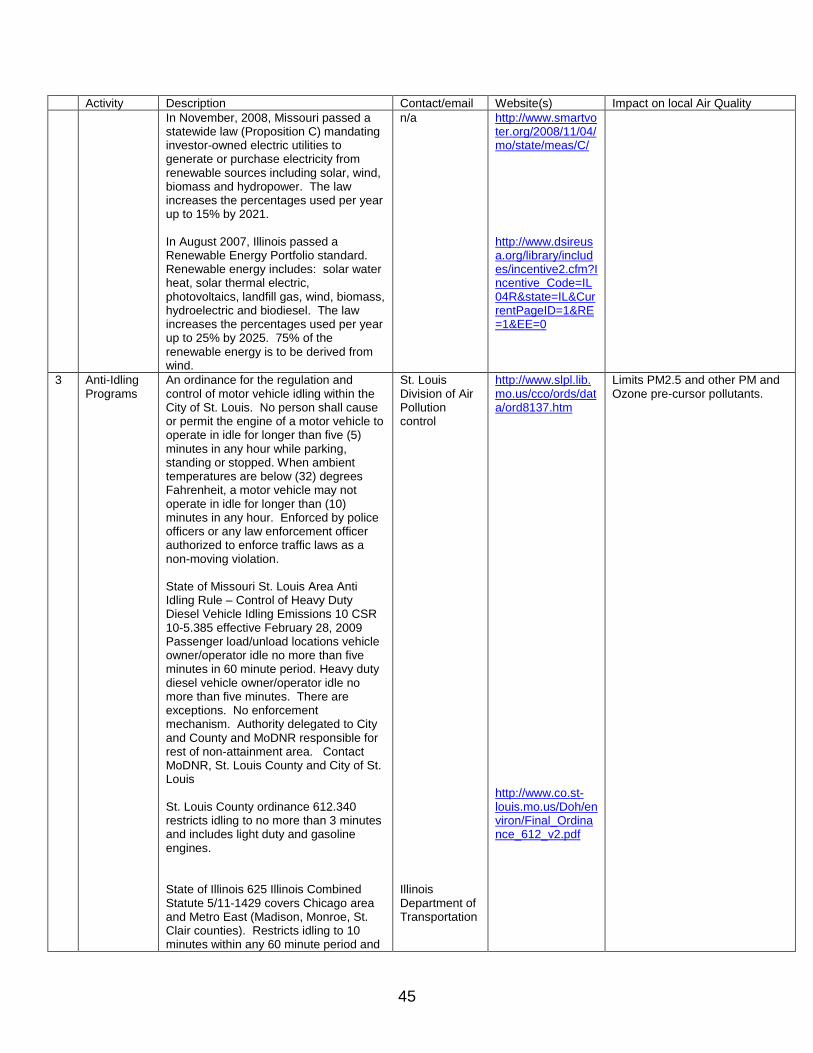
45
Activity Description Contact/email Website(s) Impact on local Air Quality
In November, 2008, Missouri passed a statewide law (Proposition C) mandating investor-owned electric utilities to generate or purchase electricity from renewable sources including solar, wind, biomass and hydropower. The law increases the percentages used per year up to 15% by 2021. In August 2007, Illinois passed a Renewable Energy Portfolio standard. Renewable energy includes: solar water heat, solar thermal electric, photovoltaics, landfill gas, wind, biomass, hydroelectric and biodiesel. The law increases the percentages used per year up to 25% by 2025. 75% of the renewable energy is to be derived from wind.
n/a http://www.smartvoter.org/2008/11/04/mo/state/meas/C/ http://www.dsireusa.org/library/includes/incentive2.cfm?Incentive_Code=IL04R&state=IL&CurrentPageID=1&RE=1&EE=0
3 Anti-Idling Programs
An ordinance for the regulation and control of motor vehicle idling within the City of St. Louis. No person shall cause or permit the engine of a motor vehicle to operate in idle for longer than five (5) minutes in any hour while parking, standing or stopped. When ambient temperatures are below (32) degrees Fahrenheit, a motor vehicle may not operate in idle for longer than (10) minutes in any hour. Enforced by police officers or any law enforcement officer authorized to enforce traffic laws as a non-moving violation. State of Missouri St. Louis Area Anti Idling Rule – Control of Heavy Duty Diesel Vehicle Idling Emissions 10 CSR 10-5.385 effective February 28, 2009 Passenger load/unload locations vehicle owner/operator idle no more than five minutes in 60 minute period. Heavy duty diesel vehicle owner/operator idle no more than five minutes. There are exceptions. No enforcement mechanism. Authority delegated to City and County and MoDNR responsible for rest of non-attainment area. Contact MoDNR, St. Louis County and City of St. Louis St. Louis County ordinance 612.340 restricts idling to no more than 3 minutes and includes light duty and gasoline engines. State of Illinois 625 Illinois Combined Statute 5/11-1429 covers Chicago area and Metro East (Madison, Monroe, St. Clair counties). Restricts idling to 10 minutes within any 60 minute period and
St. Louis Division of Air Pollution control Illinois Department of Transportation
http://www.slpl.lib.mo.us/cco/ords/data/ord8137.htm http://www.co.st-louis.mo.us/Doh/environ/Final_Ordinance_612_v2.pdf
Limits PM2.5 and other PM and Ozone pre-cursor pollutants.
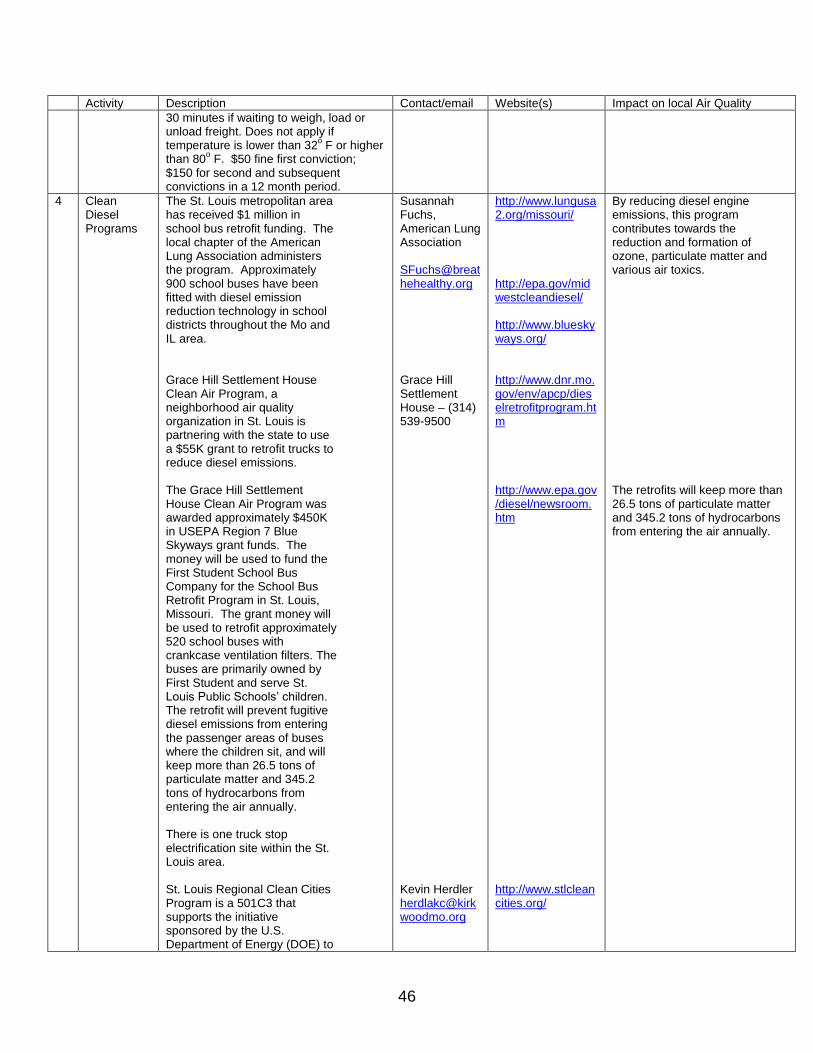
46
Activity Description Contact/email Website(s) Impact on local Air Quality
30 minutes if waiting to weigh, load or unload freight. Does not apply if temperature is lower than 32
o F or higher
than 80o F. $50 fine first conviction;
$150 for second and subsequent convictions in a 12 month period.
4 Clean Diesel Programs
The St. Louis metropolitan area has received $1 million in school bus retrofit funding. The local chapter of the American Lung Association administers the program. Approximately 900 school buses have been fitted with diesel emission reduction technology in school districts throughout the Mo and IL area. Grace Hill Settlement House Clean Air Program, a neighborhood air quality organization in St. Louis is partnering with the state to use a $55K grant to retrofit trucks to reduce diesel emissions. The Grace Hill Settlement House Clean Air Program was awarded approximately $450K in USEPA Region 7 Blue Skyways grant funds. The money will be used to fund the First Student School Bus Company for the School Bus Retrofit Program in St. Louis, Missouri. The grant money will be used to retrofit approximately 520 school buses with crankcase ventilation filters. The buses are primarily owned by First Student and serve St. Louis Public Schools’ children. The retrofit will prevent fugitive diesel emissions from entering the passenger areas of buses where the children sit, and will keep more than 26.5 tons of particulate matter and 345.2 tons of hydrocarbons from entering the air annually. There is one truck stop electrification site within the St. Louis area. St. Louis Regional Clean Cities Program is a 501C3 that supports the initiative sponsored by the U.S. Department of Energy (DOE) to
Susannah Fuchs, American Lung Association [email protected] Grace Hill Settlement House – (314) 539-9500 Kevin Herdler [email protected]
http://www.lungusa2.org/missouri/ http://epa.gov/midwestcleandiesel/ http://www.blueskyways.org/ http://www.dnr.mo.gov/env/apcp/dieselretrofitprogram.htm http://www.epa.gov/diesel/newsroom.htm http://www.stlcleancities.org/
By reducing diesel engine emissions, this program contributes towards the reduction and formation of ozone, particulate matter and various air toxics. The retrofits will keep more than 26.5 tons of particulate matter and 345.2 tons of hydrocarbons from entering the air annually.

47
Activity Description Contact/email Website(s) Impact on local Air Quality
expand the use of vehicles that operate with fuels other than petroleum-based gasoline and diesel. They also work with other organizations to obtain and administer grants for clean diesel retrofits. A recent effort involves promoting the development of charging stations for electric vehicles.
5 Greenhouse Gas Reduction programs
St. Louis is a regional participant in the Climate Prosperity Project, which supports innovation and economic development towards a carbon free future. The mayors of 14 cities in Missouri and Illinois have signed the U.S. Conference of Mayors Climate Protection Agreement. The agreement lays out three main objectives: 1) Strive to meet or beat the Kyoto Protocol targets in their own communities, through actions ranging from anti-sprawl land-use policies to urban forest restoration projects to public information campaigns; 2) Urge their state governments, and the federal government, to enact policies and programs to meet or beat the greenhouse gas emission reduction target suggested for the United States in the Kyoto Protocol -- 7% reduction from 1990 levels by 2012; and 3) Urge the U.S. Congress to pass the bipartisan greenhouse gas reduction legislation, which would establish a national emission trading system
http://www.climateprosperityproject.org/index.htm http://www.usmayors.org/climateprotection/ Participating Cities within the St. Louis area Alton, IL – www.alton-il.net Edwardsville, IL – www.cityofedwardsville.com South Roxana, IL – www.southroxana.net St. Louis, MO – www.stlouis.missouri.org/government Lake Saint Louis, MO – www.lakesaintlouis.com St. Peters, MO – www.stpetersmo.net Clayton, MO – www.ci.clayton.mo.us Creve Coeur, MO – www.creve-coeur.org Florissant, MO – www.florissantmo.com Kirkwood, MO –
Advocates energy efficiency programs, use of alternative energy, etc, resulting in lower Ozone and PM2.5 precursor emissions.

48
Activity Description Contact/email Website(s) Impact on local Air Quality
Illinois participates in the Midwest Governors Greenhouse Gas Reduction Accord. The Accord seeks to explore options towards creating a regional greenhouse gas cap and trade program. A recommendations document and model rule were completed in May, 2010. Illinois previously had a Climate Change Advisory Group, created by Executive Order 2006-11 in 2006. The group made its final recommendations to the governor on September 6, 2007. The recommendations address GHG reduction policy options for various sectors including transportation, electric, rail, agriculture & local government.
www.kirkwoodmo.org Maplewood, MO – www.ci.maplewood.mo.us Overland, MO – www.overlandmo.org Sunset Hills, MO – www.sunset-hills.com University City, MO – www.ucitymo.org http://www.midwesternaccord.org/ http://www.epa.state.il.us/air/climatechange/documents/final-recommendations.html
6 Green Buildings Program
U.S. Green Building Council St. Louis Regional Chapter Focus – to increase LEED-registered and certified buildings; facilitating professional development and accreditation; and promoting practical green standards. City of St. Louis Board Bill 323 (signed into law February 20, 2007) Directed Board of Public Service to adopt LEED Green Building Rating System for newly constructed city-owned facilities greater than 5,000 square feet. Buildings are to meet the LEED Silver level of certification as a minimum threshold of building performance. Board of Public Service also is to apply LEED principles during retrofit and renovation projects of current standing facilities whenever it is practical. Ordinance 67414: An ordinance directing the Board of Public Service to adopt Leadership in Energy and Environmental Design (LEED) Green Building rating system for all newly constructed and
Executive Director - Emily Andrews of Missouri Botanical Garden [email protected]
http://www.usgbc-stl.org/ http://www.slpl.lib.mo.us/cco/ords/data/ord7414.htm
Green Building programs help to reduce the amount of energy used, resulting in lower greenhouse gas emissions.
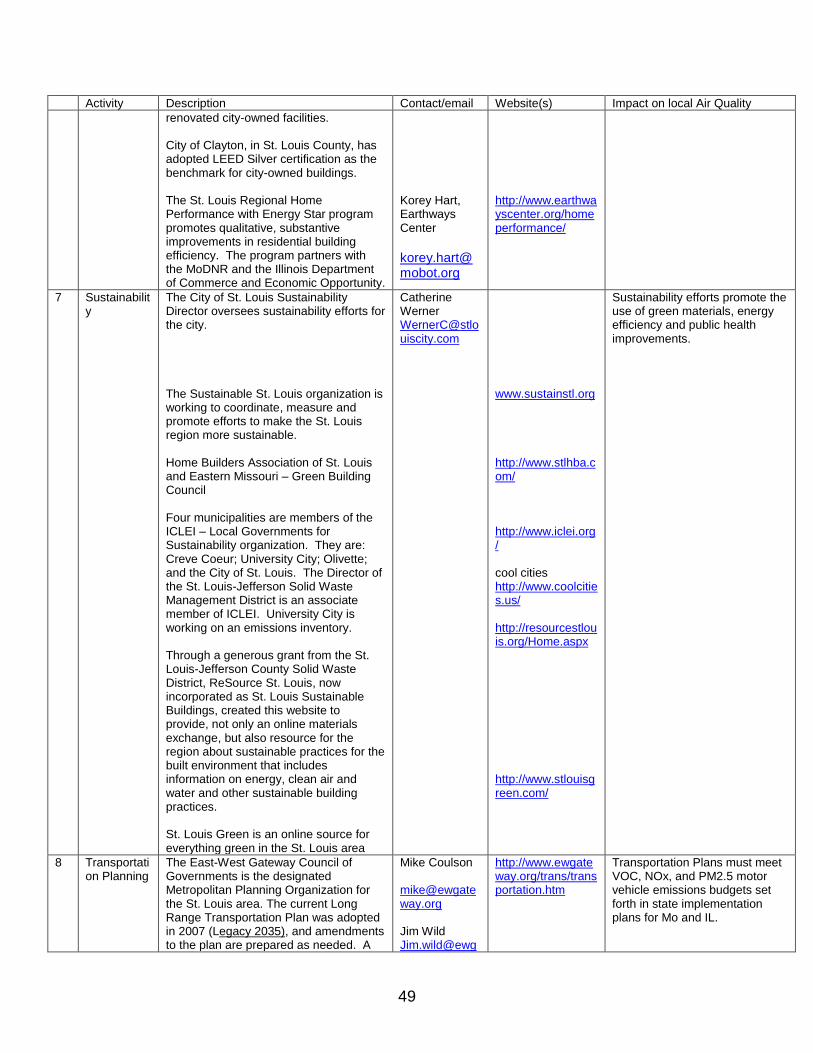
49
Activity Description Contact/email Website(s) Impact on local Air Quality
renovated city-owned facilities. City of Clayton, in St. Louis County, has adopted LEED Silver certification as the benchmark for city-owned buildings. The St. Louis Regional Home Performance with Energy Star program promotes qualitative, substantive improvements in residential building efficiency. The program partners with the MoDNR and the Illinois Department of Commerce and Economic Opportunity.
Korey Hart, Earthways Center
http://www.earthwayscenter.org/homeperformance/
7 Sustainability
The City of St. Louis Sustainability Director oversees sustainability efforts for the city. The Sustainable St. Louis organization is working to coordinate, measure and promote efforts to make the St. Louis region more sustainable. Home Builders Association of St. Louis and Eastern Missouri – Green Building Council Four municipalities are members of the ICLEI – Local Governments for Sustainability organization. They are: Creve Coeur; University City; Olivette; and the City of St. Louis. The Director of the St. Louis-Jefferson Solid Waste Management District is an associate member of ICLEI. University City is working on an emissions inventory. Through a generous grant from the St. Louis-Jefferson County Solid Waste District, ReSource St. Louis, now incorporated as St. Louis Sustainable Buildings, created this website to provide, not only an online materials exchange, but also resource for the region about sustainable practices for the built environment that includes information on energy, clean air and water and other sustainable building practices. St. Louis Green is an online source for everything green in the St. Louis area
Catherine Werner [email protected]
www.sustainstl.org http://www.stlhba.com/ http://www.iclei.org/ cool cities http://www.coolcities.us/ http://resourcestlouis.org/Home.aspx http://www.stlouisgreen.com/
Sustainability efforts promote the use of green materials, energy efficiency and public health improvements.
8 Transportation Planning
The East-West Gateway Council of Governments is the designated Metropolitan Planning Organization for the St. Louis area. The current Long Range Transportation Plan was adopted in 2007 (Legacy 2035), and amendments to the plan are prepared as needed. A
Mike Coulson [email protected] Jim Wild Jim.wild@ewg
http://www.ewgateway.org/trans/transportation.htm
Transportation Plans must meet VOC, NOx, and PM2.5 motor vehicle emissions budgets set forth in state implementation plans for Mo and IL.
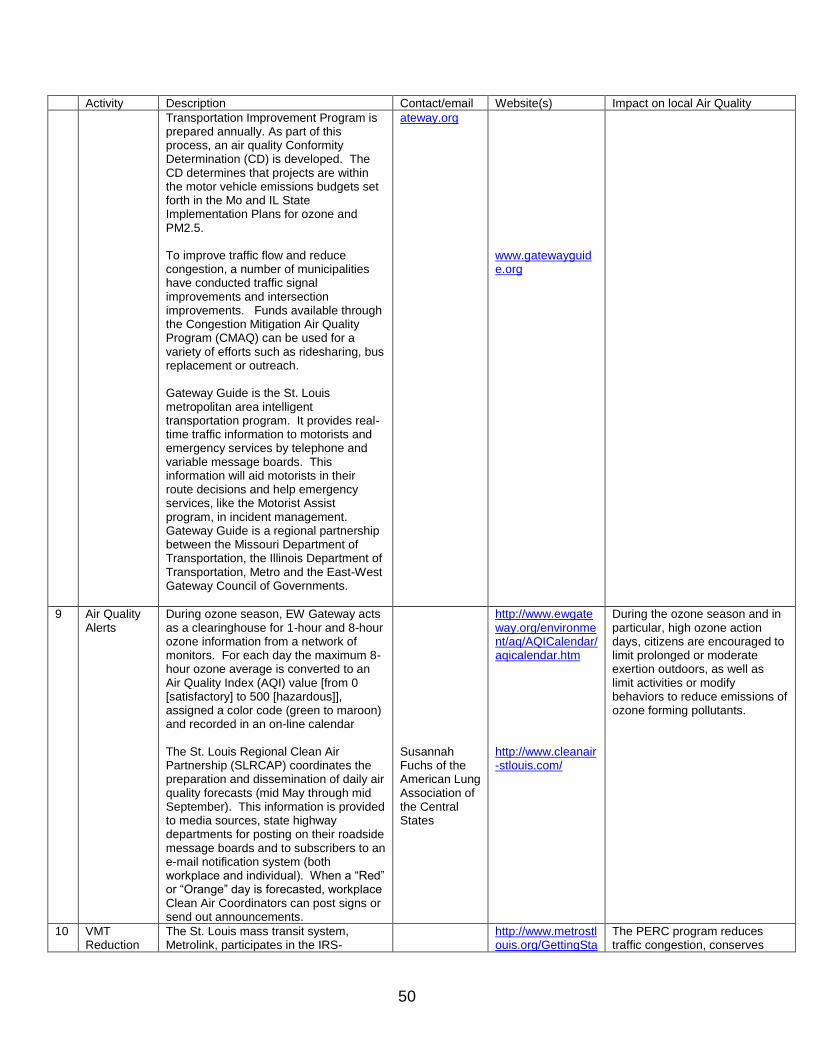
50
Activity Description Contact/email Website(s) Impact on local Air Quality
Transportation Improvement Program is prepared annually. As part of this process, an air quality Conformity Determination (CD) is developed. The CD determines that projects are within the motor vehicle emissions budgets set forth in the Mo and IL State Implementation Plans for ozone and PM2.5. To improve traffic flow and reduce congestion, a number of municipalities have conducted traffic signal improvements and intersection improvements. Funds available through the Congestion Mitigation Air Quality Program (CMAQ) can be used for a variety of efforts such as ridesharing, bus replacement or outreach. Gateway Guide is the St. Louis metropolitan area intelligent transportation program. It provides real-time traffic information to motorists and emergency services by telephone and variable message boards. This information will aid motorists in their route decisions and help emergency services, like the Motorist Assist program, in incident management. Gateway Guide is a regional partnership between the Missouri Department of Transportation, the Illinois Department of Transportation, Metro and the East-West Gateway Council of Governments.
ateway.org
www.gatewayguide.org
9 Air Quality Alerts
During ozone season, EW Gateway acts as a clearinghouse for 1-hour and 8-hour ozone information from a network of monitors. For each day the maximum 8-hour ozone average is converted to an Air Quality Index (AQI) value [from 0 [satisfactory] to 500 [hazardous]], assigned a color code (green to maroon) and recorded in an on-line calendar The St. Louis Regional Clean Air Partnership (SLRCAP) coordinates the preparation and dissemination of daily air quality forecasts (mid May through mid September). This information is provided to media sources, state highway departments for posting on their roadside message boards and to subscribers to an e-mail notification system (both workplace and individual). When a “Red” or “Orange” day is forecasted, workplace Clean Air Coordinators can post signs or send out announcements.
Susannah Fuchs of the American Lung Association of the Central States
http://www.ewgateway.org/environment/aq/AQICalendar/aqicalendar.htm http://www.cleanair-stlouis.com/
During the ozone season and in particular, high ozone action days, citizens are encouraged to limit prolonged or moderate exertion outdoors, as well as limit activities or modify behaviors to reduce emissions of ozone forming pollutants.
10 VMT Reduction
The St. Louis mass transit system, Metrolink, participates in the IRS-
http://www.metrostlouis.org/GettingSta
The PERC program reduces traffic congestion, conserves

51
Activity Description Contact/email Website(s) Impact on local Air Quality
program authorized “Partial Expense Reduction for Commuters” (PERC) program. Local businesses and city governments can provide up to $110/month to offset public transit costs. Approximately 6500 commuters participate in this program at more than 100 local area employers. RideFinders is the regional rideshare program sponsored by the Madison County Transit District (MCT). Over 1400 employers promote ridesharing (carpools or vanpools) and over 8000 commuters are sharing the ride. RideFinders also provides a Guaranteed Ride Home service for participants. The Citizens for Modern Transit (CMT) organization promotes use of mass transit (bus and light rail). Employers can sign up for a Guaranteed Ride Home program which their employees, if registered, can utilize. Another program offered by CMT is the Ten Toes Express. It is designed to link walking with using light rail or the bus for the work commute. To encourage sharing the ride, both State DOTs have constructed park and ride lots in the outer parts of the region. Both Metro and MCT have built and operate multi-modal transit centers. The original MetroLink light rail transit line runs from Lambert Airport to Scott Air Force Base. The Cross County extension runs from St. Louis to Clayton and on to Shrewsbury. Metro has replaced some of its fleet with CNG buses. The St. Louis Regional Clean Cities Program is a voluntary initiative which promotes alternative fuels, advanced vehicles, fuel blends, fuel economy, hybrid vehicles and idle reduction. It is composed of fleet owners/operators, fuel and vehicle industry representatives and local governments. The goals of the Clean Cities Program are to reduce dependence on foreign oil, improve air quality and promote economic development in the St. Louis region.
Kevin Herdler is the Executive Director of the St. Louis Regional Clean Cities Program [email protected]
rted/TryTransit/trytransit.asp?promoID=10 www.stlouiscleancities.org
energy and reduces vehicle emissions.
11 Biking and Walking Programs
Trailnet is a St. Louis based community group that encourages the consideration of biking and pedestrian trails in community planning. In conjunction with the East-West Gateway Council of Governments, the group has actively promoted outreach and public education events, encouraging biking for transportation where feasible.
http://www.trailnet.org/ourportfolio.php
Reducing vehicle use results in lower ozone, PM and VOC emissions.
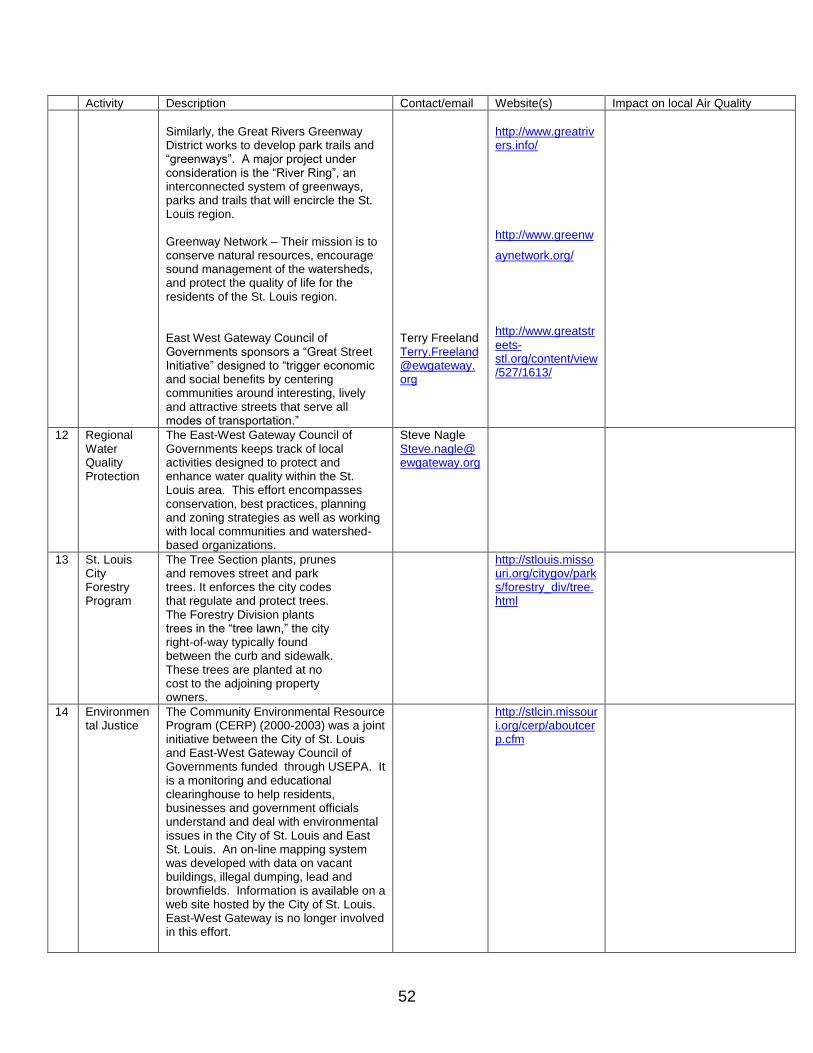
52
Activity Description Contact/email Website(s) Impact on local Air Quality
Similarly, the Great Rivers Greenway District works to develop park trails and “greenways”. A major project under consideration is the “River Ring”, an interconnected system of greenways, parks and trails that will encircle the St. Louis region. Greenway Network – Their mission is to conserve natural resources, encourage sound management of the watersheds, and protect the quality of life for the residents of the St. Louis region. East West Gateway Council of Governments sponsors a “Great Street Initiative” designed to “trigger economic and social benefits by centering communities around interesting, lively and attractive streets that serve all modes of transportation.”
Terry Freeland [email protected]
http://www.greatrivers.info/
http://www.greenw
aynetwork.org/
http://www.greatstreets-stl.org/content/view/527/1613/
12 Regional Water Quality Protection
The East-West Gateway Council of Governments keeps track of local activities designed to protect and enhance water quality within the St. Louis area. This effort encompasses conservation, best practices, planning and zoning strategies as well as working with local communities and watershed-based organizations.
Steve Nagle [email protected]
13 St. Louis City Forestry Program
The Tree Section plants, prunes and removes street and park trees. It enforces the city codes that regulate and protect trees. The Forestry Division plants trees in the “tree lawn,” the city right-of-way typically found between the curb and sidewalk. These trees are planted at no cost to the adjoining property owners.
http://stlouis.missouri.org/citygov/parks/forestry_div/tree.html
14 Environmental Justice
The Community Environmental Resource Program (CERP) (2000-2003) was a joint initiative between the City of St. Louis and East-West Gateway Council of Governments funded through USEPA. It is a monitoring and educational clearinghouse to help residents, businesses and government officials understand and deal with environmental issues in the City of St. Louis and East St. Louis. An on-line mapping system was developed with data on vacant buildings, illegal dumping, lead and brownfields. Information is available on a web site hosted by the City of St. Louis. East-West Gateway is no longer involved in this effort.
http://stlcin.missouri.org/cerp/aboutcerp.cfm
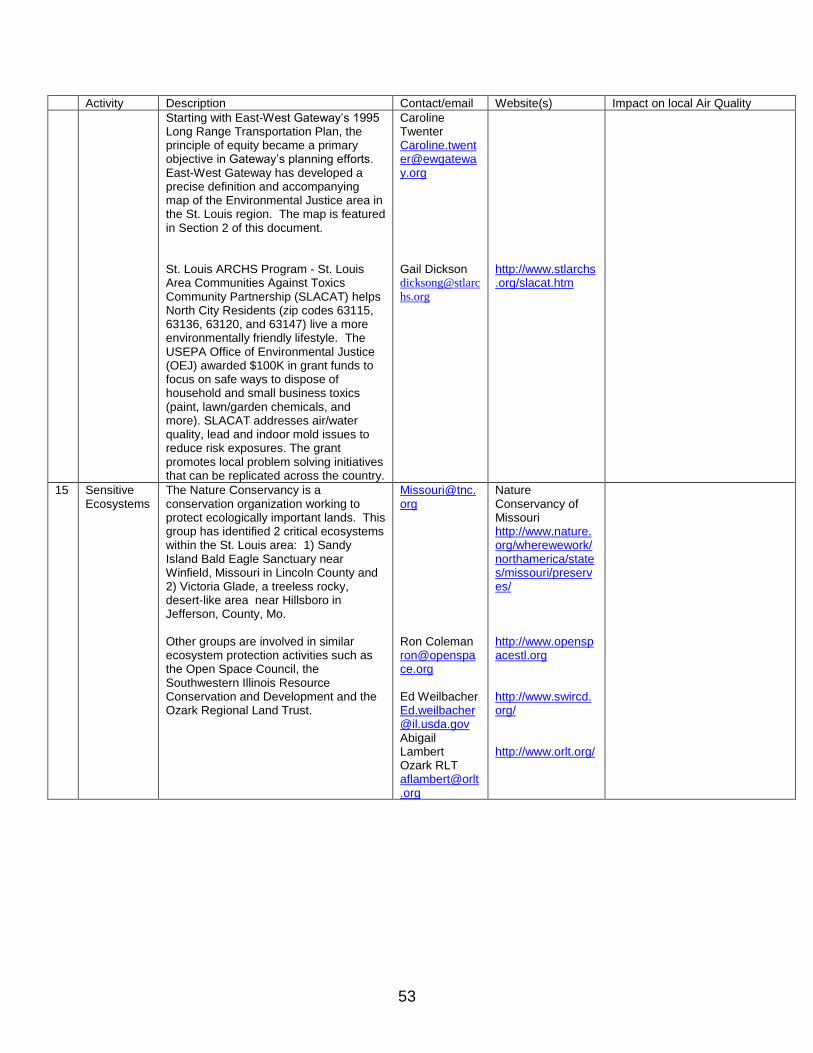
53
Activity Description Contact/email Website(s) Impact on local Air Quality
Starting with East-West Gateway’s 1995 Long Range Transportation Plan, the principle of equity became a primary objective in Gateway’s planning efforts. East-West Gateway has developed a precise definition and accompanying map of the Environmental Justice area in the St. Louis region. The map is featured in Section 2 of this document. St. Louis ARCHS Program - St. Louis Area Communities Against Toxics Community Partnership (SLACAT) helps North City Residents (zip codes 63115, 63136, 63120, and 63147) live a more environmentally friendly lifestyle. The USEPA Office of Environmental Justice (OEJ) awarded $100K in grant funds to focus on safe ways to dispose of household and small business toxics (paint, lawn/garden chemicals, and more). SLACAT addresses air/water quality, lead and indoor mold issues to reduce risk exposures. The grant promotes local problem solving initiatives that can be replicated across the country.
Caroline Twenter [email protected] Gail Dickson dicksong@stlarc
hs.org
http://www.stlarchs.org/slacat.htm
15 Sensitive Ecosystems
The Nature Conservancy is a conservation organization working to protect ecologically important lands. This group has identified 2 critical ecosystems within the St. Louis area: 1) Sandy Island Bald Eagle Sanctuary near Winfield, Missouri in Lincoln County and 2) Victoria Glade, a treeless rocky, desert-like area near Hillsboro in Jefferson, County, Mo. Other groups are involved in similar ecosystem protection activities such as the Open Space Council, the Southwestern Illinois Resource Conservation and Development and the Ozark Regional Land Trust.
[email protected] Ron Coleman [email protected] Ed Weilbacher [email protected] Abigail Lambert Ozark RLT [email protected]
Nature Conservancy of Missouri http://www.nature.org/wherewework/northamerica/states/missouri/preserves/ http://www.openspacestl.org http://www.swircd.org/ http://www.orlt.org/