appendix 2 - lake george - wattle range council range council appendix 2 - lake george groyne...
TRANSCRIPT

WATTLE RANGE COUNCIL
Appendix 2 - Lake George
Groyne Extension Concept Design
301015-03541 – 002
28-Oct-2015
Infrastructure Level 12, 141 Walker Street, North Sydney NSW 2060 Australia Telephone: +61 2 8923-6866 Facsimile: +61 2 8923-6877 www.worleyparsons.com ABN 61 001 279 812
© Copyright 2014 WorleyParsons Services Pty Ltd

WATTLE RANGE COUNCIL
APPENDIX 2 - LAKE GEORGE
GROYNE EXTENSION CONCEPT DESIGN
PROJECT 301015-03541 - APPENDIX 2 - LAKE GEORGE
REV DESCRIPTION ORIG REVIEW WORLEY- PARSONS APPROVAL
DATE CLIENT APPROVAL
DATE
A Issued for internal review
C Adamantidis
A Nielsen
A Nielsen
29-Nov14 N/A
B Draft
C Adamantidis
A Nielsen
A Nielsen
29-Nov-14
C Final
C Adamantidis
A Nielsen
A Nielsen
28-Oct-15
c:\users\chris.adamantidis\documents\projects\lake george\draft report\for submission\final\appendix 2.docm Document No : 002 Page ii
Disclaimer
This report has been prepared on behalf of and for the exclusive use of Wattle Range Council,
and is subject to and issued in accordance with the agreement between Wattle Range Council
and WorleyParsons. WorleyParsons accepts no liability or responsibility whatsoever for it in
respect of any use of or reliance upon this report by any third party.
Copying this report without the permission of Wattle Range Council and WorleyParsons is not
permitted.
WATTLE RANGE COUNCIL
APPENDIX 2 - LAKE GEORGE
GROYNE EXTENSION CONCEPT DESIGN
Appendix 2.docm Page 1 28 October 2015
CONTENTS
1 METHODOLOGY................................................................................................................ 2
2 WAVE MODELLING ........................................................................................................... 3
2.1 SWAN Model Results ......................................................................................................... 3
2.2 SBEACH Modelling ............................................................................................................. 4
2.2.1 Results ................................................................................................................... 5
3 HYDRAULIC ARMOUR STABILITY OF ROCK GROYNES .............................................. 6
3.1 Rock Armour Stability ......................................................................................................... 6
3.2 Underlayers ......................................................................................................................... 8
3.3 Toe level ............................................................................................................................. 8
3.4 Length of groynes ............................................................................................................... 8
4 REFERENCES ................................................................................................................. 10
WATTLE RANGE COUNCIL
APPENDIX 2 - LAKE GEORGE
GROYNE EXTENSION CONCEPT DESIGN
Appendix 2.docm Page 2 28 October 2015
1 METHODOLOGY
This Appendix presents the derivation of the estimated wave conditions in the nearshore area of the
Beachport for the conceptual design of the groyne extensions at the outlet to Lake George.
The nearshore design wave estimates were based on the transformation of offshore wave conditions
through numerical modelling to the project site. The principal aim of establishing the extreme wave
conditions is to provide initial estimates of design wave conditions for the existing coastal structures
along the Beachport foreshore. The offshore boundary conditions were based on published extreme
wave data collected by offshore wave buoys and metocean hindcasts.
It should be noted that numerical models as applied herein are a tool that can provide estimates of
the physical response of the coastal system, based on its calibration and capacity to replicate
measured phenomena. The models used herein provide an estimate of the design nearshore water
levels and wave heights that would apply at the various coastal structures and are thus applicable for
assessment of their structural stability and conceptual design of an upgrade of the structures. It
should be noted that there can be departures between a model output and the actual physical
response, as not all processes are able to be replicated by numerical approximations. However, the
model results provide the best available estimates of the design parameters for assessment of the
performance of the coastal structures.
Nearshore wave conditions were derived using a 3rd
generation 2D(H) spectral wave model (SWAN).
As the spectral wave model is not able to model wave induced setup, a 1D roller model, which is able
to model wave induced setup (SBEACH), was used to transform the nearshore wave conditions to the
shore. The use of the SWAN and SBEACH models together provides a three dimensional solution
algorithm for wave transformation across the surf zone to shore and gives a far better result than that
obtained from a 1D solution alone, such as GENESIS or LITPAC.
Armour stability for the existing structures was assessed using the Hudson equations with the derived
nearshore design wave height for the 1 year, 10 year and 100 year ARI wave events.
WATTLE RANGE COUNCIL
APPENDIX 2 - LAKE GEORGE
GROYNE EXTENSION CONCEPT DESIGN
Appendix 2.docm Page 3 28 October 2015
2 WAVE MODELLING
Both SWAN and SBEACH models were used for the wave transformation modelling. The SWAN
model (version 40.85) (Delft University of Technology, 2011) was used to derive transformed
nearshore wave heights for the range of offshore wave directions and periods comprising the long
term wave climate to establish suitable input boundary conditions for the SBEACH surfzone wave
transformation model. The SBEACH model was utilised to describe in detail the surfzone wave
transformation processes for the determination of nearshore wave setup water levels and wave
heights at the structures, necessary for assessment of their structural stability.
The SWAN and SBEACH wave transformation modelling is presented in detail in the Rivoli Bay Study
(WorleyParsons 2014).
2.1 SWAN Model Results
The SWAN model was run for an offshore wave height of 1 m (to obtain wave height coefficients), for
all wave directions ranging from south to north-east. It was found that the largest wave height
coefficients occurred when the offshore wave direction was from the south at Beachport. WRL (2013)
found that the highest significant wave heights along the coastline adjacent to western Victoria occur
from the west-southwest directions (225 – 270°). WRL (2012) adopted a 10 year ARI significant wave
height of 5.9 m for this section of coast for directions between east and south compared with a much
higher significant wave height of 9.5 m for waves from the west. Despite waves from the south being
lower offshore than waves from the west, due to wave refraction around Penguin Island, southerly
waves result in the highest waves at the Beachport shoreline.
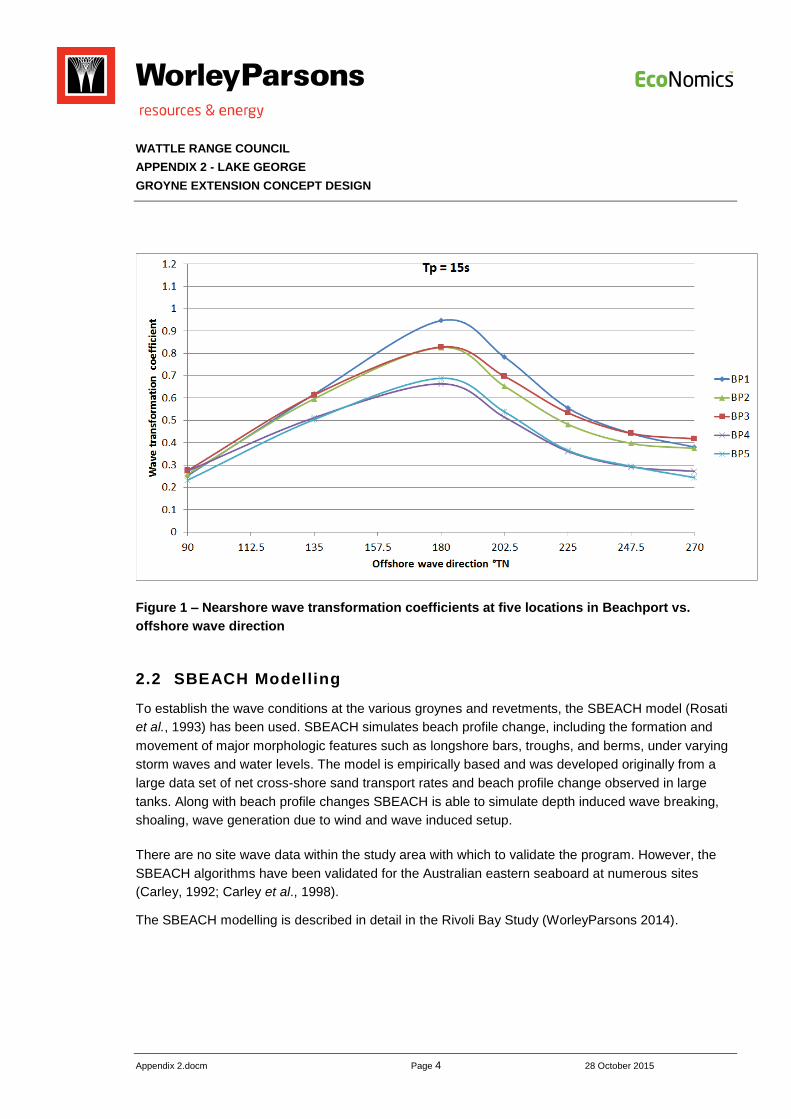
Wave transformation coefficients for a peak wave period of 15 s at selected nearshore locations in
3 m water depth at Beachport for the range of offshore wave directions modelled are illustrated in
Figure 1. It can be seen from these plots that at Beachport, the peak wave energy arrives at the
foreshore when offshore wave direction is from the south.
WATTLE RANGE COUNCIL
APPENDIX 2 - LAKE GEORGE
GROYNE EXTENSION CONCEPT DESIGN
Appendix 2.docm Page 4 28 October 2015
Figure 1 – Nearshore wave transformation coefficients at five locations in Beachport vs.
offshore wave direction
2.2 SBEACH Modelling
To establish the wave conditions at the various groynes and revetments, the SBEACH model (Rosati
et al., 1993) has been used. SBEACH simulates beach profile change, including the formation and
movement of major morphologic features such as longshore bars, troughs, and berms, under varying
storm waves and water levels. The model is empirically based and was developed originally from a
large data set of net cross-shore sand transport rates and beach profile change observed in large
tanks. Along with beach profile changes SBEACH is able to simulate depth induced wave breaking,
shoaling, wave generation due to wind and wave induced setup.
There are no site wave data within the study area with which to validate the program. However, the
SBEACH algorithms have been validated for the Australian eastern seaboard at numerous sites
(Carley, 1992; Carley et al., 1998).
The SBEACH modelling is described in detail in the Rivoli Bay Study (WorleyParsons 2014).
WATTLE RANGE COUNCIL
APPENDIX 2 - LAKE GEORGE
GROYNE EXTENSION CONCEPT DESIGN
Appendix 2.docm Page 5 28 October 2015
2.2.1 Results
As the wave conditions are depth limited, the design wave for the structures would be the largest
wave that breaks on the structure. This corresponds to the largest wave that is half a wavelength
seaward of the seawall or groyne.
The SBEACH model allows the determination of nearshore water level conditions to be estimated,
including the effects of wave setup. Based on these water levels, a maximum breaking wave height at
each of the groynes was able to be estimated. As the nearshore wave height is controlled by the
water depth, there is an increase in wave height in front of the structures with the rarer events, which
is due to the influence of wave setup. Given the relatively small water depths involved, it is clear that
climate change sea level rise has the potential to increase significantly the size of the incident
breaking wave heights.
The most important parameters for assessing the stability of the groynes and revetments are the
breaking wave height in front of the structure, the scour level at the structure toe and the water level
at the structure. These parameters determine the effectiveness of the existing works, such as the
stability of the existing rock armour and the probability that the structures would be overtopped. The
results from the SBEACH model provide the variation in these design parameters along the entire
foreshore at Beachport. Generally:
The present day maximum wave height approaching the structures at Beachport ranges from
0.9 – 2.0 m for the 1 year ARI, 1.5 – 2.4 m for the 10 year ARI and 1.9 – 2.7 m for the 100
year ARI storm events. These wave heights do not include shoaling – the breaking wave
height (Hb) at the structures would be larger than these due to shoaling, which is derived
separately.
The maximum water levels (including the effects of wave setup at the foreshore) vary from
2.3 – 3.7 m AHD for the 1 year ARI, 2.6 – 4.4 m for the 10 year ARI event and 3.0 – 5.1 m for
the 100 year ARI event. Wave setup at the foreshore is significant in the extreme events due
to the shallow nature of Rivoli Bay and extensive wave breaking that occurs during these
events.
The largest wave heights occur where the coastal structures are located furthest seaward along the
beach profile (i.e. at the Beachport jetty), due to the profile being deeper at these locations. The
variation in wave height along the foreshore is a function of the nearshore water depth at a point half
a wavelength in front of the foreshore structures. Water level variations between profiles are a
function of the wave setup calculated by SBEACH at the measurement point half a wavelength in
front of the structures. The maximum wave heights obtained from SBEACH (not including shoaling)
were found to be around 2.5 m – with shoaling, this would result in a breaking wave height at the
structure of around 3.7 m for a 100 year ARI event.
WATTLE RANGE COUNCIL
APPENDIX 2 - LAKE GEORGE
GROYNE EXTENSION CONCEPT DESIGN
Appendix 2.docm Page 6 28 October 2015
3 HYDRAULIC ARMOUR STABILITY OF ROCK GROYNES
The results of the wave modelling have been used to assess the size of rock required to protect the
groyne extensions against wave attack, for the 1 year, 10 year and 100 year ARI storm events.
3.1 Rock Armour Stability
The stability of the primary armour against wave attack has been assessed using the Hudson
equation. Another commonly used formulation for rock armour sizing is the Van der Meer equation.
This equation, however, is only applicable for deep water conditions (i.e. where the depth in front of
the structure is greater than three times the significant wave height in front of the structure, CIRIA,
CUR, CETMEF 2007). The conditions at the groynes and revetments are shallow water conditions
and the structures will be subject to breaking waves. Hence, the van der Meer formulae are
inappropriate for use in assessing the structure stability and the Hudson formula has been used for
the calculation of the requisite armour size for the structure.
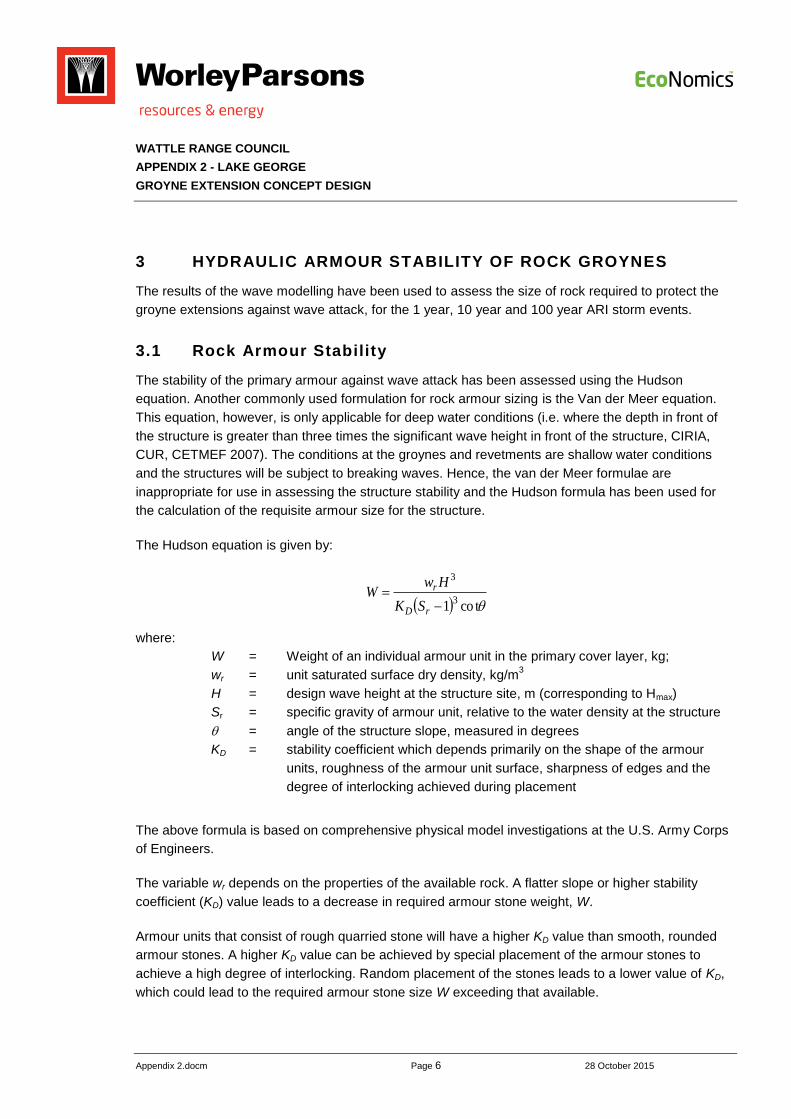
The Hudson equation is given by:
co t1
3
3
rD
r
SK
HwW
where:
W = Weight of an individual armour unit in the primary cover layer, kg;
wr = unit saturated surface dry density, kg/m3
H = design wave height at the structure site, m (corresponding to Hmax)
Sr = specific gravity of armour unit, relative to the water density at the structure
= angle of the structure slope, measured in degrees
KD = stability coefficient which depends primarily on the shape of the armour
units, roughness of the armour unit surface, sharpness of edges and the
degree of interlocking achieved during placement
The above formula is based on comprehensive physical model investigations at the U.S. Army Corps
of Engineers.
The variable wr depends on the properties of the available rock. A flatter slope or higher stability
coefficient (KD) value leads to a decrease in required armour stone weight, W.
Armour units that consist of rough quarried stone will have a higher KD value than smooth, rounded
armour stones. A higher KD value can be achieved by special placement of the armour stones to
achieve a high degree of interlocking. Random placement of the stones leads to a lower value of KD,
which could lead to the required armour stone size W exceeding that available.
WATTLE RANGE COUNCIL
APPENDIX 2 - LAKE GEORGE
GROYNE EXTENSION CONCEPT DESIGN
Appendix 2.docm Page 7 28 October 2015
Incorporated within the KD value are variables such as the angle of incidence of wave attack, size and
porosity of the underlayer material, revetment crest width and the extent of the revetment slope below
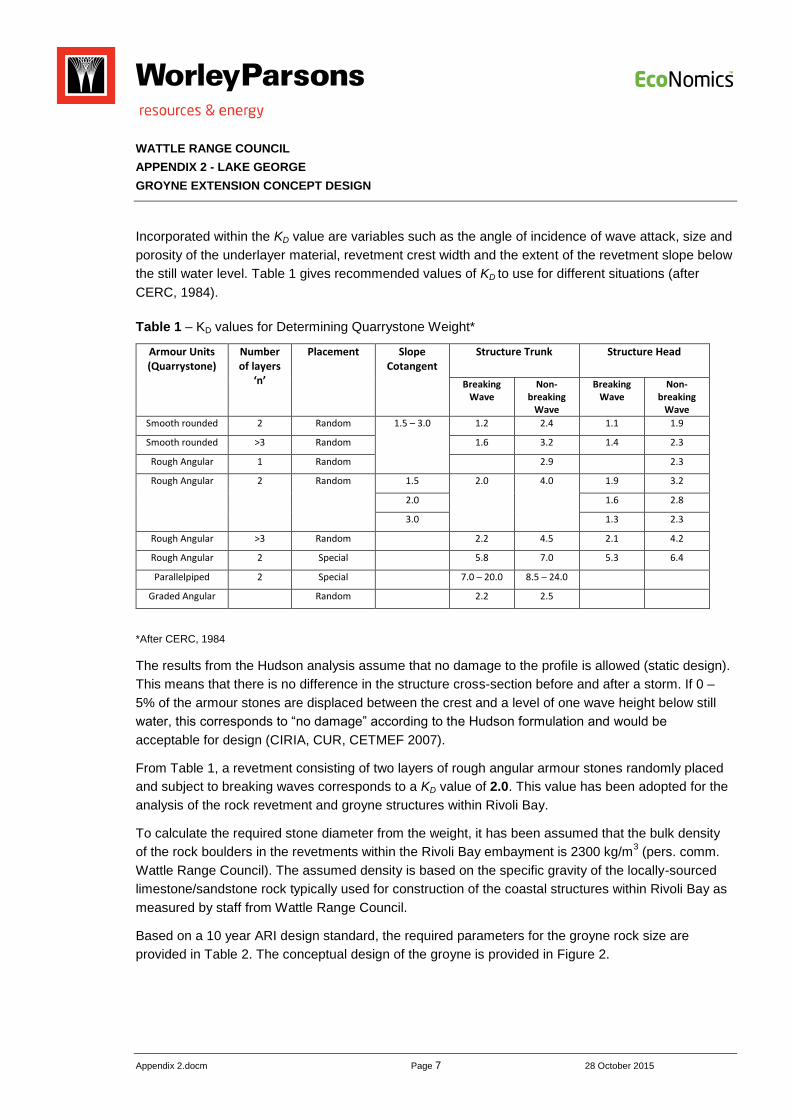
the still water level. Table 1 gives recommended values of KD to use for different situations (after
CERC, 1984).
Table 1 – KD values for Determining Quarrystone Weight*
*After CERC, 1984
The results from the Hudson analysis assume that no damage to the profile is allowed (static design).
This means that there is no difference in the structure cross-section before and after a storm. If 0 –
5% of the armour stones are displaced between the crest and a level of one wave height below still
water, this corresponds to “no damage” according to the Hudson formulation and would be
acceptable for design (CIRIA, CUR, CETMEF 2007).
From Table 1, a revetment consisting of two layers of rough angular armour stones randomly placed
and subject to breaking waves corresponds to a KD value of 2.0. This value has been adopted for the
analysis of the rock revetment and groyne structures within Rivoli Bay.
To calculate the required stone diameter from the weight, it has been assumed that the bulk density
of the rock boulders in the revetments within the Rivoli Bay embayment is 2300 kg/m3 (pers. comm.
Wattle Range Council). The assumed density is based on the specific gravity of the locally-sourced
limestone/sandstone rock typically used for construction of the coastal structures within Rivoli Bay as
measured by staff from Wattle Range Council.
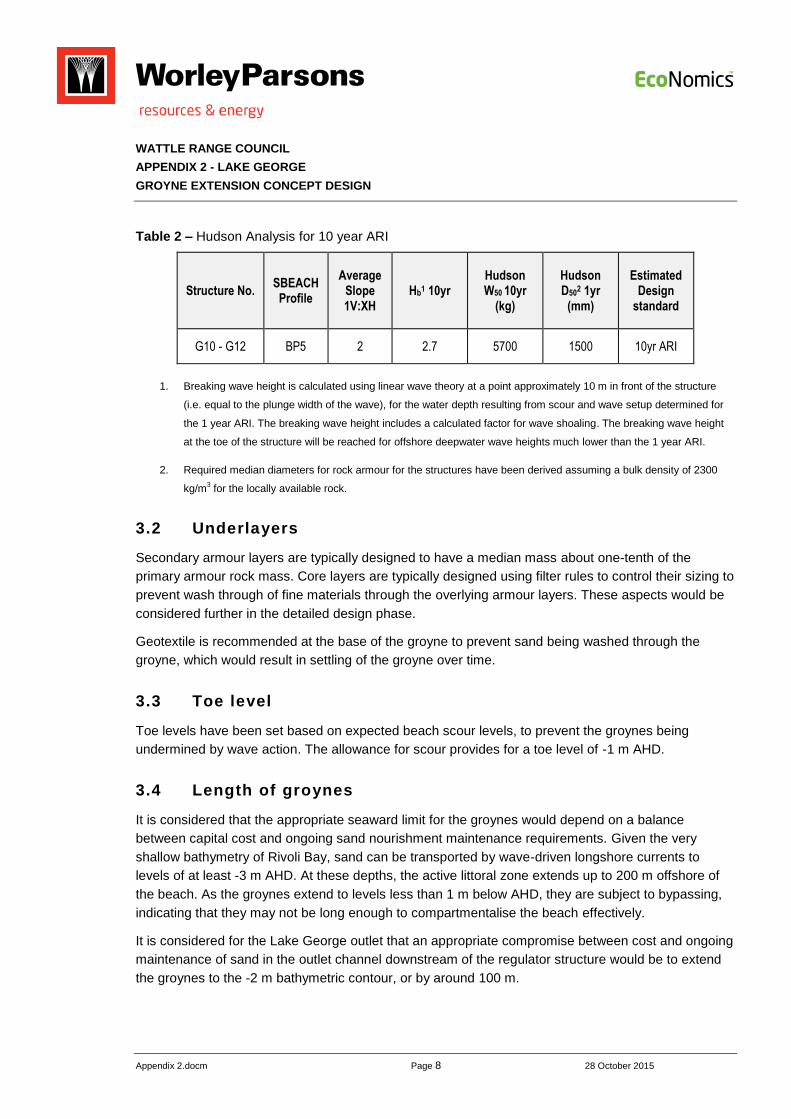
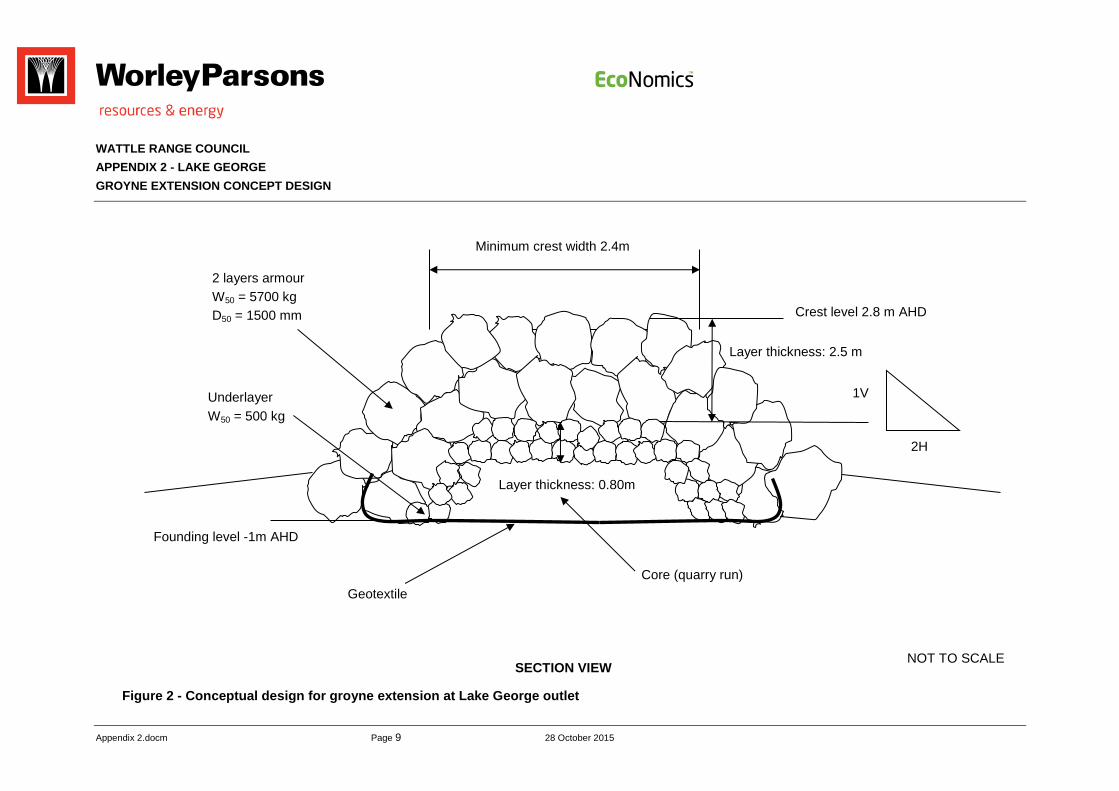
Based on a 10 year ARI design standard, the required parameters for the groyne rock size are
provided in Table 2. The conceptual design of the groyne is provided in Figure 2.
Armour Units (Quarrystone)
Number of layers
‘n’
Placement Slope Cotangent
Structure Trunk Structure Head
Breaking Wave
Non-breaking
Wave
Breaking Wave
Non-breaking
Wave
Smooth rounded 2 Random 1.5 – 3.0 1.2 2.4 1.1 1.9
Smooth rounded >3 Random 1.6 3.2 1.4 2.3
Rough Angular 1 Random 2.9 2.3
Rough Angular 2 Random 1.5 2.0 4.0 1.9 3.2
2.0 1.6 2.8
3.0 1.3 2.3
Rough Angular >3 Random 2.2 4.5 2.1 4.2
Rough Angular 2 Special 5.8 7.0 5.3 6.4
Parallelpiped 2 Special 7.0 – 20.0 8.5 – 24.0
Graded Angular Random 2.2 2.5
WATTLE RANGE COUNCIL
APPENDIX 2 - LAKE GEORGE
GROYNE EXTENSION CONCEPT DESIGN
Appendix 2.docm Page 8 28 October 2015
Table 2 – Hudson Analysis for 10 year ARI
Structure No. SBEACH Profile
Average Slope 1V:XH
Hb1 10yr Hudson W50 10yr
(kg)
Hudson D502 1yr
(mm)
Estimated Design
standard
G10 - G12 BP5 2 2.7 5700 1500 10yr ARI
1. Breaking wave height is calculated using linear wave theory at a point approximately 10 m in front of the structure
(i.e. equal to the plunge width of the wave), for the water depth resulting from scour and wave setup determined for
the 1 year ARI. The breaking wave height includes a calculated factor for wave shoaling. The breaking wave height
at the toe of the structure will be reached for offshore deepwater wave heights much lower than the 1 year ARI.
2. Required median diameters for rock armour for the structures have been derived assuming a bulk density of 2300
kg/m3 for the locally available rock.
3.2 Underlayers
Secondary armour layers are typically designed to have a median mass about one-tenth of the
primary armour rock mass. Core layers are typically designed using filter rules to control their sizing to
prevent wash through of fine materials through the overlying armour layers. These aspects would be
considered further in the detailed design phase.
Geotextile is recommended at the base of the groyne to prevent sand being washed through the
groyne, which would result in settling of the groyne over time.
3.3 Toe level
Toe levels have been set based on expected beach scour levels, to prevent the groynes being
undermined by wave action. The allowance for scour provides for a toe level of -1 m AHD.
3.4 Length of groynes
It is considered that the appropriate seaward limit for the groynes would depend on a balance
between capital cost and ongoing sand nourishment maintenance requirements. Given the very
shallow bathymetry of Rivoli Bay, sand can be transported by wave-driven longshore currents to
levels of at least -3 m AHD. At these depths, the active littoral zone extends up to 200 m offshore of
the beach. As the groynes extend to levels less than 1 m below AHD, they are subject to bypassing,
indicating that they may not be long enough to compartmentalise the beach effectively.
It is considered for the Lake George outlet that an appropriate compromise between cost and ongoing
maintenance of sand in the outlet channel downstream of the regulator structure would be to extend
the groynes to the -2 m bathymetric contour, or by around 100 m.
WATTLE RANGE COUNCIL
APPENDIX 2 - LAKE GEORGE
GROYNE EXTENSION CONCEPT DESIGN
Appendix 2.docm Page 9 28 October 2015
NOT TO SCALE
Core (quarry run)
2 layers armour
W50 = 5700 kg
D50 = 1500 mm
Underlayer
W50 = 500 kg
Minimum crest width 2.4m
1V
2H
Geotextile
SECTION VIEW
Founding level -1m AHD
Layer thickness: 2.5 m
Layer thickness: 0.80m
Crest level 2.8 m AHD
Figure 2 - Conceptual design for groyne extension at Lake George outlet
WATTLE RANGE COUNCIL
APPENDIX 2 - LAKE GEORGE
GROYNE EXTENSION CONCEPT DESIGN
c:\users\chris.adamantidis\documents\projects\lake george\draft report\for submission\final\appendix 2.docm
Page 10 301015-03541 : 002Rev C : 28-Oct-2015
4 REFERENCES
Carley J.T. (1992), “Analysis of SBEACH Numerical Beach Erosion Model and Applications in
Australia”, Master of Engineering Science Thesis, University of New South Wales, Sydney, Australia.
Carley, J.T, Couriel, E.D. and Cox, D.R. (1998), “Numerical Modelling Sand Nourishment
Profiles/Quantities and Beach Erosion Due to Storms and Sea Level Rise”, WRL Technical Report
98/04, University of New South Wales, Sydney, Australia.
CERC (1984) “Shore Protection Manual”
CIRIA, CUR, CETMEF (2007) “The Rock Manual. The use of rock in hydraulic engineering (2nd
edition)”, C683, CIRIA, London.
Delft University of Technology, 2011, SWAN (Simulating Waves Nearshore) User Manual,
http://www.fluidmechanics.tudelft.nl/swan/index.htm.
Rosati, J.D., A.R. Wise, N.C. Kraus & M. Larson (1993). “SBEACH: Numerical Model for Simulating
Storm-Induced Beach Change; Report 3 User’s Manual”. Instruction Report CERC-93-2, US Army
Corps of Engineers, Waterways Experiment Station, Coastal Engineering Research Centre,
Vicksburg, MS.
WorleyParsons (2014). “Rivoli Bay Study”, Draft Report to Wattle Range Council, Report no, 301015-
03541, October.
WRL (2012). “Generic Design Coastal Erosion Volumes and setbacks for Australia”, report for
Antarctic Climate and Ecosystems Cooperative Research Centre 2012.
WRL (2013). “Future Coasts – Port Fairy Coastal Hazard Assessment”, WRL Technical Report
2012/21, April.