annual report of sid bank and the sid bank group …zjshemrs republic of slovenia guarantee scheme...
TRANSCRIPT

ANNUAL REPORT OF
SID BANK AND
THE SID BANK GROUP
2018


Business name: SID – Slovenska izvozna in razvojna banka, d. d.,
Ljubljana
Abbreviated business name: SID banka d.d., Ljubljana
Registered office: Ulica Josipine Turnograjske 6, SI-1000 Ljubljana
Registration number: 5665493
Tax number: 82155135
VAT ID number: SI82155135
Settlement account: 0100 0000 3800 058
IBAN: SI056 0100 0000 3800 058
SWIFT: SIDRSI22
LEI: 549300BZ3GKOJ13V6F87
Website: www.sid.si
E-mail: [email protected]
Tel.: + 386 (1) 200 75 00
SID Bank Group companies: SID – Prva kreditna zavarovalnica d. d.
Davčna ulica 1, SI-1000 Ljubljana
Tel: + 386 (1) 200 58 00
https://www.sid-pkz.si/
Prvi faktor, faktoring družba, d. o. o. (in
liquidation)
Slovenska cesta 17, SI-1000 Ljubljana
Tel: + 386 (1) 200 54 10
www.prvifaktor.si/
Centre for International Cooperation and
Development
Kardeljeva ploščad 1, SI-1000 Ljubljana
Tel: + 386 (1) 568 13 96
www.cmsr.si/

Major financial data and performance indicators of SID Bank and
the SID Bank Group
Major financial data 1
in EUR thousand
SID Bank SID Bank Group 2018 2017 2016 2018 2017 2016
Statement of financial position
Total assets 2,318,834 2,451,641 2,548,643 2,364,541 2,497,302 2,596,076
Loans and deposits from customers 548,452 454,828 487,427 548,452 454,828 487,427
Loans and advances to customers 706,787 597,740 610,563 706,787 597,740 610,563
Total equity 422,051 409,893 393,829 437,706 427,600 413,808
Allowances, value adjustments and provisions for credit losses
96,534 145,380 199,744
96,534 145,380 199,744
Off-balance sheet items 360,760 89,272 64,253 360,760 89,272 64,253
Statement of profit or loss
Net interest 22,986 20,294 23,841 22,986 20,596 24,166
Net non-interest income 7,969 2,641 21,213 6,036 4,932 27,192
Labour costs, general and administrative costs
(13,270) (12,394) (11,018)
(13,270) (16,664) (15,288)
Amortisation/depreciation (881) (852) (805) (881) (1,267) (1,115)
Impairments and provisions (credit losses) 853 6,648 (7,914) 853 6,571 (7,619)
Pre-tax profit 17,519 16,224 25,317 15,825 14,168 27,336
Corporate income tax (3,205) (2,268) (3,954) (3,444) (2,406) (4,371)
Net profit for financial year 14,314 13,956 21,363 12,381 11,762 22,965
Statement of other comprehensive income
Other comprehensive income before tax (12,735) 2,603 10,399
(12,885) 2,506 10,594
Corporate income tax on other comprehensive income
2,418 (495) (2,097)
2,449 (476) (2,417)
Number of employees as at 31 December 185 170 162 277 266 277
Shares
Number of shareholders 1 1 1
Number of shares 3,121,741 3,121,741 3,121,741
Nominal value of one share (in EUR) 96.10 96.10 96.10
Book value per share (in EUR) 136.00 132.08 126.91
Long-term credit rating as at 31 December
Standard and Poor’s A+ A+ A
1 Notes:
The prescribed data and indicators are calculated in accordance with the Guidelines for compiling the statement of financial position, income statement and statement of comprehensive income, and calculating the performance indicators of banks and savings banks, which were prescribed by the Bank of Slovenia on the basis of the Regulation on the books of account and annual reports of banks and savings banks (Official Gazette of the Republic of Slovenia, No. 69/17).
The SID Bank Group’s net non-interest income in 2018 includes a net loss after tax from discontinued operations.
In light of the intended sale of the subsidiary SID-PKZ, the consolidated financial statements for 2018 have been compiled in accordance with IFRS 5. The figures for 2016 and 2017 in the above table have not been adjusted to this.
The effect of the transition to IFRS 9 as at 1 January 2018 is also taken into account in the items of the statement of comprehensive income.

Selected indicators 2
In % SID Bank SID Bank Group
2018 2017 2016 2018 2017 2016
Equity
CET1 ratio
34.2 36.8 33.6
- - 34.0
Tier 1 capital ratio 34.2 36.8 33.6
- - 34.0
Total capital ratio 34.2 36.8 33.6
- - 34.0
Leverage ratio 16.3 15.5 14.0 - - 14.5
Quality of assets in statement of financial position and commitments given Non-performing (on-balance sheet and off-balance sheet) exposures/Classified on-balance-sheet and off-balance-sheet asset items
3.7 - -
- - -
Non-performing loans and advances /Classified loans and advances
5.6 - - - - -
Allowances, value adjustments and provisions for credit losses /Non-performing exposures
66.5 - -
- - -
Collaterals received/Non-performing exposures
28.8 - - - - -
Profitability
Interest margin 1.0 0.8 0.9 0.9 0.8 0.9
Financial intermediation margin 1.3 0.9 1.6 1.2 0.8 1.6
Return on assets after tax 0.6 0.6 0.8 0.5 0.5 0.8
Return on equity before tax 4.2 4.0 6.6 3.6 3.4 6.8
Return on equity after tax 3.4 3.5 5.6 2.8 2.8 5.7
Operating costs
Operating costs/average assets 0.6 0.5 0.4 0.6 0.7 0.6
Operating costs/net income 45.7 57.8 26.4 48.8 70.2 31.9
January-
March April- June
July-September
October-
December
Liquidity in 2018 (SID Bank)
Liquidity coverage ratio (%) 3086% 2960% 1767% 1404% Liquidity buffer (in EUR thousand) 420,875 359,680 301,612 252,612 Total net cash outflows (in EUR thousand) 19,238 18,430 41,121 58,364
2 Notes on indicators:
As of 2017 SID Bank is no longer required to meet the requirements on a consolidated basis under the CRR (prudential consolidation), which means that the capital ratios, the leverage ratio and the quality indicators for assets in the statement of financial position and commitments given for 2017 and 2018 have been calculated on an individual basis for SID Bank.
The quality indicators for assets in the statement of financial position and commitments given have not been calculated for 2016 and 2017, as the figures are not comparable because of the transition to IFRS 9 in 2018.
In light of the intended sale of the subsidiary SID-PKZ, the consolidated financial statements for 2018 have been compiled in accordance with IFRS 5. The indicators for the SID Bank Group for 2016 and 2017 in the above table have not been adjusted to this.
The calculation of the financial intermediation margin for the SID Bank Group does not take account of SID-PKZ’s income from insurance operations.

List of abbreviations
AJPES Agency of the Republic of Slovenia for Public Legal Records and Related Services
ALM Assets Liabilities Management AOP Annual Operational Plan BAMC Bank Assets Management Company
BAS Bank Association of Slovenia BGN Bloomberg Generic Price
CCF Credit Conversion Factor CEB Council of Europe Development Bank CIR Cost-to-Income Ratio
CMSR Centre for International Cooperation and Development CRM Credit Risk Mitigation
CRR Capital Requirements Regulation CVA Credit Valuation Adjustment EAD Exposure At Default
EAPB European Association of Public Banks EBA European Banking Authority
EBRD The European Bank for Reconstruction and Development ECAI External Credit Assessment Institutions ECB European Central Bank
EFSI European Fund for Strategic Investments EIAH European Investment Advisory Hub
EIB European Investment Bank EIF European Investment Fund
ELTI European Long-Term Investors EQFM European Quality Foundation Model ESMA European Security and Markets Authority
EU European Union EUA European Emission Allowances
EUAA European Aviation Allowances EWS Early Warning System GDP Gross Domestic Product
GODECP Government Office for Development and European Cohesion Policy GURS Surveying and Mapping Authority of the Republic of Slovenia
HQLA High-Quality Liquid Assets IAS International Accounting Standards IASB International Accounting Standards Board
ICAAP Internal Capital Adequacy Assessment Process IFRIC International Financial Reporting Interpretations Committee
IFRS International Financial Reporting Standards as adopted by the EU ILAAP Internal Liquidity Adequacy Assessment Process
IRRBB Interest Rate Risk arising from the Banking Book KfW Kreditanstalt für Wiederaufbau LCR Liquidity Coverage Ratio
LGD Loss Given Default LR Liquidity Ratio
LTD Loan-to-Deposit Ratio LTV Loan-to-Value Ratio MEDT Ministry of Economic Development and Technology
MEIP Minimum Export Insurance Premiums NEFI Network of European Financial Institutions for Small and Medium Sized Enterprises
NPE Non Performing Exposures NSFR Net Stable Funding Ratio OECD Organisation for Economic Co-operation and Development
O-SII Other Systemically Important Institutions PD Probability of Default
POCI Purchased or Originated Credit-Impaired Assets ROE Return on Equity RS Republic of Slovenia
RWA Risk-Weighted Assets SID-PKZ SID – Prva kreditna zavarovalnica
SMEs Small and medium-sized enterprises SPPI Solely Payments of Principal and Interest
SREP Supervisory Review and Evaluation Process SSH Slovenian Sovereign Holding TLTRO Targeted Longer-term Refinancing Operations
ZBan-2 Banking Act ZGD-1 Companies Act
ZIPRS Republic of Slovenia Budget Implementation Act ZJShemFO Republic of Slovenia Guarantee Scheme for Natural Persons Act ZJShemRS Republic of Slovenia Guarantee Scheme Act
ZPFIGD Act on Guarantees of the Republic of Slovenia to Finance Corporate Investments ZPPOGD Act Governing the Remuneration of Managers of Companies with Majority Ownership held by the Republic of
Slovenia or Self-Governing Local Communities ZSIRB Slovene Export and Development Bank Act ZZFMGP Insurance and Financing of International Commercial Transactions Act

BUSINESS
REPORT
A word from the president of the management
board___8
Supervisory board report for 2018___12
About SID Bank and the SID Bank Group___15
Corporate governance statement___24
Social responsibility___37
SID Bank’s strategy___44
Risk management___46
Declaration of the management body on the
adequacy of the risk management framework___52
Performance in 2018___53

8 | Annual report of SID Bank and the SID Bank Group 2018
A word from the president of the management board
The changes resulting from the financial and
economic crisis a decade ago have had a long-
term impact on the functioning of the global,
European and local economies, and also marked
the year 2018. In this sense the year 2018 was
a turning point, in that the good economic and
financial situation of recent years, which was
the result of the changes and measures taken
by developed countries, began to notably
deteriorate, and caused imbalances in
developing countries. New risks were revealed
in the past actions, and particularly in the
present practices, including central bank
policies, lower demand, reduced trade,
protectionism, nationalism, populism and,
above all, geopolitical shifts.
The Slovenian economy, which depends on
foreign demand but traditionally experiences
global trends with a lag, has continued to
function with high growth in GDP (4.5%) and,
in particular, employment. Total employment in
Slovenia has reached a record high of 1.03
million. The high growth was primarily driven by
exports (up 7.2%) and investment (up 10.6%),
followed by strengthened domestic
consumption (up 4.6%), which was at its
highest level since the crisis year of 2008.
Inflation stood at around 1.9%, while
productivity was outperformed by the European
average.
In these conditions SID Bank and the SID Bank
Group again performed well in 2018. We
provided services to over 2,200 clients,
primarily SMEs and exporters, with EUR 479
million of new financing and EUR 875 million of
new insurance. Every fifth euro of Slovenia’s
exports has been backed by financial services
from SID Bank, which represents an indirect
presence in 115 countries around the world and
cover of 20% of Slovenia’s exports. Our services
contribute EUR 4.6 billion to GDP and EUR 5
billion to Slovenian companies’ sales, according
to an independent study on effectiveness of SID
Bank’s operations for the Slovenian economy.
Given the good economic situation and the
intensity of market participants’ activity in the
banking and insurance markets, we worked
within the business model framework, applying
new approaches within the established market
gaps. Consequently, we withdrew from certain
markets, especially in the insurance. SID Bank’s
total assets declined by 5% to EUR 2.3 billion,
although there was no significant change in the
structure of the balance sheet. Financing was
based on indirect financing through banks,
which accounts for 51% of the total credit
portfolio, equivalent to EUR 745 million (up
10%). Direct financing, which accounts for 49%
of the portfolio and amounted to EUR 707
million, also recorded growth (of 18%), which
was primarily attributable to changes in the
banking environment and the syndicated
financing of major infrastructure investments
(railways, roads, energy) and municipalities’
projects.
The banking environment was favourable last
year, although the banks’ consolidation process
brings about certain risks with regard to income
and maturity, which given the high liquidity and
the average LTD ratio under 80% is reducing
our possibilities of financing through banks.
Accordingly, there was an increase of direct
financing of Slovenian companies, that have
specific needs, particularly in the areas of long-
term and mezzanine financing.
In 2018, we continued to upgrade our business
model and introduced changes in the ways and
forms of operation. In particular, we tried to
achieve a shift from the use of non-refundable
to refundable financial instruments, particularly
at the level of the EU cohesion funds. As the
manager of the Fund of Funds, which we
operate under the authorisation of the The
Ministry of Economic Development and
Technology and the Government Office for
Development and European Cohesion Policy on
behalf of the state, we successfully placed funds
in the amount of EUR 28 million via financial
intermediaries for the purposes of research,
development and innovation at companies of all
sizes, and microloans for SMEs and sole traders,
which is a new segment in our business.

Annual report of SID Bank and the SID Bank Group 2018 | 9
Alongside these new developments, we
continued to finance SMEs, mostly from long-
term financial programmes, mainly using
financial instruments, but also equity financing
through the Slovene Equity Growth Investment
Programme in collaboration with the EIF. In
2018 two Slovenian companies were equity
financed from this program and three
professional managers of private equity funds,
which will invest equity in Slovenian companies,
were selected.
On the funding side, the main factor in the
decline of liquid assets and thus in total
liabilities was the repayment of a bond in the
amount of EUR 290 million. The liquidity and
refinancing were at a very high level throughout
the year, and the regulatory indicators (LCR,
NSFR) were highly exceeded. To this end we
had, as in the past, made use of credit lines
from multilateral development institutions (EIB,
KfW, CEB), and maintained a presence in the
international financial markets.
As the first Slovenian issuer on the international
financial markets, SID Bank successfully issued
a certified green bond in the amount of EUR 75
million, which is listed on the Vienna stock
exchange and will provide the basis for
financing green projects and circular economy
projects, which is one of the fundamental
elements of our business in Slovenia. In this
area we also developed a special methodology
for measuring soft factors, which helps steer our
financing and corporate investment in the
direction of the circular economy.
Given the favourable economic environment
and economic growth, risk exposure remained
unchanged. Credit risk exposure in the total
portfolio was down, and amounted to EUR 1.45
billion, including non-performing exposure, the
proportion of which declined to 5.5% while their
coverage increased to 67%.
In accordance with the low internally set limits,
which are twice as stringent as the regulatory
limits, the exposure to interest rate risk was
high, but acceptable. As mentioned earlier,
liquidity risk was very low, given the high
liquidity reserves and high liquidity ratios. With
the continuation of the low interest rate
environment, income risk remains high,
although it is being managed through various
measures on the income and the expenses side.
We have upgraded our asset-liability
management, including a new pricing policy and
a new interest rate risk methodology within the
framework of an upgrade to IRRBB.
Improvements have also been made to
operational risk management in the area of new
products, IT and fraud risk.
The risk management culture was upgraded
again last year, in all elements of the effective
risk management process, by enhancing risk
management strategy and policy, where we
added a new strategic risk management policy,
all in line with the SREP, which we passed
successfully.
All of these traits, activities and services and all
our endeavours were reflected in good financial
performance. SID Bank generated a pre-tax
profit of EUR 17.5 million, which reflected an
ROE of 4.2%. Net profit for the financial year
amounted to EUR 14.3 million, up on the
previous year, thanks to net interest income of
almost EUR 23 million, up 13% on the previous
year, despite the low interest rates. Non-
interest income amounted to EUR 7.9 million,
up significantly on the previous year. As a result
of a change in the business model, and because
of investments, particular in new employees,
operating costs increased by 6.8%, taking the
CIR to 45.7%.
The Bank generated net income from
impairments and provisions in the amount of
EUR 715 thousand, having made all the
necessary methodological adjustments early in
2018 for the full application of IFRS 9 in this
area. SID Bank maintained its strong capital
adequacy in 2018 (with a total capital ratio of
34.2%), while the leverage ratio stood at
16.3%.
The internal control mechanisms, from internal
auditing to compliance, acted in line with the
regulators’ latest rules and standards. We also
strengthened these departments in terms of
staffing and proper technical support. The same
applies to accounting and administrative
procedures and tasks, and to the regulatory
reporting, which represented a major burden
for a bank of SID Bank’s size, which is ranked
second in terms of systemic importance in the
Slovenian banking system.

10 | Annual report of SID Bank and the SID Bank Group 2018
We were especially active in overhauling and
optimising our internal processes, in particular
the IT system, which over the coming years will
be overhauled in line with the newly adopted
development strategy. This was redesigned for
the period of 2019 to 2023, with new strategic
activities, outcomes and metrics, the aim being
to achieve an even better positive impact on the
Slovenian economy, thereby increasing its
competitiveness on international markets.
The good economic situation and, in particular,
the high exports growth also had a positive
impact on our activities in the insurance of non-
marketable risks, where we provide our services
on behalf of and for the account of the state.
This business amounted to EUR 808 million, up
31.8%. There was however no significant
change in the breakdown and content of our
insurance operations: short-term and medium-
term operations continue to prevail, most
notably insurance for export preparation loans
and investment insurance concentrated in
countries such as Russia, the USA, Belarus,
Croatia, Bosnia and Herzegovina, and Serbia. In
our efforts for market diversification we
continued to open insurance lines in the Middle
East and in Africa, which companies have not
yet utilised to a great extent.
Insurance premiums and fees amounted to EUR
8.6 million in 2018, and more than doubled as
the volume of business increased. Claims
amounted to just under EUR 1 million, down
significantly on the previous year, which
brought a positive insurance technical result in
the amount of EUR 7.3 million, in contrast to the
loss made in the previous year. The Ministry of
Finance contributed a further EUR 13.7 million
in additional contingency funds in 2018, which
took the contingency reserves to EUR 154
million, up 16.7%. This offers Slovenian
businesses a sound basis for the proper
management of non-marketable risks in the
upcoming period of uncertainty on international
markets.
Accordingly we will focus our future innovations
primarily on those market segments where
difficulties could arise, and on those companies
that need our backing because of changed
circumstances. We will also focus on our direct
financing from the Fund of Funds in areas such
as energy efficiency, urban development, and
financing of innovative companies through
portfolio guarantees for banks under the
InnovFin programme. We will also continue to
finance green circular economy projects, and to
co-finance new infrastructure projects in
cooperation with commercial banks and
multilateral development banks.
Last year was a turning point for the SID Bank
Group, as in line with our strategy we focused
expressly on the development banking
activities, and in line with the policy of
withdrawing from the market also opted to sell
the subsidiary SID-PKZ, which provides
insurance of short-term marketable risks. In an
international public offering process, which ran
for the entire year, the preferred bidder selected
was Coface, a French group. Over the next few
years Coface will use the insurer SID-PKZ as a
hub for the Adriatic region, thereby continuing
its successful performance for clients, mainly
exporters, and will also strengthen cooperation
with SID Bank in the area of insurance of non-
marketable risks. The orderly wind-down of the
Prvi Faktor Group is also coming to a close,
where the objectives we set together with NLB
at the beginning of the process will be met. The
CMSR performed well last year, particularly in
offering official development support in
developing countries.
The changes and trends cited at the beginning
are causing uncertainty, and are clouding the
economic and financial picture, therefore, SID
Bank has begun preparing for any new
challenges and interventions in these changing
circumstances. These are likely to occur in the
area of the competitiveness of Slovenian
economy and productivity, as labour
productivity remains below the European
average despite high employment growth, as
well as in the broader and deeper international
environment, on which Slovenia’s economic
growth and its sustainable development
depend, the latter most likely being the only
plausible policy.

Annual report of SID Bank and the SID Bank Group 2018 | 11
In the next few years the European economy in
particular could be faced with the collision of
numerous risks, particularly given the opposing
and uncertain economic situations in individual
countries, and deteriorating international
relations, as exemplified by Brexit. This could
impact economic growth and development, thus
hitting Slovenian exporters, and so we will use
our services to try to ensure a level playing field
with the competition when it comes to financing
and insurance.
As an environment-friendly company, we have
also made significant advances in our attitude
to the environment, which is fully evidenced by
the indicators that we monitor. We have also
upgraded our internal and external
communications, in particular regarding the
methods and forms of our business.
An independent group of experts and academics
from the Faculty of Economics at the University
of Ljubljana has completed a periodic study of
the impact of SID Bank’s operations between
years 2011 and 2016. It highlighted many
positive effects on the Slovenian economy,
although there is still room for improvement,
which we will keep in mind as we design and
implement the Bank’s new strategy.
Responsibility to the environment, to our
employees and to our stakeholders is our
priority, and a core strategic guideline, in
keeping with SID Bank’s values, commitments
and mission. To all our employees, to our
clients, supervisors and owners, to association
members inside and outside the banking
profession, and to government and financial
institutions, on behalf of the management
board, I would like to express gratitude for the
confidence you have shown in us, and for our
good cooperation.
SID Bank will continue its work in line with its
new strategy of focusing on activities of
promotional and development banking, as well
as providing tailored financial services that our
clients need, while using refundable financial
resources. This we will do primarily by means of
market gap financing and insurance,
professional advice in all phases of companies’
development, digitalisation, and appropriate
risk management. We are confident that in this
way we will contribute to the sustainable
development of all of our stakeholders, and the
Slovenian economy as a whole.
Sibil Svilan, M. Sc.

12 | Annual report of SID Bank and the SID Bank Group 2018
Supervisory board report
In monitoring and supervising the operations of
SID Bank and the work of the management
board, the supervisory board performed its
work in accordance with the powers and
responsibilities prescribed by law, the articles of
association, codes of conduct, and its own rules
of procedure, and within that framework and
taking account of the Bank’s strategic objectives
and the risks to which the Bank is exposed,
assessed the adequacy of the Bank’s
management and its performance.
The members of the supervisory board in 2018
were Monika Pintar Mesarič (chair until the
expiry of her term of office on 21 February and
as of 15 March following her reappointment to
the supervisory board on 22 February), Marko
Tišma (deputy-chair), Marjan Divjak, Leo Knez,
Zlatko Vili Hohnjec and Aleš Berk Skok (until 16
November 2018).
The supervisory board held 14 ordinary sessions
and eight correspondence sessions in 2018, at
which it discussed general and specific matters
relating to the Bank’s operation and
performance, and also took decisions on certain
transactions in line with its powers to do so. The
sessions were attended in full by supervisory
board members, although there were absences
on two occasions, which were reported in a
timely manner in line with the rules of
procedure.
The supervisory board members actively
participated in discussions, with comments and
guidance, and also through various questions
and requests for clarification. The supervisory
board members signed a statement of
independence through which they affirmed that
there are no circumstances that could influence
their impartial, professional and thorough
judgement in discharging their duties or taking
decisions. In the discharge of their duties and
the decision-making of the supervisory board
members, there were no circumstances or
conduct that led or could have led to conflicts of
interest, or the conflicts of interest were
managed such that the supervisory board
member in question did not receive the
materials and information and was not present
at the session during the discussion and
decision-making on the matter regarding which
they had a conflict of interest.
Expert support for the work of the supervisory
board was provided by:
− the audit committee, which held seven
sessions, at which it discussed and drew up
positions primarily with regard to the Bank’s
interim performance reports and financial
statements, the compilation of the unaudited
annual report for 2017, the final auditor’s
report on the audit of the financial
statements for 2017 and the special auditor’s
report on the transition to IFRS 9, the Bank’s
financial plan for 2019, regular quarterly
reports of the internal audit department, the
annual report of the internal audit
department and the work plans of the
internal audit department, and the signing of
contracts with an audit firm for the provision
of non-audit services, and also monitored
the progress of the final audit for 2017 and
the preliminary audit for 2018, and the
procedure to award the public contract for
auditing SID Bank’s separate and
consolidated financial statements for the
financial years of 2019 to 2022;
− the risk committee, which held eight
sessions, and provided expert support to the
supervisory board in the area of the risk
appetite and risk management, drew up
positions primarily with regard to the risk
management strategy and policy, the
methodologies and assessments of the risk
profile of the Bank and the Group, the
methodologies and implementation of the
internal capital adequacy assessment
process and the internal liquidity adequacy
assessment process, the findings of the Bank
of Slovenia in the supervisory review and
evaluation process, and risk management
and control within the framework of the
discussion of quarterly risk reports, and
regularly followed up the realisation of
recommendations in connection with the
findings of the Bank of Slovenia from the
supervisory review of the Bank in 2017, and
within this framework the project to overhaul
the Bank’s rating system;

Annual report of SID Bank and the SID Bank Group 2018 | 13
− the nomination and remuneration
committee, which held nine sessions, and
provided the supervisory board with expert
support in the assessment of the adequacy
of remuneration policies and practices, the
overhaul of the policy for assessment of the
suitability of members of the management
body and key function holders and the
annual assessment of the performance of
the management board, discussed and
approved the assessment of the
management body with regard to the
knowledge, skills and experience of the
individual members of the management
board and the supervisory board and the
management body as a whole, and an
assessment of the structure, size,
composition and performance of the
management board and supervisory board,
and with regard to the change in the
membership of the supervisory board, i.e.
the appointment of new members, discussed
and approved the suitability assessments
drawn up by the suitability assessment
committee.
The major issues discussed and/or decided on
by the supervisory board in 2018 were:
− the annual report for 2017 with the auditor’s
report, and the proposal for the use of the
distributable profit for 2017;
− the Bank’s strategy for the period of 2019 to
2023, and the realisation of the strategic
objectives in 2018;
− the Bank’s information system development
strategy;
− the annual operational plan, with elements
of the business policy and risk policy, and the
financial plan for 2019;
− the risk management strategy and policy,
and the risk appetite;
− an evaluation of SID Bank’s activities
between 2011 and 2016, and the future
strategic challenges;
− regular reports on the performance of the
Bank and the undertakings in the Group, and
risk reports;
− the Bank’s risk profile assessment for 2018;
− the report to the Bank of Slovenia on the
internal capital adequacy assessment
process and the internal liquidity assessment
process, and the Bank of Slovenia’s findings
in the supervisory review and evaluation
process;
− the internal audit department’s plan of work
for 2019 and strategic plan of work for 2019
and 2020, the annual internal audit report
for 2017 and the quarterly reports by the
internal audit department;
− the compliance department’s programme of
work and the annual report on the
implementation of the code of ethics and
professional standards;
− decision-making on specific financing and
borrowing transactions in line with its
powers under the articles of association;
− the introduction of new products and
programmes by the Bank, in particular the
loan funds, and financial engineering and
financial instruments within the framework
of the management of EU cohesion funds;
− regular reports on loan reprogramming and
corporate restructuring;
− a report on an audit of outsourcing;
− the procedure for the sale of SID-PKZ and
the process of orderly wind-down of the
undertakings in the Prvi Faktor Group.
In its monitoring and supervision of the Bank’s
management and operations, the supervisory
board obtained regular and comprehensive
information from the management board, and
obtained all the requisite additional information
based on which it was able to continuously
assess the performance and work of the
management board and to take decisions
pursuant to its powers.
In 2018 the supervisory board assessed its own
work in 2017, while the self-assessment and
assessment of the work of the supervisory
board in 2018 was carried out in April 2019 on
the basis of the recommendations of the manual
for evaluating the effectiveness of the work of
supervisory boards issued by the Slovenian
Directors’ Association. Before beginning the
self-assessment procedure, the supervisory
board members also obtained reports on the
work of all three of the supervisory board
committees. The results of the self-assessment
confirm that the supervisory board carried out
its work professionally, with due diligence and
responsibility, and in line with the interests of
the Bank, and the individual supervisory board
members and that the supervisory board as a
collective body possess the knowledge and
experience to ensure that its duties are
performed effectively. The supervisory board

14 | Annual report of SID Bank and the SID Bank Group 2018
also discussed the results of the self-
assessment with regard to the activities
required for the further improvement of its
work.
Approval of the 2018 annual report
The unaudited annual report of SID Bank and
the SID Bank Group for 2018 was discussed by
the audit committee and the risk committee at
sessions on 11 March 2019, and by the
supervisory board at a session on 11
March 2019. The audited annual report was
discussed by the audit committee and the risk
committee at sessions on 4 April 2019, when
the two committees were also briefed by the
certified auditor. The two committees assessed
the annual report as satisfactory, and proposed
that the supervisory board approve the annual
report.
The supervisory board discussed and reviewed
the annual report of SID Bank and the SID Bank
Group at a session on 4 April 2019, together
with the proposal for the use of the distributable
profit for 2018 submitted by SID Bank’s
management board, and had no reservations or
comments.
The supervisory board also discussed the
independent auditor’s report, in which Deloitte
Revizija d.o.o., Ljubljana issued an unqualified
opinion of the financial statements of SID Bank
and the consolidated financial statements of the
SID Bank Group for 2018. In the opinion of the
auditor, the financial statements present, in all
material aspects, a true and fair picture of the
financial position of the company as at 31
December 2018 and its net profit and cash
flows, while the consolidated financial
statements present the consolidated financial
position of the Group as at 31 December 2018,
and its consolidated net profit and consolidated
cash flows for the year then ended, in
accordance with the International Financial
Reporting Standards (IFRS) as adopted by the
European Union. The supervisory board had no
reservations or comments with regard to the
report by Deloitte Revizija d.o.o., Ljubljana.
After the review, the supervisory board
unanimously approved the annual report of SID
Bank and the SID Bank Group for 2018.
Monika Pintar Mesarič
Chair of the Supervisory Board

Annual report of SID Bank and the SID Bank Group 2018 | 15
About SID Bank and the SID Bank Group
About SID Bank
SID Bank is a specialist promotional, export and
development bank authorised to carry out long-
term financial services designed to supplement
financial markets in various areas defined by the
Slovene Export and Development Bank Act
(hereinafter: the ZSIRB) as important to
Slovenia’s sustainable development. The core
activity within the activities performed by SID
Bank is financing relating to market gaps, which
mostly focuses on SMEs, development,
environmental protection, infrastructure and
energy projects, and the internationalisation of
enterprises.
SID Bank’s activity is based on a clear strategy
and business model that is derived from the
long-term development documents of Slovenia
and the EU. The long-term stability of SID Bank
is guaranteed by the Republic of Slovenia (the
state), allowing it to carry out its business and
activities to pursue the long-term development
policies of Slovenia and the EU. As the sole
shareholder, the Republic of Slovenia bears
irrevocable and unlimited liability for SID Bank’s
liabilities from transactions undertaken in its
pursuit of the activities set out in Articles 11 and
12 of the ZSIRB. If SID Bank fails to settle a
past-due liability to a creditor at the latter’s
written request, the Republic of Slovenia must
settle the liability at the creditor’s request
without delay. This allows SID Bank to borrow
on the financial markets without needing to
obtain a government guarantee for each
transaction.
In providing its services SID Bank may use all
financial instruments available under EU and
Slovenian legislation, such as loans, guarantees
and other forms of surety and risk take-up,
purchase of receivables, finance leasing,
financial engineering, concessionary loans and
other instruments of international development
cooperation, capital investments and other
methods of financing, and integrates these into
development and promotional financing
programmes.
History and legal status
Establishment of Slovenska izvozna družba (SID) as a special private
financial institution for insuring and
financing Slovenian exports. SID’s business activities were then
regulated by the Slovenian Export Finance and Insurance Company Act.
Entry into force of the ZZFMGP,3 which stipulated that SID bring the
insurance operations that it pursued
on its own behalf and for its own account into line with the regulations
governing insurance corporations. SID established an insurance
corporation on this legal basis, to which it transferred its portfolio of
marketable insurance that had been
operated on its own behalf and for its own account up to the end of 2004.
3 The ZZFMGP regulated the system for insuring and financing international commercial transactions as instruments of
Slovenia’s national trade policy.
1992 2004

16 | Annual report of SID Bank and the SID Bank Group 2018
Commencement of operations of SID
– Prva kreditna zavarovalnica d.d., Ljubljana.
At the end of the year, by obtaining
an authorisation to provide banking services and other financial services
from the Bank of Slovenia, SID was
converted into a bank and changed its name to SID – Slovenska izvozna
in razvojna banka, d.d., Ljubljana.4
Commencement of operations of SID
Bank as a specialist development
bank.
Entry into force of the ZSIRB, which
confers upon the Bank the following
two powers:
− SID Bank is authorised to act as Slovenia’s specialist promotional,
export and development bank in the pursuit of activities under the
ZSIRB;
− SID Bank is the authorised
institution for all transactions under the ZZFMGP.
The updated Banking Act expressly
stipulated that SID Bank is authorised as Slovenia’s specialist, promotional,
export and development bank, and is
not allowed to accept deposits from the public.
With the adoption of the Commission
Directive 2010/16/EU of 9 March 2010 amending Directive 2006/48/EC
of the European Parliament and of the Council, the European
Commission confirmed, in accordance with the opinion of the European
Banking Committee, that SID Bank is
an institution involved in specific activities in the public interest and is
thus eligible for inclusion on the list of institutions excluded from the
scope of application of Directive
2006/48/EC pursuant to Article 2 of that directive.
SID Bank was recognised as a
significant institution in the Slovenian banking system on the basis of a
decision by the Bank of Slovenia in
October.
SID Bank and the MEDT signed an
agreement on financing and
implementation of the first financial engineering measure in Slovenia.
The government gave its consent to
key elements of the financial engineering measures to promote the
development of SMEs, on the basis of
which a new EUR 500 million loan fund was established at SID Bank.
SMEs thus gained an opportunity to obtain loans to finance working
capital and new investments, and the corresponding recruitment.
SID Bank was one of three Slovenian
banks at which the ECB carried out a comprehensive assessment,
comprising an asset quality review
and stress tests. The comprehensive assessment was passed by SID Bank,
and no capital shortfall was identified.
4 Henceforth in the annual report any use of “SID Bank” or “the Bank” refers to SID banka, d.d., Ljubljana, irrespective of the
time and the change in business name, while the SID Bank Group may be referred to as “the SID Bank Group” or simply “the Group”.
2005 2006
2007 2008
2010 2011
2013 2014

Annual report of SID Bank and the SID Bank Group 2018 | 17
On the basis of the ZBan-2, the Bank
of Slovenia issued a decision designating SID Bank an O-SII (other
systemically important institution).
Under the agreement on financing
and implementing the financial engineering measure to promote the
investments, operations and capital
enhancement of SMEs, SID Bank established a new loan fund in
conjunction with the MEDT, within the framework of which two credit
lines were introduced, namely a development and promotional
programme for financing the
operations and capital enhancement of SMEs, and SID Bank’s
development and promotional programme for financing the
investments and capital enhancement
of SMEs, each in the amount of EUR 100 million.
The MEDT and SID Bank signed a financing agreement in which the
Republic of Slovenia authorised SID
Bank to manage the Fund of Funds.
Together with the EIF, the Bank set up a Slovene Equity Growth
Investment Programme worth EUR 100 million.
Under the aegis of the Fund of Funds, EU cohesion funds were used
to develop the first financial
instruments and selected financial intermediaries for loans for
investments related to research, development and innovation, and for
microloans.
SID Bank signed a sale and purchase agreement for the sale of its entire
holding in its subsidiary SID-PKZ.
SID Bank became the first Slovenian
issuer to issue green bonds on the international capital market.
SID Bank’s services
In line with its aforementioned role, purpose
and tasks, SID Bank primarily provides financial
services within the framework of authorisations
issued by the Bank of Slovenia. The main
service is the provision of loans, which largely
flow via commercial banks and savings banks,
and in certain instances in cooperation with
other commercial banks in bank syndicates, but
the Bank also lends directly to final beneficiaries
to a certain extent.
SID Bank’s financial services support four main
purposes of development:
− development of a society of knowledge and
innovative enterprise;
− development of an environment-friendly
society and environment-friendly
production;
− development of a competitive economy;
and
− regional and social development.
The Bank provides its financial services with
regard to identified market gaps, carrying out
developmental and promotional tasks, and
through financial services achieves the
objectives of long-term development policy,
primarily, in the following areas (according to
the ZSIRB):
− the development of SMEs and
entrepreneurship;
− research, development and innovation;
− environmental protection, energy
efficiency and climate change;
− international business transactions and
international economic cooperation;
− regional development;
− economic and public infrastructure.
2015 2016
2017 2018

18 | Annual report of SID Bank and the SID Bank Group 2018
As at 31 December 2018 SID Bank held a Bank
of Slovenia authorisation to provide the
following mutually recognised financial services
under Article 5 of the ZBan-2:5
− acceptance of deposits from informed
persons;
− granting of loans, including:
− mortgage loans;
− purchase of receivables with or
without recourse (factoring);
− financing of commercial transactions,
including export financing based on
the purchase of non-current non-past-
due receivables at a discount and
without recourse, secured by financial
instruments (forfeiting);
− issuance of guarantees and other sureties;
− trading for own account or for the account
of customers:
− in foreign legal tender, including
currency-exchange transactions;
− in standardised futures and options;
− in currency and interest-rate
instruments;
− trading on own account:
− in money-market instruments;
− credit rating services: collection, analysis
and dissemination of information about
creditworthiness.
SID Bank’s activities under Republic of Slovenia authorisation
Insurance against non-marketable risks
SID Bank provides insurance against
non-marketable risks for international business transactions under the
ZZFMGP on behalf of and for the account of the Republic of Slovenia, as
an agent of the state.
The requisite funding for the effective provision of insurance operations
under the ZZFMGP is provided to SID
Bank by the Republic of Slovenia in the form of contingency reserves, which
are used to settle liabilities to policyholders (claims payouts) and to
cover losses on these operations. Contingency reserves are also created
from premiums, fees and
commissions, recourse from paid claims and other income generated by
SID Bank from insurance and reinsurance against non-marketable
risks. If the claims cannot be settled
from the aforementioned reserves, the funding for payouts is provided by the
Republic of Slovenia.
Fund of Funds for the implementation of financial instruments within the framework of the European Cohesion Policy 2014-2020
In November 2017 the MEDT
appointed SID Bank as manager of the
Fund of Funds for the implementation of financial instruments within the
scope of European cohesion policy, into which EUR 253 million will be paid
by 2023 from European cohesion funds that are available to Slovenia
within the 2014-2020 financial
framework. The purpose of establishing this fund is the promotion
and financing of sustainable economic growth and development, investments
in innovations and current operations
through debt and equity financing focused on four areas in which market
gaps were identified based on a preliminary assessment of financing
gaps by PwC Slovenia and
supplemented by analysis conducted by the European Investment Bank:
research, development and innovation, SMEs, energy efficiency
and urban development.
5 The authorisation to provide banking services is
published on the Bank of Slovenia website: https://www.bsi.si/financna-stabilnost/subjekti-
nadzora/banke-v-sloveniji/11/sid-slovenska-izvozna-in-razvojna-banka-dd-ljubljana

Annual report of SID Bank and the SID Bank Group 2018 | 19
Management of emission allowances and Kyoto units
Under the updated Environmental
Protection Act, SID Bank was authorised in 2010 to act as a state
auctioneer at emission allowance auctions and to carry out the Kyoto
units and emission allowances programme on behalf of and for the
account of the state, and any related
transactions.
Guarantee schemes and sureties for investments
On the basis of three laws, the
Republic of Slovenia Guarantee Scheme Act, the Republic of Slovenia
Guarantee Scheme for Natural Persons Act and the Republic of
Slovenia Guarantees for Financial Investments by Companies Act, SID
Bank was authorised to pursue
business in the form of guarantee issuance on behalf of and for the
account of the state. The statutory deadline for issuing government
guarantees passed at the end of 2010
for the first two laws, and at the end of 2015 for the third.
Activities under all three schemes are
now carried out in the processing of applications for consent to contractual
amendments, requests for the payment of guarantees and in the
enforcement of recourse claims.
SID Bank’s activities under Republic of Slovenia authorisation in 2018 are presented in detail in the
section entitled Operations under Republic of Slovenia authorisation.

20 | Annual report of SID Bank and the SID Bank Group 2018
Organisational structure of SID Bank as at 31 December 2018
Share capital
The Bank’s share capital is divided into
3,121,741 no-par-value shares. These are
ordinary registered shares, issued in
dematerialised form. The central shareholder
register and all procedures for trading the
shares are administered at the Central
Securities Clearing Corporation in Ljubljana.
There were no changes to the share capital in
2018, which amounted to EUR 300,000
thousand as at 31 December 2018.
There are no constraints on shareholder voting
rights: each SID Bank no-par-value share
entitles its holder to one vote. The financial
rights attached to shares are not separated
from the ownership of the shares.
Management Board
Executive Director IV
Back-Office and Payments Department
Accounting Department
Controlling and Reporting Department
Executive Director III
Legal and Claims Department
Credit and Investment Insurance Department
General Affairs and HR Department
Investments and European Programme
Department
Executive Director II
Credit Analysis Department
Monitoring of Financing Operations
Department
Distressed Investment Management Department
IT Department
Technology Department
Executive Director I
Corporate
Department
Financial Institutions
Department
Treasury Department
Fund of Funds Department
Project Financing Department
Compliance Department
Internal Audit Department
Research, Development and
Strategy Department
Risk Management Department
Supervisory board
Republic of Slovenia 3.103.296 99,4
SID Bank (treasury shares) 18.445 0,6
Total 3.121.741 100,0
Number of
shares
Holding of
share capital
(%)Shareholders as at 31 December 2018

Annual report of SID Bank and the SID Bank Group 2018 | 21
In accordance with Article 4 of the ZSIRB, the
Republic of Slovenia is the sole shareholder in
SID Bank, and the distributable profit may not
be used for distribution to shareholders, but is
instead allocated to other profit reserves.
On 14 June 2018 the SID Bank general meeting
passed a resolution allocating the distributable
profit for 2017 in the amount of EUR
6,628,945.98 to other profit reserves.
The Bank’s total shareholder equity amounted
to EUR 422,051 thousand as at 31 December
2018, while the audited book value of one share
stood at EUR 136.00 (31 December 2017: EUR
132.08).
About the SID Bank Group
SID Bank Group
As at 31 December 2018 the SID Bank Group
comprised:
The SID Bank Group’s consolidated financial
statements include SID Bank and SID – Prva
kreditna zavarovalnica d.d., Ljubljana under the
full consolidation method, and the Prvi Faktor
Group under the equity method. In light of the
intended sale of the subsidiary SID-PKZ, the
consolidated financial statements have not been
compiled according to the traditional method,
but are instead disclosed in accordance with
IFRS 5.
Given its immaterial impact on the financial
position and profit or loss of the SID Bank
Group, the Centre for International Cooperation
and Development is not included in
consolidation.
Organisational structure of the SID Bank Group as at 31 December 2018
SID banka d. d., Ljubljana Parent bank -
SID - Prva kreditna zavarovalnica d. d., Ljubljana Subsidiary 100
Prvi faktor Group Joint venture 50
Centre for International Cooperation and Development (CMSR) Joint foundation -
Company Relation/role
Holding of
SID Bank
(%)
SID banka d.d.,
Ljubljana
SID – Prva kreditna
zavarovalnica d.d.,
Ljubljana
Prvi faktor d.o.o.,
Ljubljana (in liquidation)
•
Centre for International
Cooperation and
Development, Ljubljana
Prvi faktor,
faktoring društvo,
d.o.o., Zagreb (in
liquidation)
•
Prvi faktor
d.o.o.,
Sarajevo (in
liquidation)
Prvi faktor –
faktoring d.o.o.,
Beograd (in
liquidation)
100% 50%
100% 100% 90% 5%

22 | Annual report of SID Bank and the SID Bank Group 2018
About the group companies
SID – Prva kreditna zavarovalnica d.d., Ljubljana
The nominal value of SID Bank’s interest in
SID-PKZ stood at EUR 8.4 million as at 31
December 2018.
SID – Prva kreditna zavarovalnica d.d.,
Ljubljana (SID-PKZ) commenced its operations
on 1 January 2005.
SID-PKZ insures short-term trade receivables,
generally with a maturity of up to 180 days, or
up to 1 year when the nature of the transaction
or the type of goods so requires. The insurance
covers commercial and optional risks, and also
non-commercial (political) risks. The insurance
contracts are generally annual or apply for a
two-year period, and cover the policyholder’s
entire turnover on an open basis. It is also
possible to insure one particular segment of
sales (e.g. exports, domestic sales, receivables
financed by a bank), if SID-PKZ assesses that
objective criteria apply to the selection of the
segment offered for insurance, and not any kind
of moral hazard. Pre-delivery risks (production
risks) may also be insured separately in
insurance contracts. SID-PKZ also insures
factoring operations under adjusted terms and
specific project and engineering operations if
the payment periods do not exceed two years.
In 2018 SID-PKZ offered its customers
upgraded coverage with additional coverages,
transitional coverage, insurance of disputed
receivables and extended coverage for
previously approved orders. Transitional
coverage enables the secure and quick
transition (transfer of limits) of a policyholder
from competing insurers to SID-PKZ, insurance
of disputed receivables provides for advance
insurance payouts when receivables are
contested by a customer, while extended
coverage for previously approved orders
provides coverage for receivables arising on the
basis of approved orders in the event of the limit
being lowered or cancelled.
SID-PKZ was headed by a three-member
management board in 2018: Sergej Simoniti
(president), Igor Pirnat and Denis Stroligo. The
terms of office of all three members began on
1 January 2018.
SID-PKZ’s supervisory board in 2018 consisted
of Goran Katušin (president), Bojan Pecher
(deputy-president), Ph.D. Matejka Kavčič and
Mirjam Janežič, Andraž Tinta and Sanja Dimec
(the last two of whom are employee
representatives). The audit committee
consisted of four members in 2018, namely
three members of the supervisory board and an
independent expert, Blanka Vezjak. The audit
committee operated with Matejka Kavčič as
chair, Mirjam Janežič as deputy-chair, and
Bojan Pecher and Blanka Vezjak as the other
members.
SID Bank signed a sale and purchase agreement
for the sale of its entire holding in its subsidiary
SID-PKZ in September 2018. The transfer of
ownership and receipt of the consideration is
expected in the first half of 2019. SID Bank has
thereby pushed ahead with its strategic
alignment and its focus on its core business
activities. In its business for the account of the
state, SID Bank will continue to provide
insurance and reinsurance services in
collaboration with SID-PKZ, assuming further
collaboration is ensured. The arrival of a
strategic owner (Coface, a French credit insurer
and one of the leading groups in the market)
with a wide network of insurance products and
services will allow SID-PKZ to expand and to
further develop.
Prvi faktor, faktoring družba, d. o. o. (in liquidation)
SID acquired a 50% interest in the nominal
capital and half of the voting rights of the
company in 2002. The other partner was Nova
Ljubljanska banka d.d., Ljubljana (NLB).
The nominal value of SID Bank’s interest in the
company stood at EUR 1.6 million as at
31 December 2018.
The main activity of Prvi faktor, faktoring
družba, d.o.o., Ljubljana (in liquidation) was the
provision of factoring services. On 28 December
2016 the company's general meeting passed a
decision to initiate voluntary liquidation
proceedings, and to appoint the two previous
directors as liquidators.

Annual report of SID Bank and the SID Bank Group 2018 | 23
The company’s liquidators in 2018 were Klemen
Hauko and Marcel Mišanović Osti. SID Bank was
represented at the general meeting in 2018 by
Saša Keleman and Branko Jerak.
Prvi faktor, Ljubljana is also the founder of the
following:
− Prvi faktor, faktoring društvo, d.o.o., Zagreb
(in liquidation), of which it owns 100%. The
company was established on 17 December
2003. Its nominal capital amounts to EUR
2.7 million. The company has been in
liquidation since 31 December 2016. The
liquidators of the company in 2018 were Jure
Hartman and Marko Ugarković. The
company’s general meeting comprises
representatives of Prvi faktor Ljubljana,
namely Marcel Mišanović Osti (chair of the
general meeting) and Klemen Hauko. The
chair of the company’s supervisory board is
Klemen Hauko, while Igor Jarc and Matjaž
Jevnišek are the other members.
− Prvi faktor d.o.o., Sarajevo (in liquidation),
of which it owns 100%. The company was
established on 27 February 2006. Its
nominal capital amounts to EUR 1.4 million.
The company has been in liquidation since
29 December 2016. The previous director
and current liquidator of the company is
Đenan Bogdanić. The company’s general
meeting comprises representatives of Prvi
faktor Ljubljana, namely Marcel Mišanović
Osti (chair of the general meeting), Klemen
Hauko and Svetlana Miškić.
− Prvi faktor – faktoring d.o.o., Beograd (in
liquidation), of which it owns 90%. The
company was established on 24 February
2005. The company has been in liquidation
since 3 August 2017. The company’s nominal
capital amounts to EUR 2.5 million. With the
conversion of cash and receivables into
equity in the company by NLB and SID Bank,
changes were made in the company’s
ownership structure at the end of July 2017,
with both owners each gaining a 5% direct
interest. The company was managed by
liquidator Željko Atanasković in 2018. SID
Bank was represented at the general
meeting in 2018 by the Bank’s management
board or its proxies Saša Keleman and
Branko Jerak.
Centre for International Cooperation and Development (CMSR)
SID Bank is a co-founder of the CMSR together
with the Republic of Slovenia. The CMSR’s core
activities are macroeconomic, political and other
analysis of sovereigns, assessments of country
risk and publicity activities. On the basis of the
International Development Cooperation and
Humanitarian Aid of the Republic of Slovenia
Act, the CMSR carries out technical and
operational work in the field of international
development cooperation.
The CMSR’s management bodies are the
director and the council. The institute is
represented by its director. The council had five
members as at 31 December 2018. SID Bank’s
representatives on the council are Sibil Svilan,
who is also chair of the council, and Bojan
Pecher.

24 | Annual report of SID Bank and the SID Bank Group 2018
Corporate governance statement
In accordance with the fifth paragraph of Article 70 of the ZGD-1, SID Bank hereby issues the following
corporate governance statement.
1. Reference to codes, recommendations and other internal regulations on
corporate governance, and on derogations from codes and
recommendations
SID Bank is a company with a capital asset of
the state, and is not a public company in the
sense of the Financial Instruments Markets Act.
SID Bank applied the following codes and
recommendations in its operations in 2018:
– The Corporate Governance Code issued by
the Ljubljana Stock Exchange and the
Slovenian Directors’ Association on 27
October 2016. The full text of the code is
available on the Ljubljana Stock Exchange
website, (http://www.ljse.si/);
– The Corporate Governance Code for
Companies with Capital Assets of the State,
which was issued by Slovenski državni
holding d.d. in May 2017, and the
Recommendations and Expectations of
Slovenian Sovereign Holding, which was
issued by Slovenski državni holding d.d. in
March 2018. The two documents are
published on Slovenski državni holding’s
website (www.sdh.si).
Details of the derogations from the
aforementioned codes and recommendations
and the arguments for these derogations are
presented below, and primarily proceed from
the special arrangements of the ZBan-2 and
ZSIRB.
Corporate Governance Code
Corporate governance framework
Recommendation 1
The fundamental principles of the operations of
SID Bank are set out in the ZSIRB. The basic
objective of SID Bank is not to maximise the
company’s value, but to create direct or indirect
value-added for the users of its financial
services and, in particular, the maintenance and
increase of its capital without pursuing the
objective of maximising profit (Article 9 of the
ZSIRB).
Relations between the company and its
shareholders
Recommendation 6
Since the Republic of Slovenia is the sole
shareholder in SID Bank, the recommendations
are applied mutatis mutandis (Article 4 of the
ZSIRB).
Recommendations 8.1., 8.2, 8.4 and 8.10
The Republic of Slovenia is the sole shareholder
in SID Bank (Article 4 of the ZSIRB).
Recommendation 8.9
A representative of the auditor is not invited to
the general meeting. The sole shareholder
(Slovenski državni holding) is regularly briefed
on SID Bank’s performance.
Supervisory board
Recommendations 9, 10 and 12
The recommendations are applied mutatis
mutandis, as the nomination and appointment
of supervisory board members is determined by
a special law (Article 18 of the ZSIRB). SID Bank
is committed to complying with the ZBan-2 and
regulations issued on its basis (e.g. the
Regulation on internal governance
arrangements, the management body and the
internal capital adequacy assessment process
for banks and savings banks).
SID Bank implements its corporate governance
arrangements in accordance with the legislation
applicable in Slovenia, having regard for its own
bylaws (e.g. its articles of association). SID
Bank also takes account of the regulatory
framework of the European Banking Authority
(EBA) and the European Securities and Markets
Authority (ESMA), the legal acts of the ECB, and

Annual report of SID Bank and the SID Bank Group 2018 | 25
the regulations and other acts of the Bank of
Slovenia.
Recommendation 18.1
SID Bank is required to comply with Article 49
of the ZBan-2, which stipulates that a bank’s
supervisory board must have an audit
committee and a risk committee. SID Bank also
has a nomination and remuneration committee.
Recommendations 18.2 and 18.3
SID Bank is required to comply with Article 49
of the ZBan-2, which stipulates that, the ZGD-1
notwithstanding, only members of a bank’s
supervisory board may sit on its supervisory
board committees.
Transparency of operations
Recommendations 27.3 and 29.3
The ownership of SID Bank is prescribed by law
(limited), with the sole shareholder in SID Bank
being the Republic of Slovenia (Article 4 of the
ZSIRB).
Recommendation 28.2
The recommendation is applied mutatis
mutandis.
Corporate Governance Code for
Companies with Capital Assets of the
State
3. Corporate governance framework for
companies with capital assets of the state
Recommendation 3.1
The operations of SID Bank are regulated by the
ZSIRB, which stipulates, inter alia, that SID
Bank provides its services in order to create
direct or indirect value-added for the users of its
services, in accordance with the purpose and
goal of individual transactions, projects,
investments and other forms, and, in particular,
to maintain or increase capital without pursuing
the objective of maximising profit (Article 9 of
the ZSIRB).
4. Relationship between shareholders or
partners, SSH, the state and companies
with capital assets of the state
Recommendations are applied mutatis
mutandis.
Recommendation 4.2
The ownership of SID Bank is prescribed by law
(limited), with the sole shareholder in SID Bank
being the Republic of Slovenia (Article 4 of the
ZSIRB).
Recommendation 4.3
The power to nominate members of SID Bank’s
supervisory board is shared by the minister
responsible for finance and the minister
responsible for the economy, each of whom
nominates one member, and the minister
responsible for development and European
affairs (now the Government Office for
Development and European Cohesion Policy),
who nominates five independent experts. The
power to appoint members of SID Bank’s
supervisory board lies with the government
(Article 18 of the ZSIRB).
6. Supervisory board
Recommendation 6.4
In addition to the ZBan-2 and the ZGD-1, the
procedures for the nomination and appointment
of members of SID Bank’s supervisory board are
also governed by the ZSIRB, which sets out the
number of supervisory board members and the
composition of the supervisory board (Article 18
of the ZSIRB).
Recommendations 6.5, 6.10 and 6.13
SID Bank is required to comply with Article 49
of the ZBan-2, which stipulates that, the ZGD-1
notwithstanding, only members of a bank’s
supervisory board may sit on its supervisory
board committees.
Recommendation 6.6
Members of SID Bank’s supervisory board are
appointed by the government, at the proposal
of ministers (Article 18 of the ZSIRB).
Recommendation 6.7
The recommendation is applied mutatis
mutandis. Members of SID Bank’s supervisory
board are appointed by the government, at the
proposal of ministers (Article 18 of the ZSIRB).
The procedure for assessing candidates is
conducted in accordance with the ZBan-2, the
EBA guidelines and bylaws in the manner
described in detail in the section relating to the
actions of the committee for the assessment of
the suitability of members of the management
body and key function holders (in this section,
under the title Composition and functioning of

26 | Annual report of SID Bank and the SID Bank Group 2018
management and supervisory bodies and their
committees).
Recommendation 6.8.2
The same applies as in the case of the
supervisory board’s audit committee (point 6.5),
in that SID Bank complies with the provisions of
the ZBan-2.
Recommendation 6.8.5
The recommendation is applied mutatis
mutandis, having regard for Article 18 of the
ZSIRB.
Recommendations 6.8.8 and 6.8.9
Members of SID Bank’s supervisory board are
appointed by the government, at the proposal
of ministers (Article 18 of the ZSIRB).
Recommendation 6.9.2
Alongside the model resolution by the general
meeting, given the incomplete composition of
the supervisory board, an increase in the total
amount of fees for performing functions on
supervisory board committees was proposed for
the period until the supervisory board reached
full complement.
8. Transparency of operations and
reporting
Recommendation 8.1.1
SID Bank is required to comply with the ZBan-2
with regard to disclosures, and more precisely
in the compilation of its business report it is
required to take account of the requirements
set out in Chapter 4 of the ZBan-2 (Articles 86
to 93), Sections 3.2 and 3.4 of the Regulation
on books of account, and Article 70 of the
ZGD-1. Disclosures under Part Eight (Articles
431 to 451 and Article 492) of the CRR are
included in the financial report, in the format
and with the content set out by the Guidelines
on disclosure requirements under Part Eight of
Regulation (EU) No 575/2013.
Recommendations and Expectations of
Slovenian Sovereign Holding
Sponsorship and donations
Recommendation 3.8
SID Bank is not financed from public funds, as
a result of which the restrictions referred to in
section 3.11 do not apply to it. SID Bank has
adopted a communications strategy, which has
neither been approved by the supervisory board
nor published on its website. A governance
policy that regulates sponsorship and donations
among other issues has been
adopted/approved by the supervisory board.
Information about sponsorship and donation
agreements is published on the SID Bank
website (https://www.sid.si).
Optimisation of costs
Recommendation 4.4
SID Bank paid annual leave allowance in 2018
in line with the collective agreement for the
banking sector, and the performance-related
payment in line with its own collective
agreement, which sets out the procedures and
criteria for defining payments. SID Bank did not
publish information about the payments.
Recommendation 4.5
SID Bank has published the collective
agreement for the banking sector on its
website, but has not published its own collective
agreement, which sets out in detail the
conditions, criteria and metrics for promotions,
and for the assessment of personal on-the-job
performance and overall performance, and the
amount of other personal remuneration of
employees paid by SID Bank on the basis of the
collective agreement for the banking sector. SID
Bank’s remuneration system is presented in
detail in disclosures in the annual report.
Achieving quality and excellence in the
operations of a company/group
SID Bank has joined the process of regular self-
assessment under the proven European model
of business excellence developed by the
European Foundation for Quality Management
(EFQM). The process was last undertaken in
2016, and the next was deferred until 2019
because of an extensive overhaul of the
strategy, which alongside the external elements
is also based on self-assessment of quality and
the attainment of the Bank’s mandates.
SID Bank is a signatory of the Slovenian
corporate integrity guidelines. The guidelines
are published online at http://www.zdruzenje-
ns.si.
Annual report of SID Bank and the SID Bank Group 2018 | 27
2. Main features of internal control systems and risk management in connection
with financial reporting procedure
The internal control mechanisms put in place for
all of SID Bank’s business activities
commensurately with the materiality and risk of
the individual activities include:
– internal controls of the implementation of
the Bank’s organisational procedures,
business procedures and work procedures;
– functions and internal control departments
that, in organisational terms, report directly to the Bank's management board.
The implementation of internal controls is
primarily undertaken on the basis of:
− documented rules and procedures for
ensuring the compliance of the Bank’s
operations with regulations, standards and
bylaws, and the requirements of the Bank of
Slovenia and other competent supervisory
authorities;
− monitoring of the compliance of business
transactions and investments with the
adopted risk limits;
− oversight of the proper implementation of
the prescribed work procedures in
connection with operational and
organisational activities on the part of
employees;
− verification of the accuracy of internal and
external reports;
− safeguarding of the Bank’s assets;
− development and safeguarding of the
security of the Bank’s information systems
and information.
In the area of financial reporting procedures,
internal controls that are primarily carried out at
organisational units responsible for risk
management, accounting, controlling and
reporting have been put in place via bylaws. The
functioning of internal controls and risk
management at the Bank is also subject to
internal auditing, which is carried out by a
dedicated organisational unit.
The internal control functions at SID Bank
include the internal audit department, the risk
management function, which is organised
within the risk management department (for
more details see the section entitled Risk
management in the business report and section
3.3 of the financial report), and the compliance
function, including the information security
function, which is organised at the compliance
department.
The supervisory board has established an audit
committee, whose work focuses on financial
reporting, and a risk committee, whose
responsibilities primarily relate to supervision
and the provision of advice on risk
management.
Compliance
Compliance risk is the risk of a significant
financial loss or loss of reputation owing to legal
sanctions and measures by supervisory
authorities that the Bank could suffer because
of the wilful or accidental failure of its
operations to comply with applicable legislation
and standards of good practice.
SID Bank established a compliance department
in 2008 and was therefore one of the first banks
in Slovenia with a compliance function.
The compliance function advises the
management body on action that needs to be
taken to ensure compliance with applicable
legislation and other regulations and standards,
and assesses the potential effects of changes in
the legal and legislative environment on the
bank’s activities and its compliance
arrangements.
Independently of the establishment and
implementation of the compliance function, SID
Bank’s management board remains primarily
responsible for managing compliance risk and
for ensuring that SID Bank’s operations comply
with regulations. All of the Bank’s employees
are responsible for ensuring compliance, with
regard to their role and level of responsibility. It
is their right and obligation to undergo training
in the area of compliance risk management.
The aim of the compliance function is to
eliminate or mitigate SID Bank’s compliance
risk, to strengthen its corporate ethics and
integrity, and to prevent fraud and abuse. With
minor derogations explained in point 1 of this
statement, SID Bank complies with the
Corporate Governance Code for Companies with

28 | Annual report of SID Bank and the SID Bank Group 2018
Capital Assets of the State and the Corporate
Governance Code, and is a signatory of the
Slovenian Corporate Integrity Guidelines.
With the consent of the supervisory board, the
management board of SID Bank adopted a code
of ethics and professional standards (published
online at https://www.sid.si) setting out the
principles and rules by which SID Bank, its
bodies and its employees act in the
performance of their work and tasks in relation
to customers, other banks, the economic
environment and within SID Bank itself.
The compliance department has a supervisory
function, and as the administrator of the
internal code of ethics and professional
standards is responsible for handling breaches
of the aforementioned code and for handling
anonymous or public reports of breaches and/or
complaints, filed either by employees or third
parties. The whistleblowing system allows for
the anonymous reporting of breaches. The
department received and handled two
whistleblowers’ reports in 2018, establishing in
the investigation procedure that no breach had
occurred. The compliance department exercises
its supervisory role by means of regular and
extraordinary audits of operations from the
point of view of compliance, focusing on those
areas where analysis of the risk profile suggests
that the risk of non-compliance is highest.
During compliance audits the compliance
department cooperates with the internal audit
department by exchanging information and
findings, and with the risk management
department. The compliance function includes
monitoring and reporting on compliance risk,
and providing advice and training on the
management of compliance risk.
The compliance department had two employees
in 2018. The compliance department is an
independent organisational unit whose director
is directly accountable to the management
board, and is able to communicate directly with
the supervisory board. Under the aegis of the
compliance department there is also an
information security officer, who is responsible
for monitoring and conducting controls on
information security procedures for the purpose
of preventing unauthorised access to
information in storage, during processing or
during transfer, and changes thereto, including
the management of related risks and the
production of analysis of these risks on each
occasion.
Internal auditing
The internal audit department is an
independent and impartial organisational unit
that is separate from the Bank’s other
organisational units in terms of functioning and
organisation, and is answerable directly to the
management board.
The internal audit department operates in
accordance with the Banking Act, the
International Standards for the Professional
Practice of Internal Auditing, the Code of Ethics
of Internal Auditors and the Code of Internal
Auditing Principles. The activity of the internal
audit department and the procedures of internal
auditing are set out in the rules of procedure of
internal auditing and in the internal auditing
manual.
The purpose of the internal audit department is
to provide independent and impartial
assessments on the effectiveness and quality of
risk management, internal controls and internal
governance arrangements, thereby contributing
to the Bank’s improved functioning and
achievement of objectives. The internal audit
department pursues its mission through internal
audits and provision of advice, focusing on the
highest-risk areas that it defines within the
scope of planning the work of the department.
The annual and strategic plans are based on the
Bank’s risk profile, the internal methodology of
audit planning, and the regulator’s
requirements for mandatory auditing of
individual areas of the Bank’s operations, with
the aim of auditing the most high-risk areas of
the Bank’s operations and periodically covering
low-risk or as-yet-unaudited areas. The two
plans are adopted by the management board,
subject to the supervisory board’s approval.
The annual plan for 2018 envisaged 12
comprehensive and complex audits, of which
ten were completed during the year, one was
completed in 2019, and one was switched to the
annual plan for the 2019 financial year. There
was also one ad hoc audit conducted in 2018,
and a self-assessment of the quality of the work
of the internal audit department.

Annual report of SID Bank and the SID Bank Group 2018 | 29
The internal audit department also devoted
considerable attention to following up the
implementation of recommendations. In
addition to regular audits and the follow-up of
recommendations, in 2018 the internal audit
department also provided advice in the area of
the development of banking products within the
framework of the Fund of Funds and financial
engineering, and also informal advice of a broad
spectrum.
The internal audit department reports on an
annual and quarterly basis to the Bank’s
management board, audit committee and
supervisory board regarding its work, its
findings and the follow-up of recommendations.
The Bank’s management board also discusses
all reports on individual audits that have been
carried out.
The internal audit department had three
employees in 2018, one of whom was on half
hours. All of the employees possess the
required licences and professional titles to
perform internal auditing tasks.
3. Information on point 4 of the fifth paragraph of Article 70 of the ZGD-1 with
regard to the information referred to in points 3, 4, 6, 8 and 9 of the sixth
paragraph of the aforementioned article
The Republic of Slovenia is the sole shareholder
in SID Bank pursuant to Article 4 of the ZSIRB.
Company rules on the appointment and replacement of members of management and supervisory bodies, and change to articles of association
Members of the Bank’s management body may
be appointed/dismissed in accordance with the
ZBan-2, the ZGD-1 and the articles of
association. None of the members of SID Bank’s
supervisory board was dismissed in 2018, but
Aleš Berk Skok submitted his resignation in
November 2018, which reduced the number of
members to five.
There were no changes in the management
board in 2018.
There were also no changes to SID Bank’s
articles of association in 2018, which means
that the articles of association approved at the
general meeting of 6 July 2016, when they were
adopted by the sole shareholder, remain in
force.
4. Information about the operation and key powers of the general meeting, and
description of shareholder rights and their exercise
SID Bank’s general meeting is convened by the
management board, and may also be convened
by the supervisory board. The general meeting
is convened in accordance with the law and the
articles of association by means of registered
mail to the sole shareholder. The support
material for the general meeting is sent to the
shareholder at the same time as the convening
notice. On the day that the registered mail is
sent, SID Bank publishes all the notices and
information required by the ZGD-1 on its
website. In accordance with Article 4 of the
ZSIRB, the voting rights and other rights of the
sole shareholder are exercised by the Republic
of Slovenia, which in accordance with the
Slovenian Sovereign Holding Act authorises
Slovenski državni holding d.d. to act on behalf
of and for the account of the sole shareholder
pursuant to law. When the ZGD-1 gives the sole
shareholder the right to use electronic means, it
may submit proposals, authorisations and other
documents to SID Bank by emailing the address
cited in the convening notice. The general
meeting sits at least once a year, after the end
of the financial year, at SID Bank’s
headquarters, at the registered office of the sole
shareholder, or at a place designated by the
sole shareholder. The exact time and date of the
general meeting are determined when it is
convened.
The general meeting’s powers are set out by the
ZGD-1 and the ZBan-2.

30 | Annual report of SID Bank and the SID Bank Group 2018
5. Composition and functioning of management and supervisory bodies and
their committees
SID Bank has a two-tier system of governance:
the business is directed by the management
board, while its functioning is supervised by the
supervisory board.
Supervisory board
The supervisory board monitors and supervises
the management and operations of the Bank.
The supervisory board operates on the basis of
its rules of procedure, which set out in detail the
principles, procedures and work methods, while
its principal powers and responsibilities are set
out by the Bank’s articles of association and
laws governing the Bank’s operations, most
notably the ZGD-1, the ZBan-2 and the ZSIRB.
The supervisory board’s role includes approving
the Bank’s strategic policy, reviewing the annual
reports and other financial reports and
formulating an opinion thereof, explaining to
the general meeting its opinion of the annual
report by the internal audit department and its
opinion of the annual report by the
management board, approving the annual
report and the management board’s proposal
for the use of the distributable profit, and
discussing any findings made in supervisory
procedures by the Bank of Slovenia, tax
inspectors and other supervisory authorities. In
addition, the supervisory board is responsible
for giving its consent to the management board
in relation to the Bank’s business policy,
financial plan, remuneration policy, the
organisation of the system of internal controls,
the internal audit department’s annual
programme of work, and the compliance
department’s annual programme of work. The
supervisory board is also responsible for issuing
prior consent for the conclusion of financing,
borrowing and capital investment transactions.
The supervisory board has appointed an audit
committee, a risk management committee and
a nomination and remuneration committee as
advisory bodies. Each committee’s tasks and
powers are set out in its own rules of procedure.
In accordance with the ZSIRB, the supervisory
board consists of seven members who are
appointed by the government. Members of the
supervisory board are appointed to a five-year
term of office. The procedure and requirements
for the selection of suitable members are set out
in the ZSIRB and ZBan-2, and in the policy for
the selection of supervisory board members
that was adopted by the Slovenian government.
The policy sets out the method for the selection
of candidates who possess the relevant
knowledge, skills and experience to supervise
and monitor the direction of the Bank’s
business, and the requisite reputation, and
ensures that the supervisory board as a whole
possesses the relevant knowledge, skills and
experience required for the in-depth
understanding of SID Bank’s activities and the
risks to which it is exposed. Diversity is
encouraged as much as possible in terms of
knowledge, skills and experience, and also in
terms of other circumstances, in particular
regarding gender, age, qualifications, social
status and other circumstances on the part of
candidates. The supervisory board comprises at
least one member with knowledge and
experience in the areas of (i) financial risk
management, (ii) supervision and auditing of
SID Bank’s activities, (iii) commercial law and
corporate governance, and (iv) management
and remuneration, and at least two members
with specific banking knowledge and several
years of experience in banking.
SID Bank has put in place a process for
assessing the suitability of members of the
management body. An assessment of the
suitability of members of the management body
is formulated at least once a year. The
structure, size, composition and performance of
the management body are assessed at least
once a year by the supervisory board itself.
Within the framework of the annual assessment
of the management body, the supervisory board
was assessed as suitable, both in terms of the
knowledge, skills and experience of individual
members and the body as a whole, with regard
to its structure, size and composition and the
performance of its work, irrespective of its
incomplete composition in accordance with the
ZSIRB. All three committees of the supervisory
board (the audit committee, the risk committee
and the nomination and remuneration

Annual report of SID Bank and the SID Bank Group 2018 | 31
committee) have the suitable size and
composition, and the committee members
possess the requisite knowledge and experience
to perform the tasks of individual committees
that are determined by the law, meaning that
the committees did not use any external
advisors or experts in 2018.
It was established during the assessment
procedure that the composition of the
supervisory board ensures diversity according
to the majority of the criteria referred to in the
selection policy for supervisory board members.
However, the composition lacks balance in
terms of gender. As a result, increased focus
was placed on this criterion when determining
the profiles of supervisory board members to be
recruited, which in 2018 were set out by the
nomination and remuneration committee in the
procedure for appointing new supervisory board
members. The nomination and remuneration
committee informed the ministries responsible
for proposing members of SID Bank’s
supervisory board of the numerical
incompleteness of the supervisory board,
particularly at the end of the year, when the
resignation of one member left it with just five
members.
In 2018 there was no need to formulate new
overall assessments of the suitability of
individual members of the supervisory board, as
no circumstances arose in connection with the
board members that would require a new
individual suitability assessment, other than in
the case of new candidates for supervisory
board membership.
As at 31 December 2018 the supervisory board
consisted of Monika Pintar Mesarič as chair,
Marko Tišma as deputy-chair, Marjan Divjak,
Zlatko Vili Hohnjec and Leo Knez.
Supervisory board’s nomination and
remuneration committee
The nomination and remuneration committee is
authorised and responsible for the performance
of duties relating to the appointment of
management board and supervisory board
members and the remuneration system. It tasks
therefore include the identification and
recommendation of candidates for membership
of the management board to the supervisory
board with a definition of the tasks and
conditions for a particular appointment, the
assessment of the composition and
performance of the management board, the
knowledge, skills and experience of individual
members of the management board and
supervisory board or both bodies as a whole,
and the assessment of the appropriateness of
remuneration policies and practices and the
drafting of proposed decisions of the
management body related to remuneration,
including those that impact risks and the Bank’s
risk management.
The committee met at seven ordinary sessions
in 2018, and held two correspondence sessions.
As at 31 December 2018 the committee
consisted of Monika Pintar Mesarič as chair,
Marko Tišma as deputy-chair and Zlatko Vili
Hohnjec.
Name and SurnameDate of
Appointment
Duration of
Mandate
(yrs)
Duration
(untill)Position Changes in 2018
Monika Pintar Mesarič 22-Feb-2018* 5 2023 Chair until 21-Feb-2018
Member from 22-2-Feb-2018
Chair from 15-Mar-2018
Marko Tišma 28-jul-2016 5 2021 Deputy-chair -
Marjan Divjak 18-maj-2017 5 2022 Member -
Leo Knez 22-Feb-2018* 5 2023 Member until 21-Feb-2018
Member from 22-Feb-2018
Aleš Berk Skok 13-apr-2017 5 16-nov-2018 Member until 16-Nov-2018
Zlatko Vili Hohnjec 18-maj-2017 5 2022 Member -
*Re-appointment

32 | Annual report of SID Bank and the SID Bank Group 2018
Supervisory board’s audit committee
In connection with its powers of monitoring and
supervision, the audit committee primarily
discusses the Bank’s annual and interim
financial statements, the activities of the
internal audit department, the organisation of
the system of internal controls, risk
management, and any findings by supervisory
authorities in procedures of supervision. The
committee also participates in procedures to
select an external auditor, and reviews and
monitors the auditor’s work and impartiality.
The committee held six ordinary sessions and
one correspondence session in 2018.
As at 31 December 2018 the audit committee
consisted of Zlatko Vili Hohnjec as chair, Marjan
Divjak as deputy-chair and Leo Knez.
Supervisory board’s risk committee
Within the scope of its powers, the risk
committee primarily provides advice regarding
the Bank’s general risk appetite and risk
management strategy, assists in the
implementation of supervision of senior
management with regard to the risk
management strategy, checks whether risks are
taken into account in incentives within the
framework of the remuneration system and
checks whether the prices of the Bank’s
products are compatible with its business model
and risk management strategy.
The risk committee met at eight ordinary
sessions in 2018.
As at 31 December 2018 the risk committee
consisted of Leo Knez as chair, Marjan Divjak as
deputy-chair and Marko Tišma.
Management board
SID Bank’s business is directed by the
management board, which represents it in
public and legal matters. The management
board is appointed by the supervisory board for
a term of five years, and may be reappointed.
In accordance with the articles of association,
the management board has a maximum of
three members, one of whom is appointed
president, with the precise number of
management board members being determined
by the supervisory board.
The management board directs the business
independently and at its own liability. Its activity
is governed by the rules of procedure of the
management board. The management board
generally sits in session on a weekly basis,
where matters from all areas of SID Bank’s
Name and Surname Position Changes in 2018
Monika Pintar Mesarič Chair until 21-Feb-2018
Member from 9-Mar-2018
Chair from 15-Mar-2018
Marko Tišma Deputy-chair -
Zlatko Vili Hohnjec Member -
Name and Surname Position Changes in 2018
Aleš Berk Skok Chair until 16-Nov-2018
Zlatko Vili Hohnjec Member -
Deputy-chair from 15-Mar-2018
Chair from 13-Dec-2018
Marjan Divjak Deputy-chair from 13-Dec-2018
Leo Knez Deputy-chair until 21-Feb-2018
Member from 9-Mar-2018
Name and Surname Position Changes in 2018
Leo Knez Chair until 21-Feb-2018
Member from 9-Mar-2018
Chair from 15-Mar-2018
Marjan Divjak Deputy-chair -
Marko Tišma Member -
Aleš Berk Skok Member untill 16-Nov-2018
Annual report of SID Bank and the SID Bank Group 2018 | 33
operations are discussed. The management
board regularly briefs the supervisory board on
the most important issues in the Bank’s
operations, on its business policy, its financial
position and other significant issues relating to
its activity.
In 2018 the management board consisted of
Sibil Svilan as president and Goran Katušin.
They both meet the requirements with regard
to knowledge, skills and experience and other
criteria, while the management board as a
whole meets the collective suitability
requirement, meaning that the two
management board members satisfy all the
suitability assessment criteria together and
without the need for additional training. In 2018
there was no need to formulate new
assessments of the suitability of the
management board, as no circumstances arose
in connection with the board members that
would require a new individual suitability
assessment for a particular management board
member. There was no change to the
composition of the management board in 2018,
and no change in the powers of the members
of the management board, and no
circumstances arose in connection with either
member of the management board. In the
annual assessment of the management body, it
was found that the two members of the
management board are individually and
collectively suitable for performing their
functions.
The management board transferred certain
decision-making rights to collective decision-
making bodies, such as the credit committee,
the government operations committee, the
distressed investment management committee
and the asset-liability and liquidity management
committee. The main powers and
responsibilities and the methods of work of the
committees are set out in the committees’ rules
of procedure. In addition, the management
board transferred certain decision-making
powers with regard to transactions to individual
employees at SID Bank on the basis of the
rulebook on authorisations.
Credit committee
The credit committee decides on approvals and
changes to terms of investment operations that
do not constitute refinancing or restructuring
due to a borrower’s financial difficulties, on the
classification of individual investments,
exposure limits to an individual customer and on
the documentation when introducing new or
changing existing financing programmes or
individual products. The credit committee
approves the conditions and procedures for
selecting financial intermediaries for financing
from the fund of funds, and the related business
plans, and takes decisions of financial
transactions and contracts of participation. The
credit committee is also responsible for capital
growth investment programmes for corporate
equity financing. The credit committee monitors
individual exposures and the quality of the
credit portfolio on the basis of reports by
individual organisational units, and also decides
on the transfer of investments with increased
credit risk to non-performing investments, and
on the termination and cancellation of
investment operations. The committee consists
of five members, who meet at weekly sessions.
Asset-liability and liquidity management
committee
Within the scope of its powers of managing the
Bank’s liquidity, the asset-liability and liquidity
management committee manages liquidity risk
and structural liquidity. To that end, it makes
decisions on the raising of funding and
placement of assets on the money and capital
markets in Slovenia and in the rest of the world,
and on the utilisation of Bank of Slovenia and
ECB instruments, and approves and supervises
the exchange rate and interest rate policy. The
committee is also responsible for managing the
free assets of financial instruments funded via
the European structural and investment funds,
and assets earmarked for corporate equity
financing.

34 | Annual report of SID Bank and the SID Bank Group 2018
In the area of asset-liability management the
committee sets out, modifies and monitors the
implementation of the strategy and policy of the
balance sheet structure, defines and monitors
the implementation of the pricing, liquidity,
interest rate and exchange rate policy, decides
on proposals regarding asset-liability risk
management, approves the financing
programme and products relating to treasury
operations and changes thereto, monitors the
Bank’s capital adequacy, approves the treasury
investment policy, and monitors and discusses
the stress test results. The committee also
manages liquidity and manages assets and
liabilities (balance sheet) in relation to SID
Bank’s operations under Republic of Slovenia
authorisation, primarily managing liquidity risk
and structural liquidity, and in the area of asset-
liability management adopts the policy for
contingency reserve investments and assesses
the impact of new programmes of insurance up
to the amount of contingency reserves.
In terms of membership, it is the largest of the
Bank’s committees, and consists of nine
members. Sessions focusing on liquidity
management are held weekly, while asset-
liability management is discussed monthly.
State-related Investments Committee
The purpose of the special government
operations committee is the consistent
segregation of SID Bank’s ordinary operations
from its operations for the account of the
Republic of Slovenia. The committee decides on
approvals and changes to transactions that SID
Bank concludes for the account of the Republic
of Slovenia, including the financing of
international commercial transactions from
contingency reserves, insurance and
reinsurance, guarantee schemes, and financial
instruments funded by European structural and
investment funds, and on matters related to
these transactions. The government operations
committee has five members, and meets in
weekly sessions.
Distressed investment management
committee
The distressed investment management
committee, which has five members, manages
problem claims with non-performing investment
status, whereby it makes decisions on approvals
and changes to the terms of investment
operations and financial restructuring plans and
on all matters associated with non-performing
investments (also regarding the enforcement of
rights in insolvency proceedings). The
committee sits weekly.
Committee for the assessment of the suitability of members of the management body and key function holders
The committee for the assessment of the
suitability of members of the management body
and key function holders has three members,
who are appointed by the management board,
subject to the prior approval of the supervisory
board. The committee is autonomous in its work
and independent of the management board and
the supervisory board. The committee consists
of two external members with knowledge and
experience of banking and financial services and
of recruitment, psychology and related
professional fields, and a third member who is
an employee, namely the director of the
compliance department, to whom the
management board ensures suitable protection
against potential retaliatory measures.
The committee for the assessment of the
suitability of members of the management body
and key function holders and the supervisory
board’s nomination and remuneration
committee carry out the process of assessing
the suitability of the members of the
management body.

Annual report of SID Bank and the SID Bank Group 2018 | 35
Members of the management body are subject
to assessment by the two committees before
their appointment or the commencement of
their function, and also if new circumstances
arise in connection with a particular member of
the management body during the term of office.
An annual performance assessment is also
formulated for members of the management
body on a separate basis from the above. The
annual performance assessment for the
management body is generally drawn up by the
director of the compliance department. It is
then discussed by the supervisory board’s
nomination and remuneration committee, which
formulates a position on it.
In line with applicable banking legislation,6
alongside the selection policy for members of
the management body the procedure for
assessing members of the supervisory board
also takes account of elements deriving from
the ZSIRB, the Corporate Governance Code and
the Corporate Governance Code for Companies
with Capital Assets of the State, and the
selection policy for members of the supervisory
board.
The work of the management body in 2017 was
assessed by the director of the compliance
department in 2018. The work of the
supervisory board was assessed as positive,
although it was highlighted that the composition
of the supervisory board did not comply with the
ZSIRB, which stipulates that the supervisory
board should have seven members, while the
supervisory board acted with six members in
2018, and finished the year with five members.
Owing to the end of the term of office of certain
supervisory board members and a change in
circumstance on the part of one supervisory
board member, the two committees drafted one
partial assessment and two comprehensive
assessments of the suitability of candidates for
supervisory board membership in 2018.
6 The ZBan-2, the Regulation on internal governance
arrangements, the management body and the internal capital adequacy assessment process for banks and savings banks, other Bank of Slovenia regulations, EBA and ESMA regulations, most notably the Joint ESMA and EBA Guidelines on the assessment of the suitability of
International trade promotion commission
The government has appointed an international
trade promotion commission to coordinate the
actions of the relevant government bodies and
other bodies and institutions in the
implementation of the ZZFMGP, and to ensure
the effective implementation of the insurance
and financing of international trade and
investment.
The commission makes decisions on the Bank’s
proposals for the conclusion of insurance
operations that exceed EUR 5 million, or
whenever SID Bank itself is involved in a
transaction. It also holds decisive powers on
other matters related to risk management, such
as approvals for:
− the policy of insurance operations in
individual countries or groups of countries,
which together with the limits on insurance
already set out in the ZZFMGP act to limit
potential claims;
− the formulation and conclusion of special
insurance terms for individual insurance
policies and other transactions;
− the management of the contingency
reserves and the risks taken up in insurance
operations;
− the conclusion of agreements and relations
with financial institutions and other
institutions;
− the reprogramming, recovery and liquidation
of claims;
− other operations in connection with
insurance under government authorisation.
The international trade promotion commission
regularly monitors the Bank’s operations in
areas regulated by the ZZFMGP, discussing
performance reports and providing an opinion
of the Bank’s exercise of authorisations under
the ZZFMGP for the Ministry of Finance.
As at 31 December 2018 the commission
consisted of Franc Stanonik as chair, Matej
Čepeljnik as deputy-chair, Jože Renar, Alenka
Suhadolnik, Stanislava Zadravec Caprirolo and
Jernej Tovšak.
members of the management body and key function holders (EBA/GL/2017/12) and the EBA Guidelines on internal governance (EBA/GL/2017/11) are taken into account.

36 | Annual report of SID Bank and the SID Bank Group 2018
6. Diversity policy
SID Bank has transposed the requirements with
regard to the composition of the management
body in terms of knowledge, skills and
experience and also in terms of gender balance
into its bylaws, including the selection policy for
supervisory board members and the selection
policy for management board members. The
aforementioned policies stipulate that in the
event of the availability of several diverse
candidates who meet the conditions of
appointment, whose individual suitability
assessments are equally good, and who would
also ensure that the collective suitability of the
management body is satisfied, precedence is
given to the candidate who would bring the
greatest diversity to the membership of the
management body.
The gender diversity criterion was not satisfied
in 2018, irrespective of the definition of the
criteria in the profile of members of the
management body, while other criteria relating
to qualifications, professional experience, skills
and competencies, and age were satisfied.
Ljubljana, 5 March 2019
Management board of SID Bank
Goran Katušin Sibil Svilan, M.Sc.
Member President

Annual report of SID Bank and the SID Bank Group 2018 | 37
Social responsibility
SID Bank mission statement
The mission and activities of SID Bank focus on
meeting the wider social objectives defined by
all three components of sustainable
development in Slovenia: economic growth,
social security and environmental concerns. The
foundation of SID Bank’s activities consists of
long-term development policy in Slovenia and
the EU, where priority areas are defined
through societal consensus.
SID Bank contributes to ensuring economic
growth that is sustainable and stable in the long
term via a system of development financing and
the insurance of international commercial
transactions, thereby promoting Slovenia’s
economic and sustainable development. The
financial value of services for final beneficiaries,
the implementation of the development
strategy and the effective implementation of its
public authorisations are the foundation on
which SID Bank pursues its objective of being
an effective and valued development partner.
SID Bank’s role is to intervene in areas where it
is able to create significant social benefits:
− sustainable and balanced economic
development in Slovenia;
− research and innovation, and other forms of
economic development activity that increase
the competitiveness and excellence of
businesses in Slovenia;
− sustainable development with a high degree
of protection for the environment and
habitat;
− advanced public and economic infrastructure
and energy efficiency;
− social progress, education and employment;
− other economic activities contributing to
growth, development and prosperity.
By assessing companies over the various
developmental stages of operations and
providing tailored financial services, SID Bank
ensures suitable financing terms and conditions
where the market offer proves insufficient. To
this end, it encourages the Slovenian corporate
sector to take advantage of its opportunities at
home and abroad, particularly with respect to
SMEs with high development potential.
Socially responsible approach to customers and the environment
Effects of the Bank’s activities
With its important role during the crisis, SID
Bank became one of Slovenia’s key financial
institutions. Financing socially beneficial
infrastructure projects and target groups in the
economy is the primary way by which SID Bank
provides support for Slovenia’s sustainable
development policies. Using the standardised
methodology of macroeconomic multipliers, the
SID Bank Group’s services facilitated EUR 10.1
billion in sales by Slovenian companies, EUR 4.1
billion of GDP, EUR 4.8 billion of exports and
more than 23,900 new jobs in 2018. The
purpose of SID Bank’s operations is to achieve
not just the aforementioned economic effects,
but also other social and environmental effects
as a result of the projects that it supports and
the development promotion programmes that it
implements.
In 2018, at SID Bank’s invitation, a group of
economics experts at the Faculty of Economics
in Ljubljana conducted a third evaluation of its
activities, this time for the five-year period of
2011 to 2016. It is a case of the implementation
of good international practice in the area of
development banking. During this period SID
Bank acted in the area of the cyclical gaps that
arose during the extremely adverse situation of
the macroeconomic crisis, and offered support
to Slovenian companies through counter-
cyclical measures. The evaluation revealed that
between 2011 and 2016 SID Bank reinforced its
position as the central public promotional
institution in the country.

38 | Annual report of SID Bank and the SID Bank Group 2018
Circular economy and green economy
SID Bank provides support for the circular
economy and the green economy through its
existing financial programmes, either directly,
or indirectly via commercial banks. Through its
development promotion programmes SID Bank
contributes to the development of a competitive
economy, focused on SMEs, the development of
a knowledge-based society and innovative
entrepreneurship, the development of an
environment-friendly society, and regional and
social development. Via SID Bank’s existing
programmes it is possible to directly finance
companies and their investments in projects for
energy efficiency, renewables, renovation of
buildings, sustainable transport, and the
sustainable handling and recycling of water,
wastes and other natural resources. Within the
framework of the programmes for financing
SMEs it is possible to obtain funds for the
purchase of secondary raw materials, the
coverage of labour costs in the production of
secondary raw materials, the development and
production of new products from secondary raw
materials, the development and production of
reuse, etc.
SID Bank provides indirect support for the
circular economy and the green economy
through systematic evaluation of the business
models of its clients. In addition to financial
solidity, within the framework of the credit
assessment of companies SID Bank also
evaluates elements of the long-term
sustainability and viability of their business
models, and their compliance with the purposes
pursued by SID Bank within the framework of
its mandates. SID Bank assesses the
sustainability of a firm’s business model from
five perspectives: it's long-term resilience,
material efficiency, concern for the natural
environment, energy efficiency, and innovation
and technological breakthrough. SID Bank
integrates the assessment of the firm from
these five perspectives into its interest rate
policy, and provides more favourable financing
for companies with circular business models.
In 2018 the Bank carried out a project to
formulate methodology for evaluating
companies from the perspective of circularity
and for assessing their potential for circular
transformation, and on this basis upgraded the
five perspectives model.
Responsible lending and borrowing
As a member of the BAS, SID Bank complies
with the principles of responsible lending, which
represent guidelines and recommendations to
fulfil the objective of responsibility towards
clients, owners and other stakeholders. In
practice SID Bank has built the concept of
responsible lending into the internal decision-
making process. Alongside the economic and
financial position, the latter also includes an
assessment of borrowers from the five
perspectives. In parallel with the planned
adjustment in its lending activities, SID Bank is
also developing and introducing systemic
solutions, and is tailoring its range of services in
substantive and technical terms to the changing
needs of final beneficiaries, and of commercial
banks when they act as intermediaries for SID
Bank’s purpose-specific funding.
As a development bank SID Bank is required to
ensure the long-term financial sustainability of
its business model. Because it does not operate
within the goal of maximising profitability, it is
able to provide more favourable financial terms
in its promotional programmes. In accordance
with the ZSIRB, SID Bank reinvests and
earmarks all profits for the additional financing
of the real sector. SID Bank’s role is thus not to
support all transactions, but only those
transactions that are economically and
financially justifiable, and yet include a
sustainable development component.
SID Bank realises the value-added of its services
via the following levers:
− ensuring diversity and favourable terms of
funding sources;
− ensuring more efficient use and allocation of
funds;
− providing programmes with longer maturity
and greater risk take-up;
− providing lower prices of services and other
more favourable terms, in line with the
allocation of permitted state aid for
promoting the economy;
− stimulating the functioning of the private
sector to act in the direction of sustainable
development and to build capacity;
− transferring the financial benefits to final
beneficiaries instead of maximising its own
earnings;
− developing financial instruments tailored to
the needs of the Slovenian economy;

Annual report of SID Bank and the SID Bank Group 2018 | 39
− achieving positive developmental, social and
environmental effects;
− liaising with other public promotional
institutions and combining refundable and
non-refundable funds;
− providing advisory services.
In its transactions with customers SID Bank
devotes special attention to preventing
corruption and to environmental policy. In so
doing SID Bank is aware that its specific position
requires it to act in a way that prevents the
distortion of free competition. SID Bank’s
activities have therefore essentially been
established within a framework that is
complementary to other market participants in
the area of financing.
Accessibility to services
Given its public mandates, the Bank pursues the
principle of equal access and the equal
treatment of all users of its services, meaning
the same services under the same conditions for
all equally entitled entities (principle of non-
discrimination). Particular attention is also given
to the appropriate regional allocation of
development funds.
In 2018 SID Bank within its products and
programmes continued to pursue the concept of
covering key phases in the production chain
where market gaps arise. SID Bank also
contributes to the accessibility of financial
services by developing new and adapting its
existing products . The development of new
products tailored to the needs of the real sector
and economic policy primarily focuses on the
areas of financing for SMEs, infrastructure,
environment-friendly programmes, support for
the financial and business restructuring of the
economy, and capital market catalysis.
Professional commitments and cooperation
Interbank agreements and recommendations
that reinforce best practices and the rules and
principles of the banking profession are
contributing to long-term viability, responsible
lending, security and liquidity inside and outside
the banking sector. The Bank therefore places
great emphasis on such agreements with
financial institutions at both the national and
international levels, and actively participates in
the exchange of information, best business
practices and the establishment of professional
values.
SID Bank mainly guides its activities by
cooperating within the framework of the Bank
Association of Slovenia and foreign banking
associations. It is also a member of several
international associations of financial
institutions, including the European Association
of Public Banks (EAPB), the European
Association of Long-Term Investors (ELTI), the
Network of European Financial Institutions for
SMEs (NEFI) and the Berne Union. Together
with more than 50 other members of the Berne
Union, the Bank signed a special declaration by
which it undertakes to strive to achieve the high
ethical standards and values of the association,
and to perform its activities professionally and
in a financially responsible manner, while
respecting the environment. With the aim of
strengthening cooperation with European
institutions, SID Bank is also a shareholder in
the European Investment Fund (EIF). SID Bank
cooperates with the European Investment
Advisory Hub (EIAH), where it acts as a national
access point for providing support to investment
projects, primarily from the European Fund for
Strategic Investments (EFSI).
SID Bank is also a signatory to the Slovenian
corporate integrity guidelines, and a founder
member of the Slovenian Innovation Hub, a
European economic interest grouping where it
cooperates with members from the corporate
sector, banking, academia and regional and
local organisations.
Communication with external audiences
As a promotional and development bank, SID
Bank pays a great deal of attention to the
transparency of its operations, and thus to open
and transparent communication.
The primary focus of external communications
is the business audience, in particular business
partners. SID Bank provides comprehensive
information about its programmes and
opportunities to receive its funds through
advanced communication channels. In addition
to press releases, news on its website and
online bulletins, SID Bank organised
presentations of new and existing products for
companies, banks and local authorities in 2018,
and provided regular information to and built

40 | Annual report of SID Bank and the SID Bank Group 2018
business relationships with firms and other
commercial banks that mediate SID Bank’s
funds to companies.
Media communication with the business
audience was further strengthened in 2018 via
interviews, articles, advertisements and promo
pieces, particularly in the second half of the
year, and even more so from October, when the
first agreements were signed with financial
intermediaries for the Fund of Funds. The
Bank’s activities in this area are evidenced in a
rise of more than 12% in the number of articles
dealing with related themes.
At a traditional Knowledge hub organised by
SID Bank and attended by more than 150
participants, renowned experts from Slovenia
and further afield highlighted hot topics with
regard to geopolitical structures and economic
transformations currently taking place in the
world, and their impact on the Slovenian
economy.
SID Bank representatives attended and
participated in various events, seminars,
conferences, roundtables, etc. at 70 events
throughout Slovenia, where they discussed
topics of relevance to the activities of SID Bank,
such as exports, development, the energy
sector, the environment, the circular economy,
competitive entrepreneurship, and sustainable
economic growth.
Environment-friendly company
From the perspective of environmental
protection and energy efficiency, SID Bank acts
with social responsibility both inwardly and
outwardly. In 2018 it continued to monitor its
energy-environmental balance sheet, calculated
its carbon footprint and monitored other social
responsibility indicators. In this way SID Bank
measures the environmental impact of its
measures, and its achievement of targets in the
area of social responsibility. SID Bank has put in
place a system for the separate collection and
disposal of waste, and measures to reduce
electricity consumption in offices, has
introduced paperless operations, has taken
action to encourage the use of public transport,
etc.
SID Bank is continuing its practice of donating
money instead of giving gifts to business
partners. In 2018 the majority of the funds
previously intended for Christmas and new year
presents were donated to set up beehives at
Sostro primary school. In this way SID Bank is
encouraging the development, education and
work of young beekeepers in Slovenia.
Unit 2018 2017
Consumption of energy for heating kWh 321,561 330,111
per employee kWh/employee 1,811.6 1,988.6
Electricity consumption kWh 171,592 172,605
per employee kWh/employee 966.7 1,039.8
Consumption of water m3 1,168 1,109
per employee m3/employee 6.6 6.9Carbon footprint/CO2 emissions t 246 245
per employee t/employee 1.4 1.5
Use of office paper t 5 6
per employee kg/employee 27.8 33.0
Value of other office supplies EUR 16,476 18,977
per employee EUR/employee 92.8 114.3
Size of business premises
per employee m2/employee 14.7 13.8

Annual report of SID Bank and the SID Bank Group 2018 | 41
Socially responsible activity at the Bank
SID Bank is aware that socially responsible
carrying out of its activities cannot be properly
implemented without enforcing the personal
responsibility of all individuals at the
organisation, requiring awareness of personal
and social responsibility to be promoted at all
levels at the Bank as the lifestyle of the
individual and the organisation as a whole in all
aspects of its activities.
SID Bank’s social responsibility policy is a
formally binding document that emphasises the
importance of the entire collective working
together to achieve their objectives in this area.
Through the process of strategic and
operational planning SID Bank pursues the
continual and systematic enhancement of
substantive ideas and measures that increase
social responsibility.
SID Bank has adopted a governance policy
based on its internal socially responsible activity
conduct. The policy highlights corporate values,
model codes of governance, cooperation with
all stakeholders, the policy for transactions
between the company and related parties, the
commitment to identifying conflicts of interest,
the independence of management and
supervisory bodies, performance assessment,
and the protection of employees’ interests.
A code of ethics and professional standards sets
out in detail the principles and rules by which
the Bank, its bodies and its employees act in the
performance of their tasks in relation to
customers, other banks, the economic
environment and within the Bank. The code
reinforces the established practice of
encouraging the right organisational culture,
positive conduct and attitude on the part of
employees. The code also places special
emphasis on social responsibility and the
attitude to the environment.
In addition to professional standards, the Bank
has put in place a system for protecting
whistleblowers, which is extended to the Bank’s
own employees and to people working with the
Bank.
Internal communications
SID Bank performs a highly specialised activity.
It is therefore crucial to its successful
functioning that employees understand and
support its actions. Effective and open
communications can contribute to this.
Various forms of notifying and communicating
with employees have been put in place at the
Bank. They include direct communication
between the senior management and
employees (e.g. regular internal meetings and
meetings between employees and the
management board, meetings with the trade
union), access to electronic databases, internal
email bulletins and the half-yearly release of
Cekin, the in-house journal.
Responsibility to employees
SID Bank facilitates flexible working hours,
making it easier to achieve work-life balance, in
particular allowing parents with young children
to arrange different working hours from other
employees. The management board allows
employees to occasionally work from home,
when the nature of their work allows this and
their absence does not hinder the organisation
of work. Special attention is also given to the
rights of employees, their health and safety,
working conditions, social security, personal
and professional development, social dialogue
and mutual relationships.
In the area of employee health and safety, SID
Bank continued the practice of organising prior
targeted and periodic medical examinations for
all employees. It also conducts regular
professional training in the area of occupational
health and safety and fire safety, which all
employees are required to attend. By regularly
monitoring employees’ needs, implementing the
recommendation of occupational medicine
experts, and taking measures to promote health
in the workplace, the Bank is working to provide
the healthiest possible working conditions and
working environment.

42 | Annual report of SID Bank and the SID Bank Group 2018
Valid legislation and the collective agreement
for the banking sector is observed when setting
salaries and determining other labour costs for
employees. Remuneration for performance and
advancement are governed by the company-
level collective agreement, which also sets out
the terms, conditions and criteria for
additionally motivating key staff. In 2018 the
Bank continued the practice of paying premiums
for voluntary health insurance and
supplementary pension insurance for
employees.
SID Bank has particular concern for employee
development. By upgrading the employee
development system, the Bank ensures that the
educational and qualifications structure is
suitable for its development and its strategic
objectives, thereby ensuring that each
employee at the Bank has the knowledge, skills
and abilities required to perform effectively in
their work, raising the quality of work of
individuals and teams. The incentive-based
system of remuneration further helps
employees to effectively adapt to changes and
challenges within the organisation and in an
environment that will present them with
sufficient professional challenges in the future.
The system of competencies for specific posts
ensures quality within the framework of SID
Bank’s complex functional structure as a
development bank.
Annual development interviews are conducted
with employees, and represent the basis for
assessing the development potential of
individuals, the definition of key staff members
and the formulation of annual training plans.
The Bank is thus able to identify needs for new
knowledge in a timely manner, and to plan
targeted training and education programmes
for individuals and groups of employees.
Promoting the acquisition of additional
knowledge and skills and their practical use is
one of the guidelines of SID Bank’s action
strategy. A total of 93% of all employees
attended various forms of training in 2018. A
great deal of emphasis is also placed on training
in connection with the development of new
products and services, the internal transfer of
newly acquired knowledge, and the evaluation
of these processes.
In the context of internal social responsibility,
the Bank strives to implement and live by its
values in the everyday life and work of
employees by conducting annual interviews and
holding employee meetings. The employees
also attend numerous meetings and
roundtables at which they promote the values
of sustainable development and ethical conduct
as the basis for socially responsible and
sustainable banking.
The Bank encourages employees to submit
suggestions for improvements to procedures
and processes via a well-established system for
promoting creativity and handling suggested
improvements that encompasses informing
employees of the importance of creativity for
the viability and development of the Bank,
regularly monitoring creative accomplishments,
rewarding suggestions, and putting
improvements into practice.

Annual report of SID Bank and the SID Bank Group 2018 | 43
Recruitment was undertaken in line with the
annual employment plan in 2018, and in line
with guidelines from the action strategy, which
is based on a new business model and on the
adjustment of recruitment to growth in turnover
and the development of new products, the
recruitment of experts with specific skills and
experience, and the retention of capable and
promising employees.
SID Bank hired 23 new employees in 2018,
mostly to replace employees who found new
challenges outside the Bank or who took
temporary leave of absence, and partly as a
response to needs and challenges dictated by
new tasks and the increased workload brought
by the launch of new products and the transition
to a new business model. SID Bank had 185
employees at the end of the year, of whom 124
were women and 61 were men. The headcount
averaged 181 in 2018.
Education
level number proportion, % number proportion, %
5 or less 15 8.1 26 9.4
6/1 12 6.5 19 6.9
6/2 37 20.0 58 20.9
7 92 49.7 137 49.5
8/1 24 13.0 32 11.6
8/2 5 2.7 5 1.8
Total 185 100.0 277 100.0
SID Bank GroupSID Bank

44 | Annual report of SID Bank and the SID Bank Group 2018
SID Bank’s strategy
Strategic planning at SID Bank is based on a
strategy that encompasses all of the key
aspects of its medium-term operations and its
long-term objectives. In 2018 SID Bank set in
place its new development strategy for the
period of 2019 to 2023, with a vision of strategic
success over the horizon to 2025. Through the
updated strategy SID Bank is ensuring that its
foundations are fit for purpose in allowing the
Bank to adapt to its external circumstances and
for its continued evolution within the framework
of the entrusted mandates.
First and foremost the strategy reflects changes
in the sense of the functioning of financial
markets and the banking system domestically
and in the foreign environment, while taking
account of the current economic situation, the
medium-term macroeconomic projections and
the objectives of national development policy.
Accordingly, needs arose for changes to certain
key internal elements of the strategy, primarily
adjustments to the business model, products
and services, the method of lending, and risk
management.
Mission statement, vision and values
As Slovenia’s central financial institution in the
areas of promotion and development, SID Bank
develops and provides long-term financial
services to complement the market, thereby
promoting economic competitiveness, job
creation, social inclusiveness and sustainable
development. Through its actions and its
dedication to its mission, SID Bank is
consolidating its role as a major factor in
Slovenia’s sustainable development.
The vision of SID Bank’s strategic success over
the period to 2025 encompasses four aspects.
From the aspect of key stakeholders’
expectations, within the framework of its
mandates SID Bank will increase the scope of
its services while ensuring its ongoing financial
viability. It will work proactively in formulating
and implementing Slovenia’s long-term
development strategies, and will act as the main
channel for placing government and EU funds
with the real sector. From the aspect of external
relations, SID Bank will play an important
liaising role within the framework of Slovenia’s
system of public promotion. In addition, in the
domestic environment it will work with
development incubators, chambers and
educational institutions. It will also strengthen
cooperation with international financial
institutions and associations active in
development, and will continue to base its
operations primarily on cooperation with
commercial banks. From the aspect of internal
processes and capabilities, SID Bank strives to
provide high-tech support for its business
processes, which are capable of adapting
quickly to market needs and internal needs, and
provide high-quality support for clients in all
their development phases. The Bank will devote
particular attention to monitoring the financial
and developmental impact of individual
transactions, which will be incorporated into its
pricing policy. From the aspect of organisational
structure, culture and resources, SID Bank will
strive for good process management and
organisation, high job flexibility with highly
qualified staff, process automation, and fast and
effective decision-making, while ensuring a high
level of transparency both inwardly and
outwardly.
SID Bank operates at all levels with
transparency, efficiency and social
responsibility. Great attention is accorded to
employee satisfaction and development, and
the promotion of internal growth. The Bank’s
activities rely on the responsibility,
professionalism, commitment, cooperation and
creativity of its employees. These values are a
key element of the organisational culture, and
constitute fundamental principles and guidance
in employees’ everyday work, and in mutual
contacts with clients and other stakeholders.

Annual report of SID Bank and the SID Bank Group 2018 | 45
Key strategic objectives
SID Bank’s development strategy for the period
of 2019 to 2023 pursues two fundamental
objectives: high multiplier and sustainability
effects in business and society , and the Bank’s
own performance and long-term viability. Over
the upcoming medium-term period SID Bank
will direct its actions into increasing the profile
of its role and the scale of its activities in market
gaps.
Plans for 2019
The macroeconomic situation and existing
financing programmes designed to support
national development policy will play a
significant part in SID Bank’s actions in 2019 in
the form of direct financing. The focus in 2019
will nevertheless be on usage of mechanisms for
including banks in various forms of co-financing
in all transactions where this is possible and
where the banks show suitable interest.
Activities will focus on higher-risk products with
longer maturities, where there are market gaps,
where products will be provided primarily
through instruments of financial engineering,
the Fund of Funds and instruments from the
centralised EU instruments.
Self-sufficiency, the operational balance, and
the proactive management of all risks, which is
reflected in capital stability, robust liquidity and
appropriate cost-effectiveness, will all remain
fundamental parts of SID Bank’s activities in
2019.
In light of the change in its business model, and
the increasing complexity that it faces, SID Bank
will optimise certain business processes in 2019
during the gradual shift towards the
digitalisation of operations. A start is envisaged
to the installation of a new expanded core
information system, for the purpose of
providing proper support for process
automation. Here the Bank’s aim is to facilitate
system connectivity and the digitalisation of its
operations with multiple stakeholders
(commercial banks, other financial
intermediaries, ministries), making it easier for
the justification and purpose of financing to be
reviewed and for clients of direct and indirect
financing and insurance to undertake reporting
and to view information. Other aims in
introducing the new IT system are optimising
internal processes and improving their flexibility
(lending, insurance, asset and liabilities
management, business intelligence, etc.),
making decision-making faster and more
effective, making it quicker to launch new
financing and insurance products, improving the
quality and consistency of information, and
putting in place the conditions for the Bank’s
future business model. The introduction of the
new IT system will be carried out as a strategic
project, beginning in 2019.
.

46 | Annual report of SID Bank and the SID Bank Group 2018
Risk management
General
The main risks to which the SID Bank Group is
exposed are credit risk, interest rate risk,
liquidity risk, profitability risk, currency risk,
operational risk, strategic risk, capital risk and
reputation risk. The risk management process
additionally takes account of the specific
attributes of the implementation of promotional
and development tasks and services of
importance to Slovenia’s development, and the
segmentation of operations into those involving
the Bank’s own resources and those on behalf
of and for the account of the Republic of
Slovenia, including the management of the
contingency reserves.
The internal governance system at SID Bank is
based on:
− a clear organisational structure with
precisely defined, transparent and consistent
internal relations with regard to
responsibility that facilitates effective
communication and cooperation at all
organisational levels, including the adequate
upward and downward flow of information;
− an effective risk management process that
includes identifying, measuring or assessing,
managing and monitoring risks, and internal
and external reporting of risks;
− adequate internal control mechanisms that
include appropriate administrative and
accounting procedures; and
− suitable policies and practices of
remuneration for categories of employees
who have a major impact on the Bank’s risk
profile.
Organisational aspects of the risk management process
The risk management process is established
inside the entire organisational structure and
processes at SID Bank in a way that allows for
business targets to be met while operations
remain secure and compliant with regulations.
The key objective during the implementation of
risk management measures is to achieve the
proper risk awareness on the part of employees
at all levels of the Bank’s operations, which via
their actions and attitude towards risk and their
proposals for additional internal control
functions is reflected in their decisions with
regard to the take-up and management of risks
at the level of the Bank’s daily activities. This
way the Bank promotes and strengthens the
risk management culture and the level of the
Bank’s standards and values relating to the
awareness of its risks.
Risk identification begins in commercial
organisational units, and continues with
measurement and assessment of risks and
formulation of risk management measures in
organisational units separate from the
commercial units, and proceeds all the way up
to the management board, thereby ensuring the
independence of the risk management function.
The management body (management board
and supervisory board), regardless of the
independence of the risk management function,
is authorised and responsible for balancing the
Bank’s business objectives and business
strategy with the strategy and policies for taking
up and managing risk, and for ensuring
relatively effective internal governance
arrangements according to the nature, scale
and complexity of the risks inherent in the
Bank’s business model. SID Bank’s
management body is regularly informed of and
discusses all types of risk to which the Bank is
exposed. At the same time it pursues and
performs management and supervision through
the introduction and implementation of
comprehensive risk management systems in the
Bank’s operations, including the consideration
of specific development risks, in accordance
with the long-term governance objectives and
the fundamental principles of SID Bank’s
activity. The management board and
supervisory board are responsible for adopting
the risk profile assessment, determining risk
appetite, regularly reviewing and approving the
strategy and policy for taking up and managing
the risks to which the Bank is or could be
exposed in its operations, including risks
inherent in the macroeconomic environment in
which the Bank operates, taking into account
the current credit and business cycle. Once a
year the management body approves the
internal capital adequacy assessment process

Annual report of SID Bank and the SID Bank Group 2018 | 47
(ICAAP) and the internal liquidity adequacy
assessment process (ILAAP).
SID Bank’s management board appropriately
transfers certain risk management powers to
the risk management function, other
organisational units and the Bank’s decision-
making bodies.
The asset-liability and liquidity management
committee thus guides, supervises and
monitors risk management at the Bank
aggregate level. It is responsible for managing
(balancing) liquidity and managing the balance
sheet in order to properly manage interest rate
risk, market risk, operational risk, capital risk
and profitability risk, and also any other risks,
including the treatment of credit risk and
various aspects of concentration of the entire
credit portfolio of SID Bank, taking into account
the Bank’s business strategy and changes to
individual categories of the Bank’s balance
sheet within the ratios that are normal for
comparable development banks. In addition, it
is responsible for liquidity and asset-liability
management in relation to SID Bank’s
operations under Republic of Slovenia
authorisation.
The credit committee is responsible for the
management of credit risk for operations on
behalf of and for the account of SID Bank,
primarily through making decisions on
proposals in individual transactions that affect
exposure to credit risk. The committee monitors
individual exposures and the quality of the
credit portfolio and makes decisions on
proposals to assign non-performing investment
status and the classification of individual
investments and groups of connected clients. It
is also responsible for approving and modifying
documentation during the introduction of new
financing programmes and/or individual
products, and during the modification of
existing programmes and products.
The distressed investment management
committee is responsible for the management
of non-performing exposures that the credit
committee classifies as non-performing
investments, measures for the forbearance of
exposures and for the cancellation and
termination of an investment operation due to
financial difficulties or other breaches of
contractual commitments by the debtor.
The risk management function as a mandatory
function of the Bank’s internal controls is
organised within the risk management
department, which is directly accountable to the
Bank’s management board, and in
organisational terms is segregated from the
commercial units that take up risks and from
other organisational units that participate in the
risk management process. The risk
management department is responsible for
drafting the strategy and policies for taking up
and managing the risks to which SID Bank is
exposed in its operations. It is also responsible
for drafting the relevant methodology and
conducting the risk profile assessment,
calculating the internal capital requirement and
internal capital adequacy, drafting the plan of
activities for the management of individual
risks, assessing outsourcing risk and introducing
new products, and, in conjunction with the
treasury department, implementing the internal
liquidity adequacy assessment process. The risk
management department is also responsible for
drafting internal and external reports for the
purpose of supervising, monitoring and briefing
on all types of risk at the Bank’s aggregate level,
while not being directly involved in the credit
process or in the assessment of individual loan
transactions. The director of the risk
management department reports directly and
independently to the Bank’s management board
and the supervisory board’s risk committee on
all material risks and circumstances that affect
or could affect the Bank’s risk profile. The
director is also the head of the risk management
function in accordance with the Banking Act,
and in the event of specific risk developments
has direct access to the supervisory board to
enable him/her to express potential doubts or
submit warnings.
SID Bank has also put in place two other
mandatory internal control functions. The
internal audit department regularly,
independently and comprehensively audits the
functioning of internal controls and the
implementation of the adopted risk
management measures, and provides
recommendations to improve the system of
internal controls and risk management
procedures. The compliance department, which
includes the information security function,
identifies, assesses and monitors compliance
risks to which SID Bank is exposed in its

48 | Annual report of SID Bank and the SID Bank Group 2018
operations, and reports its findings to the Bank’s
management board and supervisory board.
A major role in the risk management process is
also played by the executive director for the
assessment and monitoring of credit risk and IT,
who is included in the credit process within the
scope of assessing and monitoring credit risk at
the individual exposure level and within the
process of managing non-performing
investments, and who guides, coordinates and
supervises the work of organisational units and
directors, who are directly accountable to
him/her and fall within the context of internal
controls in the risk management process.
SID Bank’s credit analysis department is
responsible for the measurement and
assessment of credit risks of individual
customers and groups of connected clients, the
assessment of investment projects and
assessment of their economic justification, the
assessment of acceptability and definition of the
terms under which new investments are
funded, the definition of financial commitments
and cooperation in the oversight and
implementation of monitoring in accordance
with the internal instructions within the context
of the credit process.
The monitoring of financing operations
department carries out control activities in the
credit process, the documentary and data
monitoring of financing operations and the
review of collateral, verification of terms for
drawdown and the monitoring of debtors. It is
also responsible for compiling watch lists for the
early detection of exposures with increased
credit risk (the EWS), the monitoring of credit
protection and in-depth monitoring of debtors.
The key to the management of non-performing
exposures and forborne exposures is the
distressed investment management
department, which is responsible for managing
problem exposures that the credit committee
has classified as non-performing investments,
and for proposing solutions to prevent and
minimise potential losses.
The back-office and payments department
carries out daily monitoring of currency risk,
liquidity risk and credit risk in treasury
operations in accordance with internally set
limits, in addition to making payments for SID
Bank needs and carrying out operations under
the authorisation of the Republic of Slovenia. It
also participates in groups for the monitoring of
loans under guarantee schemes and keeps
analytical records of financing, borrowing and
treasury operations.
Essential features of risk take-up and management
SID Bank takes up risk within the scope of the
adopted overall risk appetite that the Bank is
still willing to take up in order to realise its
business objectives, strategies, policies and
plans, having regard for the Bank’s risk
absorption capacity, its strategies and policies
for the take-up and management of risks, and
its capital, liquidity and remuneration policies.
In keeping with the mandates of a development
bank, the risk appetite is higher than at other
commercial banks, as SID Bank operates in the
realm of market gaps. The risk appetite is
approved on an annual basis by the
management board and supervisory board
when adopting the business strategy, business
policy and risk management policy within the
framework of the annual operational plan.
Regular monitoring of risk appetite indicators is
provided for on SID Bank’s management body.
In the area of risk management, SID Bank has
put in place a strategy and seven policies for
risk take-up and management that define the
procedures for identifying, measuring or
assessing, managing and monitoring all types of
risks to which the bank is or could be exposed
in its operations. These documents take into
account the applicable legislation and
regulations governing risk management and
SID Bank’s special features proceeding from its
status as an authorised institution under the
ZSIRB. The risk management strategy and the
risk take-up and management policies are
updated at least once a year, having regard for
the adequate compliance of the Bank’s business
objectives and business strategy with the risk
take-up and management strategy and policies.
The management boards of other companies in
the SID Bank Group are primarily responsible
for the management of risks that are taken up
by the other companies in the SID Bank Group
that carry out complementary non-banking
services, within the scope of the defined risk
management strategy and policies. In that

Annual report of SID Bank and the SID Bank Group 2018 | 49
respect each must pursue the strategic
objectives, achieve the planned operating
results and also manage risks in accordance
with the applicable legislation and the guidance
of the SID Bank Group. The supervisory bodies
of these companies approve the risk
management objectives and policies, and
monitor their implementation and assess their
adequacy within the scope of their powers.
The Bank assesses the risk profile on an annual
basis, in a broad assessment of risk areas,
business processes and the control
environment. The risk profile is a tool for the
comprehensive risk management process, in
terms of the Bank’s governance, the
management of financial risks and organisation
of business processes. To ensure a
comprehensive and comparable overview of
risks and the control environment by individual
business process, the risk profile is the
fundamental basis for the planning of internal
auditing and compliance procedures, and serves
as the basis of the internal capital adequacy
assessment process. The risk profile
assessment also represents one of the key
strategic metrics of success in implementing
SID Bank’s strategy.
The Bank also conducts stress tests on the basis
of its own scenarios and scenarios submitted by
the supervisor. On the basis of the results of
these tests the Bank is able to identify in
advance those areas where it is most
vulnerable, and to mitigate the risks and
improve its performance by means of
appropriate measures.
SID Bank uses a standardised approach for
calculating minimum capital requirements for
credit risk and a basic indicator approach for
operational risk. The Bank is exposed to market
risks to a limited extent, since it does not pursue
trading activities. Within the scope of market
risks, the Bank takes up, monitors and manages
currency risk to a limited extent, and calculates
a capital requirement for currency risk in
accordance with the provisions of Articles 351
to 354 of the CRR.
Risk exposure in 2018
SID Bank retained its strong capital position and
sound liquidity position in 2018. The Bank
disclosed a high total capital ratio of 34.2% as
at 31 December 2018. It also recorded a
leverage ratio of 16.3%, significantly better
than the prescribed regulatory figure, which
allows the Bank to operate stably in the future.
The good liquidity position is reflected in high
liquidity ratios and a high liquidity coverage
ratio (LCR), well above the regulatory limits.
The latter stood at 458% at the end of 2018.
The quality of the credit portfolio improved in
2018, primarily as a result of a decline in the
NPE ratio. The ratio of non-performing loans
and other non-performing financial assets to
classified claims and other financial assets
amounted to 5.6% at the end of 2018. The
coverage of NPEs remains relatively high (at
66.5% at the end of 2018), and above the
average of the Slovenian banking system, which
could also allow further reduction in NPEs
without a major impact on the costs of risk in
upcoming periods.
SID Bank has devoted particular attention to the
risks inherent in loan funds or products based
on financial engineering from national funds
where the government covers the first loss in
the agreed proportion. Increased credit risk
within the framework of individual financing
programmes is reflected via the financing of
clients with poorer current credit ratings, the
financing of high-risk segments, which is in line
with role and policies of a development bank,
longer moratorium periods, and poorer LTVs.
When managing risks derived from loan fund
transactions, SID Bank takes into account the
methods and procedures for the measurement
and assessment, management and monitoring
of transactions used in its other operations. In
addition, for the loans from the loan fund the
Bank has established internal methods and
procedures for the implementation of model
audits of the purpose-specific use of funds and
for the supervision and reporting of the quality
of the credit portfolio of the loan fund.

50 | Annual report of SID Bank and the SID Bank Group 2018
As of 1 January 2018 SID Bank has carried out
the required methodological adjustments in the
creation of impairments and provisions in
accordance with IFRS 9, including the provision
of adequate IT support. The Bank upgraded its
internal and external reporting in this area in
2018. Detailed clarifications are given in the
financial report.
In the area of risk management, SID Bank has
continued implementing activities focused on
the further strengthening of the system
established for the management of all types of
risks. The key activities in the area of risk
management in 2018 were as follows:
− an overhaul of internal rules for the
management of problem exposures and
collateral in accordance with regulatory
requirements, taking account of
organisational changes;
− an update of the model for assessing the
credit risk of borrowers and determining
credit assessments;
− an upgrade of internal and external
reporting;
− intensive monitoring of non-performing
exposures in accordance with the regulator’s
guidelines and the Bank’s strategy in this
area;
− the introduction of new architecture for
business processes, the drafting of the
methodology for modelling and documenting
business processes, and on this basis the
implementation of activities regarding the
inventory of business processes;
− an assessment of the risk profile on the basis
of the revised business process structure,
followed by changes in individual elements
for the assessment of the risk profile;
− the identification of the growing importance
of strategic risk and the consequent
preparation of new risk management policy
in this area;
− the implementation of activities in
connection with the upgrade of the
monitoring of loss events and operational
risk management.
Risk management in the coming financial year
In 2019 SID Bank will take up risk in accordance
with the limits set for individual types of risk
within the framework of the adopted risk
appetite. The Bank is also planning to take up
risk within the framework of an equity financing
programme, namely the Slovene Equity Growth
Investment Programme product, and new
financing programmes within the framework of
products on the basis of financial engineering
from national funds. The Bank will also continue
its activities for managing the Fund of Funds
from EU cohesion policy via financial
intermediaries, and its activities the form of
direct financing of end users. The high risk
absorption capacity (the Bank’s sound capital
and liquidity position) is facilitating the take-up
of new risks.
In the area of risk management, SID Bank will
devote particular attention in the coming year
to:
− further overhauling internal risk reporting;
− optimising the process for the introduction of
new products;
− managing specific risks in the Bank’s new
products; and
− upgrading risk management in accordance
with new regulatory requirements.
As part of the upgrade of existing risk
management techniques, upgrades to portfolio
risk management, liquidity risk management
scenarios, measurement of interest rate risk in
the banking book and automation of data
capture within the scope of upgrading the
asset-liability management system are planned.
In credit risk take-up and management, the
plans include an upgrade of the IT platform to
improve the collection and flows of information
that is important in decision-making, in
particular with regard to customers with
potentially higher repayment risk. In the
assessment of borrowers’ credit risk and the
determination of credit ratings, in 2019 SID
Bank will begin using a statistical model that will
replace the point-scoring model in part of the
analysis of financial statements. The model has
been upgraded with a quantitative
determination of the impact of soft factors on
the credit rating, and takes account of limiting
factors and other risk factors, which provides
methodologically for the more unambiguous
determination of credit ratings. The Bank will
continue to actively manage NPEs in line with
the adopted strategy for managing problem
exposures, and will implement the new EBA
guidelines on the management of non-

Annual report of SID Bank and the SID Bank Group 2018 | 51
performing and forborne exposures. The Bank
will maintain the diligent implementation of the
lending process and an adequate risk
management culture.
With regard to the management of systemic IT
risks, the Bank will further upgrade its
established measures such as the business
continuity plan put in place, the duplication of
server infrastructure, penetration detection and
prevention systems, surveillance systems, and
audit trails in systems and applications.
In line with market developments, SID Bank
expects the low interest rate environment in the
euro area to continue to have a significant
impact on profitability risk and on liquidity
reserve management in particular. In the
coming years the Bank intends to increase
income primarily by developing and placing new
products and upgrading the asset-liability
management system, and also by streamlining
costs by optimising processes and procedures.
This will require urgent investment in IT.
The market situation will continue to impact the
management of liquid assets, where the Bank
will pursue a policy of investing its surplus
liquidity in high-quality liquid financial
instruments. It will also focus its attention on
the structure and concentration of liquidity
reserves, having regard for potential adverse
developments on the financial markets. The
Bank regularly monitors developments on the
financial markets, and in the event of adverse
developments adjusts its strategy for investing
in liquid assets as necessary.
Risk management of operations under Republic of Slovenia authorisation
SID Bank also provides credit and investment
insurance against non-marketable risks of a
commercial and non-commercial nature on
behalf of and for the account of the Republic of
Slovenia. Income generated from these
operations is recorded to the account of
contingency reserves, out of which claims are
paid out to policyholders.
To prevent conflicts of interest and to maximise
efficiency, credit and investment insurance
operations are executed in a special department
that is organisationally segregated from
banking operations all the way to the level of
the executive director and management board,
while a special committee for operations under
Republic of Slovenia authorisation decides on
and discusses these types of operations. The
committee decides on exposure limits for
individual clients, and on the payment of
insurance and reinsurance claims, discusses
requests to call government guarantees, and
regularly monitors and oversees the execution
of all operations under Republic of Slovenia
authorisation. The committee also has a
significant role in adopting business plans and
strategic programme documents in connection
with the establishment of financial instruments
funded via the European structural and
investment funds.
The powers to conclude operations are set out
in bylaws similarly to banking operations,
whereby all transactions of EUR 5 million or
more are decided on by the international trade
promotion commission. The commission has the
power to make decisions in other areas related
to risk management, such as approvals for the
policy of insurance operations in individual
countries or groups of countries, which together
with the limits on insurance already set out in
the ZZFMGP act to limit potential claims.
In addition, SID Bank uses a risk management
model (value-at-risk technique or VaR) to
calculate potential claims on the basis of data
on insurance concluded on behalf of and for the
account of the Republic of Slovenia, to assess
whether the assets of the contingency reserves
are adequate to cover these claims, and to
estimate the maximum potential claim and the
impact of new insurance operations on potential
claims. The methodology used to calculate the
assessment of potential losses from the
insurance portfolio is based on coefficients
indicating the probability of a loss event, both
for countries (sovereigns) and individual
debtors. The calculation of the probability of
default for a specific country or customer is
based on recognised international credit
assessments, and the corresponding adjusted
probabilities of default.
For more on risk management, see Section 3 of
the financial report.

52 | Annual report of SID Bank and the SID Bank Group 2018
Declaration of the management body on the adequacy of the risk
management framework
In accordance with Article 435(1)(e) of Regulation (EU) No 575/2013 of the European Parliament and
of the Council on prudential requirements for credit institutions and investment firms (CRR), the
management body, represented by
on behalf of the management board: Sibil Svilan (president) and Goran Katušin
and on behalf of the supervisory board: Monika Pintar Mesarič (chair)
hereby confirms the adequacy of the risk management framework at SID Bank and in the SID Bank
Group, which ensures that the established risk management systems comply with the Bank’s risk profile
and business strategy.
Within the Bank’s organisational structure, the risk management function is segregated in organisational
terms from the commercial units that take up risks, i.e. within the credit process up to the level of the
executive director who covers the organisational unit responsible for the assessment of credit risks of
individual business entities and groups of connected clients, while the risk management function at the
aggregate level of the Bank is directly accountable to the management board. This ensures the
appropriate implementation of the risk management framework at the level of the Bank’s daily activities
and the regular notification of the management board. Regular independent briefing of the supervisory
board’s risk committee and the supervisory board on the risks to which the Bank is exposed has also
been put in place.
The risk management function is provided with direct access to the chair of the supervisory board and
the chair of the risk committee for the notification of important circumstances that affect or could affect
the Bank’s risk profile. The regulatory framework of the risk management process, including the internal
capital and liquidity adequacy assessment processes, ensures the Bank that the systems put in place
for the management of identified risks comply with the Bank’s profile and business strategy.
Notwithstanding the above, the Bank’s management body (the management board and the supervisory
board) is fully authorised and responsible for defining and adopting the risk management framework
and for regularly reviewing its adequacy, including the provision of updates, depending on the effects
of the Bank’s internal and external environmental factors, and for overseeing the implementation of the
adopted risk management strategies and policies.
Ljubljana, 5 March 2019
Management board of SID Bank Supervisory board
Goran Katušin Svilan Sibil, M.Sc. Monika Pintar Mesarič
Member President Chair

Annual report of SID Bank and the SID Bank Group 2018 | 53
Performance in 2018
Macroeconomic environment in 2018
International environment
The escalation of certain unfavourable factors
at the global level led to a slowdown in global
economic growth in the second half of the year,
taking growth in 2018 to 3.7%. The major
challenges facing the global economy include
changes in trade policy in the wake of trade
disputes and protectionist measures,
geopolitical instabilities along with intensifying
national oriented policies towards national
interests and the erosion of respect of global
norms, and uncertainties in connection with
Brexit.
Rising employment, high consumer and
business confidence, and the effects of
expansionary fiscal policy in the USA saw
advanced economies record economic growth
of 2.3% in 2018. Growth slowed towards the
end of the year, following the peak in the
economic cycle of recent years, the gradual
withdrawal of expansionary monetary and fiscal
policy, and uncertainties in connection with
global trade. With inflation running at more than
2%, the USA continued to tighten monetary
policy in line with expectations, while the ECB is
envisaging no change in interest rates until
autumn 2019 at least. The situation in the
international environment is being reflected in
less favourable economic growth forecasts for
Slovenia’s main export markets.
Economic growth in developing countries was
still high in 2018 at 4.6%, despite less
expansionary monetary policies in the wake of
support for domestic currencies, a stronger
dollar, trade tensions, capital flight and volatile
oil prices. Large differences have arisen in
economic growth rates in developing countries.
More restrictive credit standards and higher
bank funding costs had a significant limiting
impact on the availability of financial resources.
Rising leverage in numerous countries has led
to increased vulnerability along with a rise in
interest rates or an adverse economic situation.
Economic growth in China began to slow in
2018 with the tightening of financial
regulations, overleveraging in the public and
private sectors, a trade dispute with the USA
and an expected cyclical slowdown.
Economic growth in the euro area stood at
1.8% in 2018, having slowed in the second half
of the year, primarily as a result of weaker
growth in foreign and domestic demand and
sector-specific factors (car industry). Growth
was supported by monetary policy stimulus,
improvements in household wealth,
strengthened consumption in the context of the
buoyant labour market, and higher inflation
expectations. The European economy could
face a number of interrelated risks given the
uncertain impact of the economic policies of
individual countries, the UK’s anticipated exit
from the EU, and trade tensions.
Growth in investment varies greatly between
euro area countries. Investment is being
supported by favourable growth in corporate
loans, which were encouraged by looser credit
standards and low interest rates, despite higher
yields on corporate bonds. The Juncker Plan has
also been a factor in the growth in investment.
The need for corporate deleveraging has
diminished. The continuing growth in
investment, albeit slower, was conditioned by
high capacity utilisation, favourable corporate
earnings, satisfactory confidence indicators in
the first half of the year, and the need for
additional modernisation of production
infrastructure. Labour productivity remains
modest in the wake of further growth in
employment and lower growth in GDP. Growth
in consumption, as the main engine of future
growth, derives from increased disposable
income as a result of wage growth. Growth in
consumption is also acting to encourage the
ongoing favourable situation in the housing
market, and with it construction activity.

54 | Annual report of SID Bank and the SID Bank Group 2018
Inflation in the euro area stood at 1.5% last
year, with a decline late in the year, primarily as
a result of a fall in oil prices. The anticipated
decline in foreign demand will reduce upward
pressure on inflation, assuming no change in
commodity prices. The ECB intends to leave
monetary policy unchanged until the autumn, or
until inflation reaches close to 2%.
The structural deficit in the euro area declined
to 0.7% of GDP in 2018, while gross
government debt in the euro area increased
only slightly to end the year at 87% of GDP,
despite the prevailingly low interest rates and
the consequent decline in interest expenditure.
The differences between yields on government
bonds in the euro area widened again, given the
issues in individual countries.
Slovenian economy
As the Slovenian economy passed into a mature
phase of the economic cycle, forecasts for the
main economic indicators were revised slightly
downwards. GDP growth was still high in 2018
at 4.5%. Growth was broadly based: growth in
household consumption stood at 2.2%, growth
in investment at 10.6% and growth in exports
at 7.2%. Given the uncertainties in international
markets, the dependence on foreign demand is
the main challenge facing the Slovenian
economy, alongside imbalances in the real
estate market and rising cost pressures in the
context of the positive output gap.
The situation on the labour market was
favourable in 2018: the surveyed
unemployment rate stood at just over 5%.
Employment reached record levels in 2018: it
stood at 1.03 million according to the national
accounts methodology. A labour shortage in
certain sectors was compensated for by the
hiring of foreign workers who are less qualified
on average, which alongside the curbs on
inflation acted to slow real growth in the
average gross wage. Inflation averaged 1.9% in
2018, only slightly above the euro area average,
but up 0.3 percentage points on 2017. Wage
growth is therefore not significantly outpacing
productivity growth, and has thus not yet been
reflected in a significant deterioration in
external cost competitiveness. Sustainable
economic development requires a rise in
potential output via sustained long-term (non-
cyclical) growth in productivity through
investment in technological progress in the form
of investment in research and development, in
training and education, and in other productive
areas.
High employment saw annual household
disposable income increase by almost 6% in
nominal terms, which allowed for a saving rate
of 15%. This is high, despite the adverse
situation for saving and favourable
consumption, that was also supported by high
growth in consumer loans. Volume is declining
on the real estate market as prices continually
rise, thereby reducing housing affordability.
Growth in real estate prices remained high in
2018, as supply and demand remained
mismatched. Year-on-year growth in housing
loans has remained at almost 5%.
The strong contribution made to economic
growth by investment in 2018 was attributable
to domestic and foreign demand, growth in
corporate earnings, high capacity utilisation and
favourable financing conditions. The structure
of investment deteriorated from the perspective
of the output potential of the economy as
growth in investment in buildings increased and
growth in investment in machinery and
equipment slowed. Despite the high prices on
the real estate market, growth in investment in
residential buildings was significantly lower than
growth in investment in other buildings, where
public investment related to the disbursement
of EU funds is a notable factor.
Exports increased by 7.2% in 2018, as price and
cost competitiveness were maintained. The
trade surplus has reached just over 7% of GDP,
which is enabling a reduction in the net debt to
the rest of the world via current domestic
saving.

Annual report of SID Bank and the SID Bank Group 2018 | 55
High economic growth brought an improvement
in the public finances in 2018 and an upgrade
in the outlook at one of the rating agencies from
stable to positive. There was a budget surplus
of 0.7% of GDP, while the public debt declined
to 70.1% of GDP in the wake of high revenues
and a significant decline in interest expenditure
as a result of active debt management. The
government debt servicing burden fell to 9% of
annual general government revenues, or to 2%
of GDP. The required yield on 10-year
government bonds fluctuated around 1%.
Banking environment
The two important challenges facing the
Slovenian banking system remain income risk
and the maturity mismatch between assets and
liabilities. Growth in interest income remains
slow. The banks’ liquidity position remains very
favourable. The quality of the credit portfolio is
continuing to improve, as a result of corporate
deleveraging and upgraded credit ratings, and
also as a result of the still-favourable economic
growth. The capital adequacy of the Slovenian
banking system remains solid, albeit with
sizeable variations from bank to bank, and
remains level with the euro area average.
Strengthened lending activity is bringing an
increase in the banks’ capital requirements, but
is also generating internal capital via
profitability. Bank profitability improved slightly
in 2018 with positive growth in interest, and
particularly in non-interest income, while
operating costs were unchanged and there was
a further net release of impairments. The
gradual improvement in profit is also
attributable to funding costs, which remain very
low, given the large proportion of sight deposits
and the low interest rates. For the first time
since the crisis, quantity effects (the stock of
assets and liabilities) prevailed over price effects
in the movement in net interest income in 2018.
There has been a consolidation process in the
banking system in recent years aimed at
achieving synergies and greater resilience in
business models. The government sold a 65%
stake in NLB in 2018, and the most notable new
owners are Brandes Investment Partners, an
American fund manager, and the EBRD.
Slovenski državni holding intends to continue
the privatisation process, in light of the
commitments made to the European
Commission, which means that the remaining
stake in NLB (up to 75% minus one share) will
be sold by the end of 2019. Abanka, the third
largest Slovenian bank, which is under 100%
government ownership, must also be privatised
in 2019. The sale process was begun in 2018.
Nova KBM was sold to Apollo, an American fund,
and the EBRD in June 2015.
The continuing decline in the banks’ non-
performing claims, which now account for 4%
of total claims, is having a favourable impact on
performance, as non-performing claims do not
contribute to income generation and are a
burden on the balance sheet. The figure is still
high in international terms, although the decline
was among the largest, and coverage of non-
performing claims by impairments and by
capital is among the highest in the euro area.
The proportions of non-performing claims in
real estate activities, in construction, and in
wholesale and retail trade and accommodation
and food service activities are significantly
above the average for the non-financial
corporations sector. Less than two-thirds of
non-performing claims are classed as forborne,
while a quarter have again fallen more than 90
days past due after forbearance.
Growth in deposits is sufficient to fund the
increase in loans. The LTD ratio has stabilised
at just under 80%, in the wake of a significant
decline in the proportions of funding accounted
for by debt securities and by banks in the rest
of the world. The proportion accounted for by
liabilities to the Eurosystem also remains small.
Funding stability is primarily exposed to the risk
of a rise in deposit interest rates and the
migration of sight deposits to fixed-term
deposits. The increase in corporate deposits in
2018 was significantly smaller than in previous
years, but they nevertheless remain the second
most important source of bank funding,
accounting for almost 17% of total liabilities.
Interest rates on corporate deposits remain
very low, and are actually below the euro area
average.
The proportion of fixed-rate loans is increasing
for all types of loan. The banks must therefore

56 | Annual report of SID Bank and the SID Bank Group 2018
address their interest rate risk management.
Over 15% of the stock of corporate loans
consists of fixed-rate loans. The banks are
redirecting to household lending, and now hold
more than quarter of their total assets in this
segment. Consumer loans are growing in
importance. Corporate loans increased by just
over 2.2% in year-on-year terms, and now
account for 22% of total assets.
Non-financial corporations’ total financial
liabilities have begun increasing again in the last
two years. Equity financing is increasing as debt
financing declines, which in the context of
favourable valuation effects is further reducing
non-financial corporations’ leverage. The
saving-investment gap in the non-financial
corporations sector remains positive, although
it is narrowing, and for the moment is still
allowing non-financial corporations to finance
themselves to a certain extent. Changes in
ownership structure mean that financing via
trade credits is gaining in importance, as in
certain cases new owners are partly taking over
financing within groups, which has also acted to
reduce the importance of short-term bank
financing in recent years. Interest rates on
corporate loans remain favourable at Slovenian
banks, although those on long-term loans to
SMEs are higher than those applying to large
enterprises. Interest rates are also higher in the
sectors of construction and trade, which are
notable for their high proportions of non-
performing claims and high sectoral risk.
According to Bank of Slovenia survey, the banks
recorded an 8% year-on-year increase in 2018
in demand for loans for current operations, for
investment purposes and, above all, for
refinancing existing loans under more
favourable terms related to lower interest rates
and longer repayment terms. The rate of excess
demand remains highest for loans for
investment purposes. The banks are
maintaining relatively high credit standards,
while firms are frequently citing non-acceptance
of terms among the reasons for a failure to sign
a loan agreement.
Impact of the external environment on the performance of SID Bank and the SID Bank Group
SID Bank’s operations in 2018 were marked by
the still-favourable trends in the domestic
macroeconomic environment, and by a very
slow increase in corporate lending by banks,
and rising uncertainty in the international
economic situation. Economic growth was
based on high growth in exports and
investment, which need to be supported by
appropriate financing to ensure their
sustainability. SID Bank therefore carries out
supplementary measures according to the
activities of financial intermediaries, ensuring its
presence in the area of market gaps, and
thereby preventing its activities from crowding
commercial banks out of the functioning
segments of the market. In these circumstances
SID Bank is focusing on financial support for
sustainable economic development: support for
research, development and business
innovation, support for long-term business
investment projects, support for infrastructure
and environmental protection projects, financial
instruments for strengthening the capital
position of non-financial corporations and
support for SMEs. Great emphasis is also given
to the preparation and promotion of financing
programmes from the Fund of Funds, where
SID Bank strives to use EU cohesion policy
funds in efficient and timely fashion. Given the
rising uncertainty and the slowing economic
growth in the international environment, in the
second half of the year the Bank also drew up
certain initiatives to ensure readiness for more
expansionary lending to the real sector in the
event of a deterioration in the economic
situation in Slovenia.
Given the prevailing high liquidity in the banking
system, the low deposit interest rates and high
level of saving, including in the corporate
sector, the mediation of development funds into
the real economy has been hampered to a great
extent. Under these conditions most banks have
a very low demand for external funding, and
therefore a low appetite for SID Bank’s purpose-
specific funding. One of the financial
advantages of SID Bank’s funding is thus the
long maturity of funds that are provided for
promoting purpose-specific financing. Given the
level of investment activity in the country,
corporate demand for such financing at banks
is very limited. In recent years SID Bank has

Annual report of SID Bank and the SID Bank Group 2018 | 57
further expanded its range of services in this
segment of financing and developed various
new development programmes. However, these
programmes cannot compensate for the decline
in loans from the period of the Bank’s crisis-
related activity. The Bank is endeavouring to
take over part of the administrative tasks in
connection with purpose-specific funds, and to
adjust the credit lines to the new pricing terms.
The stock of purpose-specific funds for
mediating to the real economy via commercial
banks thereby began rising again in 2018.
Performance of SID Bank
Funding and liquidity
In 2018 SID Bank continued to maintain an
appropriate level, quality and structure of liquid
assets for covering its expected and unexpected
liquidity outflows and for business continuity in
all circumstances.
The Bank’s liquidity reserves amounted to EUR
836,519 thousand at the end of 2018 (2017:
EUR 1,139,911 thousand). The main reason for
the decline in liquidity reserves was the
repayment of a maturing 3-year bond in the
nominal amount of EUR 289,835 thousand in
August 2018.
Investments in debt securities (EUR 650,871
thousand) accounted for the largest proportion
of liquid assets at the end of 2018, followed by
balances at the central bank and sight deposits
at banks (EUR 121,184 thousand) and short-
term interbank deposits (EUR 64,464
thousand).
The Bank manages investments in securities for
the purposes of liquidity provision, asset-liability
management, and stabilisation of the interest
margin. In investing liquid assets in securities
the Bank follows a conservative and prudent
strategy, as the majority of the portfolio
consists of marketable, liquid debt securities
eligible as collateral at the central bank,
ensuring adequate diversification with regard to
the type and location of the issuer and the credit
rating.
The structure of the securities portfolio shifted
in 2018 towards securities with lower credit risk,
most notably sovereign issuers, while the
average maturity of the portfolio lengthened
from 3 years to 3.4 years.
The main challenge in the management of liquid
assets is the investment of assets in a
demanding market situation, namely the low
interest rate environment.
Investments in securities Deposits with banks
Balances with the central bankand demand deposits with
banks
63%
31%
6%
78%
8%
14%
Structure of liquid assets
31 Dec 2017 31 Dec 2018
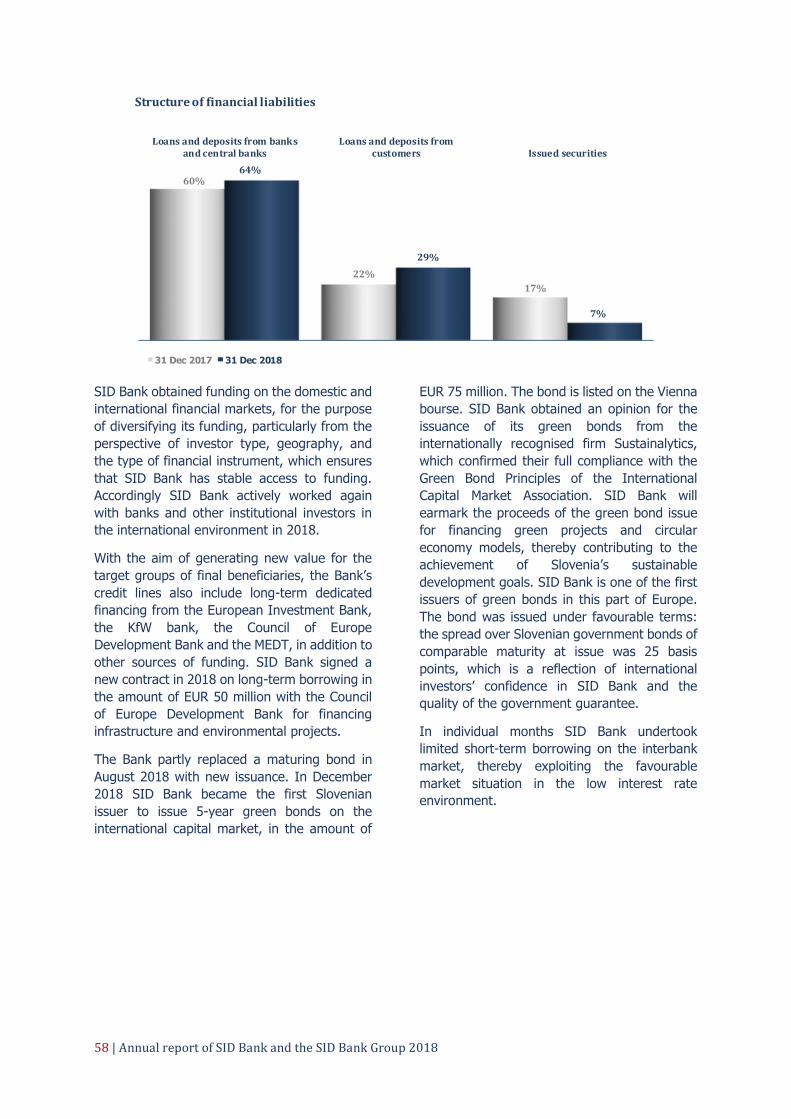
58 | Annual report of SID Bank and the SID Bank Group 2018
SID Bank obtained funding on the domestic and
international financial markets, for the purpose
of diversifying its funding, particularly from the
perspective of investor type, geography, and
the type of financial instrument, which ensures
that SID Bank has stable access to funding.
Accordingly SID Bank actively worked again
with banks and other institutional investors in
the international environment in 2018.
With the aim of generating new value for the
target groups of final beneficiaries, the Bank’s
credit lines also include long-term dedicated
financing from the European Investment Bank,
the KfW bank, the Council of Europe
Development Bank and the MEDT, in addition to
other sources of funding. SID Bank signed a
new contract in 2018 on long-term borrowing in
the amount of EUR 50 million with the Council
of Europe Development Bank for financing
infrastructure and environmental projects.
The Bank partly replaced a maturing bond in
August 2018 with new issuance. In December
2018 SID Bank became the first Slovenian
issuer to issue 5-year green bonds on the
international capital market, in the amount of
EUR 75 million. The bond is listed on the Vienna
bourse. SID Bank obtained an opinion for the
issuance of its green bonds from the
internationally recognised firm Sustainalytics,
which confirmed their full compliance with the
Green Bond Principles of the International
Capital Market Association. SID Bank will
earmark the proceeds of the green bond issue
for financing green projects and circular
economy models, thereby contributing to the
achievement of Slovenia’s sustainable
development goals. SID Bank is one of the first
issuers of green bonds in this part of Europe.
The bond was issued under favourable terms:
the spread over Slovenian government bonds of
comparable maturity at issue was 25 basis
points, which is a reflection of international
investors’ confidence in SID Bank and the
quality of the government guarantee.
In individual months SID Bank undertook
limited short-term borrowing on the interbank
market, thereby exploiting the favourable
market situation in the low interest rate
environment.
Loans and deposits from banksand central banks
Loans and deposits fromcustomers Issued securities
60%
22%
17%
64%
29%
7%
Structure of financial liabilities
31 Dec 2017 31 Dec 2018

Annual report of SID Bank and the SID Bank Group 2018 | 59
Financing
Financing of clients is based on established
instruments such as purpose-specific loans to
commercial banks, loans with or without the
status of state aid, purchase of receivables,
accession to debt and other forms of risk take-
up, project financing and export credits. The
scope and method of financing by SID Bank is
complementary by nature given the identified
market gaps, market needs and activity of other
financial institutions.
An important innovation in 2018 was the initial
offering of the first financial instruments from
the Fund of Funds in the amount of EUR 253
million from EU cohesion policy.
SID Bank’s activity in 2018 was focused on
development financing and more complex
schemes. In the mediation of funding via banks
and savings banks, in line with the
aforementioned changes the Bank adjusted its
range of services and strengthened its function
of providing administrative technical assistance
to intermediaries (simplifications, consultancy,
workshops, development of software support).
It strengthened its partnerships with other
stakeholders in the development and
implementation of major export projects and in
the opening of new markets for the Slovenian
economy, promoted the strengthened
capitalisation of SMEs via development loans,
and joined initiatives focusing on the circular
economy, environmental protection and energy
efficiency.
In 2018 SID Bank strengthened its activities in
the financing of strategic investments as one of
the most important objectives of Slovenia and
the EU. To this end it created a project financing
department, which will fill gaps at the national
level from the perspective of investment
assessment and the preparation of their
financial constructions. Technical assistance
was also obtained within the framework of the
Investment Plan for Europe, based on which the
project financing department will strengthen
the local EIAH in 2019 and will facilitate the
preparation and realisation of strategic
investments important to Slovenia’s
development.
The total net stock of loans granted stood at
EUR 1,451,673 thousand at the end of 2018
(2017: EUR 1,275,366 thousand), up 13.8% on
the stock at the end of 2017.
The structure of SID Bank’s credit portfolio in
terms of maturity reflects its focus on activities
under the ZSIRB and the ZZFMGP. Almost all
loans are long-term with a variable interest rate.
The proportion of short-term loans and fixed-
rate loans is negligible.
31 Dec 2017 31 Dec 2018
678 745
598
707
Loan portfolio (EUR million)
Loans to banks Loans to customers
1,275
1,452

60 | Annual report of SID Bank and the SID Bank Group 2018
In 2018 the financing of final beneficiaries was
also carried out primarily on the basis of long-
term purpose-specific financing via banks and
savings banks. Commercial banks and savings
banks in the role of intermediaries thus remain
the most important partners in financing final
beneficiaries, while public funds are also
involved in intermediation. In this way SID Bank
is further strengthening its role as the central
public financial institution for promoting
economic development and financing of the
economy, in collaboration and partnership with
commercial banks, savings banks and public
funds.
Loans to banks and savings banks accounted for
51% of SID Bank’s credit portfolio at the end of
2018 (2017: 53%). The stock amounted to EUR
744,886 thousand, up 10.9% on the end of
2017.
Within the framework of direct lending to
corporates and other customers, SID Bank
mostly carried out financing either within the
framework of the notified state aid schemes or
in the form of the co-financing of corporates
together with other banks. In 2018 direct
financing was carried out in the form of
specialised credit lines for the promotion of
technological and development projects,
research, development and innovations,
investment and employment, and energy
efficiency, to increase capitalisation and
development of SMEs and environment-friendly
public investments at the local level.
Loans to customers amounted to EUR 706,787
thousand at the end of 2018, up 18.2% on the
end of 2017. They accounted for 49% of the
credit portfolio, up 2 percentage points on 2017.
Target groups of final beneficiaries
SID Bank funds were approved for EUR 463.8
million of loans in 2018, made via intermediary
banks to 258 final beneficiaries and directly via
SID Bank to 154 borrowers established in
Slovenia. There were 1,324 final beneficiaries
and 604 direct borrowers established in
Slovenia being financed by SID Bank as at
31 December 2018. The funds were earmarked
primarily for the promotion of research,
development and innovations, job preservation
and job creation, corporate growth (primarily
SMEs), internationalisation of business, better
infrastructure, energy efficiency, reduction of
pollution and increased environmental
protection.
In terms of the primary purpose, development
of economic competitiveness accounted for
63.4% of new loans in terms of total value,
regional development for 28.6%, development
of a society of knowledge and innovative
enterprise for 7.8%, and development of an
environment-friendly society for 0.2%. In terms
of corporate size, a total of 374 SMEs
established in Slovenia (89.5% of all borrowers)
received support in the amount of EUR 169.5
million (36.6% of loans), of which 78 were sole
traders (20.9% of all SMEs), who received EUR
9.2 million.
Distribution of loans by region and economic sector
In the regional breakdown of new loans
approved for borrowers established in Slovenia,
borrowers from Central Slovenia accounted for
the largest proportion (48.9%), followed by
borrowers from Savinjska (10.8%), Podravska
(5.2%), Gorenjska (5%), and other regions
(30.1%).
Firms in the manufacturing sector were
prevalent among borrowers (35.6% of new
loans in value terms), followed by wholesale
and retail trade, repair of motor vehicles and
motorcycles (13.9%), professional, scientific
and technical activities (5.3%), and other
sectors.
Development programmes via commercial banks and savings banks
SID Bank continued to enhance its cooperation
with commercial banks in 2018, which given the
regulatory framework included the adjustment
and optimisation of existing services, the
simplification of implementation, and the
strengthening of administrative technical
support for financial intermediaries.
Credit lines that are mediated via commercial
banks and savings banks are adjusted to the
method of financing and to the specific
conditions of purpose-specific financing. The
terms for final beneficiaries are also formulated
accordingly.

Annual report of SID Bank and the SID Bank Group 2018 | 61
On the basis of existing long-term borrowing at
the development banks KfW and the EIB and
other bank funding, SID Bank continued the
programme for the intermediation of long-term
financing for SMEs and Mid-Caps in the total
amount of EUR 150 million.
In its financing activities, SID Bank also places
great emphasis on non-financial content, such
as:
− activities for maintaining and expanding the
circle of financial intermediaries and
increasing their intermediation role (number
of final beneficiaries, scope of sub-credits);
− marketing activities to strengthen the profile
of SID Bank financing (presence at regional
events, advertisements, online, etc.);
− a suitable combination of pricing terms,
maturity, and purposes of use, and transfer
of the financial advantages to final
beneficiaries;
− administrative and technical support for
banks (preparation of model questions and
answers, assistance in the resolution of
individual cases, monitoring of effects of
specific investments, workshops with banks’
customer relationship managers);
− activities aimed at upgrading software
support in order to simplify monitoring and
reporting.
The adjustment of financial instruments will
significantly impact the preservation and
stimulation of the placement of SID Bank funds
via commercial banks and savings banks,
especially in terms of its role as the operator of
the Fund of Funds, the instruments within the
Fund of Funds and the implementation of
financial engineering instruments.
Products based on financial engineering from national funds
For the implementation of financial measures of
national and European public policies (Fund of
Funds financial instruments), SID Bank provides
a package of financial instruments that are
based on refundable forms of promotion with a
combination of own, budgetary and other
favourable sources of funding.
Through these products SID Bank and the
MEDT secure long-term resources for financing
SMEs and development projects that are based
on in-house research and development
activities by firms to increase their innovative
and competitive capacities. Measures in the
past were prepared as SID Bank’s response to
the economic and financial crisis, and as such
were coordinated with the responsible ministry.
31 dec 2017 31 dec 2018
174257
423
450
Loans to customers (EUR million)
Loans, based on financial engineering funds
Other loans to customers
598
707

62 | Annual report of SID Bank and the SID Bank Group 2018
In 2018, the Bank and the MEDT implemented
seven financial engineering measures in the
form of seven specialised credit lines whose
funds could be obtained by firms directly at SID
Bank. SID Bank expanded its toolkit of financial
engineering measures in 2018, introducing four
new measures:
− a credit line for financing SMEs with a
maturity of 3 to 10 years, a maximum
moratorium period of half of the loan
maturity, and loan amounts of EUR 100
thousand to EUR 5 million; the funds are
earmarked for financing property, plant and
equipment, intangible assets, materials,
services, supplies, merchandise and labour
costs;
− a credit line for financing investment
projects, which is earmarked for financing
investments in property, plant and
equipment and intangible assets in Slovenia;
a maximum loan amount of EUR 10 million
with a maturity of 6 to 20 years, with a
maximum moratorium period of half of the
loan maturity, but no more than five years;
using loans of this type firms can expand and
technologically update their production and
service capacities, thereby strengthening
their competitiveness;
− a credit line for financing investments in the
forestry and wood manufacturing chain,
which is earmarked for financing the
construction of new wood processing plants
or technological modernisation of existing
wood processing plants in line with the best
available technology, financing the
development of new materials from wood,
the processing of all forms of wood residue
and scrap wood, financing the development
of products with high value-added and
increased diversification of production into
new wood products, and financing
significant changes in the whole production
process in wood processing; loan amounts of
EUR 100 thousand to EUR 5 million, loan
maturity of 6 to 12 years, and a maximum
moratorium period of half of the loan
maturity;
− a credit line for financing investment in
sustainable growth in Slovenian tourism,
which is earmarked for financing
investments in property, plant and
equipment and intangible assets in Slovenia
in the areas of accommodation capacity,
sports, entertainment or cultural
infrastructure, cable cars, marinas or tourist
resorts; a maximum loan amount of EUR 20
million, a maturity of 6 to 30 years, but no
more than the useful life of the property,
plant and equipment, with a maximum
moratorium period of half of the loan
maturity, but no more than five years.
In addition to the newly introduced credit lines,
clients were also given access to financing for
various projects via existing credit lines as
follows in 2018:
− a credit line for financing technological
development projects in the form of loans of
EUR 100 thousand to EUR 15 million, with a
maturity of 6 to 12 years and a moratorium
period; SID Bank used this credit line to
finance projects that included research and
development activity to develop innovations
in terms of technology, processes and
organisational changes; funds were
earmarked for financing wages, contractual
research, advisory and other services, and
materials, instruments and equipment used
on the project; the credit line was withdrawn
in the final quarter of 2018;
− a credit line for financing the operations and
capitalisation of SMEs and a credit line for
financing the investments and capitalisation
of SMEs; the credit lines earmarked for
strengthening the capital of SMEs in the total
amount of EUR 200 million are based on the
principle of favourable long-term loans of 6
to 12 years with a moratorium period of half
of the loan maturity; loan amount of EUR
100 thousand to EUR 5 million; in addition to
the typical development effects given the
Bank’s target areas (investments, research,
development, innovations, non-current
working capital), the main purpose of the
product is to enable firms with low capital
adequacy to improve the maturity structure
of their debt, to gradually strengthen their
capital position and to introduce a (new)
business model with good prospects.

Annual report of SID Bank and the SID Bank Group 2018 | 63
The aforementioned credit lines generally
contain elements of state aid that are reflected
in favourable interest rates on loans. The
weighted average maturity of the loans was 9.1
years, while the weighted average premium
over the benchmark interest rate was 2.34
percentage points. Funding from the MEDT
played a key part in reducing financing costs for
final beneficiaries. EUR 3.8 of primary lending
potential was available for each euro of ministry
financing.
A total of EUR 112.9 million in new loans was
placed in 2018 within the scope of financial
engineering funds. The net stock of loans
granted in that respect amounted to EUR 257.1
million at the end of 2018.
Through using refundable forms of financing
and combined funding, SID Bank is providing
more favourable lending terms for the Slovenian
economy (maturity, interest rate, collateral) and
a multiplier and revolving effect on state budget
funds.
Programme for the financing of municipalities
In 2018 SID Bank continued the promotion of
investments in local public infrastructure, local
measures regarding efficient use of energy,
utilities connections and the provision of a
public-owned housing fund. Funds from the
loan could be used to finance at most 85% of
the entire project, while the remaining 15% had
to be provided by the municipality.Municipalities
often acquire most of the funds from non-
refundable government and EU funding, using
SID Bank’s loans to obtain the other required
funds.
SID Bank earmarked EUR 100 million for these
purposes from funding raised at development-
focused international financial institutions.
Municipalities were able to obtain the loans
directly from SID Bank, or in the form of co-
financing with one of the commercial banks.
The loan amount that could be raised by the
municipalities under this programme was
between EUR 34 thousand and EUR 17 million,
with a maturity of 5 to 20 years and a
moratorium period allowed.
Infrastructure financing
In order to improve the logistics, utilities and
other commercial and public infrastructure in
Slovenia, SID Bank financed investments in this
type of infrastructure, in cooperation with
commercial banks or independently, thus
contributing to more balanced and faster
regional development. In addition, the Bank
also used funds from loans from the
development-focused international financial
institutions, thereby securing long-term funds
under favourable terms for the development of
infrastructure projects.
Export financing
In 2018 SID Bank continued its promotion of
international commercial and development
cooperation and international commercial
transactions, in particular for promoting long-
term business transactions that allow
participants to enter and operate in foreign
markets, including support for related import
transactions, the preparation of international
commercial transactions, investments and
support for long-term growth in exports and the
internationalisation of the economy. It also
participated in activities focused on support for
joint ventures in third markets with domestic,
foreign or international entities.
Equity financing programme
SID Bank concluded two investment
transactions in 2018 in accordance with the
Slovene Equity Growth Investment Programme,
which it runs in conjunction with the EIF. An
investment in the amount of EUR 10 million for
the equity financing of Slovenian firms was
approved in the form of a capital contribution to
a private equity fund focusing on investments in
firms in central and eastern Europe and south-
eastern Europe via primary fund investment. An
equity investment in the amount of EUR 5.5
million in a Slovenian energy firm was approved
for projects in Slovenia via co-investment. Half
of the available funds were provided by SID
Bank in both cases.

64 | Annual report of SID Bank and the SID Bank Group 2018
A tender for Slovenian operators of private
equity funds was held in 2018; the execution of
the tender was taken over by the EIF. Four
potential private equity funds responded to the
tender. The EIF chose two in December 2018,
and began its due diligence in January 2019 (a
legal, financial, HR and strategy review). The
signing of memorandums of understanding with
the private equity fund operators is expected in
the first quarter of 2019.
Other financing
By using long-term financing, independently
and in cooperation with other banks, SID Bank
complements the range of services of
commercial banks in all areas for which it can
provide support in accordance with the ZSIRB,
i.e. in particular in the areas of energy
efficiency, environmental protection, provision
of housing for vulnerable population groups,
promotion of internationalisation, competitive-
ness, employment, technological development,
research and innovation. Therefore SID Bank
uses various financing instruments, such as
loans to commercial banks, syndicated loans,
independent direct financing, purchase of
receivables, accession to debt and other forms
of risk participation, project financing, etc.
Information support
Some important innovations at SID Bank in
2018 were the upgrade of the portal for
financial intermediaries’ reporting (also for the
needs of the Fund of Funds), and the
introduction of a new digital platform for
reporting by direct financing clients. This has
simplified clients’ dealings with the Bank, and is
also allowing the Bank to carry out the related
work processes more efficiently from the
perspective of controlling labour costs while
increasing the volume of business. The Bank
also launched a new-look website in 2018 to
improve understandability, transparency and
the level of information for clients.
During the year the Bank implemented all new
regulatory requirements relating to reporting to
the regulator (in particular AnaCredit reporting),
and replaced the application support for ITS
reporting (replacement of an external
application with an application developed in-
house).
The Bank thoroughly overhauled its Bonsis
rating system (application support for assessing
client credit risk) and upgraded its IT support
for liquidity risk and interest rate risk
management. It began upgrading the technical
platforms of application support for loans and
guarantees and for the main ledger, with the
aim of reducing operational risk. In light of
rising cyber threats in the environment, and
aware of the importance of protecting clients’
data, the Bank successfully introduced several
protective systems such as ATP (Advanced
Threat Protection) and SIEM (Security
Information and Event Management).
Operations under Republic of Slovenia authorisation
Insurance against non-marketable risks
As an authorised institution, on behalf of and for
the account of the Republic of Slovenia, SID
Bank insures against those commercial and
non-commercial or political (non-marketable)
risks that, in light of their nature and level of
risk, the private sector in general is not willing
to take up or has limited capacity to take up. EU
regulations class commercial and political risks
with a maturity of more than 2 years in OECD
or EU countries and all risks in countries outside
the OECD and the EU as non-marketable. The
role of SID Bank is crucial in the area of insuring
non-marketable risks, as the majority of export
transactions, particularly medium-term, would
not be undertaken without such insurance.
Exporters and investors can also mitigate their
operational risks in higher-risk countries by
means of appropriate insurance, thereby
creating higher value-added.

Annual report of SID Bank and the SID Bank Group 2018 | 65
Volume of insurance operations
The volume of operations amounted to EUR
807,919 thousand in 2018, up 31.8% on the
previous year. The increase in volume was
evident in short-term and medium-term
operations alike. There was a notable increase
in insurance of medium-term loans, insurance
of export preparation loans and investment
insurance.
The realised volume in 2018 was equivalent to
6.1% of the limit on new annual liabilities set
out in the ZZFMGP. Reinsurance of short-term
export credits (renewable insurance of non-
marketable risks) accounted for the largest
proportion of the realised volume of insurance
operations (56% of the total), followed by
insurance of outward investments (24.7%),
while the remainder was accounted for by
insurance of short-term and medium-term loans
(10.4%), guarantees (2.2%), and export
preparation loans (6.7%).
There was no significant change in the
breakdown of insurance by country. The largest
proportion in 2018 related to insurance
operations in Russia (39.7%), followed by the
USA (13.7%), Belarus (12.6%), Croatia
(10.9%), Ukraine (4.3%), Bosnia and
Herzegovina (3.7%), Serbia (4%), Uzbekistan
(2.1%), Kazakhstan (1.5%) and Georgia (1%).
Having regard for firms’ responses, the largest
opportunities lie in the area of export financing
insurance, although this is relatively demanding
from the perspective of the structuring of the
operations and risk assessment, for which
reason the number of realised projects remains
low, albeit rising. There is also awareness of this
at commercial banks, which have begun
strengthening their export financing
departments. There is a trend of diminishing
rigidity in risk take-up, at banks and firms alike,
and consequently a larger number of higher-
value operations and project financing
operations can be expected.
It remains a challenge to provide insurance
support for SME exporters, which SID Bank will
encourage to engage in joint export ventures in
order to generate the required financial
strength.
The largest insurance and financing operations
are still concluded for Slovenian firms’ projects
in the countries of the former Soviet Union and
the former Yugoslavia. In connection with new
markets for insurance and financing, much
attention is being focused on identifying the
right banks with a local presence in individual
African countries, via which Slovenian firms’
project financing would proceed. Projects of
smaller value would be better suited to this
area, as it is primarily SMEs with growth
potential that are interested in business in this
part of the world. Activities in connection with
the opening of the Iranian market shut down
after the introduction of sanctions against Iran
by the USA, which was mainly related to the
complete withdrawal of Slovenian exporters
from the country. SID Bank is considering the
establishment of new insurance lines with banks
in eastern Europe and north Africa, with which
it would promote Slovenian firms’ export
business. There are also opportunities in the
area of factoring and forfaiting insurance,
Insurance of Short-Term ExportCredits (Receivables) and
Guarantees
Insurance of OutwardInvestments
Insurance of Medium-TermExport Credits (Receivables) and
Guarantees
435
140
39
484
200
125
Volume of insurance operations by type (EUR million)
1-12/2017 1-12/2018

66 | Annual report of SID Bank and the SID Bank Group 2018
including operations of longer maturity for
customers from western countries.
Exposure
Exposure from current insurance policies
amounted to EUR 582,774 thousand at the end
of 2018. Exposure from firm insurance
commitments, which under the ZZFMGP is
included in the total net exposure, amounted to
EUR 17,549 thousand. Total exposure from
insurance operations for the account of the
state and from issued firm insurance
commitments amounted to EUR 600,323
thousand, up 2.3% on the end of 2017. The
increase in exposure was primarily attributable
to the increase in the volume of insurance
operations.
The exposure amount is equivalent to 28.6% of
the limit defined in the State Budget 2018
Implementation Act (ZIPRS) and 1.5% of the
limit defined in the ZZFMGP.
The largest exposures in the insurance portfolio
in 2018 were disclosed against Russia, Belarus,
Croatia, the USA, Ukraine, Bosnia and
Herzegovina, Serbia, Kazakhstan, France and
North Macedonia.
Other insurance-technical provisions
Premiums and fees from insurance against non-
marketable risks amounted to EUR 8,624
thousand in 2018, 2.4 times higher than in
2017. The increase in insurance premium is
attributable to the increase in the volume of
insurance operations, and the structure of
insurance products. Insurance of medium-term
loans accounts for largest proportion of paid
premium, followed by reinsurance and
insurance of short-term export credits and
investment insurance. The premium rates for
short-term insurance are lower than those for
medium-term insurance, and consequently
premiums are also lower. Income from
processing fees is negligible, because SID Bank
includes the amount in the premium in the case
of individual export operations or investments in
accordance with its business policy and current
price lists.
Insurance of Short-Term ExportCredits (Receivables) and
Guarantees
Insurance of OutwardInvestments
Insurance of Medium-TermExport Credits (Receivables) and
Guarantees
321
193
73
309
153138
Exposure by type (EUR million)
1-12/2017 1-12/2018
Premiums 8,624 3,560 242.2
Potential claims 639 2,453 26.1
Claims under consideration 1,531 2,226 68.8
Claims paid (979) (15,302) 6.4
Recourse 207 1,142 18.1
Technical result 7,290 (11,228) -
Surplus of income 8,378 (9,982) -
in EUR thousand
31 Dec 2018
or
1-12/2018
31 Dec 2017
or
1-12/2017
Index
2018/2017

Annual report of SID Bank and the SID Bank Group 2018 | 67
Claims paid amounted to EUR 979 thousand in
2018, down significantly on the previous year
(2017: EUR 15,302 thousand). The largest
proportion consisted of claims paid on a short-
term export preparation loan, while the
remainder relates to claims paid on the
reinsurance of short-term credits. The amount
includes recovery costs for claims paid in
previous years.
Claims under consideration (claims filed)
amounted to EUR 1,531 thousand as at
31 December 2018, down EUR 695 thousand on
the end of 2017.
At EUR 639 thousand, potential claims in 2018
were down by EUR 1,814 thousand on the 2017
figure, while the majority of potential claims
relate to the reinsurance of short-term credits.
The technical result in 2018 was positive, in the
amount of EUR 7,290 thousand, in contrast to
the previous year (2017: loss of EUR 11,228
thousand). The surplus of income over
expenses amounted to EUR 8,378 thousand,
compared with a surplus of expenses over
income in the amount of EUR 9,982 thousand in
2017.
Contingency reserves
The contingency reserves constitute a
significant capacity for SID Bank and for the
Republic of Slovenia in insurance against non-
marketable risks, before claims are paid out
from the state budget.
With a contribution by the Ministry of Finance in
the amount of EUR 13,737 thousand in
December 2018, the contingency reserves
stood at EUR 154,281 thousand at the end of
2018, up 16.7% on the end of 2017.
Insurance against non-marketable risks by type of insurance
Insurance of short-term export
loans/credits and guarantees
Short-term insurance in the reinsurance and
insurance of export credits, guarantees and
export preparation amounted to EUR 483,535
thousand at the end of 2018, up 11.3% on the
previous year.
The majority of short-term insurance relates to
reinsurance of short-term revolving export
credits on the basis of reinsurance contracts
that SID Bank has signed with SID-PKZ and
Zavarovalnica Triglav. Only a small proportion
relates to insurance of individual export
transactions.
The volume of short-term insurance operations
realised in 2018 primarily related to export
transactions in Russia, Ukraine, Serbia,
Uzbekistan, Kazakhstan, and Bosnia and
Herzegovina. Exposure from these operations,
including commitments, stood at EUR 309,419
thousand at the end of 2018, down 3.5% on the
end of 2017 (EUR 320,528 thousand).
The increase in the volume of short-term
insurance operations was not tracked by
realised insurance premium, which amounted to
EUR 1,947 thousand, down 4.7%. This was
attributable to the market in short-term
insurance, which requires primary insurers to
continue agreeing lower prices with their
policyholders. Despite an increase in the
amount of insured receivables, the number of
exporters fell, while insurance operations were
concluded with an increasing number of foreign
debtors, resulting in increased diversification of
risks taken-up from the perspective of insurance
of receivables.
SID Bank assesses that demand for the
reinsurance of short-term export credits will
increase, which can be attributed to a rise in
interest among exporters in placing their goods
on so-called non-traditional or new markets,
such as Russia and the countries of the former
Soviet Union, where higher returns can be
generated. The expectations of higher exposure
also derive from a higher volume associated
with the sharing of risks with the private market
(50:50), which is permitted by the reinsurance
contract between SID Bank and SID-PKZ, which
entered into force on 1 January 2019.
Further growth in Slovenian exports is expected
in 2019, which will have a positive impact on the
volume of reinsurance operations of primary
insurers concluded with SID Bank. Here it
should be noted that most export growth will
nevertheless be realised on the developed
markets of EU and OECD countries, although
the non-marketable markets are also expected
to grow.

68 | Annual report of SID Bank and the SID Bank Group 2018
Insurance of medium-term export credits
The largest proportion of insured medium-term
export credits, bank guarantees and export
preparation loans in 2018 related to exports of
communications and other electrical appliances,
tools and machinery, manufacturing of motor
vehicles, and engineering and technical
consultancy services. The largest share of
medium-term operations was insured for
receivables from customers from Belarus, the
USA, the UAE, Saudi Arabia, Ukraine and
Croatia. The stock of insured medium-term
export credits varies from year to year, due to
the small number of annually realised projects
and their size.
The volume of insurance operations realised for
medium-term export transactions (export
credits, bank guarantees and export
preparation loans) in 2018 was up significantly
on the previous year and stood at EUR 124,506
thousand (2017: EUR 39,020 thousand). The
export financing insurance product is useful to
exporters, but is still complex and time-
consuming from a documentary perspective. In
the past exporters consequently opted for
various modifications to transactions that were
simpler for contractual partners. Irrespective of
the complexities, the market situation, in
particular the expectations of foreign
customers, is increasingly convincing Slovenian
exporters to opt for the product in the way that
it was designed. The assessment is that future
business trends will move in this direction.
The interest of commercial banks in becoming
active in the area of export financing in Slovenia
is slowly increasing, but the banks still remain
cautious, and given their lack of experience
would like to finance export transactions in
conjunction with SID Bank. Positive shifts in this
area are expected in the future.
Exposure from the insurance of medium-term
export credits, bank guarantees and export
preparation loans (concluded insurance policies
and commitments) amounted to EUR 137,890
thousand as at 31 December 2018, Belarus
accounting for 80.9% of the total exposure.
Premiums from this insurance amounted to EUR
5,404 thousand in 2018. Claims paid from the
insurance of medium-term export credits
amounted to EUR 19 thousand in 2018.
In 2019 there is expected to be further growth
in insurance of medium-term operations, which
will be smaller in relative terms than those
realised in 2018. The operations will be in Soviet
successor states and the former Yugoslav
republics, while a breakthrough is also
anticipated in African markets.
Insurance of outward investments
The volume of insured outward investments
reached EUR 199,879 thousand in 2018, up
43.4% on the previous year. Newly insured
outward investments and renewals of
investments insured in previous years that in
terms of content can be deemed newly insured
investments are included among the volume of
insurance.
The majority of operations were realised in the
non-shareholder loan insurance scheme, while
demand for insurance of investments declined
almost in its entirety. This is a result of reduced
risks in the former Yugoslav republics, which are
acceding to EU structures. These countries
represented the largest target market for
investments by Slovenian firms. An even more
significant factor in the decline in this class of
insurance is that Slovenian firms underestimate
the political risks inherent in investing in foreign
markets.
Croatia accounts for the largest proportion of
insured investments, followed by the USA, and
Bosnia and Herzegovina. Premiums from
investment insurance in 2018 were up 24.1%
on the previous year at EUR 1,250 thousand.
Exposure from investment insurance amounted
to EUR 153,013 thousand at the end of 2018,
down 20.8% on the end of the previous year.
Insurance of non-shareholder loans also
accounts for the largest proportion of the
exposure. The current insurance arrangements
are expiring in accordance with the signed loan
agreements and insurance policies. The insured
non-shareholder loans are being adequately
serviced, for which reason exposure also
declined in 2018 without new insurance.

Annual report of SID Bank and the SID Bank Group 2018 | 69
The target for 2019 is for the realisation of
insurance of new investments to exceed the
value of maturing annuities and other existing
insurance arrangements. The expectations lie
primarily in the insurance of non-shareholder
loans for Slovenian firms’ business in the former
Yugoslav republics.
Fund of Funds
In line with the objectives of the Operational
Programme for the Implementation of the EU
Cohesion Policy 2014-2020, under the aegis of
the Fund of Funds, for which an agreement on
funding in the amount of EUR 253 million was
signed with the MEDT in 2017, SID Bank is to
provide financial products that it will offer to
Slovenian firms and municipalities via financial
intermediaries (primarily commercial banks,
savings banks and public funds). The financial
intermediaries for the first financial instruments
that have been developed have already been
chosen, and the range of financial instruments
will be further strengthened in 2019 through the
development and launch of new products and
through the expansion of the circle of financial
intermediaries.
In addition to the funds from European
cohesion policy, the financial intermediaries will
have to secure additional funds from other
sources of funding because of the leverage
requirement. Given the requirement for the
reuse of repaid EU cohesion policy funds, the
financial intermediaries will provide additional
funds in the amount of around EUR 150 million,
which means that a total of more than EUR 400
million will be available to firms and other final
beneficiaries.
By establishing the Fund of Funds, Slovenia took
an important step towards transitioning from
non-refundable to refundable forms of support
modelled on foreign practices. These are
significantly more effective than grants,
primarily on account of higher leverage,
multiplier effects, and the revolving effect on
state budget funds.
SID Bank pushed ahead in 2018 with its
activities under the aegis of the Fund of Funds.
The first financial instruments were developed
for investments related to research,
development and innovation, and for
microloans. The financial intermediaries were
also chosen for these instruments (a bank, a
savings bank and a public fund). In line with the
legal framework, the financial intermediaries
were chosen on the basis of public tenders,
while given the novelty in the Slovenian context,
SID Bank offered the requisite legal and
administrative technical support to the
intermediaries during the development phase
and during implementation itself. The first loans
are now available to final beneficiaries.
In 2018 loans of up to EUR 10 million with a
maturity period of up to 9 years, with longer
moratorium periods of up to 3 years, and with
no collateral terms or less stringent collateral
terms were available to firms of all sizes (start-
ups, sole traders, MSMEs, large enterprises) for
research, development and innovation, via the
chosen financial intermediary (a commercial
bank).
Microloans of up to EUR 25,000 with a maturity
period of up to 5 years, with longer moratorium
periods of up to 2.5 years, and less stringent
collateral terms were available to start-ups, sole
traders, and micro and small enterprises, via a
financial intermediary (a savings bank). Late in
2018 SID Bank signed a financial agreement for
the area of microloans with a public fund, which
has already announced its first call for
applications.
The purpose of the Fund of Funds created in
this manner is the promotion and financing of
sustainable economic growth and development,
investments in innovation, and current
operations, through debt and equity financing.
The financial instruments are designed in four
areas where there are market gaps in financing:
− research, development and innovation,
− competitiveness of SMEs,
− energy efficiency, and
− urban development.

70 | Annual report of SID Bank and the SID Bank Group 2018
The main advantages of the financial
instruments of the Fund of Funds are as follows:
− creation of instruments in areas of identified
market gaps;
− attraction of private equity (required
leverage);
− multiplier effects;
− market appraisal of projects built into the
very process;
− better financial discipline and greater impact
from supported projects;
− sustainable and revolving funds (reuse of
funds);
− more effective allocation of government
development funds;
− reduced possibility of misuse of funds and
distortion of competition effects.
The financial instruments of the Fund of Funds
provide final beneficiaries with a range of
benefits, from the perspective of capital and
reduced interest rates, and also from the
perspective of longer maturities, reduced or
zero collateral requirements, and longer
moratorium periods.
Management of emission allowances and Kyoto units
Pursuant to Article 127 of the Environmental
Protection Act, in 2018 SID Bank continued its
function as the official auctioneer of greenhouse
gas emission allowances in accordance with
Commission Regulation (EU) No 1031/2010 on
the timing, administration and other aspects of
auctioning of greenhouse gas emission
allowances pursuant to Directive 2003/87/EC of
the European Parliament and the Council
establishing a scheme for greenhouse gas
emission allowances trading within the
Community, as amended by Commission
Regulation (EU) 1210/2011.
In auctions organised by the joint auctioning
system of EU members (the European Energy
Exchange), SID Bank sells emission allowances
on behalf of the Republic of Slovenia as set out
by the aforementioned regulation, the relevant
European Commission decisions and the auction
timetable, and transfers the proceeds to the
account of the Republic of Slovenia.
The Bank participated in 139 auctions as an
official auctioneer of emission allowances
(EUAs) in 2018, at which a total of 4,290
thousand allowance units were sold for a
consideration of EUR 66,190 thousand.
Four auctions for EU aviation allowances (EUAA)
were also held in 2018. A total of 6,500
thousand units were sold for a consideration of
EUR 124 thousand.
Other transactions under authorisation
In line with its legal authorisations, in 2018 SID
Bank again actively managed its recovery
portfolio from the guarantee scheme laws
(ZJShemRS, ZJShemFO and ZPFIGD).
The Bank did not address any changes to loan
terms or receive any new requests for
guarantee calls in 2018 for loans approved
under the ZJShemRS. At the end of 2018 there
were seven loan agreements secured by
government guarantee still active at the
commercial banks (2017: 13 loan agreements),
the stock of principal amounting to EUR 11.7
million as at 31 December 2018 (2017: EUR
15.2 million).
The Bank did not any receive new requests for
guarantee calls in 2018 for loans approved
under the ZJShemFO. There were 89 loans in
the stock as at 31 December 2018 (2017: 99),
while the total loan principal amounted to EUR
3.2 million (2017: EUR 3.7 million).
The stock of all loans supported by a
government guarantee under the ZPFIGD
amounted to EUR 1.1 million at the end of 2018
(2017: EUR 10 million). Within this amount the
government guarantee amounted to EUR 0.8
million (2017: EUR 5.4 million).

Annual report of SID Bank and the SID Bank Group 2018 | 71
Transparency of financial relations between SID Bank and the Republic of Slovenia
The table discloses SID Bank’s total (direct and
indirect) income and expenses for its individual
activities pursued in 2018. The income for an
individual activity under Republic of Slovenia
authorisation consists of the fees that SID Bank
receives for pursuing a particular activity on the
basis of contracts with the Republic of Slovenia
or statutory powers. The indirect expenses for
an individual activity are determined on the
basis of criteria set out in a bylaw, the Criteria
for allocating indirect costs of activities under
Republic of Slovenia authorisation.
Separate financial statements are compiled for
insurance against non-marketable risks and the
activities of the Fund of Funds, in which the
Bank also manages assets allocated for
management.
Performance of the SID Bank Group
SID – Prva kreditna zavarovalnica d.d., Ljubljana
The countries that have a material impact on
the operations of SID-PKZ continued to record
economic growth in 2018, which brought an
increase in insurance business and more
favourable claims developments for the
majority of policyholders. Owing to market
activity by competitors and also by insurance
intermediaries (pressure to reduce premium
rates, cancellations of contracts), SID-PKZ
again operated in a very competitive
environment in 2018, which had an impact on
its sales activities and the quest for new
approaches in the sale and monitoring of
insurance operations, and in the development
of products and SID-PKZ’s future strategy.
The influence of the environment and SID-PKZ’s
prompt response were reflected in an increase
in insurance business and a fall in premium
rates. The growth in insurance business was
largely attributable to an increase in business
with existing policyholders, and also to business
with new policyholders and an increasing focus
on sales and on servicing existing policyholders.
Alongside the competitive environment, the
decline in premium rates and thus in premium
was also attributable to more favourable claims
ratios in recent years, which SID-PKZ took into
account when setting its premium rates. Owing
to the above, SID-PKZ saw a decline of 5.2% in
its premium relative to the previous year (gross
premium written in 2018: EUR 14,279
thousand).
Income Expenses
Insurance against non-marketable risks 1,740 (1,576)
Fund of funds 1,780 (1,462)
Auctions of emission allowances 20 (20)
Other transactions under authorisation 16 (73)
Activity
EUR thousand
Total assets 56,442 54,079 104.4
Equity 26,386 26,119 101.0
Gross claims paid 4,920 24,603 20.0
Claims ratio 34.5% 163.4%
Net profit 967 1,159 83.4
Index
2018/2017EUR thousand
31 dec 2018
or
1-12/2018
31 dec 2017
or
1-12/2017

72 | Annual report of SID Bank and the SID Bank Group 2018
Claims were in line with expectations in 2018,
compared with the situation in 2017, when
several major claims with high reinsurance were
paid. Fewer claims were registered and resolved
in 2018 than in previous years. There were also
no large claims. As a result, the claims ratio
(gross claims to gross premium written)
declined from 163.4% in 2017 to 34.5% in
2018. Gross claims in 2018 were down 80% on
2017 at EUR 4,920 thousand. Net claims
expenses amounted to EUR 2,528 thousand in
2018, down 13.5% on 2017. Net premium
income exceeded net claims expenses by EUR
3,186 thousand in 2018 (2017: EUR 3,019
thousand), an increase of 5.5%.
Net profit amounted to EUR 967 thousand in
2018, down EUR 192 thousand on 2017, but
above the forecast in the plan for 2018.
Income from reinsurance commission was down
EUR 53 thousand or 1.8% on 2017. Although
SID-PKZ was entitled to a slightly higher
percentage commission in 2018 than in 2017 on
the basis of its international reinsurance
contract, there was a decline in income from
reinsurance commission, as a result of lower
premiums transferred to reinsurers.
Income from investments was down by EUR 49
thousand or 15.4% on 2017. The decline in
interest income was primarily attributable to
persistently low market interest rates, and to a
low average stock of investments relative to the
previous year. SID-PKZ invests exclusively in
Slovenian bank deposits and debt financial
instruments. Securities issued by the Slovenian
government or other EU member states and
securities covered by guarantees issued by
these governments accounted for 71.8% of the
total stock of investments in 2018 (2017: 69%).
Operating costs in 2018 were up EUR 65
thousand or 1.3% at EUR 4,888 thousand. The
cost ratio7 stood at 34.2% (2017: 32%). Labour
costs accounted for the majority of costs
(65.7% in 2018, compared with 64.7% in
2017). The increase in labour costs was
primarily attributable to a rise in the headcount
in 2018, and to promotions.
SID-PKZ is forecasting that its gross premium
written in 2019 will be at a similar level to 2018,
despite the anticipated ongoing decline in
premium rates. The expectation that premium
will be maintained is thus primarily based on
planned growth in insurance business. The
2019 financial plan forecasts that the claims
ratio will be slightly higher than that realised in
2018, but lower than that of 2017. SID-PKZ is
forecasting that it will maintain stability in the
claims ratio because of the expectations of a
relatively favourable economic and political
situation in its markets of importance, and
because of the quality of its system for
transferring risk to reinsurance.
Prvi Faktor Group
7 Ratio of operating costs to gross insurance premium
written.
Total assets 1,544 2,534 60.9
Equity 151 882 17.1
Net profit or loss (731) 1,180 -
Total assets 11,880 14,391 82.6
Equity 5,674 5,960 95.2
Net profit or loss (203) 5,598 -
Prvi faktor, Ljubljana
EUR thousand
31 Dec 2018
or
1-12/2018
31 Dec 2017
or
1-12/2017
Index
2018/2017
Prvi Faktor Group
EUR thousand
31 Dec 2018
or
1-12/2018
31 Dec 2017
or
1-12/2017
Index
2018/2017

Annual report of SID Bank and the SID Bank Group 2018 | 73
Orderly wind-down activities continued at the
Prvi Faktor Group in 2018, where the focus was
on liquidating the portfolio, cutting costs and
setting limits on operations in accordance with
the outlined plans.
An examination of subsequent optimisations of
liquidation proceedings was undertaken in
parallel for the purpose of concluding
operations faster and more efficiently, in
particular the possibility of outsourced
management and/or sales. There were no
purchases of receivables in 2018.
On the basis of the finalisation of unresolved
relations and the liquidated portfolio, taking into
account the planned costs for the period 2017
to 2021 and the balances in accounts, the
group’s companies repaid EUR 2.2 million of
loans to shareholders in 2018.
The group’s total assets at consolidated level
amounted to EUR 11,880 thousand as at
31 December 2018, down 17.4% on the end of
the previous year. In terms of total assets, the
largest company in the Prvi Faktor Group is Prvi
faktor, Zagreb (in liquidation), whose total
assets amounted to EUR 7,058 thousand. It is
followed by Prvi faktor, Beograd (in liquidation)
with total assets of EUR 3,282 thousand, Prvi
faktor, Ljubljana (in liquidation) with total
assets of EUR 1,544 thousand and Prvi faktor,
Sarajevo (in liquidation) with total assets of EUR
16 thousand.
The Prvi Faktor Group ended 2018 with losses
of EUR 203 thousand, primarily as a result of a
decline in income, costs, and the creation of
new impairments. The companies that recorded
a profit were Prvi faktor, Beograd (in
liquidation) with a profit of EUR 360 thousand,
and Prvi faktor, Zagreb (in liquidation) with a
profit of EUR 183 thousand. Losses were
recorded by Prvi faktor, Ljubljana (in
liquidation), in the amount of EUR 731
thousand, and Prvi faktor, Sarajevo (in
liquidation), in the amount of EUR 15 thousand.
The Prvi Faktor Group’s shareholder equity was
positive in the amount of EUR 5,674 thousand.
The group companies all recorded positive
equity at the end of the year.
Centre for International Cooperation and Development (CMSR)
The CMSR works with SID Bank on the
preparation of country risk analysis, surveys of
firms, data processing, and the preparation of
market gap analysis.
The CMSR performed in line with its financial
plan in 2018, and generated a surplus of
revenues over expenses.
Under its contracts for co-financing its
programme in connection with international
development cooperation, the CMSR realised all
of the funding available for state grants. The
CMSR informed co-financers of projects of
international development cooperation of its
cost-effective, high-quality execution, the
results of the projects, and the importance of
providing bilateral development aid to promote
economic development in Slovenia.
The CMSR continued to publish the
International Business Law journal in 2018. The
content has been upgraded and is now
marketed in the form of consultations, legal
analysis and market analysis, while the journal
is also a key reference in attracting business via
public tenders. The CMSR also issued a
promotional business publication, Doing
Business in Slovenia, in 2018, while the online
version is regularly updated on the Slovenian
Business Portal (www.poslovniportal.si).
The CMSR continued its work with SPIRIT, a
public agency, in producing analysis of legal
regimes in various countries of the world, and
in preparing information about the legal regime
in Slovenia.
EUR thousand
Operating revenues 516 466 110.7
Gross profit/loss 4 27 14.8
Total assets 4,067 2,980 136.5
Index
2018/2017
31 Dec 2018
or
1-12/2018
31 Dec 2017
or
1-12/2017

74 | Annual report of SID Bank and the SID Bank Group 2018
Financial position
Total assets
SID Bank’s total assets at the end of 2018 stood
at EUR 2,318,834 thousand, equivalent to
94.6% of its total assets in 2017. Total assets
were down EUR 132,807 thousand on 2017.
Loans and advances to banks and investments
in securities recorded the largest declines on the
asset side of the statement of financial position,
while issued securities recorded the largest
decline on the liability side.
In light of SID Bank’s overwhelming controlling
interest in the SID Bank Group, the nature of
the group and the mutual relations within it, the
SID Bank Group’s total assets were only EUR
45,707 thousand or 2% higher than SID Bank’s
total assets.
The SID Bank Group’s total assets amounted to
EUR 2,364,541 thousand at the end of 2018,
down EUR 132,761 thousand or 5.3% on the
end of 2017.
Assets of SID Bank and the SID Bank Group
SID Bank SID Bank Group
2.452 2.4972.319 2.365
Total assets (EUR million)
31 dec 2017 31 dec 2018
31 Dec 2018 31 Dec 2017 31 Dec 2018 31 Dec 2017
809,350 1,032,179 78.4 809,350 1,037,431 78.0
Loans to customers 706,787 597,740 118.2 706,787 597,740 118.2
662,688 730,521 90.7 662,688 750,004 88.4
Cash balances at central bank 121,184 71,071 170.5 121,184 75,950 159.6
18,825 20,130 93.5 64,532 36,177 178.4
Total assets 2,318,834 2,451,641 94.6 2,364,541 2,497,302 94.7
Loans to banks
Index
2018/2017
Other assets
in EUR thousand
Index
2018/2017
Securities
SID Bank SID Bank Group

Annual report of SID Bank and the SID Bank Group 2018 | 75
Assets of SID Bank
Loans and advances to banks accounted for the
largest proportion (34.9%) of the Bank’s assets
in 2018 (2017: 42.1%). Loans and advances to
banks, which includes loans and deposits,
totalled EUR 809,350 thousand at the end of
2018, down EUR 222,829 thousand or 21.6%
on the end of 2017. The decline was the result
of a decline in the stock of bank deposits, which
were down EUR 290,089 thousand. The decline
in deposits was primarily attributable to the
payment of maturing bank bonds in August
2018. Deposits accounted for 8% of loans and
advances to banks. Long-term loans, which
accounted for 92% of total loans and advances
to banks, increased by EUR 67,260 thousand in
2018 to EUR 744,886 thousand.
Loans and advances to customers were up EUR
109,047 thousand or 18.2% in 2018. The stock
of these loans amounted to EUR 706,787
thousand at the end of the year, or 30.5% of
SID Bank’s total assets (2017: 24.4%). The
largest increase was in loans and advances to
non-financial corporations, primarily loans in
loan funds.
For more on lending, see the section entitled
Financing.
Investments in securities amounted to EUR
662,688 thousand at the end of 2018, of which
investments in debt securities amounted to EUR
650,871 thousand and investments in equities
to EUR 11,817 thousand. The stock was down
EUR 67,833 thousand on the end of 2017,
primarily as a result of a decline of EUR 63,416
thousand in the stock of debt securities. The
proportion of the Bank’s total assets accounted
for by investments in securities stood at 28.6%
at the end of 2018 (2017: 29.8%).
For more on debt securities, see the section
entitled Funding and liquidity, and section 3 of
the Financial Report (Risk management).
SID Bank held EUR 121,184 in balances at the
central bank and at commercial banks at the
end of 2018, up EUR 50,113 thousand on the
previous year. The proportion of the Bank’s total
assets that they account for increased from
2.9% at the end of 2017 to 5.2% at the end of
2018.
Other assets in the amount of EUR 18,825
thousand comprised:
− non-current assets held for sale and
discontinued operations in the amount of
EUR 8,413 thousand, which consist of an
investment in the subsidiary SID-PKZ; in
2017 this investment was classed under
investments in subsidiaries, associates and
joint ventures;
− property, plant and equipment and
intangible assets in the amount of EUR 5,921
thousand, up EUR 125 thousand on the end
of 2017;
− corporate income tax assets in the amount
of EUR 2,271 thousand (2017: EUR 4,086
thousand);
− other financial assets in the amount of EUR
1,853 thousand (2017: EUR 1,553
thousand); and
− all other assets in the amount of EUR 367
thousand (2017: EUR 282 thousand).
Loans to banksLoans to
customers SecuritiesCash balances at
central bank Other assets
42%
24%
30%
3%1%
35%30%
29%
5%1%
Assets structure
31 dec 2017 31 dec 2018

76 | Annual report of SID Bank and the SID Bank Group 2018
Assets of the SID Bank Group
The assets of the SID Bank Group are the same
as the assets of SID Bank, with the exception of
the items of other financial assets and non-
current assets held for sale and discontinued
operations. The SID Bank Group’s other
financial assets were EUR 4 thousand lower at
EUR 1,849 thousand. The difference is
attributable to intragroup relations eliminated in
the consolidation process. The SID Bank
Group’s non-current assets held for sale and
discontinued operations amounted to EUR
54,124 thousand. Intragroup relations have
been eliminated from the item, while all the
assets of the subsidiary have been included. In
light of the intended sale of the subsidiary
SID-PKZ, the consolidated financial statements
have not been compiled according to the
traditional method, but are instead disclosed in
accordance with IFRS 5. Under the
aforementioned standard, all assets of the
subsidiary excluding intragroup balances are
disclosed under non-current assets held for sale
and discontinued operations.
Equity and liabilities of SID Bank and of the SID Bank Group
Equity and liabilities of SID Bank
SID Bank’s equity and liabilities comprised
liabilities in the amount of EUR 1,896,783
thousand and shareholder equity in the amount
of EUR 422,051 thousand at the end of 2018.
Liabilities accounted for 81.8% of total equity
and liabilities (2017: 83.3%), while equity
accounted for 18.2% (2017: 16.7%).
31 Dec 2018 31 Dec 2017 31 Dec 2018 31 Dec 2017
Loans and deposits from banks and central bank 1,206,244 1,230,807 98.0 1,206,244 1,230,807 98.0
Loans and deposits from customers 548,452 454,828 120.6 548,452 454,828 120.6
Debt securities 132,601 350,320 37.9 132,601 350,320 37.9
Total equity 422,051 409,893 103.0 437,706 427,600 102.4
Other liabilities 9,486 5,793 163.7 39,538 33,747 117.2
Total liabilities and equity 2,318,834 2,451,641 94.6 2,364,541 2,497,302 94.7
SID Bank SID Bank GroupIndex
2018/2017
Index
2018/2017in EUR thousand

Annual report of SID Bank and the SID Bank Group 2018 | 77
At 52% (2017: 50.2%), deposits and loans from
banks and liabilities to the central bank again
accounted for the largest proportion of total
equity and liabilities at the end of 2018.
Liabilities to banks and the central bank
amounted to EUR 1,206,244 thousand, down
EUR 24,563 thousand or 2% on the previous
year.
Liabilities to customers stood at EUR 548,452
thousand at the end of 2018, up EUR 93,624
thousand or 20.6% on the end of the previous
year. The proportion of total equities and
liabilities that they account for increased from
18.6% in 2017 to 23.7% at the end of 2018.
Debt securities declined by EUR 217,719
thousand or 62.1% in 2018, primarily as a result
of a maturing bond with a nominal value of EUR
289,835 thousand. The Bank issued a new bond
with a nominal value of EUR 75,000 thousand in
December. The proportion of total equities and
liabilities that they account for declined from
14.3% in 2017 to 5.7% at the end of 2018. The
stock of issued securities stood at EUR 132,601
thousand at the end of 2018.
For more on the liability side, see the section
entitled Funding and liquidity.
Provisions in the amount of EUR 1,130 thousand
at the end of 2018 were down EUR 1,816
thousand on the end of the previous year.
Provisions for off-balance-sheet liabilities
declined by EUR 1,950 thousand in 2018 to EUR
420 thousand, while provisions for liabilities to
employees amounted to EUR 710 thousand, up
EUR 134 thousand on the end of 2017.
Other liabilities in the total amount of EUR 8,356
thousand comprised:
− other financial liabilities in the amount of
EUR 2,024 thousand (2017: EUR 2,191
thousand);
− corporate income tax liabilities in the amount
of EUR 3,294 thousand (2017: EUR 447
thousand);
− hedging derivatives in the amount of EUR
2,898 thousand (2017: EUR 93 thousand);
and
− all other liabilities in the amount of EUR 140
thousand (2017: EUR 116 thousand).
SID Bank’s shareholder equity increased by EUR
12,158 thousand or 3% in 2018, to end the year
at EUR 422,051 thousand. Profit reserves were
up EUR 14,144 thousand, accumulated other
comprehensive income was down EUR 11,713
thousand, and retained earnings, including net
profit for the financial year, were up EUR 9,727
thousand on the previous year.
Loans anddeposits from
banks andcentral bank
Loans anddeposits from
customers Debt securities Total equity Other liabilities
50%
19%14%
17%
0%
52%
24%
6%
18%
0%
Liabilities structure
31 Dec 2017 31 Dec 2018

78 | Annual report of SID Bank and the SID Bank Group 2018
Equity and liabilities of the SID Bank Group
The SID Bank Group’s liabilities are the same as
SID Bank’s liabilities, with the exception of
liabilities associated with non-current assets
held for sale and discontinued operations. The
latter amounted to EUR 30,052 thousand at the
level of the Group. The item includes all the
liabilities of the subsidiary SID-PKZ, less
intragroup relations. In light of the intended
sale of the subsidiary SID-PKZ, the consolidated
financial statements have not been compiled
according to the traditional method, but are
instead disclosed in accordance with IFRS 5.
Under the aforementioned standard, all assets
of the subsidiary excluding intragroup balances
are disclosed under the aforementioned item.
The SID Bank Group’s shareholder equity
amounted to EUR 437,706 thousand as at
31 December 2018, an increase of EUR 10,106
thousand or 2.4% on the end of 2017. Profit
reserves were up EUR 6,920 thousand,
accumulated other comprehensive income was
down EUR 11,830 thousand, and retained
earnings, including net profit for the financial
year, were up EUR 15,016 thousand on the
previous year.
Financial results
1-12/2018 1-12/2017 1-12/2018 1-12/2017
Net interest income 22,986 20,294 113.3 22,986 20,294 113.3
Net non-interest income 7,969 2,641 301.7 7,344 (765) -960.0
Operating costs (14,151) (13,246) 106.8 (14,151) (13,240) 106.9
Impairments and provisioning 715 6,535 10.9 715 6,535 10.9
Profit before tax 17,519 16,224 108.0 16,894 12,824 131.7
Income tax (3,205) (2,268) 141.3 (3,205) (2,268) 141.3
Net profit from continuing operations 14,314 13,956 102.6 13,689 10,556 129.7
Net profit/(loss) after tax from discontinued operations - - - (1,308) 1,206 -
Net profit for financial year 14,314 13,956 102.6 12,381 11,762 105.3
in EUR thousand
Index
2018/2017
Index
2018/2017
SID Bank SID Bank Group

Annual report of SID Bank and the SID Bank Group 2018 | 79
Financial results of SID Bank
SID Bank generated a pre-tax profit of EUR
17,519 thousand in 2018, which was reflected
in a return on equity of 4.2% (2017: 4%). The
figure was up EUR 1,295 thousand on 2017. Net
profit for the financial year amounted to EUR
14,314 thousand, up EUR 358 thousand on the
previous year.
Net interest
SID Bank generated net interest income in the
amount of EUR 22,986 thousand in 2018, up
13.3% on 2017 (2017: EUR 20,294 thousand).
Interest income amounted to EUR 31,122
thousand in 2018, up 6.9% on the previous year
(2017: EUR 29,119 thousand), while interest
expenses amounted to EUR 8,136 thousand,
down 7.8% on 2017 (2017: EUR 8,825). The
increase in interest income and net interest was
attributable to extraordinary interest income
from repayments from the bankruptcy estates
of four customers, and to the reclassification of
one customer from non-performing to
performing exposures and the payment of the
customer’s liabilities from interest from previous
years, and to the increase in the credit portfolio
and the associated change in its structure. The
Bank recorded a net interest margin of 1% in
2018 (2017: 0.8%). Net interest accounted for
74.3% of total net income (2017: 88.5%).
Non-interest income
Net non-interest income amounted to EUR
7,969 thousand in 2018, up EUR 5,328
thousand on 2017 (2017: EUR 2,641 thousand).
The Bank received dividends in the amount of
EUR 618 thousand in 2018 (2017: EUR 3,440
thousand) from its investment in the EIF and its
investment in the subsidiary SID-PKZ.
Net fees and commission amounted to EUR 291
thousand in 2018 (2017: loss of EUR 227
thousand).
Net gains on financial assets not measured at
fair value through profit or loss in the amount
of EUR 3,218 thousand (2017: loss of EUR 1,523
thousand) comprise net gains on financial
assets measured at fair value through other
comprehensive income in the amount of EUR
1,076 thousand, net gains on financial assets
measured at amortised cost in the amount of
EUR 115 thousand and net gains on financial
liabilities measured at amortised cost in the
amount of EUR 2,027 thousand (2017: net loss
of EUR 4,989 thousand). This item includes
revaluation income from negative performance
by loan funds. Under the contract each
positive/negative financial result increase/
decreases SID Bank’s liabilities to the MEDT.
Other net gains amounted to EUR 658
thousand, and other net losses to EUR 49
thousand. The Bank recorded expenses of EUR
129 thousand from changes in fair value in
hedge accounting in 2018.
Other net operating gains relate to income from
business activities under Republic of Slovenia
authorisation in the amount of EUR 3,558
thousand (2017: EUR 1,893 thousand) and
other net operating expenses in the amount of
EUR 196 thousand (2017: EUR 161 thousand).
The increase in income from business activities
under Republic of Slovenia authorisation is
primarily the result of a start having been made
to the management of the Fund of Funds.
The Bank’s financial intermediation margin
stood at 1.3% in 2018 (2017: 0.9%), up on the
previous period, as a result of increases in
interest income and non-interest income alike.
Operating costs
The Bank’s operating costs amounted to EUR
14,151 thousand in 2018, up 6.8% on 2017.
The increase in costs was primarily attributable
to the Bank’s development activities and
recruitment. Labour costs amounted to EUR
9,978 thousand, up 12.7% on 2017. Costs of
materials and services amounted to EUR 3,292
thousand, down EUR 249 thousand or 7% on
the previous year. Costs of materials were up
EUR 16 thousand on the previous year, while
costs of services were down EUR 265 thousand
on the previous year. Amortisation and
depreciation were up 3.4% at EUR 881
thousand.

80 | Annual report of SID Bank and the SID Bank Group 2018
Impairments and provisions
The Bank generated net income from
impairments and provisions in the amount of
EUR 715 thousand in 2018 (2017: EUR 6,535
thousand). Net income from impairments
amounted to EUR 1,037 thousand, while net
expenses for provisions amounted to EUR 322
thousand.
Financial results of the SID Bank Group
The SID Bank Group’s gross profit from
continuing operations was EUR 625 thousand
less than SID Bank’s gross profit. Dividends in
the amount of EUR 582 thousand and other net
operating gains in the amount of EUR 43
thousand have been eliminated from the
consolidated financial result. Other items are
the same as those for SID Bank. The SID Bank
Group’s net profit for the financial year was
reduced by net losses after tax from
discontinued operations in the amount of EUR
1,308 thousand, taking the Group’s net profit in
2018 to EUR 12,381 thousand (2017: EUR
11,762 thousand), EUR 1,933 thousand less
than SID Bank’s net profit for the financial year.
The net losses after tax from discontinued
operations comprise the overall operating result
of the subsidiary SID-PKZ after the elimination
of intragroup relations in the amount of EUR
1,249 thousand, less current corporate income
tax in the amount of EUR 239 thousand and the
expected loss on disposal in the amount of EUR
2,318 thousand. In light of the intended sale of
the subsidiary SID-PKZ, the consolidated
financial statements have not been compiled
according to the traditional method, but are
instead disclosed in accordance with IFRS 5. In
line with the aforementioned standard, the
company’s overall result after the elimination of
intragroup relations is disclosed in a single row
under net profit/(loss) after tax from
discontinued operations.

Annual report of SID Bank and the SID Bank Group 2018 | 81
Highlights of 2018
Having upgraded its outlook for Slovenia from
stable to positive, Standard & Poor’s revised its
outlook for SID Bank from stable to positive in
June 2018. SID Bank’s rating remains
unchanged.
SID Bank signed a sale and purchase agreement
for the sale of its entire holding in its subsidiary
SID-PKZ in September 2018. The transfer of
ownership and receipt of the consideration is
expected in the first half of 2019.
In December 2018 SID Bank became the first
Slovenian issuer to issue 5-year green bonds on
the international capital markets, in the amount
of EUR 75 million. SID Bank will earmark the
proceeds of the green bond issue for financing
green projects and circular economy models,
thereby contributing to the achievement of
Slovenia’s sustainable development goals.
On the basis of a financing agreement with the
MEDT, SID Bank pushed ahead in 2018 with its
activities under the aegis of the Fund of Funds,
developing the first financial instruments and
selecting the first financial intermediaries. The
first loans are now available to final
beneficiaries.
SID Bank expanded its toolkit of financial
engineering measures in 2018, introducing four
new measures in conjunction with the MEDT:
- a credit line for financing SMEs;
- a credit line for financing investment
projects in the real sector;
- a credit line for financing investments in the
forestry and wood manufacturing chain;
- a credit line for financing investment in
sustainable growth in Slovenian tourism.
Events after the reporting period
There were no events after the reporting date
that could have had an impact on the separate
and consolidated financial statements of SID
Bank and the SID Bank Group.
FINANCIAL
REPORT
Management board’s declaration on the financial
statements of SID Bank and the SID Bank Group___83
Independent auditor’s report on the financial statements
of SID Bank and the SID Bank Group___84
1 Financial statements of SID Bank and the SID Bank
Group___94
2 Notes to the financial statements___101
3 Risk management___158
4 Management body’s concise statement on SID Bank’s
approach to the realisation of the risk appetite___207
5 Reporting by operating segment___210
6 Disclosures on the basis of Part Eight of the
CRR___213
7 Disclosures in accordance with the Regulation on the
books of account and annual reports of banks and
savings banks___242
8 Operations under Republic of Slovenia
Authorisation___243
Annual report of SID Bank and the SID Bank Group 2018 | 83
Management board’s declaration on the financial statements of SID
Bank and the SID Bank Group
On 5 March 2019 the management board hereby approves the financial statements of SID Bank and
the SID Bank Group, and the annual report for the year ending 31 December 2018. The financial
statements have been compiled in accordance with the International Financial Reporting Standards
(IFRS) as applied in the EU.
The management board believes that SID Bank and the SID Bank Group have sufficient resources to
operate as going concerns.
The senior management’s responsibilities are:
− to employ relevant accounting policies, and to ensure that they are consistently applied,
− to make use of reasonable and prudent accounting estimates and judgements,
− to ensure that the financial statements are compiled on a going-concern basis for SID Bank and the
SID Bank Group.
The management board is responsible for maintaining accounting documents and records to disclose
the financial position of SID Bank and the SID Bank Group with reasonable accuracy at any time. The
management board is also responsible for ensuring that the financial statements have been compiled
in accordance with the legislation and regulations of the Republic of Slovenia. The management board
must do everything possible to safeguard the assets of SID Bank and the SID Bank Group, and must
undertake all necessary action to prevent or detect any fraud or other irregularities.
The tax authorities may audit a bank’s operations at any time in the five years after the date that tax
was due to be levied, which may result in additional tax liabilities, penalty interest and fines in connection
with corporate income tax or other taxes and levies. The management board is not aware of any
circumstances that could give rise to any significant liability on this account.
Ljubljana, 5 March 2019
Management board of SID Bank
Goran Katušin Sibil Svilan, M.Sc.
Member President
84 | Annual report of SID Bank and the SID Bank Group 2018
Independent auditor’s report on the financial statements of SID
Bank and the SID Bank Group

Annual report of SID Bank and the SID Bank Group 2018 | 85
86 | Annual report of SID Bank and the SID Bank Group 2018

Annual report of SID Bank and the SID Bank Group 2018 | 87

88 | Annual report of SID Bank and the SID Bank Group 2018

Annual report of SID Bank and the SID Bank Group 2018 | 89

90 | Annual report of SID Bank and the SID Bank Group 2018

Annual report of SID Bank and the SID Bank Group 2018 | 91

92 | Annual report of SID Bank and the SID Bank Group 2018

Annual report of SID Bank and the SID Bank Group 2018 | 93

94 | Annual report of SID Bank and the SID Bank Group 2018
1. Financial statements of SID Bank and the SID Bank Group
1.1 Statement of financial position
SID Bank SID Bank Group
(EUR thousand) Note 31 Dec 2018 31 Dec 2017 31 Dec 2018 31 Dec 2017
Cash, cash balances at central banks and other demand deposits at banks 2.4.1 121,184 71,071 121,184 75,950 Non-trading financial assets mandatorily at fair value through profit or loss 2.4.2 15,667 n.a. 15,667 n.a. Financial assets measured at fair value through other comprehensive income 2.4.3 662,688 n.a. 662,688 n.a.
Available-for-sale financial assets (under IAS 39) 2.4.4 n.a. 730,521 n.a. 750,004
Financial assets measured at amortised cost 2.4.5 1,502,323 n.a. 1,502,319 n.a.
Loans and advances to banks 809,350 n.a. 809,350 n.a.
Loans and advances to customers 691,120 n.a. 691,120 n.a.
Other financial assets 1,853 n.a. 1,849 n.a.
Loans and advances (under IAS 39) 2.4.6 n.a. 1,631,472 n.a. 1,636,725
Loans and advances to banks n.a. 1,032,179 n.a. 1,037,431
Loans and advances to customers n.a. 597,740 n.a. 597,740
Other financial assets n.a. 1,553 n.a. 1,554
Investments in subsidiaries, associates and joint ventures 2.4.8 0 8,413 0 0
Property, plant and equipment 2.4.7 4,922 4,992 4,922 7,476
Intangible assets 2.4.7 999 804 999 1,281
Corporate income tax assets 2.4.9 2,271 4,086 2,271 4,513
Current tax assets 0 4,086 0 4,513
Deferred tax assets 2,271 0 2,271 0
Other assets 2.4.10 367 282 367 21,353 Non-current assets held for sale and discontinued operations 2.4.11 8,413 0 54,124 0
TOTAL ASSETS 2,318,834 2,451,641 2,364,541 2,497,302
Financial liabilities measured at amortised cost 2.4.12 1,889,321 2,038,146 1,889,321 2,039,017
Deposits by banks and central banks 43,293 25,264 43,293 25,264
Deposits by customers 39,210 0 39,210 0
Loans from banks and central banks 1,162,951 1,205,543 1,162,951 1,205,543
Loans from customers 509,242 454,828 509,242 454,828
Debt securities 132,601 350,320 132,601 350,320
Other financial liabilities 2,024 2,191 2,024 3,062
Hedging derivatives 2.4.13 2,898 93 2,898 93
Provisions 2.4.14 1,130 2,946 1,130 27,137
Corporate income tax liabilities 2.4.9 3,294 447 3,294 569
Current tax liabilities 3,294 0 3,294 0
Deferred tax liabilities 0 447 0 569
Other liabilities 2.4.15 140 116 140 2,886 Liabilities associated with non-current assets held for sale and discontinued operations 2.4.11 0 0 30,052 0
TOTAL LIABILITIES 1,896,783 2,041,748 1,926,835 2,069,702
Share capital 300,000 300,000 300,000 300,000
Share premium account 1,139 1,139 1,139 1,139
Accumulated other comprehensive income 3,731 15,444 4,238 16,068
Profit reserves 102,149 88,005 114,779 107,859
Treasury shares (1,324) (1,324) (1,324) (1,324) Retained earnings (including net profit for financial year) 16,356 6,629 18,874 3,858 Equity attributable to owners of controlling bank 422,051 409,893 437,706 427,600
TOTAL EQUITY 2.4.16 422,051 409,893 437,706 427,600
TOTAL EQUITY AND LIABILITIES 2,318,834 2,451,641 2,364,541 2,497,302
The notes are an integral part of the financial statements.

Annual report of SID Bank and the SID Bank Group 2018 | 95
1.2 Statement of profit or loss
SID Bank SID Bank Group
(EUR thousand) Note 2018 2017 2018 2017
Interest income recognised at effective interest rate 31,122 29,119 31,122 29,119
Interest income 31,122 29,119 31,122 29,119
Interest expenses (8,136) (8,825) (8,136) (8,825)
Net interest 2.5.1 22,986 20,294 22,986 20,294
Dividend income 2.5.2 618 3,440 36 87
Fee and commission income 591 232 591 232
Fee and commission expenses (300) (459) (300) (459)
Net fees and commission 2.5.3 291 (227) 291 (227)
Net gains/(losses) on financial assets and liabilities not measured at fair value through profit or loss 2.5.4 3,218 (1,523) 3,218 (1,523)
Net gains/(losses) on financial assets and liabilities held for trading (6) 385 (6) 385
Net gains on non-trading financial assets mandatorily at fair value through profit or loss 2.5.5 655 n.a. 655 n.a.
Changes in fair value in hedge accounting 2.5.6 (129) 21 (129) 21
Net foreign exchange (losses) 2.5.7 (8) (1,186) (8) (1,186)
Net gains/(losses) on derecognition of non-financial assets 3 (5) 3 (5)
Other net operating gains 2.5.8 3,362 1,732 3,319 1,679
Administrative expenses 2.5.9 (13,270) (12,394) (13,270) (12,388)
Depreciation and amortisation 2.5.10 (881) (852) (881) (852)
Net (losses) on change in repayment terms (35) n.a. (35) n.a.
Provisions 2.5.11 (322) (917) (322) (917)
Impairments 2.5.12 1,037 7,452 1,037 7,452
Net gains on non-current assets held for sale and associated liabilities 0 4 0 4
Profit from continuing operations 17,519 16,224 16,894 12,824
Corporate income tax on continuing operations 2.5.13 (3,205) (2,268) (3,205) (2,268)
Net profit from continuing operations 14,314 13,956 13,689 10,556
Net profit/(loss) after tax from discontinued operations 2.5.14 0 0 (1,308) 1,206
Net profit for financial year 14,314 13,956 12,381 11,762
Attributable to owners of bank 14,314 13,956 12,381 11,762
Continuing operations 14,314 13,956 13,689 10,556
Discontinued operations 0 0 (1,308) 1,206
Basic earnings per share / diluted earnings per share, EUR 2.5.15 4.61 4.50 3.99 3.79
The notes are an integral part of the financial statements.

96 | Annual report of SID Bank and the SID Bank Group 2018
1.3 Statement of comprehensive income
(EUR thousand)
SID Bank SID Bank Group
Note 2018 2017 2018 2017
Net profit for financial year after tax 14,314 13,956 12,381 11,762
Other comprehensive income after tax (10,317) 2,108 (10,436) 2,030
Items that will not be reclassified to profit or loss 2,952 0 2,979 7
Actuarial gains associated with defined-benefit pension plans 0 0 30 8
Gains associated with fair value changes of equity instruments measured at fair value through other comprehensive income 3,645 n.a. 3,645 n.a.
Corporate income tax associated with items that will not be reclassified to profit or loss 2.4.9 (693) 0 (696) (1)
Items that may be reclassified subsequently to profit or loss (13,269) 2,108 (13,415) 2,023
(Losses) associated with cash flow hedges (effective portion) (2,150) 0 (2,150) 0
Valuation (losses) taken to equity (2,275) 0 (2,275) 0
Transfer to profit or loss 125 0 125 0
(Losses) associated with investments in debt instruments at fair value through other comprehensive income 2.4.3 (14,230) n.a. (14,410) n.a.
Valuation (losses) taken to equity (13,154) n.a. (13,334) n.a.
Transfer to profit or loss (1,076) n.a. (1,076) n.a.
Gains associated with available-for-sale financial assets (under IAS 39) 2.4.4 n.a. 2,603 n.a. 2,498
Valuation gains taken to equity n.a. 5,787 n.a. 5,671
Transfer to profit or loss n.a. (3,184) n.a. (3,173)
Corporate income tax associated with items that may be reclassified subsequently to profit and loss 2.4.9 3,111 (495) 3,145 (475)
Total comprehensive income for financial year after tax 3,997 16,064 1,945 13,792
Attributable to owners of bank 3,997 16,064 1,945 13,792
Continuing operations 3,997 16,064 1,097 12,711
Discontinued operations 0 0 848 1,081
The notes are an integral part of the financial statements.

Annual report of SID Bank and the SID Bank Group 2018 | 97
1.4 Statement of changes in equity
SID Bank
2018
(EUR thousand) Share
capital
Share premium account
Accumulated other
comprehensive income
Profit reserves
Retained earnings
(including net
profit for financial
year) Treasury
shares Total
equity
OPENING BALANCE as at 1 Jan 2018 (before adjustment) 300,000 1,139 15,444 88,005 6,629 (1,324) 409,893
Effects of changes in accounting policies (IFRS 9) 0 0 (1,396) 0 9,557 0 8,161
OPENING BALANCE as at 1 Jan 2018 300,000 1,139 14,048 88,005 16,186 (1,324) 418,054
Net profit for period 0 0 0 0 14,314 0 14,314
Other comprehensive income 0 0 (10,317) 0 0 0 (10,317)
Total comprehensive income for financial year after tax 0 0 (10,317) 0 14,314 0 3,997
Allocation of net profit to profit reserves 0 0 0 14,144 (14,144) 0 0
CLOSING BALANCE as at 31 Dec 2018 300,000 1,139 3,731 102,149 16,356 (1,324) 422,051
The notes are an integral part of the financial statements.
2017 (EUR thousand)
Share capital
Share premium account
Accumulated other
comprehensive income
Profit reserves
Retained earnings
(including net
profit for financial
year) Treasury
shares Total
equity
OPENING BALANCE as at 1 Jan 2017 300,000 1,139 13,335 70,531 10,148 (1,324) 393,829
Net profit for period 0 0 0 0 13,956 0 13,956
Other comprehensive income 0 0 2,108 0 0 0 2,108
Total comprehensive income for financial year after tax 0 0 2,108 0 13,956 0 16,064
Allocation of net profit to profit reserves 0 0 0 17,474 (17,474) 0 0
CLOSING BALANCE as at 31 Dec 2017 300,000 1,139 15,444 88,005 6,629 (1,324) 409,893
The notes are an integral part of the financial statements.

98 | Annual report of SID Bank and the SID Bank Group 2018
SID Bank Group
2018
(EUR thousand) Share
capital
Share premium account
Accumulated other
comprehensive income
Profit reserves
Retained earnings
(including net
profit for financial
year) Treasury
shares
Equity attributable
to owners of
controlling bank
Total equity
OPENING BALANCE as at 1 Jan 2018 (before adjustment) 300,000 1,139 16,068 107,859 3,858 (1,324) 427,600 427,600
Effects of changes in accounting policies (IFRS 9) 0 0 (1,396) 0 9,557 0 8,161 8,161
OPENING BALANCE as at 1 Jan 2018 300,000 1,139 14,672 107,859 13,415 (1,324) 435,761 435,761
Net profit for period 0 0 0 0 12,381 0 12,381 12,381
Other comprehensive income 0 0 (10,436) 0 0 0 (10,436) (10,436)
Total comprehensive income for financial year after tax 0 0 (10,436) 0 12,381 0 1,945 1,945
Allocation of net profit to profit reserves 0 0 0 11,856 (11,856) 0 0 0
Transfer of profit reserves to retained earnings 0 0 0 (4,936) 4,936 0 0 0
Other* 0 0 2 0 (2) 0 0 0
CLOSING BALANCE as at 31 Dec 2018 300,000 1,139 4,238 114,779 18,874 (1,324) 437,706 437,706
* transfer of actuarial gains to retained earnings
The notes are an integral part of the financial statements.
2017
(EUR thousand) Share
capital
Share premium account
Accumulated other
comprehensive income
Profit reserves
Retained earnings
(including net
profit for financial
year) Treasury
shares
Equity attributable
to owners of
controlling bank
Total equity
OPENING BALANCE as at 1 Jan 2017 300,000 1,139 14,039 83,187 16,766 (1,324) 413,807 413,807
Net profit for period 0 0 0 0 11,762 0 11,762 11,762
Other comprehensive income 0 0 2,030 0 0 0 2,030 2,030
Total comprehensive income for financial year after tax 0 0 2,030 0 11,762 0 13,792 13,792
Allocation of net profit to profit reserves 0 0 0 24,672 (24,672) 0 0 0
Other* 0 0 (2) 0 2 0 0 0
CLOSING BALANCE as at 31 Dec 2017 300,000 1,139 16,068 107,859 3,858 (1,324) 427,600 427,600
* transfer of actuarial gains to retained earnings
The notes are an integral part of the financial statements.

Annual report of SID Bank and the SID Bank Group 2018 | 99
1.5 Statement of cash flows
(EUR thousand)
SID Bank SID Bank Group
2018 2017 2018 2017
CASH FLOWS FROM OPERATING ACTIVITIES
Pre-tax profit 17,519 16,224 15,586 14,168
Depreciation and amortisation 881 852 881 1,267
(Reversal of impairments) of investments in debt instruments measured at fair value through other comprehensive income (789) n.a. (789) n.a.
(Reversal of impairments) of loans and other financial assets measured at amortised cost (248) (7,731) (248) (7,731)
Impairments of property, plant and equipment (including impairments of investment property), intangible assets and other assets 0 0 0 91
Impairments of investments in subsidiaries, associates and joint ventures 0 279 0 279
Net (gains) on investments in subsidiaries, associates and joint ventures n.a. (3,353) n.a. 0
Net foreign exchange losses 8 1,186 8 1,185
Net losses on change in repayment terms of debt financial instruments 35 n.a. 35 n.a.
Net (gains)/losses on sale of property, plant and equipment (3) 5 (3) 5
Other (gains) from investing activities (618) (87) (36) (87)
Net unrealised (gains) on non-current assets held for sale and discontinued operations and associated liabilities 0 (4) 0 (4)
Other adjustments in pre-tax profit (90) 447 (90) 329
Cash flows from operating activities before changes in operating assets and liabilities 16,695 7,818 15,344 9,502
Decrease in operating assets (excluding cash equivalents) 220,663 30,389 221,078 31,874
Net decrease in financial assets held for trading 0 73 0 73
Net decrease in non-trading financial assets mandatorily at fair value through profit or loss 3,007 n.a. 3,007 n.a.
Net decrease in financial assets measured at fair value through other comprehensive income 58,037 n.a. 58,037 n.a.
Net decrease in available-for-sale financial assets n.a. 48,503 n.a. 52,303
Net (increase)/decrease in loans and other financial assets measured at amortised cost 159,704 (18,210) 159,704 (17,330)
Net decrease in available-for-sale non-current assets 0 0 415 0
Net (increase)/decrease in other assets (85) 23 (85) (3,172)
(Decrease) in operating liabilities (182,455) (107,300) (180,293) (106,331)
Net (decrease) in financial liabilities held for trading 0 (4) 0 (4)
Net increase in deposits and loans measured at amortised cost 34,832 16,372 34,832 16,513
Net (decrease) in issued debt securities measured at amortised cost (217,508) (110,280) (217,508) (110,280)
Net increase in hedging derivatives 201 143 201 143
Net increase in liabilities associated with non-current assets held for sale 0 0 2,162 0
Net increase/(decrease) in other liabilities 20 (13,531) 20 (12,703)
Cash flows from operating activities 54,903 (69,093) 56,129 (64,955)
(Paid)/refunded corporate income tax 1,963 (9,981) 1,963 (10,887)
Net cash flow from operating activities 56,866 (79,074) 58,092 (75,842)
CASH FLOWS FROM INVESTING ACTIVITIES
Inflows from investing activities 625 3,442 43 89
Proceeds from sale of property, plant and equipment 7 2 7 2
Other inflows from investing activities 618 3,440 36 87
Outflows from investing activities (1,003) (840) (1,003) (1,527)
(Acquisition of property, plant and equipment) (494) (279) (494) (829)
(Acquisition of intangible assets) (509) (282) (509) (419)
(Acquisition of investments in subsidiaries, associates and joint ventures) 0 (279) 0 (279)
Net cash flow from investing activities (378) 2,602 (960) (1,438)

100 | Annual report of SID Bank and the SID Bank Group 2018
(EUR thousand)
SID Bank SID Bank Group
2018 2017 2018 2017
Effect of foreign exchange differences on cash and cash equivalents 250 (125) 250 (125)
Net increase/(decrease) in cash and cash equivalents 56,488 (76,472) 57,132 (77,280)
Opening balance of cash and cash equivalents 71,071 147,668 75,950 153,355
Closing balance of cash and cash equivalents 127,809 71,071 133,332 75,950
The notes are an integral part of the financial statements.
Cash equivalents
SID Bank SID Bank Group
(EUR thousand) 31 Dec 2018 31 Dec 2017 31 Dec 2018 31 Dec 2017
Bank deposits 6,625 0 6,625 0
Cash, cash balance in settlement account at central bank 120,871 70,778 120,871 70,778
Sight deposits at banks 313 293 313 5,172
Cash and cash equivalents of discontinued operations 0 0 5,523 0
Total 127,809 71,071 133,332 75,950
Cash flows from interest and dividends
SID Bank SID Bank Group
(EUR thousand) 2018 2017 2018 2017
Cash flows from interest and dividends
Interest received 43,115 45,166 43,115 45,749
Interest paid (10,358) (11,418) (10,358) (11,418)
Dividends received 618 3,440 36 87
Total 33,375 37,188 33,375 34,418
The statement of cash flows of SID Bank and
the SID Bank Group has been compiled using
the indirect method.
Pre-tax profit served as the basis for the
preparation of the cash flow of SID Bank and
the SID Bank Group.
Under the indirect method, the net cash flow
from operating activities is determined by
adjusting pre-tax profit for the effects of
changes in operating receivables and liabilities,
the effects of non-cash items such as
depreciation and amortisation, provisions,
impairments, fair value changes in hedge
accounting, and foreign exchange differences,
and the effects of cash flows from investing
activities. SID Bank and the SID Bank Group
include the effects of changes in issued debt
securities in net cash flows from operating
activities.
Cash flows from investing activities are
determined by the direct method, and include
dividends received under inflows from investing
activities and proceeds from the sale of
property, plant and equipment, while outflows
from investing activities include acquisitions of
property, plant and equipment, acquisitions of
intangible assets, and acquisitions of
investments in joint ventures.

Annual report of SID Bank and the SID Bank Group 2018 | 101
2 Notes to the financial statements
Sections 1.1 to 1.5 of the financial report
present the statement of financial position as at
31 December 2018, the statement of profit or
loss for the 2018 financial year, the statement
of other comprehensive income for the 2018
financial year, the statement of changes in
equity for the 2018 financial year and the
statement of cash flows for the 2018 financial
year for SID Bank (separate statements) and for
the SID Bank Group (consolidated statements).
Figures for the position as at 31 December 2017
and for the 2017 financial year are disclosed in
the aforementioned financial statements for the
purposes of comparison.
The abbreviation “n.a.” (not applicable) is used
in tables when an item is not relevant to the
period in question. As a general rule, “n.a.” is
used for changes in financial statement
categories and the corresponding changes in
the structure of the reporting of financial
instruments, and the related disclosures
deriving from the initial application of IFRS 9.
Henceforth where the figures for the Bank and
the Group are identical, they are only presented
once.
2.1 Basic information
The SID Bank Group (also referred to simply as
“the Group”) comprises SID - Slovenska izvozna
in razvojna banka, d.d., Ljubljana (hereinafter:
SID Bank or “the Bank”) as the controlling
company, a subsidiary, joint ventures and an
associate. A detailed presentation of the Group
is given in section 2.4.8.
The SID Bank Group provides banking services
under authorisations obtained from the Bank of
Slovenia, and undertakes transactions under
the authorisation of the Slovenian state (the
Republic of Slovenia) and insurance of
receivables. The granting of loans to promote
development, environmental protection and
energy projects accounts for the majority of its
banking activities. A more detailed description
of the services under authorisation is given in
section 2.3.21.
SID Bank’s registered office is at Ulica Josipine
Turnograjske 6, 1000 Ljubljana, Slovenia.
The Bank’s share capital amounts to EUR
300,000,090.70, and is divided into 3,121,741
ordinary registered no-par-value shares
released in several issues. The Republic of
Slovenia (the Slovenian state) is the Bank’s sole
shareholder.
2.2 Statement of compliance
The financial statements of SID Bank and the
SID Bank Group have been compiled in
accordance with the International Financial
Reporting Standards and the corresponding
interpretations as approved by the EU (the
IFRS), having regard for the Companies Act, the
Banking Act and Bank of Slovenia regulations.

102 | Annual report of SID Bank and the SID Bank Group 2018
2.3 Significant accounting policies
The significant accounting policies that provide
the basis of measurement for the compilation of
the financial statements of SID Bank and the
SID Bank Group and other accounting policies
that are of significance in the interpretation of
the separate and consolidated financial
statements are given below.
In light of their immateriality, the accounting
policies relating to insurance contracts are not
disclosed in detail.
In compiling the financial statements for 2018
the Bank applied the same accounting policies
as those used in compiling the financial
statements for 2017, with the exception of the
accounting standards and other changes
effective as of 1 January 2018 and approved by
the EU.
2.3.1 Basis for compiling the financial statements
The financial statements of SID Bank and the
SID Bank Group have been compiled on a
going-concern basis, on an original cost basis,
with the exception of financial assets measured
at fair value through profit or loss, financial
assets measured at fair value through other
comprehensive income, financial assets held for
trading, hedging derivatives and investment
property, which are measured at fair value.
The accounting policies may only be changed if:
– the change is mandatory under a standard
or interpretation, or
– the change results in the financial
statements presenting information of
greater reliability or relevance.
2.3.2 Use of estimates and judgements and material uncertainties
The compilation of the financial statements in
accordance with the IFRS at SID Bank and the
SID Bank Group requires the use of estimates
and judgements that affect the carrying
amounts of reported assets and liabilities, the
disclosure of contingent assets and liabilities as
at the reporting date, and the amount of
revenue and expenses in the reporting period.
Financial instruments are assigned to a category
upon initial recognition with regard to the policy
of SID Bank and the SID Bank Group. Estimates
and judgments were applied to the following:
– impairments of financial assets measured at
amortised cost, provisions for contingent
liabilities and impairments of financial assets
measured at fair value through other
comprehensive income (see note in section
2.3.11 Impairments of financial assets and
provisions),
– estimates of the fair value of financial assets
and liabilities (see note in section 2.3.11
Principles applied in valuation at fair value),
– valuation of derivatives (see notes in section
2.3.12 Derivatives and hedge accounting),
– depreciation and amortisation period of
property, plant and equipment and
intangible assets (see notes in section 2.3.14
Property, plant and equipment and
intangible assets),
– potential tax items (see notes in section
2.3.22 Taxes), and
– provisions for commitments to employees
(see notes in section 2.3.23 Employee
benefits).
Although the estimates used are based on the
best knowledge of current developments and
activities, the actual results may differ from the
estimates. SID Bank and the SID Bank Group
make revisions to the estimates and
assumptions used, and recognise their effects
during the period of the revision.
Annual report of SID Bank and the SID Bank Group 2018 | 103
2.3.3 Consolidation
Undertakings included in consolidation
The following are included in the consolidated
financial statements:
– full consolidation method: the controlling
company SID Bank, and the subsidiary SID -
Prva kreditna zavarovalnica d.d., Ljubljana,
and
– equity method: the Prvi Faktor Group (joint
venture).
A subsidiary is a company that is directly or
indirectly controlled by SID Bank.
Consolidation of the subsidiary has been
undertaken not in the traditional method, but
rather in accordance with IFRS 5 given the
intended sale of the subsidiary. This means that
intragroup stocks and transactions are first
eliminated from the subsidiary’s financial
statements, then the total assets that remain
are disclosed under non-current assets held for
sale and discontinued operations, while the total
liabilities that remain are disclosed under
liabilities associated with non-current assets
held for sale and discontinued operations. In
profit or loss, the undertaking’s overall result
after the elimination of intragroup relations is
disclosed in a single row under net profit/(loss)
after tax from discontinued operations.
For the sake of the comparability of the net
profit with the figures for the previous year, the
SID Bank Group’s net profit has been restated
in the same manner in line with the
requirements of standards.
A joint venture is a company jointly controlled
by the SID Bank Group on the basis of a
contractual agreement. In the consolidated
financial statements, investments in joint
ventures are accounted under the equity
method. The pertaining profit or loss of the joint
venture is recognised in the consolidated
statement of profit or loss. The pertaining
effects included in other comprehensive income
of the joint venture are recognised in other
comprehensive income. Investments in joint
ventures are adjusted to the recognised effects.
When the loss exceeds the investment value in
the consolidated statement of financial position,
the loss is no longer recognised, unless a liability
derives from it that would have to be settled by
the SID Bank Group. The SID Group re-
recognises its share of the profits from the
investment in a joint venture only after its share
of the profits equals the amount of
unrecognised loss.
Undertakings excluded from consolidation
Given its immateriality to a true and fair picture
of the financial statements, SID Bank does not
include the associate, the Centre for
International Cooperation and Development
(CMSR), in consolidation. SID Bank is a co-
founder of the CMSR, in which it does not have
any financial stake, but holds 33% of the voting
rights.
An associate is a company in which SID Bank
directly or indirectly holds 20% or more of the
voting rights, and exercises significant influence
on it but does not control it.
The total assets of the CMSR amount to less
than 1% of SID Bank’s total assets. On the basis
of the aforementioned indicator, the CMSR is
immaterial to the SID Bank Group, and is
therefore excluded from consolidation.
Assessments concerning control decisions
The principles of management and the
assessment of the following factors are used as
the basis for consolidation: the purpose and
structure of the investee, relevant activities and
associated decision-making, whether it is able
to direct important activities based on existing
rights, whether the investor is exposed to
variable returns and whether the investor may
influence the returns.
104 | Annual report of SID Bank and the SID Bank Group 2018
2.3.4 Functional and reporting currency
The financial statements of SID Bank and the
SID Bank Group have been compiled in euros,
which is the reporting currency of the SID Bank
Group, and the functional currency of SID Bank.
All amounts in separate and consolidated
financial statements and the accompanying
notes are expressed in thousands of euros,
unless stated otherwise.
2.3.5 Translation of transactions and items in foreign currency
All transactions in foreign currency are
converted into the functional currency at the
exchange rate on the transaction date. Foreign
exchange differences are recognised in profit or
loss as foreign exchange gains/losses.
Assets and liabilities denominated in foreign
currencies are converted in the Bank’s and
Group’s financial statements using the
reference European Central Bank exchange rate
applicable on the reporting date. Translation
effects are disclosed in profit or loss as foreign
exchange gains/losses.
Foreign exchange differences arising in the
settlement of monetary items or in the
translation of monetary items at exchange rates
other than those at which they were translated
upon initial recognition in the period or in
previous financial statements are recognised in
profit or loss in the period in which they arise.
They are disclosed under the item of net foreign
exchange gains/losses.
Foreign exchange differences on the principal
and interest for debt instruments are recognised
in profit or loss, while foreign exchange
differences arising in valuation at fair value (the
effect of a change in the market price in a
foreign currency) are disclosed under other
comprehensive income.
Foreign exchange differences arising on non-
monetary items such as equities classed as
available-for-sale financial assets measured at
fair value through other comprehensive income
are recognised in accumulated other
comprehensive income together with the effect
of valuation at fair value in other comprehensive
income.
The translation of the financial statements of
undertakings whose functional currency differs
from the reporting currency is reflected in
foreign exchange differences from
consolidation, which are disclosed in a separate
equity adjustment and are only recognised in
profit or loss when the investment is disposed
of.
2.3.6 Cash equivalents
Cash equivalents in the statement of cash flows
include cash-on-hand and balances in
settlement accounts and business accounts at
banks, and deposits at and loans to banks, and
securities measured at fair value through other
comprehensive income with an original maturity
of no more than three months.
All cash equivalent items are short-term, highly
liquid investments that are readily convertible
into predetermined cash amounts.
2.3.7 Interest income and expenses
Interest income and interest expenses include
income and expenses for interest on loans
granted and received, interest on derivatives,
interest on financial assets measured at fair
value through other comprehensive income and
other interest.

Annual report of SID Bank and the SID Bank Group 2018 | 105
Interest income and expenses for interest on
loans granted and received and for other
interest are recognised in profit or loss in the
relevant period using the effective interest rate
method.
Accrued interest relating to impaired loans is
excluded from income and is only recognised in
the event of payment.
For financial assets measured at fair value
through other comprehensive income, interest
income calculated on the basis of amortised
cost using the effective interest rate method is
calculated on the basis of yield-to-maturity.
2.3.8 Fees and commission received and granted
Fee and commission income primarily includes
fees and commission on guarantees and loans
granted, which are not included in the effective
interest rate. Fee and commission expenses
comprise fees and commission for loan
borrowings, and for stock exchange
transactions and other transactions in
securities.
Fees and commission are recognised in profit or
loss when a service has been rendered.Fees and
commission included in the calculation of the
effective interest rate of a financial asset or
financial liabilities are disclosed under interest
income or interest expenses.
2.3.9 Dividend income
Dividend income is recognised in profit or loss
when the right to receive dividends is acquired,
and it is probable that the economic benefits
associated with the transaction will flow to the
undertaking.
2.3.10 Other net operating gains/losses
Other net operating gains/losses recognised in
profit or loss include revenues for non-banking
services, income from insurance operations and
expenses for insurance operations.
Revenues for non-banking services include
revenues for credit assessment information,
fees for services provided under authorisation
and other services.
Revenue is recognised when the contractual
obligation has been performed, i.e. when the
goods and services have been transferred to the
customer. It is recognised in an amount that
reflects the consideration to which the
undertaking expects to be entitled.
2.3.11 Financial instruments
Classification and measurement of financial instruments in accordance with IFRS 9
Business model
Classification and measurement of financial
assets in the financial statements is determined
by the selected business model within which
financial assets are managed, and the
characteristics of their contractual cash flows.
Upon their initial recognition, each financial
asset is classified into one of the following
business models:
1. a model whose purpose is the collection of
contractual cash flows (hold to collect model:
measurement at amortised cost),

106 | Annual report of SID Bank and the SID Bank Group 2018
2. a model whose purpose is the collection of
contractual cash flows and sale (hold to collect
and sell model: measurement at fair value
through other comprehensive income),
3. other models (measurement at fair value
through profit or loss and through other
comprehensive income).
SID Bank assesses the purpose of the business
model under which the financial asset is
classified on a portfolio basis, as this is the
method used for the management of operations
and the submission of information to the
management. Given its role and framework of
operation, SID Bank manages financial assets
under the first two basic business models, and
only classifies financial assets under the third
business model when they fail to meet the
conditions of one of the first two business
models.
Purchases and sales of financial assets other
than loans and receivables are recognised on
the trade date. Loans and receivables are
recognised on the settlement date.
SID Bank’s basic business activity involves
lending operations executed either via
commercial banks or in cooperation with them,
or via direct lending to final beneficiaries. The
aim of lending activities is to collect contractual
cash flows, and accordingly these transactions
are classified under the first business model.
The purpose of treasury transactions is to
manage liquidity, interest rate risk and currency
risk, and to provide funding for the purposes of
financing. The purpose of deposit and credit
operations is the collection of contractual cash
flows, and they are therefore classified under
the first business model. Transactions in debt
securities may be concluded to collect
contractual cash flows or also with the eventual
aim of sale, and on this basis they can be
classified under the first or second business
models.
According to the requirements of the standard,
all equity instruments may only be classified
under the third business model. Given that
these financial instruments are not traded by
the Bank, it decides, upon initial recognition of
an individual equity or a group of equities,
whether it will use the alternative option of
measurement under other comprehensive
income. Financial assets that fail the SPPI test
are also classified under this business model.
Assessment of whether contractual cash flows comprise solely payments of principal and interest (SPPI test)
SID Bank carries out an SPPI test for debt
instruments assigned to the hold to collect
model and the hold to collect and sell model.
For the purpose of this assessment, the
principal is defined as the fair value of financial
assets upon initial recognition. Interest is
defined as a compensation for the time value of
money, the credit risk associated with the
unpaid principal and other lending risks and
costs (liquidity risk and administrative
expenses) and the profit margin.
The Bank assesses whether contractual cash
flows are comprised solely of payments of
principal and interest on the basis of the
contractual characteristics of the financial
instrument. This assessment also involves a
judgment of whether the financial asset
contains contractual provisions that may
change the time and amount of the contractual
cash flows so that this condition would no
longer be met. In so doing, the Bank takes
account of:
− potential events that could change the time
and amount of contractual cash flows;
− the possibility of early repayment or
extended loan repayment;
− conditions that restrict the Group’s cash
flows of some assets (e.g. subordination of
payments);
− characteristics that change the
understanding of the time value of money
(e.g. periodic repricing of interest rates).
If a debt instrument fails the SPPI test, it has to
be measured at fair value, i.e. under the third
business model.
Categories of financial assets
Based on the business model and the SPPI test
carried out for the first and second business
models, financial assets are assigned to the
following categories:

Annual report of SID Bank and the SID Bank Group 2018 | 107
Financial assets measured at amortised cost
Financial assets are measured at amortised cost
if they are assets under the hold to collect
business model, for which the contractual
provisions stipulate the payment of certain
time-dependent cash flows that constitute
solely the payment of the principal and interest
on the unpaid principal.
The Bank includes in this category loans and
other financial assets such as trade receivables,
and debt securities that it has determined that
it does not intend to sell. The effects of interest,
foreign exchange differences and impairments
are recognised in profit or loss.
Financial assets measured at fair value through other comprehensive income
Financial assets are measured at fair value
through other comprehensive income if they are
financial assets under the hold to collect and sell
business model, for which the contractual
provisions stipulate the payment of certain
time-dependent cash flows that constitute
solely the payment of the principal and interest
on the unpaid principal.
The Bank includes debt securities in this
category.
These assets are recognised at fair value in the
statement of financial position. The effects in
profit or loss are the same as in the case of
measurement at amortised cost, i.e. interest,
foreign exchange differences from the
amortised cost of the financial assets and
impairments. The difference between the
amortised cost and the fair value, taking
account of the creation of impairments for
expected credit losses, is recorded under other
comprehensive income.
Upon derecognition the accumulated effect of
the measurement is transferred from other
comprehensive income to profit or loss.
The Bank also valuates equities at fair value
through other comprehensive income. The Bank
does not trade in equities and it acquires them
either through the conversion of non-
performing claims or as a strategic investment,
and in each individual case chooses the option
of measuring them at fair value through other
comprehensive income. In this case only
dividend income is recognised in profit or loss.
Effects accumulated under other
comprehensive income are never transferred to
profit or loss, even upon derecognition.
Financial assets at fair value through profit or loss
If financial assets are not measured at
amortised cost or fair value through other
comprehensive income, they are measured at
fair value through profit or loss.
This category primarily includes financial assets
mandatorily at fair value through profit or loss
and financial assets designated for
measurement at fair value through profit or
loss.
Financial assets mandatorily at fair value
through profit or loss include any debt
instruments that are otherwise managed under
the first and second business models, but owing
to the characteristics of the contractual cash
flows did not pass the SPPI test, and derivatives
otherwise used for hedging other on-balance
sheet items but that do not meet all of the
conditions to be classified as hedging
derivatives.
The Bank would classify debt instruments that
passed the SPPI test but that were defined as
hedging instruments upon initial recognition
under financial assets designated for
measurement at fair value through profit or
loss, if such classification would materially
reduce or eliminate accounting discrepancies
that occur due to the use of different valuation
methods. The Bank currently has no such
financial assets.
The aforementioned categories of financial
assets have replaced the categories for the
measurement of financial assets under IAS 39.

108 | Annual report of SID Bank and the SID Bank Group 2018
Derecognition of modified financial assets
IFRS 9 maintains the provisions of IAS 39
according to which financial assets are
derecognised when the contractual rights to the
cash flows expire, or the asset is transferred
and the transfer qualifies for derecognition, but
it fails to provide any guidance on how to apply
this criterion in the event of changed or
modified financial assets.
In defining whether a change in financial assets
results in derecognition and the recognition of a
new financial asset, or the existing financial
asset remains recognised and its gross carrying
amount is adjusted by a gain or loss arising from
the change, SID Bank applies the criteria below:
The primary criteria for derecognition are:
– when the net present value of modified
contractual cash flows of a financial asset differs by more than 10% from the net
present value of the residual cash flows prior to the modification, it is recognised as a
material change resulting in derecognition;
– notwithstanding the 10% criterion, the Bank
may derecognise an asset in the event that the change in repayment terms (e.g. a
change in maturity, currency and/or interest rate) did not occur as the result of the
debtor’s inability to repay debt under the
originally agreed terms, but for commercial
and/or market-related reasons, and the original exposure was classified as stage 1
for the purpose of creating allowances and/or provisions for credit losses, prior to
the change in repayment terms;
– when the change results in the
reclassification of an on-balance sheet exposure and a transition to measurement
at fair value;
– a new debtor replaces the original debtor in the credit relationship by virtue of a new
contract based on which the original debtor’s
debt is repaid. The aforementioned rule does not apply if the new debtor is part of a group
of connected clients that includes the original debtor;
– consolidation of several financial assets into
a single or modified structure of new
financial assets with a new cash flow scheme;
– a change in contractual currency;
– partial conversion of debt to equity.
Upon derecognition, all costs and fees are
disclosed in profit or loss upon derecognition of
the original financial asset, and the new
financial asset is recognised at fair value, i.e.
less expected credit losses as appropriate.
Write-off of investment operations
The Bank writes off receivables from investment
operations when recovery has failed (generally
after the exhaustion of all legal remedies and
after the end of the statute-barring periods), or
in the event that the customer no long
possesses any assets with which the debt from
the investment operation could be repaid. In so
doing the Bank takes account of Article 32 of
the Bank of Slovenia’s regulation on credit risk
management at banks and savings banks,
which regulates the write-off of problem
exposures for reason of failed recovery.
The previous paragraph notwithstanding, the
write-off of an exposure in full nevertheless
occurs on the basis of a final court order on the
completion of bankruptcy proceedings
administered against the customer.
Should it be assessed in the recovery procedure
that an on-balance-sheet exposure will not be
repaid, and that the conditions for
derecognising the exposure from the statement
of financial position have been met in
accordance with the IFRS, the procedure for
derecognising the outstanding exposure from
the statement of financial position and
transferring it to the off-balance-sheet records
in full is begun even before a final court order
on the completion of bankruptcy proceedings is
obtained, in the following cases:
a) for unsecured exposures, when bankruptcy proceedings are initiated against the
customer and the order initiating bankruptcy proceedings is final,
b) for secured exposures, when a period of
more than the following has passed since the order initiating bankruptcy proceedings
became final:
- seven years for exposures secured by
real estate,

Annual report of SID Bank and the SID Bank Group 2018 | 109
- five years for exposures secured by
movable property or other forms of credit
protection (e.g. guarantees, securities,
monetary claims, and the
aforementioned assets have not been
liquidated in the interim. If the exposure
is secured by collateral of various types,
the longer of the periods regarding the
other assets is taken into account.
The write-off of an exposure may also occur:
a) if an extra-judicial forbearance agreement or
extra-judicial settlement is concluded
between SID Bank and the customer,
b) on the basis of the sale of SID Bank’s
receivables, in the amount representing the
difference between SID Bank’s exposure as
at the reporting date and the selling price
achieved,
c) on the basis of a final court order approving
compulsory composition or simplified
compulsory composition or a financial
restructuring agreement, in the amount in
which SID Bank’s right to exercise payment
from the customer in judicial or other
proceedings was extinguished.
Financial liabilities
Financial liabilities are measured either at
amortised cost or at fair value through profit or
loss.
At initial recognition financial liabilities are
classified with regard to the purpose of
acquisition, the time held in possession and the
type of financial instrument.
Financial liabilities at fair value through profit or
loss are:
– financial liabilities held for trading, under
which derivatives not used to hedge against risk are classified, and
– hedging derivatives, which include derivatives that meet the conditions for hedge accounting.
Net gains/losses on the basis of changes in the
fair value of financial liabilities are disclosed in
profit or loss.
All other liabilities are classified into the
category of liabilities at amortised cost, which
comprises liabilities from deposits and loans
from banks and central banks and customers,
issued debt securities and other financial
liabilities.
Principles applied in valuation at fair value
Fair value is the price that would be received
when selling an asset or paid when transferring
a liability in a transaction between market
participants at the measurement date under
current market terms, regardless of whether the
price can be directly observed or estimated
using a valuation technique. The price on the
most advantageous market is not adjusted for
transaction costs.
The fair value of a financial instrument at initial
recognition is the same as the transaction price.
Should one of the following conditions be met,
the fair value is not equal to the transaction
price:
− the transaction is executed under duress, or
the vendor is compelled to accept a price in
the case of financial difficulties;
− the transaction is executed between related
parties;
− the transaction is executed in a market that
is not the most advantageous;
− the transaction price includes transaction
costs.
The valuation methods and the assumptions
applied are additionally disclosed in section 3.7.
The aforementioned note also describes and
discloses the fair value hierarchy.

110 | Annual report of SID Bank and the SID Bank Group 2018
Impairments of financial assets and provisions
In comparison with IAS 39, IFRS 9 replaces the
incurred loss model with the expected credit
loss model, where in addition to historical data
on recoverability it is necessary to take account
of forward-looking information and other
internal and external factors that indicate the
debtor’s solvency in the future.
Estimated expected credit losses need to be
estimated for the following financial
instruments:
− financial assets measured at amortised
cost;
− debt securities classified as financial assets
measured at fair value through other
comprehensive income;
− lease receivables;
− off-balance-sheet exposures from loan
commitments given and financial
guarantee contracts.
In essence IFRS 9 distinguishes between the
recognition of expected credit losses during a
12-month period, and lifetime expected credit
losses. SID Bank classifies financial assets
subject to impairment or provisions in
accordance with IFRS 9 into stages as follows:
– financial assets where there has not yet
been a significant increase in credit risk,
and for which impairments and/or
provisions for credit losses are measured
on the basis of expected credit losses over
a 12-month period are classified as stage
1. Interest income from these financial
instruments is calculated on the basis of
the gross carrying amount;
– financial assets where there has been a
significant increase in credit risk in the
period between initial recognition and the
date for which the Bank is estimating the
expected credit losses, and purchased or
originated credit-impaired financial assets
(POCI items) once they have become a
performing exposure, are classified as
stage 2. Allowances and provisions for
credit losses are measured on the basis of
expected credit losses over the entire
lifetime of the financial asset. Interest
income from these financial instruments is
calculated on the basis of the gross
carrying amount;
– financial assets where there has been a
default event on the part of the debtor, and
purchased or originated credit-impaired
financial assets (POCI items) while still a
non-performing exposure, are classified as
stage 3. Allowances and provisions for
credit losses are measured on the basis of
on expected credit losses over the entire
lifetime of the financial instrument.
Interest income from these financial
instruments is calculated on the basis of
the net carrying amount;
The Bank classifies a financial instrument as
stage 1 upon initial recognition, except in the
case of purchased or originated credit-impaired
financial asset (POCI item), which is classified
as stage 3. Upon subsequent measurement, the
Bank assesses whether there has been a
significant increase in the credit risk of the
financial instrument in the period between initial
recognition and the date for which the Bank is
estimating expected credit losses. If the credit
risk has not increased significantly, the financial
instrument remains classified as stage 1. If
there has been a significant increase in credit
risk but the financial instrument has not been
yet defined as a non-performing exposure, the
financial instrument is classified as stage 2. If a
purchased or originated credit-impaired
financial asset (POCI item), becomes a
performing exposure, it is classified as stage 2.
The requirements of IFRS 9 with regard to the
assessment of expected credit losses are
complex and require critical assessments by the
management, and estimates and assumptions
in the following areas in particular described in
detail below:
– assessment of a significant increase in
credit risk since initial recognition;
– inclusion of forward-looking information in
the assessment of expected credit losses.
Measurement of expected credit loss
The Bank must measure expected credit losses
of a financial instrument in a manner that takes
account of:
– an unbiased and probability-weighted
amount that is determined by evaluating a
range of possible outcomes;
– the time value of money; and

Annual report of SID Bank and the SID Bank Group 2018 | 111
– reasonable and supportable information
that is available without undue cost or
effort at the reporting date about past
events, current conditions and forecasts of
future economic conditions.
Definition of default
In determining the default of a debtor, SID Bank
applies the definition of a default of a debtor set
out in Article 178 of the CRR, namely:
− the debtor is past due more than 90 days
on any material credit obligation to SID
bank or any of its subsidiaries, and/or
− it is unlikely that the debtor will settle its
credit obligations to SID Bank or any of its
subsidiaries in full, without recourse by the
Bank to actions such as liquidation of
collateral or other procedures.
Significant increase in credit risk
SID Bank assesses on each reporting date
whether the credit risk inherent in a financial
instrument has increased significantly since
initial recognition. SID Bank assesses significant
increases in credit risk using reasonable and
supportable information at the level of the
individual financial instrument, taking into
account the following criteria:
− a change in credit rating with respect to
initial recognition;
− a change in weighted lifetime probability of
default with respect to initial recognition;
− the number of days past due at the level of
the financial asset is more than 30 days,
− the financial instrument becomes a
performing forborne exposure;
− the fair value is lower (by a specified
percentage) than the amortised cost of a
marketable debt security throughout a
specified period.
SID Bank does not take account of the
exemptions referred to in Article 5.5.10 of IFRS
9 with regard to the consideration of exposures
with low credit risk.
Inputs used to calculate expected credit losses
SID Bank calculates expected credit losses on
the basis of the following methodologies:
− methodology for stages 1 and 2,
− methodology for stage 3 (estimate of cash
flows),
− methodology for stage 3 (estimate of
collateral).
The inputs used to calculate expected credit
losses on the basis of the methodology for
stages 1 and 2 are as follows:
− probability of default (PD);
− loss given default (LGD);
− exposure at default (EAD);
− discount factor.
SID Bank defines the probability-of-default
curve (PD curve) and loss-given-default curve
(LGD curve) for individual homogeneous groups
defined internally on the basis of internally
developed methodologies.
Probability of default for two main
homogeneous PD groups: SID Bank determines
exposures to large enterprises in Slovenia and
exposures to SMEs in Slovenia on the basis of
modelled transition matrices. The input data in
the model consists of microdata from the AJPES
database for the period of 2006 to 2017. For the
purposes of determining the probability of
default for other main homogeneous PD groups,
SID Bank uses the data of the rating agency
Fitch Ratings, which is microdata to which SID
Bank applies regression methods in survival
analysis for modelling.
In the determination of loss given default, SID
Bank applies the adjusted parameters contained
in the Guidelines for calculating default rate and
loss rate issued by the Bank of Slovenia, where
forward-looking information is also taken into
account.
SID Bank determines exposure at default with
respect to the exposure of a financial
instrument on the date of calculation of
expected credit losses and the future
contractual cash flows from the financial
instruments. When calculating exposure at
default for off-balance-sheet exposures, SID
Bank takes account of the regulatory conversion
factors set out in the CRR.
The effective interest rate determined at initial
recognition or an approximation thereof is used
as a discount factor. In the case of a purchased
or originated credit-impaired financial asset
(POCI item), the credit-adjusted effective
interest rate determined at initial recognition is
used for discounting. In connection with
financial guarantee contracts and financial

112 | Annual report of SID Bank and the SID Bank Group 2018
instruments for which the effective interest rate
cannot be determined, SID Bank uses the
weighted interest rate of performing exposures
in its credit portfolio.
SID Bank calculates the expected credit losses
on financial instruments classified as stage 3 on
the basis of the methodology of cash flow
estimation or collateral estimation, taking into
account forward-looking information.
In the case of a purchased or originated credit-
impaired financial asset (POCI item) that is
defined as a non-performing exposure, SID
Bank calculates the expected credit losses on
the basis of the stage 3 methodologies. In the
case of a purchased or originated credit-
impaired financial asset (POCI item) that
becomes a performing exposure, SID Bank
calculates the expected credit losses on the
basis of the stage 2 methodology.
Forward-looking information
In the determination of probability of default,
SID Bank takes account of forward-looking
information on the basis of the correlation
between the default rate and a macroeconomic
indicator derived from GDP growth.
In the determination of loss given default, SID
Bank takes account of forward-looking
information concerning the parameter of
recovery rate for an unsecured exposure and
the parameter of haircut in the form of factors
of macroeconomic forecasts.
When determining the dependence of the
parameter of recovery rate for an unsecured
exposure on the state of the economy, SID Bank
examined the recovery rates for unsecured
exposures depending on the value of a
macroeconomic indicator derived from GDP
growth.
In order to calculate the factors of
macroeconomic forecasts for the haircut
parameter, SID Bank divided collateral into two
groups:
− real estate collateral (commercial and
residential real estate);
− other types of collateral (securities, movable
property and receivables).
In order to identify the dependence of real
estate values on the state of the economy, SID
Bank took account of the correlation between
the index of the Surveying and Mapping
Authority of the Republic of Slovenia and a
macroeconomic indicator derived from GDP
growth, and the correlation between the
collateral values from the Bank’s portfolio and a
macroeconomic indicator derived from GDP
growth for other types of collateral.
SID Bank takes account of standard factors of
macroeconomic forecasts to calculate expected
credit losses for the entire portfolio. The factors
of macroeconomic forecasts are taken into
account in the calculation of individual points on
the LGD curve for financial instruments
classified in stages 1 and 2, and in the
calculation of estimated repayments for
financial instruments classified in stage 3.
In the calculation of expected credit losses, SID
Bank takes into account three scenarios of
macroeconomic forecasts, and may take
account of more in the event of expected major
shocks. In general the scenarios comprise the
baseline, favourable and adverse projections of
major macroeconomic factors. The gap
between the favourable and adverse scenarios
reflects the internally evaluated risk in the
domestic and foreign macrofinancial
environments.
Annual GDP growth, %
Slovenia Euro area
2018 2019 2020 2021 2018 2019 2020 2021
Baseline scenario 4.4 3.7 3.4 3.1 2.0 1.8 1.7 1.7
Favourable scenario 4.5 4.2 3.8 3.5 2.2 2.0 2.0 1.9
Adverse scenario 4.2 -0.1 0.6 1.4 1.8 0.5 0.5 1.0

Annual report of SID Bank and the SID Bank Group 2018 | 113
Forborne loans
Forborne loans are loans arising as a result of
the debtor’s inability to repay a debt under the
originally agreed terms, either by modifying the
terms of the original contract or by signing a
new contract under which the contracting
parties agree the partial or total repayment of
the original debt.
In the forbearance of loans, financial difficulties
and the ability to repay a debt are assessed by
the Bank at the level of the debtor. All related
undertakings in the Group subject to
consolidation for accounting purposes are
classed as debtors. The debtor’s ability to repay
the debt is assessed by the Bank, in addition to
the possibility of the acceptance of other assets
or repayment via the liquidation of loan
collateral, primarily from the perspective of the
impact of the forbearance on the sufficiency of
cash flows from the debtor’s operations or from
the perspective of the possibility of controlling
those related undertakings that are capable of
generating cash flows from operations.
The Bank forbears financial loans vis-à-vis
debtors by undertaking one or more activities
that it would not normally decide to undertake
were the debtor in a normal economic and
financial position. The potential activities that
can be undertaken individually or in
combination are determined by an
implementing regulation issued by the Bank of
Slovenia, namely:
– an extension of the deadline or a deferral of the repayment of the receivables,
– a reduction in the interest rate and/or other
charges,
– a reduction in the amount of the receivables
as a result of contractually agreed debt forgiveness and/or ownership restructuring,
– conversion of the debt into an equity
investment in the debtor,
– acceptance of other assets (including the
liquidation of credit protection) for the partial or full repayment of the receivables; and
– other activities.
All differences resulting from forbearance are
recognised in profit or loss.
The Bank documents all decisions regarding the
forbearance of loans whose value exceeds EUR
100,000 with an appropriate analysis of
alternative solutions with their economic effects
(from the liquidation of collateral, the sale of
financial assets, the termination of the contract,
and any other activities).
The Bank provides analytical records for
forborne loans in its books of account, including
information about the method of forbearance
(via an annex or a new contract), the types of
forbearance, the dates of forbearance, and
effects that change the value of loans, including
the effects of write-offs and derecognition from
the statement of financial position, a change in
the probability of loss, a change in the debtor’s
credit rating and any changes in the
performance status of the forborne loans.
Hedge accounting
New developments in hedge accounting include
the abolition of the measurement of hedge
effectiveness, time value of options and forward
points, determination of the total exposure of
hedged items, the possibility of hedging
separate components of risk, and prohibition of
voluntary discontinuation of hedging
relationships.
Eligible hedging instruments are:
− derivatives measured at fair value through
profit or loss;
− non-derivative financial assets or non-
derivative financial liabilities measured at fair
value through profit or loss; and
− contracts with parties external to the Group
and/or the Bank.
Undertakings may use hedge accounting in
accordance with IAS 39 until the new standard
on macro-hedging is published by the IASB. SID
Bank uses this option.

114 | Annual report of SID Bank and the SID Bank Group 2018
Accounting policies for financial instruments in comparative statements
The Bank’s accounting policies changed
significantly with the introduction of IFRS 9 (effective as of 1 January 2018). In line with the
transitional provisions of IFRS 9, data for the previous year (2017) is not restated in
accordance with the new standard, therefore the on-balance sheet items in the financial
statements for the previous year are presented
in accordance with the accounting templates that were in force in the previous year.
IFRS 9 changed the categories for the
classification of financial assets that applied
under IAS 39. Under IFRS 9 financial assets held
for trading are classified as financial assets
mandatorily at fair value through profit or loss,
loans and receivables are classified as financial
assets measured at amortised cost, and
available-for-sale financial assets are classified
as financial assets measured at fair value
through other comprehensive income, unless
the business model of measurement at fair
value through profit or loss applies to them.
There were no changes in the classification and
measurement of financial liabilities.
Detailed accounting policies with regard to
financial instruments (classification,
measurement, recognition, derecognition,
principles used in valuation at fair value, gains
and losses, and impairments of financial assets)
in accordance with IAS 39 are stated in the 2017
annual report of SID Bank and the SID Bank
Group (available on the Bank’s website:
https://www.sid.si/sites/www.sid.si/files/docu
ments/sid_bank_annual report_2017.pdf) on
pages 108 to 112.
2.3.12 Derivatives and hedge accounting
The Bank makes use of the option to apply IAS
39 to hedge accounting, and does not yet apply
IFRS 9 to these instruments.
Derivatives are classified as financial
instruments held for trading and financial
instruments used for hedging. They are
recognised in the statement of financial position
as assets when the fair value is positive, and as
a liability when the fair value is negative.
SID Bank classifies derivatives such as foreign
exchange forward contracts that serve for
hedging against the currency risk that the Bank
faces in its daily operations on the financial
markets as financial instruments held for
trading.
Derivatives held for trading are initially
recognised at fair value in the statement of
financial position. After initial recognition they
are measured at fair value through profit or
loss, taking into account market prices.
Financial instruments held for hedging include
those derivatives that meet the conditions for
hedge accounting.
Hedge accounting means the booking of a
hedge relationship between the hedging
instrument (usually a derivative) and the
hedged item (an asset or liability, or a group of
assets or group of liabilities with similar risk
attributes) for the purpose of mutually
neutralising the effects of measuring the two
instruments in profit or loss, which would
otherwise not be recognised in profit or loss
simultaneously. In so doing the hedge
relationship should be formally noted and
appropriately documented.
When hedging is introduced, the Bank must
produce a formal document that describes the
relationship between the hedged item and the
hedging instrument, the purpose of risk
management, the valuation methodology and
the hedging strategy. In addition, it has to
document the assessment of the performance
of hedging instruments when faced with
exposure to changes in the fair value of the
hedged item. These are the conditions that
must be met for hedging relationships to be
eligible. The bank assesses hedging
performance at the conclusion of a transaction
and then during the hedging relationship, and
the hedging performance must fall within a
range of 80% to 125%. Hedge accounting is
discontinued when the hedging instrument
expires or is sold, and when the hedging no
longer qualifies for hedge accounting as
described above.

Annual report of SID Bank and the SID Bank Group 2018 | 115
Changes in the fair value of derivatives used as
a fair value hedge are recognised in profit or
loss in conjunction with the change in fair value
of the hedged item that is attributable to the
hedged risk. With an effective hedge, the fair
value changes of the hedging instrument and
associated hedged items are disclosed in profit
or loss under the item of changes in fair value
in hedge accounting.
2.3.13 Non-current assets held for sale
Non-current assets held for sale are assets
whose carrying amount will be settled primarily
through sale and not through further use. This
condition is satisfied only when a sale is highly
likely and the asset is available for immediate
sale in its current condition.
Non-current assets are allocated to the
aforementioned category when the owner has
expressed in writing the intention to sell the
asset, and a timetable of the sale process is
enclosed. The sale must be made within one
year of the asset being classified in this
category.
Non-current assets held for sale are measured
at the carrying amount before classification or
at the fair value less cost to sell, whichever is
the lower. The effects of the sale are disclosed
in profit or loss as net gains/losses on non-
current assets held for sale and the associated
liabilities.
2.3.14 Property, plant and equipment and intangible assets
Property, plant and equipment
Property, plant and equipment comprise real
estate, equipment and supplies.
Property, plant and equipment are valued at
original cost upon initial recognition. The
original cost comprises the purchase price,
import duties and non-refundable purchase
taxes, and the costs that can be directly
attributed to making the asset fit for its intended
use. Subsequently incurred costs of
maintenance and repairs in connection with an
item of property, plant and equipment are
disclosed as costs in profit or loss. Investments
in existing property, plant and equipment that
increase the future economic benefits increase
the value of the aforementioned assets.
After initial recognition a cost model is applied,
which means that items of property, plant and
equipment are disclosed at original cost, less
the accumulated depreciation and accumulated
impairment loss.
Land and buildings are treated separately, even
if acquired together.
Property, plant and equipment become subject
to depreciation once the asset is available for
use. Depreciation is charged on a straight-line
basis.
Depreciation rates in 2018 and 2017:
(%)
SID Bank and
SID Bank Group
Buildings and parts of
buildings 2 to 5
Computer equipment 25 to 50
Cars 12.5 to 20
Furniture 11 to 20
Other equipment 20 to 25
Supplies 20 to 100
Property, plant and equipment are impaired
when their carrying amount exceeds the
recoverable amount. The impairment loss is
recognised as an expense in profit or loss. The
existence of indications of impairment is
assessed at the end of each financial year, on
the reporting date. If such indications exist, the
recoverable amount of the asset is estimated as
follows:
– the fair value less cost to sell, or
– the value in use, whichever is the larger.
The carrying amount of an individual item of
property, plant and equipment is derecognised
upon its disposal, if future economic benefits
are no longer expected from its use or disposal.

116 | Annual report of SID Bank and the SID Bank Group 2018
Intangible assets with determinable useful life
This item includes investments in software and
other property rights. In 2018 and 2017,
software was subject to amortisation at a rate
of 20% to 25%, and other property rights at a
rate of 12% to 20%. Amortisation is charged on
a straight-line basis.
Intangible assets with determinable useful life
are impaired when their carrying amount
exceeds the recoverable amount. The
impairment loss is recognised as an expense in
profit or loss. The existence of indications of
impairment is assessed at the end of each
financial year, on the reporting date. If such
indications exist, the recoverable amount of the
asset is estimated as follows:
– the fair value less cost to sell, or
– the value in use, whichever is the larger.
After initial recognition, intangible assets with
determinable useful life are disclosed using the
cost model, at the original cost less the
accumulated amortisation and any accumulated
impairment losses.
Amortisation ceases either on the day when the
asset is classified as available-for-sale, or on the
day when it is derecognised, whichever is the
earlier.
Goodwill
Goodwill arises in the acquisition of investments
in subsidiaries, when the original cost exceeds
the fair value.
The Group examines annually whether there are
any grounds for the impairment of goodwill.
Should the recoverable amount be lower than
the carrying amount, impairment is recognised.
The recoverable amount is the value in use.
2.3.15 Long-term investments in subsidiaries and joint ventures
Interests in subsidiaries and joint ventures are
recognised in separate financial statements at
original cost (cost method), and dividends are
recognised in profit or loss when the right to
receive the dividend arises.
When there is evidence of the need for the
impairment of an investment in a subsidiary or
joint venture, the Bank assesses the
recoverable amount for each investment
separately. In the case of investments in
subsidiaries where there is no goodwill at the
time of acquisition, an assessment is made of
whether there is any indication of impairment
on the reporting date, and if there is such
indication, an impairment test is conducted. In
the case of investments in a joint venture, an
impairment test is carried out on the basis of a
goodwill impairment test of cash-generating
units that includes goodwill. In the case of
consolidated financial statements, a goodwill
impairment test is carried out at each reporting
date for cash-generating units.
Investment impairment tests are made in
accordance with the commercial expectations of
the individual investment.
The basis for the test is the valuation of the
interest. The input data for valuation comprises
commercial expectations supported by the
individual undertaking’s business plan and the
impact that SID Bank has on the individual
undertaking’s performance. The valuation
model is based on the measurement of
discounted cash flows. The discount factor is
calculated in accordance with the risks to which
the individual interest is exposed.
2.3.16 Other assets
Receivables arising from insurance contracts,
prepayments, tax assets and advances are
included in other assets.
Other assets are recognised in the amounts
arising from the relevant documents, on the
assumption that they will be recovered. The fair
value, i.e. recoverable amount, is examined for
other assets in various ways on the reporting
date. If there is objective evidence of other
assets disclosed at amortised cost having
undergone an impairment loss, it is disclosed as

Annual report of SID Bank and the SID Bank Group 2018 | 117
impairments in connection with other assets;
the carrying amount of the other assets is
reduced by the conversion in the value
adjustment subsidiary account.
2.3.17 Provisions for liabilities and costs
Provisions are created for contingent losses in
connection with risks inherent in off-balance-
sheet liabilities (approved but unused loans and
credit lines, guarantees), for termination
benefits at retirement and for jubilee benefits,
and for liabilities from insurance contracts.
Provisions for liabilities and costs are recognised
when there is a present commitment (legal or
indirect) as a result of a past event, and it is
likely that in the settlement of the commitment
there will be an outflow of resources yielding
economic benefits, and a reliable estimate can
be made of the commitment. Provisions are
reversed when excessive provisions are
established or when contingent losses in
connection with risks are reduced.
SID Bank recognises provisions for off-balance-
sheet liabilities on the basis of the procedures
cited in section 2.3.11 under the title
Impairments of financial assets and provisions
Provisions for commitments under insurance
contracts arise from credit insurance held by the
subsidiary SID-PKZ. Insurance technical
provisions include unearned premium,
provisions for claims outstanding, provisions for
bonuses and rebates. Provisions for unearned
premium comprise the unearned portion of
premium written. They are calculated for each
account separately (i.e. the invoice issued by
the policyholder to its customer). The
calculation of unearned premium takes account
of the estimated time distribution of the
probability of a loss event occurring. Provisions
for claims outstanding are created in the
amount of the estimated liabilities that the
insurer is obliged to pay on the basis of
insurance contracts in respect of which an
insurance claim will occur before the end of the
accounting period, irrespective of whether the
insurance claim has already been reported,
including all costs borne by the insurer on the
basis of the contracts. Provisions for bonuses
are created for insurance contracts that include
a clause on the repayment of part of the
premium. They are calculated across individual
insurance contracts with regard to earned
premium in an individual contract year and with
regard to the estimated claims ratio prior to the
reporting date.
2.3.18 Other liabilities
Other liabilities include liabilities from insurance
contracts, accruals
and deferred income, tax liabilities and
advances received.
2.3.19 Shareholder equity
Shareholder equity consists of share capital,
share premium, profit reserves, accumulated
other comprehensive income, the equity
adjustment (shares held in treasury) and net
profit for the financial year.
Share capital is disclosed in the nominal value,
and has been paid up by the owners.
Share premium may be used in accordance with
the law to cover losses and increase capital.
Profit reserves are recognised when created by
the body that compiles the annual report or by
a resolution of the competent body, and are
used in accordance with the articles of
association and the law.

118 | Annual report of SID Bank and the SID Bank Group 2018
Reserves under the articles of association may
be used to cover net loss during the financial
year, to cover net losses brought forward, to
increase the share capital, to create reserves for
treasury shares and to cover major damage
incurred during operations or extraordinary
business events. Other profit reserves are
intended to strengthen capital adequacy.
Accumulated other comprehensive income
includes revaluation in association with
investments in debt financial instruments
measured through other comprehensive
income.
Own shares held in treasury are disclosed as a
deduction to equity in the amount of the
consideration therefor.
2.3.20 Contingent liabilities and financial commitments given
Financial and service guarantees, approved
undrawn loans and credit lines and unpaid
capital are disclosed under assumed financial
commitments.
Financial commitments given for sureties
comprise irrevocable commitments for when a
customer fails to meet its liabilities to third
parties.
The risks related to contingent liabilities and
financial commitments given are assessed on
the basis of current accounting policy and
internal regulations in connection with risk
management described in section 2.3.11
Impairments of financial assets and provisions.
Any increase in liabilities dependent on risk is
reflected in the item of provisions.
2.3.21 Operations for the account of the Republic of Slovenia
Operations on behalf of and for the account of the Republic of Slovenia
The insurance operations that SID Bank
provides on behalf of and for the account of the
Republic of Slovenia are disclosed under
separate items, as determined by the Bank of
Slovenia for the administration of transactions
under authorisation. The assets and liabilities
relating to these transactions are not included
in the Bank’s statement of financial position.
Operations on its own behalf and for the account of the Republic of Slovenia
The operations of the Fund of Funds that SID Bank manages on its own behalf and for the
account of the Republic of Slovenia are recorded as separate items. The assets and liabilities
relating to the Fund of Funds are not included
in the Bank’s statement of financial position.
Explanations of the operations under Republic
of Slovenia authorisation are given in the
section of the business report entitled
Operations under Republic of Slovenia
authorisation.
2.3.22 Taxes
Corporate income tax is accounted at the
undertakings in the SID Bank Group in
accordance with local legislation.
Deferred taxes are accounted using the
statement of financial position liability method
for all temporary differences arising between
the tax values of assets and liabilities and their
carrying amounts. Deferred taxes are calculated
using the tax rates that are applicable as at the
reporting date, or that are expected to apply
when the deferred tax asset is realised or the
deferred tax liability is settled.
Deferred tax assets are recognised for all
deductible temporary differences if it is likely
that an available taxable profit will arise against
Annual report of SID Bank and the SID Bank Group 2018 | 119
which it will be possible to apply deductible
temporary differences.
Deferred taxes in connection with the valuation
of financial instruments measured at fair value
through other comprehensive income are
disclosed directly in other comprehensive
income.
2.3.23 Employee benefits
Employee benefits include current and non-
current employee benefits.
Current employee benefit commitments are
recognised in an undiscounted amount, and are
disclosed as expenses when the work of the
employee is performed in respect of the specific
current benefit.
Non-current employee benefits include
provisions for termination benefits at retirement
and jubilee benefits.
Legislation stipulates that employees generally
retire after 40 years of service, and are then
entitled to a one-off termination benefit at
retirement, provided that the stipulated
conditions are met. Employees are also entitled
to jubilee benefits in accordance with the
collective agreements of individual undertakings
in the Group. The aforementioned
commitments and all corresponding
gains/losses are included in profit or loss,
except actuarial gains and losses from
termination benefits, which are recognised in
the statement of comprehensive income.
The requisite provisions on this basis are
calculated in the amount of the present value of
future expenses, having regard for the specific
assumptions. The major assumptions are a
discount factor of 40% of the weighted average
interest rate on government securities
published by the Ministry of Finance for the
purposes of pension insurance, the headcount
on the final day of the year, and the average
wage of employees in the final quarter.
Provisions of this type are calculated every year
except in the Prvi Faktor Group, where they are
calculated for a three-year period.
2.3.24 Calculation of net earnings per share
Net earnings per share are calculated as the
ratio of the net profit disclosed by the Bank in
the statement of profit or loss to the number of
shares making up its share capital. Own shares
held in treasury are not included in the
calculation.
2.3.25 Reporting by operating segment
Allocation and disclosure by operating segment
is carried out on the basis of the attributes of
individual business activities within the SID
Bank Group. Under IFRS 8, the SID Bank Group
has two operating segments, namely banking
and insurance of receivables.
The banking segment constitutes a single
operating segment, as the operations at the
Bank do not vary significantly in terms of risk or
return.

120 | Annual report of SID Bank and the SID Bank Group 2018
2.3.26 New standards and interpretations in the reporting period and
issued/approved standards and interpretations not yet effective and applied
Initial application of the latest amendments to
existing standards and interpretations that are
effective as of 1 January 2018 and were issued
by the International Accounting Standards
Board (IASB) and adopted by the EU:
- IFRS 15 Revenues from Contracts with
Customers, as adopted by the EU on 22
September 2016 and effective for annual
periods beginning on or after 1 January
2018. The standard sets out how and when
revenue is recognised, but does not affect
the recognition of revenue in connection
with financial instruments within the
framework of IAS 39 or IFRS 9.
- IFRS 15 (amendment) Clarifications to
revenues from contracts with customers, as
adopted by the EU on 31 October 2017 and
effective for annual periods beginning on or
after 1 January 2018. The amendment
clarifies how to identify the performance
obligation in the contract, how to determine
whether an undertaking is the customer, and
whether revenue from an issued licence is
recognised currently or over a longer period.
In addition to clarifications, the amendment
includes two expedients to reduce the cost
and complexity for undertakings applying
the new standard for the first time.
- IFRIC 22 Foreign Currency Transactions and Advance Consideration, as adopted by the
EU on 28 March 2018 and effective for
annual periods beginning on or after 1 January 2018. The interpretation addresses
the use of exchange rates in transactions that include the receipt or payment of
advance consideration in a foreign currency.
- IFRS 2 (amendment) Classification and
measurement of share-based payment
transactions, as adopted by the EU on 26
February 2018 and effective for annual
periods beginning on or after 1 January
2018. The amendment clarifies how to treat
certain types of share-based payment
transactions.
- IFRS 4 (amendment) Applying IFRS 9
Financial Instruments with IFRS 4 Insurance
Contracts, adopted by the EU on 3
November 2017 and effective for annual
periods beginning on or after 1 January
2018. The amendment addresses issues
deriving from the application of the new
standard on financial instruments (IFRS 9)
before the introduction of the new
replacement standard (IFRS 4).
- IAS 40 (amendment) Transfers of
investment property, as adopted by the EU
on 14 March 2018 and effective for annual
periods beginning on or after 1 January
2018. The amendment clarifies the
requirements during transfer to or from
investment property.
- Annual Improvements to the IFRS 2014-
2016, adopted by the EU on 7 February 2018
and effective for annual periods beginning
on or after 1 January 2018. The
improvements consist of minor changes that
clarify, revise or delete excessive text in
standards. The improvements effective as of
1 January 2018 relate to two standards:
IFRS 1 First-Time Adoption of International
Financial Reporting Standards and IAS 28
Investments in Associates and Joint
Ventures.
- IFRS 9 Financial Instruments, adopted by
the EU on 22 November 2016 and effective
for annual periods beginning on or after 1
January 2018.
With the exception of the introduction of IFRS
9, the adoption of these new standards,
amendments to existing standards and
interpretations did not lead to any material
changes in the financial statements of SID Bank
or the SID Bank Group. The Bank primarily
generates income from financial instruments
that fall under the IFRS 9 framework, and thus
the introduction of IFRS 15 did not have a
significant impact on its financial statements.
The impact of the introduction of IFRS 9 is
disclosed in detail in section 2.3.27 Disclosures
upon the introduction of IFRS 9.
On the day that these financial statements were
approved, the following new standards and
amendments to existing standards had been
issued by the IASB and adopted by the EU, but
were not yet effective:
- IFRS 16 Leases, approved by the EU on 31
October 2017 and effective for annual
periods beginning on or after 1 January
2019. The standard regulates the obligation
to recognise, measure, present and disclose
leases, and replaces the existing IAS 17

Annual report of SID Bank and the SID Bank Group 2018 | 121
Leases. The new accounting model requires
lessees to recognise all assets and liabilities
relating to lease agreements. This means
that the distinction between finance leases
and operating leases (as in the predecessor
IAS 17) is no longer applicable for the lessee.
IFRS 16’s approach to lessor accounting is
substantially unchanged from its
predecessor, IAS 17.
- IFRIC 23 Uncertainty over Income Tax
Treatments, as adopted by the EU on 23
October 2018 and effective for annual periods beginning on or after 1 January
2019. The interpretation clarifies the accounting of income taxes when it is
perhaps uncertain how tax legislation should be applied to a specific transaction or
circumstance, and whether a tax authority
will accept an undertaking’s tax treatment.
- IFRS 9 (amendment) Prepayment features
with negative compensation, as adopted by
the EU on 22 March 2018 and effective for
annual periods beginning on or after 1
January 2019. The amendment allows an
undertaking to measure financial assets with
prepayment features that permit a
contracting party to receive or demand the
payment of reasonable compensation for
early contract termination (known as
“negative compensation” for the holder of a
financial asset) at amortised cost or at fair
value through other comprehensive income.
New standards and amendments to existing
standards issued by the IASB but not yet
adopted by the EU:
- IAS 28 (amendment) Long-term interests in
associates and joint ventures, effective for
annual periods beginning on or after 1
January 2019. The amendment clarifies that
IFRS 9 applies to long-term interests in an
associate or joint venture that form part of
the “net investment” in the associate or joint
venture but to which the equity method is
not applied.
- Annual improvements 2015-2017. The
improvements are effective for annual
periods beginning on or after 1 January
2019. The improvements consist of
substantive amendments and clarifications,
and relate to IFRS 3, IFRS 11, IFRS 12 and
IAS 23.
- IFRS 14 Regulatory Deferral Accounts is a
non-mandatory standard, and is effective for
annual periods beginning on or after 1
January 2016. The European Commission
opted not to begin proceedings to approve
this interim standard, but will wait until the publication of the final version. The standard
allows entities adopting the IFRS for the first time to largely continue accounting
regulatory deferral accounts in line with
previous generally accepted accounting principles.
- IFRS 17 Insurance Contracts. The standard
is effective for annual periods beginning on
or after 1 January 2021. It provides a
comprehensive framework for the
measurement and presentation of all
insurance contracts.
- Amendments to IFRS 10 and IAS 28. The
IASB has indefinitely deferred the effective
date. The amendments address conflicts
between the requirements of IFRS 10
Consolidated Financial Statements and IAS
28 Investments in Associates and Joint
Ventures.
- IAS 19 (amendment) Plan amendment,
curtailment or settlements, effective for
annual periods beginning on or after 1
January 2019. The amendment defines how
to determine current costs for the remainder
of the reporting period after a change in a
pension plan.
- IAS 1 and IAS 8 (amendments) Definition of
material, effective for annual periods
beginning on or after 1 January 2020. The
amendment aims to make it easier for
undertakings to assess materiality, and to
decide on the inclusion of information in
their financial statements.
- IFRS 3 (amendment) Definition of a
business, effective for annual periods
beginning on or after 1 January 2020. The
amendment aims to improve the definition
of a business. It should help undertakings in
determining whether they have acquired a
business or a group of assets. The distinction
is material, because an acquirer recognises
goodwill when acquiring a business.
- Revisions to the Conceptual Framework for
Financial Reporting, which apply to annual
periods beginning on or after 1 January
2020.
The Group does not expect the introduction of
these new standards, amendments and
interpretations to have a material impact on its
financial statements during initial application.
The Group decided not to apply any new

122 | Annual report of SID Bank and the SID Bank Group 2018
standards or amendments to the existing ones
before the date of mandatory application.
The Group assesses that the use of hedge
accounting in connection with the portfolio of
financial assets and liabilities in accordance with
the requirements of IFRS 9 Financial
Instruments: Recognition and Measurement
would not have had a material impact on its
financial statements, were it to have been used
on the reporting date.
The Bank also has no lease agreements that
need to be recognised within the framework of
on-balance-sheet items in accordance with IFRS
16.
2.3.27 Disclosures upon the introduction of IFRS 9
IFRS 9 is a new accounting standard issued by
the International Accounting Standards Board
(IASB) in July 2014, and replaces IAS 39. The
European Commission approved IFRS 9 via
Regulation (EU) 2016/2067 of 22 November
2016 amending Regulation (EC) No 1126/2008
adopting certain international accounting
standards in accordance with Regulation (EC)
No 1606/2002 of the European Parliament and
of the Council, and it is effective as of 1 January
2018. The IASB published amendments to IFRS
9 Prepayment features with negative
compensation in October 2017. The
amendments are effective for annual periods
beginning on or after 1 January 2019. Earlier
application is allowed.
SID Bank first applied IFRS 9 on 1 January
2018, and did not make use of the possibility of
the earlier application of the aforementioned
amendments to the standard effective for
annual periods beginning on or after 1 January
2019. Given the option of later application, the
subsidiary SID-PKZ did not transition to IFRS 9,
and provides financial statement data in
accordance with the new standard solely for the
purposes of consolidation. Given that the
calculated effects are immaterial (less than EUR
20 thousand), it also does not provide for the
calculation of impairments in accordance with
IFRS 9 for purposes of consolidation. The
effects of the transition at the subsidiary are
immaterial (approximately EUR 17 thousand),
and therefore the effects of the transition are
disclosed below for SID Bank alone.
In line with the transitional provisions of IFRS 9,
data for the previous year is not restated in
accordance with the new standard, therefore
the on-balance sheet items in the financial
statements for the previous year are presented
in accordance with the accounting templates
that were in force in the previous year.
Until the new standard on macro-hedging is
published by the IASB, undertakings may apply
hedge accounting in accordance with IAS 39.
SID Bank uses this option. The cumulative
effect of the introduction of IFRS 9 on retained
earnings from the transition to IFRS 9 for SID
Bank as at 1 January 2018 amounted to EUR
9,557 thousand, and comprises:
– a decline of EUR 5,595 thousand from the
effect of classification and measurement,
– an increase of EUR 50,495 thousand from
the effect of impairments,
– a decline of EUR 2,239 thousand from the
effect of current and deferred taxes,
– a decline of EUR 33,104 thousand in total
positive effects resulting from the transfer of
the effect to liabilities to the MEDT arising
from loan funds (SID Bank’s exposures from
loan funds are classified as on-balance-sheet
items. Nevertheless, profit or loss of loan
funds is determined separately, and a
potential loss on the part of loan funds is
covered from invested MEDT funds as a
decline in liabilities to the MEDT. On this
basis, a subsequent profit is first allocated to
the MEDT as an increase in liabilities to the
MEDT, so that the previously reduced
liability resulting from the loss of the loan
fund increases again.).Since part of the
positive effect of the transition to IFRS 9 in
the amount of EUR 33,104 thousand related
to loans from loan funds, liabilities to the
MEDT were increased by this amount, and
there was no effect on retained earnings
from this part of the effect of the transition.

Annual report of SID Bank and the SID Bank Group 2018 | 123
Regulatory capital (taking into account the
effects as if audited) increases by EUR 9,525
thousand. In the wake of the increase in risk-
weighted assets by approximately EUR 35,957
thousand, and under the calculation according
to the CRR as applicable on 31 December 2017,
the total capital ratio declines by approximately
by 0.3 percentage points.
The Bank did not reclassify any financial
liabilities during the transition to IFRS 9. Neither
does the Bank recognise any financial liabilities
at fair value, with the exception of hedging
derivatives. The transition to IFRS 9 thus had
no effect on financial liabilities, and the effects
of the transition are therefore disclosed below
for financial assets alone.
Classification and measurement
SID Bank did not reclassify any financial assets
upon the transition to IFRS 9, except loans
which owing to their failure to pass the SPPI test
had to be reclassified as mandatorily at fair
value through profit or loss. All debt securities
that in accordance with IAS 39 were classified
as available-for-sale were classified as
measured at fair value through other
comprehensive income. For equities that were
also classified as available-for-sale in
accordance with IAS 39, the Bank exercised the
option of measurement at fair value through
other comprehensive income, such that the
entire securities portfolio remained valued at
fair value through other comprehensive income.
An overview of the changes to the
measurement categories and the carrying
amounts of financial assets as at 31 December
2017 in accordance with IAS 39 and as at 1
January 2018 in accordance with IFRS 9 is given
in the following table.
Overview of changes in measurement categories and changes in carrying amounts of
financial assets
(EUR thousand)
IAS 39
IFRS 9
Original carrying amount
under
IAS 39
New carrying amount
under IFRS 9 Comment Classification
Measurement category Classification
Measurement category
Cash, cash balances at
central banks and other demand deposits at banks
Loans and
receivables Amortised cost
Financial assets
measured at amortised cost
Amortised cost
71,071 71,071
1
Debt instruments Available-for-sale financial assets
Fair value through
other comprehensive
income
Financial assets measured at fair
value through other
comprehensive income
Fair value through
other comprehensive
income 714,287 714,287
2
Equities Available-for-sale
financial assets
Fair value through other
comprehensive income
Financial assets measured at fair value through
other comprehensive
income (option)
Fair value through other
comprehensive income
16,234 16,234
Loans and
advances to banks
Loans and
receivables Amortised cost
Financial assets
measured at amortised cost
Amortised cost 1,032,179 1,039,135
3 Loans and
advances to customers
Loans and
receivables Amortised cost
Financial assets measured at amortised cost
Amortised cost 579,212 613,808
Non-trading financial assets
mandatorily at fair value through
profit or loss
Fair value through profit or loss
18,528 18,019
Other financial
assets
Loans and
receivables Amortised cost
Financial assets
measured at amortised cost
Amortised cost 1,553 1,553
4

124 | Annual report of SID Bank and the SID Bank Group 2018
Comments:
1. The Bank also calculates expected credit
losses for balances at the central bank and sight deposits at banks, but the impairment
amounts established are immaterial, so the impairments were not recognised.
2. All securities remained measured at fair value through other comprehensive income,
and therefore their values did not change.
3. The on-balance sheet item of loans and advances under IAS 39 is reclassified under
IFRS 9
in part to the category of financial assets at
amortised cost and in part to financial assets
mandatorily at fair value through profit or loss. The differences in the carrying amounts
arise from the change in impairments for loans at amortised cost and from valuation
at fair value for loans at fair value.
4. Under both standards other financial assets
are measured at amortised cost, and expected credit losses are established for
them, but due to the immateriality of the amounts the impairments were not
recognised.
Effects of reclassification and revaluation of financial assets
(EUR thousand)
IAS 39
31 Dec 2017
Reclassification Remeasurement
IFRS 9
1 Jan 2018
Cash, cash balances at central banks and other demand deposits
at banks 71,071 0 0 71,071
Financial assets measured at fair value through other comprehensive income n.a. 714,287 0 714,287
Debt instruments n.a. 714,287 0 714,287
Of which from available-for-sale financial assets 714,287
Financial assets measured at fair value through other comprehensive income (option) n.a. 16,234 0 16,234
Equities n.a. 16,234 0 16,234
Of which from available-for-sale financial assets 16,234
Available-for-sale financial assets 730,521 (730,521) 0 n.a.
Debt instruments 714,287 (714,287) 0 n.a.
Of which transfer to financial assets measured at fair value through other comprehensive income (714,287)
Equities 16,234 (16,234) 0 n.a.
Of which transfer to financial assets measured at fair value through other comprehensive income (16,234)
Non-trading financial assets mandatorily at fair value through profit or loss n.a. 18,528 (509) 18,019
Loans and advances to customers n.a. 18,528 (509) 18,019
Of which transfer from loans and receivables 18,528
Financial assets measured at amortised cost n.a. 1,612,944 41,552 1,654,496
Loans and advances to banks n.a. 1,032,179 6,956 1,039,135
Of which transfer from loans and receivables 1,032,179
Loans and advances to customers n.a. 579,212 34,596 613,808
Of which transfer from loans and receivables 579,212
Other financial assets n.a. 1,553 0 1,553
Of which transfer from loans and receivables 1,553
Loans and receivables 1,631,472 (1,631,472) 0 n.a.
Loans and advances to banks 1,032,179 (1,032,179) 0 n.a.
Of which transfer to financial assets measured at amortised
cost (1,032,179)
Loans and advances to customers 597,740 (597,740) 0 n.a.
Of which transfer to non-trading financial assets mandatorily at fair value through profit or loss (18,528)
Of which transfer to financial assets measured at amortised
cost (579,212)
Other financial assets 1,553 (1,553) 0 n.a.
Of which transfer to financial assets measured at amortised cost (1,553)
Total 2,433,064 0 41,043 2,474,107

Annual report of SID Bank and the SID Bank Group 2018 | 125
Impairments and provisions
Effect of transition to IFRS 9 on impairments and provisions
(EUR thousand)
Impairments under IAS 39
and provisions
under IFRS 37 as at 31 Dec
2017
Impairments
used in transition to
fair value
Impairments
used in transition to
POCI
Change in impairments
and provisions
Impairments
and provisions under IFRS 9
1 Jan 2018
Available-for-sale financial assets (under IAS 39) / Financial assets measured at fair value through other comprehensive
income (under IFRS 9) 2,768 0 0 (1,724) 1,044
Loans and receivables under IAS 39 / Financial assets at amortised cost (IFRS 9) 97,173 0 (29,578) (44,294) 23,301
Loans and receivables under IAS 39 / Financial assets at fair value through profit or loss (IFRS 9) 45,837 (45,837) 0 0 0
Total impairments 145,778 (45,837) (29,578) (46,018) 24,345
Provisions for off-balance-sheet liabilities 2,946 0 0 (2,134) 812
Total impairments and provisions 148,724 (45,837) (29,578) (48,152) 25,157
The Bank reduced impairments and provisions
during the transition to IFRS 9. The total effect
on securities that in accordance with IAS 39 were classified as available-for-sale financial
assets and under IFRS 9 are classified as financial assets measured at fair value through
other comprehensive income amounted to EUR
1,724 thousand. Impairments in the amount of EUR 1,044 thousand were created for debt
securities, while under IAS 39 the Bank had created a permanent impairment of equities in
the amount of EUR 2,768 thousand, which it reversed upon the transition to IFRS 9.
The positive effect on financial assets measured
at amortised cost in the total amount of EUR
119,709 thousand consists of three parts:
– for loans that remained measured at fair
value and were not classified as POCI items upon transition, EUR 44,294 thousand in
impairments was reversed;
– for loans that were classified as POCI items upon transition, EUR 29,578 thousand in
allowances were used for the recognition of
those loans at net value with a credit-adjusted effective interest rate;
– for loans that did not pass the SPPI test upon
transition and under IFRS 9 are measured at
fair value, EUR 45,837 thousand of impairments was used for the valuation of those loans at fair value.
Corporate income tax assets and liabilities
(EUR thousand)
IAS 39 31 Dec 2017
Effect IFRS 9
IFRS 9 1 Jan 2018
Corporate income tax assets 4,086 95 4,181
Corporate income tax liabilities 447 2,006 2,453
Upon the transition to IFRS 9, gross retained
earnings increased by EUR 11,796 thousand, on
which corporate income tax in the amount of
EUR 2,334 thousand was charged, while a
deferred tax asset in the amount of EUR 95
thousand was created. In addition, the gross
effect of the transition on other comprehensive
income was negative in the amount of EUR
1,723 thousand, on which a deferred tax asset
in the amount of EUR 327 thousand was
created. The net effect on retained earnings
was thus positive in the amount of EUR 9,557
thousand, while the net effect on accumulated
other comprehensive income was negative in
the amount of EUR 1,395 thousand.

126 | Annual report of SID Bank and the SID Bank Group 2018
2.3.28 Comparative data
Compared with the financial statements for the
year ending 31 December 2017, the templates
for the statement of financial position and
statement of profit or loss are different, owing
to adjustments made during the introduction of
IFRS 9 and changes prescribed by the Bank of
Slovenia. In accordance with the transition to
IFRS 9, the Bank opted not to restate
comparative data in the financial statements for
2018, for which reason the presentation of the
financial statements is a combination of
classification and measurement categories in
accordance with IAS 39 (for stocks as at 31
December 2017 and effects recognised in 2017)
and IFRS 9 (for stocks as at 31 December 2018
and effects recognised in 2018).
As a result of the introduction of IFRS 9, there
was also a change in IAS 1, which requires the
separate disclosure of “interest income
calculated using the effective interest rate
method”, owing to which the comparative data
in the statement of profit or loss has been
adjusted.
The changes in the financial statements
prescribed by the Bank of Slovenia relate to the
presentation of effects deriving from
investments in subsidiaries, associates and joint
ventures in the statement of profit or loss. SID
Bank also adjusted the presentation of
comparative data to these changes.
In the statement of profit or loss for the year
ending 31 December 2017, the item of net
gains/(losses) on investments in subsidiaries,
associates and joint ventures for SID Bank
includes dividends of subsidiaries, associates
and joint ventures. In the statement of profit or
loss for the year ending 31 December 2018,
dividends of subsidiaries, associates and joint
ventures are included in the item of dividend
income.
SID Bank SID Bank Group
2017 before adjustment Adjustment
2017 new disclosure
2017 before adjustment Adjustment
2017 new disclosure
Dividend income 87 3,353 3,440 87 0 87
Net gains/(losses) on investments in subsidiaries, associates and joint ventures 3,353 (3,353) 0 0 0 0
In 2018 the Bank revised an error from the
erroneous application of accounting policies
with regard to the recognition of events related
to lending from loan funds. A first loss clause
was contractually agreed with the MEDT for all
funds, i.e. any loss on the part of the funds is
first covered by the priority participation of the
MEDT in loan fund risks by reducing the
liabilities to the MEDT and recognising any gains
on financial assets and liabilities measured at
fair value through profit or loss (until 2017).
In 2018 the Bank recognised the effect under
the item of net gains/(losses) on financial assets
and liabilities not measured at fair value through
profit or loss, or more precisely under the item
of net gains/(losses) on financial liabilities
measured at amortised cost. Where necessary,
the comparative data has been restated to
ensure comparability with the current period.

Annual report of SID Bank and the SID Bank Group 2018 | 127
SID Bank and SID Bank Group
2017 before adjustment Adjustment 2017 new disclosure
Realised gains 7,830 (7,830) 0
Realised losses (12,669) 12,669 0
Gains/(losses) on financial assets and liabilities measured at fair value through profit or loss (4,839) 4,839 0
Available-for-sale financial assets (under IAS 39) 3,184 0 3,184
Gains 3,419 0 3,419
Losses (235) 0 (235)
Loans and advances (under IAS 39) 282 0 282
Gains 282 0 282
Losses 0 0 0
Financial liabilities measured at amortised cost (150) (4,839) (4,989)
Gains 0 7,830 7,830
Losses (150) (12,669) (12,819)
Net gains/(losses) on financial assets and liabilities not measured at fair value through profit or loss 3,316 (4,839) (1,523)
2.4 Notes to the statement of financial position
2.4.1 Cash and cash equivalents
Cash, cash balances at central banks and other demand deposits at banks
SID Bank SID Bank Group
31 Dec 2018 31 Dec 2017 31 Dec 2018 31 Dec 2017
Settlement account 120,871 70,778 120,871 70,778
Sight deposits at banks 313 293 313 5,172
Total 121,184 71,071 121,184 75,950
2.4.2 Non-trading financial assets mandatorily at fair value through profit or loss
SID Bank and SID Bank Group
31 Dec 2018 31 Dec 2017
Loans and other financial assets 15,667 n.a.
To customers 15,667 n.a.
Total 15,667 n.a.

128 | Annual report of SID Bank and the SID Bank Group 2018
2.4.3 Financial assets measured at fair value through other comprehensive
income
Breakdown by type of financial asset measured at fair value through other comprehensive income
SID Bank and SID Bank Group
31 Dec 2018 31 Dec 2017
Bonds 628,554 n.a.
Government 417,409 n.a.
Slovenia 255,609 n.a.
Other countries 161,800 n.a.
Banks 111,017 n.a.
Non-financial corporations 72,460 n.a.
Financial institutions 27,668 n.a.
Treasury bills 22,317 n.a.
Debt securities, total 650,871 n.a.
Shares and participating interests at fair value 11,817 n.a.
Equities, total 11,817 n.a.
Total 662,688 n.a.
Quoted 635,882 n.a.
Unquoted 26,806 n.a.
Total 662,688 n.a.
Impairments for credit losses (255) n.a.
When IFRS 9 became effective, the Bank
transferred the entire portfolio of securities that
in accordance with IAS 39 were classified as
available-for-sale financial assets as at 31
December 2017 to financial assets measured at
fair value through other comprehensive income.
The table illustrates the carrying amount of
financial assets measured at fair value through
other comprehensive income by type of
instrument for SID Bank and the SID Bank
Group as at 31 December 2018. In its securities
portfolio management, the SID Bank Group
follows the principles of safety, liquidity and
profitability in order to ensure liquidity and ALM.
To this end, the securities portfolio contains a
large proportion of marketable government
securities and other highly liquid debt securities.
Marketable quoted securities accounted for
95.9% of all financial assets measured at fair
value through other comprehensive income at
SID Bank as at the end of 2018. Debt securities
accounted for 98.2% of the portfolio of
securities measured at fair value through other
comprehensive income at SID Bank and the SID
Bank Group, while shares and participating
interests accounted for less than 2%.
Government debt securities (bonds and
treasury bills) accounted for 66.4% of all
financial assets measured at fair value through
other comprehensive income at SID Bank as at
the end of 2018. The standard institutional
sector classification of the bond issuer is taken
into account in the breakdown of the bond
portfolio by the issuer type in the above table.
Impairments for credit losses on debt securities
measured at fair value through other
comprehensive income amounted to EUR 255
thousand as at 31 December 2018.
The total carrying amount of pledged financial
assets measured at fair value through other
comprehensive income amounted to EUR
312,055 thousand at the end of the year. The
securities were pledged as collateral for
targeted longer-term refinancing operations
(TLTROs) from the Bank of Slovenia or the ECB.

Annual report of SID Bank and the SID Bank Group 2018 | 129
Changes in financial assets measured at fair value through other comprehensive income
SID Bank SID Bank Group
2018 2017 2018 2017
Balance as at 1 Jan 730,521 n.a. 750,004 n.a.
Recognition of new financial assets 164,093 n.a. 164,093 n.a.
Accrued interest 5,058 n.a. 5,058 n.a.
Interest paid (20,103) n.a. (20,103) n.a.
Net revaluation through equity (9,796) n.a. (9,796) n.a.
Effect of change in fair value of hedged financial instruments 211 n.a. 211 n.a.
Derecognition of financial assets (207,296) n.a. (207,296) n.a.
Transfer to non-current assets held for sale and discontinued operations 0 n.a. (19,483) n.a.
Balance as at 31 Dec 662,688 n.a. 662,688 n.a.
2.4.4 Available-for-sale financial assets (under IAS 39)
Breakdown by type of available-for-sale financial asset (under IAS 39)
SID Bank SID Bank and
SID Bank Group
31 Dec 2018 31 Dec 2017 31 Dec 2018 31 Dec 2017
Bonds n.a. 665,763 n.a. 685,246
Government n.a. 460,733 n.a. 471,715
Slovenia n.a. 224,588 n.a. 229,754
Other countries n.a. 236,145 n.a. 241,961
Banks n.a. 103,390 n.a. 107,663
Non-financial corporations n.a. 68,403 n.a. 70,484
Financial institutions n.a. 33,237 n.a. 35,384
Treasury bills n.a. 38,523 n.a. 38,523
Certificates of deposit n.a. 10,001 n.a. 10,001
Shares and participating interests at fair value n.a. 16,234 n.a. 16,234
Total n.a. 730,521 n.a. 750,004
Quoted n.a. 675,805 n.a. 695,288
Unquoted n.a. 54,716 n.a. 54,716
Total n.a. 730,521 n.a. 750,004
Marketable quoted securities accounted for
92.5% of all available-for-sale financial assets
at SID Bank as at the end of 2017 (SID Bank
Group: 92.7%). Debt securities accounted for
97.8% of the portfolio of available-for-sale
securities at SID Bank and the SID Bank Group,
while shares and participating interests
accounted for less than 3%. Government debt
securities (bonds and treasury bills) accounted
for 68.3% of all available-for-sale financial
assets at SID Bank as at the end of 2017 (SID
Bank Group: 68.0%). The standard institutional
sector classification of the bond issuer is taken
into account in the breakdown of the bond
portfolio by the issuer type in the above table.

130 | Annual report of SID Bank and the SID Bank Group 2018
Changes in available-for-sale financial assets
SID Bank SID Bank Group
2018 2017 2018 2017
Balance as at 1 Jan n.a. 777,676 n.a. 801,043
Recognition of new financial assets n.a. 372,671 n.a. 374,510
Accrued interest n.a. 6,048 n.a. 6,340
Interest paid n.a. (25,285) n.a. (25,852)
Net revaluation through equity n.a. 2,603 n.a. 2,498
Effect of change in fair value of hedged financial instruments n.a. 51 n.a. 51
Net foreign exchange differences n.a. (770) n.a. (770)
Derecognition of financial assets n.a. (402,473) n.a. (407,816)
Balance as at 31 Dec n.a. 730,521 n.a. 750,004
2.4.5 Financial assets measured at amortised cost
Breakdown by type of financial asset measured at amortised cost
SID Bank SID Bank Group
31 Dec 2018 31 Dec 2017 31 Dec 2018 31 Dec 2017
Loans and advances to banks 809,350 n.a. 809,350 n.a.
Loans and advances to customers 691,120 n.a. 691,120 n.a.
Other financial assets 1,853 n.a. 1,849 n.a.
Total 1,502,323 n.a. 1,502,319 n.a.
Loans and advances to banks
SID Bank and SID Bank Group
31 Dec 2018 31 Dec 2017
Loans and advances 745,576 n.a.
Deposits 64,465 n.a.
Gross exposure 810,041 n.a.
Allowances for loans and deposits (691) n.a.
Net exposure 809,350 n.a.
Changes in loans and advances to banks (gross exposure)
Gross exposure
SID Bank and SID Bank Group Stage 1 Stage 2 Total
Balance as at 1 Jan 2018 1,035,858 3,914 1,039,772
Increase due to new lending 252,806 0 252,806
Decrease due to derecognition (481,130) (1,224) (482,354)
Net change due to credit risk 2,224 (2,690) (466)
of which transfer from stage 2 to stage 1 2,685 (2,685) 0
Foreign exchange differences 283 0 283
Balance as at 31 Dec 2018 810,041 0 810,041
The explanation of the classification of financial
instruments subject to impairment or provisions
in accordance with IFRS 9 into stages is given
in section 2.3.11 under the title Impairments of
financial assets and provisions.

Annual report of SID Bank and the SID Bank Group 2018 | 131
Changes in loss allowances: loans and advances to banks
Loss allowances
SID Bank and SID Bank Group Stage 1 Stage 2 Total
Balance as at 1 Jan 2018 (468) (169) (637)
Increase due to new lending (149) 0 (149)
Decrease due to derecognition 107 56 163
Net change due to credit risk (181) 113 (68)
of which transfer from stage 2 to stage 1 (54) 54 0
Balance as at 31 Dec 2018 (691) 0 (691)
The explanation of the classification of financial
instruments subject to impairment or provisions
in accordance with IFRS 9 into stages is given
in section 2.3.11 under the title Impairments of
financial assets and provisions.
Loans and advances to customers
SID Bank and SID Bank Group
31 Dec 2018 31 Dec 2017
Loans and advances 710,012 n.a.
Government 69,554 n.a.
Non-financial corporations 639,254 n.a.
Financial institutions 1,189 n.a.
Non-profit institutions serving households 15 n.a.
Receivables from factoring 17,527 n.a.
Gross exposure 727,539 n.a.
Allowances (36,419) n.a.
Net exposure 691,120 n.a.
The total carrying amount of pledged loans
amounted to EUR 64,445 thousand as at 31
December 2018. The Bank pledged the loans as
collateral for targeted longer-term refinancing
operations (TLTROs) from the Bank of Slovenia
or the ECB.
Changes in loans and advances to customers (gross exposure)
Gross exposure
SID Bank and SID Bank Group Stage 1 Stage 2 Stage 3 (POCI) Total
Balance as at 1 Jan 2018 516,751 56,523 21,791 41,407 636472
Increase due to new lending 262,177 0 0 2,714 264,891
Decrease due to derecognition (132,630) (13,855) (1,913) (39,904) (188,302)
Net change due to credit risk (6,816) 3,246 1,392 17,123 14,945
of which transfer from stage 1 to stage 2 (22,771) 22,771 0 0 0
of which transfer from stage 2 to stage 3 0 (2,769) 2,769 0 0
of which transfer from stage 2 to stage 1 16,782 (16,782) 0 0 0
Write-offs 0 0 (887) 0 (887)
Foreign exchange differences 339 81 0 0 420
Balance as at 31 Dec 2018 639,821 45,995 20,383 21,340 727,539
The explanation of the classification of financial
instruments subject to impairment or provisions
in accordance with IFRS 9 into stages is given
in section 2.3.11 under the title Impairments of
financial assets and provisions.

132 | Annual report of SID Bank and the SID Bank Group 2018
Changes in loss allowances: loans and advances to customers
Loss allowances
SID Bank and SID Bank Group Stage 1 Stage 2 Stage 3 (POCI) Total
Balance as at 1 Jan 2018 (7,565) (3,918) (17,427) 6,246 (22,664)
Increase due to new lending (5,263) 0 0 0 (5,263)
Decrease/(increase) due to derecognition 3,574 1,933 1,103 (13,696) (7,086)
Net change due to credit risk 820 (4,862) (735) 2,488 (2,289)
of which transfer from stage 1 to stage 2 656 (656) 0 0 0
of which transfer from stage 2 to stage 3 0 148 (148) 0 0
of which transfer from stage 2 to stage 1 (907) 907 0 0 0
Write-offs 0 0 887 0 887
Foreign exchange differences (4) 0 0 0 (4)
Balance as at 31 Dec 2018 (8,438) (6,847) (16,172) (4,962) (36,419)
The explanation of the classification of financial
instruments subject to impairment or provisions
in accordance with IFRS 9 is given in section
2.3.11 under the title Impairments of financial
assets and provisions.
The changes in allowances had only a partial
impact on the creation and reversal of
impairments in the statement of profit or loss, as
the positive allowances created in the amount
of EUR 16,159 thousand after credit
enhancements for POCI loans were closed
upon derecognition with the fair value of POCI
loans, and there was no impact on the
statement of profit or loss. The allowances
created for loans at amortised cost, which were
derecognised and then re-recognised as loans
at fair value (having failed the SPPI test) in the
amount of EUR 1,219 thousand, were directly
transferred to the fair value of new loans, and
did not have an impact on the item of
impairments in profit or loss.
Other financial assets
SID Bank SID Bank Group
31 Dec 2018 31 Dec 2017 31 Dec 2018 31 Dec 2017
Gross exposure 1,853 n.a. 1,849 n.a.
Net exposure 1,853 n.a. 1,849 n.a.
2.4.6 Loans and advances (under IAS 39)
Loans and advances to banks (under IAS 39)
SID Bank SID Bank Group
31 Dec 2018 31 Dec 2017 31 Dec 2018 31 Dec 2017
Loans and advances n.a. 682,607 n.a. 682,607
Deposits n.a. 357,160 n.a. 362,412
Gross exposure n.a. 1,039,767 n.a. 1,045,019
Allowances for loans and deposits n.a. (7,588) n.a. (7,588)
Net exposure n.a. 1,032,179 n.a. 1,037,431

Annual report of SID Bank and the SID Bank Group 2018 | 133
Changes in allowances for loans and advances to banks (under IAS 39)
SID Bank and SID Bank Group
Loans and advances Deposits Total
Balance as at 1 Jan 2017 (5,925) (1,407) (7,332)
Allowances for loans and advances (822) (2,962) (3,784)
Reversal of allowances for loans and advances 1,759 1,761 3,520
Foreign exchange differences 8 0 8
Other 0 0 0
Balance as at 31 Dec 2017 (4,980) (2,608) (7,588)
Loans and advances to customers (under IAS 39)
SID Bank and SID Bank Group
31 Dec 2018 31 Dec 2017
Loans and advances n.a. 731,707
Government n.a. 69,967
Non-financial corporations n.a. 658,732
Financial institutions n.a. 2,988
Non-profit institutions serving households n.a. 20
Receivables from guarantees given n.a. 1,455
Gross exposure n.a. 733,162
Allowances n.a. (135,422)
Net exposure n.a. 597,740
Changes in allowances for loans and advances to customers (under IAS 39)
SID Bank and SID Bank Group
Loans and advances
Receivables from
guarantees given Total
Balance as at 1 Jan 2017 (172,809) (4,489) (177,298)
Allowances created (44,011) (82) (44,093)
Reversal of allowances 52,049 3 52,052
Write-offs 30,796 16,613 47,409
Other 0 (13,500) (13,500)
Foreign exchange differences 8 0 8
Balance as at 31 Dec 2017 (133,967) (1,455) (135,422)
SID Bank and the SID Bank Group disclosed
allowances that had no impact on the statement
of profit or loss for 2017 in the item of “other”
under receivables from guarantees given. In
previous years provisioning expenses for these
guarantees had been recorded and recognised
in the statement of profit or loss. In 2017 a
guarantee was called, the receivables from the
guarantee given were recognised, and the
receivables were written off. The use of
provisions is disclosed in the table in section
2.4.14.
Other financial assets (under IAS 39)
SID Bank SID Bank Group
31 Dec 2018 31 Dec 2017 31 Dec 2018 31 Dec 2017
Gross exposure n.a. 1,553 n.a. 1,554
Net exposure n.a. 1,553 n.a. 1,554

134 | Annual report of SID Bank and the SID Bank Group 2018
Changes in allowances for other financial assets (under IAS 39)
SID Bank and SID Bank
Group
2017
Balance as at 1 Jan 2017 (37)
Allowances created (59)
Reversal of allowances 96
Balance as at 31 Dec 2017 0
2.4.7 Property, plant and equipment and intangible assets
Changes in property, plant and equipment and intangible assets: SID Bank
2018
Land and
buildings Computers Other
equipment
Total property, plant
and equipment
Intangible assets
Cost Balance as at 1 Jan 9,951 1,032 823 11,806 2,787
Addition 289 522 238 1,049 513
Disposal (145) (451) (209) (805) (49)
Balance as at 31 Dec 10,095 1,103 852 12,050 3,251
Accumulated depreciation/amortisation Balance as at 1 Jan (5,331) (842) (641) (6,814) (1,982)
Depreciation/amortisation (341) (173) (53) (567) (314)
Disposal 0 170 83 253 44
Balance as at 31 Dec (5,672) (845) (611) (7,128) (2,252)
Carrying amount as at 31 Dec 4,423 258 241 4,922 999
Changes in property, plant and equipment and intangible assets: SID Bank Group
2018
Land and
buildings Computers Other
equipment
Total property, plant
and equipment
Intangible assets
Cost Balance as at 1 Jan 13,048 1,523 1,222 15,793 3,479
Addition 289 522 238 1,049 513
Disposal (145) (451) (209) (805) (49)
Transfer to non-current assets held for sale and discontinued operations (3,097) (491) (399) (3,987) (692)
Balance as at 31 Dec 10,095 1,103 852 12,050 3,251
Accumulated depreciation/amortisation Balance as at 1 Jan (6,003) (1,349) (950) (8,302) (2,187)
Depreciation and amortisation (341) (173) (53) (567) (314)
Disposal 0 170 83 253 44
Transfer to non-current assets held for sale and discontinued operations 672 507 309 1,488 205
Balance as at 31 Dec (5,672) (845) (611) (7,128) (2,252)
Carrying amount as at 31 Dec 4,423 258 241 4,922 999

Annual report of SID Bank and the SID Bank Group 2018 | 135
Changes in property, plant and equipment and intangible assets: SID Bank
2017
Land and
buildings Computers Other
equipment
Total property, plant
and equipment
Intangible assets
Cost Balance as at 1 Jan 9,951 877 825 11,653 2,505
Addition 0 334 215 549 282
Disposal 0 (179) (217) (396) (1)
Balance as at 31 Dec 9,951 1,032 823 11,806 2,787
Accumulated depreciation/amortisation Balance as at 1 Jan (4,936) (741) (689) (6,366) (1,700)
Depreciation/amortisation (395) (131) (44) (570) (282)
Disposal 0 30 91 121 0
Balance as at 31 Dec (5,331) (842) (641) (6,814) (1,982)
Carrying amount as at 31 Dec 4,620 190 182 4,992 805
Changes in property, plant and equipment and intangible assets: SID Bank Group
2017
Land and
buildings Computers Other
equipment
Total property, plant
and equipment
Intangible assets
Cost Balance as at 1 Jan 13,048 1,523 1,222 15,793 3,479
Addition 0 870 229 1,098 418
Disposal 0 (342) (242) (584) (1)
Balance as at 31 Dec 13,048 2,051 1,208 16,307 3,897
Accumulated depreciation/amortisation Balance as at 1 Jan (6,003) (1,349) (950) (8,302) (2,187)
Depreciation/amortisation (497) (253) (87) (838) (429)
Disposal 0 192 116 308 0
Balance as at 31 Dec (6,500) (1,410) (921) (8,831) (2,616)
Carrying amount as at 31 Dec 6,548 641 287 7,476 1,281
SID Bank and the SID Bank Group recorded no
pledged assets or assets acquired on the basis
of a finance lease under property, plant and
equipment as at 31 December 2018.
2.4.8 Investments in subsidiaries, associates and joint ventures
Investments in subsidiaries, associates and joint ventures: SID Bank
2018
Prvi faktor Ljubljana
(in liquidation)
Prvi faktor Beograd
(in liquidation) Total
Equity investments 15,337 279 15,616
Allowances for equity investments (15,337) (279) (15,616)
Total 0 0 0
The Bank reclassified the investment in the
subsidiary PKZ to the item of non-current assets
held for sale and discontinued operations in
2018, for reason of its anticipated sale in the
first half of 2019.

136 | Annual report of SID Bank and the SID Bank Group 2018
2017 SID – PKZ Ljubljana
Prvi faktor Ljubljana
(in liquidation)
Prvi faktor Beograd
(in liquidation) Total
Equity investments 8,413 15,337 279 24,029
Allowances for equity investments 0 (15,337) (279) (15,616)
Total 8,413 0 0 8,413
SID Bank recapitalised Prvi faktor Beograd (in
liquidation) in the amount of EUR 279 thousand
in 2017. At the same time it created an
allowance of 100% for the investment.
Data on subsidiaries
SID Bank’s equity stake
(%) Voting rights
(%)
Nominal amount of
equity stakes Equity
of undertaking Net
profit
31 Dec 2018
SID-PKZ 100 100 8,413 26,386 967
31 Dec 2017
SID-PKZ 100 100 8,413 26,119 1,159
Data on joint ventures
Voting rights, % Current assets
Current liabilities
Equity of undertaking
Net profit Total revenues
31 Dec 2018
Prvi Faktor Group 50 11,880 6,206 5,674 (203) 1,581
31 Dec 2017
Prvi Faktor Group 50 14,508 8,248 6,260 5,898 2,354
2.4.9 Corporate income tax assets and liabilities
SID Bank SID Bank Group
31 Dec 2018 31 Dec 2017 31 Dec 2018 31 Dec 2017
Current tax assets 0 4,086 0 4,513
Deferred tax assets 2,271 0 2,271 0
Total tax assets 2,271 4,086 2,271 4,513
Current tax liabilities 3,294 0 3,294 0
Deferred tax liabilities 0 447 0 569
Total tax liabilities 3,294 447 3,294 569

Annual report of SID Bank and the SID Bank Group 2018 | 137
Breakdown by type of deferred tax
SID Bank SID Bank Group
31 Dec 2018 31 Dec 2017 31 Dec 2018 31 Dec 2017
Deferred tax assets
Impairment of equity investments 2,967 2,967 2,967 2,967
Impairment of available-for-sale financial assets (under IAS 39) n.a. 103 n.a. 103
Provisions for pensions and jubilee benefits 79 66 79 95
Valuation of available-for-sale financial assets (under IAS 39) n.a. 24 n.a. 24
Valuation of financial assets measured at fair value through other comprehensive income 167 n.a. 167 n.a.
Depreciation/amortisation 54 40 54 40
Cash flow hedge 407 0 407 0
Total 3,674 3,200 3,674 3,229
Deferred tax liabilities
Valuation of financial assets measured at fair value through other comprehensive income 1,403 n.a. 1,403 n.a.
Valuation of available-for-sale financial assets (under IAS 39) n.a. 3,647 n.a. 3,798
Total 1,403 3,647 1,403 3,798
Net deferred taxes 2,271 (447) 2,271 (569)
Included in statement of profit or loss (124) 17 (124) 14
Available-for-sale financial assets (under IAS 39) n.a. (60) n.a. (60)
Financial assets measured at fair value through other comprehensive income (150) n.a. (150) n.a.
Equity investments 0 53 0 53
Provisions for pensions and jubilee benefits 12 10 12 7
Depreciation/amortisation 14 14 14 14
Included in statement of comprehensive income 2,418 (495) 2,418 (476)
Cash flow hedge 407 0 407 0
Revaluation of financial assets measured at fair value through other comprehensive income 2,011 n.a. 2,011 n.a.
Revaluation of available-for-sale financial assets (under IAS 39) n.a. (495) n.a. (476)
Effect of transition to IFRS 9 327 n.a. 327 n.a.
SID Bank and the SID Bank Group had no
unrecognised deferred taxes as at 31 December
2018.
2.4.10 Other assets
SID Bank SID Bank Group
31 Dec 2018 31 Dec 2017 31 Dec 2018 31 Dec 2017
Other assets 367 282 367 432
Reinsurers’ assets 0 0 0 13,478
Receivables from insurance operations 0 0 0 12,562
Gross exposure 367 282 367 26,471
Allowances for insurance operations 0 0 0 (5,118)
Net exposure 367 282 367 21,353

138 | Annual report of SID Bank and the SID Bank Group 2018
Short-term prepayments were the largest item
in the other assets of SID Bank and the SID
Bank Group in 2018. The largest items in the
SID Bank Group’s other assets in 2017 were
reinsurers’ assets from insurance technical
provisions and receivables from insurance
operations. The largest elements of receivables
from insurance operations consisted of
receivables with recourse, which amounted to
EUR 8,308 thousand as at 31 December 2017,
and allowances for these assets in the amount
of EUR 4,775 thousand.
Changes in allowances for insurance operations
SID Bank Group
31 Dec 2018 31 Dec 2017
Balance as at 1 Jan (5,118) (10,523)
Allowances created 0 (596)
Reversal of allowances 0 459
Write-off 0 5,542
Transfer to non-current assets held for sale and discontinued operations 5,118 0
Balance as at 31 Dec 0 (5,118)
2.4.11 Non-current assets held for sale and discontinued operations
Breakdown by asset and liability category
SID Bank SID Bank Group
31 Dec 2018 31 Dec 2017 31 Dec 2018 31 Dec 2017
Equity investment 8,413 0 0 0
Assets of non-current assets held for sale and discontinued operations 0 0 54,124 0
Sight deposits at banks 0 0 5,523 0
Financial assets measured at fair value through other comprehensive income 0 0 24,597 0
Financial assets measured at amortised cost 0 0 4,660 0
Property, plant and equipment and intangible assets 0 0 2,586 0
Other assets 0 0 16,758 0
Total assets held for sale 8,413 0 54,124 0
Liabilities associated with non-current assets held for sale and discontinued operations 0 0 30,052 0
Financial liabilities measured at amortised cost 0 0 873 0
Provisions 0 0 25,745 0
Other liabilities 0 0 3,434 0
Total liabilities associated with non-current assets held for sale and discontinued operations 0 0 30,052 0
The Bank reclassified the investment in the
subsidiary SID-PKZ to the item of non-current
assets held for sale and discontinued operations
in 2018, for reason of its anticipated sale in the
first half of 2019. The items of assets and
liabilities of non-current assets held for sale and
discontinued operations include the assets and
corresponding liabilities of SID-PKZ.
Changes in non-current assets held for sale and discontinued operations
SID Bank SID Bank Group
31 Dec 2018 31 Dec 2017 31 Dec 2018 31 Dec 2017
Balance as at 1 Jan 0 0 0 0
Transfer to non-current assets held for sale and discontinued operations 8,413 0 54,124 0
Balance as at 31 Dec 8,413 0 54,124 0
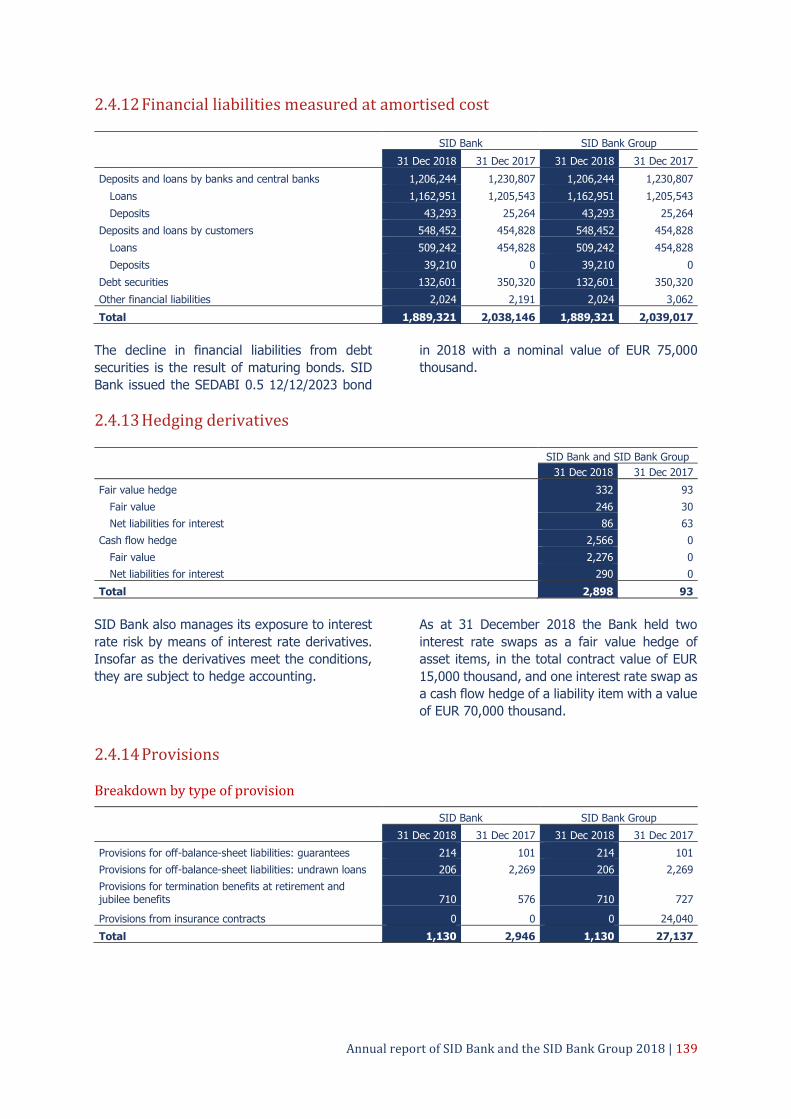
Annual report of SID Bank and the SID Bank Group 2018 | 139
2.4.12 Financial liabilities measured at amortised cost
SID Bank SID Bank Group
31 Dec 2018 31 Dec 2017 31 Dec 2018 31 Dec 2017
Deposits and loans by banks and central banks 1,206,244 1,230,807 1,206,244 1,230,807
Loans 1,162,951 1,205,543 1,162,951 1,205,543
Deposits 43,293 25,264 43,293 25,264
Deposits and loans by customers 548,452 454,828 548,452 454,828
Loans 509,242 454,828 509,242 454,828
Deposits 39,210 0 39,210 0
Debt securities 132,601 350,320 132,601 350,320
Other financial liabilities 2,024 2,191 2,024 3,062
Total 1,889,321 2,038,146 1,889,321 2,039,017
The decline in financial liabilities from debt
securities is the result of maturing bonds. SID
Bank issued the SEDABI 0.5 12/12/2023 bond
in 2018 with a nominal value of EUR 75,000
thousand.
2.4.13 Hedging derivatives
SID Bank and SID Bank Group
31 Dec 2018 31 Dec 2017
Fair value hedge 332 93
Fair value 246 30
Net liabilities for interest 86 63
Cash flow hedge 2,566 0
Fair value 2,276 0
Net liabilities for interest 290 0
Total 2,898 93
SID Bank also manages its exposure to interest
rate risk by means of interest rate derivatives.
Insofar as the derivatives meet the conditions,
they are subject to hedge accounting.
As at 31 December 2018 the Bank held two
interest rate swaps as a fair value hedge of
asset items, in the total contract value of EUR
15,000 thousand, and one interest rate swap as
a cash flow hedge of a liability item with a value
of EUR 70,000 thousand.
2.4.14 Provisions
Breakdown by type of provision
SID Bank SID Bank Group
31 Dec 2018 31 Dec 2017 31 Dec 2018 31 Dec 2017
Provisions for off-balance-sheet liabilities: guarantees 214 101 214 101
Provisions for off-balance-sheet liabilities: undrawn loans 206 2,269 206 2,269
Provisions for termination benefits at retirement and jubilee benefits 710 576 710 727
Provisions from insurance contracts 0 0 0 24,040
Total 1,130 2,946 1,130 27,137

140 | Annual report of SID Bank and the SID Bank Group 2018
Changes in off-balance-sheet liabilities and provisions for off-balance-sheet liabilities
SID Bank and SID Bank Group
Provisions for
off-balance-sheet liabilities: guarantees
Provisions for
off-balance-sheet liabilities: undrawn loans
Stage 1 Total Stage 1 Stage 2 Total
Balance as at 1 Jan 2018 6 6 219 11 230
Increase due to issuance and acquisition 751 751 2,771 0 2,771
Decrease due to derecognition (543) (543) (2,784) (11) (2,795)
Balance as at 31 Dec 2018 214 214 206 0 206
Balance as at 1 Jan 2017 n.a. 14,750 n.a. n.a. 327
Additions n.a. 246 n.a. n.a. 18,810
Reversals n.a. (1,385) n.a. n.a. (16,868)
Used n.a. (13,500) n.a. n.a. 0
Foreign exchange differences n.a. (10) n.a. n.a. 0
Balance as at 31 Dec 2017 n.a. 101 n.a. n.a. 2,269
The explanation of the classification of financial
instruments subject to impairment or provisions
in accordance with IFRS 9 into stages is given
in section 2.3.11 under the title Impairments of
financial assets and provisions.
SID Bank used provisions for off-balance-sheet
liabilities: guarantees in the amount of EUR
13,500 thousand in 2017 as a result of the
calling of guarantees by undertakings in the Prvi
Faktor Group.
The changes in off-balance-sheet liabilities are
disclosed in section 2.6.1.
Changes in provisions for termination benefits at retirement and jubilee benefits, and liabilities from insurance contracts
SID Bank SID Bank Group
Provisions for termination benefits at
retirement and jubilee benefits
Provisions for termination benefits at
retirement and jubilee benefits
Change in liabilities from
insurance contracts
Balance as at 1 Jan 2018 576 727 24,040
Additions 138 0 0
Used (4) 0 0
Transfer to non-current assets held for sale and discontinued operations 0 (727) (24,040)
Balance as at 31 Dec 2018 710 0 0
Balance as at 1 Jan 2017 469 639 23,241
Additions 113 130 16,889
Reversals 0 (13) 10,254
Used (6) (30) (26,343)
Balance as at 31 Dec 2017 576 727 24,040
SID Bank held provisions for termination
benefits at retirement and jubilee benefits as at
31 December 2018 that were created on the
basis of its own calculation. The calculation is
based on the assumption that all 185 employees
of SID Bank on 31 December 2018 (31
December 2017: 170) will remain employed at
the bank until the payment of all pertaining
jubilee benefits and until retirement. The
calculated amounts as at 31 December 2018 are
discounted using a discount rate of 1,0122 (31
December 2017: 1,0142).
Gross insurance technical provisions are
disclosed under liabilities from insurance
contracts.

Annual report of SID Bank and the SID Bank Group 2018 | 141
2.4.15 Other liabilities
SID Bank SID Bank Group
31 Dec 2018 31 Dec 2017 31 Dec 2018 31 Dec 2017
Current deferred income 91 63 91 275
Accruals 0 2 0 2
Accrued reinsurance liabilities 0 0 0 2,401
Tax liabilities 49 51 49 174
Other liabilities 0 0 0 34
Total 140 116 140 2,886
2.4.16 Shareholder equity
SID Bank SID Bank Group
31 Dec 2018 31 Dec 2017 31 Dec 2018 31 Dec 2017
Share capital 300,000 300,000 300,000 300,000
Profit reserves 102,149 88,005 114,779 107,859
Regulatory reserves 12,418 11,702 13,274 12,558
Reserves for treasury shares 1,324 1,324 1,324 1,324
Reserves under articles of association 50,113 43,313 54,319 47,519
Other profit reserves 38,294 31,666 45,862 46,458
Share premium account 1,139 1,139 1,139 1,139
Accumulated other comprehensive income 3,731 15,444 4,238 16,068
Treasury shares (1,324) (1,324) (1,324) (1,324)
Retained earnings (including net profit for financial year) 16,356 6,629 18.874 3,858
Total 422,051 409,893 437,706 427,600
There were no changes to the treasury shares
reserve in 2018. SID Bank held 18,445 shares
in SID Bank, ticker symbol SIDR, in the total
amount of EUR 1,324 thousand as at 31
December 2018.
Under a general meeting resolution, the
undistributed profit for 2017 in the amount of
EUR 6,629 thousand was allocated to other
profit reserves.
The changes are disclosed in the statement of
changes in equity.
2.4.17 Distributable profit
SID Bank
31 Dec 2018 31 Dec 2017
Net profit for financial year 14,314 13,956
Increase in profit reserves
Regulatory reserves (716) (698)
Reserves under articles of association (6,799) (6,629)
Retained earnings due to transition to IFRS 9 9,557 0
Distributable profit 16,356 6,629
In accordance with the articles of association,
the management board used SID Bank’s net
profit for 2018 in the amount of EUR 14,314
thousand (2017: EUR 13,956 thousand) to
create regulatory reserves in the amount of EUR
716 thousand (2017: EUR 698 thousand) and
reserves under the articles of association in the
amount of EUR 6,799 thousand (2017: EUR
6,629 thousand). The distributable profit from

142 | Annual report of SID Bank and the SID Bank Group 2018
2017 in the amount of EUR 6,629 thousand was
allocated to other profit reserves.
Under the ZSIRB, SID Bank’s distributable profit
may not be used for distribution to
shareholders. The management board and the
supervisory board proposed to the general
meeting that it pass a resolution whereby the
distributable profit for the 2018 financial year
should be:
– allocated to other profit reserves in the
amount of EUR 6,799 thousand, and
– held as retained earnings in the amount of
EUR 9,557 thousand for reason of the
transition to IFRS 9.
2.5 Notes to the statement of profit or loss
2.5.1 Net interest
SID Bank and SID Bank Group
2018 2017
Interest income
Interest income recognised at effective interest rate 31,122 29,119
Interest on non-trading financial assets mandatorily at fair value through profit or loss 1,543 n.a.
Interest on financial assets measured at fair value through other comprehensive income 5,125 n.a.
Interest on available-for-sale financial assets (under IAS 39) n.a. 6,111
Interest on financial assets measured at amortised cost 23,654 n.a.
Loans and advances to banks 5,850 n.a.
Loans and advances to customers 17,804 n.a.
Interest on financial liabilities carrying negative interest rate 800 546
Interest on deposits and loan borrowings 800 546
Loans and deposits (under IAS 39) n.a. 22,462
To banks n.a. 6,505
To customers n.a. 15,957
Total interest income 31,122 29,119
Interest expenses
Interest on financial liabilities measured at amortised cost (6,741) (8,172)
Issued securities (2,248) (3,744)
Loans and deposits (4,493) (4,428)
From banks (1,007) (922)
From customers (3,486) (3,506)
Hedging derivatives (775) (95)
Interest on financial assets carrying negative interest rate (620) (558)
Total interest expenses (8,136) (8,825)
Net interest 22,986 20,294
SID Bank generated net interest income of EUR
22,986 thousand in 2018, up 13.2% on 2017.
In accordance with the note in section 2.3.7,
any interest relating to impaired loans is
excluded from income. Calculated and excluded
interest income amounted to EUR 12,736
thousand as at 31 December 2018 (2017: EUR
9,343 thousand).
The effect of calculated and excluded interest
income relating to D- and E-rated customers
amounted to EUR 12,706 thousand as at 31
December 2018 (2017: EUR 9,200 thousand).

Annual report of SID Bank and the SID Bank Group 2018 | 143
2.5.2 Dividend income
SID Bank SID Bank Group
2018 2017 2018 2017
Financial assets measured at fair value through other comprehensive income 36 n.a. 36 n.a.
Dividends associated with investment held at end of reporting period 36 n.a. 36 n.a.
Available-for-sale financial assets (under IAS 39) n.a. 87 n.a. 87
Investments in subsidiaries, associates and joint ventures 582 3,353 0 0
Total 618 3,440 36 87
2.5.3 Net fees and commission
SID Bank and SID Bank Group
2018 2017
Fee and commission income
Fee and commission income from loan operations 423 127
Fee and commission income from guarantees given 168 105
Total fee and commission income 591 232
Fee and commission expenses
Fees and commission for loan operations (96) (207)
Other fees and commission (stock exchange transactions, other) (204) (252)
Total fee and commission expenses (300) (459)
Net fees and commission 291 (227)
2.5.4 Net gains/losses on financial assets and liabilities not measured at fair value
through profit or loss
SID Bank and SID Bank Group
2018 2017
Financial assets measured at fair value through other comprehensive income 1,076 n.a.
Gains 1,197 n.a.
Losses (121) n.a.
Available-for-sale financial assets (under IAS 39) n.a. 3,184
Gains n.a. 3,419
Losses n.a. (235)
Financial assets measured at amortised cost 115 n.a.
Gains 115 n.a.
Loans and advances (under IAS 39) n.a. 282
Gains n.a. 282
Financial liabilities measured at amortised cost 2,027 (4,989)
Gains 5,050 7,830
Losses (3,023) (12,819)
Net gains/(losses) on financial assets and liabilities not measured at fair value through profit or loss 3,218 (1,523)
Within the framework of its business for its own
account, SID Bank manages four loan funds set
up in conjunction with the MEDT. A first loss
clause was contractually agreed with the MEDT
for all four funds, i.e. any loss on the part of the
funds is first covered by the priority
participation of the MEDT in loan fund risks by
reducing the liabilities to the MEDT and
recognising gains on financial assets and
liabilities measured at amortised cost. If the

144 | Annual report of SID Bank and the SID Bank Group 2018
loan funds operate profitably over the
subsequent periods, the liability owed to the
MEDT is increased, and losses are recognised
under financial assets and liabilities measured
at amortised cost.
Considering the relatively high risk of
investments from the loan funds and the
consequently high percentages of impairments
on such loans, lending activity has a substantial
impact on the performance of the loan funds. In
periods of high rates of lending, impairments
and provisions are high, leading to a large loss
on the part of the funds, and vice-versa in
periods when loans are repaid and impairments
are released, which is reflected in relatively high
gains on the part of the loan funds.
Lending from the loan funds in 2018 was up on 2017. A loss in the amount of EUR 2,027
thousand was recorded, which because of the agreed first loss clause was reflected in
recognised gains on financial liabilities
measured at amortised cost.
The loan funds recorded a positive result in
2017 in the amount of EUR 4,839 thousand, and
consequently recognised losses in the same
amount.
2.5.5 Net gains/losses on non-trading financial assets mandatorily at fair value
through profit or loss
SID Bank and SID Bank Group
2018 2017
Loans and other financial assets 655 n.a.
Net gains on non-trading financial assets mandatorily at fair value through profit or loss 655 n.a.
2.5.6 Changes in fair value in hedge accounting
SID Bank and SID Bank Group
2018 2017
Net losses on derivatives held as fair value hedge (215) (30)
Net gains on fair-value-hedged items relating to hedged risk 211 51
Losses on ineffective cash flow hedges (125) 0
Total (129) 21
2.5.7 Net foreign exchange gains/losses
SID Bank and SID Bank Group
2018 2017
Income from exchange rate differences 2,717 6,461
Expenses from exchange rate differences (2,725) (7,647)
Net losses (8) (1,186)
The exchange rate differences disclosed in the
above table relate to financial liabilities and
financial assets measured at amortised cost and
current accounts at banks in the country in
foreign currency.
Foreign exchange losses in 2018 were down on
2017, primarily as a result of changes in the
structure of the foreign currency sub-balance.

Annual report of SID Bank and the SID Bank Group 2018 | 145
2.5.8 Other net operating gains/losses
SID Bank SID Bank Group
2018 2017 2018 2017
Gains
Income from activities under Republic of Slovenia authorisation 3,558 1,893 3,558 1,893
Other operating revenues 106 78 63 25
Total gains 3,664 1,971 3,621 1,918
Losses
Other operating expenses (302) (239) (302) (239)
Total losses (302) (239) (302) (239)
Net operating gains 3,362 1,732 3,319 1,679
The Bank realised gains of EUR 3,558 thousand
in 2018 (2017: EUR 1,893 thousand) from the
provision of services under authorisation. There
were gains from the management of
contingency reserve assets in the amount of
EUR 1,740 thousand (2017: EUR 1,740
thousand), from the management of the Fund
of Funds in the amount of EUR 1,781 thousand
(2017: EUR 126 thousand), from guarantee
schemes in the amount of EUR 16 thousand
(2017: EUR 15 thousand) and from other
services under authorisation in the amount of
EUR 21 thousand (2017: EUR 12 thousand).
2.5.9 Administrative expenses
SID Bank SID Bank Group
2018 2017 2018 2017
Labour costs (9,978) (8,853) (9,978) (8,852)
Gross salaries (7,502) (6,678) (7,502) (6,677)
Pension insurance costs (669) (595) (669) (595)
Social security costs (555) (495) (555) (495)
Other labour costs (1,252) (1,085) (1,252) (1,085)
General and administrative costs (3,292) (3,541) (3,292) (3,536)
Costs of materials (136) (120) (136) (120)
Costs of services (3,156) (3,421) (3,156) (3,416)
Total (13,270) (12,394) (13,270) (12,388)
2.5.10 Depreciation and amortisation
SID Bank and SID Bank Group
2018 2017
Depreciation of property, plant and equipment (567) (570)
Amortisation of intangible assets (314) (282)
Total (881) (852)

146 | Annual report of SID Bank and the SID Bank Group 2018
2.5.11 Provisions
SID Bank and SID Bank Group
2018 2017
Provisions for off-balance-sheet liabilities: guarantees (208) 1,138
Provisions for off-balance-sheet liabilities: undrawn loans 24 (1,942)
Other provisions (138) (113)
Total (322) (917)
SID Bank recorded expenses of EUR 184
thousand in 2018 from the creation of
provisions for off-balance-sheet liabilities
(2017: expenses in the amount of EUR 804
thousand).
The stocks of off-balance-sheet liabilities for
which the provisions have been created are
disclosed in the table in section 2.6.1.
Other provisions include provisions for
termination benefits at retirement and jubilee
benefits.
2.5.12 Impairments
SID Bank and SID Bank Group
2018 2017
Impairments of financial assets measured at fair value through other comprehensive income 789 n.a.
Impairments of financial assets measured at amortised cost 248 n.a.
Loans and advances to banks (53) n.a.
Loans and advances to customers 301 n.a.
Impairments of loans and other financial assets measured at amortised cost (under IAS 39) n.a. 7,731
Loans and advances to banks n.a. (264)
Loans and advances to customers n.a. 7,958
Other financial assets n.a. 37
Impairments of investments in subsidiaries, associates and joint ventures 0 (279)
Total 1,037 7,452
The effect of the release of impairments of
financial assets measured at amortised cost
(under IFRS 9) and the impairments of loans
and other financial assets measured at
amortised cost (under IAS 39) are not directly
comparable in the disclosed years because of
the recalculation of risk parameters. In addition,
the calculation of impairments under IFRS 9,
which is based on 12-month and lifetime losses,
differs significantly from the previous
methodology.
The release of impairments in 2018 was
attributable to the recalculated parameters,
which capture data that is more favourable from
the perspective of macroeconomic
developments.
2.5.13 Corporate income tax on continuing operations
SID Bank and SID Bank Group
2018 2017
Current income tax (3,081) (2,285)
Deferred taxes (124) 17
Total (3,205) (2,268)
The corporate income tax rate in Slovenia was
19% in 2018 (2017: 19%). Current income tax
differs from tax calculated using the prescribed
tax rate, and is disclosed in the table below.
Analysis of deferred taxes disclosed in profit or
loss is given in section 2.4.9.
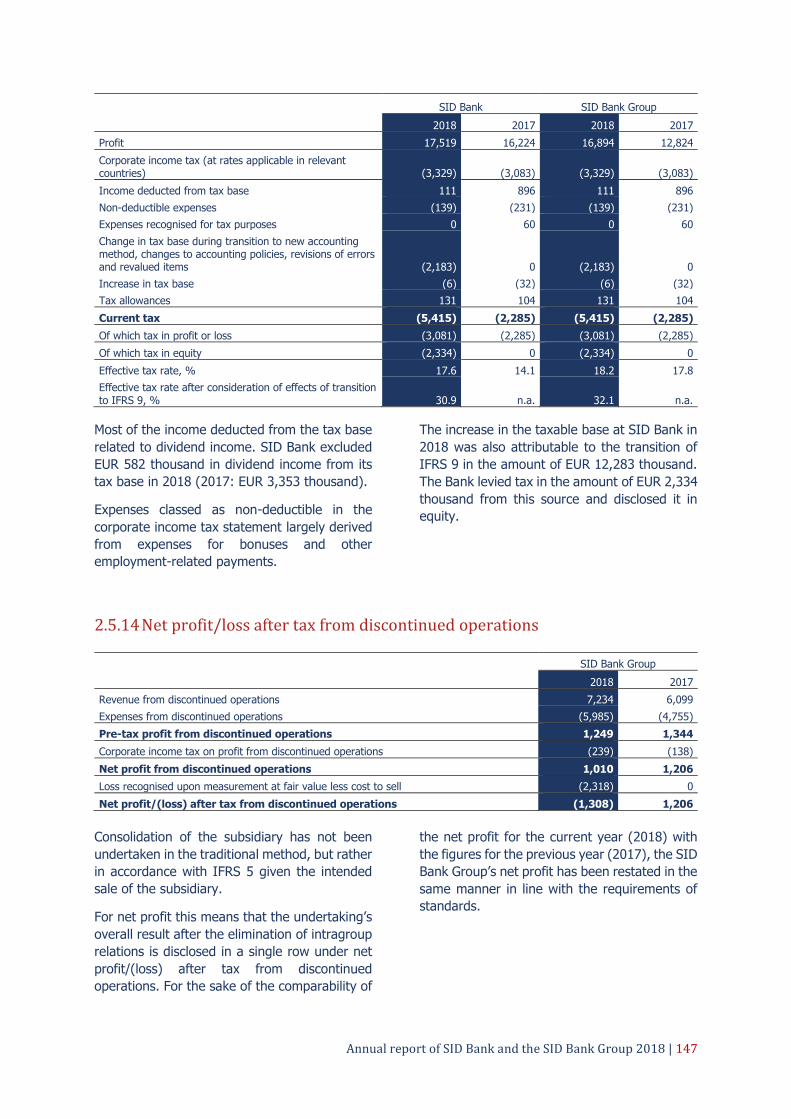
Annual report of SID Bank and the SID Bank Group 2018 | 147
SID Bank SID Bank Group
2018 2017 2018 2017
Profit 17,519 16,224 16,894 12,824
Corporate income tax (at rates applicable in relevant countries) (3,329) (3,083) (3,329) (3,083)
Income deducted from tax base 111 896 111 896
Non-deductible expenses (139) (231) (139) (231)
Expenses recognised for tax purposes 0 60 0 60
Change in tax base during transition to new accounting method, changes to accounting policies, revisions of errors and revalued items (2,183) 0 (2,183) 0
Increase in tax base (6) (32) (6) (32)
Tax allowances 131 104 131 104
Current tax (5,415) (2,285) (5,415) (2,285)
Of which tax in profit or loss (3,081) (2,285) (3,081) (2,285)
Of which tax in equity (2,334) 0 (2,334) 0
Effective tax rate, % 17.6 14.1 18.2 17.8
Effective tax rate after consideration of effects of transition to IFRS 9, % 30.9 n.a. 32.1 n.a.
Most of the income deducted from the tax base
related to dividend income. SID Bank excluded
EUR 582 thousand in dividend income from its
tax base in 2018 (2017: EUR 3,353 thousand).
Expenses classed as non-deductible in the
corporate income tax statement largely derived
from expenses for bonuses and other
employment-related payments.
The increase in the taxable base at SID Bank in
2018 was also attributable to the transition of
IFRS 9 in the amount of EUR 12,283 thousand.
The Bank levied tax in the amount of EUR 2,334
thousand from this source and disclosed it in
equity.
2.5.14 Net profit/loss after tax from discontinued operations
SID Bank Group
2018 2017
Revenue from discontinued operations 7,234 6,099
Expenses from discontinued operations (5,985) (4,755)
Pre-tax profit from discontinued operations 1,249 1,344
Corporate income tax on profit from discontinued operations (239) (138)
Net profit from discontinued operations 1,010 1,206
Loss recognised upon measurement at fair value less cost to sell (2,318) 0
Net profit/(loss) after tax from discontinued operations (1,308) 1,206
Consolidation of the subsidiary has not been
undertaken in the traditional method, but rather
in accordance with IFRS 5 given the intended
sale of the subsidiary.
For net profit this means that the undertaking’s
overall result after the elimination of intragroup
relations is disclosed in a single row under net
profit/(loss) after tax from discontinued
operations. For the sake of the comparability of
the net profit for the current year (2018) with
the figures for the previous year (2017), the SID
Bank Group’s net profit has been restated in the
same manner in line with the requirements of
standards.

148 | Annual report of SID Bank and the SID Bank Group 2018
2.5.15 Net earnings per share
SID Bank SID Bank Group
2018 2017 2018 2017
Number of ordinary registered no-par value shares 3,121,741 3,121,741 3,121,741 3,121,741
Treasury shares 18,445 18,445 18,445 18,445
Number of ordinary shares (excluding treasury shares) 3,103,296 3,103,296 3,103,296 3,103,296
Net profit for financial year, EUR thousand 14,314 13,956 12,381 11,762
Net earnings per share, EUR 4.61 4.50 3.99 3.79
Diluted earnings per share equals basic
earnings per share for SID Bank and the SID
Bank Group.
2.6 Other notes to the financial statements
2.6.1 Contingent liabilities and commitments given
Contractual liabilities for off-balance-sheet financial instruments arising from commitments given
SID Bank and SID Bank Group
31 Dec 2018 31 Dec 2017
Guarantees 66,790 13,863
Other off-balance-sheet liabilities 208,970 60,409
Total commitments given 275,760 74,272
Provisions for off-balance-sheet risks: guarantees (214) (101)
Provisions for off-balance-sheet risks: undrawn loans (206) (2,269)
Total provisions for commitments given (420) (2,370)
SID Bank and the SID Bank Group discloses the
value of guarantees given and the value of
other off-balance-sheet liabilities, including the
value of undrawn loans and the value of
uncalled unpaid capital, under commitments
given. The value of guarantees given increased
in 2018 as a result of new issuance of
guarantees. The amount of loans approved for
customers but as yet undrawn stood at EUR
129,259 thousand as at 31 December 2018
(2017: EUR 24,743 thousand), while the
amount of loans approved for banks stood at
EUR 67,711 thousand (2017: EUR 23,665
thousand). The value of uncalled unpaid capital
stood at EUR 12,000 thousand (2017: EUR
12,000 thousand).

Annual report of SID Bank and the SID Bank Group 2018 | 149
Changes in contractual liabilities for off-balance-sheet financial instruments
SID Bank and SID Bank Group
Off-balance-sheet-liabilities: guarantees
Off-balance-sheet liabilities: undrawn loans
Stage 1 Total Stage 1 Stage 2 Stage 3 Total
Balance as at 1 Jan 2018 13,863 13,863 59,747 662 0 60,409
Increase due to issuance and approval of new guarantees/loans 67,778 67,778 621,778 1,095 1,900 624,773
Decrease due to derecognition (14,582) (14,582) (472,555) (1,757) (1,900) (476,212)
Net change due to credit risk 0 0 (998) 998 0 0
of which transfer from stage 1 to stage 2 0 0 (998) 998 0 0
Foreign exchange differences (269) (269) 0 0 0 0
Balance as at 31 Dec 2018 66,790 66,790 207,972 998 0 208,970
The explanation of the classification of financial
instruments subject to impairment or provisions
in accordance with IFRS 9 into stages is given
in section 2.3.11 under the title Impairments of
financial assets and provisions.
Contractual value of derivatives
SID Bank and SID Bank Group
31 Dec 2018 31 Dec 2017
Hedging derivatives
Interest rate swaps 85,000 15,000
Total 85,000 15,000
The contractual value of hedging derivatives
amounted to EUR 85,000 thousand. Derivatives
that meet the criteria for hedge accounting are
used to hedge against interest rate risk. The fair
values and economic effects are disclosed in
sections 2.4.13 and 2.5.6.
2.6.2 Related party disclosures
Within the framework of continuing operations,
specific banking transactions were conducted
with related parties, i.e. parties where one party
controls the other or has a significant influence
over its financial and business decisions.
Major transactions between SID Bank and the
undertakings in the SID Bank Group are
disclosed below. Their intragroup relations are
eliminated from the consolidated financial
statements.
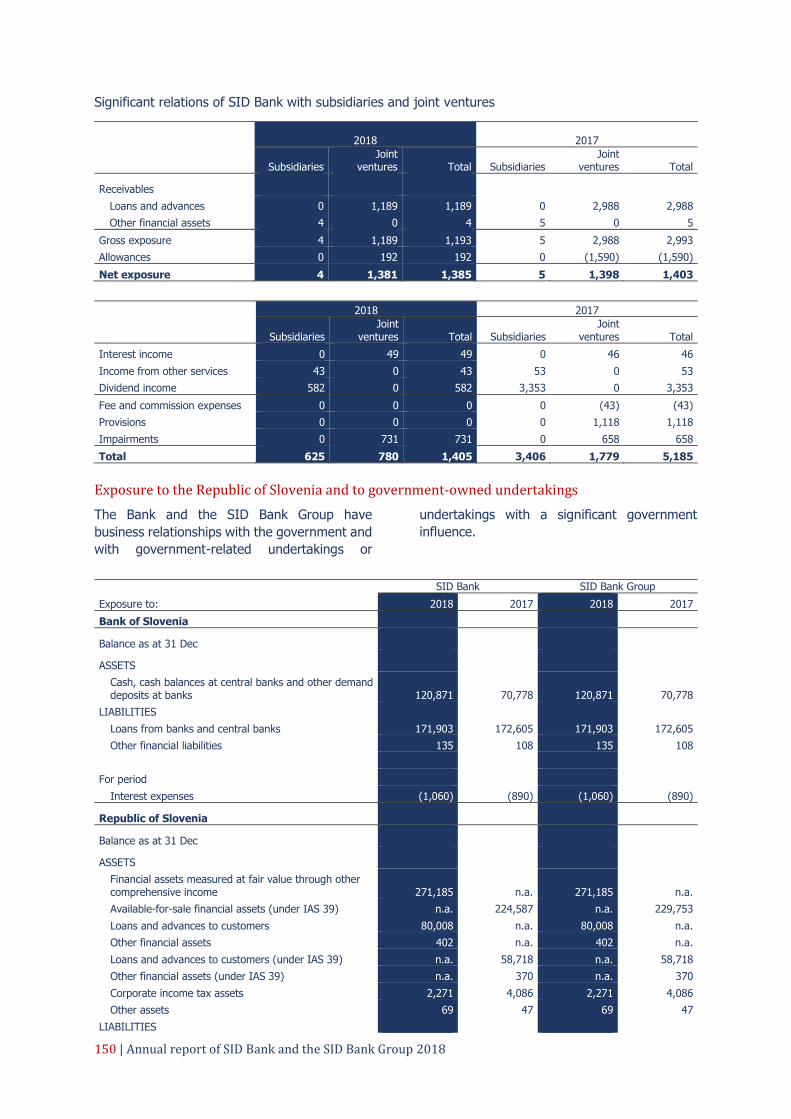
150 | Annual report of SID Bank and the SID Bank Group 2018
Significant relations of SID Bank with subsidiaries and joint ventures
2018 2017
Subsidiaries
Joint ventures Total Subsidiaries
Joint ventures Total
Receivables Loans and advances 0 1,189 1,189 0 2,988 2,988
Other financial assets 4 0 4 5 0 5
Gross exposure 4 1,189 1,193 5 2,988 2,993
Allowances 0 192 192 0 (1,590) (1,590)
Net exposure 4 1,381 1,385 5 1,398 1,403
2018 2017
Subsidiaries
Joint ventures Total Subsidiaries
Joint ventures Total
Interest income 0 49 49 0 46 46
Income from other services 43 0 43 53 0 53
Dividend income 582 0 582 3,353 0 3,353
Fee and commission expenses 0 0 0 0 (43) (43)
Provisions 0 0 0 0 1,118 1,118
Impairments 0 731 731 0 658 658
Total 625 780 1,405 3,406 1,779 5,185
Exposure to the Republic of Slovenia and to government-owned undertakings
The Bank and the SID Bank Group have
business relationships with the government and
with government-related undertakings or
undertakings with a significant government
influence.
SID Bank SID Bank Group
Exposure to: 2018 2017 2018 2017
Bank of Slovenia
Balance as at 31 Dec
ASSETS Cash, cash balances at central banks and other demand deposits at banks 120,871 70,778 120,871 70,778
LIABILITIES
Loans from banks and central banks 171,903 172,605 171,903 172,605
Other financial liabilities 135 108 135 108
For period
Interest expenses (1,060) (890) (1,060) (890)
Republic of Slovenia
Balance as at 31 Dec
ASSETS Financial assets measured at fair value through other comprehensive income 271,185 n.a. 271,185 n.a.
Available-for-sale financial assets (under IAS 39) n.a. 224,587 n.a. 229,753
Loans and advances to customers 80,008 n.a. 80,008 n.a.
Other financial assets 402 n.a. 402 n.a.
Loans and advances to customers (under IAS 39) n.a. 58,718 n.a. 58,718
Other financial assets (under IAS 39) n.a. 370 n.a. 370
Corporate income tax assets 2,271 4,086 2,271 4,086
Other assets 69 47 69 47
LIABILITIES

Annual report of SID Bank and the SID Bank Group 2018 | 151
SID Bank SID Bank Group
Exposure to: 2018 2017 2018 2017
Loans from customers 173,805 173,805 173,805 173,805
Other financial liabilities 362 310 362 310
Provisions 0 35 0 35
Corporate income tax liabilities 3,294 0 3,294 0
Other liabilities 49 51 49 51
CONTINGENT LIABILITIES AND COMMITMENTS GIVEN 55,170 1,568 55,170 1,568
For period
Interest income 3,132 2,854 3,132 2,996
Fee and commission expenses (3) (10) (3) (10)
Net gains on financial assets and liabilities not measured at fair value through profit or loss 386 1,675 386 1,675
Changes in fair value in hedge accounting 211 51 211 51
Net foreign exchange losses 0 (304) 0 (304)
Other net operating gains 1,807 1,785 1,807 1,785
Administrative expenses (97) (57) (97) (57)
Impairments and provisions 2 (4) 2 (4)
Government-owned undertakings
Balance as at 31 Dec
ASSETS
Cash, cash balances at central banks and other demand deposits at banks 283 48 283 48
Financial assets measured at fair value through other comprehensive income 50,574 n.a. 50,574 n.a.
Available-for-sale financial assets (under IAS 39) n.a. 63,306 n.a. 64,324
Loans and advances to banks 320,217 n.a. 320,217 n.a.
Loans and advances to customers 211,738 n.a. 211,738 n.a.
Other financial assets 430 n.a. 426 n.a.
Loans and advances to banks (under IAS 39) n.a. 318,810 n.a. 318,810
Loans and advances to customers (under IAS 39) n.a. 209,231 n.a. 209,231
Other financial assets (under IAS 39) n.a. 131 n.a. 126
Non-current assets held for sale and discontinued operations 8,413 0 0 0
Investments in subsidiaries, associates and joint ventures 0 8,413 0 0
Other assets 65 6 65 7
LIABILITIES
Deposits by banks 4,998 15,264 4,998 15,264
Deposits by customers 39,210 0 39,210 0
Loans from customers 757 20,755 757 20,755
Other financial liabilities 98 126 98 126
Provisions 34 211 34 211
CONTINGENT LIABILITIES AND COMMITMENTS GIVEN 0 28,863 0 28,863
For period
Interest income 7,131 8,442 7,131 8,488
Interest expenses 1,236 1,307 1,236 1,307
Dividend income 582 3,353 0 0
Fee and commission income 64 138 64 138
Fee and commission expenses (144) (192) (144) (192)
Net gains on financial assets and liabilities not measured at fair value through profit or loss 0 167 0 167
Other net operating gains 1,823 179 1,823 (11,540)
Administrative expenses (206) (163) (206) (163)
Impairments and provisions 397 6,109 397 6,263

152 | Annual report of SID Bank and the SID Bank Group 2018
2.6.3 Remuneration system
SID Bank’s remuneration policy is consistently
aimed at meeting the objectives of the its
business strategy, and is aligned with its risk
profile and risk absorption capacity.
The size and organisational structure of the
Bank as well as the nature, scale and complexity
of the activities pursued by SID Bank are taken
into account in the remuneration policy. In
accordance with the ZSIRB, SID Bank’s
objective is not maximising profit, but primarily
conserving capital, whereby all SID Bank’s
transactions are subject to the assessment of
economic quality on the basis of international
criteria. Moreover, the remuneration policy
takes account of the fact that SID Bank, unlike
other commercial banks, provides only specific
services and transactions (financing of
corporates and banks), i.e. it does not provide
the majority of services provided by other banks
(e.g. SID Bank does not take deposits from the
public, does not provide retail services, does not
manage current accounts for clients, does not
provide payment services for clients, and does
not provide investment services for clients), and
that due to the specific business model typical
of development banks, SID Bank may be
classified in the category of banks carrying out
activities with a relatively low complexity of
risks.
In accordance with Commission Delegated
Regulation (EU) No 604/2014, Regulation (EU)
No 575/2013 and Article 169 of the ZBan-2, the
remuneration policy specifically defines the
material business units and the specific jobs of
employees who, on the basis of their powers or
duties and activities or on the basis of their
membership in committees may have a material
impact on the Bank’s risk profile.
The remuneration policy specifies that
employee remuneration should be formulated in
such a way that it does not encourage
employees whose professional activities have a
material impact on the Bank’s risk profile to
irresponsibly take disproportionately large risks
in the course of their work, or risks that exceed
the Bank’s risk absorption capacity.
The remuneration of employees in independent
control functions is determined in such a way
that their independence and objectivity in the
performance of duties are not compromised.
Employees who perform independent control
functions are independent from the
organisational units on which they conduct
controls, and have the appropriate powers and
receive remuneration with respect to the
achievement of objectives linked to their
functions, regardless of the performance of the
business areas on which they conduct controls.
Employees who perform independent control
functions receive performance bonuses
irrespective of the policy in accordance with the
company-level collective agreement.
(Article 450(1)(a) of the CRR)
SID Bank’s back-office departments (risk
management, compliance, internal audit,
accounting, and general affairs and HR), its
management board, its supervisory board
committees (risk committee, nomination and
remuneration committee) are involved in the
process of putting in place, implementing and
conducting controls on the remuneration policy,
together with the supervisory board, which
monitors the remuneration policy.
The nomination and remuneration committee
(the main body for overseeing remuneration)
held nine sessions in 2018, and discussed
remuneration policy and practice at two of the
sessions. No change was made to the
remuneration policy in 2018. The most recent
change in the remuneration policy was
approved by the supervisory board on 30
August 2017.
No external consultant was involved in the
development of the remuneration policy.
The remuneration policy is applied at the level
of the SID Bank Group (SID - Prva kreditna
zavarovalnica d.d. in addition to SID Bank).
Overseeing the consistent application of the
policy at the level of the subsidiary is the
responsibility of the members of the supervisory
bodies of the subsidiary, who are employees of
SID Bank, in line with the policy for the
governance of SID Bank organisational units.
(Article 450(1)(b) of the CRR)
In the event of unsatisfactory performance or a
negative operating result, SID Bank
considerably reduces the variable remuneration
(including the possibility of reducing such

Annual report of SID Bank and the SID Bank Group 2018 | 153
remuneration to zero or to the lower threshold
set out in the collective agreement for the
sector), whereby both current remuneration
and reductions in payments of previously
earned amounts are taken into account,
including through malus or clawback
arrangements in accordance with the law
governing employment relationships and the
collective agreement for the sector.
(Article 450(1)(c) of the CRR)
Fixed remuneration is above all an appropriate
reflection of a person’s professional experience
and responsibilities at the bank, as defined in
the description of the employee’s work tasks as
part of the terms and conditions of employment.
Variable remuneration reflects sustainable and
risk-adjusted performance, and performance
that exceeds the expected performance as
defined in the description of the employee’s
work tasks as part of the terms and conditions
of employment. The entire variable component
of an employee’s remuneration is determined
on the basis of the performance of the
employee, the employee's organisational unit
and the Bank’s overall operating results.
Performance bonuses for all categories of
employees are paid after the approval of the
annual report by the supervisory board.
Performance bonuses are not paid if the Bank
fails to generate any profits in the financial year.
In the event of any recommendations from the
Bank’s shareholders or any other persons
responsible for such recommendations relating
to restrictions regarding performance bonuses
or other remuneration arising from
employment, the management board may
make a decision contrary to the provisions of
the company-level collective agreement.
The provisions concerning performance
bonuses do not apply if variable remuneration
is required to be reduced in accordance with the
provisions of SID Bank’s remuneration policy, in
particular the provisions on the observation of
the impact of variable remuneration on SID
Bank’s financial position and the provisions on
performance measurement and risk
adjustment.
The accounting period is the calendar year. The
deferral period for variable remuneration begins
after the end of the accounting period and, in
accordance with the remuneration policy, for
employees whose professional activities have a
material impact on the Bank’s risk profile and if
total variable remuneration in a single year
exceeds the gross amount of EUR 50,000, lasts
for three years, in the deferred amount of 40%
of the variable remuneration. As regards the
payment and deferral of the variable
remuneration of the president and other
members of the management board, the
provisions of the ZPPOGD and the remuneration
policy apply, and specify that the deferral period
is three years and the deferred proportion of the
variable remuneration is 50%.
(Article 450(1)(d) of the CRR)
Under the remuneration policy, the fixed portion
of remuneration accounts for at least 75% of
the average employee’s total remuneration for
all types of employees. The remuneration policy
provides that the variable component of
remuneration includes any payment for
performance over the percentage from the
collective agreement for Slovenia’s banking
sector, performance bonuses, other bonuses
(e.g. for project work), and other remuneration
and benefits (e.g. termination benefits above
the amount set by labour regulations).
The requirements referred to in points 7 and 8
of the first paragraph of Article 170 of the ZBan-
2 concerning the formulation and payment of
variable remuneration do not apply when the
total variable remuneration of an employee
whose professional activities have a material
impact on the Bank’s risk profile does not
exceed EUR 50,000 gross in a single year
(application of the lower threshold of variable
remuneration).
(Article 450(1)(e) of the CRR)
Given that the ZSIRB stipulates that SID Bank
may have only one shareholder and that the
Republic of Slovenia guarantees the
commitments of the Bank, SID Bank cannot and
may not pay the variable component of
remuneration in the form of shares. This means
that in cases where the total variable
remuneration of an employee whose
professional activities have a material impact on
the Bank’s risk profile exceeds EUR 50,000
gross in a single year, SID Bank may take into
account only to a limited extent the principles
laid down in section 7 of the first paragraph of

154 | Annual report of SID Bank and the SID Bank Group 2018
Article 170 of the Banking Act (ZBan-2), which
require at least 50% of the variable
remuneration of every individual to be provided
in the form of ordinary and preference shares of
the bank, or share-linked instruments or
equivalent non-cash instruments when a bank’s
shares are not listed on a regulated market. If
the total variable remuneration of an employee
whose professional activities have a material
impact on the Bank’s risk profile exceeds the
gross amount of EUR 50,000 in a given year,
the amount above that figure is indexed to the
growth in the book value of SID Bank’s shares
until the payment date, notwithstanding any
transactions with the owner (e.g. capital
increase/decrease, pooling/splitting of shares).
(Article 450(1)(f) of the CRR)
Variable remuneration of employees
1. The variable remuneration of any employees
having an employment contract signed in
accordance with the provisions of the collective
agreement for the Slovenian banking sector and
the company-level collective agreement is paid
as a payment for performance over the
percentage from the collective agreement for
the banking sector, performance bonuses, other
bonuses (e.g. for project work) or termination
benefits pay above the amount set by labour
regulations. Employee performance is
monitored and assessed once annually by their
immediate superiors on the basis of the
execution of their duties specified in respective
annual development interviews based on the
tasks set out in the annual operational plan
(AOP), and based on the achievement of the
criteria of scale and quality of work, efficiency,
attitude towards other staff members and
customers, diligence, willingness to work and
development of competencies. In accordance
with the tariff annex to the company-level
collective agreement, the funds earmarked for
the payment of on-the-job performance
bonuses are equivalent to 10% of the funds
earmarked for the payment of employees’ base
monthly salaries under the collective
agreement.
The payment of performance bonuses depends
on the results of the implementation of the AOP
at the level of the Bank and individual
organisational units in terms of achieving key
performance indicators in the implementation of
the strategy for each year (financial aspect, e.g.
ROE, CIR; market aspect, e.g. volume of new
business, stock of loans; internal aspect, e.g.
share of realised projects/tasks; aspect of
learning and development, e.g. conducting
development interviews, internal transfer of
knowledge) and the achievement of key
performance indicators as well as the
performance of the tasks of individual
organisational units (duties defined by bylaws,
the AOP according to various aspects such as
the above-mentioned criteria at the level of the
Bank, through individual decisions of the
management board, and annual interviews with
the managers). The maximum performance
bonus may not exceed the employee’s monthly
salary. The total variable remuneration of
employees may not exceed 33% of the fixed
remuneration.
2. Employees with individual employment
contracts are paid variable remuneration once a
year in the form of performance bonuses based
on the achievement of goals, tasks and
obligations determined by a decision adopted by
the management board every year and/or the
business policy of the department/departments
and/or the objectives and tasks of the director
as well as other tasks according to the
resolution of the management board.
Alternatively, the variable remuneration is paid
taking into account the assessment of the work
of the management board by SID Bank’s
supervisory board. The various aspects listed in
point 1 above are taken into account as criteria
for all employees or as criteria that also apply to
SID Bank’s management board. The provisions
of the individual contracts generally limit
performance bonuses to 25% of the base
annual salary.
3. The provisions of the Act Governing the
Remuneration of Managers of Companies with
Majority Ownership Held by the Republic of
Slovenia or Self-Governing Local Communities
(ZPPOGD) also apply to the performance criteria
(based on which variable remuneration is
determined) for members of SID Bank’s
management board. The variable remuneration,
which may not exceed 30% of the base salary
of any member of the management board, is
determined by the supervisory board at the
proposal of the nomination and remuneration
committee, following the approval of SID Bank’s
annual report, depending on the fulfilment of

Annual report of SID Bank and the SID Bank Group 2018 | 155
SID Bank’s AOP and other performance
measurement criteria. The fulfilment of the AOP
provides a basis for the payment of the entire
variable remuneration, while in the event of a)
partial fulfilment of the AOP or b) if certain
objectives have been exceeded and others have
not been met, the supervisory board takes a
decision on the amount of the variable
remuneration by taking into account the
criterion concerning the fulfilment of
objectives/tasks in comparison with all tasks as
well as quantitative and qualitative criteria set
out in the AOP and their weight in accordance
with the provisions of the articles of association
and the adopted strategy defining the purpose
and mission of the company and the various
circumstances in which the company operated
in the previous year.
Other non-cash benefits received by any
employees whose professional activities have a
material impact on the Bank’s risk profile relate
to the benefits agreed in the employment
contract (e.g. life insurance, company car use
for business and private purposes), for which
fringe benefits are accounted by SID Bank.
(Article 450(1)(g)(h)(i)(j) of the CRR)
Quantitative information on remuneration in 2018
Manage-
ment body in supervi-
sory function
Manage-
ment body in
manage-
ment function
Finan-
cing and insurance
Invest-
ment banking
Retail banking
Asset
manage-ment
Corporate functions
Indepen-dent
internal
control functions Other
Members (number of employees) 6 2 n.a. n.a. n.a. n.a. n.a. n.a. n.a.
Number of identified FTE employees n.a. n.a. 7.0 0 0 5.8 10.0 3.0 4
Number of identified employees in senior management positions n.a. n.a. 0 0 0 0 4.0 0 0
Total fixed remuneration, EUR 195,916 396,826 453,957 0 0 296,013 868,314 196,105 259,268
Of which: fixed remuneration in cash 195,916 396,826 453,957 0 0 296,013 868,314 196,105 259,268
Total variable remuneration, EUR 0 88,779 65,362 0 0 22,265 138,840 10,896 24,565
Of which: variable remuneration in
cash 0 88,779 65,362 0 0 22,265 138,840 10,896 24,565
Total amount of variable remuneration awarded in 2018 and
deferred, EUR 0 48,623 0 0 0 0 0 0 0
Of which: deferred variable
remuneration in 2018 in cash 0 48,623 0 0 0 0 0 0 0
Additional information in connection
with amount of total variable remuneration
Total amount of outstanding deferred variable remuneration awarded in previous periods and not
in 2018, EUR (Article 450(1)(h)(iii) of the CRR) 0 94,088 3,955 0 0 0 25,854 0 0
All variable remuneration was paid in cash;
there are no other types of variable
remuneration. All amounts of outstanding
deferred remuneration from previous years are
vested. No single person was remunerated
more than EUR 1 million.

156 | Annual report of SID Bank and the SID Bank Group 2018
Remuneration of members of supervisory bodies in 2018
(EUR)
Gross
payment for
perfor-mance of
function
Gross session
fees
Gross
total Net total
Gross reimbur-
sement of
expenses
Net reimbur-
sement of
expenses
Other
benefits (liability
insurance) Name Function
Monika
Pintar Mesarič
chair of supervisory board, to 21 Feb 2018 and
since 15 Mar 2018
28,583 7,590 36,173 26,276 0 0 119
member of supervisory board, 22 Feb to 14 March 2018
chair of nomination and remuneration committee, to 21 Feb 2018 and since 15 Mar 2018
member of nomination and remuneration committee, 9 to 14 Mar 2018
Marjan Divjak
M.Sc.
member of supervisory board
19,225 6,820 26,045 18,910 0 0 119
deputy-chair of audit committee since 13 Dec 2018
deputy-chair of risk committee
Leo Knez
M.Sc.
member of supervisory board
25,065 8,866 33,931 24,646 0 0 119
member of risk committee, 9 to 14 March 2018
chair of risk committee, to 21 Feb 2018 and since
15 Mar 2018
deputy-chair of audit committee to 21 Feb 2018
member of audit committee since 9 Mar 2018
Marko
Tišma
deputy-chair of supervisory board
24,362 8,685 33,047 24,003 2,818 2,049 119
member of risk committee
deputy-chair of nomination and remuneration committee
Aleš Berk Skok
PhD
member of supervisory board to 15 Nov 2018
22,186 6,985 29,171 21,183 371 270 119
chair of audit committee to 15 Nov 2018
member of risk committee to 15 Nov 2018
Zlatko Vili
Hohnjec
member of supervisory board
22,935 8,646 31,581 22,936 2,065 1,502 119
member of audit committee to 14 Mar 2018
deputy-chair of audit committee, 15 Mar to 12 Dec 2018
chair of audit committee since 13 Dec 2018
member of nomination and remuneration committee
142,356 47,592 189,948 137,954 5,254 3,821 714
Remuneration of members of management board in 2018
SID Bank’s management board was paid EUR
485,605 in 2018, consisting of which EUR
396,826 in fixed remuneration, EUR 48,623 in
current variable remuneration and EUR 40,156
in deferred variable remuneration from previous
years.
Sibil Svilan, M.Sc., the president of the
management board, received EUR 261,936 in
total remuneration (EUR 112,526 net) in 2018,
of which EUR 214,959 was fixed and EUR
46,977 was variable remuneration. The fixed
remuneration consisted of gross salary in the
amount of EUR 204,993 (net salary amounted
to EUR 90,865), voluntary supplementary
pension insurance payments in the amount of
EUR 2,819, meal allowances of EUR 857 and
additional fringe benefits (company car use,
voluntary health insurance, life insurance and
liability insurance) valued at EUR 6,290. The
variable remuneration consisted of variable
remuneration awarded and paid in 2018 in the
amount of EUR 26,405 and deferred variable
remuneration from previous years paid in the
amount of EUR 20,572 in 2018.
Goran Katušin, a member of the management
board, received EUR 204,085 in total
remuneration (EUR 95,528 net) in 2018, of
which EUR 181,867 was fixed and EUR 22,218
was variable remuneration. The fixed
remuneration consisted of gross salary in the
amount of EUR 174,817 (net salary amounted
to EUR 82,324), annual leave allowance in the
amount of EUR 1,327, jubilee benefits in the
amount of EUR 460, voluntary supplementary

Annual report of SID Bank and the SID Bank Group 2018 | 157
pension insurance payments in the amount of
EUR 2,819, travel and meal allowances of EUR
1,804 and additional fringe benefits (voluntary
health insurance, accident insurance and
liability insurance) valued at EUR 640. All the
variable remuneration in the amount of EUR
22,218 was awarded and paid in 2018; no
deferred variable remuneration was paid to him
in 2018.
Jožef Bradeško, a member of the management
board until 31 December 2016, received
deferred variable remuneration from previous
years in the amount of EUR 19,584 in 2018.
2.6.4 Total amount spent on auditors
SID Bank SID Bank Group
2018 2017 2018 2017
Auditing of annual report 43 44 63 69
Other assurance services 8 14 12 23
Other non-audit services 102 69 102 69
Total 153 127 177 161
Under non-audit services SID Bank and the SID
Bank Group disclose their spending on auditors
in 2018 for the preparation of a risk model and
pricing policy for the Fund of Funds, advice, the
drafting of guidelines and other documentation
for individual instruments planned within the
framework of the investment strategy, and
training.
2.6.5 Events after the reporting period
There were no events after the reporting date
that could have had an impact on the individual
and consolidated financial statements of SID
Bank and of the SID Bank Group.

158 | Annual report of SID Bank and the SID Bank Group 2018
3 Risk management
Risk management in the SID Bank Group
The SID Bank Group’s risk management system
is based on an effective risk management
process that includes identifying, measuring or
assessing, managing and monitoring risks, as
well as internal and external risk reporting.
To this end, SID Bank has put in place a risk
management strategy that defines the basic
principles applying to the take-up and
management of SID Bank’s risk and establishes
a framework and basis for the drawing-up of
documents that define in detail the processes of
taking up and managing specific types of risks,
including the organisational rules applying to
the risk management process, the internal
control mechanisms, the steps taken to ensure
compliance and the public disclosure of
information relating to the Bank.
The management boards of other companies in
the SID Bank Group that carry out
complementary non-banking services are
primarily responsible for managing the risks
taken up by these other companies. In that
respect, they must pursue the strategic
objectives, achieve the planned operating
results and also manage risks in accordance
with the applicable legislation and the
guidelines of the SID Bank Group.
SID Bank’s approach to risk management
On the basis of the risk management strategy,
SID Bank has developed policies for managing
specific types of risk, as well as other bylaws
regulating the business processes in which the
Bank takes up risks. The policies and other
bylaws define the procedures, methods and
methodologies used by the Bank in the risk
management process for any type of risk.
The risk management strategy aims to put in
place an effective risk management process for
identifying, measuring or assessing, managing
and monitoring risk, including reporting on the
risks to which the Bank is or could be exposed
in its operations, by providing:
– (internal) definitions of specific types of risk;
– risk absorption capacity;
– risk appetite;
– a risk management action plan, i.e. risk
identification, measurement and/or
assessment, management and monitoring
procedures;
– appropriate internal control mechanisms;
– internal relations with regard to
responsibilities.
The key strategic focuses relating to risk, which
pay due regard to the Bank’s business model
and business strategy, are defined in the risk
absorption and risk appetite as presented below
as part of the management body’s concise
statement on SID Bank’s approach to the
realisation of risk appetite.
Risk absorption capacity is the largest overall
risk level that SID Bank is able to take up,
having regard for its available capital, liquidity,
risk management measures and control
environment, stress test results and other
restrictions on the take-up of risks.
When assessing its risk absorption capacity, SID
Bank takes into account:
− the assessment of the risk profile of SID
Bank in the context of which the overall
level of risk and the individual types of
material risk are comprehensively
identified at least once a year;
− the result of the internal capital adequacy
assessment process (ICAAP), including the
internal assessment of capital
requirements and the internal assessment
of capital to cover losses in the event of
materialisation of risks taken up, which
covers both ordinary SID Bank operations
and extraordinary events affecting SID
Bank operations;
− the Bank of Slovenia’s expectations after
each completed supervisory review and
evaluation process (SREP) in terms of
maintaining the total capital ratio and the
proportion of common equity Tier 1 capital
to cover the recognised assessment of
internal capital requirements, both of
which are prescribed by the Bank of
Slovenia within the context of the SREP;
− the leverage ratio;
− the result of the internal liquidity adequacy
assessment process (ILAAP) or liquidity of
the Bank with regard to its risk profile;

Annual report of SID Bank and the SID Bank Group 2018 | 159
− the plan of risk management activities,
which sets out the measures available for
the management of identified and
measured or assessed risks;
− other restrictions, including any restrictions
arising from SID Bank bylaws, from
regulations and standards, and from the
requirements of the Bank of Slovenia and
other competent or supervisory
authorities.
SID Bank carries out a comprehensive internal
capital adequacy assessment process, tailored
to the risks taken up, at least once a year, and
reports to the management body, thereby
ensuring that the risks taken up remain within
the limits of SID Bank’s risk absorption capacity.
The assessed risk absorption capacity is taken
into account when the business strategy is
being drafted and the business objectives and
risk appetite defined.
In accordance with its business strategy,
business objectives, risk absorption capacity
and risk management strategy, SID Bank takes
on risks in its operations within a long-term
sustainable target risk profile. It gives priority to
the security and stability of its operations to
maintain or increase the value of its equity in
the long term, maintain the Bank’s reputation,
and maximise the benefits for users of SID
Bank’s services and other stakeholders.
SID Bank’s risk appetite is defined in the
applicable SID Bank development strategy, its
annual operational plan and through internally
defined limits. SID Bank’s risk appetite, taking
into account its risk absorption capacity, is
assessed by SID Bank once a year, or more
frequently in the event of significant changes in
risk exposure.
Internal control mechanisms
Internal control mechanisms, the operation of
which is put in place for all SID Bank’s business
processes in proportion to the materiality and
risk of an individual business process, include:
− internal controls of the implementation of
the Bank’s organisational procedures,
business procedures and work procedures;
− internal control functions and services (the
internal audit department; the compliance
function, including the information security
function, which is organised within the
compliance department; the risk
management function organised within the
risk management department) report
directly to the Bank’s management board.
The purpose of internal controls is to ensure
systematic control over all of the Bank’s material
risks and to provide an independent and
objective assessment of effectiveness and
compliance with regard to the Bank’s internal
governance arrangements on the basis of a
review and assessment of the adequacy of risk
strategies and policies, the Bank’s risk
management processes, procedures and
methodologies, and reporting on risks.
Organisational aspects of the risk management process
SID Bank’s organisational structure and work
processes are such as to allow the business
objectives to be achieved at the same time as
the operations remain secure and compliant
with regulations. In the implementation of risk
management measures, the key objective is to
achieve proper awareness of risks at all levels
of the Bank’s activities. The risk management
structure in place includes an active role for the
supervisory board and the management board.
Within the Bank’s organisational structure, the
risk management framework or function is
organisationally separate from the commercial
units that take up risks, i.e. within the credit
process up to the level of the executive director,
who covers the organisational unit responsible
for the assessment of credit risks of individual
business entities and groups of connected
clients, while the risk management function at
the aggregate level of the Bank is directly
accountable to the Bank’s management board.
Regular participation in meetings of the
supervisory board is ensured when issues
relating to the risk management function are
discussed and in audit committee meetings, as
well as direct access to the chair of the
supervisory board and chair of the supervisory
board’s risk committee for the provision of
information on important circumstances that
affect or could affect the Bank’s risk profile.
Within the scope of their powers and duties
under the ZBan-2, the Bank’s management
board and supervisory board are responsible for
defining, adopting and regularly reviewing the
strategy and policies for take-up and

160 | Annual report of SID Bank and the SID Bank Group 2018
management of the risks to which the Bank is
or could be exposed in its operations, including
risks from the macroeconomic environment in
which the Bank operates, taking into account
the current business cycle. The risk
management strategy and policies include
guidelines on the take-up of risks, as well as
procedures and tools for managing the risks.
The risk management action plan is adopted by
the Bank’s management board with the consent
of the supervisory board, following consultation
with the supervisory board’s risk committee.
Regular quarterly reports on performance, on
risks and on movements on financial markets
are produced to provide the management board
and supervisory board with comprehensive
information regarding risk management issues.
The risk reports contain information regarding
SID Bank’s exposure to credit risk at the level of
the entire credit portfolio, including a detailed
analysis of individual and sectoral concentration
of the credit portfolio, the credit portfolio
structure by geographical area, credit rating,
currency risk, liquidity risk and interest rate risk,
and an assessment of any other risks. The
management board and the supervisory board
discuss and approve the result of the internal
capital adequacy assessment process (ICAAP)
and the internal liquidity adequacy assessment
process (ILAAP), and the Bank’s capital
adequacy and liquidity with regard to its risk
profile on an annual basis; the management
board is also briefed on risk management in the
context of the discussion and adoption of the
SID Bank Group’s annual report. In addition, the
Bank’s management board is regularly briefed
on and discusses the operational risk report,
and the management body is briefed on and
discusses the report on the engagement of
external vendors. The management body
discusses individual exposures or proposals to
increase exposure requiring approvals from the
management body, or in the event of any major
changes in the risks identified in accordance
with SID Bank’s articles of association.
The supervisory board is assisted in performing
its supervisory duties regarding risk
management by the risk committee, which
provides advice regarding the Bank’s general
risk appetite and risk management strategy,
supervises senior management regarding the
risk management strategy, and verifies whether
risks are taken into account in the incentives
within the scope of the remuneration system
and whether the prices of the Bank’s products
are compatible with its business model and with
the risk management strategy.
SID Bank has not set up a separate risk
management committee. Risks are dealt with by
three committees at SID Bank, which are of key
importance in the area of risk management: the
asset-liability and liquidity management
committee, the credit committee, and the
distressed investment management committee.
Committee meetings are typically held on a
weekly basis.
The asset-liability and liquidity management
committee provides guidance, supervision and
monitoring of risk management at the Bank,
including risk management at the aggregate
level of the Bank, balance-sheet structure and
capital adequacy. In order to manage credit,
interest-rate, operational, capital, profitability
and market risk, as well as any other risks at the
level of SID Bank, it is responsible, in particular,
for monitoring, analysing and assessing:
− the results of the Bank’s performance in
terms of achievement of the business
objectives;
− the structure of the Bank’s balance sheet;
− developments, changes and trends
regarding the Bank’s balance sheet;
− capital adequacy reports;
− reports on the Bank’s exposure to interest
rate risk, market risk, capital risk, credit
risk, operational risk and profitability risk;
− the Bank’s investments, by taking into
consideration profitability and risk as
regards realisation of the planned
objectives;
− the structure and performance of the
Bank’s products;
− the draft business plans and their
amendments under materially changed
operating conditions in individual areas of
the Bank’s operations;
− the Bank’s accounting policies and
principles;
− the consolidated financial statements of
the SID Bank Group;
− relations with related parties;
− trading volumes and the fulfilment of
related capital requirements;

Annual report of SID Bank and the SID Bank Group 2018 | 161
− the fulfilment of performance criteria in line
with regulations and the Bank’s business
policy;
− reports on open transactions and their
impact on liquidity ratios, and information
on transactions that failed to achieve
average or target interest margin;
− the utilisation and/or exceeding of the
limits, and the implementation of general
authorisations of treasury department staff
members;
− reports on the amount of allocated funds
with regard to funding contracts with
international financial development
institutions and Slovenia;
− reports on equity and quasi-equity
financing.
The criteria taken into consideration by the
asset-liability and liquidity management
committee in asset and liability management
include capital adequacy, profitability of
operations and performance of
products/services.
The credit committee is responsible for
managing credit risk for operations on behalf of
and for the account of SID Bank. It makes
decisions on proposals (regarding specific
investment operations) that have an impact on
the credit risk exposure of SID Bank and the SID
Bank Group, and discusses the reports on the
findings of periodic and in-depth monitoring,
the fulfilment or non-fulfilment of commitments,
the issuing of reminders, recovery, the
monitoring of collateral, and the impairment
and provisioning rates for existing and new
investment operations.
The distressed investment management
committee is responsible for managing problem
exposures handled by the distressed investment
management department, forbearances, and
cancellations and terminations of investment
operations as a result of a debtor’s financial
problems. It is also responsible for dealing with
the list of forborne and insolvent exposures,
reports on recoveries, collateral, and fulfilment
of the financial and other contractual
commitments applying to forborne transactions.
The general risk management framework is
described in the business section of the Risk
management chapter, where other bodies and
organisational units responsible for the direct
implementation of risk management are
specified.
3.1 Credit risk
As far as credit risk is concerned, SID Bank’s
operations are most exposed to the risk of
losses arising from a counterparty’s inability to
settle contractual liabilities by the originally
agreed deadline without the liquidation of
collateral. The Bank actively manages credit risk
by, among other things, eliminating any
deficiencies detected, improving management
procedures and methods, and upgrading risk
management methodology.
The umbrella document dealing with the
management of credit risk in SID Bank
operations is the Credit Risk Management
Policy. This policy defines the attitude to the
take-up of credit risk in relation to SID Bank’s
business objectives and strategies, risk
appetite, mechanisms and procedures for
identifying, measuring or assessing, monitoring,
managing and reporting on credit risks, and the
powers and responsibilities of the management
body, the relevant committees and individual
organisational units in relation to the
management of credit risk.
The documents integral to comprehensive
credit risk management at SID Bank include all
the applicable regulations and bylaws that
define in detail the credit risk management
methodologies, procedures and tools used by
SID Bank for the approval and securing of
investment operations, the monitoring and
management of the credit portfolio, the
determination of a debtor’s rating grade, the
classification of exposures, the calculation of
interest, the recovery of non-performing
exposures, etc. The Credit Risk Management
Policy also incorporates the main substantive
162 | Annual report of SID Bank and the SID Bank Group 2018
points of the applicable bylaws that address
credit risk management.
Operations relating to credit risk include all
active investment operations that give rise to
credit risk, i.e. loans, including contingent
liabilities and commitments given, deposits
placed, transactions involving investments in
securities that SID Bank manages for the
purpose of ensuring liquidity and asset-liability
management, and transactions involving
derivatives that the Bank uses exclusively for
the purpose of protecting open foreign-
exchange and interest-rate positions.
The level to which credit risk is taken on is
determined in accordance with the adopted risk
appetite, which is reflected through the limits
placed on exposure to credit risk. The scope of
the take-up of credit risk is monitored annually
by the management body as part of the process
of monitoring the annual operational plan and
the risk management strategy, and upon the
introduction of every new product.
From the point of view of the identification and
assessment or measurement of credit risk,
credit risk management at SID Bank comprises
activities connected with assessing debtors’
creditworthiness, compiling credit-rating
reports and assigning debtors to the
appropriate rating grades. The credit committee
or another competent body approves any
exposure in line with the authorisations for
approval of transactions as set out in SID Bank’s
bylaws and articles of association and in
accordance with the investment value and the
existing exposure.
As regards the limits on exposure to credit risk,
they first take account of the regulatory limits
under the applicable banking legislation
concerning the exposure to individual clients,
groups of connected clients or persons in a
special relationship with SID Bank. Credit risk
take-up is also limited by SID Bank’s articles of
association and its internal limits.
Classification of financial assets and commitments given into rating grades
SID Bank assesses clients’ credit quality after
making an assessment of the relevant
quantitative and qualitative elements. It places
them in one of 21 internal rating grades, which
are then combined into five rating pools from A
to E, in accordance with Bank of Slovenia
criteria.
The quantitative elements include an
assessment of the client’s financial and asset
positions, the efficiency and profitability of their
business operations and the anticipated future
trends. The qualitative elements take account of
all soft information on the client at the Bank’s
disposal. Before their loan is approved, all
clients are assigned the appropriate rating
grade. Their business operations are then
monitored for the lifetime of the loan and
ongoing assessments made to verify whether
the rating grade is still appropriate.
The Bank has developed credit risk assessment
methodologies for assigning ratings to clients
separately for corporates, banks and savings
banks, and investment projects. The credit
ratings of domestic public-sector entities are
derived from Slovenia’s sovereign credit rating.
Management of credit protection
Before entering into a contractual relationship,
SID Bank compiles an assessment of the
debtor’s creditworthiness, which constitutes the
primary source of repayment. Collateral serves
as a secondary source of loan repayment and is
not a replacement for the primary
creditworthiness of the debtor. The internal
rulebook on collateral for investment operations
is a document under which credit protection is
implemented in practice. It defines in detail:
− the types and conditions of acceptable
collateral with regard to the type of debtor
and the investment transaction;
− the competencies of specific organisational
units in accordance with the rules on
internal organisation;
− the ratio between the value of the
collateral and the value of the investment
transaction per type of collateral;
− the documentation required per individual
type of collateral so as to ensure the legal
certainty of the collateral;
− the methodology for valuing individual
types of collateral, which sets out the
method, monitoring and frequency of
valuation;
− the policy of regularly vetting the
independence and qualifications of
appraisers and the quality of their
valuations;

Annual report of SID Bank and the SID Bank Group 2018 | 163
− the types of collateral requiring a physical
inspection of the assets pledged as
collateral;
− the liquidation and/or termination of
collateral.
The level of detail of the breakdown of collateral
is unambiguously defined in the regulatory
requirements contained in the CRR and the
Bank of Slovenia’s regulations. For the purpose
of taking account of collateral in the assessment
of expected credit losses, SID Bank values at
zero any collateral that does not meet the
requirements of the Regulation on credit risk
management at banks and savings banks.
SID Bank values collateral at fair (market)
value. Commercial real estate is valued
pursuant to a valuation report compiled by an
independent certified appraiser in accordance
with valuation standards. Unless they serve as
collateral for non-performing exposures,
apartments with a value of up to EUR 250
thousand are valued in accordance with the
generalised market value as supplied by the
Surveying and Mapping Authority of the
Republic of Slovenia (GURS). For the purpose of
valuing apartments with a value of over EUR
250 thousand, and apartment buildings and
residential real estate serving as collateral for
non-performing exposures, SID Bank takes into
account the generalised market value supplied
by GURS if the independent certified appraiser
produces an opinion to the effect that the
generalised market value is appropriate. If the
independent certified appraiser assesses that
the generalised market value is not appropriate,
SID Bank obtains a valuation report. When
valuing real estate, SID Bank pays due regard
to the market value and, in the case of exposure
designated as non-performing, to the
liquidation value. Throughout the lifetime of an
exposure, SID Bank regularly monitors the
value of the assets pledged and assesses the
value of business and residential real estate at
least twice annually using statistical methods. In
the case of real estate serving as collateral for
an exposure in excess of EUR 3 million, or 5%
of the Bank’s regulatory capital, SID Bank
obtains the assessment of an independent
external appraiser at least every three years.
The Bank also obtains a reassessment from an
independent external appraiser whenever the
information at the Bank’s disposal indicates that
the value of the real estate may have materially
declined relative to the general level of market
prices. Securities traded on a regulated
securities market are valued at the average
price, in accordance with the Guidelines for
implementing the regulation on reporting by
monetary financial institutions. Non-marketable
equities and participating interests in a
company are valued pursuant to a valuation
report compiled by an independent certified
appraiser in accordance with valuation
standards. Equipment, plant and vehicles are
valued pursuant to a purchase agreement or
invoice between unconnected parties, where
the agreement or invoice may not be more than
one year old, or a valuation report compiled by
an independent certified appraiser in
accordance with valuation standards. SID Bank
values inventories pursuant to an authentic
monthly printout from the client’s accounting
records. Patents, trademarks and models are
valued pursuant to a valuation report compiled
by an independent certified appraiser in
accordance with valuation standards. Assigned
receivables are valued pursuant to monthly
reports by clients, without taking into account
past-due claims and claims against legal or
natural persons that comprise a group of
connected clients with the client. Sureties and
guarantees are valued in accordance with the
value of exposure or the contractual amount of
the surety or guarantee, whichever is lower. SID
Bank gives a value exceeding EUR 0 for the
guarantees of legal persons only if the rating
grade of the legal entity giving the guarantee is
higher than BBB-, based on the internal credit
risk assessment methodology. Guarantees from
natural persons are valued at zero. Deposits are
valued in accordance with the balance of the
deposit. SID Bank’s insurance policy issued for
the account of Slovenia for insurance against
commercial risks is valued at the level of the
Slovenian government guarantee for
commercial risk, as set out in the insurance
contract.
Only collateral whose maturity is longer than
the maturity of the investment transaction is
considered by the Bank to be eligible collateral.
The currency of the collateral is, as a rule,
identical to the currency of the investment
transaction. In the event of a currency
mismatch, the Bank has a specified higher ratio
164 | Annual report of SID Bank and the SID Bank Group 2018
in place between the amount of collateral and
the amount of the investment transaction.
Throughout the lifetime of the exposure, SID
Bank monitors the debtor’s rating grade and the
coverage of the exposure by collateral. Should
the value of the collateral fall, the SID Bank
Group takes action to establish additional
collateral as appropriate. If the ratio between
the value of overall collateral arising from a
specific investment transaction and the current
exposure declines by more than 50% relative to
the ratio that existed at the time the investment
transaction was approved, this can also provide
grounds for placing the debtor concerned on the
watch list.
The collateral for exposures of other SID Bank
Group companies is monitored in the analytical
accounts of each company.
When calculating the capital requirement for
credit risk using the standardised approach, SID
Bank does not take into account a reduction in
risk-weighted assets as a result of the effects of
credit protection.
Estimation of expected credit losses
For the estimation of expected credit losses, SID
Bank has put in place its own methodology in
accordance with IFRS 9, which is defined in the
internal rulebook, and includes:
- classification of exposures into stages for the
purpose of estimating expected credit
losses, including the definition of a
methodology for assessing a significant
increase in credit risk;
- segmentation of the portfolio for the
calculation of expected credit losses (PD and
LGD segments);
- modelling of probability of default (PD) and
loss given default (LGD);
- calculation of expected credit losses; and
- back-testing.
The estimation of expected credit losses is
defined in more detail under section 2.3.11
(Impairments of financial assets and
provisions).
Credit risk monitoring
SID Bank carries out regular and in-depth
monitoring of credit risk. Regular monitoring of
credit risk includes daily monitoring to ensure
that the debtor’s rating grade remains
appropriate, the monitoring of financial and
other contractual commitments, verification of
the adequacy and amount of additional
collateral, and the monitoring and updating of
groups of connected clients. SID Bank carries
out in-depth monitoring when it detects a
serious breach of contractual obligations, a
deterioration in the debtor’s financial and asset
position, an increase in the risk derived from the
purpose-specific use of the loan, or other
circumstances that affect or may affect the
debtor’s business operations and the successful
conclusion of the investment transaction.
SID Bank regularly carries out in-depth
monitoring on the basis of a list approved by the
credit committee. When creating a watch list,
the amount and maturity of an investment
transaction, the client’s rating grade and other
criteria that entail a client being placed on a
watch list and that affect the credit risk are
taken into account.
Early warning system for detecting an increased credit risk
SID Bank has put in place an early warning
system (EWS) as part of its credit risk
management system that allows early detection
of increased credit risk for any exposure and
potential defaulter. The early warning system is
based on internally defined criteria for inclusion
on or removal from the list that enable SID Bank
to identify any potential difficulties in debt
repayment at an early stage and to try to
prevent any further deterioration in the credit
quality of the exposure by taking timely
corrective measures and monitoring the
implementation of measures so that the client
does not move to a position of default.
SID Bank monitors exposures with an increased
credit risk on the watch list and the transitional
list of defaulters discussed on a weekly basis by
the credit committee. If, after successfully
performing the relevant measures, a client no
longer meets any of the criteria for being placed
on the watch list, they are returned to ordinary
treatment again, or are reclassified as non-
performing loans if they meet the criteria for
reclassification of the exposure as a non-
performing loan.
Annual report of SID Bank and the SID Bank Group 2018 | 165
Management of non-performing exposures
The criteria for categorising exposures as non-
performing are aligned with Basel and EBA
guidelines. In the event that an exposure
associated with increased risk is classified as a
non-performing loan following a decision of the
credit committee, it is assigned to a special
organisational unit, the distressed investment
management department, which carries out an
economic and legal review of the exposure on
the basis of internally defined criteria. In every
case, an internal plan on possible solutions for
that exposure is drafted and, on the basis of an
appropriate analysis, either a process of
forbearance of the exposure or a process of
recovery is initiated.
Forbearance of an investment operation is
typically connected with the financial,
ownership or operational restructuring of the
debtor in accordance with the guidelines of the
Bank of Slovenia and the Bank Association of
Slovenia.
In the forbearance procedure, and in line with
the forbearance plan, SID Bank agrees with the
client on any amendments to the terms of the
original contract, either by modifying the terms
of the original contract or by signing a new
contract under which the contracting parties
agree partial or full repayment of the original
debt. Potential actions for the forbearance of
claims include:
− an extension of the deadline or a deferral
of the repayment of the claims;
− a reduction in the interest rate and/or
other charges;
− a reduction in the amount of the claims as
a result of contractually agreed debt
forgiveness and ownership restructuring;
− conversion of the claims into an equity
investment in the debtor;
− the takeover of other assets (including
through the liquidation of collateral) for
partial or full repayment of the claims;
− other activities.
In the majority of cases, SID Bank forms part of
the core group of banks in which it actively
collaborates with management boards and
external consultants. When negotiating
forbearance, the Bank ensures that Slovenian
corporate debt restructuring principles,
prepared by the Bank of Slovenia together with
the Bank Association of Slovenia, are
implemented in a consistent manner. As regards
micro, small and medium-sized enterprises, the
Bank also pays due regard to the Restructuring
guidelines for micro, small and medium-sized
companies (MSME) and the Bank of Slovenia’s
Handbook for effective management and
workout of MSME non-performing loans.
After transactions have been classified as non-
performing loans, SID Bank monitors them on
special lists; these are the transitional list, the
list of forborne exposures and the list of
insolvent exposures, which are discussed on a
weekly basis by the distressed investment
management committee.
In relation to the management of problem
exposures, SID Bank has drawn up a strategy
for managing problem exposures and a plan for
reducing non-performing exposures for a period
of three years. This plan indicates that there has
been a reduction in non-performing exposures
as a result of their active management. When
preparing the plan for reducing non-performing
exposures, SID Bank took into account, among
other things, the expectations regarding write-
offs, repayments from collateral, disposal of the
exposure, repayments from continuing
operations, etc.
Segmentation of the portfolio of non-performing
exposures designated as non-performing loans
takes place in three stages: In the first stage,
the non-performing loans are divided into micro
exposures and other exposures; in the second
stage they are classified into simple and
complex non-performing loans; and the third
stage involves an assessment of the
sustainability of the debtor’s business model
and the type of credit protection for the
exposure. SID Bank identifies as debtors with a
sustainable business model those debtors with
the ability to generate cash flow from their core
activity and to service the financial debt at the
same time. SID Bank identifies as debtors with
an unsustainable business model those debtors
that do not have the ability to generate cash
flow from their core activity. It further classifies
them based on their expected or current status,
i.e. whether bankruptcy proceedings, removal
from the commercial register or regular or
compulsory composition have been initiated
against the debtor.

166 | Annual report of SID Bank and the SID Bank Group 2018
Recovery procedure
Recovery takes place in accordance with
internal procedures and may vary from case to
case. It is divided into extra-judicial and judicial
recovery. The method of recovery chiefly
depends on the type of collateral, the length of
the delay, the degree of cooperation displayed
by the debtor, and the amount of any past-due
and outstanding exposures of SID Bank to the
debtor.
Irrespective of the recovery method and the
person performing the recovery, each recovery
begins with a verbal and written reminder to the
debtor. In the event that the procedure of
issuing reminders is unsuccessful or the
exposure could not be forborne, procedures are
initiated to ensure the repayment of past-due
exposures in default from collateral
instruments.
If extra-judicial recovery is not successful,
judicial recovery is initiated and headed by the
distressed investment management
department. It starts by establishing the
available assets of the debtor, and then files
claims and motions for enforcement, performs
other activities in the judicial recovery
procedure, and registers claims against the
debtor in a compulsory composition,
bankruptcy, liquidation or other appropriate
procedure.
Management and monitoring of credit risk
SID Bank manages credit risk in several ways:
– by determining the risk appetite and the
risk appetite indicators;
– by setting internal limits in order to limit
the concentration of exposure for specific
segments, economic sectors and
geographical areas;
– by taking into account the limits of
exposure to individual clients, groups of
connected clients and shadow banking
entities;
– by establishing collateral;
– by identifying the risk posed by a specific
client and creating impairments and
provisions for on-balance-sheet assets or
off-balance-sheet liabilities;
– by ensuring sufficient capital to cover
unexpected credit risk losses.
The monitoring of credit risk begins upon the
conclusion of a contractual relationship in the
process of credit risk take-up, and ends on the
day all of the client’s contractual and other
obligations have been performed.
In credit operations, limits are not
predetermined or determined in general; rather,
creditworthiness is determined when an
individual investment operation is reviewed with
reference to the company’s calculated
borrowing capacity, which includes an
assessment of long-term sustainable annual
cash flow, less the normalised volume of
replacement investments, normalised taxes,
long-term expected dividends and gains, and
the current and envisaged financial debt.
Credit risk from securities arises from the
portfolio managed by SID Bank for the purpose
of ensuring liquidity and asset and liability
management. SID Bank manages this credit risk
primarily by means of limits on exposure with
regard to the issuer’s credit rating, the issuer’s
location, the type of issuer, the type of
instrument, and the monitoring of the market
values of securities. The system of limits in this
area is designed so as to ensure investment
primarily in debt securities of higher credit
quality. Generally speaking, it does not allow
any investment in financial instruments of
foreign issuers without a credit rating from an
international rating agency.
SID Bank has no financial instruments held for
trading. Counterparty credit risk is also taken
into account when settling transactions in
securities and in relation to derivatives. SID
Bank calculates its credit exposure arising from
derivatives using the original exposure method,
according to which the exposure value is the
notional amount of each instrument multiplied
by the percentages set out in Article 275 of the
CRR.
The business model and business strategy
adopted by SID Bank entails increased
concentration, which is accepted with full
awareness for the following:
– groups of clients and sectors that are
involved in Slovenia’s exports to an above-
average degree;
– certain countries that are major
destinations for Slovenia’s merchandise

Annual report of SID Bank and the SID Bank Group 2018 | 167
exports, exports of services and outward
FDI;
– banks involved in transactions referred to
in the two previous indents, and exposures
to banks established in Slovenia, if the
banks transfer the funding obtained to final
beneficiaries under the Slovene Export and
Development Bank Act or another law.
Maximum exposure to credit risk
SID Bank SID Bank Group
31 Dec 2018 Maximum credit risk Collateral
Other
credit enhance-
ments
Overall reduction in
credit risk Maximum credit risk Collateral
Other
credit enhance-
ments
Overall reduction in
credit risk
Gross on-balance-sheet exposures 2,327,410 508,089 95,669 603,758 2,327,406 508,089 95,669 603,758
Cash, cash balances at central banks and other demand deposits at banks 121,184 0 0 0 121,184 0 0 0
Non-trading financial assets mandatorily at fair value through profit or loss 15,667 25,882 0 25,882 15,667 25,882 0 25,882
Loans and advances to customers 15,667 25,882 0 25,882 15,667 25,882 0 25,882
Financial assets measured at fair value through other comprehensive income 651,126 0 10,347 10,347 651,126 0 10,347 10,347
Debt securities 651,126 0 10,347 10,347 651,126 0 10,347 10,347
Financial assets measured at amortised cost 1,539,433 482,207 85,322 567,529 1,539,429 482,207 85,322 567,529
Loans and advances to banks 810,041 0 14,643 14,643 810,041 0 14,643 14,643
Loans and advances to customers 727,539 482,207 70,659 552,866 727,539 482,207 70,659 552,866
Other financial assets 1,853 0 20 20 1,849 0 20 20
Gross off-balance-sheet exposures 275,760 11,523 33,555 45,078 275,760 11,523 33,555 45,078
Guarantees 66,790 0 33,385 33,385 66,790 0 33,385 33,385
Assets: undrawn loans 196,970 11,523 170 11,693 196,970 11,523 170 11,693
EIF 12,000 0 0 0 12,000 0 0 0
Total gross credit risk exposure 2,603,170 519,612 129,224 648,836 2,603,166 519,612 129,224 648,836
SID Bank SID Bank Group
31 Dec 2017
Maximum
credit risk Collateral
Other credit enhance-
ments
Overall reduction in
credit risk
Maximum
credit risk Collateral
Other credit enhance-
ments
Overall reduction in
credit risk
Gross on-balance-sheet exposures 2,559,840 695,771 26,569 722,340 2,589,455 695,771 26,569 722,340
Balances at central bank and sight deposits at banks 71,071 0 0 0 75,950 0 0 0
Available-for-sale financial assets (under IAS 39) 714,287 0 8,129 8,129 733,770 0 8,129 8,129
Debt securities 714,287 0 8,129 8,129 733,770 0 8,129 8,129
Loans and advances (under IAS 39) 1,774,482 695,771 18,440 714,211 1,779,735 695,771 18,440 714,211
Loans and advances to banks 1,039,767 0 2,543 2,543 1,045,019 0 2,543 2,543
Loans and advances to customers 733,162 695,771 15,897 711,668 733,162 695,771 15,897 711,668
Other financial assets 1,553 0 0 0 1,554 0 0 0
Gross off-balance-sheet exposures 74,271 3,866 219 4,085 74,271 3,866 219 4,085
Guarantees 13,863 0 0 0 13,863 0 0 0
Assets – undrawn loans 48,408 3,866 219 4,085 48,408 3,866 219 4,085
EIF 12,000 0 0 0 12,000 0 0 0
Total gross credit risk exposure 2,634,111 699,637 26,788 726,425 2,663,726 699,637 26,788 726,425
In line with the transitional provisions of IFRS 9,
data for the previous year is not restated in
accordance with the new standard, therefore
the on-balance sheet items for the previous
year are presented in accordance with the
accounting templates that were in force in the
previous year. As a result of material differences
between IFRS 9 and IAS 39 regarding the
method by which financial instruments are
recognised, the figures are not comparable. The
data for the previous year is therefore
presented in a separate table.
The table shows that the largest exposure to
credit risk on the part of SID Bank and the SID
Bank Group as at 31 December 2018 arose from

168 | Annual report of SID Bank and the SID Bank Group 2018
balances at the central bank, financial assets
mandatorily at fair value through profit or loss,
financial assets measured at fair value through
other comprehensive income, financial assets
measured at amortised cost, and off-balance-
sheet liabilities, without taking into
consideration credit protection.
As at 31 December 2018, SID Bank’s exposure
to credit risk had fallen by EUR 30,941 thousand
in comparison with 31 December 2017.
Exposure from loans and other financial assets
measured at amortised cost and loans
mandatorily at fair value through profit or loss
fell by EUR 219,382 thousand, exposure from
debt securities measured at fair value through
other comprehensive income fell by EUR 63,161
thousand, exposure from off-balance-sheet
liabilities rose by EUR 201,489 thousand and
exposure from balances at the central bank rose
by EUR 50,113 thousand.
The introduction of IFRS 9 was one of the
factors affecting the reduction in exposure from
loans. Owing to a failure to pass the SPPI test,
a portion of the on-balance-sheet item loans
measured at amortised cost under IAS 39 were
reclassified into the category of financial assets
mandatorily at fair value through profit or loss.
Collateral as disclosed in the table includes
collateral in the form of residential real estate,
commercial real estate, shares and participating
interests, bank deposits, other material assets
and other forms of collateral.
Other credit enhancements as shown in the
table include collateral in the form of irrevocable
Slovenian government guarantees and financial
guarantees that are not irrevocable Slovenian
government guarantees.
When estimating expected credit losses for
exposures assigned to stages 1 and 2, SID Bank
takes collateral into account in the calculation of
the loss-given-default (LGD) curves for each
homogeneous LGD segment. When calculating
the loss-given-default (LGD) curves, SID Bank
reduces the value of the collateral by the haircut
(HC) determined for each type of collateral, and
also incorporates forward-looking information
when determining the value of the collateral.
When determining the haircut (HC), SID Bank
largely takes into account the Guidelines for
calculating default rate and loss rate issued by
the Bank of Slovenia. In the case of collateral in
the form of material assets and other forms of
collateral, SID Bank mostly takes account of a
haircut (HC) in the amount of 95%.
When estimating expected credit losses for
exposures assigned to stage 3, where the
expected credit losses are calculated using the
collateral assessment methodology, SID Bank
determines the collateral value in the same way
as for the calculation of the loss-given-default
(LGD) curves.
For the situation as at 31 December 2018, SID
Bank applied the collateral assessment
methodology when calculating the expected
credit losses for 45 of the total of 67 exposures
assigned to stage 3.
The estimation of expected credit losses is
defined in more detail under section 2.3.11
(Impairments of financial assets and
provisions).
As at 31 December 2018, the value of the
collateral amounted to EUR 560,596 thousand
for exposures assigned to stage 1, EUR 33,524
thousand for exposures assigned to stage 2 and
EUR 28,834 thousand for exposures assigned to
stage 3. The value of collateral for financial
assets mandatorily at fair value through profit
or loss amounted to EUR 25,882 thousand as at
31 December 2018.

Annual report of SID Bank and the SID Bank Group 2018 | 169
Types of credit protection
SID Bank and SID Bank Group
31 Dec 2018
Collateral in
the form of irrevocable Slovenian
government guarantees
Collateral in
the form of financial
guarantees
that are not irrevocable Slovenian
government guarantees
Collateral in the form of
commercial real estate
Collateral in the form of
residential real estate
Collateral in the form of shares and
participating interests
Collateral in the form of
bank deposits
Collateral in the form of
other
material assets
Other forms of collateral Total
Financial assets 28,304 67,365 236,454 5,032 77,057 4,210 77,573 107,763 603,758
Non-trading financial assets mandatorily at fair value through profit or loss 0 0 22,845 216 0 0 1,635 1,186 25,882
Loans and advances to customers 0 0 22,845 216 0 0 1,635 1,186 25,882
Financial assets measured at fair value through other
comprehensive income 214 10,133 0 0 0 0 0 0 10,347
Debt securities 214 10,133 0 0 0 0 0 0 10,347
Financial assets measured at amortised cost 28,090 57,232 213,609 4,816 77,057 4,210 75,938 106,577 567,529
Loans and advances to banks 14,643 0 0 0 0 0 0 0 14,643
Loans and advances to customers 13,447 57,212 213,609 4,816 77,057 4,210 75,938 106,577 552,866
Other financial assets 0 20 0 0 0 0 0 0 20
Off-balance-sheet liabilities 170 33,385 0 0 0 0 6,421 5,102 45,078
Guarantees 0 33,385 0 0 0 0 0 0 33,385
Assets: undrawn loans 170 0 0 0 0 0 6,421 5,102 11,692
Total 28,474 100,750 236,454 5,032 77,057 4,210 83,994 112,865 648,836
The total value of SID Bank’s collateral
amounted to EUR 648,836 thousand as at 31
December 2018, a fall of EUR 77,589 thousand
in comparison with 31 December 2017. The
collateral meets the requirements of the
Regulation on credit risk management at banks
and savings banks for the purpose of taking
account of credit protection in the assessment
of expected credit losses.
On 31 August 2018, SID Bank undertook a
revaluation of real estate accepted as collateral
for which an appraisal report had been
produced prior to 1 January 2018, and did so
using a statistical method.
Collateral in the form of commercial real estate
accounts for the highest single share in terms
of volume, followed by other forms of collateral,
financial guarantees that are not irrevocable
Slovenian government guarantees, other
material assets, shares and participating
interests, irrevocable Slovenian government
guarantees, residential real estate and bank
deposits.
As regards collateral in the form of irrevocable
Slovenian government guarantees, collateral in
the form of SID Bank insurance policies issued
for the account of Slovenia to insure against
commercial risks accounts for the highest single
share in terms of volume.
As regards collateral in the form of financial
guarantees that are not irrevocable Slovenian
government guarantees, collateral in the form
of a sovereign limited conditional subsidiary
guarantee accounts for the highest single share
in terms of volume, followed by bank
guarantees, ECB, state and central bank
guarantees, which are assigned a risk rating of
0 or 1 under the minimum export insurance
premiums (MEIP) listing, and guarantees of
legal persons whose rating grade is higher than
BBB, on the basis of the internal credit risk
assessment methodology.
As regards collateral in the form of material
assets, collateral in the form of the pledging of
inventories accounts for the highest single share
in terms of volume, followed by collateral in the
form of the pledging of equipment, plant and
vehicles.
As regards other forms of collateral, collateral in
the form of the assignment of claims accounts
for the highest single share in terms of volume,
followed by collateral in the form of a lien on
other rights (patents, trademarks, models).

170 | Annual report of SID Bank and the SID Bank Group 2018
In 2018 SID Bank updated its collateral policy in
line with the amendments to the Regulation on
credit risk management at banks and savings
banks and the Guidelines for implementing the
regulation on reporting by monetary financial
institutions.
Securing of loans and claims
SID Bank SID Bank Group
Fully secured and over-secured loans
Unsecured and under-secured loans
Fully secured and over-secured loans
Unsecured and under-secured loans
31 Dec 2018
Net value of loans
and receivables
Fair value
of collateral
Net value
of loans and claims
Fair value
of collateral
Net value
of loans and claims
Fair value
of collateral
Net value of
loans and claims
Fair value
of collateral
Financial assets measured at amortised cost
Loans and advances to banks 4,939 4,960 804,411 9,683 4,939 4,960 804,411 9,683
Loans and advances to customers 221,554 476,591 469,566 76,275 221,554 476,591 469,566 76,275
Other financial assets 20 20 1,833 0 20 20 1,829 0
Total 226,513 481,571 1,275,810 85,958 226,513 481,571 1,275,806 85,958
SID Bank SID Bank Group
Fully secured and over-secured loans
Unsecured and under-secured loans
Fully secured and over-secured loans
Unsecured and under-secured loans
31 Dec 2017
Net value of loans
and claims
Fair value of
collateral
Net value of loans
and claims
Fair value of
collateral
Net value of loans
and claims
Fair value of
collateral
Net value of loans and
claims
Fair value of
collateral
Loans and advances
(under IAS 39)
Loans and advances to banks 0 0 1,032,179 2,543 0 0 1,045,019 2,543
Loans and advances to customers 230,027 609,093 367,713 91,827 230,027 609,093 367,713 91,827
Other financial assets 0 0 1,553 0 0 0 1,554 0
Total 230,027 609,093 1,401,445 94,370 230,027 609,093 1,414,286 94,370
Fully secured and over-secured loans are loans
and other financial assets measured at
amortised cost, where the fair value of the
collateral is higher than or equal to the gross
carrying amount of the loan or other financial
asset. Unsecured and under-secured loans are
loans and other financial assets measured at
amortised cost, where the fair value of the
collateral is lower than the gross carrying
amount of the loan or other financial asset.
A large part of SID Bank’s portfolio of loans and
other financial assets measured at amortised
cost comprises loans to banks established in
Slovenia, which transfer the funding thus
obtained to the final beneficiaries under the
ZSIRB. The above loans are generally
unsecured. As at 31 December 2018, secured
loans to banks were loans to foreign banks
secured by SID Bank insurance policies issued
for the account of the Republic of Slovenia to
insure against commercial risks.
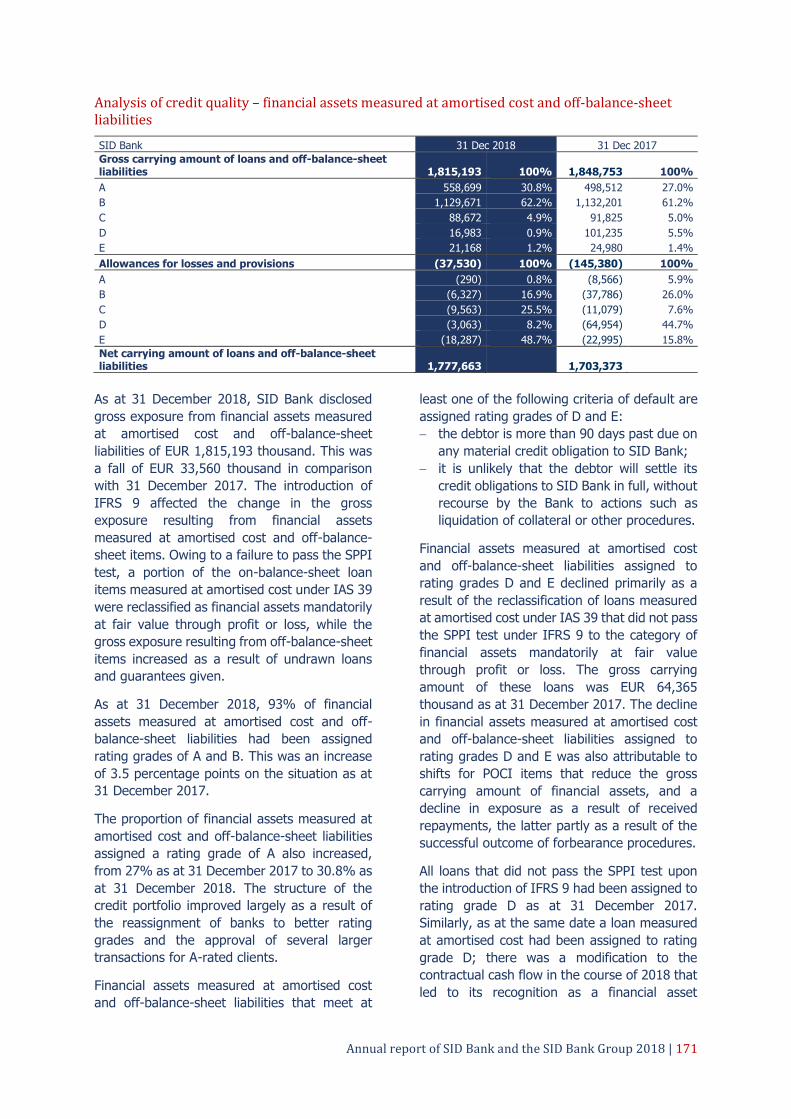
Annual report of SID Bank and the SID Bank Group 2018 | 171
Analysis of credit quality – financial assets measured at amortised cost and off-balance-sheet liabilities
SID Bank 31 Dec 2018 31 Dec 2017
Gross carrying amount of loans and off-balance-sheet liabilities 1,815,193 100% 1,848,753 100%
A 558,699 30.8% 498,512 27.0%
B 1,129,671 62.2% 1,132,201 61.2%
C 88,672 4.9% 91,825 5.0%
D 16,983 0.9% 101,235 5.5%
E 21,168 1.2% 24,980 1.4%
Allowances for losses and provisions (37,530) 100% (145,380) 100%
A (290) 0.8% (8,566) 5.9%
B (6,327) 16.9% (37,786) 26.0%
C (9,563) 25.5% (11,079) 7.6%
D (3,063) 8.2% (64,954) 44.7%
E (18,287) 48.7% (22,995) 15.8%
Net carrying amount of loans and off-balance-sheet liabilities 1,777,663 1,703,373
As at 31 December 2018, SID Bank disclosed
gross exposure from financial assets measured
at amortised cost and off-balance-sheet
liabilities of EUR 1,815,193 thousand. This was
a fall of EUR 33,560 thousand in comparison
with 31 December 2017. The introduction of
IFRS 9 affected the change in the gross
exposure resulting from financial assets
measured at amortised cost and off-balance-
sheet items. Owing to a failure to pass the SPPI
test, a portion of the on-balance-sheet loan
items measured at amortised cost under IAS 39
were reclassified as financial assets mandatorily
at fair value through profit or loss, while the
gross exposure resulting from off-balance-sheet
items increased as a result of undrawn loans
and guarantees given.
As at 31 December 2018, 93% of financial
assets measured at amortised cost and off-
balance-sheet liabilities had been assigned
rating grades of A and B. This was an increase
of 3.5 percentage points on the situation as at
31 December 2017.
The proportion of financial assets measured at
amortised cost and off-balance-sheet liabilities
assigned a rating grade of A also increased,
from 27% as at 31 December 2017 to 30.8% as
at 31 December 2018. The structure of the
credit portfolio improved largely as a result of
the reassignment of banks to better rating
grades and the approval of several larger
transactions for A-rated clients.
Financial assets measured at amortised cost
and off-balance-sheet liabilities that meet at
least one of the following criteria of default are
assigned rating grades of D and E:
− the debtor is more than 90 days past due on
any material credit obligation to SID Bank;
− it is unlikely that the debtor will settle its
credit obligations to SID Bank in full, without
recourse by the Bank to actions such as
liquidation of collateral or other procedures.
Financial assets measured at amortised cost
and off-balance-sheet liabilities assigned to
rating grades D and E declined primarily as a
result of the reclassification of loans measured
at amortised cost under IAS 39 that did not pass
the SPPI test under IFRS 9 to the category of
financial assets mandatorily at fair value
through profit or loss. The gross carrying
amount of these loans was EUR 64,365
thousand as at 31 December 2017. The decline
in financial assets measured at amortised cost
and off-balance-sheet liabilities assigned to
rating grades D and E was also attributable to
shifts for POCI items that reduce the gross
carrying amount of financial assets, and a
decline in exposure as a result of received
repayments, the latter partly as a result of the
successful outcome of forbearance procedures.
All loans that did not pass the SPPI test upon
the introduction of IFRS 9 had been assigned to
rating grade D as at 31 December 2017.
Similarly, as at the same date a loan measured
at amortised cost had been assigned to rating
grade D; there was a modification to the
contractual cash flow in the course of 2018 that
led to its recognition as a financial asset

172 | Annual report of SID Bank and the SID Bank Group 2018
mandatorily at fair value through profit or loss
as a result of the failure to pass the SPPI test.
As at 31 December 2018, SID Bank disclosed
impairments for credit losses on financial assets
measured at amortised cost and provisions for
off-balance-sheet liabilities amounting to EUR
37,530 thousand. This was a fall of EUR
107,850 thousand in comparison with 31
December 2017.
The overall effect of the introduction of IFRS 9
on allowances for credit losses and provisions
from the transition to IFRS 9 as at 1 January
2018 amounted to EUR 121,843 thousand, as
follows:
– in respect of financial assets measured at
amortised cost and off-balance-sheet
liabilities that remained measured at
amortised cost and were not classified as
POCI items upon the transition to IFRS 9,
allowances for credit losses and provisions
in the amount of EUR 46,428 thousand
were reversed,
– in respect of financial assets measured at
amortised cost that were classified as POCI
items upon the transition to IFRS 9,
allowances for credit losses in the amount
of EUR 29,578 thousand were used for the
recognition of those loans in net value with
a credit-adjusted effective interest rate;
– in respect of financial assets measured at
amortised cost that did not pass the SPPI
test upon the transition to IFRS 9 and that
under IFRS 9 are mandatorily at fair value
through profit or loss, allowances for credit
losses in the amount of EUR 45,837 were
used for the valuation of those loans to fair
value.
SID Bank held total allowances for credit losses
and provisions in the amount of EUR 37,530
thousand as at 31 December 2018. Allowances for credit losses on loans granted and other
financial assets measured at amortised cost amounted to EUR 37,110 thousand, while
provisions for off-balance-sheet liabilities
amounted to EUR 420 thousand.
As at 1 January 2018, allowances for credit
losses on loans and other financial assets and provisions for off-balance-sheet liabilities
amounted to EUR 23,537 thousand upon the introduction of IFRS 9. Allowances for credit
losses on loans granted and other financial
assets measured at amortised cost amounted to
EUR 23,301 thousand, and increased by EUR
13,809 thousand in 2018. Provisions for off-
balance-sheet liabilities amounted to EUR 236 thousand as at 1 January 2018 and increased
by EUR 184 thousand in 2018.
The derecognition of POCI items repaid in 2018
had the greatest impact on the increase in
allowances for credit losses on loans and other financial assets measured at amortised cost in
2018. As at 1 January 2018, these POCI items
had a positive allowance value.
Under IFRS 9, a bank is obliged, for POCI items, to recognise the amount of the change in the
lifetime expected credit losses on the financial
instrument in profit or loss as an impairment gain or loss. A bank is obliged to recognise
favourable changes to lifetime expected credit losses of the financial instrument as an
impairment gain, even if the lifetime expected
credit losses are lower than the amount of the expected losses included in the estimated cash
flows at initial recognition. Under IFRS 9, POCI items are initially recognised at fair value in the
statement of financial position. Upon subsequent measurement, this represents the
basis for measurement at amortised cost. Under
this rule, POCI items had to be recognised, upon transition to IFRS 9 on 1 January 2018, at the
fair value calculated on the date of recognition
and not on the date of transition to IFRS 9.
As at 1 January 2018, SID Bank disposed of 24
exposures under POCI items, including 11
performing exposures where the total allowance
was positive and amounted to EUR 6,246
thousand. In 2018 SID Bank derecognised ten
POCI items, which included nine performing
exposures and one non-performing exposure,
and recognised a POCI item that had been
repaid by the end of 2018. As at 31 December
2018, the allowance from POCI items was
negative and amounted to EUR 4,961 thousand.
In 2018 the significant increase in the credit risk
of individual financial assets in the period from
initial recognition, and their consequent
assignment to Stage 2, where impairments are
measured on the basis of the lifetime expected
credit losses on the financial instrument, and
the recognition of new financial assets also had
an impact on the increase in allowances for
credit losses on loans and other financial assets
measured at amortised cost.
The largest factor in the decline in allowances
for credit losses on loans and other financial

Annual report of SID Bank and the SID Bank Group 2018 | 173
assets measured at amortised cost and
assigned to stage 3 (non-performing financial
assets), where impairments for credit losses are
measured on the basis of the lifetime expected
credit losses on the financial instrument, was
the derecognition of one exposure in which a
modification to the contractual cash flows in the
course of 2018 led to its recognition as a
financial asset mandatorily at fair value through
profit or loss as a result of the failure to pass
the SPPI test.
The estimation of expected credit losses is
defined in more detail under section 2.3.11
(Impairments of financial assets and
provisions).
Analysis of credit quality – non-trading financial assets mandatorily at fair value through profit or loss
31 Dec 2018 SID Bank and SID
Bank Group
D 15,667
Net carrying amount 15,667
Analysis of credit quality – financial assets measured at fair value through other comprehensive income
31 Dec 2018
SID Bank and SID Bank Group
Stage 1 Total
Gross carrying amount: debt securities 651,126 651,126 100%
A 635,440 635,440 97.6%
B 15,686 15,686 2.4%
Impairments for credit losses (255) (255) 100%
A (161) (161) 63.1%
B (94) (94) 36.9%
Net carrying amount: fair value 650,871 650,871
As at 31 December 2018, SID Bank disclosed
gross exposure from financial assets measured
at fair value through other comprehensive
income amounting to EUR 651,126 thousand.
Under IFRS 9, a bank is obliged to estimate
expected credit losses on financial assets
measured at fair value through other
comprehensive income.
As at 31 December 2018, all financial assets
measured at fair value through other
comprehensive income had been assigned to
stage 1 (no significant increase in credit risk
since the initial recognition), where impairments
for credit losses are measured on the basis of
12-month expected credit losses. Impairments
for credit losses on financial assets measured at
fair value through other comprehensive income
amounted to EUR 255 thousand as at 31
December 2018.
Analysis of credit quality – financial assets measured at amortised cost – loans and advances to banks
31 Dec 2018
SID Bank and SID Bank Group
Stage 1 Total
Gross carrying amount 810,041 810,041 100%
A 210,948 210,948 26.0%
B 599,093 599,093 74.0%
Allowances for losses (691) (691) 100%
A (54) (54) 7.8%
B (637) (637) 92.2%
Net carrying amount 809,350 809,350

174 | Annual report of SID Bank and the SID Bank Group 2018
As at 31 December 2018, SID Bank disclosed
exposure from financial assets measured at
amortised cost (loans and advances to banks)
amounting to EUR 810,041 thousand.
As at 31 December 2018, all loans and advances
to banks had been assigned to stage 1 (no
significant increase in credit risk since the initial
recognition), where impairments for credit
losses are measured on the basis of 12-month
expected credit losses. As at 31 December
2018, allowances for credit losses on financial
assets measured at amortised cost (loans and
advances to banks) amounted to EUR 691
thousand.
Analysis of credit quality – financial assets measured at amortised cost – loans and advances to customers
SID Bank and SID Bank Group
31 Dec 2018 Stage 1 Stage 2 Stage 3 POCI Total
Gross carrying amount 639,821 45,995 20,383 21,340 727,539 100%
A 192,630 0 0 0 192,630 26.5%
B 384,538 20,974 0 3,572 409,084 56.2%
C 62,653 25,021 0 0 87,674 12.1%
D 0 0 3,371 13,612 16,983 2.3%
E 0 0 17,012 4,156 21,168 2.9%
Allowances for losses (8,438) (6,847) (16,172) (4,962) (36,419) 100%
A (188) 0 0 0 (188) 0.5%
B (4,756) (778) 0 216 (5,318) 14.6%
C (3,494) (6,069) 0 0 (9,563) 26.3%
D 0 0 (1,983) (1,080) (3,063) 8.4%
E 0 0 (14,189) (4,098) (18,287) 50.2%
Net carrying amount 631,383 39,148 4,211 16,378 691,120
As at 31 December 2018, SID Bank disclosed
exposure from financial assets measured at
amortised cost (loans and advances to
customers) amounting to EUR 727,539
thousand.
A total of EUR 639,821 thousand in loans and
advances to customers was assigned to stage 1
(no significant increase in credit risk since the
initial recognition), where impairments for
credit losses are measured on the basis of 12-
month expected credit losses. As at 31
December 2018, allowances for credit losses on
loans and advances to customers assigned to
stage 1 amounted to EUR 8,438 thousand.
As SID Bank also approves loan transactions for
rating grade C within individual financing
programmes involving elements of state aid,
EUR 62,653 thousand in loans and advances to
customers was assigned to stage 1.
A total of EUR 49,567 thousand in loans and
advances to customers was assigned to stage 2
(significant increase in credit risk since the initial
recognition), where impairments for credit
losses are measured on the basis of lifetime
expected credit losses on the financial
instrument, with performing POCI items
accounting for EUR 3,572 thousand. Allowances
for credit losses on loans and advances to
customers assigned to stage 2 amounted to
EUR 6,631 thousand as at 31 December 2018,
where EUR 216 thousand was the positive
allowance for credit losses on performing POCI
items.
A total of EUR 38,151 thousand in loans and
advances to customers was assigned to stage 3
(non-performing financial assets), where
impairments for credit losses are measured on
the basis of lifetime expected credit losses on
the financial instrument, with non-performing
POCI items accounting for EUR 17,768
thousand. Allowances for credit losses on loans
and advances to customers assigned to stage 3
amounted to EUR 21,350 thousand as at 31
December 2018, where EUR 5,178 thousand
was the allowance for credit losses on non-
performing POCI items.

Annual report of SID Bank and the SID Bank Group 2018 | 175
Analysis of credit quality – financial assets measured at amortised cost – other financial assets
SID Bank
31 Dec 2018 Stage 1 Total
Gross carrying amount 1,853 1,853 100%
A 1,773 1,773 95.7%
B 80 80 4.3%
Net carrying amount 1,853 1,853
As at 31 December 2018, SID Bank disclosed
exposure from financial assets measured at
amortised cost (other financial assets)
amounting to EUR 1,853 thousand.
As at 31 December 2018, all other financial
assets had been assigned to stage 1 (no
significant increase in credit risk since the initial
recognition), where impairments for credit
losses are measured on the basis of 12-month
expected credit losses. Owing to the
immateriality of the amounts, allowances for
credit losses were not recognised.
SID Bank Group
31 Dec 2018 Stage 1 Total
Gross carrying amount 1,849 1,849 100%
A 1,769 1,769 95.7%
B 80 80 4.3%
Net carrying amount 1,849 1,849
Analysis of credit quality – financial assets measured at amortised cost – total
SID Bank
31 Dec 2018 Stage 1 Stage 2 Stage 3 POCI Total
Gross carrying amount 1,451,715 45,995 20,383 21,340 1,539,433 100%
A 405,351 0 0 0 405,351 26.3%
B 983,711 20,974 0 3,572 1,008,257 65.5%
C 62,653 25,021 0 0 87,674 5.7%
D 0 0 3,371 13,612 16,983 1.1%
E 0 0 17,012 4,156 21,168 1.4%
Allowances for losses (9,129) (6,847) (16,172) (4,962) (37,110) 100%
A (242) 0 0 0 (242) 0.7%
B (5,393) (778) 0 216 (5,955) 16.0%
C (3,494) (6,069) 0 0 (9,563) 25.8%
D 0 0 (1,983) (1,080) (3,063) 8.3%
E 0 0 (14,189) (4,098) (18,287) 49.3%
Net carrying amount 1,442,586 39,148 4,211 16,378 1,502,323
SID Bank Group
31 Dec 2018 Stage 1 Stage 2 Stage 3 POCI Total
Gross carrying amount 1,451,711 45,995 20,383 21,340 1,539,429 100%
A 405,347 0 0 0 405,347 26.3%
B 983,711 20,974 0 3,572 1,008,257 65.5%
C 62,653 25,021 0 0 87,674 5.7%
D 0 0 3,371 13,612 16,983 1.1%
E 0 0 17,012 4,156 21,168 1.4%
Allowances for losses (9,129) (6,847) (16,172) (4,962) (37,110) 100%
A (242) 0 0 0 (242) 0.7%
B (5,393) (778) 0 216 (5,955) 16.0%
C (3,494) (6,069) 0 0 (9,563) 25.8%
D 0 0 (1,983) (1,080) (3,063) 8.3%
E 0 0 (14,189) (4,098) (18,287) 49.3%
Net carrying amount 1,442,582 39,148 4,211 16,378 1,502,319

176 | Annual report of SID Bank and the SID Bank Group 2018
Analysis of credit quality – off-balance-sheet items
SID Bank and SID Bank Group
31 Dec 2018 Stage 1 Stage 2 Total
Gross carrying amount 274,762 998 275,760 100%
A 153,348 0 153,348 55.6%
B 121,414 0 121,414 44.0%
C 0 998 998 0.4%
Provisions (420) 0 (420) 100%
A (48) 0 (48) 11.4%
B (372) 0 (372) 88.6%
Net carrying amount 274,342 998 275,340
As at 31 December 2018, SID Bank disclosed
exposure from off-balance-sheet liabilities
amounting to EUR 275,760 thousand.
A total of EUR 274,762 thousand in off-balance-
sheet liabilities was assigned to stage 1 (no
significant increase in credit risk since the initial
recognition), where provisions for credit losses
are measured on the basis of 12-month
expected credit losses. As at 31 December
2018, provisions for credit losses on off-
balance-sheet liabilities assigned to stage 1
amounted to EUR 420 thousand.
A total of EUR 998 thousand in off-balance-
sheet liabilities was assigned to stage 2
(significant increase in credit risk since the initial
recognition), where provisions for credit losses
are measured on the basis of lifetime expected
credit losses on the financial instrument.
Provisions amounting to a mere EUR 0.1
thousand were formed for them; this was
because these off-balance-sheet liabilities had
been secured by SID Bank insurance policies
issued for the account of Slovenia to insure
against commercial risks.
Maturity of financial assets
SID Bank
Gross carrying amount Loss allowances
31 Dec 2018 Stage 1 Stage 2 Stage 3 POCI Total Stage 1 Stage 2 Stage 3 POCI Total
Loans and advances to banks
Non-past-due 810,041 0 0 0 810,041 (691) 0 0 0 (691)
Total 810,041 0 0 0 810,041 (691) 0 0 0 (691)
Loans and advances to customers
Non-past-due 636,026 44,362 1,384 17,184 698,956 (8,369) (6,551) (387) (864) (16,171)
Up to 29 days past due 3,795 1,292 212 0 5,299 (69) (280) (96) 0 (445)
30 to 89 days past due 0 341 895 0 1,236 0 (16) (891) 0 (907)
90 to 180 days past due 0 0 285 0 285 0 0 (196) 0 (196)
More than 180 days past due 0 0 17,607 4,156 21,763 0 0 (14,602) (4,098) (18,700)
Total 639,821 45,995 20,383 21,340 727,539 (8,438) (6,847) (16,172) (4,962) (36,419)
Other financial assets
Non-past-due 1,853 0 0 0 1,853 0 0 0 0 0
Total 1,853 0 0 0 1,853 0 0 0 0 0

Annual report of SID Bank and the SID Bank Group 2018 | 177
SID Bank
Gross carrying
amount
Loss allowances
31 Dec 2017 Individual
impairments Collective
impairments
Loans and advances to banks (under IAS 39) Non-past-due 1,039,767 0 (7,588)
Total 1,039,767 0 (7,588)
Loans and advances to customers (under IAS 39) Non-past-due 704,193 (61,724) (47,473)
Up to 30 days past due 865 (838) 0
30 to 90 days past due 8 (3) 0
More than 90 days past due 28,096 (25,384) 0
Total 733,162 (87,949) (47,473)
Other financial assets (under IAS 39) Non-past-due 1,552 0 0
Up to 30 days past due 1 0 0
Total 1,553 0 0
Past-due financial assets are loans and other
financial assets measured at amortised cost,
where a debtor is a day or more past due for
the whole or part of the exposure. The whole
exposure under a specific loan agreement
(rather than only the part of the exposure for
which the debtor is past due with payment) is
classified as a past-due loan or other financial
asset. If the Bank is also exposed to the same
debtor under other agreements and the debtor
is not past due as regards the exposures under
other agreements, such exposures are not
classified as past-due loans.
Gross exposure of past-due claims resulting
from loans and other financial assets measured
at amortised cost decreased and amounted to
EUR 28,583 thousand at the end of 2018 (EUR
28,970 thousand as at 31 December 2017),
which represents 1.9% of all gross exposure
resulting from loans and other financial assets
measured at amortised cost. The major portion
of this amount comprises loans assigned to
stage 3 (non-performing financial assets),
where impairments for credit losses are
measured on the basis of lifetime expected
credit losses on the financial instrument.
Past-due loans assigned to stage 1, where
impairments for credit losses are measured on
the basis of 12-month expected credit losses,
and Stage 2, where impairments for credit
losses are measured on the basis of lifetime
expected credit losses on the financial
instrument, account for 19.0% of all past-due
loans.
Non-past-due loans and other financial assets
account for 98.1% of all gross exposure
resulting from loans and other financial assets
measured at amortised cost. The high
proportion of non-past-due loans is connected
with the provision of loans to banks established
in Slovenia, which transfer the funding thus
obtained to the final beneficiaries under the
ZSIRB. In addition, a large proportion of
exposure resulting from loans and other
financial assets measured at amortised cost is
classified under the group of banks from
countries that have a risk rating of 0 or 1 under
the minimum export insurance premium (MEIP)
listing.
Past-due claims resulting from loans, where the
loans have been less than 29 days past due and
their gross carrying amount is EUR 5,299
thousand, are secured with commercial real
estate amounting to EUR 2,266 thousand, other
material assets amounting to EUR 1,534
thousand, and other forms of collateral
amounting to EUR 1,930 thousand.
Past-due claims resulting from loans, where the
loans have been more than 30 and less than 89
days past due and their gross carrying amount
is EUR 1,236 thousand, are secured with
irrevocable Slovenian government guarantees
amounting to EUR 192 thousand and other
material assets amounting to EUR 226
thousand.
Past-due claims resulting from loans, where the
loans have been more than 90 and less than
180 days past due and their gross carrying
amount is EUR 285 thousand, are secured with

178 | Annual report of SID Bank and the SID Bank Group 2018
other forms of collateral amounting to EUR 238
thousand.
Past-due claims resulting from loans, where the
loans have been more than 180 days past due
and their gross carrying amount is EUR 21,763
thousand, are secured with irrevocable
Slovenian government guarantees amounting
to EUR 240 thousand, commercial real estate
amounting to EUR 4,459 thousand, residential
real estate amounting to EUR 554 thousand,
other material assets amounting to EUR 1,572
thousand, and other forms of collateral
amounting to EUR 346 thousand.
SID Bank Group
Gross carrying amount Loss allowances
31 Dec 2018 Stage 1 Stage 2 Stage 3 POCI Total Stage 1 Stage 2 Stage 3 POCI Total
Loans and advances to
banks
Non-past-due 810,041 0 0 0 810,041 (691) 0 0 0 (691)
Total 810,041 0 0 0 810,041 (691) 0 0 0 (691)
Loans and advances to
customers
Non-past-due 636,026 44,362 1,385 17,183 698,956 (8,369) (6,551) (387) (864) (16,171)
Up to 29 days past due 3,795 1,292 212 0 5,299 (69) (280) (96) 0 (445)
30 to 89 days past due 0 341 895 0 1,236 0 (16) (891) 0 (907)
90 to 180 days past due 0 0 285 0 285 0 0 (196) 0 (196)
More than 180 days past due 0 0 17,607 4,156 21,763 0 0 (14,602) (4,098) (18,700)
Total 639,821 45,995 20,384 21,339 727,539 (8,438) (6,847) (16,172) (4,962) (36,419)
Other financial assets
Non-past-due 1,849 0 0 0 1,849 0 0 0 0 0
Total 1,849 0 0 0 1,849 0 0 0 0 0
SID Bank Group
Gross carrying
amount
Loss allowances
31 Dec 2017
Individual
impairments
Collective
impairments
Loans and advances to banks (under IAS 39) Non-past-due 1,045,019 0 (7,588)
Total 1,045,019 0 (7,588)
Loans and advances to customers (under IAS 39) Non-past-due 704,193 (61,724) (47,473)
Up to 30 days past due 865 (838) 0
30 to 90 days past due 8 (3) 0
More than 90 days past due 28,096 (25,384) 0
Total 733,162 (87,949) (47,473)
Other financial assets (under IAS 39) Non-past-due 1,552 0 0
Up to 30 days past due 1 0 0
Total 1,553 0 0

Annual report of SID Bank and the SID Bank Group 2018 | 179
Debt securities measured at fair value through other comprehensive income in accordance with the issuer’s rating grade
SID Bank SID Bank Group
31 Dec 2018 31 Dec 2017 31 Dec 2018 31 Dec 2017
AAA 0 0 0 2,024
AA- to AA+ 65,917 37,718 65,917 38,880
A- to A+ 450,644 403,483 450,644 417,950
BBB+ to BBB- 118,718 228,459 118,718 230,289
Lower than BBB- 15,592 44,627 15,592 44,627
Total 650,871 714,287 650,871 733,770
The table shows the fair value of debt securities
measured at fair value through other
comprehensive income, classified in terms of
the issuer’s rating grade in accordance with SID
Bank’s methodology.
Credit risk from debt securities of the SID Bank
Group, measured at fair value through other
comprehensive income, arises from the
portfolio managed by SID Bank for the purpose
of ensuring liquidity and managing the balance
sheet.
SID Bank manages the credit risk from debt
securities of the SID Bank Group, measured at
fair value through other comprehensive income,
primarily by means of limits on exposure with
regard to the issuer’s rating grade, registered
office location and type, and by monitoring
changes to the market value of debt securities.
At the end of 2018, SID Bank’s portfolio of debt
securities, measured at fair value through other
comprehensive income, decreased to EUR
650,871 thousand; this was a fall of 8.9%
relative to the end of 2017 (when it was EUR
714,286 thousand). The largest share of the
entire portfolio (65% as at 31 December 2018,
64.7% at the end of 2017) comprises debt
securities issued by EU Member States (central
government) and classed as investment-grade
(BBB- or higher). Slovenian government debt
securities account for 39.5% (end of 2017:
31.7%) of the portfolio of debt securities
measured at fair value through other
comprehensive income.
In comparison with 2017, the structure of SID
Bank’s debt securities portfolio in terms of credit
rating generally improved in 2018, primarily as
a result of the reassignment of issuers to higher
rating grades, a decrease in exposure to
domestic banking issuers with a credit rating
lower than BBB- and a decrease in total
exposure in debt securities.
A detailed breakdown of financial assets
measured at fair value through other
comprehensive income is given under section
2.4.3 Financial assets measured at fair value
through other comprehensive income.
Breakdown of exposure to credit risk by geographical region
The tables illustrate the breakdown of net
exposure to credit risk by geographical region
as defined by the debtor’s registered office. The
majority of credit risk exposure to the rest of the
world at the SID Bank Group level arises from
SID Bank’s exposure.

180 | Annual report of SID Bank and the SID Bank Group 2018
31 Dec 2018
SID Bank
Slovenia
Other
EU Member
States Other Europe
Other
countries Total
Financial assets as at 31 Dec 2018 1,890,547 338,380 23,411 37,707 2,290,045
Cash, cash balances at central banks and other demand deposits at banks 121,184 0 0 0 121,184
Non-trading financial assets mandatorily at fair value through profit or loss 11,174 4,493 0 0 15,667
Financial assets measured at fair value through other comprehensive income 326,911 290,885 6,667 26,408 650,871
Debt securities 326,911 290,885 6,667 26,408 650,871
Financial assets measured at amortised cost 1,431,278 43,002 16,744 11,299 1,502,323
Loans and advances to banks 761,487 32,847 15,016 0 809,350
Loans and advances to customers 668,938 9,155 1,728 11,299 691,120
Other financial assets 853 1,000 0 0 1,853
Off-balance-sheet liabilities as at 31 Dec 2018 199,640 45,954 29,746 0 275,340
Guarantees 66,576 0 0 0 66,576
Gross exposure 66,790 0 0 0 66,790
Provisions (214) 0 0 0 (214)
Other off-balance-sheet liabilities 133,064 45,954 29,746 0 208,764
Gross exposure 133,260 45,964 29,746 0 208,970
Provisions (196) (10) 0 0 (206)
Total exposure as at 31 Dec 2018 2,090,187 384,334 53,157 37,707 2,565,385
Financial assets as at 31 Dec 2017 1,716,906 644,155 13,334 42,435 2,416,830
Off-balance-sheet liabilities as at 31 Dec 2017 39,358 16,049 10,107 6,387 71,901
Total exposure as at 31 Dec 2017 1,756,264 660,204 23,441 48,822 2,488,731
At the end of 2018, SID Bank exposure to the
Slovenian government accounted for 81.5%
(end of 2017: (7.6%) of total exposure resulting
from financial assets and off-balance-sheet
liabilities (end of 2017: 70.6%) and increased
by EUR 333,923 thousand in comparison with
the end of 2017. This increase was mainly due
to the increase in financial assets, chiefly
balances at central banks and loans and
advances to customers, as well as an increase
in off-balance-sheet liabilities and higher total
exposure.
At the end of 2018, exposure to other EU
Member States accounted for most of the credit
portfolio’s exposure to the rest of the world,
amounting to 15% (end of 2017: 26.5%) of the
total exposure resulting from financial assets
and off-balance-sheet liabilities. It fell in
comparison with the end of 2017 mainly as a
result of a fall in deposits with foreign banks and
in exposure to foreign issuers’ debt securities.
At the end of 2018, credit risk exposure to the
countries from the rest of Europe (Europe
without EU Member States) accounted for 2.1%
(end of 2017: 0.9%) of total exposure, and
exposure to other countries accounted for 1.5%
(end of 2017: 2%) of total exposure.
SID Bank uses internal exposure limits to apply
a maximum allowable exposure to individual
geographical regions. A detailed presentation of
the greater credit risk exposure by individual
country is given in separate tables.
As at 31 December 2018, the structure of SID
Bank’s exposures to specific countries shows a
major change in comparison with the end of
2017, mainly due to a fall in deposits with
foreign banks and changes to exposure by
country in the debt securities portfolio.

Annual report of SID Bank and the SID Bank Group 2018 | 181
31 Dec 2018
SID Bank Group
Slovenia
Other EU
Member States Other Europe
Other
countries Total
Financial assets as at 31 Dec 2018 1,890,543 338,380 23,411 37,707 2,290,041
Cash,cash balances at central banks and other demand deposits at banks 121,184 0 0 0 121,184
Non-trading financial assets mandatorily at fair value through profit or loss 11,174 4,493 0 0 15,667
Financial assets measured at fair value through other comprehensive income 326,911 290,885 6,667 26,408 650,871
Debt securities 326,911 290,885 6,667 26,408 650,871
Financial assets measured at amortised cost 1,431,274 43,002 16,744 11,299 1,502,319
Loans and advances to banks 761,487 32,847 15,016 0 809,350
Loans and advances to customers 668,938 9,155 1,728 11,299 691,120
Other financial assets 849 1,000 0 0 1,849
Off-balance-sheet liabilities as at 31 Dec 2018 199,640 45,954 29,746 0 275,340
Guarantees 66,576 0 0 0 66,576
Gross exposure 66,790 0 0 0 66,790
Provisions (214) 0 0 0 (214)
Other off-balance-sheet liabilities 133,064 45,954 29,746 0 208,764
Gross exposure 133,260 45,964 29,746 0 208,970
Provisions (196) (10) 0 0 (206)
Total exposure as at 31 Dec 2018 2,090,183 384,334 53,157 37,707 2,565,381
Financial assets as at 31 Dec 2017 1,733,222 655,821 14,456 42,946 2,446,445
Off-balance-sheet liabilities as at 31 Dec 2017 39,358 16,049 10,107 6,387 71,901
Total exposure as at 31 Dec 2017 1,772,580 671,870 24,563 49,333 2,518,346
31 Dec 2018 31 Dec 2017
SID Bank
Financial
assets
Off-balance-
sheet liabilities Total exposure
Financial
assets
Off-balance-
sheet liabilities Total exposure
Slovenia 1,890,548 199,641 2,090,189 1,716,906 39,358 1,756,264
France 24,869 0 24,869 85,133 0 85,133
Spain 31,709 0 31,709 76,553 0 76,553
Poland 42,950 0 42,950 62,361 0 62,361
Netherlands 36,804 0 36,804 54,505 0 54,505
Italy 18,455 0 18,455 51,842 0 51,842
Germany 31,969 33,954 65,923 49,628 0 49,628
Romania 12,441 0 12,441 40,672 0 40,672
USA 36,213 0 36,213 38,199 0 38,199
Hungary 16,435 0 16,435 27,069 0 27,069
Ireland 26,634 0 26,634 19,242 0 19,242
Croatia 13,197 0 13,197 10,438 4,049 14,487
Czech Republic 25,110 0 25,110 17,772 0 17,772
Sweden 16,912 0 16,912 13,640 0 13,640
Belarus 15,016 28,748 43,764 2,654 8,094 10,922
Other 50,783 12,997 63,780 150,216 20,400 170,442
Total exposure 2,290,045 275,340 2,565,385 2,416,830 71,901 2,488,731

182 | Annual report of SID Bank and the SID Bank Group 2018
31 Dec 2018 31 Dec 2017
SID Bank Group Financial
assets Off-balance-
sheet liabilities Total exposure Financial
assets Off-balance-
sheet liabilities Total exposure
Slovenia 1,890,544 199,641 2,090,185 1,733,222 39,358 1,772,580
France 24,869 0 24,869 86,220 0 86,220
Spain 31,709 0 31,709 77,852 0 77,852
Poland 42,950 0 42,950 66,878 0 66,878
Netherlands 36,804 0 36,804 56,713 0 56,713
Italy 18,455 0 18,455 51,842 0 51,842
Germany 31,969 33,954 65,923 49,628 0 49,628
Romania 12,441 0 12,441 40,672 0 40,672
USA 36,213 0 36,213 38,199 0 38,199
Hungary 16,435 0 16,435 27,069 0 27,069
Ireland 26,634 0 26,634 19,773 0 19,773
Croatia 13,197 0 13,197 10,438 4,049 14,487
Czech Republic 25,110 0 25,110 17,772 0 17,772
Sweden 16,912 0 16,912 13,640 0 13,640
Belarus 15,016 28,748 43,764 2,654 8,094 10,922
Other 50,783 12,997 63,780 153,873 20,400 174,099
Total exposure 2,290,041 275,340 2,565,381 2,446,445 71,901 2,518,346
Breakdown of credit risk exposure by sector
The tables illustrate the breakdown of net
exposure to credit risk by sector.
The majority of credit risk exposure by sector at
the SID Bank Group level arises from SID Bank’s
exposure.
SID Bank
31 Dec 2018
Financial and
insurance
activities
Manufactu
ring
Public
administration and
defence
Wholesale and retail
trade, repair of
motor
vehicles
Transportation and
storage
Professional,
scientific and
technical
activities
Electricity, gas,
steam and air
conditioni
ng supply Other Total
Financial assets as at 31 Dec 2018 1,095,257 262,713 497,889 86,050 90,052 49,295 121,538 87,251 2,290,045
Cash, cash balances at central banks and other demand deposits at banks 121,184 0 0 0 0 0 0 0 121,184
Non-trading financial assets mandatorily at fair value through profit or loss 0 0 0 13,974 0 0 0 1,693 15,667
Financial assets measured at fair value through other comprehensive income 152,759 6,658 425,113 25,599 4,222 16,133 4,026 16,361 650,871
Debt securities 152,759 6,658 425,113 25,599 4,222 16,133 4,026 16,361 650,871
Financial assets measured at amortised cost 821,314 256,055 72,776 46,477 85,830 33,162 117,512 69,197 1,502,323
Loans and advances to banks 809,350 0 0 0 0 0 0 0 809,350
Loans and advances to customers 10,593 256,055 72,374 46,477 85,810 33,102 117,512 69,197 691,120
Other financial assets 1,371 0 402 0 20 60 0 0 1,853
Off-balance-sheet liabilities as at 31 Dec 2018 79,700 20,629 56,168 43,602 66,615 3,142 0 5,484 275,340
Guarantees 0 0 0 0 66,576 0 0 0 66,576
Gross exposure 0 0 0 0 66,790 0 0 0 66,790
Provisions 0 0 0 0 (214) 0 0 0 (214)
Other off-balance-sheet liabilities 79,700 20,629 56,168 43,602 39 3,142 0 5,484 208,764
Gross exposure 79,712 20,714 56,168 43,662 40 3,161 0 5,514 208,971
Provisions (12) (85) 0 (60) (1) (19) 0 (30) (207)
Total exposure as at 31 Dec 2018 1,174,957 283,342 554,057 129,652 156,667 52,437 121,538 92,735 2,565,385
Financial assets as at 31 Dec 2017 1,293,330 198,668 514,758 74,963 91,869 43,438 129,210 70,594 2,416,830
Off-balance-sheet liabilities as at 31 Dec 2017 48,746 4,188 2,528 251 0 2,231 4,049 9,908 71,901
Total exposure as at 31 Dec 2017 1,342,076 202,856 517,286 75,214 91,869 45,669 133,259 80,502 2,488,731
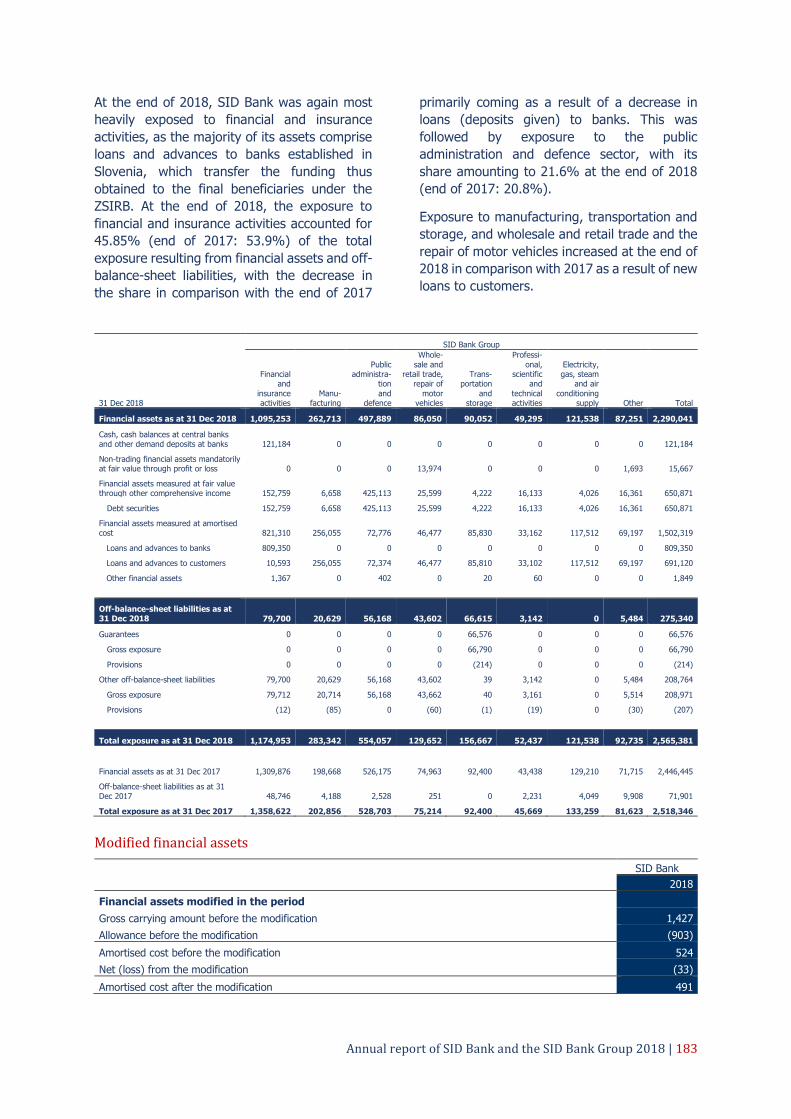
Annual report of SID Bank and the SID Bank Group 2018 | 183
At the end of 2018, SID Bank was again most
heavily exposed to financial and insurance
activities, as the majority of its assets comprise
loans and advances to banks established in
Slovenia, which transfer the funding thus
obtained to the final beneficiaries under the
ZSIRB. At the end of 2018, the exposure to
financial and insurance activities accounted for
45.85% (end of 2017: 53.9%) of the total
exposure resulting from financial assets and off-
balance-sheet liabilities, with the decrease in
the share in comparison with the end of 2017
primarily coming as a result of a decrease in
loans (deposits given) to banks. This was
followed by exposure to the public
administration and defence sector, with its
share amounting to 21.6% at the end of 2018
(end of 2017: 20.8%).
Exposure to manufacturing, transportation and
storage, and wholesale and retail trade and the
repair of motor vehicles increased at the end of
2018 in comparison with 2017 as a result of new
loans to customers.
31 Dec 2018
SID Bank Group
Financial and
insurance activities
Manu-facturing
Public administra-
tion
and defence
Whole-
sale and retail trade,
repair of
motor vehicles
Trans-portation
and storage
Professi-
onal, scientific
and
technical activities
Electricity, gas, steam
and air
conditioning supply Other Total
Financial assets as at 31 Dec 2018 1,095,253 262,713 497,889 86,050 90,052 49,295 121,538 87,251 2,290,041
Cash, cash balances at central banks and other demand deposits at banks 121,184 0 0 0 0 0 0 0 121,184
Non-trading financial assets mandatorily at fair value through profit or loss 0 0 0 13,974 0 0 0 1,693 15,667
Financial assets measured at fair value through other comprehensive income 152,759 6,658 425,113 25,599 4,222 16,133 4,026 16,361 650,871
Debt securities 152,759 6,658 425,113 25,599 4,222 16,133 4,026 16,361 650,871
Financial assets measured at amortised cost 821,310 256,055 72,776 46,477 85,830 33,162 117,512 69,197 1,502,319
Loans and advances to banks 809,350 0 0 0 0 0 0 0 809,350
Loans and advances to customers 10,593 256,055 72,374 46,477 85,810 33,102 117,512 69,197 691,120
Other financial assets 1,367 0 402 0 20 60 0 0 1,849
Off-balance-sheet liabilities as at 31 Dec 2018 79,700 20,629 56,168 43,602 66,615 3,142 0 5,484 275,340
Guarantees 0 0 0 0 66,576 0 0 0 66,576
Gross exposure 0 0 0 0 66,790 0 0 0 66,790
Provisions 0 0 0 0 (214) 0 0 0 (214)
Other off-balance-sheet liabilities 79,700 20,629 56,168 43,602 39 3,142 0 5,484 208,764
Gross exposure 79,712 20,714 56,168 43,662 40 3,161 0 5,514 208,971
Provisions (12) (85) 0 (60) (1) (19) 0 (30) (207)
Total exposure as at 31 Dec 2018 1,174,953 283,342 554,057 129,652 156,667 52,437 121,538 92,735 2,565,381
Financial assets as at 31 Dec 2017 1,309,876 198,668 526,175 74,963 92,400 43,438 129,210 71,715 2,446,445
Off-balance-sheet liabilities as at 31 Dec 2017 48,746 4,188 2,528 251 0 2,231 4,049 9,908 71,901
Total exposure as at 31 Dec 2017 1,358,622 202,856 528,703 75,214 92,400 45,669 133,259 81,623 2,518,346
Modified financial assets
SID Bank
2018
Financial assets modified in the period
Gross carrying amount before the modification 1,427
Allowance before the modification (903)
Amortised cost before the modification 524
Net (loss) from the modification (33)
Amortised cost after the modification 491

184 | Annual report of SID Bank and the SID Bank Group 2018
The table shows the effects of the modification
to the contractual cash flows of financial assets
in 2018, where SID Bank measures impairments
for credit losses on the basis of lifetime
expected credit losses on the financial
instrument and the modifications did not lead
to the derecognition of the financial instrument.
In the event of modification to the contractual
cash flows of a financial asset that do not lead
to its derecognition, SID Bank calculates the
current value of the modified contractual cash
flows using, as the discount rate, the effective
interest rate at recognition, or the credit-
adjusted effective interest rate in the case of
POCI items. SID Bank also adjusts the gross
carrying amount of the financial asset by the
amount of the difference established. SID Bank
accrues the amount by which the gross carrying
amount of the financial asset is adjusted as a
result of a modification to contractual cash flows
for the entire remainder of the lifetime of the
financial asset and discloses it in profit or loss
as interest income.
In 2018 modifications to contractual cash flows
did not lead to the derecognition of the financial
asset in five cases of financial assets.
A loss was recognised in profit or loss in
response to the modification to contractual cash
flows in the case of three financial assets,
including two financial assets where SID Bank
measures impairments for credit losses on the
basis of lifetime expected credit losses on the
financial asset.
Counterparty credit risk
Market interest rates and yield curves are taken
into consideration when valuing derivatives. As
the market interest rates and yield curves used
for the valuation of derivatives contain no
counterparty credit risk, credit valuation
adjustment (CVA) is calculated for that purpose.
CVA represents a value adjustment of the
derivative for the counterparty credit risk and is
defined as the difference between the value of
a financial instrument without the credit risk
taken into account and the value with the credit
risk taken into account. For valuation
adjustment, counterparty credit risk (CVA) must
be taken into account on the one hand and own
credit risk on the other hand. SID Bank does not
calculate its own credit risk. CVA is calculated
on a monthly basis for each derivatives
transaction. Any collateral is also taken into
consideration in the calculation.
SID Bank only concludes transactions outside
the regulated stock market (OTC transactions)
with banks with which it concluded a framework
agreement on transactions in derivatives (ISDA
Master Agreement). For the purpose of
counterparty credit risk mitigation in derivatives
transactions, the Bank has signed a credit
support annex (CSA) as a legal supplement to
the master agreement, based on a system of
providing variation margins through the
exchanges of collateral depending on the daily
fair value of the derivative.
The Bank carries out daily monitoring of
counterparty credit risk on the basis of the fair
value of the derivative. If insufficient coverage
of exposure by collateral due to adverse
derivative fair value movements results in
insufficient coverage of exposure by collateral,
the counterparty is asked to provide additional
collateral. SID Bank agreed on cash deposits as
collateral with counterparties with whom it
concluded derivatives transactions in 2018.
SID Bank recognises the calculated CVA amount
in profit or loss in months in which the total
amount of the calculated CVA for all derivatives
exceeds 10 basis points of the last total risk
exposure amount, as per Article 92(3) of the
CRR.
As at 31 December 2018, the CVA for SID Bank
and the SID Bank Group was EUR 0.

Annual report of SID Bank and the SID Bank Group 2018 | 185
3.2 Liquidity risk
Liquidity risk is the risk of a loss occurring when
a bank is unable to settle all of its maturing
liabilities, or when a bank is obliged to obtain
sources of liquidity at costs significantly higher
than average market costs due to its inability to
provide sufficient funding to settle its liabilities
at maturity. The greater the mismatch between
flows of interest and principal on the asset side
and the liability side, and in off-balance-sheet
items, the higher the risk of illiquidity.
Liquidity risk in the narrower sense arises when
a bank is unable to repay its liabilities via
investment operations. These liabilities are
usually settled using cash inflows, readily
convertible assets and borrowed funding.
Liquidity risk in the broader sense is the risk that
a bank will have to undertake additional
borrowing at a higher interest rate, and the risk
that a bank will be compelled to sell non-
monetary investments at a discount as a result
of the need for liquidity. At SID Bank, given the
high secondary liquidity, a significant proportion
of which consists of government securities and
other high-quality highly liquid securities, this
risk is assessed as low.
By managing liquidity risk, the SID Bank Group
ensures the regular settlement of all monetary
liabilities, and the high-quality management of
operational and structural liquidity. All activities
and processes in liquidity risk management are
carried out by each member of the SID Bank
Group independently.
The subsidiary that performs insurance
activities manages its liquidity risk in accordance
with its own financial risk management policy,
which takes account of specific characteristics
and regulations concerning liquidity risk
management in the insurance business and has
been approved by the management body of the
subsidiary. The majority of the insurer’s
financial assets comprise marketable
government debt securities, other highly liquid
debt securities, and short-term deposits at
banks. For the purpose of covering increased
demand for liquidity, the insurer has defined a
cash-call option in its contract with reinsurers.
The majority of the SID Bank Group’s liquidity
risk exposure is exposure arising from the
operations of SID Bank, which is obliged to
meet legal and regulatory requirements in the
area of banking. SID Bank’s framework for the
take-up and management of liquidity risk is
presented below.
Take-up and management of liquidity risk
SID Bank takes up liquidity risk in accordance
with the business strategy, its risk absorption
capacity and its risk appetite and the risk
management strategy, with the primary
objective of ensuring prudent and secure
operations of the Bank. Liquidity management
includes prudent management of assets and
liabilities (on-balance-sheet and off-balance-
sheet) and a balanced borrowing strategy so
that the Bank is capable of meeting its due
liabilities (liquidity) at any given moment and in
due time, and is capable of meeting all its
liabilities (solvency) on a continuous basis.
The process of the take-up and management of
liquidity risk is conducted in line with the
adopted liquidity risk management policy, which
is discussed and adopted at least once a year
by the Bank’s management body. The Bank’s
management body discusses and adopts the
report on the internal liquidity adequacy
assessment process (ILAAP) on a annual basis.
The plan of liquidity risk management activities
includes the framework for the management of
liquidity and the securing of funding,
procedures for identifying, measuring and
managing liquidity risk, including the methods
used to monitor and report on the Bank’s
liquidity position, and procedures for carrying
out liquidity risk management measures.
Exposure to liquidity risk is discussed and
monitored on a regular basis through weekly
and monthly reports at the asset-liability and
liquidity management committee, and through
quarterly reports at meetings of the
management body.
The scope of the take-up of liquidity risk is
monitored annually by the management body
as part of the process of monitoring the
business strategy, the assessment of the risk
absorption capacity and the risk management
strategy.

186 | Annual report of SID Bank and the SID Bank Group 2018
The Bank defines an adequate liquidity position
or adequate level of liquidity buffer and stable
funding structure through the adopted risk
liquidity risk appetite, and particularly through
the setting of a minimum liquidity coverage
ratio (LCR) and net stable funding ratio (NSFR)
and through the strategic indicator of the
proportion of liquid assets on the balance sheet.
The liquidity risk management policy and its
associated bylaws define additional quantitative
limits and measures on the basis of which the
Bank manages the take-up of liquidity risk.
The liquidity risk management policy also
envisages procedures and responsibilities of the
competent committees and relevant
organisational units dealing in liquidity risk
management, and the range of possible
measures to be taken if operational or structural
liquidity deteriorates and/or the internally set
limits are exceeded.
In the introduction to section 3, the Bank
presents the key responsibilities of the
competent bodies in the area of risk
management, the risk management functions
and the individual organisational units. Risk
management The asset-liability and liquidity
committee is responsible for deciding on
proposals regarding liquidity risk management,
and the approval, guiding and supervision of the
implementation of liquidity policy and treasury
investment policy. The risk management
department drafts and, at least once a year,
reviews and proposes any changes to the
liquidity risk management policy in accordance
with the Bank’s risk profile, the adopted
business policy and the liquidity risk appetite. It
also ensures regular briefing of the
management body on the Bank’s exposure to
liquidity risk. The treasury department is
responsible for managing, achieving and
maintaining daily liquidity, concluding
transactions for the purpose of managing liquid
assets and carrying out borrowing activities
within the context of the adopted policy of
taking up and managing liquidity risk, the
authorisations put in place and the decisions of
the competent bodies. It is actively involved in
the process of assessing the liquidity adequacy
of the Bank.
In addition to measuring and monitoring
liquidity position, liquidity ratios, regulatory
ratios in the area of liquidity, liquidity risk
management at SID Bank also includes, in
particular, regular planning and monitoring of
liquidity cash flows and the assessment of
impacts of new transactions on the liquidity
ratio and the liquidity coverage ratio for the
coming period, and the regular verification of
the Bank’s liquidity position by taking into
account internally defined liquidity scenarios.
Strict daily monitoring of operational liquidity is
provided. Liquidity is ensured by asset
management, particularly liquidity reserves
and/or access to additional sources. For the
purpose of raising additional reserves of daily
liquidity from the central bank or from other
banks, SID Bank has a portfolio of securities
permanently available to serve as collateral for
such claims. The Bank manages structural
liquidity through the assessment of long-term
liquidity position.
Borrowing activities are based on SID Bank’s
business strategy and the annual financial
borrowing plan, which is drafted as part of the
annual operational plan. The purpose of
borrowing is to ensure appropriate funding for
the implementation of SID Bank’s asset-side
transactions. Adequacy is assessed with regard
to maturity, currency, interest-rate type, costs
of borrowing and any other characteristics. SID
Bank borrows for the purposes set out in the
ZSIRB.
SID Bank measures, supervises and monitors
exposure to liquidity risk on the basis of the
daily calculation of liquidity ratios in the manner
prescribed by the Bank of Slovenia. The liquidity
ratio is the ratio between the sum of financial
assets in domestic and foreign currency and the
total funding in domestic and foreign currency
with regard to residual maturity. The first-
bucket liquidity ratio (LR 0-30 days) must be at
least 1, while the second-bucket liquidity ratio
(LR 0-180 days) is of an informative nature. SID
Bank has set internal liquidity ratios that are
higher than those prescribed by law. This
provides additional security. SID Bank’s liquidity
risk management policy also sets out the
procedures in the event that the internally
prescribed liquidity ratio values are achieved.

Annual report of SID Bank and the SID Bank Group 2018 | 187
31 Dec 2018
SID Bank
Minimum value
Average value 31 Dec 2018
LR (0-30) 1.7 5.3 2.4
LR (0-180) 1.8 3.0 2.3
The minimum level of daily values for the first-
bucket liquidity ratio for all currencies amounted
to 1.7 in 2018 (2017: 5.8). The daily values
therefore exceeded the statutory requirements
of the Bank of Slovenia throughout the year.
SID Bank calculates the value of the liquidity
coverage ratio (LCR) on a monthly basis and the
net stable funding ratio (NSFR) on a quarterly
basis. The calculated ratios, the changes over
time and the compliance of the above ratios
with the adopted internal limits are discussed on
a regular basis by the asset-liability and liquidity
management committee.
At the end of 2018, SID Bank’s net stable
funding ratio amounted to 140% (end of 2017:
140%) and is reported by the Bank for
information purposes only.
The aim of the liquidity coverage ratio (LCR) is
to prevent liquidity risk by reducing credit
institutions’ dependence on short-term funding
and liquidity provided by central banks, by
introducing a requirement for banks hold
sufficient liquid assets to handle any surplus of
liquid outflows over inflows that could be
expected to occur over a 30-day stress period.
The LCR must be met in full as of 1 January
2018. When calculating the liquidity buffer, the
Bank has, since the beginning of 2018, taken a
conservative approach by taking only high-
quality liquid assets of the Bank into account
(and not high-quality liquid assets of loan
funds). At the end of 2018, the liquidity
coverage ratio amounted to 458% (end of
2017: 1,340%).
In the Disclosures section, the Bank discloses,
pursuant to Part Eight of the CRR, additional
qualitative and quantitative information in
accordance with the EBA guidelines on liquidity
coverage ratio (LCR) disclosure in order to
complement the disclosure of liquidity risk
management under Article 435 of the CRR.
SID Bank actively monitors and maintains an
adequate buffer of unencumbered, high-quality
liquid assets to be held as a contingency against
adverse liquidity conditions.
As at 31 December 2018, the liquid assets
eligible for inclusion in the LCR calculation
amounted to EUR 279.3 million, after haircuts
had been taken into account (2017: EUR 458.2
million), with the liquid assets of central
government accounting for 78% (2017: 81.7%)
of all eligible liquid assets after haircuts had
been taken into account. At the end of 2018,
the proportion of Level 1 high-quality liquid
assets (HQLA) amounted to 99.2% (2017:
98.2%).
SID Bank does not accept deposits from the
public and is therefore not exposed to any
potential outflows arising from retail and
corporate deposits in the event of adverse
liquidity conditions. This fact and the specific
Central bankassets
Centralgovernment
assets
Creditinstitution
(promotionallender) assets
Public SectorEntity assets
Corporate debtsecurities
15%
82%
1% 0% 2%
18%
78%
3% 1% 1%
Structure of high-quality liquid assets (after using applicable wieght)
31 Dec 2017 31 Dec 2018

188 | Annual report of SID Bank and the SID Bank Group 2018
role of the Bank also affect the structure of the
funding and mean that there is higher
concentration with regard to funding than is the
case with commercial banks. The fact that SID
Bank obtains long-term funding supported by
Slovenian government guarantees mainly on
international financial markets and at related
financial institutions increases the stability of
the Bank.
SID Bank has adopted internal rules that
provide a framework for contingent liquidity risk
management. To this end, the Bank has defined
the key elements of contingent liquidity risk
management:
– organisation and competences;
– procedures for the early identification of
possible liquidity shortfalls;
– the contingent liquidity risk management
plan and the responsibilities for resolving
liquidity crises;
– the criteria for activating the contingent
liquidity risk management plan;
– the set of possible measures for resolving
a liquidity crisis;
– early warning indicators for adverse
liquidity conditions;
– the implementation of internal liquidity
stress scenarios.
As part of the briefing process at competent
committees, SID Bank regularly monitors:
– the trend in SID Bank’s performance
indicators;
– the trend in macroeconomic indicators;
– events on financial markets;
– liquidity indicators, the liquidity coverage
ratio and the net stable funding ratio;
– planned and realised liquidity flows;
– early warning indicators for adverse
liquidity conditions;
– the results of implementation of internal
liquidity scenarios.
By regularly monitoring the liquidity position,
ratios and indicators, the Bank is able to identify
any adverse liquidity conditions promptly and
take appropriate measures to overcome any
liquidity difficulties.
Internal liquidity adequacy assessment process (ILAAP)
Through regular implementation of the internal
liquidity adequacy assessment process (ILAAP),
SID Bank ensures the effectiveness of liquidity
risk management and the adequacy of the
Bank’s liquidity relative to its risk profile. The
process includes an assessment of liquidity
needs and available liquidity within the context
of regular operations and of the business
strategy for the coming period or the annual
operational plan. The Bank’s liquidity position is
verified on a regular basis by the competent
committees through the monitoring of various
indicators, including in relation to achievement
of the planned indicators. The Bank regularly
carries out an assessment of the adequacy of
funding, with activities particularly focused on
the process of annual planning of business
needs, where the Bank defines the funding
policy for the current planning period.
Once a year, the Bank carries out, in a
comprehensive and structured manner in the
ILAAP report, a review and assessment of the
Bank’s liquidity profile in terms of the following
key elements: risk management in respect of
the Bank’s liquidity profile and liquidity risk
appetite, the effectiveness of the organisational
structure and the adequacy of the LCR buffer,
including in relation to the internal scenarios
and the contingency plan in place. The ILAAP
report also serves as a basis for supervisory
reviews and the evaluation of the Bank’s
liquidity risk.

Annual report of SID Bank and the SID Bank Group 2018 | 189
Exposure to liquidity risk
31 Dec 2018
SID Bank
Up to 1 month
1 to 3 months
3 to 12 months
1 to 5 years
More than 5 years Total
Financial assets as at 31 Dec 2018 193,438 11,996 123,025 629,414 1,343,989 2,301,862
Cash, cash balances at central banks and other demand deposits at banks 121,184 0 0 0 0 121,184
Non-trading financial assets mandatorily at fair value through profit or loss 0 0 188 13,974 1,505 15,667
Financial assets measured at fair value through other comprehensive income 38,503 0 66,591 371,905 185,689 662,688
Financial assets measured at amortised cost 33,751 11,996 56,246 243,535 1,156,795 1,502,323
Loans and advances to banks 30,091 11,626 35,286 95,809 636,538 809,350
Loans and advances to customers 3,030 167 20,960 147,706 519,257 691,120
Other financial assets 630 203 0 20 1,000 1,853
Financial liabilities as at 31 Dec 2018 75,460 20,834 5,374 623,947 1,441,944 2,167,559
Financial liabilities measured at amortised cost 63,460 20,834 5,374 552,145 1,247,508 1,889,321
Deposits by banks and central banks 22,497 20,796 0 0 0 43,293
Deposits by customers 39,210 0 0 0 0 39,210
Loans from banks and central
banks 0 0 5,373 405,188 752,390 1,162,951
Loans from customers 0 0 0 72,075 437,167 509,242
Debt securities 0 0 0 74,762 57,839 132,601
Other financial liabilities 1,753 38 1 120 112 2,024
Hedging derivatives 0 0 0 0 2,898 2,898
Irrevocable commitments and financial guarantees given 12,000 0 0 71,802 191,538 275,340
Liquidity gap as at 31 Dec 2018 117,978 (8,838) 117,651 5,467 (97,955) 134,303
Financial assets as at 31 Dec 2017 91,714 75,772 403,954 790,070 1,071,553 2,433,063
Financial liabilities as at 31 Dec 2017 42,247 1,481 331,443 412,144 1,322,825 2,110,140
Liquidity gap as at 31 Dec 2017 49,467 74,291 72,511 377,926 (251,272) 322,923

190 | Annual report of SID Bank and the SID Bank Group 2018
31 Dec 2018
SID Bank Group
Up to 1 month
1 to 3 months
3 to 12 months
1 to 5 years
More than 5 years Total
Financial assets as at 31 Dec 2018 193,434 11,996 123,025 629,414 1,343,989 2,301,858
Cash, cash balances at central banks and other demand deposits at banks 121,184 0 0 0 0 121,184
Non-trading financial assets mandatorily at fair value through profit or loss 0 0 188 13,974 1,505 15,667
Financial assets measured at fair value through other comprehensive income 38,503 0 66,591 371,905 185,689 662,688
Financial assets measured at amortised cost 33,747 11,996 56,246 243,535 1,156,795 1,502,319
Loans and advances to banks 30,091 11,626 35,286 95,809 636,538 809,350
Loans and advances to customers 3,030 167 20,960 147,706 519,257 691,120
Other financial assets 626 203 0 20 1,000 1,849
Financial liabilities as at 31 Dec 2018 75,460 20,834 5,374 623,947 1,441,944 2,167,559
Financial liabilities held for trading 0
Financial liabilities measured at amortised cost 63,460 20,834 5,374 552,145 1,247,508 1,889,321
Deposits by banks 22,497 20,796 0 0 0 43,293
Deposits by customers 39,210 0 0 0 0 39,210
Loans from banks and central
banks 0 0 5,373 405,188 752,390 1,162,951
Loans from customers 0 0 0 72,075 437,167 509,242
Debt securities 0 0 0 74,762 57,839 132,601
Other financial liabilities 1,753 38 1 120 112 2,024
Hedging derivatives 0 0 0 0 2,898 2,898
Irrevocable commitments and financial guarantees given 12,000 0 0 71,802 191,538 275,340
Liquidity gap 117,974 (8,838) 117,651 5,467 (97,955) 134,299
Financial assets as at 31 Dec 2017 96,824 76,490 409,160 804,963 1,075,241 2,462,678
Financial liabilities as at 31 Dec 2017 42,722 1,551 331,738 412,176 1,322,825 2,111,012
Liquidity gap as at 31 Dec 2017 54,102 74,939 77,422 392,787 (247,584) 351,666
The breakdown of financial assets and financial
liabilities by residual maturity shows the liquidity
risk in connection with credit risk. The items are
disclosed in net amounts (gross amounts minus
the allowances formed for credit losses). Cash
flows from the payment of interest on the fixed
and variable parts of derivatives used for
hedging are settled in net amounts.
In 2018 SID Bank and the SID Bank Group once
again had a good liquidity position, particularly
due to longer maturity of liabilities and the high
proportion of secondary liquidity, which can be
seen from the structure of the liquidity gaps.
SID Bank is obliged to meet the reserve
requirement at the central bank. The reserve
requirement is 1% of the stock of deposits
received and issued debt securities with an
agreed maturity of up to 2 years. At the end of
2018, the reserve requirement was EUR 0.

Annual report of SID Bank and the SID Bank Group 2018 | 191
3.3 Interest rate risk
Interest rate risk is the risk of a change in the
interest rates of interest-sensitive asset and
liability items that could have an adverse impact
on profit or loss, and on the economic value of
assets, liabilities and off-balance-sheet items.
To a great extent, exposure to interest rate risk
derives from interest-sensitive assets with
different maturities and a different repricing
dynamic compared with interest-sensitive
liabilities (income aspect). Another part of
interest rate risk consists of the sensitivity of
assets to changes in interest rates (economic
aspect).
On the asset side, SID Bank and the SID Bank
Group are exposed to interest rate risk from
securities measured at fair value through other
comprehensive income, loans given, and the
balance in the settlement account and in
commercial accounts. On the liability side, it is
exposed to interest rate risk from loans received
and debt securities issued.
The operations of SID Bank account for a large
part of the interest rate risk of the SID Bank
Group. Exposure to interest rate risk at the
subsidiary arises primarily from financial assets,
and cash and cash equivalents. The insurer
mitigates its interest rate risk by maintaining an
appropriate combination of long-term and
short-term financial assets with fixed and
variable interest rates in its portfolio, thereby
ensuring the required solvency capital.
SID Bank identifies, measures, manages and
monitors interest rate risk in accordance with
the current interest rate risk management
policy. The Bank’s management body
(management board and supervisory board)
reviews and adopts the interest rate risk
management policy at least once a year. The
level of interest rate risk has been mitigated
through the introduction of a limit system and
the determination of the internal capital
requirements. The Bank has a limit system in
place for mitigating interest rate risk via
indicative limits on interest rate gaps. In the
event of an increase in exposure to interest rate
risk evident from an increase in interest rate
gaps, the treasury department proposes
measures to mitigate interest rate risk,
which are approved and adopted by the asset-
liability and liquidity management committee.
Through the regular application of the interest
rate management process, SID Bank succeeds
in maintaining interest rate risk within
acceptable limits and within the risk appetite as
adopted.
SID Bank manages exposure to interest rate risk
through the coordination of funds and
investments in accordance with their maturity
and the level and method of setting interest
rates, and through the use of derivatives. The
management of interest rate risk is conducted
in particular through the coordination of
methods for the remuneration of assets and
liabilities, since the majority of assets and
liabilities consist of euro-denominated
instruments with an interest rate tied to the
Euribor reference interest rate. The Bank is
exposed to interest rate risk arising from
mismatches in the repricing periods and
incomplete matching in the choice of the
reference interest rate, and from exposure in
debt securities measured at fair value through
other comprehensive income and other items
with a fixed interest rate.
To manage interest rate risk, SID Bank also
conducts transactions in derivatives (interest
rate swaps). If the derivatives meet the
conditions, these are dealt with by applying
hedge accounting with the aim of achieving
lower volatility of profit or loss resulting from
changes to the fair value of derivatives. To this
end, the Bank has internal documents in place
that describe the relationship between the
hedged item and the hedging instrument, the
purpose of risk management, the valuation
method and the hedging strategy. The Bank
also has documented assessments of the
success of the hedge ratios compiled upon the
conclusion of transactions, and regularly
conducts monthly assessments of the success
of the hedge ratios. As at 31 December 2018,
SID Bank held two interest rate swaps as fair
value hedges of assets to a total contractual
value of EUR 15,000 thousand and an interest
rate swap as a hedge for expected cash flows
of liabilities to a total contractual value of EUR
70,000 thousand, for which the Bank used

192 | Annual report of SID Bank and the SID Bank Group 2018
hedge accounting. At the end of 2018, all hedge
ratios were successful under hedge accounting.
SID Bank measures exposure to interest rate
risk arising from the mismatch of interest-
sensitive items in the banking book using the
interest rate gap method, whereby it applies the
principle of the classification of interest-
sensitive on-balance-sheet items into time
intervals according to residual maturity for
items with a fixed interest rate and with regard
to the first repricing for items with a variable
interest rate. When interest-sensitive items are
classified, they are itemised by currency. Due to
low exposure in foreign currencies, interest-
sensitive items in foreign currencies are added
to items in euros. The Bank does not accept
sight deposits from the public and therefore
does not use an internal model of movements
of deposits with no maturity.
The Bank carries out monthly analyses of the
sensitivity of net interest income and the
economic value of equity based on scenarios of
changes to the interest rate curve. To assess
the impact of rapid changes in market interest
rates (a sudden parallel shift of 200 basis
points) on the economic value of its equity, SID
Bank has an internal indicative limit, not
counting capital, that is defined in significantly
stricter terms than set out in the banking
regulations. Under the provisions of the ZBan-
2, the Bank must report to the competent
authority on changes to economic value arising
from the calculation of the outcome of the
standard shock. If a sudden and unexpected
repricing of interest rates of 200 basis points
absorbs more than 20% of the Bank’s capital,
the supervisory authority may require the Bank
to adopt measures to limit interest rate risk. SID
Bank also has an internal indicative limit for
assessing the impact of sudden changes in
market interest rates (a sudden parallel shift of
200 basis points) on net interest income in the
first year after the change.
Information on interest rate gaps, sensitivity
analyses, possible transgressions of limits on
exposure to interest rate risk and other
information on exposure to interest rate risk is
discussed by the asset-liability and liquidity
management committee.
Exposure to interest rate risk for on-balance-sheet and off-balance-sheet financial instruments
The tables show financial assets and liabilities
with respect to residual maturity for items with
a fixed interest rate and with regard to the first
repricing for items with a variable interest rate,
whereby debt securities are considered at fair
value and loans at the net carrying amount.

Annual report of SID Bank and the SID Bank Group 2018 | 193
31 Dec 2018
SID Bank
Up to 1 month
1 to 3 months
3 to 12 months
1 to 5 years
More than 5
years
Total remunera-ted items
Non-remu-nerated
items Total
Financial assets as at 31 Dec 2018 433,526 380,740 865,388 379,592 235,901 2,295,147 6,715 2,301,862
Cash, cash balances at central banks and other demand deposits at banks 121,184 0 0 0 0 121,184 0 121,184 Non-trading financial assets mandatorily at fair
value through profit or loss 4,513 0 11,154 0 0 15,667 0 15,667 Financial assets measured at fair value through other comprehensive income 38,076 4,964 66,591 362,426 185,689 657,746 4,942 662,688
Financial assets measured at amortised cost 269,753 375,776 787,643 17,166 50,212 1,500,550 1,773 1,502,323
Loans and advances to banks 60,057 236,893 512,400 0 0 809,350 0 809,350
Loans and advances to customers 209,616 138,883 275,243 17,166 50,212 691,120 0 691,120
Other financial assets 80 0 0 0 0 80 1,773 1,853
Financial liabilities as at 31 Dec 2018 265,239 327,060 903,355 302,876 91,899 1,890,429 1,790 1,892,219
Financial liabilities measured at amortised cost 265,239 327,060 903,355 302,876 89,001 1,887,531 1,790 1,889,321
Deposits by banks 22,497 20,796 0 0 0 43,293 0 43,293
Deposits by customers 39,210 0 0 0 0 39,210 0 39,210
Loans from banks and central banks 22,257 116,006 827,805 196,883 0 1,162,951 0 1,162,951
Loans from customers 181,057 190,250 75,542 31,231 31,162 509,242 0 509,242
Debt securities 0 0 0 74,762 57,839 132,601 0 132,601
Other financial liabilities 218 8 8 0 0 234 1,790 2,024
Hedging derivatives 0 0 0 0 2,898 2,898 0 2,898
Interest rate sensitivity gap as at 31 Dec 2018 168,287 53,680 (37,967) 76,716 144,002 404,718 4,925 409,643
Financial assets as at 31 Dec 2017 279,041 391,621 1,044,419 465,407 234,789 2,415,277 17,787 2,433,064
Financial liabilities as at 31 Dec 2017 251,736 258,141 1,206,726 203,821 115,826 2,036,250 1,989 2,038,239
Interest rate sensitivity gap as at 31 Dec 2017 27,305 133,480 (162,307) 261,586 118,963 379,027 15,798 394,825
31 Dec 2018
SID Bank Group
Up to 1 month
1 to 3 months
3 to 12 months
1 to 5 years
More than 5
years
Total remune-
rated items
Non-remu-nerated
items Total
Financial assets as at 31 Dec 2018 433,526 380,740 865,388 379,592 235,901 2,295,147 6,711 2,301,858
Cash, cash balances at central banks and other demand deposits at banks 121,184 0 0 0 0 121,184 0 121,184 Non-trading financial assets mandatorily at fair
value through profit or loss 4,513 0 11,154 0 0 15,667 0 15,667 Financial assets measured at fair value through other comprehensive income 38,076 4,964 66,591 362,426 185,689 657,746 4,942 662,688
Financial assets measured at amortised cost 269,753 375,776 787,643 17,166 50,212 1,500,550 1,769 1,502,319
Loans and advances to banks 60,057 236,893 512,400 0 0 809,350 0 809,350
Loans and advances to customers 209,616 138,883 275,243 17,166 50,212 691,120 0 691,120
Other financial assets 80 0 0 0 0 80 1,769 1,849
Financial liabilities as at 31 Dec 2018 265,239 327,060 903,355 302,876 91,899 1,890,429 1,790 1,892,219
Financial liabilities measured at amortised cost 265,239 327,060 903,355 302,876 89,001 1,887,531 1,790 1,889,321
Deposits by banks 22,497 20,796 0 0 0 43,293 0 43,293
Deposits by customers 39,210 0 0 0 0 39,210 0 39,210
Loans from banks and central banks 22,257 116,006 827,805 196,883 0 1,162,951 0 1,162,951
Loans from customers 181,057 190,250 75,542 31,231 31,162 509,242 0 509,242
Debt securities 0 0 0 74,762 57,839 132,601 0 132,601
Other financial liabilities 218 8 8 0 0 234 1,790 2,024
Hedging derivatives 0 0 0 0 2,898 2,898 0 2,898
Interest rate sensitivity gap as at 31 Dec 2018 168,287 53,680 (37,967) 76,716 144,002 404,718 4,921 409,639
Financial assets as at 31 Dec 2017 283,920 394,246 1,049,582 478,580 238,563 2,444,891 17,788 2,462,679
Financial liabilities as at 31 Dec 2017 251,736 258,141 1,206,726 203,821 115,826 2,036,250 2,860 2,039,110
Interest rate sensitivity gap as at 31 Dec 2017 32,184 136,105 (157,144) 274,759 122,737 408,641 14,928 423,569

194 | Annual report of SID Bank and the SID Bank Group 2018
Sensitivity analysis
The SID Bank Group’s exposure to interest rate
risk comes entirely from SID Bank’s
remunerated items. SID Bank conducts an
analysis of the sensitivity of remunerated assets
and liabilities to changes in interest rates on an
annual basis. Analysis of the sensitivity of
interest-sensitive asset and liability items is
made under the assumption of a sudden change
of 100 basis points in market interest rates. The
impact on net interest income is calculated for
a period of one year.
Had market interest rates risen by 100 basis
points, SID Bank’s net interest income in 2018
would have increased by EUR 2,003 thousand
(compared with EUR 883 thousand in 2017).
The change would have been reflected in higher
income in the statement of profit or loss. Had
market interest rates fallen by 100 basis points,
the changes would have been of the same
magnitude as after a rise in interest rates, but
in the opposite direction. For larger or smaller
changes in market interest rates, the results
have been calculated proportionately.
In addition to an analysis of the sensitivity of
net interest income for a period of one year and
an analysis of the economic value of equity, SID
Bank also regularly carries out an analysis of the
sensitivity of the market values of the securities
portfolio using an approximate modified
duration in line with the internal methodology.
In the area of interest rate risk in the banking
book, in 2019 the Bank is planning to upgrade
the measurement and/or assessment and
performance of a sensitivity analysis in line with
the new European Banking Authority (EBA)
guidelines and/or with the changes in
regulatory requirements within the scope of the
measurement of interest rate risk in the banking
book.
3.4 Currency risk
Currency risk is the risk of a loss arising from
adverse changes in exchange rates.
SID Bank identifies, measures, manages and
monitors currency risk in accordance with the
adopted current currency risk management
policy. The management body reviews and
adopts the currency risk management policy at
least once a year. The implementation of the
policy is monitored and supervised by the asset-
liability and liquidity management committee.
When taking up and managing currency risk,
SID Bank takes into account the adopted
currency risk appetite. The process of managing
currency risk includes both the setting of
internal limits and the regular measurement,
monitoring and reporting of exposure to
currency risk on the basis of the calculation of
the overall net position in foreign currencies.
The Bank manages exposure to currency risk
chiefly by matching asset and liability positions
in foreign currencies and trading in derivatives
in significant foreign currencies.
In the management of currency risk, SID Bank
determines the potential loss that would arise
as a result of a change in exchange rates by
means of the open foreign exchange position,
which is the difference between the sums of all
assets and liabilities in foreign currencies. The
Bank has a limit system in place for limiting
currency risk via limits on open foreign
exchange positions. The daily open net foreign
exchange position in 2018 was within the
internally set limits.
Neither the transactions executed by SID Bank
and the SID Bank Group in foreign currencies
nor the currency risk are materially significant.
Owing to the low level of exposure to currency
risk, SID Bank and SID Bank Group do not carry
out analyses of currency sensitivity.
The subsidiaries of the SID Bank Group match
the structure of assets and liabilities in foreign
currencies to the greatest extent possible. The
insurer matches the liabilities structure with the
currency structure of the assets, whereby the
largest part of the currency mismatch arises
from insurance technical provisions and
insurance technical provisions ceded to
reinsurers.

Annual report of SID Bank and the SID Bank Group 2018 | 195
Exposure to currency risk for on-balance-sheet and off-balance-sheet financial instruments
31 Dec 2018
SID Bank SID Bank Group
EUR USD
Other
curren- cies Total EUR USD
Other
curren-cies Total
Financial assets as at 31 Dec 2018 2,286,363 15,498 1 2,301,862 2,286,359 15,498 1 2,301,858
Cash, cash balances at central banks and other demand deposits at banks 120,904 279 1 121,184 120,904 279 1 121,184
Non-trading financial assets mandatorily at fair value through profit
or loss 15,667 0 0 15,667 15,667 0 0 15,667
Financial assets measured at fair value through other comprehensive income 662,688 0 0 662,688 662,688 0 0 662,688
Financial assets measured at amortised cost 1,487,104 15,219 0 1,502,323 1,487,100 15,219 0 1,502,319
Loans and advances to banks 805,430 3,920 0 809,350 805,430 3,920 0 809,350
Loans and advances to customers 679,821 11,299 0 691,120 679,821 11,299 0 691,120
Other financial assets 1,853 0 0 1,853 1,849 0 0 1,849
Financial liabilities as at 31 Dec 2018 1,876,469 15,725 25 1,892,219 1,876,469 15,725 25 1,892,219
Financial liabilities measured at amortised cost 1,873,571 15,725 25 1,889,321 1,873,571 15,725 25 1,889,321
Deposits by banks 31,496 11,797 0 43,293 31,496 11,797 0 43,293
Deposits by customers 39,210 0 0 39,210 39,210 0 0 39,210
Loans from banks and central banks 1,159,023 3,928 0 1,162,951 1,159,023 3,928 0 1,162,951
Loans from customers 509,242 0 0 509,242 509,242 0 0 509,242
Debt securities 132,601 0 0 132,601 132,601 0 0 132,601
Other financial liabilities 1,999 0 25 2,024 1,999 0 25 2,024
Hedging derivatives 2,898 0 0 2,898 2,898 0 0 2,898
Net on-balance-sheet position as at 31 Dec 2018 409,894 (227) (24) 409,643 409,890 (227) (24) 409,639
Irrevocable commitments given as at 31 Dec 2018 275,340 0 0 275,340 275,340 0 0 275,340
Financial assets as at 31 Dec 2017 2,414,345 18,718 1 2,433,064 2,443,937 18,718 24 2,462,679
Financial liabilities as at 31 Dec 2017 2,021,722 16,517 0 2,038,239 2,022,588 16,520 2 2,039,110
Net on-balance-sheet position as at 31 Dec 2017 392,623 2,201 1 394,825 421,349 2,198 22 423,569
Irrevocable commitments given as at 31 Dec 2017 58,139 0 13,762 71,901 58,139 0 13,762 71,901

196 | Annual report of SID Bank and the SID Bank Group 2018
3.5 Operational risk
Operational risk arises as a result of inadequate
or failed internal processes, people and
systems, or from external events not arising
from credit, market or liquidity risk. Operational
risk also includes IT risk, legal risks and risks
associated with compliance, but does not
include strategic risk and reputation risk. An
element of legal risk is compliance risk, which is
the risk of legal or regulatory sanctions,
significant financial losses or a loss of reputation
as a result of the Bank’s operations failing to
comply with the main regulations and standards
of good practice.
Operational risk depends on internal
organisation, the management of business
processes, the functioning of internal controls,
the effectiveness of internal and external
auditing, etc. Operational risk factors include
personnel, business processes, information
technology and other infrastructure,
organisational arrangements and external
events.
Management of operational risk is based on the
established system of internal controls, the
system of decision-making and powers, proper
replacements during absences, the right
training for personnel carried out on a regular
basis, and investment in information
technology. The Bank continually endeavours to
improve the culture of awareness among
management and other employees of the
importance of effective management of
operational risk, which is present in all activities
and processes relating to operations.
The system for managing operational risk
includes the recording of loss events in the
software database and the analysis and
resolution thereof with the aim of effectively
identifying, assessing and managing operational
risk. Control of the entered loss events is carried
out by the risk management department, which
regularly reports to the management board on
their numbers, on any loss valuation, and on
proposed measures for reducing the likelihood
of the repetition of an individual loss event.
Quarterly reports on loss events arising from
operational risk are also submitted to the Bank
of Slovenia. In the case of a loss event involving
significant losses, SID Bank is obliged to notify
the supervisory board and the Bank of Slovenia
immediately and to submit all relevant
documentation.
In terms of the order of loss events in line with
the Basel standards, the most common loss
events in 2018 were execution, delivery and
process management (80% of all loss events),
followed by business disruption and systems
failures (18%), and customers, products and
negative business practices (2%). No loss
events involving significant losses were
recorded in 2018.
The Bank uses a basic indicator approach for
calculating capital requirements for operational
risk in line with the provisions of the CRR.
SID Bank assesses operational risk annually by
developing a risk profile for the Bank or
assessing the risk matrix on the basis of
selected elements. SID Bank considers
elements in the area of information support,
business continuity, the effect of new product
launches, outsourcing and the employment rate
for company positions as the key elements in
the assessment of the materiality of operational
risk within the scope of the ICAAP.
By conducting internal audits, the internal audit
department ensures the independent and
impartial assessment of the internal governance
arrangements, including risk management
systems and processes and internal controls.
With the aim of improving operations and
adding value, internal audits are carried out of
all areas, business activities, processes and
functions of SID Bank in line with the Bank’s risk
profile and the annual internal audit work plan.
The systemic risks entailed by information
technology, which are increasing as the level of
computerisation increases, are managed by
additional measures such as the business
continuity plan, the duplication of critical
infrastructure and other measures to increase
information security (advanced systems to
prevent and detect hacking, incident-
management security systems, staff training).
The implementation of the business continuity
plan is assigned to groups of employees formed

Annual report of SID Bank and the SID Bank Group 2018 | 197
in advance (emergencies group, operational
security group, first aid and rescue group, asset
remediation group). The members of these
groups also collaborate in the procedure for
amending the business continuity plan, while
the body responsible for amending the plan is
the compliance department, which ensures
mutual coordination and provision of
information in cooperation with IT.
In managing operational risk, SID Bank also
takes account of the outsourcing policy and the
outsourcing plan, the purpose of which is to
create a framework for the selection,
establishment, implementation and monitoring
of contractual relationships with external
providers, to prevent inconsistencies,
inequalities, ambiguities and imbalanced risk
management when outsourcing, and thus the
possible adverse consequences on the
operations of SID Bank, and to ensure an
adequate level of professionalism of outsourced
services at SID Bank, monitor the
implementation of those services and manage
the risk arising from outsourcing. The risk
management department drafts an annual
review of risk management with external
contractors, compiles an annual report and
proposes measures. After receiving the
management board’s approval, the supervisory
board’s risk committee is briefed on the report,
which is then forwarded to the Bank of Slovenia.
As Slovenia’s central financial institution in the
area of promotion and development, SID Bank
is moving into new areas of operation in line
with its mission. Operational risk is increasing at
the Bank due to the gradual introduction of new
products and the increasing complexity of
products and processes.
It is primarily through the provision of financing
programmes for small and medium-sized
enterprises (the promotional-development
platform) that SID Bank has obtained a large
number of new customers in the last few years;
this has, in turn, required the recruitment of
new staff and further development of the
relevant software support. The associated
operational risk is managed using
predetermined work processes and a system of
powers, by applying the four-eyes principle and
by ensuring adequate IT support.
To manage risk arising from new product
launches, the Bank has adopted internal rules
that set out the rules for launching new
products and the powers and responsibilities of
the organisational units in the process of
launching new products, with an emphasis,
among other things, on the production of a
comprehensive and impartial risk assessment.
All material risks identified during the
development or launch of a new product in
connection with the planned
introduction/launch of a new product must be
processed in a timely and thorough manner in
the risk management process in accordance
with the bylaws governing the management of
individual risks. This means, inter alia, that
means measures are adopted to manage the
identified risks at the bank’s competent bodies.
SID Bank also has in place an information
security function that monitors and controls
information security procedures, and any
changes to those procedures, for the purpose of
preventing unauthorised access to information
in storage, being processed or being
transferred. One of the duties of the information
security officer is to manage security incidents
or potential security incidents. At least once a
year, using records of loss events, the
information security officer also produces an
analysis of all security incidents and proposes
appropriate measures in response.
In the event of a cyber incident that constitutes
an unwanted or unexpected information
security event or a series of such events that
could compromise operations and threaten
information security, employees who detect or
suspect a cyber incident must immediately
notify the information security officer and the
director of the IT department. They assume
responsibility for processing the incident and for
reporting to the Bank of Slovenia, in line with
the Bank of Slovenia’s requirements relating to
reporting on significant cyber incidents.
At the end of 2018, SID Bank overhauled its
operational risk management system as it
pertains to the processing of loss events. It did
so by upgrading information support and giving
a greater role to directors in resolving loss
events. The overhauled system of recording loss
events came into operation at the beginning of
2019. In 2018 SID Bank also further automated
198 | Annual report of SID Bank and the SID Bank Group 2018
its reporting, compiled an inventory of
overhauled business processes and undertook a
number of other measures.
In 2018, as part of the overhaul of the
operational risk management system, SID Bank
also focused particular attention on fraud risk.
The possibility of internal and external fraud
was assessed in relation to all business
processes at the Bank, in line with the adopted
internal methodology for assessing fraud risk.
The results obtained during this process were
then incorporated into the Bank’s risk profile
assessment for 2018.
When assessing its exposure to fraud risk, the
Bank proceeded from the assumption that fraud
was the intentional/deliberate committing of an
act for the purpose of acquiring an unlawful
pecuniary benefit for oneself or a third party.
Measures to prevent fraud are divided into
short-term measures, which include internal
controls/procedures in particular, and long-term
measures, to be implemented through the
strengthening of organisational culture on the
part of the Bank. SID Bank also monitors fraud
risk within the context of operational risk via a
loss events database that classifies loss events
as follows, in line with Article 324 of the CRR:
- internal fraud (unapproved activities, theft
and fraud, malicious activities in the Bank’s
information system);
- external fraud (theft and fraud, malicious
activities in the Bank’s information system);
- negative employment practices (relations
with employees, safe environment,
diversity/discrimination);
- clients, products and negative business practices (consent/disclosure/fiduciary
requirements, inappropriate business and market practices, deficiencies in products,
recusal/surety/exposure, consulting
activities); - damage to movable property and real
estate (disasters and other events); - business disruptions and system failures;
- execution, delivery and process management.
There were no instances of fraud at SID Bank in 2018.
3.6 Capital management
Capital management
SID Bank and the SID Bank Group must always
have adequate capital at their disposal as a
reserve against the various risks to which they
are exposed in their operations. This is a
continuous process of determining and
maintaining an amount and quality of capital
that is adequate, taking the risks defined in the
capital management policy into account.
Fulfilment of the capital requirements and of the
requirements relating to buffers and the
leverage ratio is based on the provisions of the
CRR.
Capital risk relates to the inadequate
composition of capital with regard to the scope
and type of operations or to the difficulties that
the Bank faces in obtaining fresh capital,
particularly in the event of the need for a rapid
increase or in the event of adverse conditions in
the business environment.
The role and responsibilities of the supervisory
board in the management of capital risk are to
assess the adequacy of the Capital Risk
Management and Capital Management Policy
and assess the implementation of that policy.
The management board is responsible for
adopting an adequate capital risk management
policy, ensuring an adequate amount and
quality of capital, and meeting the regulator’s
capital requirements.
As insurance corporations (SID-PKZ) are not
included in prudential consolidation, which is
based on the provisions of the CRR, and
following the liquidation of Prvi Faktor Group
companies and the subsequent reduction in the
Prvi Faktor Group’s total assets, the Bank has,
since the beginning of 2017, no longer been
obliged to meet prudential requirements on a
consolidated basis, but only individually (for SID
Bank).

Annual report of SID Bank and the SID Bank Group 2018 | 199
Capital for capital adequacy purposes
Capital is divided into three categories with
regard to its attributes and the requirements:
common equity Tier 1 (CET1), additional Tier 1
(T1) and Tier 2 (T2). SID Bank’s capital is
comprised solely of the highest quality common
equity Tier 1 capital. The Bank does not hold
any additional Tier 1 capital or Tier 2 capital.
The Bank does not take into account the net
profit for the financial year, which for 2018
amounted to EUR 14,314 thousand, in the
calculation of capital for capital adequacy
purposes until SID Bank’s general meeting
adopts the resolution on the distribution of
profit.
The bank calculates the capital requirement for
credit risk using the standardised approach, in
accordance with Part Three, Title II, Chapter 2
of the CRR. To calculate the amounts of the risk-
weighted exposures for credit risk, the ratings
for individual categories of risk are not used;
rather, the risk weights for the individual
categories of risk are assigned with respect to
the degree of risk of the customer’s country. In
order to determine the level of credit quality of
a central government (Article 114 of the CRR),
the Bank uses SID Bank’s rating as a nominated
export credit agency, as set out in Article 137 of
the CRR.
The Bank uses a basic indicator approach for
calculating capital requirements for operational
risk (Articles 315 and 316 of the CRR).
The capital requirement for credit valuation
adjustment (CVA) risk is calculated using the
standardised method, as set out in Article 384
of the CRR.
The capital requirement for currency risk is
calculated in accordance with Articles 351 to
354 of the CRR, and is calculated when the sum
of the total net foreign currency position
exceeds 2% of the total capital for capital
adequacy purposes. As at the of 2018, SID Bank
was not required to formulate capital
requirements for currency risk, as the limit was
not exceeded.

200 | Annual report of SID Bank and the SID Bank Group 2018
Reconciliation of items of common equity Tier 1 capital with the statement of financial position, the prudential filters, the risk exposure and the capital adequacy ratios
SID Bank 31 Dec 2018 31 Dec 2017
Total regulatory capital 422,052 409,893
of which:
Paid-up capital instruments 300,000 300,000
Share premium (paid-in surplus) 1,139 1,139
Treasury shares (1,324) (1,324)
Profit reserves and retained earnings (including net profit) 118,506 94,635
Accumulated other comprehensive income 3,731 15,444
Net profit for financial year (not taken into account) (14,314) (13,956)
Prudential filters (1,680) (10,319)
Intangible assets (999) (804)
Surplus of deductions from items of additional Tier 1 capital over additional Tier 1 capital (681) (731)
Elements or deductions of common equity Tier 1 capital: other 0 (426)
Other transitional adjustments to common equity
Tier 1 capital 0 (8,359)
Common equity Tier 1 capital (CET1) 406,057 385,619
Additional Tier 1 capital (AT1) 0 0
Tier 1 capital (T1) 406,057 385,619
Tier 2 capital (T2) 0 0
Capital for capital adequacy purposes 406,057 385,619
Total exposure to credit risk 1,119,749 969,785
of which:
Central governments or central banks 15,150 21,343
Regional governments or local authorities 10,980 8,582
Public sector entities 6,457 6,877
Multilateral development banks 2,400 2,400
Institutions 215,751 239,782
Corporates 796,877 610,598
Exposures in default 33,685 37,601
Equities 32,848 37,266
Other 5,601 5,336
Exposure to market risk (currency risk) 0 0
Exposure to operational risk 55,106 77,152
Exposure to credit valuation adjustment risk 13,127 2,117
Total risk exposure (RWA) 1,187,983 1,049,055
Surplus of common equity Tier 1 capital (CET1) 352,598 338,411
Surplus of Tier 1 capital (T1) 334,778 322,675
Total surplus capital 311,019 301,694
Common equity Tier 1 capital ratio (CET1) 34.18% 36.76%
Tier 1 capital ratio (T1) 34.18% 36.76%
Total capital ratio 34.18% 36.76%
Breakdown of capital requirements by type of risk and structure
SID Bank 31 Dec 2018
Structure
31 Dec 2017
Structure
% %
Capital requirements
For credit risk 89,580 94.3 77,583 92.4
For operational risk 4,409 4.6 6,172 7.4
For credit valuation adjustment risk 1,050 1.1 169 0.2
Total 95,039 100 83,924 100

Annual report of SID Bank and the SID Bank Group 2018 | 201
Capital requirements for credit risk
SID Bank 31 Dec 2018 31 Dec 2017
Exposure class
Central governments or central banks 1,212 1,707
Regional governments or local authorities 878 687
Public sector entities 517 550
Multilateral development banks 192 192
Institutions 17,260 19,183
Corporates 63,750 48,848
Exposures in default 2,695 3,008
Equities 2,628 2,981
Other 448 427
Total 89,580 77,583
Assessment of internal capital requirement
SID Bank annually assesses its risk profile,
which comprises a documented and categorised
collection of quantitative and qualitative
assessments of the risks that a bank takes up
within the framework of its operations and the
control environment with which it manages
these risks. Checks are made at least every
three years, upon material changes in the risks
to which the Bank is exposed (e.g. upon new
product launches) and upon substantial
changes to the organisational structure and the
operation of the system of internal controls to
ensure that the assumptions of the
methodology for assessing the risk profile of
SID Bank are appropriate.
The risk profile represents a basis for the
integral risk management process, the internal
capital adequacy assessment process, the
planning of internal audit procedures,
compliance and direct supervision by the Bank
of Slovenia.
The results of the risk profile assessment for
2018 indicate that the risks with the highest risk
scores at SID Bank are strategic risk,
profitability risk, operational risk, reputation risk
and credit risk. The results of the risk profile
assessment for 2018 in general confirm the
previous risk score for SID Bank.
SID Bank uses a building-block approach in the
internal assessment of risk-based capital
requirements. In the first element (risks subject
to minimum capital requirements), SID Bank
assesses the risk-based capital requirements in
the amount of the minimum capital
requirements, as set out in the section on
capital for capital adequacy purposes. In the
second element (risks not fully covered by
minimum capital requirements), SID Bank did
not identify any material risks. In the third
element (risks not subject to minimum capital
requirements), SID Bank identifies interest rate
risk in the banking book, concentration risk,
profitability risk and strategic risk as significant.
In 2018 SID Bank also allocated, within the
context of capital requirements, additional
capital for a capital conservation buffer in the
amount of the difference between what was
prescribed for 2018 and what will apply as of 1
January 2019, and additional capital for a buffer
for other systemically important institutions in
the amount that will apply as of 1 January 2020.
In the fourth element (external factors), the
bank identifies risk-based capital requirements
on the basis of stress tests, whereby it takes
account of the fact that this is an additional
component of capital intended to be used in
crisis situations.
On a quarterly basis, SID Bank calculates the
internal capital requirements and checks
whether the level of capital is appropriate. The
calculations are then reviewed by the asset-
liability and liquidity management committee.
Once a year, the management body approves
the Bank’s risk profile score and the internal
capital adequacy assessment process.
In 2018 the Bank of Slovenia, during its regular
supervisory review and evaluation process
(SREP) assessed the risks to which SID Bank
was exposed and found that the strategies and
processes in place for the continuous
assessment and provision of adequate internal
capital ensured risks were recognised to an
adequate degree. As at 31 December 2018, SID
Bank exceeded the Bank of Slovenia’s
requirements with respect to the level of capital
ratios.

202 | Annual report of SID Bank and the SID Bank Group 2018
Capital buffers
Under the provisions of the ZBan-2 and
European banking legislation, the Bank of
Slovenia has to define requirements regarding
the maintenance of capital buffers that a bank
shall meet for the purpose of preventing or
mitigating macroprudential and systemic risks.
Capital buffers represent an additional
requirement for the Bank in determining the
required level of capital, as banks must use their
highest-quality capital (CET1) to meet not only
the requirements arising from risks under Pillar
1 and Pillar 2 of the Basel Agreement, but also
the requirements regarding capital buffers.
The combined buffer requirement means the
total capital that banks must maintain to meet
the requirements in connection with:
– the capital conservation buffer;
– the institution-specific countercyclical
capital buffer;
– the buffer for globally systemically
important institutions (not relevant for SID
Bank);
– the buffer for other systematically
important institutions;
– the systemic risk buffer.
As at the end of 2018, SID Bank met the
requirements relating to capital buffers, as
explained below.
The Bank covers the capital conservation buffer
with common equity Tier 1 (CET1) capital,
which in 2018 amounted to 1.875% of the total
risk exposure. The countercyclical capital buffer
is implemented to protect the banking system
against potential losses insofar as these are
related to an increase in risks in the system as
a result of excessive growth in lending. The
instrument increases the resilience of the
banking system, and prevents excessive growth
in lending The buffer rate may range from 0%
to 2.5% of the total risk exposure amount (and
may exceptionally be higher), and depends on
the level of risk in the system. The current
buffer rate for exposure in Slovenia, in effect as
of 1 January 2016, is 0%. The institution-
specific countercyclical capital buffer rate
comprises the weighted average of
countercyclical buffer rates that apply in
countries in which the related credit exposures
of the Bank are located. SID Bank discloses the
required data on the geographical distribution
of credit exposures relevant to the calculation of
the countercyclical capital buffer, capital
requirements and the level of the institution-
specific countercyclical capital buffer in Section
1 (Disclosures under Part 8 of the CRR). As at
31 December 2018, the level of SID Bank’s
institution-specific countercyclical capital buffer
stood at 0.01% of total risk exposure, which
arises from the relevant credit exposure to
Norway, whose countercyclical capital buffer
rate is set at 2%, and the United Kingdom,
whose countercyclical capital buffer rate is set
at 1%. Pursuant to a Bank of Slovenia
resolution, SID Bank will have to provide a
buffer for other systemically important
institutions (O-SII) on a consolidated basis
through its common equity Tier 1 (CET1) capital
in the amount of 0.25% of total risk exposure
from 1 January 2019 on, and in the amount of
0.5% of total risk exposure from 1 January 2020
on.
Leverage ratio
SID Bank’s asset-liability and liquidity
management committee regularly monitors the
movement of the leverage ratio. During the
assessment of the risk profile, checks are also
made to ensure that the Bank’s leverage ratio is
appropriate.
The leverage ratio stood at 16.3% as at 31
December 2018 (end of 2017: 15.5%),
significantly in excess of the regulatory value
and the adopted limit value within the
framework of the risk appetite indicators. With
respect to the structure of the statement of
financial position and the level of the leverage
ratio, the Bank concludes that the risk of
excessive leverage is low. Detailed disclosures
of the leverage ratio are given in the section on
Disclosure under Part Eight of the CRR.

Annual report of SID Bank and the SID Bank Group 2018 | 203
3.7 Fair value of financial assets and liabilities
Fair value of financial assets and liabilities
Fair value is the price that would be received
when selling an asset or paid when transferring
a liability in a standard transaction between
market participants at the measurement date
under current market terms, regardless of
whether the price can be directly observed or
estimated using another valuation technique.
The fair value of financial assets and financial
liabilities traded on an active market is based on
the published market prices. SID Bank and the
SID Bank Group establish fair value for all other
financial instruments using other valuation
techniques.
An active market is a market on which frequent
transactions are made using assets or liabilities,
whereby public information on prices is
provided on a regular basis.
SID Bank and the SID Bank Group measure fair
value using a fair value hierarchy that reflects
the significance of the input data.
– Level 1: quoted prices on active markets for
identical assets or liabilities to which SID Bank
and the SID Bank Group have access as at the
measurement date. For the SID Bank Group,
level 1 includes investments in bonds, to which
the MTS price applies within the MTS Slovenia
trading system, and the Composite Bloomberg
Bond Trader (CBBT) price.
– Level 2: inputs other than the quoted prices
included in level 1 that can be directly (prices)
or indirectly (derived from prices) observed for
assets or liabilities. In level 2, SID Bank and the
SID Bank Group include financial instruments
valued through the use of quoted prices for
similar assets and liabilities on active markets,
quoted prices for equivalent or similar assets
and liabilities on inactive markets, or inputs
other than quoted prices and that can be
observed as assets or liabilities, e.g. interest
rates and yield curves. Level 2 also includes
investment in bonds, which are valued on the
basis of the Bloomberg Generic Price (BGN), as
this price is identical to the interbank or OTC
market price. While the BGN is not a direct price
that SID Bank and the SID Bank Group could
use to sell securities on the valuation date, its
use does ensure impartiality in valuation. The
price is a reflection of the actual transactions on
the market and is an appropriate indicator of the
prices that could be achieved through the sale
of bonds on the market. The prices of sellers do
not deviate from the applied price to a
materially significant extent. SID Bank and the
SID Bank Group do not have any loans at level
2 measured at fair value.
– Level 3: SID Bank and the SID Bank Group
include in this category financial instruments for
which fair value is calculated according to
models that mainly use unobservable inputs,
and financial instruments that were valued at
historical cost in the previous period. The fair
value of loans mandatorily at fair value is
calculated through the discounting of estimated
cash flows at a uniform interest rate at
recognition. Estimated future cash flows for
loans to going concerns are calculated on the
basis of contractual cash flows, the likelihood of
repayment and macroeconomic forecasting
factors. For loans to companies that are not
going concerns, estimated future cash flows are
calculated taking account of liquidation of
collateral, the haircut, the collateral redemption
period and macroeconomic forecasting factors.
Observable inputs are developed on the basis of
market data such as public information on
actual events and transactions. Unobservable
inputs are inputs for which market data is not
available and are developed using the best
available information on the assumptions that
market participants would use when pricing the
asset or liability.
Financial assets measured at fair value
The financial instruments that SID Bank and the
SID Bank Group disclose at fair value in the
statement of financial position are non-trading
financial assets mandatorily at fair value
through profit or loss and measured at fair value
through other comprehensive income and
hedging derivatives.
Hedging derivatives that include interest rate
swaps are valued taking account of market
interest rates and yield curves.
The fair value of non-trading financial assets
mandatorily at fair value through profit or loss

204 | Annual report of SID Bank and the SID Bank Group 2018
and measured at fair value through other
comprehensive income is determined using
prices quoted on active markets for identical
assets, prices quoted on active markets for
similar assets and prices quoted for identical
and similar assets on inactive markets.
Financial instruments measured at fair value – fair value hierarchy
The table shows financial instruments measured
at fair value as at the reporting date with
respect to the level at which they are classified
in the fair value hierarchy.
SID Bank
31 Dec 2018 31 Dec 2017
Level 1 Level 2 Level 3 Total Level 1 Level 2 Level 3 Total
Non-trading financial assets mandatorily at fair value through
profit or loss 0 0 15,667 15,667 n.a. n.a. n.a. n.a.
Financial assets measured at fair value through other comprehensive income 33,938 570,250 58,500 662,688 n.a. n.a. n.a. n.a.
Debt securities 33,938 570,250 46,683 650,871 n.a. n.a. n.a. n.a.
Equities 0 0 11,817 11,817 n.a. n.a. n.a. n.a.
Available-for-sale financial assets (under IAS 39) n.a. n.a. n.a. n.a. 32,048 628,282 70,191 730,521
Debt securities n.a. n.a. n.a. n.a. 32,048 618,393 63,846 714,287
Equities n.a. n.a. n.a. n.a. 0 9,889 6,345 16,234
Total financial assets 33,938 570,250 74,167 678,355 32,048 628,282 70,191 730,521
Hedging derivatives 0 2,898 0 2,898 0 93 0 93
Total financial liabilities 0 2,898 0 2,898 0 93 0 93
SID Bank Group
31 Dec 2018 31 Dec 2017
Level 1 Level 2 Level 3 Total Level 1 Level 2 Level 3 Total
Non-trading financial assets mandatorily at fair value through profit
or loss 0 0 15,667 15,667 n.a. n.a. n.a. n.a.
Financial assets measured at fair value through other comprehensive income 33,938 570,250 58,500 662,688 n.a. n.a. n.a. n.a.
Debt securities 33,938 570,250 46,683 650,871 n.a. n.a. n.a. n.a.
Equities 0 0 11,817 11,817 n.a. n.a. n.a. n.a.
Available-for-sale financial assets (under IAS 39) n.a. n.a. n.a. n.a. 50,513 629,300 70,191 750,004
Debt securities n.a. n.a. n.a. n.a. 50,513 619,411 63,846 733,770
Equities n.a. n.a. n.a. n.a. 0 9,889 6,345 16,234
Total financial assets 33,938 570,250 74,167 678,355 50,513 629,300 70,191 750,004
Hedging derivatives 0 2,898 0 2,898 0 93 0 93
Total financial liabilities 0 2,898 0 2,898 0 93 0 93

Annual report of SID Bank and the SID Bank Group 2018 | 205
Financial assets not measured at fair value
The table shows the fair values of financial
assets not measured at fair value. Financial
assets are stated at fair value at the reporting
date, according to the level in the fair value
hierechy in which they are classified.
SID Bank SID Bank Group
31 Dec 2018 Level 2 Level 3 Fair value
Carrying
amount Level 2 Level 3 Fair value
Carrying
amount
Cash, cash balances at central banks and other demand deposits at banks 121,184 0 121,184 121,184 121,184 0 121,184 121,184
Financial assets measured at amortised cost 817,190 753,959 1,571,149 1,502,323 817,186 753,959 1,571,145 1,502,319
Loans and advances to banks 815,337 0 815,337 809,350 815,337 0 815,337 809,350
Loans and advances to customers 0 753,959 753,959 691,120 0 753,959 753,959 691,120
Other financial assets 1,853 0 1,853 1,853 1,849 0 1,849 1,849
Total financial assets 938,374 753,959 1,692,333 1,623,507 938,370 753,959 1,692,329 1,623,503
Financial liabilities measured at amortised cost 1,208,663 681,152 1,889,815 1,889,321 1,208,663 681,152 1,889,815 1,889,321
Deposits by banks 43,293 0 43,293 43,293 43,293 0 43,293 43,293
Deposits by customers 0 39,210 39,210 39,210 0 39,210 39,210 39,210
Loans from banks and central banks 1,163,346 0 1,163,346 1,162,951 1,163,346 0 1,163,346 1,162,951
Loans from customers 0 509,341 509,341 509,242 0 509,341 509,341 509,242
Debt securities 0 132,601 132,601 132,601 0 132,601 132,601 132,601
Other financial liabilities 2,024 0 2,024 2,024 2,024 0 2,024 2,024
Total financial liabilities 1,208,663 681,152 1,889,815 1,889,321 1,208,663 681,152 1,889,815 1,889,321
SID Bank SID Bank Group
31 Dec 2017 Level 2 Level 3 Fair value Carrying amount Level 2 Level 3 Fair value
Carrying amount
Cash, cash balances at central banks and other demand deposits at banks 71,071 0 71,071 71,071 75,950 0 75,950 75,950
Loans and advances (under IAS 39) 1,035,253 599,138 1,647,698 1,631,472 1,040,506 599,138 1,639,691 1,636,725
Loans and advances to banks 1,033,700 0 1,033,700 1,032,179 1,038,952 0 1,038,952 1,037,431
Loans and advances to customers 0 599,138 612,445 597,740 0 599,138 599,138 597,740
Other financial assets 1,553 0 1,553 1,553 1,554 0 1,601 1,554
Total financial assets 1,106,324 599,138 1,718,769 1,702,543 1,116,456 599,138 1,715,641 1,712,675
Financial liabilities measured at amortised cost 1,233,423 805,270 2,038,693 2,038,145 1,234,294 805,270 2,039,564 2,039,016
Deposits by banks 25,264 0 25,264 25,264 25,264 0 25,264 25,264
Deposits by customers 0 0 0 0 0 0 0 0
Loans from banks and central banks 1,205,968 0 1,205,968 1,205,542 1,205,968 0 1,205,968 1,205,542
Loans from customers 0 454,950 454,950 454,828 0 454,950 454,950 454,828
Debt securities 0 350,320 350,320 350,320 0 350,320 350,320 350,320
Other financial liabilities 2,191 0 2,191 2,191 3,062 0 3,062 3,062
Total financial liabilities 1,233,423 805,270 2,038,693 2,038,145 1,234,294 805,270 2,039,564 2,039,016
The carrying amounts for cash are assumed to
be approximately equal to their fair values.
The fair values of loans are calculated using
discount curves composed of probability of
default values for large Slovenian enterprises.

206 | Annual report of SID Bank and the SID Bank Group 2018
The fair value of financial liabilities with variable
interest rates is approximately equal to their
carrying amounts as at the reporting date.
Market interest rates are used to calculate the
fair value of liabilities for variable interest rate
loans measured at amortised cost. Loans with
fixed interest rates account for 5.6% of
liabilities for loans measured at amortised cost
at SID Bank and the SID Bank Group. Both
conclude that there are no material differences
between the fair value of the loans and their
carrying amounts.
SID Bank and SID Bank Group recognise and
measure issued debt securities and loans
according to amortised cost. For instruments
included in the hedge ratio for purposes of
calculation of the effects of the hedge
accounting, the fair value is calculated using
valuation techniques and the expected current
value. The expected current value is calculated
using inputs that are not quoted prices and that
can be observed, i.e. interest rates and yield
curves.
Table of transfers between levels
2018
SID Bank and SID Bank Group
Transfers from level 1
to level 3
Transfers from level 3
to level 1
Transfers from level 2
to level 3
Financial assets measured at fair value
Financial assets measured at fair value through other comprehensive income 14,074 2,297 4,942
Debt securities 14,074 2,297 0
Equities 0 0 4,942
Transfers from level 1 to level 3 and transfers
from level 3 to level 1 at the SID Bank Group
are the consequence of changes to the price of
investments in bonds, which in 2018 are valued
on the basis of the Ljubljana Stock Exchange
price. Transfers from level 2 to level 3 are the
consequence of a change to the method of
valuing investments in equities.
2017
SID Bank SID Bank Group
Transfers from level 2
to level 3
Transfers from level 2
to level 1
Transfers from level 1
to level 2
Transfers from level 2
to level 3
Transfers from level 2
to level 1
Financial assets measured at fair value
Available-for-sale financial assets (under IAS 39) 3,596 14,073 590 3,596 14,073
Debt securities 3,596 14,073 590 3,596 14,073
Transfers from level 2 to level 1 and transfers
from level 2 to level 3 at the SID Bank Group
are the consequence of the inclusion of
investments in bonds, which in 2017 were
valued on the basis of the Ljubljana Stock
Exchange price at level 1 or 3, while in 2016
they were valued on the basis of the price
according to the Bloomberg model and
classified as level 2.

Annual report of SID Bank and the SID Bank Group 2018 | 207
4 Management body’s concise statement on the SID Bank's
approach to the measurement of risk appetite
In accordance with Article 435(1)(f) of Regulation (EU) No 575/2013 of the European Parliament and
of the Council on prudential requirements for credit institutions and investment firms (hereinafter: the
CRR), the second paragraph of Article 17 of the Regulation on internal governance arrangements, the
management body and the internal capital adequacy assessment process for banks and savings banks,
and the EBA Guidelines on disclosure requirements under Part Eight of Regulation (EU) No 575/2013
(EBA GL/2016/11), the management body hereby issues the following concise statement on risk
management:
1. The overall risk level and the levels and types of individual material risks are subject to
comprehensive identification once a year in the process of drawing up the Bank’s risk profile, which
is approved by its management body. During the internal capital adequacy assessment process
(ICAAP), once a year the management body approves the assessment of the internal capital
requirement and the capital available to cover losses in the event of the realisation of the risks taken
up. The assessed risk absorption capacity is taken into account when the business strategy is being
drafted and the business objectives and risk appetite are being defined. The risk profile of SID Bank
is presented in detail in the Risk management segment in section 3 of the financial report, in
subsection 3.6 Capital management. The management also approves the internal liquidity adequacy
assessment process (ILAAP) once a year, in which the Bank carries out a comprehensive assessment
of the established systems for the management of liquidity risk, including an assessment of liquidity
risk in connection with the Bank’s risk profile and strategy.
When assessing its risk absorption capacity, which represents the maximum overall level of risk, SID
Bank takes into account:
- its risk profile assessment;
- the result of the ICAAP, covering both the ordinary and extraordinary operations of SID Bank;
- the Bank of Slovenia’s expectations after each completed supervisory review and evaluation
process in terms of maintaining the total capital ratio and the proportion of common equity Tier
1 capital for covering the recognised assessment of the internal capital requirement, which are
both prescribed by the Bank of Slovenia;
- the leverage ratio;
- the result of the ILAAP and SID Bank’s liquidity with regard to its risk profile;
- the plan of risk management activities, which sets out the measures available for the
management of identified and measured or assessed risks;
- other restrictions derived from SID Bank’s bylaws and regulations and standards, or the
requirements of the Bank of Slovenia and other competent and supervisory authorities.
2. SID Bank’s risk appetite, taking into account its risk absorption capacity, is assessed by SID Bank
once a year, or more frequently in the event of significant changes in risk exposure. The management
body sets out the risk appetite at least once a year, in parallel with the process of adopting the
annual operational plan, thereby ensuring that the risk appetite has been aligned to any changes in
the business model and in the current business strategy.
The risk appetite framework takes account of all material risks identified within the framework of the
risk profile, and is reflected in the risk appetite indicators approved by the management body,
including threshold values set with regard to the bank’s planned activities, and also the limits set in
the policies for the take-up and management of individual risks and other bylaws of SID Bank. Where
these risk appetite indicators have prescribed regulatory values, SID Bank has set significantly more
stringent target values. In accordance with the disclosures under the CRR, the selected risk appetite
indicators for SID Bank are presented below. The major financial data and performance indicators

208 | Annual report of SID Bank and the SID Bank Group 2018
of SID Bank are disclosed in the introductory section of the annual report, within the framework of
the section entitled Major financial data and performance indicators of SID Bank and the SID Bank
Group. The selected risk appetite indicators recorded at the end of 2018 are cited below, together
with the target values for the risk appetite:
- common equity Tier 1 capital ratio (CET1): 34.2% (target value: ≥ 15%),
- leverage ratio: 16.3% (target value: > 5%),
- liquidity coverage ratio (LCR): 458% (target value: > 150%),
- net stable funding ratio (NSFR): 140% (target value: > 110%),
- coverage of NPEs by total impairments, allowances and provisions for credit losses: 83.5%
(target value: > 50%),
- operational risk assessment score (profile): 2.8 (target value: ≤ 3).
In addition, the Bank has identified risk appetite indicators for the purpose of directing the business
and mitigating individual types of risks, in particular:
- profitability and risks for the purpose of directing the business: ratio of risk-weighted assets to
total assets, gross earnings before impairments and provisions, taxes (excluding the
performance of the loan funds) relative to average risk-weighted assets, interest margin;
- supervision of individual types of risks for risk mitigation: limits on the NPE ratio, limits on the
change in the economic value of equity in the standard yield curve shock, limits on overall net
position in foreign currencies and net positions in individual currencies in terms of ratio to
capital.
The risk appetite framework is approved annually by the management board and the supervisory
board, and is monitored regularly and reported at the extended session of SID Bank’s management
board, where the executive directors and directors of individual organisational units attend in addition
to the management board. Regular reporting of the achieved risk appetite indicator values is also
provided to the supervisory board’s risk committee.
The scope of risk take-up complements the set of internal policies for the management of individual
types of risk, via which SID Bank transfers limits regarding risk appetite into operational restrictions
for the appropriate direction of the business. Risk management policies and internal rules set out
the limits for the management of credit risk, market risk and liquidity risk, including the procedures
for dealing with transgressions of the limits and notification of the management board.
In order to manage the credit risk inherent in investments for managing the Bank’s liquidity, bylaws
set out limits on exposures to individual persons, and in case the persons comprise a group of
connected clients also a limit on the group and a limit on the individual persons. In managing these
investments, SID Bank pursues a policy of investing its surplus liquidity in high-quality liquid financial
instruments. In credit operations, limits are not predetermined or determined in general; rather,
creditworthiness is determined when an individual investment operation is reviewed with reference
to the company’s calculated borrowing capacity, which includes an assessment of long-term
sustainable annual cash flow, less the normalised volume of replacement investments, normalised
taxes, long-term expected dividends and gains, and the current and envisaged financial debt. Bylaws
are used for the entire portfolio to set out the method of identifying and measuring concentration
risk, on an individual basis, by economic sector, by country and by rating. The powers to approve
transactions are set out in the bylaws and the articles of association of SID Bank with regard to the
investment value and current exposure.
Quantitative limits are also set for the management of market risks. Limits on changes in net interest
income and changes in the economic value of the Bank’s equity (limits on weighted interest rate
gaps) are set for interest rate risk. The limits are significantly more stringent than those prescribed
by banking regulations. Position limits (stop loss) are set for the management of position risk. A limit
on net exposure in a particular foreign currency and on net exposure in all foreign currencies relative
to the Bank’s capital is set for currency risk.

Annual report of SID Bank and the SID Bank Group 2018 | 209
Quantitative limits are also set for the management of liquidity risk, and are more stringent than
those prescribed in regulations. The Bank also carries out regular planning and monitoring of cash
flows, and assessment of the effects of new transactions on the liquidity ratio and the liquidity
coverage ratio for the coming period. In addition, it also regularly verifies its liquidity position,
including the consideration of internally defined liquidity scenarios, and has drafted a plan of liquidity
risk management for contingencies. The management body annually reviews and approves the ILAAP
result, which covers an assessment of liquidity needs and an assessment of available liquidity within
the framework of ordinary operations, and in adverse situations. The Bank’s liquidity position is
verified regularly by decision-making bodies through the monitoring of various indicators, including
in relation to the achievement of planned ratios. The Bank regularly carries out an assessment of
the adequacy of the Bank’s funding, with a particular focus on the annual planning of business needs.
The financial plan for the next three financial years is approved annually by the management body.
3. The Bank manages other material risks, among which it highlights strategic risk, reputation risk and
profitability risk, and risks that are difficult to measure, such as certain subtypes of operational risk,
i.e. compliance risk, business continuity risk, the risk of money laundering and terrorist financing and
other unethical business practices, through qualitative risk management measures and internal
control mechanisms. SID Bank’s appetite to take up risks that are difficult to measure and reputation
risk is low, with a focus on minimising their impact on its performance. The management of these
risks is carried out, in particular, through set internal rules and controls over the implementation of
the Bank’s organisational, operational and work procedures and additional monitoring by
independent functions and internal control departments. Notwithstanding the above, other material
risks and risks that are difficult to measure are subject to qualitative measurement within the process
of formulating a risk profile and are quantified in accordance with the predetermined criteria. SID
Bank manages other material risks by defining an internal capital requirement. Where necessary, or
depending on the assessment of residual risk, the internal capital requirement and the appropriate
coverage by capital are also determined in the case of risks that are difficult to measure.
4. As a development bank in accordance with the Slovene Export and Development Bank Act (ZSIRB),
SID Bank is required to fully comply with the act governing banking, with exception of parts that are
explicitly excluded. This relates to special features during the assessment of large exposures, capital
requirements, the establishment of bank branches, with regard to the obligation to draw up a
recovery plan and the application of the provisions with regard to deposits covered by guarantee, as
SID Bank is not allowed to take deposits from the public. Additional restrictions on operations are
set out in the ZSIRB and the rules governing state aid that apply in the EU, which require SID Bank
to provide financial services only in segments where market gaps appear or are identified, and
prohibit it from competing with other commercial banks. Furthermore, the purpose of SID Bank’s
funding must comply with the purposes defined by the law. SID Bank is not allowed to finance firms
that are classed as firms in difficulty. The Bank and its management body take account of these and
other prescribed requirements in the adoption and implementation of its business objectives,
strategies and policies.
Ljubljana, 5 March 2019
Management board of SID Bank Supervisory board
Goran Katušin Sibil Svilan, M.Sc. Monika Pintar Mesarič
Member President Chair

210 | Annual report of SID Bank and the SID Bank Group 2018
5 Reporting by operating segment
Allocation and disclosure by operating segment
is carried out on the basis of the attributes of
individual business activities at the SID Bank
Group. The disclosure of information by
operating segment takes account of supervisory
approaches and the content of reports that
serve the Bank’s senior management in the
governance of the SID Bank Group.
Performance across operating segments is
monitored on the basis of accounting policies as
presented in section 2.3.25. Reports are
compiled in accordance with the IFRS. The
majority of the SID Bank Group’s operations are
in the domestic market, for which reason it does
not disclose additional itemisation by
geographical area.
The SID Bank Group’s business activities can be
divided into two operating segments:
– banking, and
– insurance of receivables.
Each operating segment is organised as a legal
entity in the form of an independent
undertaking. Within the SID Bank Group,
banking services are provided by the controlling
company SID Bank, and insurance of
receivables is pursued at SID-PKZ. The
individual operating segments include products
and services that differ from the other operating
segment in terms of risk and return.
Transactions between the two operating
segments are executed under normal
commercial terms.
Analysis by operating segment
2018 Banking Insurance of
receivables Total Intragroup
relations Relations to third parties
Interest income 31,122 0 31,122 0 31,122
Interest expenses (8,136) 0 (8,136) 0 (8,136)
Net interest 22,986 0 22,986 0 22,986
Dividend income 618 0 618 (582) 36
Fee and commission income 591 0 591 0 591
Fee and commission expenses (300) 0 (300) 0 (300)
Net fees and commission 291 0 291 0 291
Net gains on financial assets and liabilities not measured at fair value through profit or loss 3,218 0 3,218 0 3,218
Net (losses) on financial assets and liabilities held for trading (6) 0 (6) 0 (6)
Net gains on non-trading financial assets mandatorily at fair value through profit or loss 655 0 655 0 655
Changes in fair value in hedge accounting (129) 0 (129) 0 (129)
Net foreign exchange (losses) (8) 0 (8) 0 (8)
Net gains on derecognition of non-financial assets 3 0 3 0 3
Other net operating gains 3,362 0 3,362 (43) 3,319
NET INCOME 30,990 0 30,990 (625) 30,365
Other information by segment (13,471) 0 (13,471) 0 (13,471)
Administrative expenses (13,270) 0 (13,270) 0 (13,270)
Depreciation and amortisation (881) 0 (881) 0 (881)
Net (losses) on change in repayment terms (35) 0 (35) 0 (35)
Provisions (322) 0 (322) 0 (322)
Impairments 1,037 0 1,037 0 1,037
Profit from continuing operations 17,519 0 17,519 (625) 16,894
Corporate income tax on continuing operations (3,205) 0 (3,205) 0 (3,205)
Net profit from continuing operations 14,314 0 14,314 (625) 13,689
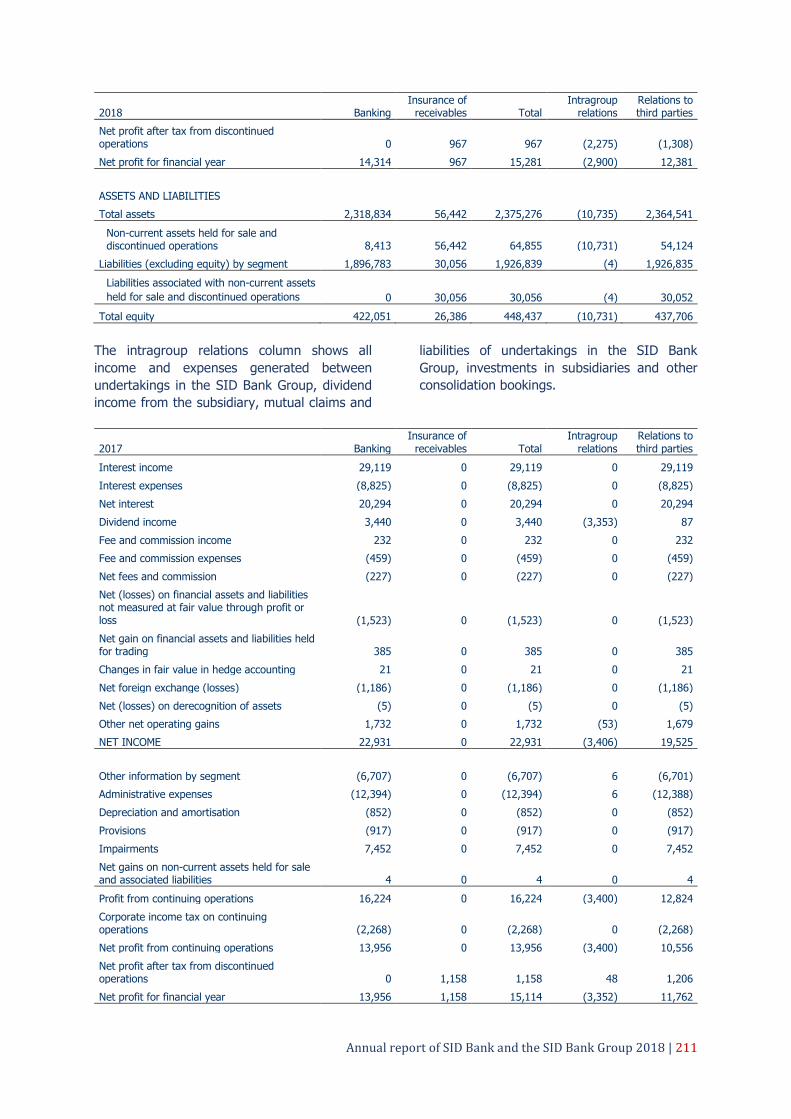
Annual report of SID Bank and the SID Bank Group 2018 | 211
2018 Banking Insurance of
receivables Total Intragroup
relations Relations to third parties
Net profit after tax from discontinued operations 0 967 967 (2,275) (1,308)
Net profit for financial year 14,314 967 15,281 (2,900) 12,381
ASSETS AND LIABILITIES
Total assets 2,318,834 56,442 2,375,276 (10,735) 2,364,541
Non-current assets held for sale and discontinued operations 8,413 56,442 64,855 (10,731) 54,124
Liabilities (excluding equity) by segment 1,896,783 30,056 1,926,839 (4) 1,926,835
Liabilities associated with non-current assets
held for sale and discontinued operations 0 30,056 30,056 (4) 30,052
Total equity 422,051 26,386 448,437 (10,731) 437,706
The intragroup relations column shows all
income and expenses generated between
undertakings in the SID Bank Group, dividend
income from the subsidiary, mutual claims and
liabilities of undertakings in the SID Bank
Group, investments in subsidiaries and other
consolidation bookings.
2017 Banking Insurance of
receivables Total Intragroup
relations Relations to third parties
Interest income 29,119 0 29,119 0 29,119
Interest expenses (8,825) 0 (8,825) 0 (8,825)
Net interest 20,294 0 20,294 0 20,294
Dividend income 3,440 0 3,440 (3,353) 87
Fee and commission income 232 0 232 0 232
Fee and commission expenses (459) 0 (459) 0 (459)
Net fees and commission (227) 0 (227) 0 (227)
Net (losses) on financial assets and liabilities not measured at fair value through profit or loss (1,523) 0 (1,523) 0 (1,523)
Net gain on financial assets and liabilities held for trading 385 0 385 0 385
Changes in fair value in hedge accounting 21 0 21 0 21
Net foreign exchange (losses) (1,186) 0 (1,186) 0 (1,186)
Net (losses) on derecognition of assets (5) 0 (5) 0 (5)
Other net operating gains 1,732 0 1,732 (53) 1,679
NET INCOME 22,931 0 22,931 (3,406) 19,525
Other information by segment (6,707) 0 (6,707) 6 (6,701)
Administrative expenses (12,394) 0 (12,394) 6 (12,388)
Depreciation and amortisation (852) 0 (852) 0 (852)
Provisions (917) 0 (917) 0 (917)
Impairments 7,452 0 7,452 0 7,452
Net gains on non-current assets held for sale and associated liabilities 4 0 4 0 4
Profit from continuing operations 16,224 0 16,224 (3,400) 12,824
Corporate income tax on continuing operations (2,268) 0 (2,268) 0 (2,268)
Net profit from continuing operations 13,956 0 13,956 (3,400) 10,556
Net profit after tax from discontinued operations 0 1,158 1,158 48 1,206
Net profit for financial year 13,956 1,158 15,114 (3,352) 11,762

212 | Annual report of SID Bank and the SID Bank Group 2018
2017 Banking Insurance of
receivables Total Intragroup
relations Relations to third parties
ASSETS AND LIABILITIES
Total assets 2,451,641 54,079 2,505,720 (8,418) 2,497,302
Investments in subsidiaries, associates and joint ventures 8,413 0 8,413 (8,413) 0
Liabilities (excluding equity) by segment 2,041,748 27,959 2,069,707 (5) 2,069,702
Total equity 409,893 26,120 436,013 (8,413) 427,600
Additions/(disposals) of property, plant and equipment and intangible assets (296) 270 (26) 0 (26)
The intragroup relations column shows all
income and expenses generated between
undertakings in the SID Bank Group, dividend
income from the subsidiary, mutual claims and
liabilities of undertakings in the SID Bank
Group, investments in subsidiaries and other
consolidation bookings.

Annual report of SID Bank and the SID Bank Group 2018 | 213
6 Disclosures on the basis of Part Eight of the CRR
The disclosures under Part Eight of the CRR that
are relevant to SID Bank and are not included
in the business or financial sections of the
annual report are presented in this section
below. The disclosures have been compiled with
regard to the Guidelines on disclosure
requirements under Part Eight of Regulation
(EU) No 575/2013 published by the EBA
(hereinafter: the EBA guidelines).
In light of the liquidation process and the
resulting reduction in the total assets of the
undertakings in the Prvi Faktor Group, as of
2017 SID Bank has no longer been required to
fulfil requirements on a consolidated basis in
accordance with Article 19(1)(a) of the CRR, as
the proportionate part of the total assets of the
Prvi Faktor Group pertaining to SID Bank no
longer exceeds EUR 10 million. In accordance
with the CRR, insurance undertakings (that is
SID-PKZ within the SID Bank Group) are exempt
from prudential consolidation, meaning that the
disclosures for SID Bank are prepared on an
individual basis in accordance with Article 6 of
the CRR.
In accordance with the EBA guidelines, the data
for the comparative period relates to the most
recently published data in line with the
frequency of disclosure as required by the EBA
guidelines. Individual tables show only the rows
and columns of relevance to SID Bank.
6.1 LCR disclosure to complement the disclosure of liquidity risk
management under Article 435 of CRR Regulation
(Article 435(1)(f) of the CRR Regulation) Quantitative information of LCR
On an individual basis On an individual basis
Currency and units In EUR 000 In EUR 000
Quarter ending on 31 Mar 2018 30 Jun 2018
Number of data points used in the calculation of averages 12 12
Total unweighted
value (average)
Total unweighted
value (average)
Total unweighted
value (average)
Total unweighted
value (average)
High-quality liquid assets
1 Total high-quality liquid assets (HQLA) 420,875 359,680
Cash - outflows
2 Retail deposits and deposits from small business customers, of which: 0 0 0 0
3 Stable deposits 0 0 0 0
4 Less stable deposits 0 0 0 0
5 Unsecured wholesale funding 26,496 26,496 20,063 18,412
6 Operational deposits (all counterparties) and deposits in networks of cooperative banks 0 0 0 0
7 Non-operational deposits (all counterparties) 26,090 26,090 19,657 18,006
8 Unsecured debt 406 406 406 406
9 Secured wholesale funding 0 0
10 Additional requirements 53,947 20,170 68,812 20,735
11 Outflows related to derivative exposures and other collateral requirements 229 229 229 229

214 | Annual report of SID Bank and the SID Bank Group 2018
Total unweighted
value (average)
Total unweighted
value (average)
Total unweighted
value (average)
Total unweighted
value (average)
12 Outflows related to loss of funding on debt products 0 0 0 0
13 Credit and liquidity facilities 53,717 19,940 68,583 20,506
14 Other contractual funding obligations 1,819 1,819 487 487
15 Other contingent funding obligations 15,363 1,647 10,947 1,095
16 Total Cash - outflows 50,131 40,729
Cash - inflows
17 Secured lending (e.g. reverse repos) 0 0 0 0
18 Inflows from fully performing exposures 39,854 34,621 29,792 24,808
19 Other cash inflows 11,389 11,389 3,360 3,360
20 Total cash inflows 51,242 46,009 33,152 28,168
EU-20a Fully exempt inflows 0 0 0 0
EU-20b Inflows subject to 90% cap 0 0 0 0
EU-20c Inflows subject to 75% cap 51,242 46,009 33,152 28,168
Total adjusted
value
Total adjusted
value
21 Liquidity buffer 420,875 359,680
22 Total net cash outflows 19,238 18,430
23 Liquidity coverage ratio (%) 3086% 2960%
On an individual basis On an individual basis
Currency and units In EUR 000 In EUR 000
Quarter ending on 30 Sep 2018 31 Dec 2018
Number of data points used in the calculation of averages 12 12
Total unweighted
value (average)
Total unweighted
value (average)
Total unweighted
value (average)
Total unweighted
value (average)
High-quality liquid assets
1 Total high-quality liquid assets (HQLA) 301,612 252,612
Cash - outflows
2 Retail deposits and deposits from small business customers, of which: 0 0 0 0
3 Stable deposits 0 0 0 0
4 Less stable deposits 0 0 0 0
5 Unsecured wholesale funding 53,463 50,722 75,411 70,289
6 Operational deposits (all counterparties) and deposits in networks of cooperative banks 0 0 0 0
7 Non-operational deposits (all counterparties) 28,905 26,164 50,853 45,730
8 Unsecured debt 24,559 24,559 24,559 24,559
9 Secured wholesale funding 0 0
10 Additional requirements 98,696 22,370 133,915 29,360
11 Outflows related to derivative exposures and other collateral requirements 257 257 36 36
12 Outflows related to loss of funding on debt products 0 0 0 0
13 Credit and liquidity facilities 98,439 22,113 133,879 29,324
14 Other contractual funding obligations 389 389 289 289
15 Other contingent funding obligations 8,722 2,392 6,790 3,701
16 Total Cash - outflows 75,873 103,640
Cash - inflows
17 Secured lending (e.g. reverse repos) 0 0 0 0
18 Inflows from fully performing exposures 40,103 36,473 44,056 41,116
19 Other cash inflows 4,148 4,148 10,029 10,029

Annual report of SID Bank and the SID Bank Group 2018 | 215
On an individual basis On an individual basis
Currency and units In EUR 000 In EUR 000
Quarter ending on 30 Sep 2018 31 Dec 2018
Number of data points used in the calculation of averages 12 12
Total unweighted
value (average)
Total unweighted
value (average)
Total unweighted
value (average)
Total unweighted
value (average)
20 Total cash inflows 44,251 40,621 54,085 51,145
EU-20a Fully exempt inflows 0 0
EU-20b Inflows subject to 90% cap 0 0 0 0
EU-20c Inflows subject to 75% cap 44,251 40,621 54,085 51,145
Total adjusted
value
Total adjusted
value
21 Liquidity buffer 301,612 252,612
22 Total net cash outflows 41,121 58,364
23 Liquidity coverage ratio (%) 1767% 1404%
Qualitative information of LCR
Concentration of funding and liquidity The specific role of the Bank and the fact that SID Bank does not take deposits from the public have a significant impact on the structure of funding. SID Bank obtains long-term funding supported by a Slovenian government guarantee primarily on international financial markets and at related financial institutions. Disclosure regarding structure of financial liabilities and liquid assets: - Business Report, Performance in 2018 section, Funding
and liquidity subsection - Financial Report, section 2.4 - Financial Report, 3.2 Liquidity risk
Derivative exposures and potential collateral calls Exposure to derivatives is presented in the Financial Report, section 2.4.13.
Currency mismatch in LCR The liquidity buffer solely comprises items denominated in euros. The liquidity inflows and outflows are also mostly denominated in euros. The proportion denominated in US dollars is small. The proportion of other currencies in liquidity inflows (balances in bank accounts in foreign currencies) is negligible.
Description of degree of centralisation of liquidity management and mutual relations and communication mechanisms between units in group
The Bank calculates the LCR on an individual basis.
Other items in the LCR calculation that are not captured in the LCR disclosure template but that the institution considers relevant to its liquidity profile
-

216 | Annual report of SID Bank and the SID Bank Group 2018
6.2 The number of directorships held by members of the management
body
(Article 435(2)(a) of the CRR Regulation) Membership in bodies of other persons as at 31 Dec 2018
Name of other party Function
Management board
Sibil Svilan CMSR CMSR council chair
Bank Association of Slovenia member of supervisory board
European Association of Public Banks (EAPB) member of board of directors
Goran Katušin SID-PKZ chair of supervisory board
Supervisory board
Monika Pintar Mesarič Succession Fund of the Republic of Slovenia (public fund) member of supervisory board
Interdepartmental Commission for the ZUKSB member
Working group for the preparation of the restructuring plan for the Abanka Vipa and Banka Celje consolidation process
member
Umbrella Pension Fund for Public-Sector Employees member
Zlatko Vili Hohnjec Finančni inženiring Zlatko Vili Hohnjec, s.p. sole proprietor
Terme Olimia d.d. member of supervisory board
TPC LIVADE d.o.o. S.r.l. director
Petin d.o.o. (in bankruptcy) official receiver
Bigrad d.o.o. (in bankruptcy) official receiver
Gradis Celje d.d. (in bankruptcy) official receiver
Finsvet d.o.o. (in bankruptcy) official receiver
Avto plus d.o.o. (in bankruptcy) official receiver
CPL d.o.o. (in bankruptcy) official receiver
ELTI d.o.o. (in bankruptcy) official receiver
Društvo Mladi Romi, so.p. (in bankruptcy) official receiver
Verada d.o.o. (in bankruptcy) official receiver
Papir Servis d.o.o. (in bankruptcy) official receiver
PGM Pižem d.o.o. (in bankruptcy) official receiver
Polzela d.o.o. (in bankruptcy) official receiver
S2-Invest (in bankruptcy) official receiver
G Gradnje d.o.o. (in bankruptcy) official receiver
SGP Gorica d.o.o. (in bankruptcy) official receiver
Istraturist member
Marko Tišma Ecofin, ekonomsko finančno svetovanje, Marko Tišma, s.p. sole trader
Terme Olimia d.d. member of supervisory board
BAMC non-executive director

Annual report of SID Bank and the SID Bank Group 2018 | 217
6.3 The main features of the capital instruments issued by the Bank
(Article 437 (b)(c) of the CRR Regulation)
1 Issuer SID - Slovenska izvozna in razvojna banka, d.d.,
Ljubljana
2 Unique identifier SIDR, ISIN SI0021102932
3 Governing law(s) of the instrument Slovene
Regulatory treatment
4 Transitional CRR rules Common Equity Tier 1
5 Post-transitional CRR rules Common Equity Tier 1
6 Eligible at solo/(sub-)consolidated/solo & (sub-)consolidated Solo
7 Instrument type Ordinary shares
8 Amount recognised in regulatory capital EUR 300 million
9 Nominal amount of instrument No nominal amount - per value shares
9a Issue price No nominal amount - per value shares
9b Redemption price N/A
10 Accounting classification Shareholders’ equity
11 Original date of issuance 20 June 1997
12 Perpeptual or dated Perpetual
13 Original maturity date No maturity
14 Issuer call subjet to prior supervisory approval No
15 Optional call date, contingent call dates, and redemption amount N/A
16 Subsequent call dates, if applicable N/A
Coupons / dividends N/A
N/A – not aplicable
SID Bank has no instruments of additional
Tier 1 capital or Tier 2 capital. In accordance
with Article 4 of the ZSIRB, SID Bank’s
distributable profit may not be used for
distribution to shareholders, but is instead
allocated to other profit reserves.
6.4 Disclosure of own funds, regulatory adjustments and prudential filters
(Commission Implementing Regulation (EU) No 1423/2013) (Article 437 (1)(d)(e) of the CRR Regulation)
31 Dec 2018 31 Dec 2018 30 Jun 2018 30 Jun 2018
Common Equity Tier 1 capital: instruments
and reserves
(A)
Amount at
disclosure
date
C)
Amounts
subject to
pre-CRR
treatment or
CRR
prescribed
residual
amount
(A)
Amount at
disclosure
date
(C)
Amounts
subject to
pre-CRR
treatment or
CRR
prescribed
residual
amount
1 Capital instruments and the related share
premium accounts
299,815
299,815
of which: Paid up capital instruments 300,000 300,000
of which: Share premium 1,139 1,139
of which: Own CET1 instruments (1,324) (1,324)
2 Retained earnings (excluding net profit for
the year) 9,557 9,557
3 Accumulated other comprehensive income
(and any other reserves) 98,365 106,401
6 Common Equity Tier 1 (CET1) capital
before regulatory adjustments 407,737 415,773

218 | Annual report of SID Bank and the SID Bank Group 2018
31 Dec 2018 31 Dec 2018 30 Jun 2018 30 Jun 2018
Common Equity Tier 1 capital: instruments
and reserves
(A)
Amount at
disclosure
date
C)
Amounts
subject to
pre-CRR
treatment or
CRR
prescribed
residual
amount
(A)
Amount at
disclosure
date
(C)
Amounts
subject to
pre-CRR
treatment or
CRR
prescribed
residual
amount
7 Common Equity Tier 1 (CET1) capital:
regulatory adjustments (681) (701)
8 Additional value adjustments (negative
amount) (999) (1,117)
28 Total regulatory adjustments to
Common Equity Tier 1 (CET1) (1,680) (1,818)
29 Common Equity Tier 1 (CET1) capital 406,057 413,955
45 Tier 1 capital (T1 = CET1 + AT1) 406,057 413,955
59 Total capital (TC = T1 + T2) 406,057 413,955
60 Total risk-weighted assets 1,187,983 1,103,488
61 Tier 1 (as a percentage of total risk
exposure amount) 34.18% 37.51%
62 Total capital (as a percentage of total risk
exposure amount) 34.18% 37.51%
63 Institution specific buffer requirement
(CET1 requirement in accordance with
article 92 (1) (a) plus capital conservation
and countercyclical buffer requirements
plus a systemic risk buffer, plus
systemically important institution buffer
expressed as a percentage of total risk
exposure amount) 34.18% 37.51%
64 of which: capital conservation buffer
requirement 1.886% 0.250% 1.886% 0.250%
65 of which: countercyclical buffer requirement 1.875% 0% 1.875% 0%
66 of which: systemic risk buffer requirement 0.011% 0% 0.011% 0%
67 of which: Global Systemically Important
Institution (G-SII) or Other Systemically
Important Institution (O-SII) buffer 0% 0.250% 0% 0.250%
67a Common Equity Tier 1 available to meet
buffers (as a percentage of risk exposure
amount) 0% 0.250% 0%
0.250%
72 Direct and indirect holdings of the capital of
financial sector entities where the
institution does not have a significant
investment in those entities (amount below
10% threshold and net of eligible short
positions 6,875 6,489 73 Direct and indirect holdings of the CET1
instruments of financial sector entities
where the institution has a significant
investment in those entities (amount below
10% threshold and net of eligible short
positions 8,413 8,413
The above table discloses the items of the
Bank’s own funds under the template from
Commission Implementing Regulation (EU) No
1423/2013, which sets out the disclosure of own
funds requirements for institutions in
accordance with the CRR. The table shows the
rows of the template containing amounts that
are relevant to SID Bank. Column (C) indicates
the remaining amounts determined in
accordance with the CRR.
SID Bank has no instruments of additional Tier
1 capital or Tier 2 capital. any additional Tier 1
capital or Tier 2 capital.

Annual report of SID Bank and the SID Bank Group 2018 | 219
The Bank does not take into account the net
profit for the financial year, which for 2018
amounted to EUR 14,314 thousand, in the
calculation of capital for capital adequacy
purposes until SID Bank’s general meeting
adopts the resolution on the distribution of
profit.
6.5 The geographical distribution of its credit exposures relevant for the
calculation of its countercyclical capital buffer – breakdown by country
(Article 440(1)(a) of the CRR Regulation)
The table below indicates those credit
exposures to individual sovereigns
(governments) that are relevant to the
calculation of countercyclical capital buffers, i.e.
exposures to individual exposure classes set out
in Article 112 of the CRR, excluding the
exposure classes referred to in points (a) to (f)
of the aforementioned article.
The Bank uses a standardised approach for the
calculation of exposure values. The Bank has no
exposures included in the trading book, and no
exposures to securitisation positions.
General credit exposures Own funds requirements
(110) Own funds
requirements weights
(120) Countercyclical
capital buffer rate
31 Dec 2018
(010) Exposure value
under the Standardised
Approach
(070) of which:
General credit exposures
(100) Total
Country code
SI US HR NL IE CK GB NO AT RS UA ME BA DE BE IT
777,798 27,652 13,197 10,153 7,259 6,875 3,930 3,285 2,544 1,312
451 290 41 9 8 1
63,331 2,212 1,056
812 581 550 314 263 203 105 54 35 3 1 1 0
63,331 2,212 1,056
812 581 550 314 263 203 105 54 35 3 1 1 0
0.91 0.03 0.02 0.01 0.01 0.01 0.00 0.00 0.00 0.00 0.00 0.00 0.00 0.00 0.00 0.00
0.00% 0.00% 0.00% 0.00% 0.00% 0.00% 1.00% 2.00% 0.00% 0.00% 0.00% 0.00% 0.00% 0.00% 0.00% 0.00%
Total 854,805 69,521 69,521 1.00
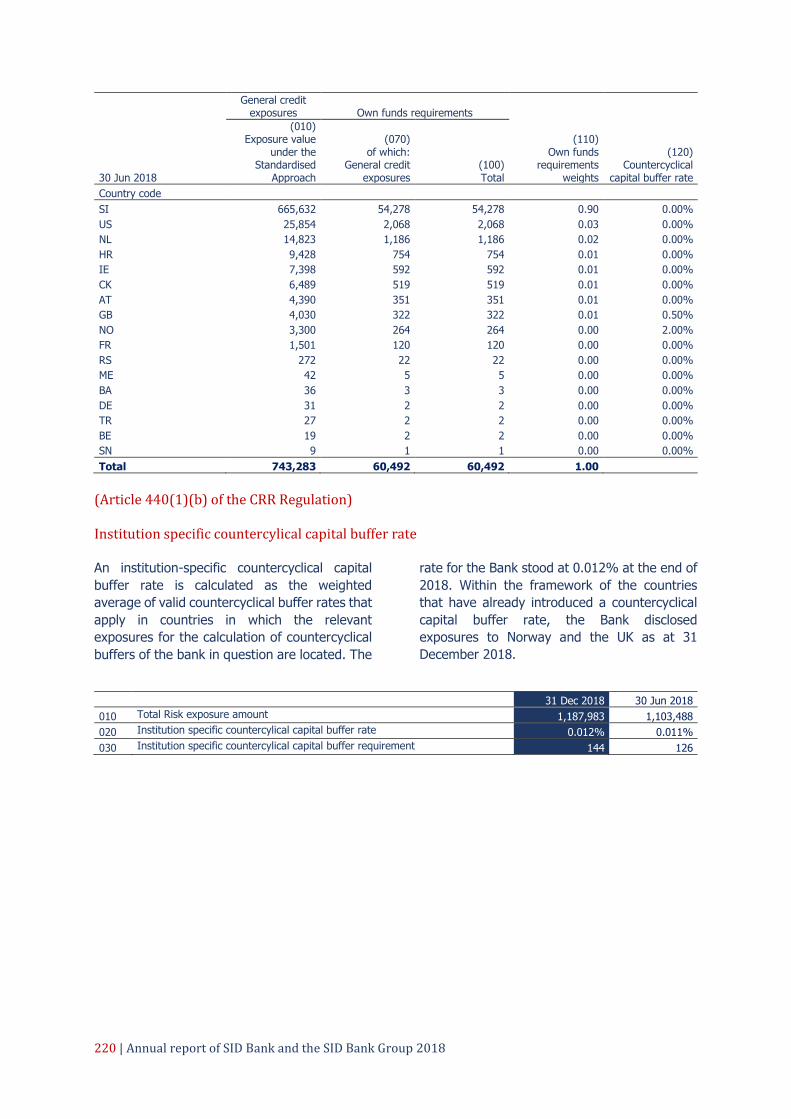
220 | Annual report of SID Bank and the SID Bank Group 2018
General credit exposures Own funds requirements
(110) Own funds
requirements weights
(120) Countercyclical
capital buffer rate
30 Jun 2018
(010) Exposure value
under the Standardised
Approach
(070) of which:
General credit exposures
(100) Total
Country code
SI 665,632 54,278 54,278 0.90 0.00%
US 25,854 2,068 2,068 0.03 0.00%
NL 14,823 1,186 1,186 0.02 0.00%
HR 9,428 754 754 0.01 0.00%
IE 7,398 592 592 0.01 0.00%
CK 6,489 519 519 0.01 0.00%
AT 4,390 351 351 0.01 0.00%
GB 4,030 322 322 0.01 0.50%
NO 3,300 264 264 0.00 2.00%
FR 1,501 120 120 0.00 0.00%
RS 272 22 22 0.00 0.00%
ME 42 5 5 0.00 0.00%
BA 36 3 3 0.00 0.00%
DE 31 2 2 0.00 0.00%
TR 27 2 2 0.00 0.00%
BE 19 2 2 0.00 0.00%
SN 9 1 1 0.00 0.00%
Total 743,283 60,492 60,492 1.00
(Article 440(1)(b) of the CRR Regulation) Institution specific countercylical capital buffer rate An institution-specific countercyclical capital
buffer rate is calculated as the weighted
average of valid countercyclical buffer rates that
apply in countries in which the relevant
exposures for the calculation of countercyclical
buffers of the bank in question are located. The
rate for the Bank stood at 0.012% at the end of
2018. Within the framework of the countries
that have already introduced a countercyclical
capital buffer rate, the Bank disclosed
exposures to Norway and the UK as at 31
December 2018.
31 Dec 2018 30 Jun 2018
010 Total Risk exposure amount 1,187,983 1,103,488
020 Institution specific countercylical capital buffer rate 0.012% 0.011%
030 Institution specific countercylical capital buffer requirement 144 126

Annual report of SID Bank and the SID Bank Group 2018 | 221
6.6 Template 1 – EU LI1: Differences between accounting and regulatory
scopes of consolidation and the mapping of financial statement
categories with regulatory risk categories
(Article 436(b) of the CRR Regulation)
a c d f g
Carrying values of items
31 Dec 2018
Carrying values as
reported in published financial
statements
Subject to the credit
risk framework
Subjekt to the CCR
framework
Subject to the market
risk framework
Not subject to capital
requirements or subject
to deduction from capital
Cash, cash balances at central bank and demand deposits at banks 121,184 121,184 Non-trading financial assets mandatorily at fair value through profit or loss 15,667 15,667 16 Financial assets measured at fair value through other comprehensive income 662,688 662,688 663 Loans and receivables 1,502,323 1,502,323 Property, plant and equipment 4,922 4,922 Intangible assets 999 0 999 Other assets 2,638 2,638 Non-current assets held for sale and discontinued operations 8,413 8,413 TOTAL ASSETS 2,318,834 2,317,835 0 0 1,677
Financial liabilities measured at amortised cost 1,889,321 Derivatives – Hedge accounting 2,898 2,898 3 Provisions 1,130 Other liabities 3,434 TOTAL LIABILITIES 1,896,783 0 2,898 0 3
a c d f g
31 Dec 2017
Carrying
values as
reported in
published
financial
statements
Carrying values of items
Subject to the
credit risk
framework
Subjekt to
the CCR
framework
Subject to the market risk framework
Not subject to
capital
requirements
or subject to
deduction
from capital
Cash, cash balances at central bank and
demand deposits at banks 71,071 71,071 Available-for-sale financial assets 730,521 730,521 731
Loans and receivables 1,631,472 1,631,472 Property, plant and equipment 4,992 4,992 Intangible assets 804 804
Investments in subsidiaries, associates and
joint ventures 8,413 8,413 Other assets 4,368 4,368 TTotal ssetsL ASSETS OTAL ASSETS 2,451,641 2,450,837 0 0 1,535
Financial liabilities measured at amortised
cost
2,038,146
Derivatives – Hedge accounting 93 93 0
Provisions 2,946 Other liabilities 563 2,041,748 0 93 0 0

222 | Annual report of SID Bank and the SID Bank Group 2018
6.7 Template 2 – EU LI2: Main sources of differences between regulatory
exposure amounts and carrying values in financial statements
(Article 436(b) of the CRR Regulation)
31 Dec 2018
a b c
Total
Items subject to
Credit risk framework
CCR framework
1 Assets carrying value amount under the scope of regulatory consolidation (as per template EU LI1)
2,318,834
2,317,835
-
2 Liabilities carrying value amount under the regulatory scope of consolidation (as per template EU LI1)
1,896,783
-
2,898
3 Total net amount under the regulatory scope of consolidation 2,320,733 2,317,835 2,898 4 Off-balance-sheet amounts 360,760 275,760 85,000
10 Exposure amounts considered for regulatory purposes 2,681,493 2,593,595 87,898
In light of the liquidation process and the
resulting reduction in the total assets of the
undertakings in the Prvi Faktor Group, as of
2017 SID Bank is no longer bound to comply
with regulatory requirements on a consolidated
basis in accordance with Article 19(1)(a) of the
CRR, but on an individual basis. The data in the
table above therefore refer to individual
financial statements of SID Bank
.
6.8 Template 3 – EU LI3: Outline of the differences in the scopes of
consolidation
(Article 436(b) of the CRR Regulation) Outline of the differences in the scopes of consolidation
Method of
accounting consolidation
Method of regulatory consolidation
Description of the entity Name of the entity
Full consolidation
Proportional consolidation
Neither consolidated
nor deducted Deducted
SID Prva kreditna
zavarovalnica d.d.
Full
consolidation X Financial and
insurance activities
Prvi faktor, Ljubljana
- v likvidaciji Equity method X Financial and
insurance activities

Annual report of SID Bank and the SID Bank Group 2018 | 223
6.9 Template 4 – EU OV1: Overview of RWAs
(Article 438 (c) - (f) of th CRR Regulation)
RWAs Minimal capital requirements
31.12.2018 30.09.2018 31.12.2018 30.09.2018
1 Credit risk (excluding CCR) 1,119,749 1,098,207 89,580 87,857
Article 438(c)(d) 2 Of which the standardised
approach 1,119,749 1,098,207 89,580 87,857 Article 438(c) (d), Article 107
6 CCR 13,127 13,505 1,050 1,080
Article 438(c)(d) 12 Of which CVA 13,127 13,505 1,050 1,080
Article 438(f) 23 Operational risk 55,106 55,106 4,409 4,409
24 Of which basic indicator approach 55,106 55,106 4,409 4,409 Article 437(2), Article 48, Article 60
27 Amounts below the thresholds for deduction (subject to 250% risk weight) 26,708 29,839 2,137 2,387
29 Total 1,214,690 1,196,657 97,176 95,733
6.10 Template 6 – EU INS1: Non-deducted participation in insurance
undertakings
(Article 438(c) of the CRR Regulation)
31 Dec 2018 30 Jun 2018
Values Values
Holdings of own funds instruments of a financial sector entity where the institution has a
significant investment not deducted from own funds (before risk-weighting) 8,413 8,413
Total risk-weighted assets 21,032 21,032
The carrying amount in the above table of EUR
8,413 thousand and the risk-weighted exposure
amount relate to the investment in the
subsidiary SID-PKZ.
6.11 Template 7 – EU CRB-B: Total and average net amount of exposures
(Article 442(c) of the CRR Regulation)
a b a b
Net value of
exposures at 31 December 2018
Average net exposure
amount over 2018
Net value of exposures at 31 December 2017
Average net exposure
amount over 2017
16 Central governments or central banks 613,070 577,835 541,743 610,338
17 Regional governments or local authorities 55,174 47,124 41,079 37,328
18 Public sector entities 32,286 33,172 34,386 27,150
19 Multilateral development banks 13,000 13,010 13,050 12,210
21 Institutions 995,042 1,110,900 1,193,831 1,164,403
22 Corporates 832,954 730,208 631,601 589,639
23 Of which: SMEs 248,873 223,014 193,573 114,614
28 Exposures in default 32,468 35,837 38,265 72,017
33 Equity exposures 20,230 24,866 24,647 23,380
34 Other exposures 5,601 5,575 5,336 5,486
35 Total standardised approach 2,599,825 2,578,525 2,523,938 2,541,951
36 Total 2,599,825 2,578,525 2,523,938 2,541,951

224 | Annual report of SID Bank and the SID Bank Group 2018
6.12 Template 8 – EU CRB-C: Geographical breakdown of exposures
(Article 442(d) of the CRR Regulation)
a b c d n
31 Dec 2018 Net value
Slovenia
Other EU members
Other non EU Europe
countries Other
countries Total
7 Central governments or central banks 445,806 165,770 - 1,494 613,070 8 Regional governments or local
authorities 51,860 2,232 1,083 - 55,174 9 Public sector entities 32,286 - - - 32,286 10 Multilateral Development Banks - 13,000 - - 13,000 12 Institutions 766,812 172,489 47,146 8,595 995,042 13 Corporates 768,589 31,618 5,129 27,618 832,954 16 Exposures in default 26,796 5,422 250 - 32,468 21 Equity exposures 13,355 6,875 - - 20,230 22 Other exposures 5,506 61 - 34 5,601 23 Total standardised approach 2,111,009 397,467 53,608 37,741 2,599,825 24 Total 2,111,009 397,467 53,608 37,741 2,599,825
a b c d n
31 Dec 2017 Net value
Slovenia
Other EU members
Other non EU Europe
countries Other
countries Total
7 Central governments or central banks 301,343 236,145 - 4,255 541,743 8 Regional governments or local
authorities 39,939 - 1,140 - 41,079 9 Public sector entities 34,386 - - - 34,386 10 Multilateral Development Banks - 13,050 - - 13,050 12 Institutions 803,496 367,243 14,262 8,829 1,193,830 13 Corporates 549,810 38,210 7,844 35,737 631,601 16 Exposures in default 31,314 6,757 194 - 38,265 21 Equity exposures 18,302 6,346 - - 24,648 22 Other exposures 5,264 58 - 14 5,336
23 Total standardised approach 1,783,854 667,809 23,440 48,835 2,523,938 24 Total 1,783,854 667,809 23,440 48,835 2,523,938

Annual report of SID Bank and the SID Bank Group 2018 | 225
6.13 Template 9 – EU CRB-D: Concentration of exposures by industry or
counterparty types
(Article 442(e) of the CRR Regulation)
Net values
31 Dec 2018
Financial
and insurance
activities
Public administration
and defence, compulsory
social security
Manu-
facturing
Transport-
ation and
storage
Trade;
maintenance and repair of
motor vehicles Others Total
7 Central governments or central banks 120,871 492,199 - - - - 613,070
8 Regional governments or local authorities - 55,174 - - - - 55,174
9 Public sector entities 23,287 8,999 - - - - 32,286 10 Multilateral Development
Banks 13,000 - - - - - 13,000 12 Institutions 995,042 - - - - - 995,042 13 Corporates 27,668 - 275,284 150,153 115,546 264,304 832,954 16 Exposures in default 1,381 - 8,058 6,514 14,107 2,408 32,468 21 Equity exposures 15,287 - - 4,942 - - 20,230 22 Other exposures 5,398 - - - 12 190 5,601 23 Total standardised
approach
1,201,935 556,372 283,342 161,609 129,665 266,902 2,599,825 24 Total 1,201,935 556,372 283,342 161,609 129,665 266,902 2,599,825
Net values
31 Dec 2017
Financial
and insurance activities
Public administration
and defence, compulsory
social security Manu-
facturing
Electricity,
gas, steam and air
conditioning
Transport-
ation and
storage Others Total
7 Central governments or central banks 70,778 470,965 - - - - 541,743
8 Regional governments or local authorities - 41,079 - - - - 41,079
9 Public sector entities 23,736 9,348 - - - 1,302 34,386 10 Multilateral Development
Banks 13,050 - - - - - 13,050 12 Institutions 1,193,831 - - - - - 1,193,831 13 Corporates 40,237 - 195,332 133,258 82,035 180,738 631,600 16 Exposures in default 1,517 - 7,525 - 9,834 19,390 38,266 21 Equity exposures 14,758 - - - 9,889 - 24,647 22 Other exposures 5,165 4 - - - 167 5,336
23 Total standardised approach 1,363,072 521,396 202,857 133,258 101,758 201,597 2,523,938
24 Total 1,363,072 521,396 202,857 133,258 101,758 201,597 2,523,938
Within the framework of exposure to other
economic sectors, the largest exposures as at
31 December 2018 were disclosed against the
sector of electricity, gas, steam and air
conditioning supply in the amount of EUR
121,538 thousand, and the sector of
professional, scientific and technical activities in
the amount of EUR 52,460 thousand.

226 | Annual report of SID Bank and the SID Bank Group 2018
6.14 Template 10 – EU CRB-E: Maturity of exposures
(Article 442(f) of the CRR Regulation)
The table below shows net on-balance-sheet
and off-balance-sheet exposures, broken down
by individual exposure class in terms of residual
maturity, excluding credit protection effects.
The final maturity date of a transaction is taken
into account in the case of instalment
repayment upon maturity of individual
transactions.
a b c d e f
31 Dec 2018
Net exposure value
On demand ≤ 1 year
> 1 year ≤ 5 years > 5 years
No stated maturity Total
7 Central governments or central banks 120,871 54,689 224,563 210,677 2,271 613,070
8 Regional governments or local authorities
- 47 3,360 51,767 - 55,174
9 Public sector entities - - 14,074 18,211 - 32,286
10 Multilateral Development Banks - - - 1,000 12,000 13,000
12 Institutions 313 85,815 190,263 718,651 - 995,042
13 Corporates 8 44,898 252,278 535,771 - 832,954
16 Exposures in default 2,967 6,722 16,679 6,099 - 32,468
21 Equity exposures - - - - 20,230 20,230
22 Other exposures 0 358 - - 5,243 5,601
23 Total standardised approach 124,158 192,530 701,217 1,542,177 39,743 2,599,825
24 Total 124,158 192,530 701,217 1,542,177 39,743 2,599,825
a b c d e f
31 Dec 2017
Net exposure value
On demand ≤ 1 year
> 1 year ≤ 5 years > 5 years
No stated maturity Total
7 Central governments or central banks 70,955 85,140 289,985 95,663 - 541,743
8 Regional governments or local authorities
- - 1,574 39,505 - 41,079
9 Public sector entities - 1,302 14,073 19,011 - 34,386 10 Multilateral Development Banks - - - 1,050 12,000 13,050 12 Institutions 1 364,243 218,172 611,415 - 1,193,831 13 Corporates 1 34,681 253,843 343,076 - 631,601 16 Exposures in default 2,744 113 29,338 6,070 - 38,265 21 Equity exposures - - - - 24,647 24,647 22 Other exposures - 127 - - 5,210 5,337
23 Total standardised approach 73,701 485,606 806,985 1,115,790 41,857 2,523,939 24 Total 73,701 485,606 806,985 1,115,790 41,857 2,523,939

Annual report of SID Bank and the SID Bank Group 2018 | 227
6.15 Template 11– EU CR1-A: Credit quality of exposures by exposure class
and instrument
(Article 442(g) and (h) of the CRR Regulation)
a b c e f g
31 Dec 2018
Gross carrying values of
Specific
credit risk
adjustment
Accumu-
lated
write-offs
in 2018
Credit risk
adjustments
charges
in 2018
Net
value
(a+b-c)
Defaulted
exposures
Non-defaulted
exposures
16 Central governments or
central banks 0 613,085 15 0 (1) 613,070
17 Regional governments
or local authorities 0 55,216 42 0 2 55,174
18 Public sector entities 0 32,291 5 0 (2) 32,286
19 Multilateral
development banks 0 13,000 0 0 0 13,000
21 Institutions 0 995,769 726 0 (23) 995,042
22 Corporates 0 848,601 15,647 887 2,816 832,954
23 of which SME 0 259,716 -10,843 759 (4,324) 270,558
28 Exposures in default 53,818 0 21,351 0 (1,939) 32,468
33 Equity exposures 20,558 15,287 15,616 0 0 20,230
34 Other exposures 0 5,601 0 0 0 5,601
35 Total standardized approach 74,377 2,578,850 53,401 887 853 2,599,825
36 Total 74,377 2,578,850 53,401 887 853 2,599,825
37 Of which: Loans 53,818 1,499,429 37,110 0 248 1,516,137
38 Of which: Debt
securities 0 651,126 255 0 789 650,871
39 Of which: Off-balance-
sheet exposures 0 275,760 420 0 (184) 275,340
a b c e f g
30 Jun 2018
Gross carrying values of
Specific
credit risk
adjustments
Accumu-
lated
write-
offs
Credit risk
adjustments
charges of
the period
Net
value
(a+b-c)
Defaulted
exposures
Non-defaulted
exposures
16 Central governments or
central banks 0 591,923 15 0 0 591,909
17 Regional governments
or local authorities 0 47,166 42 0 2 47,124
18 Public sector entities 0 32,734 5 0 (1) 32,729
19 Multilateral
development banks 0 13,000 0 0 0 13,000
21 Institutions 0 1,199,323 644 0 54 1,198,679
22 Corporates 0 720,267 -1,882 804 4,246 722,149
23 of which SME 0 220,523 7,099 750 (1,411) 213,424
28 Exposures in default 55,382 0 19,433 0 0 35,949
33 Equity exposures 27,280 14,301 15,616 0 0 26,565
34 Other exposures 0 5,334 0 0 1 5,334
35 Total standardized approach 82,662 2,624,649 33,873 804 4,303 2,673,438
36 Total 82,662 2,624,649 33,873 804 4,303 2,673,438
37 Of which: Loans 55,382 1,635,938 16,935 804 4,344 1,674,385
38 Of which: Debt
securities 0 664,175 947 0 97 663,228
39 Of which: Off-balance-
sheet exposures 0 179,004 374 0 (138) 178,630
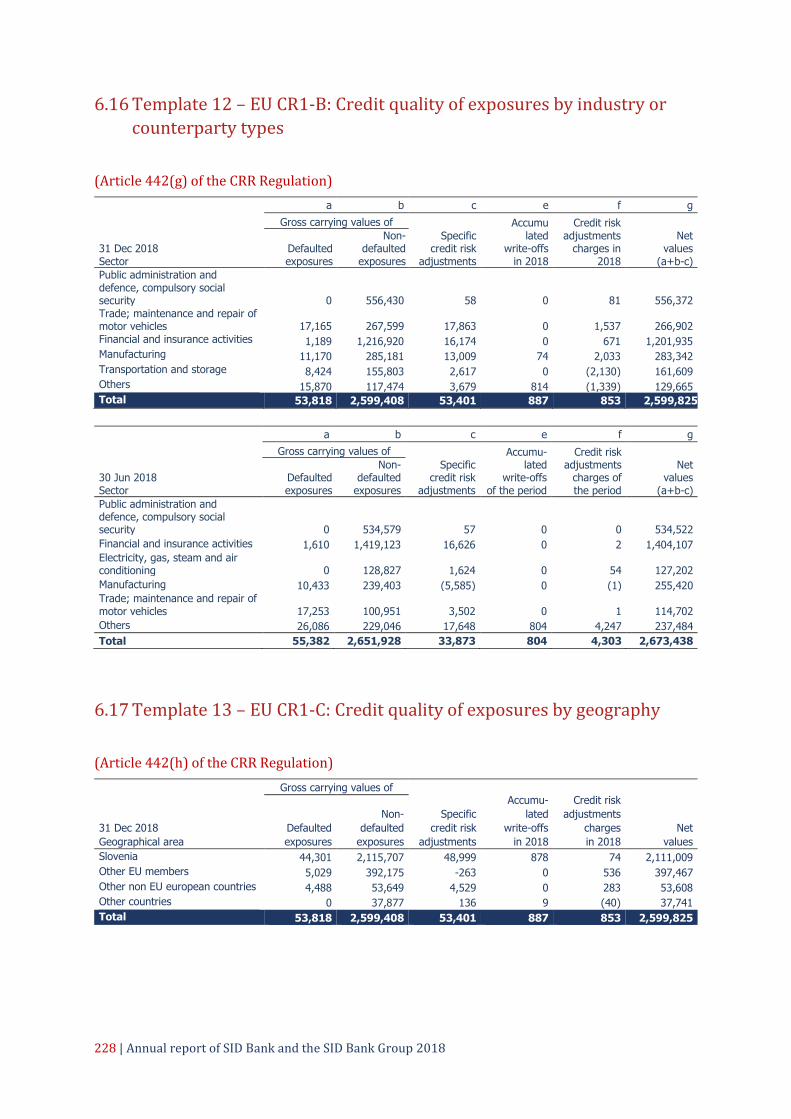
228 | Annual report of SID Bank and the SID Bank Group 2018
6.16 Template 12 – EU CR1-B: Credit quality of exposures by industry or
counterparty types
(Article 442(g) of the CRR Regulation)
a b c e f g
Gross carrying values of
Specific credit risk
adjustments
Accumu lated
write-offs in 2018
Credit risk adjustments
charges in 2018
31 Dec 2018 Sector
Defaulted exposures
Non-defaulted
exposures
Net values
(a+b-c)
Public administration and defence, compulsory social security 0 556,430 58 0 81 556,372 Trade; maintenance and repair of motor vehicles 17,165 267,599 17,863 0
1,537 266,902
Financial and insurance activities 1,189 1,216,920 16,174 0 671 1,201,935 Manufacturing 11,170 285,181 13,009 74 2,033 283,342 Transportation and storage 8,424 155,803 2,617 0 (2,130) 161,609 Others 15,870 117,474 3,679 814 (1,339) 129,665 Total 53,818 2,599,408 53,401 887 853 2,599,825
a b c e f g Gross carrying values of
Specific credit risk
adjustments
Accumu- lated
write-offs of the period
Credit risk adjustments
charges of the period
30 Jun 2018 Sector
Defaulted exposures
Non- defaulted
exposures
Net values
(a+b-c)
Public administration and defence, compulsory social security 0 534,579 57 0 0 534,522
Financial and insurance activities 1,610 1,419,123 16,626 0 2 1,404,107 Electricity, gas, steam and air conditioning 0 128,827 1,624 0 54 127,202
Manufacturing 10,433 239,403 (5,585) 0 (1) 255,420 Trade; maintenance and repair of motor vehicles 17,253 100,951 3,502 0 1 114,702
Others 26,086 229,046 17,648 804 4,247 237,484
Total 55,382 2,651,928 33,873 804 4,303 2,673,438
6.17 Template 13 – EU CR1-C: Credit quality of exposures by geography
(Article 442(h) of the CRR Regulation)
31 Dec 2018
Geographical area
Gross carrying values of
Specific
credit risk
adjustments
Accumu-
lated
write-offs
in 2018
Credit risk
adjustments
charges
in 2018
Net
values
Defaulted
exposures
Non-
defaulted
exposures
Slovenia 44,301 2,115,707 48,999 878 74 2,111,009
Other EU members 5,029 392,175 -263 0 536 397,467
Other non EU european countries 4,488 53,649 4,529 0 283 53,608
Other countries 0 37,877 136 9 (40) 37,741
Total 53,818 2,599,408 53,401 887 853 2,599,825

Annual report of SID Bank and the SID Bank Group 2018 | 229
30 Jun 2018
Geographical area
Gross carrying values of
Specific
credit risk
adjustments
Accumu-
lated
write-offs
of the period
Credit risk
adjustments
charges
of the period
Net
values
Defaulted
exposures
Non-
defaulted
exposures
Slovenia 44,800 2,017,453 28,877 804 4,111 2,033,376
Other EU members 5,955 549,137 182 0 90 554,911
Other non EU european countries 4,627 35,984 4,647 0 166 35,964
Other countries 0 49,355 168 0 (64) 49,187
Total 55,382 2,651,928 33,873 804 4,303 2,673,438
The table indicates on-balance sheet and off-
balance sheet gross and net exposures.
Provisions for off-balance-sheet liabilities are
disclosed within the scope of specific credit risk
adjustments.
6.18 Template 14 – EU CR1-D: Ageing of past-due exposures
(Article 442(g) and (h) of the CRR Regulation)
Gross carrying values
31 Dec 2018 ≤ 30 days
> 30 days
≤ 60 days
> 60 days
≤ 90 days
> 90 days
≤ 180 days
> 180 days
≤ 1 leto > 1 leto
1 Loans 1,674 3 336 9 1,109 18,140
2 Debt securities - - - - - -
3 Total exposures 1,674 3 336 9 1,109 18,140
Gross carrying values
30 Jun 2018 ≤ 30 days
> 30 days
≤ 60 days
> 60 days
≤ 90 days
> 90 days
≤ 180 days
> 180 days
≤ 1 leto > 1 leto
1 Loans 133 4 0 994 3,107 15,297
2 Debt securities 0 0 0 0 0 0
3 Total exposures 133 4 0 994 3,107 15,297
6.19 Template 15 – EU CR1-E: Non-performing and forborne exposures
(Article 442(g) and (i) of the CRR Regulation)
a b c d e f g h i j k l m
31.12.2018
Of which
defaulted
Of which
impaired
Of which
forborne
Of which
forborne
Of which
forborne
010 Debt securities 651,126 0 0 0 0 0 0 (255) 0 0 0 0 0
020 Loans and advances 1,719,417 341 3,887 96,951 96,951 38,151 85,254 (15,759) 203 (64,483) (12,397) 27,910 25,202
030 Off-balance-sheet exposures 275,760 0 0 0 0 0 0 420 0 0 0 0 0
Collaterals and financial
guarantees received
Of which
performing
but past due
> 30 days and
<= 90 days
Of which
performing
forborne
Of which non-performing On performing exposures On non-performing exposures
On non-
performing
exposures
Of which
forborne
exposures
Gross carrying values of performing and non-performing exposuresAccumulated impairment and provisions and negative fair
value adjustments due to credit risk
a b c d e f g h i j k l m
30.06.2018
Of which
defaulted
Of which
impaired
Of which
forborne
Of which
forborne
Of which
forborne
010 Debt securities 664,175 0 0 0 0 0 0 (947) 0 0 0 0
020 Loans and advances 1,848,428 133 19,403 98,233 98,233 38,186 87,581 2,498 14,831 62,284 (10,830) 31,097 33,182
030 Off-balance-sheet exposures 179,004 0 0 0 0 0 0 374 0 0 0 0 0
Accumulated impairment and provisions and negative fair
value adjustments due to credit risk
Collaterals and financial
guarantees received
Of which
performing
but past due
> 30 days and
<= 90 days
Of which
performing
forborne
Of which non-performing On performing exposures On non-performing exposures
On non-
performing
exposures
Of which
forborne
exposures
Gross carrying values of performing and non-performing exposures
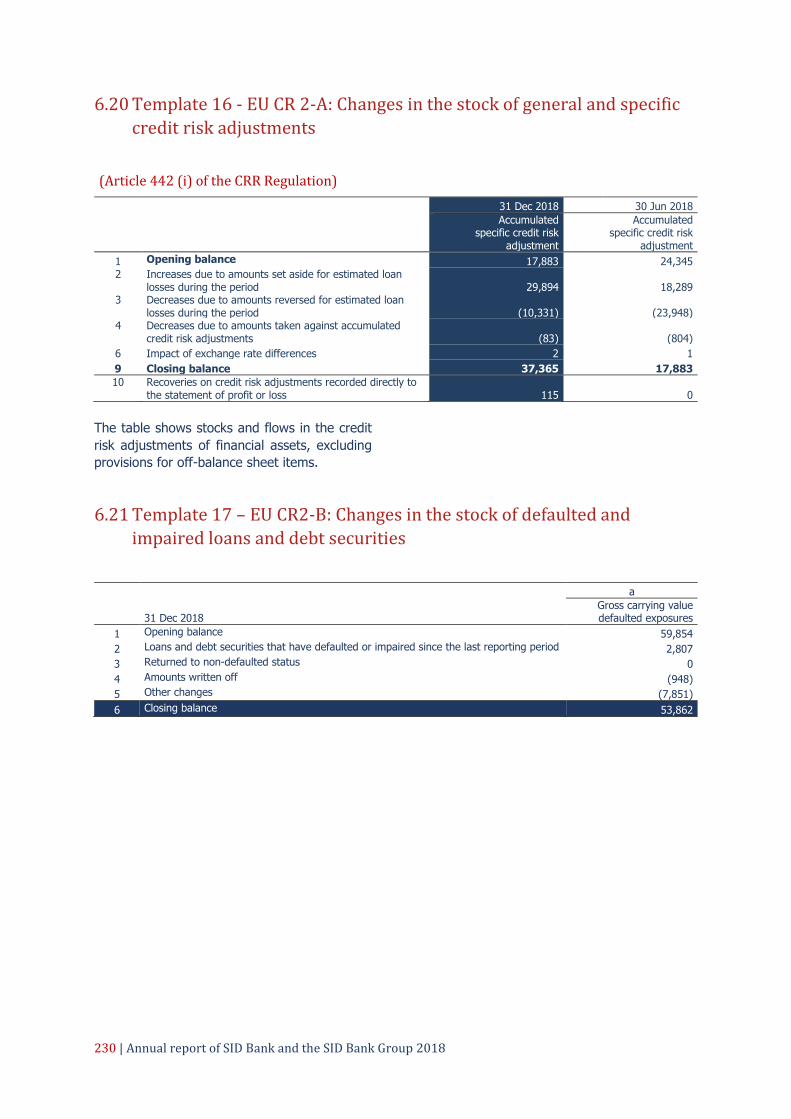
230 | Annual report of SID Bank and the SID Bank Group 2018
6.20 Template 16 - EU CR 2-A: Changes in the stock of general and specific
credit risk adjustments
(Article 442 (i) of the CRR Regulation)
31 Dec 2018 30 Jun 2018
Accumulated specific credit risk
adjustment
Accumulated specific credit risk
adjustment
1 Opening balance 17,883 24,345 2 Increases due to amounts set aside for estimated loan
losses during the period 29,894 18,289 3 Decreases due to amounts reversed for estimated loan
losses during the period (10,331) (23,948) 4 Decreases due to amounts taken against accumulated
credit risk adjustments (83) (804)
6 Impact of exchange rate differences 2 1
9 Closing balance 37,365 17,883
10 Recoveries on credit risk adjustments recorded directly to the statement of profit or loss 115 0
The table shows stocks and flows in the credit
risk adjustments of financial assets, excluding
provisions for off-balance sheet items.
6.21 Template 17 – EU CR2-B: Changes in the stock of defaulted and
impaired loans and debt securities
a
31 Dec 2018 Gross carrying value defaulted exposures
1 Opening balance 59,854
2 Loans and debt securities that have defaulted or impaired since the last reporting period 2,807
3 Returned to non-defaulted status 0
4 Amounts written off (948)
5 Other changes (7,851)
6 Closing balance 53,862

Annual report of SID Bank and the SID Bank Group 2018 | 231
6.22 Template 18 – EU CR3: CRM techniques – Overview
(Article 453(g) of the CRR Regulation) Total exposures secured by financial guarantees
31 Dec 2018 30 Jun 2018
Exposures
unsecured –
Carrying amount
Exposures to
be secured
Exposures
secured by
financial
guarantees
Exposures
unsecured –
Carrying amount
Exposures to
be secured
Exposures
secured by
financial
guarantees
Total loans 1,516,137 0 0 1,611,743 62,642 62,642 Total debt securities 650,871 0 0 715,478 8,020 8,020
Total exposures 2,167,008 0 0 2,327,221 70,662 70,662
Of which defaulted 32,468 0 0 35,724 225 225
The table above shows the carrying amount of
secured and unsecured loans and debt
securities. Only exposures that the Bank has
taken into account for credit risk mitigation
when calculating capital requirements are
disclosed as secured. The management of credit
protection is described in detail in section 3.1 of
the financial report.
6.23 Template 19 – EU CR4: Standardized approach – credit risk exposure
and credit risk mitigation effects
(Article 453(f)(g) of the CRR Regulation)
The table shows on-balance sheet and off-
balance sheet exposures by individual class, i.e.
net exposures before the application of
conversion factors and before the reduction in
exposures resulting from the effects of using
eligible collateral, exposures after the use
thereof, the amount of risk-weighted assetsand
the breakdown by individual exposure class.
a b c d e f
Exposures before CCF and CRM
Exposures post CCF and CRM
RWA
RWA density 31.12.2018
On- Balance
Sheet amount
Off-Balance
Sheet amount
On- Balance
Sheet amount
Off- Balance
Sheet amount
1 Central governments or central
banks 565,040 48,030 565,040 24,015 15,150 1.3% 2 Regional governments or local
authorities 47,036 8,138 47,036 4,069 10,980 1.0%
3 Public sector entities 32,286 0 32,286 0 6,457 0.6%
4 Multilateral development banks 1,000 12,000 1,000 12,000 2,400 0.2%
6 Institutions 920,693 74,350 920,693 40,500 215,751 19.3%
7 Corporates 693,482 139,473 693,482 103,025 796,877 71.2%
10 Exposures in default 32,468 0 32,468 0 33,685 3.0%
15 Equity exposures 20,230 0 20,230 0 32,848 2.9%
16 Other exposures 5,601 0 5,601 0 5,601 0.5% 17 Total 2,317,835 281,990 2,317,835 183,608 1,119,749 100.0%

232 | Annual report of SID Bank and the SID Bank Group 2018
a b c d e f
Exposures before
CCF and CRM Exposures post CCF and CRM
RWA RWA
density 30 Jun 2018
On- Balance
Sheet amount
Off-Balance
Sheet amount
On- Balance
Sheet amount
Off- Balance
Sheet amount
1 Central governments or central
banks 526,040 65,869 555,642 32,935 15,514 1.5% 2 Regional governments or local
authorities 40,858 6,266 40,746 3,133 9,427 0.9%
3 Public sector entities 32,729 0 32,729 0 6,546 0.6%
4 Multilateral development banks 1,000 12,000 1,000 12,000 2,400 0.2%
6 Institutions 1,155,195 43,484 1,144,328 24,946 243,089 23.6%
7 Corporates 663,738 58,411 646,578 29,082 675,681 65.4%
10 Exposures in default 35,949 0 35,724 0 35,953 3.5%
15 Equity exposures 26,565 0 26,565 0 39,184 3.8%
16 Other exposures 5,334 0 5,334 0 5,334 0.5%
17 Total 2,487,408 186,030 2,488,646 102,096 1,033,128 100.0%
6.24 Template 20 – EU CR5: Standardized approach – exposures by asset
classes and risk weights
(Article 444(e) of the CRR Regulation)
31 Dec 2018 Risk weight
Total
Of which
unrated
Deducted Exposure clasess 0% 20% 50% 100% 150% 250%
1 Central governments or
central banks 564,056 8,794 12,441 1,494 0 2,271 589,055 589,055
(423)
2 Regional governments
or local authorities 0 50,522 0 0 584 0 51,105 51,105 (2)
3 Public sector entities 0 32,286 0 0 0 0 32,286 32,286 (14)
4 Multilateral development
banks 1,000 12,000 0 0 0 0 13,000 13,000 0
6 Institutions 0 931,802 0 29,390 0 0 961,192 961,192 (111)
7 Corporates 0 0 0 795,765 741 0 796,506 796,506 (101)
10 Exposures in default 0 0 0 30,033 2,435 0 32,468 32,468 (16)
15 Equity exposures 0 0 0 11,817 0 8,413 20,230 20,230 (12)
16 Other exposures 0 0 0 5,601 0 0 5,601 5,601 (999)
17 Total 565,056 1,035,403 12,441 874,101 3,759 10,683 2,501,443 2,501,443 (1,677)
30 Jun 2018 Risk weight
Total
Of which
unrated
Deducted Exposure clasess 0% 20% 50% 100% 150% 250%
1 Central governments or
central banks 572,042 0 12,806 141 0 3,588 588,577 588,577 (405)
2 Regional governments
or local authorities 0 43,378 0 0 501 0 43,879 43,879 (2)
3 Public sector entities 0 32,729 0 0 0 0 32,729 32,729 (14)
4 Multilateral development
banks 1,000 12,000 0 0 0 0 13,000 13,000 0
6 Institutions 0 1,157,731 0 11,543 0 0 1,169,274 1,169,274 (129)
7 Corporates 0 0 0 675,618 42 0 675,660 675,660 (113)
10 Exposures in default 0 0 0 35,265 459 0 35,724 35,724 (17)
15 Equity exposures 0 0 0 18,152 0 8,413 26,565 26,565 (18)
16 Other exposures 0 0 0 5,334 0 0 5,334 5,334 (1,117)
17 Total 573,042 1,245,838 12,806 746,054 1,001 12,001 2,590,742 2,590,742 (1,816)

Annual report of SID Bank and the SID Bank Group 2018 | 233
6.25 Template 25 – EU CCR1: Analysis of CCR exposure by approach
(Article 439(e)(f)(i) of the CRR Regulation)
31 Dec 2018 Notional EAD post CRM RWAs
2 Original exposure 85,000 6,650 1,330
11 Total 85,000 6,650 1,330
30 Jun 2018 Notional EAD post CRM RWAs
2 Original exposure 85,000 7,400 1,480
11 Total 85,000 7,400 1,480
6.26 Template 26 – EU CCR2: CVA capital charge
(Article 439(f) of the CRR Regulation)
31 Dec 2018 30 Jun 2018
Exposure value RWAs Exposure value RWAs
4 All portfolios subject to the standardised method – RWA 6,650 13,127 7,400 15,254
5 Total subject to the CVA capital charge 6,650 13,127 7,400 15,254
6.27 Template 32: EU CCR5–B: Composition of collateral for exposures to
counterparty credit risk
a b c d
Collateral used in derivative transactions
Fair value of collateral received Fair value of posted collateral
31 Dec 2018 Segregated Unsegregated Segregated Unsegregated
Deposits 0 0 0 2.840 Total 0 0 0 2.840
6.28 Encumbered and unencumbered assets
(Article 443 of the CRR Regulation)
(Commission Implementing Regulation (EU) No 2016/200) The table below shows the medians of
consecutive quarterly mean values of the Bank’s
encumbered and unencumbered assets over a
12-month period using interpolation. The Bank
has assets (eligible securities and loans)
pledged at the central bank as collateral for the
loan received from the drawdown of targeted
longer-term refinancing operations (TLTROs)
from the Bank of Slovenia and the ECB.

234 | Annual report of SID Bank and the SID Bank Group 2018
Encumbered assets Unencumbered assets
2018
Carrying
amount
Fair
value
Carrying
amount
Fair
value
Loans on demand 0 0 103,166 103,166
Equity instruments 0 0 16,893 16,893
Debt securities 129,252 129,252 544,659 544,659
Loans and advances other than loans on demand 42,974 43,051 1,557,330 1,561,031
Other assets 0 0 19,999 19,999
Total assets 172,227 172,303 2,242,047 2,245,748
Encumbered assets Unencumbered assets
2017
Carrying
amount
Fair
value
Carrying
amount
Fair
value
Loans on demand 0 0 76,652 76,652
Equity instruments 0 0 15,506 15,506
Debt securities 124,707 124,707 647,389 647,389
Loans and advances other than loans on demand 48,222 48,274 1,547,929 1,550,795
Other assets 0 0 19,242 19,242
Total assets 172,929 172,981 2,306,718 2,309,584
6.29 Exposures to equities outside the trading book
(Article 447 of the CRR Regulation)
31 Dec 2018 31 Dec 2017
Carrying amount 11,817 16,234
Realised gains 0 1
Equities in the amount of EUR 4,942 thousand
were acquired from the conversion of
receivables, while the amount of EUR 6,875
thousand relates to investments in EIF shares.
All these securities are classed as available-for-
sale financial assets, are not quoted on a stock
exchange, and are disclosed at fair value.
6.30 Leverage ratio
(Article 451 of the CRR Regulation) Summary of reconciliation of accounting assets and leverage ratio exposure measure
31 Dec 2018 30 Jun 2018
Transitional
definition
Fully phased in definition
Transitional definition
Fully phased in definition
1 Total assets as per published financial statements 2,594,594 2,594,594 2,667,529 2,667,529 4 Adjustments for derivative financial instruments (6,650) (6,650) (7,400) (7,400) 6 Adjustment for off-balance sheet items (ie
conversion to credit equivalent amounts of off-balance sheet exposures) ---(98,802) ---(98,802) (84,308) (84,308)
7 Other adjustments 9,297 9,297 11,779 11,779
8 Total leverage ratio exposure 2,498,439 2,498,439 2,587,600 2,587,600

Annual report of SID Bank and the SID Bank Group 2018 | 235
Leverage ratio: common disclosure
31 Dec 2018 30 Jun 2018
Transitional definition
Fully phased in definition
Transitional definition
Fully phased in definition
On-balance sheet exposures (excluding derivatives and SFTs
1 On-balance sheet items (excluding derivatives, SFTs and fiduciary assets, but including collateral) 2,317,835 2,317,835 2,488,646 2,488,646
2 Asset amounts deducted in determining Tier 1 capital (3,004) (3,004) (3,142) (3,142)
3 Total on-balance sheet exposures (excluding derivatives, SFTs and fiduciary assets) (sum of lines 1 and 2) 2,314,831 2,314,831 2,485,504 2,485,504
Derivative exposures EU05a Exposure determined under Original Exposure
Method 6,650 6,650 7,400 7,400 11 Total derivative exposures (sum of lines 4 to 10) 6,650 6,650 7,400 7,400
Other off-balance sheet exposures 17 Off-balance sheet exposures at gross notional
amount 275,760 275,760 179,004 179,004 18 (Adjustments for conversion to credit equivalent
amounts) (98,802) (98,802) (84,308) (84,308) 19 Other off-balance sheet exposures (sum of lines 17
to 18) 176,958 176,958 94,696 (94,696)
Capital and total exposures
20 Tier 1 capital 406,057 406,057 413,955 413,955 21 Total leverage ratio exposures (sum of lines 3, 11,
16, 19, EU-19a and EU-19b) 2,498,439 2,498,439 2,587,600 2,587,600
Leverage ratio
22 Leverage ratio 16.25% 16.25% 16.00% 16.00%
Breakdown of on-balance-sheet exposures
31 Dec 2018 30 Jun 2018
Transitional
definition
Fully phased in definition
Transitional definition
Fully phased in definition
EU-1 Total on-balance sheet exposures (excluding derivatives, SFTs, and exempted exposures), of which: 2,317,835 2,317,835 2,488,646 2,488,646
EU-3 Banking book exposures, of which: 2,317,835 2,317,835 2,488,646 2,488,646 EU-5 Exposures treated as sovereigns 566,040 566,040 556,642 556,642 EU-6 Exposures to regional governments, MDB,
international organisations and PSE not treated as sovereign 79,322 79,322 73,475 73,475
EU-7 Institutions 920,693 920,693 1,144,328 1,144,328 EU-10 Corporates 693,482 693,482 646,578 646,578 EU-11 Exposures in default 32,468 32,468 35,724 35,724 EU-12 Other exposures (eg equity, securitisations, and
other non-credit obligation assets) 25,831 25,831 31,899 31,899
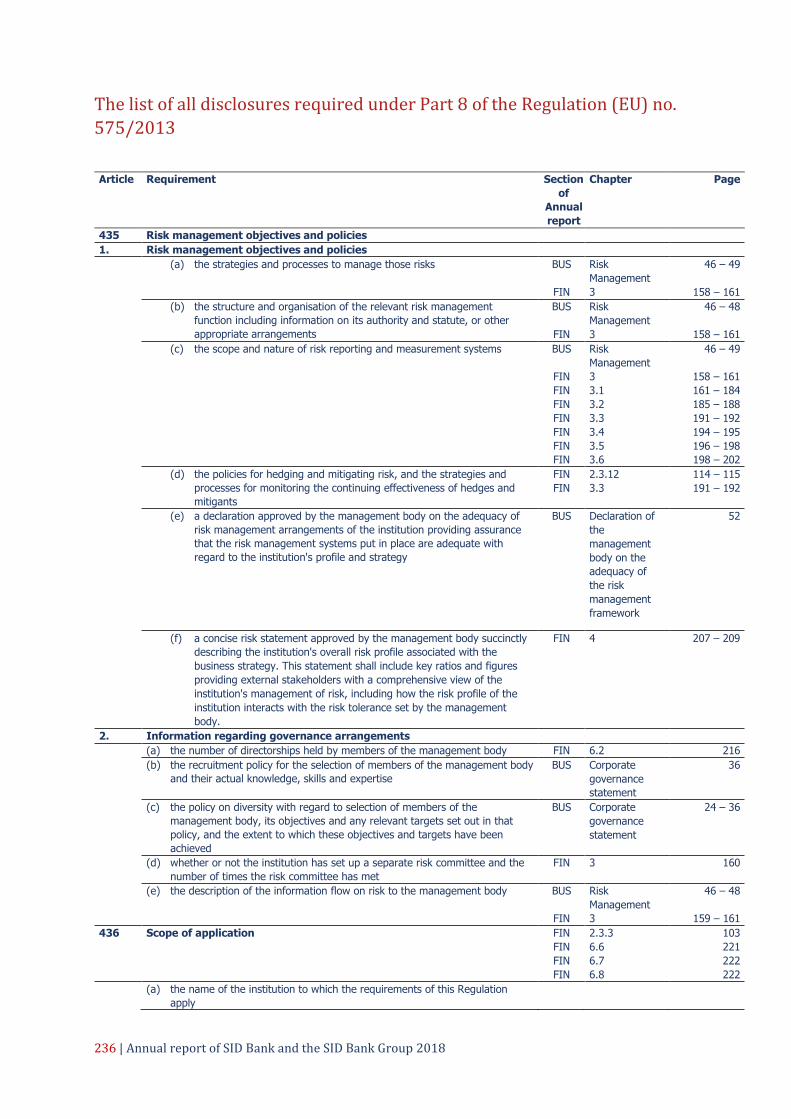
236 | Annual report of SID Bank and the SID Bank Group 2018
The list of all disclosures required under Part 8 of the Regulation (EU) no.
575/2013
Article Requirement Section
of
Annual
report
Chapter Page
435 Risk management objectives and policies
1. Risk management objectives and policies (a) the strategies and processes to manage those risks BUS
Risk
Management
46 – 49
FIN 3 158 – 161 (b) the structure and organisation of the relevant risk management
function including information on its authority and statute, or other
appropriate arrangements
BUS
Risk
Management
46 – 48
FIN 3 158 – 161 (c) the scope and nature of risk reporting and measurement systems BUS
Risk
Management
46 – 49
FIN
FIN
FIN
FIN
FIN
FIN
FIN
3
3.1
3.2
3.3
3.4
3.5
3.6
158 – 161
161 – 184
185 – 188
191 – 192
194 – 195
196 – 198
198 – 202 (d) the policies for hedging and mitigating risk, and the strategies and
processes for monitoring the continuing effectiveness of hedges and
mitigants
FIN 2.3.12 114 – 115
FIN 3.3 191 – 192
(e) a declaration approved by the management body on the adequacy of
risk management arrangements of the institution providing assurance
that the risk management systems put in place are adequate with
regard to the institution's profile and strategy
BUS Declaration of
the
management
body on the
adequacy of
the risk
management
framework
52
(f) a concise risk statement approved by the management body succinctly
describing the institution's overall risk profile associated with the
business strategy. This statement shall include key ratios and figures
providing external stakeholders with a comprehensive view of the
institution's management of risk, including how the risk profile of the
institution interacts with the risk tolerance set by the management
body.
FIN 4 207 – 209
2. Information regarding governance arrangements (a) the number of directorships held by members of the management body FIN 6.2 216 (b) the recruitment policy for the selection of members of the management body
and their actual knowledge, skills and expertise
BUS Corporate
governance
statement
36
(c) the policy on diversity with regard to selection of members of the
management body, its objectives and any relevant targets set out in that
policy, and the extent to which these objectives and targets have been
achieved
BUS Corporate
governance
statement
24 – 36
(d) whether or not the institution has set up a separate risk committee and the
number of times the risk committee has met
FIN 3 160
(e) the description of the information flow on risk to the management body BUS
Risk
Management
46 – 48
FIN 3 159 – 161
436 Scope of application FIN
FIN
FIN
FIN
2.3.3
6.6
6.7
6.8
103
221
222
222 (a) the name of the institution to which the requirements of this Regulation
apply

Annual report of SID Bank and the SID Bank Group 2018 | 237
Article Requirement Section
of
Annual
report
Chapter Page
(b) an outline of the differences in the basis of consolidation for accounting and
prudential purposes, with a brief description of the entities therein,
explaining whether they are fully consolidated, proportionally consolidated,
deducted from own funds, neither consolidated nor deducted;
(c) any current or foreseen material practical or legal impediment to the prompt
transfer of own funds or repayment of liabilities among the parent
undertaking and its subsidiaries;
(d) the aggregate amount by which the actual own funds are less than required
in all subsidiaries not included in the consolidation, and the name or names
of such subsidiaries;
(e) if applicable, the circumstance of making use of the provisions laid down in
Articles 7 and 9
437 Own funds (a) a full reconciliation of Common Equity Tier 1 items, Additional Tier 1 items,
Tier 2 items and filters and deductions applied pursuant to Articles 32 to 35,
36, 56, 66 and 79 to own funds of the institution and the balance sheet in
the audited financial statements of the institution;
FIN
FIN
3.6
6.4
200 – 201
217 – 219
(b) a description of the main features of the Common Equity Tier 1 and
Additional Tier 1 instruments and Tier 2 instruments issued by the
institution;
FIN 6.3 217
(c) the full terms and conditions of all Common Equity Tier 1, Additional Tier 1
and Tier 2 instruments;
FIN 6.3 217
(d) separate disclosure of the nature and amounts of the following: FIN 6.4 217 – 219
(i) each prudential filter applied pursuant to Articles 32 to 35 (ii) each deduction made pursuant to Articles 36, 56 and66 (iii) items not deducted in accordance with Articles 47, 48, 56, 66 and
79
(e) a description of all restrictions applied to the calculation of own funds in
accordance with this Regulation and the instruments, prudential filters and
deductions to which those restrictions apply;
FIN 6.3 217
(f) where institutions disclose capital ratios calculated using elements of own
funds determined on a basis other than that laid down in this Regulation, a
comprehensive explanation of the basis on which those capital ratios are
calculated.
N/A
438 Capital requirements (a) a summary of the institution's approach to assessing the adequacy of its
internal capital to support current and future activities
BUS
Risk
Management
49
FIN 3.6 201 (b) upon demand from the relevant competent authority, the result of the
institution's internal capital adequacy assessment process including the
composition of the additional own funds requirements based on the
supervisory review process as referred to in point (a) of Article 104(1) of
Directive 2013/36/EU
N/A
(c) for institutions calculating the risk-weighted exposure amounts in accordance
with Chapter 2 of Part Three, Title II, 8 % of the risk-weighted exposure
amounts for each of the exposure classes specified in Article 112
FIN
FIN
FIN
3.6
6.9
6.11
200 – 201
223
223 (d) for institutions calculating risk-weighted exposure amounts in accordance
with Chapter 3 of Part Three, Title II, 8 % of the risk-weighted exposure
amounts for each of the exposure classes specified in Article 147. For the
retail exposure class, this requirement applies to each of the categories of
exposures to which the different correlations in Article 154 (1) to (4)
correspond
N/A
(e) own funds requirements calculated in accordance with points (b) and (c) of
Article 92(3)
FIN
FIN
3.6
6.9
200 – 201
223 (f) own funds requirements calculated in accordance with PartThree, Title III,
Chapters 2, 3 and 4 and disclosed separately.
FIN 6.9 223
439 Exposure to counterparty credit risk (a) a discussion of the methodology used to assign internal capital and credit
limits for counterparty credit exposures
FIN
FIN
3.1
3.6
184
199 (b) a discussion of policies for securing collateral and establishing credit reserves FIN 3.1 184 (c) a discussion of policies with respect to Wrong-Way risk exposures FIN 3.1 184

238 | Annual report of SID Bank and the SID Bank Group 2018
Article Requirement Section
of
Annual
report
Chapter Page
(d) a discussion of the impact of the amount of collateral the institution would
have to provide given a downgrade in its credit rating
FIN 3.1 184
(e) gross positive fair value of contracts, netting benefits, netted current credit
exposure, collateral held and net derivatives credit exposure. Net derivatives
credit exposure is the credit exposure on derivatives transactions after
considering both the benefits from legally enforceable netting agreements
and collateral arrangements
FIN
FIN
6.25
6.27
233
233
(f) measures for exposure value under the methods set out in Part Three, Title
II, Chapter 6, Sections 3 to 6 whichever method is applicable;
FIN
FIN
6.25
6.26
233
233 (g) the notional value of credit derivative hedges, and the distribution of current
credit exposure by types of credit exposure
N/A
(h) the notional amounts of credit derivative transactions, segregated between
use for the institution's own credit portfolio, as well as in its intermediation
activities, including the distribution of the credit derivatives products used,
broken down further by protection bought and sold within each product
group
N/A
440 Capital buffers FIN 3.6 200 (a) the geographical distribution of its credit exposures relevant for the
calculation of its countercyclical capital buffer
FIN 6.5 219
(b) the amount of its institution specific countercyclical capital buffer. FIN 6.5 220
441 Indicators of global systemic importance N/A
442 Credit risk adjustments (a) the definitions for accounting purposes of “past due” and “impaired” FIN 2.3.11 111
FIN 3.1 171 (b) a description of the approaches and methods adopted for determining
specific and general credit risk adjustments
FIN 2.3.11 110 – 113
FIN 3.1 164 (c) the total amount of exposures after accounting offsets and without taking
into account the effects of credit risk mitigation, and the average amount of
the exposures over the period broken down by different types of exposure
classes
FIN 6.11 223
(d) the geographic distribution of the exposures, broken down in significant
areas by material exposure classes, and further detailed if appropriate
FIN 6.12 224
(e) the distribution of the exposures by industry or counterparty type, broken
down by exposure classes, including specifying exposure to SMEs, and
further detailed if appropriate
FIN 6.13 225
(f) the residual maturity breakdown of all the exposures, broken down by
exposure classes, and further detailed if appropriate;
FIN 6.14 226
(g) by significant industry or counterparty type, the amount of: FIN 6.16 228
- impaired exposures and past due exposures, provided separately - specific and general credit risk adjustments - charges for specific and general credit risk adjustments during the
reporting period
(h) the amount of the impaired exposures and past due exposures, provided
separately, broken down by significant geographical areas including, if
practical, the amounts of specific and general credit risk adjustments related
to each geographical area
FIN 6.17 228 – 229
(i) the reconciliation of changes in the specific and general credit risk
adjustments for impaired exposures, shown separately
FIN
FIN
6.20
6.21
230
230 The information shall comprise: FIN 2.4.5 130 - 132 - a description of the type of specific and general credit risk
adjustments
- the opening balances - the amounts taken against the credit risk adjustments during the
reporting period
- the amounts set aside or reversed for estimated probable losses on
exposures during the reporting period, any other adjustments
including those determined by exchange rate differences, business
combinations, acquisitions and disposals of subsidiaries, and
transfers between credit risk adjustments
- the closing balances.
443 Unencumbered assets FIN 6.28 233
444 Use of ECAIs
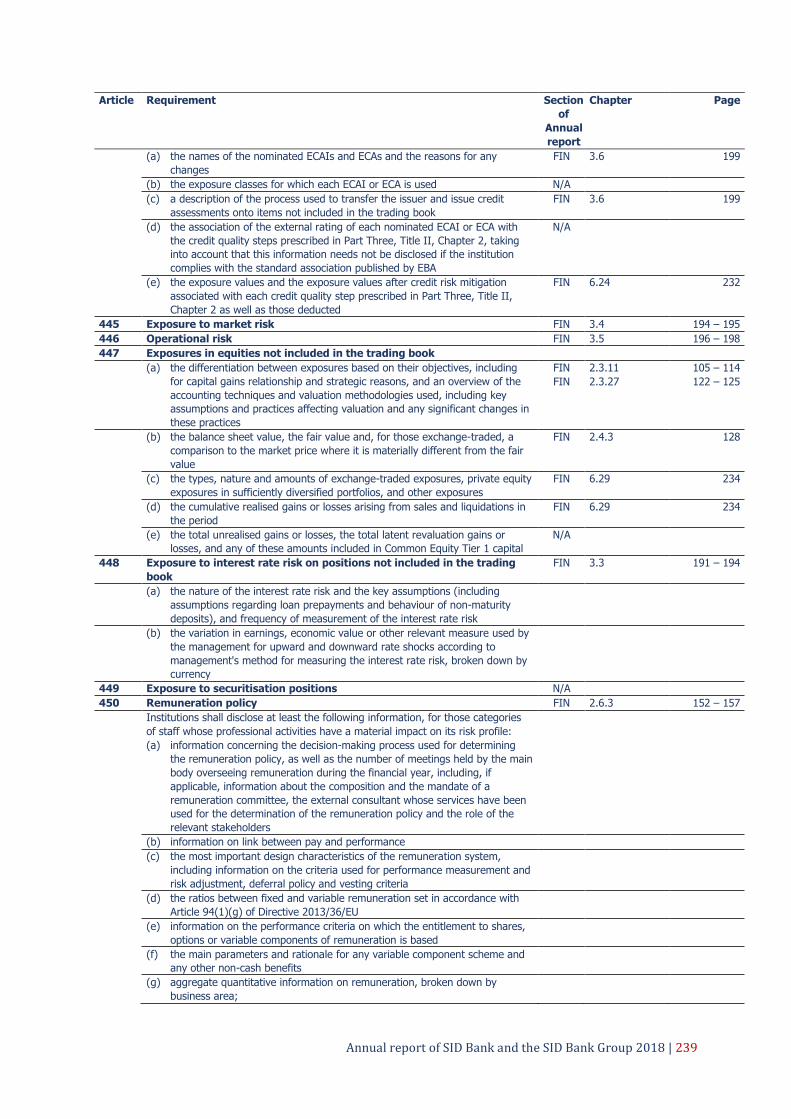
Annual report of SID Bank and the SID Bank Group 2018 | 239
Article Requirement Section
of
Annual
report
Chapter Page
(a) the names of the nominated ECAIs and ECAs and the reasons for any
changes
FIN 3.6 199
(b) the exposure classes for which each ECAI or ECA is used N/A (c) a description of the process used to transfer the issuer and issue credit
assessments onto items not included in the trading book
FIN 3.6 199
(d) the association of the external rating of each nominated ECAI or ECA with
the credit quality steps prescribed in Part Three, Title II, Chapter 2, taking
into account that this information needs not be disclosed if the institution
complies with the standard association published by EBA
N/A
(e) the exposure values and the exposure values after credit risk mitigation
associated with each credit quality step prescribed in Part Three, Title II,
Chapter 2 as well as those deducted
FIN 6.24 232
445 Exposure to market risk FIN 3.4 194 – 195
446 Operational risk FIN 3.5 196 – 198
447 Exposures in equities not included in the trading book (a) the differentiation between exposures based on their objectives, including
for capital gains relationship and strategic reasons, and an overview of the
accounting techniques and valuation methodologies used, including key
assumptions and practices affecting valuation and any significant changes in
these practices
FIN
FIN
2.3.11
2.3.27
105 – 114
122 – 125
(b) the balance sheet value, the fair value and, for those exchange-traded, a
comparison to the market price where it is materially different from the fair
value
FIN 2.4.3 128
(c) the types, nature and amounts of exchange-traded exposures, private equity
exposures in sufficiently diversified portfolios, and other exposures
FIN 6.29 234
(d) the cumulative realised gains or losses arising from sales and liquidations in
the period
FIN 6.29 234
(e) the total unrealised gains or losses, the total latent revaluation gains or
losses, and any of these amounts included in Common Equity Tier 1 capital
N/A
448 Exposure to interest rate risk on positions not included in the trading
book
FIN 3.3 191 – 194
(a) the nature of the interest rate risk and the key assumptions (including
assumptions regarding loan prepayments and behaviour of non-maturity
deposits), and frequency of measurement of the interest rate risk
(b) the variation in earnings, economic value or other relevant measure used by
the management for upward and downward rate shocks according to
management's method for measuring the interest rate risk, broken down by
currency
449 Exposure to securitisation positions N/A
450 Remuneration policy FIN 2.6.3 152 – 157 Institutions shall disclose at least the following information, for those categories
of staff whose professional activities have a material impact on its risk profile:
(a) information concerning the decision-making process used for determining
the remuneration policy, as well as the number of meetings held by the main
body overseeing remuneration during the financial year, including, if
applicable, information about the composition and the mandate of a
remuneration committee, the external consultant whose services have been
used for the determination of the remuneration policy and the role of the
relevant stakeholders
(b) information on link between pay and performance (c) the most important design characteristics of the remuneration system,
including information on the criteria used for performance measurement and
risk adjustment, deferral policy and vesting criteria
(d) the ratios between fixed and variable remuneration set in accordance with
Article 94(1)(g) of Directive 2013/36/EU
(e) information on the performance criteria on which the entitlement to shares,
options or variable components of remuneration is based
(f) the main parameters and rationale for any variable component scheme and
any other non-cash benefits
(g) aggregate quantitative information on remuneration, broken down by
business area;
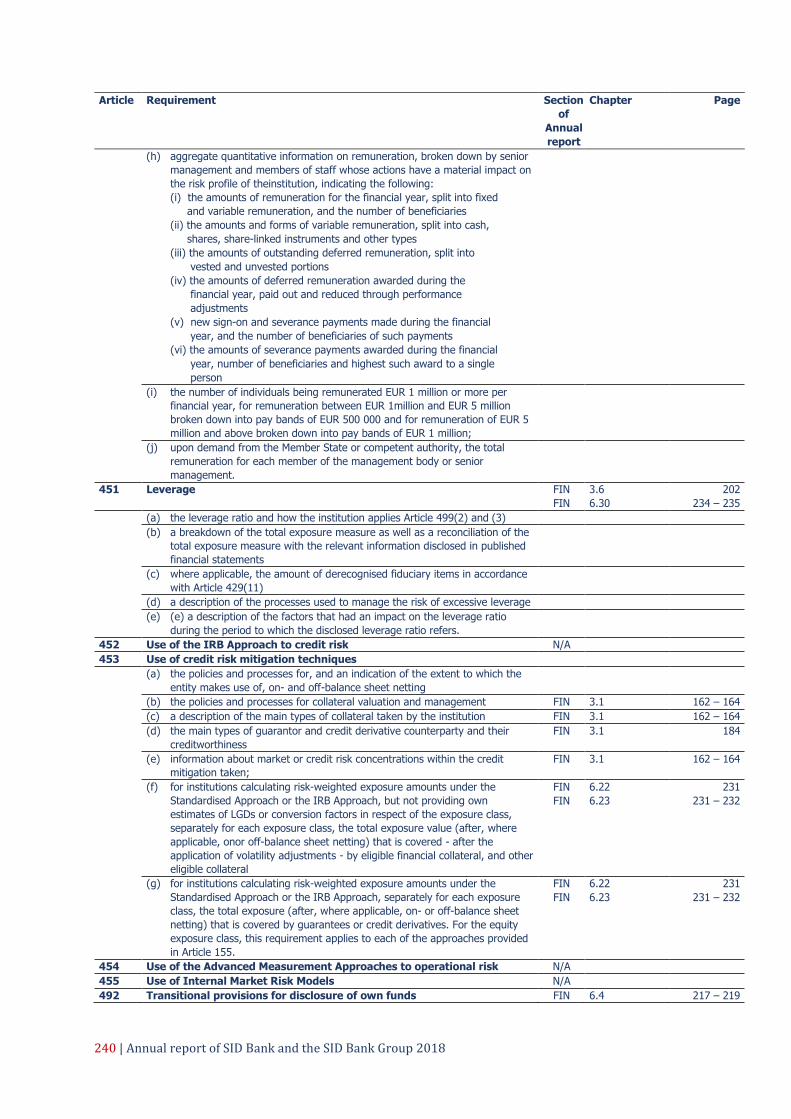
240 | Annual report of SID Bank and the SID Bank Group 2018
Article Requirement Section
of
Annual
report
Chapter Page
(h) aggregate quantitative information on remuneration, broken down by senior
management and members of staff whose actions have a material impact on
the risk profile of theinstitution, indicating the following:
(i) the amounts of remuneration for the financial year, split into fixed
and variable remuneration, and the number of beneficiaries
(ii) the amounts and forms of variable remuneration, split into cash,
shares, share-linked instruments and other types
(iii) the amounts of outstanding deferred remuneration, split into
vested and unvested portions
(iv) the amounts of deferred remuneration awarded during the
financial year, paid out and reduced through performance
adjustments
(v) new sign-on and severance payments made during the financial
year, and the number of beneficiaries of such payments
(vi) the amounts of severance payments awarded during the financial
year, number of beneficiaries and highest such award to a single
person
(i) the number of individuals being remunerated EUR 1 million or more per
financial year, for remuneration between EUR 1million and EUR 5 million
broken down into pay bands of EUR 500 000 and for remuneration of EUR 5
million and above broken down into pay bands of EUR 1 million;
(j) upon demand from the Member State or competent authority, the total
remuneration for each member of the management body or senior
management.
451 Leverage FIN
FIN
3.6
6.30
202
234 – 235 (a) the leverage ratio and how the institution applies Article 499(2) and (3) (b) a breakdown of the total exposure measure as well as a reconciliation of the
total exposure measure with the relevant information disclosed in published
financial statements
(c) where applicable, the amount of derecognised fiduciary items in accordance
with Article 429(11)
(d) a description of the processes used to manage the risk of excessive leverage (e) (e) a description of the factors that had an impact on the leverage ratio
during the period to which the disclosed leverage ratio refers.
452 Use of the IRB Approach to credit risk N/A
453 Use of credit risk mitigation techniques
(a) the policies and processes for, and an indication of the extent to which the
entity makes use of, on- and off-balance sheet netting
(b) the policies and processes for collateral valuation and management FIN 3.1 162 – 164 (c) a description of the main types of collateral taken by the institution FIN 3.1 162 – 164 (d) the main types of guarantor and credit derivative counterparty and their
creditworthiness
FIN 3.1 184
(e) information about market or credit risk concentrations within the credit
mitigation taken;
FIN 3.1 162 – 164
(f) for institutions calculating risk-weighted exposure amounts under the
Standardised Approach or the IRB Approach, but not providing own
estimates of LGDs or conversion factors in respect of the exposure class,
separately for each exposure class, the total exposure value (after, where
applicable, onor off-balance sheet netting) that is covered - after the
application of volatility adjustments - by eligible financial collateral, and other
eligible collateral
FIN
FIN
6.22
6.23
231
231 – 232
(g) for institutions calculating risk-weighted exposure amounts under the
Standardised Approach or the IRB Approach, separately for each exposure
class, the total exposure (after, where applicable, on- or off-balance sheet
netting) that is covered by guarantees or credit derivatives. For the equity
exposure class, this requirement applies to each of the approaches provided
in Article 155.
FIN
FIN
6.22
6.23
231
231 – 232
454 Use of the Advanced Measurement Approaches to operational risk N/A
455 Use of Internal Market Risk Models N/A
492 Transitional provisions for disclosure of own funds FIN 6.4 217 – 219

Annual report of SID Bank and the SID Bank Group 2018 | 241
Article Requirement Section
of
Annual
report
Chapter Page
(a) the nature and effect on Common Equity Tier 1 capital, Additional Tier 1
capital, Tier 2 capital and own funds of the individual filters and deductions
applied in accordance with Articles 467 to 470, 474, 476 and 479
(b) the amounts of minority interests and Additional Tier 1 and Tier 2
instruments, and related retained earnings and share premium accounts,
issued by subsidiaries that are included in consolidated Common Equity Tier
1 capital, Additional Tier 1 capital, Tier 2 capital and own funds in
accordance with Section 4 of Chapter 1
(c) the effect on Common Equity Tier 1 capital, Additional Tier 1 capital, Tier 2
capital and own funds of the individual filters and deductions applied in
accordance with Article 481
(d) the nature and amount of items that qualify as Common Equity Tier 1 items,
Tier 1 items and Tier 2 items by virtue of applying the derogations specified
in Section 2 of Chapter 2.
(e) the amount of instruments that qualify as Common Equity Tier 1
instruments, Additional Tier 1 instruments and Tier 2 instruments by virtue
of applying Article 484
BUS: Business report
FIN: Financial report
N/A: Not applicable
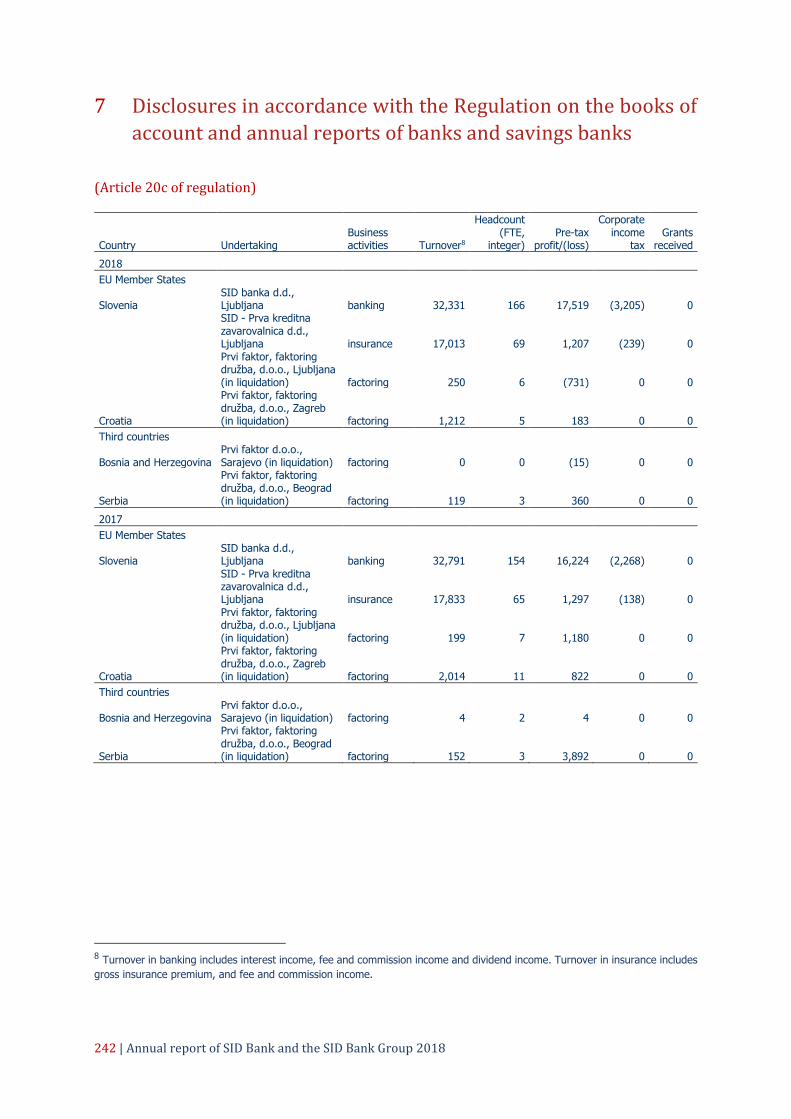
242 | Annual report of SID Bank and the SID Bank Group 2018
7 Disclosures in accordance with the Regulation on the books of
account and annual reports of banks and savings banks
(Article 20c of regulation)
Country Undertaking Business activities Turnover8
Headcount (FTE,
integer) Pre-tax
profit/(loss)
Corporate income
tax Grants
received
2018 EU Member States
Slovenia SID banka d.d., Ljubljana banking 32,331 166 17,519 (3,205) 0
SID - Prva kreditna zavarovalnica d.d., Ljubljana insurance 17,013 69 1,207 (239) 0
Prvi faktor, faktoring družba, d.o.o., Ljubljana (in liquidation) factoring 250 6 (731) 0 0
Croatia
Prvi faktor, faktoring družba, d.o.o., Zagreb (in liquidation) factoring 1,212 5 183 0 0
Third countries
Bosnia and Herzegovina Prvi faktor d.o.o., Sarajevo (in liquidation) factoring 0 0 (15) 0 0
Serbia
Prvi faktor, faktoring družba, d.o.o., Beograd (in liquidation) factoring 119 3 360 0 0
2017
EU Member States
Slovenia SID banka d.d., Ljubljana banking 32,791 154 16,224 (2,268) 0
SID - Prva kreditna zavarovalnica d.d., Ljubljana insurance 17,833 65 1,297 (138) 0
Prvi faktor, faktoring družba, d.o.o., Ljubljana (in liquidation) factoring 199 7 1,180 0 0
Croatia
Prvi faktor, faktoring družba, d.o.o., Zagreb (in liquidation) factoring 2,014 11 822 0 0
Third countries
Bosnia and Herzegovina Prvi faktor d.o.o., Sarajevo (in liquidation) factoring 4 2 4 0 0
Serbia
Prvi faktor, faktoring družba, d.o.o., Beograd (in liquidation) factoring 152 3 3,892 0 0
8 Turnover in banking includes interest income, fee and commission income and dividend income. Turnover in insurance includes
gross insurance premium, and fee and commission income.

Annual report of SID Bank and the SID Bank Group 2018 | 243
8 Operations under Republic of Slovenia authorisation
Operations on behalf of and for the account of the Republic of Slovenia
As an authorised institution, on behalf of and for
the account of the Republic of Slovenia, SID
Bank insures against those commercial and
non-commercial or risks that, in light of their
nature and level of risk, the private reinsurance
sector is not willing to take up or has limited
capacity to take up.
Operations on behalf of and for the account of
the Republic of Slovenia are not included in SID
Bank’s financial statements. They are recorded
in separate items, as determined by the Bank of
Slovenia for the administration of these
operations.
Insurance on behalf of and for the account of the Republic of Slovenia 31 Dec 2018 31 Dec 2017
Assets
Customer funds in current accounts 9,002 237
Financial assets measured at fair value through other comprehensive income 132,736 n.a.
Available-for-sale financial assets (under IAS 39) n.a. 117,196
Loans 14,128 17,351
Loans and advances to banks 14,128 17,351
Equity investments 1,977 1,073
Other assets 396 864
Total assets 158,239 136,721
Liabilities
Contingency reserves 154,281 132,167
Accumulated other comprehensive income 1,534 2,597
Other financial liabilities 4 4
Other liabilities 2,420 1,953
Total tax liabilities 158,239 136,721
Memorandum account for brokerage 601,854 586,797
The memorandum account for insurance
brokerage on behalf of and for the account of
the Republic of Slovenia represents the
exposure from valid insurance policies and
commitments.
Operations on its own behalf and for the account of the Republic of Slovenia
SID Bank was appointed the manager of the
Fund of Funds in 2017, within the framework of
the implementation of financial instruments of
the European cohesion policy.
SID Bank manages the Fund of Funds on its
own behalf and for the account of the Republic
of Slovenia.
The purpose of the fund is the promotion and
financing of sustainable economic growth and
development, investments in innovation, and
current operations, through debt and equity
financing in four areas:
research, development and innovation, SMEs,
energy efficiency, and urban development.
The operations of the Fund of Funds that SID
Bank manages on its own behalf and for the
account of the Republic of Slovenia are not
included in the financial statements of SID
Bank, but are instead recorded in separate
items.

244 | Annual report of SID Bank and the SID Bank Group 2018
31 Dec 2018 31 Dec 2017
Assets
Funds in settlement account 27,892 31,062
Available-for-sale financial assets (under IAS 39) n.a. 3,176
Financial assets mandatorily at fair value through profit or loss 27,537 n.a.
Loans and advances 5,995 28,785
Loans and advances to banks 5,995 28,785
Other assets 1 0
Total assets 61,425 63,023
Liabilities
Financial liabilities 61,393 63,023
Loans from customers 61,693 63,250
Revaluation of loans from customers (657) (354)
Other financial liabilities 357 127
Provisions 32 0
Total tax liabilities 61,425 63,023
Transaction memorandum account 235,159 189,750
Off-balance-sheet receivables 189,750 189,750
Loans received: east 69,675 69,675
Loans received: west 101,325 101,325
Loans received: unclassified 18,750 18,750
Off-balance-sheet liabilities 45,409 0
Loans granted: east 18,770 0
Loans granted: west 26,639 0