republic of slovenia 2013 article iv consulation
DESCRIPTION
Republic of Slovenia 2013 Article IV ConsulationTRANSCRIPT
©2014 International Monetary Fund
IMF Country Report No. 14/11
REPUBLIC OF SLOVENIA 2013 ARTICLE IV CONSULTATION Under Article IV of the IMF’s Articles of Agreement, the IMF holds bilateral discussions with members, usually every year. In the context of the 2013 Article IV consultation with the Republic of Slovenia, the following documents have been released and are included in this package: The Staff Report for the 2013 Article IV consultation, prepared by a staff team of the IMF for Executive Board’s consideration on January 13, 2014, following discussions that ended on October 29, 2013, with the officials of the Republic of Slovenia on economic developments and policies. Based on information available at the time of these discussions, the staff report was completed on December 27, 2013.
An Informational Annex prepared by the IMF.
An Debit Sustainability Analysis (DSA) prepared by the IMF.
A Press Release summarizing the views of the Executive Board as expressed during its January 13, 2014 consideration of the staff report that concluded the Article IV Consultation with the Republic of Slovenia.
A Statement by the Executive Director for the Republic of Slovenia.
The publication policy for staff reports and other documents allows for the deletion of market-sensitive information.
Copies of this report are available to the public from
International Monetary Fund Publication Services 700 19th Street, N.W. Washington, D.C. 20431
Telephone: (202) 623-7430 Telefax: (202) 623-7201 E-mail: [email protected] Internet: http://www.imf.org
Price: $18.00 a copy
International Monetary Fund
Washington, D.C.
January 2014
REPUBLIC OF SLOVENIA STAFF REPORT FOR THE 2013 ARTICLE IV CONSULTATION KEY ISSUES Context: Slovenia is facing a deep recession resulting from a vicious circle of strained
corporate and bank balance sheets, weak domestic demand, and necessary fiscal
consolidation. The headline deficit remains around 4¼ percent of GDP in 2013 excluding
bank restructuring costs, and public debt—55 percent of GDP at the end of 2012—is
increasing rapidly. Concerns about growth, banks, and the fiscal gap and large fiscal
contingent liabilities have kept sovereign borrowing rates high. Based on the asset quality
review (AQR) and stress tests (ST), the government is recapitalizing state-owned banks.
Challenges: (i) building on the planned recapitalization, promptly restructure banks to
ensure financial stability; (ii) restructure the corporate sector to avoid a recurrence of
financial problems; (iii) pursue gradual fiscal consolidation over the medium term, including
via further pension reform, to safeguard debt sustainability.
Staff views: The independent AQR and ST and recapitalization are key milestones. However,
only restructuring the corporate and bank sectors, including a thorough clean-up of bank
balance sheets, and reducing the role of the state in the economy can sustain durable
growth. Without this, the bank recapitalization will be only a stop-gap—albeit expensive—
measure. Corporate restructuring, involving debt-equity swaps to deleverage viable
companies and liquidation of unviable ones, is needed. The bank asset management
company (BAMC) and the new insolvency law can facilitate this but more nonperforming
loans (NPLs) than currently proposed should be transferred to the BAMC. The authorities’
plan appropriately envisions a reduction in the general government deficit (excluding bank
restructuring and recapitalization costs) to 3½ percent of GDP in 2014 and below 3 percent
of GDP in 2015, but additional, upfront measures of some 1 percent of GDP may be needed
to achieve the 2014 target. In the medium term, additional consolidation is necessary to
address the fiscal costs stemming from bank restructuring. In addition, pension reforms are
needed in response to unfavorable demographic trends.
Authorities’ views: After bank recapitalization, corporate restructuring facilitated by
transferring part of the bad assets to the BAMC and by the new insolvency law is a priority,
but expanding corporates’ access to credit is also important. Privatization of 15 companies,
including Telekom, NKBM, Abanka, and (partly) NLB, will further improve governance. While
acknowledging fiscal risks for 2014, the authorities are optimistic about the fiscal measures,
and will consider corrective actions later in the year if needed. A second round of pension
reform will be considered after 2015 when the pension freeze will expire. Decisive
implementation of reforms will decrease further the cost of borrowing.
December 27, 2013
REPUBLIC OF SLOVENIA
2 INTERNATIONAL MONETARY FUND
Approved By Philip Gerson and
Ranil Manohara
Salgado
The mission took place in Ljubljana from October 17 through 28, 2013.
The team comprised Messrs. Spilimbergo (head), Craig, Dalgıç,
Halikias, Jaramillo-Vallejo, Lombardo, Tapsoba, and Ms. Zakharova
and was assisted at headquarters by Mr. Winnekens and Ms. Moraes
Rego. The mission held discussions with Mr. Čufer (Minister of
Finance), Mr. Jazbec (Governor of the Bank of Slovenia), other
ministers, government officials and representatives of parliament,
financial sector, labor, business, academy, and media. Mr. Repanšek
(Advisor to the Executive Director) attended most meetings.
Mr. Prader (Executive Director) attended the concluding meeting.
CONTENTS
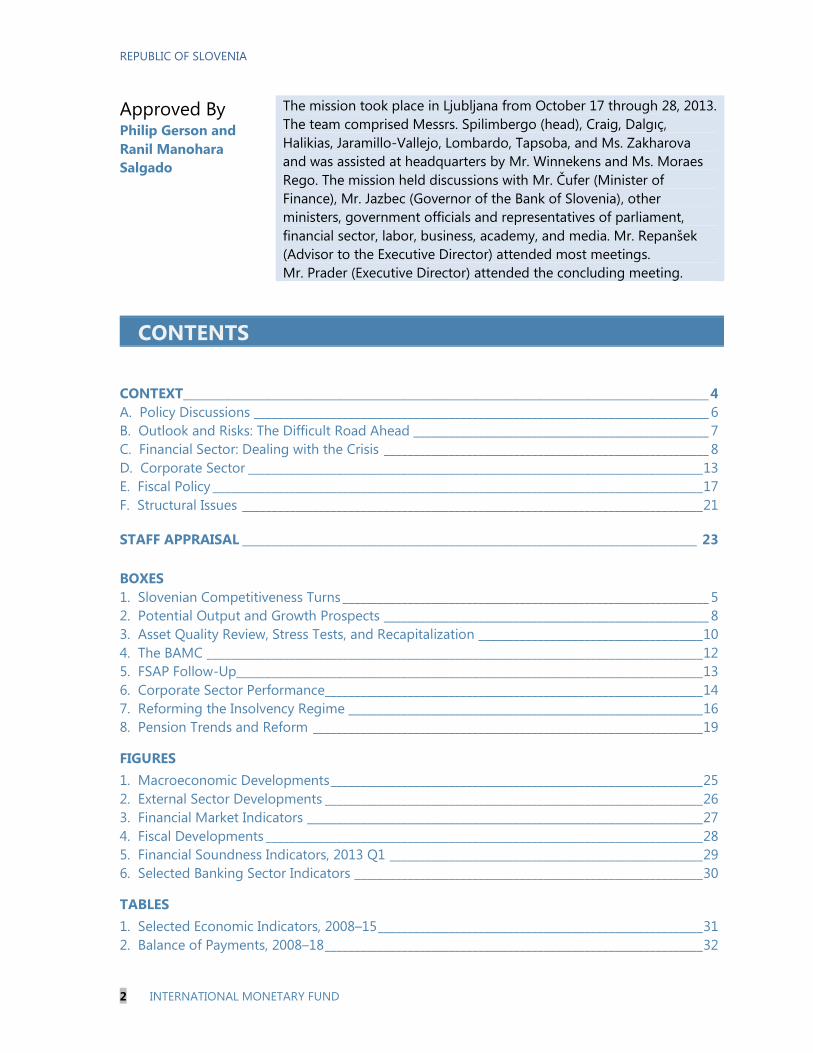
CONTEXT_________________________________________________________________________________________ 4
A. Policy Discussions _____________________________________________________________________________ 6
B. Outlook and Risks: The Difficult Road Ahead __________________________________________________ 7
C. Financial Sector: Dealing with the Crisis _______________________________________________________ 8
D. Corporate Sector _____________________________________________________________________________ 13
E. Fiscal Policy ___________________________________________________________________________________ 17
F. Structural Issues ______________________________________________________________________________ 21
STAFF APPRAISAL _____________________________________________________________________________ 23
BOXES
1. Slovenian Competitiveness Turns ______________________________________________________________ 5
2. Potential Output and Growth Prospects _______________________________________________________ 8
3. Asset Quality Review, Stress Tests, and Recapitalization ______________________________________ 10
4. The BAMC ____________________________________________________________________________________ 12
5. FSAP Follow-Up_______________________________________________________________________________ 13
6. Corporate Sector Performance________________________________________________________________ 14
7. Reforming the Insolvency Regime ____________________________________________________________ 16
8. Pension Trends and Reform __________________________________________________________________ 19
FIGURES
1. Macroeconomic Developments _______________________________________________________________ 25
2. External Sector Developments ________________________________________________________________ 26
3. Financial Market Indicators ___________________________________________________________________ 27
4. Fiscal Developments __________________________________________________________________________ 28
5. Financial Soundness Indicators, 2013 Q1 _____________________________________________________ 29
6. Selected Banking Sector Indicators ___________________________________________________________ 30
TABLES
1. Selected Economic Indicators, 2008–15 _______________________________________________________ 31
2. Balance of Payments, 2008–18 ________________________________________________________________ 32
REPUBLIC OF SLOVENIA
INTERNATIONAL MONETARY FUND 3
3. Financial Soundness Indicators, 2008–13 _____________________________________________________ 33
4. General Government Operations (cash basis), 2008–18 _______________________________________ 34
5. Macroeconomic Framework, 2008–18 ________________________________________________________ 35
APPENDIX
1. Risk Assessment Matrix _______________________________________________________________________ 36
REPUBLIC OF SLOVENIA
4 INTERNATIONAL MONETARY FUND
CONTEXT
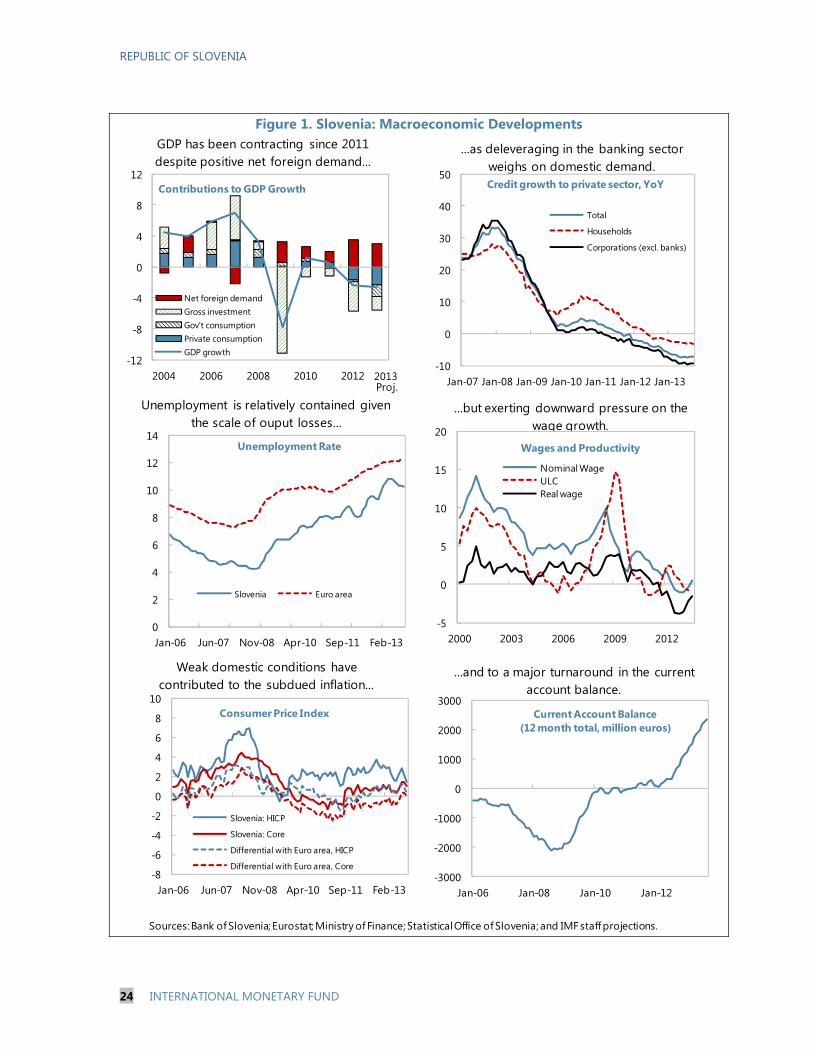
1. Slovenia remains in deep recession. Around the period of euro adoption in 2007,
Slovenia experienced an externally-financed construction and investment boom that masked pre-
existing structural weaknesses. The global financial crisis caused a sudden stop in external
financing and a sharp drop in GDP. After a brief stabilization in 2010, the recession resumed
in 2011 and the economy now has contracted for eight consecutive quarters. While a sharp
contraction in investment was the main driver of the downturn in the early stages, consumption—
hitherto buffered by healthy household balance sheets—also started to decline from 2012,
weighed down by deep fiscal cuts, stagnant wages, and growing uncertainty. In all, real GDP has
fallen by 11 percent from its pre-crisis peak through mid-2013, the largest output loss among the
euro area members after Greece.
2. Interlinked problems in the banking and corporate sectors are at the core of
Slovenia’s difficulties. The sudden stop in external financing brought to the surface pervasive
bank and corporate governance shortcomings. The combination of an overly indebted corporate
sector and weak banks has limited credit availability and precipitated a vicious circle of deepening
recession, mounting bankruptcies, rising NPLs, and further deleveraging.
3. Public debt has been increasing rapidly. Before the global financial crisis public debt was
low (22 percent of GDP) and the fiscal position close to balance, but the prolonged recession and
the burden of supporting the state-owned banks have since put public finances under considerable
strain. Public debt has more than doubled since 2008, reaching 55 percent of GDP by end-2012,
and is set to increase sharply after bank restructuring. The deficit is slated to exceed 4 percent of
GDP in 2013 (excluding bank support costs), despite a significant fiscal consolidation over the last
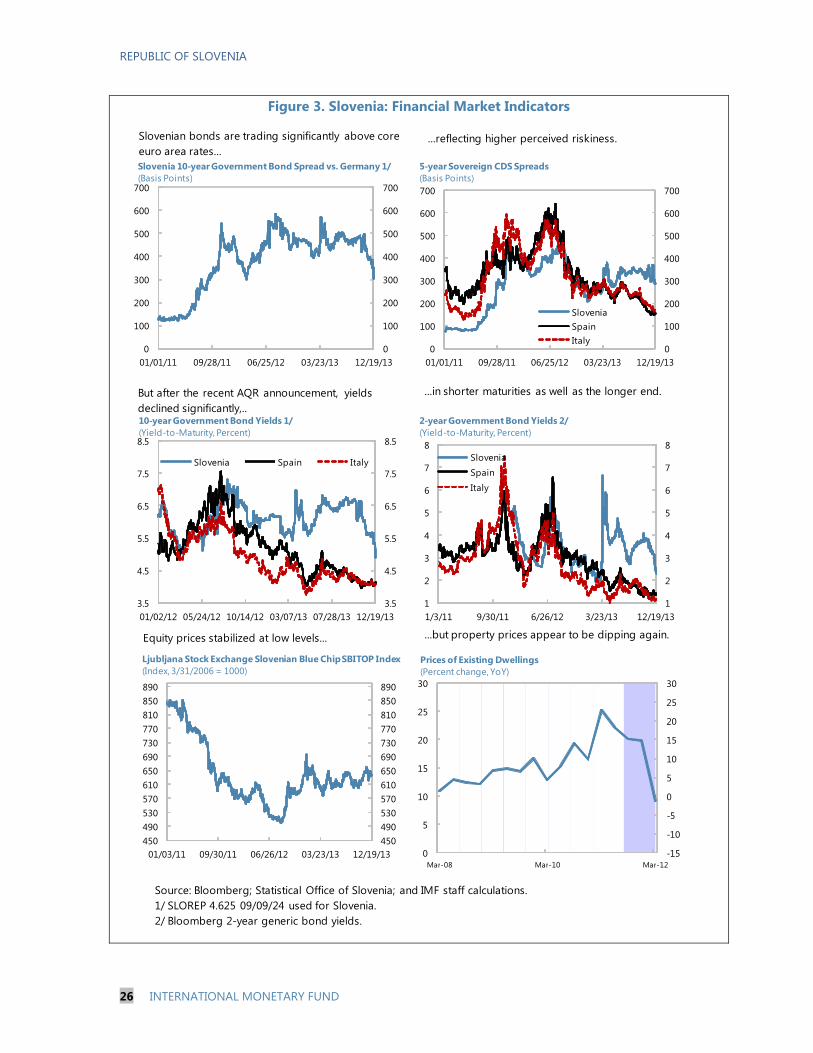
three years. Reflecting in part concerns about the fiscal impact of bank restructuring, government
bond yields reached about 2 percentage points higher than in similarly-rated Spain and Italy,
posing a challenge for debt sustainability, before moderating to about 1¼ percent above Spain
and Italy after the announcement of bank asset quality review results in December. In mid-
November, the authorities made a €1.5 billion private placement of a 3-year euro bond, at a spread
of 465 basis points above German paper.
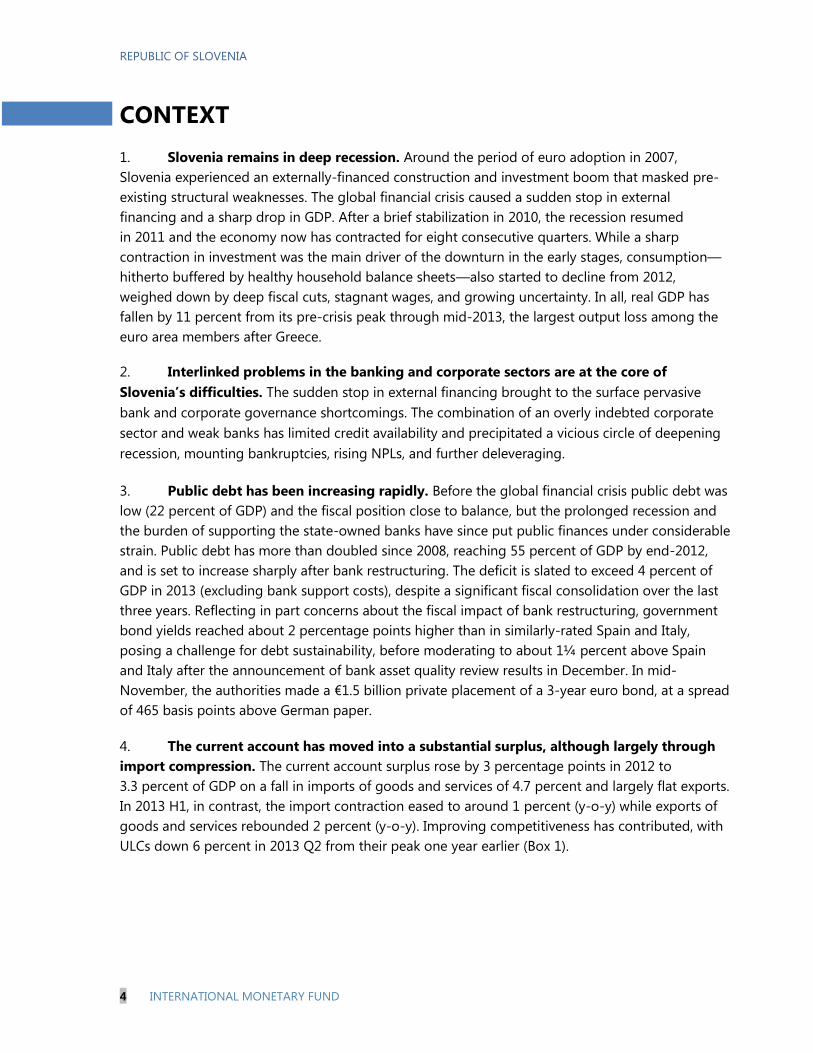
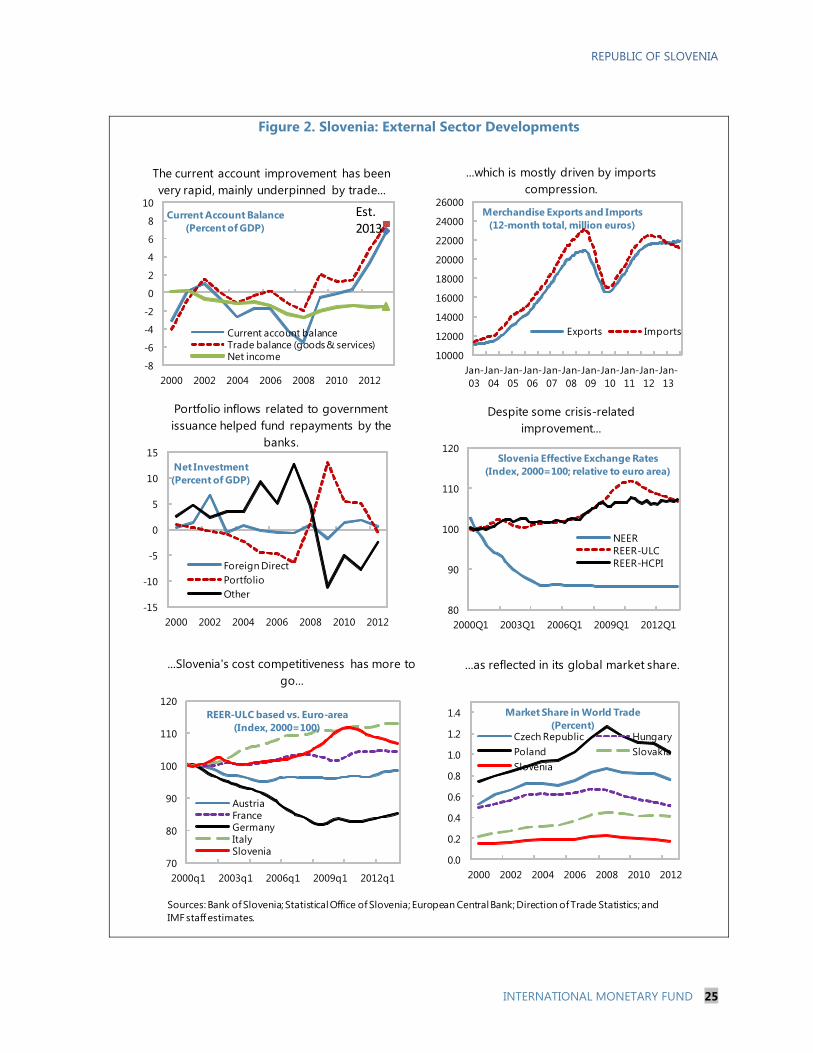
4. The current account has moved into a substantial surplus, although largely through
import compression. The current account surplus rose by 3 percentage points in 2012 to
3.3 percent of GDP on a fall in imports of goods and services of 4.7 percent and largely flat exports.
In 2013 H1, in contrast, the import contraction eased to around 1 percent (y-o-y) while exports of
goods and services rebounded 2 percent (y-o-y). Improving competitiveness has contributed, with
ULCs down 6 percent in 2013 Q2 from their peak one year earlier (Box 1).
REPUBLIC OF SLOVENIA
INTERNATIONAL MONETARY FUND 5
96
98
100
102
104
106
108
110
2008 2009 2010 2011 2012
SVN: Real ULC
EA: Real ULC
SVN: Labor productivity (per hour worked)
EA: Labor productivity (per hour worked)
Slovenia: ULC and Productivity relative to the E.U.(Index, 2008 = 100)
Source: Haver; and IMF staff calculations.
-10
-5
0
5
10
15
20
(minus) Employment Real output Productivity
Slovenia: Productivity(log difference, peak to trough)
Box 1. Slovenian Competitiveness Turns
Slovenia’s competitiveness has improved over the last year. The real exchange rate depreciated
modestly this year as unit labor costs turned down. The loss in export market share documented in last
year’s report appears to have bottomed out and is recovering, with stronger export growth occurring in
markets outside the E.U. The real exchange rate is close to equilibrium with different CGER methodologies
showing deviations of less than 5 percent (Table). The bulk of the improvement in the current account, to
around 6 percent of GDP this year, has been cyclical, but estimates of the underlying current account now
stands significantly above the current account norm based on fundamentals, indicating that structural
factors are playing a role. Slovenia’s net International Investment Position stood at negative 45 percent at
end 2012, but should narrow over the medium term with the current account surplus and external
deleveraging.
Slovenia: Equilibrium Exchange Rates
CGER Methodology 2013 2012
Macroeconomic Balance -4.7 0.6
Equilibrium Exchange Rate 2.9 2.0
External sustainability -4.3 -1.2
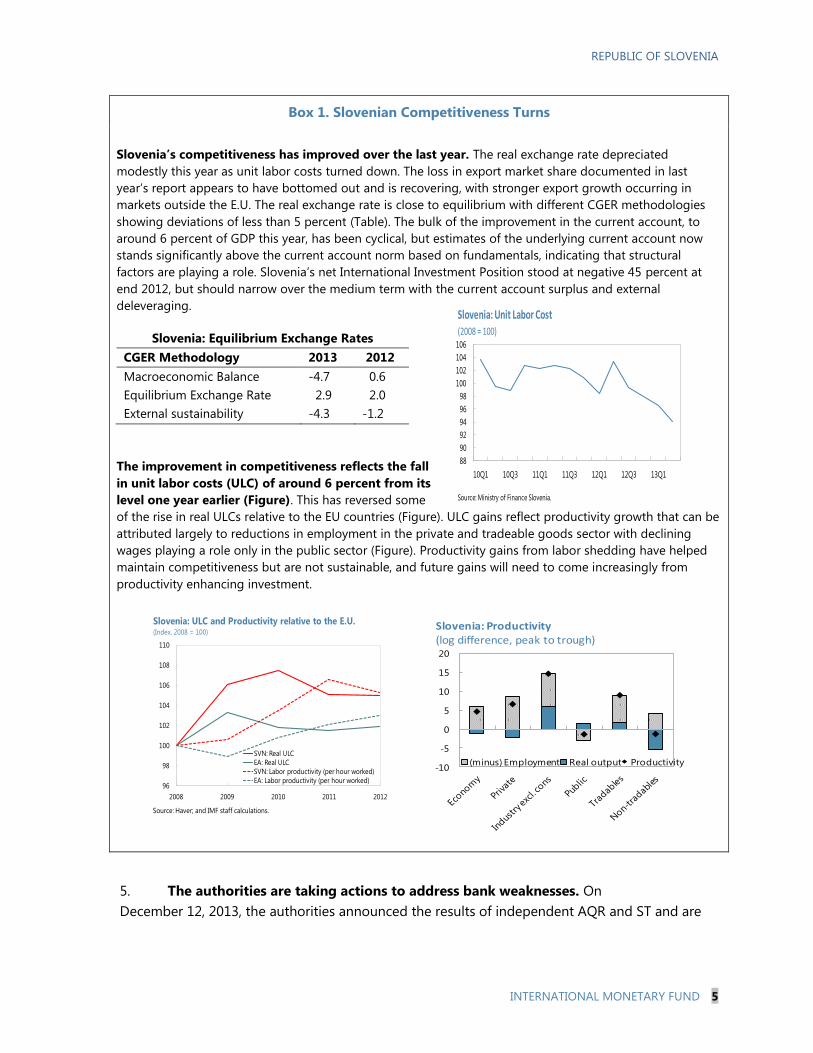
The improvement in competitiveness reflects the fall
in unit labor costs (ULC) of around 6 percent from its
level one year earlier (Figure). This has reversed some
of the rise in real ULCs relative to the EU countries (Figure). ULC gains reflect productivity growth that can be
attributed largely to reductions in employment in the private and tradeable goods sector with declining
wages playing a role only in the public sector (Figure). Productivity gains from labor shedding have helped
maintain competitiveness but are not sustainable, and future gains will need to come increasingly from
productivity enhancing investment.
5. The authorities are taking actions to address bank weaknesses. On
December 12, 2013, the authorities announced the results of independent AQR and ST and are
88
90
92
94
96
98
100
102
104
106
10Q1 10Q3 11Q1 11Q3 12Q1 12Q3 13Q1
Slovenia: Unit Labor Cost(2008 = 100)
Source: Ministry of Finance Slovenia.
REPUBLIC OF SLOVENIA
6 INTERNATIONAL MONETARY FUND
proceeding with banks’ recapitalization (see paragraph 18). The authorities are also transferring
some impaired assets to the BAMC.
6. The government also has made some progress on other reforms but political
situation remains complicated. In the spring, parliament passed laws making referenda more
difficult to call (the ease of calling referenda to block reforms was perceived as an important
institutional problem) and introduced a (structurally) balanced budget rule in the constitution.
Since the summer, the parliament approved key laws on corporate insolvency, bank resolution,
and state holding company. Despite this important institutional progress, tough discussions on
banks and the 2014 budget highlighted tensions within the government coalition.
A. Policy Discussions
7. Policy discussions focused on the growth outlook, the asset quality review (AQR)
and stress tests (ST) and their implications for bank recapitalization, corporate sector
restructuring, fiscal consolidation, pension and labor market reforms, and competitiveness.
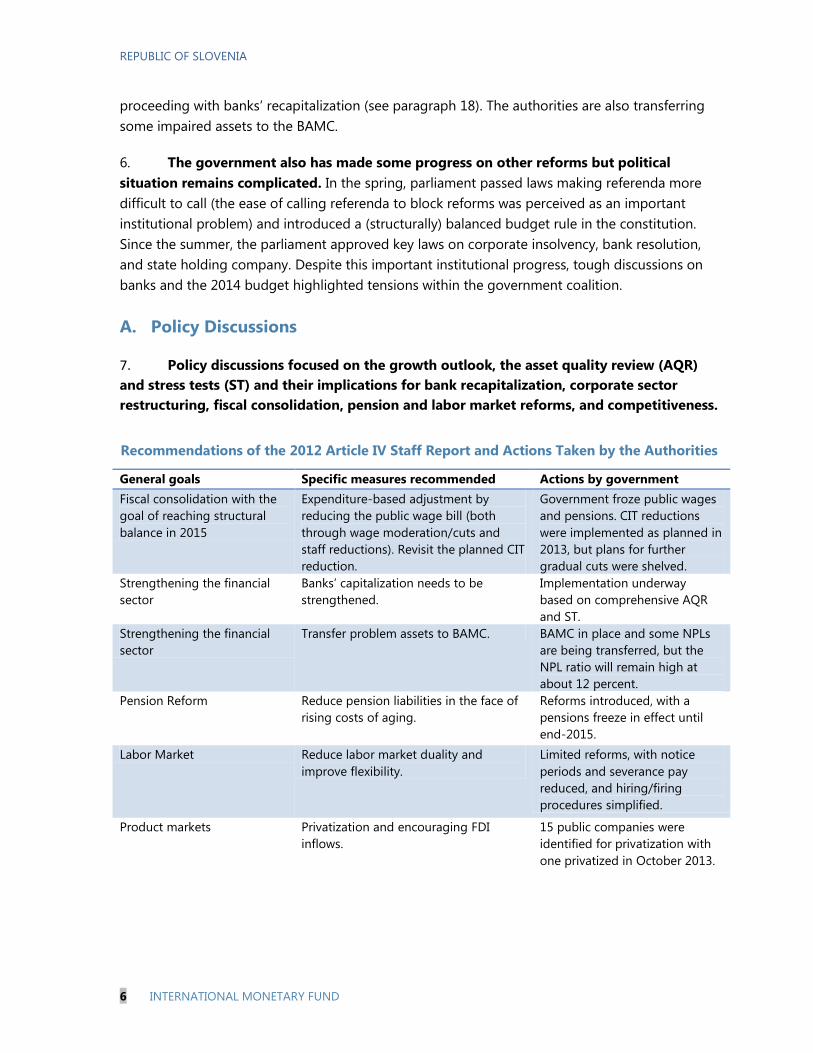
Recommendations of the 2012 Article IV Staff Report and Actions Taken by the Authorities
General goals Specific measures recommended Actions by government
Fiscal consolidation with the
goal of reaching structural
balance in 2015
Expenditure-based adjustment by
reducing the public wage bill (both
through wage moderation/cuts and
staff reductions). Revisit the planned CIT
reduction.
Government froze public wages
and pensions. CIT reductions
were implemented as planned in
2013, but plans for further
gradual cuts were shelved.
Strengthening the financial
sector
Banks’ capitalization needs to be
strengthened.
Implementation underway
based on comprehensive AQR
and ST.
Strengthening the financial
sector
Transfer problem assets to BAMC. BAMC in place and some NPLs
are being transferred, but the
NPL ratio will remain high at
about 12 percent.
Pension Reform Reduce pension liabilities in the face of
rising costs of aging.
Reforms introduced, with a
pensions freeze in effect until
end-2015.
Labor Market Reduce labor market duality and
improve flexibility.
Limited reforms, with notice
periods and severance pay
reduced, and hiring/firing
procedures simplified.
Product markets Privatization and encouraging FDI
inflows.
15 public companies were
identified for privatization with
one privatized in October 2013.
REPUBLIC OF SLOVENIA
INTERNATIONAL MONETARY FUND 7
B. Outlook and Risks: The Difficult Road Ahead
8. The near-term economic outlook is difficult. Poor asset quality and funding problems
in the banks, debt overhang in the corporate sector, and large fiscal consolidation needs
(including owing to the need to recapitalize banks) cloud the near-term horizon. Staff forecasts
that the economy will continue to shrink in 2013 by 1.7 percent and—despite the expected
recovery in the euro area—by a further 1.1 percent in 2014. The consensus and government
growth forecasts range between 0 and -1 percent for 2014.
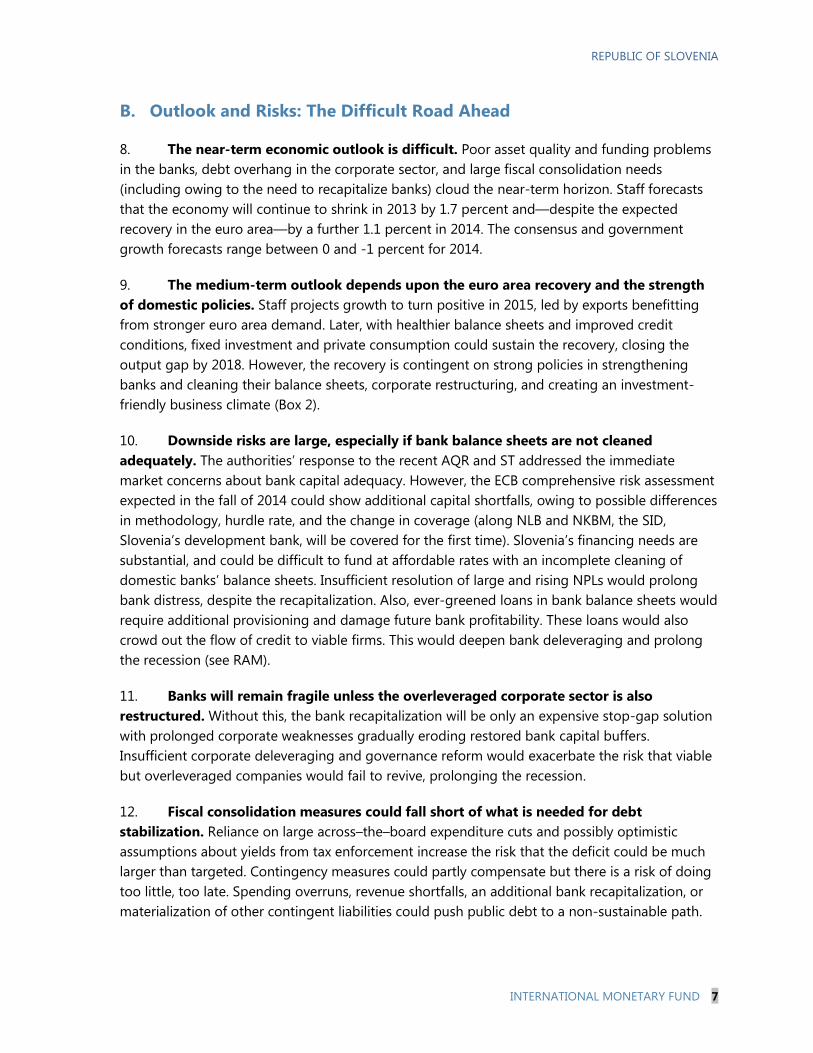
9. The medium-term outlook depends upon the euro area recovery and the strength
of domestic policies. Staff projects growth to turn positive in 2015, led by exports benefitting
from stronger euro area demand. Later, with healthier balance sheets and improved credit
conditions, fixed investment and private consumption could sustain the recovery, closing the
output gap by 2018. However, the recovery is contingent on strong policies in strengthening
banks and cleaning their balance sheets, corporate restructuring, and creating an investment-
friendly business climate (Box 2).
10. Downside risks are large, especially if bank balance sheets are not cleaned
adequately. The authorities’ response to the recent AQR and ST addressed the immediate
market concerns about bank capital adequacy. However, the ECB comprehensive risk assessment
expected in the fall of 2014 could show additional capital shortfalls, owing to possible differences
in methodology, hurdle rate, and the change in coverage (along NLB and NKBM, the SID,
Slovenia’s development bank, will be covered for the first time). Slovenia’s financing needs are
substantial, and could be difficult to fund at affordable rates with an incomplete cleaning of
domestic banks’ balance sheets. Insufficient resolution of large and rising NPLs would prolong
bank distress, despite the recapitalization. Also, ever-greened loans in bank balance sheets would
require additional provisioning and damage future bank profitability. These loans would also
crowd out the flow of credit to viable firms. This would deepen bank deleveraging and prolong
the recession (see RAM).
11. Banks will remain fragile unless the overleveraged corporate sector is also
restructured. Without this, the bank recapitalization will be only an expensive stop-gap solution
with prolonged corporate weaknesses gradually eroding restored bank capital buffers.
Insufficient corporate deleveraging and governance reform would exacerbate the risk that viable
but overleveraged companies would fail to revive, prolonging the recession.
12. Fiscal consolidation measures could fall short of what is needed for debt
stabilization. Reliance on large across–the–board expenditure cuts and possibly optimistic
assumptions about yields from tax enforcement increase the risk that the deficit could be much
larger than targeted. Contingency measures could partly compensate but there is a risk of doing
too little, too late. Spending overruns, revenue shortfalls, an additional bank recapitalization, or
materialization of other contingent liabilities could push public debt to a non-sustainable path.
REPUBLIC OF SLOVENIA
8 INTERNATIONAL MONETARY FUND
-10
-8
-6
-4
-2
0
2
4
6
8
2001 2002 2003 2004 2005 2006 2007 2008 2009 2010 2011 2012 2013 2014
Actual
Potential
Potential versus actual growth(Percent)
13. External risks derive largely from the re-emergence of euro area financial stress and
slower European growth. While Slovenian banks have already gone through a significant
deleveraging in recent years, a failure of euro area countries to deliver on policy commitments or
a negative result from the euro area AQR and ST could curtail the foreign bank credit on which
export-oriented Slovenian firms rely. Slower euro area growth would undermine Slovenia’s
growth prospects and worsen its public debt dynamics. Possible outward spillovers are limited to
countries where subsidiaries of Slovenian banks are present, including Bosnia and Herzegovina,
Kosovo, Macedonia, Montenegro, and Serbia.
14. The authorities broadly agreed with staff’s outlook and the assessment of risks.
Official forecasts for 2014 growth are moderately better than staff’s, but the authorities agreed
that the risks to forecasts are to the downside. They broadly concurred with the classification of
risks as in the RAM, but stressed that Slovenia is committed to the prompt implementation of the
policy agenda so domestic risks are limited.
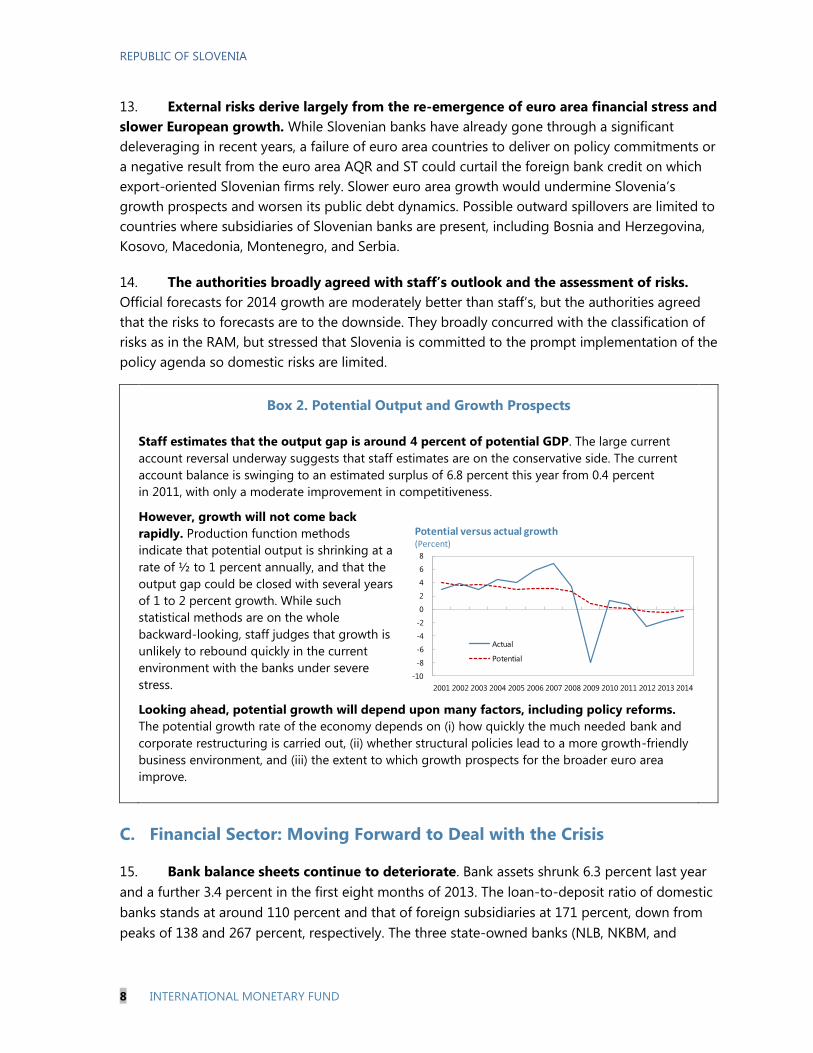
Box 2. Potential Output and Growth Prospects
Staff estimates that the output gap is around 4 percent of potential GDP. The large current
account reversal underway suggests that staff estimates are on the conservative side. The current
account balance is swinging to an estimated surplus of 6.8 percent this year from 0.4 percent
in 2011, with only a moderate improvement in competitiveness.
However, growth will not come back
rapidly. Production function methods
indicate that potential output is shrinking at a
rate of ½ to 1 percent annually, and that the
output gap could be closed with several years
of 1 to 2 percent growth. While such
statistical methods are on the whole
backward-looking, staff judges that growth is
unlikely to rebound quickly in the current
environment with the banks under severe
stress.
Looking ahead, potential growth will depend upon many factors, including policy reforms.
The potential growth rate of the economy depends on (i) how quickly the much needed bank and
corporate restructuring is carried out, (ii) whether structural policies lead to a more growth-friendly
business environment, and (iii) the extent to which growth prospects for the broader euro area
improve.
C. Financial Sector: Moving Forward to Deal with the Crisis
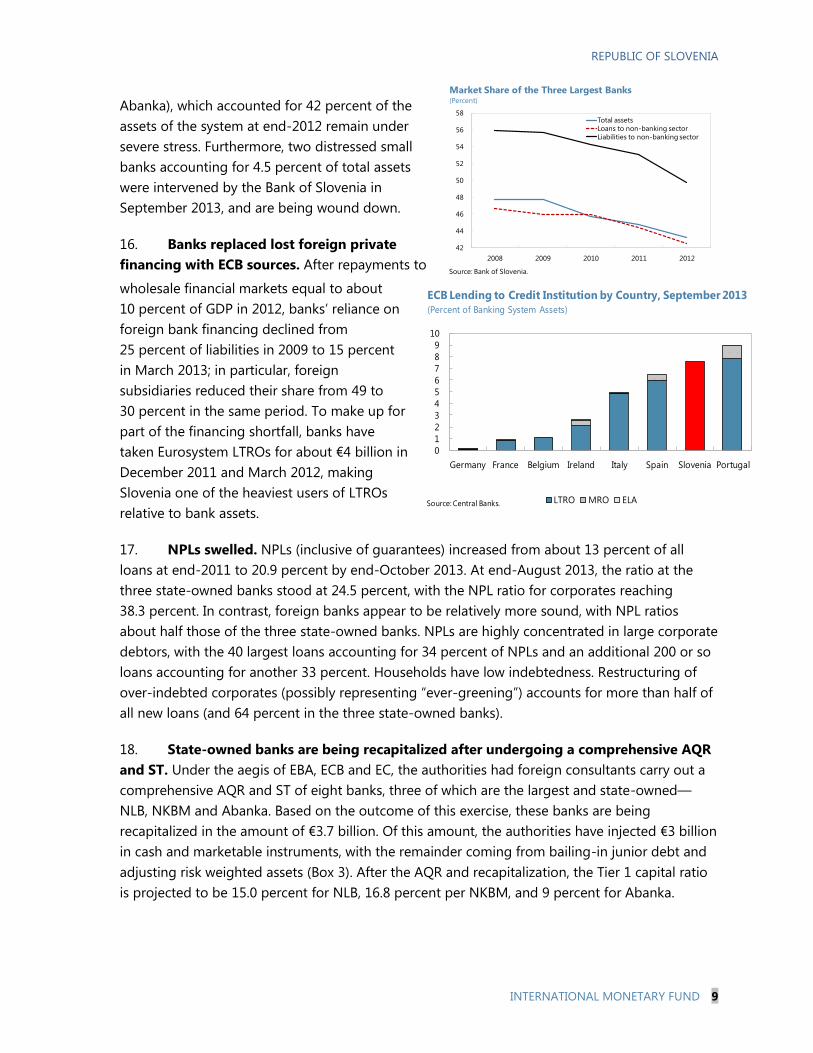
15. Bank balance sheets continue to deteriorate. Bank assets shrunk 6.3 percent last year
and a further 3.4 percent in the first eight months of 2013. The loan-to-deposit ratio of domestic
banks stands at around 110 percent and that of foreign subsidiaries at 171 percent, down from
peaks of 138 and 267 percent, respectively. The three state-owned banks (NLB, NKBM, and
REPUBLIC OF SLOVENIA
INTERNATIONAL MONETARY FUND 9
Abanka), which accounted for 42 percent of the
assets of the system at end-2012 remain under
severe stress. Furthermore, two distressed small
banks accounting for 4.5 percent of total assets
were intervened by the Bank of Slovenia in
September 2013, and are being wound down.
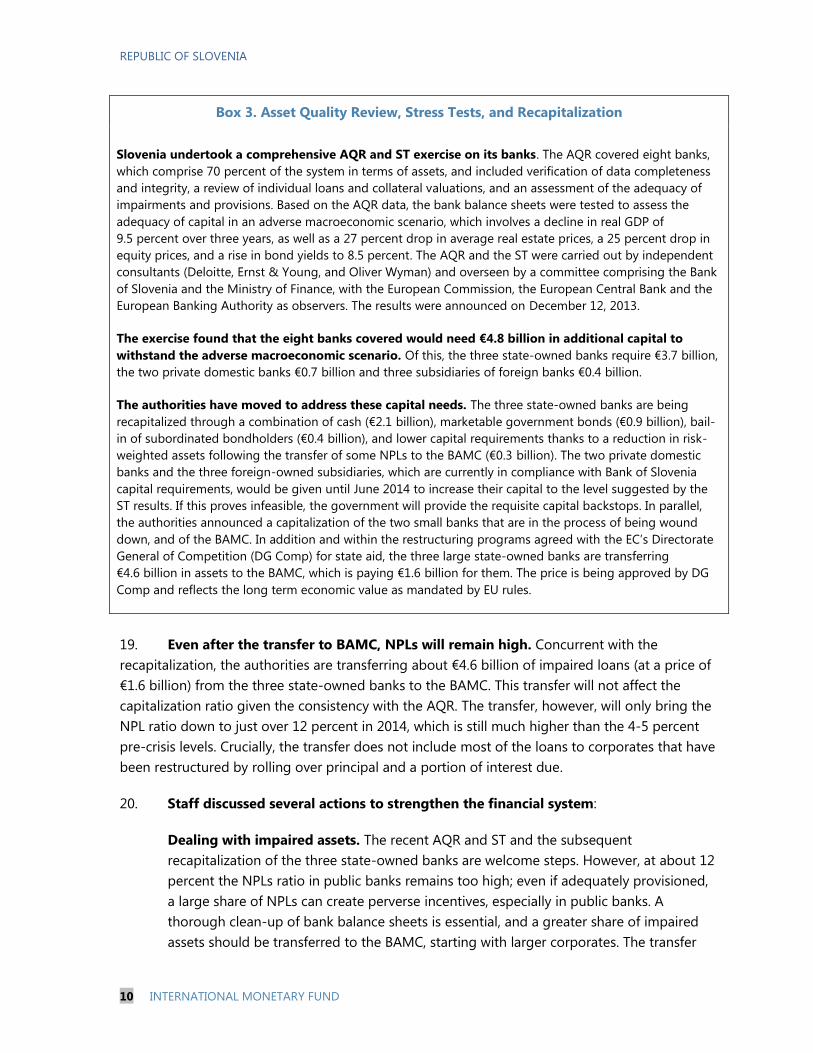
16. Banks replaced lost foreign private
financing with ECB sources. After repayments to
wholesale financial markets equal to about
10 percent of GDP in 2012, banks’ reliance on
foreign bank financing declined from
25 percent of liabilities in 2009 to 15 percent
in March 2013; in particular, foreign
subsidiaries reduced their share from 49 to
30 percent in the same period. To make up for
part of the financing shortfall, banks have
taken Eurosystem LTROs for about €4 billion in
December 2011 and March 2012, making
Slovenia one of the heaviest users of LTROs
relative to bank assets.
17. NPLs swelled. NPLs (inclusive of guarantees) increased from about 13 percent of all
loans at end-2011 to 20.9 percent by end-October 2013. At end-August 2013, the ratio at the
three state-owned banks stood at 24.5 percent, with the NPL ratio for corporates reaching
38.3 percent. In contrast, foreign banks appear to be relatively more sound, with NPL ratios
about half those of the three state-owned banks. NPLs are highly concentrated in large corporate
debtors, with the 40 largest loans accounting for 34 percent of NPLs and an additional 200 or so
loans accounting for another 33 percent. Households have low indebtedness. Restructuring of
over-indebted corporates (possibly representing “ever-greening”) accounts for more than half of
all new loans (and 64 percent in the three state-owned banks).
18. State-owned banks are being recapitalized after undergoing a comprehensive AQR
and ST. Under the aegis of EBA, ECB and EC, the authorities had foreign consultants carry out a
comprehensive AQR and ST of eight banks, three of which are the largest and state-owned—
NLB, NKBM and Abanka. Based on the outcome of this exercise, these banks are being
recapitalized in the amount of €3.7 billion. Of this amount, the authorities have injected €3 billion
in cash and marketable instruments, with the remainder coming from bailing-in junior debt and
adjusting risk weighted assets (Box 3). After the AQR and recapitalization, the Tier 1 capital ratio
is projected to be 15.0 percent for NLB, 16.8 percent per NKBM, and 9 percent for Abanka.
42
44
46
48
50
52
54
56
58
2008 2009 2010 2011 2012
Total assets
Loans to non-banking sector
Liabilities to non-banking sector
Source: Bank of Slovenia.
Market Share of the Three Largest Banks(Percent)
0
1
2
3
4
5
6
7
8
9
10
Germany France Belgium Ireland Italy Spain Slovenia Portugal
LTRO MRO ELA
ECB Lending to Credit Institution by Country, September 2013
(Percent of Banking System Assets)
Source: Central Banks.
REPUBLIC OF SLOVENIA
10 INTERNATIONAL MONETARY FUND
Box 3. Asset Quality Review, Stress Tests, and Recapitalization
Slovenia undertook a comprehensive AQR and ST exercise on its banks. The AQR covered eight banks,
which comprise 70 percent of the system in terms of assets, and included verification of data completeness
and integrity, a review of individual loans and collateral valuations, and an assessment of the adequacy of
impairments and provisions. Based on the AQR data, the bank balance sheets were tested to assess the
adequacy of capital in an adverse macroeconomic scenario, which involves a decline in real GDP of
9.5 percent over three years, as well as a 27 percent drop in average real estate prices, a 25 percent drop in
equity prices, and a rise in bond yields to 8.5 percent. The AQR and the ST were carried out by independent
consultants (Deloitte, Ernst & Young, and Oliver Wyman) and overseen by a committee comprising the Bank
of Slovenia and the Ministry of Finance, with the European Commission, the European Central Bank and the
European Banking Authority as observers. The results were announced on December 12, 2013.
The exercise found that the eight banks covered would need €4.8 billion in additional capital to
withstand the adverse macroeconomic scenario. Of this, the three state-owned banks require €3.7 billion,
the two private domestic banks €0.7 billion and three subsidiaries of foreign banks €0.4 billion.
The authorities have moved to address these capital needs. The three state-owned banks are being
recapitalized through a combination of cash (€2.1 billion), marketable government bonds (€0.9 billion), bail-
in of subordinated bondholders (€0.4 billion), and lower capital requirements thanks to a reduction in risk-
weighted assets following the transfer of some NPLs to the BAMC (€0.3 billion). The two private domestic
banks and the three foreign-owned subsidiaries, which are currently in compliance with Bank of Slovenia
capital requirements, would be given until June 2014 to increase their capital to the level suggested by the
ST results. If this proves infeasible, the government will provide the requisite capital backstops. In parallel,
the authorities announced a capitalization of the two small banks that are in the process of being wound
down, and of the BAMC. In addition and within the restructuring programs agreed with the EC’s Directorate
General of Competition (DG Comp) for state aid, the three large state-owned banks are transferring
€4.6 billion in assets to the BAMC, which is paying €1.6 billion for them. The price is being approved by DG
Comp and reflects the long term economic value as mandated by EU rules.
19. Even after the transfer to BAMC, NPLs will remain high. Concurrent with the
recapitalization, the authorities are transferring about €4.6 billion of impaired loans (at a price of
€1.6 billion) from the three state-owned banks to the BAMC. This transfer will not affect the
capitalization ratio given the consistency with the AQR. The transfer, however, will only bring the
NPL ratio down to just over 12 percent in 2014, which is still much higher than the 4-5 percent
pre-crisis levels. Crucially, the transfer does not include most of the loans to corporates that have
been restructured by rolling over principal and a portion of interest due.
20. Staff discussed several actions to strengthen the financial system:
Dealing with impaired assets. The recent AQR and ST and the subsequent
recapitalization of the three state-owned banks are welcome steps. However, at about 12
percent the NPLs ratio in public banks remains too high; even if adequately provisioned,
a large share of NPLs can create perverse incentives, especially in public banks. A
thorough clean-up of bank balance sheets is essential, and a greater share of impaired
assets should be transferred to the BAMC, starting with larger corporates. The transfer
REPUBLIC OF SLOVENIA
INTERNATIONAL MONETARY FUND 11
should be as comprehensive as possible to reduce uncertainty, restore the banks’
financial viability, and reduce their incentives for evergreening.
BAMC. The BAMC will mitigate creditor coordination problems and reduce the capital
needs in the banks by allowing a decline in their risk weighted assets (Box 4). The BAMC
can also facilitate corporate restructuring, with the goal of maximizing recovery value.
BAMC’s independence is essential to achieve these goals. The BAMC should use the cash
from asset sales to pay down its outstanding debt according to a cash protocol.
Bank governance and risk management. Governance and risk management practices
should be strengthened to address endemic connected lending and lax risk controls,
especially for state-owned banks. Strong private ownership would be helpful in curbing
political interference.
Bank resolution. The authorities’ approach to the recent liquidation of two small banks
has highlighted shortcomings of the resolution framework. The authorities bailed out all
creditors (except junior debt), including fiduciary accounts and liabilities that might
belong to non-performing debtors. The fiscal burden will turn out to be higher because
impaired assets and liabilities are not being netted out by client. While the authorities
acted to safeguard financial stability, a concern which staff shares, the approach is
problematic in terms of incentives and costs to the state. The authorities issued
guarantees of about 3 percent of GDP, and estimate net resolution costs at about
1¼ percent of GDP for these two small banks accounting for 4.5 percent of the system.
Future resolutions should aim at bailing-out only insured deposits and should net out
assets and liabilities by client.
Bank consolidation. Bank consolidation will likely be an important element in the
authorities’ resolution toolkit. Mergers should be private-sector driven but not leave
banks with unqualified owners unable to keep banks well-capitalized in the face of
ongoing asset quality deterioration.
The authorities have made good progress in implementing other FSAP
recommendations, especially in expanding the toolkit to safeguard financial stability,
guard banks’ investments and investments in banks, qualify bank officials and protect
bank supervisors (Box 5).
REPUBLIC OF SLOVENIA
12 INTERNATIONAL MONETARY FUND
Box 4. The BAMC
In late 2012, the authorities created the BAMC as a public agency, which is subject to oversight by the
Court of Audit (supreme audit institution) and the parliament. The BAMC is governed by a board where
the majority consists of well-known foreign experts; its purchases and business plans are approved by the
Slovenian government.
By statute, the BAMC can issue up to €4 billion of government-guaranteed bonds (about 11 percent
of GDP) to acquire bank impaired assets, restructure corporates or recapitalize banks. With prior
authorization by the EC, the BAMC is buying from the three major state-owned banks about €4.6 billion
of impaired assets; these assets are regarded as "non-core" and include mostly bankrupt financial holding
and construction sector companies. The BAMC is paying only €1.6 billion for these impaired assets; the
acquisition price follows the EC's State Aid Guidelines of the “real long-term value” and is cleared by the
EC's DG Comp.
The BAMC has the legal instruments and the power to seek a quick resolution of impaired assets,
be it by restructuring the corporate (when it holds more than 50 percent of the credits) or by liquidating it
and selling its collateral and assets. Bankruptcy procedures where the BAMC is involved are to be
concluded within six months. The BAMC has the option of acquiring credits of impaired creditors from
other banks to facilitate corporate restructuring, but has to purchase those credits at market prices to
avoid providing state aid.
A second wave of transfers is possible. The authorities may evaluate with EC's DG COMP whether a
second wave of impaired assets transfer is warranted to ease the burden on the three state-owned banks,
and will proceed accordingly. The BAMC is to be wound down after five years, with the remaining assets
to be transferred to the Slovenia Sovereign Holding (SSH) company.
Measures are being taken to ensure a strong financial position of the BAMC. While public debt
increases when the BAMC’s bonds are issued, this debt should be partially repaid with the proceeds from
the liquidation of assets, including the privatization of corporations that end up in the BAMC’s portfolio.
The Anticorruption Commission and the authorities are defining processes and operational principles that
are highly transparent, while preserving the operational independence and confidentiality of the agency;
these principles should be in place by the time of the first transfers. The authorities have also increased
the capital of the BAMC by €200 million, which satisfies the entity’s cash flow needs while limiting the
burden on the government's cash position.
The authorities would like to extend the life of BAMC to ten years or more. While the details are not
clear, two additional changes include allowing private investment in the capital of the BAMC, and relaxing
the BAMC's obligation to sell at least 10 percent of its holdings every year. Although private investors
have indicated interest in buying blocks of assets, the authorities regard the 10 percent rule as a fire-sale
rule that fails to maximize the value for Slovenian taxpayers.
REPUBLIC OF SLOVENIA
INTERNATIONAL MONETARY FUND 13
21. The authorities broadly concurred with the staff’s recommendations and said that
they will assess the need for additional transfers once the first round is complete.
Authorities stressed they are recapitalizing the banks as per the recommendations of the AQR
and ST exercise, and are transferring some impaired assets to BAMC in line with the restructuring
plans agreed with the EC. They also noted that governance in the banks will be addressed also
via privatization. Staff reiterated that recapitalization is a first step to restructure financial and
corporate sectors, and warned against complacency after a successful recapitalization.
D. Corporate Sector
22. An overleveraged corporate sector is thwarting economic recovery. Slovenian
corporates are among the most highly leveraged in the euro area, mainly because of a lack of
equity: the corporate debt to GDP ratio is about the euro area average. This is a legacy of the
boom years, when bank financing was plentiful, enabling companies to expand beyond their core
areas, engage in acquisitions, and invest heavily in risky projects without putting up their own
money. The sudden stop in capital flows and the ensuing recession stopped credit availability,
weakened cash flows, and exposed significant weaknesses in corporate management and
governance. The average interest bill to earnings ratio has reached 90 percent, pushing into the
Box 5. FSAP Follow-Up
The authorities are making progress in implementing the recommendations of the 2012 FSAP,
including through an AQR and ST that will lead to recapitalization of some banks.
In late 2012 the authorities revamped the Bank of Slovenia's (BoS) legislative framework (Banking
Law, approved by Parliament in November), introducing the following main changes:
Financial system stability: BoS now has powers over extraordinary receivership, sale of all of a
bank’s shares, mandating and carrying out increases in share capital, and transfers of the total or
a partial share of a bank’s assets and liabilities.
Investments in banks: BoS must give its prior consent to any purchase of a qualifying holding in a
bank, and BoS to be notified of any significant changes in ownership that could influence the
assessment of the appropriateness of a qualifying holder. Violators (banks and individuals) are
subject to repeated fines. This injuction also covers investments by Slovenian banks in financial
sector entities in other EU Member States and third countries.
Oversight of bank investments: BoS now has the legal power to request from corporations in
which a bank acquires a qualifying holding a report outlining risks incurred by the bank.
Qualification of bank officials and limits to bank decisions: BoS may disqualify a person from
holding office as a member of a supervisory board, if they have breached their obligations as a
member of a supervisory board.
Protection of bank supervisors: BoS supervisors are now protected from civil and criminal law
suits, provided their actions were lawful and conducted with expert diligence.
In the future, regulations will follow the Basel internal ratings based (IRB) approach definition of default to
assess impairments and provisioning.
REPUBLIC OF SLOVENIA
14 INTERNATIONAL MONETARY FUND
10
12
14
16
18
20
22
2006 2007 2008 2009 2010 2011 2012
1/ Unsustainable debt is defined as earnings before interest and taxes below the interest expense.Source: Bank of Slovenia.
Share of Employment in Firms with Unsustainable Debt 1/
(Percent)
red companies that might be viable with lower debt. Credit availability and pricing has worsened
as banks deleverage (Box 6).
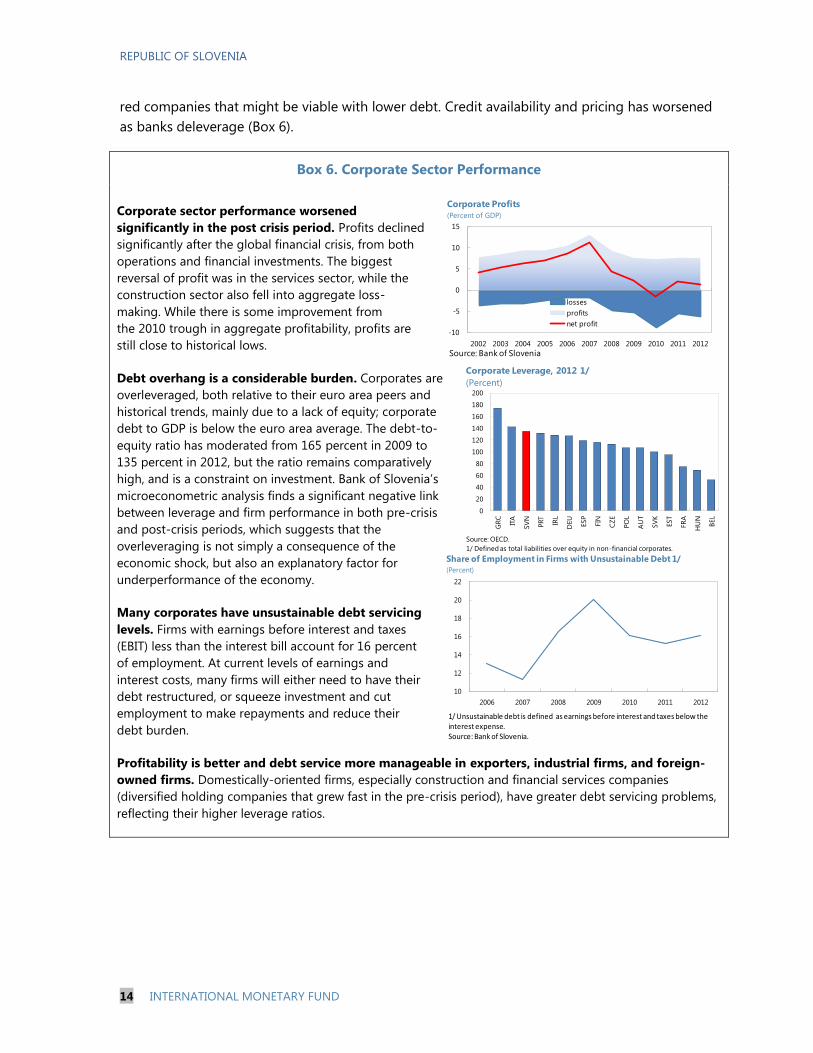
Box 6. Corporate Sector Performance
Corporate sector performance worsened
significantly in the post crisis period. Profits declined
significantly after the global financial crisis, from both
operations and financial investments. The biggest
reversal of profit was in the services sector, while the
construction sector also fell into aggregate loss-
making. While there is some improvement from
the 2010 trough in aggregate profitability, profits are
still close to historical lows.
Debt overhang is a considerable burden. Corporates are
overleveraged, both relative to their euro area peers and
historical trends, mainly due to a lack of equity; corporate
debt to GDP is below the euro area average. The debt-to-
equity ratio has moderated from 165 percent in 2009 to
135 percent in 2012, but the ratio remains comparatively
high, and is a constraint on investment. Bank of Slovenia’s
microeconometric analysis finds a significant negative link
between leverage and firm performance in both pre-crisis
and post-crisis periods, which suggests that the
overleveraging is not simply a consequence of the
economic shock, but also an explanatory factor for
underperformance of the economy.
Many corporates have unsustainable debt servicing
levels. Firms with earnings before interest and taxes
(EBIT) less than the interest bill account for 16 percent
of employment. At current levels of earnings and
interest costs, many firms will either need to have their
debt restructured, or squeeze investment and cut
employment to make repayments and reduce their
debt burden.
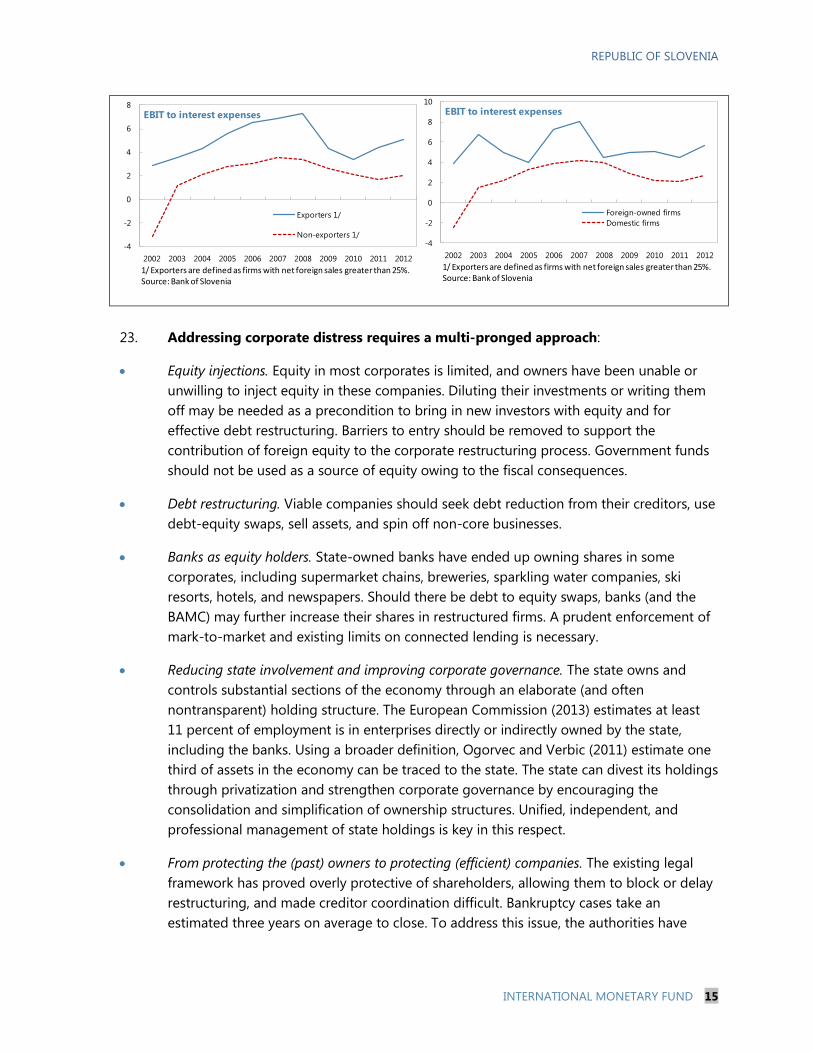
Profitability is better and debt service more manageable in exporters, industrial firms, and foreign-
owned firms. Domestically-oriented firms, especially construction and financial services companies
(diversified holding companies that grew fast in the pre-crisis period), have greater debt servicing problems,
reflecting their higher leverage ratios.
-10
-5
0
5
10
15
2002 2003 2004 2005 2006 2007 2008 2009 2010 2011 2012
losses
profits
net profit
Source: Bank of Slovenia
Corporate Profits
(Percent of GDP)
0
20
40
60
80
100
120
140
160
180
200
GR
C
ITA
SV
N
PRT
IRL
DEU
ESP
FIN
CZ
E
PO
L
AU
T
SV
K
EST
FR
A
HU
N
BEL
Corporate Leverage, 2012 1/
(Percent)
Source: OECD.
1/ Defined as total liabilities over equity in non-financial corporates.
REPUBLIC OF SLOVENIA
INTERNATIONAL MONETARY FUND 15
23. Addressing corporate distress requires a multi-pronged approach:
Equity injections. Equity in most corporates is limited, and owners have been unable or
unwilling to inject equity in these companies. Diluting their investments or writing them
off may be needed as a precondition to bring in new investors with equity and for
effective debt restructuring. Barriers to entry should be removed to support the
contribution of foreign equity to the corporate restructuring process. Government funds
should not be used as a source of equity owing to the fiscal consequences.
Debt restructuring. Viable companies should seek debt reduction from their creditors, use
debt-equity swaps, sell assets, and spin off non-core businesses.
Banks as equity holders. State-owned banks have ended up owning shares in some
corporates, including supermarket chains, breweries, sparkling water companies, ski
resorts, hotels, and newspapers. Should there be debt to equity swaps, banks (and the
BAMC) may further increase their shares in restructured firms. A prudent enforcement of
mark-to-market and existing limits on connected lending is necessary.
Reducing state involvement and improving corporate governance. The state owns and
controls substantial sections of the economy through an elaborate (and often
nontransparent) holding structure. The European Commission (2013) estimates at least
11 percent of employment is in enterprises directly or indirectly owned by the state,
including the banks. Using a broader definition, Ogorvec and Verbic (2011) estimate one
third of assets in the economy can be traced to the state. The state can divest its holdings
through privatization and strengthen corporate governance by encouraging the
consolidation and simplification of ownership structures. Unified, independent, and
professional management of state holdings is key in this respect.
From protecting the (past) owners to protecting (efficient) companies. The existing legal
framework has proved overly protective of shareholders, allowing them to block or delay
restructuring, and made creditor coordination difficult. Bankruptcy cases take an
estimated three years on average to close. To address this issue, the authorities have
-4
-2
0
2
4
6
8
2002 2003 2004 2005 2006 2007 2008 2009 2010 2011 2012
EBIT to interest expenses
Exporters 1/
Non-exporters 1/
1/ Exporters are defined as firms with net foreign sales greater than 25%.Source: Bank of Slovenia
-4
-2
0
2
4
6
8
10
2002 2003 2004 2005 2006 2007 2008 2009 2010 2011 2012
EBIT to interest expenses
Foreign-owned firms
Domestic firms
1/ Exporters are defined as firms with net foreign sales greater than 25%.Source: Bank of Slovenia
REPUBLIC OF SLOVENIA
16 INTERNATIONAL MONETARY FUND
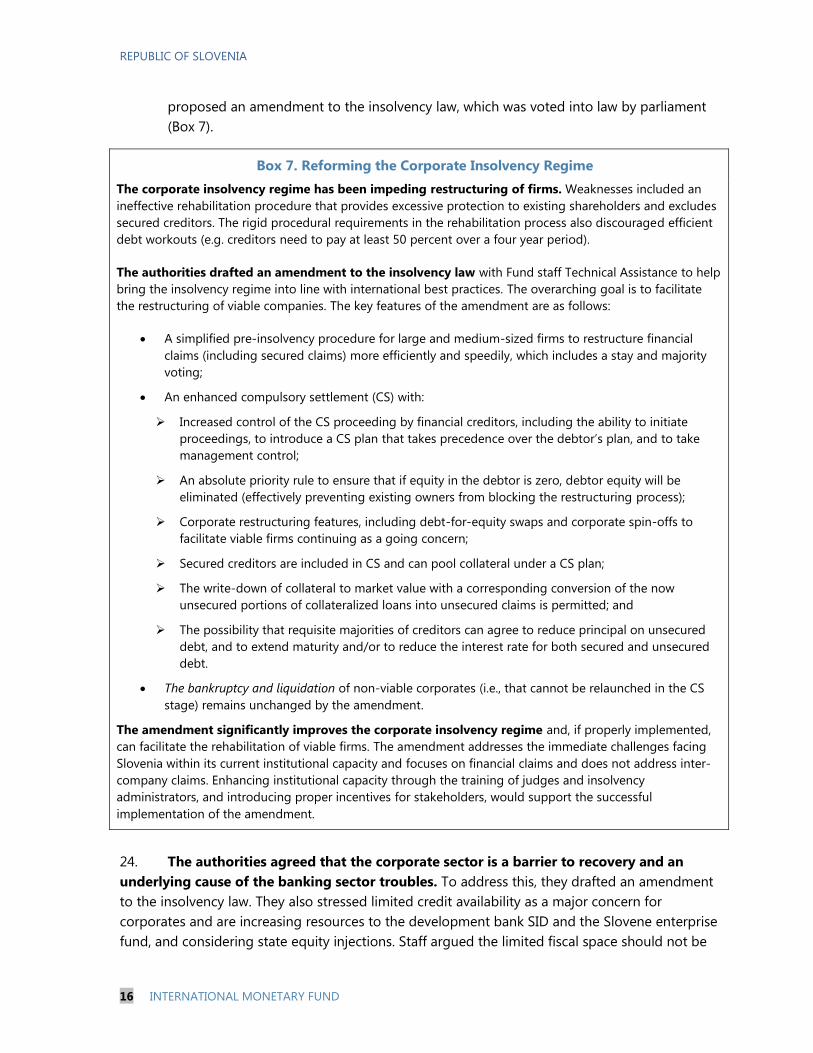
proposed an amendment to the insolvency law, which was voted into law by parliament
(Box 7).
Box 7. Reforming the Corporate Insolvency Regime
The corporate insolvency regime has been impeding restructuring of firms. Weaknesses included an
ineffective rehabilitation procedure that provides excessive protection to existing shareholders and excludes
secured creditors. The rigid procedural requirements in the rehabilitation process also discouraged efficient
debt workouts (e.g. creditors need to pay at least 50 percent over a four year period).
The authorities drafted an amendment to the insolvency law with Fund staff Technical Assistance to help
bring the insolvency regime into line with international best practices. The overarching goal is to facilitate
the restructuring of viable companies. The key features of the amendment are as follows:
A simplified pre-insolvency procedure for large and medium-sized firms to restructure financial
claims (including secured claims) more efficiently and speedily, which includes a stay and majority
voting;
An enhanced compulsory settlement (CS) with:
Increased control of the CS proceeding by financial creditors, including the ability to initiate
proceedings, to introduce a CS plan that takes precedence over the debtor’s plan, and to take
management control;
An absolute priority rule to ensure that if equity in the debtor is zero, debtor equity will be
eliminated (effectively preventing existing owners from blocking the restructuring process);
Corporate restructuring features, including debt-for-equity swaps and corporate spin-offs to
facilitate viable firms continuing as a going concern;
Secured creditors are included in CS and can pool collateral under a CS plan;
The write-down of collateral to market value with a corresponding conversion of the now
unsecured portions of collateralized loans into unsecured claims is permitted; and
The possibility that requisite majorities of creditors can agree to reduce principal on unsecured
debt, and to extend maturity and/or to reduce the interest rate for both secured and unsecured
debt.
The bankruptcy and liquidation of non-viable corporates (i.e., that cannot be relaunched in the CS
stage) remains unchanged by the amendment.
The amendment significantly improves the corporate insolvency regime and, if properly implemented,
can facilitate the rehabilitation of viable firms. The amendment addresses the immediate challenges facing
Slovenia within its current institutional capacity and focuses on financial claims and does not address inter-
company claims. Enhancing institutional capacity through the training of judges and insolvency
administrators, and introducing proper incentives for stakeholders, would support the successful
implementation of the amendment.
24. The authorities agreed that the corporate sector is a barrier to recovery and an
underlying cause of the banking sector troubles. To address this, they drafted an amendment
to the insolvency law. They also stressed limited credit availability as a major concern for
corporates and are increasing resources to the development bank SID and the Slovene enterprise
fund, and considering state equity injections. Staff argued the limited fiscal space should not be
REPUBLIC OF SLOVENIA
INTERNATIONAL MONETARY FUND 17
used for shoring up corporations and urged reconsidering a planned transfer to SID of seed
money for lending programs. In staff’s view, only a decisive retrenchment of the state from the
financial and corporate sector will bring a lasting solution.
E. Fiscal Policy
25. Despite the deep recession, the authorities achieved major fiscal consolidation
during 2011–12. Staff estimates an improvement in the structural primary balance of some
3 percent of GDP during this period. The adjustment was broadly balanced between revenue
increases and expenditure reductions, the latter including wage cuts and sharp reductions in
public investment.
26. The authorities target a general government deficit below 3 percent of GDP
by 2015 and a balanced budget in structural terms by 2017. This is consistent with the recent
two-year extension of the corresponding deadline under the Excessive Deficit Procedure (EDP).
In line with these objectives, the original 2013 budget aimed at expenditure-based
consolidation, supported by cuts in public wages and public consumption. In the event,
the budget had to be revisited in mid-2013, owing to slippages in first-quarter indirect
tax collections (later reversed), higher-than-budgeted increases in the interest bill and,
especially, large shortfalls in corporate income tax collections.
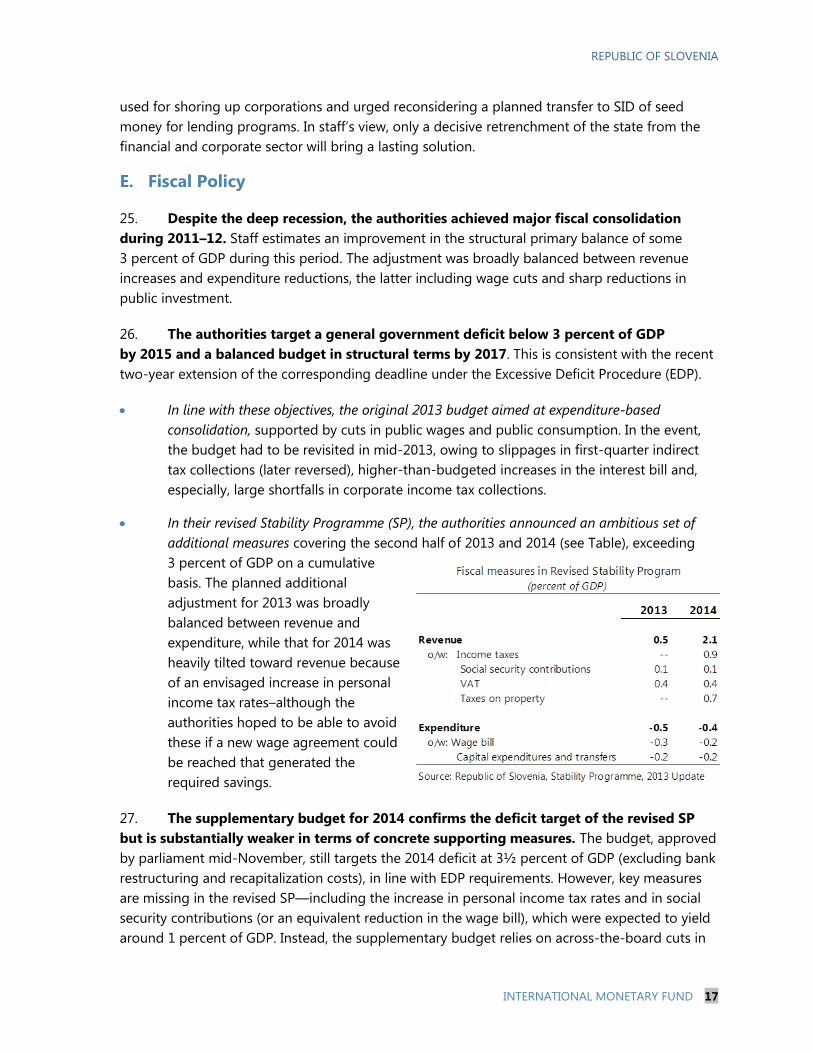
In their revised Stability Programme (SP), the authorities announced an ambitious set of
additional measures covering the second half of 2013 and 2014 (see Table), exceeding
3 percent of GDP on a cumulative
basis. The planned additional
adjustment for 2013 was broadly
balanced between revenue and
expenditure, while that for 2014 was
heavily tilted toward revenue because
of an envisaged increase in personal
income tax rates–although the
authorities hoped to be able to avoid
these if a new wage agreement could
be reached that generated the
required savings.
27. The supplementary budget for 2014 confirms the deficit target of the revised SP
but is substantially weaker in terms of concrete supporting measures. The budget, approved
by parliament mid-November, still targets the 2014 deficit at 3½ percent of GDP (excluding bank
restructuring and recapitalization costs), in line with EDP requirements. However, key measures
are missing in the revised SP—including the increase in personal income tax rates and in social
security contributions (or an equivalent reduction in the wage bill), which were expected to yield
around 1 percent of GDP. Instead, the supplementary budget relies on across-the-board cuts in
REPUBLIC OF SLOVENIA
18 INTERNATIONAL MONETARY FUND
the expenditure on goods and services by line ministries (11 percent year-on-year)—which are
not supported by reforms—and in subsidies (12 percent year-on-year), without specifying which
subsidies are to be reduced. On the revenue side, the authorities adopted a broad-based
property tax increase expected to yield about ¾ percent of GDP, while also counting on
uncertain revenue gains from stronger tax collection enforcement (¼ percent of GDP), including
tighter limits on cash transactions, stronger reporting requirements on offshore holdings, and
enhanced cross-checking of income declarations against household assets.
28. Staff expressed concern about the quality of fiscal measures underpinning the
budget and called for additional measures. While endorsing the property tax increase, staff
was skeptical about the across-the-board expenditure cuts and large revenue yields from
administrative improvements. In addition, domestic courts have mandated restitutions against a
partial retroactive wage freeze imposed in early 2012 and European Courts have mandated
payments of certain social benefits to residents of Slovenia who had not obtained Slovenian
citizenship in 1991—neither of these payments are accounted for in the budget. These one-off
items could increase the 2014 deficit by an additional 0.2 percent of GDP, and possibly more if
they are relatively frontloaded. In sum, staff estimates an overall shortfall relative to the
authorities’ target of some 1 percent of GDP. As the bulk of concrete measures already taken
related to the revenue side of the budget, there was a compelling case to focus the needed
corrective measures on expenditure: staff recommended more ambitious public employment
reduction, better targeting of social transfers, and specific cuts in transfers and subsidies.
29. The authorities recognized the risks, but pointed out that any shortfall could be
made up during the year. They argued that expenditure controls have improved considerably,
rendering across-the board cuts more effective than in the past; yet they acknowledged that cuts
of the magnitude budgeted entailed considerable risk. Furthermore, they thought that recent tax
administration reforms constituted substantial improvements and viewed the expected revenue
gains as moderate, but agreed that there were some risks. Overall, they thought that the fiscal
risks could be addressed in the course of the year. Staff cautioned that significant delays in
adopting offsetting measures would narrow available options, with public investment once again
the most likely victim.
30. Over the medium term and with unchanged policies, public debt will continue to
increase rapidly. The recent rising trend in the debt ratio is set to continue in the near term, as
the effects of persistent recession are compounded by the fiscal cost of bank restructuring,
bringing the projected debt ratio to a little under 80 percent of GDP by end-2014. Thereafter, the
debt ratio would reach some 85 percent over the medium term. The public debt sustainability
analysis (DSA) confirms that public debt has entered knife-edge territory, with sensitivity analysis
pointing to the risk of explosive debt dynamics under plausible shocks.
31. Further gradual fiscal adjustment is needed to restore debt sustainability. To reverse
the adverse debt dynamics and contain fiscal risks, fiscal consolidation would need to continue
over the medium term, but the needed adjustment would be moderate. An improvement in the
structural primary balance of ¾ percent of GDP per year during 2015–16 to a primary surplus of
REPUBLIC OF SLOVENIA
INTERNATIONAL MONETARY FUND 19
some 3½ percent of GDP over the medium term should put the debt ratio on a steady downward path after 2015. These estimates assume that the fiscal costs of bank recapitalization remain at the level indicated by the AQR; should additional recapitalization prove necessary, faster adjustment would be called for. Maintaining this primary surplus over time would require continued consolidation efforts, however, since a rising interest bill, a reversal of the recent sharp cuts in public investment, and mounting pension expenditures imply a substantial underlying deterioration that would have to be offset by further spending cuts or revenue increases. Staff argued that measures to contain the wage bill and reform social benefits, and a broadening of the corporate income tax base, would be useful to get the debt dynamics under control. In addition, further difficult but critical reforms are necessary to contain the rising costs of the pension system in the medium term (Box 8). The authorities broadly agreed on the needed pace of consolidation, but noted that it may have to be reassessed in the context of bank and corporate restructuring. They noted that another round of pension reform was under preparation, and could be implemented after the 2014–15 suspension of pension indexation expires.
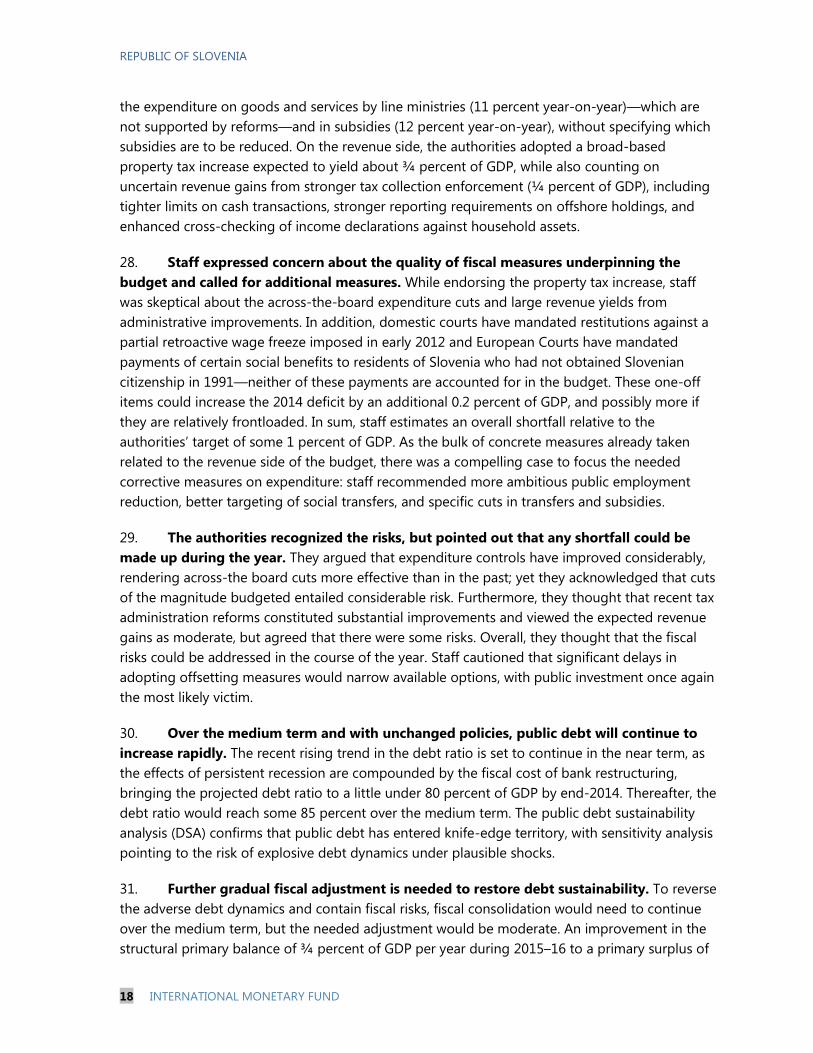
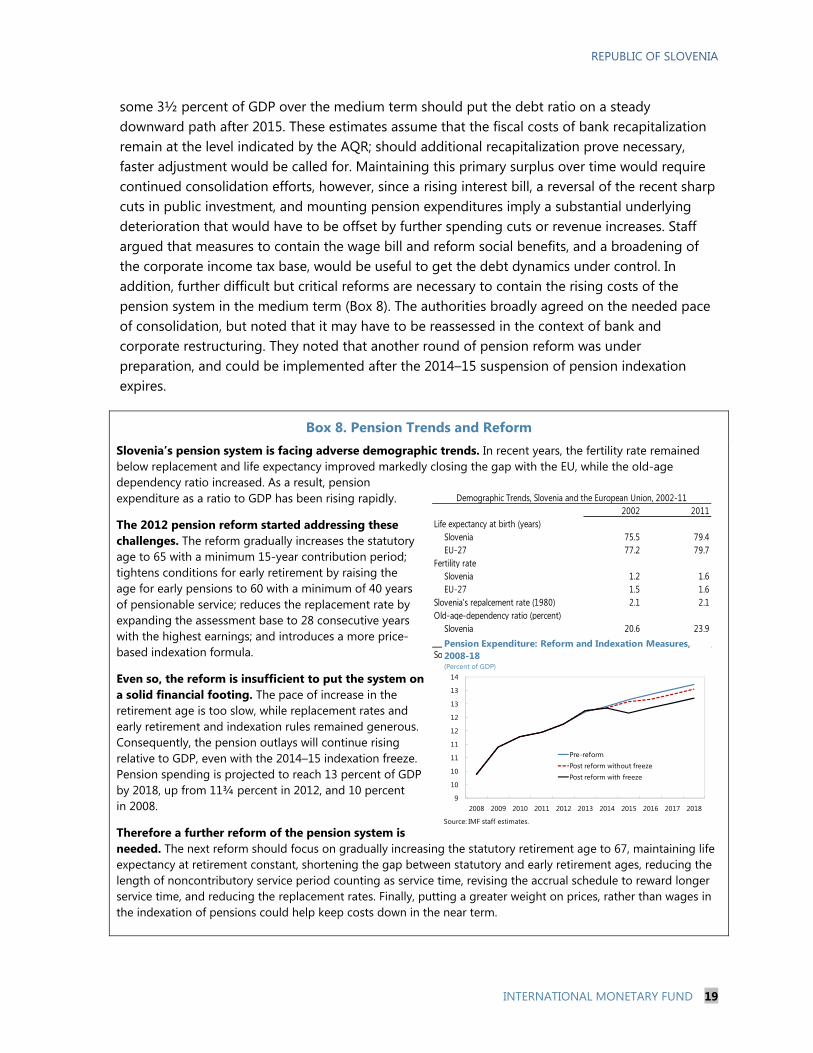
Box 8. Pension Trends and Reform Slovenia’s pension system is facing adverse demographic trends. In recent years, the fertility rate remained below replacement and life expectancy improved markedly closing the gap with the EU, while the old-age dependency ratio increased. As a result, pension expenditure as a ratio to GDP has been rising rapidly.
The 2012 pension reform started addressing these challenges. The reform gradually increases the statutory age to 65 with a minimum 15-year contribution period; tightens conditions for early retirement by raising the age for early pensions to 60 with a minimum of 40 years of pensionable service; reduces the replacement rate by expanding the assessment base to 28 consecutive years with the highest earnings; and introduces a more price-based indexation formula.
Even so, the reform is insufficient to put the system on a solid financial footing. The pace of increase in the retirement age is too slow, while replacement rates and early retirement and indexation rules remained generous. Consequently, the pension outlays will continue rising relative to GDP, even with the 2014–15 indexation freeze. Pension spending is projected to reach 13 percent of GDP by 2018, up from 11¾ percent in 2012, and 10 percent in 2008.
Therefore a further reform of the pension system is needed. The next reform should focus on gradually increasing the statutory retirement age to 67, maintaining life expectancy at retirement constant, shortening the gap between statutory and early retirement ages, reducing the length of noncontributory service period counting as service time, revising the accrual schedule to reward longer service time, and reducing the replacement rates. Finally, putting a greater weight on prices, rather than wages in the indexation of pensions could help keep costs down in the near term.
2002 2011Life expectancy at birth (years)
Slovenia 75.5 79.4EU-27 77.2 79.7
Fertility rateSlovenia 1.2 1.6EU-27 1.5 1.6
Slovenia's repalcement rate (1980) 2.1 2.1Old-age-dependency ratio (percent)
Slovenia 20.6 23.9EU-27 23.8 26.2
Source: Eurostat.
Demographic Trends, Slovenia and the European Union, 2002-11
9
10
10
11
11
12
12
13
13
14
2008 2009 2010 2011 2012 2013 2014 2015 2016 2017 2018
Pre-reformPost reform without freezePost reform with freeze
Pension Expenditure: Reform and Indexation Measures, 2008-18(Percent of GDP)
Source: IMF staff estimates.
REPUBLIC OF SLOVENIA
20 INTERNATIONAL MONETARY FUND
F. Structural Issues
32. Financial imbalances and structural weaknesses thwart medium-term growth. As noted above, undercapitalized banks and excess leverage in the corporate sector mean firms are unable to obtain new credit or equity to invest and expand employment. Shortcomings in corporate governance, pervasive state involvement, labor market rigidities, and weaknesses in the insolvency regime all impede the corporate restructuring needed to unleash Slovenia’s growth potential.
33. Competitiveness has improved in sectors exposed to foreign competition. This has contributed to the swing in the current account from a large deficit pre-crisis to a projected surplus of almost 7 percent of GDP in 2013: while compressed domestic demand has limited imports, exports have also benefited from improving competitiveness and increased foreign demand. This surplus will narrow over the medium term as domestic demand recovers but should remain positive on the back of steady growth in exports. Slovenia has a segment of strong, export-oriented firms that have been less affected by the broader corporate distress (Box 6). Unit labor costs have fallen to a greater extent in this segment than in the rest of the economy, where firms have boosted productivity but largely by shedding labor (Box 8). Labor shedding will play a role in improving competitiveness and in corporate restructuring but if growth rebounds and credit constraints ease, gains can come increasingly from employment-creating corporate investment.
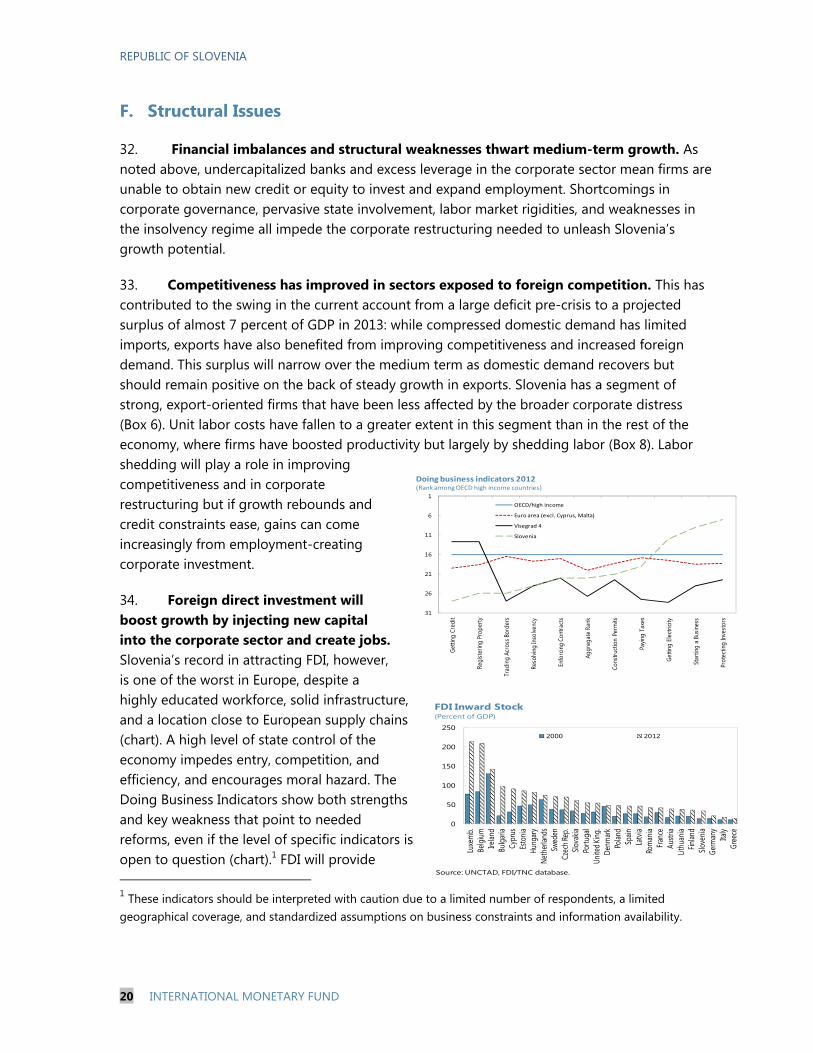
34. Foreign direct investment will boost growth by injecting new capital into the corporate sector and create jobs. Slovenia’s record in attracting FDI, however, is one of the worst in Europe, despite a highly educated workforce, solid infrastructure, and a location close to European supply chains (chart). A high level of state control of the economy impedes entry, competition, and efficiency, and encourages moral hazard. The Doing Business Indicators show both strengths and key weakness that point to needed reforms, even if the level of specific indicators is open to question (chart).1 FDI will provide 1 These indicators should be interpreted with caution due to a limited number of respondents, a limited geographical coverage, and standardized assumptions on business constraints and information availability.
0
50
100
150
200
250
Luxe
mb.
Belg
iumIre
land
Bulga
riaCy
prus
Esto
niaHu
ngar
yNe
ther
lands
Swed
enCz
ech R
ep.
Slova
kiaPo
rtuga
lUn
ited K
ing.
Denm
ark
Polan
dSp
ainLa
tvia
Rom
ania
Franc
eAu
stria
Lithu
ania
Finlan
dSlo
veni
aGe
rman
yIta
lyGr
eece
2000 2012
Source: UNCTAD, FDI/TNC database.
FDI Inward Stock(Percent of GDP)
1
6
11
16
21
26
31
Getti
ng C
redi
t
Regi
ster
ing
Prop
erty
Trad
ing
Acro
ss B
orde
rs
Reso
lving
Inso
lvenc
y
Enfo
rcin
g Co
ntra
cts
Aggr
egat
e Ra
nk
Cons
truct
ion
Perm
its
Payin
g Ta
xes
Getti
ng E
lect
ricity
Star
ting
a Bu
sines
s
Prot
ectin
g In
vest
ors
OECD/high income
Euro area (excl. Cyprus, Malta)
Visegrad 4
Slovenia
Doing business indicators 2012(Rank among OECD high income countries)
REPUBLIC OF SLOVENIA
INTERNATIONAL MONETARY FUND 21
much-needed equity capital and help create jobs for the young. Slovenian companies are poorly capitalized and attracting foreign capital is key to help solving this problem. Moreover, FDI—which tends to employ young educated workers—will also create jobs for the youth, which suffered disproportionally during the crisis.
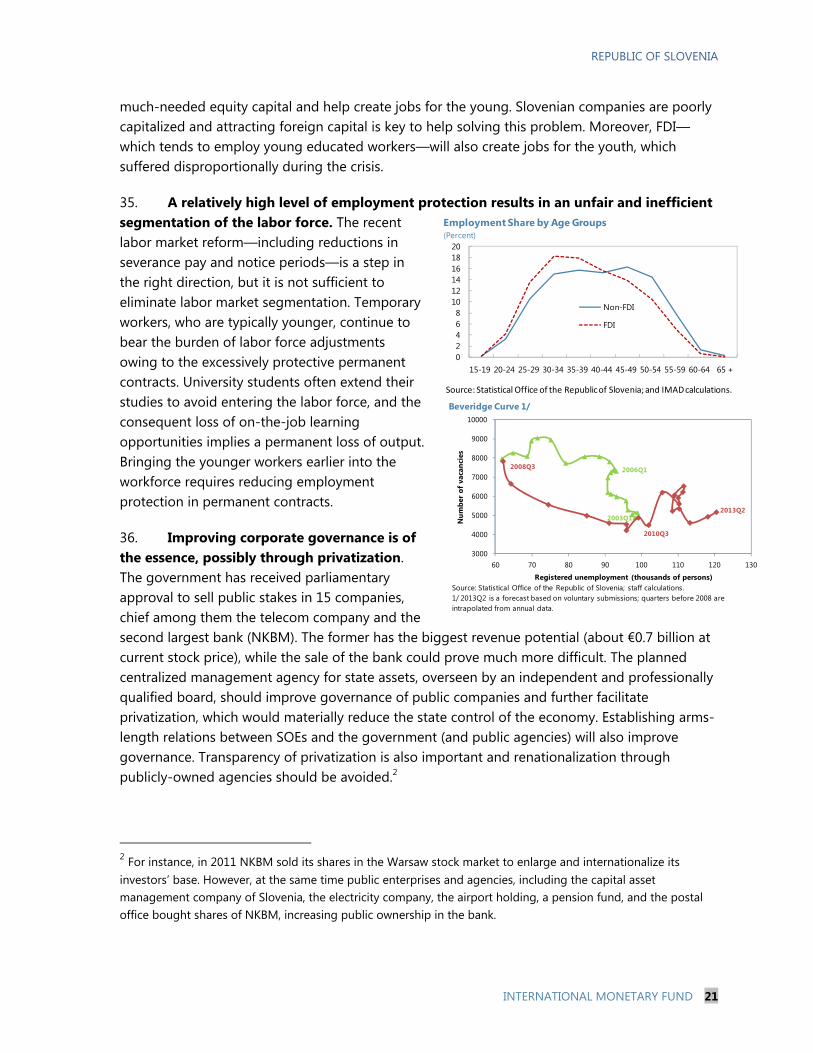
35. A relatively high level of employment protection results in an unfair and inefficient segmentation of the labor force. The recent labor market reform—including reductions in severance pay and notice periods—is a step in the right direction, but it is not sufficient to eliminate labor market segmentation. Temporary workers, who are typically younger, continue to bear the burden of labor force adjustments owing to the excessively protective permanent contracts. University students often extend their studies to avoid entering the labor force, and the consequent loss of on-the-job learning opportunities implies a permanent loss of output. Bringing the younger workers earlier into the workforce requires reducing employment protection in permanent contracts.
36. Improving corporate governance is of the essence, possibly through privatization. The government has received parliamentary approval to sell public stakes in 15 companies, chief among them the telecom company and the second largest bank (NKBM). The former has the biggest revenue potential (about €0.7 billion at current stock price), while the sale of the bank could prove much more difficult. The planned centralized management agency for state assets, overseen by an independent and professionally qualified board, should improve governance of public companies and further facilitate privatization, which would materially reduce the state control of the economy. Establishing arms-length relations between SOEs and the government (and public agencies) will also improve governance. Transparency of privatization is also important and renationalization through publicly-owned agencies should be avoided.2
2 For instance, in 2011 NKBM sold its shares in the Warsaw stock market to enlarge and internationalize its investors’ base. However, at the same time public enterprises and agencies, including the capital asset management company of Slovenia, the electricity company, the airport holding, a pension fund, and the postal office bought shares of NKBM, increasing public ownership in the bank.
02468
101214161820
15-19 20-24 25-29 30-34 35-39 40-44 45-49 50-54 55-59 60-64 65 +
Non-FDI
FDI
Source: Statistical Office of the Republic of Slovenia; and IMAD calculations.
Employment Share by Age Groups(Percent)
3000
4000
5000
6000
7000
8000
9000
10000
60 70 80 90 100 110 120 130
Num
ber
of v
acan
cies
Registered unemployment (thousands of persons)Source: Statistical Office of the Republic of Slovenia; staff calculations.1/ 2013Q2 is a forecast based on voluntary submissions; quarters before 2008 are intrapolated from annual data.
2013Q2
2008Q3
2010Q3
2006Q1
2003Q1
Beveridge Curve 1/
REPUBLIC OF SLOVENIA
22 INTERNATIONAL MONETARY FUND
STAFF APPRAISAL 37. The AQR and ST together with the prompt bank recapitalization are key milestones along the path toward stability and growth. The comprehensive and independent AQR and ST were crucial to remove the uncertainty about the strength of the banking system and restore confidence. The prompt bank recapitalization will reduce short-term deleveraging pressures in the banking system.
38. Bank recapitalization, however, is not sufficient to lay the groundwork for a resumption of growth. Only restructuring the corporate and financial sectors and reducing the role of the state in the economy can restore durable growth. Without these reforms, recapitalizing banks will be only an expensive stop-gap solution, as loss-making corporations will generate new NPLs that erode rebuilt bank buffers, and evergeened loans absorb credit growth.
39. The BAMC is expected to facilitate bank and corporate restructuring. A swift transfer of impaired assets to the BAMC, at prices that reflect realistic recovery values, will support corporate restructuring. The BAMC has the tools to achieve a quick resolution of impaired assets. A timely disposal of restructured assets and a strong cash protocol should ensure that bonds issued by the BAMC are quickly repaid. However, the effectiveness of the BAMC as a restructuring tool hinges on ensuring its operational independence and clear accountability, as well as transferring most NPLs and evergreened loans from the banks’ balance sheets.
40. Bank governance and risk management should be strengthened to address endemic connected lending and lax risk controls. The role of the state in the financial system should be drastically reduced through privatization and independent management. Bank consolidation should be driven by private market considerations favoring strong and qualified candidates.
41. Bankers should focus on banking. State-owned banks have ended up owning shares in several corporates, including the main supermarket chain, breweries, sparkling water plants, hotels, and newspapers, creating the potential for directed and connected lending and political interference. A prudent enforcement of mark-to-market and existing limits on connected lending are necessary.
42. Corporate restructuring requires a multi-pronged approach. In addition to the BAMC, the new insolvency law will facilitate effective and speedy rehabilitation of viable corporates and deleveraging through debt-to-equity swaps while allowing nonviable firms to be wound down. State support of troubled non-financial enterprises should be avoided: it is an inefficient use of limited fiscal resources, and also undermines management incentives and governance, while distorting competition. FDI is an important potential source of fresh capital for corporates.
43. The planned fiscal stance for 2014 is appropriate but the lack of credible measures raises concerns that the deficit target may not be achieved. The introduction of a broad-
REPUBLIC OF SLOVENIA
INTERNATIONAL MONETARY FUND 23
based property tax is welcome. However, most of the projected improvement in the 2014 budget hinges on large across–the–board expenditure cuts, not supported by specific reforms, and uncertain revenue yields from stronger tax enforcement. Therefore, additional measures of around 1 percent of GDP will be needed to meet the deficit target. These could include a more ambitious public employment reduction, better targeting of social transfers, and reductions of specific subsidies. The transfer of seed money to the development bank, SID for a new lending program, which increases public debt and contingent liabilities, should be reconsidered.
44. Further gradual fiscal consolidation is in order. Sizeable public guarantees and the costs of an aging population will substantially increase public debt, necessitating gradual fiscal consolidation. Consensus should be built around additional necessary reforms of the pension system to address the indexation mechanism, benefits eligibility, and the retirement age. Should future bank recapitalizations be needed due to an insufficient bank clean-up, faster adjustment would be called for.
45. Labor market flexibility is important to facilitate corporate restructuring. Corporate restructuring will require a reallocation of labor among firms and industries. The brunt of this adjustment is likely to fall disproportionately on the young because older workers enjoy higher job protection. The recent reform reduces labor market duality and is a step in the right direction but its effectiveness needs to be closely monitored.
46. The state should reduce its role in the economy. Slovenia’s attractiveness for foreign direct investment—a crucial conduit of job opportunities for young educated workers—remains hindered by excessive state control of the economy and pervasive red tape. The government’s plan to privatize 15 companies is welcome (especially if promptly executed) but further privatization will be necessary. The decision to set up a centralized management agency for state assets is welcome.
47. It is proposed that the next Article IV consultation be held on the 12-month cycle.
REPUBLIC OF SLOVENIA
24 INTERNATIONAL MONETARY FUND
Figure 1. Slovenia: Macroeconomic Developments
Sources: Bank of Slovenia; Eurostat; Ministry of Finance; Statistical Office of Slovenia; and IMF staff projections.
GDP has been contracting since 2011 despite positive net foreign demand...
...as deleveraging in the banking sector weighs on domestic demand.
Unemployment is relatively contained given the scale of ouput losses...
...but exerting downward pressure on the wage growth.
Weak domestic conditions have contributed to the subdued inflation...
...and to a major turnaround in the current account balance.
-12
-8
-4
0
4
8
12
2004 2006 2008 2010 2012
Contributions to GDP Growth
Net foreign demandGross investmentGov't consumptionPrivate consumptionGDP growth
Proj.2013
-10
0
10
20
30
40
50
Jan-07 Jan-08 Jan-09 Jan-10 Jan-11 Jan-12 Jan-13
Credit growth to private sector, YoY
Total
Households
Corporations (excl. banks)
-3000
-2000
-1000
0
1000
2000
3000
Jan-06 Jan-08 Jan-10 Jan-12
Current Account Balance(12 month total, million euros)
-5
0
5
10
15
20
2000 2003 2006 2009 2012
Wages and Productivity
Nominal WageULCReal wage
0
2
4
6
8
10
12
14
Jan-06 Jun-07 Nov-08 Apr-10 Sep-11 Feb-13
Unemployment Rate
Slovenia Euro area
-8
-6
-4
-2
0
2
4
6
8
10
Jan-06 Jun-07 Nov-08 Apr-10 Sep-11 Feb-13
Consumer Price Index
Slovenia: HICP
Slovenia: Core
Differential with Euro area, HICP
Differential with Euro area, Core
REPUBLIC OF SLOVENIA
INTERNATIONAL MONETARY FUND 25
Figure 2. Slovenia: External Sector Developments
Sources: Bank of Slovenia; Statistical Office of Slovenia; European Central Bank; Direction of Trade Statistics; and IMF staff estimates.
-8
-6
-4
-2
0
2
4
6
8
10
2000 2002 2004 2006 2008 2010 2012
Current Account Balance (Percent of GDP)
Current account balanceTrade balance (goods & services)Net income
Est.2013
70
80
90
100
110
120
2000q1 2003q1 2006q1 2009q1 2012q1
REER-ULC based vs. Euro-area(Index, 2000=100)
AustriaFranceGermanyItalySlovenia
80
90
100
110
120
2000Q1 2003Q1 2006Q1 2009Q1 2012Q1
Slovenia Effective Exchange Rates(Index, 2000=100; relative to euro area)
NEERREER-ULCREER-HCPI
0.0
0.2
0.4
0.6
0.8
1.0
1.2
1.4
2000 2002 2004 2006 2008 2010 2012
Market Share in World Trade(Percent)
Czech Republic HungaryPoland SlovakiaSlovenia
The current account improvement has been very rapid, mainly underpinned by trade...
...which is mostly driven by imports compression.
Despite some crisis-related improvement...
...Slovenia's cost competitiveness has more to go...
...as reflected in its global market share.
Portfolio inflows related to government issuance helped fund repayments by the
banks.
-15
-10
-5
0
5
10
15
2000 2002 2004 2006 2008 2010 2012
Net Investment(Percent of GDP)
Foreign DirectPortfolioOther
10000
12000
14000
16000
18000
20000
22000
24000
26000
Jan-03
Jan-04
Jan-05
Jan-06
Jan-07
Jan-08
Jan-09
Jan-10
Jan-11
Jan-12
Jan-13
Merchandise Exports and Imports(12-month total, million euros)
Exports Imports
REPUBLIC OF SLOVENIA
26 INTERNATIONAL MONETARY FUND
Figure 3. Slovenia: Financial Market Indicators
Source:
0
100
200
300
400
500
600
700
0
100
200
300
400
500
600
700
01/01/11 09/28/11 06/25/12 03/23/13 12/19/13
Slovenia 10-year Government Bond Spread vs. Germany 1/(Basis Points)
0
100
200
300
400
500
600
700
0
100
200
300
400
500
600
700
01/01/11 09/28/11 06/25/12 03/23/13 12/19/13
SloveniaSpainItaly
5-year Sovereign CDS Spreads(Basis Points)
3.5
4.5
5.5
6.5
7.5
8.5
3.5
4.5
5.5
6.5
7.5
8.5
01/02/12 05/24/12 10/14/12 03/07/13 07/28/13 12/19/13
Slovenia Spain Italy
10-year Government Bond Yields 1/(Yield-to-Maturity, Percent)
1
2
3
4
5
6
7
8
1
2
3
4
5
6
7
8
1/3/11 9/30/11 6/26/12 3/23/13 12/19/13
SloveniaSpainItaly
2-year Government Bond Yields 2/(Yield-to-Maturity, Percent)
450490530570610650690730770810850890
450490530570610650690730770810850890
01/03/11 09/30/11 06/26/12 03/23/13 12/19/13
Ljubljana Stock Exchange Slovenian Blue Chip SBITOP Index(Index, 3/31/2006 = 1000)
-15
-10
-5
0
5
10
15
20
25
30
0
5
10
15
20
25
30
Mar-08 Mar-10 Mar-12
Prices of Existing Dwellings(Percent change, YoY)
Slovenian bonds are trading significantly above core euro area rates...
...reflecting higher perceived riskiness.
But after the recent AQR announcement, yields declined significantly,..
...in shorter maturities as well as the longer end.
Equity prices stabilized at low levels... ...but property prices appear to be dipping again.
Source: Bloomberg; Statistical Office of Slovenia; and IMF staff calculations.1/ SLOREP 4.625 09/09/24 used for Slovenia.2/ Bloomberg 2-year generic bond yields.
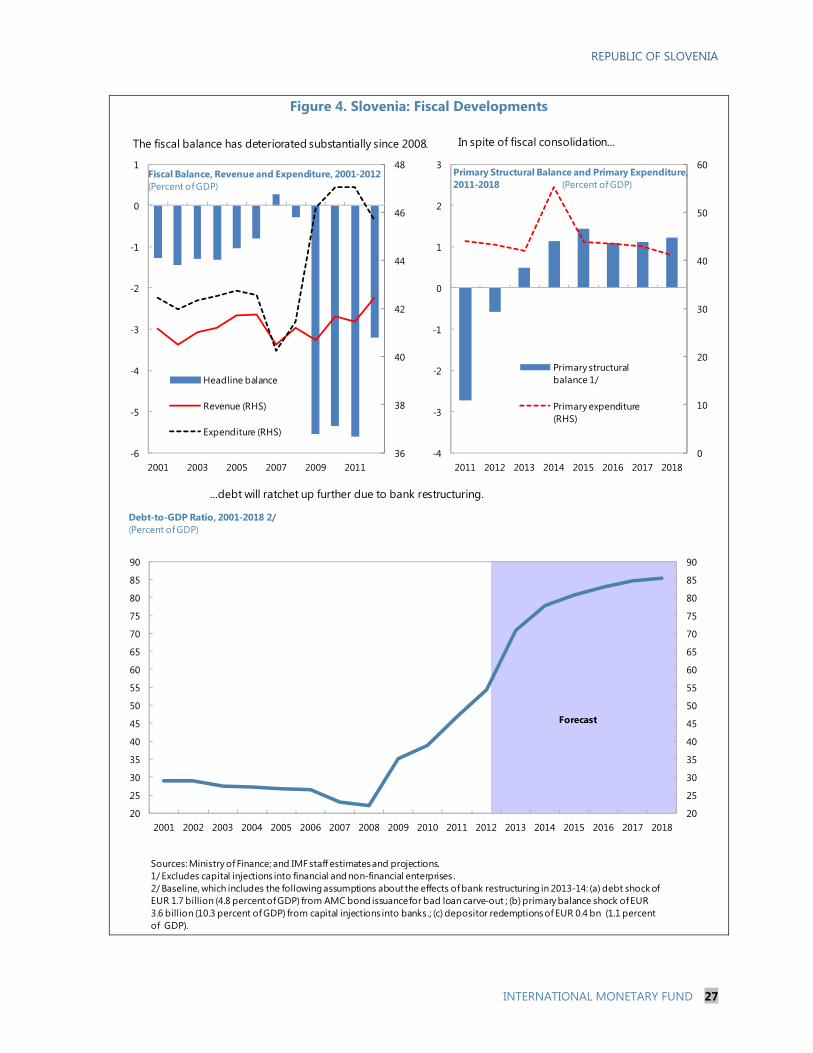
REPUBLIC OF SLOVENIA
INTERNATIONAL MONETARY FUND 27
Figure 4. Slovenia: Fiscal Developments
Sources: Ministry of Finance; and IMF staff estimates and projections.1/ Excludes capital injections into financial and non-financial enterprises . 2/ Baseline, which includes the following assumptions about the effects of bank restructuring in 2013-14: (a) debt shock of EUR 1.7 billion (4.8 percent of GDP) from AMC bond issuance for bad loan carve-out ; (b) primary balance shock of EUR 3.6 billion (10.3 percent of GDP) from capital injections into banks .; (c) depositor redemptions of EUR 0.4 bn (1.1 percent of GDP).
36
38
40
42
44
46
48
-6
-5
-4
-3
-2
-1
0
1
2001 2003 2005 2007 2009 2011
Headline balance
Revenue (RHS)
Expenditure (RHS)
Fiscal Balance, Revenue and Expenditure, 2001-2012 (Percent of GDP)
0
10
20
30
40
50
60
-4
-3
-2
-1
0
1
2
3
2011 2012 2013 2014 2015 2016 2017 2018
Primary structural balance 1/
Primary expenditure (RHS)
Primary Structural Balance and Primary Expenditure, 2011-2018 (Percent of GDP)
20
25
30
35
40
45
50
55
60
65
70
75
80
85
90
20
25
30
35
40
45
50
55
60
65
70
75
80
85
90
2001 2002 2003 2004 2005 2006 2007 2008 2009 2010 2011 2012 2013 2014 2015 2016 2017 2018
Debt-to-GDP Ratio, 2001-2018 2/(Percent of GDP)
Forecast
...debt will ratchet up further due to bank restructuring.
In spite of fiscal consolidation...The fiscal balance has deteriorated substantially since 2008.
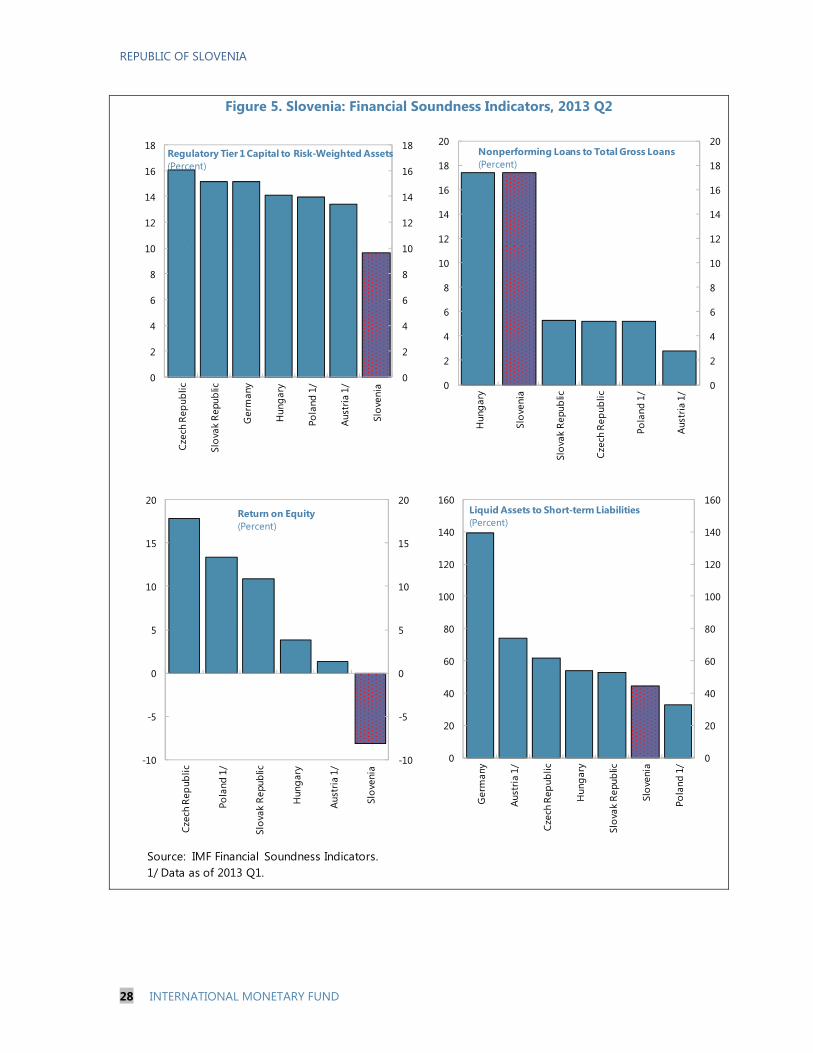
REPUBLIC OF SLOVENIA
28 INTERNATIONAL MONETARY FUND
Figure 5. Slovenia: Financial Soundness Indicators, 2013 Q2
Source: IMF Financial Soundness Indicators.1/ Data as of 2013 Q1.
0
2
4
6
8
10
12
14
16
18
0
2
4
6
8
10
12
14
16
18
Czec
h Re
publ
ic
Slov
ak R
epub
lic
Ger
man
y
Hun
gary
Pola
nd 1
/
Aust
ria 1
/
Slov
enia
Regulatory Tier 1 Capital to Risk-Weighted Assets(Percent)
0
2
4
6
8
10
12
14
16
18
20
0
2
4
6
8
10
12
14
16
18
20
Hun
gary
Slov
enia
Slov
ak R
epub
lic
Czec
h Re
publ
ic
Pola
nd 1
/
Aust
ria 1
/
Nonperforming Loans to Total Gross Loans(Percent)
-10
-5
0
5
10
15
20
-10
-5
0
5
10
15
20
Czec
h Re
publ
ic
Pola
nd 1
/
Slov
ak R
epub
lic
Hun
gary
Aust
ria 1
/
Slov
enia
Return on Equity(Percent)
0
20
40
60
80
100
120
140
160
0
20
40
60
80
100
120
140
160
Ger
man
y
Aust
ria 1
/
Czec
h Re
publ
ic
Hun
gary
Slov
ak R
epub
lic
Slov
enia
Pola
nd 1
/
Liquid Assets to Short-term Liabilities(Percent)
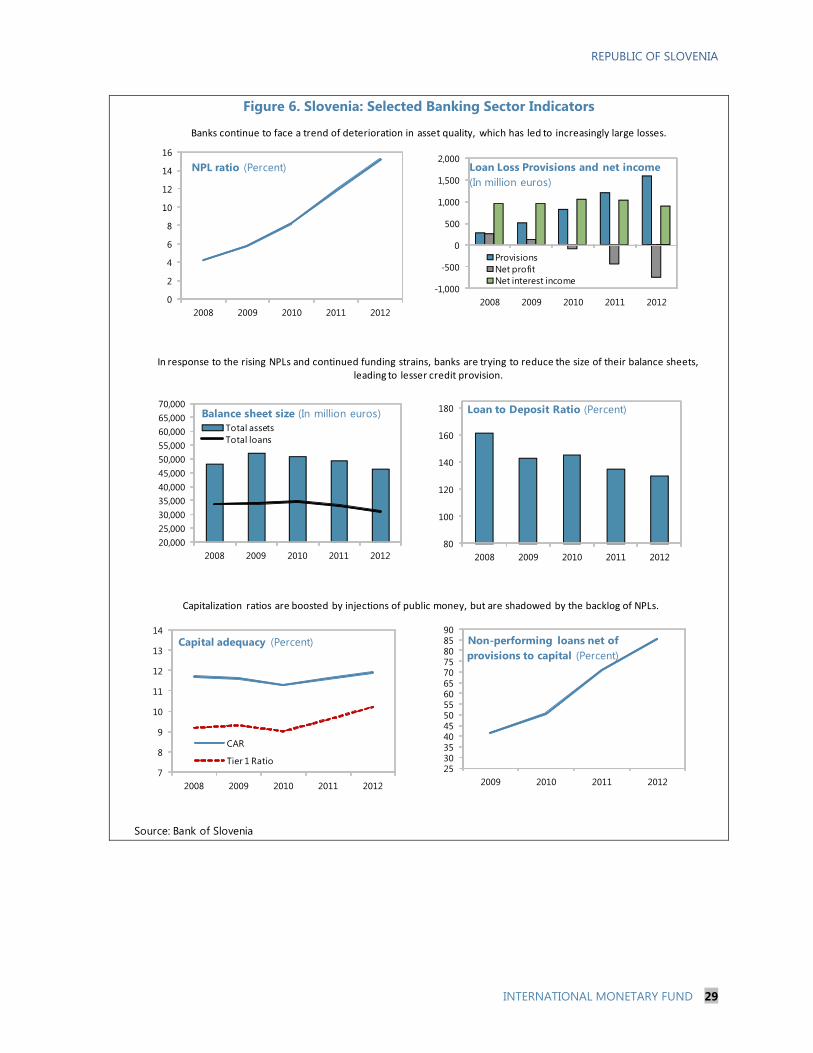
REPUBLIC OF SLOVENIA
INTERNATIONAL MONETARY FUND 29
Figure 6. Slovenia: Selected Banking Sector Indicators
Source: Bank of Slovenia
20,00025,00030,00035,00040,00045,00050,00055,00060,00065,00070,000
2008 2009 2010 2011 2012
Balance sheet size (In million euros)Total assetsTotal loans
0
2
4
6
8
10
12
14
16
2008 2009 2010 2011 2012
NPL ratio (Percent)
2530354045505560657075808590
2009 2010 2011 2012
Non-performing loans net of provisions to capital (Percent)
-1,000
-500
0
500
1,000
1,500
2,000
2008 2009 2010 2011 2012
Loan Loss Provisions and net income (In million euros)
ProvisionsNet profitNet interest income
7
8
9
10
11
12
13
14
2008 2009 2010 2011 2012
Capital adequacy (Percent)
CAR
Tier 1 Ratio
80
100
120
140
160
180
2008 2009 2010 2011 2012
Loan to Deposit Ratio (Percent)
Banks continue to face a trend of deterioration in asset quality, which has led to increasingly large losses.
In response to the rising NPLs and continued funding strains, banks are trying to reduce the size of their balance sheets, leading to lesser credit provision.
Capitalization ratios are boosted by injections of public money, but are shadowed by the backlog of NPLs.
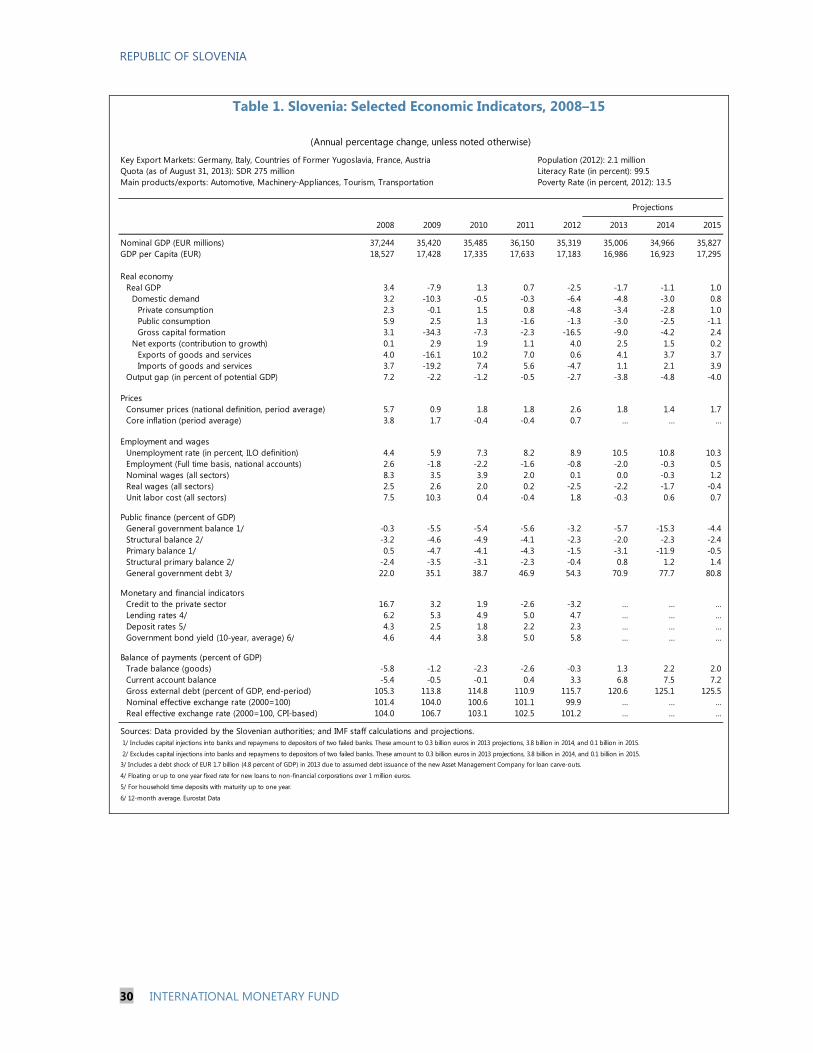
REPUBLIC OF SLOVENIA
30 INTERNATIONAL MONETARY FUND
Table 1. Slovenia: Selected Economic Indicators, 2008–15
Key Export Markets: Germany, Italy, Countries of Former Yugoslavia, France, Austria Population (2012): 2.1 millionQuota (as of August 31, 2013): SDR 275 million Literacy Rate (in percent): 99.5Main products/exports: Automotive, Machinery-Appliances, Tourism, Transportation Poverty Rate (in percent, 2012): 13.5
2008 2009 2010 2011 2012 2013 2014 2015
Nominal GDP (EUR millions) 37,244 35,420 35,485 36,150 35,319 35,006 34,966 35,827GDP per Capita (EUR) 18,527 17,428 17,335 17,633 17,183 16,986 16,923 17,295
Real economyReal GDP 3.4 -7.9 1.3 0.7 -2.5 -1.7 -1.1 1.0
Domestic demand 3.2 -10.3 -0.5 -0.3 -6.4 -4.8 -3.0 0.8Private consumption 2.3 -0.1 1.5 0.8 -4.8 -3.4 -2.8 1.0Public consumption 5.9 2.5 1.3 -1.6 -1.3 -3.0 -2.5 -1.1Gross capital formation 3.1 -34.3 -7.3 -2.3 -16.5 -9.0 -4.2 2.4
Net exports (contribution to growth) 0.1 2.9 1.9 1.1 4.0 2.5 1.5 0.2Exports of goods and services 4.0 -16.1 10.2 7.0 0.6 4.1 3.7 3.7Imports of goods and services 3.7 -19.2 7.4 5.6 -4.7 1.1 2.1 3.9
Output gap (in percent of potential GDP) 7.2 -2.2 -1.2 -0.5 -2.7 -3.8 -4.8 -4.0
PricesConsumer prices (national definition, period average) 5.7 0.9 1.8 1.8 2.6 1.8 1.4 1.7Core inflation (period average) 3.8 1.7 -0.4 -0.4 0.7 … … …
Employment and wagesUnemployment rate (in percent, ILO definition) 4.4 5.9 7.3 8.2 8.9 10.5 10.8 10.3Employment (Full time basis, national accounts) 2.6 -1.8 -2.2 -1.6 -0.8 -2.0 -0.3 0.5Nominal wages (all sectors) 8.3 3.5 3.9 2.0 0.1 0.0 -0.3 1.2Real wages (all sectors) 2.5 2.6 2.0 0.2 -2.5 -2.2 -1.7 -0.4Unit labor cost (all sectors) 7.5 10.3 0.4 -0.4 1.8 -0.3 0.6 0.7
Public finance (percent of GDP) General government balance 1/ -0.3 -5.5 -5.4 -5.6 -3.2 -5.7 -15.3 -4.4Structural balance 2/ -3.2 -4.6 -4.9 -4.1 -2.3 -2.0 -2.3 -2.4Primary balance 1/ 0.5 -4.7 -4.1 -4.3 -1.5 -3.1 -11.9 -0.5Structural primary balance 2/ -2.4 -3.5 -3.1 -2.3 -0.4 0.8 1.2 1.4General government debt 3/ 22.0 35.1 38.7 46.9 54.3 70.9 77.7 80.8
Monetary and financial indicatorsCredit to the private sector 16.7 3.2 1.9 -2.6 -3.2 … … …Lending rates 4/ 6.2 5.3 4.9 5.0 4.7 … … …Deposit rates 5/ 4.3 2.5 1.8 2.2 2.3 … … …Government bond yield (10-year, average) 6/ 4.6 4.4 3.8 5.0 5.8 … … …
Balance of payments (percent of GDP)Trade balance (goods) -5.8 -1.2 -2.3 -2.6 -0.3 1.3 2.2 2.0Current account balance -5.4 -0.5 -0.1 0.4 3.3 6.8 7.5 7.2Gross external debt (percent of GDP, end-period) 105.3 113.8 114.8 110.9 115.7 120.6 125.1 125.5Nominal effective exchange rate (2000=100) 101.4 104.0 100.6 101.1 99.9 … … …Real effective exchange rate (2000=100, CPI-based) 104.0 106.7 103.1 102.5 101.2 … … …
Sources: Data provided by the Slovenian authorities; and IMF staff calculations and projections.
4/ Floating or up to one year fixed rate for new loans to non-financial corporations over 1 million euros.
5/ For household time deposits with maturity up to one year.
6/ 12-month average. Eurostat Data
(Annual percentage change, unless noted otherwise)
3/ Includes a debt shock of EUR 1.7 billion (4.8 percent of GDP) in 2013 due to assumed debt issuance of the new Asset Management Company for loan carve-outs. 2/ Excludes capital injections into banks and repaymens to depositors of two failed banks. These amount to 0.3 billion euros in 2013 projections, 3.8 billion in 2014, and 0.1 billion in 2015.
1/ Includes capital injections into banks and repaymens to depositors of two failed banks. These amount to 0.3 billion euros in 2013 projections, 3.8 billion in 2014, and 0.1 billion in 2015.
Projections
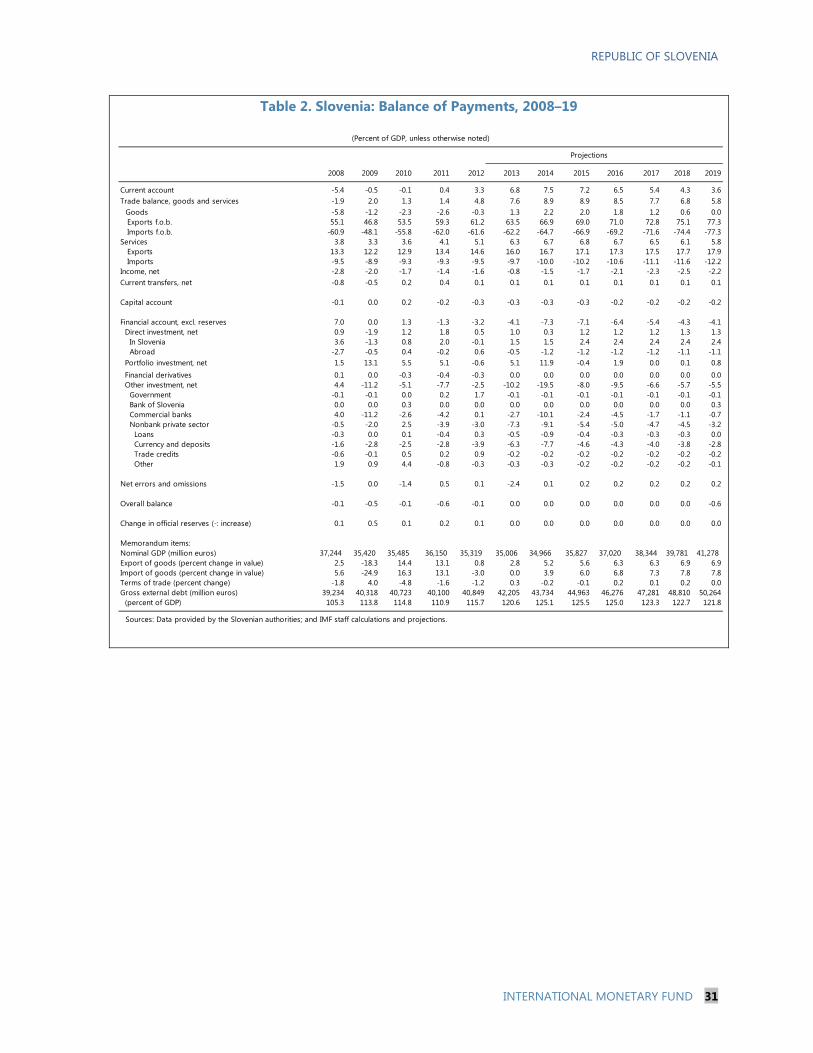
REPUBLIC OF SLOVENIA
INTERNATIONAL MONETARY FUND 31
Table 2. Slovenia: Balance of Payments, 2008–19
2008 2009 2010 2011 2012 2013 2014 2015 2016 2017 2018 2019
Current account -5.4 -0.5 -0.1 0.4 3.3 6.8 7.5 7.2 6.5 5.4 4.3 3.6-1.9 2.0 1.3 1.4 4.8 7.6 8.9 8.9 8.5 7.7 6.8 5.8
Goods -5.8 -1.2 -2.3 -2.6 -0.3 1.3 2.2 2.0 1.8 1.2 0.6 0.055.1 46.8 53.5 59.3 61.2 63.5 66.9 69.0 71.0 72.8 75.1 77.3
-60.9 -48.1 -55.8 -62.0 -61.6 -62.2 -64.7 -66.9 -69.2 -71.6 -74.4 -77.33.8 3.3 3.6 4.1 5.1 6.3 6.7 6.8 6.7 6.5 6.1 5.8
13.3 12.2 12.9 13.4 14.6 16.0 16.7 17.1 17.3 17.5 17.7 17.9-9.5 -8.9 -9.3 -9.3 -9.5 -9.7 -10.0 -10.2 -10.6 -11.1 -11.6 -12.2-2.8 -2.0 -1.7 -1.4 -1.6 -0.8 -1.5 -1.7 -2.1 -2.3 -2.5 -2.2-0.8 -0.5 0.2 0.4 0.1 0.1 0.1 0.1 0.1 0.1 0.1 0.1
Capital account -0.1 0.0 0.2 -0.2 -0.3 -0.3 -0.3 -0.3 -0.2 -0.2 -0.2 -0.2
Financial account, excl. reserves 7.0 0.0 1.3 -1.3 -3.2 -4.1 -7.3 -7.1 -6.4 -5.4 -4.3 -4.10.9 -1.9 1.2 1.8 0.5 1.0 0.3 1.2 1.2 1.2 1.3 1.33.6 -1.3 0.8 2.0 -0.1 1.5 1.5 2.4 2.4 2.4 2.4 2.4
-2.7 -0.5 0.4 -0.2 0.6 -0.5 -1.2 -1.2 -1.2 -1.2 -1.1 -1.11.5 13.1 5.5 5.1 -0.6 5.1 11.9 -0.4 1.9 0.0 0.1 0.8
Financial derivatives 0.1 0.0 -0.3 -0.4 -0.3 0.0 0.0 0.0 0.0 0.0 0.0 0.04.4 -11.2 -5.1 -7.7 -2.5 -10.2 -19.5 -8.0 -9.5 -6.6 -5.7 -5.5
-0.1 -0.1 0.0 0.2 1.7 -0.1 -0.1 -0.1 -0.1 -0.1 -0.1 -0.10.0 0.0 0.3 0.0 0.0 0.0 0.0 0.0 0.0 0.0 0.0 0.34.0 -11.2 -2.6 -4.2 0.1 -2.7 -10.1 -2.4 -4.5 -1.7 -1.1 -0.7
-0.5 -2.0 2.5 -3.9 -3.0 -7.3 -9.1 -5.4 -5.0 -4.7 -4.5 -3.2-0.3 0.0 0.1 -0.4 0.3 -0.5 -0.9 -0.4 -0.3 -0.3 -0.3 0.0-1.6 -2.8 -2.5 -2.8 -3.9 -6.3 -7.7 -4.6 -4.3 -4.0 -3.8 -2.8-0.6 -0.1 0.5 0.2 0.9 -0.2 -0.2 -0.2 -0.2 -0.2 -0.2 -0.21.9 0.9 4.4 -0.8 -0.3 -0.3 -0.3 -0.2 -0.2 -0.2 -0.2 -0.1
Net errors and omissions -1.5 0.0 -1.4 0.5 0.1 -2.4 0.1 0.2 0.2 0.2 0.2 0.2
Overall balance -0.1 -0.5 -0.1 -0.6 -0.1 0.0 0.0 0.0 0.0 0.0 0.0 -0.6
Change in official reserves (-: increase) 0.1 0.5 0.1 0.2 0.1 0.0 0.0 0.0 0.0 0.0 0.0 0.0
Memorandum items:Nominal GDP (million euros) 37,244 35,420 35,485 36,150 35,319 35,006 34,966 35,827 37,020 38,344 39,781 41,278
2.5 -18.3 14.4 13.1 0.8 2.8 5.2 5.6 6.3 6.3 6.9 6.95.6 -24.9 16.3 13.1 -3.0 0.0 3.9 6.0 6.8 7.3 7.8 7.8
Terms of trade (percent change) -1.8 4.0 -4.8 -1.6 -1.2 0.3 -0.2 -0.1 0.2 0.1 0.2 0.0Gross external debt (million euros) 39,234 40,318 40,723 40,100 40,849 42,205 43,734 44,963 46,276 47,281 48,810 50,264
105.3 113.8 114.8 110.9 115.7 120.6 125.1 125.5 125.0 123.3 122.7 121.8
Sources: Data provided by the Slovenian authorities; and IMF staff calculations and projections.
Direct investment, net
Trade balance, goods and services
Exports f.o.b. Imports f.o.b.Services Exports ImportsIncome, netCurrent transfers, net
Projections
(Percent of GDP, unless otherwise noted)
Other
In Slovenia
Portfolio investment, net
Other investment, net Government Bank of Slovenia
Abroad
Commercial banks Nonbank private sector Loans Currency and deposits Trade credits
Export of goods (percent change in value)Import of goods (percent change in value)
(percent of GDP)
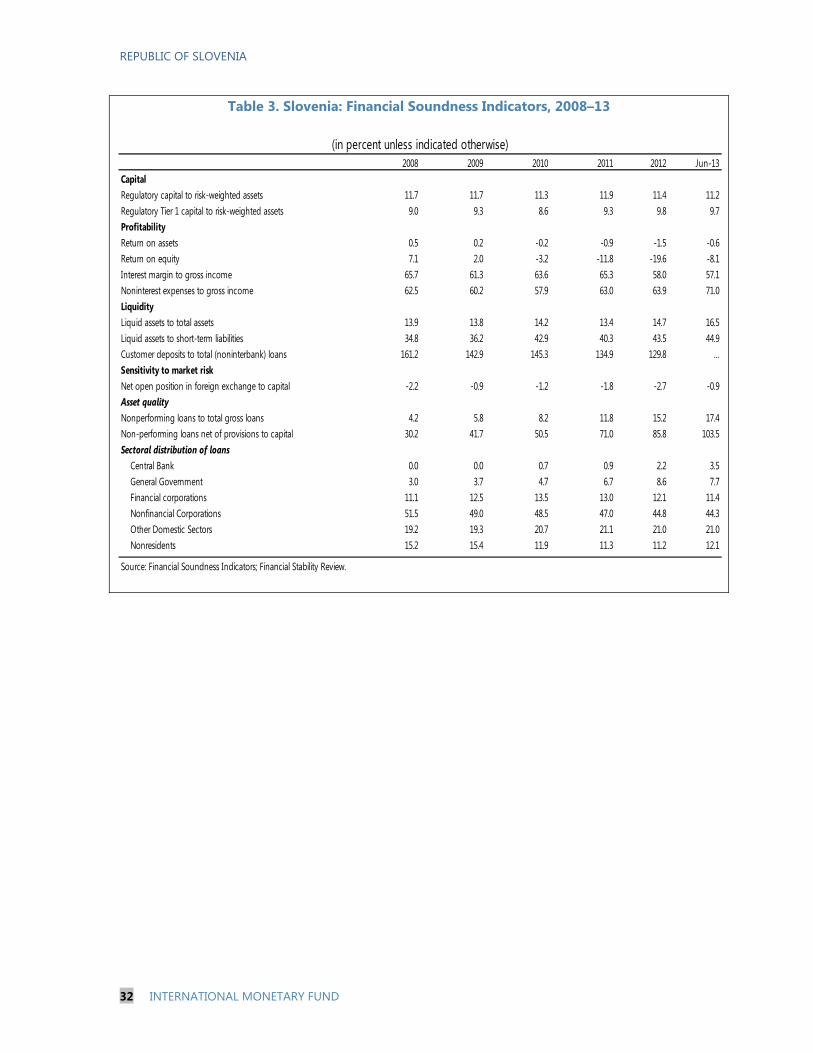
REPUBLIC OF SLOVENIA
32 INTERNATIONAL MONETARY FUND
Table 3. Slovenia: Financial Soundness Indicators, 2008–13
2008 2009 2010 2011 2012 Jun-13CapitalRegulatory capital to risk-weighted assets 11.7 11.7 11.3 11.9 11.4 11.2Regulatory Tier 1 capital to risk-weighted assets 9.0 9.3 8.6 9.3 9.8 9.7ProfitabilityReturn on assets 0.5 0.2 -0.2 -0.9 -1.5 -0.6Return on equity 7.1 2.0 -3.2 -11.8 -19.6 -8.1Interest margin to gross income 65.7 61.3 63.6 65.3 58.0 57.1Noninterest expenses to gross income 62.5 60.2 57.9 63.0 63.9 71.0LiquidityLiquid assets to total assets 13.9 13.8 14.2 13.4 14.7 16.5Liquid assets to short-term liabilities 34.8 36.2 42.9 40.3 43.5 44.9Customer deposits to total (noninterbank) loans 161.2 142.9 145.3 134.9 129.8 …Sensitivity to market riskNet open position in foreign exchange to capital -2.2 -0.9 -1.2 -1.8 -2.7 -0.9Asset qualityNonperforming loans to total gross loans 4.2 5.8 8.2 11.8 15.2 17.4Non-performing loans net of provisions to capital 30.2 41.7 50.5 71.0 85.8 103.5Sectoral distribution of loans
Central Bank 0.0 0.0 0.7 0.9 2.2 3.5General Government 3.0 3.7 4.7 6.7 8.6 7.7Financial corporations 11.1 12.5 13.5 13.0 12.1 11.4Nonfinancial Corporations 51.5 49.0 48.5 47.0 44.8 44.3Other Domestic Sectors 19.2 19.3 20.7 21.1 21.0 21.0Nonresidents 15.2 15.4 11.9 11.3 11.2 12.1
Source: Financial Soundness Indicators; Financial Stability Review.
(in percent unless indicated otherwise)
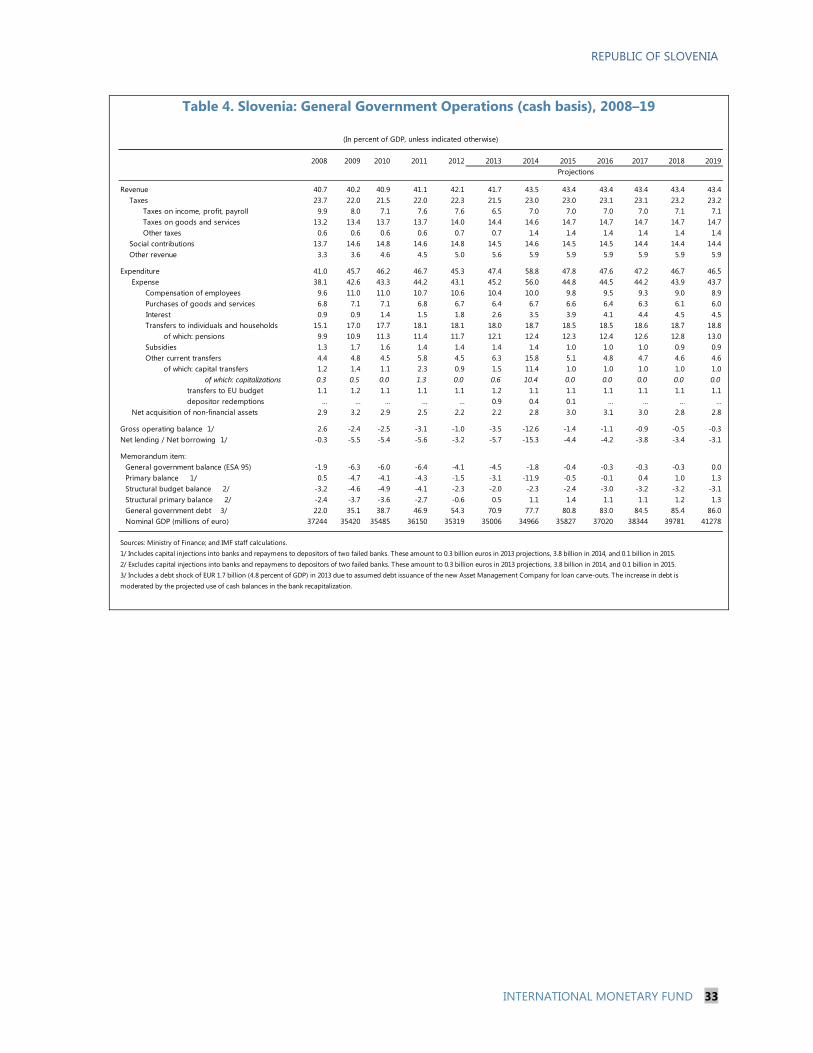
REPUBLIC OF SLOVENIA
INTERNATIONAL MONETARY FUND 33
Table 4. Slovenia: General Government Operations (cash basis), 2008–19
2008 2009 2010 2011 2012 2013 2014 2015 2016 2017 2018 2019
Revenue 40.7 40.2 40.9 41.1 42.1 41.7 43.5 43.4 43.4 43.4 43.4 43.4 Taxes 23.7 22.0 21.5 22.0 22.3 21.5 23.0 23.0 23.1 23.1 23.2 23.2 Taxes on income, profit, payroll 9.9 8.0 7.1 7.6 7.6 6.5 7.0 7.0 7.0 7.0 7.1 7.1 Taxes on goods and services 13.2 13.4 13.7 13.7 14.0 14.4 14.6 14.7 14.7 14.7 14.7 14.7 Other taxes 0.6 0.6 0.6 0.6 0.7 0.7 1.4 1.4 1.4 1.4 1.4 1.4 Social contributions 13.7 14.6 14.8 14.6 14.8 14.5 14.6 14.5 14.5 14.4 14.4 14.4 Other revenue 3.3 3.6 4.6 4.5 5.0 5.6 5.9 5.9 5.9 5.9 5.9 5.9
Expenditure 41.0 45.7 46.2 46.7 45.3 47.4 58.8 47.8 47.6 47.2 46.7 46.5 Expense 38.1 42.6 43.3 44.2 43.1 45.2 56.0 44.8 44.5 44.2 43.9 43.7 Compensation of employees 9.6 11.0 11.0 10.7 10.6 10.4 10.0 9.8 9.5 9.3 9.0 8.9 Purchases of goods and services 6.8 7.1 7.1 6.8 6.7 6.4 6.7 6.6 6.4 6.3 6.1 6.0
Interest 0.9 0.9 1.4 1.5 1.8 2.6 3.5 3.9 4.1 4.4 4.5 4.5 Transfers to individuals and households 15.1 17.0 17.7 18.1 18.1 18.0 18.7 18.5 18.5 18.6 18.7 18.8 of which: pensions 9.9 10.9 11.3 11.4 11.7 12.1 12.4 12.3 12.4 12.6 12.8 13.0 Subsidies 1.3 1.7 1.6 1.4 1.4 1.4 1.4 1.0 1.0 1.0 0.9 0.9 Other current transfers 4.4 4.8 4.5 5.8 4.5 6.3 15.8 5.1 4.8 4.7 4.6 4.6 of which: capital transfers 1.2 1.4 1.1 2.3 0.9 1.5 11.4 1.0 1.0 1.0 1.0 1.0 of which: capitalizations 0.3 0.5 0.0 1.3 0.0 0.6 10.4 0.0 0.0 0.0 0.0 0.0
transfers to EU budget 1.1 1.2 1.1 1.1 1.1 1.2 1.1 1.1 1.1 1.1 1.1 1.1depositor redemptions … … … … … 0.9 0.4 0.1 … … … …
Net acquisition of non-financial assets 2.9 3.2 2.9 2.5 2.2 2.2 2.8 3.0 3.1 3.0 2.8 2.8
Gross operating balance 1/ 2.6 -2.4 -2.5 -3.1 -1.0 -3.5 -12.6 -1.4 -1.1 -0.9 -0.5 -0.3Net lending / Net borrowing 1/ -0.3 -5.5 -5.4 -5.6 -3.2 -5.7 -15.3 -4.4 -4.2 -3.8 -3.4 -3.1
Memorandum item:General government balance (ESA 95) -1.9 -6.3 -6.0 -6.4 -4.1 -4.5 -1.8 -0.4 -0.3 -0.3 -0.3 0.0Primary balance 1/ 0.5 -4.7 -4.1 -4.3 -1.5 -3.1 -11.9 -0.5 -0.1 0.4 1.0 1.3Structural budget balance 2/ -3.2 -4.6 -4.9 -4.1 -2.3 -2.0 -2.3 -2.4 -3.0 -3.2 -3.2 -3.1Structural primary balance 2/ -2.4 -3.7 -3.6 -2.7 -0.6 0.5 1.1 1.4 1.1 1.1 1.2 1.3General government debt 3/ 22.0 35.1 38.7 46.9 54.3 70.9 77.7 80.8 83.0 84.5 85.4 86.0Nominal GDP (millions of euro) 37244 35420 35485 36150 35319 35006 34966 35827 37020 38344 39781 41278
Sources: Ministry of Finance; and IMF staff calculations.
3/ Includes a debt shock of EUR 1.7 billion (4.8 percent of GDP) in 2013 due to assumed debt issuance of the new Asset Management Company for loan carve-outs. The increase in debt ismoderated by the projected use of cash balances in the bank recapitalization.
Projections
1/ Includes capital injections into banks and repaymens to depositors of two failed banks. These amount to 0.3 billion euros in 2013 projections, 3.8 billion in 2014, and 0.1 billion in 2015.2/ Excludes capital injections into banks and repaymens to depositors of two failed banks. These amount to 0.3 billion euros in 2013 projections, 3.8 billion in 2014, and 0.1 billion in 2015.
(In percent of GDP, unless indicated otherwise)
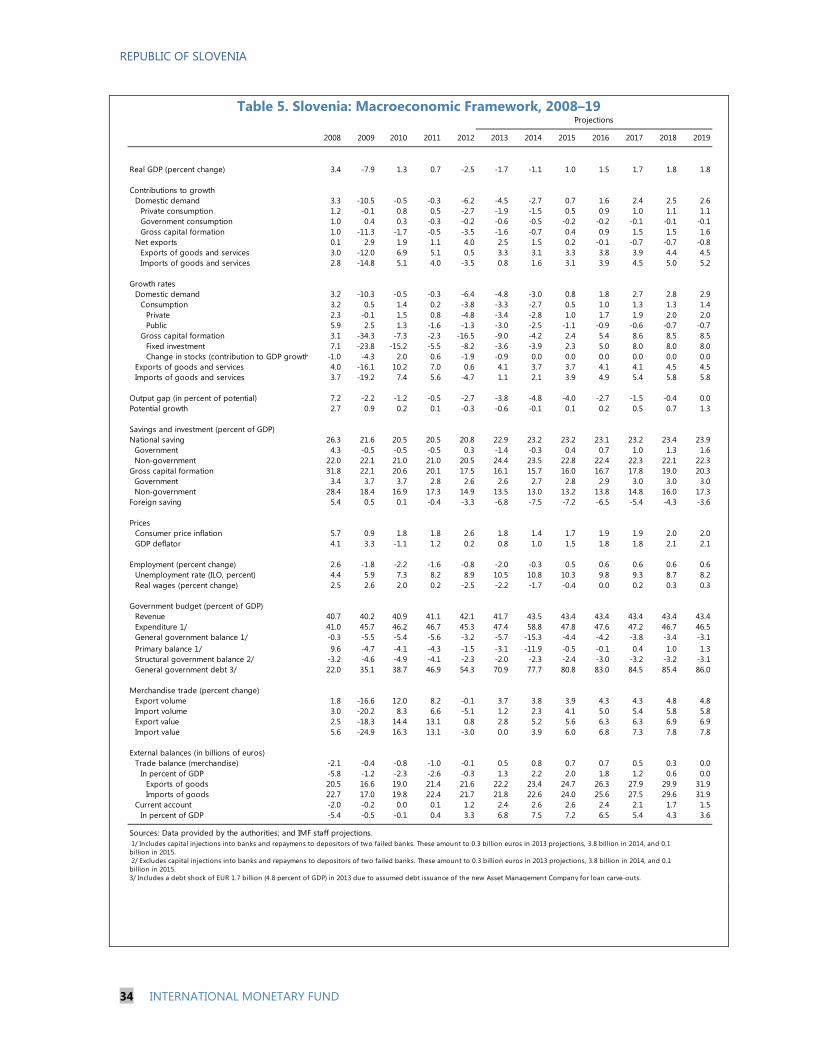
REPUBLIC OF SLOVENIA
34 INTERNATIONAL MONETARY FUND
Table 5. Slovenia: Macroeconomic Framework, 2008–19
2008 2009 2010 2011 2012 2013 2014 2015 2016 2017 2018 2019
Real GDP (percent change) 3.4 -7.9 1.3 0.7 -2.5 -1.7 -1.1 1.0 1.5 1.7 1.8 1.8
Contributions to growthDomestic demand 3.3 -10.5 -0.5 -0.3 -6.2 -4.5 -2.7 0.7 1.6 2.4 2.5 2.6
Private consumption 1.2 -0.1 0.8 0.5 -2.7 -1.9 -1.5 0.5 0.9 1.0 1.1 1.1Government consumption 1.0 0.4 0.3 -0.3 -0.2 -0.6 -0.5 -0.2 -0.2 -0.1 -0.1 -0.1Gross capital formation 1.0 -11.3 -1.7 -0.5 -3.5 -1.6 -0.7 0.4 0.9 1.5 1.5 1.6
Net exports 0.1 2.9 1.9 1.1 4.0 2.5 1.5 0.2 -0.1 -0.7 -0.7 -0.8Exports of goods and services 3.0 -12.0 6.9 5.1 0.5 3.3 3.1 3.3 3.8 3.9 4.4 4.5Imports of goods and services 2.8 -14.8 5.1 4.0 -3.5 0.8 1.6 3.1 3.9 4.5 5.0 5.2
Growth ratesDomestic demand 3.2 -10.3 -0.5 -0.3 -6.4 -4.8 -3.0 0.8 1.8 2.7 2.8 2.9
Consumption 3.2 0.5 1.4 0.2 -3.8 -3.3 -2.7 0.5 1.0 1.3 1.3 1.4Private 2.3 -0.1 1.5 0.8 -4.8 -3.4 -2.8 1.0 1.7 1.9 2.0 2.0Public 5.9 2.5 1.3 -1.6 -1.3 -3.0 -2.5 -1.1 -0.9 -0.6 -0.7 -0.7
Gross capital formation 3.1 -34.3 -7.3 -2.3 -16.5 -9.0 -4.2 2.4 5.4 8.6 8.5 8.5Fixed investment 7.1 -23.8 -15.2 -5.5 -8.2 -3.6 -3.9 2.3 5.0 8.0 8.0 8.0Change in stocks (contribution to GDP growth -1.0 -4.3 2.0 0.6 -1.9 -0.9 0.0 0.0 0.0 0.0 0.0 0.0
Exports of goods and services 4.0 -16.1 10.2 7.0 0.6 4.1 3.7 3.7 4.1 4.1 4.5 4.5Imports of goods and services 3.7 -19.2 7.4 5.6 -4.7 1.1 2.1 3.9 4.9 5.4 5.8 5.8
Output gap (in percent of potential) 7.2 -2.2 -1.2 -0.5 -2.7 -3.8 -4.8 -4.0 -2.7 -1.5 -0.4 0.0Potential growth 2.7 0.9 0.2 0.1 -0.3 -0.6 -0.1 0.1 0.2 0.5 0.7 1.3
Savings and investment (percent of GDP)National saving 26.3 21.6 20.5 20.5 20.8 22.9 23.2 23.2 23.1 23.2 23.4 23.9 Government 4.3 -0.5 -0.5 -0.5 0.3 -1.4 -0.3 0.4 0.7 1.0 1.3 1.6 Non-government 22.0 22.1 21.0 21.0 20.5 24.4 23.5 22.8 22.4 22.3 22.1 22.3Gross capital formation 31.8 22.1 20.6 20.1 17.5 16.1 15.7 16.0 16.7 17.8 19.0 20.3 Government 3.4 3.7 3.7 2.8 2.6 2.6 2.7 2.8 2.9 3.0 3.0 3.0 Non-government 28.4 18.4 16.9 17.3 14.9 13.5 13.0 13.2 13.8 14.8 16.0 17.3Foreign saving 5.4 0.5 0.1 -0.4 -3.3 -6.8 -7.5 -7.2 -6.5 -5.4 -4.3 -3.6
PricesConsumer price inflation 5.7 0.9 1.8 1.8 2.6 1.8 1.4 1.7 1.9 1.9 2.0 2.0GDP deflator 4.1 3.3 -1.1 1.2 0.2 0.8 1.0 1.5 1.8 1.8 2.1 2.1
Employment (percent change) 2.6 -1.8 -2.2 -1.6 -0.8 -2.0 -0.3 0.5 0.6 0.6 0.6 0.6Unemployment rate (ILO, percent) 4.4 5.9 7.3 8.2 8.9 10.5 10.8 10.3 9.8 9.3 8.7 8.2Real wages (percent change) 2.5 2.6 2.0 0.2 -2.5 -2.2 -1.7 -0.4 0.0 0.2 0.3 0.3
Government budget (percent of GDP)Revenue 40.7 40.2 40.9 41.1 42.1 41.7 43.5 43.4 43.4 43.4 43.4 43.4Expenditure 1/ 41.0 45.7 46.2 46.7 45.3 47.4 58.8 47.8 47.6 47.2 46.7 46.5General government balance 1/ -0.3 -5.5 -5.4 -5.6 -3.2 -5.7 -15.3 -4.4 -4.2 -3.8 -3.4 -3.1Primary balance 1/ 9.6 -4.7 -4.1 -4.3 -1.5 -3.1 -11.9 -0.5 -0.1 0.4 1.0 1.3Structural government balance 2/ -3.2 -4.6 -4.9 -4.1 -2.3 -2.0 -2.3 -2.4 -3.0 -3.2 -3.2 -3.1General government debt 3/ 22.0 35.1 38.7 46.9 54.3 70.9 77.7 80.8 83.0 84.5 85.4 86.0
Merchandise trade (percent change)Export volume 1.8 -16.6 12.0 8.2 -0.1 3.7 3.8 3.9 4.3 4.3 4.8 4.8Import volume 3.0 -20.2 8.3 6.6 -5.1 1.2 2.3 4.1 5.0 5.4 5.8 5.8Export value 2.5 -18.3 14.4 13.1 0.8 2.8 5.2 5.6 6.3 6.3 6.9 6.9Import value 5.6 -24.9 16.3 13.1 -3.0 0.0 3.9 6.0 6.8 7.3 7.8 7.8
External balances (in billions of euros)Trade balance (merchandise) -2.1 -0.4 -0.8 -1.0 -0.1 0.5 0.8 0.7 0.7 0.5 0.3 0.0
In percent of GDP -5.8 -1.2 -2.3 -2.6 -0.3 1.3 2.2 2.0 1.8 1.2 0.6 0.0Exports of goods 20.5 16.6 19.0 21.4 21.6 22.2 23.4 24.7 26.3 27.9 29.9 31.9Imports of goods 22.7 17.0 19.8 22.4 21.7 21.8 22.6 24.0 25.6 27.5 29.6 31.9
Current account -2.0 -0.2 0.0 0.1 1.2 2.4 2.6 2.6 2.4 2.1 1.7 1.5In percent of GDP -5.4 -0.5 -0.1 0.4 3.3 6.8 7.5 7.2 6.5 5.4 4.3 3.6
Sources: Data provided by the authorities; and IMF staff projections.
2/ Excludes capital injections into banks and repaymens to depositors of two failed banks. These amount to 0.3 billion euros in 2013 projections, 3.8 billion in 2014, and 0.1 billion in 2015.3/ Includes a debt shock of EUR 1.7 billion (4.8 percent of GDP) in 2013 due to assumed debt issuance of the new Asset Management Company for loan carve-outs.
1/ Includes capital injections into banks and repaymens to depositors of two failed banks. These amount to 0.3 billion euros in 2013 projections, 3.8 billion in 2014, and 0.1 billion in 2015.
Projections
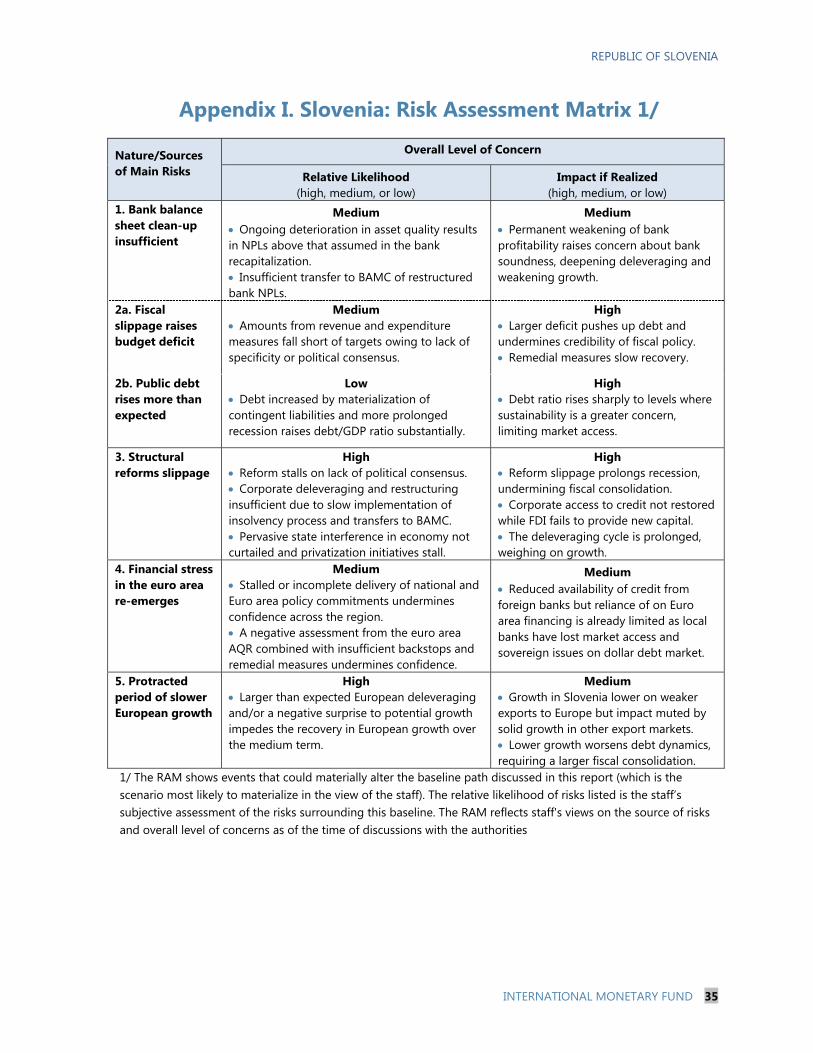
REPUBLIC OF SLOVENIA
INTERNATIONAL MONETARY FUND 35
Appendix I. Slovenia: Risk Assessment Matrix 1/
Nature/Sources of Main Risks
Overall Level of Concern
Relative Likelihood (high, medium, or low)
Impact if Realized (high, medium, or low)
1. Bank balance sheet clean-up insufficient
Medium Ongoing deterioration in asset quality results in NPLs above that assumed in the bank recapitalization. Insufficient transfer to BAMC of restructured bank NPLs.
Medium Permanent weakening of bank profitability raises concern about bank soundness, deepening deleveraging and weakening growth.
2a. Fiscal slippage raises budget deficit
Medium Amounts from revenue and expenditure measures fall short of targets owing to lack of specificity or political consensus.
High Larger deficit pushes up debt and undermines credibility of fiscal policy. Remedial measures slow recovery.
2b. Public debt rises more than expected
Low Debt increased by materialization of contingent liabilities and more prolonged recession raises debt/GDP ratio substantially.
High Debt ratio rises sharply to levels where sustainability is a greater concern, limiting market access.
3. Structural reforms slippage
High Reform stalls on lack of political consensus. Corporate deleveraging and restructuring insufficient due to slow implementation of insolvency process and transfers to BAMC. Pervasive state interference in economy not curtailed and privatization initiatives stall.
High Reform slippage prolongs recession, undermining fiscal consolidation. Corporate access to credit not restored while FDI fails to provide new capital. The deleveraging cycle is prolonged, weighing on growth.
4. Financial stress in the euro area re-emerges
Medium Stalled or incomplete delivery of national and Euro area policy commitments undermines confidence across the region. A negative assessment from the euro area AQR combined with insufficient backstops and remedial measures undermines confidence.
Medium Reduced availability of credit from foreign banks but reliance of on Euro area financing is already limited as local banks have lost market access and sovereign issues on dollar debt market.
5. Protracted period of slower European growth
High Larger than expected European deleveraging and/or a negative surprise to potential growth impedes the recovery in European growth over the medium term.
Medium Growth in Slovenia lower on weaker exports to Europe but impact muted by solid growth in other export markets. Lower growth worsens debt dynamics, requiring a larger fiscal consolidation.
1/ The RAM shows events that could materially alter the baseline path discussed in this report (which is the scenario most likely to materialize in the view of the staff). The relative likelihood of risks listed is the staff’s subjective assessment of the risks surrounding this baseline. The RAM reflects staff's views on the source of risks and overall level of concerns as of the time of discussions with the authorities
REPUBLIC OF SLOVENIA STAFF REPORT FOR THE 2013 ARTICLE IV CONSULTATION—INFORMATIONAL ANNEX Prepared By
European Department
FUND RELATIONS ________________________________________________________________________ 2
STATISTICAL ISSUES ______________________________________________________________________ 4
CONTENTS
December 27, 2013
REPUBLIC OF SLOVENIA
2 INTERNATIONAL MONETARY FUND
FUND RELATIONS
(As of October 31, 2013)
Membership Status: Joined 12/14/1992; Article VIII
General Resources Account:
SDR Million Percent of Quota
Quota 275.0 100
Fund holdings of currency 177.37 64.50
Reserve position 97.65 35.51
Lending to the Fund 33.38
SDR Department:
SDR Million Percent of Allocation
Net cumulative allocation 215.88 100
Holdings 193.55 89.65
Outstanding Purchases and Loans: None
Financial Arrangements: None
Projected Payments to Fund:
(SDR Million; based on existing use of resources and present holdings of SDRs):
Forthcoming
2013 2014 2015 2016 2017
Principal
Charges/Interest 0.00 0.02 0.02 0.02 0.02
Total 0.00 0.02 0.02 0.02 0.02
Exchange Rate Arrangement:
Slovenia adopted the euro on January 1, 2007. Slovenia has accepted the obligations of Article VIII.
Slovenia maintains an exchange system that is free of restrictions on the making of payments and
transfers for current international transactions, with the exception of exchange restrictions
maintained for security reasons, which have been notified to the Fund pursuant to Decision
No. 144-(52/51).
Article IV Consultation:
Slovenia is on the 12-month Article IV consultation cycle. The 2013 mission visited Ljubljana during
October 17–29, 2013 and held discussions with the Minister of Finance, the Governor of the Bank of
Slovenia, and other key economic ministers, government officials and representatives of the
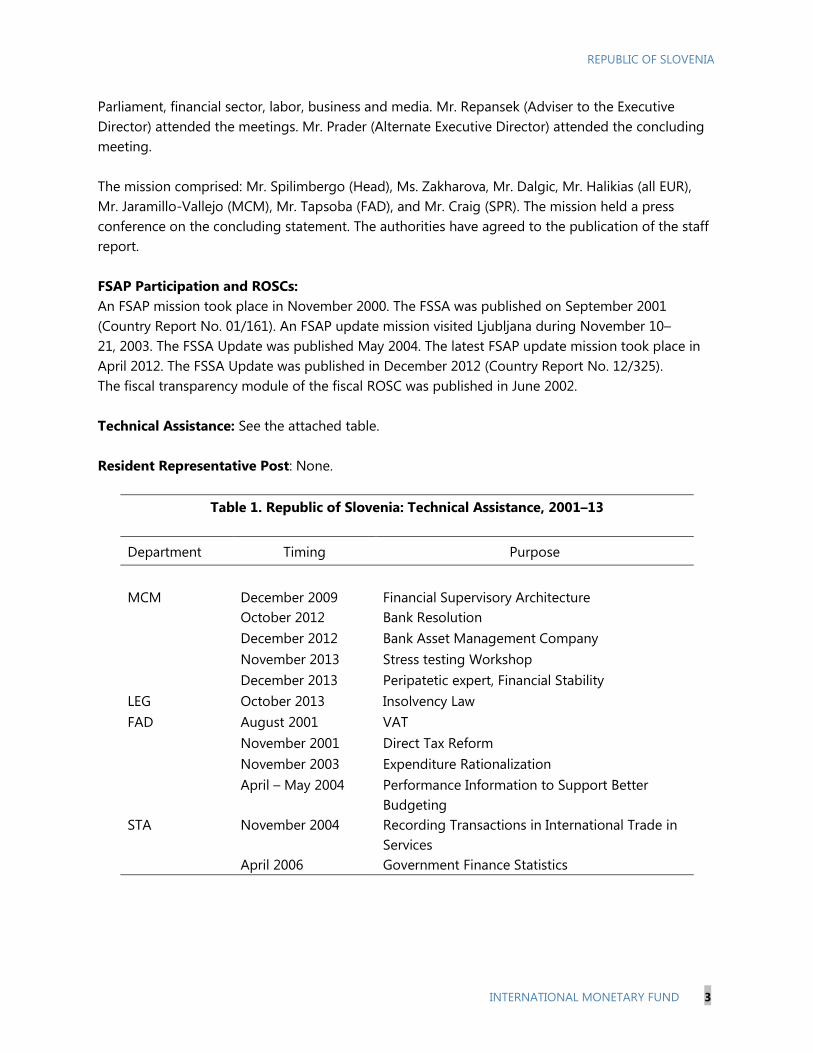
REPUBLIC OF SLOVENIA
INTERNATIONAL MONETARY FUND 3
Parliament, financial sector, labor, business and media. Mr. Repansek (Adviser to the Executive
Director) attended the meetings. Mr. Prader (Alternate Executive Director) attended the concluding
meeting.
The mission comprised: Mr. Spilimbergo (Head), Ms. Zakharova, Mr. Dalgic, Mr. Halikias (all EUR),
Mr. Jaramillo-Vallejo (MCM), Mr. Tapsoba (FAD), and Mr. Craig (SPR). The mission held a press
conference on the concluding statement. The authorities have agreed to the publication of the staff
report.
FSAP Participation and ROSCs:
An FSAP mission took place in November 2000. The FSSA was published on September 2001
(Country Report No. 01/161). An FSAP update mission visited Ljubljana during November 10–
21, 2003. The FSSA Update was published May 2004. The latest FSAP update mission took place in
April 2012. The FSSA Update was published in December 2012 (Country Report No. 12/325).
The fiscal transparency module of the fiscal ROSC was published in June 2002.
Technical Assistance: See the attached table.
Resident Representative Post: None.
Table 1. Republic of Slovenia: Technical Assistance, 2001–13
Department Timing Purpose
MCM December 2009 Financial Supervisory Architecture
October 2012 Bank Resolution
December 2012 Bank Asset Management Company
November 2013 Stress testing Workshop
December 2013 Peripatetic expert, Financial Stability
LEG October 2013 Insolvency Law
FAD August 2001 VAT
November 2001 Direct Tax Reform
November 2003 Expenditure Rationalization
April – May 2004 Performance Information to Support Better
Budgeting
STA November 2004 Recording Transactions in International Trade in
Services
April 2006 Government Finance Statistics
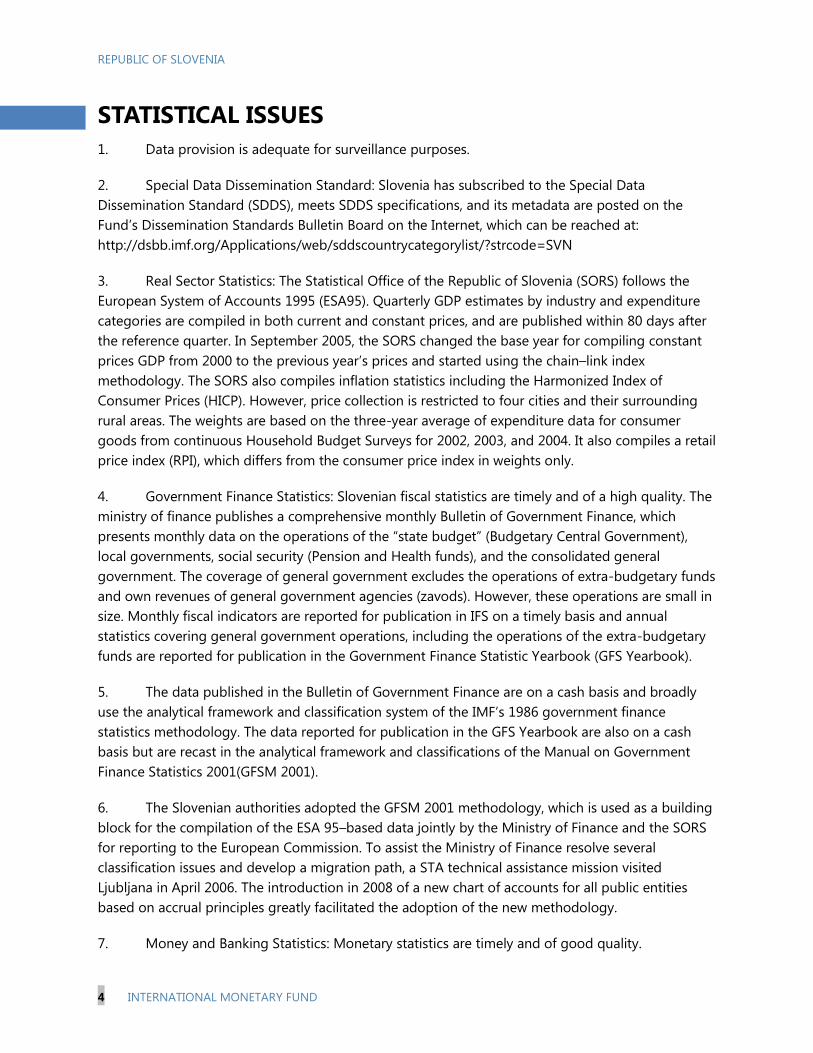
REPUBLIC OF SLOVENIA
4 INTERNATIONAL MONETARY FUND
STATISTICAL ISSUES
1. Data provision is adequate for surveillance purposes.
2. Special Data Dissemination Standard: Slovenia has subscribed to the Special Data
Dissemination Standard (SDDS), meets SDDS specifications, and its metadata are posted on the
Fund’s Dissemination Standards Bulletin Board on the Internet, which can be reached at:
http://dsbb.imf.org/Applications/web/sddscountrycategorylist/?strcode=SVN
3. Real Sector Statistics: The Statistical Office of the Republic of Slovenia (SORS) follows the
European System of Accounts 1995 (ESA95). Quarterly GDP estimates by industry and expenditure
categories are compiled in both current and constant prices, and are published within 80 days after
the reference quarter. In September 2005, the SORS changed the base year for compiling constant
prices GDP from 2000 to the previous year’s prices and started using the chain–link index
methodology. The SORS also compiles inflation statistics including the Harmonized Index of
Consumer Prices (HICP). However, price collection is restricted to four cities and their surrounding
rural areas. The weights are based on the three-year average of expenditure data for consumer
goods from continuous Household Budget Surveys for 2002, 2003, and 2004. It also compiles a retail
price index (RPI), which differs from the consumer price index in weights only.
4. Government Finance Statistics: Slovenian fiscal statistics are timely and of a high quality. The
ministry of finance publishes a comprehensive monthly Bulletin of Government Finance, which
presents monthly data on the operations of the “state budget” (Budgetary Central Government),
local governments, social security (Pension and Health funds), and the consolidated general
government. The coverage of general government excludes the operations of extra-budgetary funds
and own revenues of general government agencies (zavods). However, these operations are small in
size. Monthly fiscal indicators are reported for publication in IFS on a timely basis and annual
statistics covering general government operations, including the operations of the extra-budgetary
funds are reported for publication in the Government Finance Statistic Yearbook (GFS Yearbook).
5. The data published in the Bulletin of Government Finance are on a cash basis and broadly
use the analytical framework and classification system of the IMF’s 1986 government finance
statistics methodology. The data reported for publication in the GFS Yearbook are also on a cash
basis but are recast in the analytical framework and classifications of the Manual on Government
Finance Statistics 2001(GFSM 2001).
6. The Slovenian authorities adopted the GFSM 2001 methodology, which is used as a building
block for the compilation of the ESA 95–based data jointly by the Ministry of Finance and the SORS
for reporting to the European Commission. To assist the Ministry of Finance resolve several
classification issues and develop a migration path, a STA technical assistance mission visited
Ljubljana in April 2006. The introduction in 2008 of a new chart of accounts for all public entities
based on accrual principles greatly facilitated the adoption of the new methodology.
7. Money and Banking Statistics: Monetary statistics are timely and of good quality.
REPUBLIC OF SLOVENIA
INTERNATIONAL MONETARY FUND 5
8. Balance of Payments Statistics: Balance of payments data are comprehensive and of high
quality. The data have been published in the Balance of Payments Statistics Yearbook since 1993
(with estimates of the international investment position published since 1994).
9. External Debt Statistics: External debt statistics were revised and brought in line with the
SDDS in August 2003. The main change comprised the inclusion of trade credits in the debt data.
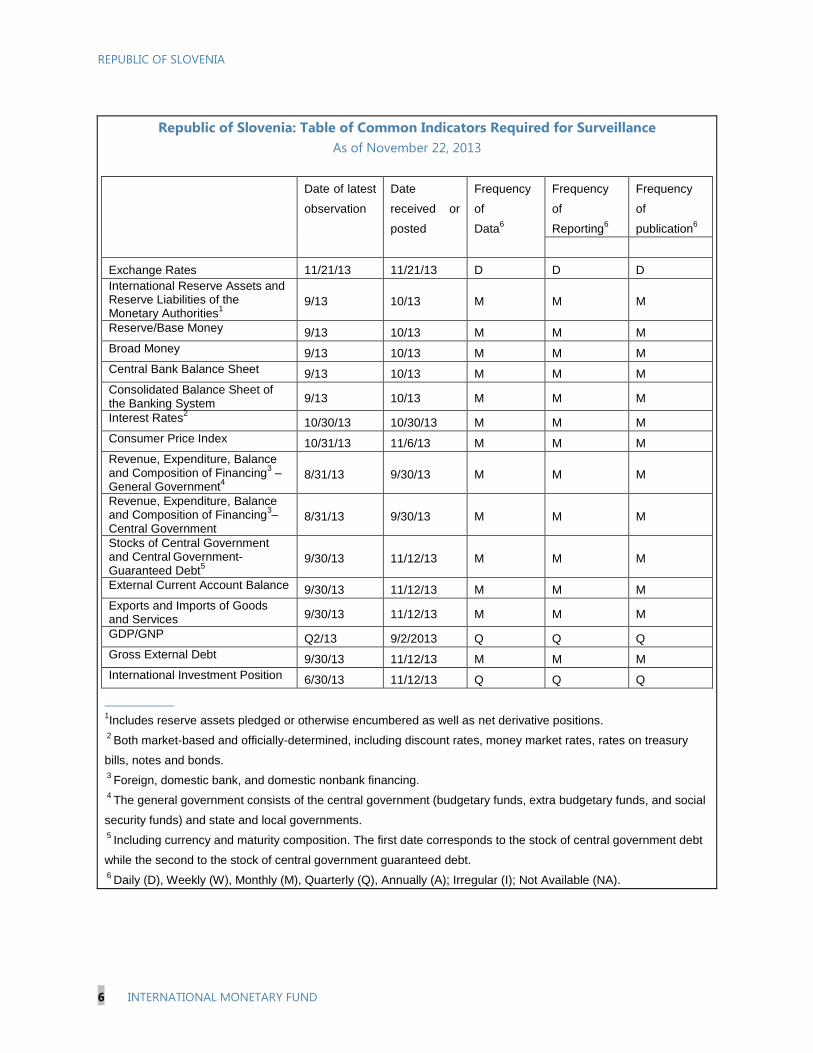
REPUBLIC OF SLOVENIA
6 INTERNATIONAL MONETARY FUND
Republic of Slovenia: Table of Common Indicators Required for Surveillance
As of November 22, 2013
Date of latest
observation
Date
received or
posted
Frequency
of
Data6
Frequency
of
Reporting6
Frequency
of
publication6
Exchange Rates 11/21/13 11/21/13 D D D
International Reserve Assets and Reserve Liabilities of the Monetary Authorities
1 9/13 10/13 M M M
Reserve/Base Money 9/13 10/13 M M M
Broad Money 9/13 10/13 M M M
Central Bank Balance Sheet 9/13 10/13 M M M
Consolidated Balance Sheet of the Banking System 9/13 10/13 M M M
Interest Rates2
10/30/13 10/30/13 M M M
Consumer Price Index 10/31/13 11/6/13 M M M
Revenue, Expenditure, Balance and Composition of Financing
3 –
General Government4
8/31/13 9/30/13 M M M
Revenue, Expenditure, Balance and Composition of Financing
3–
Central Government 8/31/13 9/30/13 M M M
Stocks of Central Government and Central
Government-
Guaranteed Debt5
9/30/13 11/12/13 M M M
External Current Account Balance 9/30/13 11/12/13 M M M
Exports and Imports of Goods and Services 9/30/13 11/12/13 M M M
GDP/GNP Q2/13 9/2/2013 Q Q Q
Gross External Debt
9/30/13 11/12/13 M M M
International Investment Position 6/30/13 11/12/13 Q Q Q
____________ 1Includes reserve assets pledged or otherwise encumbered as well as net derivative positions.
2 Both market-based and officially-determined, including discount rates, money market rates, rates on treasury
bills, notes and bonds. 3
Foreign, domestic bank, and domestic nonbank financing. 4
The general government consists of the central government (budgetary funds, extra budgetary funds, and social
security funds) and state and local governments.
5 Including currency and maturity composition. The first date corresponds to the stock of central government debt
while the second to the stock of central government guaranteed debt. 6
Daily (D), Weekly (W), Monthly (M), Quarterly (Q), Annually (A); Irregular (I); Not Available (NA).
REPUBLIC OF SLOVENIA STAFF REPORT FOR THE 2013 ARTICLE IV
CONSULTATION—DEBT SUSTAINABILITY ANALYSIS
PUBLIC DEBT SUSTAINABILITY ANALYSIS ______________________________________________ 2
EXTERNAL DEBT SUSTAINABILITY ANALYSIS _________________________________________10
Approved By Philip Gerson (EUR) and
Ranil Salgado (SPR)
Prepared by the Staff of the International Monetary Fund
December 27, 2013
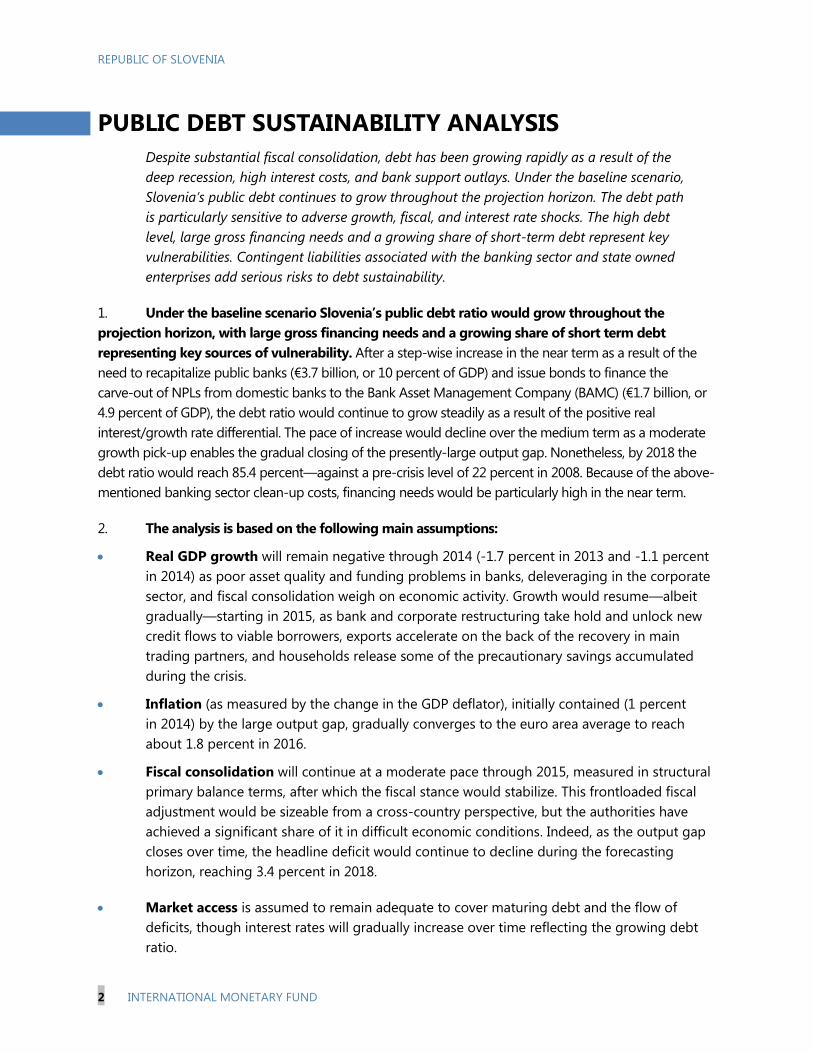
REPUBLIC OF SLOVENIA
2 INTERNATIONAL MONETARY FUND
PUBLIC DEBT SUSTAINABILITY ANALYSIS
Despite substantial fiscal consolidation, debt has been growing rapidly as a result of the
deep recession, high interest costs, and bank support outlays. Under the baseline scenario,
Slovenia’s public debt continues to grow throughout the projection horizon. The debt path
is particularly sensitive to adverse growth, fiscal, and interest rate shocks. The high debt
level, large gross financing needs and a growing share of short-term debt represent key
vulnerabilities. Contingent liabilities associated with the banking sector and state owned
enterprises add serious risks to debt sustainability.
1. Under the baseline scenario Slovenia’s public debt ratio would grow throughout the
projection horizon, with large gross financing needs and a growing share of short term debt
representing key sources of vulnerability. After a step-wise increase in the near term as a result of the
need to recapitalize public banks (€3.7 billion, or 10 percent of GDP) and issue bonds to finance the
carve-out of NPLs from domestic banks to the Bank Asset Management Company (BAMC) (€1.7 billion, or
4.9 percent of GDP), the debt ratio would continue to grow steadily as a result of the positive real
interest/growth rate differential. The pace of increase would decline over the medium term as a moderate
growth pick-up enables the gradual closing of the presently-large output gap. Nonetheless, by 2018 the
debt ratio would reach 85.4 percent—against a pre-crisis level of 22 percent in 2008. Because of the above-
mentioned banking sector clean-up costs, financing needs would be particularly high in the near term.
2. The analysis is based on the following main assumptions:
Real GDP growth will remain negative through 2014 (-1.7 percent in 2013 and -1.1 percent
in 2014) as poor asset quality and funding problems in banks, deleveraging in the corporate
sector, and fiscal consolidation weigh on economic activity. Growth would resume—albeit
gradually—starting in 2015, as bank and corporate restructuring take hold and unlock new
credit flows to viable borrowers, exports accelerate on the back of the recovery in main
trading partners, and households release some of the precautionary savings accumulated
during the crisis.
Inflation (as measured by the change in the GDP deflator), initially contained (1 percent
in 2014) by the large output gap, gradually converges to the euro area average to reach
about 1.8 percent in 2016.
Fiscal consolidation will continue at a moderate pace through 2015, measured in structural
primary balance terms, after which the fiscal stance would stabilize. This frontloaded fiscal
adjustment would be sizeable from a cross-country perspective, but the authorities have
achieved a significant share of it in difficult economic conditions. Indeed, as the output gap
closes over time, the headline deficit would continue to decline during the forecasting
horizon, reaching 3.4 percent in 2018.
Market access is assumed to remain adequate to cover maturing debt and the flow of
deficits, though interest rates will gradually increase over time reflecting the growing debt
ratio.
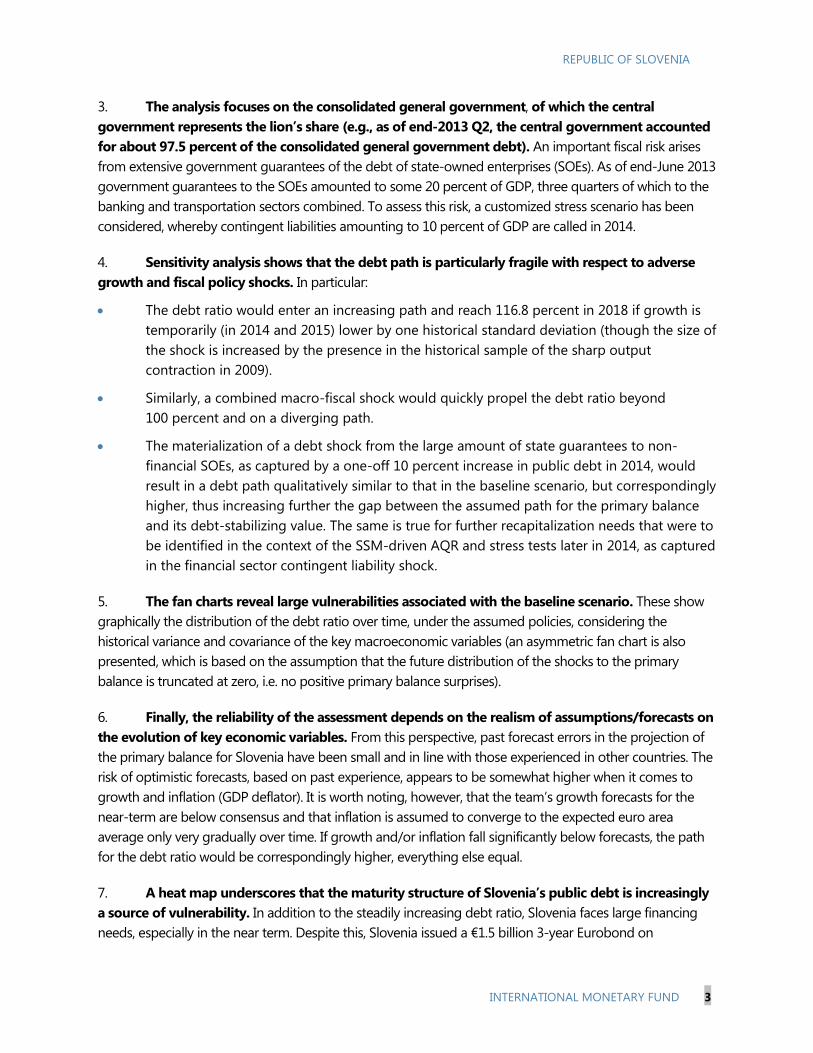
REPUBLIC OF SLOVENIA
INTERNATIONAL MONETARY FUND 3
3. The analysis focuses on the consolidated general government, of which the central
government represents the lion’s share (e.g., as of end-2013 Q2, the central government accounted
for about 97.5 percent of the consolidated general government debt). An important fiscal risk arises
from extensive government guarantees of the debt of state-owned enterprises (SOEs). As of end-June 2013
government guarantees to the SOEs amounted to some 20 percent of GDP, three quarters of which to the
banking and transportation sectors combined. To assess this risk, a customized stress scenario has been
considered, whereby contingent liabilities amounting to 10 percent of GDP are called in 2014.
4. Sensitivity analysis shows that the debt path is particularly fragile with respect to adverse
growth and fiscal policy shocks. In particular:
The debt ratio would enter an increasing path and reach 116.8 percent in 2018 if growth is
temporarily (in 2014 and 2015) lower by one historical standard deviation (though the size of
the shock is increased by the presence in the historical sample of the sharp output
contraction in 2009).
Similarly, a combined macro-fiscal shock would quickly propel the debt ratio beyond
100 percent and on a diverging path.
The materialization of a debt shock from the large amount of state guarantees to non-
financial SOEs, as captured by a one-off 10 percent increase in public debt in 2014, would
result in a debt path qualitatively similar to that in the baseline scenario, but correspondingly
higher, thus increasing further the gap between the assumed path for the primary balance
and its debt-stabilizing value. The same is true for further recapitalization needs that were to
be identified in the context of the SSM-driven AQR and stress tests later in 2014, as captured
in the financial sector contingent liability shock.
5. The fan charts reveal large vulnerabilities associated with the baseline scenario. These show
graphically the distribution of the debt ratio over time, under the assumed policies, considering the
historical variance and covariance of the key macroeconomic variables (an asymmetric fan chart is also
presented, which is based on the assumption that the future distribution of the shocks to the primary
balance is truncated at zero, i.e. no positive primary balance surprises).
6. Finally, the reliability of the assessment depends on the realism of assumptions/forecasts on
the evolution of key economic variables. From this perspective, past forecast errors in the projection of
the primary balance for Slovenia have been small and in line with those experienced in other countries. The
risk of optimistic forecasts, based on past experience, appears to be somewhat higher when it comes to
growth and inflation (GDP deflator). It is worth noting, however, that the team’s growth forecasts for the
near-term are below consensus and that inflation is assumed to converge to the expected euro area
average only very gradually over time. If growth and/or inflation fall significantly below forecasts, the path
for the debt ratio would be correspondingly higher, everything else equal.
7. A heat map underscores that the maturity structure of Slovenia’s public debt is increasingly
a source of vulnerability. In addition to the steadily increasing debt ratio, Slovenia faces large financing
needs, especially in the near term. Despite this, Slovenia issued a €1.5 billion 3-year Eurobond on
REPUBLIC OF SLOVENIA
4 INTERNATIONAL MONETARY FUND
November 15th, 2013, although at a relatively high coupon of 4.7 percent. In the baseline scenario, the
share of short-term debt is envisaged to increase steadily, underscoring once more the underlying
refinancing risks. Indeed a key source of risk is the possibility that the cost of market funding becomes
increasingly prohibitive and/or access to the funding becomes difficult, in which case Slovenia would need
to reduce its financing needs faster than presently envisaged.
8. The authorities broadly agree with staff’s assessment that further consolidation is needed to
lower the vulnerabilities associated with public debt dynamics. They consider that the quantum and
the pace will need to be reassessed in the context of bank and corporate restructuring. They also note that
future privatizations would reduce funding costs and help lower the gross debt ratio. Such privatizations
could also have a positive effect on potential growth by increasing the efficiency of the economy.
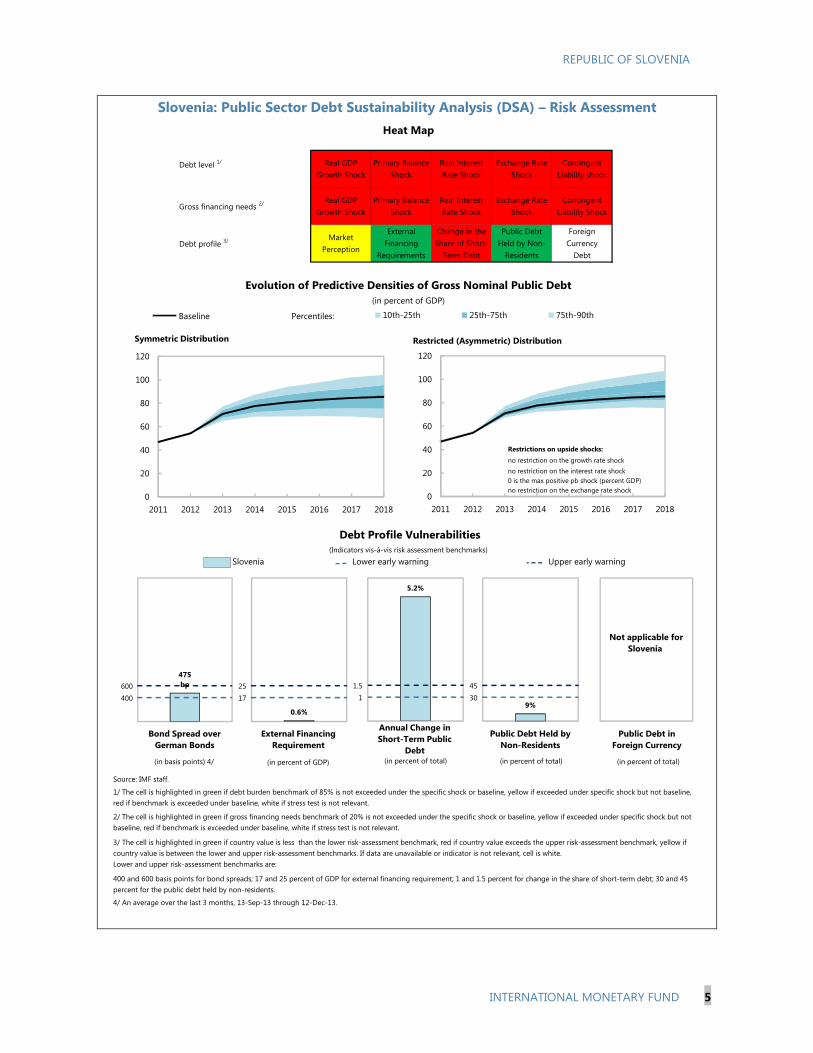
REPUBLIC OF SLOVENIA
INTERNATIONAL MONETARY FUND 5
Slovenia: Public Sector Debt Sustainability Analysis (DSA) – Risk Assessment
Slovenia
Source: IMF staff.
4/ An average over the last 3 months, 13-Sep-13 through 12-Dec-13.
Real GDP
Growth Shock
2/ The cell is highlighted in green if gross financing needs benchmark of 20% is not exceeded under the specific shock or baseline, yellow if exceeded under specific shock but not
baseline, red if benchmark is exceeded under baseline, white if stress test is not relevant.
1/ The cell is highlighted in green if debt burden benchmark of 85% is not exceeded under the specific shock or baseline, yellow if exceeded under specific shock but not baseline,
red if benchmark is exceeded under baseline, white if stress test is not relevant.
Real Interest
Rate Shock
External
Financing
Requirements
Real GDP
Growth Shock
Heat Map
Upper early warning
Evolution of Predictive Densities of Gross Nominal Public Debt
(in percent of GDP)
Debt profile 3/
Lower early warning
400 and 600 basis points for bond spreads; 17 and 25 percent of GDP for external financing requirement; 1 and 1.5 percent for change in the share of short-term debt; 30 and 45
percent for the public debt held by non-residents.
Foreign
Currency
Debt
Public Debt
Held by Non-
Residents
(Indicators vis-à-vis risk assessment benchmarks)
Market
Perception
Gross financing needs 2/
Primary Balance
Shock
Real Interest
Rate Shock
Exchange Rate
Shock
Contingent
Liability Shock
Primary Balance
Shock
Debt Profile Vulnerabilities
3/ The cell is highlighted in green if country value is less than the lower risk-assessment benchmark, red if country value exceeds the upper risk-assessment benchmark, yellow if
country value is between the lower and upper risk-assessment benchmarks. If data are unavailable or indicator is not relevant, cell is white.
Lower and upper risk-assessment benchmarks are:
Change in the
Share of Short-
Term Debt
Exchange Rate
Shock
Contingent
Liability shock
Debt level 1/
1 2
Not applicable for
Slovenia
400
600
475
bp
1 2
17
25
0.6%
1 2
1
1.5
5.2%
1 2
Bond Spread over
German Bonds
External Financing
Requirement
Annual Change in
Short-Term Public
Debt
Public Debt in
Foreign Currency
(in basis points) 4/ (in percent of GDP) (in percent of total) (in percent of total)
0
20
40
60
80
100
120
2011 2012 2013 2014 2015 2016 2017 2018
10th-25th 25th-75th 75th-90thPercentiles:Baseline
Symmetric Distribution
0
20
40
60
80
100
120
2011 2012 2013 2014 2015 2016 2017 2018
Restricted (Asymmetric) Distribution
no restriction on the growth rate shock
no restriction on the interest rate shock
0 is the max positive pb shock (percent GDP)
no restriction on the exchange rate shock
Restrictions on upside shocks:
30
45
9%
1 2
Public Debt Held by
Non-Residents
(in percent of total)

REPUBLIC OF SLOVENIA
6 INTERNATIONAL MONETARY FUND
Slovenia: Public DSA – Realism of Baseline Assumptions
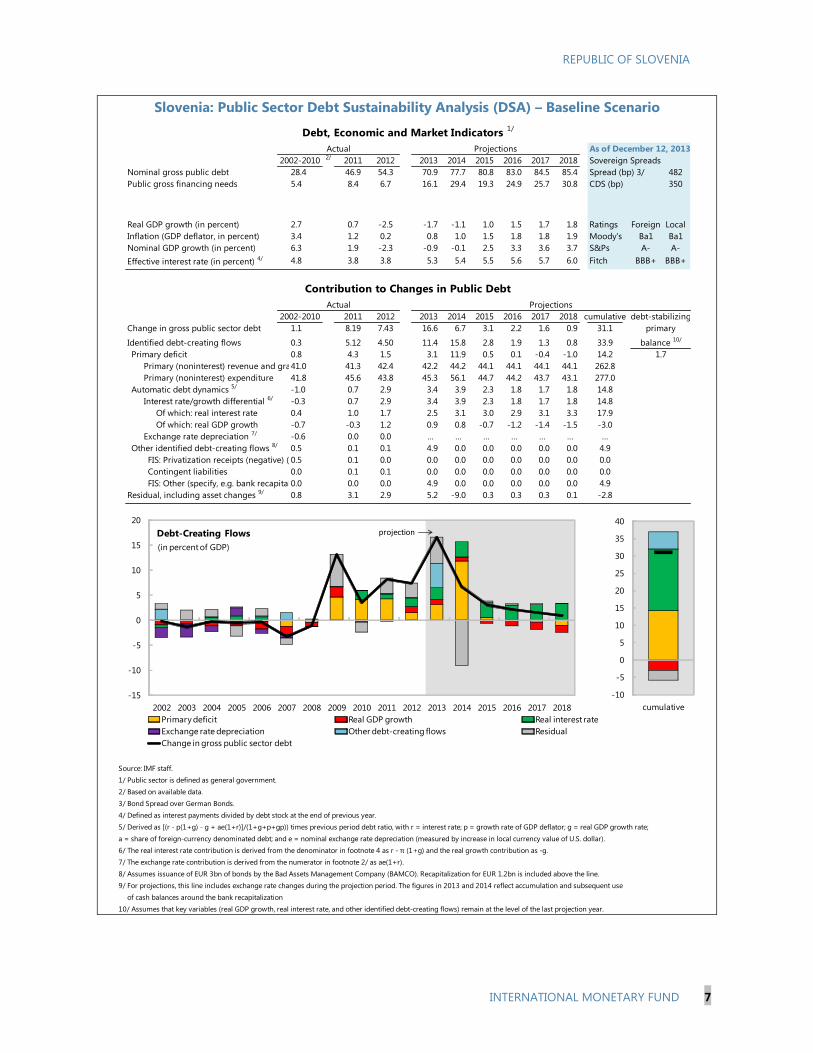
REPUBLIC OF SLOVENIA
INTERNATIONAL MONETARY FUND 7
Slovenia: Public Sector Debt Sustainability Analysis (DSA) – Baseline Scenario
As of December 12, 20132/
2011 2012 2013 2014 2015 2016 2017 2018 Sovereign Spreads
Nominal gross public debt 28.4 46.9 54.3 70.9 77.7 80.8 83.0 84.5 85.4 Spread (bp) 3/ 482
Public gross financing needs 5.4 8.4 6.7 16.1 29.4 19.3 24.9 25.7 30.8 CDS (bp) 350
Real GDP growth (in percent) 2.7 0.7 -2.5 -1.7 -1.1 1.0 1.5 1.7 1.8 Ratings Foreign Local
Inflation (GDP deflator, in percent) 3.4 1.2 0.2 0.8 1.0 1.5 1.8 1.8 1.9 Moody's Ba1 Ba1
Nominal GDP growth (in percent) 6.3 1.9 -2.3 -0.9 -0.1 2.5 3.3 3.6 3.7 S&Ps A- A-
Effective interest rate (in percent) 4/ 4.8 3.8 3.8 5.3 5.4 5.5 5.6 5.7 6.0 Fitch BBB+ BBB+
2011 2012 2013 2014 2015 2016 2017 2018 cumulative
Change in gross public sector debt 1.1 8.19 7.43 16.6 6.7 3.1 2.2 1.6 0.9 31.1
Identified debt-creating flows 0.3 5.12 4.50 11.4 15.8 2.8 1.9 1.3 0.8 33.9
Primary deficit 0.8 4.3 1.5 3.1 11.9 0.5 0.1 -0.4 -1.0 14.2
Primary (noninterest) revenue and grants41.0 41.3 42.4 42.2 44.2 44.1 44.1 44.1 44.1 262.8
Primary (noninterest) expenditure 41.8 45.6 43.8 45.3 56.1 44.7 44.2 43.7 43.1 277.0
Automatic debt dynamics 5/
-1.0 0.7 2.9 3.4 3.9 2.3 1.8 1.7 1.8 14.8
Interest rate/growth differential 6/
-0.3 0.7 2.9 3.4 3.9 2.3 1.8 1.7 1.8 14.8
Of which: real interest rate 0.4 1.0 1.7 2.5 3.1 3.0 2.9 3.1 3.3 17.9
Of which: real GDP growth -0.7 -0.3 1.2 0.9 0.8 -0.7 -1.2 -1.4 -1.5 -3.0
Exchange rate depreciation 7/
-0.6 0.0 0.0 … … … … … … …
Other identified debt-creating flows 8/
0.5 0.1 0.1 4.9 0.0 0.0 0.0 0.0 0.0 4.9
FIS: Privatization receipts (negative) (negative)0.5 0.1 0.0 0.0 0.0 0.0 0.0 0.0 0.0 0.0
Contingent liabilities 0.0 0.1 0.1 0.0 0.0 0.0 0.0 0.0 0.0 0.0
FIS: Other (specify, e.g. bank recapitalization)0.0 0.0 0.0 4.9 0.0 0.0 0.0 0.0 0.0 4.9
Residual, including asset changes 9/
0.8 3.1 2.9 5.2 -9.0 0.3 0.3 0.3 0.1 -2.8
Source: IMF staff.
1/ Public sector is defined as general government.
2/ Based on available data.
3/ Bond Spread over German Bonds.
4/ Defined as interest payments divided by debt stock at the end of previous year.
5/ Derived as [(r - p(1+g) - g + ae(1+r)]/(1+g+p+gp)) times previous period debt ratio, with r = interest rate; p = growth rate of GDP deflator; g = real GDP growth rate;
a = share of foreign-currency denominated debt; and e = nominal exchange rate depreciation (measured by increase in local currency value of U.S. dollar).
6/ The real interest rate contribution is derived from the denominator in footnote 4 as r - π (1+g) and the real growth contribution as -g.
7/ The exchange rate contribution is derived from the numerator in footnote 2/ as ae(1+r).
8/ Assumes issuance of EUR 3bn of bonds by the Bad Assets Management Company (BAMCO). Recapitalization for EUR 1.2bn is included above the line.
9/ For projections, this line includes exchange rate changes during the projection period. The figures in 2013 and 2014 reflect accumulation and subsequent use
of cash balances around the bank recapitalization
10/ Assumes that key variables (real GDP growth, real interest rate, and other identified debt-creating flows) remain at the level of the last projection year.
1.7
balance 10/
primary
Debt, Economic and Market Indicators 1/
2002-2010
Actual
Projections
Contribution to Changes in Public Debt
Projections
2002-2010
Actual
debt-stabilizing
-10
-5
0
5
10
15
20
25
30
35
40
cumulative
-15
-10
-5
0
5
10
15
20
2002 2003 2004 2005 2006 2007 2008 2009 2010 2011 2012 2013 2014 2015 2016 2017 2018
Debt-Creating Flows
Primary deficit Real GDP growth Real interest rate
Exchange rate depreciation Other debt-creating flows Residual
Change in gross public sector debt
projection
(in percent of GDP)
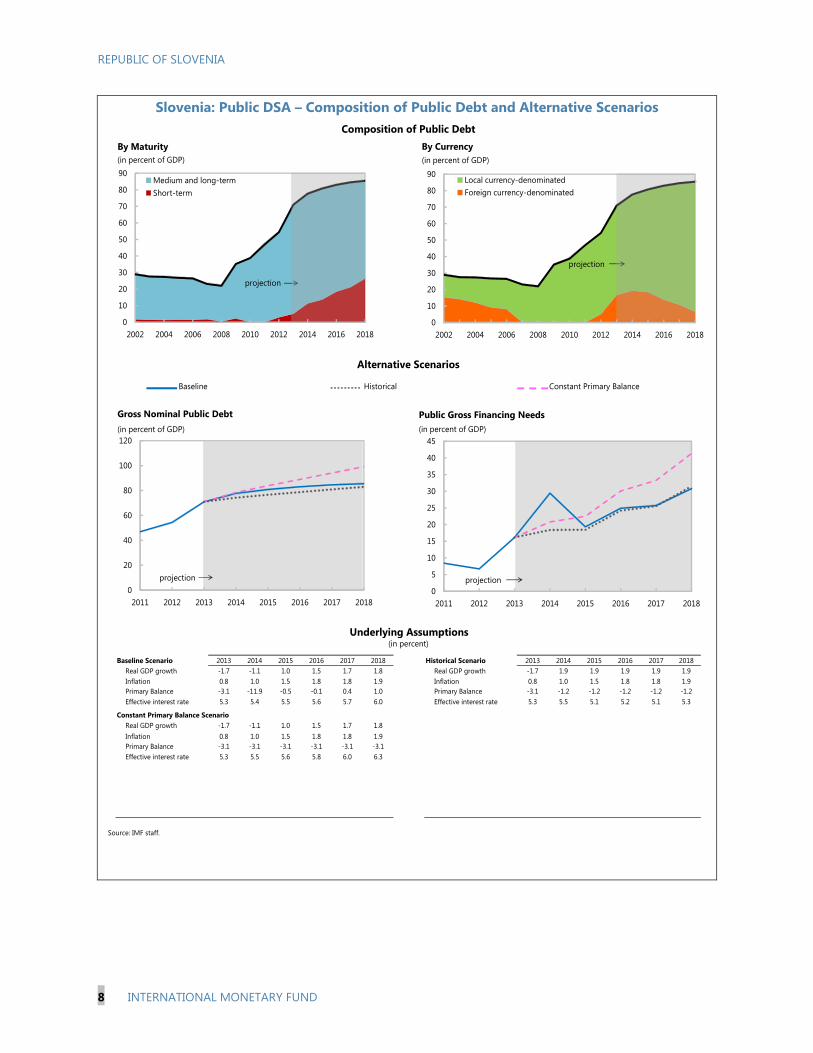
REPUBLIC OF SLOVENIA
8 INTERNATIONAL MONETARY FUND
Slovenia: Public DSA – Composition of Public Debt and Alternative Scenarios
Baseline Scenario 2013 2014 2015 2016 2017 2018 Historical Scenario 2013 2014 2015 2016 2017 2018
Real GDP growth -1.7 -1.1 1.0 1.5 1.7 1.8 Real GDP growth -1.7 1.9 1.9 1.9 1.9 1.9
Inflation 0.8 1.0 1.5 1.8 1.8 1.9 Inflation 0.8 1.0 1.5 1.8 1.8 1.9
Primary Balance -3.1 -11.9 -0.5 -0.1 0.4 1.0 Primary Balance -3.1 -1.2 -1.2 -1.2 -1.2 -1.2
Effective interest rate 5.3 5.4 5.5 5.6 5.7 6.0 Effective interest rate 5.3 5.5 5.1 5.2 5.1 5.3
Constant Primary Balance Scenario
Real GDP growth -1.7 -1.1 1.0 1.5 1.7 1.8
Inflation 0.8 1.0 1.5 1.8 1.8 1.9
Primary Balance -3.1 -3.1 -3.1 -3.1 -3.1 -3.1
Effective interest rate 5.3 5.5 5.6 5.8 6.0 6.3
Source: IMF staff.
Underlying Assumptions(in percent)
Alternative Scenarios
Composition of Public Debt
Baseline Historical Constant Primary Balance
0
20
40
60
80
100
120
2011 2012 2013 2014 2015 2016 2017 2018
Gross Nominal Public Debt
(in percent of GDP)
projection
0
5
10
15
20
25
30
35
40
45
2011 2012 2013 2014 2015 2016 2017 2018
Public Gross Financing Needs
(in percent of GDP)
projection
0
10
20
30
40
50
60
70
80
90
2002 2004 2006 2008 2010 2012 2014 2016 2018
By Maturity
Medium and long-term
Short-term
projection
(in percent of GDP)
0
10
20
30
40
50
60
70
80
90
2002 2004 2006 2008 2010 2012 2014 2016 2018
By Currency
Local currency-denominated
Foreign currency-denominated
projection
(in percent of GDP)
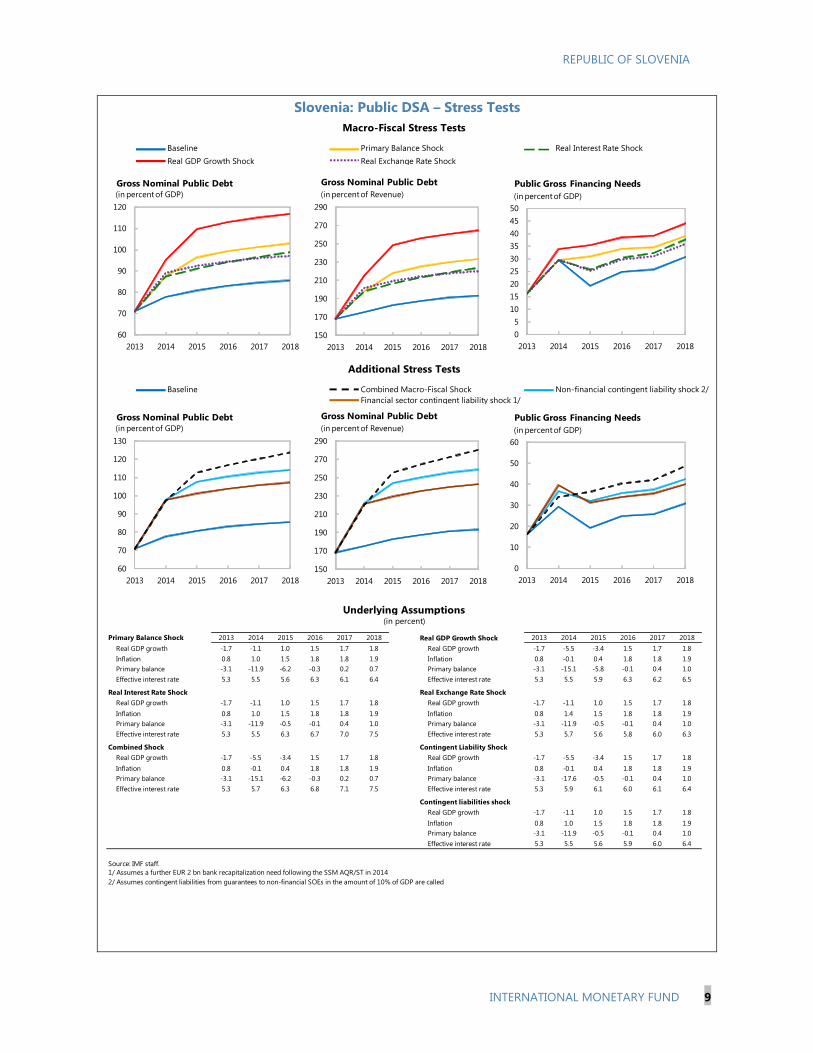
REPUBLIC OF SLOVENIA
INTERNATIONAL MONETARY FUND 9
Slovenia: Public DSA – Stress Tests
Primary Balance Shock 2013 2014 2015 2016 2017 2018 Real GDP Growth Shock 2013 2014 2015 2016 2017 2018
Real GDP growth -1.7 -1.1 1.0 1.5 1.7 1.8 Real GDP growth -1.7 -5.5 -3.4 1.5 1.7 1.8
Inflation 0.8 1.0 1.5 1.8 1.8 1.9 Inflation 0.8 -0.1 0.4 1.8 1.8 1.9
Primary balance -3.1 -11.9 -6.2 -0.3 0.2 0.7 Primary balance -3.1 -15.1 -5.8 -0.1 0.4 1.0
Effective interest rate 5.3 5.5 5.6 6.3 6.1 6.4 Effective interest rate 5.3 5.5 5.9 6.3 6.2 6.5
Real Interest Rate Shock Real Exchange Rate Shock
Real GDP growth -1.7 -1.1 1.0 1.5 1.7 1.8 Real GDP growth -1.7 -1.1 1.0 1.5 1.7 1.8
Inflation 0.8 1.0 1.5 1.8 1.8 1.9 Inflation 0.8 1.4 1.5 1.8 1.8 1.9
Primary balance -3.1 -11.9 -0.5 -0.1 0.4 1.0 Primary balance -3.1 -11.9 -0.5 -0.1 0.4 1.0
Effective interest rate 5.3 5.5 6.3 6.7 7.0 7.5 Effective interest rate 5.3 5.7 5.6 5.8 6.0 6.3
Combined Shock Contingent Liability Shock
Real GDP growth -1.7 -5.5 -3.4 1.5 1.7 1.8 Real GDP growth -1.7 -5.5 -3.4 1.5 1.7 1.8
Inflation 0.8 -0.1 0.4 1.8 1.8 1.9 Inflation 0.8 -0.1 0.4 1.8 1.8 1.9
Primary balance -3.1 -15.1 -6.2 -0.3 0.2 0.7 Primary balance -3.1 -17.6 -0.5 -0.1 0.4 1.0
Effective interest rate 5.3 5.7 6.3 6.8 7.1 7.5 Effective interest rate 5.3 5.9 6.1 6.0 6.1 6.4
Contingent liabilities shock
Real GDP growth -1.7 -1.1 1.0 1.5 1.7 1.8
Inflation 0.8 1.0 1.5 1.8 1.8 1.9
Primary balance -3.1 -11.9 -0.5 -0.1 0.4 1.0
Effective interest rate 5.3 5.5 5.6 5.9 6.0 6.4
Source: IMF staff.
1/ Assumes a further EUR 2 bn bank recapitalization need following the SSM AQR/ST in 2014
2/ Assumes contingent liabilities from guarantees to non-financial SOEs in the amount of 10% of GDP are called
Macro-Fiscal Stress Tests
Baseline Primary Balance Shock
Real GDP Growth Shock
Real Interest Rate Shock
(in percent)
Real Exchange Rate Shock
Combined Macro-Fiscal Shock
Additional Stress Tests
Baseline
Underlying Assumptions
Non-financial contingent liability shock 2/
Financial sector contingent liability shock 1/
60
70
80
90
100
110
120
2013 2014 2015 2016 2017 2018
Gross Nominal Public Debt(in percent of GDP)
150
170
190
210
230
250
270
290
2013 2014 2015 2016 2017 2018
Gross Nominal Public Debt
(in percent of Revenue)
0
5
10
15
20
25
30
35
40
45
50
2013 2014 2015 2016 2017 2018
Public Gross Financing Needs
(in percent of GDP)
60
70
80
90
100
110
120
130
2013 2014 2015 2016 2017 2018
Gross Nominal Public Debt(in percent of GDP)
150
170
190
210
230
250
270
290
2013 2014 2015 2016 2017 2018
Gross Nominal Public Debt
(in percent of Revenue)
0
10
20
30
40
50
60
2013 2014 2015 2016 2017 2018
Public Gross Financing Needs
(in percent of GDP)
REPUBLIC OF SLOVENIA
10 INTERNATIONAL MONETARY FUND
EXTERNAL DEBT SUSTAINABILITY ANALYSIS
Slovenia had a high external debt-to-GDP ratio of 116 percent at end 2012 that has been
growing as the deep recession reduced nominal GDP and the public sector raised
financing abroad. This ratio is projected to peak in 2014 and starts to fall very gradually
thereafter. Slovenia’s external claims are substantial at 60 percent of GDP at end 2012
and projected to grow more rapidly, with the result that net external debt is at a relatively
comfortable level and falling rapidly. The projected decline in gross debt is particularly
sensitive to a negative growth shock given that it is driven by economic recovery.
1. Under the baseline scenario Slovenia’s external debt ratio starts to decline modestly in 2015
as its gross external financing needs are offset by the recovery in nominal GDP. External debt
increases between 2013 and 2014 as external debt purchases of debt issued to finance the bank
recapitalization adds to external financing of the deficit. After 2014, however, external debt issuance is
driven primarily by budget deficit financing needs that are not large enough to offset the effect on the ratio
of the rebound in nominal GDP given the fiscal consolidation that has occurred and is projected to
continue.
2. The analysis is based on the macroeconomic assumptions outlined above in the public DSA.
There government is assumed to be the primary issuer of external debt as bank and non-financial private
sector institutions are deleveraging abroad and have a limited need to borrow externally. External debt is
distributed fairly evenly across the government, banks and the non-financial private sectors. Within the
latter, debt is largely trade credit and loans to exporters, and unlikely to involve significant contingent
liabilities for the government.
Sensitivity analysis shows that the external debt path is particularly sensitive with respect to
adverse growth shocks and a reversion to historical averages. In particular, the external debt
ratio continues to increase throughout the projections horizon in both scenarios. In contrast, the
interest rate and depreciation shocks do not pose significant risks to external debt sustainability.
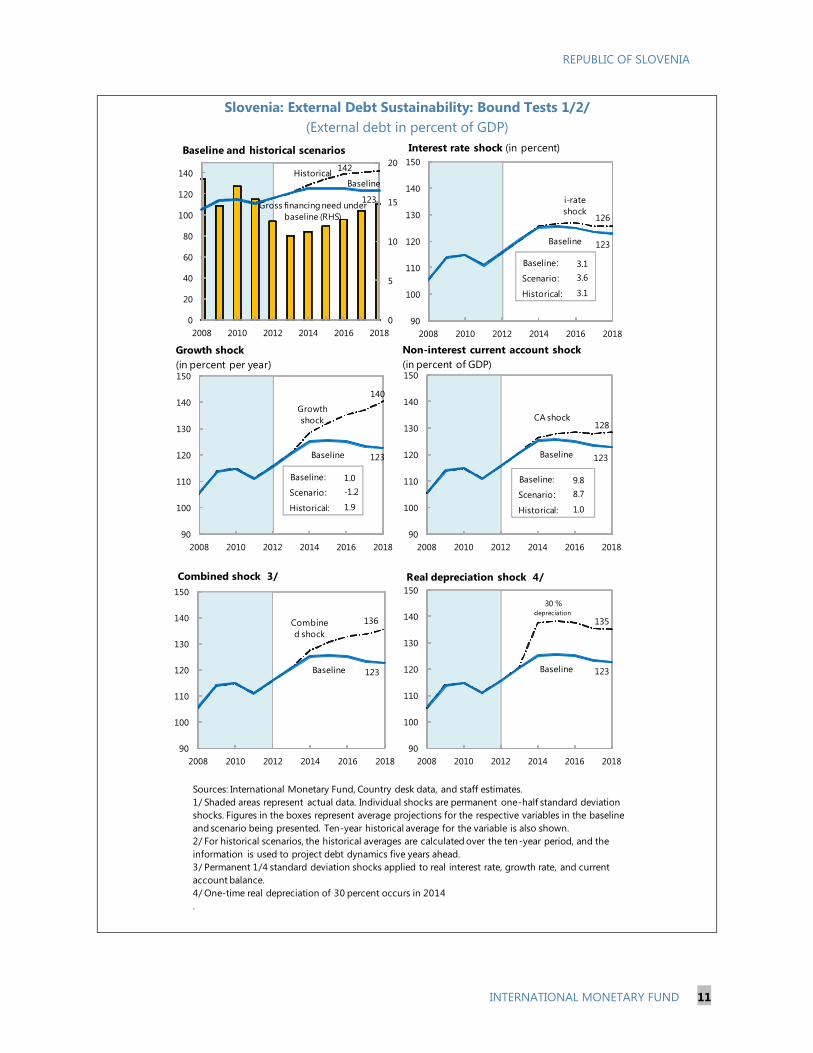
REPUBLIC OF SLOVENIA
INTERNATIONAL MONETARY FUND 11
Slovenia: External Debt Sustainability: Bound Tests 1/2/
(External debt in percent of GDP)
i-rate
shock126
Baseline 123
90
100
110
120
130
140
150
2008 2010 2012 2014 2016 2018
Interest rate shock (in percent)
Sources: International Monetary Fund, Country desk data, and staff estimates.
1/ Shaded areas represent actual data. Individual shocks are permanent one-half standard deviation
shocks. Figures in the boxes represent average projections for the respective variables in the baseline
and scenario being presented. Ten-year historical average for the variable is also shown.
2/ For historical scenarios, the historical averages are calculated over the ten-year period, and the
information is used to project debt dynamics five years ahead.
3/ Permanent 1/4 standard deviation shocks applied to real interest rate, growth rate, and current
account balance.
4/ One-time real depreciation of 30 percent occurs in 2014
.
Historical142
Baseline
123
0
5
10
15
20
0
20
40
60
80
100
120
140
2008 2010 2012 2014 2016 2018
Baseline and historical scenarios
CA shock 128
Baseline 123
90
100
110
120
130
140
150
2008 2010 2012 2014 2016 2018
Combine
d shock
136
Baseline 123
90
100
110
120
130
140
150
2008 2010 2012 2014 2016 2018
Combined shock 3/
30 % depreciation
135
Baseline 123
90
100
110
120
130
140
150
2008 2010 2012 2014 2016 2018
Real depreciation shock 4/
Gross financing need under
baseline (RHS)
Non-interest current account shock
(in percent of GDP)
Growth
shock
140
Baseline 123
90
100
110
120
130
140
150
2008 2010 2012 2014 2016 2018
Baseline:
Scenario:
Historical:
3.1
3.6
3.1
Baseline:
Scenario:
Historical:
1.0
-1.2
1.9
Baseline:
Scenario:
Historical:
9.8
8.7
1.0
Growth shock
(in percent per year)
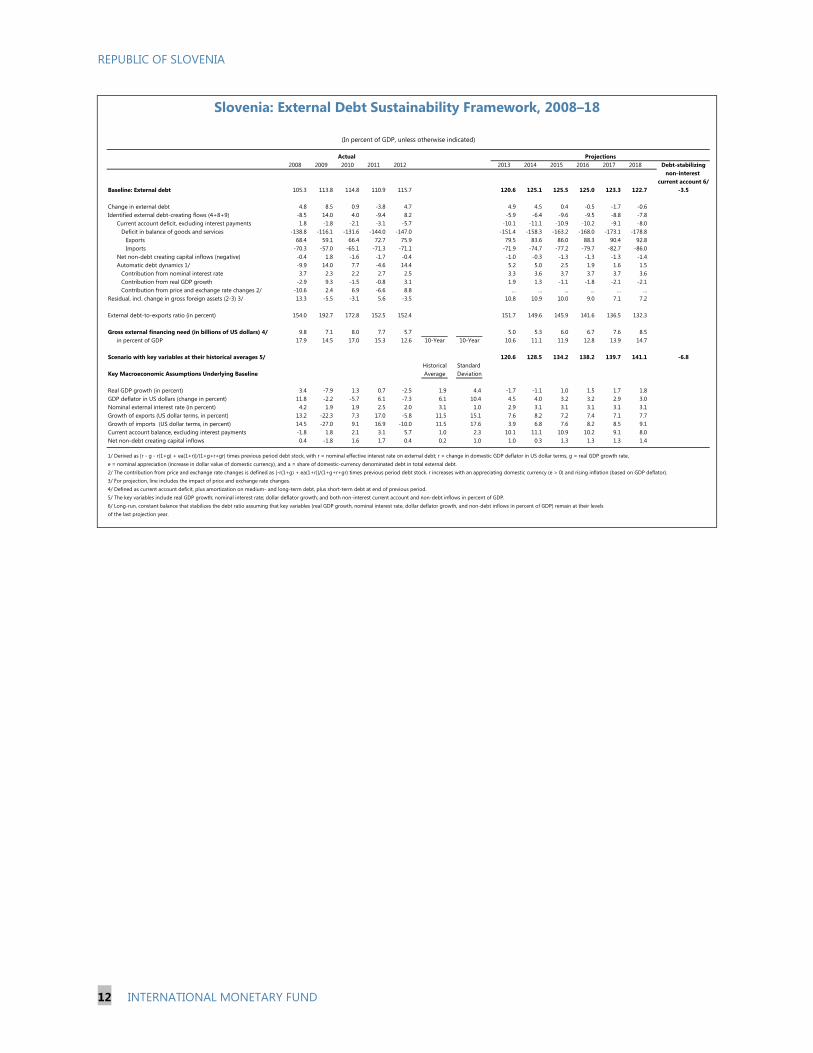
REPUBLIC OF SLOVENIA
12 INTERNATIONAL MONETARY FUND
Slovenia: External Debt Sustainability Framework, 2008–18
Projections
2008 2009 2010 2011 2012 2013 2014 2015 2016 2017 2018 Debt-stabilizing
non-interest
current account 6/
Baseline: External debt 105.3 113.8 114.8 110.9 115.7 120.6 125.1 125.5 125.0 123.3 122.7 -3.5
Change in external debt 4.8 8.5 0.9 -3.8 4.7 4.9 4.5 0.4 -0.5 -1.7 -0.6
Identified external debt-creating flows (4+8+9) -8.5 14.0 4.0 -9.4 8.2 -5.9 -6.4 -9.6 -9.5 -8.8 -7.8
Current account deficit, excluding interest payments 1.8 -1.8 -2.1 -3.1 -5.7 -10.1 -11.1 -10.9 -10.2 -9.1 -8.0
Deficit in balance of goods and services -138.8 -116.1 -131.6 -144.0 -147.0 -151.4 -158.3 -163.2 -168.0 -173.1 -178.8
Exports 68.4 59.1 66.4 72.7 75.9 79.5 83.6 86.0 88.3 90.4 92.8
Imports -70.3 -57.0 -65.1 -71.3 -71.1 -71.9 -74.7 -77.2 -79.7 -82.7 -86.0
Net non-debt creating capital inflows (negative) -0.4 1.8 -1.6 -1.7 -0.4 -1.0 -0.3 -1.3 -1.3 -1.3 -1.4
Automatic debt dynamics 1/ -9.9 14.0 7.7 -4.6 14.4 5.2 5.0 2.5 1.9 1.6 1.5
Contribution from nominal interest rate 3.7 2.3 2.2 2.7 2.5 3.3 3.6 3.7 3.7 3.7 3.6
Contribution from real GDP growth -2.9 9.3 -1.5 -0.8 3.1 1.9 1.3 -1.1 -1.8 -2.1 -2.1
Contribution from price and exchange rate changes 2/ -10.6 2.4 6.9 -6.6 8.8 ... ... ... ... ... ...
Residual, incl. change in gross foreign assets (2-3) 3/ 13.3 -5.5 -3.1 5.6 -3.5 10.8 10.9 10.0 9.0 7.1 7.2
External debt-to-exports ratio (in percent) 154.0 192.7 172.8 152.5 152.4 151.7 149.6 145.9 141.6 136.5 132.3
Gross external financing need (in billions of US dollars) 4/ 9.8 7.1 8.0 7.7 5.7 5.0 5.3 6.0 6.7 7.6 8.5
in percent of GDP 17.9 14.5 17.0 15.3 12.6 10-Year 10-Year 10.6 11.1 11.9 12.8 13.9 14.7
Scenario with key variables at their historical averages 5/ 120.6 128.5 134.2 138.2 139.7 141.1 -6.8
Historical Standard
Key Macroeconomic Assumptions Underlying Baseline Average Deviation
Real GDP growth (in percent) 3.4 -7.9 1.3 0.7 -2.5 1.9 4.4 -1.7 -1.1 1.0 1.5 1.7 1.8
GDP deflator in US dollars (change in percent) 11.8 -2.2 -5.7 6.1 -7.3 6.1 10.4 4.5 4.0 3.2 3.2 2.9 3.0
Nominal external interest rate (in percent) 4.2 1.9 1.9 2.5 2.0 3.1 1.0 2.9 3.1 3.1 3.1 3.1 3.1
Growth of exports (US dollar terms, in percent) 13.2 -22.3 7.3 17.0 -5.8 11.5 15.1 7.6 8.2 7.2 7.4 7.1 7.7
Growth of imports (US dollar terms, in percent) 14.5 -27.0 9.1 16.9 -10.0 11.5 17.6 3.9 6.8 7.6 8.2 8.5 9.1
Current account balance, excluding interest payments -1.8 1.8 2.1 3.1 5.7 1.0 2.3 10.1 11.1 10.9 10.2 9.1 8.0
Net non-debt creating capital inflows 0.4 -1.8 1.6 1.7 0.4 0.2 1.0 1.0 0.3 1.3 1.3 1.3 1.4
1/ Derived as [r - g - r(1+g) + ea(1+r)]/(1+g+r+gr) times previous period debt stock, with r = nominal effective interest rate on external debt; r = change in domestic GDP deflator in US dollar terms, g = real GDP growth rate,
e = nominal appreciation (increase in dollar value of domestic currency), and a = share of domestic-currency denominated debt in total external debt.
2/ The contribution from price and exchange rate changes is defined as [-r(1+g) + ea(1+r)]/(1+g+r+gr) times previous period debt stock. r increases with an appreciating domestic currency (e > 0) and rising inflation (based on GDP deflator).
3/ For projection, line includes the impact of price and exchange rate changes.
4/ Defined as current account deficit, plus amortization on medium- and long-term debt, plus short-term debt at end of previous period.
5/ The key variables include real GDP growth; nominal interest rate; dollar deflator growth; and both non-interest current account and non-debt inflows in percent of GDP.
6/ Long-run, constant balance that stabilizes the debt ratio assuming that key variables (real GDP growth, nominal interest rate, dollar deflator growth, and non-debt inflows in percent of GDP) remain at their levels
of the last projection year.
Actual
(In percent of GDP, unless otherwise indicated)
Press Release No. 14/13
FOR IMMEDIATE RELEASE
January 17, 2014
IMF Executive Board Concludes 2013 Article IV Consultation with
the Republic of Slovenia
On January 13, 2014, the Executive Board of the International Monetary Fund (IMF)
concluded the Article IV consultation1 with the Republic of Slovenia.
After a brief stabilization in 2010, the recession resumed in 2011 and the economy now has
contracted for eight consecutive quarters. While a sharp contraction in investment was the
main driver of the downturn in the early stages, consumption—until then buffered by healthy
household balance sheets—also started to decline from 2012, weighed down by deep fiscal
cuts, stagnant wages, and growing uncertainty. The current account has moved into a
substantial surplus. While competitiveness is on the mend, the bulk of the external
adjustment has come from import compression. In all, through mid-2013, real GDP has fallen
by 11 percent from its pre-crisis peak, the largest output loss among the euro area members
after Greece.
The combination of an overly indebted corporate sector and weak banks has led to a vicious
circle of deepening recession, mounting bankruptcies, rising nonperforming loans (NPLs),
and further deleveraging. NPLs (inclusive of guarantees) increased from 11.2 percent at end-
2011 to 20.9 percent by end-October 2013. NPLs are highly concentrated in large corporate
debtors and in state banks. The deterioration in asset quality has led to an erosion of
profitability and capitalization, forcing banks into deleveraging. At the same time, Slovenian
corporates have one of the highest leverage ratios in the euro area, mainly because of a lack
of equity. The average interest bill to earnings ratio has reached 90 percent, pushing into the
red companies that might be viable with lower debt.
1 Under Article IV of the IMF's Articles of Agreement, the IMF holds bilateral discussions with members,
usually every year. A staff team visits the country, collects economic and financial information, and discusses
with officials the country's economic developments and policies. On return to headquarters, the staff prepares a
report, which forms the basis for discussion by the Executive Board.
International Monetary Fund
Washington, D.C. 20431 USA
2
On December 12, 2013, the Slovenian authorities announced the results of the
comprehensive bank asset quality review and stress test exercise carried out by independent
consultants. The exercise found that the banking system would need €4.8 billion in additional
capital to withstand a severe adverse macroeconomic scenario. The authorities have since
proceeded to address these capital needs by recapitalizing the three state-owned banks from
budgetary resources, with the remaining five banks expected to raise private capital in the
first half of 2014.
Public debt has been increasing rapidly. Before the global financial crisis public debt was
low (22 percent of GDP) and the fiscal position close to balance. The prolonged recession
and the burden of supporting the state-owned banks have put public finances under
considerable strain. Public debt has more than doubled since 2008, reaching 55 percent of
GDP by end-2012, and is set to increase sharply after bank restructuring. The deficit is slated
to exceed 4 percent of GDP in 2013 (excluding bank support costs), despite a significant
fiscal consolidation over the last three years. Reflecting in part concerns about the fiscal
impact of bank restructuring, government bond yields averaged about 2 percentage points
higher than in similarly-rated Spain and Italy in the second half of 2013, posing a challenge
for debt sustainability, before moderating to about 1 percent following the announcement of
the bank asset quality review results.
Executive Board Assessment2
Executive Directors noted that, with the economy still in recession, comprehensive bank and
corporate restructuring is essential to achieve financial stability, fiscal and debt sustainability,
and durable growth, and called on the Slovenian authorities to step up the current reform
effort. Directors welcomed as key milestones the completion of the bank asset quality
review and stress tests, recent bank recapitalization, ongoing transference of banks’ problem
loans to the Bank Asset Management Company (BAMC), and the adoption of new
insolvency legislation.
Directors supported the authorities’ 2014 fiscal deficit target, but raised concerns about the
quality of the fiscal measures underpinning the budget. They advised more ambitious public
employment reduction, better targeting of social transfers, and specific cuts in transfers and
subsidies. Directors noted that further gradual consolidation would be necessary beyond 2014
to support debt sustainability in the face of sizeable government guarantees and bank
restructuring costs, and highlighted the need for pension reform, given unfavorable
demographic trends.
2 At the conclusion of the discussion, the Managing Director, as Chairman of the Board, summarizes the views
of Executive Directors, and this summary is transmitted to the country's authorities. An explanation of any
qualifiers used in summings up can be found here: http://www.imf.org/external/np/sec/misc/qualifiers.htm.
3
Directors underscored that durable financial stability hinges on reducing banks’
vulnerabilities through improved bank governance, risk management, and profitability. In
this regard, reducing the role of the state, including through privatization, is particularly
important. Directors also recommended strengthening financial sector supervision and
addressing shortcomings in the bank resolution framework. At the same time, Directors noted
that public banks should focus on core activities, including through divestment of their
corporate holdings, and that limiting connected lending is essential to contain moral hazard
and excessive risk taking.
Directors emphasized that comprehensive non financial corporate restructuring that addresses
the debt overhang is essential to break the negative feedback loop of recession, bank
deleveraging, and corporate distress, which has been at the root of Slovenia’s recent
problems. They cautioned that budgetary support of distressed corporates would amplify
fiscal risks, and should be avoided given limited fiscal space. Directors encouraged the
authorities to utilize the tools provided by the BAMC and the new insolvency law for
restructuring the sector, and welcomed the recent launching of the privatization program.
They supported the authorities’ plans to adopt a coherent state owned enterprise management
strategy and a centralized management agency for state assets.
Directors welcomed the reduction in unit labor costs and labor market rigidities that have
enhanced Slovenia’s external competitiveness. They called for further regulatory and product
market reforms to strengthen the business climate and better attract foreign direct investment.
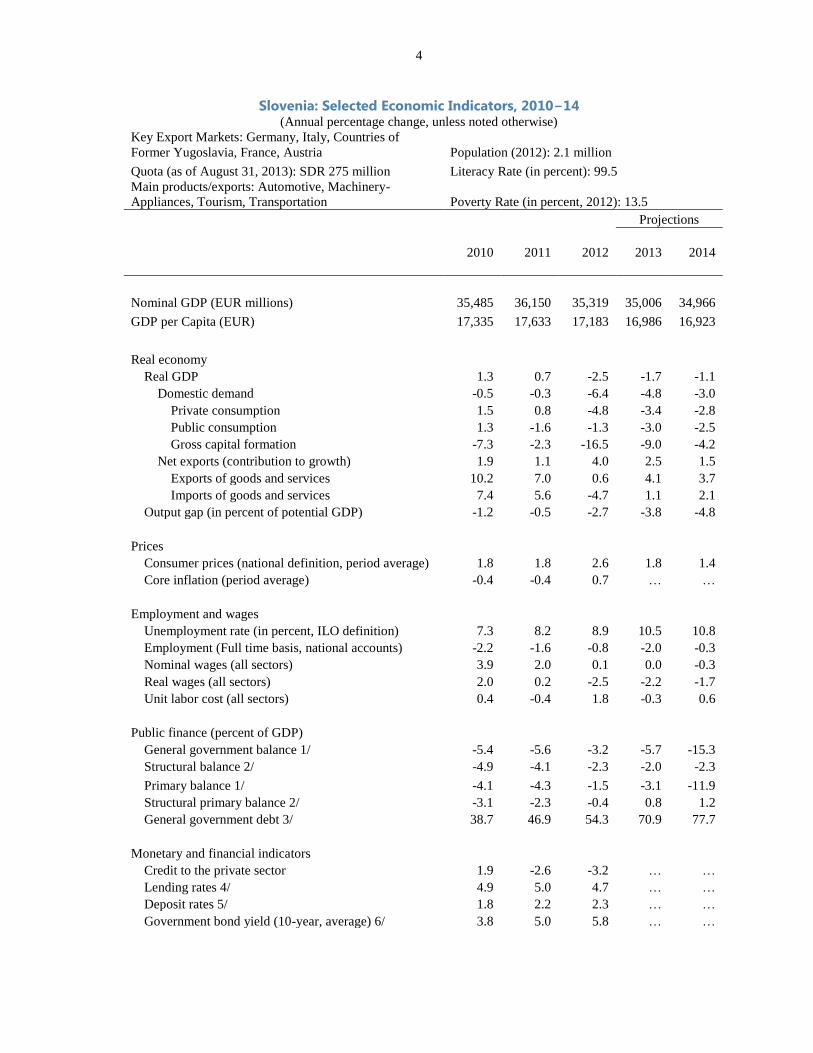
4
Slovenia: Selected Economic Indicators, 2010−14 (Annual percentage change, unless noted otherwise)
Key Export Markets: Germany, Italy, Countries of
Former Yugoslavia, France, Austria Population (2012): 2.1 million
Quota (as of August 31, 2013): SDR 275 million Literacy Rate (in percent): 99.5
Main products/exports: Automotive, Machinery-
Appliances, Tourism, Transportation Poverty Rate (in percent, 2012): 13.5
Projections
2010 2011 2012 2013 2014
Nominal GDP (EUR millions) 35,485 36,150 35,319 35,006 34,966
GDP per Capita (EUR) 17,335 17,633 17,183 16,986 16,923
Real economy
Real GDP 1.3 0.7 -2.5 -1.7 -1.1
Domestic demand -0.5 -0.3 -6.4 -4.8 -3.0
Private consumption 1.5 0.8 -4.8 -3.4 -2.8
Public consumption 1.3 -1.6 -1.3 -3.0 -2.5
Gross capital formation -7.3 -2.3 -16.5 -9.0 -4.2
Net exports (contribution to growth) 1.9 1.1 4.0 2.5 1.5
Exports of goods and services 10.2 7.0 0.6 4.1 3.7
Imports of goods and services 7.4 5.6 -4.7 1.1 2.1
Output gap (in percent of potential GDP) -1.2 -0.5 -2.7 -3.8 -4.8
Prices
Consumer prices (national definition, period average) 1.8 1.8 2.6 1.8 1.4
Core inflation (period average) -0.4 -0.4 0.7 … …
Employment and wages
Unemployment rate (in percent, ILO definition) 7.3 8.2 8.9 10.5 10.8
Employment (Full time basis, national accounts) -2.2 -1.6 -0.8 -2.0 -0.3
Nominal wages (all sectors) 3.9 2.0 0.1 0.0 -0.3
Real wages (all sectors) 2.0 0.2 -2.5 -2.2 -1.7
Unit labor cost (all sectors) 0.4 -0.4 1.8 -0.3 0.6
Public finance (percent of GDP)
General government balance 1/ -5.4 -5.6 -3.2 -5.7 -15.3
Structural balance 2/ -4.9 -4.1 -2.3 -2.0 -2.3
Primary balance 1/ -4.1 -4.3 -1.5 -3.1 -11.9
Structural primary balance 2/ -3.1 -2.3 -0.4 0.8 1.2
General government debt 3/ 38.7 46.9 54.3 70.9 77.7
Monetary and financial indicators
Credit to the private sector 1.9 -2.6 -3.2 … …
Lending rates 4/ 4.9 5.0 4.7 … …
Deposit rates 5/ 1.8 2.2 2.3 … …
Government bond yield (10-year, average) 6/ 3.8 5.0 5.8 … …
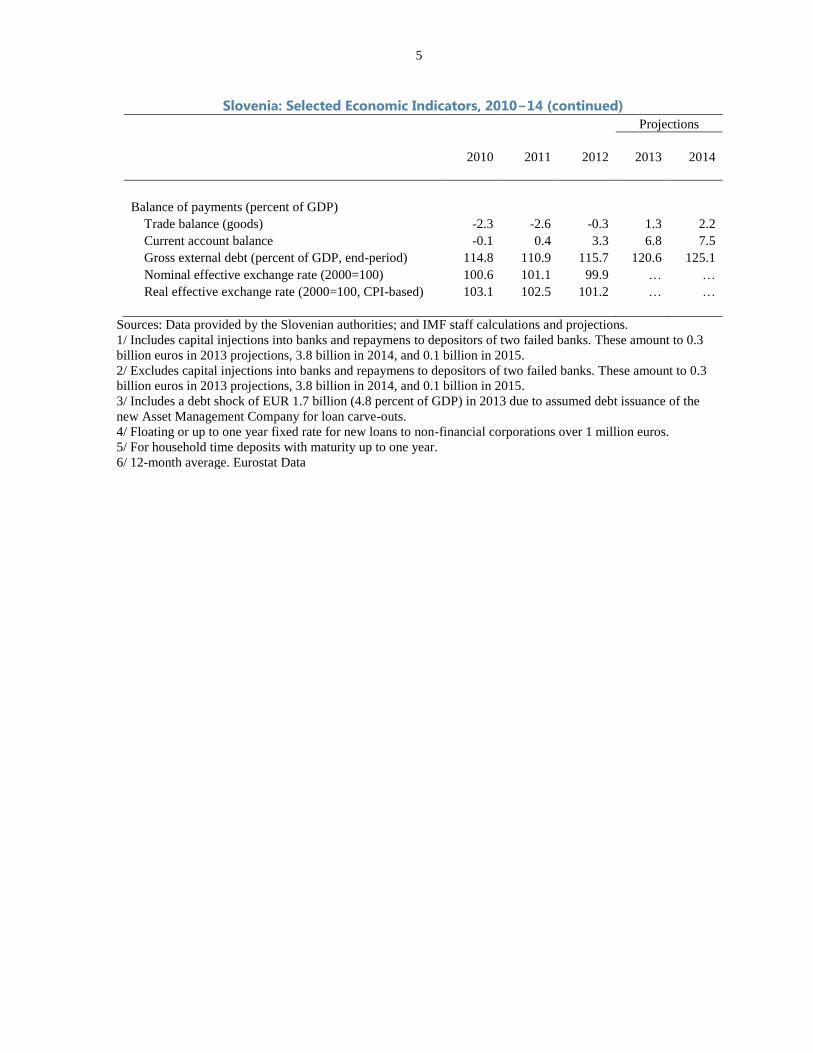
5
Slovenia: Selected Economic Indicators, 2010−14 (continued)
Projections
2010 2011 2012 2013 2014
Balance of payments (percent of GDP)
Trade balance (goods) -2.3 -2.6 -0.3 1.3 2.2
Current account balance -0.1 0.4 3.3 6.8 7.5
Gross external debt (percent of GDP, end-period) 114.8 110.9 115.7 120.6 125.1
Nominal effective exchange rate (2000=100) 100.6 101.1 99.9 … …
Real effective exchange rate (2000=100, CPI-based) 103.1 102.5 101.2 … …
Sources: Data provided by the Slovenian authorities; and IMF staff calculations and projections.
1/ Includes capital injections into banks and repaymens to depositors of two failed banks. These amount to 0.3
billion euros in 2013 projections, 3.8 billion in 2014, and 0.1 billion in 2015.
2/ Excludes capital injections into banks and repaymens to depositors of two failed banks. These amount to 0.3
billion euros in 2013 projections, 3.8 billion in 2014, and 0.1 billion in 2015.
3/ Includes a debt shock of EUR 1.7 billion (4.8 percent of GDP) in 2013 due to assumed debt issuance of the
new Asset Management Company for loan carve-outs.
4/ Floating or up to one year fixed rate for new loans to non-financial corporations over 1 million euros.
5/ For household time deposits with maturity up to one year.
6/ 12-month average. Eurostat Data
Statement by Johann Prader, Executive Director for the Republic of Slovenia and
Borut Repansek, Advisor do the Executive Director
January 13, 2014
The Slovenian authorities thank staff for the valuable exchange of views during the meetings and
their in-depth appraisal of the Slovenian economy. They broadly agree with the Fund’s analysis
and advice. The authorities also appreciate the Fund’s technical assistance.
Economic Developments, Measures and Outlook
In the third quarter of 2013, Slovenia’s current account balance reached 6.8 percent of GDP,
growth was -0.6 percent and the unemployment rate stood at 9.4 percent. For the first three
quarters of 2013, the general government deficit is estimated at 5.5 percent of GDP and its
consolidated gross debt at the end of the third quarter is estimated at 62.6 percent of GDP.
Inflation in December 2013 was 0.7 percent.
The authorities are more optimistic about the growth outlook than the Fund staff. The good
performance of the export-oriented corporate sector, increased competitiveness and the recent
bold actions taken in the banking sector are promising indicators.
Since the last Article IV Consultation, the Slovenian authorities have intensified their efforts to
reduce macroeconomic imbalances which, combined with high economic uncertainty, required
urgent policy responses and vigorous measures. Many remedial steps have been taken and the
positive effects are becoming gradually visible.
In January 2013, the pension reform entered into force, followed by a labor market reform in
March, when the Bank Assets Management Company (BAMC) was also established.
In March, the new government took over and was immediately faced with refinancing risks.
The authorities swiftly responded to market speculations by preparing a bond issuance and
raised USD 3.5 billion in early May. The Cyprus crisis challenged the trust of bank
depositors also in Slovenia. Fortunately, no significant decrease in households’ deposits
occurred.
In May, Slovenia submitted to the European Commission the comprehensive 2013 stability
programme covering the period 2012-2016 and its 2013 national reform programme. At the
end of May, the European Commission issued its policy recommendations to the Slovenian
authorities. In parallel, the authorities had agreed with the social partners on an additional
1.25 percent reduction in basic gross wages in the public sector, on top of the 3 percent
reduction that had been agreed upon in May 2012. Also, Parliament had approved a
constitutional basis for establishing a general government budget balance/surplus rule in
structural terms and tightened the constitutional rules to call and win a referendum. The latter
should facilitate the introduction of fiscal and structural reforms.
2
In autumn, Slovenia presented the Economic Partnership programme and Draft Budgetary
Program to the European Commission. The measures outlined in these documents were
evaluated by the Commission as adequate to address the macroeconomic challenges.
The European Commission requested the execution of an independent Asset Quality Review
(AQR) and stress tests for a representative portion of the banking system as a prerequisite for
the transfer of claims to the BAMC and the approval of state aid. The Slovenian authorities
embarked on the aforementioned actions in July 2013 by engaging foreign experts to ensure
the complete independence and credibility of the review. The AQR and stress tests results
were announced on December 12. A few days later, five banks were recapitalized and the
first batch of bad assets was transferred to the BAMC. Markets clearly welcomed the
transparency and the measures taken, and spreads declined considerably as a result. In
addition to implementing the Fund’s FSAP recommendations, the authorities will also take
further measures, including privatizing now well-capitalized state-owned banks,
strengthening banking supervision, implementing the banking sector consolidation, and
establishing macro-prudential supervision, for which the necessary act has already been
adopted. A new Banking Act that transposes the EU Capital Requirements Directive IV is
expected to enter into force in the spring.
In addition to the external environment, the economic outlook depends on the implementation of
technically complex reforms in the corporate, financial, and public sectors. The authorities are
aware of the implementation risks, and policy measures will have to be carefully designed to
ensure sufficient public support.
Banking sector, Asset Quality Review and Stress Tests
Banks dealt with bad assets before the stress tests were finalized in December 2013 by increasing
write-offs and provisions, which in 2011, 2012 and in the first ten months of 2013 cumulatively
amounted to EUR 4.2 billion.
The AQR, the stress tests and the bad assets transfer to BAMC exercises were designed and
conducted in close cooperation with the European Commission and the ECB.
The adverse stress test scenario was based on very conservative assumptions, i.e. a cumulative
9.5 percent decline in the GDP growth rate in the period from 2013 to 2015. This is 1 percentage
point higher than the realized decline in the period from 2009 to 2012, and quite different from
the available projections. In addition, a conservative approach was applied through the valuation
of collateral and a very stringent approach to client classifications by banks.
The estimate of a EUR 4.8 billion potential bank capital shortfall was the most conservative out
of the four stress tests results, based on the two different methods and scenarios used.
The new insolvency law should work towards slowing down NPL accumulation in banks’
balance sheets by accelerating resolution procedures.
3
Fiscal Policy
In spite of the ongoing recession, fiscal consolidation continues in Slovenia. The pace of fiscal
consolidation should take into account its impact on employment and growth. Therefore, a
gradual consolidation path towards structural balance by 2017 is underway. The authorities are
mindful of the fiscal risks and have made all efforts to contain them, including a pension freeze,
public sector wage reduction, improved tax collection, measures to limit the grey economy, and
the introduction of a property tax. Also, the conservative stress tests results and the consequent
bank recapitalization have likely ruled out the need for further state-owned bank recapitalization
in the medium term. Further tax increases are not envisaged and the authorities are committed to
pursue any additional consolidation on the expenditure side. In the authorities’ view, staff’s
analysis of Slovenia’s debt sustainability and respective policy option in the staff report should
have put more emphasis on privatization. Privatizations, coupled with the debt reductions in the
BAMC, can significantly reduce the debt level and the authorities intend to pursue this without
delay. The authorities stand ready to promptly respond to fiscal deterioration if it emerges.
Structural Issues
Improving corporate sector governance and its deleveraging are key to achieve the much-needed increase in investment. Staff’s proposal of a multi-pronged approach is well noted. Privatization of the first selected 15 companies has started, and will be upgraded by the adoption of a full-fledged strategy for managing SOEs in 2014, which will also designate further divestment paths. After the bad assets transfers and the recent recapitalization, BAMC can start coordinating creditors and facilitate corporate restructuring. The law to establish the Slovenian Sovereign Holding, whose mandate is to improve governance in state-owned companies, is in parliamentary procedure. Once the holding is functioning and the envisaged state-owned bank privatization implemented, the connected lending problem will be significantly reduced. The March 2013 labor market reform will be complemented by a reform of the so-called ‘‘student employment’’ by April 2014. The ‘‘student employment’’ increases labor market flexibility, but is clearly a distortion rooted in years of economic development with negligible new job creation and labor shedding. Consequently, a part of the young population is formally enrolling in college to avoid unemployment and obtain short-term temporary jobs more easily. College graduates increasingly end up with temporary short-term employment, as permanent contracts are rarely offered. New job creation has become one of the policy priorities closely connected with all growth-enhancing policy measures.