annual report 2016 - the global leader in the hr services
TRANSCRIPT
new connectionsannual report 2016

annual report 2016 − Randstad Holding nv
overview
2016 at a glance 2
Message from the CEO 6
New connections 8
Profile 10
Our business environment 14Structural growth drivers 14Regulatory environment in our markets 17
value proposition & strategy
How we create value 20
Strategic priorities and objectives 22
Sustainability framework 26
Value for our clients and candidates 28Our value for clients 28Our value for candidates 29Our strategy: strong concepts 30Our strategy: excellent execution 33Our strategy: superior brands 36Engaging with our clients and candidates 36
Value for our employees 40Our strategy: best people 40Making strong concepts work 40Randstad leadership 40Attracting the best people 40Developing great people 41Randstad outperformance 44Internal promotion 44A healthy and safe environment 45Diversity and inclusion 45
Value for society 47Our role in society 47Stakeholder dialogue 47Industry involvement 48Partnerships and social involvement 49
Sustainability basics 51Our tax contribution 57
performance
Introduction 59
Financial performance 62
Country performance 69
Performance by revenue category 74
Investor relations & share performance 76Investor Relations 76Capital structure 76Share performance 78
Risk & opportunity management 80Risk profile 80Risk & Control management approach 80Risk appetite 80Risk & Control framework 81Our main risks 84Emerging risks 88Conclusions 88
governance
Executive Board 90
Supervisory Board 92
Report of the Supervisory Board 94Composition, diversity and independence 94Induction, training and performance assessment 95Supervisory and advisory activities in 2016 95Supervisory Board Committee activities in 2016 96Supervisory Board remuneration 98Report of the Annual General Meeting of Shareholders 99Financial statements for 2016 100
Remuneration report 101Remuneration policy 101Executive Board remuneration 2016 101Supervisory Board remuneration 2016 and 2017 104
Corporate governance 106Principles 106Executive Board 106Supervisory Board 106Annual General Meeting of Shareholders 107Exceptions to the Code 108Legal transparency obligations 109
financial statements 111
supplementary information
Summary quarterly income statement 2016 173Ten years of Randstad 174Glossary 176Sustainability and industry memberships and partnerships 180Certifications, rankings, and awards 181Financial calendar 184
The following sections are considered to be part of the management report: overview, value proposition & strategy, performance, remunerationreport and corporate governance.
contents of the annual report 2016 ofRandstad Holding nv

1
overview
2 2016 at a glance
4 Key figures
5 Core data
6 Message from the CEO
8 New connections
10 Profile
14 Our business environment
18 Safe harbor statement

2
annual report 2016 − Randstad Holding nv
Acquisition of Monster Worldwide toaccelerate our digital strategy
Randstad renewed its partnership withVoluntary Service Overseas
49
Acquisition of Proffice, Obiettivo Lavoro,Careo, and twago, and intended acquisitionof BMC to strengthen our overall businesses
Randstad Innovation Fund again invested inHR-technology companies
35
Randstad Williams Engineering Academywelcomed new students
37
Randstad launched public offer on all sharesof Ausy, aiming to strengthen our EuropeanProfessionals business
2016 at a glance

3
annual report 2016 − Randstad Holding nv
25 countries participated in the RandstadEmployer Brand Research
37
Randstad again included in Dow JonesSustainability Index
53
Randstad improved its standing with regardto LGBT-inclusive activities in Workplace Pride
45
Eight Randstad executives from around theglobe named in SIA's Global Power 100 –Women in Staffing list
45
Flexibility@work 2016 focused on the 'Futureof Work in the Digital Age'
47
Big Data contributed substantially to theincrease in permanent placements in severalcountries

4
annual report 2016 − Randstad Holding nv
Revenue in € million
20,684.1 62
Underlying EBITAmargin (%)
4.6 65
Adjusted net incomein € million
688.9 66
Free cash flow in€ million
464.6 68
Leverage ratio
0.8 68
Proposed dividendper ordinary share(€)
1.89 78
Number ofpermanentplacements
183,900 36
Number ofcandidates working(on a daily basis)
626,300 61
Randstadoutperformance (%)
67 44
% of women insenior leadershippositions
45.2 45
Number of VSOvolunteer hours
11,000 49
Number ofemployees trained inbusiness principles
13,000 51
key figures
5
annual report 2016 − Randstad Holding nv
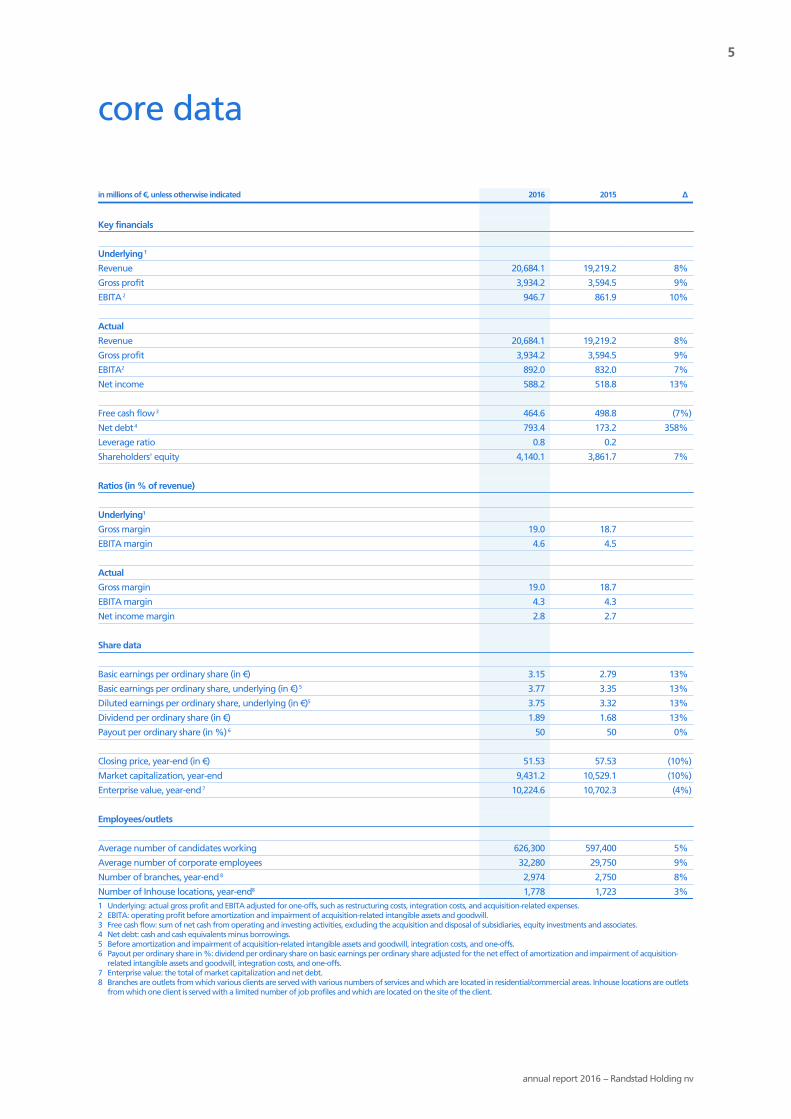
in millions of €, unless otherwise indicated 2016 2015 Δ
Key financials
Underlying 1
Revenue 20,684.1 19,219.2 8%
Gross profit 3,934.2 3,594.5 9%
EBITA 2 946.7 861.9 10%
Actual
Revenue 20,684.1 19,219.2 8%
Gross profit 3,934.2 3,594.5 9%
EBITA2 892.0 832.0 7%
Net income 588.2 518.8 13%
Free cash flow 3 464.6 498.8 (7%)
Net debt 4 793.4 173.2 358%
Leverage ratio 0.8 0.2
Shareholders' equity 4,140.1 3,861.7 7%
Ratios (in % of revenue)
Underlying1
Gross margin 19.0 18.7
EBITA margin 4.6 4.5
Actual
Gross margin 19.0 18.7
EBITA margin 4.3 4.3
Net income margin 2.8 2.7
Share data
Basic earnings per ordinary share (in €) 3.15 2.79 13%
Basic earnings per ordinary share, underlying (in €) 5 3.77 3.35 13%
Diluted earnings per ordinary share, underlying (in €)5 3.75 3.32 13%
Dividend per ordinary share (in €) 1.89 1.68 13%
Payout per ordinary share (in %) 6 50 50 0%
Closing price, year-end (in €) 51.53 57.53 (10%)
Market capitalization, year-end 9,431.2 10,529.1 (10%)
Enterprise value, year-end 7 10,224.6 10,702.3 (4%)
Employees/outlets
Average number of candidates working 626,300 597,400 5%
Average number of corporate employees 32,280 29,750 9%
Number of branches, year-end 8 2,974 2,750 8%
Number of Inhouse locations, year-end8 1,778 1,723 3%1 Underlying: actual gross profit and EBITA adjusted for one-offs, such as restructuring costs, integration costs, and acquisition-related expenses.2 EBITA: operating profit before amortization and impairment of acquisition-related intangible assets and goodwill.3 Free cash flow: sum of net cash from operating and investing activities, excluding the acquisition and disposal of subsidiaries, equity investments and associates.4 Net debt: cash and cash equivalents minus borrowings.5 Before amortization and impairment of acquisition-related intangible assets and goodwill, integration costs, and one-offs.6 Payout per ordinary share in %: dividend per ordinary share on basic earnings per ordinary share adjusted for the net effect of amortization and impairment of acquisition-
related intangible assets and goodwill, integration costs, and one-offs.7 Enterprise value: the total of market capitalization and net debt.8 Branches are outlets from which various clients are served with various numbers of services and which are located in residential/commercial areas. Inhouse locations are outlets
from which one client is served with a limited number of job profiles and which are located on the site of the client.
core data
6
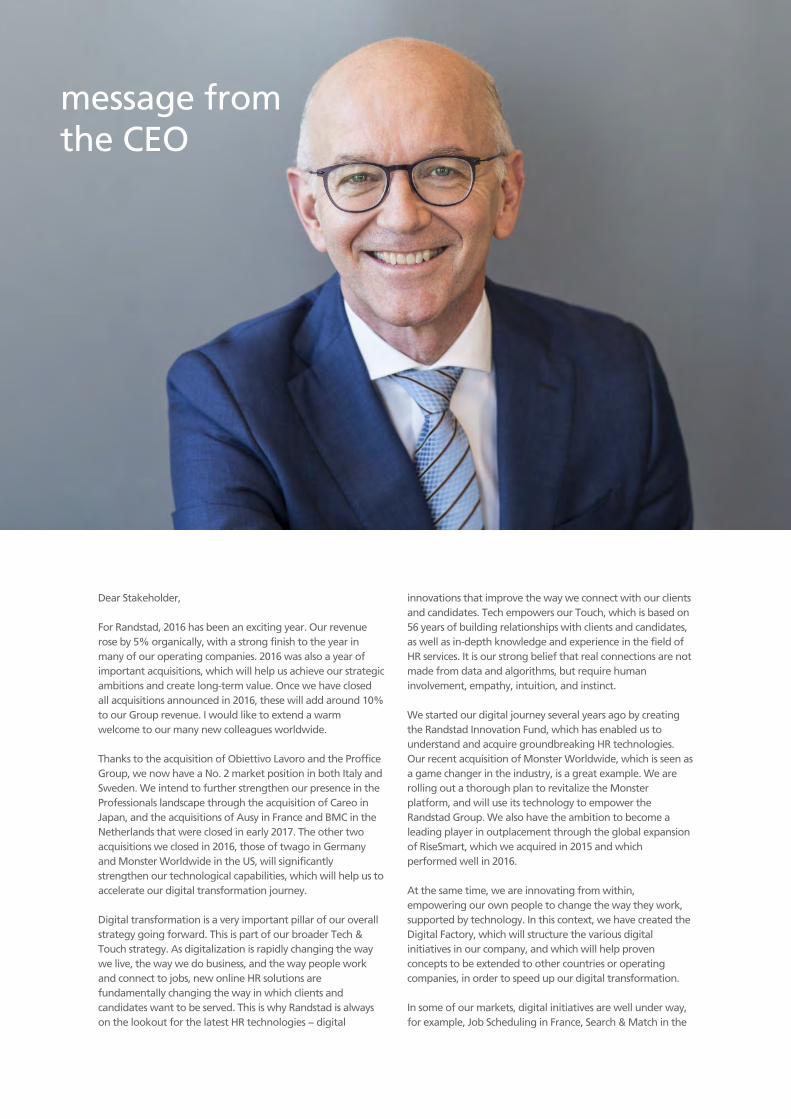
Dear Stakeholder,
For Randstad, 2016 has been an exciting year. Our revenuerose by 5% organically, with a strong finish to the year inmany of our operating companies. 2016 was also a year ofimportant acquisitions, which will help us achieve our strategicambitions and create long-term value. Once we have closedall acquisitions announced in 2016, these will add around 10%to our Group revenue. I would like to extend a warmwelcome to our many new colleagues worldwide.
Thanks to the acquisition of Obiettivo Lavoro and the ProfficeGroup, we now have a No. 2 market position in both Italy andSweden. We intend to further strengthen our presence in theProfessionals landscape through the acquisition of Careo inJapan, and the acquisitions of Ausy in France and BMC in theNetherlands that were closed in early 2017. The other twoacquisitions we closed in 2016, those of twago in Germanyand Monster Worldwide in the US, will significantlystrengthen our technological capabilities, which will help us toaccelerate our digital transformation journey.
Digital transformation is a very important pillar of our overallstrategy going forward. This is part of our broader Tech &Touch strategy. As digitalization is rapidly changing the waywe live, the way we do business, and the way people workand connect to jobs, new online HR solutions arefundamentally changing the way in which clients andcandidates want to be served. This is why Randstad is alwayson the lookout for the latest HR technologies − digital
innovations that improve the way we connect with our clientsand candidates. Tech empowers our Touch, which is based on56 years of building relationships with clients and candidates,as well as in-depth knowledge and experience in the field ofHR services. It is our strong belief that real connections are notmade from data and algorithms, but require humaninvolvement, empathy, intuition, and instinct.
We started our digital journey several years ago by creatingthe Randstad Innovation Fund, which has enabled us tounderstand and acquire groundbreaking HR technologies.Our recent acquisition of Monster Worldwide, which is seen asa game changer in the industry, is a great example. We arerolling out a thorough plan to revitalize the Monsterplatform, and will use its technology to empower theRandstad Group. We also have the ambition to become aleading player in outplacement through the global expansionof RiseSmart, which we acquired in 2015 and whichperformed well in 2016.
At the same time, we are innovating from within,empowering our own people to change the way they work,supported by technology. In this context, we have created theDigital Factory, which will structure the various digitalinitiatives in our company, and which will help provenconcepts to be extended to other countries or operatingcompanies, in order to speed up our digital transformation.
In some of our markets, digital initiatives are well under way,for example, Job Scheduling in France, Search & Match in the
message fromthe CEO
7
annual report 2016 − Randstad Holding nv
Netherlands, and sales services based on Big Data in France,the Netherlands, and the US. To support our global digitalinitiatives, we are in parallel ramping up our capabilities indigital marketing, IT, Finance, Business Concept Development,and HR.
We are convinced that our digital transformation willeventually lead to an even higher level of appreciation on thepart of both our clients and our candidates, as well as highereconomic returns. Randstad has always been an innovator inthe global staffing industry, and we see digital transformationas an opportunity to further strengthen our leading position.
With regard to our operational performance in 2016,significant progress has been made. Despite mixed macro-economic conditions, particularly in Europe, our revenue roseby 5% organically. The combined European operationsenjoyed 6% revenue growth, with key contributors beingFrance, Italy, and Spain. Unlike most of our peers, and despitetough competition, growth in North America remained inpositive territory at 1%, driven by the continuedoutperformance of our US Staffing division. Our gross marginexcluding Monster remained stable year-on-year at 18.7%, asfierce pricing pressure in some staffing markets was offset byour ongoing strong focus on higher-value-added services (e.g.,permanent placements, which grew 7%). EBITA expanded by7% organically, driving a further EBITA margin increase to4.6%, reflecting a solid incremental conversion ratio of 41%.
Even taking into account our comprehensive M&A agenda in2016, our balance sheet remained healthy, reflected by aleverage ratio of 0.8 at year-end 2016. In 2017, our focus willbe mainly on further improving our economic returns,particularly on our newly acquired companies. Hence, weexpect M&A activity to be limited in 2017. For 2016, wepropose an all-time-high all-cash dividend of € 1.89 perordinary share (2015: € 1.68), representing a payout of 50%.
Looking back on 2016, I would like to thank all ourstakeholders and investors for their continuous support andtrust. I also want to express my thanks and gratitude to all ofour 36,524 colleagues worldwide at year-end. Individually andcollectively, they make Randstad a unique and greatcompany.
We are facing the future with confidence, in the firm beliefthat we are on the right path to transform ourselves and theHR services industry, leading the change ahead of our peers.
Good to know you,
Jacques van den Broek
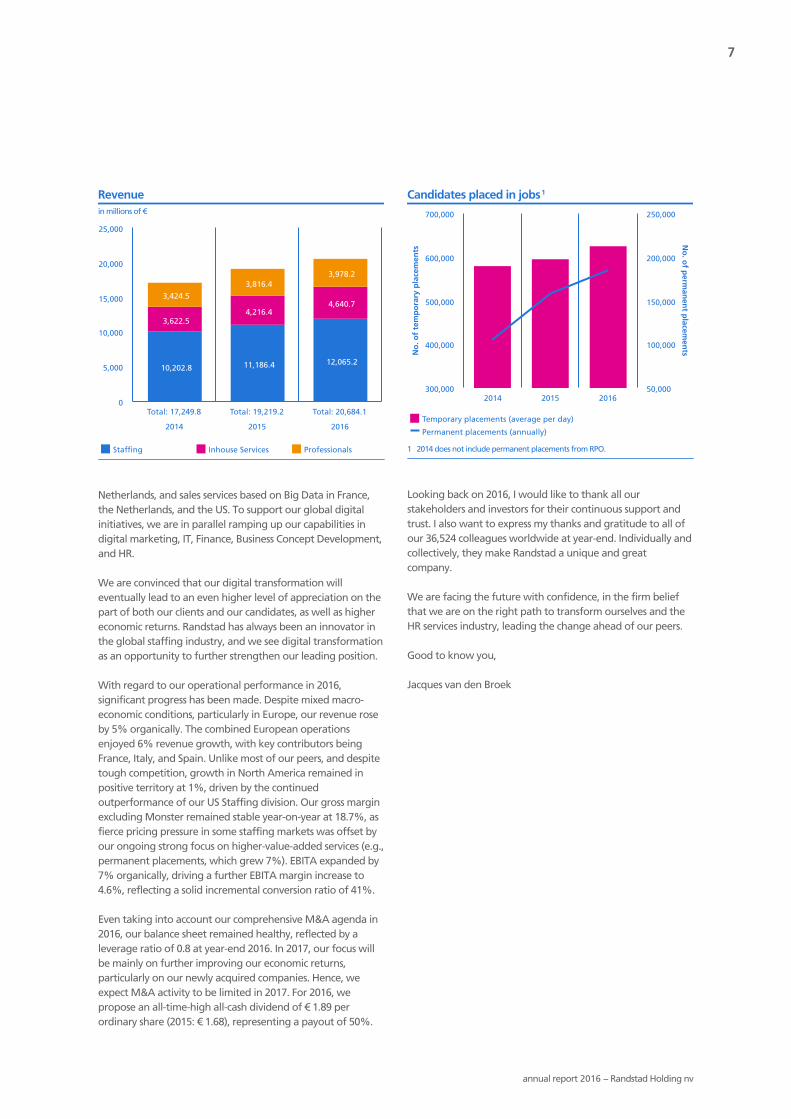
Revenuein millions of €
10,202.8 11,186.4 12,065.2
3,622.54,216.4
4,640.73,424.5
3,816.43,978.2
Staffing Inhouse Services Professionals
Total: 17,249.8
2014
Total: 19,219.2
2015
Total: 20,684.1
2016
0
5,000
10,000
15,000
20,000
25,000
Candidates placed in jobs1
No
. of
tem
po
rary
pla
cem
ents
No
. of p
erman
ent p
lacemen
ts
Temporary placements (average per day)
Permanent placements (annually)
2014 2015 2016300,000
400,000
500,000
600,000
700,000
50,000
100,000
150,000
200,000
250,000
1 2014 does not include permanent placements from RPO.

8
newconnections
The way people connect to jobs, anywhere, anytime, andthrough any device, and the role we play in this space, hasdrastically changed in the last few years and will continue tochange even more rapidly. Technology-driven solutions and toolshave transformed repetitive and process-oriented tasks.Technology is becoming the invisible engine that powers the realworld around us. As a result, the human touch we bring to thetable as Randstad is more significant and has a larger impactthan ever before.
Randstad has a unique opportunity in the way we connect andevolve our relationships with our clients, candidates, and talentsin the world of work. Research shows 57% of candidates feel therecruitment process has become overly automated, impersonaland transactional. Randstad’s Tech & Touch strategy is all aboutusing technology to the best of our advantage, saving time inadministrative processes, automating what can be automated,all without losing the personal connection whenever it isneeded. In this way, we can add more insight-based value forour stakeholders and be a source of inspiration and support.

9
We believe every individual brings something unique to theworkplace. And every workplace can teach us something newabout ourselves. It is a mutual exchange. We love to connect thedots. We believe real connections aren’t just made from dataand algorithms. It also takes empathy, real communication andinstinct. Human instinct. So when we bring the passion of morethan 36,000 HR professionals together with the power of today’sintelligent machines, magic might happen. It allows us to divedeeper than a résumé or job opening and ask the rightquestions, to pinpoint exactly what our clients and candidatesneed. A smarter, more personal HR experience.
In 2016, we made many new connections as a company. Theacquisitions we made throughout the year resulted inparticularly valuable new connections, with Monster Worldwidebeing the most visible and strategically perhaps most impactfulmove. Thanks to this acquisition, we will gain access to a worldof talent profiles and data. We also continued to invest in HRtechnology through the Randstad Innovation Fund, focusing onadding new technologies to our business portfolio, like Crunchr(a platform for HR reporting and workforce analytics) andPymetrics (gamified psychometric assessments). In addition, weexpanded our stake to fully acquire freelancer platform twago.

10
annual report 2016 − Randstad Holding nv
Who we are
Randstad is a leading global staffing and recruitmentcompany, offering a wide range of solutions in the HR servicesspace. We are a trusted human partner in the technology-driven world of talent. We take the lead in shaping the worldof work, by matching candidates with companies that willhelp them reach their full potential, and matching clients withpeople who will work to successfully develop their business.We do this by combining our human touch with technology-driven solutions and tools.
Our services include regular temporary staffing andpermanent placement of candidates. Through our uniqueInhouse Services concept, we offer dedicated on-siteworkforce management. In addition, we provide many otherHR solutions, such as Recruitment Process Outsourcing (RPO),Managed Services Programs (MSP), payroll services, andoutplacement. Through Monster, which we acquired in 2016,we can further expand our services to offer both clients andcandidates the best tools for increased efficiency andengagement, connecting more people to more jobs.
Randstad was founded in 1960 in the Netherlands. In 2016,Randstad generated revenue of € 20.7 billion, employing anaverage of 32,280 corporate employees, who worked in about4,750 branches and Inhouse locations in 39 countries. Onaverage, we deployed around 625,000 candidates per day intemporary jobs, while we placed over 180,000 candidates inpermanent positions. We are proud to find jobs for about 2.2million people annually.
Our core values and culture
We continue to adhere to and live by our core values,established in the company's early days: to know, to serve, totrust, striving for perfection, and simultaneous promotion ofall interests. The values we share serve as a compass foreveryone at Randstad, guiding our behavior and representingthe foundation of our culture. Our continuing success and ourreputation for integrity, service, and professionalism are basedon these values.
We can only promote the interests of our stakeholders if weknow them well. Our thorough knowledge of ourstakeholders and our business experience enables us to servethem better. Our engagement with our stakeholders and theservice we provide them with builds mutual trust. This trust isenhanced by continuously striving for perfection andsimultaneously promoting the interests of all our stakeholdersand society as a whole. We believe that this creates anessential foundation for our business.
Over the decades, Randstad has developed into a globalleader in the HR services industry, which is becomingincreasingly digitalized. In this world of Tech, more than ever,our clients and candidates will be looking for the humanTouch. Our values ensure our stakeholders can count on thepower of genuine human interest and trust. That's how wekeep making a unique and meaningful difference.
What we do
By helping candidates find suitable careers and develop theirfull potential, and by finding employers the people who bestfit into their organization to sustain their success, we createvalue for society as a whole. It is our ambition to be anemployer of choice and to attract, retain, and develop thebest people, who will in turn provide our clients with excellentservice. We ensure first-class service delivery by using bestpractices and proven standardized business models across ourglobal network. We contribute to a better society byleveraging the experience and expertise in the labor marketwe have gained over 56 years. As such, we help to maximizefuture employment and economic growth.
Our core valuesTo knowWe are experts. We know our clients, their companies,our candidates and our business. In our business it isoften the details that count.
To serveWe succeed through a spirit of excellent service,exceeding the core requirements of our industry.
To trustWe are respectful. We value our relationships and treatpeople well.
Striving for perfectionWe always seek to improve and innovate. We are hereto delight our clients and candidates in everything wedo. This gives us the edge.
Simultaneous promotion of all interestsWe see the bigger picture, and take our socialresponsibility seriously. Our business must always benefitsociety as a whole.
profileprofile

11
annual report 2016 − Randstad Holding nv
Our service concepts
StaffingIn Staffing, our largest business, we focus on recruiting blue-collar and white-collar candidates. The concept coverstemporary staffing and permanent placements.
Inhouse ServicesInhouse Services is a unique solution for managing a highlyefficient workforce with specific skill sets for which there is afluctuating level of demand. It is aimed at improving clients’flexibility, retention, productivity, and efficiency. We work on-site, exclusively for our clients, providing a large number ofcandidates. We jointly determine specific performance criteriaand provide total HR management, including recruitment andselection, training, planning, retention, and managementreporting.
ProfessionalsFor middle and senior leadership positions, we recruitsupervisors, managers, professionals, interim specialists, andconsultants from a wide range of industry backgrounds. Theseinclude engineering, IT, finance, healthcare, and otherdisciplines, such as HR, education, legal, and marketing &communications. This concept covers both temporary andpermanent placements.
HR SolutionsThrough HR Solutions, we provide clients with a range ofservices, including Recruitment Process Outsourcing (RPO),Managed Services Programs (MSP), Integrated TalentSolutions, payroll services, outplacement, and consultancy. Asa part of RPO, we take on primary responsibility for therecruitment and selection of a client's workforce. MSP is oneof our key offerings, whereby we take on primaryresponsibility for the organization and management of aclient's contingent workforce. Our payroll services take overclients' administrative burden, so that they can focus on theircore business.
"With new technologies, it's so mucheasier to stay in touch with mycandidates"

12
annual report 2016 − Randstad Holding nv
Germany- Revenue € 2,087.6 million- 2,660 corporate staff- 47,000 candidates- 557 outlets, including 277 Inhouse locations
Belgium & Luxembourg- Revenue € 1,372.5 million- 1,940 corporate staff- 41,900 candidates- 310 outlets, including 155 Inhouse locations
Iberia- Revenue € 1,275.1 million- 1,870 corporate staff- 63,200 candidates- 339 outlets, including 109 Inhouse locations
North America - Revenue € 4,719.9 million- 6,530 corporate staff- 109,200 candidates- 1,149 outlets, including 419 Inhouse locations
Netherlands- Revenue € 3,185.6 million- 4,320 corporate staff- 82,500 candidates- 640 outlets, including 337 Inhouse locations
France- Revenue € 3,045.1 million- 3,570 corporate staff- 78,200 candidates- 682 outlets, including 211 Inhouse locations
our global presence
We have the following alliances to expand our reach: Ancor (Russia and Commonwealth of Independent States), Dayalima (Indonesia) and Staffpoint (Finland).
profile

13
annual report 2016 − Randstad Holding nv
United Kingdom- Revenue € 817.2 million- 1,530 corporate staff- 14,700 candidates- 129 outlets, including 42 Inhouse locations
Other European countries- Revenue € 2,338.5 million- 4,150 corporate staff- 79,600 candidates- 643 outlets, including 145 Inhouse locations
Rest of the world - Revenue € 1,842.6 million- 5,510 corporate staff- 110,000 candidates- 303 outlets, including 83 Inhouse locations
our global presence
1%
9%
9%
9%
Geographic spread of Staffing revenue (incl. HR Solutions)
Staffing revenue: € 10,202.8 million
17%
19%
17%10%
9%
Geographic spread of Professionals revenue
Professionals revenue: € 3,424.5 million
16%
8%2%1%
40%
10%9%
11%
3%
Geographic spread of Inhouse Services revenue
Inhouse Services revenue: € 3,622.5 million
4%
7%
9%
5%
19%
12%
20%16%
8%
2014: Total revenue € 17,249.8 million
Split by geography
8%
6%
5%
8%
11%16%
16%
22%
8%
North America Germany Iberia
France Belgium & Luxembourg Other European countries
Netherlands United Kingdom Rest of the world
Split by geography2016: Total revenue € 20,684.1 million
23%
15%
15%10%
7%
6%
4%
11%
9%
Geographic spread of Staffing revenue(incl. HR Solutions)Staffing revenue € 12,065.2 million
18%
16%
17%9%
8%
8%
1%
13%
10%
Geographic spread of Inhouse Services revenueInhouse Services revenue € 4,640.7 million
22%
19%
12%13%
7%
5%
3%
11%
8%
Geographic spread of Professionals revenueProfessionals revenue € 3,978.2 million
39%
8%11%
10%
2%1%
15%
6%8%
North America Germany United Kingdom
Netherlands Belgium & Luxembourg Other European countries
France Iberia Rest of the world

14
annual report 2016 − Randstad Holding nv
Introduction
Randstad operates in an industry with structural growthpotential. In this section, we highlight several technologicaldevelopments in our industry, elaborate on the structuralgrowth drivers, and provide an update on the regulatoryenvironment in our markets. In combination, these form thefoundation of our strategy, through which we create valuefor our stakeholders.
The world of work is constantly changing. HR industry playersare increasingly focusing on digitalization, and newinnovations and startups are disrupting our market. The HRservices industry offers attractive growth prospects throughthe cycle, with a global market size of about € 386 billion (upby 5% compared to last year according to Staffing IndustryAnalysts' (SIA) estimates). In many major economies, staffingand other HR services are still in development. As one of theglobal leaders in HR services, we see it as our responsibility toplay an active role in developing the industry in the long term.Changing labor market trends and client needs, including anaging population, shifting labor surpluses and shortages, andincreased flexibility, require the development of newsolutions, including digital ones. By finding the right balancebetween the changing needs of employers and employees,we bring supply and demand together.
Global HR services market 2016in billions of €
58%
38%
4%
Staffing: € 224 billion Executive search: € 17 billion
Professionals: € 145 billion
Source: Randstad estimates and 2016 SIA reports
The HR services industry is divided roughly into three mainsegments: staffing, professionals, and executive search.Randstad is primarily active in the first two. The global staffingmarket is worth an estimated € 224 billion, comprisingRandstad's service concepts Staffing, Inhouse Services and HRSolutions, and accounts for around 80% of our revenue.Randstad's Staffing service concept (52% of our revenue)focuses predominantly on recruiting white- and blue-collarcandidates for temporary or permanent placements. InhouseServices (22% of our revenue) provides on-site workforcesolutions, while HR Solutions (around 6% of our revenue)includes Recruitment Process Outsourcing (RPO), ManagedServices Programs (MSP), payroll and outplacement services,
and several other HR services. The global professionals marketis worth around € 145 billion, and accounts for around 20% ofour revenue. Our Professionals segment includes permanentand temporary placement of qualified professionals andcandidates from a wide range of industry backgrounds.
Structural growth drivers
Geographically, Randstad is active in countries representingover 90% of the global HR services market, and our strategyhas been designed to capitalize on the structural growthdrivers in these markets. Randstad has defined four structuralgrowth drivers for our industry. These are (1) a need forgreater flexibility and outsourcing, (2) changingdemographics, (3) favorable developments in regulation, and(4) a continued demand among our clients for a total offering.We believe these structural growth drivers will define the HRservices market for decades to come. We have designed our
Global market share 2016Total HR services market: € 386 billion
6%6%
5%
83%
Randstad Manpower
Adecco Rest of the market
Source: Randstad estimates, 2016 Bloomberg consensus and 2016 SIA reports
Structural growth drivers
Mid-term market
Market 2016€ 386 billion
Flexibility &
outsourcing
Clients l
ook for
a total o
fferin
gDemographics
Regulation
our business environmentour business environmentour business environment

15
annual report 2016 − Randstad Holding nv
strategy to anticipate and respond to these drivers,throughout economic cycles, as effectively and agilely aspossible.
Flexibility and outsourcingOne of the most important drivers of long-term structuralgrowth in our industry is the need for increased flexibilityamong clients and candidates alike. A flexible workforce helpsour clients to improve their productivity and competitiveness.Moreover, outsourcing is a key driver, as clients increasinglyfocus on core activities and realize that outsourcing certain HRfunctions results in efficiency gains. We see that flexibility andoutsourcing continue to rise on our clients' strategic agendafor the years ahead. Clients need to take care of their long-term planning, while they also need to be able to adjust theirworkforce, even during the course of a day. As a result, theyare actively managing the flexible component of theirworkforce, also with a view to the macroeconomiccircumstances. In addition, there is a growing demand formore flexibility among candidates, with jobs-for-life being athing from the past. Candidates increasingly want to choosefor themselves where, when, and how they work, which mayinclude self-employment, remote working, part-time work,and many other flexible ways of working.
Some countries still maintain unjustified restrictions on flexiblework arrangements, and these will need to be reviewed andlifted. The previous economic downturn has shown thatcountries with unreformed labor markets that do not allowfor enough flexibility tend to have higher unemployment,
lower labor participation rates, and fewer new jobs, leadingto a lower rating on the World Economic Forum (WEF)competitiveness index. This in itself provides a strong case forreform, as there is a clear correlation between labor marketeffectiveness and competitiveness.
The staffing penetration rate (i.e., the number of temporaryworkers as a percentage of the total labor force) is animportant indicator of the structural growth of our industry.As we strive to improve global employment participation, weuse the development of penetration rates to report on ourperformance in this area. Penetration rate is a metric that wehave identified as an employment market KPI in oursustainability framework.
Penetration rates are usually higher in mature markets, wherestaffing has long been a reputable solution for flexibility inthe workplace. These more developed markets are generallyready for differentiated propositions when it comes tostaffing and hiring professionals, and often also embraceadditional added-value services, such as RPO, MSP andoutplacement.
DemographicsA number of academic studies commissioned by Randstad('The Gap' and ‘Flexibility@work’ series) revealed that agingand declining population growth is already leading to ashortage of people with vital skills in most developedcountries. In addition, there is a growing mismatch betweenthe qualifications and skills of workers and the rapidly
Strong talent shortage trend
Talent shortage trend
Low / no shortage trend
Talent gap trend2010-20 2020-30
Strong employability challenge
Medium employability challenge
Source: Boston Consulting Group Analysis
Note: Color codes based on compound annual growth rates of talent supply and demand by 2020 and 2030
Talent gaps by 2020 and beyond
16
annual report 2016 − Randstad Holding nv
evolving demands of the labor market, with a significantimpact from automation. The studies suggest that by 2020,both in the EU and the US, there will be a surplus of medium-skilled workers, a substantial shortage of highly skilledworkers, and a steady demand for those with elementaryskills.
The Flexibility@work 2016 study (‘Future of Work in theDigital Age’) shows that labor market demands are changing,driven by the continuous development of technology. This iscreating new jobs, while making others obsolete. In manyareas, employment is picking up, but employers still say theycannot fill their vacancies because even highly qualifiedcandidates have the wrong skills for the jobs available. Thecurrent education systems, employers argue, teach yesterday’sskills to tomorrow’s graduates. Many are concerned thatapplicants lack 'soft skills', such as interpersonal,communication and analytical problem-solving abilities.
Skills mismatch in an employment landscape is mainly anoutcome of structural rigidities in labor markets, but it is alsoinfluenced by cyclical gaps between supply and demand. Jobcreation is fundamental, but all aspects of the skills mismatchmust be addressed. All stakeholders should work together toaddress the issue. Free trade agreements, for example, couldinclude provisions for student and labor mobility. There isclearly a need for labor market policy to be approached muchmore actively, with unjustified restrictions being lifted andrelevant intervention stepped up.
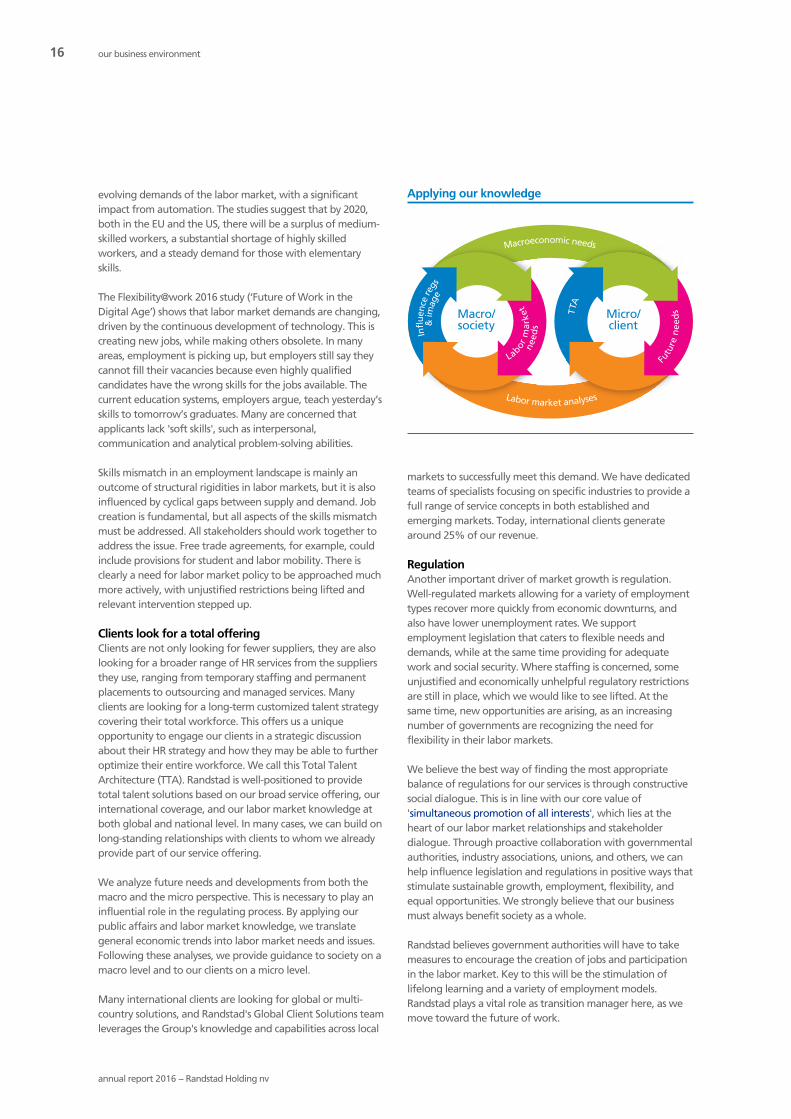
Clients look for a total offeringClients are not only looking for fewer suppliers, they are alsolooking for a broader range of HR services from the suppliersthey use, ranging from temporary staffing and permanentplacements to outsourcing and managed services. Manyclients are looking for a long-term customized talent strategycovering their total workforce. This offers us a uniqueopportunity to engage our clients in a strategic discussionabout their HR strategy and how they may be able to furtheroptimize their entire workforce. We call this Total TalentArchitecture (TTA). Randstad is well-positioned to providetotal talent solutions based on our broad service offering, ourinternational coverage, and our labor market knowledge atboth global and national level. In many cases, we can build onlong-standing relationships with clients to whom we alreadyprovide part of our service offering.
We analyze future needs and developments from both themacro and the micro perspective. This is necessary to play aninfluential role in the regulating process. By applying ourpublic affairs and labor market knowledge, we translategeneral economic trends into labor market needs and issues.Following these analyses, we provide guidance to society on amacro level and to our clients on a micro level.
Many international clients are looking for global or multi-country solutions, and Randstad's Global Client Solutions teamleverages the Group's knowledge and capabilities across local
markets to successfully meet this demand. We have dedicatedteams of specialists focusing on specific industries to provide afull range of service concepts in both established andemerging markets. Today, international clients generatearound 25% of our revenue.
RegulationAnother important driver of market growth is regulation.Well-regulated markets allowing for a variety of employmenttypes recover more quickly from economic downturns, andalso have lower unemployment rates. We supportemployment legislation that caters to flexible needs anddemands, while at the same time providing for adequatework and social security. Where staffing is concerned, someunjustified and economically unhelpful regulatory restrictionsare still in place, which we would like to see lifted. At thesame time, new opportunities are arising, as an increasingnumber of governments are recognizing the need forflexibility in their labor markets.
We believe the best way of finding the most appropriatebalance of regulations for our services is through constructivesocial dialogue. This is in line with our core value of'simultaneous promotion of all interests', which lies at theheart of our labor market relationships and stakeholderdialogue. Through proactive collaboration with governmentalauthorities, industry associations, unions, and others, we canhelp influence legislation and regulations in positive ways thatstimulate sustainable growth, employment, flexibility, andequal opportunities. We strongly believe that our businessmust always benefit society as a whole.
Randstad believes government authorities will have to takemeasures to encourage the creation of jobs and participationin the labor market. Key to this will be the stimulation oflifelong learning and a variety of employment models.Randstad plays a vital role as transition manager here, as wemove toward the future of work.
our business environment

17
annual report 2016 − Randstad Holding nv
Regulatory environment in ourmarkets
A major step forward in the regulation of the Europeanstaffing market was taken in 2008, when the EuropeanParliament adopted the Agency Work Directive (AWD). TheAWD recognizes the role of agency work and allows forgreater flexibility, which provides greater scope for furtherevolution. The aim of the AWD is twofold: to identify and liftall unjustified and/or disproportionate restrictions ontemporary agency work, while still protecting the rights oftemporary-agency workers, including their right to equaltreatment and equal pay. We observed that, since theintroduction of the AWD in 2008, several countries, especiallyin Southern and Eastern Europe, have lifted or easedrestrictions on temporary work.
The regulatory environment in some other large economies isshowing both favorable and unfavorable developments:
GermanyThe long-debated reform of the German temporary agencywork legislation has now been adopted by the GermanBundestag and Bundesrat. The new regulation will come intoforce on April 1, 2017. The main legal changes concern theintroduction of equal pay after nine months in an assignment,and the introduction of a maximum length of assignments of18 months (versus 24 months previously). We believe that theimpact on our business will be limited, seen from our currentperspective. Equal pay will only be applicable to a small partof our German temp population. Deviation from the 'equalpay after nine months' provision will be possible based on aCollective Labor Agreement (CLA) for the staffing industry,which rules what are known as 'sector surcharges'. Thereduced contract duration should have no relevance either, asit is estimated that the tenure of more than 90% of our tempsis below 18 months. In addition, deviation from the maximumlength of an assignment will be possible based on acustomer's specific CLA.
SwitzerlandIn May 2016, a new CLA for temporary agency work activitiescame into force in Switzerland. Key elements of the new CLAare the rise of the minimum wage for agency workers andchanges to the working time arrangements. This allows formore flexibility, while at the same time providing for paysupplements if the actual number of hours worked per dayexceeds a certain limit.
TurkeyTemporary agency work has finally been recognized in Turkeythanks to a new law, which came into effect in October 2016.The new law includes license for use, equal treatment, andsome minor restrictions.
State of play on staffing regulation and trends, 2016
Country 1 Regulation Regulatory trend
Argentina ↔Australia ←Austria ↔Belgium →Brazil →Canada ←China ↔Czech Republic ↔Denmark ↔France ↔Germany ↔Greece →Hungary ↔India ↔Italy →Japan →Luxembourg ↔Mexico ↔Netherlands ↔New Zealand ↔Poland ↔Portugal ↔Spain ↔Sweden ↔Switzerland ↔Turkey →UK ↔US ↔1 Main markets.
Appropriate/liberal regulation Trend has improved
Workable regulation/to be improved Trend has not changed
Restrictive/no specific regulation Trend has reversed

18
safe harborstatement
This management reportcontains forward-lookingstatements on RandstadHolding nv’s future financialperformance, results fromoperations, and goals andstrategy. By definition,forward-looking statementsgenerate risk and uncertaintybecause they refer to events inthe future and depend oncircumstances that cannot beforeseen in advance.Numerous factors cancontribute to materialdeviation from results anddevelopments indicated inforward-looking statements.
Such factors can includegeneral economiccircumstances, scarcity on thelabor market, demand for(flexible) personnel or ourother HR services, entry intonew markets, the provision ofnew services, changes instaffing and labor legislation,personnel costs, futureexchange and interest rates,changes in tax rates andsubsidies, future corporatemergers, acquisitions anddivestments, and thedevelopment of technology.You should therefore not placeundue reliance on theseforward-looking statements.
They are made at the time ofpublication of the annualfinancial statements of thecompany and in no wayprovide guarantees for futureperformance. All operatingand business environments aresubject to risk and uncertainty.For this reason, we can offerno assurances that theforward-looking statementspublished here will provecorrect at a future date, andthe company assumes no dutyto update any such forward-looking statements.

19
value proposition& strategy
20 How we create value
22 Strategic priorities and objectives
23 How sustainability is embedded withinRandstad
26 Sustainability framework
28 Value for our clients and candidates
40 Value for our employees
47 Value for society
51 Sustainability basics

20
annual report 2016 − Randstad Holding nv
Introduction
Having as many people as possible working is a good thing forsociety as a whole. It makes companies productive and itprovides people with a fulfilling life. It is our ambition to bean employer of choice ourselves, so that we can continue toattract the best people, who in turn will provide our clientswith the excellent execution they need. In this way, we cancontribute to a better society, leveraging the experience andexpertise we have gained over more than 56 years. As such,we help to maximize future employment and economicgrowth. In 2016, Randstad placed about 2.2 million people intemporary jobs (around 625,000 on a daily basis) and over180,000 people in permanent positions.
Since the introduction of our core values, we have aspired togrow sustainably, our aim being to safeguard the businessand its long-term viability, while taking the interests of allstakeholders into account, and making our businessincreasingly relevant to all parties involved. This aspiration isclearly reflected in our core value of 'simultaneous promotionof all interests'. As a result, we also adhere to the integratedreporting guidelines for the structure of this managementreport.
Long-term value creation throughour strategy
Helping people to find work is our key driver. It is Randstad'srole in society. Never before has Randstad been in a betterposition to add real value for clients and candidates in a worldwhere digital is the new normal. By smartly integratingsuperior digital HR technology with the human touch of ourprofessional and experienced people, we can stand out fromthe competition. A good example is our recent acquisition ofMonster Worldwide, whose unparalleled digital capabilities,combined with our own expertise, will enable us to push theboundaries in the industry.
This also directly translates into the company's financial andgrowth ambitions. Geographically, Randstad is active incountries representing over 90% of the global HR servicesmarket. As described in the section ‘Our businessenvironment’, we aim to capitalize on the structural growthdrivers of our industry in these geographies.
The diagram 'Our strategy and strategic roadmap' shows howwe create long-term value for our stakeholders. Our strategyto capture growth opportunities consists of four strategicbuilding blocks, which will be explained in the followingsections. Our strategic building blocks, combined with ourstrategic priorities, will enable us to serve the interests of ourstakeholders.
Strong concepts
We create and
manage a balanced
workforce by
connecting
candidates with
suitable employment
opportunities
We attract bright,
agile and adaptable
employees and
challenge them
to outperform
towards clients
and candidates
Simultaneous promotion of all interests: we help to maximize future employment and economic growth
We aim to maximize shareholder returns, by optimizing our economic value added (EVA)
Best people Excellent execution
We aim to be the
most attractive
employer for
our employees
Our strong concepts
drive excellent
development
opportunities for
our employees
Value through our strategy
Clients
Employees
SocietyIncluding shareholders
Candidates
We use best practices
and proven procedures
to ensure candidate
engagement and first-
class service delivery
Superior brands
We guarantee to our clients
that they will receive the
highest quality service and get
access to the best candidates
We are well-known for making
the best jobs available and
giving people the opportunity
to develop their talents
Superior brands help us to
attract, recruit and retain
the best people
Strategic building blocks
Stakeh
old
ers
Our high-performance
culture helps us to
recruit, retain and
develop the best people
how we create valuehow we create value

21
annual report 2016 − Randstad Holding nv
Our strategy and strategic roadmap
Strategic building blocks
- Strong concepts
- Best people
- Excellent execution
- Superior brands
Value for our stakeholdersStructural growth drivers
Randstad core values: to know, serve and trust, striving for perfection and the simultaneous promotion of all interests
Optimal workforcesfor clients
The best jobs for candidates
Expertise for a better society and shareholder return
The employer ofchoice for our employees
- Flexibility & outsourcing
- Demographics
- Clients look for a total offering
- Regulation
Sustainability basics
- Acquisition of Proffice, Obiettivo Lavoro, Careo, twago, Monster Worldwide- Intended acquisitions of Ausy and BMC (closed in early 2017)- Leverage ratio 0.8
- Incremental conversion ratio of 41%- Introduction of value-based pricing
- Deployment of global Sourceright strategy- Implementation of central delivery and SME approach in Staffing and sourcing centers for Professionals- Global IT SSC infrastructure rolled out
- Growth in MSP (+37%) and RPO (stable)- Inhouse Services maintains double-digit growth (+10%)
- Roll-out of technology platforms, e.g., RiseSmart, twago- RIF: 5 new investments- HR tech opco initiatives: Big Data, Randstad Direct, Ploy
- Organic revenue growth: 4.7%- EBITA margin of 4.6% (up 10bp year-on-year)- Productivity (GP/FTE) remained stable- About 2.2 million candidates placed- >180,000 permanent positions filled
Goals
M&A
Tech
Talent
TTA
Org
ABFS
Today
Progress in 2016Objectives
Shaping the world of work- Optimized workforces for clients- The best jobs for candidatesGrow to 5-6% EBITA- Profitable growth- Improving margin- Increasing productivity
HR Technology- Being the most agile integrator of technology & services in our industryRandstad Innovation Fund- Capturing trends and future business in HR technology
World League People, at the right place, at the right time- Optimized organization structure- High-performance culture and people engagement- Continuous process improvement
Total Talent Architecture, World Class Customer Experience- Creating quantifiable business impact by addressing the entire workforce of our clients- Increasing share of wallet- 1,000 large clients targeted
Talent management, unique candidate engagement- Optimum integration of technology and human touch- Leader in speed of matching and quality of hire- Fostering talent engagement and communities
M&A, seamless fit integrations- Strategic fit- Long-term value creation- Manageability- EVA positive after 3 years
Activity-based field steering- Driving growth and productivity through commercial excellence- Brand strength, leads and conversion
- Successful integration of technology in talent management in main operations

22
annual report 2016 − Randstad Holding nv
Our strategic objectives and roadmap (see previous page)should enable us to capitalize on the structural growth driversin our markets.
Strategic priorities for the longer termWe apply the following longer term strategic priorities, whichwill support us in realizing our objectives and maximizingshareholder returns:- Capture profitable growth opportunities;- Continue to use activity-based field steering to drive
operational excellence;- Use dedicated delivery models to target different client
groups;- Develop and roll out our digital strategy in order to
support long-term value creation;- Further improve our business mix by a strong focus on
SME, Professionals, permanent placements and the rolloutof our outplacement and career transition platformRiseSmart;
- Focus consistently on an efficient cost structure to optimizeconversion of gross profit into EBITA.
Strategic objectives for the longer termTo further guide this process, we adhere to the followingfinancial objectives, which are all closely related:- EBITA margin of 5% to 6% over time, through revenue
growth, mix improvement, and efficiency gains;- Optimizing our Economic Value Added (EVA);- Continuous profitable market share gains;- A sound financial position with a leverage ratio of
between 0 and 2.
Strategic objective Progress in 2016
EBITA margin of 5%-6% overtime
In 2016, our EBITA margin further expanded to 4.6%, up 10bp YoY. Longer term, we continueto believe that a 5%-6% EBITA margin is feasible, dependent on 1) organic revenue trends,2) pricing climate and mix effects, and 3) productivity gains including the effect ofdigitalization on our traditional business models
Optimize EVA Randstad has a long-term track record of creating economic value, only disrupted by thesevere macroeconomic crisis in 2009/2010. This underpins our vulnerability to the economiccycle. Since then, our ROIC has consistently improved until 2016. The considerable capitaldeployed to M&A in 2016 has temporarily impacted a further recovery of our ROIC and long-term value creation. Hence, our focus in 2017 will be on further improving our economicreturns, particularly on our newly acquired companies. Being an important driver foroptimizing EVA, capital discipline remains a strategic priority.
Profitable market share gains In 2016, we gained share in core markets such as France, Germany and Italy. Overall, wecontinued to execute a disciplined pricing policy, driving further profitable growth in many ofour markets.
Leverage ratio of between 0and 2
Our leverage ratio moved from 0.2 (2015) to 0.8, impacted by our acquisitions completed in2016. This is still comfortably within the targeted range of 0 and 2. Given our focus on organicoperations in 2017 and generally sound FCF prospects through the cycle, we aim to remainwithin this range going forward
"I can submit my hours workedimmediately"
strategic priorities and objectivesstrategic priorities and objectives

23
annual report 2016 − Randstad Holding nv
introduction
It is our job to make work work − in the long term and foreveryone. Sustainability is at the heart of our strategy and ouroperations. Our engagement with our stakeholders and theservice we provide to them builds mutual trust. This trust isenhanced by simultaneously promoting the interests of allstakeholders and society as a whole. We believe this creates anessential and long-term foundation for our business.Simultaneous promotion of all interests, one of our corevalues, is the basis for our social responsibility and oursustainability framework.
Our Executive Board bears ultimate responsibility for theGroup's social responsibility and our sustainability framework,while related topics are discussed frequently with theSupervisory Board. Randstad not only contributes to society atan international level, but the wider Randstad community alsoparticipates in many socially involved and volunteeringinitiatives on a local level. These activities are listed on ourcorporate website. Our operating companies have their ownSustainability Managers or a dedicated coordinator forsustainability matters, depending on their size. The GroupSustainability Manager reports directly to the CompanySecretary.In the area of sustainability in the workforce, in dialogue witha number of highly influential global companies, Randstadfocuses on several key topics to identify the principal globaldilemmas facing today's world of work and possible solutions.These dilemmas include knowledge transfer and leadershipskills.
This year, we are again publishing an integrated annualreport, in which we not only provide legally requiredinformation, but also give an update on the development ofthe interests of Randstad's stakeholders, including ourcontribution to society and the environment. In the past years,we have made significant progress in improving how wereport on sustainability and CSR-related topics. At the end of2016, we decided to initiate a process to further strengthenand update our overarching ambition and strategic prioritiesaround these topics to bring further focus and structure to ourmany current initiatives worldwide, as well as to ourcommunication and the way we aim to differentiate ourselvesfrom our peers. Our updated ambition and strategy are aimedat strengthening the value proposition of the servicesRandstad offers to the labor market, reflecting the significantimpact we have on people's lives in relation to work. We aimto communicate about the outcome of this process in the firsthalf of 2017.
Sustainable Development Goals relevant for RandstadIn September 2015, the UN launched the 17 SustainableDevelopment Goals (SDG). Countries adopted these goals toend poverty, protect the planet, and ensure prosperity for allby 2030. As an HR services provider, Randstad can contributemost to Goal 8: 'Promote sustained, inclusive and sustainableeconomic growth, full and productive employment anddecent work for all'. We also have an impact on Goal 4:'Ensure inclusive and equitable quality education andpromote lifelong learning opportunities for all', Goal 5:'Achieve gender equality and empower all women and girls',and Goal 10: Reduce inequality within and among countries'.
Sustainable Development Goals and targets on which Randstad has most impact
Goals Targets
4.4 By 2030, substantially increase the number of youth and adults who have relevant skills, including technical and vocational skills,
for employment, decent jobs and entrepreneurship
5.1 End all forms of discrimination against all women and girls everywhere
5.5 Ensure women's full and effective participation and equal opportunities for leadership at all levels of decision-making in
political, economic and public life
8.2 Achieve higher levels of economic productivity through diversification, technological upgrading and innovation, including
through a focus on high-value-added and labor-intensive sectors
8.5 By 2030, achieve full and productive employment and decent work for all women and men, including for young people and
persons with disabilities, and equal pay for work of equal value
8.6 By 2020, substantially reduce the proportion of youth not in employment, education or training
8.8 Protect labor rights and promote safe and secure working environments for all workers, including migrant workers, in
particular women migrants, and those in precarious employment
10.2 By 2030, empower and promote the social, economic and political inclusion of all, irrespective of age, sex, disability, race,
ethnicity, origin, religion or economic or other status
10.3 Ensure equal opportunity and reduce inequalities of outcome, including by eliminating discriminatory laws, policies and
practices and promoting appropriate legislation, policies and action in this regard
10.4 Adopt policies, especially fiscal, wage and social protection policies, and progressively achieve greater equality
how sustainability is embedded withinRandstad

24
annual report 2016 − Randstad Holding nv
Sustainability framework
Our sustainability framework sets the direction for ourambitions. It is based on a series of dialogues with multiplestakeholders. The Executive Board and Supervisory Boardwere involved in developing the framework, which forms theheart of our value proposition and therefore reflects ouractivities from the perspective of our clients, candidates,employees, shareholders, employment markets, and society atlarge.
The sustainability framework includes those material issueswhich are ranked as having the highest importance tostakeholders and/or the highest impact on the Randstadbusiness. We also added the related risks, Key PerformanceIndicators (KPIs), and relevant measurable targets.
We have communicated and promoted our sustainabilityframework across all layers of the organization. Several of ourlarger operating companies publish their own detailedsustainability report to facilitate their local stakeholderdialogue.
Our sustainability framework contains KPIs. Several of theseKPIs have already been in place for years, while other KPIs areunder development. New KPIs will be added, while othersmay be relinquished if they turn out to have become obsolete.Assessing KPIs for feasibility, and validating them in light ofdevelopments in the company and society, has become acontinuous process. Our operating companies report on theseKPIs through the reporting system on a quarterly basis. Ournon-financial reporting is therefore embedded in theplanning and control cycle of the organization, and CFOs ofoperating companies bear final responsibility for its quality.Elements related to sustainability reporting are explicitlyincluded in our key control framework.
Randstad has the ambition to increase the quality of itsexternal sustainability reporting. In 2016, we thereforecommissioned a consultancy firm to perform an audit of ournon-financial KPIs in order to assess the quality of the dataand the maturity of the external assurance process. Theconsultancy firm performed a review of the Group'sadministrative organization and internal controls around CSRreporting using audit methodology. They also visited anumber of large country entities, explicitly aimed atdeveloping knowledge and providing assistance at a local
level, thus improving the efficiency and quality of thereporting to the head office. As a result, we now have betterinsight into the quality of the data and the maturity of thereporting processes. As next steps, the current list of KPIs willbe reviewed for strategic relevance and the guidelines will beupdated on scope, definitions and estimations.
Given the relevance of sustainability for Randstad's business,its ambition, and long-term viability, the Supervisory Boardhas included non-financial KPIs from our sustainabilityframework − one from each pillar − to the Executive Board'slong-term incentive performance targets, in a ratio of 80%Total Shareholder Return (TSR) and 20% non-financial KPIs. Asfrom 2017, it is proposed to amend the ratio to 65% TSR and35% non-financial KPIs.
Materiality matrixIdentifying material issues is an important part of ourapproach to reporting. It helps Randstad to prioritize ourreporting on what matters most to the business and to ourstakeholders. It makes those items more explicit which are keyto Randstad's strategic direction. To identify these matters, wetake input from both inside and outside Randstad. We had amateriality analysis conducted by independent consultants inorder to validate our sustainability framework, involvingalmost 8,000 stakeholders. The stakeholder groups includedclients, candidates, employees, suppliers, authorities, investors,the financial sector, trade unions, civil society, and sectororganizations. The analysis encompassed desk research,interviews with internal stakeholders, client and candidatesurveys, and the Great People Survey for corporate employees.Based on a ranking of the stakeholders (their power toinfluence, the urgency of issues they deemed important, andthe legitimacy of their interests) and an extensive analysis ofall data generated during the process, we identified 27 keymaterial issues in the social, economic, and environmentaldomains. These issues are captured in a materiality matrix,which has been adopted by the Executive Board.
The x-axis of the matrix outlines issues we have identifiedinternally as having the strongest impact on our business interms of revenue growth, gross-margin protection, and costreduction. Issues identified as having the highest overallrelevance to stakeholders are ranked on the y-axis. Themateriality matrix was compiled of overall results for eachstakeholder group globally and therefore does not reflectregional or cultural differences.
how sustainability is embedded within Randstad

25
annual report 2016 − Randstad Holding nv
Materiality matrix
• Corporate governance
• Sustainable supply chain management
• Environmental impact of the company
• Environmental policy • Employment security
• Investing in emerging
markets • Product and service
responsibility • Climate change
• Social reporting
• Environmental reporting
Low
H
igh
Imp
ort
an
ce t
o s
takeh
old
ers
• Talent attraction
• Competitiveness and staff retention
of the company
• Corporate citizenship
• Labor management • Customer protection
relations
• Reputation management
• Employee engagement
Low HighImpact on Randstad's business
• Business principles and
• Legislation and human rights
regulation • Training and education
• Health and safety • Economic and social
management impact of labor on society
• Performance and risk management
• Stakeholder engagement
• Increase of labor market flexibility
and mobility
• CRMInnovation management •
The Top 20 materialities and their location in this report:
1. Business principles on page 51 and human rights on page 52
2. Training and education on page 37
3. Increase of labor market flexibility and mobility on page 15
4. Economic & social impact of labor on society on page 14
5. Stakeholder engagement on page 23
6. Performance on page 58 & risk management on page 80
7. Legislation & regulation on page 17
8. Health & safety management on page 39
9. Client relationship management (CRM) on page 36
10. Innovation management on page 35
11. Talent attraction on page 40 & staff retention on page 44
12. Customer protection on page 84
13. Competitiveness of the company on page 14
14. Employee engagement on page 44
15. Reputation management on page 36
16. Labor management relations on page 48
17. Corporate citizenship on page 49
18. Corporate governance on page 89
19. Sustainable supply chain management on page 54
20. Environmental impact of the company on page 54
26
annual report 2016 − Randstad Holding nv
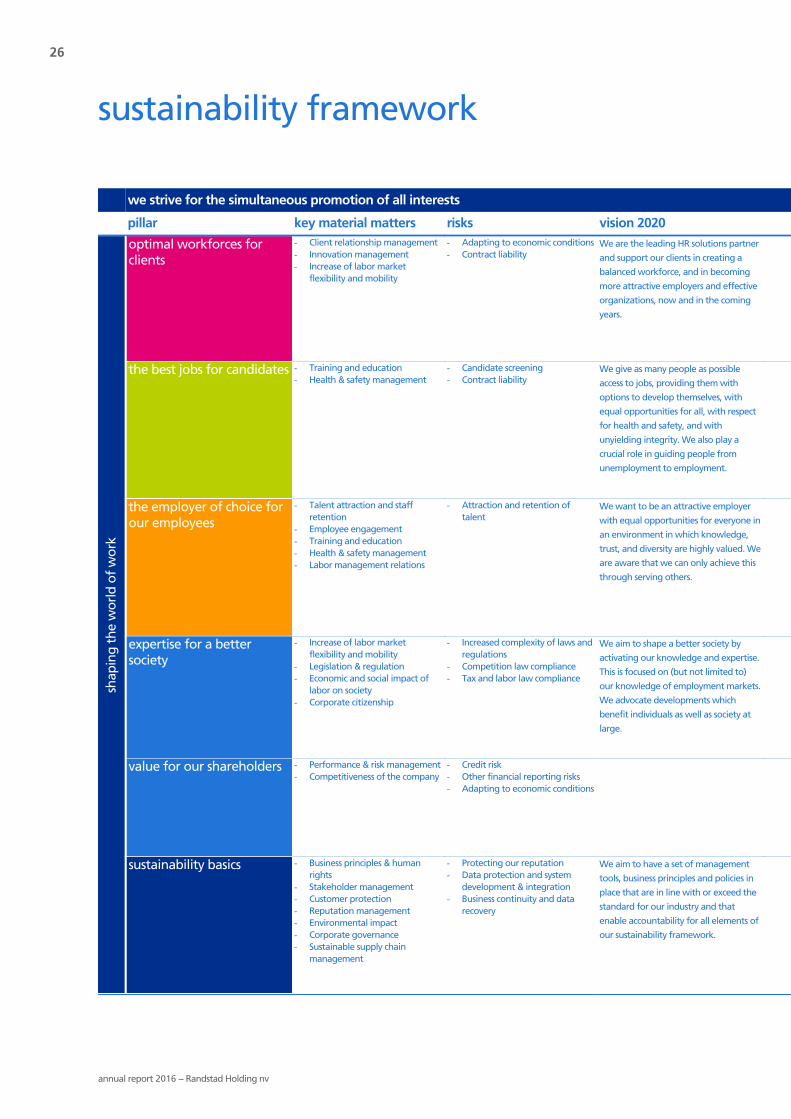
we strive for the simultaneous promotion of all interests
pillar key material matters risks vision 2020 key drivers 2012 - 2020 KPIs measurable targets
shap
ing
the
wor
ld o
f w
ork
optimal workforces forclients
- Client relationship management- Innovation management- Increase of labor market
flexibility and mobility
- Adapting to economic conditions- Contract liability
We are the leading HR solutions partner
and support our clients in creating a
balanced workforce, and in becoming
more attractive employers and effective
organizations, now and in the coming
years.
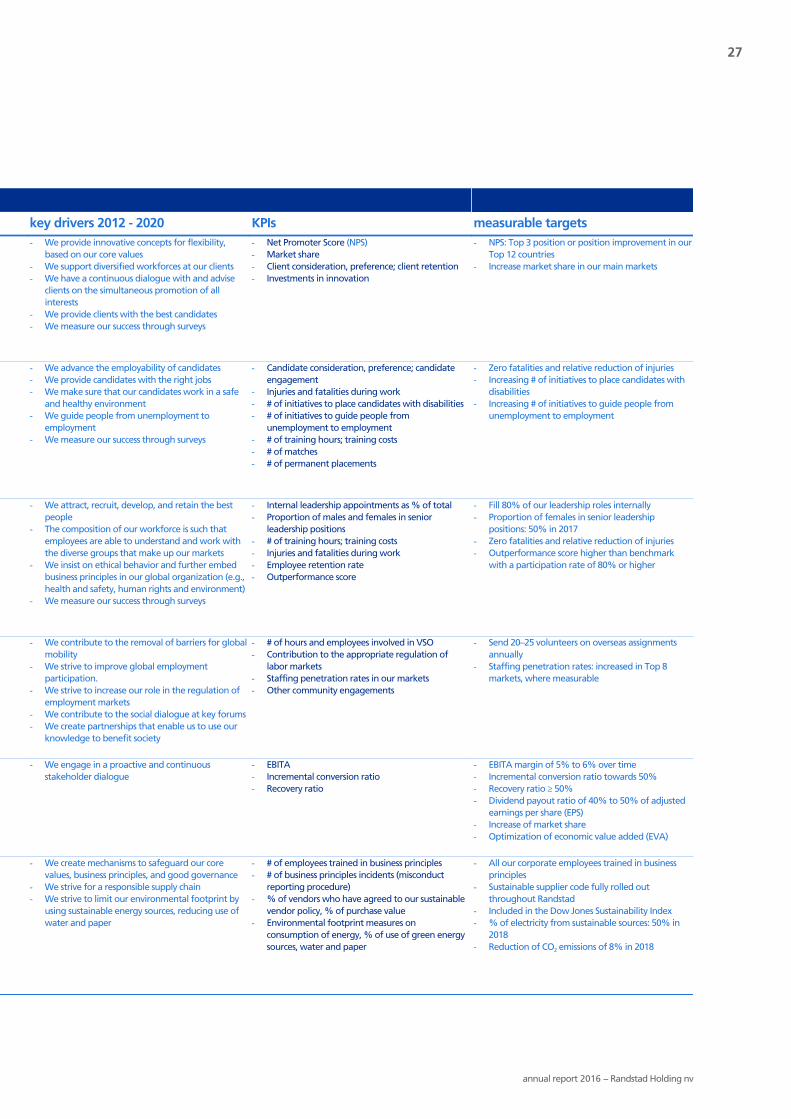
- We provide innovative concepts for flexibility,based on our core values
- We support diversified workforces at our clients- We have a continuous dialogue with and advise
clients on the simultaneous promotion of allinterests
- We provide clients with the best candidates- We measure our success through surveys
- Net Promoter Score (NPS)- Market share- Client consideration, preference; client retention- Investments in innovation
- NPS: Top 3 position or position improvement in ourTop 12 countries
- Increase market share in our main markets
the best jobs for candidates - Training and education- Health & safety management
- Candidate screening- Contract liability
We give as many people as possible
access to jobs, providing them with
options to develop themselves, with
equal opportunities for all, with respect
for health and safety, and with
unyielding integrity. We also play a
crucial role in guiding people from
unemployment to employment.
- We advance the employability of candidates- We provide candidates with the right jobs- We make sure that our candidates work in a safe
and healthy environment- We guide people from unemployment to
employment- We measure our success through surveys
- Candidate consideration, preference; candidateengagement
- Injuries and fatalities during work- # of initiatives to place candidates with disabilities- # of initiatives to guide people from
unemployment to employment- # of training hours; training costs- # of matches- # of permanent placements
- Zero fatalities and relative reduction of injuries- Increasing # of initiatives to place candidates with
disabilities- Increasing # of initiatives to guide people from
unemployment to employment
the employer of choice forour employees
- Talent attraction and staffretention
- Employee engagement- Training and education- Health & safety management- Labor management relations
- Attraction and retention oftalent
We want to be an attractive employer
with equal opportunities for everyone in
an environment in which knowledge,
trust, and diversity are highly valued. We
are aware that we can only achieve this
through serving others.
- We attract, recruit, develop, and retain the bestpeople
- The composition of our workforce is such thatemployees are able to understand and work withthe diverse groups that make up our markets
- We insist on ethical behavior and further embedbusiness principles in our global organization (e.g.,health and safety, human rights and environment)
- We measure our success through surveys
- Internal leadership appointments as % of total- Proportion of males and females in senior
leadership positions- # of training hours; training costs- Injuries and fatalities during work- Employee retention rate- Outperformance score
- Fill 80% of our leadership roles internally- Proportion of females in senior leadership
positions: 50% in 2017- Zero fatalities and relative reduction of injuries- Outperformance score higher than benchmark
with a participation rate of 80% or higher
expertise for a bettersociety
- Increase of labor marketflexibility and mobility
- Legislation & regulation- Economic and social impact of
labor on society- Corporate citizenship
- Increased complexity of laws andregulations
- Competition law compliance- Tax and labor law compliance
We aim to shape a better society by
activating our knowledge and expertise.
This is focused on (but not limited to)
our knowledge of employment markets.
We advocate developments which
benefit individuals as well as society at
large.
- We contribute to the removal of barriers for globalmobility
- We strive to improve global employmentparticipation.
- We strive to increase our role in the regulation ofemployment markets
- We contribute to the social dialogue at key forums- We create partnerships that enable us to use our
knowledge to benefit society
- # of hours and employees involved in VSO- Contribution to the appropriate regulation of
labor markets- Staffing penetration rates in our markets- Other community engagements
- Send 20–25 volunteers on overseas assignmentsannually
- Staffing penetration rates: increased in Top 8markets, where measurable
value for our shareholders - Performance & risk management- Competitiveness of the company
- Credit risk- Other financial reporting risks- Adapting to economic conditions
- We engage in a proactive and continuousstakeholder dialogue
- EBITA- Incremental conversion ratio- Recovery ratio
- EBITA margin of 5% to 6% over time- Incremental conversion ratio towards 50%- Recovery ratio ≥ 50%- Dividend payout ratio of 40% to 50% of adjusted
earnings per share (EPS)- Increase of market share- Optimization of economic value added (EVA)
sustainability basics - Business principles & humanrights
- Stakeholder management- Customer protection- Reputation management- Environmental impact- Corporate governance- Sustainable supply chain
management
- Protecting our reputation- Data protection and system
development & integration- Business continuity and data
recovery
We aim to have a set of management
tools, business principles and policies in
place that are in line with or exceed the
standard for our industry and that
enable accountability for all elements of
our sustainability framework.
- We create mechanisms to safeguard our corevalues, business principles, and good governance
- We strive for a responsible supply chain- We strive to limit our environmental footprint by
using sustainable energy sources, reducing use ofwater and paper
- # of employees trained in business principles- # of business principles incidents (misconduct
reporting procedure)- % of vendors who have agreed to our sustainable
vendor policy, % of purchase value- Environmental footprint measures on
consumption of energy, % of use of green energysources, water and paper
- All our corporate employees trained in businessprinciples
- Sustainable supplier code fully rolled outthroughout Randstad
- Included in the Dow Jones Sustainability Index- % of electricity from sustainable sources: 50% in
2018- Reduction of CO2 emissions of 8% in 2018
sustainability framework
27
annual report 2016 − Randstad Holding nv
we strive for the simultaneous promotion of all interests
pillar key material matters risks vision 2020 key drivers 2012 - 2020 KPIs measurable targets
shap
ing
the
wor
ld o
f w
ork
optimal workforces forclients
- Client relationship management- Innovation management- Increase of labor market
flexibility and mobility
- Adapting to economic conditions- Contract liability
We are the leading HR solutions partner
and support our clients in creating a
balanced workforce, and in becoming
more attractive employers and effective
organizations, now and in the coming
years.
- We provide innovative concepts for flexibility,based on our core values
- We support diversified workforces at our clients- We have a continuous dialogue with and advise
clients on the simultaneous promotion of allinterests
- We provide clients with the best candidates- We measure our success through surveys
- Net Promoter Score (NPS)- Market share- Client consideration, preference; client retention- Investments in innovation
- NPS: Top 3 position or position improvement in ourTop 12 countries
- Increase market share in our main markets
the best jobs for candidates - Training and education- Health & safety management
- Candidate screening- Contract liability
We give as many people as possible
access to jobs, providing them with
options to develop themselves, with
equal opportunities for all, with respect
for health and safety, and with
unyielding integrity. We also play a
crucial role in guiding people from
unemployment to employment.
- We advance the employability of candidates- We provide candidates with the right jobs- We make sure that our candidates work in a safe
and healthy environment- We guide people from unemployment to
employment- We measure our success through surveys
- Candidate consideration, preference; candidateengagement
- Injuries and fatalities during work- # of initiatives to place candidates with disabilities- # of initiatives to guide people from
unemployment to employment- # of training hours; training costs- # of matches- # of permanent placements
- Zero fatalities and relative reduction of injuries- Increasing # of initiatives to place candidates with
disabilities- Increasing # of initiatives to guide people from
unemployment to employment
the employer of choice forour employees
- Talent attraction and staffretention
- Employee engagement- Training and education- Health & safety management- Labor management relations
- Attraction and retention oftalent
We want to be an attractive employer
with equal opportunities for everyone in
an environment in which knowledge,
trust, and diversity are highly valued. We
are aware that we can only achieve this
through serving others.
- We attract, recruit, develop, and retain the bestpeople
- The composition of our workforce is such thatemployees are able to understand and work withthe diverse groups that make up our markets
- We insist on ethical behavior and further embedbusiness principles in our global organization (e.g.,health and safety, human rights and environment)
- We measure our success through surveys
- Internal leadership appointments as % of total- Proportion of males and females in senior
leadership positions- # of training hours; training costs- Injuries and fatalities during work- Employee retention rate- Outperformance score
- Fill 80% of our leadership roles internally- Proportion of females in senior leadership
positions: 50% in 2017- Zero fatalities and relative reduction of injuries- Outperformance score higher than benchmark
with a participation rate of 80% or higher
expertise for a bettersociety
- Increase of labor marketflexibility and mobility
- Legislation & regulation- Economic and social impact of
labor on society- Corporate citizenship
- Increased complexity of laws andregulations
- Competition law compliance- Tax and labor law compliance
We aim to shape a better society by
activating our knowledge and expertise.
This is focused on (but not limited to)
our knowledge of employment markets.
We advocate developments which
benefit individuals as well as society at
large.
- We contribute to the removal of barriers for globalmobility
- We strive to improve global employmentparticipation.
- We strive to increase our role in the regulation ofemployment markets
- We contribute to the social dialogue at key forums- We create partnerships that enable us to use our
knowledge to benefit society
- # of hours and employees involved in VSO- Contribution to the appropriate regulation of
labor markets- Staffing penetration rates in our markets- Other community engagements
- Send 20–25 volunteers on overseas assignmentsannually
- Staffing penetration rates: increased in Top 8markets, where measurable
value for our shareholders - Performance & risk management- Competitiveness of the company
- Credit risk- Other financial reporting risks- Adapting to economic conditions
- We engage in a proactive and continuousstakeholder dialogue
- EBITA- Incremental conversion ratio- Recovery ratio
- EBITA margin of 5% to 6% over time- Incremental conversion ratio towards 50%- Recovery ratio ≥ 50%- Dividend payout ratio of 40% to 50% of adjusted
earnings per share (EPS)- Increase of market share- Optimization of economic value added (EVA)
sustainability basics - Business principles & humanrights
- Stakeholder management- Customer protection- Reputation management- Environmental impact- Corporate governance- Sustainable supply chain
management
- Protecting our reputation- Data protection and system
development & integration- Business continuity and data
recovery
We aim to have a set of management
tools, business principles and policies in
place that are in line with or exceed the
standard for our industry and that
enable accountability for all elements of
our sustainability framework.
- We create mechanisms to safeguard our corevalues, business principles, and good governance
- We strive for a responsible supply chain- We strive to limit our environmental footprint by
using sustainable energy sources, reducing use ofwater and paper
- # of employees trained in business principles- # of business principles incidents (misconduct
reporting procedure)- % of vendors who have agreed to our sustainable
vendor policy, % of purchase value- Environmental footprint measures on
consumption of energy, % of use of green energysources, water and paper
- All our corporate employees trained in businessprinciples
- Sustainable supplier code fully rolled outthroughout Randstad
- Included in the Dow Jones Sustainability Index- % of electricity from sustainable sources: 50% in
2018- Reduction of CO2 emissions of 8% in 2018

28
annual report 2016 − Randstad Holding nv
Introduction
In this section, we explain our value proposition for clients,candidates, employees, and society, in line with our strategicpriorities. We will also analyze a number of non-financial KPIsas presented in our sustainability framework. In addition, thissection includes an overview of our strategic building blocks:strong concepts, excellent execution, superior brands, and bestpeople.
Our value for clients
At Randstad, we play a key role in managing our clients’ keyassets: their people. Our clients today are operating inhypercompetitive environments. The skills they need – nowand in the foreseeable future – are not always easilyaccessible. Increasingly, the talent available is simply not skilledenough to meet business demands. Clients therefore realizethat if they are to attract, engage and employ talentthemselves, they would need to make significant investments.This is where we add value. By partnering with us, our clientscan focus on their core business, while we bring them the bestcandidates for the vacancies they need to fill.
Randstad knows what it takes to be an attractive employer.We provide a strong portfolio of solutions that help ourclients create and manage a well-balanced workforce, withemployees who have the right skills, competencies, andcultural fit. Clients benefit from Randstad's strong knowledgeof the labor market, as well as our innovative Tech solutionscombined with our dedicated human Touch. We will applydigital to all activities in order to improve our core processes,as well as create new business models.
We offer a range of proven and robust services, from regulartemporary staffing and permanent placement of candidatesto dedicated on-site workforce management with InhouseServices – an offering unique in our industry. Our specializedHR Solutions include Recruitment Process Outsourcing (RPO),Managed Services Programs (MSP), payroll services,outplacement, outsourcing, and consultancy.
We deliver our services in multiple ways, using multiple serviceconcepts. Our service concepts, which are explained in thesection 'Our strategy: strong concepts', offer a wide range ofsolutions and are always based on standardized best practicesand proven procedures.
Total Talent Architecture (our large-client approach)Total Talent Architecture (TTA) is an approach we use for ourlargest clients (approx. 1,000). TTA enables a company to builda holistic talent strategy. This requires an optimum balance interms of permanent, contingent and freelance talent, in orderto make a measurable impact on business goals and growth.
Traditional talent acquisition is typically executed in silos.Hiring managers may use insourced, outsourced, or a mix of
such services to acquire talent. As a result, process overhead isunavoidable, and the lack of transparency and internalcommunication often leads to cost, quality, and complianceissues. In contrast, TTA provides an in-depth analysis of aclient’s workforce planning to deliver a talent strategy alignedwith growth ambitions and profitability targets. This strategygenerally comprises flexible talent supply models based ondifferences in business needs, geography, and workforcedemographics. TTA connects all our business lines, and we seeample opportunities to increase our presence in higher-value-added services (such as Professionals and permanentplacements).
Given our broad service offering and international coverage,Randstad is well-positioned to provide these total talentsolutions. In most cases, we build on existing, long-standingrelationships with clients. Through a comprehensive customerand market intelligence exercise, we review all internal andexternal data sources available in order to compare theirresults with those of other companies in the same industry (oradjacent industries). Together with our clients, we review theirorganizational performance, comparing their current HR/talent position with their desired future position. By drawingup a ‘total talent roadmap’, we proactively show them theirfuture talent strategy, demonstrating opportunities andbarriers to success, as well as potential business impact interms of growth, financials, and competitive position.
Through the total talent roadmap, we engage our clients in astrategic conversation. The roadmap demonstrates ourcapabilities in helping our clients optimize their workforce. Italso serves as a guideline to gradually implement our broaderrange of solutions across all layers of their organization.
Executive Board
Staffing Inhouse MSP & RPO
Profsnon-tech
Profs tech
Managing Director operating company
Marketing, HR, Business Concepts
Support SSC (Finance, IT, Legal, Facilities)
Total Talent Architecture
Total Talent Architecture
value for our clients and candidatesvalue for our clients and candidates

29
annual report 2016 − Randstad Holding nv
Our TTA framework aims to improve the alignment oforganizational strategy and workforce planning, impacting:- Quality of talent- Workforce productivity- Internal mobility (local, regional, and global)- Process efficiency- Organizational agility- Risk mitigation- Social responsibility- Profitability and growth
This approach keeps us agile, as we continuously adjust ourdelivery models to serve our clients in the best possible way.As these models evolve, we share insights and drive strategicconversations with clients so that they can benefit from thedepth of our service offering, from staffing and recruitment ofprofessionals through to highly customized RPO and MSP.Through TTA, we build long-term, sustainable relationshipsthat are focused on long-term value creation. In this way, weproactively shape the world of work.
Our value for candidates
Our mission is to make the best jobs available to as manypeople as possible, providing people with the opportunity todevelop themselves. We strive to do this while providing equalopportunities for all, respecting health and safety, and withunyielding integrity. We advocate equal opportunities andunbiased competence management, irrespective of gender,race, religion, age, or background. In addition, we play acrucial role in helping people make the transition from
unemployment to employment (e.g., through a number ofprograms to help unemployed youth).
By connecting our candidates with suitable employmentopportunities, we provide them and their families withindependence, as well as job satisfaction, dignity, and respect.Through both temporary and permanent placements, weoffer candidates opportunities to gain experience andimprove their skills, while achieving personal growth anddeveloping their career. By building long-term relationshipswith our candidates, we are able to help them formulate thebest career path and achieve their long-term career ambitions.In addition, we enable freelancers to share their knowledgeand experience with organizations, ensuring a good culturaland creative fit.
Although there are many candidates who simply prefertemporary work, for a large number of candidates, temporarywork either represents their first step on the way to apermanent job or it liberates them from unemployment.Temporary work is the best possible training for a permanentjob, as it gives candidates an opportunity to enhance andbroaden their experience, which makes them more valued byorganizations. On average, only 46% of workers wereemployed before agency work, but 72% are employed afteragency work (source: Ciett, Economic Report 2015). For othercandidates, the services we provide enable them to build acareer, to earn additional income, or to adjust their work/lifebalance to their own circumstances, needs and wishes.
By finding work for people, we contribute to the optimizationof talent allocation. By helping candidates manage theirexpectations and ambitions in terms of sector, client, and job
Total talent roadmap
- Strategic planning
- Includes all workforces
- Holistic approach
- Global and local optimization
- Applied innovations
- Aims for industry leadership
- MSP
- RPO
- Integrated Talent Solutions
- SSC
- Process improvement
- Aims to add value
- Transparency
- Longer-term view
- Process efficiencies
- Aims to lower total costs
- Consolidated
- Compliance
- Aims to control
and save costs- Diversified
- Single categories
- Aims to meet
local needs
Ad-hoc
Preferred
suppliers
Total cost of
ownership
Engagement
models
Total Talent
Architecture

30
annual report 2016 − Randstad Holding nv
profile, and by providing training where necessary, we helpthem adapt to changing requirements. We recognize thatvarious groups of people in society are distanced from work.We therefore run a variety of local job- and skills-orientedtraining programs designed to help these people integrate orreintegrate into the employment market.
Our recent acquisition of Monster Worldwide also addssignificant value for candidates. By leveraging advancedtechnology-enabled services combined with the high valuegenerated through our strong and long-term relationshipswith candidates, the Monster platform empowered byRandstad will greatly enhance candidates' careeropportunities, now and in the future.
Our strategy: strong concepts
To ensure value creation for clients and candidates, we offerthem four strong concepts:- Staffing- Inhouse Services- Professionals- HR Solutions
These concepts are based on best practices and provenprocedures, ensuring efficient working methods and first-classservice delivery. The concepts can be rapidly replicated andleveraged in other markets, and are relatively easy to adapt tomeet specific needs. Our service concepts are well-known forthe consistency and quality of their delivery. As a result, all ofour clients know they can trust Randstad to meet their needsthroughout the world. Through in-depth knowledge of ourclients' businesses, we provide them with the right talent atthe right time, addressing our clients’ need for increasedflexibility.
In 2016, we continued to focus on the right delivery modelsfor clients and client profitability. For small and medium-sizedclients, we offer Staffing and Professionals services throughour branch network and through online solutions. Our teamsin these businesses each focus on a specific market segmentand/or job profile, offering temporary staffing and/orpermanent placements. For larger clients requiring highervolumes, we have developed segment-specific deliverymodels. As our clients' businesses continue to change, weadapt our service offering accordingly. Two good examplesare Randstad Inhouse Services and Randstad Sourceright. Thelatter focuses on Recruitment Process Outsourcing (RPO) andManaged Services Programs (MSP).
As shown in the model below, across the Randstad Group, wecontinuously analyze our clients' requirements, assessingwhether the existing delivery model is still the most effectiveand efficient to meet their needs. In addition, we analyzewhether the existing contracts and delivery models generatethe desired profitability. Based on this assessment, clients maybe transferred to an alternative delivery model. For example,we may transfer a large Professionals client, serviced throughour branch network for large perm assignments, to RPO. Inthis way, we can take advantage of the scale RPO provides viaour 'hub-and-spoke' recruitment model on the client'spremises, supported by our near-shore and offshore sourcingcenters. Other examples involve launching an MSP for a largeclient, transfers from Staffing to Inhouse Services, orcentralizing recruitment through our international sourcingcenters.
Such a dedicated delivery model increases the fill rate oforders, resulting in greater efficiency and client satisfaction.What is more, by transferring larger clients to a segment-specific delivery model, the teams at the branches are betterable to focus on their SME market segments.
Client
Large account
Segment-specific
SME
Traditional model
PermTempPermTemp Profsnon-tech
Profstech
MSP & RPO
InhouseStaffing
Professionalsverticals
Total Talent ArchitectureStaffing
specialties
Client strategy
value for our clients and candidates
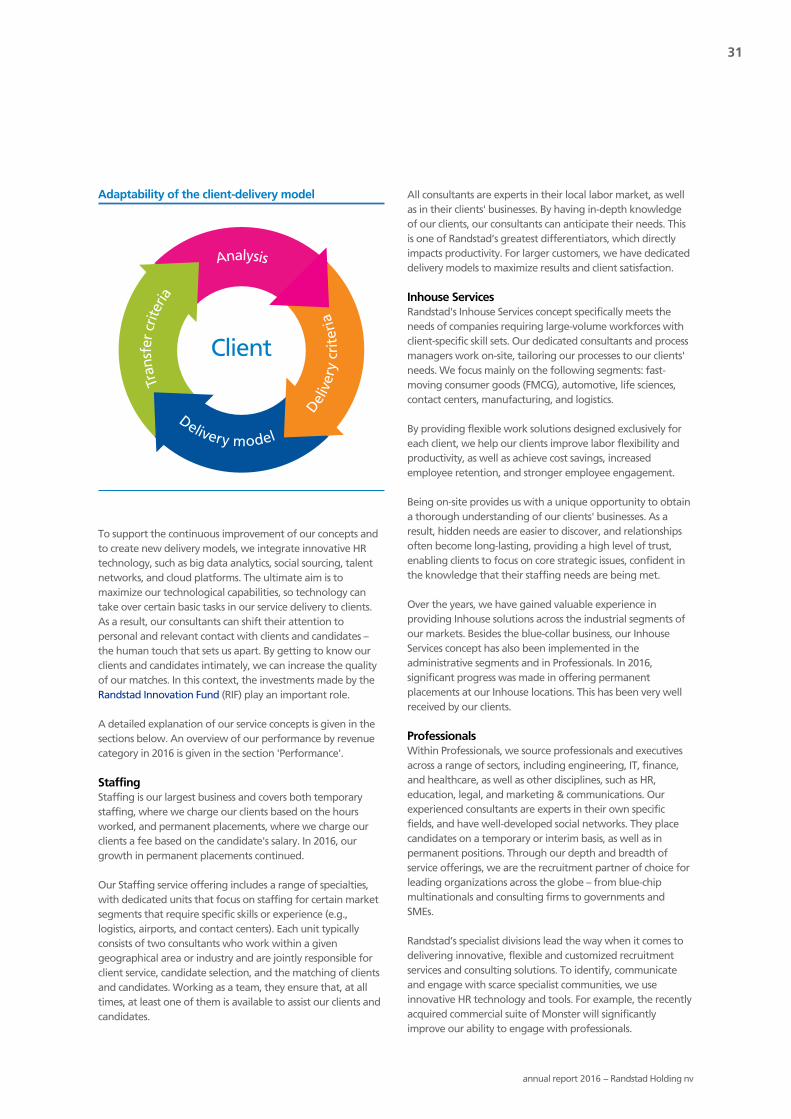
31
annual report 2016 − Randstad Holding nv
To support the continuous improvement of our concepts andto create new delivery models, we integrate innovative HRtechnology, such as big data analytics, social sourcing, talentnetworks, and cloud platforms. The ultimate aim is tomaximize our technological capabilities, so technology cantake over certain basic tasks in our service delivery to clients.As a result, our consultants can shift their attention topersonal and relevant contact with clients and candidates –the human touch that sets us apart. By getting to know ourclients and candidates intimately, we can increase the qualityof our matches. In this context, the investments made by theRandstad Innovation Fund (RIF) play an important role.
A detailed explanation of our service concepts is given in thesections below. An overview of our performance by revenuecategory in 2016 is given in the section 'Performance'.
StaffingStaffing is our largest business and covers both temporarystaffing, where we charge our clients based on the hoursworked, and permanent placements, where we charge ourclients a fee based on the candidate's salary. In 2016, ourgrowth in permanent placements continued.
Our Staffing service offering includes a range of specialties,with dedicated units that focus on staffing for certain marketsegments that require specific skills or experience (e.g.,logistics, airports, and contact centers). Each unit typicallyconsists of two consultants who work within a givengeographical area or industry and are jointly responsible forclient service, candidate selection, and the matching of clientsand candidates. Working as a team, they ensure that, at alltimes, at least one of them is available to assist our clients andcandidates.
All consultants are experts in their local labor market, as wellas in their clients' businesses. By having in-depth knowledgeof our clients, our consultants can anticipate their needs. Thisis one of Randstad’s greatest differentiators, which directlyimpacts productivity. For larger customers, we have dedicateddelivery models to maximize results and client satisfaction.
Inhouse ServicesRandstad's Inhouse Services concept specifically meets theneeds of companies requiring large-volume workforces withclient-specific skill sets. Our dedicated consultants and processmanagers work on-site, tailoring our processes to our clients'needs. We focus mainly on the following segments: fast-moving consumer goods (FMCG), automotive, life sciences,contact centers, manufacturing, and logistics.
By providing flexible work solutions designed exclusively foreach client, we help our clients improve labor flexibility andproductivity, as well as achieve cost savings, increasedemployee retention, and stronger employee engagement.
Being on-site provides us with a unique opportunity to obtaina thorough understanding of our clients' businesses. As aresult, hidden needs are easier to discover, and relationshipsoften become long-lasting, providing a high level of trust,enabling clients to focus on core strategic issues, confident inthe knowledge that their staffing needs are being met.
Over the years, we have gained valuable experience inproviding Inhouse solutions across the industrial segments ofour markets. Besides the blue-collar business, our InhouseServices concept has also been implemented in theadministrative segments and in Professionals. In 2016,significant progress was made in offering permanentplacements at our Inhouse locations. This has been very wellreceived by our clients.
ProfessionalsWithin Professionals, we source professionals and executivesacross a range of sectors, including engineering, IT, finance,and healthcare, as well as other disciplines, such as HR,education, legal, and marketing & communications. Ourexperienced consultants are experts in their own specificfields, and have well-developed social networks. They placecandidates on a temporary or interim basis, as well as inpermanent positions. Through our depth and breadth ofservice offerings, we are the recruitment partner of choice forleading organizations across the globe – from blue-chipmultinationals and consulting firms to governments andSMEs.
Randstad’s specialist divisions lead the way when it comes todelivering innovative, flexible and customized recruitmentservices and consulting solutions. To identify, communicateand engage with scarce specialist communities, we useinnovative HR technology and tools. For example, the recentlyacquired commercial suite of Monster will significantlyimprove our ability to engage with professionals.
Adaptability of the client-delivery model
Client
Analysis
Delivery model
Tran
sfer
criter
ia
Del
ivery
cri
teri
a

32
annual report 2016 − Randstad Holding nv
We know where to find the right talent, and are able tosupport our professionals in gaining additional skills throughtraining if required. Our professionals will add value from themoment they start the job and help achieve our clients'business goals.
HR SolutionsRandstad offers a range of HR solutions that focus on long-term strategic gains for our clients. Our HR Solutions free upthe time of our clients' HR leaders by taking over several oftheir tasks, enabling them to focus on their company'sstrategic HR and business issues. These services are typicallycomplementary to Staffing and Professionals, and arecharacterized by long-standing client relationships. Throughour HR Solutions, we are often able to expand our serviceoffering to Staffing and Professionals. Our key HR Solutionsservices include Recruitment Process Outsourcing (RPO),Managed Services Programs (MSP) and Integrated TalentSolutions, all provided by Randstad Sourceright, as well aspayroll services, outplacement and career transition services,and consultancy.
In 2016, the need for integrated strategic talent solutionscontinued to drive demand for Randstad Sourceright'sservices. By delivering the right talent at the right time in theright modes of employment and at the right cost, we drivequantifiable and lasting business impact for our clients. Wealso continue to see growth in MSP, as well as a demand forblended solutions, with Randstad Sourceright providing adelivery model where clients can take advantage of all hiringchannels, whether it is a contingent or permanent resource.
The global RPO and MSP markets are expected to see strongdemand going forward. The largest market is North America,followed by EMEA, Asia Pacific, and Latin America. As themarket matures, customers are looking beyond traditionaldrivers such as flexibility, scalability, and cost, attachinggreater importance to business impact – including improvingquality of hire, reducing time-to-hire of business-critical talent,measurable process improvement, ability to move intoemerging markets, and greater visibility and insights.
Randstad Sourceright has seen rapid expansion over the pastfew years. With clients increasingly buying on a multi-country,regional and global basis, we have increased our investmentin our global infrastructure in sales and solution design,marketing, account management, and shared services, as wellas technological and recruiting innovations. In line with this,we are making investments in emerging markets in AsiaPacific and Latin America to meet the growing demand for HRservices across geographically spread-out and culturally diversemarkets.
Recruitment Process Outsourcing (RPO)Our RPO services take control of our clients’ entire recruitmentand talent acquisition process, increasing the quality of theirpermanent workforce, and reducing their administrativeburden and costs. We provide tailor-made, own-branded, andon-site HR services to deal with management of vacancies,response screening and assessment, sourcing strategies forniche profiles, brand attraction insights, reduction in the useand management of external agencies, and cross-borderservices.
Our RPO clients are large organizations looking for an RPOprovider that can align organizational strategy with theworkforce plan, adding value through innovative strategicsourcing services, employer branding, diversity, talentcommunity management, workforce planning, HR technologyand talent analytics. Randstad Sourceright is well-positionedto meet these needs through our global capabilities, ournetwork of renowned thought leaders, and expertcommunities, as well as our centralized recruitment centers inthe US, the UK, Hungary, India, and Malaysia. These rapidlygrowing recruitment centers are proving an importantresource to clients, because of their innovations in sourcing,social media, recruitment and HR technology, and employerbranding.
Managed Services Programs (MSP)In our Managed Services Programs, we take primaryresponsibility for the organization and management of aclient’s contingent workforce. On behalf of our clients, wemanage the entire supply chain of all staffing providers. Thisgives clients greater control of their recruitment activities andgreater transparency regarding their spending. ManagedServices Programs are particularly useful for companieswanting a single point of contact in order to ensure greatertransparency and compliance in managing large volumes ofprofessional skills from many different suppliers. We regularlyoperate in more than one country. We have experience withmost Vendor Management System technologies to automatethe hiring and billing process and to provide clients withstatistical management information.
Besides the traditional MSP adoption drivers (such as costreduction, improved compliance, and greater spend andworkforce visibility), new drivers focusing on optimizing theblend of permanent and temporary workers and talentquality have emerged. This development is driving change inMSP solutions. Organizations are starting to look at talentholistically, with talent acquisition encompassing thetemporary, contracting, freelance, and permanent workforce,as well as statement of work (SOW) consultants. Asorganizations continue to recognize the value contributed bycontingent workers, they are increasingly paying attention tothe quality of hires and hiring managers.
value for our clients and candidates

33
annual report 2016 − Randstad Holding nv
Integrated Talent SolutionsAn Integrated Talent Solution is a comprehensive approach todelivering the right talent in the right modes of employment.Our solutions encompass all worker types and sources,including permanent hires, temp-to-hire, staffing, freelancersand contractors, SOW consultants, part-timers, payrollees andseasonal workers.
Depending on the client's requirements, we manage some orall of these types of workers by integrating our supply models,such as RPO, MSP and payroll services. For example, we maysource talent for both permanent and temporary positionsfrom the same talent pool, ensuring the hiring manager hasrapid access to the best candidates. At the center of everyclient program is a comprehensive talent analytics platform toprovide a thorough view of the client’s workforce, and everyprogram is customized to the client’s needs, culture andstructure.
Payroll ServicesOur Payroll Services take over the administrative burden ofour clients, so that they can focus on their core business needs.We provide a broad range of services, including personneladministration, payroll accounting, and contractmanagement; monitoring and addressing absenteeism; and a24/7 service portal that enables clients to register newemployees, make changes, or find specific managementinformation.
Outplacement and Career Transition ServicesWithin Outplacement, we advise and support organizations insituations in which employment contracts need to beterminated due to a strategic decision or for other reasons.We help employees to find suitable new employment, and tryto make the transition as smooth as possible. In this segment,we are market leader in the Netherlands and Belgium. Ouracquisition of RiseSmart in 2015 has significantly enhanced ourstanding, not only providing Randstad with a position in theNorth American market, but also enabling us to be theleading global innovator in this field. RiseSmart leverages aunique cloud-based technology platform with a proprietarymatching engine and provides comprehensive one-on-onesupport to help employers with their workforce transitionsand displaced employees with their career strategy.
OutsourcingIn Outsourcing, we manage several client activities withoutput responsibility in both production/logistics andadministrative environments, while we also have a largeoutsourcing business in IT.
ConsultancyThrough our Consultancy services, we support clients byproviding expert advice on organizational development andpersonal improvement, which includes employeedevelopment and coaching, optimization of HR processes andpolicies, and strategic workforce planning.
Our strategy: excellent execution
Our building block 'excellent execution' is based on bestpractices, which we have made the cornerstone of all ouractivities. We take best practices that have either beendeveloped centrally at Group level or in any one of ouroperating companies, and translate them into standardizedwork processes that we can use right across our business. Thismeans we can spend more time with clients and candidates,increasing client and candidate engagement, and enabling usto gain market share. By standardizing, we can rapidly 'copyand paste' our concepts across markets around the world,because the required processes and execution are fullydeveloped, and we can replicate them with only minoradjustments to take account of local business practices or thelocal labor market culture.
Activity-based field steering (ABFS)Our ABFS model is designed to optimize adaptability and todrive productivity and growth, which is essential in generatinga strong conversion of gross profit into EBITA. ABFS is aninput-driven (calls, visits, email, social media) field steeringmodel. It drives our daily operational activities, and enables usto better align our organization. One of our core strengths isbeing able to adjust to changing market circumstancesquickly, enabling us to provide clients with the services theyneed, when and where they need them. Building on thefoundation of our strong concepts, we use our ABFS model tomanage and direct performance across our businesses.
"I can schedule a career adviceappointment with my consultantonline"

34
annual report 2016 − Randstad Holding nv
Our ABFS model drives decisions to exploit profitable growthpotential or to reduce costs when needed. Both may apply inparallel, which is why we align those decisions with localoperational developments and local market trends at thelowest level in our organization. This means that we do notmanage on the basis of averages or predictions, but on actualreal-time, bottom-up figures. Furthermore, by embeddingoperational performance tools at every level of ourorganization, the ABFS model also helps operationalmanagers to take the right decisions, at the right time, andtranslate them into action. Managers receive up-to-date,accurate reports on a weekly basis, covering a range of keyperformance indicators. The consolidated data enables themto manage their units and teams in the field by adapting tochanging client and market demands as they occur. The ABFSmodel also helps us identify best practices, which can then berolled out globally as part of our strong concepts.
By ensuring the adaptability of the field organization, ourABFS model helps us to achieve an efficient front-staff coststructure. In addition, we closely monitor the productivity andefficiency of the whole organization, including overhead andhead-office costs. As we grow, our focus is on the conversionof additional gross profit into EBITA. Overall, we aim toachieve an incremental conversion ratio of towards 50%.
Best practices for field and back-office activitiesWe standardize both front-office and back-office processesand, where possible, marketing processes. This improves theconsistency and quality of our business and our execution. Forour head-office activities, our way of working is based on leanmanagement principles and continuous improvement,ensuring that we deliver services with the right quality at thelowest costs to our internal and external customers (clientsand candidates). In addition, we continuously benchmark ourlocal organizations and processes, in order to further drive theeffectiveness and efficiency of our head-office activities.
Digital strategyGiven the fast pace of technological developments, Randstadstrives for maximum agility to ensure that new technologiesare integrated quickly, both locally and globally. To accelerateour digital transformation as part of our Tech & Touchstrategy, Randstad has created a new organization called theDigital Factory. It identifies the best internal and externaldigital solutions and scales them around the world. Inaddition, to improve cost efficiency, to increase agility and toreduce time-to-market for new developments, we havecreated a Shared Service Center (SSC) for IT infrastructure, andwe aim to migrate our global physical infrastructure into thepublic cloud in 2017. This follows the successful roll-out ofGoogle for Work as our email and collaboration platform.
Randstad's application landscape is a balanced mix of globaland local elements, thus ensuring that we are able to adapt tothe vast variety of regulatory environments. In addition toenabling compliance with local regulations, these core systemsare selected and configured to support Randstad's business
concepts and other standards (e.g., our Blue2 web portalstandard).
Local IT directors have discretion to optimize and extend theseplatforms (e.g., by integrating components newly available onthe market). Randstad aims to have a repository of (mostlyexternal) components that operating companies can integratelocally with relatively little effort. Given this focus, localRandstad IT staff are selected for and trained in businessacumen and integration skills.
Randstad's Group-wide systems are geared, among otherthings, to consolidate financial and operational data andprovide relevant management information to ourinternational clients. Randstad aims to keep this internationallayer of systems relatively light and flexible, and non-intrusiveto local operating company developments.
We are continuously scanning the HR-technology market forpromising new components and ideas. The RandstadInnovation Fund (RIF) plays an important role in identifyingnew technologies and inspiring ideas. For example, RIF wasinstrumental in the acquisition of the innovativeoutplacement and career transition services business RiseSmartin 2015. The acquisition of digital recruiting pioneer MonsterWorldwide in 2016 also illustrates Randstad's commitment tobecoming a frontrunner in technology-driven HR solutions.
Randstad recognizes that the traditional way of doingbusiness through our branch network is evolving. While ourbranch network remains an important way of connectingwith both our clients and candidates, our visibility andpresence is enhanced through the use of other sales anddelivery channels. These include our online presence and theuse of mobile (location-based) devices. Digital initiatives thatare well under way include Job Scheduling in France andSearch & Match in the Netherlands. Job Scheduling focuses ona self-service system for clients and candidates, supported byautomated scheduling. The innovations will address ourInhouse Services customers and those with large resourcepools that need to be planned and serviced in a modern way.Search & Match focuses on creating better candidate profilesthrough a seamless experience for our talent, combined withintelligent online questionnaires, better search tools, andimproved matching algorithms. In addition, several operatingcompanies are working on promising local initiatives, such asthe sales services based on Big Data in France, theNetherlands, and the US.
All these digital initiatives demonstrate how our 'Tech &Touch' approach is transforming the way we work. Randstadis evolving from its traditional branch-based business into ahybrid model, where we deliver multiple tools to both clientsand candidates, which help in increasing efficiency andengagement.
value for our clients and candidates

35
annual report 2016 − Randstad Holding nv
Randstad Innovation Fund (RIF)As a strategic venture fund dedicated to HR technologies, RIFselects early- to expansion-stage companies that are leaders intheir fields. Our goal is to take minority participations, in therange of € 1−5 million, alongside reputable venture capitalfirms or professional investors.
Increased expertise and best practices provide unique value toall our stakeholders and complement our global brand andcustomer differentiation. RIF’s ambition remains to be at theforefront of HR technology with disruptive investments, aswell as to actively contribute to the more mature and globaldeployments of innovation within Randstad.
Out of a universe of 2,500 players and close to 500 prospects ayear, RIF made five new investments in 2016. Talentacquisition and engagement, as well as onboarding, werestrongly in focus.
In its three years of existence, Randstad Innovation Fund hassucceeded in establishing a recognized operating model andthought leadership. Through its growing expertise andinvestments, RIF continues to fuel the Group with innovationand digital transformation.
HR technology landscape
Succession
Retention
Training
Learning
Planning
Compensation & benefits
Performance
On-boarding
Selecting
Screening
Sourcing
Enables innovative offerings in multiple strategic fields
Talent Employer
PEOPLE
Managing & developing talent
Acquiring
Outplacement
Reference checksDeveloper community
Online chat events
Employee referral
Crowdsourcing platform Online freelance platform
People analytics
Recruitment platform
Job distribution
Matching
Gamified assessments
Develope ity
Automated chatbox

36
annual report 2016 − Randstad Holding nv
Our strategy: superior brands
Our superior brands are a guarantee to our clients that theywill receive the highest quality service and the best employeesworldwide. Superior brands give us better pricing options andthe type of awareness that accelerates selling and prospecting,as well as introducing new services. Superior brands also helpus attract, recruit, and retain the best people, while enhancingour visibility and credibility with regulators and legislators.
Randstad is our main brand in most of our markets. However,in cases where the market situation makes this beneficial, wemake use of other brands. This focused, centralized brandstrategy enables us to leverage brand recognition, generateefficiency benefits for our online strategy, and shareexperiences across the Group. It also generates momentumbehind our joint sponsorship initiatives, and we achievesignificant cost reductions by sharing campaign materials,photo databases, and know-how. This has led to consolidatingour brand awareness.
Our international reports on the world of work continue theirrapid rise in visibility and popularity. Randstad Sourcerightissues a well-received annual 'Talent Trends' report globally.The quarterly Randstad Workmonitor is now used in 33countries, and our independent Employer Brand Research thatrecognizes major employers in specific markets, has now beenextended to 25 countries (see the section 'Randstad EmployerBrand Research').
Brand imageThe level to which our clients and candidates are engagedwith our brand is systematically measured and benchmarkedin all major markets and in comparison with all majorcompetitors. TNS Nipo has conducted the Randstad BrandTracker survey since 2004. This international study covers allcountries in which Randstad is active. Its main purpose is tomonitor the positions of the Randstad brands, compared toour competitors and selected other benchmarks, by measuringawareness, consideration, preference, recommendation, andthe image of our brands. We also measure our brand imageusing an international methodology for rating brands indifferent product categories. We ask our target groups towhat extent they associate 48 attributes − such as innovation,integrity, social responsibility, and best brand − with Randstadand competing HR services companies.
Net Promoter Score (NPS)The Net Promoter Score represents the relationship betweentemporary employment agencies and their potential andactual candidates/clients. This indicator compares the numberof respondents who would recommend the company inquestion with the number who would not. Our goal is toalways have a Top 3 NPS score in our key countries, which weachieved in 2016. Several of our operating companies alsomonitor client and candidate satisfaction through bespokesurveys, ISO and other certification systems, as well as reviewmeetings. This enables them to not only measure NPS, but
also the drivers behind the scores. In this way, we cancontinuously improve satisfaction levels of both clients andcandidates.
ReputationIn addition, we use RepTrak, a standardized scorecard, toanalyze Randstad's reputation annually. This instrumentprovides us with detailed feedback on how our variousstakeholders perceive our company: how investors and clientsrate our performance, whether they are willing to support us,whether Randstad is a good place to work for employees andcandidates, and how Randstad is perceived in society in termsof governance, citizenship, and leadership. We have beenamong the Top 15 corporate brands in the Netherlands formany years. The Reputation Institute's Global Pulse studymeasures 600 companies globally. Companies are rated intheir home country only. Brand image, reputation, and clientand candidate satisfaction all contribute to gaining profitablemarket share, one of our key performance indicators.
Engaging with our clients andcandidates
Being a global leader in HR services, we see it as ourresponsibility to take an active role in developing our industry.Besides our international research and reports, such as theRandstad Workmonitor, the annual Randstad Employer BrandResearch, and the Talent Trends report, many researchprojects and events take place on a country level, supportingus and our clients in making sound business decisions.
"I connect real-time with mypaycheck"
value for our clients and candidates

37
annual report 2016 − Randstad Holding nv
Randstad WorkmonitorThe Randstad Workmonitor survey provides a comprehensiveunderstanding of job market sentiments and employeetrends. In addition to measuring mobility, it also measuresemployee satisfaction and personal motivation. The surveyincludes a rotating set of themed questions. It is conducted viaan online questionnaire among a population aged 18−65,working a minimum of 24 hours a week in a paid job (not self-employed). The minimum sample size is 400 respondents percountry. First introduced in the Netherlands in 2003, thesurvey now covers 33 countries around the world,encompassing Europe, Asia Pacific, and the Americas. TheRandstad Workmonitor is published four times a year, makingboth local and global trends in mobility visible over time on aregular basis. The results are published on our corporatewebsite. Topics surveyed in 2016 include the impact oftechnology and digitalization on people's jobs; an agingworkforce and the skills gap; gender equality in theworkplace; and economic outlook and the importance ofhaving a digital strategy.
Randstad Employer Brand ResearchThe impact of building a strong employer brand is immediate:stronger brands attract more and better candidates, and theybenefit from faster hiring times, stronger employeeengagement, increased retention rates, and lower recruitmentcosts. These gains turn into longer-term measurable businessimpact through stronger employee engagement andincreased productivity of the workforce.
The Randstad Employer Brand Research (previously known asthe Randstad Award) is the most representative and inclusiveemployer brand research in the world. It is a study capturingthe opinion of the general public between 18 and 65, in 25countries, dealing with the largest companies per countrybased on number of employees. It is a study providing uniqueinsights into the world of work. Our ambition is to become aleading voice in employer branding conversations, providingdedicated content to various target audiences, supported bythe largest knowledge hub in employer branding. In 2016, theresearch was conducted for the 16th time.
As part of the Randstad Employer Brand Research,respondents are asked which aspects they value in companieswhen choosing an employer. They are then asked whetherthey know the companies selected in their country andwhether they would like to work for those companies. Thesurvey includes a ranking of the most attractive industrysectors and a ranking of the most important aspects forcandidates when looking for a new job. Our research providesvital insights into how a company can build its talentattraction and engagement strategy, and drive businesssuccess.
The participating countries organize their local RandstadEmployer Brand events, engaging key players in the local HRindustry and celebrating the winner of the research as beingthe most attractive employer of that country.
Randstad Sourceright - Talent Trends Report 2016Randstad Sourceright's Talent Trends Report 2016 is acomprehensive guide to 30 of the most important trendsimpacting the world of talent, employees, and business. Thereport is based on a global survey of 400 global HR and talentacquisition leaders from more than 60 countries. By capturingthe outlook of their peers, the report enables HR and talentacquisition leaders to benchmark how their strategies andexecution stack up against fellow talent leaders. The reportprovides best practices for HR leaders to adapt to talentscarcity challenges, based on the explorations of globalworkforce trends, and with the opinions of industry thoughtleaders from across the talent management space.
Client Relationship ManagementStrong relationships with clients lead to increased customerloyalty. We are proud that the client retention rate of ourstrategic and core clients is more than 99%. Our ClientRelationship Management was assessed as best in class byRobecoSAM in the Dow Jones Sustainability Index.
Employability advancementOngoing skills development is essential for employability andsustainability in any workforce. Our training programs aretailored to meet the needs of clients and candidates inindividual employment markets. Such programs includecourses specific to IT, sales, contact centers, hospitality, andtechnical skills. Specialized programs leading to additionalprofessional qualifications are also part of training anddevelopment. More information about our local initiatives inemployability advancement can be found on our corporatewebsite. The development of funds invested in training anddevelopment of candidates in recent years is shown in thegraph 'Candidate training costs'.
Candidate training costsin millions of €
67.671.8
78.4
91.4
2013 2014 2015 20160
25
50
75
100
Randstad Williams Engineering Academy (RWEA)The RWEA is the first program of its kind to identify youngstudents from across the globe and guide them towards acareer as Formula One engineers. Eleven students from six

38
annual report 2016 − Randstad Holding nv
different countries joined the Academy in September 2015. Intwelve months, the students completed a series of e-learning-based tasks on various motorsport engineering-relatedthemes. They also worked on an essay-based project andreceived mentoring and tutoring from engineers at Williams.This is a competitive scheme, with the number of students ineach cohort gradually reducing from the time they join (aged16−18) until the completion of their university studies. Basedon various performance criteria, Williams and Randstaddecided to retain eight students, who have now started onYear 2 of the program.
In 2016, Randstad and Williams announced the nine studentsselected to join the Randstad Williams Engineering Academy's'Class of 2016' – the second intake of students to join thisinnovative scheme. These students were selected from a poolof candidates competing in the 2016 F1 in Schools WorldFinals competition held in Austin, Texas, from October 16−18,2016. F1 in Schools is a global not-for-profit STEM competitionthat sees students design, build, and race miniature racingcars.
Youth employmentYouth unemployment at large is projected to rise to 12.8%globally by 2018. But unemployment does not paint the totalpicture, as many who have left education do not even appearin labor market statistics. The risks posed by having an entiregeneration 'scarred' by negative long-term effects ofunemployment have prompted many governments to takefirm action. However, government programs cannot solve theentire issue alone, and well-coordinated efforts must comefrom all key stakeholders, including employers, trade unions,NGOs, and young people themselves.
Recognizing skills and striving for an inclusive labor marketare key in helping youth navigate their way to sustainedemployment. Improving youth labor numbers requires an in-depth understanding of employment and labor market issuesat local country level. Effective cooperation between theprivate employment industry and various public partners willbe the recipe for success in combating youth unemployment.
During CSR Europe's Enterprise 2020 Summit in 2015,Randstad announced the launch of the European Pact forYouth. This is a pledge from EU and business leaders on thejoint delivery of jobs, growth, and investment for the benefitof young people in Europe, including three objectives: toboost the number and quality of business-educationpartnerships, reduce the skills gap, and contribute to EU andnational policy developments on skills for employability.Randstad was one of the co-writers of this mutualengagement of business and EU leaders, drafting it jointlywith, among others, CSR Europe and the EuropeanCommission.
The first leaders’ meeting of the European Pact for Youth inBrussels, held in May 2016, focused on the transition to jobsthrough apprenticeships and traineeships. At this meeting,
our CEO spoke about how the future of work will bringradical change for talent, companies, and society − a changethat sees digitalization disrupt many traditional approaches,from education to employment. The group of leaders,representing a variety of companies, institutes, sectors, andregions, reflected on the progress made towards the target of10,000 new business-education partnerships, and 100,000 newgood quality apprenticeships, traineeships and entry-leveljobs. In addition, the group presented the first joint proposalon how to increase youth employability, enhancing transitionto jobs by making vocational education and training, as wellas apprenticeships, an attractive and fair choice for youngpeople across Europe. The meeting was hosted by MarianneThyssen, European Commissioner for Employment, SocialAffairs, Skills and Labour Mobility, and Viscount ÉtienneDavignon, Minister of State and President of CSR Europe.
Our operating companies offer an array of initiatives to assistyoung people in finding the right job. Randstad Italy created aspecific department dedicated to such activities, calledYouth@Work. The department aims to contribute to reducingthe gap between education (school and university) and thejob market. More information about this initiative and over 20other local initiatives on youth employment can be found onour corporate website.
Diversified workforcesWe value diversity. We do not discriminate on the grounds ofage, skin color, disability, gender, marital status, nationality,race, religion, or sexual orientation, and we have a non-discrimination policy to underline this. Many of our operating
"I can share a job opening onlinewith my consultant"
value for our clients and candidates

39
annual report 2016 − Randstad Holding nv
companies have long-standing diversity and reintegrationprograms, and some provide consultancy services to clients onequal opportunity and competency management. By forginglinks with local community stakeholders, including public,private, NGO, and institutional partnerships, we stimulatediversity in the workplace. Our Randstad Institute in Franceand our foundations in Germany and Spain provide access toemployment for disadvantaged groups, such as immigrantworkers, women at risk, victims of domestic violence, singleparents, older workers, and the long-term unemployed.Addressing the challenges that the growing number of olderworkers face in entering, re-entering, or staying active in theworkforce is also part of our approach to furtheringemployment market sustainability.
In line with our aim to promote diversity in our workforce, wealso welcome candidates with a disability. We have found thatregistration of disabled candidates varies in the differentcountries in which we operate. This may be related to locallegislation, but also to the personal wishes of the peopleconcerned. In addition, we are running a variety of localprograms to advance employment participation of minoritygroups. More information about our local initiatives regardingdiversified workforces can be found on our corporate website.
A healthy and safe work environmentCaring for people is embedded in our core values and forms amandatory part of our induction programs. It is in this contextthat our consultants work with clients and candidates tosupport workplace safety. Several of our operating companieshave specialized health and safety managers to provideguidance. We advise our clients on matters of occupationalhealth and safety; for example, by pointing out how toprevent workplace risks and by providing 'security at work'training. Formal audits at client locations are conducted insome business areas, such as construction, where taking extrahealth and safety precautions is best practice. Moreinformation about our local initiatives for a healthy and safework environment can be found on our corporate website.
Health and safety is also an ongoing topic at the EuropeanPlatform meetings, a Randstad network of national workscouncil representatives, in which candidates are alsorepresented.
In 2016, we developed a global Health & Safety Policy. Thispolicy states that Randstad is committed to providing andmaintaining a healthy and safe work environment, andpromotes well-being at work, doing all that is reasonablypractical to prevent personal injury and illness and to protectour candidates, employees, clients, and visitors fromforeseeable work hazards.
All employees across the labor market have a right to ahealthy and safe work environment. Our health and safetymanagement is organized locally at operating company level,designed to safeguard business continuity and deal with risks.Our operating companies adhere to all applicable local
standards and regulations, and are expected to have asophisticated health and safety structure in place. We tracksickness rates, work-related accidents or incidents resulting inlost-time injury, as well as work-related fatalities, both foremployees and candidates. Fatal incidents are immediatelyreported to the Executive Board.
In the past year, we provided work to more than two millionpeople. Our first duty as a company is to make sure we do notsend anyone into a work environment that may be harmful tothem. Unfortunately, despite our best efforts, accidentsoccurred that resulted in injuries. The aggregated number ofwork-related injuries among our candidates globallyamounted to 24,972 (2015: 23,288), while the number ofworking days lost due to these injuries added up to 338,797(2015: 308,820). Based on these data, our 'injury rate' is 0.2%.
Much to our regret, in 2016, we were also confronted withten fatal incidents among candidates:
Number of fatal incidents among candidates
2016 1 2015
At work
USA 1 0
Netherlands 1 0
Germany 0 3
Belgium & Luxembourg 0 2
France 2 3
Italy 0 1
India 0 4
In traffic (while working)
France 1 0
Belgium & Luxembourg 0 1
Japan 2 0
India 3 1
10 151 Excluding natural causes.
As of this year, we no longer report on fatal incidents due tonatural causes at the workplace. Regretfully, we cannotinfluence such incidents by promoting better procedures anda safe work environment at our clients. The numbers of 2015still include six cases that were due to natural causes. The fatalaccidents in traffic relate to car accidents. Following certainincidents, we were able to work with our clients to furtherimprove safety conditions and instructions.
We treat prevention, training, and safety awareness ingeneral as very important subjects. We realize that while azero score may prove impossible to achieve at the scale weoperate; this is nevertheless the only acceptable target.

40
annual report 2016 − Randstad Holding nv
Our strategy: best people
The true value of our business lies in our people. We takepride in working with the best talent in the industry. Randstadattracts agile and adaptable people, capable of effectivelydealing with and responding to rapidly changingcircumstances. We challenge them to perform to the best oftheir ability and seize the opportunities a multinationalcompany can offer. We challenge ourselves to provide ouremployees with an open and inclusive climate, which engagesthem and fosters individual development. The following keyperformance indicators show our 2016 progress on ourstrategic building block 'Best People':- Employee retention was greater than 75%, with more
employees staying within their operating company andfewer transferred within the Group;
- Overall outperformance of Randstad (engagement score)increased from 66% to 67%, showing a steadyimprovement across almost all countries;
- Proportion of women in senior leadership stabilized at45.2%, which is close to our target of 50%.
Making strong concepts work
Attracting, developing and retaining the best people isfacilitated by a strong partnership of Randstad’s leadershipand human resources. As we set high standards andambitions, it is essential our HR function focuses on enablingbusiness performance. To this end, we follow clear and simpleHR Standards, designed to guide our HR professionals throughrobust HR processes. In 2016, we made industry leadingchanges in our performance management philosophy and laidthe groundwork for innovation, digitalization, and theenablement of technology as key business drivers.
Randstad leadership
Randstad's leaders have always focused on supportingprogress, ready to fuel our clients' and talents' ambitions, tocreate opportunities, and to help them achieve success. Intoday's ever-changing world of work, our leaders willcontinue to take this approach. Randstad leaders are knownfor their ambitious strategy, combined with excellentexecution and agility, as well as their ability to 'think globaland act local'. By embracing innovation and technologicaladvances, Randstad leaders make intelligent choices, whilenot losing sight of the human side of our business. This meansthey can effectively connect with stakeholders, partner withcandidates and clients, and lead both their own team and ourglobal organization to success. This is what makes Randstadunique.
Attracting the best people
We understand how important it is for people to have achallenging job, as well as the opportunity to developthemselves. It is our passion and pride to ensure our peopleenjoy the best work environment, excellent training, excitingopportunities, and all the support they need to develop theirfull potential. We attract the best people, and we invest intheir development. 'Great people, Great opportunities' −that's our promise.
Great people, Great opportunities
Gre
at
peo
ple
, b
eca
use
we:
Work together
Are customer-focused
Can be trusted
Are proactive
Are driven and motivated
Are high achievers
Care about details
Are industry experts
Gre
at
op
po
rtu
nit
ies,
beca
use
we o
ffer:
Diverse career paths
Global mobility
International trainee Programs
World league Programs
A valuable brand
A highly dynamic environment
80% internal promotions
VSO volunteering assignments
With the release of Great People Survey results, national andlocal leaders conduct thorough research into their respectivefindings and subsequently build action plans to maintain areasof strength and address areas for improvement. Randstad'sfocus on the overall employee experience revealed by theGreat People Survey results drives the engagement,commitment, and retention of our employees worldwide.
In 2016, the criteria valued most by Randstad employeesworldwide related to a pleasant working atmosphere,interesting job content, and a long-term job perspective. Thecriteria that could be improved relate to managementassessment and a clear direction for the company's future.
value for our employees

41
annual report 2016 − Randstad Holding nv
Developing great people
We believe the ability to adapt to ever-changing businessenvironments is critical in careers today. Continuous learning isa crucial part of this. At Randstad, we encourage developmentby taking a multi-faceted 'blended' approach to learning andby continuously improving our offerings. In collaboration withour partners, we are innovating in both content and style,while utilizing our company’s digital delivery capabilities. Atthe same time, we strongly believe learning is most powerfulon the job and through mentors, in both formal and informalsettings.
Our Learning & Development strategy defines the knowledge,skills and competencies required by our workforce, and howthese can be developed. To ensure a sustainable, successfulorganization, people development at Randstad istransformational, proactive and future-focused. We make useof 'blended learning' (70-20-10 model), which at Randstadcomprises the following:- On-the-job learning to develop employees within their
roles (70%);- Coaching to support employees in achieving their personal
and professional goals (20%);- Training programs to develop the knowledge, skills, and
competencies employees need for continued careerdevelopment within Randstad (10%).
Culture and behaviorEnsuring our employees across the globe understand ourcompany’s strategic goals, business principles and operatingguidelines is an important component of our short and long-term business model. Stated simply, global alignment unitesour workforce. Randstad invests in learning & developmentprograms at both the local and holding level where standards,core values, and employee expectations are described,modeled, and applied in real-time learning environments. Foremployees wishing to work abroad, our InterculturalManagement Program teaches you how to increase youreffectiveness in an international setting. In addition,participants gain insight into their own and other cultures andhow this affects behaviors, reactions, expectations andassumptions.
On-the-job learningAll employees starting in a new role follow a formal inductionprogram in the first few months, which helps them to becomesuccessful in their new role as quickly as possible. The programcovers our ambitions, strategy, values, culture, history, andcorporate policies, as well as targeted and relevant job-relatedinformation. Randstad tracks the effectiveness of theinduction programs by measuring time to productivity andother success metrics. Immediately after the inductionprogram, an individual development plan is created to furtherenhance the employee's skills and competencies.
Coaching and mentoringAt Randstad, we work with the best and learn from the best.Through developmental relationships, Randstad employeesare coached or mentored by a senior leader. These initiativesare generally organized locally, but are also offered as anintegrated part of certain learning & development programs.
Senior leaders are also offered coaching by professionalexternal coaches to enable them to achieve specific personalor professional goals. As part of the Frits GoldschmedingAcademy, the Sales Leadership Program and the SeniorExecutive Program include professional coaching facilitated bycertified trainers and/or coaches.
Finally, in many global businesses, Randstad employees receive360-degree feedback from their colleagues, their manager,direct reports and other stakeholders. This thorough process,which monitors the organizational climate, leadership styles,and competencies, is aligned with Randstad’s leadership visionand model.
Training programsIn our training programs, we offer combinations of action-based learning, classroom-based skills training, e-learning,virtual classrooms, and gamification. Our programs are alwayscompetency-based and focus on soft skills, sales, leadershipskills, and job-related skills. They are offered at all levels withinthe organization. For field positions, we have dedicatedtraining programs focusing on operational skills and specificknowledge required for the job.
The graphs 'Employee training costs' and 'Employee traininghours' show our commitment and investment in terms of bothcosts and time spent on developing our employees.
Spotlight on mentoringIn 2016, 36 professionals representing 11 countries acrossRandstad participated in a 10-week mentoringcertification program. They will now incorporatementoring as an effective individual developmentapproach for employees who have already completedour new hire onboarding process and for high-potentialleadership development. This is done through virtualmentoring and peer networks.

42
annual report 2016 − Randstad Holding nv
Employee training costsin millions of €
15.7 16.2
18.6
22.3
2013 2014 2015 20160
5
10
15
20
25
Employee training hours
Total training hours 2016: 839,794 Total training hours 2015: 753,662
55%33%
12%
48%
40%
12%
Induction
Other training
Management & leadership programs
Randstad offers programs on a local, regional, and globallevel. On a local level, the programs are developed by theoperating companies, sometimes in cooperation with businessschools. Regionally and globally, the Frits GoldschmedingAcademy offers state-of-the-art leadership programs, alignedto our strategic objectives. Key themes for Randstad areleadership, digitalization, and innovation.
The programs are created in cooperation with leading globalbusiness schools and partners, such as INSEAD, TIAS, IMD,SMU, and Stand & Deliver Group. Our senior leadership isclosely involved in the development and delivery of theprograms. In 2016, the Frits Goldschmeding Academy trained340 senior leaders in 11 different development programs.
Talent managementRandstad recognizes the importance of talent management asone of the key factors underpinning company growth andensuring the continuity of our business. We develop andpromote talent − both future leaders and highly skilledexperts − for our current needs, while also anticipating futureneeds and preparing the next generation for new roles.
Through our talent management process, we use strategichuman resource planning to improve Randstad's businessvalue and make sure we reach our goals.
Talent management enables us to:- Attract high-caliber people;- Identify and develop our talents;- Continuously anticipate needs for future positions on a
local and global level.
The annual Talent Review process forms the foundation ofRandstad's leadership and talent management approachthroughout the company. This process addresses theperformance and potential of all employees on an individuallevel. Randstad's senior leadership (up to and including theExecutive Board) takes a keen interest in Randstad's humanresources and continuously reviews the company's strategicworkforce planning, focusing on the strengths anddevelopment needs of our senior leadership, succession plans,pipeline development, and future leadership talents.
Senior Executive ProgramIn 2016, we revamped the Senior Executive Program (SEP),a global development program for senior leaders thatfocuses on executive leadership development and theimplementation of Randstad's Tech & Touch strategy. Wealso integrated our new learning philosophy, whichfocuses on experimental learning, shifting rootperspectives, and behavioral change driven by businesscontext (outside-in transformation).
We believe learning is most powerful when we encouragegrowth by pushing our leaders out of their comfort zone. Thismay involve a new geographical location, a new department,and/or a new business line. Such moves will deepen
E-learning platform catering to allIt’s a key part of their Learning & Development offering,the e-learning platform of Randstad UK. Over the pasttwo years, 85 courses have been produced covering arange of topics, business specialisms and corecompliance requirements, accessible to all individuals.Based on the success of the platform, the tool has alsobeen opened partially to candidates and expanded toRandstad in Southeast Asia.
Having a centralized global learning platform should bethe goal of every organization, and we’re nearly there.One platform delivering world-class learning to ourglobal leaders ensures alignment, common messaging,and singular focus.
value for our employees

43
annual report 2016 − Randstad Holding nv
understanding of our clients' needs, providing unique insightsand strengthening our world view.
As a company with a global footprint, we require our localleaders to operate effectively and comfortably in a globalenvironment. The nature of our company provides ampleopportunities for employees to further develop theirleadership skills, to acquire and build a global mindset andawareness, and to effectively manage and leverage culturaldifferences.
Randstad's World League Programs are designed to developour functional communities (Finance, Legal, HR, Marketing &Communications, and IT) in the areas of people andorganization, and the way these functional communities actas business partners to line management. The programsprovide a shared vision, mission, and language for keybehaviors, skills, and knowledge within each function,supported by specific tools and development actions. WorldLeague Programs enable the global functional communities todeal with performance and development needs in an alignedand constructive way.
Achievements so far include development-related initiatives,such as High Performing Business Partner 2.0, which offerstraining for key talents in all functional areas. In the field ofmarketing, we offer the Professionals Services LeadershipInitiative. In addition, targeted functional training programsand leadership programs for Finance (IFMP) and HR (HRDP)have been conducted.
The success of the World League Programs is reflected in solidtalent pipelines and global appointments in key talentfunctions.
Performance management and rewardTo motivate employees to perform to the best of their ability,it is essential for Randstad to align our performancemanagement system with our Tech & Touch growth strategy.The traditional system of annual reviews with its focus on pastperformance and ranking is no longer adequate to cultivatetalent and increase productivity. Randstad has thereforedecided to replace the annual reviews with frequentperformance discussions. This is for a number of purposes:1. To continuously align goals with ever-changing business
priorities;2. To allow for future focus development;3. To enable culture change.
Key to our new performance management system is GreatConversations, an overarching principle ensuring everycommunication is Meaningful, Aspirational and Progress-based.
Having a total reward strategy linked to our business goals iscrucial to attract and retain our employees. We aim to provideour employees with meaningful rewards that influence their
affiliation with our company, while encouragingoutperformance.
For our senior leadership, a long-term incentive plan is in placeby means of a performance share plan. The purpose of theplan is to retain our best people and to drive and rewardsustained performance of our company by sharing in success.To encourage our corporate employees' affiliation withRandstad and to enable them to participate in Randstad'ssuccess, an employee share purchase plan is in place, withcurrently over 10,000 active participants.
Performance management cycle
Performancemanagement
cycle
Plan
Rew
ard
Review
Pe
rfo
rm
Perf
orm
an
ce r
evi
ew
Set performance objectives and formulate
Individual Development Plan (IDP)
Rate performance objectives
and competencies Dis
cuss
an
d e
valu
ate
perf
orm
an
ce o
bje
ctiv
es
an
d c
om
pete
nci
es

44
annual report 2016 − Randstad Holding nv
Randstad outperformance
At Randstad we believe our ability to engage our people,empower our leaders, and enhance our strong culture. Allencourage innovation and accountability, eventually leadingto business outperformance. Once a year, we monitor ourprogress through our Great People Survey. This measuresemployee views on key factors that make our company an'outperformance organization'.
Our people empowerment and engagement
Our leadership Our organizational capabilities
Randstad outperformance
1 2 3
Randstad outperformance
In 2016, the participation rate of the Survey was 82% (2015:81.7%). Compared to 2015, our results on Empowerment &Engagement, Leadership, and Organizational Capabilitiesincreased. This resulted in a higher score on outperformance.Of all Randstad employees, 67% agree or strongly agree withthe statement that Randstad is an outperformingorganization, resulting in a score that is close to the ServiceProvider Benchmark (Source: TNS).
Randstad outperformance by geographyas % of total number of respondents
Outperformance score Benchmark
2016 2015 2016 2015
North America 1 76% 75% 70% 73%
Netherlands 65% 68% 70% 69%
France 61% 56% 58% 63%
Germany 66% 64% 63% 68%
Belgium & Luxembourg 2 64% 57% 61% 69%
Iberia 3 73% 70% 66% 66%
United Kingdom 72% 70% 66% 65%
Other European countries 62% 64% n.a. n.a.
Rest of the world 61% 62% n.a. n.a.
Corporate 76% 71% n.a. n.a.
67% 66% 68% 67%1 Benchmark only available for the USA.2 Benchmark only available for Belgium.3 Benchmark only available for Spain.
Source: Great People Survey
Attracting new employees with the capability to succeed atRandstad is a core element of our business success. Randstadactively manages and evaluates the capabilities needed forsuccess and ensures these elements are incorporated intoonboarding, learning and development, and leadershipmetrics. As a result, our global employee retention rate goal is20-30% with variation driven primarily by local marketconditions.
Employee retention ratein % of total number of employees
2016 2015
Employees staying with their operating company
75.7
%
75.5
%
Employees transferred within the Group 0.4% 1.7%
76.1%
77.2%
Internal promotion
'Great people, Great opportunities' is also reflected in ourambition to offer talented employees internal growthopportunities. When business allows, vacant leadershippositions are first offered to our own employees. In ourmature Staffing & Professionals markets, we strive to fill 80%of our leadership roles internally. Compared to 2015, we saw aslight improvement in our internal appointments from 67.3%to 67.5%. The number of internal leadership appointments(647) also increased compared to 2015 (441).
Internal leadership appointments by geography
Total number of
appointments
% Internal
appointments
2016 2015 2016 2015
North America 226 68 62.8% 67.6%
Netherlands 21 106 95.0% 69.8%
France 23 19 73.9% 73.7%
Germany 7 7 57.1% 85.7%
Belgium & Luxembourg - - - -
Iberia 7 15 71.4% 60.0%
United Kingdom 117 29 53.8% 72.4%
Other European countries 103 40 72.8% 62.5%
Rest of the world 136 119 63.2% 63.9%
Corporate 7 38 57.1% 68.4%
647 441 67.5% 67.3%
value for our employees
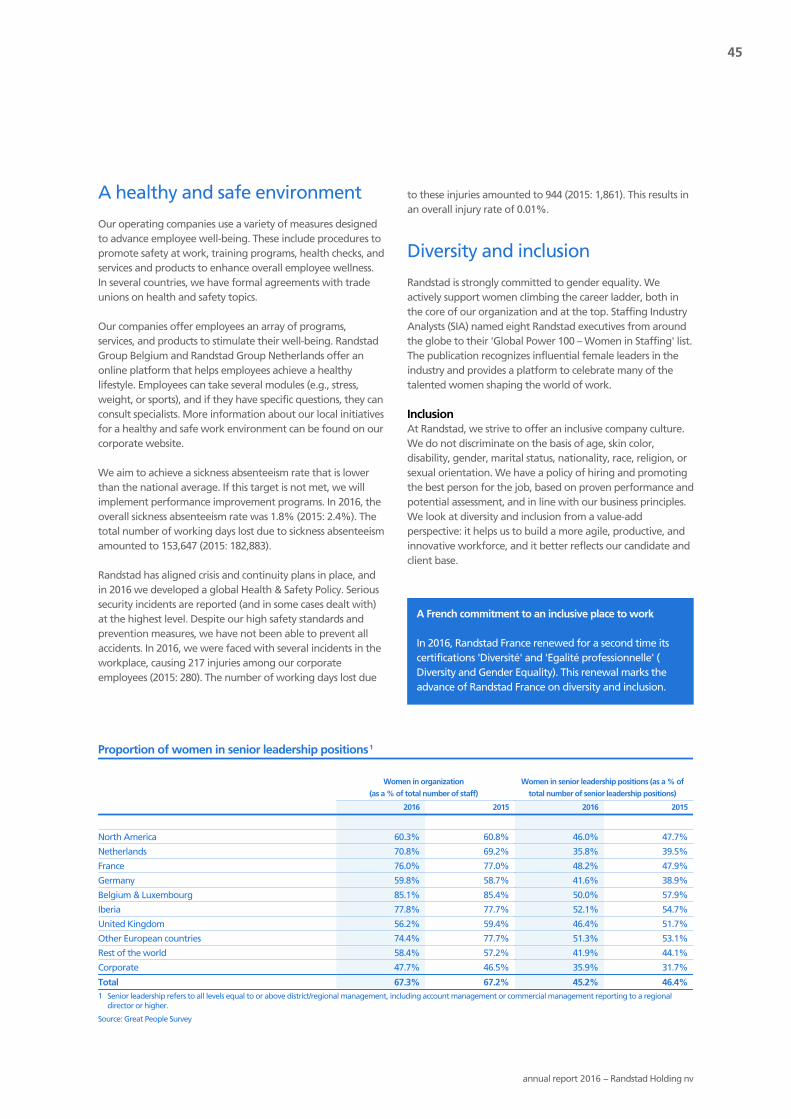
45
annual report 2016 − Randstad Holding nv
A healthy and safe environment
Our operating companies use a variety of measures designedto advance employee well-being. These include procedures topromote safety at work, training programs, health checks, andservices and products to enhance overall employee wellness.In several countries, we have formal agreements with tradeunions on health and safety topics.
Our companies offer employees an array of programs,services, and products to stimulate their well-being. RandstadGroup Belgium and Randstad Group Netherlands offer anonline platform that helps employees achieve a healthylifestyle. Employees can take several modules (e.g., stress,weight, or sports), and if they have specific questions, they canconsult specialists. More information about our local initiativesfor a healthy and safe work environment can be found on ourcorporate website.
We aim to achieve a sickness absenteeism rate that is lowerthan the national average. If this target is not met, we willimplement performance improvement programs. In 2016, theoverall sickness absenteeism rate was 1.8% (2015: 2.4%). Thetotal number of working days lost due to sickness absenteeismamounted to 153,647 (2015: 182,883).
Randstad has aligned crisis and continuity plans in place, andin 2016 we developed a global Health & Safety Policy. Serioussecurity incidents are reported (and in some cases dealt with)at the highest level. Despite our high safety standards andprevention measures, we have not been able to prevent allaccidents. In 2016, we were faced with several incidents in theworkplace, causing 217 injuries among our corporateemployees (2015: 280). The number of working days lost due
to these injuries amounted to 944 (2015: 1,861). This results inan overall injury rate of 0.01%.
Diversity and inclusion
Randstad is strongly committed to gender equality. Weactively support women climbing the career ladder, both inthe core of our organization and at the top. Staffing IndustryAnalysts (SIA) named eight Randstad executives from aroundthe globe to their 'Global Power 100 – Women in Staffing' list.The publication recognizes influential female leaders in theindustry and provides a platform to celebrate many of thetalented women shaping the world of work.
InclusionAt Randstad, we strive to offer an inclusive company culture.We do not discriminate on the basis of age, skin color,disability, gender, marital status, nationality, race, religion, orsexual orientation. We have a policy of hiring and promotingthe best person for the job, based on proven performance andpotential assessment, and in line with our business principles.We look at diversity and inclusion from a value-addperspective: it helps us to build a more agile, productive, andinnovative workforce, and it better reflects our candidate andclient base.
A French commitment to an inclusive place to work
In 2016, Randstad France renewed for a second time itscertifications 'Diversité' and 'Egalité professionnelle' (Diversity and Gender Equality). This renewal marks theadvance of Randstad France on diversity and inclusion.
Proportion of women in senior leadership positions1
Women in organization
(as a % of total number of staff)
Women in senior leadership positions (as a % of
total number of senior leadership positions)
2016 2015 2016 2015
North America 60.3% 60.8% 46.0% 47.7%
Netherlands 70.8% 69.2% 35.8% 39.5%
France 76.0% 77.0% 48.2% 47.9%
Germany 59.8% 58.7% 41.6% 38.9%
Belgium & Luxembourg 85.1% 85.4% 50.0% 57.9%
Iberia 77.8% 77.7% 52.1% 54.7%
United Kingdom 56.2% 59.4% 46.4% 51.7%
Other European countries 74.4% 77.7% 51.3% 53.1%
Rest of the world 58.4% 57.2% 41.9% 44.1%
Corporate 47.7% 46.5% 35.9% 31.7%
Total 67.3% 67.2% 45.2% 46.4%1 Senior leadership refers to all levels equal to or above district/regional management, including account management or commercial management reporting to a regional
director or higher.
Source: Great People Survey

46
annual report 2016 − Randstad Holding nv
Locally, many initiatives have been launched that go beyondgender equality to support diversity and inclusion in thebroadest sense. For example, Randstad is partner ofWorkplace Pride, a non-profit foundation promoting greateracceptance of lesbian, gay, bisexual and transgendered (LGBT)people in the workplace. In 2016, for the second year running,Randstad was rated among the Top 5 most-improvedcompanies in terms of LGBT inclusion. Randstad Netherlandspartnered with Amsterdam Gay Pride to sponsor the 2016EuroPride event in Amsterdam, and Randstad Italy was themain corporate sponsor of the 2016 Milan Pride. More localinitiatives can be found on our corporate website.
Social acceptanceOur commitment to diversity is reflected in the active stanceRandstad takes when promoting diversity throughpublications. In 2016, the Randstad Workmonitor, a quarterlyexternal survey conducted in 33 countries, showed thatemployees prefer working in gender-diverse teams. Theredoes not seem to be much difference in the general treatmentof men and women in organizations or when they apply for ajob or ask for a promotion. Of the respondents, 81% agreethat both sexes are treated equally in general, and 70% thinkthat men and women are equally supported. Even so, a stronggender bias still exists in the workplace, as 70% indicate thatmen are favored over women when two candidates equallyqualify for the same job at their workplace.
Composition of our workforce by gender
2016 2015
30%
1%
55%
14%
31%
1%
54%
14%
Male full-time Female full-time
Male part-time Female part-time
Source: Great People Survey
Composition of our workforce by age group
2016 2015
6%
21%
21%18%
24%
10% 6%
20%
22%18%
25%
9%
18 - 24 30 - 34 40 - 49
25 - 29 35 - 39 50+
Source: Great People Survey
Composition of our workforce by type of contract
2016 2015
90%
10%
89%
11%
Permanent/open-term contract Fixed-term contract
Source: Great People Survey
value for our employees

47
annual report 2016 − Randstad Holding nv
Our role in society
Our core values inspire us to conduct our activities, both insideand outside the corporate environment, in a sustainablemanner, and to use our knowledge and experience to make apositive contribution to the world around us. At the sametime, we believe our industry has a unique opportunity tohelp create a truly sustainable future, both socially andeconomically, by literally shaping the world of work.
For example, we can make a meaningful difference by usingour knowledge and services to influence diversity, socialcohesion, and inclusion in the world's employment markets.Research shows that countries with more developed HRservices markets typically have lower overall unemploymentand fewer people in long-term unemployment. These marketsare more inclusive and suffer less from unfair workingconditions, exploitation, and irregular work.
We are well-positioned to help address the growingchallenges the employment markets are facing around theworld. These challenges include structural shortages of skillsand talent, declining population growth, cultural changes inthe way new generations view work, as well as thedemographic challenges posed by aging populations in manyWestern economies.
In 2016, for the first time, we made an inventory of all sociallabor market projects our various operating companies arerunning at a local level. The results of this process reveal 88social programs that enable society as a whole to benefit fromour activities. An overview of these local sustainabilityinitiatives is given on our website.
Of course, we also address sustainability issues common to allbusinesses, such as our environmental impact and how weaffect the world around us. These issues are addressed by oursustainability framework, and we measure our progress in thisarea. This is an integral part of how we safeguard our businessand its long-term viability, while taking into account theinterests of all our stakeholders.
Stakeholder dialogue
To inform stakeholders, Randstad regularly publishes researchresults and reports. One of our key surveys is the RandstadWorkmonitor. Published four times a year, the RandstadWorkmonitor reports make both local and global trends inmobility visible over time. The results are published on ourcorporate website.
To enhance labor market knowledge, Randstad hasdeveloped leading programs. In recent years, together with anumber of academic partners, we carried out studies into theimplications of future demographic shifts for globalemployment markets. Results were published in the 'Gap'series, among other publications. Since 2013, Randstad has
published Flexibility@work, a yearly report on flexible laborand employment. The 2016 edition, launched at the OECDForum in May 2016, included a study on the future of work inthe digital age by M. Goos and J. Konings of the University ofLeuven. In the first quarter of 2017, together with IZA Instituteof Labor Economics in Bonn, Randstad will publish a study ofthe consequences for the labor market of global mobility andlabor migration.
Besides our global research and publications, Randstad alsocollects industry insights and conducts research through itsoperating companies around the world. This work yields avaluable source of information for local stakeholders. Relevantpublications issued include the World of Work research (AsiaPacific), the Workpocket (Netherlands, Belgium and others),various salary surveys tailored to specific target groups (e.g.,the Professionals segment), white papers, and online polls.More information about local initiatives regardingstakeholder dialogue can be found on our corporate website.
OECD ForumRandstad was Gold sponsor of the OECD Forum 2016, whichhas become a global showcase for thoughtful and revealingdiscussions on economic trends, especially on the topic ofhuman capital. This year, the main emphasis was on the needfor policies that strengthen productivity, which will helppromote inclusive and sustainable growth. Since the crisis,productivity growth has slowed and inequality has worsened.Addressing inequality is essential to ensuring more productiveeconomies, while allaying conventional fears that increasingproductivity means working longer, harder and later in life.
"I manage my days off through theemployee App"
value for societyvalue for society

48
annual report 2016 − Randstad Holding nv
HR Transformation ForumSince 2014, Randstad has hosted the HR TransformationForum, bringing together a network of nearly 200 HRdirectors from global blue-chip companies across Europe. Thisforum provides them with a platform to candidly discuss theissues they face in their companies' transformations, spurcross-industry fertilization of ideas, and exchange views on theglobal themes of the future.
In 2016, together with MVRO Management (TransformationForums in the Netherlands), we moved from discussing whatdefines an agile organization to showing what the behaviorof an agile organization looks like. As keynote speaker,Jacques van den Broek, Randstad's CEO, gave the attendingCHROs a deep and transparent look into what Tech & Touchwill mean for Randstad going forward.
Workforce360Randstad shares its insights, opinions, and research on theworld of work through the Workforce360 platform. Thisplatform has been implemented on randstad.com throughoutEurope, the United States, India and the Asia-Pacific region. Itgives our stakeholders the latest industry information, as wellas expert opinions from both a global and local perspective.As more Randstad countries are adding it to their websites,the platform will continue to grow.
Employment market KPIsIn accordance with our sustainability framework, we alsoreport on our contribution to employment markets. In thisrespect, two relevant KPIs are staffing penetration rates andour contribution to the regulation of labor markets. Theformer shows the development of the number of temporaryworkers as a percentage of the total labor market, while thelatter provides insight into the status of regulation in the maincountries in which Randstad operates, as well as the expectedtrends.
A third relevant KPI is our involvement in national andinternational employment institutions. The overview 'HighestRandstad positions in industry associations' shows Randstad'sparticipation in staffing industry institutions in countrieswhere we are active and where such associations exist.
Apart from our involvement within these institutions, we arealso heavily engaged in key forums and other initiativesthrough which we focus on social dialogue. How we do this isdescribed under 'Industry involvement'. A list of all ourmemberships and partnerships can be found under'Supplementary information'.
Our performance with respect to social involvement and ourpartnership with VSO can be found under 'Partnerships andsocial involvement'.
Shareholder returnWe maintain an active dialogue with existing and potentialshareholders, witnessed by the 40 roadshows, ourparticipation in 11 broker conferences, and two Inhouse &Tech innovation demo days in both France and theNetherlands in 2016. By executing our strategy and achievingour longer-term targets (see 'Strategic priorities and targets'),we believe shareholders will be rewarded with increased totalshareholder returns, including improved dividends. Pleaserefer to the investor relations section on our website for moreinformation on this topic.
We participated in 11 broker conferences and held twoInhouse & Tech innovation demo days in both France and theNetherlands.
Industry involvement
We strongly believe that social dialogue and activeparticipation in industry bodies will help produce clear, fair,and workable regulations in the markets in which we operate.By investing in strong industry federations – on a national,regional, and global level – we believe we can contribute tothe future development of the HR services industry.
In order to acknowledge the broadening range of services ourindustry offers, in September 2016, Ciett (InternationalConfederation of Private Employment Agencies) wasrebranded as World Employment Confederation. In May 2014,our Group Public Affairs director was elected President of theWorld Employment Confederation for a three-year term. Shehas already chaired the European arm of the WorldEmployment Confederation since 2005.
Employee participation in social dialogueEmployee participation in social dialogue is actively promotedthrough a network of national works councils and dialoguewith trade union representatives. Managers and employeesacross the Randstad Group discuss work- and HR-related issuesaccording to national law and practices. The results of thesedialogues are also fed into Randstad's European WorksCouncil, which meets on a regular basis to discuss the strategyand results of the company, HR issues, and informationrelevant to our employees and operating companies. UNI-Europa, the representative trade union federation for servicesin Europe, is invited to attend the European Works Councilmeetings as an observer.
Active dialogue with labor unionsRandstad also actively engages in national and internationaldialogue with labor unions. At EU level, UNI-Europa and theWorld Employment Confederation Europe meet regularly inthe sectoral social dialogue committee on temporary agencywork to discuss issues of mutual importance, and to furtherprofessionalize and gain more societal acceptance for theindustry. Randstad is represented in the World EmploymentConfederation Europe delegation. Moderated by the
value for society

49
annual report 2016 − Randstad Holding nv
European Commission's Directorate-General for Employment,Social Affairs and Equal Opportunities, the committee metthree times in 2016. The 2016/2017 work program includedissues such as promoting national social dialogue throughpresentations on open-ended contracts for agency workers inFrance. It also included a presentation from the EuropeanCommission on the Posting of Workers Directive, the EUAgenda for the Collaborative Economy (EU DG Grow), andthe New Skills Agenda for Europe (EU DG Employment). In2016/2017, the World Employment Confederation and UNI-Europa will carry out a joint project on 'labor marketintermediaries, online talent platforms and the changingworld of work', in order to compare them with thecharacteristics and regulation of temporary agency work.
Partnerships and socialinvolvement
Social involvementSince 2009, we have been measuring staff perception ofsustainability in the organization to gain a betterunderstanding of how our own people feel about Randstad'ssocial performance. More specifically, we asked them if theyfeel it is important for their company to be socially involved,and whether they perceive Randstad as being so. The resultsare shown in the graph 'Employee perception of socialinvolvement'.
Employee perception of social involvementas % of total number of respondents
81% 81%
68% 67%
Importance of social involvement Perceived as socially involved
2016 20150%
25%
50%
75%
100%
Source: Great People Survey
Voluntary Service Overseas (VSO)As part of our commitment to sharing expertise for a bettersociety, we have a global partnership with VSO to providesupport to communities in countries that need it most. VSO isthe world's leading development NGO that fights povertythrough volunteers. For almost six decades, VSO has workedrelentlessly to help poor and marginalized people build abrighter future. Their experience is that lasting change is
delivered through bringing people together – to shareknowledge and skills, build capabilities, promote mutualunderstanding, and collaborate. VSO volunteers share theirskills and expertise in areas such as finance, education,healthcare, HR, and business management. As a result, localcommunities will still benefit long after volunteer placementshave finished. Volunteers, in turn, have the opportunity tolearn from their peers in developing countries. Theknowledge they gain helps them develop both personally andprofessionally, and they can share their learnings and build onthem when they return home. In 2015/16, VSO's volunteersand partners reached more than 2.1 million people.
In 2016, Randstad and VSO renewed their 12-year partnershipfor a further three years. The aim is to continue to harness thecombined strengths of the two organizations to positivelyimpact the lives of some of the poorest people in the world. Inline with strategic choices made in 2015, we shifted ourresources to targeted countries and programs.
Driven by our (and VSO's) strategic focus on employability, weare now directly supporting two VSO projects that aim toimprove employment and entrepreneurship opportunities forthe most vulnerable, especially youth and women.
First, the recently created Randstad Youth EmploymentProject (RYEP) in Tanzania is hosting groups of 2−3 Randstadvolunteers in a relay model. In this way, the existing VSOyouth employability projects are better aligned, creating moresynergy. We will share employability knowledge andexpertise, as well as deliver training, workshops and events.Randstad volunteers are also placed on existing VSO youthemployability projects where there is an identified need for adedicated resource (e.g., an industry links adviser, coach/mentor, or organizational development specialist). In 2016, asmany as 14 Randstad volunteers worked for three to sixmonths on different projects in Tanzania under the RYEPumbrella.
Second, through the newly created Aaghaz project in India,we are looking to pair up Randstad International andRandstad India volunteers (also in a relay model) to supportwith skilling and placing 3,150 vulnerable women from urbanslums in five Indian states into formal employment over aperiod of three years. Specifically, Randstad volunteers willstrengthen the capacity of local NGO staff volunteers tocollaborate with companies for placement of trainees, as wellas training the candidates in soft skills and preparing them forinterviews to increase their chances of formal employment.
It is our ambition that by focusing some of Randstad’sresources on these specific projects, we will be better able toincrease − and measure − our impact over time.
Driven by Randstad's continued commitment tostrengthening VSO's core recruitment function, Randstad hasenabled capacity building of VSO staff and local partners, notonly through employee volunteering, but also through

50
annual report 2016 − Randstad Holding nv
technical support and pro bono services. Randstad hasprovided four recruitment specialists to develop and/or buildthe capacity of the VSO in-country recruitment function inCambodia, Ghana, Malawi, and Uganda. VSO's newlyestablished Sourcing Team traveled to Budapest for one weekto learn about contemporary sourcing first-hand from expertsat Randstad Sourceright.
Volunteers often stay in touch with the organization theyworked for overseas, and they sometimes even continue tosupport them from home. However, not every employee whowould like to contribute to the partnership is in a position topack their bags and go overseas for several months. Analternative way to support VSO is by fundraising, alone or inteams. One example of such a team effort is the VSOHimalaya Challenge 2016. Randstad employees (as part of abigger group) raised a considerable amount of money − withthe help of colleagues, clients and other sponsors − to supporta project for improving education and school attendance forgirls in Nepal.
Attitude of employees towards VSOas % of total number of respondents
67% 67%
38% 37%
Awareness of partnership Willingness to contribute
2016 20150%
20%
40%
60%
80%
Source: Great People Survey
Other volunteer projectsIn addition to these primary VSO projects, Randstadparticipated in many other volunteer projects in 2016,including socially involved and philanthropic initiatives. Thetotal amount spent on corporate philanthropy (excludingVSO) in 2016 was € 1,359,080. We implemented a globalpolicy for corporate citizenship and philanthropy, which wasapproved by the Executive Board in 2016. The purpose of thispolicy is to define common shared rules within Randstad foridentifying corporate citizenship and philanthropy initiativesthat, in line with our mission, core values, business principles,and internal policies, are aimed at meeting the needs ofcommunities or societies in which Randstad operates.
Other volunteer projects on behalf of Randstad
2016 2015
Volunteer hours 5,900 7,800 1
Volunteers 980 1,0001 Adjusted.
For example, Randstad Germany has a project called'Ehrensache', which allows Randstad employees to receivefunding for voluntary work they undertake in their free time.The purpose is to support projects for the common good, topromote voluntary work, and to stimulate employees tobroaden their personal outlook and build networks.
Randstad Argentina supports a program against child labor,called 'Jardines de Cosecha' (Harvest Kindergarten). Theprogram runs during harvesting seasons, and provides ruralworkers with a safe place to leave their children during thework day. More information about these initiatives and otherexamples of local volunteer initiatives can be found on ourcorporate website.
Randstad VSO volunteers overseas 2012−2016
2016 2015 2014 2013 2012
Volunteer hours 11,000 10,200 10,300 10,500 12,000
Volunteers 22 19 16 15 21
value for society
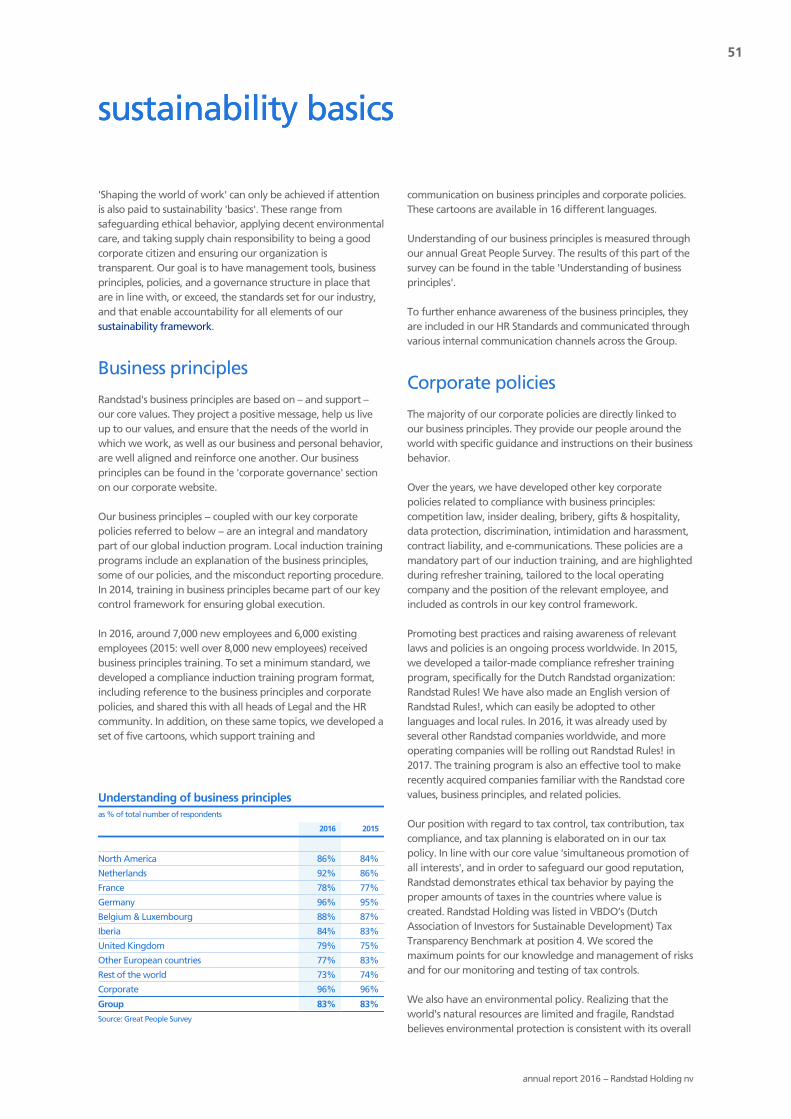
51
annual report 2016 − Randstad Holding nv
'Shaping the world of work' can only be achieved if attentionis also paid to sustainability 'basics'. These range fromsafeguarding ethical behavior, applying decent environmentalcare, and taking supply chain responsibility to being a goodcorporate citizen and ensuring our organization istransparent. Our goal is to have management tools, businessprinciples, policies, and a governance structure in place thatare in line with, or exceed, the standards set for our industry,and that enable accountability for all elements of oursustainability framework.
Business principles
Randstad's business principles are based on – and support –our core values. They project a positive message, help us liveup to our values, and ensure that the needs of the world inwhich we work, as well as our business and personal behavior,are well aligned and reinforce one another. Our businessprinciples can be found in the 'corporate governance' sectionon our corporate website.
Our business principles − coupled with our key corporatepolicies referred to below − are an integral and mandatorypart of our global induction program. Local induction trainingprograms include an explanation of the business principles,some of our policies, and the misconduct reporting procedure.In 2014, training in business principles became part of our keycontrol framework for ensuring global execution.
In 2016, around 7,000 new employees and 6,000 existingemployees (2015: well over 8,000 new employees) receivedbusiness principles training. To set a minimum standard, wedeveloped a compliance induction training program format,including reference to the business principles and corporatepolicies, and shared this with all heads of Legal and the HRcommunity. In addition, on these same topics, we developed aset of five cartoons, which support training and
communication on business principles and corporate policies.These cartoons are available in 16 different languages.
Understanding of our business principles is measured throughour annual Great People Survey. The results of this part of thesurvey can be found in the table 'Understanding of businessprinciples'.
To further enhance awareness of the business principles, theyare included in our HR Standards and communicated throughvarious internal communication channels across the Group.
Corporate policies
The majority of our corporate policies are directly linked toour business principles. They provide our people around theworld with specific guidance and instructions on their businessbehavior.
Over the years, we have developed other key corporatepolicies related to compliance with business principles:competition law, insider dealing, bribery, gifts & hospitality,data protection, discrimination, intimidation and harassment,contract liability, and e-communications. These policies are amandatory part of our induction training, and are highlightedduring refresher training, tailored to the local operatingcompany and the position of the relevant employee, andincluded as controls in our key control framework.
Promoting best practices and raising awareness of relevantlaws and policies is an ongoing process worldwide. In 2015,we developed a tailor-made compliance refresher trainingprogram, specifically for the Dutch Randstad organization:Randstad Rules! We have also made an English version ofRandstad Rules!, which can easily be adopted to otherlanguages and local rules. In 2016, it was already used byseveral other Randstad companies worldwide, and moreoperating companies will be rolling out Randstad Rules! in2017. The training program is also an effective tool to makerecently acquired companies familiar with the Randstad corevalues, business principles, and related policies.
Our position with regard to tax control, tax contribution, taxcompliance, and tax planning is elaborated on in our taxpolicy. In line with our core value 'simultaneous promotion ofall interests', and in order to safeguard our good reputation,Randstad demonstrates ethical tax behavior by paying theproper amounts of taxes in the countries where value iscreated. Randstad Holding was listed in VBDO’s (DutchAssociation of Investors for Sustainable Development) TaxTransparency Benchmark at position 4. We scored themaximum points for our knowledge and management of risksand for our monitoring and testing of tax controls.
We also have an environmental policy. Realizing that theworld's natural resources are limited and fragile, Randstadbelieves environmental protection is consistent with its overall
Understanding of business principlesas % of total number of respondents
2016 2015
North America 86% 84%
Netherlands 92% 86%
France 78% 77%
Germany 96% 95%
Belgium & Luxembourg 88% 87%
Iberia 84% 83%
United Kingdom 79% 75%
Other European countries 77% 83%
Rest of the world 73% 74%
Corporate 96% 96%
Group 83% 83%
Source: Great People Survey
sustainability basicssustainability basics

52
annual report 2016 − Randstad Holding nv
goals and core values, and should therefore be an importantconsideration in its activities. This commitment toenvironmental protection is reflected in our sustainabilityframework. It is validated through a materiality analysis, and isincluded in all our programs and practices that encourage theconduct of operations in a manner that is bothenvironmentally and economically responsible.
In 2016, we developed a global Health & Safety Policy, as wellas a global Corporate Citizenship & Philanthropy Policy.
Our corporate HR Standards are not only based on our corevalues and business principles, but also on our sustainabilityambitions. These standards are designed to guide our HRcommunity and to safeguard the recruitment, development,and retention of our employees − our most important asset.They are essential in helping us achieve our strategic goals,which is why our policies and sustainability framework areboth included in our HR Standards, and form a mandatorypart of our induction training.
Randstad's corporate policies are published on our intranetsites, and summaries of the policies are published on ourcorporate website. Through our in-control framework (whichincludes the key control framework), our operating companiescertify, semi-annually, their compliance with many of thepolicies, or explain any deviations.
Human rights
We are signatories to, and participants in, the United NationsGlobal Compact, and we support its Ten Principles regardinghuman rights, labor rights, the protection of the environment,and anti-corruption. We have posted more details about ourprogress on the website of the UN Global Compact(www.unglobalcompact.org).
The principles regarding labor are those outlined in the ILODeclaration on Fundamental Principles and Rights at Work.These are freedom of association and the right to collectivebargaining, elimination of forced or compulsory labor, theabolition of child labor, and the elimination of discriminationin respect of employment and occupation. While alwayscomplying with national laws and practices, we are alsocommitted to making the Global Compact's principles part ofRandstad's strategy, culture, and day-to-day operations. Wetherefore regard the Ten Principles as forming part of ourbusiness principles. Our CEO explicitly expressed Randstad'ssupport to the UN's Secretary-General. This statement ispublished on our corporate website.
Randstad Holding's CEO and CFO signed the United Nations'Call to Action to Governments to promote anti-corruptionmeasures and to implement policies to establish systems ofgood governance. Signing this Call to Action underlines ourcommitment to work against corruption in all its forms,including extortion and bribery. We believe that corruption is
one of the greatest obstacles to economic and socialdevelopment around the world.
In 2016, we conducted a self-assessment to check if ourbusiness activities are in line with the OECD Guidelines. Theoutcome of this self-assessment was positive. As a result,Randstad has adopted the OECD Guidelines as a benchmarkfor its international activities.
Over the past years, Randstad has participated in the businessand human rights initiative of the Global Compact NetworkNetherlands. As part of this, we have embedded the TenPrinciples into our corporate policies and developed a tool forhuman rights risk mapping. To that end, we published ourHuman Rights Impact Assessment. We also reviewed ourglobal key control framework and expanded it to cover anumber of relevant risks and controls related to business andhuman rights, notably bribery, workers' rights, health andsafety, and discrimination. Other ways in which we monitorpotential human rights risks include continuous training ofour employees and management locally, and promotingorganizational sensitivity to human rights issues in general.Our commitment and initiatives in the fields of Labor PracticeIndicators and Human Rights were recognized by RobecoSAMand were assessed as best in class in the Dow JonesSustainability Index.
Randstad Argentina's CEO signed the United Nations WomenEmpowerment Principles (WEPs) and supported the 'Unite'Campaign to end violence against women, led by Ban KiMoon. In addition, together with Trama Asociation, he helped
"Through 'My Randstad', I canapprove hours worked on the spot"
sustainability basics
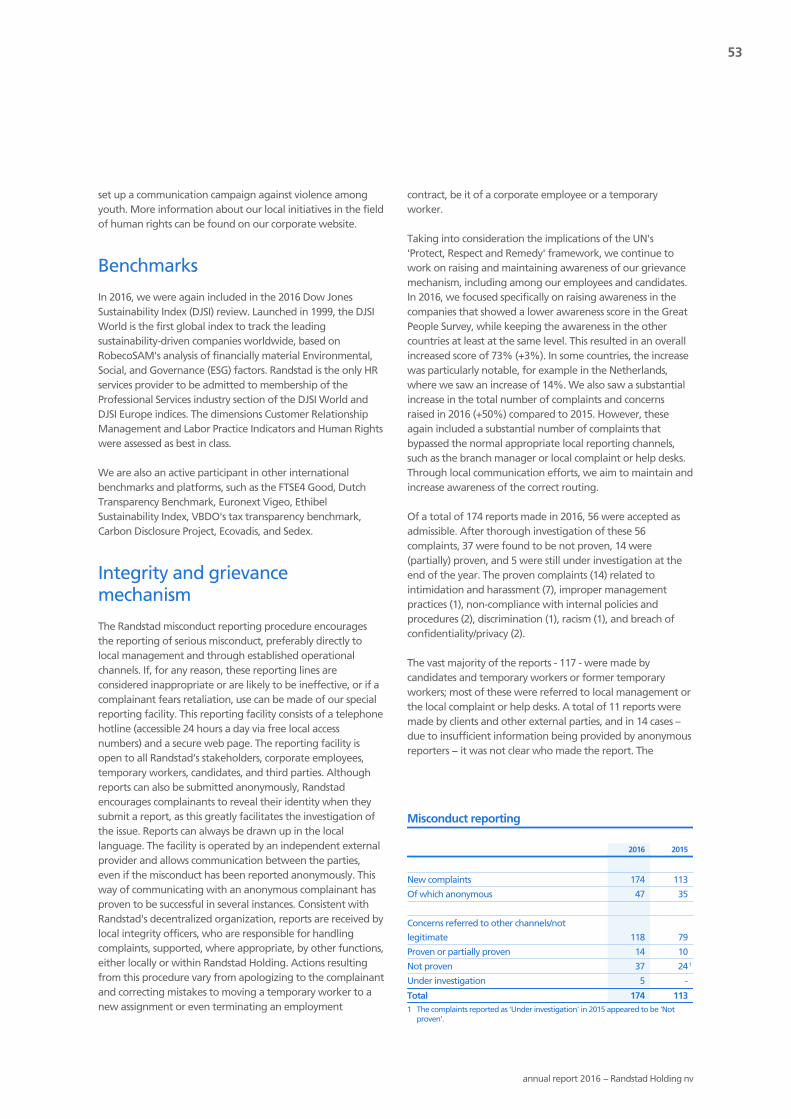
53
annual report 2016 − Randstad Holding nv
set up a communication campaign against violence amongyouth. More information about our local initiatives in the fieldof human rights can be found on our corporate website.
Benchmarks
In 2016, we were again included in the 2016 Dow JonesSustainability Index (DJSI) review. Launched in 1999, the DJSIWorld is the first global index to track the leadingsustainability-driven companies worldwide, based onRobecoSAM's analysis of financially material Environmental,Social, and Governance (ESG) factors. Randstad is the only HRservices provider to be admitted to membership of theProfessional Services industry section of the DJSI World andDJSI Europe indices. The dimensions Customer RelationshipManagement and Labor Practice Indicators and Human Rightswere assessed as best in class.
We are also an active participant in other internationalbenchmarks and platforms, such as the FTSE4 Good, DutchTransparency Benchmark, Euronext Vigeo, EthibelSustainability Index, VBDO's tax transparency benchmark,Carbon Disclosure Project, Ecovadis, and Sedex.
Integrity and grievancemechanism
The Randstad misconduct reporting procedure encouragesthe reporting of serious misconduct, preferably directly tolocal management and through established operationalchannels. If, for any reason, these reporting lines areconsidered inappropriate or are likely to be ineffective, or if acomplainant fears retaliation, use can be made of our specialreporting facility. This reporting facility consists of a telephonehotline (accessible 24 hours a day via free local accessnumbers) and a secure web page. The reporting facility isopen to all Randstad’s stakeholders, corporate employees,temporary workers, candidates, and third parties. Althoughreports can also be submitted anonymously, Randstadencourages complainants to reveal their identity when theysubmit a report, as this greatly facilitates the investigation ofthe issue. Reports can always be drawn up in the locallanguage. The facility is operated by an independent externalprovider and allows communication between the parties,even if the misconduct has been reported anonymously. Thisway of communicating with an anonymous complainant hasproven to be successful in several instances. Consistent withRandstad's decentralized organization, reports are received bylocal integrity officers, who are responsible for handlingcomplaints, supported, where appropriate, by other functions,either locally or within Randstad Holding. Actions resultingfrom this procedure vary from apologizing to the complainantand correcting mistakes to moving a temporary worker to anew assignment or even terminating an employment
contract, be it of a corporate employee or a temporaryworker.
Taking into consideration the implications of the UN's'Protect, Respect and Remedy' framework, we continue towork on raising and maintaining awareness of our grievancemechanism, including among our employees and candidates.In 2016, we focused specifically on raising awareness in thecompanies that showed a lower awareness score in the GreatPeople Survey, while keeping the awareness in the othercountries at least at the same level. This resulted in an overallincreased score of 73% (+3%). In some countries, the increasewas particularly notable, for example in the Netherlands,where we saw an increase of 14%. We also saw a substantialincrease in the total number of complaints and concernsraised in 2016 (+50%) compared to 2015. However, theseagain included a substantial number of complaints thatbypassed the normal appropriate local reporting channels,such as the branch manager or local complaint or help desks.Through local communication efforts, we aim to maintain andincrease awareness of the correct routing.
Of a total of 174 reports made in 2016, 56 were accepted asadmissible. After thorough investigation of these 56complaints, 37 were found to be not proven, 14 were(partially) proven, and 5 were still under investigation at theend of the year. The proven complaints (14) related tointimidation and harassment (7), improper managementpractices (1), non-compliance with internal policies andprocedures (2), discrimination (1), racism (1), and breach ofconfidentiality/privacy (2).
The vast majority of the reports - 117 - were made bycandidates and temporary workers or former temporaryworkers; most of these were referred to local management orthe local complaint or help desks. A total of 11 reports weremade by clients and other external parties, and in 14 cases –due to insufficient information being provided by anonymousreporters − it was not clear who made the report. The
Misconduct reporting
2016 2015
New complaints 174 113
Of which anonymous 47 35
Concerns referred to other channels/not
legitimate 118 79
Proven or partially proven 14 10
Not proven 37 24 1
Under investigation 5 -
Total 174 1131 The complaints reported as 'Under investigation' in 2015 appeared to be 'Not
proven'.

54
annual report 2016 − Randstad Holding nv
remaining 32 reports came from corporate employees orformer corporate employees.
All valid reports were followed up internally, usually by localteams with the support of the local integrity officer and/or therisk manager. If the report related to local management, itwas followed up by the central integrity officer and the GroupBusiness Risk & Audit staff. All proven reports were followedup by corrective action, which varied depending on the facts.Corrective action included additional training, coaching and/ormonitoring for the staff involved; this was especially relevantin cases of non-compliance with internal policies andprocedures and improper management practices. One reportrelated to activities at a client towards a temporary worker;this was followed up with the client and resulted in offeringthe temporary worker another assignment and the clienthandled the case internally. In the cases of intimidation andharassment and racism, the corrective action varied from awritten warning and further coaching (4) to demotion (1) anddismissal (2) of the accused.
Understanding of our misconduct reporting procedure ismeasured through our annual Great People Survey. Theresults of this part of the survey can be found in the table'Awareness of misconduct reporting procedure'.
Awareness of misconduct reporting procedureas % of total number of respondents
2016 2015
North America 76% 72%
Netherlands 70% 56%
France 85% 85%
Germany 87% 83%
Belgium & Luxembourg 58% 63%
Iberia 70% 66%
United Kingdom 69% 67%
Other European countries 65% 73%
Rest of the world 70% 67%
Corporate 85% 87%
Group 73% 70%
Source: Great People Survey
Supply chain responsibility
Our suppliers make an important contribution to the qualityof our services. We therefore ask them to embrace ourstandards and to comply with our Supplier Code. This code isan integral part of our international terms and conditions. Itaims to ensure that the procurement of goods, works, andservices takes place in a socially responsible manner and inconformity with our business principles. In this code, weexplicitly request that our suppliers respect our regulatory,social, and ecological principles, and adopt practices consistentwith those principles. Suppliers must ensure that their ownsuppliers and subcontractors also respect the principles set out
in the code. We consult with suppliers periodically in order toverify compliance with the code. If deemed necessary,Randstad may have an audit conducted at the supplier'spremises. The Supplier Code is published on our corporatewebsite. At the end of 2016, around 40% of our procurementexpenditure worldwide was covered by the Supplier Code.
A good example of supply chain management is theprocedure followed by Randstad Argentina. This works asfollows: the first mandatory step for suppliers in formalizingthe relationship is to register on Randstad's website andexplicitly subscribe to the Supplier Code. Once they are in thesystem, they are automatically notified when changes aremade to the Supplier Code or to other conditions. RandstadItaly launched a new web portal for the qualifications of itssuppliers. This consists of a very detailed questionnaire withgeneral information about the supplier company, itsorganizational structure, its approach to quality and socialresponsibility, and relevant certifications.
On a global scale, around 8.7% of our cost base consists ofsupplier spending. The graph 'Composition of the supplychain' shows the proportions of the various supplier categoriesacross the globe.
Other costs
Supplier costs
Cost of services Advertising and marketing
Accommodation
Personnel expenses
IT costs General costs
as % of total (supplier) costs (x 1,000)
1 Actual reported operating expenses and cost of services excluding
amortization, impairment and acquisition-related intangible assets.
Composition of the supply chain
9%
91%
10%
10%
11%
49%
8%
Total costs: € 19,7921 Supplier costs: € 1,729
13%
Our impact on the environment
The fact that our business is a people business is also reflectedin our cost base. The vast majority of our costs consist of thesalaries we pay to our own corporate staff and our candidatesworking for our clients. Because of the nature of our business,our impact on the environment is much less than that of someother sectors, such as manufacturing. Almost all of ourbusiness is conducted in local markets, and we have manylocations close to both clients and candidates, greatly reducingtravel and the resulting CO2 emissions. Despite this inherently
sustainability basics

55
annual report 2016 − Randstad Holding nv
minimal impact, we do what we can to limit our ecologicalfootprint by conserving energy, using sustainable energysources, and reducing water and paper usage, while re-usingor recycling wherever possible. We set the target to use atleast 50% electricity from sustainable sources in 2018, and toreduce our CO2 emissions by 8% in 2018.
In mid-2015, we established a global environmental policy.This commitment to environmental protection is reflected inour sustainability framework, validated through a materialityanalysis, as well as in our programs and practices forconducting operations in an environmentally, as well aseconomically, responsible manner. The policy can be found onour corporate website.
In 2016, we participated in the Global Climate report of theCarbon Disclosure Project (CDP) and we scored a B(management level), which is above industry average.Companies are taking further steps at management level toeffectively reduce emissions, indicating more advancedenvironmental stewardship.
CO2 footprintAs a part of our framework, we continue to improve thecompleteness and accuracy of our Group environmental data,using a step-by-step approach. In 2012, we concentrated onmeasuring our impact due to travel, in particular journeysmade using company cars. In 2013, we added to this thedistances traveled by air. In 2015, we performed an internal
review on the environmental data reported in 2013 and 2014.The main operating companies (constituting 90% of the total)were asked to check their data and make adjustments wherenecessary. This gave us better insight into the challengesrelated to collecting and reporting environmental data, whichled to improvements and more extensive coverage. In 2016, aconsulting company completed an audit in order to gain evenmore insight into the possible improvements regarding datacollection and reporting, and the feasibility of externalassurance.
We adjusted our CO2 footprint according to the GreenhouseGas Protocol. We therefore no longer report the emissions ofwater, paper and waste (formerly scope 3). The airplane CO2
emissions shifted from scope 2 to scope 3. We still facechallenges with regard to collecting actual figures on waterand general waste. We use mostly estimates to calculate thenumbers, because only a few operating companies are able toreceive this information from their suppliers. Most of ourbranches are located in collective tenant buildings, wherethere is collective water usage and the collection of waste iscentralized, which means we cannot collect our own data. For89% of our operating companies, the estimated water usagein 2016 was 245,000 m3 (2015: 260,000 m3) and our waste1,400 metric tons (2015: 1,200 metric tons).
Our CO2 footprint1
2016 2015
Usage CO2 emission Usage CO2 emission 2
Scope 1 (direct emissions)
Gas for heating (m3) 3,311,360 6,239 3,405,584 6,416
Fuel for heating (L) 41,000 131 54,000 172
District heating (GJ) 13,369 267 12,940 259
Business cars petrol (L) 4,926,000 13,793 4,470,000 12,516
Business cars diesel (L) 10,887,000 34,838 10,868,000 34,832
Business cars gas (L) 3 - - 42,000 80
CO2 metric tons scope 1 55,268 54,275
Scope 2 (indirect emissions)
Electricity (GJ) 188,786 19,488 183,953 22,132
Sustainable electricity (GJ) 73,497 - 66,034 -
CO2 metric tons scope 2 19,488 22,132
Scope 3 (remaining emissions)
Airplane (km) 43,111,049 8,622 53,055,054 10,611
CO2 metric tons scope 3 8,622 10,611
Total CO2 metric tons 83,378 87,0181 Based on 89% of our operating companies.2 The 2015 emissions have been adjusted according to the new agreements of the Greenhouse Gas Protocol.3 As of 2016, all our operating companies stopped using business cars on gas.

56
annual report 2016 − Randstad Holding nv
Energy resourcesTo limit the use of fossil fuels, we constantly seek to increasethe use of alternative, efficient, and natural energy resources(e.g., by replacing traditional lighting by LED lighting in ourbuildings). We are in the process of migrating our computingcapacity to the cloud on a global level. As we are sharingcapacity and optimizing our usage of servers by only makingthem available when we need them, we expect our energyconsumption to decrease further. The Randstad corporatehead office is the only major building we actually own; almostall other buildings worldwide are rented. Our head office uses100% certified green electricity and the Randstad Belgiumhead office is certified for BREEAM (Building ResearchEstablishment Environmental Assessment Method).
Increasing our people's awareness of simple ways to reducethe use of energy in our offices is the least we can do. At thesame time, its impact is difficult to measure, given the factthat our offices are often leased all-in, and we share buildingswith other tenants. We continue to try convincing ourlandlords to provide us with specifications of energy use,separate from lease costs, or to install smart meters. OurEuropean operating companies have taken the necessarysteps to comply with the European Commission's EnergyEfficiency Directive and will increasingly have better insightinto their energy consumption and possible improvements.
Travel and company carsWe are limiting our business travel impact on theenvironment by increasing the use of video and phoneconferencing and VoIP. This has led to a decrease in thenumber of business flights in 2016. Increasingly, we aredigitalizing time sheets and staffing contracts, includingsignatures, which reduces paper use and traveling by bothcandidates and our own consultants. Several operatingcompanies have switched to hybrid or fuel-efficient cars, orcars with capped CO2 emissions. In addition, various operatingcompanies run bike schemes, commuting projects, gas-savingcontests, and other initiatives to reduce conventional energyusage. If traveling cannot be avoided, we prefer train travelover plane or car travel, which in several countries issupported by strict policies. In the Netherlands, we participatein a CO2 compensation program for business flight emissionswith our national airline.
More information about our local initiatives on theenvironment can be found on our corporate website.
Company cars
Average number of
cars
Kilometers driven (x
1,000)
2016 2015 2016 2015
North America - - - -
Netherlands 3,382 3,237 98,376 107,932
France 1,747 1,646 34,284 33,925
Germany 1,732 1,634 50,820 50,248
Belgium & Luxembourg 1,657 1,612 41,812 37,300
Iberia 748 595 17,634 19,503
United Kingdom 227 227 3,727 3,314
Other European countries 718 543 15,467 11,539
Rest of the world 572 572 10,628 9,766
Corporate 125 125 3,302 3,257
Group 10,908 10,191 276,050 276,784
Business flightsTotal distance traveled (x 1,000 km)
2016 2015
North America 22,681 32,248
Netherlands 364 314
France 3,482 3,188
Germany 2,370 2,570
Belgium & Luxembourg 134 31
Iberia 5,110 3,683
United Kingdom 1,693 1,081
Other European countries 1,934 1,911
Rest of the world 15,190 19,864
Corporate 9,945 8,560
Group 62,903 73,450
sustainability basics
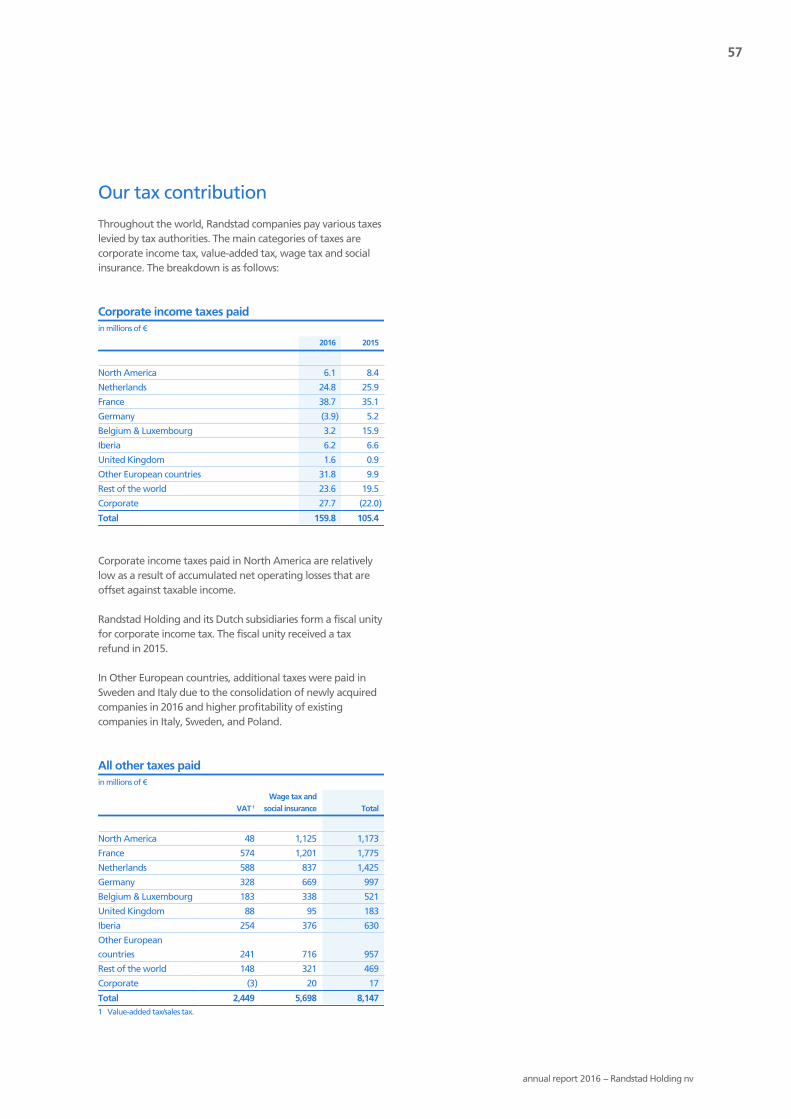
57
annual report 2016 − Randstad Holding nv
Our tax contribution
Throughout the world, Randstad companies pay various taxeslevied by tax authorities. The main categories of taxes arecorporate income tax, value-added tax, wage tax and socialinsurance. The breakdown is as follows:
Corporate income taxes paidin millions of €
2016 2015
North America 6.1 8.4
Netherlands 24.8 25.9
France 38.7 35.1
Germany (3.9) 5.2
Belgium & Luxembourg 3.2 15.9
Iberia 6.2 6.6
United Kingdom 1.6 0.9
Other European countries 31.8 9.9
Rest of the world 23.6 19.5
Corporate 27.7 (22.0)
Total 159.8 105.4
Corporate income taxes paid in North America are relativelylow as a result of accumulated net operating losses that areoffset against taxable income.
Randstad Holding and its Dutch subsidiaries form a fiscal unityfor corporate income tax. The fiscal unity received a taxrefund in 2015.
In Other European countries, additional taxes were paid inSweden and Italy due to the consolidation of newly acquiredcompanies in 2016 and higher profitability of existingcompanies in Italy, Sweden, and Poland.
All other taxes paidin millions of €
VAT 1
Wage tax and
social insurance Total
North America 48 1,125 1,173
France 574 1,201 1,775
Netherlands 588 837 1,425
Germany 328 669 997
Belgium & Luxembourg 183 338 521
United Kingdom 88 95 183
Iberia 254 376 630
Other European
countries 241 716 957
Rest of the world 148 321 469
Corporate (3) 20 17
Total 2,449 5,698 8,1471 Value-added tax/sales tax.

58
performance
59 Introduction
62 Financial performance
69 Country performance
74 Performance by revenue category
76 Investor relations & share performance
80 Risk & opportunity management

59
annual report 2016 − Randstad Holding nv
How we measure performance
Randstad has an extensive performance management systemin place. Performance management at Randstad starts at thelowest level in our organization in the context of what we call'activity-based field steering' (ABFS). Our ABFS model requiresour units and teams to translate commercial goals (activeclients, people at work) into actual activities on a daily basis.As our planning and control cycle is operationally driven, thedata acquired through ABFS drives action right up to theExecutive Board level. As a result, Executive Board membersare closely involved with the operating companies under theirresponsibility.
Performance managementThe performance of each operating company is measured atvarious stages during the year:- Weekly overview of activities (ABFS tracker), temporary
employees working (volumes), and permanentplacements;
- Monthly income statement, balance sheet, cash flow,selected non-financial data, and a forecast with analysis;
- Quarterly income statement, balance sheet, cash flow,non-financial data, and a forecast with extensive analysisand benchmarking.
Each month, the Executive Board discusses performance withthe management team of each operating company. Theagenda includes financial and operational performance,forecasts, risk management, and the progress made inachieving strategic goals. Internal and external benchmarksare used to challenge performance and to identify points forimprovement. In addition to the monthly control cycle, ayearly strategic planning cycle takes place in the spring, andan operational planning cycle takes place in the fall. Theplanning and control cycle is embedded in our Risk & Controlframework.
Key performance indicatorsOur day-to-day performance overview includes keyperformance indicators (KPIs) showing our growth,productivity, profitability, working capital, and cash flow. Weuse a variety of tools within our planning and control cycle toassess our performance and align future strategic andinvestment decisions to best utilize commercial andorganizational opportunities. KPIs are used to measure andmonitor performance against budgets, forecasts, the previousyear, and our strategic targets. These indicators are describedbelow.
Weekly indicatorsWeekly volumes of employees working are an importantindicator within our field steering model and measure thesuccess of the units and teams. In addition, we track weeklyinformation on permanent placements.
Market shareGaining profitable market share is an important strategictarget. Where possible, we aim to measure market shares atthe lowest possible level (units and teams).
ProfitabilityProfitability indicates the quality of our top line andoperational efficiency. Our overall financial goal is to achievean EBITA margin of 5% to 6% over time. More informationon our performance in 2016 can be found in the 'Financialperformance' section, and information about our targets canbe found in the 'Strategic priorities and targets' section.
Gross marginWe focus on temp margin (gross profit generated throughtemporary staffing) and the contribution of permanentplacements and other fee-based business. Gross margin is,however, not a strategic target as such. In order to realize ourEBITA-margin target, we focus on the extent to which grossprofit is converted into EBITA.
Cost controlPersonnel costs are the largest contributor to operatingexpenses. By using our ABFS model, we know when andwhere we need to add or reduce staff. Relatively high staffturnover facilitates a good degree of flexibility of these costs.Other costs are also highly flexible and tightly controlled.
Incremental conversion ratioWe measure the percentage of gross profit growth convertedinto EBITA. In the early stages of recovery, we generallyrequire the incremental conversion ratio (ICR) of a company tobe over 70%. Once recovery has developed further, an ICR of50% is required. In a period of contraction, we aim for arecovery ratio of 50%. This means that 50% of lost gross profitis recovered through reduced operating expenses. In the
Weekly indicators
Market share
Profitability
Gross margin
Cost control
Incremental conversion ratioProductivity
Cash flow generation
Working capital
Financial position
Key p
erf
orm
an
ce in
dic
ato
rs
Number of permanent placements
Number of candidates working
Key performance indicators
introductionintroduction

60
annual report 2016 − Randstad Holding nv
'Financial performance' section, we have included an overviewof conversion ratios in recent years.
ProductivityProductivity improvements (see 'Financial performance' formore details) are important in helping us to achieve ourprofitability targets. We measure productivity in three ways:- Gross profit per staff member (GP/FTE);- Gross profit in relation to personnel expenses (GP/PE);- The number of candidates per staff member (Temps/FTE).
Working capitalThere is a strong focus within Randstad on Days SalesOutstanding (DSO), the amount of overdues, and workingcapital. This focus is also reflected in the bonus targets set forour senior management. As a further incentive, through asimplified EVA method, operating companies are charged fortheir use of operating working capital. Within workingcapital, the 'trade receivables' component is the mostimportant for us to influence. Our liabilities comprise mainlywage tax and social security payments to tax authorities.Clearly, those payment terms are more difficult to influence.In the 'Financial performance' section, we have included amore detailed analysis of our historical performance.
Financial positionTo maintain a solid financial position, we monitor ourleverage ratio (net debt divided by 12-month EBITDA). This isused as guidance for dividend payment on ordinary sharesand as a basis for our acquisition policy. Strategically, ourtarget range is between 0 and 2, while our bank covenantsallow for 3.5. In certain cases, we are now allowed to report toa maximum leverage ratio of 4.25x EBITDA for a limitedamount of time. This provides us with a cushion in managingthrough the cycle. More information on our financial positionand capital structure can be found in the section 'Investorrelations and share performance'.
Cash flow generationBetter profitability and more efficient use of working capitalresult in sound cash generation, which we measure on thebasis of the amount of free cash flow generated. Free cashflow includes operating profit and movements in workingcapital plus capital expenditure. In a normal year, our freecash flow moves in line with the seasonal pattern in ourbusiness. While the free cash flow in the first quarter isnormally low, it is negative in the second quarter, as workingcapital requirements increase in line with higher revenue andthe payment of holiday allowances in Belgium and theNetherlands. Free cash flow in the second half of the year isnormally higher, based on higher revenue and profit.Traditionally, we experience unwinding of working capital inDecember, impacted by the holidays. The development in freecash flow per quarter is shown in the graph 'free cash flowdevelopment'. In a downturn, we typically see significantunwinding of working capital. More information on cash flowanalysis can be found in our quarterly press releases, and inthe section 'Performance'.
Free cash flow developmentin millions of €
2014 2015 2016
Q1 Q2 Q3 Q4-200
-100
0
100
200
300
400
introduction

61
annual report 2016 − Randstad Holding nv
Number of candidates workingIn order to determine our success across the various markets inwhich we operate, we also regularly monitor the number ofcandidates we place with our clients, as well as our marketshare across countries. See the graph 'Candidates working splitby geography' for more details on the development perregion. Performance relating to market share can be found inthe section 'Country performance'.
Candidates working split by geographyas a % of total number of candidates working per day
17% 18% 18%
13% 13% 13%
12% 12% 12%
8% 8% 8%
7% 7% 7%
10% 10% 10%
2% 3% 3%
13% 10% 10%
18% 19% 19%
North America Germany United Kingdom
Netherlands Belgium & Luxembourg Other European countries
France Iberia Rest of the world
2016 Total:
626,300
2015 Total:
597,400
2014 Total:
580,300
0
100
Number of permanent placementsMatching candidates with clients for temporary assignmentshas always been the biggest part of our business. However,over the past few years, permanent placements have becomea growing proportion of our daily work. The table 'Number ofpermanent placements' reflects the 2016 numbers comparedto 2015, broken down by geography.
Number of permanent placements
2016 1 2015
North America 44,700 51,400
Netherlands 7,900 7,500
France 42,400 32,900
Germany 4,300 3,900
Belgium & Luxembourg 3,200 2,900
Iberia 24,600 19,100
United Kingdom 10,900 11,100
Other European countries 16,500 10,200
Rest of the world 29,400 19,500
Group 183,900 158,5001 2015 numbers have been restated. Both years include RPO placements.

62
annual report 2016 − Randstad Holding nv
Income statement
For a meaningful analysis of our results, we need to look atthe underlying results, which excludes the impact of foreignexchange movements, mergers and acquisitions, and one-offitems such as restructuring costs and integration costs.
Income statement, underlyingin millions of €, unless otherwise indicated
2016 2015 organic ∆
Revenue 20,684.1 19,219.2 5%
Cost of services 16,749.9 15,624.7
Gross profit 3,934.2 3,594.5 4%
Personnel
expenses 2,251.5 2,077.0
Other expenses 736.0 655.6
Operating
expenses 2,987.5 2,732.6 3%
EBITA,
underlying 946.7 861.9 7%
Gross margin 19.0% 18.7%
Operating
expenses margin 14.4% 14.2%
EBITA margin 4.6% 4.5%
RevenueAt Group level, organic revenue increased 4.7% in 2016(2015: 6.2%). Currency effects had a negative impact of −0.8%and M&A contributed +3.6%. Overall reported revenue forthe year increased 8% to € 20,684.1 million. Our Europeanoperations grew 6% in 2016 (2015: up 6%), North Americagrew 1% (2015: up 5%), Asia grew 5% (2015: up 8%), andLatin America grew 15% (2015: up 15%). Particularly Europeexperienced a strong finish of the year, fueled by a broad-based acceleration of growth in countries such as France,Germany, Iberia and Italy. More detailed information isincluded in the section 'Country performance'. Moreinformation about the three main revenue categories(Staffing, Inhouse Services, and Professionals) can be found inthe section 'Performance by revenue category'.
Permanent placements were up 7% (2015: up 14%).Permanent placements made up 2.0% of revenue (2015:2.0%). Revenue from temporary billing increased by 5%organically (2015: up 6%)
On average, we employed 626,300 candidates per day, andwe made around 183,900 permanent placements in 2016.Annually, we employ more than two million people.
Organic revenue growth per working dayin %
Q1 Q2 Q3 Q4 Full year
Geographic areas
North America 3 0 1 1 1
Netherlands 6 3 2 2 3
France 9 4 5 10 7
Germany 5 5 5 10 6
Belgium & Luxembourg (2) (2) 5 5 2
Iberia 8 5 6 10 7
United Kingdom 1 0 1 2 1
Other European countries 10 9 10 20 13
Rest of the world 5 4 8 10 7
Revenue categories
Staffing 3 2 3 5 3
Inhouse Services 10 6 10 13 10
Professionals 4 4 2 3 3
Group 5 3 4 7 5
Year-on-year organic growth
Temp revenue Perm revenue Other revenue
Q1 2014
Q2 2014
Q3 2014
Q4 2014
Q1 2015
Q2 2015
Q3 2015
Q4 2015
Q1 2016
Q2 2016
Q3 2016
Q4 2016
-10%
-5%
0%
5%
10%
15%
20%
25%
financial performancefinancial performance

63
annual report 2016 − Randstad Holding nv
Gross profitGross profit reflects our effectiveness in pricing, cost ofemployee benefits, and idle-time management. In 2016, grossprofit amounted to € 3,934 million, an organic increase of 4%compared to the previous year (2015: up 7%). Gross marginincreased 30bp to 19.0%, driven by the Monster acquisition.Excluding Monster, gross margin remained stable YoY at18.7%. The graph 'Change in gross margin' shows the changein gross margin in 2016. Note 5 to the financial statementsincludes an overview of the actual reported gross profit pergeography.
Change in gross margin
18.7% (0.1)% 0.1%
0.3% 19.0%
2015
temp
marg
in
perm
fees
HR
S/oth
er
2016
17.0%
18.0%
19.0%
20.0%
Our temp margin decreased 10bp compared to last year asmix effects offset a more competitive market. Permanentplacements and HR Solutions fees combined had a positiveimpact of 40bp driven by the Monster acquisition. At Grouplevel, the contribution from permanent placements ('permfees') made up 10.4% (2015: 10.6%) of gross profit.
Gross profitin millions of €
2,564.72,848.6 3,040.8
615.3745.9
893.4
Temp Perm/fees
Total: 3,180.0
2014
Total: 3,594.5
2015
Total: 3,934.2
2016
0
1,000
2,000
3,000
4,000
5,000
The trend in gross margin is monitored closely. Animprovement indicates that we are succeeding in enrichingour business mix towards higher-value-added segments in the
HR services space. In order to realize our EBITA margin targets,we aim to maximize conversion of gross profit into EBITA. In2016, we converted 24% of gross profit into EBITA.
Gross margin, conversion ratio and EBITA margin
Gro
ss m
arg
in/C
on
vers
ion
rat
io
EBITA
marg
in
Gross margin Conversion ratio¹ EBITA margin
2012 2013 2014 2015 201615%
20%
25%
30%
3%
4%
5%
6%
1 EBITA as percentage of gross profit.
ProductivityAs explained in the sections 'Value proposition & strategy' and'How we measure performance', productivity improvementsare key to achieving our profitability targets. We measureproductivity in three ways:- Gross profit per staff member (GP/FTE);- Gross profit in relation to personnel expenses (GP/PE);- Number of candidates per staff member (Temps/FTE).
Productivity (GP/FTE) was organically flat in 2016 (2015: up4%). We aim to focus on achieving greater efficiencies acrossthe organization, mainly through better execution based onfield steering and the implementation of the right deliverymodels for our clients. The lack of material growth over thepast years and pricing pressure in certain markets made itdifficult to significantly improve our productivity.
Productivity, indexed100 = 2007
GP/FTE GP/PE Temps/FTE
Q1 2013
Q2 2013
Q3 2013
Q4 2013
Q1 2014
Q2 2014
Q3 2014
Q4 2014
Q1 2015
Q2 2015
Q3 2015
Q4 2015
Q1 2016
Q2 2016
Q3 2016
Q4 2016
80
90
100
110
120
130

64
annual report 2016 − Randstad Holding nv
Operating expensesA breakdown of operating expenses is shown in the table'Operating expenses'. These expenses reflect the costs relatedto our sales and delivery organization, as well as our headoffices.
Operating expensesin millions of €, unless otherwise indicated
2016 2015
Personnel expenses 2,251.5 2,077.0
Advertising and marketing 129.5 109.4
Accommodation costs 196.2 184.2
Other operating expenses 337.5 298.2
Depreciation, amortization and
impairment of PPE and software 72.8 63.8
Operating expenses, underlying 2,987.5 2,732.6
Average number of corporate employees 32,280 29,750
Number of branches, year-end 2,974 2,750
Number of Inhouse locations, year-end 1,778 1,723
In 2016, underlying operating expenses amounted to € 2,987.5million, up 3% organically. Foreign exchange effectsdecreased our cost base by € 22 million. Actual operatingexpenses in 2016 included € 41.1 million one-offs (2015: € 29.9million), which are mainly M&A expenses and restructuringcosts, for which we aim to achieve a payback period of twelvemonths.
The graph 'Change in operating expenses' shows the mostimportant changes in our underlying cost base in 2016.
Personnel expenses increased by 3% organically. We investedin areas where growth continued, such as in the US (Staffing),Spain and Italy. Personnel expenses per FTE were slightlyhigher compared to 2015, due to growth in our moredeveloped markets. An overview of corporate staff by regionis given in the section 'Country performance'. Further detailson actual personnel expenses can be found in note 9 to thefinancial statements.
Operating expensesOperating expenses: € 2,987.5 million
75%
4%
7%
11%3%
Personnel Accommodation Depreciation
Marketing Other (IT, 3rd party, etc)
Marketing costs were 0.6% of revenue (in line with 2015).Further information about our marketing strategy is includedin the section 'Value for our clients and candidates'.
Accommodation costs fell by 1% organically. Across theboard, we continued to consolidate branches, without leavingmarkets. As we continued to see strong demand for InhouseServices, we opened 55 new Inhouse locations in 2016 (2015:128), most notably in Japan, Spain and spread over the 'OtherEuropean countries' region. At the end of 2016, we wereoperating a network of 2,974 branches, including locationsdriven by M&A (up 8%), and 1,778 Inhouse locations (up 3%).
Change in operating expensesin millions of €
2,732.6
197.8 (21.9) 1.454.0 16.3 7.3 2,987.5
2015 M&A Fx North America Europe Rest of world Corporate 20161,500.0
2,000.0
2,500.0
3,000.0
3,500.0
financial performance

65
annual report 2016 − Randstad Holding nv
Other operating expenses − mainly IT and general costs −increased organically by 6%. IT costs generally contract andexpand with our capacity. General costs, which mainly consistof postage, office supplies, and consultancy costs, decreased inline with our focus on cost control.
Depreciation and amortization charges were higher than in2015 due to the impact of M&A. On average, we depreciateassets over three to five years.
Branches and Inhouse locations, year-end
2016 2015
Branches
Inhouse
locations Branches
Inhouse
locations
North America 730 419 696 423
Netherlands 303 337 311 333
France 471 211 521 207
Germany 280 277 274 276
Belgium & Luxembourg 155 155 150 153
Iberia 230 109 207 99
United Kingdom 87 42 75 64
Other European countries 498 145 288 118
Rest of the world 220 83 228 50
2,974 1,778 2,750 1,723
EBITAUnderlying EBITA increased to € 946.7 million, with EBITAmargin improving to 4.6%, compared to 4.5% in 2015.Currency effects had a negative impact on EBITA of € 2million.
EBITA development, underlyingin millions of €
EBIT
A (
x €
mill
ion
)
EBITA
marg
in
EBITA (€) Margin
2014 2015 20160
250
500
750
1,000
1,250
3%
3.5%
4%
4.5%
5%
5.5%
EBITAin millions of €
2016 2015 ∆
EBITA, underlying 946.7 861.9 10%
Integration costs 13.6 0.0
One-offs 41.1 29.9
EBITA, actual 892.0 832.0 7%
Amortization and impairment of
intangible assets and goodwill
impairment 101.4 127.3
Operating profit 790.6 704.7 12%
Net finance costs (3.8) (29.1)
Share in profit of associates (0.8) 0.7
Result on disposal of associates (one-
off) 0.0 6.1
Income before taxes 786.0 682.4
Taxes on income (197.8) (163.6)
Net income 588.2 518.8 13%
As explained in the section 'How we measure performance',we measure the conversion of gross profit into EBITA. If wegrow, our target is to convert around 50% of incrementalgross profit into EBITA (incremental conversion ratio). If ourgross profit declines, our target is to achieve cost savings of atleast 50% of lost gross profit (recovery ratio). For the Group asa whole, the incremental conversion ratio was 41%, primarilyas Q4 2016 faced a tough comparison given an above-averagelevel of positive incidentals in Q4 2015.
Incremental conversion ratio
Europe North America Group
2013 2014 2015 2016-200%
-150%
-100%
-50%
0%
50%
100%
150%
Target:
- Incremental conversion ratio: 50%
- Recovery ratio: 50%

66
annual report 2016 − Randstad Holding nv
Amortization of intangible assets, and impairment ofgoodwillIntangible assets are capitalized in the balance sheet uponacquisition of companies and reflect the value that is allocatedto assets, such as brand names, customer relationships, andcandidate databases. These intangible assets are amortizedover a period of one to ten years. During the year, theamortization charge lowered, as some prior acquisition-related intangibles have now been fully amortized. For moreinformation, see note 4.1 and note 15 to the financialstatements.
Operating profitOperating profit is EBITA including the non-cash amortizationand impairment charges on acquisition-related intangibleassets and goodwill. As a result of the change in theaforementioned charges, operating profit increased by 12%compared to 2015 to € 790.6 million.
Net finance costsFor the full year, net finance costs amounted to € 3.8 million,compared to € 29.1 million in 2015. Net finance costs includenet interest expenses on our net debt position, as well asforeign currency effects and adjustments in the valuation ofcertain assets and liabilities. Interest expenses on our net debtposition amounted to € 14.6 million (2015: € 13.3 million).Interest expenses increased, as a result of our acquisition-related cash outflow. We have a policy of using floatinginterest rates as a natural hedge against the development inoperational results, which continued to pay off significantly.Foreign currency effects had a positive effect of € 3.8 million(2015: € 17.5 million negative). Further details on net financecosts are included in note 10 to the financial statements.
Taxes on incomeThe effective tax rate before amortization and impairment ofacquisition-related intangible assets and goodwill, integrationcosts, and one-offs amounted to 26.0% in 2016 (2015: 25.5%).The change in effective tax rate was driven by a differentcountry mix in taxable profits/losses. More information on theactual effective tax rate is given in note 4.3 to the financialstatements.
Net income, earnings per share and dividendAdjusted net income for holders of ordinary shares amountedto € 688.9 million (2015: € 608.3 million).
Underlying diluted EPS increased by 13% to € 3.75 (2015:€ 3.32). The number of outstanding ordinary shares remainedvirtually stable.
In line with our dividend policy, we will propose the paymentof an all-cash dividend of € 1.89 per ordinary share (2015:€ 1.68). This means a payout ratio of 50% (in line with 2015).Our dividend proposal is further elaborated on in the 'Investorrelations' section.
Net income, earnings per share and dividendin millions of €, unless otherwise indicated
2016 2015
Net income 588.2 518.8
Net income for non-controlling interests 0.2 0.0
Net income for holders of preference
shares 12.6 12.6
Net income for holders of ordinary shares 575.4 506.2
Amortization of intangible assets 1 101.4 127.3
Integration costs 13.6 -
One-offs 2 41.1 23.8
Tax effect on amortization, integration
costs and one-offs (42.6) (49.0)
Net income for holders of ordinary shares,adjusted 688.9 608.3
Basic EPS (€) 3.15 2.79
Underlying basic EPS (€) 3.77 3.35
Underlying diluted EPS (€) 3.75 3.32
Proposed dividend (€) 1.89 1.68
Payout ratio (% of underlying basic EPS) 50 501 Amortization of acquisition-related intangible assets and impairment of goodwill.2 2015: Including € 6.1 million gain on disposal of associates.
financial performance

67
annual report 2016 − Randstad Holding nv
Invested capital
Our invested capital amounted to € 4.9 billion (2015:€ 4.0 billion). The primary components of our invested capital,as shown in the overview below, are goodwill and acquisition-related intangible assets, working capital, and net tax assets.Return on invested capital declined to 15.9%, due toacquisitions (2015: 18.8%).
Invested capitalin millions of €, unless otherwise indicated
2016 2015
Goodwill and acquisition-related intangible assets 3,286.3 2,603.3
Trade and other receivables 1 4,104.3 3,428.9
Trade and other payables 2 3,392.2 2,807.5
Operating working capital 712.1 621.4
Net tax assets 3 479.6 516.8
All other assets/(liabilities) 4 456.2 293.4
Invested capital 4,934.2 4,034.9
Financed by
Total equity 4,140.8 3,861.7
Net debt 793.4 173.2
Invested capital 4,934.2 4,034.9
Ratios
DSO (Days Sales Outstanding, moving average) 51.4 50.7
Working capital as % of revenue 3.4% 3.2%
Leverage ratio (net debt/EBITDA) 0.8 0.2
Return on invested capital 5 15.9% 18.8%1 Trade and other receivables minus the current part of financial fixed assets,
deferred receipts from disposed Group companies, and interest receivable.2 Trade and other payables minus interest payable.3 Net tax assets: deferred income tax assets and income tax receivables less deferred
income tax liabilities and income tax liabilities.4 All other assets/liabilities: property, plant and equipment, and software, plus
financial assets and associates, less provisions and employee benefit obligationsand other liabilities.
5 Return on invested capital: underlying EBITA less income tax paid as a percentageof invested capital.
Operating working capitalDuring the year, we continued our focus on working capitalmanagement, paying special attention to the collection oftrade receivables and the reduction of overdues. Tradereceivables grew along with the revenue growth. As apercentage of revenue, working capital was 3.4% (2015:3.2%). Within working capital, the component we most needto be able to influence is trade receivables. Our DSO increasedto 51.4 days (2015: 50.7), due to the higher DSO of acquiredcompanies (mainly Obiettivo Lavoro and Monster). We aim torealize further improvements by focusing on the aging oftrade receivables, including payment terms and overdues. Thegraph 'Working capital management' shows the developmentof working capital and DSO over the past few years.
Our exposure to bad debt remained limited, amounting toonly 0.3% of revenue (2015: 0.2%). The change was due toacquisitions. Our trade receivables portfolio is very diversifiedgeographically, in terms of both segmentation and clientbase, which mitigates credit risk. Current liabilities mainlycomprise liabilities such as wage tax, social security charges,and pensions, for which payment terms are determined bylaw and therefore difficult to change.
Working capital management
Wo
rkin
g c
apit
al a
s %
of
reve
nu
e
DSO
(mo
ving
average)
Working capital as % of revenue DSO (moving average)
2012 2013 2014 2015 20160%
1%
2%
3%
4%
44
46
48
50
52
54
All other assets and liabilitiesFor the purpose of analyzing our invested capital, we havegrouped various other assets and liabilities. Please seefootnote 4 of the invested capital table for a description ofthe constituents. The largest part of the year-on-year changein this section was caused by a € 110.3 million increase of theCICE receivable (arising from tax credits under the FrenchCompetitive Employment Act). These tax credits can be offsetagainst the income tax liability with respect to the calendaryear to which the wages (based on which the tax credit iscalculated) relate. Any excess credit can be carried forwardand offset against the tax liability in the next three years. Anyexcess after three years will be refunded. The first refund of€ 67.4 million is expected in 2017.

68
annual report 2016 − Randstad Holding nv
Net debtOur net debt position increased to € 793.4 million, mainly as aresult of net acquisitions (€ 709 million), dividends paid (€ 320million), and a solid free cash flow of € 464.6 million. As aresult, the leverage ratio (net debt divided by 12-monthEBITDA) was 0.8 at year-end, well within our targeted rangeof between 0 and 2. The section 'How we measureperformance' contains an overview of the development of netdebt and the leverage ratio.
Net debtin millions of €, unless otherwise indicated
2016 2015
Cash and cash equivalents 385.8 133.5
Less: Non-current borrowings 699.2 124.6
Less: Current borrowings 480.0 182.1
Net debt 793.4 173.2
Leverage ratio 0.8 0.2
As at December 31, 2016, the Group had a € 1,920 millioncommitted multi-currency syndicated revolving credit facilityat its disposal (2015: € 1,800 million), which matures in July2021 (2015: July 2020). As the second extension option wasexercised in 2016, the final maturity date is now July 2021. Thefacility agreement contains a covenant with respect to the netdebt to EBITDA ratio (leverage ratio), as well as a paragraphon material adverse changes. The net debt to EBITDA ratio hasa limit of 3.5, and is calculated based on the results of theGroup on a 12-month basis. In certain cases, Randstad isallowed to report a leverage ratio of 4.25x EBITDA for alimited period of time.
Net debt and leverage ratio developmentin millions of €
Net
deb
t
Leverage ratio
Net debt Lev. ratio
2014 2015 20160
100
200
300
400
500
600
700
800
900
1,000
0
0.5
1
1.5
2
Cash flow analysis
Free cash flowFree cash flow amounted to € 464.6 million (2015: € 498.8million). The increase in working capital requirements (€ 169.5million outflow) is driven by M&A and the funding of ourorganic sales growth. Due to a different mix in taxable profitsand losses and a shift in tax deductible costs between 2016and 2015, the cash tax rate of 2015 was relatively lowcompared to 2016 and 2014. Capex increased in 2016, drivenby a refurbishment of our headquarters in the Netherlands(€ 11 million), the addition of Monster (€ 6 million) and otherinvestments in future growth. For more details on this topic,see the Consolidated statement of cash flows on page 115.
Consolidated cash flow statementin millions of €
2016 2015
EBITA, actual 892.0 832.0
Depreciation, amortization and
impairment of property, plant and
equipment, and software 74.1 64.7
EBITDA 966.1 896.7
Working capital (169.5) (121.9)
Provisions and other items (77.1) (103.8)
Corporate income taxes (159.8) (105.4)
Net cash flow from operating activities 559.7 565.6
Net capital expenditures 1 (94.0) (63.0)
Loans and receivables (1.1) (3.8)
Free cash flow 464.6 498.8
Net acquisitions and disposals 2 (709.0) (83.9)
Issue of ordinary shares 0.1 4.2
Purchase of own shares (35.8) (58.3)
Dividend paid on ordinary shares (307.2) (81.5)
Dividend paid on preference shares (12.6) (12.6)
Net finance costs (11.8) (9.1)
Translation and other effects (8.5) (8.8)
Net decrease of net debt (620.2) 248.81 Net additions in property, plant and equipment and software.2 Net acquisitions and disposals of subsidiaries/activities, associates and equity
investments at an amount of € 709.0 million, includes an amount of € 128.3 millionof non-current borrowings acquired.
financial performance

69
annual report 2016 − Randstad Holding nv
Introduction
Randstad operates in 39 countries, representing more than90% of the global HR services market. This is not likely tochange much, as we believe our current network covers themost attractive geographies. In this section, we provide anoverview of our underlying performance in these countries in2016.
North America
in millions of € 2016 2015 Organic ∆
Revenue 4,719.9 4,653.4 1%
EBITA 266.1 249.1 6%
EBITA margin 5.6% 5.4%
Randstad is one of the largest providers of HR services inNorth America. We hold leading positions in key verticals,including IT, accounting and finance, office/clerical, industrial,and permanent placements. In 2016, sales in North Americaincreased 1.1%, while gross profit was up 1.7%. Overallprofitability in North America reached a new record level forthe fourth consecutive year. This was a result of improvedfocus on pricing and continued cost control. EBITA marginincreased to 5.6% in 2016, compared to 5.4% in 2015.
US revenue grew by 1.0%, while gross profit grew by 1.5%.With our continued advances in field steering andimprovements in back-office efficiency, EBITA margin for ourcombined US businesses improved once again. The US staffingmarket saw moderate overall growth in 2016 compared torecent years, coupled with a declining labor supply withinmany key verticals. In 2016, Randstad US launched a Big Dataproject aimed at increasing recruitment efficiency, ultimatelyenhancing both the client and the candidate experience.Client segmentation and gaining cost efficiencies through the
implementation of centralized delivery models continue to beareas of strong focus.
The US Staffing and Inhouse businesses benefited from thecombined impact of field steering, strong perm revenuegrowth and pricing discipline, with full-year growth of 3% inrevenue and 4% in gross profit, outperforming the market.Inhouse Services performed particularly well, driven by stronggrowth in new accounts. Permanent placements within ourStaffing business grew 13% compared to 2015.
Revenue growth in our US Professionals group was down 2%,and gross profit was down 1%. EBITA margin in our combinedProfessionals businesses was flat year-on-year. IT revenuescame down by 2%, while our healthcare business grew by13%. Engineering continues to face tough market conditions,and was down 3% for the year.
Our Sourceright business grew by 7%, mainly driven by 25%growth in MSP.
Main market positions, 20161
in billions of local currencies
Markets
Market
growth
Market
share
Market
position
United States 4% 4% 2
Netherlands 9% 18% 1
France 6% 14% 3
Germany 6% 8% 1
Belgium & Luxembourg 7% 25% 1
Spain 9% 29% 1
United Kingdom 3% 2% 71 Based on country data, 2016 figures, and SIA estimated growth rates.
Development in the main geographic marketsin millions of €, unless otherwise indicated
Revenue Organic
growth
Average candidates Average corporate staff
2016 2015 2016 2015 2016 2015
North America 4,719.9 4,653.4 1% 109,200 108,800 6,530 6,430
Netherlands 3,185.6 3,076.9 3% 82,500 76,600 4,320 4,150
France 3,045.1 2,845.1 7% 78,200 74,600 3,570 3,460
Germany 2,087.6 1,969.6 6% 47,000 45,800 2,660 2,570
Belgium & Luxembourg 1,372.5 1,350.3 2% 41,900 41,400 1,940 1,890
Iberia 1,275.1 1,193.5 7% 63,200 61,000 1,870 1,750
United Kingdom 817.2 909.5 1% 14,700 16,000 1,530 1,560
Other European countries 2,338.5 1,576.6 13% 79,600 60,100 4,150 2,820
Rest of the world 1,842.6 1,644.3 7% 110,000 113,100 5,510 4,930
Corporate n.a. n.a. n.a. n.a. n.a. 200 190
20,684.1 19,219.2 5% 626,300 597,400 32,280 29,750
country performancecountry performancecountry performance

70
annual report 2016 − Randstad Holding nv
CanadaDespite very challenging market conditions, Randstad Canadaperformed well, and revenue increased by 3%. A strongperformance in perm, which grew by 9%, resulted in a stronggross profit performance and increase of profitability.
The Netherlands
in millions of € 2016 2015 Organic ∆
Revenue 3,185.6 3,076.9 3%
EBITA 182.2 194.4 (6%)
EBITA margin 5.7% 6.3%
In the Netherlands, where Randstad is the market leader,revenue grew 3% organically. Our EBITA margin decreased60bp to 5.7%, and perm fees increased 8%.
Our combined Staffing and Inhouse revenues (represented bythe Randstad and Tempo-Team brands) increased 3%. OurProfessionals business was flat after a strong year of growth in2015 (up 17%). Our HR Solutions business, which mainlyconsists of payroll services, suffered substantially from the lossof the Dutch government payrolling. The market remainedcompetitive. Although we were able to keep a highconversion rate by having the right delivery models in placewith regard to both our Inhouse Services concept and centraldelivery, we were unable to fully offset the pricing pressure.
France
in millions of € 2016 2015 Organic ∆
Revenue 3,045.1 2,845.1 7%
EBITA 168.4 148.7 13%
EBITA margin 5.5% 5.2%
Randstad is the third-largest provider of HR services in France,with a 12% market share. Revenue grew 7% at an EBITAmargin of 5.5% (an improvement of 30bp compared to 2015).In France, we have leading positions in Inhouse Services,healthcare and permanent placements. Our French marketgrew by 7% in 2016, compared to 4% in 2015. This was mainlydriven by strong growth in transportation (up 18%),construction (up 17%) and industry (up 10%).
Regaining market share while consolidating higherprofitability levels was Randstad's primary goal in Francethroughout 2016. Our focus remains strongly on profitablemarket segments. This is of paramount importance, as weoperate in a mature market in which prices are underpressure. Our combined Staffing and Inhouse revenues grew6%, and we achieved 12% growth in Professionals. Overallrevenue from permanent placements grew by 29% in 2016across all business lines, with Professionals placementsincreasing by 31%, helped by our new big data tool, 'Starter'.
The 12% growth in Professionals was driven by a very strongperformance from our Expectra brand (16% growth), as wellas another good year for our healthcare services (up 10%).Our focus on applying our Tech & Touch strategy to betterserve our SME clients also paid off, with our retail accountsgrowing at twice the rate of our large accounts in 2016.
Germany
in millions of € 2016 2015 Organic ∆
Revenue 2,087.6 1,969.6 6%
EBITA 100.3 95.7 6%
EBITA margin 4.8% 4.9%
The German staffing market continued its recovery into 2016,following the green shoots that appeared in the course of2015. Our overall revenue increased by 6% compared to theprevious year, and we managed to expand our marketleading position. Underlying EBITA margin reached 4.8%,compared to 4.9% in 2015. The lack of improvement wassolely attributable to Q4 2016, which saw a much lowerrelease in holiday accruals than Q4 2015, as well as fewerworking days and a higher sickness rate.
In Staffing and Inhouse Services (where we operate asRandstad and Tempo-Team), we grew by 6%. Our InhouseServices started off below last year, due to continued transfersand less business from some major clients, but managed torecapture growth in the second half of the year. Ourcontinued efforts in Staffing to improve our business mix paidoff, and we managed to both increase our SME business andcontinue to grow in permanent placements.
In Professionals, we formerly operated under two brands inGermany: GULP and Randstad Professionals. GULP has beenthe most important source of IT project candidates amongexternal specialists in Germany, while Randstad Professionalsprovided high-end HR solutions in the engineering and ITservices segments. In order to be able to leverage bestpractices and improve performance, we decided to moveRandstad Professionals under GULP leadership in 2016 andrebranded the company into GULP Solution Services. Revenueof the combined Professionals businesses increased by 8%.
Belgium & Luxembourg
in millions of € 2016 2015 Organic ∆
Revenue 1,372.5 1,350.3 2%
EBITA 87.5 79.6 10%
EBITA margin 6.4% 5.9%
Randstad remains the clear market leader in Belgium andLuxembourg. The market recorded 7% growth in the year,despite a difficult start, which was overshadowed by the
country performance

71
annual report 2016 − Randstad Holding nv
terrorist attacks. Overall, revenue grew by 2% in 2016. Thecombined Staffing and Inhouse Services businesses (where weoperate as Randstad and Tempo-Team) reported 1% toplinegrowth. EBITA increased by 50bp to 6.4%, thanks to acontinued focus on client profitability. For the second year in arow, the Belgium & Luxembourg region recorded the highestlevel of profitability in its history.
Iberia
in millions of € 2016 2015 Organic ∆
Revenue 1,275.1 1,193.5 7%
EBITA 59.7 51.4 16%
EBITA margin 4.7% 4.3%
Revenue growth in our Iberian business was 7%, with EBITAmargin reaching 4.7%, compared to 4.3% in 2015. We aremarket leader in both Spain and Portugal.
SpainSpain enjoyed another strong year in 2016 (revenue up 8%).This was due to the underlying improvement in the economyand labor market, as well as our relentless focus on clientprofitability, internal productivity, and risk control. OurStaffing business grew by 7%, and Inhouse Services by 12%.Our decision to continue to invest in the Professionals businesshas paid off, as we are now clearly one of the Top 3Professionals players in Spain. Innovation also played anincreasingly important role in 2016.
PortugalOverall revenue increased by 6% compared to last year.Strong growth was achieved in the contact center business,and our Professionals business also had a good year, withcontinued growth in permanent placements. The combinedStaffing & Inhouse Services businesses were in line with theprevious year. We focus on client profitability andoptimization of delivery models, such as the successfulimplementation of our Inhouse concept. The implementationof field steering and the ongoing optimization ofadministrative processes were important achievements in2016.
United Kingdom
in millions of € 2016 2015 Organic ∆
Revenue 817.2 909.5 1%
EBITA 20.7 22.0 6%
EBITA margin 2.5% 2.4%
Following a strong first half year, with EBITA up year-on-yearon the back of a small gross profit improvement, the secondhalf of the year slipped, with the fallout from Brexit hittingsome of our business lines.
For the full year, EBITA (up 6%) remains ahead of the prioryear, despite only limited revenue growth. Our Sourcerightbusiness and our Construction, Property & Engineeringbusiness unit both performed well, delivering continuedgrowth, while our Professionals business suffered a little in acompetitive sector and tumultuous period. Our public sectorbusiness lines have been joined together to form a single,dedicated business unit. Similarly, our private-sector,professionally focused business lines have been joinedtogether into our new Business Solutions business unit. Wecontinue to focus on operational efficiency improvements,both in terms of innovative digital solutions and simplificationof business processes. As a result, we are starting to seeimproved productivity.
Other European countries
in millions of € 2016 2015 Organic ∆
Revenue 2,338.5 1,576.6 13%
EBITA 93.8 61.9 13%
EBITA margin 4.0% 3.9%
Revenue growth for 'Other European countries' was 13% in2016, while EBITA margin improved 10bp to 4.0%.
PolandIn Poland, we again had a good year, growing 12%. RandstadPoland was particularly successful in the Inhouse Servicesbusiness, as well as in Professionals. However, we do see thatmarket conditions are becoming tougher, due to scarcity ofcandidates. The large cities in Poland already have almost nounemployment.
ItalyIn Italy, where we acquired Obiettivo Lavoro in 2016, webecame the No. 2 in the market, after being No. 4 in theprevious years. The Obiettivo Lavoro integration is well ontrack. Revenue grew organically by 16% to € 1 billion. Growthaccelerated in the second half of the year, with a positiveeffect on market share. This was led by good growth in bothStaffing and Inhouse Services, supported by significantinvestments in consultants. In addition, we achieved very goodresults in permanent placements in Professionals, with 43%year-on-year growth. Operational expenditure remainedunder control, with dedicated investments to maintaingrowth.
NordicsAfter the successful completion of the acquisition of Profficein early 2016, we immediately started full integration ofRandstad and Proffice across the Nordic region, as a result ofwhich the integration is now well on track. In 2016, we sawrevenue growth in our combined businesses in Sweden beingsomewhat under pressure, driven by transfers and reduceddemand on the part of a few large clients. However, growthin permanent placements, which comprised 21% of gross

72
annual report 2016 − Randstad Holding nv
profit, was strong, posting 20% growth on a pro forma basis.In Norway, where the market faced a severe downturn inprevious years, we saw green shoots of recovery in 2016, andwe managed to improve our underlying profitability in 2016.In Denmark, where the magnitude of the integration wasrelatively limited, we outperformed the market, with revenuegrowth reaching 11% on a pro forma basis.
SwitzerlandIn 2016, the Swiss market showed the first signs of recoveryafter the Swiss Franc revaluation in 2015. With 13% salesgrowth, we outperformed the Swiss market for the sixthconsecutive year.
AustriaIn Austria, we grew by 9%, ahead of the market and mainlythanks to the strong performance of Inhouse Services andProfessionals.
Hungary, Turkey, Czech Republic, Greece, andRomaniaIn Hungary, where we are a strong leader in perm, we hadanother very successful year, growing our Randstad businessby 15%. In the Czech Republic, we again booked high-double-digit growth (22%). In Turkey, we had an excellent year giventhe turbulent political situation in the country (up 9%), andwe were able to improve our profitability. Randstad also hada good year in Greece, where we grew 32%, which was wellahead of the market. Romania was added to Randstad'scountry portfolio through the Obiettivo Lavoro acquisition.
Rest of the world
in millions of € 2016 2015 Organic ∆
Revenue 1,842.6 1,644.3 7%
EBITA 36.9 20.8 46%
EBITA margin 2.0% 1.3%
Revenue in the 'Rest of the world' region grew by 7%organically. EBITA margin improved from 1.3% to 2.0%.
JapanIn Japan, we continued to invest in expanding our position inProfessionals and permanent placements in 2016. Overall,revenue grew by 5% year-on-year, with solid performance inStaffing and Outsourcing. Permanent placements for entry-level jobs achieved double-digit growth, and Professionalsnearly doubled its revenue with strong demand from clientsdue to talent shortages resulting from the lowestunemployment rate in 20 years in Japan (close to 3.0%).Inhouse Services successfully expanded the number oflocations to 81 (2015: 52).
In July 2016, Randstad acquired Careo, which provides white-collar staffing and IT/Engineering services in central Tokyo.The integration of this acquisition is well on track.
Australia and New ZealandOperations in Australia continued to show solid growth (8%),while improving profitability on the back of strong numbersin permanent placements. Within Staffing, our Educationbusiness had a record year, while Business Support continuedto invest in the strength of its excellent performance. Thestrong growth in our Assessment & Transition business helpeddrive improvements in profitability. The Professionals,Technologies, HR Partners and Construction, Property &Engineering divisions all capitalized on their strong reputationand footprint to deliver solid growth and results.
Revenue split by geography
2016: revenue € 20,684.1 million 2015: revenue € 19,219.2 million
23%
15%
15%10%
7%
6%
4%
11%
9%
24%
16%
15%10%
7%
6%
5%
8%
9%
North America Germany United Kingdom
Netherlands Belgium & Luxembourg Other European countries
France Iberia Rest of the world
EBITA split by geography
2016: EBITA € 946.7 million 2015: EBITA € 861.9 million
26%
18%
17%
10%
9%
6%2%
9%3%
27%
21%
16%
10%
9%
6%2%
7% 2%
North America Germany United Kingdom
Netherlands Belgium & Luxembourg Other European countries
France Iberia Rest of the world
country performance

73
annual report 2016 − Randstad Holding nv
New Zealand operations experienced moderate growth (4%)on the back of the refocused business model and streamlinedbusiness divisions adopted in 2015. They will serve as a solidbase to leverage from in 2017.
IndiaIndia closed 2016 up 3% organically. In our Staffing business,we increased efficiency in delivery by merging mid- and back-office activities, while gaining further traction in theSpecialties segment. The Selection business showed a solidincrease in productivity. Our RPO market presence becamemore visible, almost doubling in size. Due to a strong focus oncost-effectiveness, Randstad India returned to profit in the lastquarter of the year.
China and other Asian countriesAt 13%, double-digit revenue growth of our Chinese businesscontinued into 2016, mostly driven by our temporary Staffingbusiness, despite the challenges related to theimplementation of VAT in China. The revenue growth in ourtemporary Staffing business was achieved both through theexpansion of business with our existing clients and throughnew client acquisitions. Strong cost and productivitymanagement ensured a healthy conversion of topline growthinto China’s bottom line.
Outside mainland China, we saw further traction in ourpermanent placement business in Hong Kong, mainly carriedby our accounting and CPE verticals.
In Malaysia, our repositioning strategy towards theProfessionals segment led to double-digit growth, mainly inthe CPE segment, while we also achieved substantialproductivity improvements. In addition to our regularbusiness, we operate a sourcing center from Kuala Lumpur toservice RPO/MSP clients in the region and in other parts of theGroup.
Our operations in Singapore saw another year of strongperformance with double-digit growth and solid incrementalreturns. In this highly competitive market, we continue to gainmarket share in the majority of the segments we operate in.
Latin AmericaIn Latin America, both our Argentinean and Chileanbusinesses continued to show good progress and deliveredprofitable growth, while introducing new concepts andfocusing on improved business processes. Our Brazilianbusiness faced a very challenging environment, but wassuccessful in introducing a range of new value propositions. InMexico, we continued to focus on improving our business mixand productivity.
"With Checkster, a candidate'sreferences are checked in the blink ofan eye"

74
annual report 2016 − Randstad Holding nv
IntroductionIn this section, we provide an overview of the underlyingperformance per revenue category in 2016. More detailedinformation on these service concepts can be found in thesection 'Value for our clients and candidates'. In our financialreporting, we have merged these service concepts into threerevenue categories: Staffing (including HR Solutions), InhouseServices, and Professionals (including Search & Selection).
Split by revenue category
Revenue 2016: € 20,684.1 million EBITA 2016: € 946.7 million
59%22%
19%
56%
24%
20%
Staffing Inhouse Services Professionals
Staffing (including HR Solutions)in millions of € 2016 2015 Organic ∆
Revenue 12,065.2 11,186.4 3%
EBITA 566.5 514.9 0%
EBITA margin 4.7% 4.6%
In the revenue category of Staffing, we include the serviceconcepts of Staffing and HR Solutions. Within Staffing, weserve clients in the industrial segment (blue-collar) andadministrative segment (white-collar). In our revenue mix, thisis about 50:50. HR Solutions includes a wide range of services,of which Payroll Services, RPO, MSP, Outsourcing andOutplacement are the largest. HR Solutions is well-establishedin the Netherlands and North America, while we haveimplemented a number of initiatives to further diversify ourservice portfolio in Europe and Asia. One of our priorities hasbeen to achieve a greater share of permanent placements inour Staffing businesses. In 2016, we continued our progress inthis regard, with permanent placements increasingproportionately, with growth of 15% in the year (excludingRPO).
Staffing revenue was € 12.1 billion. On an organic basis, thiswas an increase of 3%. The growth rate is impacted by thetransfer of business from Staffing to Inhouse Services, as wecontinued to optimize our service delivery to our clients. Atthe same time, we also saw an increase in the amount ofbusiness through central delivery. In the Netherlands, wherecentral delivery is more established, we already see that
around 60% of our business is no longer serviced throughbranches. This allows our branches to focus on SMEs.
In HR Solutions, revenue continued to see solid growth. RPOshowed a solid performance, while revenue in MSP saw stronggrowth throughout the year. Payroll Services faced asignificant adverse impact due to the loss of a major contractwith the government (due to insourcing). With thetransformation of our European RPO/MSP business, wecontinue to see benefits, notably in the cross-border/multi-country growth of RPO and MSP.
Underlying EBITA margin improved from 4.6% to 4.7%.
Inhouse Servicesin millions of € 2016 2015 Organic ∆
Revenue 4,640.7 4,216.4 10%
EBITA 241.0 212.7 25%
EBITA margin 5.2% 5.0%
Revenue from Inhouse Services
Rev
enu
e In
ho
use
(x
€ m
illio
n)
% o
f total reven
ue
3,051.93,223.5
3,622.5
4,216.4
4,640.717.9
19.5
21.022.0 22.0
Revenue Inhouse Services Percentage of total revenue
2012 2013 2014 2015 20161,000.0
2,000.0
3,000.0
4,000.0
5,000.0
6,000.0
5.0%
10.0%
15.0%
20.0%
25.0%
Inhouse Services continued to see sound growth in 2016.Revenue grew by 10% to € 4.6 billion, as we continued toalign clients to the most appropriate delivery model.
The concept has grown significantly in recent years, andcontinues to perform well within the traditional large-client,large-volume, blue-collar manufacturing space. Growthcontinues to be supported by transfers from Staffing.However, we also see growth from clients entering directlyinto an Inhouse Services relationship.
In addition to the strong position we retain in the blue-collarmanufacturing segment, we also see opportunities for furthergrowth in white-collar staffing, and within those Professionalssegments where volume recruitment is evident.
performance by revenue category
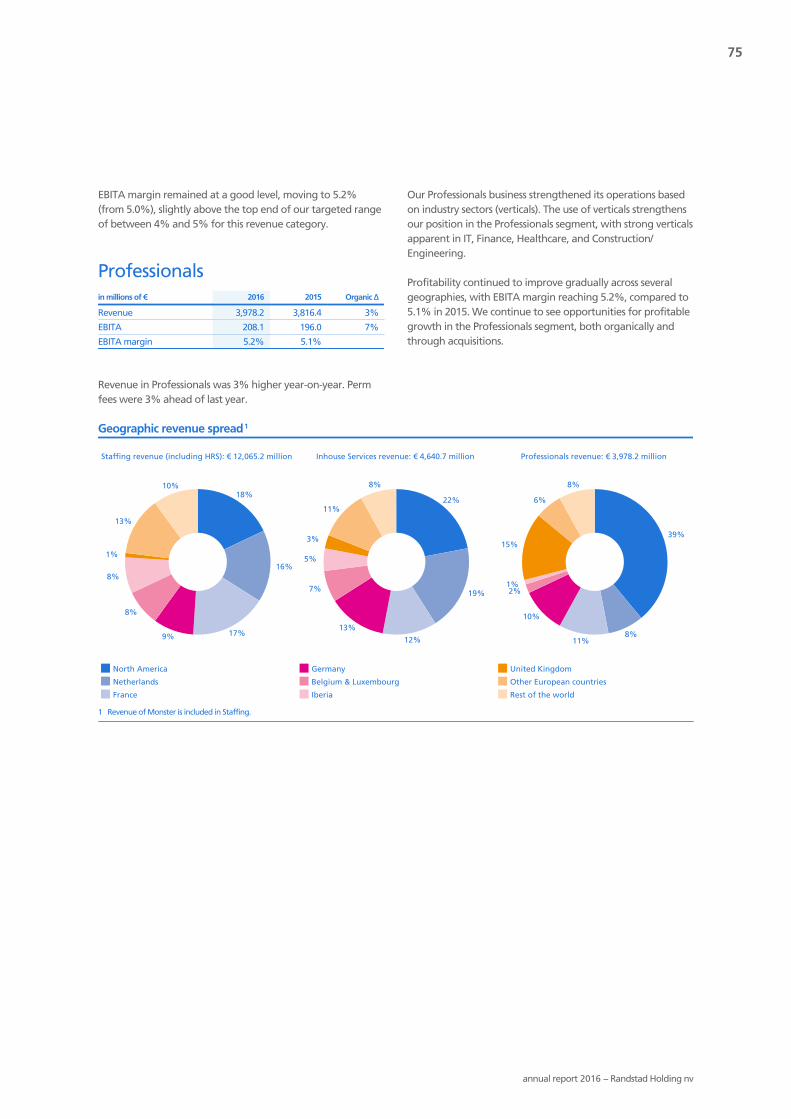
75
annual report 2016 − Randstad Holding nv
EBITA margin remained at a good level, moving to 5.2%(from 5.0%), slightly above the top end of our targeted rangeof between 4% and 5% for this revenue category.
Professionalsin millions of € 2016 2015 Organic ∆
Revenue 3,978.2 3,816.4 3%
EBITA 208.1 196.0 7%
EBITA margin 5.2% 5.1%
Revenue in Professionals was 3% higher year-on-year. Permfees were 3% ahead of last year.
Our Professionals business strengthened its operations basedon industry sectors (verticals). The use of verticals strengthensour position in the Professionals segment, with strong verticalsapparent in IT, Finance, Healthcare, and Construction/Engineering.
Profitability continued to improve gradually across severalgeographies, with EBITA margin reaching 5.2%, compared to5.1% in 2015. We continue to see opportunities for profitablegrowth in the Professionals segment, both organically andthrough acquisitions.
Geographic revenue spread1
Staffing revenue (including HRS): € 12,065.2 million Inhouse Services revenue: € 4,640.7 million Professionals revenue: € 3,978.2 million
18%
16%
17%9%
8%
8%
1%
13%
10%
22%
19%
12%
13%
7%
5%
3%
11%
8%
39%
8%11%
10%
2%1%
15%
6%
8%
North America Germany United Kingdom
Netherlands Belgium & Luxembourg Other European countries
France Iberia Rest of the world
1 Revenue of Monster is included in Staffing.

76
annual report 2016 − Randstad Holding nv
Investor Relations
Randstad Investor Relations' main goal is to safeguard our'financial brand'. Whereas clients and candidates recognizethe Randstad brand for its reliability and service quality,investors and analysts should recognize our brand for its openand transparent communication. Our aim is to be best in classin terms of disclosure and to provide insight into the strategicdirection of the business. These efforts should enable anaccurate valuation of Randstad shares over time.
Investor relations policyWe maintain an active, open and transparent dialogue withexisting and potential shareholders, as well as with analystsand banks. We organize road shows, attend investorconferences, and accommodate meeting requests whereverfeasible, as well as adhering to all legal obligations relating toconfidentiality.
We are committed to providing high-quality and timelyinformation to all stakeholders, while at the same timeensuring that the entire market has access to such information(including price-sensitive data). Our policy is that, wheneverpossible, we make a member of the Executive Board and/or arepresentative of the Investor Relations department availableto meet with investors. From time to time, we also involvecountry management and facilitate field trips.
Bilateral meetings and conference calls with analysts andactual or potential shareholders will not be held during'closed periods', which normally run from the end of a quarteruntil publication date. Our policy of holding bilateralmeetings with shareholders is set out in the corporategovernance section on our corporate website.
Dialogue with investors, analysts, and otherstakeholdersEach quarter, Randstad organizes conference calls to discussthe latest results. These events are broadcast online. Inaddition, we hold events to inform the markets on ourbusiness. In 2016, we held two fireside chats with sell-sideanalysts, where we provided an update on our recentoperational performance, strategy, and outlook.
In 2016, we continued to visit investors via roadshows andconferences. In total, we participated in 11 broker conferencesand held two Inhouse & Tech innovation demo days in bothFrance and the Netherlands. We also went on 40 roadshows inBelgium, Canada, China, France, Germany, Hong Kong, Italy,Ireland, Japan, the Nordics, Singapore, Spain, Switzerland, theNetherlands, the UK, and the US. In addition, a large numberof investor meetings were held at our head office in theNetherlands.
On March 31, 2016, we held our Annual General Meeting(AGM) of Shareholders. More information on the AGM,including key decisions and attendance, can be found in thesection 'Report of the Supervisory Board'.
Financial strategyIn 2016, we continued to focus on strong cash flowgeneration, while increasing our working capitalrequirements driven by M&A and the funding of our organicsales growth. As a result, the free cash flow decreased by 7%to € 465 million. We used our free cash flow to reduce our2016 debt, to pay a dividend, to acquire Proffice, ObiettivoLavoro, Careo, twago, and Monster Worldwide.
More information on our debt can be found in the 'Capitalstructure' section.
Capital structure
Invested capital amounted to € 4.9 billion, and we achievedreturn on invested capital of 15.9%, down from 18.8% lastyear. More information on and an analysis of invested capitalcan be found in the section 'Financial performance'.
Invested capitalin millions of €
2016 2015
Net debt 793.4 173.2
Total equity 4,140.8 3,861.7
4,934.2 4,034.9
Return on invested capital 15.9% 18.8%
DebtOur financing policy aims to secure financing that matches themid- to long-term financing requirements of the Group.During the year, we took the opportunity to extend our debtfacility on favorable terms for another year. The increase inworking capital requirements driven by M&A, as well as thefunding of our organic sales growth, drove our net debt up by€ 620.2 million over the year, which in turn increased ourleverage ratio (net debt/12-month EBITDA) to 0.8, well withinour targeted range of between 0 and 2, despite theacquisitions made in 2016. We consider being within thisrange important for continuity. We have maintained ourpolicy of using floating interest rates as a natural hedge
- Dividend: € 1.89 per share, 50%payout ratio
- Dividend yield: 3.7%- Diluted earnings per share,
underlying: € 3.75- Market capitalization at year-end:
€ 9,431.2 million
investor relations & share performanceinvestor relations & share performance

77
annual report 2016 − Randstad Holding nv
against the development of operational results, whichcontinued to pay off significantly during 2016.
Debtin millions of €
2016 2015
Total debt facility 1,920.0 1,800.0
Net debt 793.4 173.2
Leverage ratio 0.8 0.2
Total equityDuring 2016, the number of issued and outstanding ordinaryshares remained virtually stable compared to 2015 at 183million.
We aim to offset the dilutive effect of the performance shareplans through share repurchase programs. This policy will bepursued as long as the value of shares to be issued is below€ 25 million, and if higher, when our financial position allowsfor it. In January 2016, we repurchased around 297,000 shares.Between October 25, 2016 and February 13, 2017, we starteda share repurchase program to buy back around 763,000shares. We intend to neutralize the impact of the additional0.4 million share dilution in 2017, after February 14 (when weissue our FY 2016 results). This will be used for the allocationof shares under the performance share plans on February 14,2017.
Total equity
Numbers year-end
(in millions)
Nominal value
per share
2016 2015
Ordinary shares 183.0 183.0 € 0.10
Preference shares B 25.2 25.2 € 0.10
Preference shares C 50.1 50.1 € 0.10
Total number of shares 258.3 258.3
On March 31, 2016, the Annual General Meeting ofShareholders approved a proposal to pay a cash dividend of€ 1.68 per ordinary share.
On December 31, 2016, there were 50.1 million preferenceshares C in issue. The dividend yield on these shares is 5.8%.For preference shares B, there were 25.2 million shares inissue, with a dividend yield of 2.7%. We consider preferenceshares to be an attractive part of equity. It provides fullycommitted long-term capital at relatively low cost.
Voting rights on sharesThe ordinary shares have equal voting rights (one share, onevote). The voting rights on the preference shares B and C are
aligned with the historical capital contribution. This meansthat there are 3.6 million voting rights on preference shares Band 5.6 million voting rights on preference shares C.
Listing and indicesRandstad Holding is publicly listed on Euronext Amsterdam(ticker symbol RAND.AS), where Randstad shares and optionscan be traded. Randstad shares are also included in a numberof other indices, such as Euronext 100, Dow Jones StoxxEurope Sustainability, Dow Jones Sustainability World Index,Euronext Vigeo Benelux 20and the Euronext Vigeo Eurozone120. Inclusion in major indices is important, because itimproves visibility and liquidity.
Indicative free floatRandstad's free float amounts to approximately 60%. Themajority of the free float of ordinary shares is held outside theNetherlands. We actively pursue an international spread,reflected by 52% of shares held by Anglo-Saxon investors(2015: 51%). During 2016, French investment rose from 10%to 13% of free float. We estimate that in total approximately84% of our ordinary shares are held by institutional investors,while retail investors hold around 8%.
Indicative geographic spread of ordinary shares(free float)
2016
32%
20%14%
13%
20%
1%
North America Netherlands Other European countries
United Kingdom France Rest of the world
Major shareholdersA list of our major shareholders can be found in the report ofthe Supervisory Board under 'Legal transparency obligations'.
Value investors retain their position as the largest holders ofRandstad shares, comprising 33% of the free float. Growth-focused investors own 22% of the ordinary shares, with theremainder being held by alternative, index and yield investors.

78
annual report 2016 − Randstad Holding nv
LiquidityThe number of shares traded has risen substantially, from 86million in 2005 (mainly on Euronext) to about 560 million in2016 on various trading platforms, but mainly on Euronext.Velocity (measured as the total number of shares tradeddivided by the average number of shares outstanding) alsoplayed a role. Velocity increased significantly in the year,reflecting the increased volatility in the markets. Our velocitylevel implies that the average holding period is around four tosix months for the total number of outstanding shares, orapproximately two to four months for the free float.
Share volume traded and velocity1
Vo
lum
e tr
aded
(in
mill
ion
s)
Velo
city (%)
Volume traded (in millions) Velocity (%)
2012 2013 2014 2015 2016300
400
500
600
300%
350%
400%
450%
500%
550%
600%
1 Numbers of previous years were restated to include OTC (Over the CounterTrades).
Dividend policy on ordinary sharesWe continue to aim at a flexible payout ratio of 40% to 50%of net profit adjusted for amortization and impairment ofacquisition-related intangible assets and goodwill, integrationcosts, and one-offs, provided our financial position allows forit.
In 2016, we further enhanced our financial position. Inaddition, our business sustained growth throughout the year,and we improved profitability. As a result, and in line with ourdividend policy, we will propose to our shareholders an all-cash dividend of € 1.89 per ordinary share, based on a payoutof 50% (2015: 50%). The ex-dividend date will be April 3,2017. The number of shares entitled to dividend will bedetermined on April 4, 2017 (record date). The payment ofcash dividend will take place on April 7, 2017.
We will also propose a dividend payment on preferenceshares B and C of € 12.6 million.
We aim to amend our dividend policy going forward. We willpropose an all-cash dividend when our leverage ratio is below1.0. We will offer an optional dividend (cash or stock) whenour leverage ratio is between 1.0 and 2.0, while proposing anoptional dividend with a premium on stock dividend whenour leverage ratio is between 2.0 and 2.5. We will continue to
offer a stock dividend when our leverage ratio is above 2.5.We will also continue to aim at a flexible payout ratio of 40%to 50% of net profit, adjusted for amortization andimpairment of acquisition-related intangible assets andgoodwill, integration costs and one-offs, provided that ourfinancial position allows for it.
Per share data
2016 2015 2014 2013 2012
Dividend (€) 1.89 1.68 1.29 0.95 1.25
Dividend yield (%) 3.7 2.9 3.2 2.0 4.5
Payout (%) 50 50 50 45 59
Basic EPS (€) 1 3.77 3.35 2.57 2.09 2.13
Diluted EPS (€)1 3.75 3.32 2.54 2.07 2.11
EBITA (€) 2 5.18 4.74 3.92 3.26 3.25
Free cash flow (€) 2.54 2.75 2.66 1.65 2.69
Equity (€) 22.66 21.25 18.28 16.40 15.741 Before amortization and impairment of acquisition-related intangible assets and
goodwill, badwill (2013 only), integration costs, and one-offs.2 Underlying.
Share performance
Share price developmentThe share price ended the year 2016 at € 51.53, which was10% lower than the 2015 closing price of € 57.53. In April, adividend of € 1.68 per ordinary share was paid out. As a result,the total shareholder return (TSR) for 2016 was −8%.
In the first half of the year, the share price declined from€ 57.53 to € 36.16, reaching a low point of € 32.58 amidst theuncertainty surrounding Brexit. In the second half of the year,the share price rebounded to a high of € 52.64, ultimatelyending the year at € 51.53, 43% above the low point, asmacroeconomic expectations raised.
Share price developmentin millions of €, unless otherwise indicated
2016 2015 2014 2013 2012
Closing price (€) 51.53 57.53 40.06 47.15 27.81
TSR (%) (8) 47 (12) 74 27
High (€) 57.53 64.92 49.54 47.15 30.09
Low (€) 32.58 38.37 31.40 27.81 20.52
P/E ratio 13.7 17.3 15.8 22.8 13.2
EV/Sales 0.49 0.56 0.44 0.55 0.34
Market capitalization 9,431.2 10,529.1 7,215.2 8,366.0 4,785.3
Enterprise value 10,224.6 10,702.3 7,637.2 9,127.0 5,881.0
investor relations & share performance
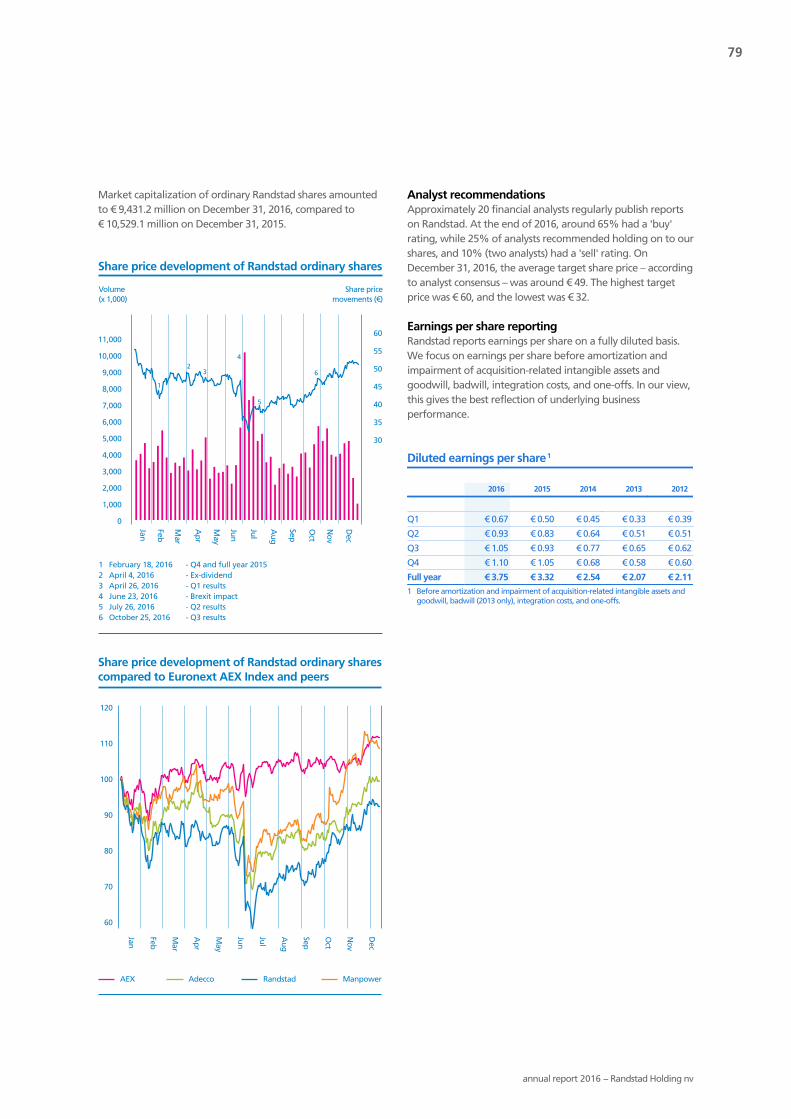
79
annual report 2016 − Randstad Holding nv
Market capitalization of ordinary Randstad shares amountedto € 9,431.2 million on December 31, 2016, compared to€ 10,529.1 million on December 31, 2015.
Share price development of Randstad ordinary shares
11,000
10,000
9,000
8,000
7,000
6,000
5,000
4,000
3,000
2,000
1,000
0
1 February 18, 2016 - Q4 and full year 2015
2 April 4, 2016 - Ex-dividend
3 April 26, 2016 - Q1 results
4 June 23, 2016 - Brexit impact
5 July 26, 2016 - Q2 results
6 October 25, 2016 - Q3 results
Volume
(x 1,000)
Share price
movements (€)
1
23
4
6
60
55
50
45
40
35
30
5
Share price development of Randstad ordinary shares compared to Euronext AEX Index and peers
AEX Adecco Randstad Manpower
Dec
No
v
Oct
Sep
Au
g
Jul
Jun
May
Ap
r
Mar
Feb
Jan
120
110
100
90
80
70
60
Analyst recommendationsApproximately 20 financial analysts regularly publish reportson Randstad. At the end of 2016, around 65% had a 'buy'rating, while 25% of analysts recommended holding on to ourshares, and 10% (two analysts) had a 'sell' rating. OnDecember 31, 2016, the average target share price – accordingto analyst consensus – was around € 49. The highest targetprice was € 60, and the lowest was € 32.
Earnings per share reportingRandstad reports earnings per share on a fully diluted basis.We focus on earnings per share before amortization andimpairment of acquisition-related intangible assets andgoodwill, badwill, integration costs, and one-offs. In our view,this gives the best reflection of underlying businessperformance.
Diluted earnings per share1
2016 2015 2014 2013 2012
Q1 € 0.67 € 0.50 € 0.45 € 0.33 € 0.39
Q2 € 0.93 € 0.83 € 0.64 € 0.51 € 0.51
Q3 € 1.05 € 0.93 € 0.77 € 0.65 € 0.62
Q4 € 1.10 € 1.05 € 0.68 € 0.58 € 0.60
Full year € 3.75 € 3.32 € 2.54 € 2.07 € 2.111 Before amortization and impairment of acquisition-related intangible assets and
goodwill, badwill (2013 only), integration costs, and one-offs.

80
annual report 2016 − Randstad Holding nv
Introduction
As part of our long-term value creation, risk and opportunitymanagement is embedded in our strategy and is essential forachieving our targets. Entrepreneurship is actively stimulatedthroughout the organization, and we encourage people toidentify and seize opportunities. At the same time, wecounterbalance this with clear risk boundaries, which are setfor operating companies in various policies and agreed inbudgets. Our risk management practices, key controlframework and internal audits contribute to a balancedapproach.
This section provides a high-level description of our Risk &Control framework and its effectiveness, substantiating ourRisk & Control statement. We elaborate on the variouselements that together make up our Risk & Controlframework, and describe how we manage our company inthis regard.
Risk profile
Our risk profile is closely determined by our geographiccoverage. We have wide geographic coverage, which meansour exposure is spread across both mature and emergingmarkets, which are experiencing a variety of economicconditions and varying stages of regulatory development.These conditions are very relevant to developments in ourmarkets. Since it remains extremely difficult to predict futureeconomic and legislative developments successfully, we focuson responding to actual performance in all of our localmarkets. Our business model, our processes, and our weeklyindicators help to ensure that we are flexible enough toquickly respond to growth or decline in our markets. Wecontinuously and closely monitor key risks and opportunities,both locally and centrally, and respond appropriately to anyemerging risks.
Missing out on opportunities can also result in a loss. Wetherefore focus on replicating successful concepts and bestpractices across the Group. Our Tech & Touch strategy meansthat our business models will change and possibly disruptmarkets, and with that our risk profile will shift. For example,in the future, RiseSmart will strengthen our resilience toeconomic cycle downturns, and with the acquisition ofMonster Worldwide we have entered into new technologicalbusiness areas. We concentrate innovation in those parts ofour organization where success is most likely. In addition, wehave a dedicated entity, the Randstad Innovation Fund, tosecure access to external innovation.
Risk & Control managementapproach
We manage our risks and opportunities according to localcircumstances. We operate in many markets around theworld, and this requires a flexible approach to risk andopportunity management. Our global Risk & Controlframework is flexible and customized to local circumstances.Factors that we consider in our Risk & Control frameworkinclude the size, service offering, and local regulatory andmarket environment of each operating company.
Risk appetite
Our risk appetite is derived from our strategy and priorities,and is broken down into four risk areas:- Strategic: We allow for strategic and M&A risks in the
pursuit of long-term value creation and profitable growth,as well as risks following changes in our business mix inboth mature and emerging markets. Given the volatility ofthe markets and economic climates in which we operate,the adaptability of our people, our service offering, andour infrastructure plays a key part in enabling us toidentify and seize opportunities.
- Operational: We take a balanced approach to operationalrisk, mainly related to increased productivity in the field,which means that we consider both the risk and thereward of key business decisions.
- Financing & Reporting: We maintain a prudent financingstrategy, even when undertaking major acquisitions, andtherefore take calculated risks in this area. Only minimumrisk is accepted in relation to errors in our reporting.
- Compliance: We consider adherence to laws, regulations,and agreements to be fundamental in enabling us toprovide our candidates, our clients, and our people with
Global risk &
control framework
Risk appetite
Locally tailored
approach
Risk & Control management approach
risk & opportunity managementrisk & opportunity management

81
annual report 2016 − Randstad Holding nv
quality services. Compliance is strongly embedded in theculture of our company. We therefore take a strictapproach to breaches of our core values and businessprinciples.
The table titled 'Sensitivity analysis' illustrates the impact ofthe various changes and trends on our revenue, gross margin,operating expenses, and currency and interest rates on ourEBITA. Typically, a trend will include a number of theseelements. Overall, given the current growth trend, we aim toachieve an incremental conversion ratio of 50% (see 'Activity-based field steering' for more details).
Risk & Control framework
Our global Risk & Control framework is designed to secure theGroup's in-control position. The components provide Group-wide comfort in terms of control, while giving the flexibility toadapt to the local business environment and enablingentrepreneurship. The components of the framework areshown in the Risk & Control framework diagram. Our Risk &Control framework is based on the COSO internal controlframework, complemented with elements from variousmanagement and control models.
To avoid surprises, operating companies and Holdingdepartments assess, on at least a semi-annual basis, thecomponents of the Risk & Control framework. The results ofthis assessment are reported to the Group Business Risk &Audit department, and possible improvements are discussedwith local management and the responsible Executive Boardmember. Internal audits are executed to evaluate these self-assessments. Every six months, the department reports to theExecutive Board and the Audit Committee on the state of thein-control situation in the Group. The Executive Board and
Audit Committee set priorities and provide guidance tofurther enhance control throughout the Group.
Tone at the top and cultureThe tone at the top is derived from our core values, which areembedded in our leadership style. The tone at the topdetermines our culture. Randstad benefits from strongleadership, built up over 56 years. We have been able toextensively develop management by example, based on ourcore values and business principles.
Our core values are embodied in 16 business principles, whichform the basis for the behavior we expect from all ouremployees. The Executive Board secures alignment of the toneat the top among senior management, while seniormanagement ensures alignment among staff in our operatingcompanies. This alignment exercise is a continuous effort anddrives our company’s culture.
Upon joining our company, our employees receive a copy ofand training in the business principles and acknowledge thatthey will comply with them. Periodic refresher courses are alsoin place. These courses also form a crucial part of our strategywith regard to integrating acquired companies.
A misconduct reporting procedure is in place, which enablespeople to report any suspicion they have of wrongdoing via asecure phone line or website. In 2016, we received 174complaints, 47 of which were anonymous. These complaintswere assessed and investigated where necessary by the localintegrity officers and/or the central integrity officer, togetherwith the Group Business Risk & Audit department. Whendeemed necessary, disciplinary actions and mitigating controlswere put in place.
Sensitivity analysis
Change Impact On Assumption FY 2016
Revenue +/-1% +/- € 39 million EBITA Flat gross margin and no change to cost base
Revenue +1% + € 20 million EBITA Flat gross margin and target 50% conversion (ICR)
Revenue (1%) - € 20 million EBITA Flat gross margin and target 50% recovery (RR)
Gross margin +/-0.1% +/- € 21 million EBITA Flat revenue and no change to cost base
Gross margin +0.1% + € 10 million EBITA Flat revenue and target 50% conversion (ICR)
Gross margin (0.1%) - € 10 million EBITA Flat revenue and target 50% recovery (RR)
Operating expenses +/-1% +/- € 30 million EBITA
USD +/-10% +/- € 24 million EBITA Stable revenue and margin in US
GBP +/-10% +/- € 2 million EBITA Stable revenue and margin in UK
JPY +/-10% +/- € 3 million EBITA Stable revenue and margin in Japan
Interest rate +100 bp + € 5 million Financial charges Average net debt 2016
Net debt +/- € 200 million +/- € 1 million Financial charges Stable interest rates

82
annual report 2016 − Randstad Holding nv
Each year, our Great People Survey is carried out by anexternal provider. This allows us to monitor the engagementof our employees, and provides indicators of the tone at thetop in each of the operating companies and at the headoffice. Based on the results, action plans are initiated. TheGreat People Survey is reviewed by Group HR, the ExecutiveBoard and various management layers. The results are takeninto account in appraisal discussions, as well as in setting ourmanagers' bonus targets.
Performance managementPerformance management is at the heart of our organization.The two-year plans and rolling forecasts of our operatingcompanies are set in accordance with strategic priorities andmarket trends. While setting their budgets for the year aheadin relation to their plan, operating companies also describetheir main risks and opportunities. This is particularlyimportant given the significant uncertainties most of ouroperating companies face. By constructing various scenariosand thanks to our flexibility, we are able to prepare for andreact to market volatility. Monthly rolling forecasts andincremental conversion ratio monitoring are used to enable usto make rapid adjustments to our cost base if necessary.
Our operating companies report various performanceindicators on financial results, underlying process activities,and people. By setting reporting dates, performanceindicators, and formats, as well as including risk andopportunity in our quarterly management reporting pack, weprovide clarity that enables us to plan ahead, withoutdisrupting our focus on day-to-day activities. By further
combining this planning and control cycle with our focus onactivity-based field steering, our monitoring systems haveimproved, giving more depth to discussions in the businessreview meetings. See the section 'How we measureperformance' for more details.
Our Group Corporate Sustainability Reporting guidelinesprescribe detailed performance indicators. In 2016, reviewswere performed for some selected sustainability indicatorsreported. These regular performance discussions on all levelshelp us adapt our Risk & Control framework to dynamic localcircumstances.
Concepts and best practicesOur client and candidate services concepts and best practicesdetermine our way of working. Our strong concepts, asdescribed in the section 'Value for our clients and candidates',provide best practices for our core commercial operations. Ourconcepts are tailored to local practices and market conditions.Concept reviews are carried out to identify, understand, andremediate deviations to ensure our objectives are realized.
Blueprints describe our operational best practices. They areused to govern our key processes and to enable our localoperations to adapt and tailor best practices to their needs.We have implemented a contract-to-cash and procurement-to-pay blueprint in all our country organizations. Theseinclude authorization procedures for sales pricing and clientcontracting, as well as purchasing and mandatory usage ofour supplier code. In addition, a financial close processblueprint has been implemented in all operating companies.
The tone at the top is derived from our core values, which are embedded in our leadership style
Reviews and audits give us comfort that our risk & control objectives are realized
Risk & Control framework
Performance management
steers our organization
Risk & control activities
secure our in-control position
MatchCandidate service concepts and
best practices determine our
way of working
Client service concepts and
best practices determine our
way of working
risk & opportunity management

83
annual report 2016 − Randstad Holding nv
This blueprint is relevant for all historical financial and non-financial information, including the income statement,balance sheet, cash flow statement, and disclosures.
We have an extensive framework of Group policies that covercompliance in multiple areas. These include our FinanceManual; Competition Compliance Policy; Discrimination,Intimidation & Harassment Policy; Bribery, Gifts & HospitalityPolicy; Data Protection Policy; and Information Security Policy.In 2016, a global Health & Safety Policy was rolled out toenhance global standardization. In addition, the DataProtection Policy and the Information Security Policy werefurther upgraded. Our policies are derived from best practicesidentified. Group policies are communicated throughout theGroup in various ways. The Approval & InformationRequirements Policy specifies events that either need to beapproved by, or reported to, the Executive Board.
Risk & Control activitiesRisk & Control activities secure our in-control position. Ouroperating companies compile risk registers semi-annually, andlegal risk registers annually. These show the local business risksand opportunities they may be exposed to, together withaction plans and deadlines to address them. The risk registersare drawn up using input from Risk & Control roundtablesthat are held at least twice a year in most operatingcompanies. The aggregated data enables us to get insight intothe most important risks impacting the Group. These arediscussed twice a year by the Executive Board and by theAudit Committee.
Our key control framework contains a concise list of keyoperational, compliance and financial risks and practicalcontrol activities to guide all operating companies. Thestructure of the key control framework is organized aroundRandstad's core process: the 'funnel'. Every six months,operating companies perform self-assessments with regard tothe relevant controls. The results of these control self-assessments are subsequently challenged by the GroupBusiness Risk & Audit department and tested on a risk basis.Where necessary, Business Risk & Audit staff help local
operating companies to improve their processes, controls andpractices.
The key control framework is updated annually, using controlexperiences and best practices from around ten differentoperating companies. In 2016, a fraud risk assessment wasperformed to further upgrade the key control framework.These updates have led to a renewed management focus oninternal control, as well as an improved control situationthroughout the Group and a more focused and adapted setof controls. By implementing web-based tooling for the keycontrol framework, we are able to systematically and closelymonitor the adequacy of our Risk & Control framework.
Our insurance risk program follows the same principles as ourglobal Risk & Control framework. Insurable risks areperiodically assessed, and Group-wide risks are either retainedor transferred to the insurance market under our global orlocal insurance programs. We regularly review insurable risksand our insurance policy coverage, as well as the credit ratingsof our insurers.
Reviews and auditsReviews and audits reassure us that our Risk & Controlobjectives are being realized.
The semi-annual Risk & Control framework assessments onoperating company level lead to a Group-wide in-controlbenchmark discussion in meetings of both the Executive Boardand the Audit Committee. In these discussions, Risk & Controlpriorities are set, and the Group Business Risk & Audit plan isupdated and agreed. The annual Group Business Risk & Auditplan is risk-based. The Executive Board identified five focusareas for 2016: candidate screening; client contractmanagement and liabilities; payroll; data privacy andinformation security; and pricing processes. The resulting auditplan led to the coverage of key financial line items in theGroup consolidated financial statements, such as revenue, costof sales, salary costs, internal personnel expenses, accountsreceivable, and accruals.
Putting the framework into practice
Framework component Practical applications to our business
Tone at the top Core values and business
principles
Onboarding training Great People Survey Misconduct reporting
procedure
Performance management Strategic plan and rolling
forecast
Scenarios and conversion
ratio monitoring
Planning, reporting and
review cycles and activity-
based field steering (ABFS)
Business review meetings
Concepts and best practices Strong concepts
(commercial best practices)
Corporate policies and
procedures
Blueprints (operational
best practices)
Authorization levels
Risk & Control activities Risk register Key control framework Risk & Control round tables Global insurance program
Reviews and audits Semi-annual Risk & Control
framework assessments
In-control benchmarks Internal audits In-control statement for
each operating company

84
annual report 2016 − Randstad Holding nv
Processes covered by internal audits, including the related assets and liabilities
Other not covered by internal audits EBITA
Audit coverage of key financial line items
Internal staff costs
Cost of sales - salary cost
Revenue
The Group Business Risk & Audit department leads theinternal audits and collaborates closely with other corporatedepartments (most commonly Legal and Tax) and the localRisk & Audit managers to cover the key risks. Findings andrecommendations from the audits are discussed with theoperating companies. Local management is responsible forsetting action plans and deadlines and allocatingresponsibilities. The progress of the action plans is monitoredby management, by the Business Risk & Audit network, andby the Executive Board members. The internal audit reportsare submitted to the Executive Board member responsible andto our CFO.
In 2016, Group Business Risk & Audit rolled out an internalaudit manual, which is aligned with global professionalstandards. In addition, new standard audit programs wereintroduced, such as the pricing audit program, which wasrolled out in several countries.
The global Business Risk & Audit staff network provides aplatform for sharing best practices, and is a sounding boardfor emerging opportunities, risks, and possible internal controlgaps. The network consists of a cross-disciplinary team withBusiness Risk & Audit staff from the operating companies andthe Group Business Risk & Audit department. Where needed,experts are involved in audits. For additional reassurance, BDOhas been engaged to perform financial audits in multiplecountries.
In 2016, we detected a few cases of fraud, involving, forexample, the recording of non-existent permanent
placements, and the payment of fictitious flexworkers. Thesefraud cases were investigated and, in cooperation with localmanagement, corrective action was taken. These casesinvolved small amounts of money and had no material impacton the results of the Group. All cases have been widelycommunicated and were used to create awareness andimprove fraud prevention.
Operating companies submit their in-control statement semi-annually. This statement certifies that the corporate policieshave been complied with and explains any exceptions ordeviations that have occurred. The statement forms acascaded certification, which assists the Executive Board indetermining our in-control situation as required by the DutchFinancial Supervision Act.
Deloitte has been appointed to act as our external auditorfrom 2015 onwards. In their audit plan, Deloitte covers allfinancially significant operations. As such, these audits are animportant supplement to our own review and audit activities.
The Audit Committee is informed about the results of bothexternal and internal audits. The role of the Audit Committeeincludes monitoring the risk management and controlsystems, the quality of the financial information, and thefollow-up of recommendations made as a result of the audits.More information can be found in the Report of theSupervisory Board and in the section 'Corporate governance'
Our main risks
Our main risks are those that threaten the achievement of theGroup’s objectives as well as the in-control positionof the Group over the next three years. The general riskprofile has not changed significantly since last year.Continuous effort is required to address evolving strategic andcompliance risks.
The first table hereafter depicts the main risks as identified(categorized into four areas: Strategic,Operational, Financial & Reporting, and Compliance) thatcould prevent us from realizing our financial and non-financialstrategic targets, as well as how we address these risksthrough the six building blocks of our strategic road map.
The second table provides a more detailed description of themain risks in 2016, where key risks are in bold, including theactions taken to mitigate these risks and any relatedopportunities. This list should not be considered exhaustive.
risk & opportunity management

85
annual report 2016 − Randstad Holding nv
Our risks related to our strategic targets
Strategic OperationalFinancial &Reporting Compliance
Stra
tegi
c ro
adm
apbu
ildin
g bl
ocks
1
Ada
ptin
g to
eco
nom
ican
d m
arke
t con
ditio
ns2
Prot
ectin
g ou
rre
puta
tion
Incr
ease
d co
mpl
exity
o f la
ws
and
regu
latio
ns2
Info
rmat
ion
secu
rity,
syst
em d
evel
opm
ent
and
inte
grat
ion,
ITou
tsou
rcin
g2
Busi
ness
con
tinui
tyan
d da
ta re
cove
ry
Tale
nt a
ttra
ctio
nan
d re
tent
ion
Cont
ract
liab
ility
2
Cred
it ris
k
Com
petit
ion
l aw
com
plia
nce
Tax
and
labo
rl a
w c
ompl
ianc
e2
Dat
a pr
otec
tion2
Cand
idat
esc
reen
ing
ABFS V V V V V V V V V
Org V V V V V V V V V V V
TTA V V V V V V V
Talent V V
Tech V V V V V V V
M&A V V V V1 Activity-based field steering, organizational, total talent architecture, talent management, HR technology, and mergers and acquisitions.2 Main risks in both 2016 and 2015.
Strategic risks Risk-mitigating actions Related opportunities
Adapting to economic conditionsOur operations are highly susceptible tomacroeconomic volatility. Although wesee economic improvement in somecountries, we continue to focus on theflexibility of our cost base. Not beingflexible enough to respond timely tochanging economic conditions couldhave a negative impact on theprofitability of the Group. Conversely,cutting costs too much could limit ourability to take advantage of a marketupturn.In addition, the business landscape ischanging, with new technologies beingdeveloped that over time may displaceour traditional business services.
Our geographical diversity and the spread of the Group'srevenues across mature and emerging markets have helped usto mitigate the impact of volatile economic conditionsworldwide.By 'managing through the cycle', we provide operatingcompanies with guidelines on how to react to changes ineconomic conditions. These guidelines are described in thesection ‘Performance’.With our Tech & Touch strategy, we are transforming ourbusiness models to stay ahead of disruptive developments. OurRandstad Innovation Fund invests in HR-technology companiesto increase our agility. Our organizational strategic goal containsvarious actions to further prepare Randstad for market dynamicsas explained in our strategic priorities.
With our strong concepts and varied service offerings,we can respond appropriately to different marketconditions, and thus address changing macro-economicconditions.Our operations respond differently to economicuncertainty in the market. For example, in an uncertainmarket, our clients tend to use more temporary workersrather than hire permanent staff. Staffing and HRSolutions tend to be more resilient to a weaker market,with Professionals tending to perform better in astronger market.With timely transformation of our organization andinvestment in HR technologies, there will beopportunities for innovative solutions to make HRservices more efficient and bring fresh answers to futureHR challenges. In this, we strive to be disruptive vis-à-visthe established practices in the HR services sector.
Protecting our reputationRandstad and Tempo-Team are valuableinternational brands, and the Randstadbrand is used in all countries in whichwe operate. Damage to the Randstad orTempo-Team brand in one countrycould have a serious impact on ourglobal reputation.
We protect the strong reputation of our brands by ensuring thatall our people adhere to our core values and business principles,and comply with our policies and guidelines. When necessary,we react promptly, using internal and external communicationsto mitigate potential damage. We use our Net Promoter Scoreas a metric to measure our image. We also have a misconductreporting procedure, so that our people and stakeholders canreport any complaints or breaches of compliance.
Our brands are managed centrally, which ensuresconsistency across the world and increases costefficiency. Locally targeted marketing is applied by theoperating companies. This will continue to strengthenthe global recognition of our brands in a cost-effectivemanner.
Increased complexity of laws andregulationsThe complexity and quantity of lawsand regulations have increased over theyears, especially with respect to dataprotection, competition, staffing (e.g.,equal pay), outsourcing, and payrollingservices. Consequently, we are exposedto greater risk of non-compliance,which could result in class actions,claims, and fines or reputationaldamage.
In all our major operations worldwide, we have in-house legalteams who help management comply with local laws andlegislation. Semi-annually, the in-house legal counsels of thelargest operating companies get together, and once a year alegal conference is organized for all in-house legal counsels,with the aim of sharing knowledge, and developing andimproving standards.If we are affected by new laws and regulations (e.g., EU dataprotection regulation), project teams with Legal, Risk & Audit, ITstaff, and other experts are formed to anticipate the effects,provide training, and ensure that proper processes and controlsare embedded in our local organizations.
New laws bring administrative burden and risk to ourclients, which creates an opportunity for new serviceofferings for us and establish ourselves as thoughtleaders. The new regulations require a critical review ofexisting training, systems, policies, and procedures tokeep these processes and documents up to date andtopical.
Our knowledge of new legislation (e.g., staffing laws,EU data protection regulation) can be shared with ourclients, strengthening our relationship with them.

86
annual report 2016 − Randstad Holding nv
Operational risks Risk-mitigating actions Related opportunities
Contract liabilityFor contract liability, especially in Anglo-Saxoncountries, clients ask us to take a greater shareof the liability for our flex-workers while on theirpremises and under their supervision.Requirements from clients may vary, resulting inunique contract clauses.
Accepting inappropriately high contractualliability could result in a client making a claimthat would materially affect the Group’s results.
Whenever possible, we work with standard contracts. In the case of non-standard terms, a cost-benefit analysis is carried out to determine whetherprojected revenue or profit levels are high enough to absorb the costsassociated with the additional risks. The local legal department reviews thecontract and the risk and reward assessment with management, after whichmanagement decides whether to accept the contract. In certain cases,additional approvals from the Executive Board are required, as set out in thecontract liability policy. This risk mitigation is coupled with insurance.
We focus on further improvement of our contract delivery models andcontract management to ensure proper services delivery. In addition, periodiccompliance reviews are being conducted.
Improvement in contractmanagement and quality ofservices will add value for ourclients by improving our servicedelivery models, performance andpractices.
Information security, system development andintegration, IT outsourcingThe continuous integration of technology withinand outside the business, and increasedengagement of third-party IT vendors potentiallyexpose us to high-level IT security risks. Thiscould lead to a system outage, as well asleakages of candidate or employee personaldata and company-sensitive information, whichwould pose significant financial and reputationalrisks.
We continuously strengthen IT controls and compliance by improving our ITcontrol frameworks, including IT security and general IT controls. This isintegrated in our information security policies. In addition, awareness activitiesare rolled out to increase employees' awareness of IT security risks.
We perform IT audits to ensure our IT controls are up to date and effective inall our countries. For these audits, the scope and frameworks applied areperiodically updated to align with the latest technological and organizationaldevelopments. Audits cover security penetration testing, access controls andsegregation of duties, third-party reliance and assurance, and general ITcontrols. On a business process level, the effectiveness of automated controlsis audited.
In addition, continuous attention is given to significant IT projects andprograms through reviews and audits.
Improvements in system securitygive us the opportunity to ensuredata protection for all ourcandidates and clients, thusincreasing the value of our serviceoffering for them and enhancingour reputation.
Business continuity and data recoverySerious business disruption of IT systems couldresult in financial losses, fines, and damage toour reputation. For example, our business entailspaying flex-workers on a weekly or monthlybasis, and then billing these amounts to ourclients. A problem with one of our IT systems forpayrolling and billing could cause major businessdisruptions.
We have local IT systems in each country for payrolling and billing. Thisspreads our risks of an IT failure, which would be limited to one country oroperating company.
Per policy, on a country level, disaster recovery plans are in place or are beingdeveloped to address possible IT failures, and are tested at least once a year.Group IT has centralized the IT infrastructure with a professional IT serviceprovider. This will also further improve business continuity and data recovery.
In several countries, we haveshared service centers and we areinitiating cloud infrastructureusage. Besides increasedefficiency, this further improvesthe quality of business continuityplanning by concentratingexpertise, as well as resulting incost reduction in the mid to longterm.
Attraction and retention of talentPeople are our most important asset, and it ischallenging to retain them in a competitivemarket. If we cannot attract and retain the rightpeople, we could fail to achieve our objectives.
Retention rates are analyzed and reported by every operating company on amonthly basis. Our Great People Survey is carried out annually to monitorengagement levels at each operating company and each department. Timelyaction is taken by local and Group HR departments to investigate and addressany negative trends.
We provide training for the purposes of coaching and developing our people.In addition, we identify our future leaders and provide managementdevelopment programs for those with high potential.
Our reward systems, which are tailored to local market conditions, includebonuses and employee share purchase plans, among other things. Wemonitor our employer brand and initiate local programs to attract talent.
It is our rule to fill 80% ofmanagement positions throughinternal promotions. This increasesthe loyalty of our people. As aresult, we will continue to have apipeline of talent who understandour people, our candidates,clients, and our operations.
risk & opportunity management

87
annual report 2016 − Randstad Holding nv
Financial & Reporting risks Risk-mitigating activities Related opportunities
Credit riskSome clients try to delay payment of invoices.An increase of just one day in the time taken tocollect the receivable (days sales outstanding orDSO) leads to greater usage of operatingworking capital and increased interest costs.
Invoicing and credit control policies and best practices areincluded in our blueprints. Operating companies have anoperating working capital charge included in their results, whichhighlights awareness throughout the Group of the cost ofcapital. DSO is a component of the budgets and performancetargets of operating company management. In addition, aprovision is made for all receivables older than 182 days.
Compliance with the contract-to-cash blueprint is monitored bythe Group Business Risk & Audit department. Further details oncredit risk are provided in note 3 to the financial statements:'Capital and financial risk management'. An improvingeconomy generally reduces credit risk.
As more best practices are implemented acrossour operating companies in the contract-to-cash cycle, our approach to credit risk becomesmore rigorous, resulting in a relatively low DSOand a correspondingly lower operating workingcapital need.
Compliance risks Risk-mitigating actions Related opportunities
Data protection laws and regulationsIncreased integration of business withtechnology in both front and back-offices, aswell as recent and upcoming (European)legislative focus on personal data protectionhave increased the likelihood of litigation orregulatory action in the event of leakages ofcandidate or employee personal data andcompany-sensitive information. This posessignificant financial and reputational risks.
Our Group Data Protection Policy has been localized for alloperating companies. In 2015, a Data Protection Officer wasappointed and a global program started to prepare ouroperations for the upcoming European General Data ProtectionRegulation, which is scheduled to come into force in 2018. Thisprogram is continuing and making good progress.
Improvement in system security gives us theopportunity to ensure data protection for allour candidates and clients, and so increase thevalue of our service offering for them.
Competition law complianceOur staff may breach competition law byintentionally or accidentally sharing informationwith competitors. This could result in materialfines or penalties, or litigation with clients, whichcould harm our brand.
On July 10, 2013, the French Competition LawAuthorities started an investigation intoRandstad France and a number of competitors.The investigation related to certain Frenchoperations and, in particular, activitiesconcerning vendor- neutral platforms relating toHR outsourcing management are ongoing.
Training with regard to competition law compliance, our corevalues and our business principles forms an integral part of ouronboarding program, and management needs to ensure thatwritten acknowledgement is obtained that such training hasbeen understood and compliance is observed. We encourageour employees to report any breaches they find through themisconduct reporting procedure. When developing newbusiness models or concepts, our Legal department (and ifnecessary competition law experts) is consulted to ensure legalcompliance.
Randstad France is cooperating closely with the FrenchCompetition Law Authorities in relation to their investigation.Consistent with Randstad's core values and business principles,we seek to conduct our business in accordance with allapplicable laws, and have invested considerable time andresources in improving competition controls and awareness inour French operation and in abiding by the commitments givento the authorities, following a previous investigation in France(which concluded in 2009). We are confident that the outcomeof the present investigation will be positive.
Tax and labor law complianceComplex and changing labor, tax and socialsecurity regulations could lead to a lack of clarityand errors in wage, social security and payroll taxcompliance, leading to possible disputes, claimsand fines.
The payroll calculation process and actual calculation is subjectto an independent periodic review by Group Tax. Where laborlegislation is unclear, we monitor market developmentsregarding similar cases, as well as reviewing our existing policiesand procedures. Group Tax together with GBR&A performregular payroll and payroll system audits in selected countries inorder to review compliance with local laws and regulations.
In our payroll compliance audits, we also focuson identifying best practices to increaseefficiencies in administering payroll taxes andsocial security.
Candidate screeningPart of our services includes the screening ofcandidates as required by client contracts andlocal guidelines. If we fail to fulfill theserequirements, we may face legal claims.
In the past, deficiencies in the screening of candidates werenoted in various situations. In response, we tightened control inthis area. Risk-based audits are carried out annually andcandidate screening has become a permanent priority on theagenda of our operating companies.
We are continuously developing and sharingour best practices for candidate screeningacross the Group. Through our increasinglyrigorous approach to such matters, we will beable to demonstrate to clients the consistentlyhigh quality of our candidates.

88
annual report 2016 − Randstad Holding nv
Emerging risks
While we focus on managing existing key risks, we are alsokeenly aware of imminent emerging risks (and opportunities)that can significantly impact us. For example, emergingtechnological developments pose risks we have incorporatedin our Tech & Touch strategy. In addition, heightened politicaluncertainty could impact our fiscal and monetary policies,which we need to anticipate. Our local-for-local approachallows for timely adoption of new business models ifnecessary. Finally, large-scale involuntary migration couldincrease the pool of available talent, but also necessitatesmore stringent candidate screening. We need to showresilience to this risk by improving our internal processes.
Conclusions
The Executive Board is responsible for Randstad’s Risk &Control framework and for reviewing its effectiveness. Theframework, as described earlier, is designed to manage therisks that may prevent us from achieving our businessobjectives. However, the framework cannot provide fullassurance that all material misstatements, cases of fraud, orviolations of laws and regulations will be prevented. Futureeffectiveness of the framework is subject to the risk that thecontrols in place or the degree of compliance with the Group'spolicies and procedures may deteriorate.
In 2016, the Executive Board reviewed and analyzed theStrategic, Operational, Financial & Reporting, and Compliancerisks to which the Group was exposed, and it regularlyreviewed the design and operational effectiveness of theRandstad Risk & Control framework. The outcome of thesereviews was shared with the Audit Committee and theSupervisory Board, and was discussed with our externalauditor.
The Risk & Control framework should ensure consistent andreliable financial reporting, both internally and externally.Operating companies develop annual business plans andbudgets, which are subject to amendment and approval bythe Executive Board. Subsequently, the actual performance ofthe operating companies is measured against these businessplans and budgets, and the results are discussed in regularreview meetings between the operating companymanagement and the responsible Executive Board member.
In accordance with best-practice provision II.1.4 of the DutchCorporate Governance Code, we have assessed the design andoperational effectiveness of our Risk & Control framework.Based on the activities performed during 2016, and inaccordance with best-practice provision II.1.5, the ExecutiveBoard considers that, during 2016, the Risk & Controlframework regarding the Financial & Reporting risks workedeffectively, and that this provides reasonable assurance thatthe financial statements 2016 do not contain any materialmisstatements.
In accordance with the Dutch Financial Supervision Act,section 5.25c, the Executive Board declares that, to the best ofits knowledge:- The financial statements for 2016 provide, in accordance
with IFRS as endorsed by the EU, a true and fair view of theconsolidated assets, liabilities and financial position as atDecember 31, 2016, and of the 2016 consolidated incomestatement of Randstad Holding nv;
- The annual report provides a true and fair view of thesituation as at December 31, 2016, and the state of affairsduring the financial year 2016, together with a descriptionof the principal risks faced by the Group.
Diemen, the Netherlands, February 13, 2017
The Executive Board,
Jacques van den Broek Linda GalipeauRobert Jan van de Kraats Chris HeutinkFrançois Béharel
risk & opportunity management

89
governance
90 Executive Board
92 Supervisory Board
94 Report of the Supervisory Board
101 Remuneration report
106 Corporate governance

90
annual report 2016 − Randstad Holding nv
Jacques van den Broek (1960, Dutch)
CEO and Chair of the Executive Board
- Joined Randstad in 1988
- Appointed to the Executive Board in 2004
- Appointed as CEO and Chair of theExecutive Board in 2014
BackgroundAfter graduating in law, Jacques van den Broek held a managementposition with an international trading company until he joinedRandstad as a branch manager. Appointments followed as RegionalDirector in the Netherlands and, subsequently, as Marketing DirectorRandstad Europe. In 2002, he moved to Capac Inhouse Services asManaging Director, also taking on responsibility for Randstad inDenmark and Switzerland.
ResponsibilitiesJacques van den Broek is responsible for Germany, Australia, NewZealand, China, Hong Kong, and Singapore & Malaysia. In addition, heis responsible for IT, Group Business Concept Development, HR,Marketing & Communications, and Public Affairs.
Robert Jan van de Kraats (1960, Dutch)
CFO and Vice-Chair of the Executive Board
- Joined Randstad in 2001
- Appointed to the Executive Board in 2001
- Appointed as Vice-Chair of the ExecutiveBoard in 2006
BackgroundA certified auditor, Robert Jan van de Kraats began his career with oneof the big four accountancy firms. In 1989, he joined an internationaltechnology group as Finance and IT Director for the Netherlands. Heheld various senior positions with an international credit insurancegroup from 1994, and in 1999 he was appointed CFO and member ofits managing board. He joined Randstad in 2001 as CFO. He is also amember of the Board of Directors of OCI NV, a member of theSupervisory Board of Schiphol Group, and a member of the monitoringcommittee of the Dutch Corporate Governance Code.
ResponsibilitiesRobert Jan van de Kraats is responsible for Japan, India, Denmark,Sweden, and Norway and also for Group Finance & Accounting, GroupBusiness Control, M&A, Tax, Treasury, Business Risk & Audit, Legal, andInvestor Relations.
Executive Board
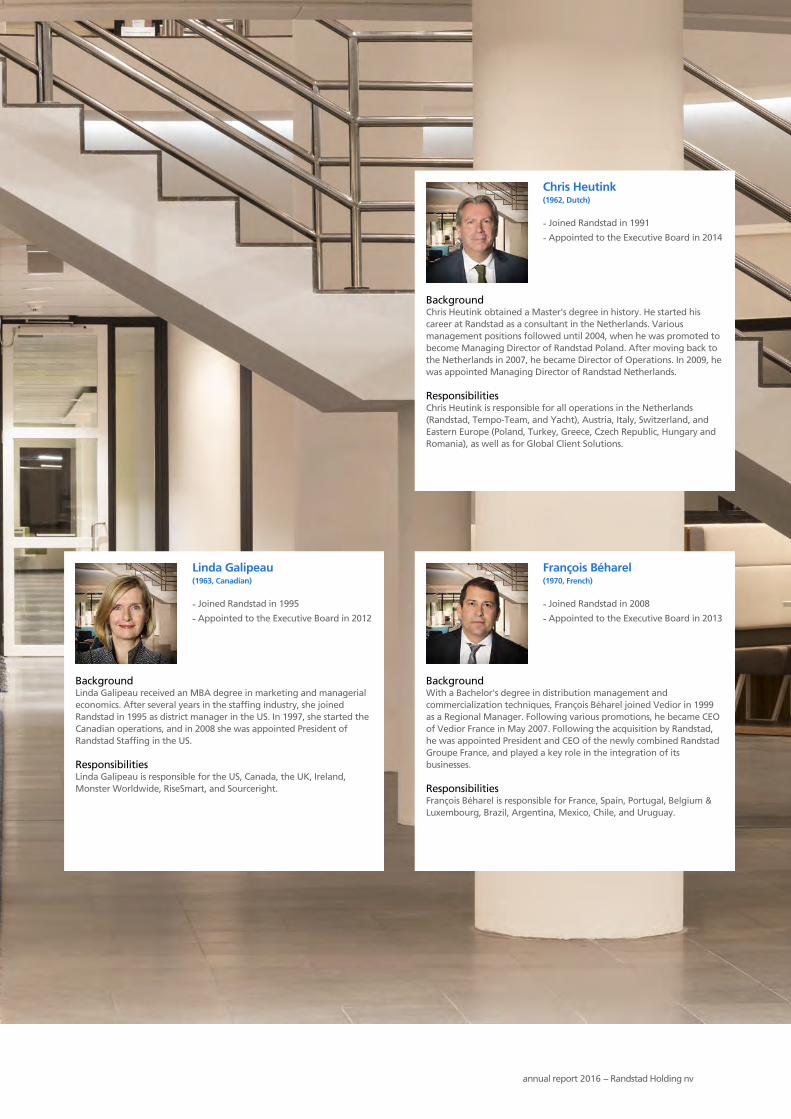
91
annual report 2016 − Randstad Holding nv
Chris Heutink (1962, Dutch)
- Joined Randstad in 1991
- Appointed to the Executive Board in 2014
BackgroundChris Heutink obtained a Master's degree in history. He started hiscareer at Randstad as a consultant in the Netherlands. Variousmanagement positions followed until 2004, when he was promoted tobecome Managing Director of Randstad Poland. After moving back tothe Netherlands in 2007, he became Director of Operations. In 2009, hewas appointed Managing Director of Randstad Netherlands.
ResponsibilitiesChris Heutink is responsible for all operations in the Netherlands(Randstad, Tempo-Team, and Yacht), Austria, Italy, Switzerland, andEastern Europe (Poland, Turkey, Greece, Czech Republic, Hungary andRomania), as well as for Global Client Solutions.
Linda Galipeau (1963, Canadian)
- Joined Randstad in 1995
- Appointed to the Executive Board in 2012
BackgroundLinda Galipeau received an MBA degree in marketing and managerialeconomics. After several years in the staffing industry, she joinedRandstad in 1995 as district manager in the US. In 1997, she started theCanadian operations, and in 2008 she was appointed President ofRandstad Staffing in the US.
ResponsibilitiesLinda Galipeau is responsible for the US, Canada, the UK, Ireland,Monster Worldwide, RiseSmart, and Sourceright.
François Béharel (1970, French)
- Joined Randstad in 2008
- Appointed to the Executive Board in 2013
BackgroundWith a Bachelor's degree in distribution management andcommercialization techniques, François Béharel joined Vedior in 1999as a Regional Manager. Following various promotions, he became CEOof Vedior France in May 2007. Following the acquisition by Randstad,he was appointed President and CEO of the newly combined RandstadGroupe France, and played a key role in the integration of itsbusinesses.
ResponsibilitiesFrançois Béharel is responsible for France, Spain, Portugal, Belgium &Luxembourg, Brazil, Argentina, Mexico, Chile, and Uruguay.

92
annual report 2016 − Randstad Holding nv
Wout Dekker (1956, Dutch)
Chair of the Supervisory Board
- Member of the Supervisory Board since2012
- Current term of office 2016−2020
BackgroundWout Dekker is the former Chairman of the Executive Board and CEOof Nutreco N.V and the former Chairman of the Supervisory Board ofRabobank. He is Chairman of the Supervisory Board of the PrincessMaxima Centre for Child Oncology.
ResponsibilitiesWout Dekker is Co-Chair of the Remuneration and NominationCommittee (Nomination) and a member of the Audit Committee.
Jaap Winter (1963, Dutch)
Vice-Chair of the Supervisory Board
- Member of the Supervisory Board since2011
- Current term of office 2015−2019
BackgroundJaap Winter is President of the Executive Board of Vrije UniversiteitAmsterdam. Until December 2013, he was partner at law firm DeBrauw Blackstone Westbroek. He is Professor of International CompanyLaw at the University of Amsterdam. He was a member of the firstDutch Corporate Governance Committee and the European CorporateGovernance Forum. He is a member of the Supervisory Board of HetKoninklijk Concertgebouw N.V. and Stichting Het Van Gogh Museum.
ResponsibilitiesJaap Winter is Chair of the Strategy Committee and a member of theAudit Committee.
Giovanna Kampouri Monnas (1955, Greek)
- Member of the Supervisory Board since2006
- Current and final term of office2014−2018
BackgroundGiovanna Kampouri Monnas is the former President of theinternational division and member of the Executive Committee of Joh.A. Benckiser GmbH. She is a Non-Executive Director of Puig S.L, AptarGroup Inc, Fondation Air France and Imerys SA. She is President of theEstia Agios Nikolaos Foundation in Germany and Greece.
ResponsibilitiesGiovanna Kampouri Monnas is Co-Chair of the Remuneration andNomination Committee (Remuneration) and a member of the StrategyCommittee.
Henri M.E.V. Giscard d’Estaing (1956, French)
- Member of the Supervisory Board since2008
- Current term of office 2016−2020
BackgroundHenri Giscard d’Estaing has been Chairman of the Board and CEO ofClub Méditerranée SA since December 2002. Before joining ClubMéditerranée in 1997, he held various management positions atGroupe Danone and Cofremca. He was formerly a member of theSupervisory Board of Vedior N.V. He is currently also a member of theBoard of Directors of Groupe Casino Guichard-Perrachon SA.
ResponsibilitiesHenri Giscard d’Estaing is a member of the Strategy Committee.
Supervisory Board

93
annual report 2016 − Randstad Holding nv
Frank Dorjee (1960, Dutch)
- Member of the Supervisory Board since2014
- Current term of office 2014−2018
BackgroundFrank Dorjee was Chief Strategic Officer and member of the Board ofDirectors of Prysmian Spa from March 2011 until January 2014. Until itstakeover by Prysmian Spa, he was CEO and Chairman of the ExecutiveBoard of Draka Holding NV from 2010 to 2011 and its CFO from 2004until 2009. He is a member of the Supervisory Board of Koole BV and amember of the Board of Directors of YOFC.
ResponsibilitiesFrank Dorjee is Chair of the Audit Committee.
Barbara Borra (1960, Italian)
- Member of the Supervisory Board since2015
- Current term of office 2015−2019
BackgroundBarbara Borra is CEO for EMEA of Fontana Group. Before joiningFontana, she was with Whirlpool for 10 years, serving in differentsenior management positions and more recently as Vice-President of itsChinese operations. Before joining Whirlpool, she held a number ofinternational roles in various countries at Rhodia, GE and Lev-O-CalCompany. She is a member of the Board of Directors of Italgas S.p.A.
ResponsibilitiesBarbara Borra is a member of the Remuneration and NominationCommittee.
Rudy Provoost (1959, Belgian)
- Member of the Supervisory Board since2015
- Current term of office 2015−2019
BackgroundRudy Provoost is the former CEO and Chairman of the Board ofDirectors of the Rexel Group. Before joining the Rexel Group, he heldvarious senior leadership and executive management positions at RoyalPhilips. He is a member of the Board of Directors of the Vlerick LeuvenGent Management School.
ResponsibilitiesRudy Provoost is a member of the Strategy Committee.

94
annual report 2016 − Randstad Holding nv
Introduction
2016 was an exciting year for Randstad, during which anumber of key decisions were taken that will be crucial in thecompany's drive to transform itself, to stay relevant for clientsand candidates in a fast evolving environment. A relativelylarge number of acquisitions were successfully realized, andRandstad made a significant step towards becoming marketleader in Italy and Sweden. The acquisitions of Ausy and BMCwill strengthen Randstad's presence in the EuropeanProfessionals segment. The acquisition of Monster Worldwideis considered a potential game changer, and leadership iscurrently revitalizing the Monster platform to enable itstechnology to be used within the Group worldwide. Oncecompleted, all these acquisitions will add approximately 10%to Group revenue. In addition, significant steps were made toroll out the digital strategy. Throughout the year, theSupervisory Board was closely involved in the discussionsrelating to these major decisions proposed by the ExecutiveBoard. With regard to Group strategy and development,alignment between the Boards is strong. There is open, in-depth discussion, encouraging mutual trust.
In this report, the Supervisory Board explains how it fulfilledall of these and other duties and responsibilities in 2016.
Composition, diversity andindependence
The Supervisory Board currently comprises seven members:Wout Dekker (Chair), Jaap Winter (Vice-Chair), Barbara Borra,Frank Dorjee, Henri Giscard d'Estaing, Giovanna KampouriMonnas, and Rudy Provoost (see the section Supervisory Boardfor their biographies). They have a diverse mix of knowledge,skills, and expertise, in line with the required profiles. TheSupervisory Board aims to ensure that its members represent agood balance in terms of diversity (including nationality,gender, and area of expertise). The Supervisory Board alsoaims for at least one-third of its membership to meet thegender criteria, which are currently met and are taken intoconsideration for each vacancy.
The Supervisory Board attaches great importance to theindependence of its members. As a rule, all members, with theexception of no more than one, should be independent in thesense of Article 1 of the Supervisory Board's by-laws. With theexception of Jaap Winter, who was appointed uponnomination by Randstad Beheer (the private shareholdingcompany of Frits Goldschmeding, Randstad's founder andleading shareholder), all members are independent. Theywere not granted, nor do they possess, any Randstad shares,with the exception of Henri Giscard d'Estaing, who personallyholds 450 shares in the company. In 2016, there was no actualor potential conflict of interest between Randstad and anyBoard member. In line with new legislation and as part of the
Diversity profile of the Supervisory Board
Name Year of birth Nationality
International
experience
Financial
expertise Specific experience Gender
Wout Dekker 1956 Dutch yes (CEO) Nutrition male
Barbara Borra 1960 Italian yes Home appliances female
Frank Dorjee 1960 Dutch yes CFO Cables male
Henri Giscard d'Estaing 1956 French yes (CEO) Tourism male
Giovanna Kampouri Monnas 1955 Greek yes Consumer goods female
Rudy Provoost 1959 Belgian yes (CEO) Distribution male
Jaap Winter 1963 Dutch yes Legal/Governance male
Retirement and reappointment schedule
Name Year appointed Year of possible reappointment Final term expires
Current number of SB positions
including Randstad
Wout Dekker 2012 2020 2024 2 (2 Chair)
Barbara Borra 2015 2019 2027 2
Frank Dorjee 2014 2018 2026 3
Henri Giscard d'Estaing 2008 - 2020 2
Giovanna Kampouri Monnas 2006 - 2018 4
Rudy Provoost 2015 2019 2027 1
Jaap Winter 2015 2019 2023 1
report of the Supervisory Boardreport of the Supervisory Boardreport of the Supervisory Board

95
annual report 2016 − Randstad Holding nv
key control framework of the company, members of theSupervisory Board (as well as the Executive Board) arerequired to annually state their related parties andtransactions, if any, between these related parties and thecompany. It was confirmed that no related-party transactionsoccurred in 2016, except for those cases where members ofthe Supervisory Board have a management company whichinvoices their related director's fees to Randstad.
Induction, training andperformance assessment
Ongoing education is an important part of good governance.New members of the Supervisory Board attend inductionsessions at which they are informed on the financial,reporting, risk & audit, HR, marketing, legal, and governance-related affairs of the company. Members of the SupervisoryBoard regularly visit Randstad's operations to gain familiaritywith senior operational and functional management, and todevelop deeper knowledge of operations, opportunities, andchallenges.
At a separate meeting, the Supervisory Board discussed itscomposition, its own performance, and that of its threecommittees. Contrary to the previous year, this self-assessmentwas not facilitated by an external advisor, as this is notconsidered necessary each year. Items assessed andsubsequently discussed by the Supervisory Board included (1)team effectiveness, (2) interaction and dialogue, (3) content-related effectiveness, (4) relationship with the ExecutiveBoard, (5) effectiveness of the Committees, (6) effectiveness ofthe individual members, and (7) effectiveness of andengagement with the organization.
The Supervisory Board concluded that the large majority ofthese items were assessed positively. Team spirit is consideredstrong, encouraging mutual trust, open discussion, and clearunderstanding of each Board member's role. In 2016, goodsteps were made in further optimizing the balance, both withregard to the functioning of each Board and with regard tothe Boards' mutual relationship. The effectiveness of theCommittees of the Supervisory Board is good, although thereis some scope for optimization. Some of the key findings andpoints for follow-up are:- The Supervisory Board is growing in its advisory role, but
further improvement could be realized through in-depthdiscussion and exchange of ideas about specific topics,strategic subjects, and dilemmas faced by the ExecutiveBoard.
- In both Boards, there is an ongoing need for ensuringdiversity in terms of international influence and expertise.
- The Supervisory Board will design a more structuredperformance evaluation and feedback process for theindividual members of the Executive Board and will paymore attention to leadership development and successionplanning.
Supervisory and advisory activitiesin 2016
Meetings of the Supervisory Board and attendanceThe Supervisory Board met nine times during 2016 (2015: 11times), of which one meeting was held by conference call.Seven of these meetings were held jointly with the fullExecutive Board. The other two meetings were held withoutthe Executive Board, but some were in part attended by theCEO. The latter two meetings were held to discuss ExecutiveBoard remuneration, the review of the related remunerationpolicy, the composition and assessment of the ExecutiveBoard, and the composition and assessment of the SupervisoryBoard. One of the meetings was attended by the externalauditor to discuss the 2015 annual report and accounts.
Between meetings, the Chair of the Supervisory Boardregularly maintained contact with the CEO and CFO. He alsofrequently met with Randstad's leading shareholder or hisrepresentative director. Individual Supervisory Board membersset up meetings related to their membership of specificCommittees or specific mandates.
In 2016, none of the members of the Supervisory Board wereabsent during any of the meetings. The attendance rate was100%.
Topics discussed and agreed with the SupervisoryBoardThe Supervisory Board meets in any case each quarter one daybefore the publication of the quarterly results, when itdiscusses these results with the Executive Board, as well asrelated documents, such as the draft press release and theauditor's quarterly report on procedures performed. Theseresults and related documents are first discussed by the AuditCommittee prior to the Supervisory Board meeting.
In addition to the standard agenda items for meetings, such asthe development of the financials and the businessperformance throughout the year, the Supervisory Boarddiscussed the following topics with the Executive Board in2016:- Organizational changes and senior management
appointments;- Compliance with relevant rules and legislation, as well as
developments in corporate governance;- The assessment of strategic, operational, financial, and
compliance risks, including Randstad's approach to risk andopportunity management, based on the quarterly reportof Group Business Risk & Audit and the external auditor'squarterly report;
- The preparation, evaluation, and follow-up of the AnnualGeneral Meeting of Shareholders;
- Topics related to sustainability relevant to Randstad,including the corporate sustainability framework andrelated key drivers and key performance indicators;

96
annual report 2016 − Randstad Holding nv
- The draft and final revised Dutch corporate governancecode;
- The views of analysts and investors, as well as changes inthe shareholder structure and base; and
- The budget for 2017.
During the year, the Supervisory Board was closely andthoroughly involved in the decision-making process regardinga relatively large number of acquisitions: Proffice, ObiettivoLavoro, Careo, twago, Monster Worldwide, Ausy and BMC. Italso discussed the global outplacement strategy following theacquisition of RiseSmart in 2015. In its decision-making processrelating to possible acquisitions, the Supervisory Board paysattention to a number of key items, notably the strategicrationale and how the acquisition fits in with the overallstrategy, the outcome of the due diligence process, risks,valuation including synergies and pricing, leadership, and theproposed integration process.
At a separate meeting, the Supervisory Board discussed withthe Executive Board the importance of purpose, culture, andcore values within the company. The culture within Randstadis important to attract top talent and designed aroundconnecting and celebrating, outperforming and measuring,and being the best place to work. Employee engagement andcultural fit are measured as part of the annual Great PeopleSurvey. The tone at the top is derived from the core valuesand embedded within the leadership style. The relatedbehavior-focused management approach implies setting theexample, transparency, clear and open communication, focuson integrity, and good governance.
To underline the importance of Randstad's business principlesand the procedure for reporting misconduct, the SupervisoryBoard shares responsibility for these matters with theExecutive Board. An assessment of the complaints reportedunder the misconduct reporting procedure is shared with theAudit Committee annually.
The Supervisory Board is frequently updated on developmentsin operating companies and markets. Senior management ofthe operations in the US and of Yacht Netherlands joined in2016 to give an update on their markets. Every year, theSupervisory Board, jointly with the Executive Board, pays atwo-day visit to the operations in a different country. Theirjoint visit to clients, branches, and Randstad's head office inFrance in December 2016 provided additional insight into thequality of local operations and management. Individualmembers of the Supervisory Board also paid visits to variousbusinesses within Randstad on an ad-hoc basis.
Strategy discussion and strategic retreatOne of the Supervisory Board's main priorities is strategy.Accordingly, and following up on last year's strategic retreat,time was spent on in-depth discussions with the ExecutiveBoard about the overall strategy and the realization of thestrategic targets. The Strategy Committee prepared and setthe framework for these discussions.
During several meetings in 2016, much time was spent ondiscussing the digital strategy, the development of relateddigital concepts and solutions, the cross-functional and cross-country setup, as well as the synergies of the MonsterWorldwide acquisition for Randstad's digital strategy.
A strategic retreat was organized in October 2016, duringwhich the Supervisory Board and the Executive Board alsodiscussed the above topics relating to the digital strategy, aswell as a significant number of other relevant strategic topics,including:- The allocation of global responsibilities amongst the EB
members;- The role of Group-wide functions, of which some are
organized more globally than centrally, using strong localleadership;
- The outcome of the 2-year growth plan, which is based onthe input from the operating companies;
- The strategy for the Professionals segment, which requiresmore focus on talent engagement and organizationalalignment, and will accelerate in Europe through theacquisitions of Ausy and BMC; and
- A review of global strategic initiatives, such as relating tofield and headcount steering, central sourcing, RandstadSourceright, the reallocation of marketing spend, theimplementation of a shared service center for global ITinfrastructure, and cross-country procurement.
Supervisory Board Committeeactivities in 2016
The Supervisory Board has three Committees: the AuditCommittee, the Remuneration and Nomination Committee,and the Strategy Committee. Their roles are described in moredetail in the section corporate governance. They generatedetailed information and prepare recommendations relatingto their specific areas, while the full Supervisory Board retainsoverall responsibility. In each case, the Committee Chairreports the Committee's main considerations and findings tothe full Supervisory Board, usually immediately after therelevant Committee meeting.
The composition of these Committees was as follows:
Audit CommitteeFrank Dorjee (Chair), Wout Dekker, and Jaap Winter. The firsttwo members in particular have relevant expertise in the fieldof financial management.
Remuneration and Nomination CommitteeGiovanna Kampouri Monnas (Chair for remuneration), WoutDekker (Chair for nomination), and Barbara Borra.
Strategy CommitteeJaap Winter (Chair), Henri Giscard d'Estaing, GiovannaKampouri Monnas, and Rudy Provoost.
report of the Supervisory Board

97
annual report 2016 − Randstad Holding nv
All Supervisory Board members have a standing invitation toattend meetings of Committees of which they are not amember, which they do attend on an ad-hoc basis.
Report of the Audit CommitteeThe Audit Committee assists the Supervisory Board in itsresponsibility to oversee Randstad's financing, financialstatements, financial reporting process, and system of internalbusiness controls, risk management and audit.
Five meetings were held in 2016 (2015: five). All meetingswere attended by the CEO, the CFO, and the managingdirectors for Group Business Control, Group Accounting andGroup Business Risk & Audit. The external auditor was alsopresent. At least once a year, the Audit Committee discusseswith the external auditor, without management beingpresent, their assessment of Randstad's performance, as wellas the collaboration with the Executive Board and the financedepartments, including their functioning.
Each quarter, the Chair of the Audit Committee meets withthe CFO and, separately with the managing directors of GroupBusiness Control, Group Accounting and Group Business Risk& Audit, generally in preparation of the quarterly AuditCommittee meeting. Also, when considered necessary, theChair meets with the external auditor in advance.
At each meeting, the Audit Committee discusses the financialperformance in much detail, as well as related items such asthe draft press release, the external auditor's report with theirquarterly observations, and the quarterly update from GroupBusiness Risk & Audit which contains management self-assessments of risks and controls, audit results and progressand outcomes of fraud investigations.
In addition, the following topics were discussed during theyear:- An update on Group Treasury and Group Tax, mostly
provided by the responsible managing director;- An update on pensions;- A report from the managing director Group Legal on
operating companies' compliance with key policies, withspecial attention in 2016 to data protection andinformation/cyber security;
- The annual legal letter, listing material litigation (wherepotential liability exceeds € 1 million). Any cases with apotential liability exceeding € 2.5 million are promptlyreported to the Audit Committee;
- The procedure for reporting misconduct, including thereport of the central integrity officer summarizing thecases reported under this procedure;
- Changes of key people in the finance function in operatingcompanies and at Group level;
- The annual talent and performance review of the financefunction and its key people, including the World LeagueFinance Program, whose aim is to develop the financefunction, all finance staff and the finance organizationthroughout Randstad.
With regard to the external audit, the Audit Committeereviewed Deloitte's proposed audit plan relating to the auditscope (90% of Group revenue), approach, focus areas and fees(see note 28 to the financial statements). For the first year,BDO presented their audit of the local statutory accounts of20 smaller countries. No material issues were noted by BDO.
The risk profile and in-control position of the Group wasdiscussed multiple times in various ways and at least quarterly.This was done, for example at the start of the year, whenapproving and updating the audit plan which is based onRandstad's risk profile and the priorities for 2016. InDecember, the risk-based audit plan for 2017 was discussed.
In the second and fourth quarter, the Group's in-controlsituation was discussed more in detail, using the results of therisk assessments, key control framework and audits. Thisdiscussion addressed key risks taking into account theeffectiveness of controls to mitigate these risks. Priorities forinternal audits of local audit teams are set by the managingdirector Group Business Risk & Audit and discussed andagreed with the Executive Board and the Audit Committee.This semi-annual in-control evaluation process allows allGroup companies to further develop controls using a maturitymodel. Further information can be found in the section risk &opportunity management.
The Group Business Risk & Audit department is adequatelyembedded within the organization by way of the Global Risk& Audit network, consisting of local internal auditors atoperating company level. In 2016, the Audit Committeeapproved the updated Business Risk & Audit Charter, whichconfirms the direct access of the department's managingdirector to the Chair of the Audit Committee, and as suchensures objectivity, authority, and responsibility setting.
The Audit Committee assured itself of the independence ofthe external auditor and the non-audit services provided bythe external auditor, in line with the relevant policy which wasupdated at year-end reflecting recent applicable legislation.The external auditor is now prohibited to perform any non-audit services for Randstad. Audit firm rotation is now set atevery ten years, while the key partners engaged in the auditshould rotate every five years.
The Audit Committee assessed the performance of theexternal auditor, based on a satisfaction survey conductedamong all CFOs of the operating companies and keycorporate finance people. As part of this annual evaluationprocess, the following items are taken into consideration:(1) the quality of the audit work, (2) the sufficiency andfulfillment of the audit engagement, (3) the quality of theauditor's reports, (4) the independence of the auditors, (5) theexpertise and composition of the audit team, (6) the audit fee,and (7) quality control within the audit firm.

98
annual report 2016 − Randstad Holding nv
Report of the Strategy CommitteeThe Strategy Committee acts as a sparring partner for theExecutive Board and contributes in depth to the preparationof the semi-annual discussion of Randstad's strategy with thefull Supervisory Board. Each member has his own specific andextensive experience in strategy development and relatedprocesses. All meetings are attended by the full ExecutiveBoard.
In 2016, the Committee fully focused on the follow-up of thestrategic retreat held in October 2015, and the preparation ofthe strategic retreat in October 2016 as elaborated on in detailabove (Strategy discussion and strategic retreat).
Report of the Remuneration and NominationCommitteeThe Remuneration and Nomination Committee primarilymakes recommendations regarding the remuneration (andthe remuneration policy) of the Executive Board and theSupervisory Board. It is also tasked with advising on candidatesto fill vacancies in both Boards. Each Committee member hasspecific expertise in the area of remuneration and HR-relatedissues.
The Committee met four times in the course of 2016 (2015:three). The CEO participated in part of the meetings. TheCommittee regularly made use of external advice, notablyfrom Korn Ferry Hay Group and Towers Watson.
Remuneration-related topicsThe Committee discussed the remuneration of the ExecutiveBoard, notably the setting and realization of the relatedperformance targets. In the second half of 2016, theCommittee, led by the remuneration Chair, GiovannaKampouri Monnas with assistance from the CompanySecretary, extensively assessed the full remuneration policy inmore detail. Korn Ferry Hay Group, an independent strategic,human capital advisory firm, was commissioned to provideadvice. The members of the Executive Board were requestedto provide their views on the current remuneration policy aswell as items for adjustment. The Committee advised theSupervisory Board to submit a proposal to the upcomingAnnual General Meeting of Shareholders in March 2017 toslightly update the remuneration policy for the ExecutiveBoard. Further information can be found in the remuneration2017 section in the remuneration report.
Nomination-related topicsThe Committee discussed the annual assessment of theExecutive Board and its individual members, successionplanning and the annual performance review of the secondlayer leadership reporting to the Executive Board (all of whomare scheduled to meet and present to the Supervisory Board, iffeasible), as well as high potentials. The Committee alsodiscussed diversity-related topics. The Supervisory Board aimsto ensure that both its own composition as well as thecomposition of the Executive Board represents a good balancein terms of diversity (including experience, gender, and
nationality). The aim is that at least one-third of its membersmeet the criteria regarding gender. These gender criteria arecurrently being met for the Supervisory Board, but not yet forthe Executive Board. Randstad's policy regarding diversity isdescribed in the diversity and inclusion section of this annualreport. A key factor in diversity is providing equalopportunities for women. The percentage of women in seniormanagement positions amounted to 45.2% (2015: 46.4%) in2016, which is close to our target of 50% in 2017. Diversity willcontinue to be an important consideration for all futurenominations to the Boards.
Supervisory Board remuneration
The Annual General Meeting of Shareholders determines theremuneration of the members of the Supervisory Board. Theirremuneration is a fixed annual allowance paid in monthlyinstallments. It is not linked to the financial results of thecompany. Members of the Supervisory Board do not receiveany performance-related compensation or shares, and do notaccrue any pension rights with the company.
Members of the Supervisory Board who hold shares in thecompany are only allowed to do so as long-term investments.They adhere to the company's insider dealing rules. Randstaddoes not grant loans or guarantees to Supervisory Boardmembers.
Allowances of Supervisory Board membersin €
2016 2015
Supervisory Board
Chair 110,000 110,000
Vice-Chair 90,000 90,000
Members 75,000 75,000
Audit Committee
Chair 12,000 12,000
Members 8,000 8,000
Remuneration and Nomination Committee
Chair 9,000 9,000
Members 7,000 7,000
Strategy Committee
Chair 8,000 8,000
Members 6,000 6,000
The annual allowances were last determined by the AnnualGeneral Meeting of Shareholders held in 2012, while theannual Committee fees were last determined by the AnnualGeneral Meeting of Shareholders held in 2011. The annualallowances and Committee fees for the Chair and members ofthe Supervisory Board are shown in the table.
report of the Supervisory Board

99
annual report 2016 − Randstad Holding nv
In addition, Supervisory Board members receive a fixed annualexpense allowance of € 2,000 net for members and € 3,000net for the Chair. Taking into consideration their significanteffort and travel time, Supervisory Board members receive anattendance fee of € 1,500 per meeting when cross-bordertravel is required in order to attend a Supervisory Boardmeeting.
Report of the Annual GeneralMeeting of Shareholders
At the Annual General Meeting of Shareholders, held onMarch 31, 2016, the CEO and the CFO gave an account of thegeneral state of affairs at Randstad and its financialperformance in 2015. The meeting adopted the 2015 financialstatements and the dividend proposal. The members of theExecutive Board were granted discharge of liability for theirmanagement, and the members of the Supervisory Board fortheir supervision thereof. Linda Galipeau and François Béharelwere reappointed as members of the Executive Board. HenriGiscard d'Estaing and Wout Dekker were reappointed asmembers of the Supervisory Board. The meeting authorizedthe Executive Board to issue ordinary shares, limited to amaximum of 3% of the ordinary issued share capital for aperiod of 18 months, as well as to repurchase ordinary sharesand cancel repurchased shares, limited to a maximum of 10%of the ordinary issued share capital for a period of 18 months.Sjoerd van Keulen was reappointed as Board member ofStichting Administratiekantoor Preferente Aandelen RandstadHolding. Deloitte Accountants B.V. in the Netherlands wasappointed as external auditor for the financial year 2017.
Similar to the previous year, the Chair of the Audit Committeeproactively elaborated on the work of the Audit Committee in2015, the company's collaboration with the external auditor,and some specific items that were relevant in the past year:- Developments in the field of personal data protection;- Tax planning and compliance;- Goodwill valuation, partly as a result of the annual
goodwill impairment test, which, based on current insightsand estimates, did not lead to impairment;
- The valuation of the position regarding deferred taxes, asdescribed in detail in the financial statements;
- The CICE subsidies on low wages in France, which Randstadcontinued to receive in 2015;
- Some fraud-related matters, which were immaterial toRandstad.
The lead partner of Deloitte Accountants was given the floorto elaborate on the auditor's opinion. 2015 was Deloitte's firstyear as Randstad's auditor and much time was spent onbecoming acquainted with Randstad's global organizations.Much time was also spent on assessing all relevant accountingpositions, audit findings from prior years, and the auditenvironment, including the tone at the top, risk management,the internal control framework, and IT systems. This transition
work served as a basis for Deloitte's audit plan for 2015, whichfocused on (1) materiality, (2) scope, (3) internal control and ITsystems, (4) key audit matters in the financial statements, and(5) the evaluation of the management report.
"I can schedule my availabilityonline"

100
annual report 2016 − Randstad Holding nv
Financial statements for 2016
The financial statements for 2016 have been audited andprovided with an unqualified opinion by Deloitte AccountantsB.V. (see the auditor's report) and were extensively discussedwith the auditors by the Audit Committee in the presence ofthe CEO and the CFO in February 2017. The full SupervisoryBoard then discussed them with the full Executive Board inthe presence of the auditors. The Supervisory Board is of theopinion that the financial statements 2016 meet allrequirements for correctness and transparency. During theyear, the Audit Committee extensively discussed the Risk &Control framework that supports this. As such, the SupervisoryBoard recommends that the Annual General Meeting ofShareholders, to be held on March 30, 2017, adopt thefinancial statements and the appropriation of net incomeproposed by the Executive Board.
The Supervisory Board endorses the Executive Board'sproposal to the Annual General Meeting of Shareholders topay an all-cash dividend per ordinary share of € 1.89 for 2016(€ 1.68 for 2015) and a cash dividend on preference shares Band C of € 12.6 million (€ 12.6 million for 2015).
The Supervisory Board requests that the Annual GeneralMeeting of Shareholders grant discharge to the members ofthe Executive Board for their management and to themembers of the Supervisory Board for their supervision in2016.
In 2017, we hope to continue our solid performance of 2016,strengthened by the recent acquisitions. Randstad will furtherdevelop its digital strategy, while transforming the company.In the exciting journey that lies ahead, Randstad's people areat the heart of the company, as their touch continues to standout. The Supervisory Board would like to thank all Randstademployees, under the strong leadership of the ExecutiveBoard, for their contribution and continuing dedication in2016.
Diemen, the Netherlands, February 13, 2017
The Supervisory Board,
Wout Dekker, ChairJaap Winter, Vice-ChairBarbara BorraFrank DorjeeHenri Giscard d'EstaingGiovanna Kampouri MonnasRudy Provoost
report of the Supervisory Board

101
annual report 2016 − Randstad Holding nv
The Remuneration and Nomination Committee of theSupervisory Board is responsible for assessing and preparingthe remuneration policy of the Executive Board. TheSupervisory Board decides on its proposals and, in the event ofmaterial policy changes, submits these proposals to theAnnual General Meeting of Shareholders for adoption.
Remuneration policy
The last update of the remuneration policy was adopted bythe Annual General Meeting of Shareholders held on March28, 2013.
The main objective of the remuneration policy is to attract,motivate, and retain qualified senior executives of the highestcaliber, who have an international mindset and thebackground required for the successful leadership andeffective management of a large global company. Themembers of the Executive Board are rewarded accordingly,and most of their remuneration is based on Randstad'sperformance. The remuneration structure for the ExecutiveBoard is therefore designed to balance short-term operationalperformance with the long-term objectives of the companyand value creation for its stakeholders.
Remuneration levels are determined on the basis of a numberof clear, transparent criteria, and reflect general as well asspecific individual responsibilities in an international context.They are benchmarked against an international labor marketpeer group regarding fixed salary levels, and against aninternational performance peer group to establish relativeperformance:
- The international labor market peer group represents themarket in which Randstad competes for seniormanagement talent, and is used to benchmark fixed salarylevels. It is composed of international staffing and businessservices companies, reflecting Randstad's internationalscope. They are Adecco SA, Rentokil Initial Plc, CapgeminiSA, Atos Origin SA, Robert Half International Inc., CGIGroup Inc., Manpower Inc, Kelly Services Inc., Michael PageInternational Plc, Hays Plc, TUI AG, G4S Plc, and SodexoGroup SA;
- The international performance peer group is used as abenchmark to establish relative performance in terms ofTotal Shareholder Return (TSR) for the payout of the long-term incentive plan. It reflects the market in which thecompany competes for shareholder preference. This groupis composed solely of staffing companies, and cantherefore be characterized as 'sector-specific'. It consists ofAdecco SA, Kelly Services Inc., Trueblue Inc, Manpower Inc,Robert Half International Inc., USG People NV, MichaelPage International Plc, Hays Plc, and Groupe Synergie SA.Following its acquisition by Recruit Holdings Co., Ltd., USGPeople NV was replaced by Recruit Holdings Co., Ltd. as of2016.
- In addition, as an extra check, total compensation levelsare benchmarked annually against a peer group ofcompanies listed on the AEX index (consisting of largecompanies listed on Euronext Amsterdam).
Executive Board remuneration2016
The remuneration of the Executive Board consists of threecomponents:1. Short-term compensation, consisting of a base salary
and an annual cash bonus opportunity;2. Long-term compensation, consisting of performance
shares;3. Pension and other benefits.
The variable portion of the total remuneration package isperformance-related. It consists of short- and long-termcomponents. For on-target performance, approximately halfof the total compensation of a member of the ExecutiveBoard is performance-related. The Supervisory Board, on therecommendation of its Remuneration and NominationCommittee, sets the targets prior to each performance period.Performance targets and conditions are derived fromRandstad's strategy, annual budget plan, and market analysis.An overview of the 2016 and comparable 2015 remunerationamounts is included in note 24 to the financial statements.
Short-term compensation
Base salaryIn line with the relevant size and profile of Randstad,compared to the other companies included in theinternational labor market peer group, base salaries of theExecutive Board members are set at between the median and75% percentile level.
In line with the company's remuneration policy and confirmedby benchmarking carried out by Focus Orange, it was decidedto increase the base salaries of the Executive Board membersby 3.0% as of January 1, 2016. The general pay differentialswithin the company, and specifically of senior management,were taken into account when taking this decision.
Effective January 1, 2016, the base salary of Jacques van denBroek, CEO and Chairman of the Executive Board, wasincreased to € 1,000,000. This was the last step in a three-stepsalary increase following his appointment as CEO, andbrought his salary at the median level of the internationallabor market peer group and group of companies listed onthe AEX index.
Annual cash bonus opportunityThe total annual cash bonus opportunity amounts to 70% ofbase salary for on-target performance, and the maximumbonus level is 100% of base salary. If performance is below a
remuneration report

102
annual report 2016 − Randstad Holding nv
pre-defined minimum level, no bonus will be paid out. Incalculating the pro-rata bonus, a sliding scale between theminimum level and the maximum level is used. TheSupervisory Board sets the targets at the beginning of eachfinancial year upon recommendation of the Remunerationand Nomination Committee.
The framework for the annual cash bonus relates to:- Gross profit, revenue or market share, with the bonus
opportunity ranging from 10% for minimum performance,15% for on-target performance, and 25% for maximumperformance;
- EBITA or EPS realization, with the bonus opportunityranging from 10% for minimum performance, 15% for on-target performance, and 25% for maximum performance;
- Leverage ratio, or efficiency of working capital (e.g., DSOor net debt), with the bonus opportunity ranging from10% for minimum performance, 15% for on-targetperformance, and 25% for maximum performance;
- Individual targets, with a maximum of 15%;- Additional bonus at the discretion of the Supervisory
Board, with a maximum of 10%.
The actual targets for the Executive Board as a whole and thetargets for individual Board members are not disclosed, asthey qualify as information that is confidential and/orcommercially and potentially share-price sensitive.
If a variable remuneration component conditionally awardedin a previous year would, in the opinion of the SupervisoryBoard, produce an unfair result due to extraordinarycircumstances during the performance period, the SupervisoryBoard has the power to adjust the value upwards ordownwards. The Supervisory Board may also recover from theExecutive Board any variable remuneration awarded on thebasis of incorrect financial or other data. These provisions areincluded in the annual bonus and grant letter. This power wasnot used in 2016, nor was any remuneration recovered frompresent or former Executive Board members.
Based on the achievement of the shared targets as specifiedbelow and the individual targets for 2016, and using thediscretionary space available to the Supervisory Board, thebonus entitlement with regard to the performance in 2016 asa percentage of annual base salary is specified as follows:
Annual bonus payout, 2016
2016 performance target
possible
maximum
payout as % of annual base
salary
Group revenue performance 25% 14%
Group EBITA margin 25% 10%
Net debt at year-end 25% 17%
Individual targets 15% 14%
Discretionary 10% 10%
100% 65%
Long-term compensationIn order to align their own objectives with the value creationobjectives of shareholders, performance shares are granted tothe members of the Executive Board on an annual basis.
Due to their long-term nature, performance shares areinherently and significantly more open to marketuncertainties than short-term compensation elements. Sharescan become unconditional (i.e., may vest) depending solely onRandstad's TSR performance compared to the performancepeer group, measured over a three-year period starting fromJanuary 1 of the year in which they are granted. The relatedpayout range is as follows:
TSR payout range
Position 1 250%
Position 2 200%
Position 3 150%
Position 4 100%
Position 5 50%
Position 6 0%
Position 7 0%
Position 8 0%
Position 9 0%
Position 10 0%
The grant is divided into TSR-dependent (80%) andsustainability-related (20%). TSR reflects the return received bya shareholder and captures both the change in the company'sshare price and the value of dividend income, assumingdividends are reinvested in the company. TSR is anappropriate measure, as it objectively measures the company'sfinancial performance and assesses its long-term valuecreation as compared to other companies in the sector. TSRperformance for the companies of the internationalperformance peer group is calculated based on their 'home/primary listing'. TSR data are compiled and reported byexternal data provider Towers Watson. Given the relevance ofcertain non-financial targets for Randstad's business,ambition, and long-term viability, five targets withinRandstad's sustainability KPI framework are added at thediscretion of the Supervisory Board. These targets are also setat the start of the three-year vesting period.
Performance shares are granted in the open period followingthe publication of the Group's fourth-quarter financial resultsin February. The number of shares will be calculated based onthe fair value of the Randstad share as at January 1. At themoment the performance shares are granted, their fair valueassuming on-target performance is equal to an amount of100% of the base salary for all Executive Board members alike.If a member of the Executive Board resigns before the vestingdate, conditional grants of performance shares will inprinciple lapse or, for example, in the case of retirement due
remuneration report

103
annual report 2016 − Randstad Holding nv
to reaching pensionable age, will vest pro rata related to theperformance period in service. The company offers nofinancing arrangements at grant or exercise of the options.Performance shares need to be retained for at least two yearsafter vesting, except to the extent necessary to settle anyrelated tax liabilities.
Prior to the grant, and following the advice of theRemuneration and Nomination Committee, the SupervisoryBoard analyzes the possible outcomes of the allocation.
On February 18, 2016 (the grant date under the relevantplan), a conditional grant of performance shares for on-targetperformance was made, based on 100% of the annual basesalary per Executive Board member as at January 1, 2016, andon the fair value of the performance shares as at the samedate of € 45.13 per share (TSR-dependent grant) and € 53.21per share (non-financial/sustainability-related grant).
The conditional on-target awards for 2016 are as follows:
Conditional on-target awards, 2016
Number of
shares
Jacques van den Broek 21,486
Robert Jan van de Kraats 15,260
François Béharel 13,405
Linda Galipeau 13,405
Chris Heutink 13,405
76,961
The non-financial performance targets for the 2016 grant arethe following five targets from Randstad's sustainability KPIframework:- Net Promoter Score (NPS): a Top 3 position or at least
position improvement in the Top 12 countries over theperformance period;
- Impact of initiatives with regard to guiding candidatesfrom unemployment to employment;
- Employee engagement score: at least 80% participationand outperformance of the benchmark annually;
- Involvement with key forums;- Environment: % electricity from sustainable sources: 50%
in 2018 (2015: 29%).
At the end of the performance period 2016−2018, theSupervisory Board will have the discretion to determine theactual vesting based on progress made over the performanceperiod as reported by the Executive Board in relation to eachof these targets. Each target accounts for 50% vesting, theminimum vesting equals 0%, and the maximum vestingequals 250%, in line with the minimum and maximumopportunity for the TSR-dependent grant.
At the beginning of 2016, the performance shares andperformance options that had been conditionally granted inFebruary 2013 vested based on the relative TSR performance(80% of the allocation) over the period January 1, 2013, toDecember 31, 2015. Performance resulted in 100% vesting.The performance on the non-financial targets (20% of theallocation) over this period resulted in 200% vesting. The totalpayout ratio for both grants is 115%.
Pension and other benefits
Pension contributionThe pension arrangements for members of the ExecutiveBoard are based on defined contribution. Randstad providesan annual contribution of 27% of base salary to the schemesof Executive Board members. For Netherlands-basedmembers, this contribution includes compensation forlimitations of accrual of pension rights as of 2016. For theFrance-based member, this contribution includescompensation to cover the health and long-term disabilityinsurance, life insurance and any other pension scheme andcertain social security charges. For the US-based member, thiscontribution includes compensation to cover the health andlong-term disability insurance, life insurance, andcontributions to the 401k plan or any other pension scheme.The company has no specific early retirement arrangements inplace for Board members.
Other benefitsAdditional arrangements include expense and relocationallowances, a company car or car allowance, and health andaccident insurance.
LoansThe company has issued no loans or guarantees to ExecutiveBoard members.
SeveranceIn the event of severance, a maximum of one year's annualbase salary, in addition to the 12-month notice period, appliesto all Executive Board members.
Executive service agreementsIn line with the relevant regulation, Executive Board membershave a four-year executive service agreement with thecompany, which supersedes any previous employmentagreements.
Appointment termsThe members of the Executive Board appointed before 2005were appointed for an indefinite period. The members of theExecutive Board appointed since 2005 were appointed for aperiod of four years.

104
annual report 2016 − Randstad Holding nv
Supervisory Board remuneration2016 and 2017
Information with regard to the remuneration of theSupervisory Board in 2016 is included in the section Report ofthe Supervisory Board. An overview of the 2016 andcomparable 2015 remuneration amounts is included in note24 to the financial statements.
The remuneration of the Supervisory Board, including itsCommittees, will remain unchanged in 2017.
Executive Board remuneration2017
In line with the company's remuneration policy and confirmedby benchmarking carried out by Korn Ferry Hay Group, it wasdecided to increase the base salaries of the Executive Boardmembers by 2.0% as of January 1, 2017, except for the CEO,whose salary was not increased but kept at the level agreedupon when he was appointed as CEO. The general paydifferentials within the company, and specifically within seniormanagement, were taken into account when taking thisdecision.
Remuneration policy review and proposal foramendmentThe current remuneration policy for the Executive Board datesfrom the Annual General Meeting of Shareholders in 2013. Inthe past years, the Supervisory Board has monitored theInternational and Dutch developments in relation tocorporate governance and remuneration, to ensure Randstadwas always in line. In the second half of 2016, the SupervisoryBoard, particularly its Remuneration and NominationCommittee led by the Remuneration Chair with assistancefrom the Company Secretary, extensively assessed the fullremuneration policy in detail. Korn Ferry Hay Group, anindependent, strategic human capital advisory firm, wascommissioned to provide advice. The members of theExecutive Board were requested to provide their views on thecurrent remuneration policy. The Committee took goodnotice of recent international developments and marketpractice regarding executive remuneration. When looking atmarket practice, the Committee particularly looked at theNetherlands, France and the US, given the profile of thecurrent Executive Board. It also assessed the remunerationprovisions in the new Dutch corporate governance code. Thefollowing objectives were formulated for adjustment of thenew policy:- Increase the focus of the Executive Board on long-term
sustainable value creation of the Company;- Align even more with the values and organizational
aspirations of the Company;- Correct some non-optimal items in the current policy and
incorporate several recent remuneration policy trends.
After careful consideration and upon recommendation of theRemuneration and Nomination Committee, the SupervisoryBoard decided that the developments both within thecompany and in the Dutch and international governanceframework required an update of the Randstad remunerationpolicy. The current proposal that will be submitted forapproval by the Annual General Meeting of Shareholders onMarch 30, 2017, meets the aforementioned objectives by:- Focusing the Company’s performance on strategic short-
term and long-term actions and outcomes;- Privileging long-term versus the short-term;- Encouraging share investment by the members of the
Executive Board;- Rewarding the Executive Board as a team rather than as
individual members;- Increasing the focus on results relative to market rather
than absolute results;- Further optimizing internal pay equities by aligning senior
management's remuneration structure with the ExecutiveBoard's.
Subject to approval by the Annual General Meeting ofShareholders on March 30, 2017, the policy update will takeeffect as from the current financial year. The Executive Boardwill as much as possible align the remuneration of seniormanagement with these amendments.
Below is the description and rationale of the proposed policychanges.
Base salariesBase salaries of the Executive Board members are set betweenthe median and 75% level of the international labor marketpeer group. We intend to keep this framework unchanged,which corresponds well with the international profile, size anddynamics of Randstad. The current base salaries of themembers of the Executive Board are within our policy.
The current international labor market peer group, which isused to benchmark remuneration levels, is relatively small andthere are only a limited number of direct peers with acomparable size and profile as Randstad available. In line withgood market practice, we propose to extend the current peergroup of 13 companies (Sodexo, Adecco Group, TUI,Capgemini, Manpower Group, Atos, CGI, G4S, Robert Half,Hays, Rentokil Initial, Kelly Services and Michael PageInternational) to 24 companies, adding Recruit Holdings Co,Compass Group, Hilton Worldwide, Tyco International, Capita,Equifax, Accor, Securitas, Bureau Veritas, Thomas Cook andIntertek Group.
As an additional check, the Committee annually benchmarkstotal compensation levels of the Executive Board versus theAEX peer group (excluding Royal Dutch Shell, Unilever,ArcelorMittal, Vopak, Galapagos and the financial servicescompanies). We propose to continue this sanity check as asecond benchmark.
remuneration report

105
annual report 2016 − Randstad Holding nv
Short-term incentives / annual bonusAs per the current policy, the total annual bonus opportunitycontinues to be 70% of base salary for on-target performanceand the maximum bonus is 100% of base salary. Ifperformance is below the predefined minimum targets, nobonus will be paid. The Supervisory Board sets the bonustargets at the beginning of each financial year, following thepresentation of the business objectives and plans by theExecutive Board.
We propose that the entire short term incentives (STI) will bebased on joint team performance of the Executive Board tostrengthen teamwork and focus on overall company goals.Both the current 15% bonus opportunity based on individualtargets and the 10% discretionary bonus will be discontinued.
The largest part of the achievable annual bonus (75%) willcontinue to be related to a certain number of financialtargets. In contrast to currently, the choice and weight ofthese targets will depend on the specific business objectives ofeach year, with the Supervisory Board selecting theappropriate annual targets from an agreed menu of financialtargets. In addition to the targets used currently (revenue,gross profit, EBITA, EPS, net debt, leverage ratio and debtordays) we will include relative revenue performance versus themarket and incremental conversion or recovery ratios. Thesetwo new measures are key to focus the company on growingprofitably within the market.
To further underline joint responsibility, the Supervisory Boardwill set, at the start of each financial year, yearly strategic andoperational objectives following a presentation by theExecutive Board. This bonus opportunity will at maximum be25% of base salary.
In order to enhance the Executive Board's long-term focus,25% of the net annual bonus (paid out based on realizedperformance) will be paid out in Randstad shares. After threeyears, these shares will be matched 1:1 subject to a sustainableperformance of the company during the previous three yearsand at the discretion of the Supervisory Board. Members ofthe Executive Board are allowed to voluntarily convert up to50% of net annual bonus according to the same matchingprinciples. Randstad shares need to be held for at least 5 years,after the conditional award date, except for any share salesneeded to settle related tax liabilities.
Long-term incentiveIn the recent past, the Randstad strategy has evolved towardsdeveloping global concepts to drive our businessperformance, notably including the digitalization and theProfessionals segments among others. At the same time,Randstad has reaffirmed the importance of our values andculture at the core of our practices.
Given the relevance of the Randstad values and theglobalization of the business concepts to the company’s long-term viability, the Supervisory Board believes that the weightof non-financial key performance indicators should beincreased. It is proposed to increase it to 35% of total on-target LTI, up from 20% currently. The specific performancetargets will reflect our long-term organizational and socialchallenges and will be derived from our strategic businessplans and from the sustainability KPI framework upondiscretion of the Supervisory Board.
For the non-financial measures, the Supervisory Board willdetermine the actual vesting based on progress made over theperformance period as reported by the Executive Board inrelation to each of these targets. The total vesting willcontinue to range between 0% and 250%.
Relative Total Shareholder Return (TSR) will continue to be themeasure of long-term financial performance and long-termvalue creation. It is proposed to reduce its weight to 65% fromcurrently 80% of on-target LTI to allow for the increase in theweight of non-financial KPIs above.
The international performance peer group is used to establishrelative TSR performance. The current peer group onlyincludes staffing/recruitment companies and includes 2 peersthat operate primarily locally (Synergie and TrueBlue). Wepropose to delete these 2 peers, and extend the peer groupfrom 10 to 19 companies, adding super-cyclical, asset light,business services companies (Capita, On Assignment, G4S, ISS,Compass Group, Rexel, Securitas, Office Depot, WW Grainger,Sodexo and Staples).
The related payout range will be changed as follows:
Payout per ranking position for the TSR performance incentive zone
Ranking 19 18 17 16 15 14 13 12 11 10 9 8 7 6 5 4 3 2 1
Current % - - - - - - - - - 0 0 0 0 0 50 100 150 200 250
Proposed % 0 0 0 0 0 0 0 0 0 50 75 100 100 125 150 150 175 200 200
All pay-out results and calculations will continue to be auditedby our external auditor.

106
annual report 2016 − Randstad Holding nv
Principles
Sound corporate governance is a key component ofRandstad's culture and is consistent with its core values.Randstad's corporate governance is supported by a strongfocus on integrity, transparency, and clear and timelycommunication. Good governance and proper supervision areimportant prerequisites for generating and maintaining trustin Randstad and its management.
Randstad is incorporated and based in the Netherlands. As aresult, Randstad's governance structure is based on therequirements of Dutch legislation, the company's Articles ofAssociation, complemented by internal policies andprocedures. Given the worldwide exposure of its businesses,the international context is of vital importance, andinternational developments are closely monitored.
Randstad has always sought to enhance its governance in linewith the Dutch Corporate Governance Code ('the Code',which can be found atwww.commissiecorporategovernance.nl) and internationalbest practices. Any substantial changes in Randstad'scorporate governance structure will be submitted to theAnnual General Meeting of Shareholders.
Randstad has a two-tier board structure, requiring a well-managed relationship between the Executive Board and theSupervisory Board. The two Boards have specificresponsibilities. The Supervisory Board oversees and advisesthe Executive Board in performing its management tasks andguides its general development, including the financialpolicies and corporate structure. The Supervisory Board hasthe employer role for the members of the Executive Board. Inperforming their duties, the members of the SupervisoryBoard are guided by the interests of Randstad and all itsstakeholders. The role of the Supervisory Board has grown inrecent years, and now requires Board members to play a moreprominent and active role, thinking along with and advisingthe Executive Board on key matters, such as strategicprocesses, important operational decisions, organizationalstructure, and senior management development.
Corporate governance declarationThe Executive Board and the Supervisory Board, which arejointly responsible for the corporate governance structure ofRandstad, are of the opinion that almost all of the principlesand best-practice provisions of the Code are being applied.We strongly believe that these principles and provisions areconsistent with our core values. This means that we do notmerely take a 'box ticking' approach to compliance. As theCode is based on the 'apply or explain' principle, a very limitednumber of exceptions to the Code, which are deemednecessary in the interests of Randstad, have been explained toshareholders and are described in this report. This report alsoincludes the information that needs to be disclosed inaccordance with the corporate governance declaration asreferred to in the relevant Dutch governmental decree.
Executive Board
Tasked with the overall management of Randstad, theExecutive Board is accountable for developing and executingthe strategy. The Executive Board is also responsible for theassociated risk profile, financial controls, the development ofresults, and the resolution of corporate responsibility issues,while simultaneously respecting policies that have been set.The responsibility for the management of Randstad is vestedcollectively in the Executive Board. Each member has dutiesrelated to the specific area of responsibilities and expertise.The Company Secretary acts as secretary to the ExecutiveBoard.
The Supervisory Board is empowered to recommend to theAnnual General Meeting of Shareholders candidates to beappointed to the Executive Board. The Supervisory Boarddetermines the remuneration of the members of theExecutive Board, in accordance with the remuneration policyadopted by the Annual General Meeting of Shareholders.
Since 2005, new board members have been appointed for amaximum term of four years. The division of tasks betweenthe members of the Executive Board requires the approval ofthe Supervisory Board. Members need the prior approval ofthe Supervisory Board before they can take up a boardposition at another company. A member of the ExecutiveBoard may not be a member of the Supervisory Board ofmore than two listed companies or serve as Chair of theSupervisory Board of another listed company.
Supervisory Board
The Supervisory Board supervises and advises the ExecutiveBoard in performing its management tasks, sets the directionof the Randstad business and guides its general development,including the financial policies and corporate structure. Itevaluates the strategy, development of results, operatingmodel, and sustainability framework established under theExecutive Board's management. Major managementdecisions, including those involving strategy, require theapproval of the Supervisory Board. The Supervisory Boardfurther supervises the structure and management of systemsof internal business controls and the financial reportingprocess.
The Supervisory Board is empowered to recommend to theAnnual General Meeting of Shareholders candidates to beappointed to the Supervisory Board. Such appointments areconsidered on the basis of a profile, taking into account thenature of Randstad's activities and the desired backgroundand expertise of candidates. Diversity is an important criterionin order to establish a balance in nationality, gender, age,experience, and background of the individual members. TheSupervisory Board aims for at least one-third of itsmembership to meet the diversity criteria. Members of theSupervisory Board should limit the number of Supervisory
corporate governance
107
annual report 2016 − Randstad Holding nv
Board memberships and other positions they may hold atlisted and non-listed companies in such a way as to guaranteethe proper performance of his or her duties, and may not holdmore than five Supervisory Board memberships in Dutchcompanies or other large organizations, whereby a Chaircounts as two memberships. Supervisory Board remunerationis determined by the Annual General Meeting of Shareholdersand not linked to the company's results.
Randstad ensures that there are structured reporting lines tothe Supervisory Board. The Supervisory Board meets regularlythroughout the year, according to a pre-arranged schedule,both with and without the Executive Board and seniormanagement. Through frequent informal consultation withand updates from the members of the Executive Board inbetween the meetings, the Supervisory Board remains wellinformed about the general state of affairs within Randstad.At the end of each year, the Supervisory Board extensivelyassesses the composition, performance, and functioning of theExecutive Board and the Supervisory Board, as well as theirindividual members.
The Chair of the Supervisory Board ensures the properfunctioning of the Board and its Committees, and acts as themain contact for the Executive Board. The Vice-Chair replacesthe Chair when required, and acts as the contact for the otherBoard members on matters relating to the functioning of theChair. The Company Secretary acts as secretary to theSupervisory Board.
Supervisory Board CommitteesWhile the Supervisory Board retains overall responsibility forits functions, it assigns some of its tasks to three Committees:the Audit Committee, the Strategy Committee, and theRemuneration and Nomination Committee. Their advice andrecommendations assist the Supervisory Board in its decision-making. All Supervisory Board members are, in principle, alsomembers of at least one but no more than two Committees.
The Audit Committee assists the Supervisory Board in fulfillingits supervisory responsibilities for the integrity of the financialreporting process, the system of internal business controls andrisk management, and the external audit process. TheCommittee assesses the audit plan and the scope andapproach of the external auditor, and monitors progress andperformance. The relationship with the external auditors isevaluated annually. Together with the Executive Board, theAudit Committee reviews quarterly and full-year financialstatements, auditors' reports and the management letter. Theinternal risk and control framework and tax- and treasury-related activities are recurring topics. The Audit Committeemay opt to meet separately with the external auditors todiscuss the quality of financial reporting and cooperation withthe finance departments.
The Strategy Committee acts as a sparring partner for theExecutive Board and contributes in depth to the preparation
of the annual discussion of Randstad's strategy with the fullSupervisory Board.
The Remuneration and Nomination Committee makesrecommendations regarding the remuneration policy for theExecutive Board and the Supervisory Board, for adoption bythe Annual General Meeting of Shareholders. The approvedpolicy then forms the basis for the fixed and variableremuneration of the Executive Board. The Committee is alsotasked with advising on candidates to fill vacancies in theExecutive Board and Supervisory Board, evaluating theperformance of both Boards and their members, reviewingthe company's HR strategy and development of seniormanagement, and ensuring long-term succession planning.
Board complianceBoth Boards, including the Committees of the SupervisoryBoard, have their own by-laws, which set rules regardingobjectives, composition, responsibilities, and workingmethods. These by-laws are available on our corporatewebsite.
Any conflict of interest between Randstad and a Boardmember should be avoided. Any actual or potential conflict ofinterest must be reported immediately to the other Boardmembers and/or the Chair of the Supervisory Board. Anyshareholding in the company must be for the purpose oflong-term investment. Board members must at all timescomply with the provisions contained in the Randstad insiderdealing rules. These rules include, among other items, a policythat stipulates that dealings in Randstad shares and options byBoard members should normally be restricted to the fourweeks following the publication of quarterly financial results,provided that the person involved is not in possession of anyinside information at that time.
Annual General Meeting ofShareholders
Important matters that require the approval of the (Annual)General Meeting of Shareholders are:- Adoption of the annual accounts;- Adoption of profit appropriation and additions to reserves;- Dividends;- Significant changes to the company's corporate
governance;- Remuneration policy of the Executive Board;- Remuneration of the Supervisory Board;- Discharge from liability of the Executive Board for its
management;- Discharge from liability of the Supervisory Board for its
supervision of the management;- Appointment of the external auditor;- Appointment, suspension, or dismissal of the members of
the Executive Board and the Supervisory Board;

108
annual report 2016 − Randstad Holding nv
- Authorization to purchase, issue, or sell shares in theGroup's capital;
- Adoption of amendments to the Articles of Association.
Further details about the proposals that the Executive Boardor the Supervisory Board can submit to the meeting and theprocedure according to which shareholders themselves cansubmit matters for consideration by the meeting are specifiedin the company's Articles of Association.
The Annual General Meeting of Shareholders, which isnormally held at the end of March or in early April, isbroadcast live by audio webcast via our corporate website. Asspecified in the notice for the meeting, voting instructions(anonymous if desired) can be given to an independent thirdparty in advance of the meeting. Within three months of themeeting, the draft minutes of the meeting are made availablefor three months for comments. The definitive minutes arepublished on our corporate website.
Voting rightsThe issued share capital of Randstad currently consists of 183.0million ordinary shares, 25.2 million preference shares B, 14.6million preference shares C1, and 35.6 million preferenceshares C2. The ordinary shares have equal voting rights ('oneshare, one vote'). The voting rights on the preference sharesare aligned with the capital contribution upon issuance.Effective at a Shareholders' meeting, the voting rights on thepreference shares B are 3.6 million, and the voting rights onthe preference shares C are 5.6 million.
The foundation Stichting Administratiekantoor PreferenteAandelen Randstad Holding holds the preference shares Band C. The foundation's Board consists of Bas Kortmann(Chair), Stépan Breedveld, and Sjoerd van Keulen. The Boardmembers are fully independent. The foundation's Articles ofAssociation were compiled in accordance with Annex X,Euronext Amsterdam Rule Book, Book II. Depository receiptsissued by the foundation are held by, among others,Nationale Nederlanden NV, ASR NV, Richmond, and RandstadBeheer BV. Although the voting rights attached to thepreference shares are vested in the foundation, eachdepositary receipt holder can ask for a proxy to exercise thevoting rights underlying his or her depositary receipts during aShareholders' Meeting.
Randstad may issue preference shares A to a legal entitycharged with safeguarding the company's interests andpreventing influences that may threaten its continuity,independence, or identity. To date, no such shares have beenissued. Resolutions for such an issue would require thecooperation of the Annual General Meeting of Shareholders.
As at December 31, 2016, the holders of approximately 95.8%of ordinary shares have been able to make unrestricted use oftheir voting rights. The other 4.2% of ordinary shares havebeen converted into depository receipts. A foundation,Stichting Administratiekantoor Randstad Optiefonds, holds
those shares, in which the attached voting rights are vested.The depository receipts issued by StichtingAdministratiekantoor Randstad Optiefonds are fullyexchangeable into ordinary shares, and are held by StichtingRandstad Optiefonds. Frits Goldschmeding, the company'sfounder, is the sole Board member of StichtingAdministratiekantoor Randstad Optiefonds.
Internal risk management and control systemsA detailed description of Randstad's Risk & Controlframework, including a description of the most important riskmanagement and control systems, is given in the section 'Risk& opportunity management'.
Exceptions to the Code
Randstad applies all relevant provisions of the (updated)Dutch Corporate Governance Code, with the followingexceptions.
II.1.1 A Management Board member is appointed for amaximum period of four years.The members of the Executive Board appointed before 2005were appointed for an indefinite period. Those appointedsince 2005, including the CEO, have been appointed for aperiod of four years.
II.2.5 Shares granted to Management Board members withoutfinancial consideration shall be retained for a period of atleast five years.The long-term incentive for the Executive Board is paid inperformance shares, which vest after three years. Performanceshares need to be retained for at least two more years. Webelieve this five-year term sufficiently enhances shareholderalignment and is in line with the long-term nature of theincentive. However, Randstad also believes that share salesshould be allowed earlier to the extent necessary to settle anyrelated tax liabilities.
III.5 If the Supervisory Board comprises more than fourmembers, it should designate a Remuneration Committee anda Selection and Appointment Committee.As it felt that issues related to selection, appointment, andremuneration are interlinked, the Supervisory Board decidedthat all these activities should be dealt with by oneCommittee: the Remuneration and Nomination Committee.
corporate governance
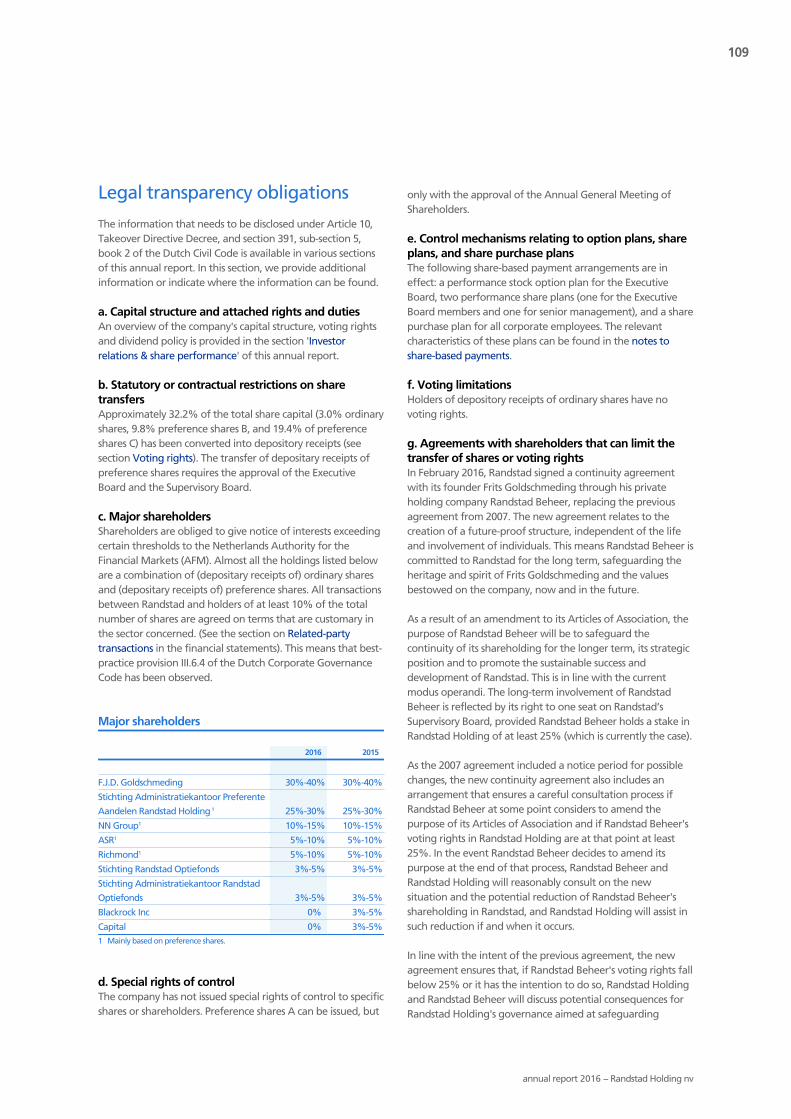
109
annual report 2016 − Randstad Holding nv
Legal transparency obligations
The information that needs to be disclosed under Article 10,Takeover Directive Decree, and section 391, sub-section 5,book 2 of the Dutch Civil Code is available in various sectionsof this annual report. In this section, we provide additionalinformation or indicate where the information can be found.
a. Capital structure and attached rights and dutiesAn overview of the company's capital structure, voting rightsand dividend policy is provided in the section 'Investorrelations & share performance' of this annual report.
b. Statutory or contractual restrictions on sharetransfersApproximately 32.2% of the total share capital (3.0% ordinaryshares, 9.8% preference shares B, and 19.4% of preferenceshares C) has been converted into depository receipts (seesection Voting rights). The transfer of depositary receipts ofpreference shares requires the approval of the ExecutiveBoard and the Supervisory Board.
c. Major shareholdersShareholders are obliged to give notice of interests exceedingcertain thresholds to the Netherlands Authority for theFinancial Markets (AFM). Almost all the holdings listed beloware a combination of (depositary receipts of) ordinary sharesand (depositary receipts of) preference shares. All transactionsbetween Randstad and holders of at least 10% of the totalnumber of shares are agreed on terms that are customary inthe sector concerned. (See the section on Related-partytransactions in the financial statements). This means that best-practice provision III.6.4 of the Dutch Corporate GovernanceCode has been observed.
Major shareholders
2016 2015
F.J.D. Goldschmeding 30%-40% 30%-40%
Stichting Administratiekantoor Preferente
Aandelen Randstad Holding 1 25%-30% 25%-30%
NN Group1 10%-15% 10%-15%
ASR1 5%-10% 5%-10%
Richmond1 5%-10% 5%-10%
Stichting Randstad Optiefonds 3%-5% 3%-5%
Stichting Administratiekantoor Randstad
Optiefonds 3%-5% 3%-5%
Blackrock Inc 0% 3%-5%
Capital 0% 3%-5%1 Mainly based on preference shares.
d. Special rights of controlThe company has not issued special rights of control to specificshares or shareholders. Preference shares A can be issued, but
only with the approval of the Annual General Meeting ofShareholders.
e. Control mechanisms relating to option plans, shareplans, and share purchase plansThe following share-based payment arrangements are ineffect: a performance stock option plan for the ExecutiveBoard, two performance share plans (one for the ExecutiveBoard members and one for senior management), and a sharepurchase plan for all corporate employees. The relevantcharacteristics of these plans can be found in the notes toshare-based payments.
f. Voting limitationsHolders of depository receipts of ordinary shares have novoting rights.
g. Agreements with shareholders that can limit thetransfer of shares or voting rightsIn February 2016, Randstad signed a continuity agreementwith its founder Frits Goldschmeding through his privateholding company Randstad Beheer, replacing the previousagreement from 2007. The new agreement relates to thecreation of a future-proof structure, independent of the lifeand involvement of individuals. This means Randstad Beheer iscommitted to Randstad for the long term, safeguarding theheritage and spirit of Frits Goldschmeding and the valuesbestowed on the company, now and in the future.
As a result of an amendment to its Articles of Association, thepurpose of Randstad Beheer will be to safeguard thecontinuity of its shareholding for the longer term, its strategicposition and to promote the sustainable success anddevelopment of Randstad. This is in line with the currentmodus operandi. The long-term involvement of RandstadBeheer is reflected by its right to one seat on Randstad’sSupervisory Board, provided Randstad Beheer holds a stake inRandstad Holding of at least 25% (which is currently the case).
As the 2007 agreement included a notice period for possiblechanges, the new continuity agreement also includes anarrangement that ensures a careful consultation process ifRandstad Beheer at some point considers to amend thepurpose of its Articles of Association and if Randstad Beheer'svoting rights in Randstad Holding are at that point at least25%. In the event Randstad Beheer decides to amend itspurpose at the end of that process, Randstad Beheer andRandstad Holding will reasonably consult on the newsituation and the potential reduction of Randstad Beheer'sshareholding in Randstad, and Randstad Holding will assist insuch reduction if and when it occurs.
In line with the intent of the previous agreement, the newagreement ensures that, if Randstad Beheer's voting rights fallbelow 25% or it has the intention to do so, Randstad Holdingand Randstad Beheer will discuss potential consequences forRandstad Holding's governance aimed at safeguarding

110
annual report 2016 − Randstad Holding nv
Randstad's development, continuity and strategic position inthe new share ownership structure.
h. Regulations concerning the appointment anddismissal of Board members and changes to theArticles of AssociationMembers of the Executive Board and Supervisory Board areappointed by, and may at any time be suspended or dismissedby, the Annual General Meeting of Shareholders. ASupervisory Board member is eligible for reappointmenttwice. Resolutions with respect to appointment and dismissalare passed by an absolute majority of the votes cast. If anamendment to the Articles of Association is proposed to theAnnual General Meeting of Shareholders, this is always statedin the convening notice for that meeting. A copy of theproposal, containing the verbatim text of the proposedamendment, is simultaneously deposited at the company'shead office, for perusal by every shareholder, as well as byevery holder of depository receipts, until the end of themeeting. Copies are made available free of charge.Amendments to the Articles of Association involving changesto the special rights accruing to the holders of preferenceshares require the approval of the holders of preferenceshares concerned at the meeting.
i. Authority of the Executive Board, especially to issueand repurchase shares in the companySubject to the approval of the Supervisory Board, theExecutive Board is authorized to issue shares, grantsubscription rights, and restrict or exclude pre-emptive rightsfor holders of ordinary shares until September 30, 2017, for anannual maximum of 3% of the issued share capital of thecompany. This issuance will mainly be for the purposes of theperformance stock option and share plans pertaining to theExecutive Board and senior management. The ExecutiveBoard is also authorized, subject to the approval of theSupervisory Board, to repurchase shares until September 30,2017, for an annual maximum of 10% of the issued sharecapital of the company. The repurchase will mainly be for thepurposes of the performance share plans pertaining to theExecutive Board and senior management.
j. Change of control arrangementsChange of control provisions have been included in thecompany's revolving syndicated credit facility, as well as thecompany's performance share and option plans for theExecutive Board and senior management, and the sharepurchase plan for corporate employees.
k. Agreements with Board members or employeesThe severance payment for all members of the ExecutiveBoard has been set at a maximum of one annual base salary inaddition to the notice period of 12 months.
corporate governance

111
financialstatements

112
annual report 2016 − Randstad Holding nv
consolidated financial statements
Consolidated statement of comprehensive income 113
Consolidated balance sheet at December 31 114
Consolidated statement of cash flows 115
Consolidated statement of changes in equity 116
main notes to the consolidated financial statements
1. General information 117
2. Summary of significant accounting policies 117
3. Capital and financial risk management 118
4. Critical accounting policies, judgments, estimates and assumptions122
4.1 Impairments 123
4.2 Provisions and employee benefit obligations 126
4.3 Corporate taxes 129
4.4 Revenue recognition 131
5. Segment reporting 133
6. Business combinations 135
7. Earnings per ordinary share 137
notes to the consolidated income statement
8. Cost of services and total operating expenses 138
9. Total wages and salaries, social security and pension charges 139
10. Net finance costs 139
11. Net income 140
12. Total other comprehensive income 140
notes to the consolidated balance sheet
13. Property, plant and equipment 141
14. Software 142
15. Acquisition-related intangible assets 143
16. Financial assets 144
17. Associates 145
18. Trade and other payables 146
19. Total equity and dividends per share 146
20. Other liabilities 148
notes to the consolidated statement of cash flows
21. Statement of cash flows 149
other notes to the consolidated financial statements
22. Subsidiaries 151
23. Share-based compensations 152
24. Related-party transactions 154
25. Employee benefit obligations 157
26. Number of employees (average) 159
27. Commitments 159
28. Auditors' fees 159
29. Events after balance sheet date 159
company financial statements
Income statement 160
Balance sheet at December 31 161
notes to the company financial statements
1 Accounting policies for the company financial statements 162
2. Net revenue 162
3. Software 162
4. Subsidiaries 162
5. Long-term loans receivable from subsidiaries 162
6. Receivables 162
7. Shareholders' equity 162
8. Borrowings 163
9. Trade and other payables 163
10. Number of employees (average) 163
11. Remuneration 163
12. Related parties 163
13. Guarantees and commitments 163
14. Auditors' fees 164
other information
Events after balance sheet date 165
Provisions in the Articles of Associationconcerning profit appropriation 165
Proposed profit appropriation 167
Independent auditor's report 168
financial statements
contents

113
annual report 2016 − Randstad Holding nv
in millions of € Note Page 2016 2015
Revenue 4.4 131 20,684.1 19,219.2
Cost of services 8.1 138 16,749.9 15,624.7
Gross profit 5.1 133 3,934.2 3,594.5
Selling expenses 8.2 138 2,092.6 1,922.4
Amortization and impairment of acquisition-related intangible assets and goodwill 8.4 139 101.4 127.3
Other general and administrative expenses 8.2 138 949.6 840.1
General and administrative expenses 1,051.0 967.4
Total operating expenses 8.2 138 3,143.6 2,889.8
Operating profit 5.1 133 790.6 704.7
Finance income 10 139 18.8 8.5
Finance expenses 10 139 (22.6) (37.6)
Net finance costs 10 139 (3.8) (29.1)
Share in profit and result on disposal of associates 17 145 (0.8) 6.8
Income before taxes 786.0 682.4
Taxes on income 4.3 129 (197.8) (163.6)
Net income 11 140 588.2 518.8
Items that may be reclassified subsequently to the income statement 12 140 16.5 150.1
Items that will not be reclassified to the income statement 12 140 (6.5) (0.6)
Total other comprehensive income, net of taxes 12 140 10.0 149.5
Total comprehensive income 598.2 668.3
Net income attributable to:
Holders of ordinary shares of Randstad Holding nv 575.4 506.2
Holders of preference shares of Randstad Holding nv 12.6 12.6
Equity holders 588.0 518.8
Non-controlling interests 0.2 0.0
Net income 588.2 518.8
Earnings per share attributable to the holders of ordinary shares of Randstad Holding nv
(expressed in € per ordinary share)
Basic earnings per ordinary share (€) 7 137 3.15 2.79
Diluted earnings per ordinary share (€) 7 137 3.13 2.76
Total comprehensive income attributable to:
Holders of ordinary shares of Randstad Holding nv 585.4 655.7
Holders of preference shares of Randstad Holding nv 12.6 12.6
Equity holders 598.0 668.3
Non-controlling interests 0.2 0.0
Total comprehensive income 598.2 668.3
consolidated statement of comprehensive incomeThe notes on pages 117 to 159 are an integral part of these consolidated financial statements.
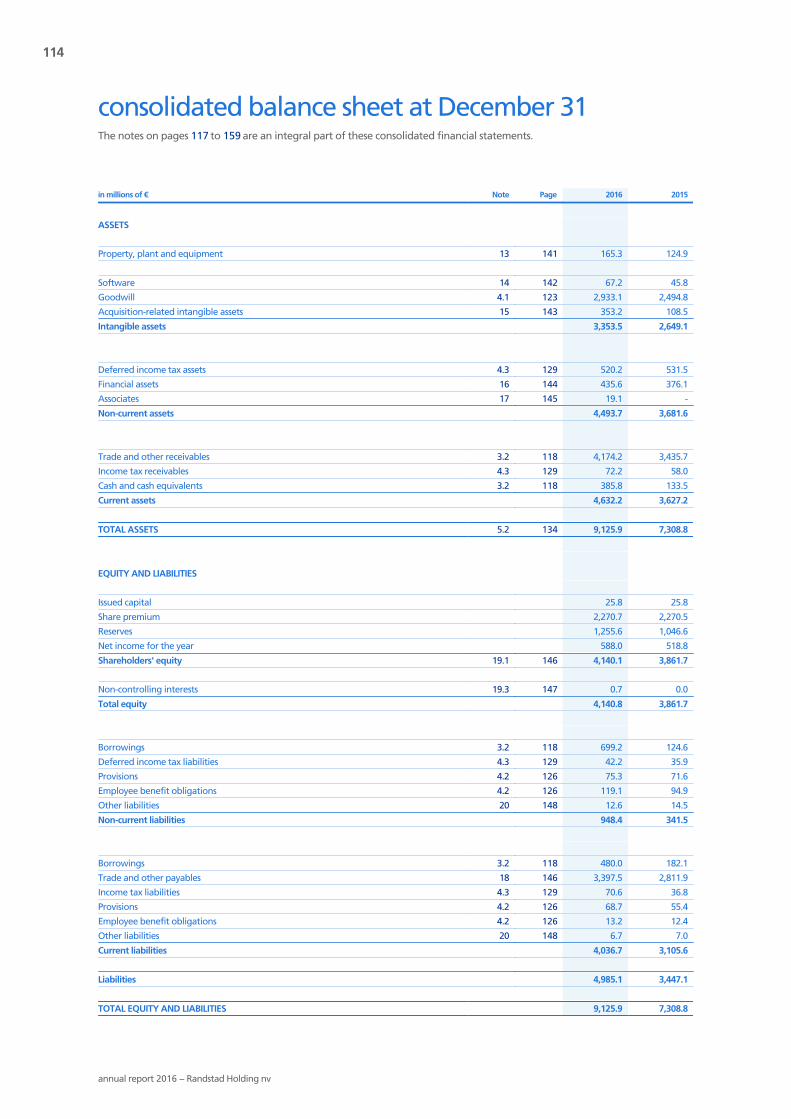
114
annual report 2016 − Randstad Holding nv
in millions of € Note Page 2016 2015
ASSETS
Property, plant and equipment 13 141 165.3 124.9
Software 14 142 67.2 45.8
Goodwill 4.1 123 2,933.1 2,494.8
Acquisition-related intangible assets 15 143 353.2 108.5
Intangible assets 3,353.5 2,649.1
Deferred income tax assets 4.3 129 520.2 531.5
Financial assets 16 144 435.6 376.1
Associates 17 145 19.1 -
Non-current assets 4,493.7 3,681.6
Trade and other receivables 3.2 118 4,174.2 3,435.7
Income tax receivables 4.3 129 72.2 58.0
Cash and cash equivalents 3.2 118 385.8 133.5
Current assets 4,632.2 3,627.2
TOTAL ASSETS 5.2 134 9,125.9 7,308.8
EQUITY AND LIABILITIES
Issued capital 25.8 25.8
Share premium 2,270.7 2,270.5
Reserves 1,255.6 1,046.6
Net income for the year 588.0 518.8
Shareholders' equity 19.1 146 4,140.1 3,861.7
Non-controlling interests 19.3 147 0.7 0.0
Total equity 4,140.8 3,861.7
Borrowings 3.2 118 699.2 124.6
Deferred income tax liabilities 4.3 129 42.2 35.9
Provisions 4.2 126 75.3 71.6
Employee benefit obligations 4.2 126 119.1 94.9
Other liabilities 20 148 12.6 14.5
Non-current liabilities 948.4 341.5
Borrowings 3.2 118 480.0 182.1
Trade and other payables 18 146 3,397.5 2,811.9
Income tax liabilities 4.3 129 70.6 36.8
Provisions 4.2 126 68.7 55.4
Employee benefit obligations 4.2 126 13.2 12.4
Other liabilities 20 148 6.7 7.0
Current liabilities 4,036.7 3,105.6
Liabilities 4,985.1 3,447.1
TOTAL EQUITY AND LIABILITIES 9,125.9 7,308.8
consolidated balance sheet at December 31The notes on pages 117 to 159 are an integral part of these consolidated financial statements.

115
annual report 2016 − Randstad Holding nv
in millions of € Note Page 2016 2015
Operating profit 790.6 704.7Amortization and impairment of acquisition-related intangible assets 8.4 101.4 127.3
Operating profit before amortization and impairment of acquisition-related intangibleassets and goodwill (EBITA) 5.1 892.0 832.0
Depreciation and impairment of property, plant and equipment 8.3 50.0 45.5
Amortization and impairment of software 8.3 24.1 19.2
Operating profit before depreciation, amortization and impairment (EBITDA) 5.1 966.1 896.7
Provisions 4.2 (7.9) (27.8)
Employee benefit obligations 25 7.7 (4.6)
Share-based compensations 23.4 31.3 29.1
Loss on disposals of property, plant and equipment 13 0.2 0.3
Gain on disposal of activities 6.2 0.0 (1.6)
Other non-cash items 21.4 (108.4) (99.2)
Cash flow from operations before operating working capital and income taxes 889.0 792.9
Trade and other receivables 21.2 (366.4) (270.6)
Trade and other payables 21.3 196.9 148.7
Operating working capital (169.5) (121.9)
Corporate income taxes 21.5 (159.8) (105.4)
Net cash flow from operating activities 559.7 565.6
Additions to property, plant and equipment 13 (62.3) (42.0)
Additions to software 14 (34.9) (25.2)
Acquisition of subsidiaries 6.1 (571.8) (89.0)
Acquisition of equity investments 16.2 (9.3) (7.4)
Loans and receivables 16.1 (1.1) (3.8)
Acquisition of associates 17 (0.3) -
Disposals of property, plant and equipment 13 3.2 4.2
Disposal of subsidiaries/activities 6.2 0.7 4.1
Disposal of associates 17 - 8.4
Net cash flow from investing activities (675.8) (150.7)
Issue of new ordinary shares 19.1 0.1 4.2
Purchase of own ordinary shares 19.1 (35.8) (58.3)
Drawings on / (repayments of) syndicated loan 3.2 552.9 (212.1)
(Repayments of) other non-current borrowings 3.2 (87.4) -
Net financing 429.8 (266.2)Finance income 10 3.2 3.9
Finance expenses 10 (15.0) (13.0)
Dividend on ordinary shares 19.2 (307.2) (81.5)
Dividend on preference shares 19.2 (12.6) ( 12.6)
Net reimbursement to financiers (331.6) (103.2)
Net cash flow from financing activities 98.2 (369.4)
Net (decrease) / net increase in cash, cash equivalents and current borrowings (17.9) 45.5
Cash, cash equivalents and current borrowings at January 1 21.1 (48.6) (107.0)Net movement in cash, cash equivalents and current borrowings (17.9) 45.5
Translation and currency gains 13.7 12.9
Cash, cash equivalents and current borrowings at December 31 21.1 (52.8) (48.6)
Free cash flow 21.6 464.6 498.8
consolidated statement of cash flowsThe notes on pages 117 to 159 are an integral part of these consolidated financial statements.

116
annual report 2016 − Randstad Holding nv
in millions of €
Issuedcapital
Sharepremium
Reserves 1 Netincome
Share-holders'
equity
Non-controlling
interests
Totalequity
Treasuryshares
Translationand other 2
Share-based
paymentsEmployee
benefitsRetainedearnings
Balance at January 1, 2016 25.8 2,270.5 (47.5) 205.1 50.4 (40.6) 879.2 518.8 3,861.7 0.0 3,861.7
Net income - - - - - - - 588.0 588.0 0.2 588.2
Total other comprehensive income - - - 16.5 - (6.5) - - 10.0 0.0 10.0
Total comprehensive income - - - 16.5 - (6.5) - 588.0 598.0 0.2 598.2
Transactions with owners:
Dividend 2015 on ordinary shares - - - - - - 199.0 (506.2) (307.2) - (307.2)
Dividend 2015 on preference
shares - - - - - - - (12.6) (12.6) - (12.6)
Purchase of own ordinary shares - - (35.8) - - - - - (35.8) - (35.8)
Share-based compensations: - - - - - - - - - - -
- fair value of vesting rights - - - - 31.3 - - - 31.3 - 31.3
- stock options exercised (on newly
issued shares) 0.0 0.2 - - (0.1) - 0.0 - 0.1 - 0.1
- performance shares issued - - 54.6 - (27.4) - (27.2) - - - -
- taxes on share-based
compensations - - - - - - 4.7 - 4.7 - 4.7
Total transactions with owners 0.0 0.2 18.8 - 3.8 - 176.5 (518.8) (319.5) - (319.5)
Acquisition of non-controlling
interests - - - - - - - - - 0.6 0.6
Disposal of non-controlling
interests - - - - - - (0.1) - (0.1) (0.1) (0.2)
Balance at December 31, 2016 25.8 2,270.7 (28.7) 221.6 54.2 (47.1) 1,055.6 588.0 4,140.1 0.7 4,140.8
Balance at January 1, 2015 25.5 2,261.1 (13.0) 55.0 56.9 (40.0) 627.5 340.1 3,313.1 0.0 3,313.1
Net income - - - - - - - 518.8 518.8 0.0 518.8
Total other comprehensive income - - - 150.1 - (0.6) - - 149.5 0.0 149.5
Total comprehensive income - - - 150.1 - (0.6) - 518.8 668.3 0.0 668.3
Transactions with owners:
Dividend 2014 on ordinary shares 0.3 (0.4) - - - - 246.1 (327.5) (81.5) - (81.5)
Dividend 2014 on preference
shares - - - - - - - (12.6) (12.6) - (12.6)
Purchase of own ordinary shares - - (58.3) - - - - - (58.3) - (58.3)
Share-based compensations:
- fair value of vesting rights - - - - 29.1 - - - 29.1 - 29.1
- stock options exercised (on newly
issued shares) 0.0 9.8 - - (2.7) - (2.9) - 4.2 - 4.2
- performance shares issued - - 23.8 - (32.9) - 9.1 - - - -
- taxes on share-based
compensations - - - - - - (0.6) - (0.6) - (0.6)
Total transactions with owners 0.3 9.4 (34.5) - (6.5) - 251.7 (340.1) (119.7) - (119.7)
Balance at December 31, 2015 25.8 2,270.5 (47.5) 205.1 50.4 (40.6) 879.2 518.8 3,861.7 0.0 3,861.71 The total of the various items included under ’reserves’ within shareholders’ equity as at December 31, 2016 is € 1,255.6 million (December 31, 2015: € 1,046.6 million).
Additional information with respect to equity is given in note 19.2 As at December 31, 2016, this reserve includes € 0,9 million (December 31, 2015: € 0,6 million) in respect of 'fair-value through other comprehensive income' -investments. For
presentation purposes in this statement of changes in equity, we have changed comparative figures (from inclusion in 'Employee benefits' to inclusion in 'Translation').
consolidated statement of changes in equityThe notes on pages 117 to 159 are an integral part of these consolidated financial statements.

117
annual report 2016 − Randstad Holding nv
1. General information
Randstad Holding nv is a public limited liability companyincorporated and domiciled in the Netherlands and listed onEuronext Amsterdam. The registered office of the company isin Amsterdam. The address of the company is Diemermere25, 1112 TC Diemen, The Netherlands.
The consolidated financial statements of Randstad Holdingnv include the company and its subsidiaries (together calledthe ‘Group’).
See note 22 for an overview of the major subsidiaries andIFRS consolidation policies.
1.1 ActivitiesRandstad specializes in solutions in the field of flexible workand human resources services. Our services comprisetemporary staffing and permanent placements. We also offeron-site workforce management, as well as other HR services,such as payroll services, outplacement, and job posting andrésumé services on digital platforms.
1.2 Date of authorization of issueThe financial statements were signed and authorized forissue by the Executive Board and Supervisory Board onFebruary 13, 2017. The adoption of the financial statementsand the adoption of the dividend are reserved for theshareholders in the Annual General Meeting of Shareholders(AGM) on March 30, 2017.
2. Summary of significantaccounting policies
The significant accounting policies applied in the preparationof these consolidated financial statements are set outseparately below or explained in the respective notes to thesefinancial statements. These policies have been consistentlyapplied to the periods presented.
2.1 Basis of preparationThe consolidated financial statements have been prepared inaccordance with International Financial Reporting Standardsand IFRS IC interpretations (IFRIC), as adopted by theEuropean Union (hereinafter IFRS) and in accordance withthe legal requirements of Part 9, Book 2 of the Dutch CivilCode.
In 2016, a number of new standards as well as amendmentsto and interpretations of existing IFRS standards becameeffective. These new standards, amendments andinterpretations, as far as they are relevant to the Group, haveno impact on the valuation and classification of assets andliabilities of the Group, nor on its income statement or cashflows.
In 2016 and before, various other new standards, as well asamendments to and interpretations of existing IFRS standardswere published for application in accounting periodsbeginning on or after January 1, 2017. As far as thesestandards, amendments, and interpretations are applicable tothe Group, the Group has decided not to opt for earlyadoption. These new standards, amendments andinterpretations, including IFRS 9 'Financial instruments' andIFRS 15 'Revenue from contracts with customers', areexpected to have no material impact on the valuation andclassification of the assets and liabilities of the Group, nor onits income statement or cash flows, with the exception ofIFRS 16 'Leases', replacing 'IAS 17 Leases' and taking effect onJanuary 1, 2019. IFRS 16 'Leases' will primarily affect theaccounting of leases, and will result in the recognition ofalmost all leases on the balance sheet.
The current distinction between operating and financingleases has been removed from IFRS 16. The standard requiresa lessee to recognize a 'right of use' asset, representing itsright to use the underlying asset and a liability, representingits obligation to make lease payments, for almost all leasecontracts. Short-term leases and low-value leases areexempted. The Group has preliminary decided to make use ofthe latter exemption when and if implemented. The impacton the income statement is that current operating expenseswill be replaced by depreciation and interest; as a result, keymetrics such as operating profit and EBIT(D)A will change.Total expenses (depreciation for 'right of use' assets andinterest on lease liabilities) are higher in the earlier years of atypical lease and lower in the later years, in comparison withcurrent accounting for operating leases.
The typical impact on the statement of cash flows is highercash flows from operating activities, since cash payments forthe principal part of the lease liability are classified in the netcash flow from financing activities.
The Group has started initial assessments of the potentialimpact on its consolidated financial statements. Themonetary effect is yet to be determined, but based oncurrent lease commitments of € 750 million, this will have amaterial effect on the valuation of assets and liabilities.
Unless otherwise stated, the financial statements areprepared under the historical cost convention and on a goingconcern basis.
For both current assets and liabilities (expected to berecovered or settled within 1 year) and non-current assetsand liabilities (expected to be recovered or settled after 1year), the corresponding presentation is used on the face ofthe balance sheet.
The Group operates in countries with different currencies. Allsubsidiaries have as their functional currency the localcurrency of the country in which they operate. The Group
main notes to the consolidated financial statements(in millions of €, unless otherwise indicated)

118
annual report 2016 − Randstad Holding nv
and its parent company use the euro as their functional andpresentation currency.
All amounts in tables are presented in millions of euros.
2.2 Fair value estimationFair value estimations are mainly used with respect tofinancial assets and financial liabilities.
As no financial assets and liabilities of the Group are traded inactive markets, the fair value of financial assets and liabilitiesis estimated by discounting the future contractual cash flowsat current market interest rates that are available to theGroup for similar financial assets and liabilities. The fair valueis only calculated for disclosure purposes.
Because of this valuation method that uses observablemarket data for the interest rates, the resulting fair valueestimates reflect 'Level 2 Financial Instruments' for 2016 and2015.
3. Capital and financial riskmanagement
3.1 Capital managementRandstad Holding’s policy is to maintain a sound financialposition through a leverage ratio (net debt/EBITDA) ofbetween 0 and 2. We believe this is important in order tomaintain candidate, client, creditor and investor confidenceand to sustain the future development of our business.
Our financing policy aims to secure financing which matchesthe Group's mid- to long-term financing requirements.
3.1.1 Dividend policyOur target is to achieve a flexible payout ratio of 40% to 50%of net profit adjusted for amortization and impairment ofacquisition-related intangible assets and goodwill,integration costs and one-offs, provided that our financialposition allows for it.
In our amended dividend policy, we propose that an all-cashdividend be paid when our leverage ratio is below 1.0. Wewill offer an optional dividend (cash or stock) when ourleverage ratio is between 1.0 and 2.0, while proposing anoptional dividend with a premium on stock dividend whenthe leverage ratio is between 2.0 and 2.5. We will continue tooffer a stock dividend when our leverage ratio is above 2.5.
3.2 Financial risk managementThe Group is exposed to a variety of financial risks, includingcredit risk, liquidity risk, foreign currency exchange risk, andinterest rate risk. One of the objectives of the Group’s Risk &Control framework is to minimize potential adverse effectson the financial performance of the Group.
Our Risk & Control framework is in place to ensure that risksare detected, measured, and reported properly. Riskmanagement procedures are carried out under policies thathave been approved by the Executive Board.
3.2.1 Credit riskCredit risk within the Group arises from the possibility thatclients and other counterparties may not be able to settletheir obligations towards the Group.
Credit control policies are included in a blueprint, which is aglobal document including prescribed work procedures andguidelines. To manage credit risk, credit checks areperformed upfront for new customers. For high-risk clients,credit limits are put in place based on internal and/or externalratings. Credit risk is monitored by the credit controldepartments of our operating companies on a daily basis.
The Group has no significant concentrations of credit risk, asthe Group has many clients in a large number of industriesand countries.
Trade and other receivables
2016 2015
Trade receivables 3,593.3 2,993.3
Less: provision for impairment 59.2 38.4
Trade receivables, net of provision for
impairment 3,534.1 2,954.9
Other receivables 456.0 393.7
Prepayments 114.2 80.4
CICE receivables 67.4 -
Held-to-maturity investments 2.5 6.7
4,174.2 3,435.7
The carrying amount of these receivables reflects the fairvalue.
The Group does not hold any collateral as security.
Accounting policyTrade and other receivables are initially stated at fair value.Subsequent measurement is at amortized cost using theeffective interest method less provision for impairment.
A provision for impairment of trade and other receivables isestablished when it is more likely than not that the Groupwill not be able to collect the amounts receivable. Theprovision for impairment of trade receivables is based on thetrade receivable portfolio experience of subsidiaries, as wellas on individual assessments of expected non-recoverablereceivables. Significant financial difficulties of the debtor, theprobability that the debtor will enter into bankruptcy orfinancial reorganization, and serious default or delinquencyin payments are considered indicators that the trade
main notes to the consolidated financial statements

119
annual report 2016 − Randstad Holding nv
receivable is impaired. The amount of the provision is equalto the difference between the carrying amount of the assetand the present value of estimated future cash flows.
Movements in the provision for impairment of tradereceivables
2016 2015
Balance at January 1 38.4 36.5
Acquisition of subsidiaries 28.8 -
Charged to selling expenses 7.7 9.4
Receivables written off as uncollectable (15.6) (7.8)
Translation differences (0.1) 0.3
Balance at December 31 59.2 38.4
In the provision for impairment of trade receivables, anamount of € 43.4 million (2015: € 24.6 million) is included forindividually impaired receivables.
The provision for impaired trade receivables is excludingrecoverable value-added taxes.
Amounts charged to the provision for impairment of tradereceivables are generally written off when there is noexpectation of recovering additional cash.
Aging of trade receivables, based on invoice date
2016 2015
Amount % Amount %
0-4 weeks 2,071.8 57.7 1,756.6 58.7
5-16 weeks 1,409.3 39.2 1,148.4 38.4
17-26 weeks 51.0 1.4 43.4 1.4
Not impaired 3,532.1 98.3 2,948.4 98.5
Impaired 61.0 1.7 44.9 1.5
3,593.1 100.0 2,993.3 100.0
The information with regard to aging categories is based oninvoice date, as the risk of non-payment starts from this date.
Trade receivables that are neither past due nor impairedamount to € 2,990 million (2015: € 2,452 million); an amountof € 542 million (2015: € 496 million) is past due, but notimpaired.
Excess cash positions are invested with preferred financialpartners, which are considered to be high-quality financialinstitutions with sound credit ratings, or in highly rated
liquidity funds. Policies are in place that limit the amount ofcredit exposure to any one financial institution.
For other financial assets, which mainly comprise receivableson governmental or semi-governmental bodies, see note 16.
3.2.2 Liquidity riskLiquidity risk is the risk that the Group will not be able tomeet its financial obligations. The Group’s approach toliquidity risk is to ensure, as far as possible, that it will alwayshave sufficient funds available to meet its liabilities whendue, under both normal and stressed conditions. This risk ismanaged by having sufficient availability of cash, as well ascommitted and uncommitted credit lines, both at Group andsubsidiary level.
Credit facilitiesAs at December 31, 2016, the Group has a € 1,920 million(2015: € 1,800 million) committed multi-currency syndicatedrevolving credit facility at its disposal, which matures in July2021 (2015: July 2020). As the Group exercised the secondextension option in 2016, the final maturity date is now July2021. The facility agreement contains a covenant with respectto the net debt to EBITDA ratio (leverage ratio), as well as aparagraph on material adverse changes. The net debt toEBITDA ratio has a limit of 3.5, and is calculated based on theresults of the Group on a 12-month basis. In certain cases,Randstad is allowed to report a leverage ratio of 4.25x EBITAfor a limited period of time.
The actual net debt to EBITDA ratio as at December 31, 2016,is 0.8, which is well below the limit.
The facility agreement stipulates that the basis for calculationof this ratio are the accounting policies as included in theannual report 2011, being the initial starting date of thecurrent facility.
The credit facility has an interest rate that is based each timeon the term of the drawings, increased by a margin abovethe applicable Euribor or Libor rates. The margin is variableand depends on the leverage ratio. The interest rates at year-end are 0.45% for drawings in euros, 1.2% for drawings in USdollars, 0.71% for drawings in UK pounds sterling, and 0.45%for drawings in Japanese yens, for a term shorter than onemonth. These are also the effective interest rates.
BorrowingsBorrowings are initially recognized at fair value lessattributable transaction costs. Subsequent to initialrecognition, borrowings are stated at amortized cost.
Any difference between the proceeds and the amount to berepaid is recognized in net finance costs during the term ofthe borrowings, using the effective interest method.

120
annual report 2016 − Randstad Holding nv
Total borrowings
2016 2015
Non-current borrowings comprising
drawings on the multi-currency syndicated
revolving credit facility 699.2 124.6
Non-current borrowings 699.2 124.6
Current borrowings 438.6 182.1
Short-term part of non-current
borrowings 41.4 -
Borrowings 480.0 182.1
Total borrowings 1,179.2 306.7
Transaction costs included in the drawings on the multi-currency syndicated revolving credit facility amount to € 5.4million (2015: € 7.6 million).
The existing drawings on the multi-currency syndicatedrevolving credit facility are denominated in euros (€ 100.0million), US dollars (€ 492.6 million), UK pounds sterling(€ 37.3 million), and Japanese yens (€ 74.7 million). Allamounts denominated in currencies other than the euro aredesignated as hedges of the net investment in subsidiaries inthe US, the UK, and Japan. These net-investment hedges areall considered effective.
Current borrowings are denominated in various currencies.As at December 31, 2016, the major amounts denominated inforeign currencies are for an amount of € 9.5 million in USdollars, € 7.1 million in Argentine pesos, € 11.9 million inIndian rupees, and € 2.9 million in Chinese renminbi.
As at December 31, 2016, the short-term part of non-currentborrowings to the amount of € 41.4 million (43.7 million USdollars) represents the remaining part of the long-term debtrelating to the acquisition of Monster, which was repaid atthe beginning of January 2017.
Since the interest rates on the current borrowings fluctuatewith the market, the effective interest rates are consideredequal to the actual rates.
Negative pledges have been issued for purposes of bankoverdraft facilities, and ‘pari passu’ clauses apply.
At year-ends 2016 and 2015, the Group had no outstandinginterest rate or currency derivatives.
Movements in non-current borrowings
2016 2015
Balance at January 1 124.6 315.0
Drawings on / (repayments of) syndicated
loan 552.9 (212.1)
Acquisition of subsidiaries 128.3 -
Repayments of other non-current
borrowings (87.4) -
Amortization of transaction costs 2.2 2.2
Changes in value of other long-term debt (3.9) -
Translation differences 23.9 19.5
Reclassification to short-term part of non-
current borrowings (41.4) -
Balance at December 31 699.2 124.6
main notes to the consolidated financial statements

121
annual report 2016 − Randstad Holding nv
Maturities of financial liabilities are expected to be:
Expected maturities of financial liabilitiesincluding interest payments
Carrying amount 0 - 90 days 91 - 365 days 2 - 5 years More than 5 years
'December 31, 2016
Non-current borrowings 1 699.2 705.2 - - -
Current borrowings 2 480.0 480.0 - - -
Trade and other payables 3 3,279.4 2,788.9 490.5 - -
Other liabilities 4 19.3 1.0 0.8 2.9 18.6
4,477.9 3,975.1 491.3 2.9 18.6
December 31, 2015
Non-current borrowings1 124.6 132.3 - - -
Current borrowings2 182.1 182.1 - - -
Trade and other payables3 2,768.6 2,307.3 461.3 - -
Other liabilities4 21.5 - 0.4 1.8 25.1
3,096.8 2,621.7 461.7 1.8 25.11 Drawings on the syndicated loan contractually mature in January of the subsequent year (see note 21.2); to be extended by new drawings. All amounts are undiscounted.2 No interest is included, since current borrowings are considered repayable upon demand. All amounts are undiscounted and include short-term part of long-term debt.3 Excluding deferred income. All amounts are undiscounted.4 Other liabilities based upon the estimated maturities, due to the nature of put options. Carrying amount is discounted, whereas other amounts are undiscounted.
Cash and cash equivalentsCash and cash equivalents comprise cash on hand and atbank, as well as time deposits and other short-term highlyliquid investments with original maturities of three months orless.
Cash and cash equivalents
2016 2015
Time deposits 19.3 5.6
Cash on hand and at bank 366.5 127.9
385.8 133.5
Time deposits fall due, on average, within a month. Theaverage interest rate for time deposits is 1.4% (2015: 5.9%).
An amount of € 381.3 million out of € 385.8 million (2015:€ 130.4 million out of € 133.5 million) is available upondemand.
Net debtThe net debt includes the balance of cash, cash equivalents,and borrowings (both current and non-current).
Net debt
2016 2015
Non-current borrowings (699.2) (124.6)
Current borrowings (438.6) (182.1)
Short-term part of non-current
borrowings (41.4) -
Total borrowings (1,179.2) (306.7)
Cash and cash equivalents 385.8 133.5
Net debt (793.4) (173.2)
3.2.3 Foreign currency exchange risk
Transactions and balances in currencies other than thefunctional currencyTransactions in currencies other than the functional currencyof the related subsidiary are converted at the foreignexchange rate on the date of the transaction.
Monetary balance sheet items (such as cash and borrowings)in currencies other than the functional currency of the relatedsubsidiary are converted at year-end exchange rates.
Exchange differences resulting from the settlement oftransactions on cash, cash equivalents, and borrowings, aswell as from the conversion of these monetary balance sheetitems, are included in net finance costs. Exchange differencesresulting from the settlement of other transactions andconversion of other monetary balance sheet items areincluded in operating expenses.

122
annual report 2016 − Randstad Holding nv
Non-monetary balance sheet items (such as property, plantand equipment) that are measured in terms of historical costin currencies other than the functional currency of the relatedcompany are converted at the foreign exchange rates on thedate of transaction.
Exposures to foreign currency exchange riskThe Group uses the euro as its reporting currency. Currenciesother than the euro that are of primary importance to theGroup are the Australian dollar, the Canadian dollar, theJapanese yen, the UK pound sterling and the US dollar.
Main exchange rates to the euroaverages on annual basis
2016 2015
Average
At year-
end Average
At year-
end
Australian dollar 0.67 0.68 0.68 0.67
Canadian dollar 0.68 0.70 0.71 0.66
Japanese yen 0.00832 0.00812 0.00745 0.00762
UK pound sterling 1.22 1.17 1.38 1.36
US dollar 0.90 0.95 0.90 0.92
The foreign currency exchange risk of the Group with respectto transactions is limited, because subsidiaries usuallygenerate both revenues and expenses in the same localcurrency.
All other foreign exchange transactions, which mostly consistof intercompany financing (equity increases, dividends,intercompany loans and interests), are executed, in principle,on a spot basis. The Group has a policy to match, withincertain preset boundaries, the currencies in the net debtpositions with the currencies in the cash flow generation. Thecurrency mix of the debt can easily be adjusted, as the € 1,920million syndicated revolving credit facility is a multi-currencyfacility. In principle, the use of derivatives is thereforeunnecessary.
Currency fluctuations can, however, affect the consolidatedresults, due to the translation of local results into the Group'sreporting currency.
Translation effects from consolidation may also impactshareholders' equity. The Group has a number of netinvestments in foreign subsidiaries whose assets and liabilitiesare exposed to currency translation risk that is accounted for,through total other comprehensive income, in equity.Currency exposures arising from the net assets of the Group'sforeign operations are monitored and, when considerednecessary, hedged against borrowings in the relevantcurrencies through a net investment hedge; translationdifferences on borrowings classified as such are included,through comprehensive income, in equity.
SensitivityIf the euro had weakened or strengthened 10% on averageduring 2016 against the currencies mentioned above, with allother variables held constant, EBITA for the year 2016 wouldhave been higher or lower respectively in the range of€ 2 million − € 24 million per currency. The effect onshareholders’ equity would have been the same (before taxeffects) (2015: range of € 2 million − € 22 million percurrency).
3.2.4 Interest rate riskAs we believe the staffing industry has a natural hedge tointerest rate changes (EBITDA levels usually move up anddown more or less in line with interest rate levels), and sincethe Group is cash-generating, the general policy is to keepinterest rates on net debt floating as much as possible. Wealso believe this adds value for shareholders in the long term,as over time floating interest rates are on averagesignificantly lower than fixed interest rates.
SensitivityIf the interest rate had been 1 percentage point higher onaverage during 2016, with all other variables held constant,net interest expenses for the year would have been € 5million higher (2015: € 4 million higher).
4. Critical accounting policies,judgments, estimatesand assumptions
In preparing the financial statements, management has tomake certain judgments, estimates, and assumptions thataffect the application of accounting policies and the reportedamounts of assets, liabilities, revenue, and expenses. Theactual outcome may differ from these judgments, estimates,and assumptions, and therefore could have a material effecton the carrying amount of the asset or liability involved. Thetiming of outflow of resources to settle provisions is subjectto the same uncertain factors. Judgments, estimates, andassumptions are reviewed on an ongoing basis, and arebased on historical experience and various other factors,including expectations about future events that are believedto be reasonable under the circumstances and for the iteminvolved. Revisions to accounting estimates are recognized inthe period in which the estimates are revised and in anyfuture periods affected.
main notes to the consolidated financial statements

123
annual report 2016 − Randstad Holding nv
The Group considers the following accounting policies,judgments, estimates, and assumptions as critical:- Impairment of non-financial assets in general and
impairment of goodwill specifically;- Provisions;- Corporate taxes;- Revenue recognition.
4.1 Impairments
4.1.1 Impairment of non-financial assetsThe carrying amounts of the Group’s non-financial assets,with the exception of deferred tax assets and the plan assetsin relation to defined benefit pension plans, are reviewed forimpairment whenever events or changes in circumstancesindicate that the carrying amount may not be recoverable.For goodwill, testing for impairment is performed at leastannually.
If there are such indications, the recoverable amount of theasset is estimated. If this is not possible, the recoverableamount of the cash-generating unit to which the assetbelongs is estimated. For purposes of impairment testing,assets are grouped at the lowest levels for which there areseparately identifiable cash flows (cash-generating units).Goodwill is allocated to groups of cash-generating units,being operating segments, for purposes of impairmenttesting.
If the recoverable amount of an asset or a cash-generatingunit (or operating segment) is estimated to be lower than itscarrying amount, the related carrying amount is reduced toits recoverable amount.
The resulting impairment loss is immediately recognized intotal operating expenses.
The recoverable amount is the higher of an asset’s fair valueless costs to dispose and its value in use.
The value in use is determined by using the present value ofestimated cash flow projections. The discount rates are basedon interest rates that align with the terms of the projectionsand the specific risks of the asset or business respectively.
In determining the fair value less costs to dispose,information such as recent market transactions is taken intoaccount; if no such transactions (or comparable transactions)can be identified, an appropriate valuation model is used.This valuation model is supplemented by valuation multiples,quoted share prices, or other available fair-value indicators.
Impairment losses relating to a cash-generating unit (oroperating segment) are first allocated to reduce the carryingamount of the goodwill of the related cash-generating unit(or operating segment) and then to reduce the carryingamount of the other assets of that cash-generating unit (oroperating segment) on a pro rata basis.
An impairment loss with respect to goodwill is not reversed.
With respect to other assets, an impairment loss recognizedin a prior period is assessed at each reporting date for anyindications that the loss has decreased or no longer exists. Animpairment loss is reversed if there has been a change in theestimates used to determine the recoverable amount.
For the impairment-testing method of property, plant andequipment, software and acquisition-related intangibleassets, see notes 13, 14 and 15 respectively.
4.1.2 Goodwill and impairment of goodwill
Goodwill
2016 2015
Cost 3,334.8 3,193.7
Accumulated impairment 840.0 818.6
Balance at January 1 2,494.8 2,375.1
Acquisition of subsidiaries 441.2 58.2
Disposal of subsidiaries (0.1) (1.5)
Impairment (9.9) -
Translation differences 7.1 63.0
Balance at December 31 2,933.1 2,494.8
Cost 3,750.2 3,334.8
Accumulated impairment 817.1 840.0
Balance at December 31 2,933.1 2,494.8
In 2016, the Group acquired various companies, resulting inan amount of goodwill of € 441.2 million, based onprovisional purchase price allocations, except for thepurchase price allocation of Proffice, which was finalized inQ4, 2016, with no adjustment compared to the provisionalone in Q1, 2016. For further information on theseacquisitions, see note 6.1.
In 2016, the Group finalized the purchase price allocationrelating to the acquisition of RiseSmart Inc. (USA) in 2015,resulting in a minor adjustment of € 0.2 million, which isincluded in the amount of € 0.2 million in respect ofacquisitions of subsidiaries. The amount involved is neitherconsidered material in relation to the total consideration forRiseSmart Inc. (USA) nor to the total goodwill for RiseSmartInc. (USA).
In 2016, the Group disposed of its subsidiary Randstad Lanka(Private) Limited (Sri Lanka). The related carrying amount ofgoodwill amounting to € 0.1 million has been derecognized.
In 2015, the Group disposed of activities in Australia. Therelated carrying amount of goodwill amounting to € 1.5million has been derecognized.

124
annual report 2016 − Randstad Holding nv
Accounting policiesGoodwill on acquisitions of subsidiaries is included inintangible assets; goodwill on acquisitions of associates isincluded in investments in associates. For the measurement ofgoodwill at initial recognition, see note 6.1.
Goodwill on acquisitions represents payments made by theGroup in anticipation of future economic benefits from assetsthat cannot be identified individually and cannot berecognized separately. These relate, for example, to synergiesexpected from integrating the acquired companies and theworkforces of the acquired companies.
Goodwill is stated at cost less accumulated impairment losses.Gains and losses on the disposal of an entity include thecarrying amount of goodwill relating to the entity that issold. Where goodwill has been allocated to an operatingsegment and part of the operation within that operatingsegment is disposed of, the goodwill related to that part isincluded in the carrying amount of the disposed operationwhen determining the gain or loss on disposal. Goodwilldisposed is calculated based on the relative value of thedisposed operation of the total value of the operatingsegment to which the disposed operation belongs. If disposalof an entity results in a loss, the goodwill part in the loss ispresented in the statement of comprehensive income as animpairment of goodwill, up to a maximum amount of theloss on disposal.
Goodwill is allocated to operating segments for the purposeof impairment testing. The allocation is made to thoseoperating segments that are expected to benefit from thebusiness combination in which the goodwill arose.
Impairment testingIn the case of triggering events and at least annually, theGroup tests whether intangible assets, being goodwill andacquisition-related intangible assets, have suffered anyimpairment. The recoverable amounts of cash-generatingunits have been determined using, among other instruments,value-in-use calculations. These calculations require the use ofestimates. Based on these impairment tests, impairmentlosses, if any, are identified.
Determination of recoverable amountThe recoverable amount for all operating segments is basedon the higher of the value in use and the fair value less costto dispose. The value in use is determined by means of cashflow projections based on the actual operating resultsadjusted for non-cash items (mainly depreciation andamortization) and the expected future performance, which inturn is based on historical performance, management'sestimates and assumptions of revenue growth, and ofdevelopments of operating margins, assessed using externaldata, covering a period of, in principle, nine years (2015: nineyears). Cash flow projections after this period areextrapolated by means of a growth percentage of 0.25%(2015: 0.25%) throughout the Group. The nine-year period of
the projections reflects an estimated full business cycle of theindustry.
Yearly impairment testKey assumptions in the cash flow projections are:- Annual revenue growth of the Group: on average
between 1.4% and 7.0% for the first three years and1.5% to 1.7% for the following six years (Netherlands:(0.2)% to 7.5% and (0.2)% respectively; USA:2.2% to 4.4% and 2.2% to 2.3% respectively);
- EBITA of the Group in the range of 4.5% to 5.0% ofrevenue (Netherlands: 4.8% to 5.0%; USA: 5.7% to 6.1%);
- Growth rate in revenue and EBITA percentages varybetween segments in relatively limited terms and aredependent on the mix in revenue.
The cash flow projections are prepared in local currencies,and discounted with pre-tax discount rates for each currencyinvolved. The pre-tax discount rates vary from 8.3% to20.8% (2015: 8.9% to 30.8%). The weighted average is 12.6%(2015: average 13.0%). Netherlands: 10.7% (2015: 10.6%);USA: 14.0% (2015: 13.8%).
Results of annual impairment testThe annual impairment tests carried out by the Group for2016 resulted in an impairment of € 9.9 million on goodwillfor operating segment India (2015: none) due to lower-than-expected revenue growth and profitability. The pre-taxdiscount rate used was 20.8% (2015: 20.2%). The annualimpairment tests did not indicate that any of the otheroperating segments that contain goodwill may be impaired.
Sensitivity relating to annual impairment testThe outcome of impairment testing is sensitive to variationsin estimates and assumptions. Variations in estimates andassumptions have the following effect on the recoverableamount calculations:- Revenue growth: a 1.0%-point lower growth rate would
not result in an impairment charge;- A 1.0%-point lower EBITA in percentage of revenue
would not result in an impairment charge; a 1.5%-pointlower EBITA in percentage of revenue would imply a € 18million impairment charge for the operating segmentsUnited Kingdom (€ 13 million) and Australia (€ 5 million)(2015: € 19 million: Australia (€ 6 million), India (€ 10million), and Latin America (€ 3 million));
- Discount rate: a 1.0%-point higher discount rate wouldnot result in an impairment charge.
For the carrying amount of goodwill by reporting segment,see note 5.2.
In 2016, the operating segments United Kingdom andAustralia are most sensitive to variations in assumptions(2015: Latin America, India and Sourceright APAC). Therecoverable amount of operating segments United Kingdomand Australia of € 485 million exceeds the carrying amount(including € 170 million of goodwill) by € 186 million.
main notes to the consolidated financial statements

125
annual report 2016 − Randstad Holding nv
The operating segment France has sufficient headroom tocover the previously mentioned variations in assumptions.The operating segments the Netherlands, Belgium &Luxembourg, Germany, USA, Canada, Italy, Spain, Portugal,Switzerland, Eastern Europe, Scandinavia, Poland, Japan,China, Sourceright North America, Hong Kong, Singapore,Malaysia, Sourceright APAC and Sourceright EMEA havesubstantial headroom available.

126
annual report 2016 − Randstad Holding nv
4.2 Provisions and employee benefit obligations
4.2.1 Provisions
Movements in provisions
Restructuring
Workers'
compensation Other Total
Balance at January 1, 2016 22.8 48.3 55.9 127.0
Movements in 2016
Acquisition of subsidiaries 7.8 - 13.2 21.0
Charged to income statement 17.7 23.6 12.8 54.1
Released to income statement (3.2) - (2.7) (5.9)
Withdrawals (19.7) (27.5) (8.9) (56.1)
Total amount in statement of cash flows (5.2) (3.9) 1.2 (7.9)
Interest due to passage of time 0.1 1.2 0.2 1.5
Translation differences 0.1 1.4 0.9 2.4
Balance at December 31, 2016 25.6 47.0 71.4 144.0
Non-current 7.4 30.2 37.7 75.3
Current 18.2 16.8 33.7 68.7
Balance at December 31, 2016 25.6 47.0 71.4 144.0
Balance at January 1, 2015
Non-current 2.5 27.9 43.2 73.6
Current 39.0 18.4 12.5 69.9
41.5 46.3 55.7 143.5
Movements in 2015
Acquisition of subsidiaries - - 4.5 4.5
Charged to income statement 29.7 24.8 19.6 74.1
Released to income statement (2.9) - (10.3) (13.2)
Withdrawals (45.7) (29.3) (13.7) (88.7)
Total amount in statement of cash flows (18.9) (4.5) (4.4) (27.8)
Interest due to passage of time - 1.5 0.2 1.7
Translation differences 0.2 5.0 (0.1) 5.1
Balance at December 31, 2015 22.8 48.3 55.9 127.0
Non-current 4.4 31.0 36.2 71.6
Current 18.4 17.3 19.7 55.4
Balance at December 31, 2015 22.8 48.3 55.9 127.0
Provisions for restructuring are recognized when a detailedand formal restructuring plan is approved, and therestructuring has either commenced or has been announcedpublicly. These restructuring provisions mainly compriseseverance payments for personnel and lease terminationpenalties for branches.
Provisions for workers' compensation are based on claims forcompensation and medical expenses (of both staffing andcorporate employees) in relation to accidents during workinghours, for which the Group is liable under applicable locallaws. These provisions relate to our activities in NorthAmerica and in part of Australia, where we are responsiblefor payment of workers' compensation claims up to amaximum amount per claim, beyond which the costs are
main notes to the consolidated financial statements

127
annual report 2016 − Randstad Holding nv
insured. Independent actuaries calculate the amount of theprovision.
The effective interest rate used in the calculation of theprovision for workers' compensation is 3% (2015: range of2% to 3%).
Other provisions mainly relate to:- Onerous contracts, where the expected benefits to be
derived by the Group from a contract are lower than theunavoidable cost of meeting its obligations under thecontract; and
- Estimated amounts of claims from third parties. Thesegenerally consist of a large number of individual claims.These claims are provided for at the lowest amount atwhich the Group expects the claim to be reasonablysettled. Due to the highly uncertain timing of theexpected future cash outflow, amounts provided forclaims from third parties are categorized to be settledwithin 1 year after the balance sheet date, unless theseare explicitly expected to be settled later.
The majority of the non-current part of these provisions isexpected to be settled within three years of the balance sheetdate.
SensitivityThe provision for workers' compensation is sensitive tointerest rate changes. Should the interest rate deviate by 1percentage point, with all other variables held constant, theprovision would deviate in the range of € 1 million to € 2million (2015: range of € 1 million to€ 2 million).
Accounting policyProvisions are recognized for legally enforceable orconstructive obligations as a result of a past event for whichthe settlement is likely to require an outflow of resources andto the extent these can be reliably estimated. If the effect ismaterial, provisions are determined by discounting theexpected future cash flows at an interest rate that reflects thecurrent market assessments of the time value of money and,where appropriate, the risks specific to the obligation.
4.2.2 Employee benefit obligations
Employee benefit obligations
2016 2015
Defined benefit pension plans 77.8 72.0
Other post-employment benefits 4.2 4.8
Other long-term employee benefits 25.3 32.0
Balance at January 1 107.3 108.8
Movements during the year
Acquisition of subsidiaries 5.8 -
Charged to comprehensive income 77.3 49.3
Withdrawals/benefits paid (47.0) (41.1)
Contributions, employers (11.7) (10.7)
Translation differences 0.6 1.0
Total movements 25.0 (1.5)
Defined benefit pension plans 91.5 77.8
Other post-employment benefits 9.7 4.2
Other long-term employee benefits 31.1 25.3
Balance at December 31 132.3 107.3
Non-current 119.1 94.9
Current 13.2 12.4
Balance at December 31 132.3 107.3
Employee benefit obligations charged tocomprehensive income
2016 2015
Current service cost, total 73.9 54.3
Contributions, employees (7.5) (7.1)
Current service cost net, charged to
operating profit 66.4 47.2
Interest expense due to passage of time 3.3 3.2
Interest income due to passage of time (1.5) (1.7)
Charged to net finance costs 1.8 1.5
Remeasurement losses, net 9.1 0.6
Charged to comprehensive income 77.3 49.3

128
annual report 2016 − Randstad Holding nv
The discount rates used to calculate employee benefitobligations are in the following ranges:
Discount rates (employee benefit obligations)
2016 2015
Defined benefit pension plans 0.5% - 1.9% 0.7% - 2.5%
Other post-employment benefits 1.9% - 2.0% 2.0% - 7.6%
Other long-term employee benefits (0.2)% - 3.0% 0.1% - 4.7%
The obligations regarding other post-employment benefitsand other long-term employee benefits are unfunded.
PensionsThe Group has various pension schemes, in accordance withlocal conditions and practices in the countries in which itoperates. In some countries, such pension schemes areoperated through a company pension fund. Most of thepension schemes are defined contribution plans, which arefunded through payments to independent entities. For theseschemes, the Group's obligation is limited to the payment ofthese annual contributions. The contributions constitute netperiodic costs for the year in which they are due and areincluded in personnel expenses and/or costs of services.
A few pension schemes are defined benefit plans. The liabilityrecognized in the balance sheet is the present value of thedefined benefit obligation less the fair value of plan assets.Independent actuaries calculate the defined benefitobligations based on factors such as age, years of service, andcompensation (projected unit credit method).
The present value of the defined benefit obligation isdetermined by discounting the estimated future cashoutflows using interest rates of high-quality corporate bondsdenominated in the currency in which the benefits will bepaid, and with terms to maturity that approximate the termwhen the related pension liability is due.
Current service costs are recognized in personnel expensesand/or cost of services and reflect the increase in the definedbenefit obligation resulting from employee service in thecurrent year.
Past service costs are recognized immediately in personnelexpenses and/or cost of services.
Remeasurement gains and losses of the net defined benefitobligation arising from experience adjustments and changesin actuarial assumptions are recognized immediately in othercomprehensive income.
The net interest expense on the net defined benefit liability isdetermined by applying the discount rate used to measurethe defined benefit obligation at the beginning of the year
to the then net defined benefit liability. Net interest expenseis recognized in net finance costs.
In the Netherlands and Belgium, three pension schemes areoperated through separate and independent companypension funds. For the Netherlands these pension funds are'Stichting Pensioenfonds Randstad' for corporate employeesand 'Stichting Pensioenfonds Flexsecurity' for staffingemployees employed by Dutch Group companies. Both fundsoperate defined contribution pension plans. StichtingPensioenfonds Randstad operates a closed pension plan. In2016, the transactions with these funds amounted to € 0.2million and € 50.7 million respectively. The balances as atDecember 31, 2016 amounted to zero and € 3.7 millionpayable respectively. For Belgium, the pension fund is'Pensioenfonds Belgische werkmaatschappijen van RandstadOFP' for corporate employees employed by Belgian Groupcompanies. The fund operates a defined benefit pensionplan. In 2016, transactions with this fund amounted to€ 3.8 million. The balance as at December 31, 2016 amountedto € 0.4 million payable.
Other post-employment benefitsOther post-employment benefit plans are defined benefitplans and follow the same accounting treatment as definedbenefit pension plans. Independent actuaries calculate thedefined benefit obligations based on factors such as age,years of service, and compensation (projected unit creditmethod). These plans mainly consist of state-driven plans inItaly and India, and post-employment health benefits in theUSA.
Remeasurements of the obligation − comprising gains andlosses arising from experience adjustments and changes inactuarial assumptions − are recognized immediately in othercomprehensive income.
Other long-term employee benefitsIn accordance with applicable legal requirements, the Grouprecognizes liabilities for several other long-term employeebenefit plans, such as sickness-related schemes and long-service leave plans. These liabilities are based on calculationsmade by independent actuaries based on factors such as age,years of service, expected sickness duration, andcompensation (the 'projected unit credit method').
Remeasurement gains and losses related to these plans arerecognized in personnel expenses and/or cost of services inthe year in which they occur.
For more information on employee benefit obligations, seenote 25.
main notes to the consolidated financial statements

129
annual report 2016 − Randstad Holding nv
4.3 Corporate taxesThe Group is subject to corporate income taxes in numerousjurisdictions. Significant judgment is required in determiningthe worldwide deferred tax asset on, among other items, taxlosses carry-forward. There are many uncertain factors thatinfluence the amount of tax losses carried forward. TheGroup recognizes deferred tax assets on tax losses carriedforward based on its best estimates. The recoverability ofdeferred income tax assets is reviewed and assessedfrequently, using forecasts that are based on the actualoperating results and expected future performance. Externaldata are used for reference if considered necessary. When theactual results are different from the amounts that wereinitially estimated, such differences will impact the incometax in the income statement (effective tax rate), as well as thedeferred tax assets and/or deferred tax liabilities in the periodin which these deviations occur. The Group has also identifieda number of uncertain tax positions, which could lead topositive and/or negative differences.
4.3.1 Deferred and current income taxesUsing the balance sheet liability method, deferred tax assetsand liabilities are recognized to provide for temporarydifferences between the value of the assets and liabilities forfinancial reporting purposes and for tax purposes. Deferredtax assets and liabilities are offset when there is a legallyenforceable right to offset current tax assets against currenttax liabilities, and when the deferred income taxes relate tothe same tax authority.
Deferred tax assets, including those resulting from tax lossescarried forward, are recognized to the extent that it isprobable that future taxable profits will be available againstwhich the temporary differences, including tax losses carriedforward, can be utilized.
Deferred tax assets and liabilities are valued at tax ratesenacted or substantially enacted at year-end and which areexpected to apply in the coming years when the assets andliabilities are expected to be realized or settled.
Deferred tax is provided on temporary differences arising oninvestments in subsidiaries and associates, except for deferredincome tax liabilities arising from undistributed profits frominvestments where the entity is able to control the timing ofthe reversal of the difference and it is probable that thereversal will not occur in the foreseeable future.
Movements in total position of corporate taxes
2016 2015
Assets/(liabilities)
Deferred income tax assets 531.5 534.7
Current income tax receivables 58.0 56.4
Deferred income tax liabilities (35.9) (34.8)
Current income tax liabilities (36.8) (29.2)
Balance at January 1 516.8 527.1
Movements during the year
Charged to income statement (197.8) (163.6)
Net payments 159.8 105.4
Acquisition of subsidiaries' deferred taxes (8.3) (6.3)
Acquisition of subsidiaries' current taxes ( 13.5) -
Recognized in other comprehensive
income 9.3 16.2
Recognized in equity on share-based
compensations 4.7 (0.6)
Translation differences 8.6 38.6
Total movements (37.2) (10.3)
Assets/(liabilities)
Deferred income tax assets 520.2 531.5
Current income tax receivables 72.2 58.0
Deferred income tax liabilities (42.2) (35.9)
Current income tax liabilities (70.6) (36.8)
Balance at December 31 479.6 516.8
Deferred income tax assets
Composition of deferred income tax assets
2016 2015
Tax losses carry-forward 347.7 453.2
Unused tax credits 112.4 87.5
Property, plant, equipment, and
intangible assets 59.0 66.7
Other receivables/other payables 91.3 71.3
Provisions 79.4 69.2
Temporary differences 229.7 207.2
Deferred income tax assets (before
netting) 689.8 747.9
Amount netted with deferred income tax
liabilities (169.6) (216.4)
Deferred income tax assets (after netting) 520.2 531.5
Deferred income tax assets in relation to tax losses carriedforward comprise an amount of € 64 million (2015:€ 81 million), originating from subsidiaries that showed taxlosses in the current or preceding year.

130
annual report 2016 − Randstad Holding nv
Certain deferred income tax assets, whose recoverability isconsidered not probable, are valued at nil. These concerndeferred tax assets in relation to tax losses carried forward of€ 334 million (2015: € 307 million), as well as deferred taxassets relating to other temporary differences of € 2 million(2015: € 2 million).
The part of deferred tax assets that is expected to berecovered within one year is estimated at € 90 million (2015:€ 99 million).
SensitivityThe deferred tax assets are only recognized to the extent thatit is considered probable that future taxable profits will beavailable against which these deferred tax assets can beutilized. The scenarios used are in agreement with theestimates and assumptions used in the goodwill impairmenttesting (see note 4.1.2). The various scenarios yield potentialoutcomes that do not materially deviate from the carryingamount.
Unused tax credits mainly relate to tax credits in the USA,which will be realized after all tax losses carried forward havebeen recovered.
Deferred income tax liabilities
Composition of income tax liabilities
2016 2015
Acquisition-related intangible assets 28.3 26.0
Temporary differences subsidiaries 71.0 117.2
Other temporary differences 112.5 109.1
Deferred income tax liabilities (before netting) 211.8 252.3
Amount netted with deferred income tax assets (169.6) (216.4)
Deferred income tax liabilities (after netting) 42.2 35.9
The part of deferred income tax liabilities that is expected tobe settled within one year is estimated at € 5 million (2015:€ 27 million).
Movements in deferred income taxesIn the table below, the balances of deferred income tax assetsand deferred income tax liabilities have been included grossat the beginning and end of the year. The netting ofdeferred income tax assets and liabilities is shown in thetables for deferred income tax assets and liabilities.
Movements in deferred income taxes
Tax losses carry-
forward Unused tax credits
Temporary
differences Total 2016 Total 2015
Deferred income tax assets 453.2 87.5 207.2 747.9 866.9
Deferred income tax liabilities - - (252.3) (252.3) (367.0)
Balance at January 1 453.2 87.5 (45.1) 495.6 499.9
Movements during the year
Acquisition of subsidiaries 3.3 - (11.6) (8.3) (6.3)
Income statement (59.8) 21.0 68.5 29.7 24.7
Other movements (52.4) - 2.8 (49.6) (62.7)
Translation differences 3.4 3.9 3.3 10.6 40.0
Total movements (105.5) 24.9 63.0 (17.6) (4.3)
Deferred income tax assets 347.7 112.4 229.7 689.8 747.9
Deferred income tax liabilities - - (211.8) (211.8) (252.3)
Balance at December 31 347.7 112.4 17.9 478.0 495.6
main notes to the consolidated financial statements

131
annual report 2016 − Randstad Holding nv
4.3.2 Corporate taxes on incomeCorporate taxes on income for the year comprise currenttaxes and deferred taxes. Income taxes are recognized in theincome statement, except for taxes that relate to itemsrecognized in other comprehensive income; these taxes arethen also directly recognized in other comprehensive income.
Current taxes on income are the sum of taxes levied on theresults before taxes, in the countries where those results weregenerated, based on local tax regulations and at tax rates ofthe applicable year. Tax-exempt income and expenses notdeductible for tax purposes are taken into account incalculating current taxes on income.
Details of corporate taxes on income
2016 2015
Current tax expense 227.5 188.3
Deferred tax (income) / expense (29.7) (24.7)
Tax expense 197.8 163.6
In 2016, the average effective tax rate on income beforetaxes was 25.1% (2015: 24.0%). The reconciliation betweenthe applicable income tax rate of the company's country ofdomicile and the average effective tax rate is as follows:
Reconciliation from applicable to effective tax rate
2016 2015
Income tax rate of the company's country of
domicile 25.0% 25.0%
Effect of income tax rates in other (non-domestic)
jurisdictions 1.6% 4.8%
Weighted average applicable tax rate 26.6% 29.8%
Tax-exempt income/non-tax-deductible items (5.7%) (5.2%)
Changes in statutory applicable tax rates and
effects of prior years 1.3% (0.4%)
Change in valuation of deferred tax assets and
other 2.9% (0.2%)
Average effective tax rate 25.1% 24.0%
The change in the weighted average applicable tax rate in2016 compared to 2015 is due to a changed relative mix inthe results of subsidiaries in countries with different tax rates.
The tax-exempt income related to French CICE tax credits hasan impact of 4.7%-points on the effective tax rate (2015:5.5%), whereas the effect of the non-tax deductible Frenchbusiness tax (CVAE) was only 3.5%-points in 2016 (2015:3.6%-points), which is due to the increase in profit beforetaxes. The other tax-exempt income and non-tax deductible
expenses had a positive impact of 4.5%-points (2015: 3.3%-points).
'Changes in statutory applicable tax rates and effects of prioryears' increased in 2016 as a result of tax rate changes and taxaudits in certain countries.
'Change in valuation of deferred tax assets and other' isimpacted by the assessment of recoverability of the tax assetsin various countries. In 2016, these assessments resulted in anincrease of the provisions recorded.
4.4 Revenue recognitionRevenue comprises the fair value of the considerationreceived or receivable for services rendered during the year tothird parties. Revenue from services rendered is recognized inthe income statement in proportion to the progress inexecution of the contract as of the balance sheet date.Progress in execution of the contract is measured byreference to costs (mainly hours) incurred to date as apercentage of total estimated costs for each contract. Whenthe outcome of the contract cannot be measured reliably,revenue is recognized only to the extent that expensesincurred are eligible to be recovered. No revenue isrecognized if there are significant uncertainties regardingrecovery of the consideration.
Revenue from temporary placements includes the amountsreceived or receivable for the services of candidates, includingthe salary and salary-related employment costs of thoseemployees (gross basis). These revenues are generally basedon the number of hours worked by these candidates.
Revenue from permanent placements includes the feereceived or receivable for the services provided. This fee isgenerally a percentage of the candidate's remunerationpackage (net basis). The revenue of these permanentplacements is recognized on completion of the service, being,in principle, the start date of the candidate. For 'retainedassignments', revenue is recognized on the completion ofcertain pre-agreed stages of the service and for which the feeis non-refundable. Allowances are established to estimatelosses due to placed candidates not remaining employedduring the agreed guarantee period.
For the job posting and résumé services of MonsterWorldwide Inc., revenue is recognized based on (statistical)usage during the term of the contract, based on the specificunderlying elements of the contract and service.
In situations where the Group is the principal in thetransaction and has risks and rewards of ownership, thetransactions are recorded gross in the statement ofcomprehensive income. When the Group acts as an agent,such as in cases where the Group acts as a managed servicesprovider, revenues are reported on a net basis.

132
annual report 2016 − Randstad Holding nv
4.4.1 Revenue categoriesRevenue categories are our service concepts. Three differentrevenue categories are reported: 'Staffing' (including HRSolutions), 'Professionals', and 'Inhouse Services' (includingSearch & Selection). All service concepts have activities in allparts of the world. For a more detailed description of theseservice concepts, see the section 'value for our clients andcandidates'.
'Staffing' includes two months' revenue of MonsterWorldwide Inc. (€ 82.2 million), acquired November 1, 2016.
Revenue by revenue category
2016 2015
Staffing 12,065.2 11,186.4
Inhouse Services 4,640.7 4,216.4
Professionals 3,978.2 3,816.4
20,684.1 19,219.2
main notes to the consolidated financial statements

133
annual report 2016 − Randstad Holding nv
5. Segment reporting
Segments are geographical areas and are reported in amanner consistent with internal management reportingprovided to the Executive Board. There are no material salesor other transactions between the geographical areas.'Corporate' is also included in the disclosures on segments,and represents the unallocated part of assets and liabilities ofholding activities, as well as the income and expenses ofholding activities; the latter net after management charges togeographical areas.
On November 1, 2016, the Group acquired MonsterWorldwide Inc. Monster Worldwide Inc. is active in more than40 countries. The assets and liabilities as at December 31,2016, as well as income statement metrics for the two-monthperiod that ended on December 31, 2016, are presentedunder 'Rest of the world'.
5.1 Income statement
Segmentation income statement
Revenue Gross profit Operating profit
2016 2015 2016 2015 2016 2015
North America 4,719.9 4,653.4 1,083.1 1,049.4 234.7 212.4
Netherlands 3,185.6 3,076.9 588.9 603.0 172.5 167.7
France 3,045.1 2,845.1 493.1 468.4 153.5 115.7
Germany 2,087.6 1,969.6 360.6 346.6 92.9 85.4
Belgium & Luxembourg 1,372.5 1,350.3 292.0 271.5 84.9 70.7
Iberia 1,275.1 1,193.5 168.9 150.4 56.1 40.8
United Kingdom 817.2 909.5 148.4 170.8 19.5 14.0
Other European countries 2,338.5 1,576.6 398.0 244.3 57.0 56.0
Rest of the world 1,842.6 1,644.3 401.2 290.1 (4.0) 4.9
Corporate - - - - (76.5) (62.9)
Total 20,684.1 19,219.2 3,934.2 3,594.5 790.6 704.7
Amortization and impairment
of acquisition-related
intangibles and goodwill EBITA
Depreciation / amortization of
property, plant, equipment, and
software, including
impairments EBITDA
2016 2015 2016 2015 2016 2015 2016 2015
North America 25.2 26.7 259.9 239.1 14.8 14.5 274.7 253.6
Netherlands 6.2 17.5 178.7 185.2 11.5 11.0 190.2 196.2
France 10.8 33.0 164.3 148.7 13.4 13.5 177.7 162.2
Germany 0.7 3.4 93.6 88.8 3.7 4.1 97.3 92.9
Belgium & Luxembourg 3.1 7.9 88.0 78.6 5.2 5.3 93.2 83.9
Iberia 3.5 9.1 59.6 49.9 2.2 1.9 61.8 51.8
United Kingdom 0.0 7.4 19.5 21.4 2.6 3.1 22.1 24.5
Other European countries 23.9 5.7 80.9 61.7 6.6 3.1 87.5 64.8
Rest of the world 28.0 16.6 24.0 21.5 10.1 7.8 34.1 29.3
Corporate - - (76.5) (62.9) 4.0 0.4 (72.5) (62.5)
Total 101.4 127.3 892.0 832.0 74.1 64.7 966.1 896.7

134
annual report 2016 − Randstad Holding nv
5.2 Balance sheet
Segmentation balance sheet
Property, plant &equipment Software Goodwill
Acquisition-relatedintangible assets
Operating workingcapital Total assets
2016 2015 2016 2015 2016 2015 2016 2015 2016 2015 2016 2015
North America 27.0 28.4 18.1 12.7 703.2 604.0 45.0 69.2 384.7 391.7 1,574.8 1,518.3
Netherlands 45.1 35.5 2.0 2.0 809.7 796.8 - 6.3 (92.3) (96.5) 1,405.2 1,366.7
France 18.9 19.6 7.2 10.2 431.7 399.6 - 10.8 (12.1) (52.7) 1,546.1 1,369.5
Germany 3.5 3.9 5.7 5.3 212.9 205.4 2.3 0.5 16.8 (12.3) 538.6 491.8
Belgium & Luxembourg 7.5 8.5 3.9 3.0 125.0 126.8 0.1 3.2 43.4 42.6 376.9 363.9
Iberia 6.1 4.3 0.4 0.2 0.9 0.9 - 3.5 139.8 96.3 306.7 283.4
United Kingdom 5.1 4.4 0.9 1.9 129.5 136.0 - - 83.6 130.0 278.1 315.2
Other European countries 9.8 6.0 11.0 2.2 244.4 102.9 67.4 2.0 140.3 77.9 936.9 440.0
Rest of the world 42.3 14.3 17.4 7.2 275.8 122.4 238.4 13.0 1.0 59.0 1,168.7 430.3
Corporate - - 0.6 1.1 - - - - 6.9 (14.6) 62.8 35.4
Eliminations - - - - - - - - - - (47.1) (28.7)
Total 165.3 124.9 67.2 45.8 2,933.1 2,494.8 353.2 108.5 712.1 621.4 8,147.7 6,585.8
5.2.1 Operating working capitalOperating working capital includes current assets, excludingcash and cash equivalents, current income tax receivables,and the current part of loans and receivables, minus currentliabilities, excluding current borrowings, current income taxliabilities, and the current part of provisions, of employeebenefit obligations, and of other liabilities. Deferred receiptsfrom disposal of subsidiaries, as well as the net interestpayable, are also excluded in order to align the presentationof the movements in these latter two items, which arepresented under net cash flow from investing activities andfinancing activities respectively.
5.2.2 Total assetsAssets by segment include total assets excluding deferredincome tax assets, current income tax receivables, and cashand cash equivalents.
Total assets
2016 2015
Total assets 9,125.9 7,308.8
Less:
- Deferred income tax assets 520.2 531.5
- Current income tax receivables 72.2 58.0
- Cash and cash equivalents 385.8 133.5
Assets by segment 8,147.7 6,585.8
Operating working capital
2016 2015
Current assets 4,632.2 3,627.2
Current liabilities (4,036.7) (3,105.6)
Working capital 595.5 521.6
Current assets 4,632.2 3,627.2
Adjusted for:
- Cash and cash equivalents (385.8) (133.5)
- Current income tax receivables (72.2) (58.0)
- Current part of loans and receivables (69.9) (6.7)
- Deferred receipts disposed Group companies - 0.0
- Interest receivable 0.0 (0.1)
Operating working capital assets 4,104.3 3,428.9
Current liabilities (4,036.7) (3,105.6)
Adjusted for:
- Current borrowings 480.0 182.1
- Current income tax liabilities 70.6 36.8
- Current provisions 68.7 55.4
- Current employee benefit obligations 13.2 12.4
- Current other liabilities 6.7 7.0
- Interest payable 5.3 4.4
Operating working capital liabilities (3,392.2) (2,807.5)
Operating working capital assets 4,104.3 3,428.9
Operating working capital liabilities (3,392.2) (2,807.5)
Operating working capital 712.1 621.4
main notes to the consolidated financial statements

135
annual report 2016 − Randstad Holding nv
6. Business combinations
6.1 Information about acquisitionsDuring 2016 and 2015, the following companies wereacquired:
Business combinations
Company
Acquired % of
shares Acquisition date
2016
Proffice AB (Sweden) 100% February 4
'twago' (Germany) 100% June 14
O(biettivo) L(avoro) Group Srl (Italy) 100% July 1
Careo Holding KK (Japan) 100% July 1
Monster Worldwide Inc. (USA) 100% November 1
2015
RiseSmart, Inc. (USA) 100% September 24
The main activities of Proffice, OL and Careo are generalstaffing (all three), professional/specialist staffing (Profficeand Careo), and recruitment services (Proffice).
Monster is a global online employment solution for peopleseeking jobs and employers who need people. Monster offersservices in more than 40 countries, providing job seeking,career management, recruitment and talent managementcapabilities.
'twago' offers a digital platform for freelancers and clients.
The acquisitions are in line within Randstad's mid- to long-term strategy to grow in (specialist) professionals activities, tostrengthen our market position in certain markets and/orcountries, and, in line with our 'Tech & Touch' growthstrategy, to complement Randstad's activities withtechnology platforms and easy-to-use digital, social, andmobile solutions.
In respect of the acquisition of Careo Holding KK, a deferredcompensation of € 2.6 million (reflecting 5% of the shares) isincluded under other liabilities.
Proffice AB and Monster Worldwide Inc. were acquiredfollowing a public offer.
In June 2016, the Group increased its shareholding in 'twago'to 100%. Before that date, 'twago' was recorded as an equityinvestment. For further information, see note 16.2 Equityinvestments.

136
annual report 2016 − Randstad Holding nv
The fair value of the assets and liabilities arising from theabove-mentioned acquisitions, based on provisional purchaseallocations, can be summarized as follows:
Summary of assets and liabilities arising from acquisitions and the reconciliation of cash flow from acquisitions
Proffice Monster Other Total 2016 Total 2015
Property, plant, equipment and software 5.8 32.1 1.8 39.7 0.6
Acquisition-related intangible assets 75.9 215.4 38.0 329.3 44.0
Deferred tax assets 2.4 13.2 8.8 24.4 10.9
Associates - 19.1 - 19.1 -
Total non-current assets 84.1 279.8 48.6 412.5 55.5
Working capital (liabilities)/assets (2.2) (96.5) 29.3 (69.4) 4.4
Non-current borrowings - 128.3 - 128.3 -
Provisions and employee benefit obligations - 22.8 4.0 26.8 4.5
Deferred tax liabilities 21.0 - 11.7 32.7 17.2
Other liabilities - - 0.9 0.9 -
Total non-current liabilities 21.0 151.1 16.6 188.7 21.7
Non-controlling interest 0.1 - 0.3 0.4 -
Net assets acquired 60.8 32.2 61.0 154.0 38.2
Goodwill 115.0 254.2 72.0 441.2 58.2
Total consideration 175.8 286.4 133.0 595.2 96.4
Net debt/(cash) acquired included in working capital 0.9 (16.0) (5.7) (20.8) (7.1)
Non-current borrowings acquired - 128.3 - 128.3 -
Net debt/(cash) acquired 0.9 112.3 (5.7) 107.5 (7.1)
Consideration, adjusted for net debt/(cash) acquired 176.7 398.7 127.3 702.7 89.3
Deferred compensation on acquisitions - - (2.6) (2.6) (0.6)
Consideration paid in respect of acquisitions in preceding years - - - - 0.3
Consideration paid, adjusted for net debt/(cash) acquired 176.7 398.7 124.7 700.1 89.0
Deduct: Non-current borrowings acquired - (128.3) - (128.3) -
Statement of cash flows, acquisition of subsidiaries 176.7 270.4 124.7 571.8 89.0
Included in goodwill and intangibles are estimated amountsof € 211 million and € 215 million respectively, which areexpected to be deductible for tax purposes.
No acquisition-related costs are included in the total amountof goodwill. The amount of acquisition-related expensescharged to operating expenses is € 13.9 million (2015: € 2.2million).
In 2016, the newly acquired companies contributedapproximately € 700 million to the Group's revenue andapproximately € 23 million to the Group's EBITA. If theseacquisitions had occurred on January 1, 2016, thecontribution to the Group's revenue and EBITA would have
been higher by approximately € 715 million and € 13 millionrespectively.
Accounting policyThe Group uses the acquisition method to account for theacquisition of subsidiaries.
Goodwill at acquisition date is measured as:- The fair value of the consideration transferred, being the
fair value of the assets given and liabilities incurred orassumed; plus
- The recognized amount of any non-controlling interests inthe acquiree; plus
main notes to the consolidated financial statements
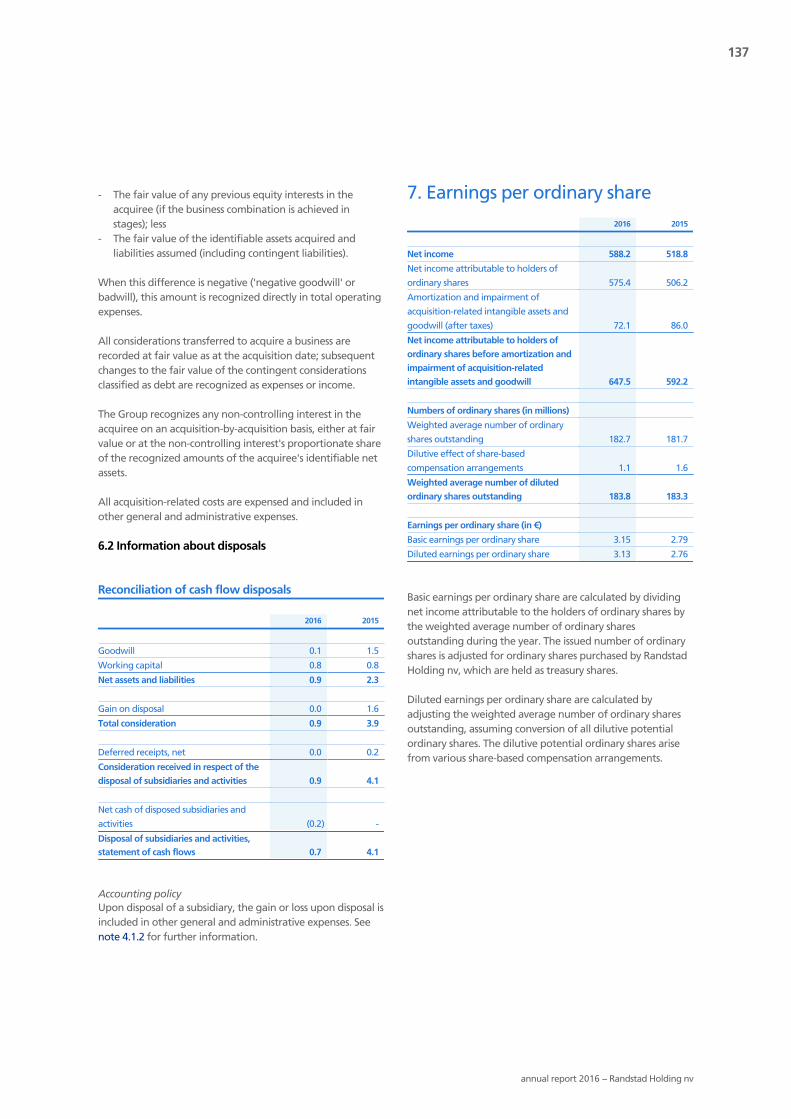
137
annual report 2016 − Randstad Holding nv
- The fair value of any previous equity interests in theacquiree (if the business combination is achieved instages); less
- The fair value of the identifiable assets acquired andliabilities assumed (including contingent liabilities).
When this difference is negative ('negative goodwill' orbadwill), this amount is recognized directly in total operatingexpenses.
All considerations transferred to acquire a business arerecorded at fair value as at the acquisition date; subsequentchanges to the fair value of the contingent considerationsclassified as debt are recognized as expenses or income.
The Group recognizes any non-controlling interest in theacquiree on an acquisition-by-acquisition basis, either at fairvalue or at the non-controlling interest's proportionate shareof the recognized amounts of the acquiree's identifiable netassets.
All acquisition-related costs are expensed and included inother general and administrative expenses.
6.2 Information about disposals
Reconciliation of cash flow disposals
2016 2015
Goodwill 0.1 1.5
Working capital 0.8 0.8
Net assets and liabilities 0.9 2.3
Gain on disposal 0.0 1.6
Total consideration 0.9 3.9
Deferred receipts, net 0.0 0.2
Consideration received in respect of the
disposal of subsidiaries and activities 0.9 4.1
Net cash of disposed subsidiaries and
activities (0.2) -
Disposal of subsidiaries and activities,statement of cash flows 0.7 4.1
Accounting policyUpon disposal of a subsidiary, the gain or loss upon disposal isincluded in other general and administrative expenses. Seenote 4.1.2 for further information.
7. Earnings per ordinary share
2016 2015
Net income 588.2 518.8
Net income attributable to holders of
ordinary shares 575.4 506.2
Amortization and impairment of
acquisition-related intangible assets and
goodwill (after taxes) 72.1 86.0
Net income attributable to holders of
ordinary shares before amortization and
impairment of acquisition-related
intangible assets and goodwill 647.5 592.2
Numbers of ordinary shares (in millions)
Weighted average number of ordinary
shares outstanding 182.7 181.7
Dilutive effect of share-based
compensation arrangements 1.1 1.6
Weighted average number of diluted
ordinary shares outstanding 183.8 183.3
Earnings per ordinary share (in €)
Basic earnings per ordinary share 3.15 2.79
Diluted earnings per ordinary share 3.13 2.76
Basic earnings per ordinary share are calculated by dividingnet income attributable to the holders of ordinary shares bythe weighted average number of ordinary sharesoutstanding during the year. The issued number of ordinaryshares is adjusted for ordinary shares purchased by RandstadHolding nv, which are held as treasury shares.
Diluted earnings per ordinary share are calculated byadjusting the weighted average number of ordinary sharesoutstanding, assuming conversion of all dilutive potentialordinary shares. The dilutive potential ordinary shares arisefrom various share-based compensation arrangements.
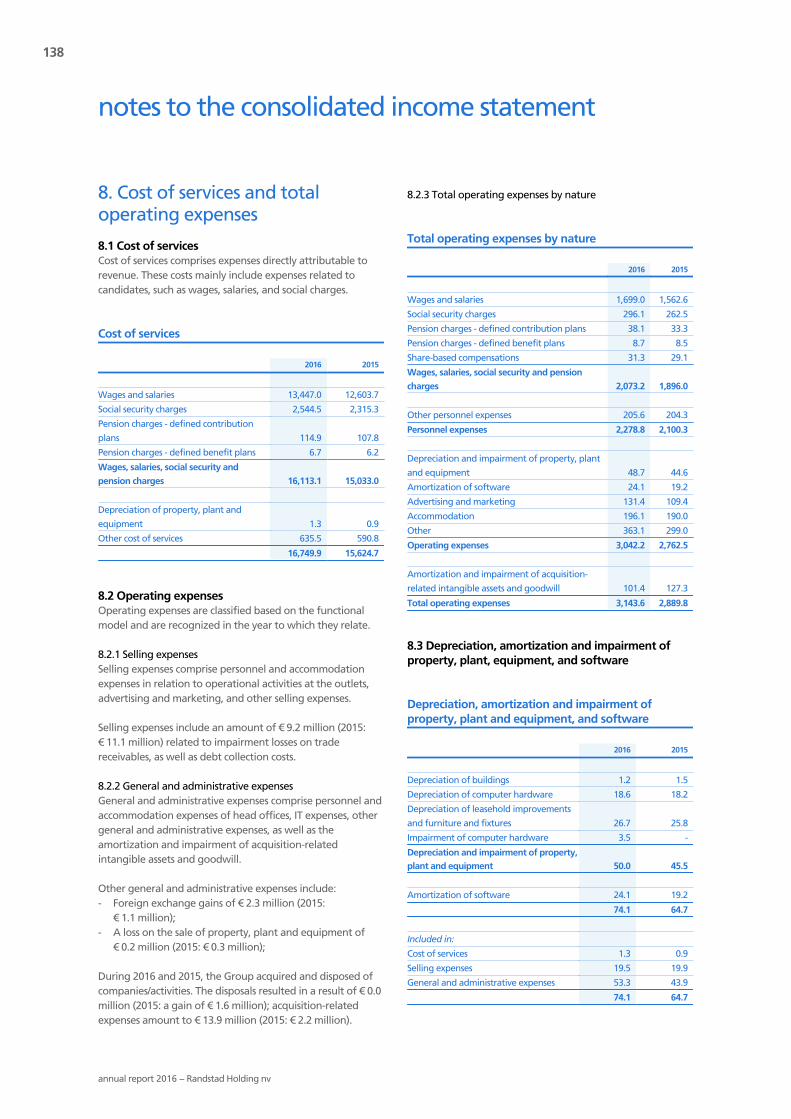
138
annual report 2016 − Randstad Holding nv
8. Cost of services and totaloperating expenses
8.1 Cost of servicesCost of services comprises expenses directly attributable torevenue. These costs mainly include expenses related tocandidates, such as wages, salaries, and social charges.
Cost of services
2016 2015
Wages and salaries 13,447.0 12,603.7
Social security charges 2,544.5 2,315.3
Pension charges - defined contribution
plans 114.9 107.8
Pension charges - defined benefit plans 6.7 6.2
Wages, salaries, social security and
pension charges 16,113.1 15,033.0
Depreciation of property, plant and
equipment 1.3 0.9
Other cost of services 635.5 590.8
16,749.9 15,624.7
8.2 Operating expensesOperating expenses are classified based on the functionalmodel and are recognized in the year to which they relate.
8.2.1 Selling expensesSelling expenses comprise personnel and accommodationexpenses in relation to operational activities at the outlets,advertising and marketing, and other selling expenses.
Selling expenses include an amount of € 9.2 million (2015:€ 11.1 million) related to impairment losses on tradereceivables, as well as debt collection costs.
8.2.2 General and administrative expensesGeneral and administrative expenses comprise personnel andaccommodation expenses of head offices, IT expenses, othergeneral and administrative expenses, as well as theamortization and impairment of acquisition-relatedintangible assets and goodwill.
Other general and administrative expenses include:- Foreign exchange gains of € 2.3 million (2015:
€ 1.1 million);- A loss on the sale of property, plant and equipment of
€ 0.2 million (2015: € 0.3 million);
During 2016 and 2015, the Group acquired and disposed ofcompanies/activities. The disposals resulted in a result of € 0.0million (2015: a gain of € 1.6 million); acquisition-relatedexpenses amount to € 13.9 million (2015: € 2.2 million).
8.2.3 Total operating expenses by nature
Total operating expenses by nature
2016 2015
Wages and salaries 1,699.0 1,562.6
Social security charges 296.1 262.5
Pension charges - defined contribution plans 38.1 33.3
Pension charges - defined benefit plans 8.7 8.5
Share-based compensations 31.3 29.1
Wages, salaries, social security and pension
charges 2,073.2 1,896.0
Other personnel expenses 205.6 204.3
Personnel expenses 2,278.8 2,100.3
Depreciation and impairment of property, plant
and equipment 48.7 44.6
Amortization of software 24.1 19.2
Advertising and marketing 131.4 109.4
Accommodation 196.1 190.0
Other 363.1 299.0
Operating expenses 3,042.2 2,762.5
Amortization and impairment of acquisition-
related intangible assets and goodwill 101.4 127.3
Total operating expenses 3,143.6 2,889.8
8.3 Depreciation, amortization and impairment ofproperty, plant, equipment, and software
Depreciation, amortization and impairment ofproperty, plant and equipment, and software
2016 2015
Depreciation of buildings 1.2 1.5
Depreciation of computer hardware 18.6 18.2
Depreciation of leasehold improvements
and furniture and fixtures 26.7 25.8
Impairment of computer hardware 3.5 -
Depreciation and impairment of property,plant and equipment 50.0 45.5
Amortization of software 24.1 19.2
74.1 64.7
Included in:
Cost of services 1.3 0.9
Selling expenses 19.5 19.9
General and administrative expenses 53.3 43.9
74.1 64.7
notes to the consolidated income statement

139
annual report 2016 − Randstad Holding nv
8.4 Amortization and impairment of acquisition-related intangible assets and goodwill
Amortization and impairment of acquisition-relatedintangible assets and goodwill
2016 2015
Amortization of acquisition-related
intangible assets 91.5 127.3
Impairment of goodwill 9.9 -
101.4 127.3
For impairment of goodwill, see note 4.1.2.
8.5 Operating leasesFor operating leases, an amount of € 240 million (2015:€ 230 million) is included in operating profit.
Lease contracts of which the majority of risks and rewardsinherent to ownership do not lie with the Group are classifiedas operating leases. Expenses related to operating leases areincluded in operating expenses and/or cost of services on astraight-line basis over the term of the lease.
8.6 GrantsGrants are recognized when there is reasonable assurancethat they will be received and that the Group will complywith the conditions attached to them.
Grants that compensate for expenses incurred are credited tooperating expenses and/or cost of services on a systematicbasis in the same period in which the expenses are incurred.
Grants included in operating profit amount to € 25.3 million(2015: € 27.8 million), of which € 22.1 million (2015:€ 25.0 million) is reported under cost of services. Grantsmainly relate to the compensation (in whole or in part) of thecosts of education of candidates and of the costs to employselected categories of employees.
9. Total wages and salaries, socialsecurity and pension charges
Wages, salaries, social security charges and pension chargesare included in cost of services for candidates and inpersonnel expenses for corporate employees.
Total amounts of wages and salaries, social securityand pension charges
2016 2015
Wages and salaries 15,146.0 14,166.3
Social security charges 2,840.6 2,577.8
Pension charges - defined contribution
plans 153.0 141.1
Pension charges - defined benefit plans 15.4 14.7
Share-based compensations 31.3 29.1
18,186.3 16,929.0
10. Net finance costs
Net finance costs
2016 2015
Finance income
Interest and similar income 3.0 3.9
Changes in value of other liabilities 1 3.9 0.4
Changes in value of other long-term debt1 3.9 -
Interest due to passage of time1 4.2 4.2
Foreign exchange gain, net1 3.8 -
Finance income 18.8 8.5
Finance expenses
Interest and similar expenses 7.0 7.6
Interest and commitment fees on non-
current borrowings 7.6 5.4
Dividend on non-controlling interests
classified as other liabilities 0.9 0.7
Amortization of transaction cost non-
current borrowings1 2.2 2.2
Interest due to passage of time1 4.3 4.2
Changes in value of equity investments1 0.6 -
Foreign exchange losses, net1 - 17.5
Finance expenses 22.6 37.6
Net finance costs 3.8 29.11 Items considered non-cash.
Net finance costs comprise interest expenses and interestincome, as well as items similar to interest and exchangedifferences on cash, cash equivalents, and borrowings.Interest expenses and income are recognized in the incomestatement on a time-proportion basis, using the effectiveinterest method. Interest due to the passage of time of loansand receivables, and deferred considerations, as well as inrelation to the valuation of certain provisions and employeebenefit obligations, are also included in net finance costs.Changes in the value of deferred considerations anddifferences upon settlement of these deferred considerations
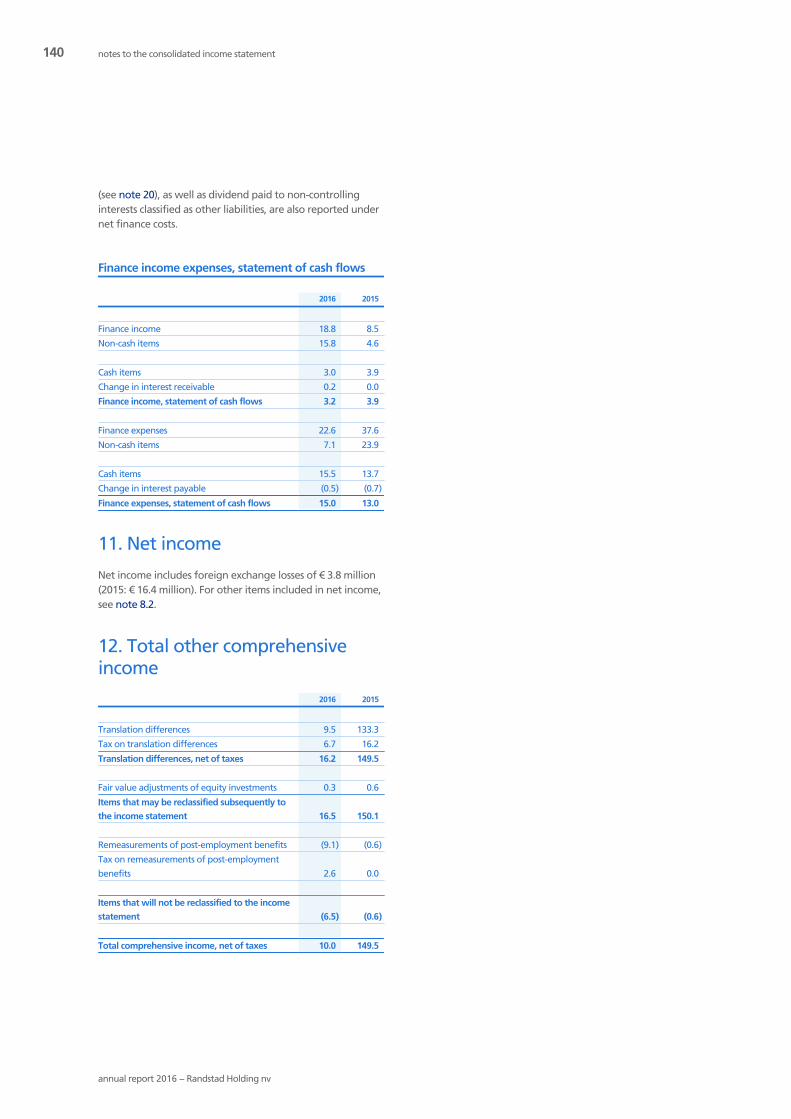
140
annual report 2016 − Randstad Holding nv
(see note 20), as well as dividend paid to non-controllinginterests classified as other liabilities, are also reported undernet finance costs.
Finance income expenses, statement of cash flows
2016 2015
Finance income 18.8 8.5
Non-cash items 15.8 4.6
Cash items 3.0 3.9
Change in interest receivable 0.2 0.0
Finance income, statement of cash flows 3.2 3.9
Finance expenses 22.6 37.6
Non-cash items 7.1 23.9
Cash items 15.5 13.7
Change in interest payable (0.5) (0.7)
Finance expenses, statement of cash flows 15.0 13.0
11. Net income
Net income includes foreign exchange losses of € 3.8 million(2015: € 16.4 million). For other items included in net income,see note 8.2.
12. Total other comprehensiveincome
2016 2015
Translation differences 9.5 133.3
Tax on translation differences 6.7 16.2
Translation differences, net of taxes 16.2 149.5
Fair value adjustments of equity investments 0.3 0.6
Items that may be reclassified subsequently to
the income statement 16.5 150.1
Remeasurements of post-employment benefits (9.1) (0.6)
Tax on remeasurements of post-employment
benefits 2.6 0.0
Items that will not be reclassified to the income
statement (6.5) (0.6)
Total comprehensive income, net of taxes 10.0 149.5
notes to the consolidated income statement

141
annual report 2016 − Randstad Holding nv
13. Property, plant and equipment
Buildings and land Computer hardware
Leasehold improvements,
furniture and fixtures Total
Balance at January 1, 2016 26.7 33.4 64.8 124.9
Movements in 2016
Acquisitions of subsidiaries 0.3 14.7 15.0 30.0
Additions 0.2 18.0 44.1 62.3
Disposals - (0.7) (2.7) (3.4)
Depreciation/impairment (1.2) (22.1) (26.7) (50.0)
Translation differences 0.4 0.4 0.7 1.5
Balance at December 31, 2016 26.4 43.7 95.2 165.3
Cost 63.4 277.7 444.3 785.4
Accumulated depreciation and impairment 37.0 234.0 349.1 620.1
Balance at December 31, 2016 26.4 43.7 95.2 165.3
Balance at January 1, 2015
Cost 59.6 186.4 404.9 650.9
Accumulated depreciation and impairment 32.6 151.3 338.2 522.1
27.0 35.1 66.7 128.8
Movements in 2015
Acquisitions of subsidiaries - 0.1 0.5 0.6
Additions - 17.1 24.9 42.0
Disposals - (1.6) (2.9) (4.5)
Depreciation (1.5) (18.2) (25.8) (45.5)
Translation differences 1.2 0.9 1.4 3.5
Balance at December 31, 2015 26.7 33.4 64.8 124.9
Cost 62.0 179.2 359.8 601.0
Accumulated depreciation and impairment 35.3 145.8 295.0 476.1
Balance at December 31, 2015 26.7 33.4 64.8 124.9
Based on appraisals made by independent and expertappraisers, the estimated fair value of buildings and land is€ 10 to € 15 million higher than the carrying amount. The fairvalue represents the market value, taking into account thatthe property is in a rented status.
Included under depreciation/impairment is an impairment ofcomputer hardware of € 3.5 million, as a result of a redesignof our IT strategy.
In the consolidated statement of cash flows, proceeds fromthe sale of property, plant and equipment comprise:
Proceeds from disposals
2016 2015
Net book value of disposals 3.4 4.5
Loss on disposals (0.2) (0.3)
Disposals of property, plant andequipment, statement of cash flows 3.2 4.2
Accounting policyProperty, plant and equipment are stated at historical costless accumulated depreciation and impairment losses.Historical cost includes expenditures that are directlyattributable to the acquisition of the assets.
Land is not depreciated. Depreciation on other property,plant and equipment is charged to operating expensesand/or cost of services on a straight-line basis over theirestimated useful lives, from the date they are available foruse.
notes to the consolidated balance sheet

142
annual report 2016 − Randstad Holding nv
The residual values and useful lives are reviewed as at eachbalance sheet date and adjusted, if appropriate.
Gains and losses arising on disposal are included in theincome statement under other general and administrativeexpenses.
Estimated useful lives of property, plant andequipmenton average
Term
Buildings 33 years
Computer hardware 4 years
Leasehold improvements 5 years
Furniture and fixtures 4-5 years
Leasehold improvements are depreciated over the term ofthe initial lease, in the event that this term is shorter than fiveyears.
Impairments, if any, are mainly caused by the discontinuationof outlets. The net book value of leasehold improvementsand other furniture and fixtures is impaired to therecoverable amount, based on each individual case. Therecoverable amount tends to be zero.
14. Software
2016 2015
Cost 295.3 263.7
Accumulated amortization and
impairment 249.5 225.1
Balance at January 1 45.8 38.6
Acquisitions of subsidiaries 9.7 -
Additions 34.9 25.2
Amortization (24.1) (19.2)
Translation differences 0.9 1.2
Balance at December 31 67.2 45.8
Cost 400.6 295.3
Accumulated amortization and
impairment 333.4 249.5
Balance at December 31 67.2 45.8
Accounting policyAcquired software (licenses) and developed software arestated at cost less accumulated amortization and impairmentlosses.
Expenditures in relation to the development of identifiableand unique software products used by the Group, and which
will probably generate economic benefits exceeding costsbeyond one year, are recognized as intangible assets andamortized over their estimated useful lives. Capitalized costsinclude employee costs of software development and anappropriate portion of relevant overhead.
Expenditures associated with maintaining computer softwareprograms are recognized as an expense when incurred.
Amortization of software applications is charged tooperating expenses and/or cost of services on a straight-linebasis over their estimated useful lives, from the date they areavailable for use.
The residual values and useful lives are reviewed as at eachbalance sheet date and adjusted, if appropriate.
The estimated useful life for software is 3 to 5 years. Acquiredcomputer software licenses are amortized on a straight-linebasis over their useful lives of 3 to 5 years or, if the licenseperiod is shorter than 3 years, over this shorter period.
Impairments, if any, are mainly caused by the discontinuationof software applications, which in the Group generally relateto front- and/or back-office applications. The net book valueof software is impaired to its recoverable amount, whichtends to be zero, based on each individual case.
notes to the consolidated balance sheet
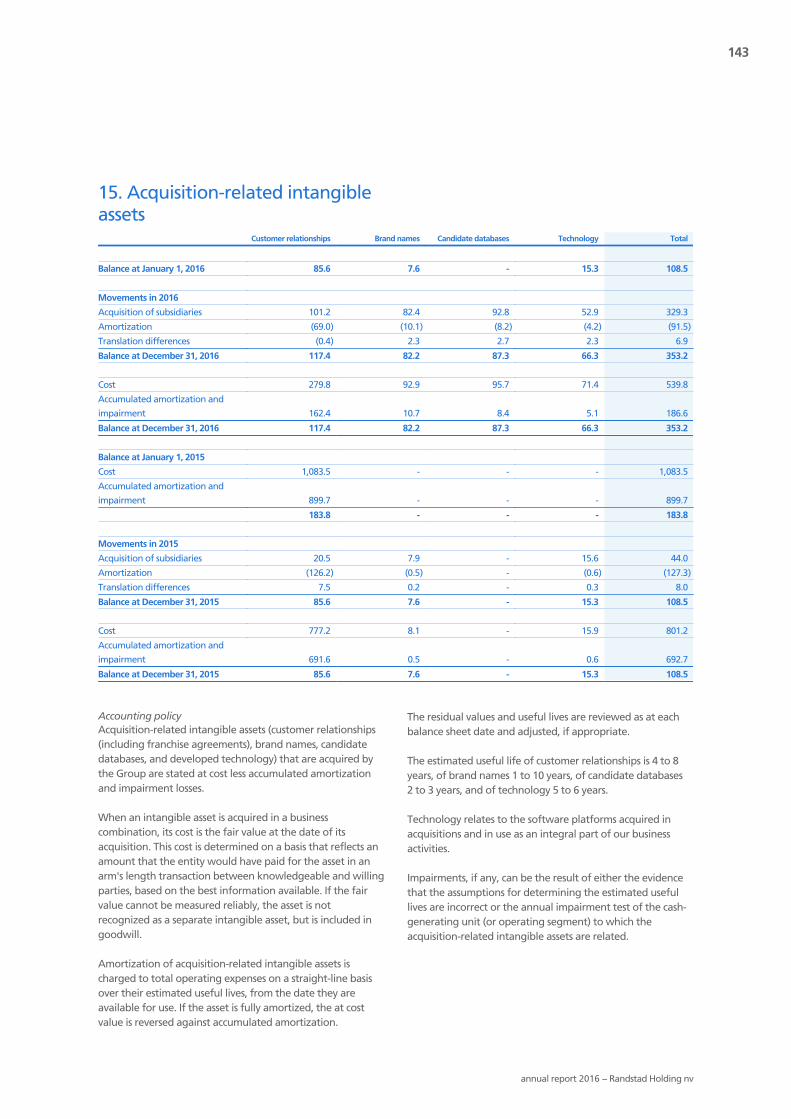
143
annual report 2016 − Randstad Holding nv
15. Acquisition-related intangibleassets
Customer relationships Brand names Candidate databases Technology Total
Balance at January 1, 2016 85.6 7.6 - 15.3 108.5
Movements in 2016
Acquisition of subsidiaries 101.2 82.4 92.8 52.9 329.3
Amortization (69.0) (10.1) (8.2) (4.2) (91.5)
Translation differences (0.4) 2.3 2.7 2.3 6.9
Balance at December 31, 2016 117.4 82.2 87.3 66.3 353.2
Cost 279.8 92.9 95.7 71.4 539.8
Accumulated amortization and
impairment 162.4 10.7 8.4 5.1 186.6
Balance at December 31, 2016 117.4 82.2 87.3 66.3 353.2
Balance at January 1, 2015
Cost 1,083.5 - - - 1,083.5
Accumulated amortization and
impairment 899.7 - - - 899.7
183.8 - - - 183.8
Movements in 2015
Acquisition of subsidiaries 20.5 7.9 - 15.6 44.0
Amortization (126.2) (0.5) - (0.6) (127.3)
Translation differences 7.5 0.2 - 0.3 8.0
Balance at December 31, 2015 85.6 7.6 - 15.3 108.5
Cost 777.2 8.1 - 15.9 801.2
Accumulated amortization and
impairment 691.6 0.5 - 0.6 692.7
Balance at December 31, 2015 85.6 7.6 - 15.3 108.5
Accounting policyAcquisition-related intangible assets (customer relationships(including franchise agreements), brand names, candidatedatabases, and developed technology) that are acquired bythe Group are stated at cost less accumulated amortizationand impairment losses.
When an intangible asset is acquired in a businesscombination, its cost is the fair value at the date of itsacquisition. This cost is determined on a basis that reflects anamount that the entity would have paid for the asset in anarm's length transaction between knowledgeable and willingparties, based on the best information available. If the fairvalue cannot be measured reliably, the asset is notrecognized as a separate intangible asset, but is included ingoodwill.
Amortization of acquisition-related intangible assets ischarged to total operating expenses on a straight-line basisover their estimated useful lives, from the date they areavailable for use. If the asset is fully amortized, the at costvalue is reversed against accumulated amortization.
The residual values and useful lives are reviewed as at eachbalance sheet date and adjusted, if appropriate.
The estimated useful life of customer relationships is 4 to 8years, of brand names 1 to 10 years, of candidate databases2 to 3 years, and of technology 5 to 6 years.
Technology relates to the software platforms acquired inacquisitions and in use as an integral part of our businessactivities.
Impairments, if any, can be the result of either the evidencethat the assumptions for determining the estimated usefullives are incorrect or the annual impairment test of the cash-generating unit (or operating segment) to which theacquisition-related intangible assets are related.

144
annual report 2016 − Randstad Holding nv
16. Financial assets
Investments in financial assets are divided into variouscategories. Classification of these investments depends on thepurposes for which the investments have been acquired.Management determines the classification at the time of thepurchase and re-evaluates such designation at eachsubsequent balance sheet date.
As at December 31, 2016, management decided to presentthe French housing loans under 'Loans and receivables'(instead of separately as 'Held-to-maturity investments'). Thisclassification on the balance sheet has no effect on valuationor the income statement.
Purchase and sale of financial assets are recognized on thesettlement date, which is the date an asset is delivered to orby the Group. The cost of financial assets includes transactioncosts.
Financial assets
2016 2015
Loans and receivables 413.3 362.8
Equity investments 22.3 13.3
435.6 376.1
16.1 Loans and receivables
2016 2015
Loans 97.9 90.7
CICE receivable 315.4 272.1
Loans and receivables 413.3 362.8
Loans and receivables are initially recognized at fair valueand subsequently measured at amortized cost, using theeffective interest method.
Loans and receivables are neither past due nor impaired.These financial assets have counterparties such asgovernmental or semi-governmental bodies.
The Group does not hold any collateral as security.
Loans and receivables comprise financial assets relating to ourFrench subsidiaries.
16.1.1 Loans
Loans
2016 2015
Balance at January 1 97.4 92.1
Additions at fair value 6.2 5.4
Redemptions (7.0) (3.9)
Interest due to passage of time 3.8 3.8
Balance at December 31 100.4 97.4
Non-current portion 97.9 90.7
Current portion 2.5 6.7
100.4 97.4
Loans represent 'housing loans' that are granted interest-freeby the French subsidiaries annually in relation to legalarrangements for payment of certain social security charges.These annual loans have a repayment term of 20 years each.These investments have an average remaining term of 12years (2015: 12 years) and an effective interest rate of 4.1%(2015: 4.1%). The nominal value of held-to-maturityinvestments amounts to € 144 million (2015: € 143 million)and best represents the maximum exposure to credit risk. Asat December 31, 2016, the fair value was approximately € 30million higher than the carrying amount (2015: € 26 million).
The difference between additions at nominal value(€ 8.1 million) and at fair value is recognized in cost ofservices, and amounts to € 1.9 million (2015: € 7.7 million and€ 2.3 million respectively).
16.1.2 CICE receivable
CICE receivable
2016 2015
Balance at January 1 272.1 170.2
Additions at fair value 110.3 101.5
Interest due to passage of time 0.4 0.4
Balance at December 31 382.8 272.1
Non-current portion 315.4 272.1
Current portion 67.4 -
382.8 272.1
This financial asset arises from tax credits under the FrenchCompetitive Employment Act (CICE). This act is aimed atimproving the competitiveness of the French economy and at
notes to the consolidated balance sheet

145
annual report 2016 − Randstad Holding nv
reducing unemployment. The tax credit is calculated as apercentage of wages and salaries paid to employees with asalary that is less than 2.5 times the French minimum wage.The tax credit can be offset against the income tax liabilitypayable with respect to the calendar year to which the wagesrelate. Any excess credit on an annual basis can be carriedforward and offset against the tax liability during the nextthree years. Any excess after three years will also berefunded.
This receivable is presented under non-current assets, sincethe amount is expected to have a maturity of longer thanone year, due to the combined effect of the legal regulationsof the CICE arrangements and the income tax situation of ourFrench operations, except for the part that originates from2013 and is due in 2017, which is presented under currentreceivables. The total receivable of € 382.8 million as atDecember 31, 2016, is ultimately due in 2017 (€ 67.4 million),in 2018 (€ 96.7 million), in 2019 (€ 101.4 million), in 2020(€ 107.3 million), and in 2021 (€ 10.0 million). In the statementof cash flows, the yearly additions at fair value of the CICEreceivable are presented in 'other non-cash items' under cashflow from operating activities, since the CICE arrangementsare considered to be related to the operating activities. Thenominal value of the receivable amounts to € 382.8 million(2015: € 273.0 million), which best represents the maximumexposure to credit risk. As at December 31, 2016, the carryingamount equals the fair value.
16.2 Equity investments
Equity investments
2016 2015
Balance at January 1 13.3 5.3
Fair value adjustments (0.3) 0.6
Net additions 9.3 7.4
Balance at December 31 22.3 13.3
Equity investments are minority participations in early-stageto expansion-stage companies that are consideredstrategically relevant to Randstad. The typical investmentamounts range between € 0.5 million and € 5 million. TheGroup has no significant influence over these investments.These investments are qualified as 'fair-value through othercomprehensive income'-investments, and if no reliable fair-value measurements are available, valued at cost. Allinvestments are considered non-current.
During the year 2016 the Group acquired 100% of the sharesof in one of its equity investments, 'twago' (Germany). Seenote 6 for general information on business combinations.
The carrying amount of this equity investment at themoment of acquisition of 100% of the shares (€ 1.4 million),including any fair value adjustments, is included as part of theconsideration for this subsidiary. The fair value adjustment atthe moment of the acquisition of 100% of the shares resultedin a loss of € 0.6 million, that is recognized under net financecosts.
The fair value of one of the investments was increased by€ 0.3 million (2015: € 0.6 million). This was based on a sharetransaction and other market information.
16.3 Impairment of financial assetsThe carrying amounts of all financial assets in this note arereviewed for impairment whenever events or changes incircumstances indicate that the carrying amount is impaired.If objective evidence exists that a financial asset or group offinancial assets is impaired, the amount of the impairmentloss is calculated as the difference between the carryingamount of the financial asset and the present value ofestimated future cash flows, discounted at the originaleffective interest rate (i.e., the effective interest ratecomputed at initial recognition of these financial assets). Theresulting impairment loss is immediately recognized in netfinance costs.
An impairment loss on financial assets is reversed if, in asubsequent period, the amount of the impairment lossdecreases and this decrease can be related objectively to anevent occurring after the impairment loss was recognized.Such reversal is immediately recognized in net finance costs.
17. Associates
2016 2015
Balance at January 1 - 1.6
Acquisitions of subsidiaries 19.1 -
Share in profit (0.8) 0.7
Additions 0.3 -
Disposals - (2.3)
Translation differences 0.5 -
Balance at December 31 19.1 -
As at December 31, 2016, the Group has investments inassociates of € 19.1 million. The largest associate is a 16.66%shareholding in Alma Career OY, Finland, which came withthe acquisition of Monster Worldwide. The total assets andliabilities of associates amounted to approximately € 108million and € 29 million respectively as at December 31, 2016.Total revenue in 2016 amounted to € 57 million. Our share inprofit was negative € 0.8 million.
During 2015, the Group disposed of its then held associates.The gain on disposal (€ 6.1 million) and our share in profit

146
annual report 2016 − Randstad Holding nv
(€ 0.7 million) were included in the statement ofcomprehensive income in 'share in profit and result ondisposal of associates'. The disposal resulted in a cash in-flowof € 8.4 million.
Accounting policyAssociates are companies over which the Group hassignificant influence, but not control, generallyaccompanying a shareholding of between 20% and 50% ofthe voting rights.
Investments in associates are accounted for using the equitymethod and are initially recognized at cost. The Group'sinvestment in associates includes goodwill on acquisition, netof any accumulated impairment losses.
The Group's share of the post-acquisition profits and losses ofthe associates is recognized as share in results of associates,and its share of post-acquisition movements in othercomprehensive income of the associates, is recognized inother comprehensive income, with a corresponding effect tothe carrying amount of the associate.
18. Trade and other payables
2016 2015
Trade payables 455.0 306.1
Other taxes and social security premiums 1,047.8 1,028.4
Pension contributions 15.4 13.0
Wages, salaries and other personnel costs 1,287.2 1,036.5
Other accruals 474.0 384.6
Deferred income 118.1 43.3
3,397.5 2,811.9
Trade and other payables are initially stated at fair value.Subsequent measurement is at amortized cost, using theeffective interest method.
19. Total equity and dividends pershare
19.1 Shareholders' equity
19.1.1 Authorized and issued capitalAuthorized capital is € 106 million (2015: € 106 million) andconsists of 350,000,000 (2015: 350,000,000) ordinary shareswith a nominal value of € 0.10, a further 106,000 (2015:106,000) type-A preference shares with a nominal value of€ 500, 30,000,000 (2015: 30,000,000) type-B preference shareswith a nominal value of € 0.10, and 150,000,000 (2015:150,000,000) type-C preference shares with a nominal valueof € 0.10.
At year-end, issued share capital consists of 183,023,267ordinary shares (2015: 183,019,235), 25,200,000 type-Bpreference shares (2015: 25,200,000), and 50,130,352 (2015:50,130,352) type-C preference shares.
For information regarding the rights, preferences andrestrictions on each type of share, see 'Voting rights', in thecorporate governance section on page 108.
The current conditions of the preference shares are such thatthe holders of these shares receive a dividend at thecompany's discretion, that dividend is preferred andcumulative, and that the voting rights are one vote per 7type-B preference shares, and one vote for each € 25 capitalpayment for type-C preference shares, resulting in 0.1117vote per share on average.
The dividend on preference shares is reviewed every sevenyears. The last review on type-B preference shares took placein November 2012, and the dividend was set at € 0.177 perpreference share. The dividend on type-C preference shareswas set at 5.8% of the capital contribution. The next reviewof the dividend will take place in November 2019. Only theExecutive Board can propose to the Annual General Meetingof Shareholders to decide that preference shares be repaid.
Number of outstanding ordinary and preferenceshares(x 1,000)
2016 2015
Ordinary
shares
Preference
shares
Ordinary
shares
Preference
shares
January 1 183,019 75,330 180,110 75,330
Stock dividend - - 2,728 -
From share-based
compensation
arrangements 4 - 181 -
December 31 183,023 75,330 183,019 75,330
As at December 31, 2016, the company holds 595,141treasury shares (2015: 896,335).
Accounting policyOrdinary and preference shares are classified as equity. Thedistribution of the dividend on ordinary and preferenceshares is recognized as a liability in the period in which thesedividends are adopted by the company's shareholders.
On the issue of new shares or on the extension of the term ofpreference shares outstanding, the proceeds less directlyattributable costs are recognized in shareholders' equitywithin issued capital and, if applicable, within sharepremium.
notes to the consolidated balance sheet

147
annual report 2016 − Randstad Holding nv
On the purchase of ordinary shares that are included inshareholders' equity, the consideration paid, includingdirectly attributable costs, is recorded as a change inshareholders' equity. Purchased ordinary shares are classifiedas treasury shares and presented as a deduction fromshareholders' equity under reserves.
On the sale (or re-issue) of treasury shares, the proceeds lessdirectly attributable costs are recognized under treasuryshares for the original consideration paid; the remainder isrecognized as a change in retained earnings.
19.1.2 Share premiumAt year-end, share premium consists of € 1,972.4 million sharepremium on ordinary shares (2015: € 1,972.2 million) and€ 298.3 million share premium on preference shares (2015:€ 298.3 million).
19.1.3 Translation reserveThe translation reserve comprises all translation differencesarising from the translation of the net investment in activitiesin currencies other than the euro, as well as translationdifferences of financial liabilities designated as hedges ofsuch investments, to the extent that the hedge is effective.Such translation differences are recognized initially in othercomprehensive income and presented in this separatecomponent of shareholders' equity. If the net investment isdisposed, these translation differences are recognized in thestatement of comprehensive income. The translation reservealso includes the tax effect on translation differences.
19.1.4 Share-based compensations reserveThe share-based compensations reserve comprises the valueof vested rights in respect of share-based compensationarrangements as far as stock options have not been exercisedor performance shares have not been allocated.
The company has various share-based compensationarrangements. Additional information about thesearrangements is given in note 23. The income statementincludes an amount of € 31.3 million (2015: € 29.1 million) forshare-based compensations.
At year-end 2016, 1.9 million performance options andperformance shares (2015: 2.3 million) are outstanding. Uponexercise of stock options or allocation of performance shares,this will lead to the issuance of the same number of newordinary shares or re-issue of treasury shares.
19.1.5 Employee benefits reserveThe employee benefits reserve comprises the cumulativeremeasurements of post-employment benefit obligations asfrom January 1, 2013 (implementation of amended IFRSstandard IAS 19 'Employee benefits'). The amounts are net ofcorporate taxes.
19.1.6 Other reserveThe other reserve comprises remeasurements in respect ofinvestments relating to 'fair value through othercomprehensive income'.
19.1.7 Other informationSee note 7 to the company financial statements for therestrictions on the distribution of dividends and therepayment of capital.
Additional information about shareholders' equity is includedin the consolidated statement of changes in equity.
19.2 Dividends on ordinary and preference shares
Dividends on ordinary and preference shares
Dividend related to
2016 2015 2014
Ordinary shares
- Dividend paid during 2015 81.5
- Stock dividend during 2015 150.6
- Dividend paid during 2016 307.2
- Dividend 2016 proposed 345.9
Preference shares
- Dividend paid during 2015 12.6
- Dividend paid during 2016 12.6
- Dividend 2016 proposed 12.6
19.2.1 Proposed profit appropriationAt the Annual General Meeting of Shareholders, to be heldon March 30, 2017, the Executive Board, with the approval ofthe Supervisory Board, will propose that a dividend of € 1.89per ordinary share be paid for the year 2016; for preferenceshares B and C it will be proposed by the Executive Board,with the approval of the Supervisory Board, that a dividendof € 4.5 million and € 8.1 million be paid respectively. It isfurther proposed that € 229.5 million be added to retainedearnings.
19.2.2 Dividends 2015 and 2014The 2015 dividend on ordinary shares, paid in 2016, had beendetermined at € 1.68 per share and was paid fully in cash.
For 2014, shareholders were given a choice between cash andshares. This choice resulted in a cash dividend of € 81.5 millionand a stock dividend of € 150.6 million, based on the volume-weighted average share price of approximately € 42.79.These amounts were paid in 2015.
19.3 Non-controlling interestsThe additions in 2016 of non-controlling interests result fromthe acquisition of subsidiaries. In addition, transactions tookplace in 2016 with non-controlling interests without a change

148
annual report 2016 − Randstad Holding nv
of control (2015: no transactions), which resulted in anamount of € 0.1 million charged to equity, while the cashconsideration amounted to € 0.2 million.
Accounting policyNon-controlling interests represent the net assets not held bythe Group and are presented within total equity in theconsolidated balance sheet as a separate category. Profit orloss and each component of other comprehensive income areattributed to the equity holders and to the non-controllinginterests.
The Group treats transactions with non-controlling interestsas transactions with equity owners of the Group. Foracquisitions of non-controlling interests, the differencebetween any consideration paid and the relevant shareacquired of the carrying value of the net assets is recorded inequity. Gains or losses on disposals of non-controllinginterests are also recorded in equity as long as control of thesubsidiary is maintained.
Additional information about non-controlling interests isincluded in the consolidated statement of changes in equity.
20. Other liabilities2016 2015
Balance at January 1 21.5 19.5
Deferred considerations in acquired
subsidiaries 0.9 -
Changes in value (3.9) (0.4)
Deferred compensations from acquired
subsidiaries 2.6 0.3
Interest due to passage of time 1.0 1.0
Translation differences (2.8) 1.1
Balance at December 31 19.3 21.5
Non-current portion 12.6 14.5
Current portion 6.7 7.0
19.3 21.5
The effective interest rate amounts to 5.0% (2015: 5.0%).
For the year 2015, the line 'deferred compensations fromacquired subsidiaries' in the amount of € 0.3 million positiveincludes a payment of € 0.3 million relating to acquisitions inpreceding years and relates for an amount of € 0.6million to deferred compensation on 2015 acquisitions.
Accounting policyOther liabilities mainly include liabilities arising fromarrangements with the previous owners of acquiredcompanies who still hold a non-controlling interest ('deferredconsiderations') and deferred payments from other businesscombinations.
With respect to these arrangements, the Group has enteredinto put and call options with the holders of these non-controlling interests. The put option gives the minorityshareholder the right to sell its non-controlling interest to theGroup. The call option gives the Group the right to purchasethe non-controlling interest. The option exercise price isdetermined by a contractually agreed formula that is basedmainly on the future results of the company involved.
The liability is initially stated at fair value. Subsequentmeasurement is at amortized cost, using the effective interestmethod. The value is determined by means of the presentvalue of the expected cash outflows to settle the liability,based on projected results. The discount rate used indiscounting the expected cash outflows is based on aninterest rate that reflects the current market assessment ofthe time value of money, taking into account the expectedsettlement of these liabilities.
In line with the nature of the put option, the liability isclassified as short term, except for the part that can only beexercised after one year. Changes in the value of theseliabilities (also including interest due to passage of time), aswell as differences upon settlement between the actual cashoutflow and the expected cash outflow, are accounted for innet finance costs. The companies acquired under thesearrangements are fully consolidated, with no recognition of anon-controlling interest.
notes to the consolidated balance sheet

149
annual report 2016 − Randstad Holding nv
21. Statement of cash flows
The statement of cash flows has been prepared applying theindirect method. Cash in the statement of cash flowscomprises cash and cash equivalents, as well as currentborrowings, because current borrowings form an integralpart of the Group's cash management.
Cash flows in foreign currencies have been translated, inprinciple, at average exchange rates; certain material (mainlyfinancing) transactions are translated at the exchange rate atthe day of translation. Exchange differences concerning cashitems are shown separately in the statement of cash flows.Income taxes paid/received are included in the cash flow fromoperating activities. Finance income received, financeexpenses paid, and dividends paid are included in the cashflow from financing activities.
The purchase price of acquisitions paid, as well as the sellingprice of disposed subsidiaries received, is included in cash flowfrom investing activities. This purchase price paid, as well asthe selling price received, is included in the statement of cashflows net of net cash acquired or disposed of respectively.Changes in assets and liabilities resulting from the acquisitionand disposal of subsidiaries are taken into account in thecalculation of the consolidated cash flows.
The majority of the items in the consolidated statement ofcash flows are individually cross-referenced to the relevantnotes to the consolidated statement of comprehensiveincome and the balance sheet. For the remainder of thematerial items, the reconciliation between amounts asincluded in the consolidated statement of cash flows andrelated amounts in the statement of comprehensive incomeand the balance sheet is shown in this note.
Currency differences on cash items are presented in the line'translation and currency gains'.
21.1 Cash
Cash
2016 2015
Cash and cash equivalents 385.8 133.5
Current borrowings (438.6) (182.1)
(52.8) (48.6)
21.2 Trade and other receivables
Trade and other receivables
2016 2015
Trade and other receivables as at January 1 3,435.7 3,077.9
Adjusted for:
Current part of loans and receivables (6.7) (3.7)
Deferred receipts relating to disposed Group
companies 0.0 (0.2)
Interest receivable (0.1) (0.1)
Operating working capital assets as at
January 1 3,428.9 3,073.9
Acquisition of subsidiaries 347.0 4.4
Disposal of subsidiaries (0.9) (0.2)
Translation gains (37.1) 80.2
Statement of cash flows 366.4 270.6
Operating working capital assets as at
December 31 4,104.3 3,428.9
Adjusted for:
Current part of CICE receivable 67.4 -
Current part of other loans and receivables 2.5 6.7
Deferred receipts relating to disposed Group
companies - 0.0
Interest receivable 0.0 0.1
Balance as at December 31 4,174.2 3,435.7
notes to the consolidated statement of cash flows

150
annual report 2016 − Randstad Holding nv
21.3 Trade and other payables
Trade and other payables
2016 2015
Trade and other payables as at January 1 2,811.9 2,589.9
Adjusted for:
Interest payable (4.4) (3.7)
Operating working capital liabilities as at
January 1 2,807.5 2,586.2
Acquisition of subsidiaries 423.4 7.1
Disposal of subsidiaries (0.3) 0.6
Translation losses (35.3) 64.9
Statement of cash flows 196.9 148.7
Operating working capital liabilities as at
December 31 3,392.2 2,807.5
Adjusted for:
Interest payable 5.3 4.4
Trade and other payables as at December 31 3,397.5 2,811.9
21.4 Other non-cash items
Other non-cash items
2016 2015
CICE receivable (110.3) (101.5)
Loans 1.9 2.3
Statement of cash flows (108.4) (99.2)
For the CICE receivable, see note 16.1.2.
21.5 Corporate income taxes paid
Corporate income taxes paid
2016 2015
North America 6.1 8.4
Netherlands 24.8 25.9
France 38.7 35.1
Germany (3.9) 5.2
Belgium & Luxembourg 3.2 15.9
Iberia 6.2 6.6
United Kingdom 1.6 0.9
Other European countries 31.8 9.9
Rest of the world 23.6 19.5
Corporate 27.7 (22.0)
Total 159.8 105.4
Corporate income taxes paid in North America are relativelylow as a result of accumulated net operating losses that areoffset against taxable income.
Randstad Holding and its Dutch subsidiaries form a fiscalunity for corporate income tax. The fiscal unity received a taxrefund in 2015.
In Other European countries, additional corporate incometaxes were paid in Sweden and Italy due to the consolidationof newly acquired companies in 2016 and higher profitabilityof existing companies in Italy, Sweden and Poland.
21.6 Free cash flowFree cash flow comprises net cash from operating andinvesting activities, excluding the acquisition and disposal ofsubsidiaries/activities, of equity investments, and ofassociates:
Free cash flow
2016 2015
Net cash from operating activities 559.7 565.6
Net cash from investing activities (675.8) (150.7)
(116.1) 414.9
Acquisition of subsidiaries/activities, equity
investments and associates 581.4 96.4
Disposal of subsidiaries/activities and
associates (0.7) (12.5)
Free cash flow 464.6 498.8
notes to the consolidated statement of cash flows

151
annual report 2016 − Randstad Holding nv
22. Subsidiaries
22.1 Overview of major subsidiaries,as per December 31, 2016
North America- Randstad North America Inc, United States- Randstad Professionals US LP, United States- RiseSmart Inc., United States- Monster Worldwide Inc., United States- Randstad Intérim Inc., Canada
France- Randstad SAS- Atoll SASU
The Netherlands- Randstad Nederland bv- Tempo-Team Group bv- Yacht Group Nederland bv- Randstad Sourceright International bv- Randstad Sourceright EMEA bv
Germany- Randstad Deutschland GmbH & Co KG 1
- Randstad Automotive GmbH & Co KG1
- GULP Solution Services GmbH & Co KG1
- Tempo-Team Personaldienstleistungen GmbH- GULP Information Services GmbH
Belgium & Luxembourg- Randstad Belgium nv- Tempo-Team nv, Belgium- Randstad Interim sa, Luxembourg
United Kingdom- Randstad CPE Limited- Randstad Financial & Professional Limited- Randstad Technologies Limited- Randstad Sourceright Limited- Randstad Employment Bureau Limited
Iberia- Randstad Empleo, Empresa De Trabajo Temporal S.A.
Sociedad Unipersonal, Spain- Randstad Recursos Humanos, Empresa de Trabalho
Temporario S.A., Portugal
Other European countries- Randstad Austria GmbH- Randstad sro, Czech Republic- Randstad A/S, Denmark- Randstad AE, Greece- Randstad Hungary Kft, Hungary- Randstad Italia SPA, Italy- O(biettivo) L(avoro) Group Srl, Italy- Randstad Norway AS, Norway- Randstad Polska Sp. z.o.o., Poland- Randstad sro, Slovakia- Randstad AB, Sweden- Proffice AB, Sweden- Randstad Schweiz AG, Switzerland- Randstad Work Solutions Istihdam ve İnsan Kaynakları
Ltd. Şti., Turkey
Rest of the world- Sesa Internacional S.A., Argentina- Randstad Pty Ltd, Australia- Randstad Brasil Recursos Humanos Ltda, Brazil- Randstad Chile S.A., Chile- Talent Shanghai Co. Ltd, China- Randstad Hong Kong Limited, Hong Kong- Randstad India Private Ltd, India- Randstad KK, Japan- Careo Holding KK, Japan- Randstad Sourceright Sdn. Bhd., Malaysia- Randstad Mexico S. de R.L. de CV, Mexico- Randstad Limited, New Zealand- Randstad (PTE) Limited, Singapore- Sesa Select Uruguay, Uruguay
Other subsidiaries- Randstad Holding Nederland bv, the Netherlands- Randstad Finance GmbH, Switzerland
1 The fully consolidated German subsidiaries mentioned above exercise simplification options in accordance with Article 264.b of the German Commercial Code ('HGB').
A list of all subsidiaries has been filed at the Chamber of Commerce in Amsterdam ('Kamer van Koophandel', Amsterdam;Chamber of Commerce number 33216172). Randstad Holding nv has, directly or indirectly, a 100% interest in all subsidiaries (byway of legal ownership of the shares or by way of economic ownership of the shares (put-call option arrangements) for alimited number of companies), unless stated otherwise.
other notes to the consolidated financial statementsother notes to the consolidated financial statements

152
annual report 2016 − Randstad Holding nv
22.2 SubsidiariesSubsidiaries are companies controlled by Randstad Holdingnv. Control exists when Randstad is exposed to or has rightsto variable returns from its involvement with subsidiarycompanies and has the ability to influence those returnsthrough its power over the subsidiary, generallyaccompanying a shareholding of more than 50% of thevoting rights. Subsidiaries are consolidated from the datethat such control commences until the date that it ceases.
Intragroup balances and intragroup transactions areeliminated, as well as any unrealized gains from thesetransactions. Unrealized losses from intragroup transactionsare also eliminated, unless there is evidence of impairment ofthe assets transferred. Intercompany transactions take placeon an arm's length basis.
22.3 Financial statements of Group companiesUpon translation of foreign activities, the assets and liabilitiesof operations in currencies other than the euro, includinggoodwill and fair-value adjustments arising on consolidation,are translated into euros at the foreign exchange rates at thebalance sheet date. The income statements of theseoperations in currencies other than the euro are translatedinto euros at average exchange rates.
Upon the acquisition of a subsidiary that has a currency otherthan the euro, balance sheet items are translated into eurosat the foreign exchange rates at the acquisition date.
22.4 Net investment in subsidiaries that have acurrency other than the euroThe net investment in subsidiaries that have a currency otherthan the euro includes the participation in the net assets ofthese subsidiaries, and, if applicable, loans to thesesubsidiaries, settlement of which is neither planned norexpected to occur in the foreseeable future.
Translation differences that occur upon consolidation,relating to the translation of the net investment insubsidiaries that have a currency other than the euro, arerecognized in other comprehensive income and presented inthe (foreign currency) translation reserve, a separatecomponent within equity, as are translation differences offinancial liabilities designated as hedges of such investments(net investment hedge), to the extent that the hedge iseffective. The gain or loss relating to the ineffective portion isrecognized immediately in net finance costs.
If the operation is a non-wholly-owned subsidiary, then therelevant proportionate share of the translation differences isallocated to the non-controlling interests.
Whenever a foreign operation is disposed of, thesetranslation differences are released or charged to thestatement of comprehensive income as part of the gain orloss on disposal.
23. Share-based compensations
The company has various share-based compensationarrangements that are settled in ordinary shares. The fairvalue of these share-based compensations, calculated ongrant date, is based on valuation models, taking into accountrelevant market conditions and non-vesting conditions. Thefair value is included in personnel expenses in the vestingperiod during which the expected employee services arereceived. The same amount is credited to shareholders’equity.
At each balance sheet date, the company reassesses itsestimates of the non-market vesting conditions under theseshare-based compensation arrangements. The impact of therevision on original estimates with respect to the past vestingperiod, if any, is recognized in personnel expensesimmediately, with a corresponding adjustment toshareholders' equity.
Within the Group, a number of share-based compensationarrangements are in effect: performance share plans forExecutive Board members, senior management, an advisoryboard share plan, and a share purchase plan for all corporateemployees.
The actual annual grant of performance shares will, inprinciple, not exceed 1% of the ordinary issued capital.However, depending on the realization of relatedperformance targets and the company's actual share price,the number of shares to be issued in relation to vesting of theperformance shares might in a certain year exceed the 1%limit.
23.1 Performance share plans
23.1.1 Executive Board performance share planAs from 2007, conditional performance shares have beengranted annually to the members of the Executive Board. Theplan has a term of three years. The number of shares to vestdepends on the company's TSR performance compared to apeer group of nine companies measured over a three-yearperiod starting on January 1 of the year of grant. As of 2013,the number of shares to vest also depends on achievingcertain sustainability performance targets.
All performance share plans are equity-settled. The fair valueis determined as at the date of each grant, based on a MonteCarlo simulation model.
Volatility of the shares of the peer companies, as well as thepair-wise correlation between all peer shares, is estimated onthe basis of historical daily prices over three years. Estimateddividends of the peer companies are based on historicaldividends.
The fair value is charged to the income statement during thevesting period, based on the on-target awards of the TSR part
other notes to the consolidated financial statements
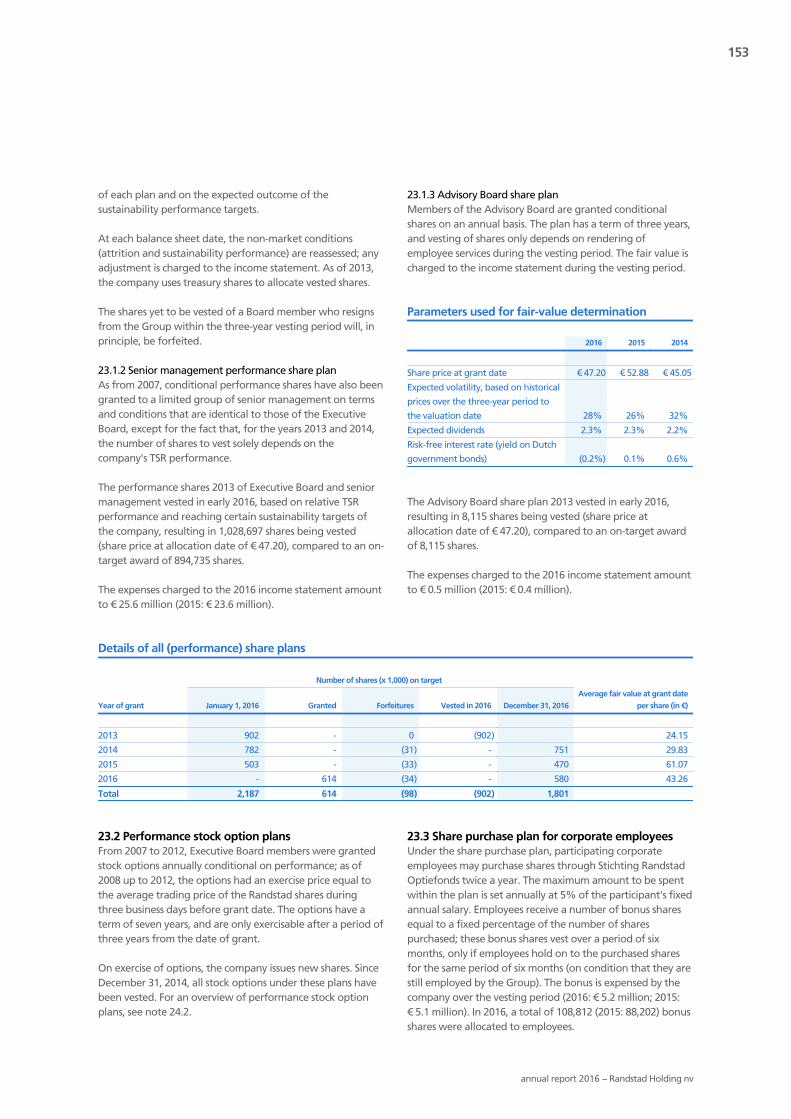
153
annual report 2016 − Randstad Holding nv
of each plan and on the expected outcome of thesustainability performance targets.
At each balance sheet date, the non-market conditions(attrition and sustainability performance) are reassessed; anyadjustment is charged to the income statement. As of 2013,the company uses treasury shares to allocate vested shares.
The shares yet to be vested of a Board member who resignsfrom the Group within the three-year vesting period will, inprinciple, be forfeited.
23.1.2 Senior management performance share planAs from 2007, conditional performance shares have also beengranted to a limited group of senior management on termsand conditions that are identical to those of the ExecutiveBoard, except for the fact that, for the years 2013 and 2014,the number of shares to vest solely depends on thecompany's TSR performance.
The performance shares 2013 of Executive Board and seniormanagement vested in early 2016, based on relative TSRperformance and reaching certain sustainability targets ofthe company, resulting in 1,028,697 shares being vested(share price at allocation date of € 47.20), compared to an on-target award of 894,735 shares.
The expenses charged to the 2016 income statement amountto € 25.6 million (2015: € 23.6 million).
23.1.3 Advisory Board share planMembers of the Advisory Board are granted conditionalshares on an annual basis. The plan has a term of three years,and vesting of shares only depends on rendering ofemployee services during the vesting period. The fair value ischarged to the income statement during the vesting period.
Parameters used for fair-value determination
2016 2015 2014
Share price at grant date € 47.20 € 52.88 € 45.05
Expected volatility, based on historical
prices over the three-year period to
the valuation date 28% 26% 32%
Expected dividends 2.3% 2.3% 2.2%
Risk-free interest rate (yield on Dutch
government bonds) (0.2%) 0.1% 0.6%
The Advisory Board share plan 2013 vested in early 2016,resulting in 8,115 shares being vested (share price atallocation date of € 47.20), compared to an on-target awardof 8,115 shares.
The expenses charged to the 2016 income statement amountto € 0.5 million (2015: € 0.4 million).
Details of all (performance) share plans
Year of grant
Number of shares (x 1,000) on target
January 1, 2016 Granted Forfeitures Vested in 2016 December 31, 2016
Average fair value at grant date
per share (in €)
2013 902 - 0 (902) 24.15
2014 782 - (31) - 751 29.83
2015 503 - (33) - 470 61.07
2016 - 614 (34) - 580 43.26
Total 2,187 614 (98) (902) 1,801
23.2 Performance stock option plansFrom 2007 to 2012, Executive Board members were grantedstock options annually conditional on performance; as of2008 up to 2012, the options had an exercise price equal tothe average trading price of the Randstad shares duringthree business days before grant date. The options have aterm of seven years, and are only exercisable after a period ofthree years from the date of grant.
On exercise of options, the company issues new shares. SinceDecember 31, 2014, all stock options under these plans havebeen vested. For an overview of performance stock optionplans, see note 24.2.
23.3 Share purchase plan for corporate employeesUnder the share purchase plan, participating corporateemployees may purchase shares through Stichting RandstadOptiefonds twice a year. The maximum amount to be spentwithin the plan is set annually at 5% of the participant's fixedannual salary. Employees receive a number of bonus sharesequal to a fixed percentage of the number of sharespurchased; these bonus shares vest over a period of sixmonths, only if employees hold on to the purchased sharesfor the same period of six months (on condition that they arestill employed by the Group). The bonus is expensed by thecompany over the vesting period (2016: € 5.2 million; 2015:€ 5.1 million). In 2016, a total of 108,812 (2015: 88,202) bonusshares were allocated to employees.

154
annual report 2016 − Randstad Holding nv
23.4 Total share-based compensations
2016 2015
Performance share plan 25.6 23.6
Advisory Board share plan 0.5 0.4
Share purchase plan 5.2 5.1
31.3 29.1
24. Related-party transactions
24.1 Key managementThe members of the Executive Board and Supervisory Boardare considered the key management of the Group.
24.2 Remuneration of the members of theExecutive BoardThe totals of the remuneration of the members of theExecutive Board are included in the income statement.
Leo Lindelauf resigned as a Board member on April 2, 2015.His remuneration has been included up to this date. Afterresigning from the Board, Leo Lindelauf continued toperform services for the company. The associated costs in2016 amounted to € 238,000 (2015: € 448,000).
The expenses for performance shares refer to the fair value ofshare-based payments charged to the income statement forthe years 2016 and 2015 respectively.
In the column 'Other benefits/expenses', special wage taxesof € 149,000 (2015: € 119,000) are included, relating to thesalary of François Béharel.
The company has not issued any loans, commitments toprovide loans, or guarantees to Executive Board members.Pension changes related to Dutch-based Board membersinclude compensation for the limitation of accrual of pensionrights in 2016 and 2015.
Executive Board remunerationx € 1,000
Fixed compensation Variable compensation Other benefits/expenses TotalBase salary Pension charge Short-term cash bonus Share-based payments
2016 2015 2016 2015 2016 2015 2016 2015 2016 2015 2016 2015
J.W. van den Broek 1,000 900 270 243 650 810 1,096 1,027 37 57 3,053 3,037
R.J. van de Kraats 710 690 192 186 462 590 842 909 35 29 2,241 2,404
F. Béharel 624 606 168 164 406 542 739 798 299 340 2,236 2,450
L. Galipeau 717 694 194 187 466 611 739 798 80 62 2,196 2,352
C. Heutink 624 606 168 164 406 572 739 598 28 27 1,965 1,967
L.J.M.V. Lindelauf - 151 - 41 - 136 - 387 - 15 - 730
Total 3,675 3,647 992 985 2,390 3,261 4,155 4,517 479 530 11,691 12,940
Number of performance stock options outstanding in 2016
Year of
granting
January 1,
2016
Transfer in
2016
Expired in
2016
Exercised in
2016
Share price at
exercise
December 31,
2016
J.W. van den Broek 2010 7,083 7,083
2011 12,614 12,614
2012 15,382 15,382
R.J. van de Kraats 2010 8,063 (4,032) 49.25 4,031
2011 14,359 14,359
2012 17,511 17,511
Total 75,012 - - (4,032) 70,980
other notes to the consolidated financial statements
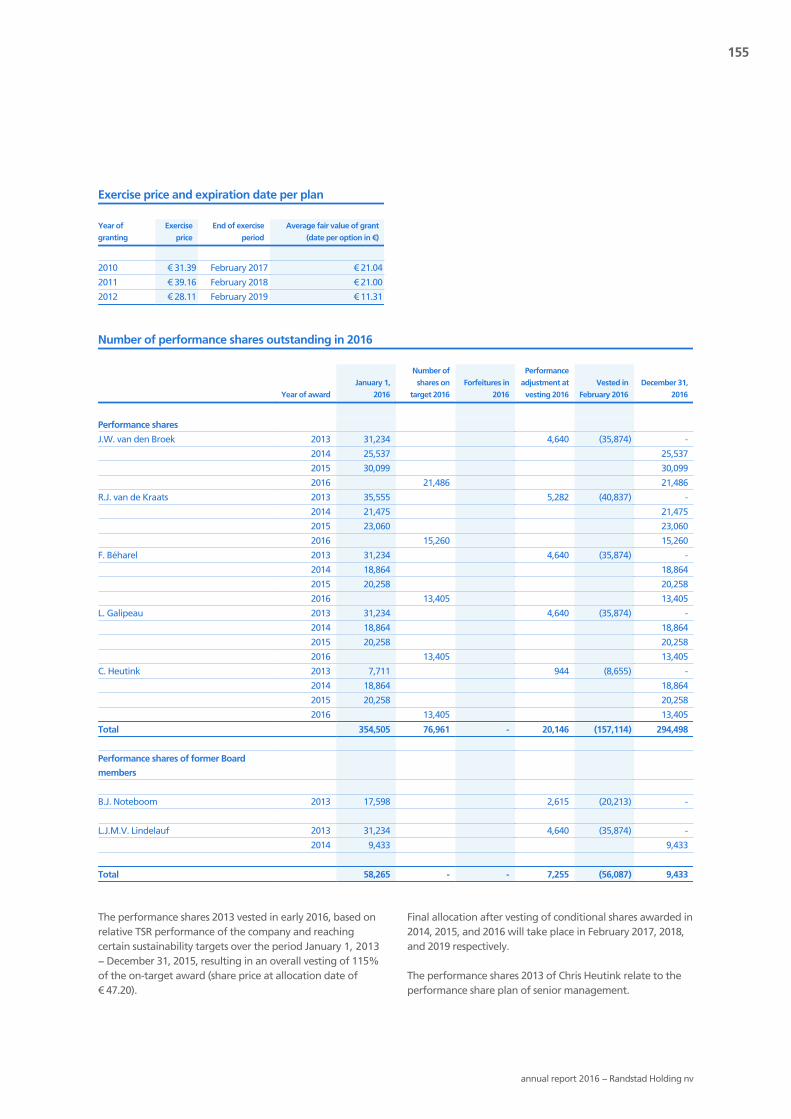
155
annual report 2016 − Randstad Holding nv
Exercise price and expiration date per plan
Year of
granting
Exercise
price
End of exercise
period
Average fair value of grant
(date per option in €)
2010 € 31.39 February 2017 € 21.04
2011 € 39.16 February 2018 € 21.00
2012 € 28.11 February 2019 € 11.31
Number of performance shares outstanding in 2016
Year of award
January 1,
2016
Number of
shares on
target 2016
Forfeitures in
2016
Performance
adjustment at
vesting 2016
Vested in
February 2016
December 31,
2016
Performance shares
J.W. van den Broek 2013 31,234 4,640 (35,874) -
2014 25,537 25,537
2015 30,099 30,099
2016 21,486 21,486
R.J. van de Kraats 2013 35,555 5,282 (40,837) -
2014 21,475 21,475
2015 23,060 23,060
2016 15,260 15,260
F. Béharel 2013 31,234 4,640 (35,874) -
2014 18,864 18,864
2015 20,258 20,258
2016 13,405 13,405
L. Galipeau 2013 31,234 4,640 (35,874) -
2014 18,864 18,864
2015 20,258 20,258
2016 13,405 13,405
C. Heutink 2013 7,711 944 (8,655) -
2014 18,864 18,864
2015 20,258 20,258
2016 13,405 13,405
Total 354,505 76,961 - 20,146 (157,114) 294,498
Performance shares of former Board
members
B.J. Noteboom 2013 17,598 2,615 (20,213) -
L.J.M.V. Lindelauf 2013 31,234 4,640 (35,874) -
2014 9,433 9,433
Total 58,265 - - 7,255 (56,087) 9,433
The performance shares 2013 vested in early 2016, based onrelative TSR performance of the company and reachingcertain sustainability targets over the period January 1, 2013− December 31, 2015, resulting in an overall vesting of 115%of the on-target award (share price at allocation date of€ 47.20).
Final allocation after vesting of conditional shares awarded in2014, 2015, and 2016 will take place in February 2017, 2018,and 2019 respectively.
The performance shares 2013 of Chris Heutink relate to theperformance share plan of senior management.

156
annual report 2016 − Randstad Holding nv
For the conditions and criteria governing the granting andexercise of stock options and performance shares, see note23.1.
Number of ordinary shares in Randstad Holding nv held by Executive Board membersas at December 31, 2016
Locked up
Total Unrestricted shares Number Until
J.W. van den Broek 85,929 65,106 3,009 February 2017
17,814 February 2018
R.J. van de Kraats 38,423 14,719 3,425 February 2017
20,279 February 2018
F. Béharel 1 61,259 30,468 30,791 February 2018
L. Galipeau 26,378 7,401 2,650 February 2017
16,327 February 2018
C. Heutink 4,273 4,273 -1 Due to French tax regulations, the number of shares locked up for François Béharel are relatively high.
24.3 Remuneration of the members of theSupervisory BoardRemuneration of the members of the Supervisory Board isincluded in the income statement.
Supervisory Board remuneration
2016 2015
Current board members
W. Dekker, Chairman 128,500 124,500
J. Winter, Vice Chairman 107,500 101,000
B. Borra 94,000 71,797
F. Dorjee 88,500 90,000
H.M.E.V. Giscard d'Estaing 88,500 88,500
G. Kampouri Monnas 91,500 92,000
R. Provoost 88,500 62,250
687,000 630,047
Former board members
F.W. Fröhlich - 34,750
B.C. Hodson - 20,500
Total - 55,250
Rudy Provoost and Barbara Borra were appointed on April 2,2015. Fritz Fröhlich and Beverly Hodson stepped down onApril 2, 2015.
As members of the Supervisory Board of the Dutch sub-holding Randstad Holding Nederland bv, Jan Hovers andWillem Vermeend, both former members of the SupervisoryBoard, received an annual allowance of € 12,500 in 2016 and2015. Henri Giscard d'Estaing holds 450 ordinary shares inRandstad Holding nv as at December 31, 2016 and 2015.
The company has not issued any loans, commitments toprovide loans, or guarantees to members of the SupervisoryBoard.
24.4 Other related-party transactionsThe founder of the Randstad Group has an interest in a legalentity, which, based on the ‘Wet financieel toezicht’ (Act onFinancial Supervision), is registered as a shareholder inRandstad Holding nv in the 30%− 40% category. There wereno transactions with this related party, other than the rentalof a ship, Clipper Stad Amsterdam, for promotional activities,at an annual rent of approximately € 1.9 million (2015:€ 1.9 million).
See note 4.2.2 'Employee benefit obligations' for transactionswith company pension funds through which certain pensionschemes are operated.
other notes to the consolidated financial statements

157
annual report 2016 − Randstad Holding nv
25. Employee benefit obligationsDefined benefit pension plans Other post-
employment
benefits
Other long-term
employee
benefits TotalObligation Plan assets Net
Balance at January 1, 2016 184.6 (106.8) 77.8 4.2 25.3 107.3
Movements in 2016
Acquisition of subsidiaries 0.1 - 0.1 5.7 - 5.8
Current service costs, total 22.9 - 22.9 0.3 50.7 73.9
Contributions, employees - (7.5) (7.5) - - (7.5)
Contributions, employers - (11.7) (11.7) - - (11.7)
Withdrawals/benefits paid (7.4) 6.2 (1.2) (0.6) (45.2) (47.0)
Total amount in statement of cash flows 15.5 (13.0) 2.5 (0.3) 5.5 7.7
Remeasurement results 7.3 1.8 9.1 - - 9.1
Interest due to passage of time, net 3.2 (1.5) 1.7 0.1 - 1.8
Translation differences 0.9 (0.6) 0.3 - 0.3 0.6
Balance at December 31, 2016 211.6 (120.1) 91.5 9.7 31.1 132.3
Non-current 211.6 (120.1) 91.5 9.5 18.1 119.1
Current - - - 0.2 13.0 13.2
Balance at December 31, 2016 211.6 (120.1) 91.5 9.7 31.1 132.3
Balance at January 1, 2015
Non-current 171.1 (99.1) 72.0 4.4 14.6 91.0
Current - - - 0.4 17.4 17.8
171.1 (99.1) 72.0 4.8 32.0 108.8
Movements in 2015
Current service costs, total 21.8 - 21.8 (0.1) 32.6 54.3
Contributions, employees - (7.1) (7.1) - - (7.1)
Contributions, employers - (10.7) (10.7) - - (10.7)
Withdrawals/benefits paid (12.8) 11.7 (1.1) (0.7) (39.3) (41.1)
Total amount in statement of cash flows 9.0 (6.1) 2.9 (0.8) (6.7) (4.6)
Remeasurement results (5.2) 5.8 0.6 - - 0.6
Interest due to passage of time, net 3.0 (1.7) 1.3 0.2 - 1.5
Translation differences 6.7 (5.7) 1.0 - - 1.0
Balance at December 31, 2015 184.6 (106.8) 77.8 4.2 25.3 107.3
Non-current 184.6 (106.8) 77.8 3.8 13.3 94.9
Current - - - 0.4 12.0 12.4
Balance at December 31, 2015 184.6 (106.8) 77.8 4.2 25.3 107.3
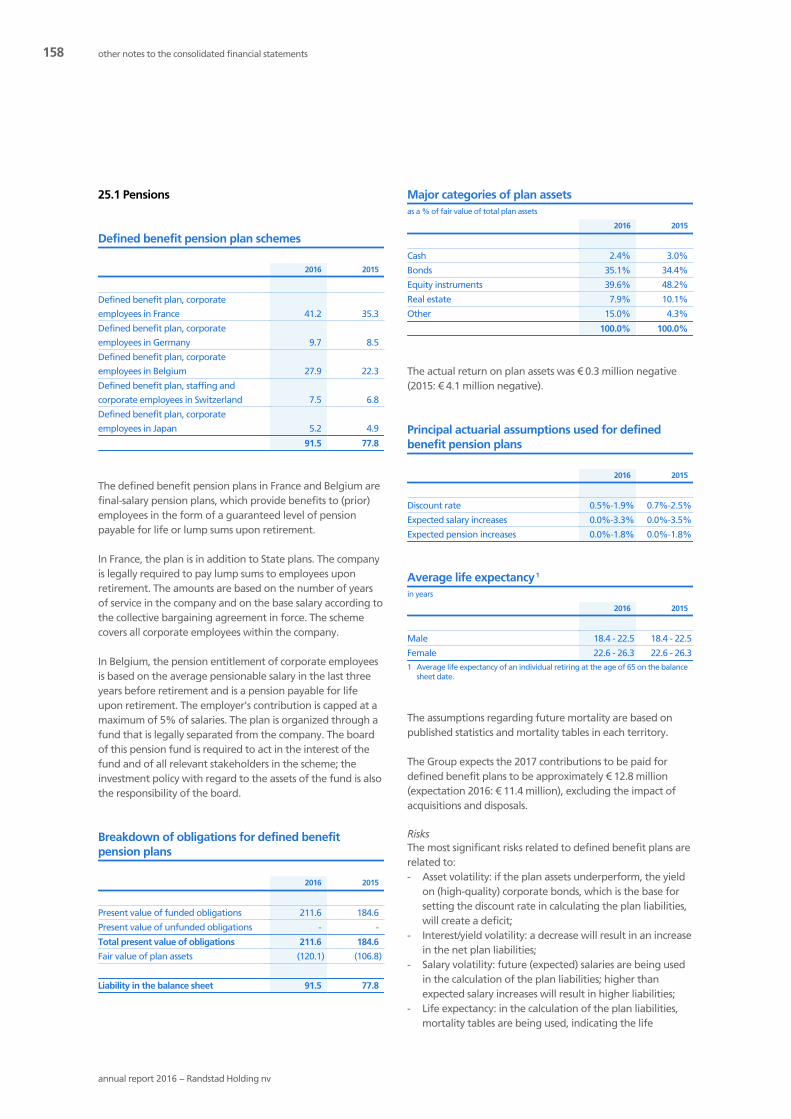
158
annual report 2016 − Randstad Holding nv
25.1 Pensions
Defined benefit pension plan schemes
2016 2015
Defined benefit plan, corporate
employees in France 41.2 35.3
Defined benefit plan, corporate
employees in Germany 9.7 8.5
Defined benefit plan, corporate
employees in Belgium 27.9 22.3
Defined benefit plan, staffing and
corporate employees in Switzerland 7.5 6.8
Defined benefit plan, corporate
employees in Japan 5.2 4.9
91.5 77.8
The defined benefit pension plans in France and Belgium arefinal-salary pension plans, which provide benefits to (prior)employees in the form of a guaranteed level of pensionpayable for life or lump sums upon retirement.
In France, the plan is in addition to State plans. The companyis legally required to pay lump sums to employees uponretirement. The amounts are based on the number of yearsof service in the company and on the base salary according tothe collective bargaining agreement in force. The schemecovers all corporate employees within the company.
In Belgium, the pension entitlement of corporate employeesis based on the average pensionable salary in the last threeyears before retirement and is a pension payable for lifeupon retirement. The employer's contribution is capped at amaximum of 5% of salaries. The plan is organized through afund that is legally separated from the company. The boardof this pension fund is required to act in the interest of thefund and of all relevant stakeholders in the scheme; theinvestment policy with regard to the assets of the fund is alsothe responsibility of the board.
Breakdown of obligations for defined benefitpension plans
2016 2015
Present value of funded obligations 211.6 184.6
Present value of unfunded obligations - -
Total present value of obligations 211.6 184.6
Fair value of plan assets (120.1) (106.8)
Liability in the balance sheet 91.5 77.8
Major categories of plan assetsas a % of fair value of total plan assets
2016 2015
Cash 2.4% 3.0%
Bonds 35.1% 34.4%
Equity instruments 39.6% 48.2%
Real estate 7.9% 10.1%
Other 15.0% 4.3%
100.0% 100.0%
The actual return on plan assets was € 0.3 million negative(2015: € 4.1 million negative).
Principal actuarial assumptions used for definedbenefit pension plans
2016 2015
Discount rate 0.5%-1.9% 0.7%-2.5%
Expected salary increases 0.0%-3.3% 0.0%-3.5%
Expected pension increases 0.0%-1.8% 0.0%-1.8%
Average life expectancy1
in years
2016 2015
Male 18.4 - 22.5 18.4 - 22.5
Female 22.6 - 26.3 22.6 - 26.31 Average life expectancy of an individual retiring at the age of 65 on the balance
sheet date.
The assumptions regarding future mortality are based onpublished statistics and mortality tables in each territory.
The Group expects the 2017 contributions to be paid fordefined benefit plans to be approximately € 12.8 million(expectation 2016: € 11.4 million), excluding the impact ofacquisitions and disposals.
RisksThe most significant risks related to defined benefit plans arerelated to:- Asset volatility: if the plan assets underperform, the yield
on (high-quality) corporate bonds, which is the base forsetting the discount rate in calculating the plan liabilities,will create a deficit;
- Interest/yield volatility: a decrease will result in an increasein the net plan liabilities;
- Salary volatility: future (expected) salaries are being usedin the calculation of the plan liabilities; higher thanexpected salary increases will result in higher liabilities;
- Life expectancy: in the calculation of the plan liabilities,mortality tables are being used, indicating the life
other notes to the consolidated financial statements

159
annual report 2016 − Randstad Holding nv
expectancy of the participants. If life expectancy increases,the plan liabilities will also increase.
SensitivityWith respect to the provision for pensions, a change in theinterest rate of 1 percentage point, with all other variablesheld constant, would result in a deviation in the range of € 11to € 15 million (2015: € 9 to € 11 million).
25.2 Employee benefit obligationsFor more information on pensions and employee benefitobligations, see note 4.2.2.
26. Number of employees(average)
2016 2015
Candidates 626,300 597,400
Corporate employees 32,280 29,750
658,580 627,150
Number of employees by segment
Candidates Corporate employees
2016 2015 2016 2015
North America 109,200 108,800 6,530 6,430
Netherlands 82,500 76,600 4,320 4,150
France 78,200 74,600 3,570 3,460
Germany 47,000 45,800 2,660 2,570
Belgium & Luxembourg 41,900 41,400 1,940 1,890
Iberia 63,200 61,000 1,870 1,750
United Kingdom 14,700 16,000 1,530 1,560
Other European
countries 79,600 60,100 4,150 2,820
Rest of the world 110,000 113,100 5,510 4,930
Corporate - - 200 190
626,300 597,400 32,280 29,750
27. Commitments
2016 2015
Commitments less than 1 year 263.1 197.6
Commitments more than 1 year, less than
5 years 421.9 332.7
Commitments more than 5 years 93.0 42.1
778.0 572.4
Commitments comprise, almost exclusively, lease contracts forbranches and lease contracts for IT equipment andautomobiles.
No guarantees have been issued other than those relating tocommitments regarding rent and leases, and those relatingto liabilities that are included in the balance sheet.
28. Auditors' fees
The following auditors' fees were expensed in the incomestatement in the reporting period:
Auditors' fees
2016 2015
Audit of the financial statements 1 3.0 3.0
Audit of the financial statements of
subsidiaries by other audit firms 1.5 0.7
Subtotal for audit of the financial
statements 2 4.5 3.7
Other audit procedures 3 0.1 0.1
Tax and other services3 0.3 0.1
Total 4.9 3.91 The fees listed above relate to the procedures applied to the company and its
consolidated Group entities by Deloitte Accountants B.V. as the external auditorreferred to in Section 1 (1) of the Dutch Accounting Firms Oversight Act (Wta) aswell as by the Deloitte network.
2 Including the audit fees with respect to the local statutory financial statements.3 The fees listed above relate to the procedures applied to the company and its
consolidated Group entities by Deloitte Accountants B.V. as the external auditorreferred to in Section 1(1) of the Dutch Accounting Firms Oversight Act (Wta)(€ 0.1 million), as well as by the Deloitte network.
29. Events after balance sheet date
Subsequent to the date of the balance sheet, the Groupacquired 100% of the shares of Sageco (Australia) and BMC(the Netherlands). Sageco is active in the outplacementbusiness and BMC is active in the Professionals segment. Thepreliminary purchase prices are € 1.2 million and € 67 millionrespectively.
On January 25, 2017, Randstad France announced it hadgained control of Ausy through a successful cash tender offerof € 55 per share. Ausy has become an operational subsidiaryof the Randstad Group as of January 31, 2017.
Preliminary purchase price allocations will take place in thefirst quarter of 2017.

160
annual report 2016 − Randstad Holding nv
Income statementin millions of € Note 2016 2015
Net revenue 2 249.8 40.4
Gross profit 249.8 40.4
Selling expenses 10.6 8.4
General and administrative expenses 71.3 72.1
Total operating expenses 81.9 80.5
Operating profit / (loss) 167.9 (40.1)
Finance income 45.9 42.3
Finance expenses (134.5) (105.9)
Net finance costs (88.6) (63.6)
Income / (loss) before taxes 79.3 (103.7)
Taxes on income (26.3) 22.0
Income from subsidiaries after taxes 4 535.0 600.5
Net income 588.0 518.8
company financial statements(before profit appropriation for ordinary shares)

161
annual report 2016 − Randstad Holding nv
Balance sheet at December 31in millions of € Note 2016 2015
ASSETS
Software 3 0.6 1.1
Intangible assets 0.6 1.1
Subsidiaries 4 7,465.6 6,415.9
Long-term loans receivable from subsidiaries 5 806.9 600.0
Financial fixed assets 8,272.5 7,015.9
Non-current assets 8,273.1 7,017.0
Receivables 6 91.4 51.2
Income tax receivable 14.2 15.8
Cash and cash equivalents 15.9 0.4
Current assets 121.5 67.4
TOTAL ASSETS 8,394.6 7,084.4
EQUITY AND LIABILITIES
Issued capital 25.8 25.8
Share premium 2,270.7 2,270.5
Legal reserves 257.8 222.7
Other reserves 997.8 823.9
Net income for the year 588.0 518.8
Shareholders' equity 7 4,140.1 3,861.7
Non-current liabilities/borrowings 8 2,298.2 1,405.6
Borrowings 8 252.4 118.9
Trade and other payables 9 1,703.9 1,698.2
Current liabilities 1,956.3 1,817.1
TOTAL EQUITY AND LIABILITIES 8,394.6 7,084.4

162
annual report 2016 − Randstad Holding nv
1 Accounting policies for thecompany financial statements
The company financial statements of Randstad Holding nvare prepared in accordance with the legal requirements ofPart 9, Book 2 of the Dutch Civil Code. The company hasmade use of the possibility based on Article 362, paragraph 8,Part 9, Book 2 of the Dutch Civil Code to prepare companyfinancial statements based on the accounting policies usedfor the consolidated financial statements.
The subsidiaries are presented in accordance with the equitymethod.
Receivables are mainly receivables on subsidiaries. Theaccounting policy on trade and other receivables is includedin note 3.2.1 of the notes to the consolidated financialstatements.
A summary of the significant accounting policies and asummary of the critical accounting estimates, assumptionsand judgments are given in note 2 and note 4 respectively ofthe notes to the consolidated financial statements.
2. Net revenue
Net revenue comprises charges to subsidiary companies withregard to corporate expense (2016 and 2015), as well asroyalty charges (2016).
These (royalty) charges are based on a percentage ofrevenues of Group companies.
3. Software
Software
2016 2015
Balance at January 1 1.1 1.5
Additions - 0.1
Amortization (0.5) (0.5)
Balance at December 31 0.6 1.1
Cost 2.0 2.0
Accumulated amortization and impairment (1.4) (0.9)
Balance at December 31 0.6 1.1
Additional information with respect to software is given innote 14 of the notes to the consolidated balance sheet.
4. Subsidiaries
2016 2015
Balance at January 1 6,415.9 5,743.9
Capital contributions 765.1 453.7
Transfer subsidiaries - 2.4
Dividend (269.6) (545.0)
Net income 535.0 600.5
Share-based compensations, subsidiaries (9.7) (3.9)
IAS 19 effects, subsidiaries (6.5) (0.6)
Fair value adjustment on equity
investment 0.3 0.6
Disposal of non-controlling interest (0.1) -
Translation differences 35.2 164.3
Balance at December 31 7,465.6 6,415.9
See note 22.1 of the notes to the consolidated financialstatements for an overview of the major subsidiaries.
5. Long-term loans receivable fromsubsidiaries
This mainly relates to various loans to subsidiaries that areissued with maturity dates from July 2018 to July 2019. Theaverage interest on all loans is 5.6% (2015: 6.3%).
6. Receivables
2016 2015
Receivables from subsidiaries 85.0 46.2
Other receivables 6.4 5.0
91.4 51.2
7. Shareholders' equity
Additional information is given in the consolidated statementof changes in equity and in note 19 of the notes to theconsolidated financial statements.
7.1 Legal reservesBased on Dutch law, a legal reserve needs to be establishedfor currency translations, fair-value adjustments, andcapitalized costs of development of software. The legalreserve cannot be used for dividend distribution and istherefore restricted in usage.
notes to the company financial statements(amounts in millions of €, unless stated otherwise)

163
annual report 2016 − Randstad Holding nv
Legal reserves
2016 2015
Translation reserve 220.7 204.5
Developed software 36.2 17.6
Fair value reserve 0.9 0.6
257.8 222.7
Movements during 2016 relate to translation gains and to thenet balance of capitalization and amortization of softwaredeveloped in-house.
7.2 Other reserves'Other reserves' includes a reserve with respect to share-basedcompensations to the amount of € 54.2 million (2015:€ 50.4 million).
8. Borrowings
2016 2015
Non-current borrowings comprising
drawings on the multi-currency syndicated
revolving credit facility 699.2 124.6
Non-current borrowings to subsidiaries 1,599.0 1,281.0
Non-current borrowings 2,298.2 1,405.6
Current borrowings 252.4 118.9
2,550.6 1,524.5
The non-current borrowings from subsidiaries consist ofvarious loans amounting to € 1,599 million (2015: € 1,281million), maturing from December 31, 2018 to April 6, 2026.The average interest rate on all loans is 5.6% (2015: 5.9%).
Movements in non-current borrowings from thirdparties
2016 2015
Balance at January 1 124.6 315.0
Drawings on / (repayments of) syndicated
loan 552.9 (212.1)
Amortization of transaction costs 2.2 2.2
Translation differences 19.5 19.5
Balance at December 31 699.2 124.6
Additional information with respect to borrowings is given innote 3.2 of the notes to the consolidated balance sheet.
9. Trade and other payables
2016 2015
Trade payables 1.2 1.2
Payables to subsidiaries 1,686.6 1,679.4
Other taxes and social security premiums 1.4 1.2
Wages, salaries and other personnel costs 6.0 7.8
Accruals and deferred income 8.7 8.6
Balance at December 31 1,703.9 1,698.2
10. Number of employees(average)
In 2016, the company employed an average of 160employees (2015: 172).
11. Remuneration
See note 24 of the notes to the consolidated financialstatements.
12. Related parties
All companies within the Group are considered to be relatedparties. Also see notes 22, 23 and 24 of the notes to theconsolidated financial statements.
13. Guarantees and commitments
The company bears joint and several liability for drawings bysubsidiaries under the multi-currency syndicated revolvingcredit facility and under bank overdraft and guaranteefacilities, to the amount of € 562 million (2015: € 484 million).
As at December 31, 2016, guarantees issued on behalf ofsubsidiaries amounted to € 7.4 million (2015: € 8.9 million).Furthermore, in the normal course of business, the companyprovides financial support to its subsidiaries.
The company’s commitments for the period shorter than oneyear amount to € 0.7 million (2015: € 0.9 million) and for theperiod between one and five years to € 1.2 million (2015:€ 1.4 million) with respect to lease contracts for automobiles.
The company is part of fiscal unities for corporate incometaxes, as well as for value-added taxes. As a consequence, thecompany bears joint and several liability for the debts withrespect to corporate income taxes and value-added taxes ofthe fiscal unities. The company settles corporate incometaxes, in principle, based on the results before taxes of thesubsidiaries belonging to the fiscal unity.

164
annual report 2016 − Randstad Holding nv
The company has issued joint and several liability statementsin accordance with Section 403, Part 9, Book 2 of the DutchCivil Code for a limited number of its Dutch subsidiarycompanies, mainly serving as sub-holding companies.
14. Auditors' fees
Information with respect to auditors' fees is given in note 28of the notes to the consolidated financial statements.
Diemen, the Netherlands, February 13, 2017
The Executive BoardJacques van den Broek (Chairman)Robert Jan van de Kraats (Vice-Chairman)François BéharelLinda GalipeauChris Heutink
The Supervisory BoardWout Dekker (Chairman)Jaap Winter (Vice-Chairman)Barbara BorraFrank DorjeeHenri Giscard d'EstaingGiovanna Kampouri MonnasRudy Provoost
notes to the company financial statements

165
annual report 2016 − Randstad Holding nv
Events after balance sheet date
See note 29 to the consolidated financial statements.
Provisions in the Articles ofAssociation concerning profitappropriation
The following is a summary of the most importantstipulations of Article 28 of the Articles of Associationconcerning profit appropriation.
Subsection 1.Any such amounts from the profits as will be fixed by theExecutive Board with the approval of the Supervisory Boardwill be allocated to reserves. As far as possible, from theremaining profits (hereinafter also called the total profits):
a. A dividend will first be distributed to the holders ofpreference A shares on the amount paid on said shares, ofwhich the percentage will be equal to the average of thestatutory interest – in the event of a change in the meantimeto the respective percentages – during the financial year forwhich the distribution is made. This percentage will beincreased by a surcharge fixed by the Executive Board, subjectto the approval of the Supervisory Board, amounting to amaximum of three percent (3%). If, in any year, the profitdistribution on preference A shares cannot be made or canonly be made partially, the overdue dividend on the shareswill be distributed in the subsequent years before any otherdividend distribution is made.
b.1 A dividend will subsequently be distributed per series toholders of preference B shares (equal to the basic percentageto be mentioned under b.2) of the sum of the nominalamount and the amount in share premium which was paidupon the first issue of the shares of said series, whichpercentage will be increased upon said issue by a surcharge,fixed by the Executive Board, subject to approval of theSupervisory Board, of a maximum of one hundred andseventy-five (175) base points. If the share premium reservehas not shown the same balance for the whole financial year,the dividend shall be calculated on the time-weightedaverage balance for that financial year.
b.2 The basic percentage referred to under b.1 will be thearithmetic average of the effective yield on the governmentbonds issued by the Kingdom of the Netherlands with a termor remaining term of six to seven years. For the first time onthe date that the preference B shares (of a series) have beenoutstanding for seven years, and subsequently each period ofseven years after this, the basic percentage of the preferenceB shares (of the series concerned) will be adjusted to the yieldthen effective of the state loans referred to in the above-mentioned provisions.
b.3 A dividend will be distributed per series of preference Cshares to holders thereof equal to the basic percentagementioned under b.4 increased with the incrementmentioned under b.4 calculated over the sum of the nominalamount increased by the daily time weighted average overthe relevant financial year of the sum of the share premiumamount and the preference C shares dividend reserve of saidseries. Notwithstanding the preceding sentence the dividendon the preference C shares for the period until theeighteenth day of November two thousand and nineteen willbe five hundred eighty (580) basis points.
b.4 For the first time on the eighteenth day of November twothousand nineteen and subsequently each period of sevenyears after this, the basic percentage of the preference Cshares (of the series concerned) will be adjusted to theaverage effective return on Dutch government bonds with a(remaining) life of seven years.
The increment is to be determined by the Executive Boardwith the approval of the Supervisory Board with a minimumof fifty (50) basis points and a maximum of six hundred andfifty (650) basis points, depending on the marketcircumstances (as a function of, among other things,illiquidity, perpetuality, creditworthiness, subordination andtax treatment) at that time and is subject to the approval ofthe meeting of shareholders of the preference C shares orseries concerned, which approval requires unanimous votesof the holders of the preference C shares present orrepresented at such meeting.
b.5 The Executive Board is authorized, subject to the approvalof the Supervisory Board, to resolve that dividend on thepreference B shares or on the preference C shares of anyseries shall not be distributed but reserved instead in order tobe distributed at a later date following a resolution to thiseffect by the Executive Board, subject to the approval of theSupervisory Board. When it is resolved that dividend on thepreference B shares shall not be distributed but reserved thenit shall also be resolved that dividend on the preference Cshares shall not be distributed but reserved and vice versa.
b.6 If and insofar as the profit is not sufficient to fully makethe distribution referred to hereinbefore on preference Bshares and on preference C shares, the Executive Board mayresolve, subject to the approval of the Supervisory Board, tomake these distributions from the freely distributablereserves, with the exception of the share premium reservesreferred to in Article 4, paragraph 4 under b and c,preference A shares dividend reserves, preference B sharesdividend reserves and preference C shares dividend reserves.
b.7 If and insofar as in any financial year no distribution canbe made, or it is resolved not to make a distribution onpreference B shares, from the profit realized in thesubsequent years after allocation to reserves and reduction ofthe amounts accruing to holders of preference A shares inaccordance with the provisions in paragraph 1 subparagraph
other information

166
annual report 2016 − Randstad Holding nv
a of Article 28, following a resolution to that effect by theExecutive Board, subject to the approval of the SupervisoryBoard, such distribution will be made to the holders of saidpreference shares or reserved that the deficit will have beenfully made good before the provisions laid downhereinbefore can be applied.
b.8 If and insofar as in any financial year no distribution canbe made, or it is resolved not to make a distribution onpreference C shares, from the profit realized in thesubsequent years after allocation to reserves and reduction ofthe amounts accruing to holders of preference A shares inaccordance with the provisions in paragraph 1 subparagrapha of Article 28, following a resolution to that effect by theExecutive Board subject to the approval of the SupervisoryBoard, such distribution will be made to the holders of saidpreference shares or reserved as such that the deficit willhave been fully made good before the provisions laid downhereinbefore can be applied. Such deficit will be increasedwith the percentage referred to in paragraph 1 under b.3 orunder b.4 of this Article 28 calculated over the period thedeficit occurred and the moment the deficit has been madegood.
b.9 If preference B shares or preference C shares have beenissued in the course of any financial year, the dividend on theshares concerned for said financial year will be reducedproportionately until the first day of issue.
Subsection 2.The balance then remaining will be available to the GeneralMeeting, subject to the proviso that (i) no distribution will bemade as long as not all the profit distributions on thepreference shares have been made and the reserves aredistributed on the preference shares as referred to in thisArticle 28 and (ii) no further distribution will be made onpreference shares, nor will any amounts be reserved for thispurpose.
Subsection 3.The company may only make distributions to shareholdersfrom the profit susceptible to distribution insofar as itscommon equity exceeds the amount of the paid and claimedpart of the capital increased by the reserves to be kept byvirtue of the law.
Subsection 4.Subject to the approval of the Supervisory Board, theExecutive Board may pass a resolution for distribution of aninterim dividend, to be deducted from the dividend expectedfor the financial year concerned, if the requirement of thepreceding paragraph has been fulfilled, as will be evidentfrom an interim specification of equity and all thedistributions on preference B shares and preference C shareshave been made. Said specification of equity will relate to theposition of the equity at the earliest on the first day of thethird month prior to the month in which the resolution fordistribution will be announced. It will be drawn up with due
observance of the valuation methods deemed acceptable insociety. The specification of equity will include the amountsto be allocated to the reserves by virtue of the law. It will besigned by the members of the Executive Board. In the eventthat the signature(s) of one or more of them should belacking, the reason thereof will be stated. The company willdeposit the specification of equity at the office of the TradeRegister within eight days after the date on which theresolution for distribution will be announced. A resolution fordistribution of an interim dividend may be limited to adistribution of an interim dividend exclusively to shareholdersof a particular class, without prejudice to the rights ofshareholders of other classes.
Subsection 5.Resolutions for the complete or partial cancellation ofreserves as stated in paragraph 1 of this Article may only bepassed by the General Meeting on a proposal of theExecutive Board approved by the Supervisory Board, with theexception of resolutions in respect of: (i) distributions fromreserved dividend on preference B shares and on preferenceC shares, which shall be resolved upon by the Executive Boardsubject to the approval of the Supervisory Board; and (ii)annual distributions of twenty per cent (20%) of thepreference C shares share premium reserve on preference Cshares, which may be increased with an additional amount atthe expense of the general reserves, such amount as to bedetermined at the time of issuance, which distributions maybe resolved upon by the Executive Board, subject to theapproval of the Supervisory Board, once the preference Cshares (of a series) have been outstanding for four years. If inany financial year a distribution as referred to under (ii) doesnot occur or does not wholly occur, such distribution maytake place in a subsequent year, provided that in anyfinancial year not more than thirty percent (30%) may bedistributed. When it is resolved that distributions shall bemade from the preference B shares dividend reserve then itshall also be resolved that distributions shall be made fromthe preference C shares dividend reserve and vice versa.
Resolutions of the General Meeting for the complete orpartial cancellation of a share premium reserve will requirethe prior approval of the meeting of holders of shares of theclass and series concerned, without prejudice to theprovisions in Article 4, paragraph 5, under b.1. Only holdersof ordinary shares will be entitled to distributions deductedfrom allocations to reserves other than those mentioned inthe preceding sentence. However, without prejudice to theamounts that would accrue to holders of preference B sharesor holders of preference C shares, in accordance with theprovisions in Article 28, paragraph 1b.4. and Article 34,paragraph 4.6., resolutions for the complete or partialcancellation of reserves as stated in paragraph 1 of this Articlemay only be passed by the General Meeting on a proposal ofthe Executive Board approved by the Supervisory Board, withthe exception of distributions from reserved dividend onpreference B shares, which shall be resolved upon by theExecutive Board subject to the approval of the Supervisory
other information

167
annual report 2016 − Randstad Holding nv
Board. Resolutions of the General Meeting for the completeor partial cancellation of a share premium reserve as stated inArticle 4, paragraph 4.b. will require the prior approval of themeeting of holders of shares of the class and seriesconcerned, without prejudice to the provisions in Article 4,paragraph 5, under b.1. Only holders of ordinary shares willbe entitled to distributions deducted from allocations toreserves other than those mentioned in the precedingsentence. However, without prejudice to the amounts thatwould accrue to holders of preference B shares in accordancewith the provisions in Article 28, paragraph 1b.4. and Article34, paragraph 4.
Article 29 of the Articles of Association concerning paymentin shares or from the reserves states:1. The General Meeting may, at the proposal of the
Executive Board and with the approval of theSupervisory Board, decide to distribute a dividend onordinary shares in whole or in part in shares of thecompany and not in cash.
2. The General Meeting may decide to make a distributionon ordinary shares, in whole or in part, in shares of thecompany and not in cash.
3. The General Meeting may, at the proposal of theExecutive Board and with the approval of theSupervisory Board, decide to make a distribution toholders of ordinary shares from the distributable part ofthe shareholders’ equity. The provisions in paragraph 1of this article will apply mutatis mutandis. Distributionas meant in the present paragraph 3 will only apply ifall the amounts owed by virtue of Article 28, paragraph1 have been paid.
4. In the event of a merger of a Subsidiary of thecompany, the General Meeting will have the authorityto issue shares from one or more of the company’sreserves, which do not need to be retained pursuant tothe law or these Articles of Association.
Proposed profit appropriation
See note 19.2.1 to the consolidated financial statements.

168
annual report 2016 − Randstad Holding nv
Independent auditor's report
To the shareholders and Supervisory Board of RandstadHolding nv
Report on the financial statements 2016, included inthe annual report
Our opinionWe have audited the financial statements 2016 of RandstadHolding nv, based in Diemen. The financial statementsinclude the consolidated financial statements and thecompany financial statements.
In our opinion:- The consolidated financial statements included in this
annual report give a true and fair view of the financialposition of Randstad Holding nv as at 31 December 2016,and of its result and its cash flows for 2016 in accordancewith International Financial Reporting Standards asadopted by the European Union (EU-IFRS) and with Part 9of Book 2 of the Dutch Civil Code.
- The company financial statements included in this annualreport give a true and fair view of the financial position ofRandstad Holding nv as at 31 December 2016, and of itsresult for 2016 in accordance with Part 9 of Book 2 of theDutch Civil Code.
The consolidated financial statements comprise:1. The consolidated balance sheet as at 31 December
2016.2. The following statements for 2016: the consolidated
statement of comprehensive income, the consolidatedstatement of cash flows and consolidated statement ofchanges in equity.
3. The notes comprising a summary of the significantaccounting policies and other explanatory information.
The company financial statements comprise:1. The company balance sheet as at 31 December 2016.2. The company income statement for 2016.3. The notes comprising a summary of the accounting
policies and other explanatory information.
Basis for our opinionWe conducted our audit in accordance with Dutch law,including the Dutch Standards on Auditing. Ourresponsibilities under those standards are further described inthe “Our responsibilities for the audit of the financialstatements” section of our report.
We are independent of Randstad Holding nv in accordancewith the Verordening inzake de onafhankelijkheid vanaccountants bij assurance-opdrachten (ViO) and otherrelevant independence regulations in the Netherlands.Furthermore we have complied with the Verordeninggedrags- en beroepsregels accountants (VGBA).
We believe the audit evidence we have obtained is sufficientand appropriate to provide a basis for our opinion.
MaterialityBased on our professional judgement we determined themateriality for the financial statements as a whole at € 30million. The materiality is based on 5% of Profit before Taxadjusted for interest and depreciation and amortization.We have also taken into account misstatements and/orpossible misstatements that in our opinon are material forthe users of the financial statements for qualitative reasons.
We agreed with the Supervisory Board that misstatements inexcess of € 1.5 million, which are identified during the audit,would be reported to them, as well as smaller misstatementsthat in our view must be reported on qualitative grounds.
Scope of the Group auditRandstad Holding nv is at the head of a group of entities. Thefinancial information of this Group is included in the financialstatements of Randstad Holding nv.
In establishing the overall Group audit strategy and plan, wedetermined the type of work that needed to be performed atthe Group entities by the Group engagement team and bycomponent auditors from other Deloitte firms. The newlyacquired companies of the former Proffice group andMonster Worldwide were included in the audit scope andwere audited by other (non-Deloitte) audit firms. Wedirected and supervised their work as part of the Groupaudit.
Where the work was performed by component auditors, wedetermined the level of involvement we needed to have inthe audit work at those Group entities so as to be able toconclude whether sufficient appropriate audit evidence hadbeen obtained as a basis for our opinion on the Groupfinancial statements as a whole. For each Group entity wedetermined whether we required an audit of their completefinancial information or whether other procedures would besufficient. Those where a complete audit was requiredincluded the following Group entities: the United States,Netherlands, France, Germany, Belgium, United Kingdom,Spain, Italy (including Obiettivo Lavoro), Australia, Japan(including Careo), India, the former Proffice group andMonster Worldwide. These were selected because of theirfinancial significance to the Group’s revenue or underlyingprofits.
Audit coverage
Audit coverage of consolidated
revenues
91%
Audit coverage of consolidated
assets
95%
other information

169
annual report 2016 − Randstad Holding nv
In addition, we performed other procedures with respect tothe remaining Group entities.
The Group consolidation, financial statement disclosures anda number of complex items were audited by the Groupengagement team at the head office. These include theannual goodwill impairment test, purchase price allocationfor all acquisitions, valuation of deferred tax assets and share-based payments.
By performing the procedures mentioned above at Groupentities, together with additional procedures at Group level,we have been able to obtain sufficient and appropriate auditevidence about the Group’s financial information to providean opinion about the financial statements.
Our key audit mattersKey audit matters are those matters that, in our professionaljudgement, were of most significance in our audit of thefinancial statements. We have communicated the key auditmatters to the Supervisory Board. The key audit matters arenot a comprehensive reflection of all matters discussed.
These matters were addressed in the context of our audit ofthe financial statements as a whole and in forming ouropinion thereon, and we do not provide a separate opinionon these matters.
Key audit matter How the key audit matter was addressed in the audit
Business combinations
In 2016, Randstad Holding nv acquired five companies
(Proffice, Twago, Obiettivo Lavoro, Careo and
Monster). The company prepared a purchase price
allocation for these acquisitions, by which the total
consideration is allocated to the assets and liabilities of
the respective acquired company. The acquisitions and
the purchase price allocation are disclosed in note 6.1
to the financial statements. Given the significance of
the purchase consideration and the management
estimates that are required to prepare a purchase
price allocation, we consider the business
combinations to be a key audit matter.
Furthermore, the financials of the newly acquired
companies are converted to Randstad accounting
policies and consolidated in the Randstad financials as
of acquisition date.
In our audit of the accounting of the acquisitions, we assessed the sale/purchase/merger
agreements and verified the payment of the purchase price to the sellers. An important
element of our audit relates to the identification of the acquired assets (e.g. valuation of
customers relationships, candidate database, trade names and technology) and liabilities
(provisions, other liabilities). We tested this identification based on our understanding of the
business of the acquired companies and the explanations and plans of the company that
supported the respective acquisition. Subsequently, we tested the fair values of the acquired
assets and liabilities based on common valuation models. We involved our valuation
specialists in our audit of the fair values. As disclosed in note 6.1, the purchase price
allocations of these companies are provisional. As a result, adjustments can be made in 2017
to the purchase price allocations based on new information. Furthermore, we assessed the
appropriateness of the disclosures in the financial statements regarding the acquisitions.
We gained an understanding of the acquired businesses including their control environment
and information systems to enable us to perform a detailed risk assessment and develop the
audit plan. This includes, amongst others, procedures on the conversion to Randstad
accounting policies and key audit matters for these businesses.
Valuation of deferred tax assets
The Group’s deferred income tax assets and deferred
income tax liabilities as at December 31, 2016 are
valued at € 520.2 million and € 42.2 million
respectively. Under EU-IFRS, the company is required
to periodically determine the valuation of deferred
tax positions. This area was significant to our audit
because of the related complexity of the valuation
process which involves significant management
judgment given it is based on assumptions that are
affected by expected future market and economic
conditions, and tax laws and regulations.
Our audit procedures included obtaining an understanding of management’s process for
valuation of deferred tax assets and testing relevant controls. Our substantive procedures
include amongst others an assessment of the recoverability of deferred tax assets in the USA
and Luxembourg because of the respective values of these deferred tax assets and for
France and India due to the level of management judgment involved. We compared the
consistency of management’s profitability forecasts with those included in the annual
goodwill impairment test. We also assessed local fiscal developments, in particular those
related to changes in the statutory income tax rate and statutes of limitation since these are
key assumptions underlying the valuation of the deferred tax assets. Further, we used our
tax specialists to assist us in evaluating the assumptions and methodologies used by the
company. In addition we also focused on the adequacy of the company’s disclosures on
deferred income tax positions and assumptions used. The company’s disclosures concerning
income taxes are included in note 4.3 to the consolidated financial statements.

170
annual report 2016 − Randstad Holding nv
Key audit matter How the key audit matter was addressed in the audit
Valuation of goodwill
At December 31, 2016 the Group’s goodwill balance is
valued at € 2,933.1 million. Under EU-IFRS, the
company is required to annually test for impairment
of goodwill. This annual impairment test was
significant to our audit because the assessment
process is complex and involves significant
management judgment and is based on assumptions
that are affected by expected future market and
economic conditions. Based on the annual goodwill
impairment test the Executive Board concluded that
no goodwill impairment was needed, except for the
€ 9.9 million impairment in relation to the segment
India. The key assumptions and sensitivities are
disclosed in note 4.1 to the consolidated financial
statements.
Our audit procedures included obtaining an understanding of management’s process for
valuation of goodwill and testing relevant controls. Our substantive procedure includes
amongst others an assessment of the mathematical accuracy of the calculations and a
reconciliation to the long term forecast as approved by the Executive Board. We used our
valuation experts to assist us in evaluating the assumptions and methodologies used in the
annual impairment test prepared by the company. We have challenged management,
primarily on their assumptions applied where upon which the outcome of the impairment
test is most sensitive, including, for example, projected revenue growth, EBITA margin,
discount rate and terminal growth. Further, we challenged management by comparing the
assumptions to historic performance of the company, local economic development and
industry outlook, taking into account the sensitivity of the goodwill balances to changes in
the respective assumptions. We also focused on the adequacy of the company’s disclosures
concerning those key assumptions to which the outcome of the impairment test is most
sensitive. The company’s disclosures concerning impairment and goodwill are included in
note 4.1 to the consolidated financial statements.
Report on the other information included in theannual reportIn addition to the financial statements and our auditor’sreport, the annual report contains other information thatconsists of:- Management Board's Report- Other Information as required by Part 9 of Book 2 of the
Dutch Civil Code
Based on the following procedures performed, we concludethat the other information:- Is consistent with the financial statements and does not
contain material misstatements.- Contains the information as required by Part 9 of Book 2
of the Dutch Civil Code.
We have read the other information. Based on ourknowledge and understanding obtained through our auditof the financial statements or otherwise, we have consideredwhether the other information contains materialmisstatements.
By performing these procedures, we comply with therequirements of Part 9 of Book 2 of the Dutch Civil Code andthe Dutch Standard 720. The scope of the proceduresperformed is substantially less than the scope of thoseperformed in our audit of the financial statements.
Management is responsible for the preparation of otherinformation.
Report on other legal and regulatory requirements
EngagementWe were appointed by the general meeting as auditor ofRandstad Holding nv on April 3, 2014 as of the audit for year2015 and have operated as statutory auditor ever since thatdate.
Description of responsibilities for the financialstatements
Responsibilities of management and the Supervisory Boardfor the financial statementsManagement is responsible for the preparation and fairpresentation of the financial statements in accordance withEU-IFRS and Part 9 of Book 2 of the Dutch Civil Code.Furthermore, management is responsible for such internalcontrol as management determines is necessary to enable thepreparation of the financial statements that are free frommaterial misstatement, whether due to fraud or error.
As part of the preparation of the financial statements,management is responsible for assessing the company’sability to continue as a going concern. Based on the financialreporting framework mentioned, management shouldprepare the financial statements using the going concernbasis of accounting unless management either intends toliquidate the company or to cease operations, or has norealistic alternative but to do so.
Management should disclose events and circumstances thatmay cast significant doubt on the company’s ability tocontinue as a going concern in the financial statements.
other information
171
annual report 2016 − Randstad Holding nv
The Supervisory Board is responsible for overseeing thecompany’s financial reporting process.
Our responsibilities for the audit of the financialstatementsOur objective is to plan and perform the audit assignment ina manner that allows us to obtain sufficient and appropriateaudit evidence for our opinion.
Our audit has been performed with a high, but not absolute,level of assurance, which means we may not have detectedall material errors and fraud.
Misstatements can arise from fraud or error and areconsidered material if, individually or in the aggregate, theycould reasonably be expected to influence the economicdecisionsof users takenon the basisof these financialstatements. The materiality affectsthe nature, timingandextent of our audit procedures and the evaluation of theeffectof identified misstatements on our opinion.
We have exercised professional judgment and havemaintained professional skepticism throughout the audit, inaccordance with Dutch Standards on Auditing, ethicalrequirements and independence requirements. Our auditincluded e.g.:
- Identifying and assessing the risks of materialmisstatement of the financial statements, whether due tofraud or error, designing and performing auditprocedures responsive to those risks, and obtaining auditevidence that is sufficient and appropriate to provide abasis for our opinion. The risk of not detecting a materialmisstatement resulting from fraud is higher than for oneresulting from error, as fraud may involve collusion,forgery, intentional omissions, misrepresentations, or theoverride of internal control.
- Obtaining an understanding of internal control relevantto the audit in order to design audit procedures that areappropriate in the circumstances, but not for the purposeof expressing an opinion on the effectiveness of thecompany’s internal control.
- Evaluating the appropriateness of accounting policiesused and the reasonableness of accounting estimates andrelated disclosures made by management.
- Concluding on the appropriateness of management’s useof the going concern basis of accounting, and based onthe audit evidence obtained, whether a materialuncertainty exists related to events or conditions that maycast significant doubt on the company’s ability to continueas a going concern. If we conclude that a materialuncertainty exists, we are required to draw attention inour auditor’s report to the related disclosures in thefinancial statements or, if such disclosures are inadequate,to modify our opinion. Our conclusions are based on theaudit evidence obtained up to the date of our auditor’sreport. However, future events or conditions may causethe company to cease to continue as a going concern.
- Evaluating the overall presentation, structure and contentof the financial statements, including the disclosures.
- Evaluating whether the financial statements represent theunderlying transactions and events in a manner thatachieves fair presentation.
Because we are ultimately responsible for the opinion, we arealso responsible for directing, supervising and performing theGroup audit. In this respect we have determined the natureand extent of the audit procedures to be carried out forGroup entities. Decisive were the size and/or the risk profileof the Group entities or operations. On this basis, we selectedGroup entities for which an audit or review had to be carriedout on the complete set of financial information or specificitems.
We communicate with the executive and Supervisory Boardregarding, among other matters, the planned scope andtiming of the audit and significant audit findings, includingany significant findings in internal control that we identifyduring our audit.
We provide the Supervisory Board with a statement that wehave complied with relevant ethical requirements regardingindependence, and to communicate with them allrelationships and other matters that may reasonably bethought to bear on our independence, and where applicable,related safeguards.
From the matters communicated with the Supervisory Board,we determine those matters that were of most significance inthe audit of the financial statements of the current periodand are therefore the key audit matters. We describe thesematters in our auditor’s report unless law or regulationprecludes public disclosure about the matter or when, inextremely rare circumstances, not communicating the matteris in the public interest.
Diemen, 13 February 2017
Deloitte Accountants B.V.
P.J.M.A. van de Goor
172
supplementaryinformation
173 Summary quarterly income statement 2016
174 Ten years of Randstad
176 Glossary
180 Sustainability and industry membershipsand partnerships
181 Certifications, rankings, and awards
183 Highest Randstad positions in industryassociations
184 Financial calendar

173
annual report 2016 − Randstad Holding nv
amounts in millions of €, unless stated otherwise First quarter Second quarter Third quarter Fourth quarter Year 2016
Revenue 4,701.5 5,108.1 5,349.3 5,525.2 20,684.1
Cost of services 3,836.1 4,144.8 4,349.5 4,419.5 16,749.9
Gross profit 865.4 963.3 999.8 1,105.7 3,934.2
Selling expenses 485.2 506.7 508.6 592.1 2,092.6
Other general and administrative expenses 214.5 221.2 231.6 282.3 949.6
Amortization and impairment of acquisition-related
intangible assets and goodwill 30.4 21.3 16.3 33.4 101.4
Total operating expenses 730.1 749.2 756.5 907.8 3,143.6
Operating profit 135.3 214.1 243.3 197.9 790.6
Net finance income / (costs) 5.2 (4.9) (4.4) 0.3 (3.8)
Share in profit of associates 0.0 0.0 0.0 (0.8) (0.8)
Income before taxes 140.5 209.2 238.9 197.4 786.0
Taxes on income (38.0) (52.9) (62.1) (44.8) (197.8)
Net income 102.5 156.3 176.8 152.6 588.2
Calculation of earnings per ordinary share
Net income for holders of ordinary shares 99.4 153.1 173.6 149.3 575.4
Amortization and impairment of acquisition-related
intangible assets and goodwill 30.4 21.3 16.3 33.4 101.4
One-offs 3.2 4.3 10.9 36.3 54.7
Tax effect on amortization and impairment of
acquisition-related intangible assets and goodwill,
integration costs and one-offs (10.2) (7.8) (8.3) (16.3) (42.6)
Net income for holders of ordinary shares before
amortization and impairment of acquisition-related
intangible assets and goodwill, integration costs and
one-offs 122.8 170.9 192.5 202.7 688.9
Basic earnings per share (€) 0.54 0.84 0.95 0.82 3.15
Diluted earnings per share (€) 0.54 0.83 0.95 0.81 3.13
Diluted earnings per share before amortization and
impairment of acquisition-related intangible assets
and goodwill, integration costs and one-offs (€) 0.67 0.93 1.05 1.10 3.75
Average number of ordinary shares outstanding (in
millions) 182.4 182.9 182.9 182.6 182.7
Average number of diluted ordinary shares
outstanding (in millions) 183.2 183.7 183.7 183.8 183.8
summary quarterly income statement 2016unaudited

174
annual report 2016 − Randstad Holding nv
amounts in millions of €, unless stated otherwise 2016 2015 2014 2013 2012 2011 2010 2009 2008 2007
Revenue 20,684.1 19,219.2 17,249.8 16,568.3 17,086.8 16,224.9 14,179.3 12,399.9 14,038.4 9,197.0
Growth % 7.6% 11.4% 4.1% (3.0)% 5.3% 14.4% 14.4% (11.7)% 52.6% 12.3%
Gross profit 1 3,934.2 3,594.5 3,177.6 3,010.0 3,107.3 2,953.9 2,669.3 2,421.3 2,972.3 2,029.7
EBITDA1 966.1 896.7 725.9 597.9 547.7 633.6 598.9 346.0 744.0 605.6
EBITA1 892.0 832.0 660.7 529.7 463.6 553.1 513.6 252.4 644.0 554.4
Operating profit/(loss)1 790.6 704.7 515.3 366.3 127.6 249.7 341.2 93.8 (34.7) 539.6
Net income 2 588.2 518.8 340.1 230.7 36.7 179.0 288.5 67.6 18.4 384.9
Growth % 13.4% 52.5% 47.4% 528.6% (79.5)% (38.0)% 326.8% 267.4% (95.2)% 6.8%
Net cash flow from operations 559.7 565.6 557.5 340.7 528.6 519.5 369.2 742.7 760.1 401.4
Free cash flow 464.6 498.8 487.7 292.9 466.5 435.2 309.3 698.1 672.7 328.4
Depreciation, amortization and impairment of property, plant, equipment, and
software 74.1 64.7 65.2 68.2 84.1 80.5 85.3 93.6 100.0 51.2
Additions to property, plant, equipment, and software 97.2 67.2 65.7 61.5 63.5 85.5 60.7 48.5 92.0 74.4
Amortization and impairment of acquisition-related intangible assets and
goodwill, and badwill 101.4 127.3 145.4 163.4 336.0 303.4 172.4 158.6 678.7 14.8
Shareholders' equity 4,140.1 3,861.7 3,313.1 2,907.8 2,724.9 2,898.4 2,850.8 2,491.0 2,416.9 1,021.6
(Net debt) / net cash (793.4) (173.2) (422.0) (761.0) (1,095.7) (1,302.6) (899.3) (1,014.7) (1,641.0) (144.2)
Operating working capital 3 712.1 621.4 487.7 459.5 527.6 631.6 525.5 395.2 711.5 409.5
Average number of candidates 626.300 597,400 580,300 567,700 581,700 576,800 521,300 465,600 555,600 369,200
Average number of corporate employees 32,280 29,750 28,720 28,030 29,320 28,700 25,680 27,640 28,230 17,570
Number of branches, year-end 2,974 2,750 2,816 3,161 3,191 3,566 3,085 3,182 4,146 1,889
Number of inhouse locations, year-end 1,778 1,723 1,595 1,426 1,305 1,145 1,110 947 1,087 997
Market capitalization, year-end 9,431.2 10,529.1 7,215.2 8,366.0 4,785.3 3,907.9 6,716.9 5,917.6 2,466.9 3,150.7
Number of ordinary shares outstanding (average in millions) 182.7 181.7 178.9 175.5 171.9 170.8 169.9 169.6 148.6 116.4
Closing price (in €) 51.53 57.53 40.06 47.15 27.81 22.86 39.50 34.90 14.55 27.02
Ratios in % of revenue
Gross profit1 19.0% 18.7% 18.4% 18.2% 18.2% 18.2% 18.8% 19.5% 21.2% 22.1%
EBITDA1 4.7% 4.7% 4.2% 3.6% 3.2% 3.9% 4.2% 2.8% 5.3% 6.6%
EBITA1 4.3% 4.3% 3.8% 3.2% 2.7% 3.4% 3.6% 2.0% 4.6% 6.0%
Operating profit1 3.8% 3.7% 3.0% 2.2% 0.7% 1.5% 2.4% 0.8% (0.2)% 5.9%
Net income 2.8% 2.7% 2.0% 1.4% 0.2% 1.1% 2.0% 0.5% 0.1% 4.2%
Basic earnings per ordinary share (€) 3.15 2.79 1.83 1.25 0.17 1.00 1.65 0.36 0.07 3.31
Diluted earnings per ordinary share (€) 3.13 2.76 1.81 1.23 0.17 1.00 1.63 0.36 0.07 3.30
Diluted earnings per ordinary share before amortization and impairment of
acquisition-related intangible assets and goodwill (€) 3.54 3.23 2.35 1.87 1.73 2.42 2.32 0.99 4.38 3.38
Dividend per ordinary share (€) 1.89 1.68 1.29 0.95 1.25 1.25 1.18 - - 1.25
Payout per ordinary share in % 4 50% 50% 50% 45% 59% 53% 60% - - 38%1 The results as presented in this overview are actual results. As such, they have not been adjusted for one-offs, integration costs or acquisition-related costs.2 For the year 2007, net income includes dividend on preferred shares as financial expenses under net finance costs.3 Operating working capital (as from 2014): trade and other receivables minus the current part of financial fixed assets, deferred receipts from disposed Group companies, and interest receivable minus trade and other payables, excluding interest payable. Comparative figure for 2013 is adjusted; all other years are not adjusted.4 Starting 2008: on basic earnings per ordinary share, adjusted for the net effect of amortization and impairment of acquisition-related intangible assets and goodwill, badwill (2013 only), integration costs and one-offs.
ten years of Randstad

175
annual report 2016 − Randstad Holding nv
amounts in millions of €, unless stated otherwise 2016 2015 2014 2013 2012 2011 2010 2009 2008 2007
Revenue 20,684.1 19,219.2 17,249.8 16,568.3 17,086.8 16,224.9 14,179.3 12,399.9 14,038.4 9,197.0
Growth % 7.6% 11.4% 4.1% (3.0)% 5.3% 14.4% 14.4% (11.7)% 52.6% 12.3%
Gross profit 1 3,934.2 3,594.5 3,177.6 3,010.0 3,107.3 2,953.9 2,669.3 2,421.3 2,972.3 2,029.7
EBITDA1 966.1 896.7 725.9 597.9 547.7 633.6 598.9 346.0 744.0 605.6
EBITA1 892.0 832.0 660.7 529.7 463.6 553.1 513.6 252.4 644.0 554.4
Operating profit/(loss)1 790.6 704.7 515.3 366.3 127.6 249.7 341.2 93.8 (34.7) 539.6
Net income 2 588.2 518.8 340.1 230.7 36.7 179.0 288.5 67.6 18.4 384.9
Growth % 13.4% 52.5% 47.4% 528.6% (79.5)% (38.0)% 326.8% 267.4% (95.2)% 6.8%
Net cash flow from operations 559.7 565.6 557.5 340.7 528.6 519.5 369.2 742.7 760.1 401.4
Free cash flow 464.6 498.8 487.7 292.9 466.5 435.2 309.3 698.1 672.7 328.4
Depreciation, amortization and impairment of property, plant, equipment, and
software 74.1 64.7 65.2 68.2 84.1 80.5 85.3 93.6 100.0 51.2
Additions to property, plant, equipment, and software 97.2 67.2 65.7 61.5 63.5 85.5 60.7 48.5 92.0 74.4
Amortization and impairment of acquisition-related intangible assets and
goodwill, and badwill 101.4 127.3 145.4 163.4 336.0 303.4 172.4 158.6 678.7 14.8
Shareholders' equity 4,140.1 3,861.7 3,313.1 2,907.8 2,724.9 2,898.4 2,850.8 2,491.0 2,416.9 1,021.6
(Net debt) / net cash (793.4) (173.2) (422.0) (761.0) (1,095.7) (1,302.6) (899.3) (1,014.7) (1,641.0) (144.2)
Operating working capital 3 712.1 621.4 487.7 459.5 527.6 631.6 525.5 395.2 711.5 409.5
Average number of candidates 626.300 597,400 580,300 567,700 581,700 576,800 521,300 465,600 555,600 369,200
Average number of corporate employees 32,280 29,750 28,720 28,030 29,320 28,700 25,680 27,640 28,230 17,570
Number of branches, year-end 2,974 2,750 2,816 3,161 3,191 3,566 3,085 3,182 4,146 1,889
Number of inhouse locations, year-end 1,778 1,723 1,595 1,426 1,305 1,145 1,110 947 1,087 997
Market capitalization, year-end 9,431.2 10,529.1 7,215.2 8,366.0 4,785.3 3,907.9 6,716.9 5,917.6 2,466.9 3,150.7
Number of ordinary shares outstanding (average in millions) 182.7 181.7 178.9 175.5 171.9 170.8 169.9 169.6 148.6 116.4
Closing price (in €) 51.53 57.53 40.06 47.15 27.81 22.86 39.50 34.90 14.55 27.02
Ratios in % of revenue
Gross profit1 19.0% 18.7% 18.4% 18.2% 18.2% 18.2% 18.8% 19.5% 21.2% 22.1%
EBITDA1 4.7% 4.7% 4.2% 3.6% 3.2% 3.9% 4.2% 2.8% 5.3% 6.6%
EBITA1 4.3% 4.3% 3.8% 3.2% 2.7% 3.4% 3.6% 2.0% 4.6% 6.0%
Operating profit1 3.8% 3.7% 3.0% 2.2% 0.7% 1.5% 2.4% 0.8% (0.2)% 5.9%
Net income 2.8% 2.7% 2.0% 1.4% 0.2% 1.1% 2.0% 0.5% 0.1% 4.2%
Basic earnings per ordinary share (€) 3.15 2.79 1.83 1.25 0.17 1.00 1.65 0.36 0.07 3.31
Diluted earnings per ordinary share (€) 3.13 2.76 1.81 1.23 0.17 1.00 1.63 0.36 0.07 3.30
Diluted earnings per ordinary share before amortization and impairment of
acquisition-related intangible assets and goodwill (€) 3.54 3.23 2.35 1.87 1.73 2.42 2.32 0.99 4.38 3.38
Dividend per ordinary share (€) 1.89 1.68 1.29 0.95 1.25 1.25 1.18 - - 1.25
Payout per ordinary share in % 4 50% 50% 50% 45% 59% 53% 60% - - 38%1 The results as presented in this overview are actual results. As such, they have not been adjusted for one-offs, integration costs or acquisition-related costs.2 For the year 2007, net income includes dividend on preferred shares as financial expenses under net finance costs.3 Operating working capital (as from 2014): trade and other receivables minus the current part of financial fixed assets, deferred receipts from disposed Group companies, and interest receivable minus trade and other payables, excluding interest payable. Comparative figure for 2013 is adjusted; all other years are not adjusted.4 Starting 2008: on basic earnings per ordinary share, adjusted for the net effect of amortization and impairment of acquisition-related intangible assets and goodwill, badwill (2013 only), integration costs and one-offs.

176
annual report 2016 − Randstad Holding nv
Operational glossaryActivity-based field steeringOur activity-based field steering (ABFS) model is used tomanage and direct performance across our businesses. Byembedding operational performance tools at every level ofour organization, the input-based ABFS model helpsoperational managers to take the right decisions, at the righttime, and translate them into action. Managers receive up-to-date, accurate reports on a weekly basis, covering a range ofkey performance indicators. These data enable us to manageour units and teams in the field by adapting to changing clientand market demands as they occur.
Agency workAgency work is a special form of temporary work, wheregenerally the employer does not hire the employee directly ona contract with a limited duration, but through a privateemployment agency. The employee is mostly hired directly bythe employment agency, mostly on a temporary basis, butsometimes on a permanent contract. During the contractperiod, the employee can be assigned to different usercompanies.
Aging populationThe process in which the working population is shrinking dueto an increasing number of people leaving the labor marketbecause of their age.
Blue-collar workerWithin Staffing, we typically divide the market into blue-collarand white-collar work. The distinguishing factor is differencein skill sets. Blue collar is predominantly geared towardsindustrial and technical job profiles.
BranchesBranches are physical office locations from which ourconsultants operate.
CandidateAnother term for the people we help to find work at ourclients (temporary and permanent employees).
Candidates/Staffing employees workingThe number of temporary employees currently working forour clients.
ConceptsOur concepts represent the services we offer to our clients. Westandardize the working processes per concept in order toeasily 'copy and paste' them across our operations around theworld.
ConsultantA consultant is a front-office employee who is located at oneof our outlets, directly meeting the demands of clients andcandidates.
FTEFull-time equivalent.
Inhouse locationAn Inhouse location is a branch that is located at a client'spremises, where our consultants work on-site dedicated tothat specific client.
Managed Services Provider (MSP)An MSP is a company that takes on primary responsibility formanaging an organization's contingent workforce program.An MSP may or may not be independent of a staffingsupplier.
OutletsOutlets are branches and Inhouse locations combined.
OutplacementWithin outplacement, we advise and support organizations insituations in which employment contracts need to beterminated because of a strategic decision or for otherreasons. We assist employees in their search for a suitable newjob to make the transition as smooth as possible.
OutsourcingOutsourcing is the sustainable transfer of several clientactivities with output responsibility both in the production/logistics and in the administrative environment.
Penetration rateThe penetration rate is the percentage of temporary workersin the total working population.
Permanent placementApart from attracting candidates for temporary jobs, we alsoservice clients by recruiting candidates for permanentpositions. The process involved is referred to as permanentplacement.
ProfessionalsProfessionals is the service we offer to our clients where weoffer a broad and deep range of candidates with an academicor equivalent degree on a temporary or interim basis, as wellas on a permanent placement basis through Search &Selection.
RecruitmentThe process of hiring candidates for permanent positions.
Recruitment Process Outsourcing (RPO)RPO is the transfer of operational responsibility for one ormore recruiting functions or tasks, including recruitmentadministration, from the client to a service provider.
SpecialtiesSpecialties are the specific market segments that dedicatedunits in our Staffing business focus on, such as healthcare,transport, airports, and call centers. The knowledge,
glossary
177
annual report 2016 − Randstad Holding nv
experience, and expertise we gain by focusing on thesespecialties translate into added value for clients andcandidates.
StaffingA service we offer to our clients that involves matchingcandidates with temporary positions at our clients.
Temporary workCompared to part-time work, temporary work is an evenmore flexible form of labor. This includes both agency workersand limited-duration contract workers.
Two-tier board structureA governance structure in which the board is split between anExecutive Board and a Supervisory Board. The Executive Boardis responsible for developing, driving, executing, andachieving the approved strategy and strategic targets, whilethe Supervisory Board acts in the interest of the company bysupervising and advising the Executive Board.
Vendor Management SystemA VMS is an internet-enabled contingent worker sourcing andbilling application that enables a company to procure andmanage a wide range of contingent workers and services inaccordance with client business rules.
White-collar workerWithin Staffing, we typically divide the market into blue-collarand white-collar work. The distinguishing factor is differencein skill sets. White collar is predominantly geared towardsadministrative job profiles.
Sustainability glossaryFatalityAn incident causing the death of a corporate staff member orcandidate at work, in traffic, while working, or whilecommuting.
Fixed-term contractAn employment contract with a particular end date, meaningthat the contract ends after a certain event or on thecompletion of a task.
Local sickness rateNumber of working days lost due to sickness within Randstad,based on actual working days. Sickness rate calculation:number of workings days lost / (average FTE x available days).
Lost Time Injury (LTI)Days off work due to work-related injury, based on actualworking days. Injury rate calculation: number of workingsdays lost / (average FTE x available days).
Misconduct Reporting Procedure (MRP)Grievance mechanism; a facility operated by an independentexternal provider, where serious breaches of the Randstadbusiness principles can be reported if the regular avenues areinappropriate.
National sickness rateSickness rate in a country as most recently quoted by localpublic administration or authorities.
OECDThe mission of the Organisation for Economic Co-operationand Development (OECD) is to promote policies that willimprove the economic and social well-being of people aroundthe world.
Permanent or open-term contractAn employment contract for an indefinite period of time; thismetric includes employees with a permanent or open-termjob but without an official contract, which is often the case inthe US, for example.
Sickness absenceIncludes both short-term and long-term sickness. Generallyexcludes absence due to work-related accidents andpregnancy leave, unless local authorities use a differentdefinition.
Sustainable Development Goals (SDG)In September 2015, the UN launched the 17 SustainableDevelopment Goals. Countries adopted these goals to endpoverty, protect the planet, and ensure prosperity for all by2030.
Training costsTotal expenditure on training of candidates or employees. Inaddition to external costs of training, an estimate is made ofthe salary costs of internal trainers.
Training hoursNumber of hours spent on training of candidates oremployees. Training of employees excludes attendance at theFrits Goldschmeding Academy, which is reported separately.
VSO volunteersNumber of employees (headcount) working on an indefinitecontract with an operating entity, who have provided supportto VSO (e.g., HR/finance/marketing/legal or strategic advice,fundraisers) either in their home country or at a VSO office(e.g., in the UK or the Netherlands), or on an assignment inAfrica or Asia.
Volunteer hoursThe number of hours actually worked by the volunteer(s) or:number of months of placement x 4 weeks x 36 hours; forshort-term volunteers: number of weeks x 36 hours.

178
annual report 2016 − Randstad Holding nv
Work-related injuriesAccidents during working hours, whether on work premisesor while traveling as part of work duties, causing candidatesor employees to be injured on a scheduled workday or normalwork shift, resulting in days off work.
World Employment Confederation (Europe)Our worldwide/European industry federation that strives forwell-regulated working conditions for corporate employeesand candidates.
Financial glossaryAmortization (and impairment) of acquisition-relatedintangible assetsUpon acquisitions, Randstad identifies intangible assets, suchas customer relationships, brand names, and candidatedatabases. On average, these acquisition-related intangibleassets are amortized over 1 to10 years, leading to an annualnon-cash amortization charge, which is included in operatingprofit.
Capital expendituresPart of cash flow from investing activities. Amounts incurredfor investments in property, plant and equipment (e.g.,furniture, computer hardware), and software.
Cash flow from operating activitiesEBITDA adjusted for changes in working capital, taxes onincome, movements in other balance sheet positions, such asprovisions, and certain other non-cash items.
Closing priceShare price of Randstad at the end of a given trading day onEuronext, where an ordinary share of Randstad is listed.
Cost of servicesExpenses which are directly attributable to revenue. Thesecosts mainly include expenses related to staffing employees,such as wages, social security charges, and taxes.
DSO (Days Sales Outstanding, moving average)The DSO represents the number of days before we are able toconvert sales into cash (received from our client). In theAnnual Report, we use the moving average of the monthlyDSO.
Diluted earnings per ordinary shareDiluted earnings per ordinary share are calculated byadjusting the weighted average number of ordinary sharesoutstanding, assuming conversion of all dilutive potentialordinary shares. The dilutive potential ordinary shares arisefrom various share-based payment arrangements.
Dividend on ordinary sharesPart of net income attributable to holders of ordinary sharesthat will be distributed to holders of ordinary shares.
EBITAEarnings Before Interest, Taxes and Amortization (andimpairment of acquisition-related intangible assets andgoodwill). It is basically the same as operating profit adjustedfor amortization charges on acquisition-related intangibleassets. This is the key performance indicator when looking atthe profitability of our business.
EBITA marginEBITA as percentage of revenue.
EBITDAEarnings Before Interest, Taxes, Depreciation of property,plant and equipment and Amortization of software.
EPS (Earnings Per Share)Net income attributable to holders of ordinary shares dividedby the weighted average number of ordinary sharesoutstanding.
Economic value added (EVA)A financial performance method to calculate the trueeconomic profit of a corporation. EVA can be calculated as netoperating profit after taxes minus a charge for theopportunity cost of the capital invested.
Enterprise valueMarket capitalization plus net debt.
Free cash flowFree cash flow is the sum of net cash flow from operatingactivities and investing activities adjusted for cash flows foracquisitions and disposals of subsidiaries, equity investmentsand associates.
Gross marginGross profit as percentage of revenue.
Gross profitRevenue minus cost of services.
IFRSInternational Financial Reporting Standards.
Incremental conversion ratioAdditional EBITA in a year, when compared with the previousyear, as a percentage of additional gross profit in a year, whencompared with the previous year, based on organic growth.We aim for an incremental conversion ratio of 50%, if grossprofit growth has been achieved.
Leverage ratioNet debt divided by 12-month EBITDA. We aim at a leverageratio of between 0 and 2x EBITDA, which is important forcontinuity. The syndicated loan documentation allows us aleverage ratio of 3.5x EBITDA.
glossary

179
annual report 2016 − Randstad Holding nv
Liquidity of sharesTotal number of shares traded on the stock exchanges.
Market capitalizationTotal shares outstanding multiplied by the share price ofRandstad.
Net debtCash and cash equivalents minus current borrowings and non-current borrowings.
Net finance costsNet finance costs include net interest expenses in relation toour net debt position, foreign currency exchange results, netinterest expenses due to passage of time, and other items.
Net incomeOperating profit minus net finance costs, share of profit (orloss) of associates, and taxes on income.
Net income attributable to holders of ordinary sharesNet income adjusted for the dividend on preferred shares, aswell as for results of non-controlling interests.
Operating expensesOperating expenses comprise personnel and accommodationexpenses in relation to the activities at the outlets and thevarious head offices, IT expenses, other general andadministrative expenses, as well as the amortization andimpairment of acquisition-related intangible assets andgoodwill.
Operating expenses marginOperating expenses as a percentage of revenue.
Operating profitGross profit minus operating expenses.
Operating working capitalTrade and other receivables (excluding current part of loansand receivables and other interest receivable) minus trade andother payables (excluding interest payable). The level ofworking capital is related to the timing of the invoicing andpayrolling processes (weekly or monthly). The payment termsnegotiated with clients and the effectiveness of our collectionprocesses are equally important. Liabilities, such as socialsecurity charges, wage tax, and value-added tax are settledevery month and in some countries on a quarterly basis.Payment terms are often determined by law and thereforedifficult to influence.
Payout per ordinary shareDividend on ordinary shares divided by net income per shareattributable to holders of ordinary shares before amortizationand impairment of acquisition-related intangible assets andgoodwill, integration costs, and one-offs (after taxes).
ProductivityWe measure productivity in three ways: (1) number oftemporary workers per staff member (EW/FTE), (2) gross profitper staff member (GP/FTE), and (3) gross profit in relation topersonnel expenses (GP/PE).
Recovery ratioThe total year-on-year change in operating expenses as apercentage of the decline in gross profit. We aim for arecovery ratio of 50% in case gross profit declines.
RevenueWe distinguish three types of revenue: (1) revenue fromtemporary billings, (2) permanent placement fees, and (3)other revenue. 'Revenue from temporary billings' includes theamounts received or receivable for the services of temporarystaff, including the salary and salary-related employment costsof those staff. These revenues are generally based on thenumber of hours worked by the temporary staff. 'Revenuefrom permanent placements' includes the fee received orreceivable for the services provided. The fee is generallycalculated as a percentage of the candidate's remunerationpackage. The category 'other revenue' includes revenue forservices such as payrolling, outplacement, outsourcing, MSPand RPO services, consultancy, and related HR offerings.
Share in profit/loss of associatesAssociates are companies in which Randstad Holding nv hassignificant influence, but no control, over the financial andoperational policies, generally accompanying a shareholdingof between 20% and 50% of the voting rights. The share ofprofit or loss of the associate is presented in this line of theincome statement.
Syndicated credit facilityRandstad has a € 1,920 million multi-currency syndicatedrevolving credit facility at its disposal, which will mature in July2021. The loan documentation allows a leverage ratio of 3.5xEBITDA, although we aim for a leverage ratio of between 0and 2, which is important for continuity. In certain cases, weare allowed to report a maximum leverage ratio of 4.25xEBITDA for a limited amount of time.
Taxes on incomeTaxes on income comprise current taxes and the realization ofdeferred taxes. Current taxes on income are the sum of taxeslevied on the results before taxes in the countries in whichthose results were generated, based on local tax regulationsand against tax rates of the applicable year. Tax-exemptincome and expenses not deductible for tax purposes aretaken into account in calculating taxes on income.
Velocity of sharesVelocity represents the average holding period of a share inRandstad. It is measured as the total number of shares tradeddivided by the average number of shares outstanding.
180
annual report 2016 − Randstad Holding nv
World Employment ConfederationThrough our membership in the WorldEmployment Confederation (before: Ciett), westrive for well-regulated working conditions forour corporate employees and candidates.
World Employment ConfederationEuropeThrough our membership in the WorldEmployment Confederation Europe(before: Eurociett), we strive for well-regulated working conditions for ourcorporate employees and candidates.
CSR EuropeCSR Europe is a leading European businessnetwork for corporate social responsibility, withmore than 60 leading multinational corporationsas members. Randstad is involved in CSR Europeprojects in the areas of skills for employability,mainstreaming diversity, and well-being in theworkplace.
Global Reporting InitiativeRandstad is a registered organizationalstakeholder of the Global ReportingInitiative (GRI) and supports its missionto make sustainability reportingstandard practice; one which helps topromote and manage change towards asustainable global economy.
VSOOur partnership with Voluntary ServiceOverseas combines the strength of twoorganizations driven by a common aim:to help alleviate poverty across theglobe by sharing skills and expertisewith local communities.VSO focuses on sustainable development, and placesvolunteers through partners in developing countries.Randstad supports VSO by providing strategic support,expertise, funding, and most of all, through our employeeswho can volunteer themselves.
UN Global CompactThe United Nations Global Compact is a voluntarybusiness initiative for companies committed toaligning their activities with ten universallyaccepted principles in the areas of human rights,labor, the environment, and anticorruption. Assignatories of the Compact since 2004, Randstadfirmly believes that responsible business promotesthe development of markets, commerce,technology, and finance for the benefit ofeconomies and societies everywhere.
Global Apprenticeships NetworkThe GAN, established in 2013, aims toaddress the urgent issue of youthunemployment and the need forbusinesses to ensure skills for the future.The Network has been developed jointly by the InternationalOrganisation of Employers (IOE) and the Business and IndustryAdvisory Committee to the OECD (BIAC), with the support ofthe International Labour Organization (ILO).
International Organisation ofEmployersThe IOE is a private sector network of 150business and employer federations in 143countries. The IOE guides its members in mattersof international labor standards, business andhuman rights, CSR, occupational health andsafety, and international industrial relations.
Brussels European Employee RelationsGroupBEERG is an information-sharing and networkinggroup of companies headquartered in the EU, theUS, India, and Japan, where labor andemployment relations professionals discuss topicsof mutual concern.
BusinessEurope AS GroupOn behalf of its member federations,BusinessEurope works to ensure that thevoice of business is heard in Europeanpolicy-making, and also represents itsmembers in the international politicalarena.
VNO-NCWVNO-NCW, the Confederation ofNetherlands Industry and Employers,represents the common interests ofDutch business, both at home andabroad. They cover almost all sectors ofthe economy, including more than 80%of all medium-sized companies in theNetherlands and nearly all of the larger,corporate institutions.
OECD Forum 2016Randstad was Gold sponsor of the OECDForum 2016, which has become a globalshowcase for thoughtful and revealingdiscussions on economic trends,especially on the topic of human capital.
sustainability and industry memberships andpartnerships

181
annual report 2016 − Randstad Holding nv
Certifications- Randstad Group Belgium and Randstad Italy hold the
Social Accountability SA 8000 accreditation.- Randstad Group Netherlands, Diemermere Beheer BV,
Randstad Italy, Randstad Sweden and Norway, RandstadBrazil, Randstad Professionals Germany hold the ISO 14001environmental management certification.
- Randstad Belgium is certified VCU and RandstadProfessionals Belgium is certified Qfor, where VCU standsfor ‘Health and Safety’ and Qfor for ‘Quality training andconsulting organizations’.
- Randstad France, Randstad Germany includingProfessionals and Tempo-Team, Randstad Belgium(Inhouse) and Tempo-Team Belgium (Staffing andInhouse), Randstad Spain, Randstad Portugal (Staffing,Professionals, Contact Centers and Healthcare), Randstadin Italy, Hungary, India, Japan, Brazil, Australia, Argentina,Greece, China, and Poland, UK Care, UK Student andWorker Support, UK Business Support, UK Education, ourcompanies in Sweden and Norway, New Zealand,Randstad Interim Luxembourg, Chile and the companies inthe Netherlands are certified under the ISO 9001 label forquality management.
- Randstad Norway is a certified employer with thecertificate ‘Revidert Arbeidsgiver’ and is qualified in theAchilles Joint Qualification system for suppliers.
- Randstad Belgium, Randstad France, Randstad Italy andRandstad Holding continue to be certified with the GenderEquality European & International Standard (GEEIS) fortheir professional gender diversity practices.
- Randstad, Tempo-Team and Yacht in the Netherlands havebeen certified by FIRA Rating System for sustainabilityassurance based on ISO 26000, consulted by purchasingorganizations.
- Randstad Professionals Germany holds the BildungsträgerAZAV certificate.
- Randstad Switzerland holds the Swissstaffing SQS label,which stands for ethical working and for high professionalstandards in the industry.
- The labor management system 'AMS' of RandstadGermany was certified for systematic and effectiveindustrial protection of the employer's liability. Thiscertification includes the standards NFL/ILO-OSH 2001 andOHSAS 18001:2007.
- Randstad Brazil and Spain hold the OHSAS 18001certificate .
- Randstad Australia has the AS/NZS 4801 accreditation(internationally known as OHSAS 18001).
- Randstad Spain holds the Youth Employment Certificate.- Randstad France and Tempo-Team Belgium hold the Label
Diversité and Randstad Group France the Label égalitéprofessionnelle femmes/hommes.
- In the field of data protection, Randstad Germany hasbeen certified by the TÜV Rheinland Industrie ServiceGmbH.
- Randstad Japan is certified as 'Excellent Staffing Agency' bythe Japan Association of Human Resource Services
Industry, entrusted by the Ministry of Health, Labor andWelfare.
Rankings and awards- Randstad Holding is the only HR services provider included
as a member in the Professional Services industry of theDJSI world and DJSI Europe indices 2016.
- Randstad Holding received confirmation of its continuedmembership of the FTSE4Good Index Series.
- According to the Euronext Vigeo index, Randstad Holdingis one of the 20 most advanced companies in the Beneluxregion and one of the 120 most advanced companies inthe Eurozone region rated on environmental, social andgovernance performances.
- Randstad Holding is included in the Dutch TransparencyBenchmark, an annual research on the content and qualityof CSR or integrated reports of Dutch companies.
- In the Carbon Disclosure Project (CDP) 2016 RandstadHolding scored a B (management level) in the GlobalClimate report (above industry average).
- Randstad Holding has been reconfirmed as a constituentof the Ethibel Sustainability Index (ESI) Excellence Europe.
- In 2016, and for the third time since 2010, RandstadHolding was again awarded winner of the FD HenriSijthoff Award, which is granted to institutions that standout in their financial reporting.
- Eight Randstad executives were included in the GlobalPower 100 – Women in Staffing List 2016. The list iscompiled by Staffing Industry Analysts, highlightingwomen's contributions to the staffing industry.
- Randstad Holding was listed in VBDO's (Dutch Associationof Investors for Sustainable Development) TaxTransparency Benchmark at position 4.
- Randstad Canada was named one of the Best Workplacesin Canada by the Great Place to Work® Institute for atenth consecutive year and was awarded one of the 50best workplaces in Canada for women.
- Randstad Canada was recognized with a 2016 LegalTechnology Award in the contract management category.Legal Technology Awards recognize legal teams andprojects that demonstrate innovation through their use oflegal enterprise management and technology.
- Randstad Canada was awarded for its successful publicrelations campaigns and special events by the CanadianPublic Relations Society Toronto. The ACE Awardsrecognize the outstanding work created by the Toronto PRindustry through its communications campaigns.
- Randstad Spain Foundation was selected as one of thefoundations in the ranking of transparency of companyfoundations.
- Randstad Spain Foundation received the CEPTA award(Confederation of Entrepreneurs of Tarragona), and theAFA award (Association of Andalucía's Foundations), bothawards of Social Responsibility.
- GULP Information Services GmbH holds the seal ofapproval 'Arbeits- und Gesundheitsschütz nach LS-
certifications, rankings, and awards

182
annual report 2016 − Randstad Holding nv
Standard' from TÜV SÜD Life Service GmbH as one of onlyfour enterprises in Bavaria.
Rankings and awards- Randstad France is among the 2% best staffing companies
in labor practices out of more than 150 staffing companiesassessed by Ecovadis, a platform to monitor sustainabilityperformance in the supply chain.
- Randstad Italy received the 'Company to watch 2016'award, appointed by Cerved Group S.p.A., the largestinformation provider in Italy and one of the main ratingagencies in Europe. Randstad Italy was granted the awardfor its economic results and balance sheet, and for itscompetitive positioning and strategic moves.
- Specialty Retail of Randstad Italy was recognized as bestpartner 2015/2016 by 'Associazione Vetrinisti & VisualEuropei' for specific training activities.
- Randstad Sourceright was recognized as a leader inRecruitment Process Outsourcing (RPO) service delivery inEverest Group's 'Recruitment Process Outsourcing – ServiceProvider Landscape with PEAK Matrix™ Assessment 2016'report.
- Several Randstad US companies are ranked in the LargestFirms list drawn up by Staffing Industry Analysts. Staffingand Professionals are in third place, Technologies in fourthand Pharma in sixth.
- Randstad US placed in the 2016 Top 25 Large Places towork, a ranking drawn up by the Atlanta JournalConstitution.
- Several Randstad US companies (Professionals,Technologies and Life Sciences) were named on the 2016Best of Staffing Client List by Invero.
- Several Randstad US companies (Professionals, Healthcare,Engineering and Technologies) were named on the Best ofStaffing Talent List by Invero.
- Randstad US Technologies and Engineering were awardedthe TechServe Alliance Excellence Award by TechServe.
- Randstad US's corporate social responsibility program, HireHope, received the 2016 Care Award from the AmericanStaffing Association.
- Randstad Poland was honored with the award for BestRecruitment Firm of the Year by CEE Shared Services andOutsourcing Awards.
- Randstad UK's CPE business was listed in Recruiter.co.ukHot100 at position 8.
- Randstad UK's CPE business was included in the SundayTimes 100 Best Companies to Work (position 26).
- Randstad Germany was recommended as Headhunter ofthe Year 2016 by candidates of the career platform'Experteer'.
- The consortium School & Economy in Hesse/Germanyhonored the Randstad Germany sponsorship program'You've got talent' with the School & Economy CorporateAward for its efforts for school kids.
- Randstad Portugal was awarded at the Contact CenterWorld with two gold medals for Best Contact Center
Trainer and Best Project Manager. At the same event, theteam was recognized with a silver medal for BestSupervisor and Best Recruitment Campaign.
- Randstad Portugal received the award of Best HR Supplierfrom HR Portugal Magazine.
- The radio campaign 'Mariana's chair', developed byRandstad Portugal together with the national broadcastradio RFM, received the 'Best Media Planning − Radio'award at the Meios & Publicidade awards.
- Randstad Netherlands won the SAN Accent advertisingaward for the Dutch Campaign 'Worden wie je bent'.
- Yacht won the 'Gouden Walnoot' (Golden Walnut) at theDutch Marketing Awards. This is the first scientificallyvalidated award in neuromarketing. The more than 100 TVcommercials tested in 2015 were ranked according to theirimpact on those networks of the human brain that areknown to make TV commercials effective in selling theproduct or valuing the brand.
- Yacht was recognized as the No. 1 brand for interimprofessionals in the Netherlands in 2016 by MT magazine,one of the leading Dutch business publications.
- Randstad Netherlands won the SponsorRing OeuvreAward, for the long-lasting successful sponsoringpartnership with the Dutch Olympic Committee, apartnership spanning two decades.
- Randstad Asia proudly received several prestigious awardsin 2016. At the Asia Corporate Excellence & SustainabilityAwards (ACES), Randstad Southeast Asia won the IndustryChampion of the Year Award. In addition, Randstad Asiawon two awards at the prestigious Global Recruiter AsiaPacific Industry Awards 2016: Best Large RecruitmentBusiness and Best Use of Social Media. Randstad Asia alsoclinched the Best Back Office Award at the RecruitmentInternational Asia Awards.
certifications, rankings, and awards
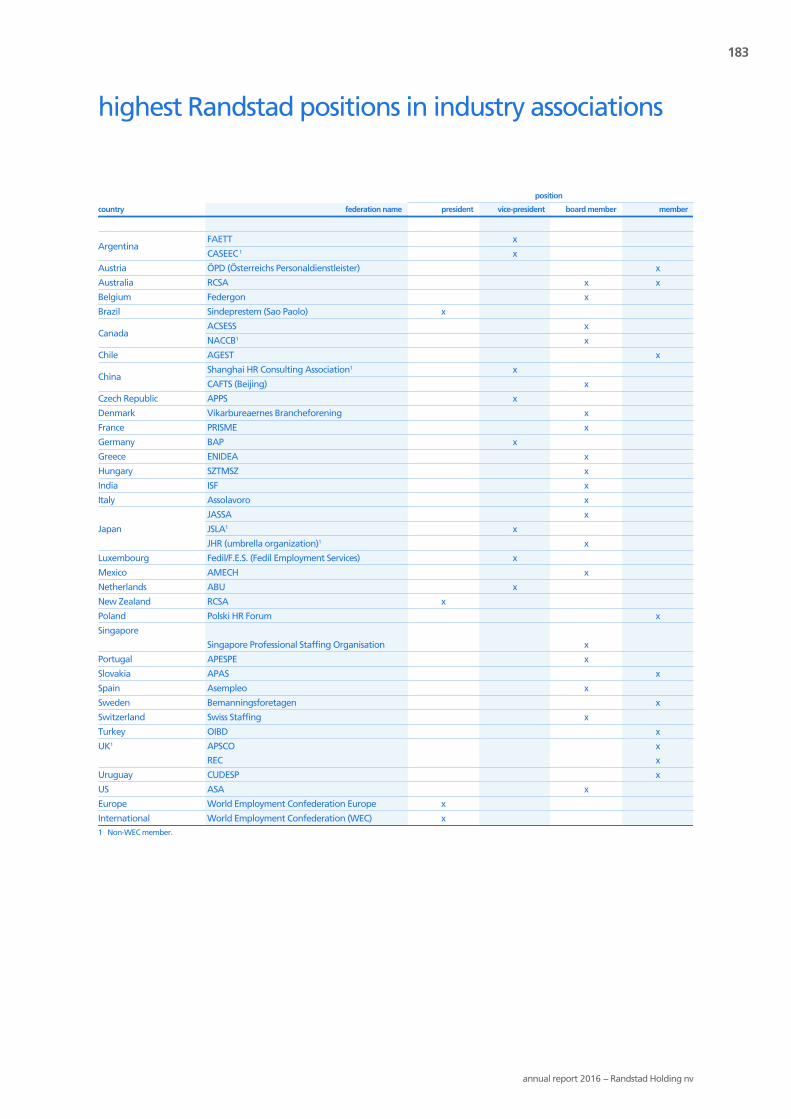
183
annual report 2016 − Randstad Holding nv
position
country federation name president vice-president board member member
ArgentinaFAETT x
CASEEC 1 x
Austria ÖPD (Österreichs Personaldienstleister) x
Australia RCSA x x
Belgium Federgon x
Brazil Sindeprestem (Sao Paolo) x
CanadaACSESS x
NACCB1 x
Chile AGEST x
ChinaShanghai HR Consulting Association1 x
CAFTS (Beijing) x
Czech Republic APPS x
Denmark Vikarbureaernes Brancheforening x
France PRISME x
Germany BAP x
Greece ENIDEA x
Hungary SZTMSZ x
India ISF x
Italy Assolavoro x
Japan
JASSA x
JSLA1 x
JHR (umbrella organization)1 x
Luxembourg Fedil/F.E.S. (Fedil Employment Services) x
Mexico AMECH x
Netherlands ABU x
New Zealand RCSA x
Poland Polski HR Forum x
Singapore
Singapore Professional Staffing Organisation x
Portugal APESPE x
Slovakia APAS x
Spain Asempleo x
Sweden Bemanningsforetagen x
Switzerland Swiss Staffing x
Turkey OIBD x
UK1 APSCO
REC
x
x
Uruguay CUDESP x
US ASA x
Europe World Employment Confederation Europe x
International World Employment Confederation (WEC) x1 Non-WEC member.
highest Randstad positions in industry associations
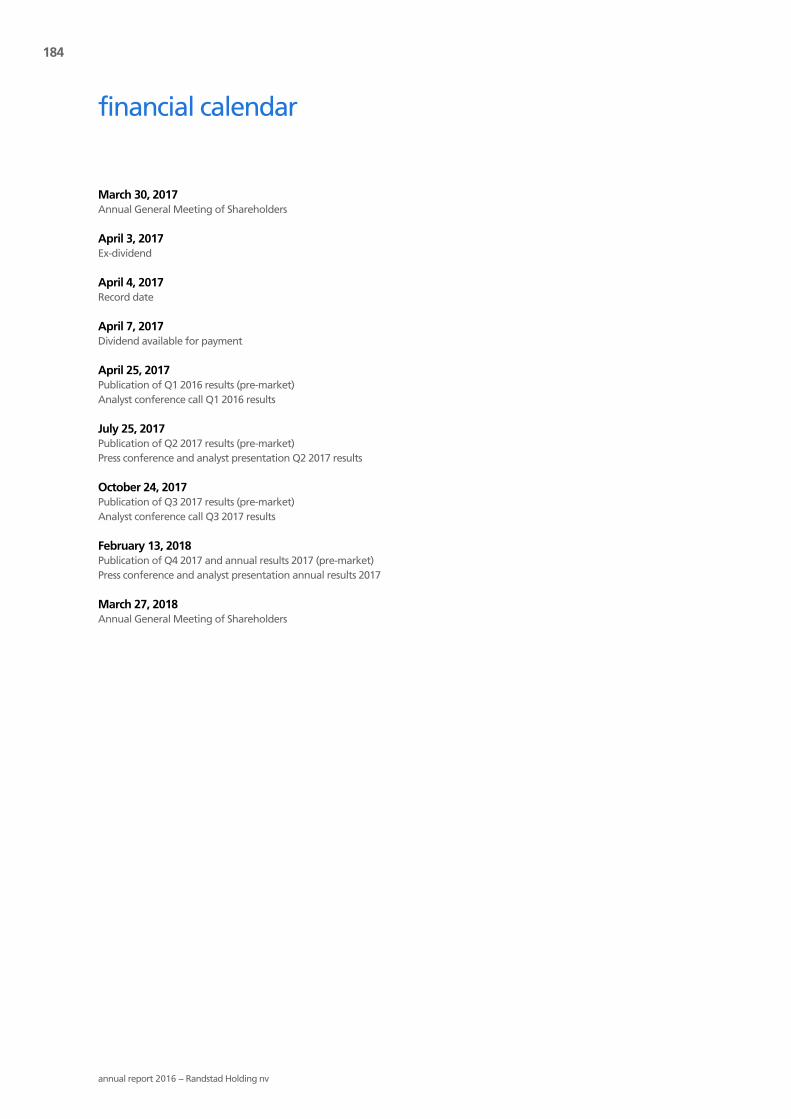
184
annual report 2016 − Randstad Holding nv
March 30, 2017Annual General Meeting of Shareholders
April 3, 2017Ex-dividend
April 4, 2017Record date
April 7, 2017Dividend available for payment
April 25, 2017Publication of Q1 2016 results (pre-market)Analyst conference call Q1 2016 results
July 25, 2017Publication of Q2 2017 results (pre-market)Press conference and analyst presentation Q2 2017 results
October 24, 2017Publication of Q3 2017 results (pre-market)Analyst conference call Q3 2017 results
February 13, 2018Publication of Q4 2017 and annual results 2017 (pre-market)Press conference and analyst presentation annual results 2017
March 27, 2018Annual General Meeting of Shareholders
financial calendar
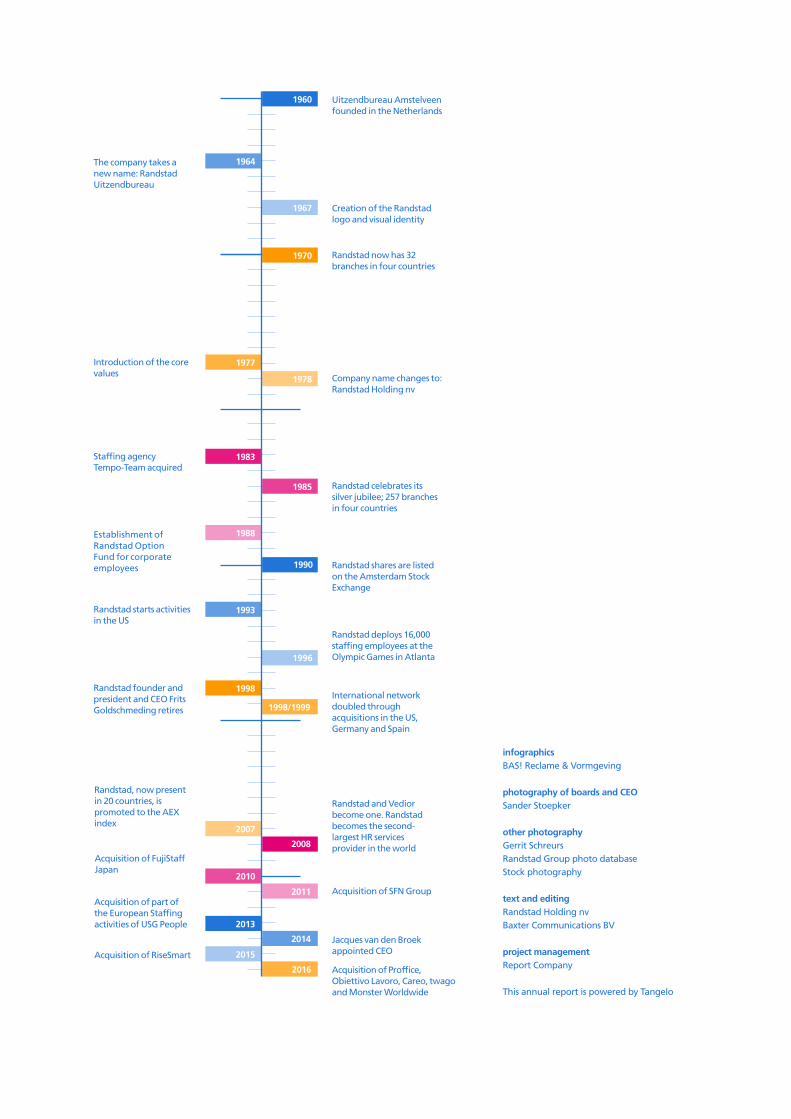
infographics BAS! Reclame & Vormgeving
photography of boards and CEOSander Stoepker
other photographyGerrit SchreursRandstad Group photo databaseStock photography
text and editingRandstad Holding nvBaxter Communications BV
project managementReport Company
This annual report is powered by Tangelo
Uitzendbureau Amstelveen founded in the Netherlands
Creation of the Randstad logo and visual identity
Randstad now has 32 branches in four countries
Company name changes to: Randstad Holding nv
Randstad celebrates its silver jubilee; 257 branches in four countries
Randstad shares are listed on the Amsterdam Stock Exchange
Randstad deploys 16,000 staffing employees at the Olympic Games in Atlanta
Randstad and Vedior become one. Randstad becomes the second-largest HR services provider in the world
Acquisition of SFN Group
International network doubled through acquisitions in the US, Germany and Spain
The company takes a new name: Randstad Uitzendbureau
Introduction of the core values
Staffing agency Tempo-Team acquired
Establishment of Randstad Option Fund for corporate employees
Randstad starts activities in the US
Randstad founder and president and CEO Frits Goldschmeding retires
Randstad, now present in 20 countries, is promoted to the AEX index
Acquisition of FujiStaff Japan
1960
1964
1977
1983
1988
1993
1998
1978
1985
1990
1996
1998/1999
1967
1970
2007
2008
2010
2011
2013
Acquisition of part of the European Staffing activities of USG People
Jacques van den Broek appointed CEO
2014
Acquisition of RiseSmart
2016 Acquisition of Proffice, Obiettivo Lavoro, Careo, twago and Monster Worldwide
2015

Randstad Holding nvaddressDiemermere 251112 TC DiemenThe Netherlandsphone +31 (0)20 569 59 11
mailing addressP.O. Box 126001100 AP Amsterdam-ZuidoostThe Netherlandswww.randstad.com
e-mailcorporate.communications@[email protected] you have any comments on or questions about this annual report, please do not hesitate to contact us by email.