annual report 20 19 - beiersdorf
TRANSCRIPT
Annual Report
20 1 9
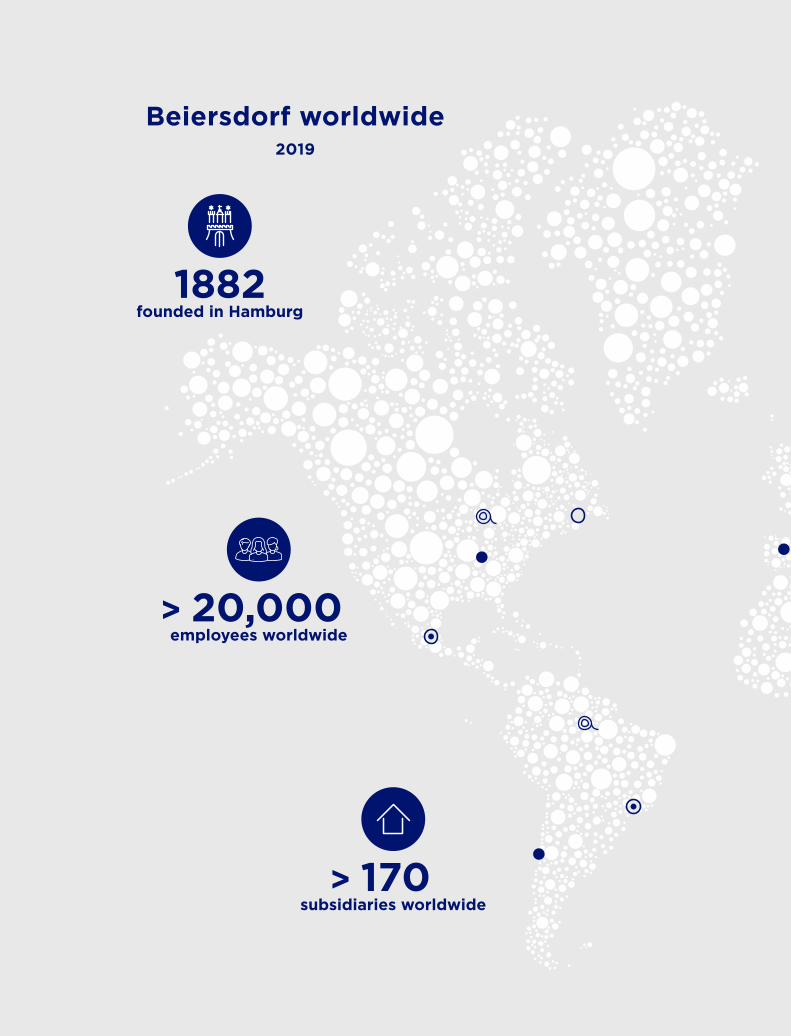
> 20,000employees worldwide
> 170subsidiaries worldwide
1882 founded in Hamburg
Beiersdorf worldwide 2019
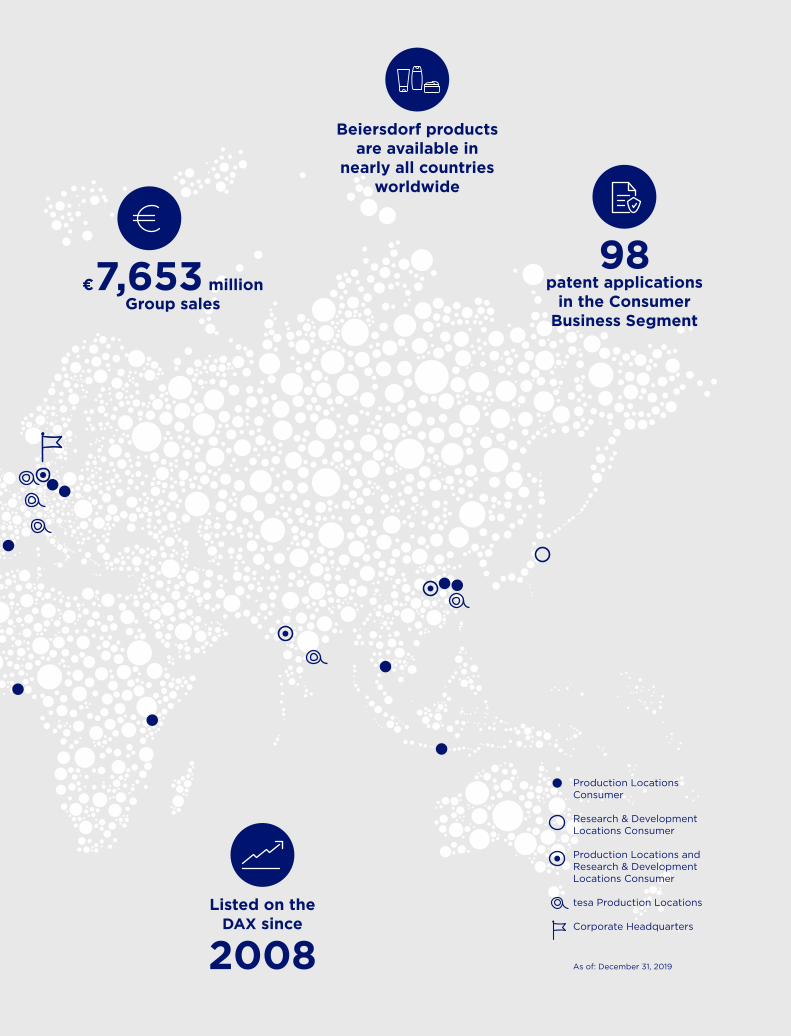
98 patent applications
in the Consumer Business Segment
Listed on the DAX since
2008
Production Locations Consumer Research & Development Locations Consumer Production Locations and Research & Development Locations Consumer
tesa Production Locations
Corporate Headquarters
As of: December 31, 2019
€ 7,653 million Group sales
Beiersdorf products are available in
nearly all countries worldwide
HEALING OINTMENT
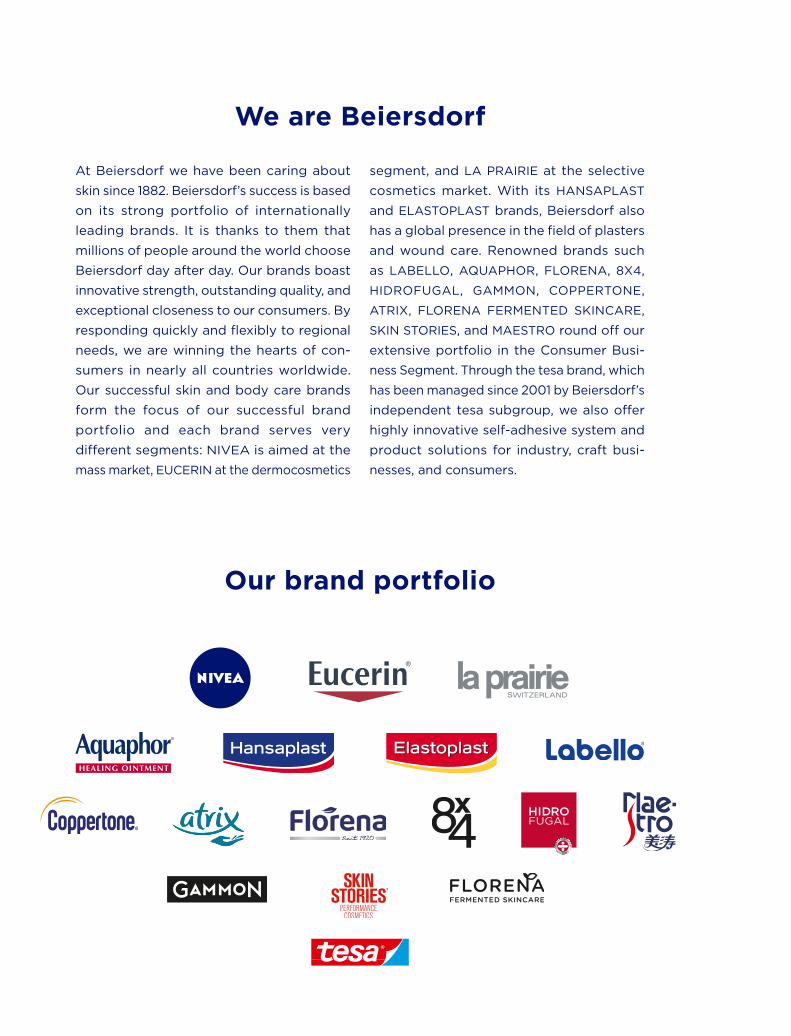
At Beiersdorf we have been caring about skin since 1882. Beiersdorf’s success is based on its strong portfolio of internationally leading brands. It is thanks to them that millions of people around the world choose Beiersdorf day after day. Our brands boast innovative strength, outstanding quality, and exceptional closeness to our consumers. By responding quickly and flexibly to regional needs, we are winning the hearts of con-sumers in nearly all countries worldwide. Our successful skin and body care brands form the focus of our successful brand portfolio and each brand serves very different segments: NIVEA is aimed at the mass market, EUCERIN at the dermocosmetics
segment, and LA PRAIRIE at the selective cosmetics market. With its HANSAPLAST and ELASTOPLAST brands, Beiersdorf also has a global presence in the field of plasters and wound care. Renowned brands such as LABELLO, AQUAPHOR, FLORENA, 8X4, HIDROFUGAL, GAMMON, COPPERTONE, ATRIX, FLORENA FERMENTED SKINCARE, SKIN STORIES, and MAESTRO round off our extensive portfolio in the Consumer Busi-ness Segment. Through the tesa brand, which has been managed since 2001 by Beiersdorf’s independent tesa subgroup, we also offer highly innovative self-adhesive system and product solutions for industry, craft busi-nesses, and consumers.
We are Beiersdorf
Our brand portfolio

KEY FIGURES – OVERVIEW
2018 2019
Group sales (in € million) 7,233 7,653
Change (organic) (in %) 5.4 4.1
Change (nominal) (in %) 2.5 5.8
Consumer sales (in € million) 5,890 6,274
Change (organic) (in %) 5.0 4.8
Change (nominal) (in %) 1.6 6.5
tesa sales (in € million) 1,343 1,379
Change (organic) (in %) 6.8 0.8
Change (nominal) (in %) 6.8 2.7
Operating result (EBIT, excluding special factors) (in € million) 1,113 1,095
Operating result (EBIT) (in € million) 1,097 1,032
Profit after tax (in € million) 745 736
Return on sales after tax (in %) 10.3 9.6
Earnings per share (in €) 3.21 3.17
Total dividend (in € million) 159 159
Dividend per share (in €) 0.70 0.70
Gross cash flow (in € million) 933 842
Capital expenditure* (in € million) 463 765
Research and development expenses (in € million) 211 236
Employees (as of Dec. 31) 20,059 20,654
* Figures comprise investments in intangible assets and property, plant, and equipment including acquisitions.
Beiersdorf 2019
20 19
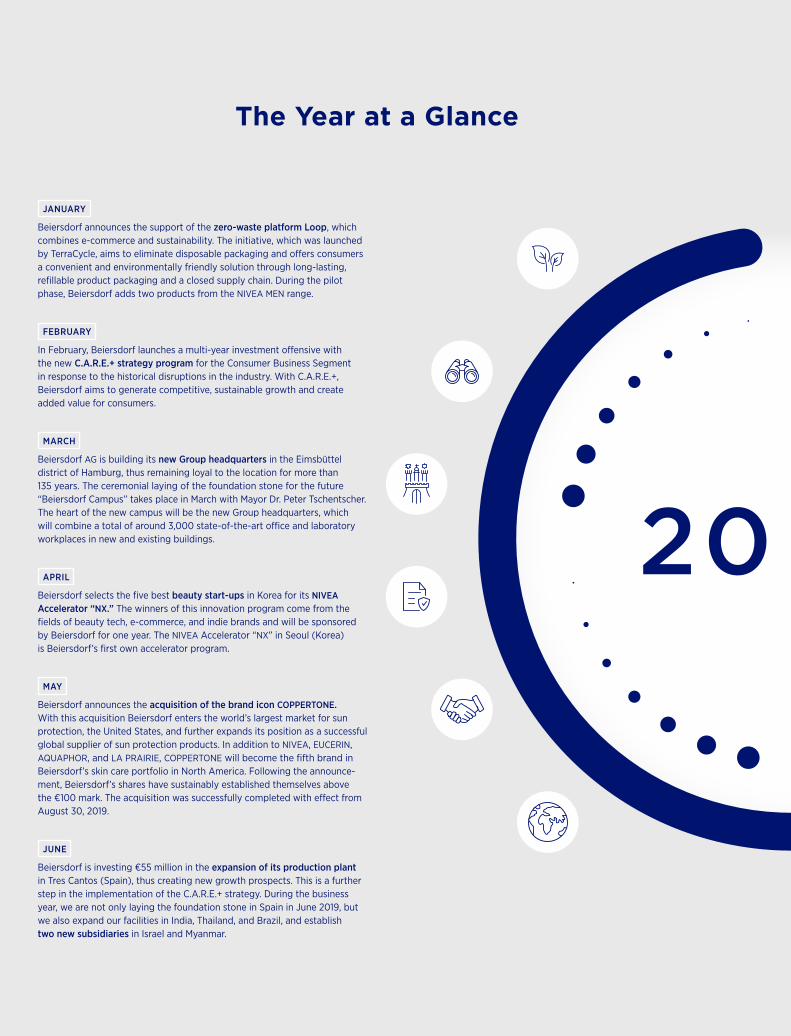
JANUARY
Beiersdorf announces the support of the zero-waste platform Loop, which combines e-commerce and sustainability. The initiative, which was launched by TerraCycle, aims to eliminate disposable packaging and offers consumers a convenient and environmentally friendly solution through long-lasting, refillable product packaging and a closed supply chain. During the pilot phase, Beiersdorf adds two products from the NIVEA MEN range.
FEBRUARY
In February, Beiersdorf launches a multi-year investment offensive with the new C.A.R.E.+ strategy program for the Consumer Business Segment in response to the historical disruptions in the industry. With C.A.R.E.+, Beiersdorf aims to generate competitive, sustainable growth and create added value for consumers.
MARCH
Beiersdorf AG is building its new Group headquarters in the Eimsbüttel district of Hamburg, thus remaining loyal to the location for more than 135 years. The ceremonial laying of the foundation stone for the future “Beiersdorf Campus” takes place in March with Mayor Dr. Peter Tschentscher. The heart of the new campus will be the new Group headquarters, which will combine a total of around 3,000 state-of-the-art office and laboratory workplaces in new and existing buildings.
APRIL
Beiersdorf selects the five best beauty start-ups in Korea for its NIVEA Accelerator “NX.” The winners of this innovation program come from the fields of beauty tech, e-commerce, and indie brands and will be sponsored by Beiersdorf for one year. The NIVEA Accelerator “NX” in Seoul (Korea) is Beiersdorf’s first own accelerator program.
MAY
Beiersdorf announces the acquisition of the brand icon COPPERTONE. With this acquisition Beiersdorf enters the world’s largest market for sun protection, the United States, and further expands its position as a successful global supplier of sun protection products. In addition to NIVEA, EUCERIN, AQUAPHOR, and LA PRAIRIE, COPPERTONE will become the fifth brand in Beiersdorf’s skin care portfolio in North America. Following the announce-ment, Beiersdorf’s shares have sustainably established themselves above the €100 mark. The acquisition was successfully completed with effect from August 30, 2019.
JUNE
Beiersdorf is investing €55 million in the expansion of its production plant in Tres Cantos (Spain), thus creating new growth prospects. This is a further step in the implementation of the C.A.R.E.+ strategy. During the business year, we are not only laying the foundation stone in Spain in June 2019, but we also expand our facilities in India, Thailand, and Brazil, and establish two new subsidiaries in Israel and Myanmar.
The Year at a Glance
20 19
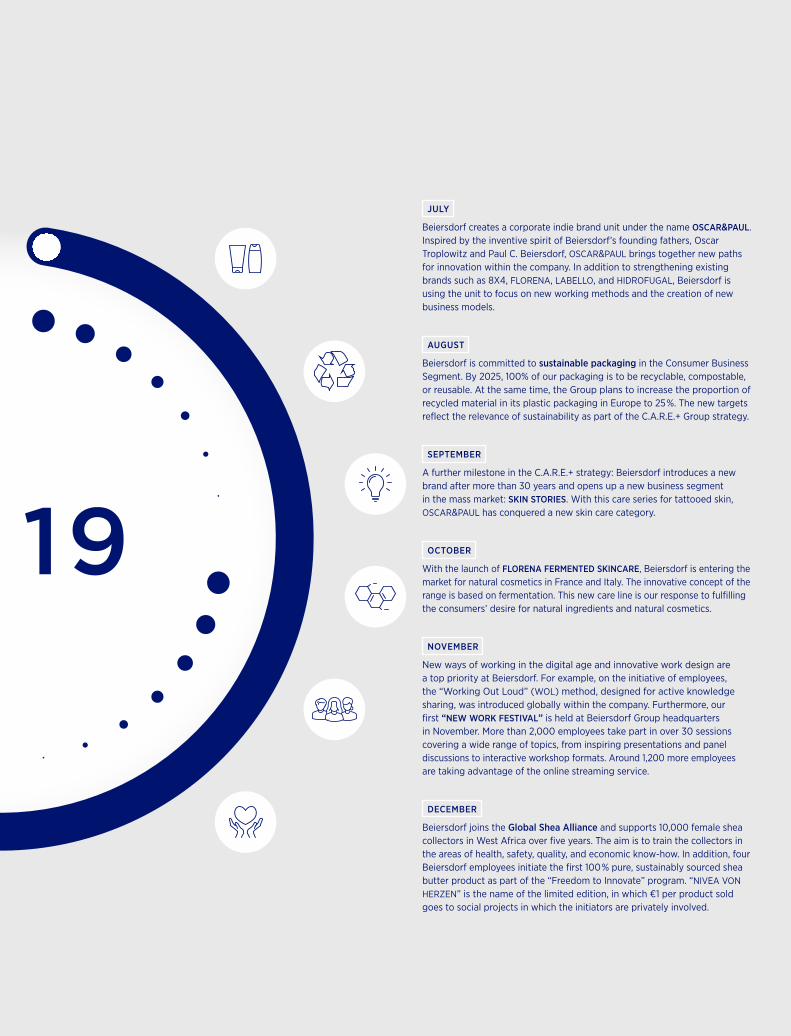
JULY
Beiersdorf creates a corporate indie brand unit under the name OSCAR&PAUL. Inspired by the inventive spirit of Beiersdorf’s founding fathers, Oscar Troplowitz and Paul C. Beiersdorf, OSCAR&PAUL brings together new paths for innovation within the company. In addition to strengthening existing brands such as 8X4, FLORENA, LABELLO, and HIDROFUGAL, Beiersdorf is using the unit to focus on new working methods and the creation of new business models.
AUGUST
Beiersdorf is committed to sustainable packaging in the Consumer Business Segment. By 2025, 100% of our packaging is to be recyclable, compostable, or reusable. At the same time, the Group plans to increase the proportion of recycled material in its plastic packaging in Europe to 25%. The new targets reflect the relevance of sustainability as part of the C.A.R.E.+ Group strategy.
SEPTEMBER
A further milestone in the C.A.R.E.+ strategy: Beiersdorf introduces a new brand after more than 30 years and opens up a new business segment in the mass market: SKIN STORIES. With this care series for tattooed skin, OSCAR&PAUL has conquered a new skin care category.
OCTOBER
With the launch of FLORENA FERMENTED SKINCARE, Beiersdorf is entering the market for natural cosmetics in France and Italy. The innovative concept of the range is based on fermentation. This new care line is our response to fulfilling the consumers’ desire for natural ingredients and natural cosmetics.
NOVEMBER
New ways of working in the digital age and innovative work design are a top priority at Beiersdorf. For example, on the initiative of employees, the “Working Out Loud” (WOL) method, designed for active knowledge sharing, was introduced globally within the company. Furthermore, our first “NEW WORK FESTIVAL” is held at Beiersdorf Group headquarters in November. More than 2,000 employees take part in over 30 sessions covering a wide range of topics, from inspiring presentations and panel discussions to interactive workshop formats. Around 1,200 more employees are taking advantage of the online streaming service.
DECEMBER
Beiersdorf joins the Global Shea Alliance and supports 10,000 female shea collectors in West Africa over five years. The aim is to train the collectors in the areas of health, safety, quality, and economic know-how. In addition, four Beiersdorf employees initiate the first 100% pure, sustainably sourced shea butter product as part of the “Freedom to Innovate” program. “NIVEA VON HERZEN” is the name of the limited edition, in which €1 per product sold goes to social projects in which the initiators are privately involved.

Contents
To Our Shareholders
Combined Management Report
Pages 6 – 20
Pages 21 – 70
4
p. 8 Letter from the Chairman
p. 10 Beiersdorf’s Shares and Investor Relations
p. 12 Report by the Supervisory Board
p. 15 Corporate Governance Report
Foundation of the Groupp. 23 Business and Strategy
p. 27 Research and Development
p. 32 Sustainability
p. 35 People at Beiersdorf
Economic Reportp. 41 Economic Environment
p. 43 Results of Operations
p. 50 Net Assets
p. 51 Financial Position
p. 52 Overall Assessment of the Group’s
Economic Position
p. 53 Beiersdorf AG
p. 55 Risk Report
p. 59 Report on Expected Developments
Remuneration Report and Other Disclosuresp. 61 Remuneration Report
p. 69 Report by the Executive Board on Dealings
among Group Companies
p. 69 Disclosures Pursuant to Takeover Laws
Contents
Consolidated Financial Statements
Additional Information
Pages 71 – 114
Pages 115 – 120
5
Consolidated Financial Statementsp. 72 Income Statement
p. 72 Statement of Comprehensive Income
p. 73 Balance Sheet
p. 74 Cash Flow Statement
p. 75 Statement of Changes in Equity
Notes to the Consolidated Financial Statementsp. 76 Segment Reporting
p. 76 Regional Reporting
p. 77 Significant Accounting Policies
p. 84 Consolidated Group, Acquisitions,
and Divestments
p. 85 Notes to the Income Statement
p. 88 Notes to the Balance Sheet
p. 103 Other Disclosures
p. 107 Report on Post-Balance Sheet Date Events
p. 107 Beiersdorf AG Boards
Attestationsp. 109 Independent Auditor’s Report
p. 114 Responsibility Statement by the Executive
Board
p. 116 Ten-year Overview
p. 117 Beiersdorf AG’s Shareholdings
p. 120 Contact Information
Financial Calendar (Cover)

To Our Shareholders
6
Beiersdorf’s share price performance
Around 85 years after Beiersdorf AG was founded in 1922, the Beiersdorf share proved to be very resilient during the uncertainty of the global financial crisis in 2007/2008, compared with the shares of many other German companies. This situation enabled Beiersdorf to move up to Germany’s benchmark index –
the DAX – on December 22, 2008. The share price struck a low point of €30 in spring of 2009, but since October 2011 it has risen nearly continually, reaching a new high in fiscal year 2019 and settling in for the long run
above the €100 mark with a closing price of €106.65.
100
120
80
60
40
20
0
2008 2009 2010 2011 2012 2013 2014 2015 2016 2017 2018 2019
€106.652019
€39.952008

To Our Shareholders
7
To Our Shareholders
Pages 6 – 20
p. 8 Letter from the Chairman
p. 10 Beiersdorf’s Shares and Investor Relations
p. 12 Report by the Supervisory Board
p. 15 Corporate Governance Report
8
To Our shareholdersLetter from the Chairman
Letter from the Chairman
In February of last year, we presented our C.A.R.E.+ strategy that is aimed at effectively answering the profound changes facing our industry, which must be addressed by our business model. At the same time, we also regard these challenges as a great opportunity by:
• increasing consumer centricity through new digital channels and technologies,
• convincing our consumers by offering superior skin care innova-tions and a strong portfolio of global brands,
• tapping into new growth markets and business areas,
• fulfilling our consumers’ expectations by making a decisive con-tribution to more sustainability.
Today, one year later, we are convinced that C.A.R.E.+ enables us to address the right topics and demonstrate our competitiveness in an increasingly challenging market environment. This is also reflected in our financial results.
Overall, Group sales grew organically by 4.1% in 2019. In nominal terms, sales were up by 5.8%, from €7,233 million to €7,653 million. The operating result (EBIT, excluding special factors) declined from €1,113 million in the previous year to €1,095 million as a result of the implementation of investments that were announced as part of our C.A.R.E.+ strategy. The Group’s corresponding EBIT margin exclud-ing special factors amounted to 14.3% and was therefore lower than the previous year’s level of 15.4%.
The two business segments performed differently, but they were both in line with our planning and expectations. The Consumer Business Segment achieved organic sales growth of 4.8%. Sales increased in nominal terms by 6.5%, from €5,890 million in the previous year to €6,274 million in 2019. The EBIT margin excluding special factors was 14.1% for the Consumer Business Segment. For the tesa Business Segment, 2019 was marked by a decline in the au-tomotive sector. Despite a challenging market environment, tesa achieved organic sales growth of 0.8%. Nominal sales increased by 2.7%, from €1,343 million in the previous year to €1,379 million. The EBIT margin in the tesa Business Segment was 15.3%. The Trade Mar-kets division, which includes the retail consumer business, contribut-ed strongly to the business segment’s positive performance. Sales in the Direct Industries division remained stable overall.
The results show: In the first year of our C.A.R.E.+ strategy, we achieved competitive, sustainable growth and consistently implemented our strategic priorities.
We are increasing the quality of our product portfolio and are taking advantage of our growth momentum. And we are gaining market share with the face and skin care range. Thus, for our iconic NIVEA brand, the NIVEA Cellular anti-aging skin care range, for example, was the strongest market launch in the NIVEA Face segment. Further-more, our EUCERIN Anti-Pigment range with the revolutionary active ingredient THIAMIDOL is breaking all records and further underscores our mission of creating added value for our consumers with skin care innovations. The product range rapidly developed into the most successful product launch in the history of EUCERIN last year.
9
To Our shareholders
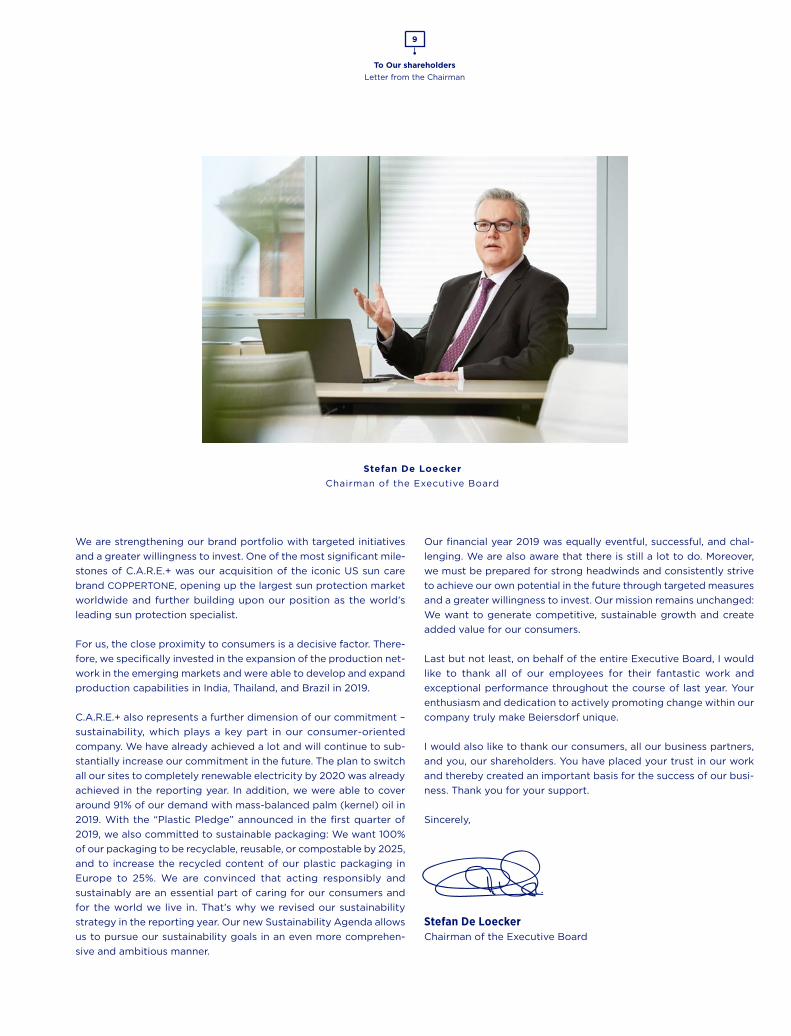
Stefan De LoeckerChairman of the Executive Board
Letter from the Chairman
We are strengthening our brand portfolio with targeted initiatives and a greater willingness to invest. One of the most significant mile-stones of C.A.R.E.+ was our acquisition of the iconic US sun care brand COPPERTONE, opening up the largest sun protection market worldwide and further building upon our position as the world’s leading sun protection specialist.
For us, the close proximity to consumers is a decisive factor. There-fore, we specifically invested in the expansion of the production net-work in the emerging markets and were able to develop and expand production capabilities in India, Thailand, and Brazil in 2019.
C.A.R.E.+ also represents a further dimension of our commitment – sustainability, which plays a key part in our consumer-oriented company. We have already achieved a lot and will continue to sub-stantially increase our commitment in the future. The plan to switch all our sites to completely renewable electricity by 2020 was already achieved in the reporting year. In addition, we were able to cover around 91% of our demand with mass-balanced palm (kernel) oil in 2019. With the “Plastic Pledge” announced in the first quarter of 2019, we also committed to sustainable packaging: We want 100% of our packaging to be recyclable, reusable, or compostable by 2025, and to increase the recycled content of our plastic packaging in Europe to 25%. We are convinced that acting responsibly and sustainably are an essential part of caring for our consumers and for the world we live in. That’s why we revised our sustainability strategy in the reporting year. Our new Sustainability Agenda allows us to pursue our sustainability goals in an even more comprehen-sive and ambitious manner.
Our financial year 2019 was equally eventful, successful, and chal-lenging. We are also aware that there is still a lot to do. Moreover, we must be prepared for strong headwinds and consistently strive to achieve our own potential in the future through targeted measures and a greater willingness to invest. Our mission remains unchanged: We want to generate competitive, sustainable growth and create added value for our consumers.
Last but not least, on behalf of the entire Executive Board, I would like to thank all of our employees for their fantastic work and exceptional performance throughout the course of last year. Your enthusiasm and dedication to actively promoting change within our company truly make Beiersdorf unique.
I would also like to thank our consumers, all our business partners, and you, our shareholders. You have placed your trust in our work and thereby created an important basis for the success of our busi-ness. Thank you for your support.
Sincerely,
Stefan De LoeckerChairman of the Executive Board
To Our Shareholders
10
Beiersdorf’s Shares and Investor Relations
Beiersdorf’s Shares and Investor Relations
Following a very weak prior-year performance, stock markets began 2019 with significant gains. This was despite concerns about global economic growth ini-tially weighing on the investment climate. The risk of a potential recession and the impact of the trade policy disputes between the United States and China then took a back seat as the year progressed. The capital market welcomed signals from the US Federal Reserve (Fed) and the European Central Bank (ECB) that they would support economic growth by continuing their loose monetary policy. This allowed stock prices to rally strongly through to year-end.
In the United States, low unemployment and positive consumer sentiment re-mained key drivers of economic growth. The Fed countered latent growth risks with three rate cuts in the second half of the year. The US economic outlook brightened toward the end of the year and, at a growth rate of over 2%, the industrial order books also improved. The strong growth in online retail also exceeded expectations. Toward the end of 2019, a partial resolution was reached in the trade dispute with China, meaning that planned tariff increases were initially suspended. Despite this, China’s growth rate slowed in 2019. The potential for further conflict with the United States continued to pose a risk to the Chinese economy and international stock markets.
In Europe, economic performance was muted. In the United Kingdom, the ongoing debates about Brexit hit consumer confidence and the investment climate. In the eurozone, the weakening currency improved companies’ price competitiveness. Nevertheless, export-oriented industries still suffered from slow global demand. Production and order books remained weak in Germany, too. However, the economic outlook improved slightly. Germany’s benchmark index, the DAX, reflected the monetary policy signals as well as these positive expectations, notching up strong gains of 25% in 2019 to end the year at 13,249 points.
For Beiersdorf’s shares, it was a mixed but overall very positive year. The pub-lication of a lower-than-expected forecast for the 2019 fiscal year caused the share price on the stock market to fall by almost 10% in February. At the same time, however, the Executive Board presented the new C.A.R.E.+ business strategy at the annual Analyst Meeting in Hamburg. This was well received on the capital market, allowing our shares not only to recover the losses but to reach new highs for the year in March and April. The Beiersdorf share price reached almost €100 in connection with the strong sales reported for the first quarter. In May, following the announcement of the acquisition of the American sun care brand COPPERTONE – the first takeover in the Consumer Business
Segment in twelve years – the shares topped the €100 mark and found a lasting foothold at this level. The excellent results for the first half of the year were regarded by the capital market as confirmation of a successful new strategy. Our share price responded by hitting new all-time highs, substantially out-performing the DAX and the HPC (home and personal care) sector, to which Beiersdorf belongs. In the final quarter of the year, sector rotation reduced the market demand for more defensive consumer stocks. Primarily as a result of this effect, our shares remained in the €102 to €106 range for several months leading up to year-end.
Capital market communication focused on the new C.A.R.E.+ strategy following its publication in February. The Executive Board explained the changes to the business model and the concrete progress in implementing the strategy at roadshows and conferences.
The 2019 Beiersdorf AG Annual General Meeting was very well attended. More than 1,400 shareholders came to the trade fair grounds in Hamburg for the event on April 17.
Thirty financial analysts published regular research notes on Beiersdorf over the course of the year; the number of buy recommendations rose considerably based on the new strategy and long-term outlook for sales growth and EBIT margin. Beiersdorf’s share price performed very respectably in 2019 with gains of 16.8%. Our shares closed the year at €106.65.
For more information on Beiersdorf’s shares please visit www.beiersdorf.com/shares .
For more information on Investor Relations please visit www.beiersdorf.com/investors .
KEY FIGURES – SHARES
2018 2019
Earnings per share as of Dec. 31 (in €) 3.21 3.17
Market capitalization as of Dec. 31 (in € million) 22,972 26,875
Closing price as of Dec. 31 (in €) 91.16 106.65
Closing high for the year (in €) 101.75 116.35
Closing low for the year (in €) 86.08 81.56

To Our Shareholders
11
Beiersdorf’s Shares and Investor Relations
BEIERSDORF’S SHARE PRICE PERFORMANCE 2019Jan. 1 – Dec. 31 / relative change in %
130
120
110
100
90
80
70
JAN FEB MAR APR MAY JUN JUL AUG SEP OCT NOV DEC
Beiersdorf DAX
Q1
€92.74CLOSING PRICE
Q2
€105.55CLOSING PRICE
Q3
€108.20CLOSING PRICE
Q4
€106.65CLOSING PRICE
SHAREHOLDER STRUCTURE (IN %)As of Dec. 31, 2019
maxingvest group51.01
Beiersdorf AG (own shares)
9.99
Free Float39.00
BASIC SHARE DATA
Company name Beiersdorf Aktiengesellschaft
Admission year 1928
WKN 520000
ISIN DE0005200000
Stock trading venues
Official Market: Frankfurt/Main and Hamburg
Open Market: Berlin, Düsseldorf, Hanover, Munich, and Stuttgart
Number of shares 252,000,000
Share capital in € 252,000,000
Class No-par-value bearer shares
Market segment/index Prime Standard/DAX
Stock exchange symbol BEI
Reuters BEIG.DE
Bloomberg BEI GR
To Our Shareholders
12
Report by the Supervisory Board
Report by the Supervisory Board
Dear Shareholders,in fiscal year 2019, the Supervisory Board performed its duties in accordance with the law, the Articles of Association, the German Corporate Governance Code, and the bylaws. It supervised and advised the Executive Board, focusing particularly on the course of business and business strategy, corporate plan-ning, accounting, the company’s position and outlook, risk management, the internal control system, and compliance. The Executive Board reported regu-larly during and between the Supervisory Board meetings, both in writing and orally, particularly on significant events and developments in the business and market. The Supervisory Board also considered and discussed external views and developments concerning good corporate governance in Germany and other countries. There were no indications of any conflicts of interest relating to Executive Board or Supervisory Board members.
A new Supervisory Board was elected effective from the end of the Annual General Meeting on April 17, 2019. The employee representatives are Manuela Rousseau, Reiner Hansert, and new members Regina Schillings, Kirstin Weiland, Jan Koltze, and Olaf Papier. The shareholder representatives are Hong Chow, Christine Martel, Martin Hansson, Michael Herz, Reinhard Pöllath, and returning member Frédéric Pflanz.
Supervisory Board members were provided with extensive information on their rights and obligations as well as on risk management and internal auditing, corporate governance, and compliance at a training session in November 2019.
Beginning in the fall of 2019, the Supervisory Board reviewed its effectiveness with an external consultant. An evaluation of responses from the Supervisory Board, Executive Board, and Executive Committee, concerning the work of the full Board and committees as well as the cooperation between the Supervisory Board and Executive Board, was presented and discussed on December 3, 2019. This included a comparison with other companies. A Supervisory Board meet-ing will be held in the first half of 2020 to discuss the findings of the interviews that the consultant is currently conducting with everyone involved.
The members’ participation rate for the 30 meetings of the full Board and committees (number of actual attendances/potential attendances) was 91%. The figures for the individual members who did not participate in every meet-ing were as follows: Hong Chow 9/13 (= 69%), Thorsten Irtz 2/6 (= 33%), Tomas Nieber 2/8 (= 25%), Manuela Rousseau 10/11 (= 91%), Regina Schillings 13/14 (= 93%), Poul Weihrauch 1/4 (= 25%), and Kirstin Weiland 7/8 (= 88%). Absent members regularly instructed someone to vote on their behalf.
The Executive Board and Supervisory Board worked together on detailed preparation and follow-up of meetings of the full Board and committees. Discussions took place with and among Supervisory Board members prior to and after the meetings. A secure digital platform for Supervisory Board mem-bers and assistants is available for drafts, documents, and comments.
The Supervisory Board’s main objective remains the stimulation and support of the Executive Board’s strategy to achieve lasting healthy growth in the busi-ness segments by delivering tangible consumer benefit. The Supervisory Board supports the C.A.R.E.+ strategy also with regards to the remuneration system and through a willingness to allow investment (research, regionalization and localization, sustainability, diversity, compliance, new channels, etc.).
Full Supervisory BoardThe Supervisory Board met nine times. In one case, following prior oral discus-sion, it issued a written decision on a change to the schedule of responsibilities for the Executive Board. The meetings of the full Board regularly addressed the company’s strategic orientation, business developments, interim financial statements, compliance, Executive Board matters, and significant individual transactions. Proposals for decision were carefully examined and discussed. All members of the Executive Board generally took part in the Supervisory Board meetings. Part of each meeting took place in the presence of the Supervisory Board members alone. The meetings early in the year focused on the prior year’s annual financial statements. The Board also discussed the new C.A.R.E.+ business strategy at length and gave its acknowledgment and approval. At the meetings in the middle of the year (some of which were not regular meetings), the Supervisory Board discussed the intended acquisition of the COPPERTONE business and the plans to construct a new aerosol plant in Saxony (Germany). The meetings at the end of the year concentrated on the latest planning for 2020.
On February 1, 2019, the Supervisory Board decided on the extent to which the Executive Board had achieved the targets set for the 2018 fiscal year. On February 21, 2019, it determined the Executive Board members’ total remuner-ation for 2018, and also discussed the performance of the business in that year. The Executive Board explained the key figures in detail and described the developments in relevant markets, putting these in the context of Beiersdorf’s own sales and market share. A detailed presentation by the Executive Board covering the development of a new business strategy and the annual planning for 2019 was another major focus of the meeting. The auditor gave a thorough report on the auditing of the annual and consolidated financial statements, the combined management report for Beiersdorf AG and the Group (including the remuneration report), and the report on dealings among Group companies. The Supervisory Board discussed the draft Supervisory Board report and corporate governance report.
At the extraordinary meeting arranged for February 26, 2019, the Executive Board reported on its resolutions from earlier that day concerning the C.A.R.E.+ business strategy, the annual and consolidated financial statements, and the combined management report for Beiersdorf AG and the Group, including the remuneration report. The Supervisory Board approved these financial state-ments and reports and thereby adopted the annual financial statements for the 2018 fiscal year. It also approved the separate combined non-financial report for Beiersdorf AG and the Group for fiscal year 2018. It discussed the
To Our Shareholders
13
Report by the Supervisory Board
Executive Board reports on dealings among Group companies and on the disclosures required under takeover law as well as the corporate governance statement. It approved the Supervisory Board’s report to the Annual General Meeting, the corporate governance report, and the remuneration report for the 2018 fiscal year. The Supervisory Board decided on the agenda and proposals for decision for the Annual General Meeting on April 17, 2019, as well as on the candidate proposals (prepared by the Nomination Committee) to the Annual General Meeting for the election of shareholder representatives to the Supervisory Board.
On April 17, 2019, the Supervisory Board discussed an Executive Board report on the performance of the business in the year to date (by country and product category), the outlook for the year as a whole, and the forecast figures for the company. The Supervisory Board also discussed the agenda and proceedings for the upcoming Annual General Meeting. At the inaugural meeting of the newly elected Supervisory Board following the Annual General Meeting, the members elected their chairman and deputy chairwoman along with a second deputy. All Supervisory Board committees were also re-elected at this meet-ing, and the Personnel Committee was expanded to six members. Outlines and plans for an intended investment involving construction of a new plant in Saxony were explained to the Supervisory Board. After an in-depth discussion, the Supervisory Board acknowledged and approved the proposal. Finally, the Supervisory Board decided on the audit engagements to be issued for the audit of the 2019 financial statements and the review of the half-year financial statements for 2019.
At the extraordinary meeting on April 29, 2019, the Executive Board gave the Supervisory Board an in-depth report on the possibility of acquiring the COPPERTONE business, including the economic circumstances of the takeover and the intention to continue the COPPERTONE business as part of the Beiersdorf business strategy following the acquisition. On this basis, the Supervisory Board approved the submission of a final offer for the acquisition of the COPPERTONE business and authorized the Executive Board to conclude the necessary contracts.
At the extraordinary meeting on June 27, 2019, the Supervisory Board dis-cussed the Executive Board remuneration. It gave its approval in principle for the investment in the construction of a new plant in Saxony.
On September 2 and 3, 2019, the Supervisory Board discussed the current business performance and the outlook for the full year. This was based on ex-tensive information, for example on the development of market share in the various product categories and on expected key business figures. The new C.A.R.E.+ business strategy, especially its digitalization and sustainability as-pects, was a focus of the two-day meeting. Staff from the relevant departments were in attendance and gave presentations on both these topics to the Super-visory Board members. The Supervisory Board supports the strategic, sustained increase in investment and the focal areas set by the Executive Board in re-search and development and sustainability. The Supervisory Board heard de-tailed reports on all these topics. tesa’s new CEO designate reported on devel-opments in the tesa Business Segment (current performance, outlook for the full year 2019, business strategy for the years ahead). The Supervisory Board
appointed the external auditor for the non-financial report for 2019 and discussed the forthcoming changes to the German Corporate Governance Code and the performance of an efficiency audit for the Supervisory Board.
On December 3, 2019, the Supervisory Board discussed the Group’s business performance up to October 31, 2019. The members looked ahead to the end of 2019 and the company’s expected key figures. In particular, the meeting covered major product launches, sustainability, and emerging markets. The Supervisory Board and Executive Board discussed the plans for fiscal year 2020 in detail. The Supervisory Board affirmed its support for more investment in growth and approved the plans. The Supervisory Board resolved to accept the amicable termination of Ralph Gusko’s membership in the Executive Board and thanked him for the decades of close cooperation. The Super-visory Board also decided on amendments to the bylaws for the Executive Board (including the schedule of responsibilities) and Supervisory Board, on the Declaration of Compliance with the German Corporate Governance Code for fiscal year 2019, and on the targets of the Executive Board members for fiscal year 2020.
In January and February 2020, the Supervisory Board discussed the achieve-ment of the targets set for the Executive Board for the 2019 fiscal year and determined the total remuneration. It approved the annual and consolidated financial statements along with the associated reports, and endorsed the pro-posals for decision for the Annual General Meeting on April 29, 2020.
CommitteesThe Supervisory Board prepares its work in six committees. These can make decisions in place of the Supervisory Board in individual cases. The chair-persons of the committees provided the Supervisory Board with regular detailed reports on the committees’ work. The Mediation Committee did not meet in fiscal year 2019.
The Presiding Committee (four meetings) discussed business developments, strategy, the remuneration of the Executive Board, and other Executive Board matters. It prepared the meetings of the full Supervisory Board. Its work focused on the acquisition of the COPPERTONE business, the planned investment in the construction of a new plant in Saxony, and the new C.A.R.E.+ strategy.
The Audit Committee (eight meetings) primarily performed the preliminary examination of the annual and interim financial statements and combined management report, discussed the Executive Board’s proposal for the appro-priation of net retained profits, verified the independence and discussed the appointment of the auditor, and specified the areas of emphasis for the audit. The auditor also participated in meetings related to audit matters. The com-mittee made a proposal to the Supervisory Board for the election of the auditor by the Annual General Meeting. The auditor reported to the Audit Committee on the key findings of the audit, the results of the audit review of the half-year report for 2019, and other auditing matters. The committee examined the content and audit of the non-financial statement and discussed improvements for the future. It also looked at the new requirements for lease accounting. Business performance, the quarterly figures, compliance, the internal control system, risk management, accounting issues, the status of legal disputes and
To Our Shareholders
14
Report by the Supervisory Board
proceedings, and the scope of non-audit services provided by the auditor were regularly discussed.
The Finance Committee (five meetings) addressed, in particular, investments and the investment strategy for cash holdings. It also regularly discussed compliance management and possible risks from legal and tax proceedings in detail. Tax structures were another major topic in fiscal year 2019.
The Personnel Committee (three meetings) discussed the long-term planning for the composition of the Executive Board and the managerial levels beneath it, Executive Board remuneration, diversity and inclusion, and the impact of the C.A.R.E.+ strategy on the planned new approach to HR: the People Agenda.
Taking into account the Supervisory Board’s targets for its composition and the requirements of the German Corporate Governance Code, the Nomination Committee (one meeting) decided on its recommendation to the full Super-visory Board concerning the candidates to be proposed to the Annual General Meeting on April 17, 2019.
Annual Financial Statements and AuditThe annual financial statements are prepared in accordance with the require-ments of the Handelsgesetzbuch (German Commercial Code, HGB), and the consolidated financial statements in accordance with the International Finan-cial Reporting Standards (IFRS), as adopted by the EU, and taking into account the applicable interpretations of the IFRS Interpretations Committee. The sup-plementary requirements of German law are also applied. The auditor audited the 2019 annual financial statements and consolidated financial statements and the combined management report for Beiersdorf AG and the Group, and issued unqualified audit opinions for them. With regard to the Executive Board’s report on dealings among Group companies (§ 312 Aktiengesetz (German Stock Corporation Act, AktG)) required due to the majority interest held by maxingvest ag, Hamburg, the auditor, following the completion of his audit in accordance with professional standards, confirmed that the infor mation contained therein is correct; that the compensation paid by the company with respect to the transactions listed in the report was not inappropriately high; and that there are no circumstances which would justify, in relation to the measures specified in the report, a materially different opinion than that held by the Executive Board. In addition, the auditor was instructed to conduct a voluntary audit of the combined non-financial report.
The Supervisory Board received the 2019 annual financial statements and consolidated financial statements, combined management report for Beiersdorf AG and the Group, and non-financial report for Beiersdorf AG and the Group, the report on dealings among Group companies, and the auditor’s reports immediately after their preparation. Prior to this, the Supervisory Board re-ceived drafts of the provisional financial statements. The auditor participated in the deliberations of the Supervisory Board on the annual financial statements of Beiersdorf AG and the Group and reported on the key findings of its audit to the Audit Committee and to the full Supervisory Board. The Supervisory Board’s examination of the annual financial statements and consolidated financial statements, combined management report, and combined non-finan-cial report for Beiersdorf AG and the Group, the report on dealings among Group companies, including the concluding declaration by the Executive Board, and the auditor’s reports did not raise any objections. The Supervisory Board concurred with the auditor’s findings and approved the annual financial state-ments of Beiersdorf AG and the consolidated financial statements for the year ending December 31, 2019; the annual financial statements of Beiersdorf AG are thus adopted. The Supervisory Board endorsed the Executive Board’s proposal on the appropriation of net profit.
The Supervisory Board would like to thank all employees worldwide, along with the employee representatives and Executive Board, for their successful work in a year of transition. The Board would also like to thank shareholders, busi-ness partners, and, most importantly, consumers for their continued trust in the company, and its achievements and brands. This trust is critical to the com-pany’s success, and it continuously needs to be earned anew, especially in times of great social, technological, and economic change. The Supervisory Board appreciates everyone’s hard work, and supports the direction of the multi-year C.A.R.E.+ strategy for the company’s successful future and the investments being made as part of this.
Hamburg, February 25, 2020 For the Supervisory Board
Reinhard PöllathChairman
To Our Shareholders
15
Corporate Governance Report
Corporate Governance Report
Good corporate management and supervision (corporate governance) has always been a high priority at Beiersdorf. Close, efficient cooperation between the Executive and Supervisory Boards, respect for the interests of share-holders, employees, and other stakeholders, open corporate communication, proper accounting and auditing, compliance with statutory provisions and corporate guidelines, and responsible risk management are the basis of the company’s success in this area. Beiersdorf is also aware of its social and envi-ronmental responsibility and ensures that its business strategy and operational decisions take this into account.
The German Corporate Governance Code (the Code) ensures transparency with respect to the legal framework for corporate management and supervision and contains accepted standards for good, responsible, and sustainable corporate management. The Code and the amendments to it did not require any fun-damental changes at Beiersdorf. We understand corporate governance as an
ongoing process and we will continuously and carefully develop this under-standing, above and beyond the Code as well.
Declaration of Compliance
In December 2019, the Executive and Supervisory Boards issued the Declaration of Compliance with the recommendations of the German Corporate Governance Code in the version dated February 7, 2017 (2017 Code) and applicable to fiscal year 2019 in accordance with § 161 Aktiengesetz (German Stock Corporation Act, AktG). As stated in the declaration, Beiersdorf AG fulfills all the recommenda-tions made in the 2017 Code with one exception, as well as all the suggestions with a small number of exceptions. The 2019 Declaration of Compliance was also made permanently accessible to the public on the company’s website at www.beiersdorf.com/ declaration_of_compliance .
Declaration by the Executive Board and the Supervisory Board of Beiersdorf Aktiengesellschaft on the Recommendations of the “Government Commission on the German Corporate Governance Code” in accordance with § 161 of the Aktiengesetz (German Stock Corporation Act, AktG)
In fiscal year 2019, Beiersdorf Aktiengesellschaft complied with, and continues to comply with, all recommendations of the “Government Commission on the German Corporate Governance Code” in the version dated February 7, 2017, with one exception:
In accordance with section 4.2.3 (2) sentence 6 of the German Corporate Governance Code, the amount of remuneration of Executive Board members should be capped, both overall and with respect to the variable remuneration components.
The remuneration of the Executive Board members is limited by such a cap. The Enterprise Value Component granted to the members of the Executive Board, alongside the regular, variable remuneration, which is based on voluntary personal investment by the Executive Board members concerned (Covered Virtual Units), participates in positive and negative changes in the enterprise value and is not capped in respect of increases in value. The Supervisory Board considers it appropriate that members of the Executive Board who contribute their own money – comparable to an investment – should be allowed to participate in positive changes in enterprise value without restriction. The Super-visory Board and Executive Board have resolved to declare a corresponding deviation from the recommendation of the German Corporate Governance Code.
Hamburg, December 2019 For the Supervisory Board For the Executive Board
Stefan De Loecker Chairman of the Executive Board
Dessi TemperleyMember of the Executive Board
Prof. Dr. Reinhard Pöllath Chairman of the Supervisory Board

To Our Shareholders
16
Corporate Governance Report
Management Structure
Beiersdorf AG is governed by German stock corporation, capital market, and codetermination law, as well as by its Articles of Association. The company has a dual management and supervisory structure consisting of the Executive Board and the Supervisory Board, as is customary in Germany. The Annual General Meeting of the shareholders is responsible for taking fundamental decisions for the company. These three bodies are all dedicated in equal measure to the good of the company and the interests of the shareholders.
1. Supervisory BoardBeiersdorf AG’s Supervisory Board consists of 12 members. Half of these are elected by the Annual General Meeting in accordance with the Aktiengesetz (German Stock Corporation Act, AktG) and half by the employees in accord-ance with the Mitbestimmungsgesetz (German Codetermination Act, MitbestG); all members are elected for a period of five years. The most recent regular election took place in fiscal year 2019. The regular term of office of all current Supervisory Board members will expire at the end of the Annual General Meeting resolving on the approval of their activities for fiscal year 2023. The shareholder representatives of the new Supervisory Board were elected indi-vidually at the Annual General Meeting in April 2019. No former Executive Board members of Beiersdorf AG currently serve as Supervisory Board members.
The Supervisory Board appoints, advises, and supervises the Executive Board as laid down by the law, the Articles of Association, and the bylaws. The Super visory Board and Executive Board work closely together for the good of the company and to achieve sustainable added value. In accordance with the bylaws for the Executive Board, certain decisions of fundamental impor-tance are subject to Supervisory Board approval. The bylaws for the Super-visory Board are available on the company’s website at www.beiersdorf.com/
bylaws_supervisory_board .
The Supervisory Board regularly makes decisions at its meetings on the basis of detailed documents. The Supervisory Board members may also participate in the meetings via conference calls or video conferencing; however, this is not the norm. The Supervisory Board also meets regularly without the Executive Board to discuss Executive Board and Supervisory Board matters along with strategy, planning, and business performance. Meetings are regularly discussed in advance; partially by the employee and shareholder representatives sepa-rately. The Supervisory Board is informed in a regular, timely, and comprehensive manner about all relevant matters. In addition, the Chairman of the Executive Board informs the Chairman of the Supervisory Board regularly and in a timely manner (including between meetings) about important transactions and liaises with him on important decisions. The Chairman of the Supervisory Board coordinates the work of the Supervisory Board, chairs its meetings, and rep-resents the interests of the Supervisory Board externally. The Chairman is in principle also willing to discuss Supervisory Board-related topics with investors.
The Supervisory Board regularly evaluates, including with the help of an exter-nal consultant, how effectively the Board and its committees are performing their tasks and decides on measures to improve this performance (efficiency audit and self-assessment). In spring 2019, the Supervisory Board began plan-ning another efficiency audit and has been conducting this since the fall of 2019 with the support of an external consultant. Further information on the current
efficiency audit can be found in this report in the section entitled “Report by the Supervisory Board.”
The members of the Supervisory Board ensure that they have sufficient time at their disposal to fulfill their duties and are personally responsible for ensur-ing they receive the necessary training and further education. The company provides them with appropriate support, such as in the form of internal train-ing events on topics relevant to Supervisory Board work and information on changes in legislation and developments. There is also a thorough onboarding of new members of the Supervisory Board.
The company’s D&O insurance policy also covers the members of the Super-visory Board. The deductible amounts to 10% of any damage incurred, up to one-and-a-half times the fixed annual remuneration of the Supervisory Board member.
a) Composition, Profile of Skills and Expertise, and Implementation Status
In December 2018, the Supervisory Board again discussed the concrete com-pany-specific objectives and the profile of skills and expertise for its composi-tion. These objectives reflect the company’s international activities, potential conflicts of interest, the number of independent Supervisory Board members, regular limits on age and length of membership for Supervisory Board mem-bers, and diversity – especially an appropriate degree of female representation. According to its profile of skills and expertise the Supervisory Board members must collectively possess the knowledge, skills, and professional experience required to properly perform the Board’s duties. The objectives and profile of skills and expertise form part of the diversity policy for the composition of the Supervisory Board. They initially apply until the end of 2021 and will be taken into account in future proposals for election as they have been in the past.
International FocusAll members of the Supervisory Board must be open to the company’s inter-national orientation. At least three members should embody this in concrete terms and should therefore have particular international experience due to their activities abroad or their background, for example. At least two members with international experience should be shareholder representatives.
WomenThe Supervisory Board’s goal is to further strengthen the number and position of women on the Supervisory Board and to achieve a target of at least four female members. At least two women should be shareholder representatives. As a listed company subject to codetermination on a basis of parity, the Supervisory Board needs to be comprised of 30% women and men, respectively, under statutory law.
Regular Limits on Age and Length of Membership According to the Supervisory Board bylaws, members should normally retire at the Annual General Meeting following their 72nd birthday, and at the latest after a term of office of 20 years. The goal for the Supervisory Board’s composition is that different age groups are adequately represented. The term of office of each Supervisory Board member is disclosed on the company’s website at www.beiersdorf.de/boards .
To Our Shareholders
17
Corporate Governance Report
Independent FocusThe Supervisory Board should include what it considers to be an appropriate number of independent members, taking into account the ownership struc-ture. A Supervisory Board member is not considered to be independent in particular if he or she or a close family member has personal or business relations with the company, its Executive Board, a controlling shareholder, or an enterprise associated with the latter which may cause a material and not merely temporary conflict of interest. The Supervisory Board considers it to be adequate if at least eight of its members are independent. In this context, it assumes that the employee representatives are to be considered independent within the meaning of the Code. With respect to the shareholder representa-tives, considering the fact that Beiersdorf AG is a dependent company within the meaning of § 17 (1) AktG, the Supervisory Board considers it to be adequate if at least two of its members are independent.
Potential Conflicts of InterestThe Supervisory Board’s objective with respect to independence also takes potential conflicts of interest on the part of its members into account. All members of the Supervisory Board must inform the Supervisory Board, by way of communication addressed to the Chairman of the Supervisory Board, of any conflicts of interest, in particular those relating to a consulting function or directorship with clients, suppliers, lenders, or competitors of the company. Members of the Supervisory Board must resign their office if faced with mate-rial and not merely temporary conflicts of interest. Where involvement of the Supervisory Board is not already required by statutory law, material trans-actions between the Group and members of the Supervisory Board and their related parties require the approval of the Supervisory Board and must comply with the standards customary in the sector.
Profile of Skills and Expertise The Supervisory Board ensures that its members collectively have the knowl-edge, skills, and professional experience needed to properly perform their duties. In addition to the concrete objectives for its composition, the Super visory Board has prepared a profile of skills and expertise setting out the particular personal and professional skills and expertise required. In terms of their exper-tise, the members must collectively be familiar with the sector in which the com-pany operates; in addition, at least one member must have expertise and ex-perience in each of the following areas: accounting and finance; consumer goods, retail and sales channels; international markets (including emerging markets); beauty and body care; brand development and management; per-sonnel development and support; corporate organization; corporate governance and supervisory law; risk management, internal control systems, compliance, and auditing; innovation management and research and development; digital, data management, and information technology; sustainability and corporate social responsibility. The Supervisory Board’s aim is that all these areas of expertise should be represented among its members in as balanced a way as possible, thereby complementing one another. In addition to this, every Super-visory Board member should meet the necessary general and personal require-ments for fulfilling their duties in terms of education, international professional orientation, international diversity, seniority, reliability, diligence, and availability to the required and appropriate extent.
Diversity Officers Two Supervisory Board members have been appointed as diversity officers in order to develop the targets further and promote diversity on the Supervisory Board: Martin Hansson and Prof. Manuela Rousseau. Their role is to support the Supervisory Board at every intended election of a shareholder representative to the Supervisory Board, or of a committee member, and to issue a statement together with the Chairman of the Supervisory Board regarding the proposals for election made by the Nomination Committee responsible for this, after consultation with the remaining members of the Supervisory Board.
Implementation Status of Targets and the Profile of Skills and ExpertiseIn addition to a balanced mix of professional skills within the Supervisory Board as a whole, diversity is an important criterion for the selection of Supervisory Board and committee members in the company’s best interests. There are currently five female Supervisory Board members in total: Prof. Manuela Rousseau, Regina Schillings, and Kirstin Weiland as employee representatives, and Dr. Dr. Christine Martel and Hong Chow as shareholder representatives. The statutory gender quota for the Supervisory Board’s composition has therefore been fulfilled. In addition to their particular professional skills, all the shareholder representative members embody the idea of international orien-tation by virtue of their background or extensive international experience.
Three-quarters of the members of the Supervisory Board are independent, and at least one-half of the shareholder representatives. The Supervisory Board assumes, as a highly precautionary measure, that a Supervisory Board mem-ber with relations to the controlling shareholder should not be regarded as independent. Notwithstanding this, the Supervisory Board believes that relations to the controlling shareholder do not in themselves pose the risk of a material and permanent conflict of interest; rather, it assumes that the com-pany’s interests will largely coincide with those of its majority shareholder in those cases in which their business activities do not overlap. The Supervisory Board therefore assumes that, among the shareholder representatives, at least the following active members are independent from both the controlling share-holder and the company and Executive Board: Hong Chow, Dr. Dr. Christine Martel (the Chair of the Audit Committee), and Frédéric Pflanz. In addition, the Supervisory Board takes the view that, alongside Martin Hansson, the Chairman of the Supervisory Board and Presiding Committee Prof. Reinhard Pöllath should be regarded as independent from the company and Executive Board, despite his more than 12 years of service on the Supervisory Board. The Super-visory Board believes that the Chairman of the Supervisory Board’s long-stand-ing, company-specific experience and expertise is conducive to the goals of advising and supervising the Executive Board and coordinating the Super visory Board’s work in a lasting and objective manner. Moreover, given his length of service, there are no circumstances in his specific case that might cause a material and not merely temporary conflict of interest.
Two Supervisory Board members, Michael Herz and Prof. Reinhard Pöllath, have exceeded the regular age limit set out in the bylaws of the Supervisory Board. One Supervisory Board member, Prof. Manuela Rousseau, has exceeded the regular term of office. Given their knowledge and experience, the Supervisory Board has decided to make a reasonable exception for these members from

To Our Shareholders
18
Corporate Governance Report
the regular limits on age and length of membership. The regular limits on age and length of membership, and the rules governing potential conflicts of inter-est, were otherwise complied with. All members of the Supervisory Board also fulfill the necessary personal competence requirements for their tasks. More-over, the Supervisory Board members are collectively familiar with the sector in which the company operates. In addition, the fields of required expertise are each represented by at least one member.
b) CommitteesThe work of the Supervisory Board is performed at, and outside of, the meetings of the full Board as well as in the committees. The committee chairs report to the Supervisory Board on the work of their committee. This report is provided no later than at the Supervisory Board meeting following the rele-vant committee meeting. The Supervisory Board has formed the following six committees:
Presiding CommitteeThe Presiding Committee is composed of the Chairman of the Supervisory Board, two additional shareholder representatives, and one employee repre-sentative. The Committee prepares meetings and human resources decisions and resolves – subject to the resolution of the full Board specifying the total remuneration – instead of the full Board on the contracts of service and pension agreements for members of the Executive Board and on other issues involving the Executive Board. Finally, it can make decisions on transactions requiring Supervisory Board approval in those cases in which the Supervisory Board cannot pass a resolution in time.
Audit CommitteeThe Audit Committee is composed of the Chairman of the Supervisory Board, two shareholder representatives, and two additional employee representatives. At least one member of the Audit Committee is an independent member of the Supervisory Board who has special expertise and experience in account-ing, internal control mechanisms, and auditing. This requirement is met in particular by the Chair of the Audit Committee, Dr. Dr. Christine Martel. The Audit Committee prepares decisions of the Supervisory Board, in particular on the annual and consolidated financial statements (including CSR reporting), the proposal to the Annual General Meeting on the election of the auditors, and the agreement with the auditors (issuing the audit engagement, stipulat-ing the areas of emphasis of the audit, and agreeing on the fee) and provides corresponding recommendations to the Supervisory Board. Regular discus-sions with the auditors additionally take place outside the meetings on relevant topics. The Audit Committee also monitors the auditor’s independence, looks at the additional services that the auditor provides in accordance with the guidelines set by the committee for approving non-audit services, and regu-larly evaluates the quality of the audit. It advises and supervises the Executive Board on questions relating to accounting and the effectiveness of the internal control system, the risk management system, and the internal audit system. In addition, it discusses the half-year reports and quarterly statements with the Executive Board before their publication.
Finance CommitteeThe Finance Committee is composed of the Chairman of the Supervisory Board, two additional shareholder representatives, and two employee representatives. It monitors corporate policy in the areas of finance, financial control, tax, and
insurance. It decides in place of the Supervisory Board on approval for raising and granting loans, on the assumption of liability for third-party liabilities, and on investment transactions. In addition, the Finance Committee advises and supervises the Executive Board on compliance and on all items assigned to it by the full Board in general or in individual cases.
Personnel CommitteeThe Personnel Committee comprises a total of six members representing share-holders and employees. It regularly discusses long-term succession planning for the Executive Board (including the remuneration structure) and addresses the diversity policy for the Executive Board’s composition along with the manner of its implementation. It also proposes a target for the proportion of women on the Executive Board as well as a deadline for achieving this.
Mediation CommitteeThe Mediation Committee required under codetermination law consists of the Chairman of the Supervisory Board and the Deputy Chairman, as well as one member elected from among the employee representatives and one member elected from among the shareholder representatives. It makes proposals on the appointment of Executive Board members if the requisite two-thirds majority is not reached during the first ballot. The Mediation Committee has not met for several terms of office.
Nomination CommitteeThe Nomination Committee is composed of the Chairman of the Supervisory Board and three additional shareholder representatives. It suggests candidates to the Supervisory Board for proposal for election to the Annual General Meeting.
The composition of the Supervisory Board and its committees can be found on our website at www.beiersdorf.com/boards and in the “Beiersdorf AG Boards” chapter of this report. Up-to-date resumés of the Supervisory Board members can also be found at the web address above.
2. Executive BoardThe Executive Board manages the company on its own responsibility and con-ducts the company’s business. It is obliged to act in the company’s best inter-ests and is committed to increasing its sustainable enterprise value. It performs its management duties as a collegiate body with collective responsibility.
The members of the Executive Board are appointed by the Supervisory Board. The Supervisory and Executive Boards together ensure long-term succession planning and take diversity aspects into account when determining the com-position of the Executive Board. In addition, the Personnel Committee estab-lished in 2018 is responsible for the development of the diversity policy for the Executive Board. All current Executive Board members embody the notion of international orientation due to their years of working abroad or to their special expertise in Beiersdorf’s key international markets. The Supervisory Board aims to ensure appropriate representation of women as part of succession planning for the Executive Board. The Supervisory Board set a target of 10% for the proportion of women on the Executive Board, to be achieved by no later than June 30, 2022. This target has been fulfilled since July 1, 2018. The bylaws for the Executive Board stipulate that the members of the Executive Board should be no older than 63 years.
To Our Shareholders
19
Corporate Governance Report
The duties of the Executive Board are broken down by functions and regions. The schedule of responsibilities constitutes part of the bylaws for the Execu-tive Board.
The Executive Board develops the corporate goals and the Group’s strategy, agrees them with the Supervisory Board, ensures their implementation, and regularly discusses them with the Supervisory Board. It is responsible for man-aging and monitoring the Group, for corporate planning including annual and multi-year planning, and for preparing the quarterly statements, the half-year reports, and the annual and consolidated financial statements. It is also respon-sible for Group financing. In addition, the Executive Board is responsible for ensuring adequate risk management and risk control, and for ensuring that all statutory provisions and internal corporate guidelines are observed, and works to ensure that Group companies abide by them (compliance). This is ensured through an appropriate compliance management system tailored to the risk situation, including a whistleblower platform operated by an independent pro-vider for employees and third parties in almost all Consumer Business Segment countries. The principles of the compliance management system are disclosed in the Sustainability Report. The Executive Board provides the Supervisory Board with regular, timely, and comprehensive reports on all questions that are of relevance for the company, including explanations for discrepancies between the actual course of business and the planning and targets. Certain Executive Board measures and transactions that are of particular significance for the company require the approval of the Supervisory Board or its committees.
The Executive Board also takes diversity aspects into account when filling executive positions within the company, particularly with regard to ensuring an appropriate degree of female representation. The Executive Board has set a target of at least 35% (figure as of year-end 2019: 31%) for the share of women at Beiersdorf AG’s first management level below the Executive Board, and a target of at least 50% (figure as of year-end 2019: 48%) for the second management level, both to be achieved by June 30, 2022.
The Executive Board passes resolutions in regular meetings that are chaired by the Chairman of the Executive Board. The members of the Executive Board work together in a collegial manner and inform one another on an ongoing basis about important measures and events in their areas of responsibility.
Executive Board members disclose potential conflicts of interest to the Supervisory Board without delay and inform their colleagues on the Executive Board. Where involvement of the Supervisory Board is not already required by statutory law, material transactions between the Group and members of the Executive Board and their related parties require the approval of the Super-visory Board and must comply with the standards customary in the sector. Sideline activities also require the approval of the Supervisory Board.
The company has taken out a D&O insurance policy for the members of the Executive Board that provides for a deductible in the amount of 10% of any damage incurred, up to one-and-a-half times the fixed annual remuneration of the Executive Board member concerned.
3. Annual General MeetingIn accordance with the Articles of Association, shareholders exercise their rights both at the Annual General Meeting and outside it. Each share entitles the holder to one vote.
Among other things, the Annual General Meeting passes resolutions on the appropriation of net retained profits, on the formal approval of Executive Board and Supervisory Board members’ actions, on the election of the auditors, and on the company’s legal basis, especially amendments to the Articles of Asso-ciation. In addition, the Executive Board will convene an extraordinary General Meeting where it considers this appropriate in individual cases, in the event of significant structural changes, or in case of a takeover offer. At this meeting, shareholders can discuss the issue at hand and resolve on measures under company law if appropriate.
The Ordinary Annual General Meeting takes place each year, generally during the first five months of the fiscal year. The notice convening the Annual General Meeting and its agenda are also published on the company’s website, together with the reports and documentation required for the Annual General Meeting, including the annual report and forms for postal voting. It can also be dis-patched electronically together with the associated documents with the consent of the individual shareholder. To assist shareholders in personally exercising their rights, the company offers them the services of a voting representative who votes in accordance with their instructions. The invitation explains how shareholders can issue instructions for exercising their voting rights. In addition, shareholders are free to appoint a proxy holder of their choice as their repre-sentative at the Annual General Meeting. It is also possible to submit postal votes, and to issue, change, and revoke proxy instructions to the voting rep-resentative appointed by the company via the internet before and during the Annual General Meeting. In addition, all shareholders can follow the full Annual General Meeting online.
Directors’ Dealings
In accordance with Article 19 (1) of the Market Abuse Regulation, the members of the Executive Board and the Supervisory Board are required to notify trans-actions involving shares in Beiersdorf AG or financial instruments linked thereto (directors’ dealings) to the company and the Bundesanstalt für Finanzdienstleistungsaufsicht (Federal Financial Supervisory Authority, BaFin) promptly and no later than three business days after the date of transaction. This also applies to related parties of such persons.
The notifications received by Beiersdorf AG are published and are available on the company’s website at www.beiersdorf.com/directors_dealings .
Further Information on Corporate Governance
Detailed information on the work of the Supervisory Board and its committees, as well as on the cooperation between the Supervisory Board and the Executive Board, can be found in the “Report by the Supervisory Board” chapter of this report. Further information on Executive Board and Supervisory Board remuneration can be found in the “Remuneration Report” section of the Combined Management Report.
The consolidated financial statements and half-year reports are prepared in accordance with International Financial Reporting Standards (IFRS), as adopted by the EU. The annual financial statements of Beiersdorf AG are prepared in accordance with the Handelsgesetzbuch (German Commercial Code, HGB).
To Our Shareholders
20
Corporate Governance Report
The Annual General Meeting on April 17, 2019, elected Ernst & Young GmbH Wirtschaftsprüfungsgesellschaft, Stuttgart, as the auditors for Beiersdorf AG and the Beiersdorf Group for fiscal year 2019 and as the auditors for the review of the half-year report 2019. Ernst & Young GmbH Wirtschaftsprüfungsgesell-schaft has been auditing the annual and consolidated financial statements of Beiersdorf AG since the 2006 fiscal year. Kristian Ludwig has been the respon-sible auditor since fiscal year 2013. Ernst & Young GmbH Wirtschafts prüfungs-gesellschaft was also commissioned with a limited assurance engagement on the separate non-financial report of the Beiersdorf Group and of Beiersdorf AG.
Current developments and key company information are published on our website, www.beiersdorf.com , as soon as possible. As well as detailed disclosures on corporate governance at Beiersdorf, the website features additional information on the Executive Board, the Supervisory Board, and the Annual General Meeting, the company’s reports (annual reports, including combined management reports and corporate governance reports, annual financial statements, half-year reports, quarterly statements, and the combined, separate non-financial report of Beiersdorf AG and the Group), as well as a financial calendar with all key events and publications, ad hoc disclosures, and direc-tors’ dealings.
The Corporate Governance Statement of Beiersdorf AG and the Group in accordance with §§ 289f and 315d HGB has been published on the company’s website in connection with the Corporate Governance Report at www.beiersdorf.com/corporate_governance_statement , and will be accessible there for at least five years. It includes the Declaration of Compliance in ac-cordance with § 161 AktG as well as information on key corporate governance practices, on Executive and Supervisory Board working practices and the com-position and working practices of their committees (including disclosures on corporate governance), on the diversity policy for the Executive and Super-visory Boards, and on the statutory requirements for the equal participation of women and men in leadership positions, along with the current implemen-tation status.
Hamburg, February 25, 2020 Beiersdorf Aktiengesellschaft
The Supervisory Board The Executive Board
Combined Management Report
21
Pages 21 – 70
Foundation of the Groupp. 23 Business and Strategy
p. 27 Research and Development
p. 32 Sustainability
p. 35 People at Beiersdorf
Economic Reportp. 41 Economic Environment
p. 43 Results of Operations
p. 50 Net Assets
p. 51 Financial Position
p. 52 Overall Assessment of the Group’s Economic Position
p. 53 Beiersdorf AG
p. 55 Risk Report
p. 59 Report on Expected Developments
Remuneration Report and Other Disclosuresp. 61 Remuneration Report
p. 69 Report by the Executive Board on Dealings among Group Companies
p. 69 Disclosures Pursuant to Takeover Laws
Combined Management
Report
Combined Management Report
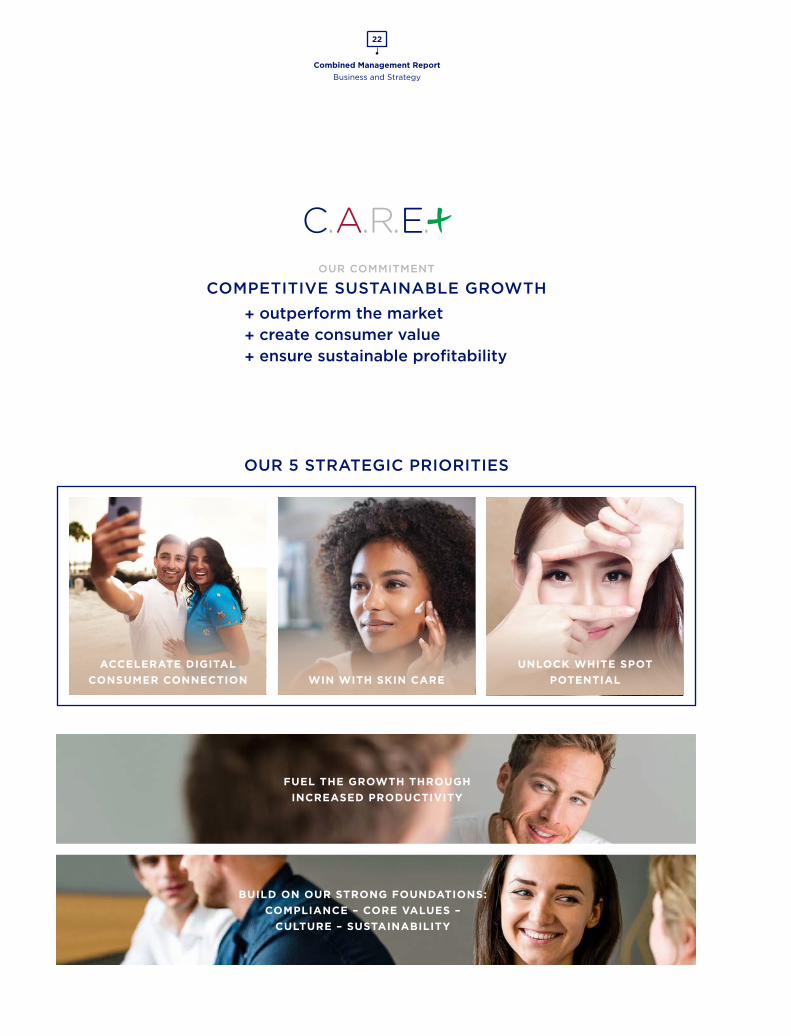
22
OUR 5 STRATEGIC PRIORITIES
OUR COMMITMENT COMPETITIVE SUSTAINABLE GROWTH
+ outperform the market+ create consumer value+ ensure sustainable profitability
Business and Strategy
FUEL THE GROWTH THROUGH INCREASED PRODUCTIVITY
ACCELERATE DIGITAL CONSUMER CONNECTION WIN WITH SKIN CARE
UNLOCK WHITE SPOT POTENTIAL
BUILD ON OUR STRONG FOUNDATIONS: COMPLIANCE – CORE VALUES –
CULTURE – SUSTAINABILITY

Combined Management Report
23
Business and Strategy
Foundation of the Group
Business and Strategy
Founded in 1882, Beiersdorf is today one of the world’s leading companies in the consumer goods industry. With strong brands, over 20,000 employees, and more than 170 affiliates worldwide, we always strive to anticipate peo-ples’ wishes and desires and offer them innovative, high-quality products. Beiersdorf’s business is divided into two business segments:
• In the Consumer Business Segment, our focus is on skin and body care. Our strong portfolio comprises such brands as NIVEA, EUCERIN, HANSAPLAST, and LA PRAIRIE, which are trusted by consumers around the world.
• In the tesa Business Segment, we concentrate on developing high-quality self-adhesive systems and product solutions for industry, craft businesses, and end consumers. Since 2001, the tesa Business Segment has been man-aged as an independent subgroup.
Consumer
The consumer goods industry, and particularly the skin care business, are undergoing a historical disruption. Our business model must address the new economic and technological challenges. However, challenges also create op-portunities. We are confident that Beiersdorf has the potential to take these opportunities and shape a successful future. Our response to the profound transformation is our C.A.R.E.+ strategic program, which we announced in Feb-ruary 2019. This involves introducing a new, multi-year investment initiative. C.A.R.E.+ stands for four key attributes with which we want to sharpen our forward-looking mindset and boost our competitive advantages: Courage, Aspiration, Responsibility, and Empathy. The “+” symbolizes our efforts to create added value for people and society.
With the new C.A.R.E.+ strategy, we aim to outperform the market, create superior value for our consumers with high-margin products and innovations, and ensure our sustainable profitability.
C.A.R.E.+ sets five strategic priorities:• Accelerate digital consumer connection • Win with skin care• Unlock white spot potential • Fuel the growth through increased productivity • Building on our strong foundations:
Compliance – Core Values – Culture – Sustainability
To ensure the sustainable success of our business, Beiersdorf worked inten-sively on implementing these five strategic priorities during the reporting year and achieved significant progress.
Accelerate digital consumer connectionDigital technologies create new opportunities for consumers to express their individual needs and to underscore their expectations. With new digital chan-nels and technologies, innovative integration of online and offline activities, and better information about consumers’ wishes and behavior, we can offer our consumers better and more personalized brand and product experiences. This boosts consumer loyalty and is a decisive factor in enabling competitive growth at Beiersdorf. We have therefore set ourselves the goal of offering our consumers unique experiences whenever they encounter our brands and prod-ucts all along their consumer journey. This goal is closely linked to our mission for our brands and products: be visible, be shoppable, and be lovable.
To achieve this, we put considerable investment into the company-wide digital transformation during the reporting year. In May 2019, for example, we opened an EUCERIN online shop on China’s largest international platform for e-commerce: Tmall from Alibaba. This platform offers us the opportunity to present our in-novations online to more than 150 million consumers in China and drive our success in the Chinese market. Our new EUCERIN online shop in Russia and our new NIVEA brand shop on the African ecommerce platform Jumia also ensure that our products are available to new and sometimes difficult-to-reach target groups. This allows us to leverage further growth potential in these markets. In August 2019, we were also the first skin care brand to open our own NIVEA brand shop on eBay Germany.
Win with skin careFor over 135 years, our focus has been on skin care – our core competency. New technologies have changed consumer behavior in fundamental ways. As a result, it is our mission to win over consumers by offering superior innovations and a strong portfolio of global brands. We want to launch skin care innovations that deliver real added value for consumers and thereby boost Beiersdorf’s competitiveness.
Numerous initiatives enabled us to reinforce our strong position in skin care during the reporting year:
The new EUCERIN Anti-Pigment range was a real innovative breakthrough for us. It is based on Thiamidol – the revolutionary active ingredient against hyperpigmentation that we have developed and patented in years of pio-neering work. Within just a few months, the range became the world’s No. 1 in caring for even skin and helped EUCERIN take a leading market position in dermocosmetics in many countries.
Our entry into natural cosmetics was another important step we took in 2019 to further strengthen our skin care expertise and to meet increased consumer demand for more natural and sustainable products. With FLORENA FERMENTED SKINCARE, we are offering a range of certified natural cosmetic products with an innovative concept that has fermentation at its heart for the first time in the pilot markets Italy and France. Furthermore, the jars are made of
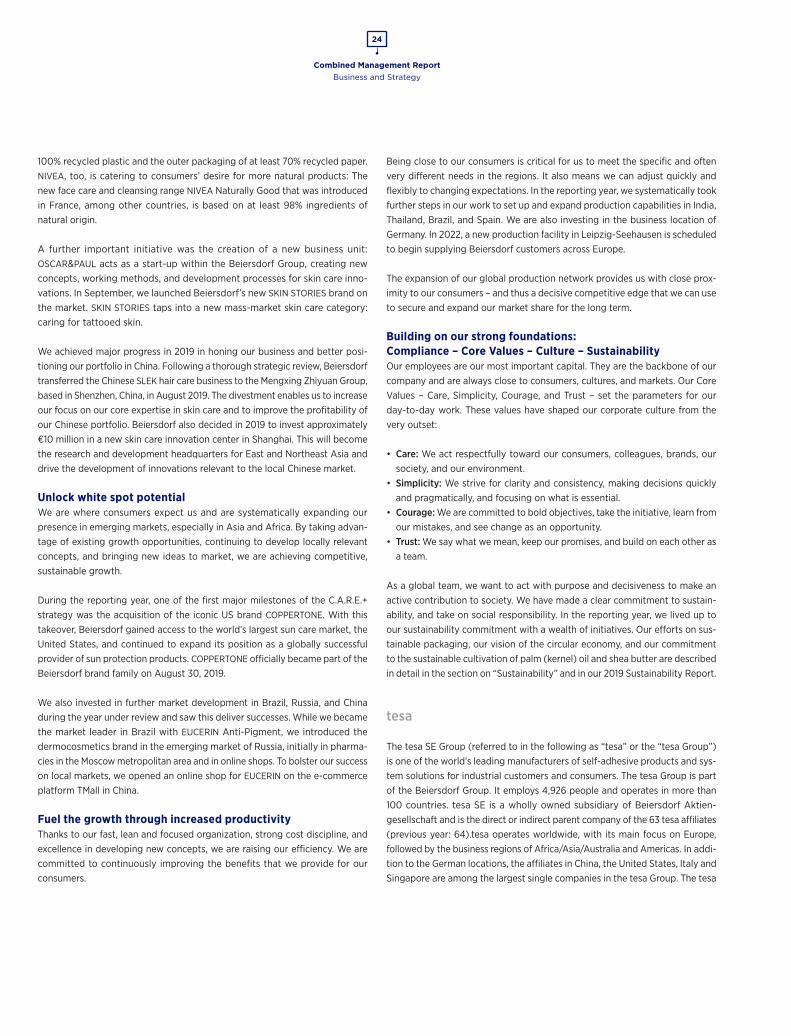
Combined Management Report
24
Business and Strategy
100% recycled plastic and the outer packaging of at least 70% recycled paper. NIVEA, too, is catering to consumers’ desire for more natural products: The new face care and cleansing range NIVEA Naturally Good that was introduced in France, among other countries, is based on at least 98% ingredients of natural origin.
A further important initiative was the creation of a new business unit: OSCAR&PAUL acts as a start-up within the Beiersdorf Group, creating new concepts, working methods, and development processes for skin care inno-vations. In September, we launched Beiersdorf’s new SKIN STORIES brand on the market. SKIN STORIES taps into a new mass-market skin care category: caring for tattooed skin.
We achieved major progress in 2019 in honing our business and better posi-tioning our portfolio in China. Following a thorough strategic review, Beiersdorf transferred the Chinese SLEK hair care business to the Mengxing Zhiyuan Group, based in Shenzhen, China, in August 2019. The divestment enables us to increase our focus on our core expertise in skin care and to improve the profitability of our Chinese portfolio. Beiersdorf also decided in 2019 to invest approximately €10 million in a new skin care innovation center in Shanghai. This will become the research and development headquarters for East and Northeast Asia and drive the development of innovations relevant to the local Chinese market.
Unlock white spot potentialWe are where consumers expect us and are systematically expanding our presence in emerging markets, especially in Asia and Africa. By taking advan-tage of existing growth opportunities, continuing to develop locally relevant concepts, and bringing new ideas to market, we are achieving competitive, sustainable growth.
During the reporting year, one of the first major milestones of the C.A.R.E.+ strategy was the acquisition of the iconic US brand COPPERTONE. With this takeover, Beiersdorf gained access to the world’s largest sun care market, the United States, and continued to expand its position as a globally successful provider of sun protection products. COPPERTONE officially became part of the Beiersdorf brand family on August 30, 2019.
We also invested in further market development in Brazil, Russia, and China during the year under review and saw this deliver successes. While we became the market leader in Brazil with EUCERIN Anti-Pigment, we introduced the dermocosmetics brand in the emerging market of Russia, initially in pharma-cies in the Moscow metropolitan area and in online shops. To bolster our success on local markets, we opened an online shop for EUCERIN on the e-commerce platform TMall in China.
Fuel the growth through increased productivityThanks to our fast, lean and focused organization, strong cost discipline, and excellence in developing new concepts, we are raising our efficiency. We are committed to continuously improving the benefits that we provide for our consumers.
Being close to our consumers is critical for us to meet the specific and often very different needs in the regions. It also means we can adjust quickly and flexibly to changing expectations. In the reporting year, we systematically took further steps in our work to set up and expand production capabilities in India, Thailand, Brazil, and Spain. We are also investing in the business location of Germany. In 2022, a new production facility in Leipzig-Seehausen is scheduled to begin supplying Beiersdorf customers across Europe.
The expansion of our global production network provides us with close prox-imity to our consumers – and thus a decisive competitive edge that we can use to secure and expand our market share for the long term.
Building on our strong foundations: Compliance – Core Values – Culture – Sustainability Our employees are our most important capital. They are the backbone of our company and are always close to consumers, cultures, and markets. Our Core Values – Care, Simplicity, Courage, and Trust – set the parameters for our day-to-day work. These values have shaped our corporate culture from the very outset:
• Care: We act respectfully toward our consumers, colleagues, brands, our society, and our environment.
• Simplicity: We strive for clarity and consistency, making decisions quickly and pragmatically, and focusing on what is essential.
• Courage: We are committed to bold objectives, take the initiative, learn from our mistakes, and see change as an opportunity.
• Trust: We say what we mean, keep our promises, and build on each other as a team.
As a global team, we want to act with purpose and decisiveness to make an active contribution to society. We have made a clear commitment to sustain-ability, and take on social responsibility. In the reporting year, we lived up to our sustainability commitment with a wealth of initiatives. Our efforts on sus-tainable packaging, our vision of the circular economy, and our commitment to the sustainable cultivation of palm (kernel) oil and shea butter are described in detail in the section on “Sustainability” and in our 2019 Sustainability Report.
tesa
The tesa SE Group (referred to in the following as “tesa” or the “tesa Group”) is one of the world’s leading manufacturers of self-adhesive products and sys-tem solutions for industrial customers and consumers. The tesa Group is part of the Beiersdorf Group. It employs 4,926 people and operates in more than 100 countries. tesa SE is a wholly owned subsidiary of Beiersdorf Aktien-gesellschaft and is the direct or indirect parent company of the 63 tesa affiliates (previous year: 64).tesa operates worldwide, with its main focus on Europe, followed by the business regions of Africa/Asia/Australia and Americas. In addi-tion to the German locations, the affiliates in China, the United States, Italy and Singapore are among the largest single companies in the tesa Group. The tesa
Combined Management Report
25
Business and Strategy
Group has production facilities in Europe (Germany and Italy), North America (United States), and Asia (China). The company headquarters, which include the research and technology center, are located in Norderstedt, near Hamburg.
Direct IndustriesIn the Direct Industries division, tesa supplies specialized system solutions directly to industrial customers, especially in the electronics, printing and paper, building and construction, and automotive industries. The strategic focus is primarily on developing and expanding profitable business lines in technologically advanced fields of application. tesa’s system solutions are used to optimize and enhance the efficiency of production processes, as customized protection and packaging systems, and as fastening solutions in construction- related applications.
tesa also offers digital connectivity solutions for branded products under tesa scribos GmbH. Currently at the forefront is the tesa® 360 Data Analytics soft-ware solution. Thanks to this data analysis module, brand owners can gather and integrally analyze data through their connected products. This provides new insights, for example into how to protect against counterfeiting, into consumer behavior, or into supply chain processes.
Another promising business area that tesa is developing for the future is being handled by tesa Labtec GmbH. This tesa affiliate develops and manufactures transdermal therapeutic systems (medicated patches) as well as buccal films (medicated films that allow direct uptake of drugs through the oral mucosa) for the pharmaceutical industry.
Trade MarketsThe Trade Markets division encompasses those markets in which tesa supplies end customers with market-driven products via retail partners or retail-like channels rather than directly. This segment includes the product ranges aimed at private consumers and craftsmen as well as adhesive tapes that are intend-ed for commercial customers and marketed primarily via the technical trade.
In the General Industrial Markets business segment, tesa offers a wide range of products for diverse applications in various industrial sectors, including prod-uct ranges for assembly and repair, tapes to secure items during transporta-tion, and adhesive solutions for the packaging industry.
In the Consumer & Craftsmen segment, whose business is focused on Europe and Latin America, tesa markets innovative product solutions intended for various applications, including for daily use in offices, the home, and in crafts. Under the tesa umbrella brand, DIY stores and superstores as well as paper goods and stationery shops offer end consumers a broad assortment of more than 300 innovative products in the consumer segment. The Craftsmen busi-ness area focuses on tailor-made product ranges for professional tradesmen as well as on the development and implementation of marketing concepts tailored to target groups.
Management and Control
The Executive Board manages the company and is dedicated to sustainably increasing its value. In addition to the functional areas of responsibility within the Executive Board, there are regional areas of responsibility. The Executive Board is closely involved in the company’s operational business in particular through the allocation of responsibilities for the regions and markets. A break-down of the Executive Board’s areas of responsibility can be found in the chapter “Beiersdorf AG Boards” of the Notes to the Consolidated Financial Statements. The tesa Business Segment is managed as an independent subgroup.
Information on the remuneration of the Executive and Supervisory Boards as well as on incentive and bonus systems is provided in the Remuneration Report, which forms part of the Combined Management Report. The Corporate Gov-ernance Statement of Beiersdorf AG and the Group in accordance with §§ 289f and 315d Handelsgesetzbuch (German Commercial Code, HGB) has been made publicly available on the company’s website at www.beiersdorf.com/corporate_
governance_statement . Additional information regarding management and con-trol, the general management structure, and the Declaration of Compliance in accordance with § 161 Aktiengesetz (German Stock Corporation Act, AktG) is also provided in the Corporate Governance Report.
Value Management and Performance Management System
The goal of Beiersdorf’s business activities is to sustainably increase the company’s market share by achieving quality growth and, at the same time, to expand its earnings base. The long-term key performance indicators – organic sales growth* in conjunction with market share development, EBIT, and the EBIT margin before special factors (the ratio of EBIT to sales) – are derived from this goal. The aim is to generate internationally competitive returns through continuous investment in growth opportunities, systematic cost management, and the highly efficient use of resources.
The company has created an efficient management system in order to meet these strategic goals. Corporate management derives business performance targets for the individual units in the Group for the coming year from the Group’s strategic business goals. This planning covers all segments and affiliates. Formal adoption by the Executive and Supervisory Board of the Group’s plan-ning for the following year is generally in the fall.
Actual key performance indicators are compared with target values and with the current forecast for the year as a whole at regular intervals during the fiscal year. These comparisons are used to manage the business in line with the objectives.
The tesa Business Segment forms a separate, independent unit within the Group. It is also managed on the basis of sales growth, the operating result (EBIT), and the EBIT margin.
In addition to the key financial performance indicators shown above, the company employs a number of non-financial indicators that are described in the chapters “Research and Development,” “Sustainability,” and “People at Beiersdorf” of the Combined Management Report.
* For the definition of organic sales growth refer to Significant Accounting Policies (“Notes to the Segment Reporting”).
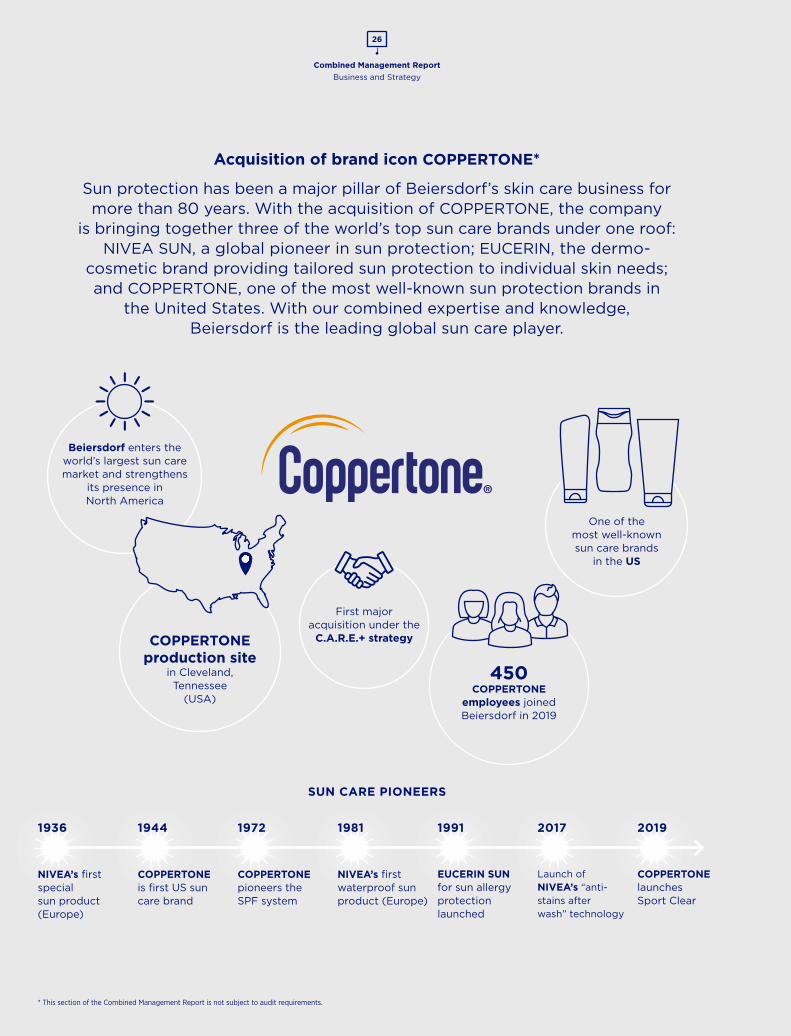
Combined Management Report
26
Business and Strategy
Beiersdorf enters the world’s largest sun care market and strengthens
its presence in North America
Acquisition of brand icon COPPERTONE*
Sun protection has been a major pillar of Beiersdorf’s skin care business for more than 80 years. With the acquisition of COPPERTONE, the company
is bringing together three of the world’s top sun care brands under one roof: NIVEA SUN, a global pioneer in sun protection; EUCERIN, the dermo-
cosmetic brand providing tailored sun protection to individual skin needs; and COPPERTONE, one of the most well-known sun protection brands in
the United States. With our combined expertise and knowledge, Beiersdorf is the leading global sun care player.
SUN CARE PIONEERS
One of the most well-known sun care brands
in the US
COPPERTONE production site
in Cleveland, Tennessee
(USA)
450 COPPERTONE
employees joined Beiersdorf in 2019
First major acquisition under the
C.A.R.E.+ strategy
NIVEA’s firstwaterproof sunproduct (Europe)
EUCERIN SUN for sun allergy protection launched
1981
Launch of NIVEA’s “ anti- stains after wash” technology
2017
COPPERTONElaunchesSport Clear
20191991
NIVEA’s firstspecial sun product (Europe)
COPPERTONE is first US suncare brand
COPPERTONEpioneers theSPF system
1936 1944 1972
* This section of the Combined Management Report is not subject to audit requirements.
Combined Management Report
27
Research and Development
Research and Development
For an innovation-driven company like Beiersdorf, research and development are of particular importance. It is the key to success and the development of innovations is part of our DNA. By developing more innovative products and solutions, we offer value to our consumers around the world. That is why we continuously research new active ingredients and solutions and systematically advance new, groundbreaking technologies.
To bring promising ideas to market as quickly as possible, we regularly evaluate our research program and define clear focus areas. In that regard, our research and development activities have the following areas of focus in line with our two business segments:
• In the Consumer Business Segment, Beiersdorf develops innovative, high-quality skin care products. By addressing consumer needs, global trends, and regional requirements through our research and product devel-opment and translating them into effective and well-tolerated skin care products, we create added value for millions of people around the world.
• In the tesa Business Segment, we are committed to the development of high-quality self-adhesive system and product solutions. Our research and development here aims to identify needs, respond flexibly to special require-ments and market trends, and make our customers’ workflows even more efficient and effective.
As of December 31, 2019, 1,453 people were employed in research and develop-ment at Beiersdorf worldwide (previous year: 1,389). Of this total, 902 (previous year: 850) worked in the Consumer Business Segment and 551 (previous year: 539) in the tesa Business Segment.
In 2019, as part of our investment offensive, that is a product of our corporate strategy C.A.R.E.+, we significantly increased our expenditure on research and development. At the end of the fiscal year, expenditure in this area amounted to €236 million, up 12.2% on the previous year (previous year: €211 million). In 2019, in the Consumer Business Segment, Beiersdorf invested €177 million (+14.5%) and in the tesa Business Segment €59 million (+5.6%) in research and development.
Consumer
Research and development excellenceBeiersdorf has built its global reputation on strong skin care expertise. We have made it our mission to decode the skin’s complex processes, research how certain substances interact with the human skin, and develop innovative new product formulations and solutions. The use of state-of-the-art technologies – for example in the fields of systems biology, rapid prototyping, and artificial intelligence – is essential for us. With this work, we ensure the innovative strength and dermatological expertise of our company.
The development of sustainable, environmentally friendly solutions – for product formulas as well as packaging – is of utmost importance for Beiersdorf. With our innovations, we aim to make a long-term contribution to a livable fu-ture and are actively driving areas of interest such as sustainable ingredients, environmentally friendly product packaging, and the concept of the circular economy through various projects and initiatives. These topic areas will be presented in greater detail in the “Sustainability” chapter as well as in the 2019 Sustainability Report.
Intensive basic research is the source of our innovations – and a major focus of our work. The following topics were among the research fields in the year under review:
• The development of alternative testing methods, i.e. new methods for safety assessments of cosmetic products, has been a substantial part of our research work for years. In 2019, in collaboration with various universities and the European association of the cosmetics industry (Cosmetics Europe), we worked on optimizing a method to assess skin penetration (the so-called OECT test method) – an important step toward safety assessments. In col-laboration with the University of Hamburg, we also made significant progress in the complex assessment of potential skin sensitization. Using a combina-tion of laboratory experiments and novel in silico (via computer simulation) techniques, we can now better assess the effects of organic molecules. Beiersdorf has been an important pioneer in the field of alternative safety assessments for 35 years. By developing new reliable methods and actively participating in validation studies, our employees continuously advance this area with the aim to quickly and reliably demonstrate the tolerability and effectiveness of our cosmetic products. Artificial intelligence and organ-on-a-chip models are the first important tools enabling us to evaluate enormous amounts of data faster and more reliably and to model possible effects of a substance applied to the skin over several days.
• Beiersdorf continued to drive its research on the skin’s energy metabolism. Together with experts from the University of Ancona (Italy), Beiersdorf demonstrated the essential role of coenzyme Q10 in the physiology of fibro-blasts (connective tissue cells). This work showed that even a slight decrease in the Q10 content in cells initially leads to an increased occurrence of damag-ing free radicals (called oxidative stress), followed by cellular energy me-tabolism dysfunction and premature cell aging. The skin’s energy metabolism remains highly relevant to modern anti-aging research.
• During 2019, epigenetics, the study of how environmental factors affect cell properties and gene activity, was another central focus of our research work. Because epigenetic changes can influence skin aging and the general appearance of the skin, Beiersdorf researchers collaborated with renowned institutions, e.g. the German Cancer Research Center (Deutsches Krebs-forschungszentrum, DKFZ), to identify what is known as epigenetically active substances for skin care that can reverse skin-relevant processes. Beiersdorf has already developed the first model substances in this pio-neering field that will be further optimized.
Combined Management Report
28
Research and Development
• Protecting the skin against the negative effects of sun exposure is one of Beiersdorf’s core strengths. Our research over the past years has repeatedly shown that sun damage to the skin is not caused by UV rays alone, but that visible light also has a significant impact on the skin. Using conventional filters to protect against visible light would lead to strongly discolored products, therefore we have developed active ingredients that protect the skin’s phys-iology by blocking free radicals and inflammatory processes induced by visible light. The findings of the Cosmetics Europe Sun Protection Task Force – a panel of industry experts – during 2019 have now shown that these anti-inflammatory agents do not affect the sun protection factor; therefore, adequate protection through UV filters is still necessary and ensured.
Global Open Innovation network Collaboration with external partners is an integral component of our research and development activities. Through combining complementary expertise and leveraging synergies we are able to strengthen our collective capacity to inno-vate and actively shape the skin care of tomorrow. In 2019, around 300 dif-ferent research institutions, universities, start-ups, independent scientists and suppliers were part of Beiersdorf’s global collaboration network.
Since 2016, we have been gathering all Open Innovation activities under the “Pearlfinders – We Open Innovation” umbrella. Our Trusted Network platform is a central component of our Open Innovation strategy. The online network (https://trusted-pearlfinders.beiersdorf.com) based on trust, fairness, and partner-ship gives external partners from all around the world access to our confiden-tial scientific research topics and invites them to offer their own ideas and solutions. Other Beiersdorf Open Innovation formats include our in-house events such as the Supplier Fair, Incubation Labs, and the Formulation Academy, where selected innovation partners present ideas and trends.
Close to consumers and markets Beiersdorf is characterized by a global presence of research and development. The largest site in our research and development network is our skin research center in Hamburg, where we employed 683 (previous year: 673) researchers and developers as of December 31, 2019. Work here concentrates on new dis-coveries to provide even better support to the skin’s own metabolic processes. Based on their results, the scientists in product development combine the various active ingredients into new and highly effective products that meet consumers’ needs. As product quality, safety, and tolerability are the top priority for Beiersdorf, newly developed products are tested before market launch, both externally and at Beiersdorf’s own test center within the skin research facility. A total of 480 studies with 19,000 participants were con-ducted at the Beiersdorf Test Center during the reporting period. Moreover, 1,700 studies with more than 44,500 participants were conducted interna-tionally in 2019.
In addition to the large skin research center in Hamburg, Beiersdorf has regional laboratories in Brazil, China, India, Japan, Mexico, and the United States. Our international development sites enable us to respond to cultural, aesthetic, and climatic conditions, and to develop products specifically for local needs and preferences. Through this research, we also participate in global innovation de-velopment and have access to local experts. Our approximately 35 coworkers from the research department of our US-American sun care brand COPPERTONE, acquired in 2019, have been integrated into our research group. We are working closely together to leverage synergies and accelerate our sun care expertise.
Innovations* Innovation is one of our core competencies and thus a cornerstone of our business strategy. We have set ourselves the objective of continually intro-ducing new skin care products that focus completely on our consumers’ needs and wishes and generate added value. In saying that, as part of this objective our innovations are not only focussed on cosmetic formulas; the development of innovative, sustainable packaging is also a part of our intensive research and development work.
We believe our unique culture of innovation, which has always been a part of research and development at Beiersdorf, is what essentially drives our ability to innovate. It is at the heart of why we always have a well-stocked innovation pipeline.
The following product launches were among the most important innovations in the reporting year:
• The anti-aging skin care range NIVEA Hyaluron Cellular Filler + Elasticity & Reshape was one of the strongest market launches in the NIVEA Face segment. Its innovative formula is based on a combination of the cell-activating ingre-dients hyaluronic acid, collagen, and elastin (proofs in vitro). This formula leaves the skin moisturized for 24 hours and stimulates the skin’s own pro-duction of hyaluronic acid, collagen, and elastin (proofs in vitro), counter-acting the signs of skin aging. The skin is plumped up from the inside out, deep wrinkles are visibly reduced, and the skin is clearly firmer in appearance. Alongside day, night, and eye creams, the range also includes a re-densifying anti-spot treatment serum and a bi-phase oil elixir.
• The new face care and cleansing range NIVEA Naturally Good, which has been launched in France, among other countries, meets the trend toward more natural skin care products. The products support the skin’s regener-ation and make it look naturally beautiful and healthy. To ensure maximum product safety and stability, we use 1% to 2% synthetic ingredients in the product range.
* This section of the Combined Management Report is not subject to audit requirements.
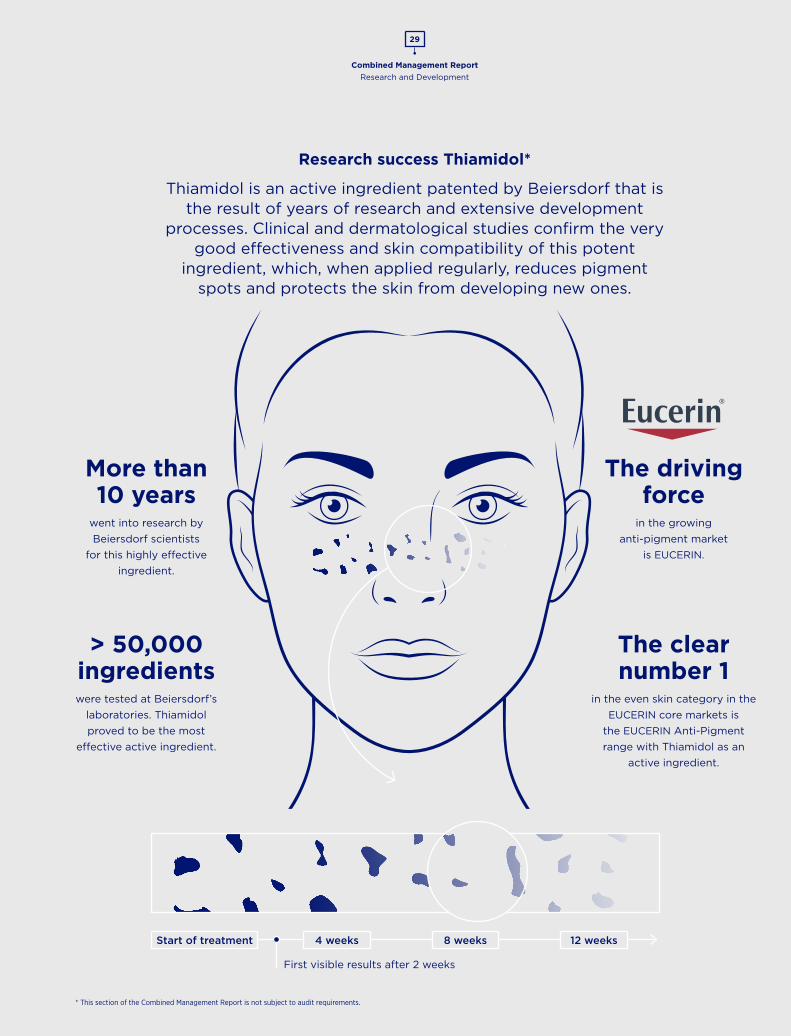
Combined Management Report
29
Research and Development
Research success Thiamidol*
Thiamidol is an active ingredient patented by Beiersdorf that is the result of years of research and extensive development
processes. Clinical and dermatological studies confirm the very good effectiveness and skin compatibility of this potent
ingredient, which, when applied regularly, reduces pigment spots and protects the skin from developing new ones.
More than 10 years
went into research by Beiersdorf scientists
for this highly effective ingredient.
The clear number 1
in the even skin category in the EUCERIN core markets is
the EUCERIN Anti-Pigment range with Thiamidol as an
active ingredient.
> 50,000 ingredients were tested at Beiersdorf’s
laboratories. Thiamidol proved to be the most
effective active ingredient.
The driving force
in the growing anti-pigment market
is EUCERIN.
First visible results after 2 weeks
4 weeksStart of treatment 8 weeks 12 weeks
* This section of the Combined Management Report is not subject to audit requirements.
Combined Management Report
30
• Both of the new NIVEA facial cleansing oils impress with an innovative tech-nology. Based on moisturizing oils, the formula creates a milky texture as soon as it comes into contact with water and is particularly effective and gentle in cleansing. Even waterproof makeup and mascara can be removed without cotton pads. In addition, the packaging consists of 25% recycled PET.
• In the past fiscal year, the nourishing NIVEA Beauty Elixir Deo was our largest product launch in the NIVEA deodorants segment. The alcohol-free formula with precious milk essence helps the skin retain moisture, recover from irri-tation, and protects against odor for 48 hours, and in the antiperspirant version also against sweat. NIVEA Beauty Elixir Deo is available as a deo-dorant and an antiperspirant.
• The NIVEA SUN Sensitive Immediate Protection range provides a high to very high sun protection factor thanks to its reliable UV filter, and is particu-larly suitable for sensitive skin, for the protection against sun allergy, and the prevention of skin irritations caused by the sun. The light, non-oily, water-proof formulas do not contain any fragrances and are enriched with natural aloe vera.
• Beiersdorf’s NIVEA MEN Sensitive All-in-One Balm is facial care for men with sensitive skin. Regardless of whether freshly shaved or sporting a three-day beard, the balm soothes the skin after shaving and reduces stubble itch.
• Following the successful international launch of EUCERIN Anti-Pigment in 2018, EUCERIN Sun Pigment Control LSF50+ was launched in 2019. The product is based on Thiamidol®, an anti-pigment ingredient developed and patented by Beiersdorf. When used regularly, this active ingredient gradually reduces hyperpigmentation of skin (pigment spots) and prevents its reap-pearance. In addition, the product offers highly effective protection against harmful UV rays, and also against high-energy visible light exposure which are main triggers for developing hyperpigmentation. With a range of products with the ingredient Thiamidol®, Beiersdorf is setting a new standard in dermo-cosmetics.
• In 2019, Beiersdorf launched EUCERIN AtopiControl Balm, a daily use moisturizing balm suitable for atopic dermatitis skin conditions. This quickly absorbent basic skin care provides intensive moisture, and strengthens the natural skin barrier, soothes irritated skin, and provides relief from itching. Thus, this product improves effectively the quality of life and sleep for babies, children, and adults and can also be used during acute flare-ups together with EUCERIN AtopiControl Acute Care Cream and EUCERIN Anti-Itching Spray. The balm contains ingredients such as soothing Licochalcone A (liquorice root extract), Ceramides, and shea butter.
• In 2019, we extended our successful EUCERIN Hyaluron-Filler range with the new EUCERIN Hyaluron-Filler Moisture Booster and the EUCERIN Hyaluron- Filler Vitamin C Booster and further strengthened our position in the dermo-cosmetic anti-aging segment. The new EUCERIN Hyaluron-Filler Moisture Booster counteracts the first signs of aging skin by plumping up the skin intensively with moisture. The light, quickly absorbent formula with just 11 ingredients combines highly concentrated hyaluronic acid with glycerin. Both ingredients work as moisture magnets, reducing the first appearance of wrinkles and leaving the skin looking healthy and fresh. EUCERIN Hyaluron- Filler Vitamin C Booster also reduces the first appearance of wrinkles from the inside out, leaving the skin looking fresher and smoother in only seven days. An innovative two-compartment dispensing system activates the vitamin C just before applying the formula, releasing its full effect as an antioxidant. In doing so, it neutralizes free radicals which accelerate skin aging while at the same time it stimulates the production of collagen in skin cells. The skin is strengthened and skin aging is counteracted.
• Following the success of HANSAPLAST/ELASTOPLAST/CURITAS Routine, the Healthcare business launched the new Spiral Heat plaster onto European markets. Its innovative technology is especially designed for targeted pain relief, yet offers maximum flexibility due to the 3D-flexible spiral heat cells. It has a special soft touch material for all-day wearing comfort and is ideal for back, neck, and shoulder pain.
• In 2019, in our luxury brand LA PRAIRIE, we launched our Platinum Rare Cellular Life Lotion – a complete essence-in-lotion, that helps to boost skin renewal from within by supporting three key detoxification processes at the cellular level. The Skin Caviar collection, too, was complemented by another highlight in 2019: Skin Caviar Eye Lift combines LA PRAIRIE‘s iconic caviar beads with an innovative gel-cream emulsion, and is the first eye-opening serum for the entire eye area, including brows.
• Under the brand name FLORENA FERMENTED SKINCARE, we launched for the first time a certified natural cosmetics range of products in the pilot markets of Italy and France that has fermentation at its heart. This new care line is our response to fulfilling the consumer’s desire for natural ingredi-ents and certified natural cosmetics. The vegan formulas contain at least 99% ingredients of natural origin. Furthermore, the cream jars are made of 100% recycled plastic and the outer packaging of at least 70% recycled paper.
• Tattooed skin has specialized care needs. That is why in 2019, Beiersdorf launched the first care system for tattooed skin under the brand SKIN STORIES. The anti-aging products with InkGuard-Technology® provide optimal care for tattoos and protect them from fading and smudging over the long term. The four products in the new care category cover the entire life cycle of tattoos – from initial care to daily care and sun protection.
Research and Development
Combined Management Report
31
Research and Development
As a result of our regional research and development work, in the reporting year we also launched the following regional innovations on the market:
• In the Asia-Pacific region, we launched NIVEA Luminous 630 SpotClear Booster Serum and NIVEA Luminous 630 SpotClear Oil Control Moisturizer SPF 50, two moisturizers that also counteract pigment spots on the skin. Another innovation in the region is the NIVEA Botanical Foam Facial Cleanser developed specially for the Chinese market, which contains various amino acids and herbal ingredients.
• In India, we have developed NIVEA Milk Delights, a range of innovative, soap-free cleansing products whose formula contains special milk proteins.
• In the United States, we introduced the NIVEA Deeply Moisturizing Body-Wash series, a new shower gel range. Its innovative formula combines cleansing and skin care in one product.
Strong patent portfolioOur innovative strength and competitiveness are demonstrated not least by our patents. As a skin research company, they hold particular relevance because they protect our innovative active ingredients, products, and technologies across the globe – subject to the regulatory framework in the respective coun-tries. In 2019, we filed 98 new patents worldwide. As of December 31, 2019, around 1,200 patent filings were in the ongoing grant procedure. At the end of the fiscal year, the entire patent portfolio comprised more than 2,700 patents.
tesa
Structural adhesivesIn 2019, R&D at tesa continued to focus on technologies for structural adhe-sives. In particular, this includes technologies for adhesive solutions with particularly high bonding strength and long-term resistance, which have so far only been possible with mechanical joining techniques such as screws, rivets, and welding. In collaboration with innovation leaders in the global automotive industry, tesa developed high-performance and durable joining solutions for automobile bodies and vehicle interiors, which also meet the high requirements for quality assurance and efficient processing steps. Another area of focus is structural bonding of various high-quality and heat-sensitive surfaces at room temperature. The main field of application for these products is the assembly of electronic devices, such as mobile phones. The first new technologies were successfully tested with selected innovation leaders.
The development of structural adhesives is carried out within tesa’s global Research and Development network with its locations in Germany, China, and North America, ensuring optimal collaboration with innovation leaders and customers. This development work was supported by the European Union via the European Regional Development Fund (ERDF).
Environmentally friendly adhesive solutions for industryWhile working on processes and products with particularly low environmental impact and efficient use of resources, tesa has developed sustainable adhesive solutions for sophisticated packaging, such as solutions to safeguard high- quality and heavy electronic devices during transport. The core offering includes adhesive tapes made from renewable raw materials as well as from recycled and biodegradable components.
Further advances in extrusion technologyIn 2019, tesa made further advances in extrusion technology, which avoids the use of solvents. Special adhesive masses can now be produced in a versatile and environmentally friendly manner with smaller production batch sizes. This technology opens up new fields of application in the global automotive, elec-tronics, and construction industries. Through this manufacturing process, high-quality adhesive layers can be produced without the need for solvents and without the drying and water treatment required during processing of adhesive dispersions.
Flame-resistant and flame-retardant adhesive tapesParticularly high safety standards apply to many applications in railways, interior fittings of aircraft, and increasingly also in battery-powered cars. Spe-cifically for these requirements, tesa developed components for flame-resistant and flame-retardant adhesive tapes, which even help extinguish flames. By combining new technologies and in collaboration with international research institutions, prototypes have been manufactured that are also particularly easy on the environment.
Mounting of sensors Sensor technology and sensors are a fast-growing field in which adhesive tapes also play an important role. Ever more powerful sensors are being produced at ever lower cost to gather data in all areas of life. The data is frequently pro-cessed and used via the internet. tesa has developed a whole array of double- sided adhesive tapes with new adhesive layers with which these sensors can be easily and reliably mounted to a wide range of surfaces, including human skin.
Specialist adhesive tapes for the construction industry tesa expanded its technology portfolio through the acquisition of Functional Coatings LLC in the United States in 2018. Of notable mention from this port-folio are specialist adhesive tapes, which are used in the insulation for modern building envelopes. In 2019, new technologies and prototypes in this area for the intelligent control of heat and moisture in modern building structures with a high proportion of wood were successfully developed. These solutions make an important contribution to sustainable building construction.
Combined Management Report
32
Sustainability
Sustainability*
Climate change is the most important challenge that we as a society are facing today, so sustainability was also a key priority for us during the past year. We have always been a company with a solid and well- balanced approach to environmental protection, social responsibility, and economic success. How ever, we want to further increase our efforts in this context. Sustainability is deeply rooted in our corporate culture and well implemented in our decision-making and business processes.
Detailed information on our commitment to sustainability is available in our Sus-tainability Report, which is published at www.beiersdorf.com/sustainability_review .
Consumer
Within our Consumer Business Segment, we updated our sustainability agenda in 2019. What used to be our “We care.” strategy with the three pillars “Products, Planet, People,” is now an integral part of our C.A.R.E.+ strategy and addresses sustainability truly holistically. Our new, up-to-date sustainability agenda defines seven focus areas where we as a company want to have a significant impact on our environment, our society and our consumers. As the urgency to act and to contribute as a business to drive change on a global scale has never been higher, we started to already activate our new agenda while it was in its development phase. We plan to set ambitious targets for all focus fields during the course of 2020 and will ensure the regular monitoring of our progress using environmental and social performance indicators.
During the implementation of our new sustainability agenda, we want to involve our key stakeholders – especially our employees, investors, suppliers, consumers, and non-governmental organizations (NGOs). In this way, we will not only maximize output, but also build trusting relationships and enhance our own understanding of the most relevant topics.
Looking back at 2019, we are proud not only to have successfully set up our new Sustainability Agenda, but also to have succeeded in achieving our ambitious commitments within the “We care.” strategy even one year earlier than planned.
ProductsOne target has been to continuously make our products more environmentally friendly. By 2020, our goal was to generate 50% of our global sales from prod-ucts with an improved environmental impact compared with the base year 2011. With a figure of 55% at the end of 2019, we have reached this target ahead of time. This was strongly driven by improvements in product formulas and sus-tainable packaging solutions. And with the “Plastic Pledge” announced in the first quarter of 2019, we have already made a new commitment to sustainable packaging: By 2025, we want 100% of our packaging to be recyclable, compost-able, or reusable, and at the same time we want to increase the use of recycled content in our plastic packaging in Europe to 25%. The new NIVEA Face Cleansing Oils launched in the reporting year are the first such products on the market: Their packaging consists of 25% recycled PET, saving over 12 metric tons of virgin plastic per year. Since spring 2019, we have also been participating with two NIVEA MEN aftershave products in the pilot phase of the zero-waste
shopping platform “Loop.” Created by the recycling company TerraCycle, the project aims to create a closed-loop material cycle and avoid single-use packaging.
With regard to product formulations, we also made good progress in the re-porting year and continued switching palm (kernel) oil-based raw materials to mass-balanced palm (kernel) oil derivatives: In 2019, we covered around 91% of our demand with mass-balanced palm (kernel) oil (previous year: 63%). Through close collaboration with our suppliers, we have also created further transparency in the supply chain for palm (kernel) oil-based raw materials: We managed to identify the exact origin of 92% of our purchase volume and have been making efforts to further improve transparency and sustainability along the supply chain for palm (kernel) oil derivatives. For example, we co-founded the Action for Sustainable Derivatives (ASD) initiative launched in 2019. As an acknowledgement of our efforts, the Carbon Disclosure Project (CDP) awarded us the top score of “A” in 2019 for our work in addressing deforestation.
Our commitment to the sustainable cultivation of raw materials used in our production was extended in 2019 to encompass shea butter, an ingredient used in some of our skin care products. We joined the Global Shea Alliance (GSA) and, together with our Swedish-Danish shea supplier AAK, launched a project with which we will support 10,000 women shea farmers over five years in Ghana and Burkina Faso. In December 2019, we also launched a first limited edition of “NIVEA VON HERZEN” – a product containing 100% pure and sustainably pro-duced shea butter.
In the reporting year, we also achieved further progress with regard to biode-gradable ingredients: Our rinse-off products such as shampoos and shower gels are now completely free of microplastics, and we have switched the affected formulas to biodegradable opacifiers. Also, for our leave-on products such as skin creams, we are working on the elimination of raw materials categorized as microplastics. Nylon, for example, which is used in some products to deliver a smooth skin feeling, will be replaced by the end of 2020. By increasing our usage of biodegradable polymers across our assortments, we continue to pursue our goal of improving the environmental impact of our product port-folio overall.
PlanetAs a globally operating and responsible company, our aim is to take all neces-sary measures to combat climate change and encourage a sparing and efficient use of resources. As already mentioned before, the situation we face globally is very challenging and we are highly committed to taking all necessary steps in driving the change. Saving water, avoiding waste, and reducing our energy consumption are essential parts of our commitment to sustainability. With our “We care.” strategy, we had set ourselves the target to reduce our energy-re-lated CO2 emissions per manufactured product by 70% by 2025 (base year 2014). We are heading in the right direction in this area and achieved 65% less CO2 emissions per product in the reporting year. We will continue to do even more in the future. The scheduled switch of all our sites to renewable electric-ity by 2020 was achieved early in the reporting year (previous year: 81%). We signed the climate pledge of the UN Global Compact and thus committed our-selves to even more ambitious climate targets that meet the requirements laid out by scientists to limit global warming to 1.5 degrees Celsius. These targets will be announced in the first quarter of 2020.
* This section of the Combined Management Report is not subject to audit requirements.
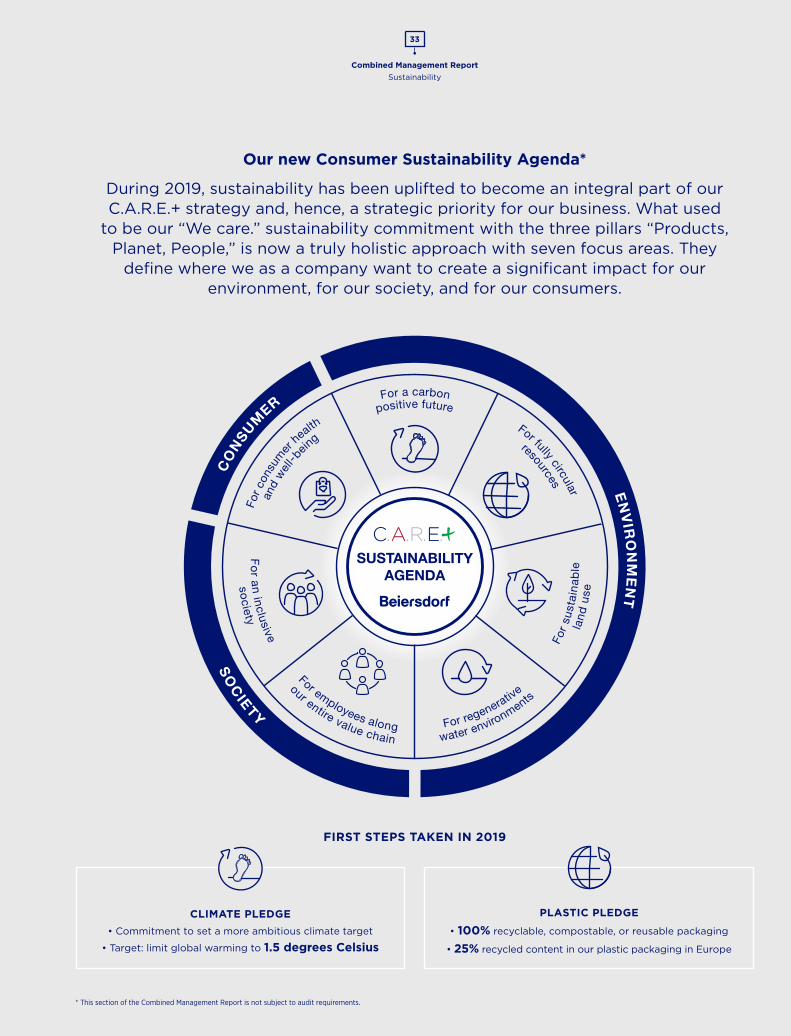
Combined Management Report
33
Sustainability
Our new Consumer Sustainability Agenda*
During 2019, sustainability has been uplifted to become an integral part of our C.A.R.E.+ strategy and, hence, a strategic priority for our business. What used
to be our “We care.” sustainability commitment with the three pillars “Products, Planet, People,” is now a truly holistic approach with seven focus areas. They
define where we as a company want to create a significant impact for our environment, for our society, and for our consumers.
FIRST STEPS TAKEN IN 2019
* This section of the Combined Management Report is not subject to audit requirements.
PLASTIC PLEDGE
• 100% recyclable, compostable, or reusable packaging
• 25% recycled content in our plastic packaging in Europe
CLIMATE PLEDGE • Commitment to set a more ambitious climate target
• Target: limit global warming to 1.5 degrees Celsius
SOCIETY

Combined Management Report
34
Sustainability
PeopleThe well-being of our employees is a high priority for us and we are convinced that a healthy and attractive working environment is fundamental to the success of our business. We therefore offer a variety of health and safety ini-tiatives for our employees. We are also committed to fair working conditions and to a transparent, respectful cooperation with all suppliers and partners.
Our “Zero Accidents” program launched in 2015, with which we aim to reduce potential risks in the workplace, continued successfully in the reporting year: Beiersdorf further reduced the accident rate at its production sites to 1.2% (previous year: 1.9%).
We also actively work outside our company boundaries to sustainably improve the situation of our fellow citizens. Pursuant to our “People” commitment, we aim to reach and improve the lives of one million families by 2020. In the re-porting year, we reached 1,068,958 families, considerably exceeding this target ahead of time, just like our “Products” targets described above.
New Sustainability Agenda from 2020 onwardsWe are convinced that acting responsibly and sustainably is an essential part of ensuring that our company is fit for the future. Our commitment to sustain-ability is therefore firmly embedded in our new C.A.R.E.+ company strategy, which was established in 2019.
We took the start of C.A.R.E.+ as an opportunity to rework our sustainability strategy during the reporting year. As mentioned above, our new Sustainability Agenda will go beyond the “Products, Planet, People” approach and is not only more up-to-date and holistic but also more ambitious: From 2020 onwards, we will work on seven focus areas which are aligned with the UN Sustainable Development Goals (SDGs):
• Carbon-positive future• Fully circular resources• Sustainable land use• Regenerative water environments• Employees along our entire value chain• Inclusive society • Consumer health and well-being
We are in the process of setting ourselves ambitious targets for each of these focus areas. They will define how we aim to minimize the negative impacts of our business activities and how we take effective, positive action for the envi-ronment, for society, and for our consumers.
More details on our new Sustainability Agenda and the projects we imple-mented in the reporting year can be found in our Sustainability Report or at www.beiersdorf.com/sustainability .
tesa
ResponsibilityAt tesa, growth and economic success are inextricably linked with corporate responsibility. Climate protection, responsible use of resources, and occupa-tional health and safety are therefore firmly anchored in the business processes. Moreover, civic engagement is an active part of our corporate culture.
Climate and environmental protectiontesa’s primary environmental impact is the energy consumption at its produc-tion sites. Therefore, tesa places particular emphasis on climate protection and reducing CO2 emissions. Environmental management systems are used at all sites with a significant environmental impact in order to control environ-mental performance effectively. Seven production sites and tesa’s global head-quarters have an ISO 14001-certified environmental management system. Global headquarters and the sites with the highest CO2 emissions (Hamburg and Offenburg) additionally have an ISO 50001 certified energy management sys-tem. The energy management systems are the backbone of further increases in energy efficiency at the sites.
With its environmental program, tesa has been setting Group-wide, ambitious targets to improve its ecological footprint since 2001. The current target period applies to the years 2016 to 2020. Over this period, specific CO2 emissions per metric ton of end product (location-based) are to be cut by a further 10% com-pared with the 2015 reference year. Strategic approaches are the use of energy- and resource-saving technologies, such as efficient generation of the com-pany’s own energy through combined heat and power plants as well as the purchase of electricity from renewable sources. On the reporting date, the CO2 emissions per metric ton of end product were 9.8% lower than the reference year 2015 (location-based method).
With its waste and raw materials management, tesa aims to minimize losses of the raw materials used in production, to use materials efficiently, and to recycle them whenever possible. Safe waste and hazardous waste containing solvents are almost fully recycled. By 2020, tesa aims to cut the specific waste volume per metric ton of end product by a further two percentage points in comparison with the 2015 reference year. As of the reporting date, tesa was on target Group-wide.
Occupational health and safetyTo avoid work-related accidents and health hazards, prevention and raising awareness among staff are prioritized. The strategic aim is to reduce the num-ber of accidents to zero.
Health and safety management is focused on production sites as these have a higher risk of accidents and health impairments than office locations. tesa em-ploys its own safety specialists at all ISO 14001-certified sites. They are familiar both with tesa’s global health and occupational safety guidelines as well as with legal requirements and conditions.
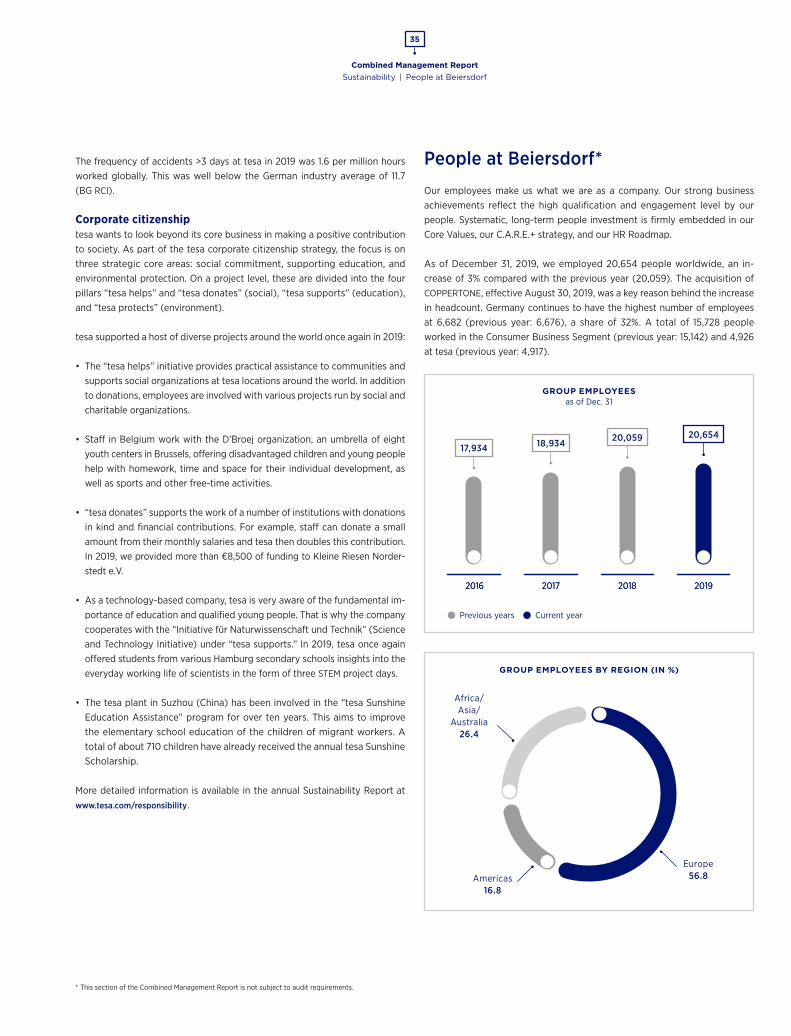
Combined Management Report
35
Sustainability | People at Beiersdorf
* This section of the Combined Management Report is not subject to audit requirements.
The frequency of accidents >3 days at tesa in 2019 was 1.6 per million hours worked globally. This was well below the German industry average of 11.7 (BG RCI).
Corporate citizenshiptesa wants to look beyond its core business in making a positive contribution to society. As part of the tesa corporate citizenship strategy, the focus is on three strategic core areas: social commitment, supporting education, and environmental protection. On a project level, these are divided into the four pillars “tesa helps” and “tesa donates” (social), “tesa supports” (education), and “tesa protects” (environment).
tesa supported a host of diverse projects around the world once again in 2019:
• The “tesa helps” initiative provides practical assistance to communities and supports social organizations at tesa locations around the world. In addition to donations, employees are involved with various projects run by social and charitable organizations.
• Staff in Belgium work with the D’Broej organization, an umbrella of eight youth centers in Brussels, offering disadvantaged children and young people help with homework, time and space for their individual development, as well as sports and other free-time activities.
• “tesa donates” supports the work of a number of institutions with donations in kind and financial contributions. For example, staff can donate a small amount from their monthly salaries and tesa then doubles this contribution. In 2019, we provided more than €8,500 of funding to Kleine Riesen Norder-stedt e.V.
• As a technology-based company, tesa is very aware of the fundamental im-portance of education and qualified young people. That is why the company cooperates with the “Initiative für Naturwissenschaft und Technik” (Science and Technology Initiative) under “tesa supports.” In 2019, tesa once again offered students from various Hamburg secondary schools insights into the everyday working life of scientists in the form of three STEM project days.
• The tesa plant in Suzhou (China) has been involved in the “tesa Sunshine Education Assistance” program for over ten years. This aims to improve the elementary school education of the children of migrant workers. A total of about 710 children have already received the annual tesa Sunshine Scholarship.
More detailed information is available in the annual Sustainability Report at www.tesa.com/responsibility .
People at Beiersdorf*
Our employees make us what we are as a company. Our strong business achievements reflect the high qualification and engagement level by our people. Systematic, long-term people investment is firmly embedded in our Core Values, our C.A.R.E.+ strategy, and our HR Roadmap.
As of December 31, 2019, we employed 20,654 people worldwide, an in-crease of 3% compared with the previous year (20,059). The acquisition of COPPERTONE, effective August 30, 2019, was a key reason behind the increase in headcount. Germany continues to have the highest number of employees at 6,682 (previous year: 6,676), a share of 32%. A total of 15,728 people worked in the Consumer Business Segment (previous year: 15,142) and 4,926 at tesa (previous year: 4,917).
GROUP EMPLOYEESas of Dec. 31
2016 2017 2018 2019
Previous years Current year
2016 2017 2018 2019
20,65417,934 18,934 20,059
GROUP EMPLOYEES BY REGION (IN %)
Europe56.8
Africa/ Asia/
Australia26.4
Americas16.8
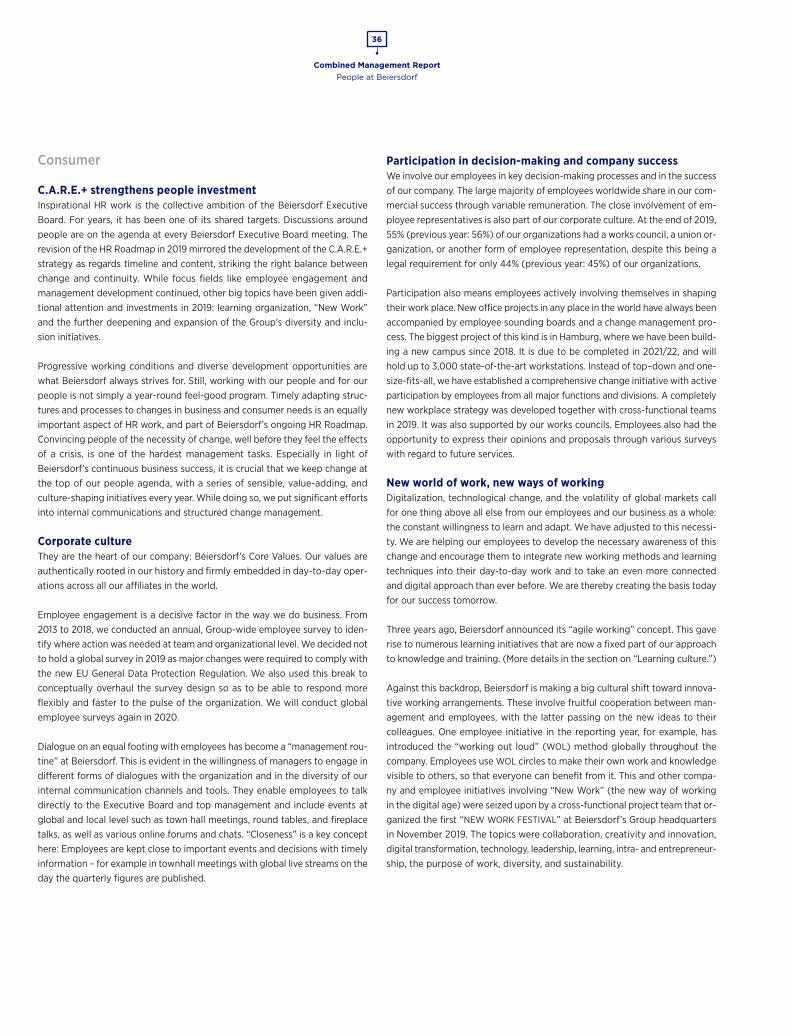
Combined Management Report
36
People at Beiersdorf
Consumer
C.A.R.E.+ strengthens people investmentInspirational HR work is the collective ambition of the Beiersdorf Executive Board. For years, it has been one of its shared targets. Discussions around people are on the agenda at every Beiersdorf Executive Board meeting. The revision of the HR Roadmap in 2019 mirrored the development of the C.A.R.E.+ strategy as regards timeline and content, striking the right balance between change and continuity. While focus fields like employee engagement and management development continued, other big topics have been given addi-tional attention and investments in 2019: learning organization, “New Work” and the further deepening and expansion of the Group’s diversity and inclu-sion initiatives.
Progressive working conditions and diverse development opportunities are what Beiersdorf always strives for. Still, working with our people and for our people is not simply a year-round feel-good program. Timely adapting struc-tures and processes to changes in business and consumer needs is an equally important aspect of HR work, and part of Beiersdorf’s ongoing HR Roadmap. Convincing people of the necessity of change, well before they feel the effects of a crisis, is one of the hardest management tasks. Especially in light of Beiersdorf’s continuous business success, it is crucial that we keep change at the top of our people agenda, with a series of sensible, value-adding, and culture-shaping initiatives every year. While doing so, we put significant efforts into internal communications and structured change management.
Corporate cultureThey are the heart of our company: Beiersdorf’s Core Values. Our values are authentically rooted in our history and firmly embedded in day-to-day oper-ations across all our affiliates in the world.
Employee engagement is a decisive factor in the way we do business. From 2013 to 2018, we conducted an annual, Group-wide employee survey to iden-tify where action was needed at team and organizational level. We decided not to hold a global survey in 2019 as major changes were required to comply with the new EU General Data Protection Regulation. We also used this break to conceptually overhaul the survey design so as to be able to respond more flexibly and faster to the pulse of the organization. We will conduct global employee surveys again in 2020.
Dialogue on an equal footing with employees has become a “management rou-tine” at Beiersdorf. This is evident in the willingness of managers to engage in different forms of dialogues with the organization and in the diversity of our internal communication channels and tools. They enable employees to talk directly to the Executive Board and top management and include events at global and local level such as town hall meetings, round tables, and fireplace talks, as well as various online forums and chats. “Closeness” is a key concept here: Employees are kept close to important events and decisions with timely information – for example in townhall meetings with global live streams on the day the quarterly figures are published.
Participation in decision-making and company successWe involve our employees in key decision-making processes and in the success of our company. The large majority of employees worldwide share in our com-mercial success through variable remuneration. The close involvement of em-ployee representatives is also part of our corporate culture. At the end of 2019, 55% (previous year: 56%) of our organizations had a works council, a union or-ganization, or another form of employee representation, despite this being a legal requirement for only 44% (previous year: 45%) of our organizations.
Participation also means employees actively involving themselves in shaping their work place. New office projects in any place in the world have always been accompanied by employee sounding boards and a change management pro-cess. The biggest project of this kind is in Hamburg, where we have been build-ing a new campus since 2018. It is due to be completed in 2021/22, and will hold up to 3,000 state-of-the-art workstations. Instead of top–down and one-size-fits-all, we have established a comprehensive change initiative with active participation by employees from all major functions and divisions. A completely new workplace strategy was developed together with cross-functional teams in 2019. It was also supported by our works councils. Employees also had the opportunity to express their opinions and proposals through various surveys with regard to future services.
New world of work, new ways of workingDigitalization, technological change, and the volatility of global markets call for one thing above all else from our employees and our business as a whole: the constant willingness to learn and adapt. We have adjusted to this necessi-ty. We are helping our employees to develop the necessary awareness of this change and encourage them to integrate new working methods and learning techniques into their day-to-day work and to take an even more connected and digital approach than ever before. We are thereby creating the basis today for our success tomorrow.
Three years ago, Beiersdorf announced its “agile working” concept. This gave rise to numerous learning initiatives that are now a fixed part of our approach to knowledge and training. (More details in the section on “Learning culture.”)
Against this backdrop, Beiersdorf is making a big cultural shift toward innova-tive working arrangements. These involve fruitful cooperation between man-agement and employees, with the latter passing on the new ideas to their colleagues. One employee initiative in the reporting year, for example, has introduced the “working out loud” (WOL) method globally throughout the company. Employees use WOL circles to make their own work and knowledge visible to others, so that everyone can benefit from it. This and other compa-ny and employee initiatives involving “New Work” (the new way of working in the digital age) were seized upon by a cross-functional project team that or-ganized the first “NEW WORK FESTIVAL” at Beiersdorf’s Group headquarters in November 2019. The topics were collaboration, creativity and innovation, digital transformation, technology, leadership, learning, intra- and entrepreneur-ship, the purpose of work, diversity, and sustainability.
Combined Management Report
37
People at Beiersdorf
New Work is not only creating a suitable workspace and using technology. Beiersdorf is also committed to the health and physical and mental well-being of its employees. The company’s own health management has been enhanced from year to year to better meet the needs of employees in a fast-changing world of work. Our “GOOD FOR ME” program seeks to maintain the health and performance of our employees on a long-term and sustainable basis as well as encourage them to take the initiative in staying healthy. Approximately 97% of our organizations worldwide offer health promotion measures (previous year: 92%). Since 2014, we have been offering skin screenings at our Group head-quarters as a special service for employees.
PART-TIME EMPLOYEES BY REGION (IN %)
2018 2019
Europe 11 12
Americas 1 0
Africa/Asia/Australia 2 1
7 7
Diversity and InclusionWe cherish diversity and inclusion not because we hope it helps our business. It is great if it does. As a company, however, we simply believe in diversity and inclusion, in their positivity and creative power.
Diversity and Inclusion is a global management process at Beiersdorf and a firm-ly established part in the Executive Board’s agenda. Measures to promote equal opportunities and diversity at Beiersdorf are designed and implemented by a cross-functional Diversity team, whose members all act as volunteers in addi-tion to their regular work. Since its launch, this team has grown into a global network with many ambassadors in the affiliates. In addition, the Diversity Committee of the Supervisory Board also regularly reviews and support various key initiatives.
As a globally operating company, we have a highly international workforce. Employees from 108 countries worked at Beiersdorf as of the end of the re-porting year (previous year: 100). At the Hamburg headquarters, the proportion of international employees was 17.4% (previous year: 17.1%). Of our managers in the top three management groups, 40% have lived and worked outside of their home countries for at least three years (previous year: 39%).
Alongside international and cultural diversity, gender – especially equal career opportunities for women and men – has been another focus area for years. To make it even more effective, in 2019 we further expanded our “enCOURAGE” initiative as a framework for all our gender diversity activities. Its measures take into account the different needs employees have at different stages of their professional life. Existing activities under this initiative include:
• “move forward!” – a mentoring program for talented women who want to begin or develop a management career.
• “Peer Coaching Circles” – an extra program of “move forward!” with the aim of learning and growing together.
• “Women in Leadership” – a network now reaching across hierarchy levels, which organized the third “Women in Leadership Convention” in 2019. The convention is more than just an annual networking event: Female role models and their real-life stories inspire a much larger target group to take on or further develop their leadership roles while at the same time supporting the career of their female colleagues.
We offer progressive HR policies and a diverse range of flexible-working options to women and men. Some 67% of our organizations (previous year: 58%) of-fer their employees flex time, 67% (previous year: 65%) offer mobile working or the opportunity to work from home, 50% (previous year: 48%) part-time working, and 28% (previous year: 21%) the opportunity to take sabbaticals. With its 108 places and 29 teachers, our company daycare facility in Hamburg is one of the largest of its kind in Germany.
Alongside standard part-time working, job sharing (where two employees share a position in a “job tandem”) has long been part of our HR practice, also at management level. At the end of the fiscal year, there were 22 job-sharing tandems at Beiersdorf in Germany. Thirteen tandems performed management roles on a part-time basis.
Since the introduction of the German law on the equal participation of women and men in leadership positions, Beiersdorf AG has been legally required to set targets for the proportion of women on the Executive Board and at the first two management levels, as well as deadlines for achieving them. The law requires that the Supervisory Board of Beiersdorf AG be comprised of at least 30% women and 30% men. With a current figure of 42% female Supervisory Board members (five of the twelve Supervisory Board members are women), this target has been well exceeded.
The current targets and deadlines for the proportion of women on the Executive Board and at the top two management levels are as follows:
• Executive Board: At least 10% women by June 30, 2022 (figure as of the end of December 2019: 13%, previous year: 14%)
• First management level: At least 35% women by June 30, 2022 (figure as of the end of December 2019: 31%, previous year: 24%)
• Second management level: At least 50% women by June 30, 2022 (figure as of the end of December 2019: 48%, previous year: 48%)
In 2018, Beiersdorf set a global target for the proportion of female leaders in the three top management groups (MG 1 – 3). This was in addition to the statutory
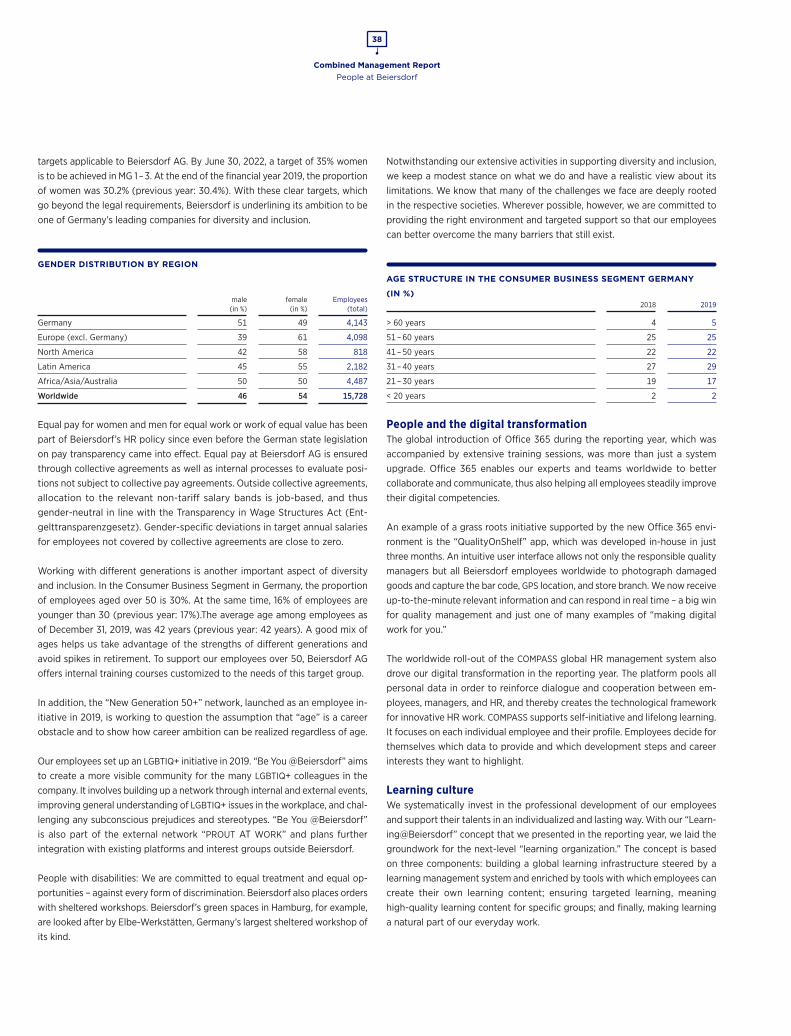
Combined Management Report
38
People at Beiersdorf
targets applicable to Beiersdorf AG. By June 30, 2022, a target of 35% women is to be achieved in MG 1 – 3. At the end of the financial year 2019, the proportion of women was 30.2% (previous year: 30.4%). With these clear targets, which go beyond the legal requirements, Beiersdorf is underlining its ambition to be one of Germany’s leading companies for diversity and inclusion.
GENDER DISTRIBUTION BY REGION
male
(in %)female
(in %)Employees
(total)
Germany 51 49 4,143
Europe (excl. Germany) 39 61 4,098
North America 42 58 818
Latin America 45 55 2,182
Africa/Asia/Australia 50 50 4,487
Worldwide 46 54 15,728
Equal pay for women and men for equal work or work of equal value has been part of Beiersdorf’s HR policy since even before the German state legislation on pay transparency came into effect. Equal pay at Beiersdorf AG is ensured through collective agreements as well as internal processes to evaluate posi-tions not subject to collective pay agreements. Outside collective agreements, allocation to the relevant non-tariff salary bands is job-based, and thus gender-neutral in line with the Transparency in Wage Structures Act (Ent-gelttransparenzgesetz). Gender-specific deviations in target annual salaries for employees not covered by collective agreements are close to zero.
Working with different generations is another important aspect of diversity and inclusion. In the Consumer Business Segment in Germany, the proportion of employees aged over 50 is 30%. At the same time, 16% of employees are younger than 30 (previous year: 17%).The average age among employees as of December 31, 2019, was 42 years (previous year: 42 years). A good mix of ages helps us take advantage of the strengths of different generations and avoid spikes in retirement. To support our employees over 50, Beiersdorf AG offers internal training courses customized to the needs of this target group.
In addition, the “New Generation 50+” network, launched as an employee in-itiative in 2019, is working to question the assumption that “age” is a career obstacle and to show how career ambition can be realized regardless of age.
Our employees set up an LGBTIQ+ initiative in 2019. “Be You @Beiersdorf” aims to create a more visible community for the many LGBTIQ+ colleagues in the company. It involves building up a network through internal and external events, improving general understanding of LGBTIQ+ issues in the workplace, and chal-lenging any subconscious prejudices and stereotypes. “Be You @Beiersdorf” is also part of the external network “PROUT AT WORK” and plans further integration with existing platforms and interest groups outside Beiersdorf.
People with disabilities: We are committed to equal treatment and equal op-portunities – against every form of discrimination. Beiersdorf also places orders with sheltered workshops. Beiersdorf’s green spaces in Hamburg, for example, are looked after by Elbe-Werkstätten, Germany’s largest sheltered workshop of its kind.
Notwithstanding our extensive activities in supporting diversity and inclusion, we keep a modest stance on what we do and have a realistic view about its limitations. We know that many of the challenges we face are deeply rooted in the respective societies. Wherever possible, however, we are committed to providing the right environment and targeted support so that our employees can better overcome the many barriers that still exist.
AGE STRUCTURE IN THE CONSUMER BUSINESS SEGMENT GERMANY
(IN %) 2018 2019
> 60 years 4 5
51 – 60 years 25 25
41 – 50 years 22 22
31 – 40 years 27 29
21 – 30 years 19 17
< 20 years 2 2
People and the digital transformationThe global introduction of Office 365 during the reporting year, which was accompanied by extensive training sessions, was more than just a system upgrade. Office 365 enables our experts and teams worldwide to better collaborate and communicate, thus also helping all employees steadily improve their digital competencies.
An example of a grass roots initiative supported by the new Office 365 envi-ronment is the “QualityOnShelf” app, which was developed in-house in just three months. An intuitive user interface allows not only the responsible quality managers but all Beiersdorf employees worldwide to photograph damaged goods and capture the bar code, GPS location, and store branch. We now receive up-to-the-minute relevant information and can respond in real time – a big win for quality management and just one of many examples of “making digital work for you.”
The worldwide roll-out of the COMPASS global HR management system also drove our digital transformation in the reporting year. The platform pools all personal data in order to reinforce dialogue and cooperation between em-ployees, managers, and HR, and thereby creates the technological framework for innovative HR work. COMPASS supports self-initiative and lifelong learning. It focuses on each individual employee and their profile. Employees decide for themselves which data to provide and which development steps and career interests they want to highlight.
Learning cultureWe systematically invest in the professional development of our employees and support their talents in an individualized and lasting way. With our “Learn-ing@Beiersdorf” concept that we presented in the reporting year, we laid the groundwork for the next-level “learning organization.” The concept is based on three components: building a global learning infrastructure steered by a learning management system and enriched by tools with which employees can create their own learning content; ensuring targeted learning, meaning high-quality learning content for specific groups; and finally, making learning a natural part of our everyday work.

Combined Management Report
39
People at Beiersdorf
Learning organization*
We invest systematically in the professional development of our employees and promote their talents individually and sustainably. In 2019, we created the online learning platform “COMPASS Learning”
as a global foundation for learning content.
EXTENSIVE E-LEARNING OFFERING
We have
250e-learning courses on offer,
and the number will increase.
IN USE WORLDWIDE
COMPASS Learning is already in use in nearly all of
our more than
170affiliates.
CROSS-FUNCTIONAL LEARNING
>30%of the courses offered are used
across functions.
TRAINING SESSIONS COMPLETED
Around the world, nearly 4,700 Beiersdorf employees completed
~13,500training sessions via COMPASS.
* This section of the Combined Management Report is not subject to audit requirements.
Combined Management Report
40
People at Beiersdorf
The “COMPASS Learning” online platform created in 2019 is the global basis for learning content and is used in almost all of our more than 170 affiliates. Globally, almost 4,700 Beiersdorf employees completed approximately 13,500 training sessions using COMPASS during the reporting year. We currently also have 250 e-learning offerings, and the numbers will further increase. What is equally encouraging: Many of our employees have shown strong interest in learning content outside their own field of expertise. Over 30% of courses are being used cross-functionally. Of the approximately 560 participants in the 15 R&D-related e-learning programs, for example, 150 worked on other fields.
In Germany, Beiersdorf also runs an extensive, free-of-charge training program for all employees outside their working time. In the reporting year, over 242 employees took part in 27 courses on personal skills, methods and techniques, and professional competencies.
Management development We are all managers, starting with managing ourselves, then projects, or our teams. Thus, development is always a joint responsibility at Beiersdorf.
We aim to fill the majority of management positions with talented people from within our own ranks. To make this possible, we systematically prepare our em-ployees for their new roles. In 2019, 100% of positions at the first management level (previous year: 75%, Roadmap 2020 target: 75%) and 83% at the second management level (previous year: 80%, Roadmap 2020 target: 90%) were awarded to internal candidates.
Beiersdorf uses a multitude of different methods in identifying new talents and supporting their long-term development. The quality of this long-term work was recognized by trendence, which awarded Beiersdorf AG the top ranking as the most attractive employer for young professionals in the German FMCG sector.
tesa
The training and commitment of its staff make a major contribution to tesa’s business success, quality, and sustainability. Being an attractive employer is therefore a vital prerequisite for the company’s ongoing positive performance. As one of the world’s technology leaders in the field of technical adhesive tapes and adhesive system solutions, tesa relies on the recruitment and long-term retention of highly qualified staff.
Personnel developmentIn 2019, tesa once again invested in advanced training and further attractive development opportunities for its staff.
2019 marked the launch of the new career path model “X perience” at all loca-tions across the globe. The model’s aim is to create a common awareness of worthwhile development and career pathways for employees across the entire company and to motivate them to consider not only international or function-al but also cross-functional job rotation opportunities in their individual career planning. As one of the first initiatives, tesa promoted this concept through an X-Change Day, where various departments showcased their job opportunities to interested staff members.
Leadership cultureManagers’ ability to offer employees a motivating work environment and en-courage them to express their talents is key to tesa’s business success and its attractiveness as an employer. In 2019, tesa therefore further expanded and broadened the international scope of the leadership program. The Essential Leadership Training is aimed at new managers at tesa and is now offered across the globe. The aim is to give all managers worldwide the same understanding of leadership. The Advanced Leadership Training is available for managers who have held management responsibility for a longer period of time. It gives managers the opportunity to tackle particularly difficult leadership challenges and develop new solutions under the guidance of a trainer. In 2019, tesa also began to design a new Management Development Program (MDP) that helps leaders and managers to further develop their competencies.
Knowledge transfertesa is making increasing use of e-learning formats for knowledge transfer. These learning methods open up opportunities for employees to acquire new knowledge anytime and anywhere, thus promoting the general trend toward more flexibility in the workplace. Current offerings include e-learning on top-ics such as compliance, occupational safety, research and development, and the tesa Supply Network. Following the successful test in four regions in 2019, employees will soon be able to access all professional development offerings at tesa at any time via a digital learning hub.
Attractive working environmentAlongside leadership, development opportunities, and performance-related pay, factors such as occupational health and safety are increasingly influencing employee retention and the company’s attractiveness as an employer. In terms of occupational health and safety, tesa places emphasis on prevention. Invest-ments in technical and occupational health and safety measures as well as reg-ular training, along with a global campaign to raise awareness, meant that the rate of work-related accidents was again considerably below the industry average in 2019. The corporate health management scheme “It’s for you” and the “tesa sport club” took a new approach in 2019 with a wide range of courses. From health check-ups to back-strengthening training programs and physio-therapy, employees can take advantage of a broad interdisciplinary offering.
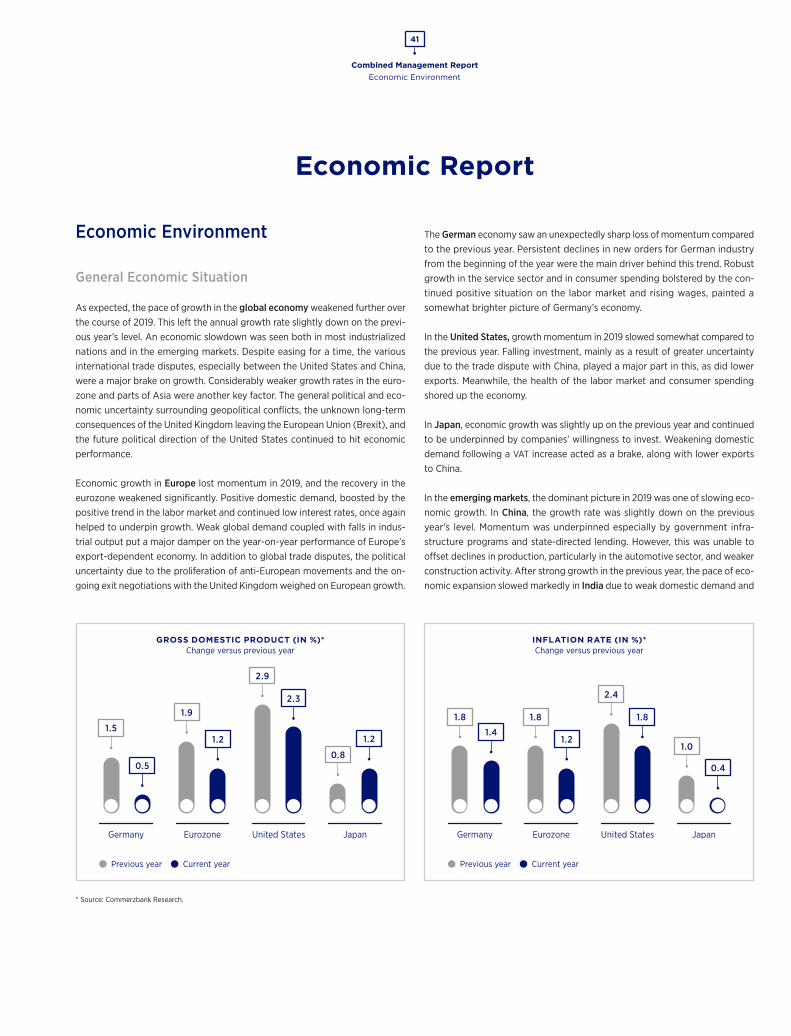
Combined Management Report
41
Economic Environment
Economic Report
Economic Environment
General Economic Situation
As expected, the pace of growth in the global economy weakened further over the course of 2019. This left the annual growth rate slightly down on the previ-ous year’s level. An economic slowdown was seen both in most industrialized nations and in the emerging markets. Despite easing for a time, the various international trade disputes, especially between the United States and China, were a major brake on growth. Considerably weaker growth rates in the euro-zone and parts of Asia were another key factor. The general political and eco-nomic uncertainty surrounding geopolitical conflicts, the unknown long-term consequences of the United Kingdom leaving the European Union (Brexit), and the future political direction of the United States continued to hit economic performance.
Economic growth in Europe lost momentum in 2019, and the recovery in the eurozone weakened significantly. Positive domestic demand, boosted by the positive trend in the labor market and continued low interest rates, once again helped to underpin growth. Weak global demand coupled with falls in indus-trial output put a major damper on the year-on-year performance of Europe’s export-dependent economy. In addition to global trade disputes, the political uncertainty due to the proliferation of anti-European movements and the on-going exit negotiations with the United Kingdom weighed on European growth.
The German economy saw an unexpectedly sharp loss of momentum compared to the previous year. Persistent declines in new orders for German industry from the beginning of the year were the main driver behind this trend. Robust growth in the service sector and in consumer spending bolstered by the con-tinued positive situation on the labor market and rising wages, painted a somewhat brighter picture of Germany’s economy.
In the United States, growth momentum in 2019 slowed somewhat compared to the previous year. Falling investment, mainly as a result of greater uncertainty due to the trade dispute with China, played a major part in this, as did lower exports. Meanwhile, the health of the labor market and consumer spending shored up the economy.
In Japan, economic growth was slightly up on the previous year and continued to be underpinned by companies’ willingness to invest. Weakening domestic demand following a VAT increase acted as a brake, along with lower exports to China.
In the emerging markets, the dominant picture in 2019 was one of slowing eco-nomic growth. In China, the growth rate was slightly down on the previous year’s level. Momentum was underpinned especially by government infra-structure programs and state-directed lending. However, this was unable to offset declines in production, particularly in the automotive sector, and weaker construction activity. After strong growth in the previous year, the pace of eco-nomic expansion slowed markedly in India due to weak domestic demand and
* Source: Commerzbank Research.
GROSS DOMESTIC PRODUCT (IN %)*Change versus previous year
INFLATION RATE (IN %)*Change versus previous year
Germany GermanyEurozone EurozoneUnited States United StatesJapan Japan
Previous year Current year Previous year Current year
0.4
1.4
1.8
1.2
1.8 1.8
2.4
1.01.2
0.5
1.51.2
1.92.3
2.9
0.8
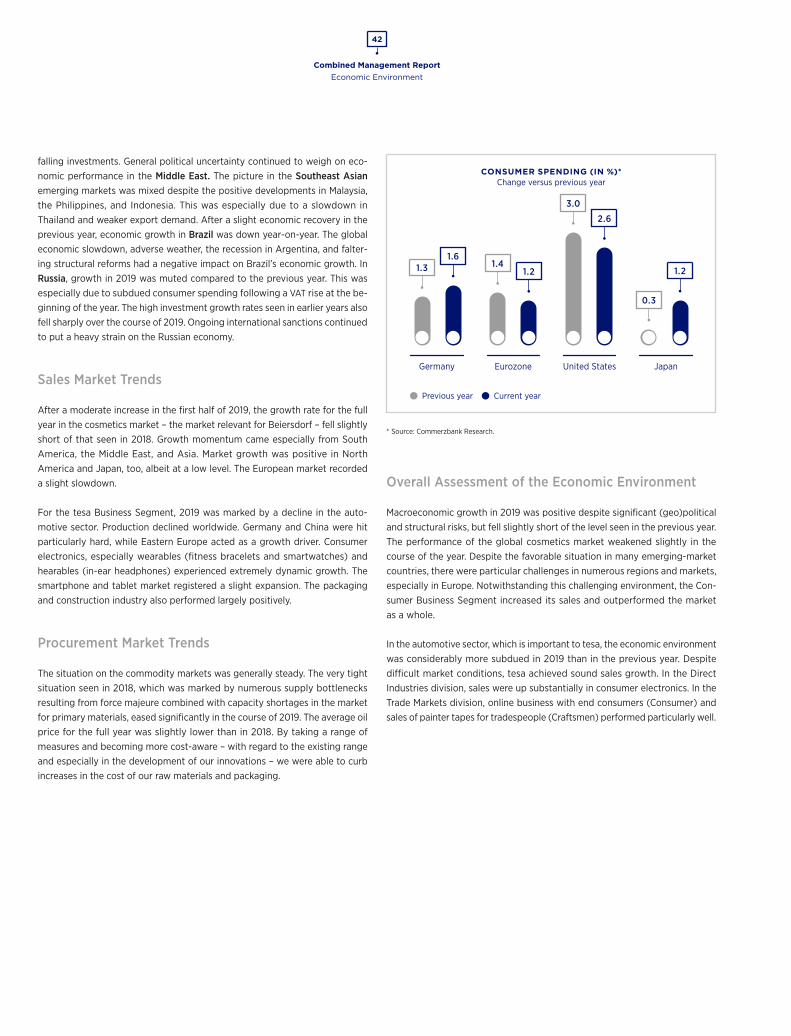
Combined Management Report
42
Economic Environment
falling investments. General political uncertainty continued to weigh on eco-nomic performance in the Middle East. The picture in the Southeast Asian emerging markets was mixed despite the positive developments in Malaysia, the Philippines, and Indonesia. This was especially due to a slowdown in Thailand and weaker export demand. After a slight economic recovery in the previous year, economic growth in Brazil was down year-on-year. The global economic slowdown, adverse weather, the recession in Argentina, and falter-ing structural reforms had a negative impact on Brazil’s economic growth. In Russia, growth in 2019 was muted compared to the previous year. This was especially due to subdued consumer spending following a VAT rise at the be-ginning of the year. The high investment growth rates seen in earlier years also fell sharply over the course of 2019. Ongoing international sanctions continued to put a heavy strain on the Russian economy.
Sales Market Trends
After a moderate increase in the first half of 2019, the growth rate for the full year in the cosmetics market – the market relevant for Beiersdorf – fell slightly short of that seen in 2018. Growth momentum came especially from South America, the Middle East, and Asia. Market growth was positive in North America and Japan, too, albeit at a low level. The European market recorded a slight slowdown.
For the tesa Business Segment, 2019 was marked by a decline in the auto-motive sector. Production declined worldwide. Germany and China were hit particularly hard, while Eastern Europe acted as a growth driver. Consumer electronics, especially wearables (fitness bracelets and smartwatches) and hearables (in-ear headphones) experienced extremely dynamic growth. The smartphone and tablet market registered a slight expansion. The packaging and construction industry also performed largely positively.
Procurement Market Trends
The situation on the commodity markets was generally steady. The very tight situation seen in 2018, which was marked by numerous supply bottlenecks resulting from force majeure combined with capacity shortages in the market for primary materials, eased significantly in the course of 2019. The average oil price for the full year was slightly lower than in 2018. By taking a range of measures and becoming more cost-aware – with regard to the existing range and especially in the development of our innovations – we were able to curb increases in the cost of our raw materials and packaging.
Overall Assessment of the Economic Environment
Macroeconomic growth in 2019 was positive despite significant (geo)political and structural risks, but fell slightly short of the level seen in the previous year. The performance of the global cosmetics market weakened slightly in the course of the year. Despite the favorable situation in many emerging-market countries, there were particular challenges in numerous regions and markets, especially in Europe. Notwithstanding this challenging environment, the Con-sumer Business Segment increased its sales and outperformed the market as a whole.
In the automotive sector, which is important to tesa, the economic environment was considerably more subdued in 2019 than in the previous year. Despite difficult market conditions, tesa achieved sound sales growth. In the Direct Industries division, sales were up substantially in consumer electronics. In the Trade Markets division, online business with end consumers (Consumer) and sales of painter tapes for tradespeople (Craftsmen) performed particularly well.
* Source: Commerzbank Research.
CONSUMER SPENDING (IN %)*Change versus previous year
Germany Eurozone United States Japan
Previous year Current year
1.2
1.61.3 1.2
1.4
2.6
3.0
0.3
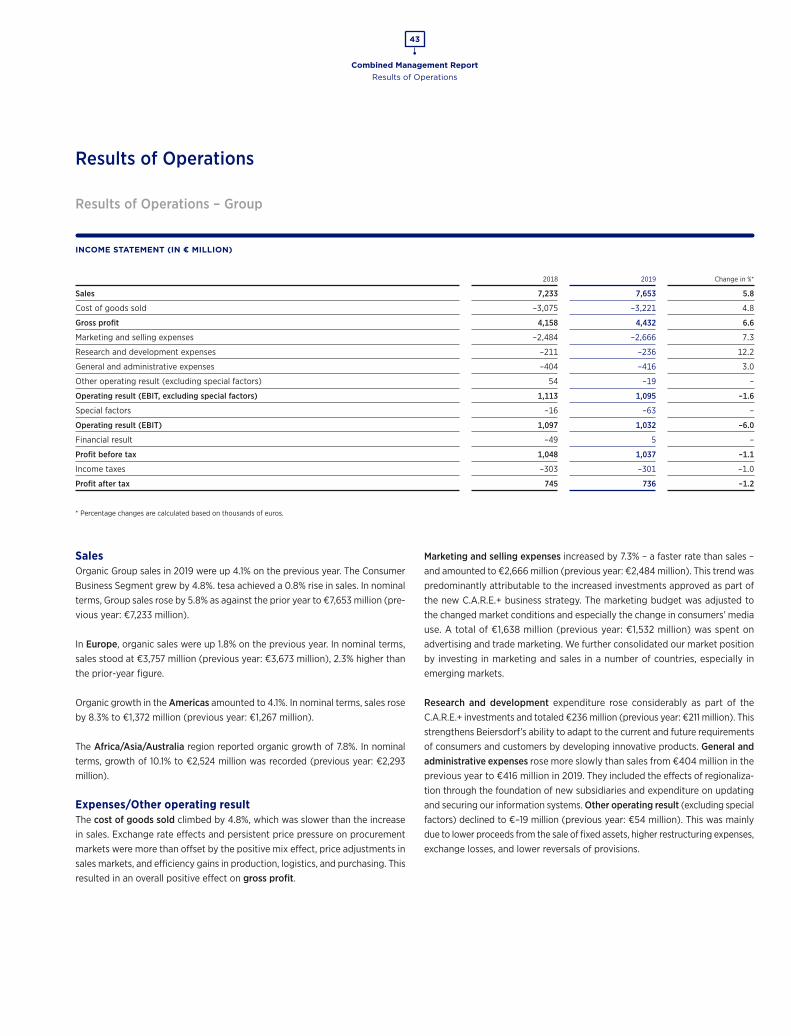
Combined Management Report
43
Results of Operations
Results of Operations
Results of Operations – Group
INCOME STATEMENT (IN € MILLION)
2018 2019 Change in %*
Sales 7,233 7,653 5.8
Cost of goods sold –3,075 –3,221 4.8
Gross profit 4,158 4,432 6.6
Marketing and selling expenses –2,484 –2,666 7.3
Research and development expenses –211 –236 12.2
General and administrative expenses –404 –416 3.0
Other operating result (excluding special factors) 54 –19 –
Operating result (EBIT, excluding special factors) 1,113 1,095 –1.6
Special factors –16 –63 –
Operating result (EBIT) 1,097 1,032 –6.0
Financial result –49 5 –
Profit before tax 1,048 1,037 –1.1
Income taxes –303 –301 –1.0
Profit after tax 745 736 –1.2
* Percentage changes are calculated based on thousands of euros.
SalesOrganic Group sales in 2019 were up 4.1% on the previous year. The Consumer Business Segment grew by 4.8%. tesa achieved a 0.8% rise in sales. In nominal terms, Group sales rose by 5.8% as against the prior year to €7,653 million (pre-vious year: €7,233 million).
In Europe, organic sales were up 1.8% on the previous year. In nominal terms, sales stood at €3,757 million (previous year: €3,673 million), 2.3% higher than the prior-year figure.
Organic growth in the Americas amounted to 4.1%. In nominal terms, sales rose by 8.3% to €1,372 million (previous year: €1,267 million).
The Africa/Asia/Australia region reported organic growth of 7.8%. In nominal terms, growth of 10.1% to €2,524 million was recorded (previous year: €2,293 million).
Expenses/Other operating result The cost of goods sold climbed by 4.8%, which was slower than the increase in sales. Exchange rate effects and persistent price pressure on procurement markets were more than offset by the positive mix effect, price adjustments in sales markets, and efficiency gains in production, logistics, and purchasing. This resulted in an overall positive effect on gross profit.
Marketing and selling expenses increased by 7.3% – a faster rate than sales – and amounted to €2,666 million (previous year: €2,484 million). This trend was predominantly attributable to the increased investments approved as part of the new C.A.R.E.+ business strategy. The marketing budget was adjusted to the changed market conditions and especially the change in consumers’ media use. A total of €1,638 million (previous year: €1,532 million) was spent on advertising and trade marketing. We further consolidated our market position by investing in marketing and sales in a number of countries, especially in emerging markets.
Research and development expenditure rose considerably as part of the C.A.R.E.+ investments and totaled €236 million (previous year: €211 million). This strengthens Beiersdorf’s ability to adapt to the current and future requirements of consumers and customers by developing innovative products. General and administrative expenses rose more slowly than sales from €404 million in the previous year to €416 million in 2019. They included the effects of regionaliza-tion through the foundation of new subsidiaries and expenditure on updating and securing our information systems. Other operating result (excluding special factors) declined to €–19 million (previous year: €54 million). This was mainly due to lower proceeds from the sale of fixed assets, higher restructuring expenses, exchange losses, and lower reversals of provisions.
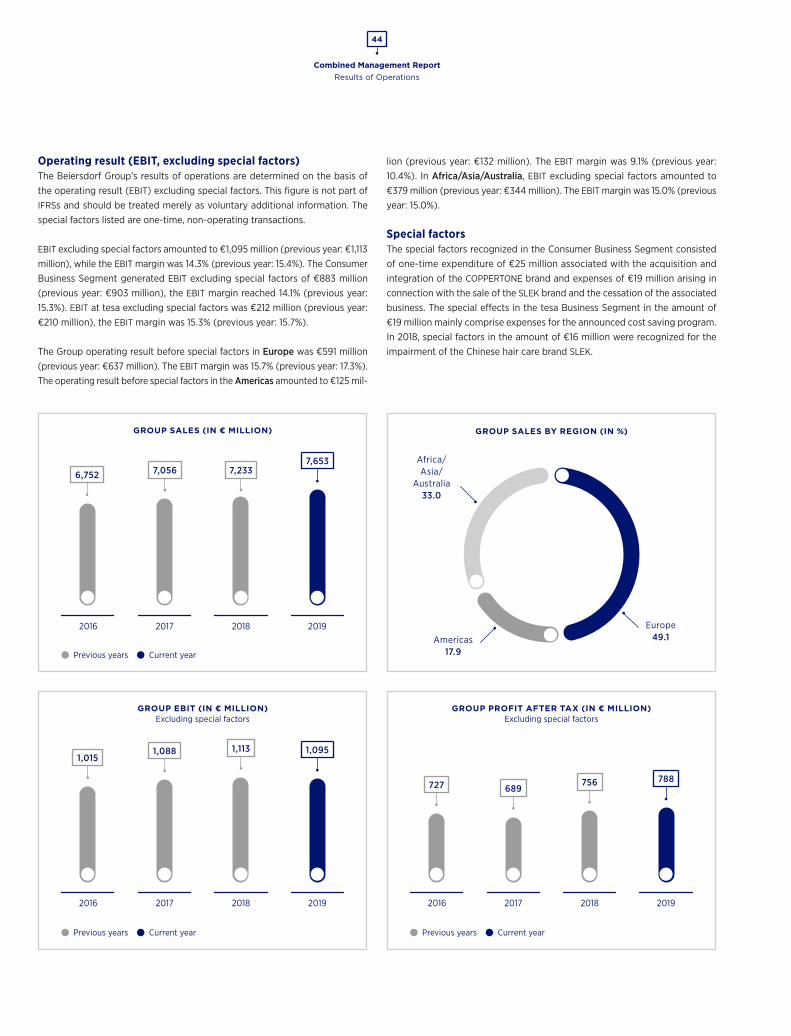
Combined Management Report
44
Results of Operations
Operating result (EBIT, excluding special factors)The Beiersdorf Group’s results of operations are determined on the basis of the operating result (EBIT) excluding special factors. This figure is not part of IFRSs and should be treated merely as voluntary additional information. The special factors listed are one-time, non-operating transactions.
EBIT excluding special factors amounted to €1,095 million (previous year: €1,113 million), while the EBIT margin was 14.3% (previous year: 15.4%). The Consumer Business Segment generated EBIT excluding special factors of €883 million (previous year: €903 million), the EBIT margin reached 14.1% (previous year: 15.3%). EBIT at tesa excluding special factors was €212 million (previous year: €210 million), the EBIT margin was 15.3% (previous year: 15.7%).
The Group operating result before special factors in Europe was €591 million (previous year: €637 million). The EBIT margin was 15.7% (previous year: 17.3%). The operating result before special factors in the Americas amounted to €125 mil-
lion (previous year: €132 million). The EBIT margin was 9.1% (previous year: 10.4%). In Africa/Asia/Australia, EBIT excluding special factors amounted to €379 million (previous year: €344 million). The EBIT margin was 15.0% (previous year: 15.0%).
Special factorsThe special factors recognized in the Consumer Business Segment consisted of one-time expenditure of €25 million associated with the acquisition and integration of the COPPERTONE brand and expenses of €19 million arising in connection with the sale of the SLEK brand and the cessation of the associated business. The special effects in the tesa Business Segment in the amount of €19 million mainly comprise expenses for the announced cost saving program. In 2018, special factors in the amount of €16 million were recognized for the impairment of the Chinese hair care brand SLEK.
GROUP SALES BY REGION (IN %)
Europe49.1
Africa/ Asia/
Australia33.0
Americas17.9
GROUP EBIT (IN € MILLION)Excluding special factors
GROUP PROFIT AFTER TAX (IN € MILLION)Excluding special factors
2016 20162017 20172018 20182019 2019
Previous years Current year Previous years Current year
1,095
788
1,015
727
1,088
689
1,113
756
2016 2017 2018 2019
7,6536,752 7,2337,056
GROUP SALES (IN € MILLION)
Previous years Current year

Combined Management Report
45
Results of Operations
Operating result (EBIT)The operating result (EBIT) amounted to €1,032 million (previous year: €1,097 mil- lion). This corresponds to an EBIT margin of 13.5% (previous year: 15.2%).
Financial resultThe financial result amounted to €5 million (previous year: €–49 million). In the previous year, the result had been affected by one-time losses in the value of financial assets and high negative exchange rate effects.
Income taxesIncome taxes amounted to €301 million (previous year: €303 million). The tax rate was 29.0% (previous year: 28.9%). The taxes for the special factors amount to €11 million.
Profit after taxProfit after tax was €736 million (previous year: €745 million), the return on sales after tax was 9.6% (previous year: 10.3%). Excluding special factors, prof-it after tax amounted to €788 million (previous year: €756 million). The corre-sponding return on sales after tax was 10.3% (previous year: 10.5%).
Earnings per share – DividendsEarnings per share were €3.17 (previous year: €3.21). Excluding special factors, earnings per share amounted to €3.40 (previous year: €3.26). These figures were calculated on the basis of the weighted number of shares bearing dividend rights (226,818,984). The Executive Board and Supervisory Board will propose a dividend of €0.70 per no-par-value share bearing dividend rights to the Annual General Meeting (previous year: €0.70). For further information on the number, type, and notional value of the shares, please refer to Note 17 “Share Capital” in the notes to the consolidated financial statements.
Results of Operations – Business Segments
Consumer
SALES – CONSUMER BUSINESS SEGMENT (IN € MILLION)Change (in %)
Jan. 1 – Dec. 31, 2018 Jan. 1 – Dec. 31, 2019 nominal organic
Europe 2,941 3,027 2.9 2.3
Western Europe 2,354 2,418 2.7 2.2
Eastern Europe 587 609 3.8 3.0
Americas 1,051 1,145 8.9 5.3
North America 441 497 12.4 3.8
Latin America 610 648 6.3 6.4
Africa/Asia/Australia 1,898 2,102 10.8 8.4
Total 5,890 6,274 6.5 4.8
Sales in the Consumer Business Segment achieved organic volume- and price-driven growth of 4.8% in 2019. Exchange rate effects added 1.7 percentage points to the growth rate, while the positive structural effects from the acqui-sition of COPPERTONE offset the sale of the Chinese hair care brand SLEK. In nominal terms, sales therefore rose by 6.5% to €6,274 million (previous year: €5,890 million).
While the situation improved considerably in most emerging markets, the sales development in the European markets showed a mixed picture. In non- European markets we gained market share and, in some cases, double-digit sales growth rates. NIVEA and the Healthcare business unit, which includes the HANSAPLAST and ELASTOPLAST brands, once again achieved healthy growth rates overall. The Derma business unit, which includes the EUCERIN and AQUAPHOR brands, and LA PRAIRIE, which continues to go from strength to strength, both contributed to the excellent performance of the business segment with growth rates that were well above average in some cases.
EBIT excluding special factors stood at €883 million (previous year: €903 mil-lion). The EBIT margin excluding special factors fell to 14.1% (previous year: 15.3%) as a result of the investment initiative announced in the previous year as part of the C.A.R.E.+ strategy. The acquisition of the COPPERTONE brand, the integration of COPPERTONE’s business into the Beiersdorf Group, and the reorganization of the Chinese business in connection with the sale of the SLEK brand resulted in non-recurring expenses of €44 million. The operating result for the Consumer Business Segment including special factors therefore stood at €839 million (previous year: €887 million), while the EBIT margin was 13.4% (previous year: 15.1%).
NIVEA grew organically by 3.0% globally in 2019. The key growth drivers were NIVEA Deo, NIVEA Body, and NIVEA Face. The NIVEA Deep range for men, intro-duced in the previous year and expanded during 2019, was a significant growth driver for NIVEA Deo, as were successful product innovations in the NIVEA Dry and NIVEA Black & White ranges. Alongside its strong core business, NIVEA
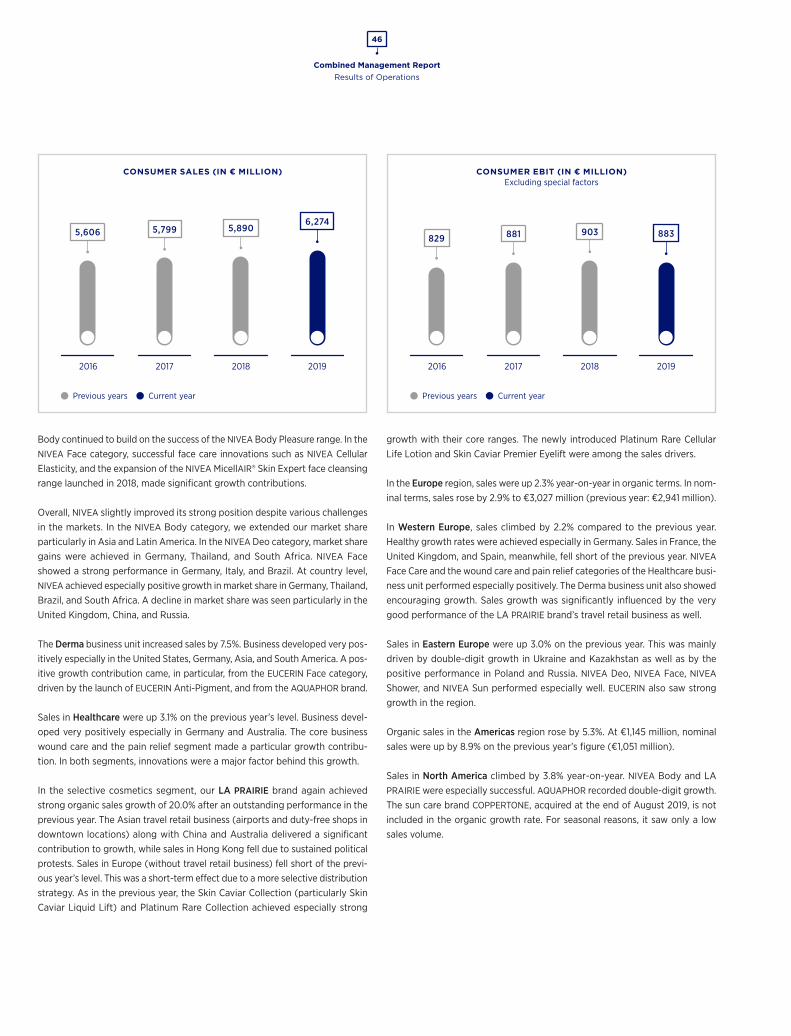
Combined Management Report
46
Results of Operations
Body continued to build on the success of the NIVEA Body Pleasure range. In the NIVEA Face category, successful face care innovations such as NIVEA Cellular Elasticity, and the expansion of the NIVEA MicellAIR® Skin Expert face cleansing range launched in 2018, made significant growth contributions.
Overall, NIVEA slightly improved its strong position despite various challenges in the markets. In the NIVEA Body category, we extended our market share particularly in Asia and Latin America. In the NIVEA Deo category, market share gains were achieved in Germany, Thailand, and South Africa. NIVEA Face showed a strong performance in Germany, Italy, and Brazil. At country level, NIVEA achieved especially positive growth in market share in Germany, Thailand, Brazil, and South Africa. A decline in market share was seen particularly in the United Kingdom, China, and Russia.
The Derma business unit increased sales by 7.5%. Business developed very pos-itively especially in the United States, Germany, Asia, and South America. A pos-itive growth contribution came, in particular, from the EUCERIN Face category, driven by the launch of EUCERIN Anti-Pigment, and from the AQUAPHOR brand.
Sales in Healthcare were up 3.1% on the previous year’s level. Business devel-oped very positively especially in Germany and Australia. The core business wound care and the pain relief segment made a particular growth contribu-tion. In both segments, innovations were a major factor behind this growth.
In the selective cosmetics segment, our LA PRAIRIE brand again achieved strong organic sales growth of 20.0% after an outstanding performance in the previous year. The Asian travel retail business (airports and duty-free shops in downtown locations) along with China and Australia delivered a significant contribution to growth, while sales in Hong Kong fell due to sustained political protests. Sales in Europe (without travel retail business) fell short of the previ-ous year’s level. This was a short-term effect due to a more selective distribution strategy. As in the previous year, the Skin Caviar Collection (particularly Skin Caviar Liquid Lift) and Platinum Rare Collection achieved especially strong
growth with their core ranges. The newly introduced Platinum Rare Cellular Life Lotion and Skin Caviar Premier Eyelift were among the sales drivers.
In the Europe region, sales were up 2.3% year-on-year in organic terms. In nom-inal terms, sales rose by 2.9% to €3,027 million (previous year: €2,941 million).
In Western Europe, sales climbed by 2.2% compared to the previous year. Healthy growth rates were achieved especially in Germany. Sales in France, the United Kingdom, and Spain, meanwhile, fell short of the previous year. NIVEA Face Care and the wound care and pain relief categories of the Healthcare busi-ness unit performed especially positively. The Derma business unit also showed encouraging growth. Sales growth was significantly influenced by the very good performance of the LA PRAIRIE brand’s travel retail business as well.
Sales in Eastern Europe were up 3.0% on the previous year. This was mainly driven by double-digit growth in Ukraine and Kazakhstan as well as by the positive performance in Poland and Russia. NIVEA Deo, NIVEA Face, NIVEA Shower, and NIVEA Sun performed especially well. EUCERIN also saw strong growth in the region.
Organic sales in the Americas region rose by 5.3%. At €1,145 million, nominal sales were up by 8.9% on the previous year’s figure (€1,051 million).
Sales in North America climbed by 3.8% year-on-year. NIVEA Body and LA PRAIRIE were especially successful. AQUAPHOR recorded double-digit growth. The sun care brand COPPERTONE, acquired at the end of August 2019, is not included in the organic growth rate. For seasonal reasons, it saw only a low sales volume.
CONSUMER SALES (IN € MILLION)
2016 2017 2018 2019
6,2745,606 5,799 5,890
CONSUMER EBIT (IN € MILLION)Excluding special factors
2016 2017 2018 2019
Previous years Current year Previous years Current year
883829 881 903
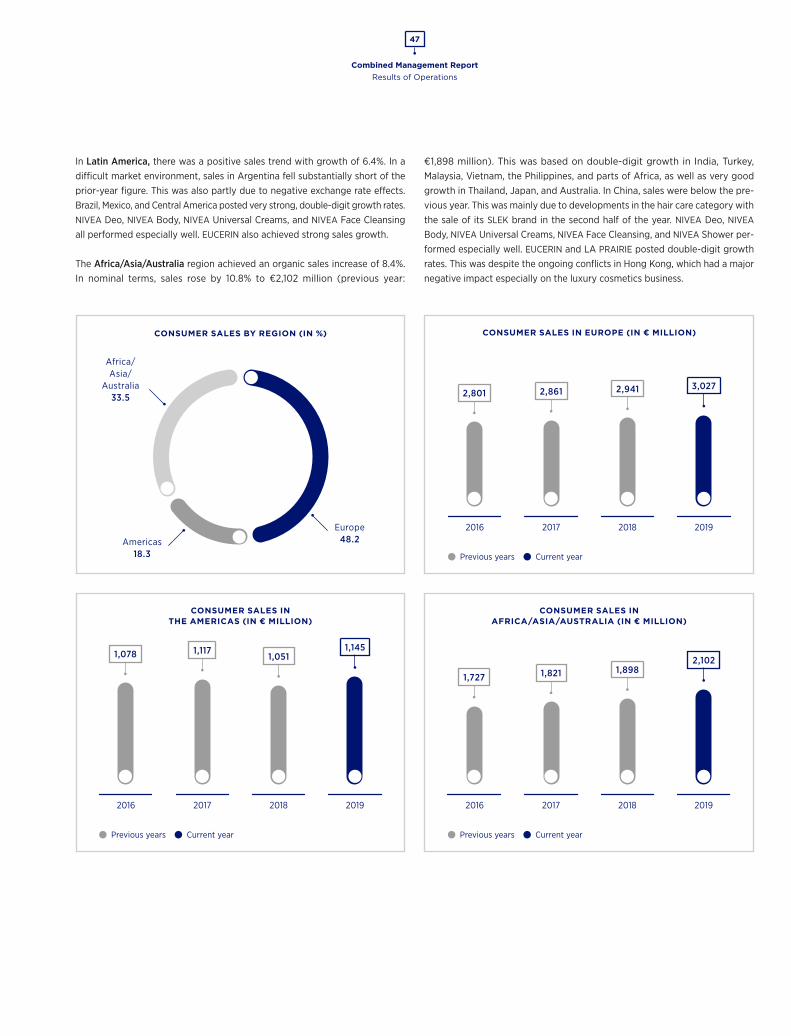
Combined Management Report
47
Results of Operations
In Latin America, there was a positive sales trend with growth of 6.4%. In a difficult market environment, sales in Argentina fell substantially short of the prior-year figure. This was also partly due to negative exchange rate effects. Brazil, Mexico, and Central America posted very strong, double-digit growth rates. NIVEA Deo, NIVEA Body, NIVEA Universal Creams, and NIVEA Face Cleansing all performed especially well. EUCERIN also achieved strong sales growth.
The Africa/Asia/Australia region achieved an organic sales increase of 8.4%. In nominal terms, sales rose by 10.8% to €2,102 million (previous year:
€1,898 million). This was based on double-digit growth in India, Turkey, Malaysia, Vietnam, the Philippines, and parts of Africa, as well as very good growth in Thailand, Japan, and Australia. In China, sales were below the pre-vious year. This was mainly due to developments in the hair care category with the sale of its SLEK brand in the second half of the year. NIVEA Deo, NIVEA Body, NIVEA Universal Creams, NIVEA Face Cleansing, and NIVEA Shower per-formed especially well. EUCERIN and LA PRAIRIE posted double-digit growth rates. This was despite the ongoing conflicts in Hong Kong, which had a major negative impact especially on the luxury cosmetics business.
CONSUMER SALES BY REGION (IN %)
Europe48.2
Africa/ Asia/
Australia33.5
Americas18.3
CONSUMER SALES IN THE AMERICAS (IN € MILLION)
CONSUMER SALES IN AFRICA/ASIA/AUSTRALIA (IN € MILLION)
2016 20162017 20172018 20182019 2019
Previous years Current year Previous years Current year
1,1452,102
1,078
1,727
1,117
1,821
1,0511,898
CONSUMER SALES IN EUROPE (IN € MILLION)
2016 2017 2018 2019
Previous years Current year
3,0272,801 2,861 2,941
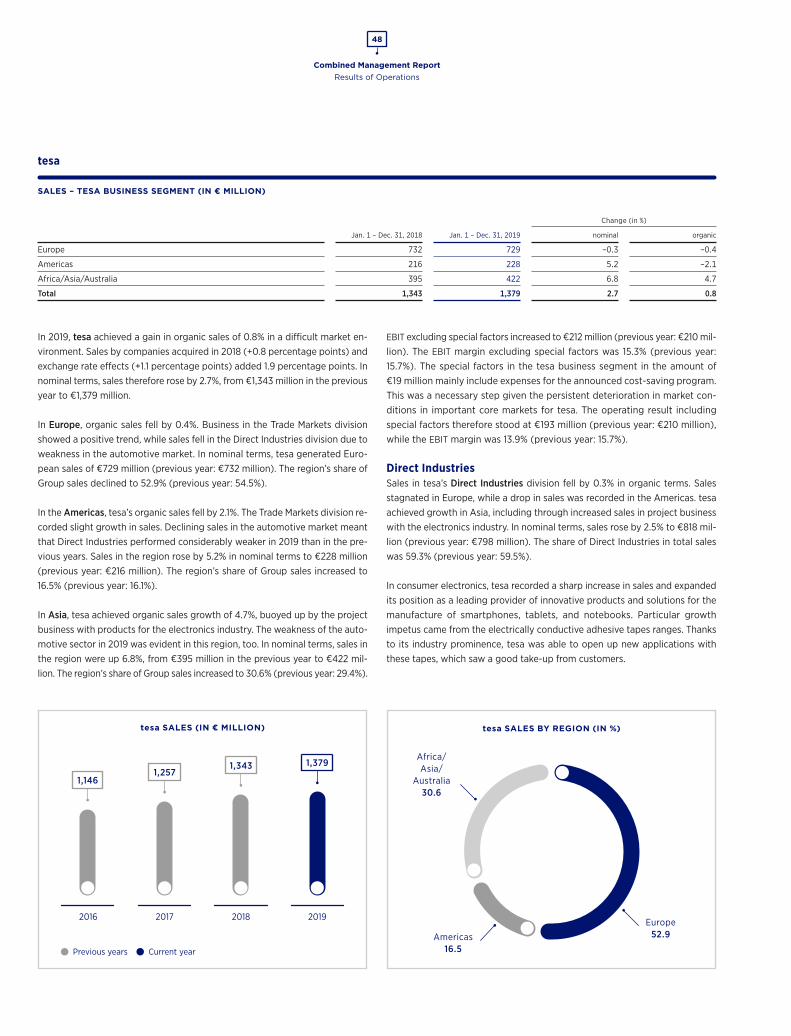
Combined Management Report
48
Results of Operations
tesa
SALES – TESA BUSINESS SEGMENT (IN € MILLION)
Change (in %)
Jan. 1 – Dec. 31, 2018 Jan. 1 – Dec. 31, 2019 nominal organic
Europe 732 729 –0.3 –0.4
Americas 216 228 5.2 –2.1
Africa/Asia/Australia 395 422 6.8 4.7
Total 1,343 1,379 2.7 0.8
In 2019, tesa achieved a gain in organic sales of 0.8% in a difficult market en-vironment. Sales by companies acquired in 2018 (+0.8 percentage points) and exchange rate effects (+1.1 percentage points) added 1.9 percentage points. In nominal terms, sales therefore rose by 2.7%, from €1,343 million in the previous year to €1,379 million.
In Europe, organic sales fell by 0.4%. Business in the Trade Markets division showed a positive trend, while sales fell in the Direct Industries division due to weakness in the automotive market. In nominal terms, tesa generated Euro-pean sales of €729 million (previous year: €732 million). The region’s share of Group sales declined to 52.9% (previous year: 54.5%).
In the Americas, tesa’s organic sales fell by 2.1%. The Trade Markets division re-corded slight growth in sales. Declining sales in the automotive market meant that Direct Industries performed considerably weaker in 2019 than in the pre-vious years. Sales in the region rose by 5.2% in nominal terms to €228 million (previous year: €216 million). The region’s share of Group sales increased to 16.5% (previous year: 16.1%).
In Asia, tesa achieved organic sales growth of 4.7%, buoyed up by the project business with products for the electronics industry. The weakness of the auto-motive sector in 2019 was evident in this region, too. In nominal terms, sales in the region were up 6.8%, from €395 million in the previous year to €422 mil-lion. The region’s share of Group sales increased to 30.6% (previous year: 29.4%).
EBIT excluding special factors increased to €212 million (previous year: €210 mil-lion). The EBIT margin excluding special factors was 15.3% (previous year: 15.7%). The special factors in the tesa business segment in the amount of €19 million mainly include expenses for the announced cost-saving program. This was a necessary step given the persistent deterioration in market con-ditions in important core markets for tesa. The operating result including special factors therefore stood at €193 million (previous year: €210 million), while the EBIT margin was 13.9% (previous year: 15.7%).
Direct IndustriesSales in tesa’s Direct Industries division fell by 0.3% in organic terms. Sales stagnated in Europe, while a drop in sales was recorded in the Americas. tesa achieved growth in Asia, including through increased sales in project business with the electronics industry. In nominal terms, sales rose by 2.5% to €818 mil-lion (previous year: €798 million). The share of Direct Industries in total sales was 59.3% (previous year: 59.5%).
In consumer electronics, tesa recorded a sharp increase in sales and expanded its position as a leading provider of innovative products and solutions for the manufacture of smartphones, tablets, and notebooks. Particular growth impetus came from the electrically conductive adhesive tapes ranges. Thanks to its industry prominence, tesa was able to open up new applications with these tapes, which saw a good take-up from customers.
tesa SALES BY REGION (IN %)
Europe52.9Americas
16.5
tesa SALES (IN € MILLION)
Africa/ Asia/
Australia30.6
Previous years Current year
2016 2017 2018 2019
1,379
1,1461,257
1,343
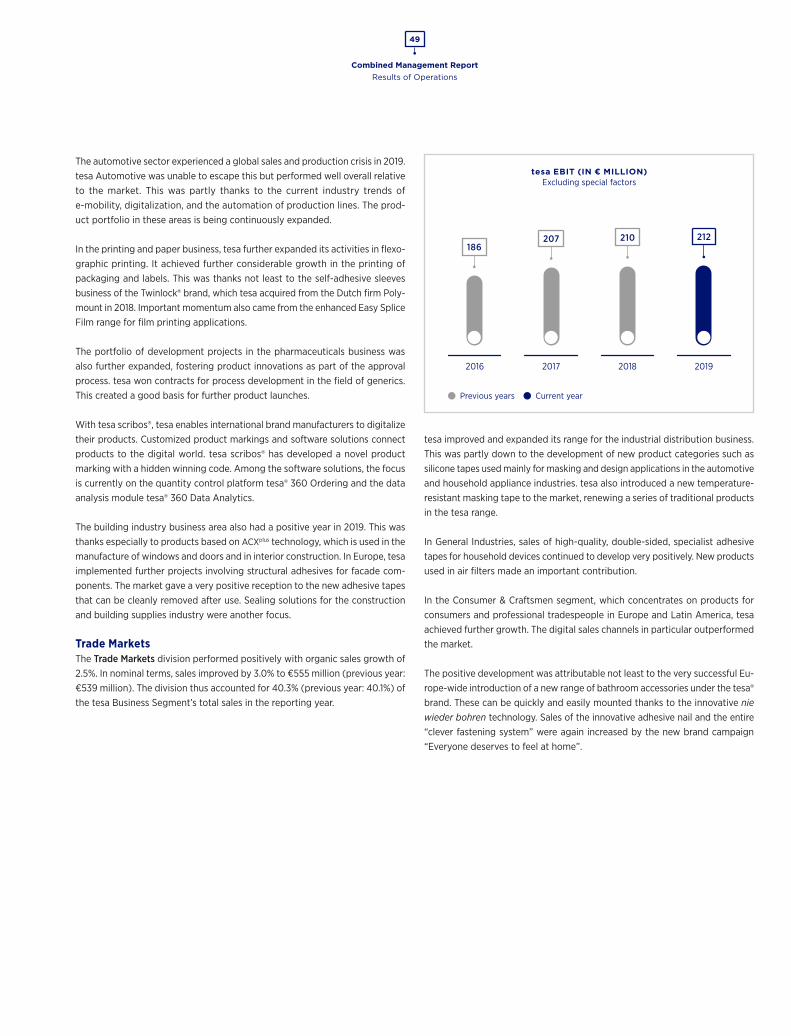
Combined Management Report
49
Results of Operations
The automotive sector experienced a global sales and production crisis in 2019. tesa Automotive was unable to escape this but performed well overall relative to the market. This was partly thanks to the current industry trends of e-mobility, digitalization, and the automation of production lines. The prod-uct portfolio in these areas is being continuously expanded.
In the printing and paper business, tesa further expanded its activities in flexo-graphic printing. It achieved further considerable growth in the printing of packaging and labels. This was thanks not least to the self-adhesive sleeves business of the Twinlock® brand, which tesa acquired from the Dutch firm Poly-mount in 2018. Important momentum also came from the enhanced Easy Splice Film range for film printing applications.
The portfolio of development projects in the pharmaceuticals business was also further expanded, fostering product innovations as part of the approval process. tesa won contracts for process development in the field of generics. This created a good basis for further product launches.
With tesa scribos®, tesa enables international brand manufacturers to digitalize their products. Customized product markings and software solutions connect products to the digital world. tesa scribos® has developed a novel product marking with a hidden winning code. Among the software solutions, the focus is currently on the quantity control platform tesa® 360 Ordering and the data analysis module tesa® 360 Data Analytics.
The building industry business area also had a positive year in 2019. This was thanks especially to products based on ACXplus technology, which is used in the manufacture of windows and doors and in interior construction. In Europe, tesa implemented further projects involving structural adhesives for facade com-ponents. The market gave a very positive reception to the new adhesive tapes that can be cleanly removed after use. Sealing solutions for the construction and building supplies industry were another focus.
Trade MarketsThe Trade Markets division performed positively with organic sales growth of 2.5%. In nominal terms, sales improved by 3.0% to €555 million (previous year: €539 million). The division thus accounted for 40.3% (previous year: 40.1%) of the tesa Business Segment’s total sales in the reporting year.
tesa improved and expanded its range for the industrial distribution business. This was partly down to the development of new product categories such as silicone tapes used mainly for masking and design applications in the automotive and household appliance industries. tesa also introduced a new temperature- resistant masking tape to the market, renewing a series of traditional products in the tesa range.
In General Industries, sales of high-quality, double-sided, specialist adhesive tapes for household devices continued to develop very positively. New products used in air filters made an important contribution.
In the Consumer & Craftsmen segment, which concentrates on products for consumers and professional tradespeople in Europe and Latin America, tesa achieved further growth. The digital sales channels in particular outperformed the market.
The positive development was attributable not least to the very successful Eu-rope-wide introduction of a new range of bathroom accessories under the tesa® brand. These can be quickly and easily mounted thanks to the innovative nie wieder bohren technology. Sales of the innovative adhesive nail and the entire “clever fastening system” were again increased by the new brand campaign “Everyone deserves to feel at home”.
tesa EBIT (IN € MILLION)Excluding special factors
2016 2017 2018 2019
Previous years Current year
212186
207 210

Combined Management Report
50
Net Assets
Net Assets
NET ASSETS – GROUP (IN € MILLION)
Assets Dec. 31, 2018 Dec. 31, 2019
Non-current assets 4,301 5,318
Inventories 986 1,016
Other current assets 2,665 2,589
Cash and cash equivalents 919 1,142
8,871 10,065
Equity and liabilities Dec. 31, 2018 Dec. 31, 2019
Equity 5,647 6,093
Non-current provisions 801 987
Non-current liabilities 73 148
Current provisions 426 491
Current liabilities 1,924 2,346
8,871 10,065
Non-current assets increased by €1,017 million to €5,318 million (previous year: €4,301 million). Long-term securities increased by €182 million to €2,795 million (previous year: €2,613 million). Capital expenditure on property, plant, and equipment, and investment in intangible assets amounted to €765 million (pre-vious year: €463 million; without tesa acquisitions: €358 million). Of this amount, €700 million (previous year: €320 million) related to the Consumer Business Segment and €65 million (previous year: €143 million) to the tesa Business Segment. A major part of the Consumer-Investment is attributable to the COPPERTONE acquisition (€445 million). Other capital expenditure are primar-ily related to the plants of the two business segments, Consumer and tesa, as well as the construction of the new Group headquarters. Recognition of right-of-use assets from leases as a result of the first-time application of IFRS 16
increased property, plant, and equipment by €177 million. Depreciation on right-of-use assets at the Group amounted to €62 million. Other depreciation, amortization, and impairment losses stood at €177 million (previous year: €165 million). Inventories increased by €30 million to €1,016 million (previous year: €986 million), partly due to the COPPERTONE acquisition. The high level of investment resulted in a decline in other current assets to €2,589 million (previous year: €2,665 million). This item includes short-term securities of €770 million (previous year: €889 million). The decline in this position was largely due to individual maturities and investment in longer-term securities. Trade receivables rose by €48 million to €1,442 million (previous year: €1,394 mil-lion). Income tax receivables amounted to €140 million (previous year: €108 mil-lion), while other current assets fell by €3 million to €155 million.
FINANCING STRUCTURE (IN %)
Equity Non-current liabilities Current liabilities
64
61 11 28
10 26
2018
2019
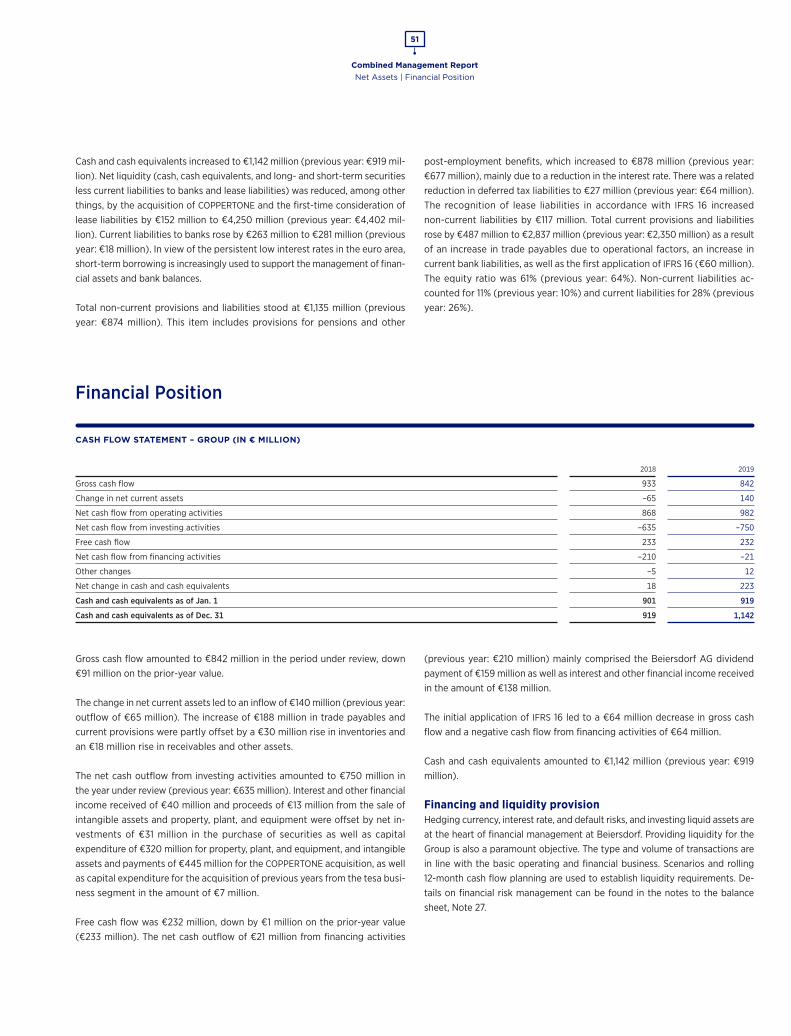
Combined Management Report
51
Net Assets | Financial Position
Cash and cash equivalents increased to €1,142 million (previous year: €919 mil-lion). Net liquidity (cash, cash equivalents, and long- and short-term securities less current liabilities to banks and lease liabilities) was reduced, among other things, by the acquisition of COPPERTONE and the first-time consideration of lease liabilities by €152 million to €4,250 million (previous year: €4,402 mil-lion). Current liabilities to banks rose by €263 million to €281 million (previous year: €18 million). In view of the persistent low interest rates in the euro area, short-term borrowing is increasingly used to support the management of finan-cial assets and bank balances.
Total non-current provisions and liabilities stood at €1,135 million (previous year: €874 million). This item includes provisions for pensions and other
post-employment benefits, which increased to €878 million (previous year: €677 million), mainly due to a reduction in the interest rate. There was a related reduction in deferred tax liabilities to €27 million (previous year: €64 million). The recognition of lease liabilities in accordance with IFRS 16 increased non-current liabilities by €117 million. Total current provisions and liabilities rose by €487 million to €2,837 million (previous year: €2,350 million) as a result of an increase in trade payables due to operational factors, an increase in current bank liabilities, as well as the first application of IFRS 16 (€60 million). The equity ratio was 61% (previous year: 64%). Non-current liabilities ac-counted for 11% (previous year: 10%) and current liabilities for 28% (previous year: 26%).
Financial Position
CASH FLOW STATEMENT – GROUP (IN € MILLION)
2018 2019
Gross cash flow 933 842
Change in net current assets –65 140
Net cash flow from operating activities 868 982
Net cash flow from investing activities –635 –750
Free cash flow 233 232
Net cash flow from financing activities –210 –21
Other changes –5 12
Net change in cash and cash equivalents 18 223
Cash and cash equivalents as of Jan. 1 901 919
Cash and cash equivalents as of Dec. 31 919 1,142
Gross cash flow amounted to €842 million in the period under review, down €91 million on the prior-year value.
The change in net current assets led to an inflow of €140 million (previous year: outflow of €65 million). The increase of €188 million in trade payables and current provisions were partly offset by a €30 million rise in inventories and an €18 million rise in receivables and other assets.
The net cash outflow from investing activities amounted to €750 million in the year under review (previous year: €635 million). Interest and other financial income received of €40 million and proceeds of €13 million from the sale of intangible assets and property, plant, and equipment were offset by net in-vestments of €31 million in the purchase of securities as well as capital expenditure of €320 million for property, plant, and equipment, and intangible assets and payments of €445 million for the COPPERTONE acquisition, as well as capital expenditure for the acquisition of previous years from the tesa busi-ness segment in the amount of €7 million.
Free cash flow was €232 million, down by €1 million on the prior-year value (€233 million). The net cash outflow of €21 million from financing activities
(previous year: €210 million) mainly comprised the Beiersdorf AG dividend payment of €159 million as well as interest and other financial income received in the amount of €138 million.
The initial application of IFRS 16 led to a €64 million decrease in gross cash flow and a negative cash flow from financing activities of €64 million.
Cash and cash equivalents amounted to €1,142 million (previous year: €919 million).
Financing and liquidity provisionHedging currency, interest rate, and default risks, and investing liquid assets are at the heart of financial management at Beiersdorf. Providing liquidity for the Group is also a paramount objective. The type and volume of transactions are in line with the basic operating and financial business. Scenarios and rolling 12-month cash flow planning are used to establish liquidity requirements. De-tails on financial risk management can be found in the notes to the balance sheet, Note 27.
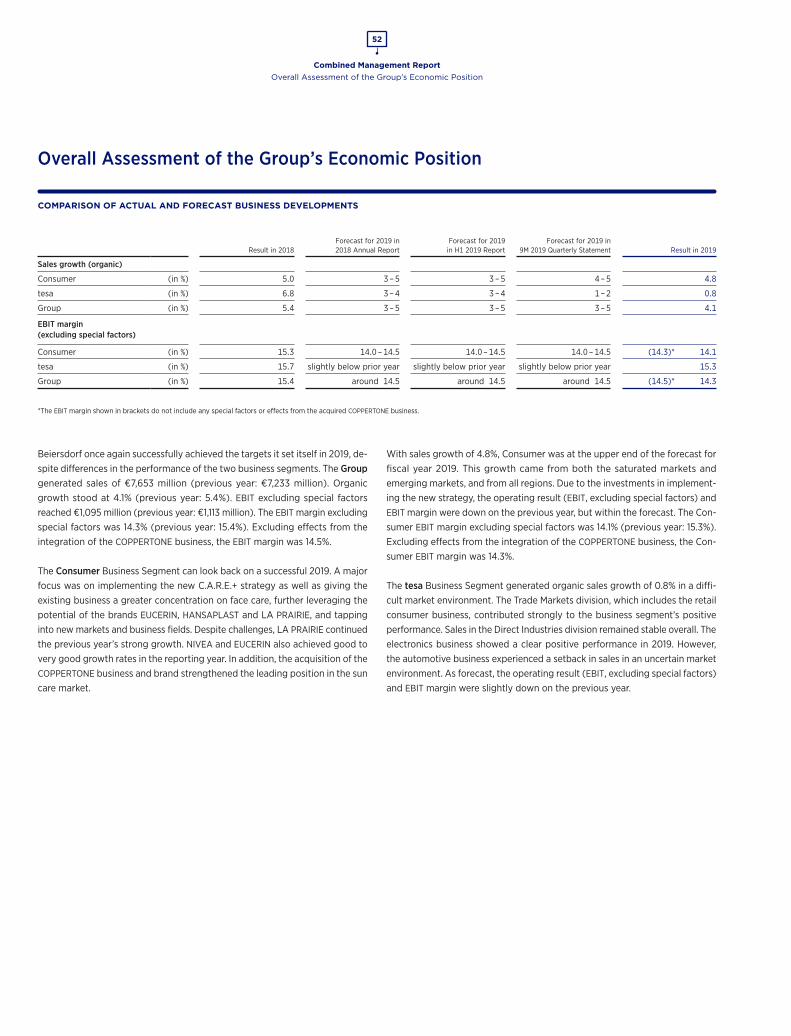
Combined Management Report
52
Overall Assessment of the Group’s Economic Position
Overall Assessment of the Group’s Economic Position
COMPARISON OF ACTUAL AND FORECAST BUSINESS DEVELOPMENTS
Result in 2018Forecast for 2019 in 2018 Annual Report
Forecast for 2019 in H1 2019 Report
Forecast for 2019 in 9M 2019 Quarterly Statement Result in 2019
Sales growth (organic)
Consumer (in %) 5.0 3 – 5 3 – 5 4 – 5 4.8
tesa (in %) 6.8 3 – 4 3 – 4 1 – 2 0.8
Group (in %) 5.4 3 – 5 3 – 5 3 – 5 4.1
EBIT margin (excluding special factors)
Consumer (in %) 15.3 14.0 – 14.5 14.0 – 14.5 14.0 – 14.5 (14.3)* 14.1
tesa (in %) 15.7 slightly below prior year slightly below prior year slightly below prior year 15.3
Group (in %) 15.4 around 14.5 around 14.5 around 14.5 (14.5)* 14.3
*The EBIT margin shown in brackets do not include any special factors or effects from the acquired COPPERTONE business.
Beiersdorf once again successfully achieved the targets it set itself in 2019, de-spite differences in the performance of the two business segments. The Group generated sales of €7,653 million (previous year: €7,233 million). Organic growth stood at 4.1% (previous year: 5.4%). EBIT excluding special factors reached €1,095 million (previous year: €1,113 million). The EBIT margin excluding special factors was 14.3% (previous year: 15.4%). Excluding effects from the integration of the COPPERTONE business, the EBIT margin was 14.5%.
The Consumer Business Segment can look back on a successful 2019. A major focus was on implementing the new C.A.R.E.+ strategy as well as giving the existing business a greater concentration on face care, further leveraging the potential of the brands EUCERIN, HANSAPLAST and LA PRAIRIE, and tapping into new markets and business fields. Despite challenges, LA PRAIRIE continued the previous year’s strong growth. NIVEA and EUCERIN also achieved good to very good growth rates in the reporting year. In addition, the acquisition of the COPPERTONE business and brand strengthened the leading position in the sun care market.
With sales growth of 4.8%, Consumer was at the upper end of the forecast for fiscal year 2019. This growth came from both the saturated markets and emerging markets, and from all regions. Due to the investments in implement-ing the new strategy, the operating result (EBIT, excluding special factors) and EBIT margin were down on the previous year, but within the forecast. The Con-sumer EBIT margin excluding special factors was 14.1% (previous year: 15.3%). Excluding effects from the integration of the COPPERTONE business, the Con-sumer EBIT margin was 14.3%.
The tesa Business Segment generated organic sales growth of 0.8% in a diffi-cult market environment. The Trade Markets division, which includes the retail consumer business, contributed strongly to the business segment’s positive performance. Sales in the Direct Industries division remained stable overall. The electronics business showed a clear positive performance in 2019. However, the automotive business experienced a setback in sales in an uncertain market environment. As forecast, the operating result (EBIT, excluding special factors) and EBIT margin were slightly down on the previous year.
*Die in Klammern ausgewiesene EBIT-Rendite beinhalten keine Sondereffekte und keine Effekte aus dem akquirierten
COPPERTONE-Geschäft.
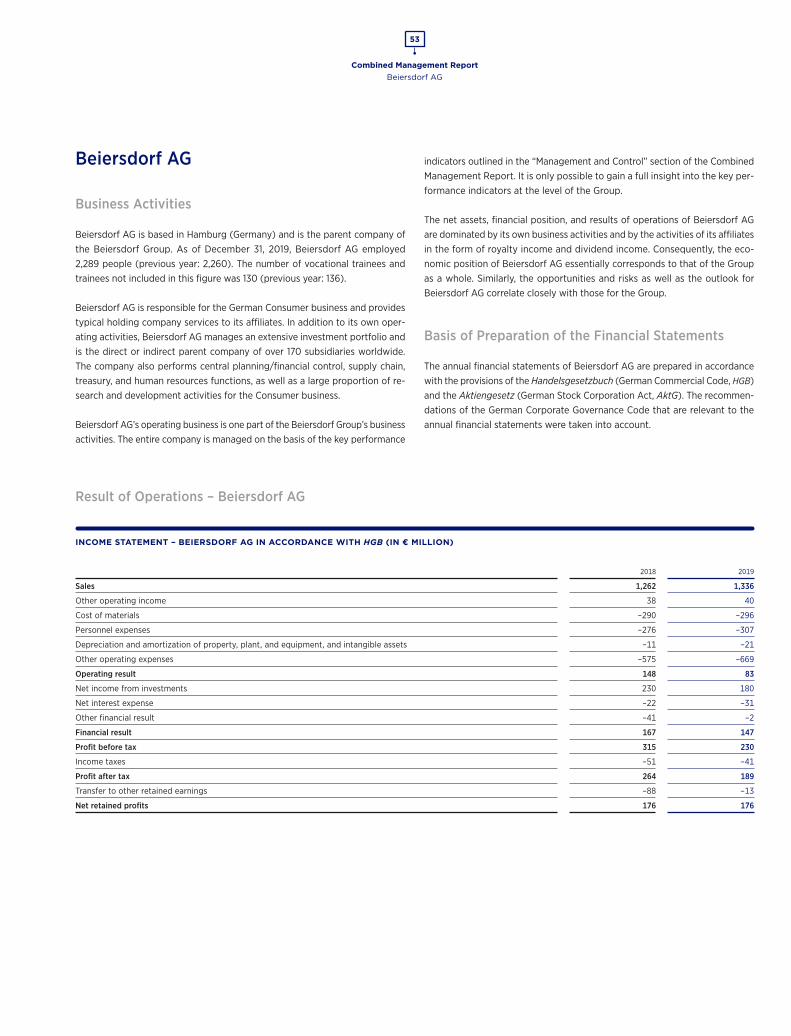
Combined Management Report
53
Beiersdorf AG
Beiersdorf AG
Business Activities
Beiersdorf AG is based in Hamburg (Germany) and is the parent company of the Beiersdorf Group. As of December 31, 2019, Beiersdorf AG employed 2,289 people (previous year: 2,260). The number of vocational trainees and trainees not included in this figure was 130 (previous year: 136).
Beiersdorf AG is responsible for the German Consumer business and provides typical holding company services to its affiliates. In addition to its own oper-ating activities, Beiersdorf AG manages an extensive investment portfolio and is the direct or indirect parent company of over 170 subsidiaries worldwide. The company also performs central planning/financial control, supply chain, treasury, and human resources functions, as well as a large proportion of re-search and development activities for the Consumer business.
Beiersdorf AG’s operating business is one part of the Beiersdorf Group’s business activities. The entire company is managed on the basis of the key performance
indicators outlined in the “Management and Control” section of the Combined Management Report. It is only possible to gain a full insight into the key per-formance indicators at the level of the Group.
The net assets, financial position, and results of operations of Beiersdorf AG are dominated by its own business activities and by the activities of its affiliates in the form of royalty income and dividend income. Consequently, the eco-nomic position of Beiersdorf AG essentially corresponds to that of the Group as a whole. Similarly, the opportunities and risks as well as the outlook for Beiersdorf AG correlate closely with those for the Group.
Basis of Preparation of the Financial Statements
The annual financial statements of Beiersdorf AG are prepared in accordance with the provisions of the Handelsgesetzbuch (German Commercial Code, HGB) and the Aktiengesetz (German Stock Corporation Act, AktG). The recommen-dations of the German Corporate Governance Code that are relevant to the annual financial statements were taken into account.
Result of Operations – Beiersdorf AG
INCOME STATEMENT – BEIERSDORF AG IN ACCORDANCE WITH HGB (IN € MILLION)
2018 2019
Sales 1,262 1,336
Other operating income 38 40
Cost of materials –290 –296
Personnel expenses –276 –307
Depreciation and amortization of property, plant, and equipment, and intangible assets –11 –21
Other operating expenses –575 –669
Operating result 148 83
Net income from investments 230 180
Net interest expense –22 –31
Other financial result –41 –2
Financial result 167 147
Profit before tax 315 230
Income taxes –51 –41
Profit after tax 264 189
Transfer to other retained earnings –88 –13
Net retained profits 176 176
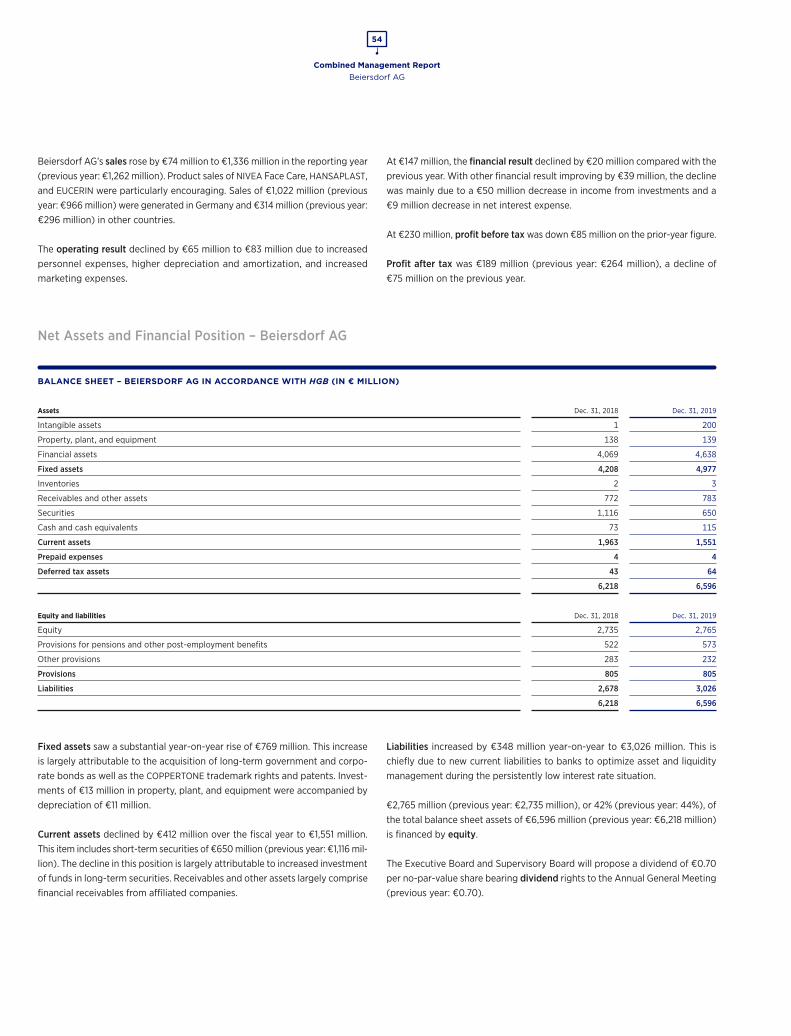
Combined Management Report
54
Beiersdorf AG
Beiersdorf AG’s sales rose by €74 million to €1,336 million in the reporting year (previous year: €1,262 million). Product sales of NIVEA Face Care, HANSAPLAST, and EUCERIN were particularly encouraging. Sales of €1,022 million (previous year: €966 million) were generated in Germany and €314 million (previous year: €296 million) in other countries.
The operating result declined by €65 million to €83 million due to increased personnel expenses, higher depreciation and amortization, and increased marketing expenses.
At €147 million, the financial result declined by €20 million compared with the previous year. With other financial result improving by €39 million, the decline was mainly due to a €50 million decrease in income from investments and a €9 million decrease in net interest expense.
At €230 million, profit before tax was down €85 million on the prior-year figure.
Profit after tax was €189 million (previous year: €264 million), a decline of €75 million on the previous year.
Net Assets and Financial Position – Beiersdorf AG
BALANCE SHEET – BEIERSDORF AG IN ACCORDANCE WITH HGB (IN € MILLION)
Assets Dec. 31, 2018 Dec. 31, 2019
Intangible assets 1 200
Property, plant, and equipment 138 139
Financial assets 4,069 4,638
Fixed assets 4,208 4,977
Inventories 2 3
Receivables and other assets 772 783
Securities 1,116 650
Cash and cash equivalents 73 115
Current assets 1,963 1,551
Prepaid expenses 4 4
Deferred tax assets 43 64
6,218 6,596
Equity and liabilities Dec. 31, 2018 Dec. 31, 2019
Equity 2,735 2,765
Provisions for pensions and other post-employment benefits 522 573
Other provisions 283 232
Provisions 805 805
Liabilities 2,678 3,026
6,218 6,596
Fixed assets saw a substantial year-on-year rise of €769 million. This increase is largely attributable to the acquisition of long-term government and corpo-rate bonds as well as the COPPERTONE trademark rights and patents. Invest-ments of €13 million in property, plant, and equipment were accompanied by depreciation of €11 million.
Current assets declined by €412 million over the fiscal year to €1,551 million. This item includes short-term securities of €650 million (previous year: €1,116 mil-lion). The decline in this position is largely attributable to increased investment of funds in long-term securities. Receivables and other assets largely comprise financial receivables from affiliated companies.
Liabilities increased by €348 million year-on-year to €3,026 million. This is chiefly due to new current liabilities to banks to optimize asset and liquidity management during the persistently low interest rate situation.
€2,765 million (previous year: €2,735 million), or 42% (previous year: 44%), of the total balance sheet assets of €6,596 million (previous year: €6,218 million) is financed by equity.
The Executive Board and Supervisory Board will propose a dividend of €0.70 per no-par-value share bearing dividend rights to the Annual General Meeting (previous year: €0.70).

Combined Management Report
55
Risk Report
Risk Report
Risks and Opportunities
In the course of its business activities, the Beiersdorf Group is exposed to a multitude of risks. These result, among other things, from its activities that seek to develop and make use of opportunities to improve the company’s competi-tiveness. Risks and opportunities encompass events and developments with a certain probability of occurrence that may have material negative or positive financial and non-financial effects on the achievement of the Beiersdorf Group’s objectives. Beiersdorf uses an integrated risk and opportunity management system in order to identify and evaluate material risks at an early stage and to consistently limit them using counteractive measures.
Integrated Risk and Opportunity Management System
The risk and opportunity management system at Beiersdorf is an integral part of the central and local planning, management, and control processes in the individual companies, management units, and regions, at Consumer and tesa Business Segment levels, and at Group level. Risk and opportunity manage-ment is complemented by the accounting-related internal control systems, the various internal and external monitoring bodies – supported by Internal Audit – and external auditors. Compliance management, which is also relevant in this context, is described extensively in the separate Group Sustainability Report.
Risk and opportunity management is closely aligned with corporate strategy and helps Beiersdorf identify and make optimal use of its potential. Regularly analyzing customers and the competition, for example, enables a swift response to dynamic market developments. Specific market opportunities and risks are derived from the information obtained.
Beiersdorf incurs risks only if there is a corresponding opportunity for an ap-propriate increase in value, and only if they can be managed using established methods and measures within the relevant organization. In cases where the full avoidance of risks is not possible or reasonable, risks are mitigated using appropriate measures, or are transferred to third parties such as insurance companies.
Within the risk management process, periodic inventories are carried out to identify, evaluate, document, and subsequently communicate the material risks in a structured way along with the measures to manage these risks. The cor-responding principles, reporting and feedback processes, as well as responsi-bilities are laid out in a directive that applies across the Group and is regularly updated. Risk management is coordinated at Group headquarters.
Beiersdorf distinguishes between strategic, functional, and operational risks. Strategic risks encompass fundamental frameworks, developments, and events that could have a substantial impact on the Group or its business segments. Functional risks are challenges inherent to the business model. The various spe-cialist functions generally work at the global or regional level to counter these risks in a sustainable manner, with action relating to the design of operational and organizational structures as well as with specific individual measures. Operational risks and opportunities are those that may influence short-term sales and profits.
BEIERSDORF RISK RADARSchematic diagram
Improbable Probable Very probable
Marketing/ Distribution/ Outbound logistics
Significant Critical Existence-imperiling
2
3
1Procurement/ Raw materials
External framework
Manufacturing
Customer/Consumer/ Markets
Competition/ Substitution
R & D/Innovations/ Quality management
Organizational excellence
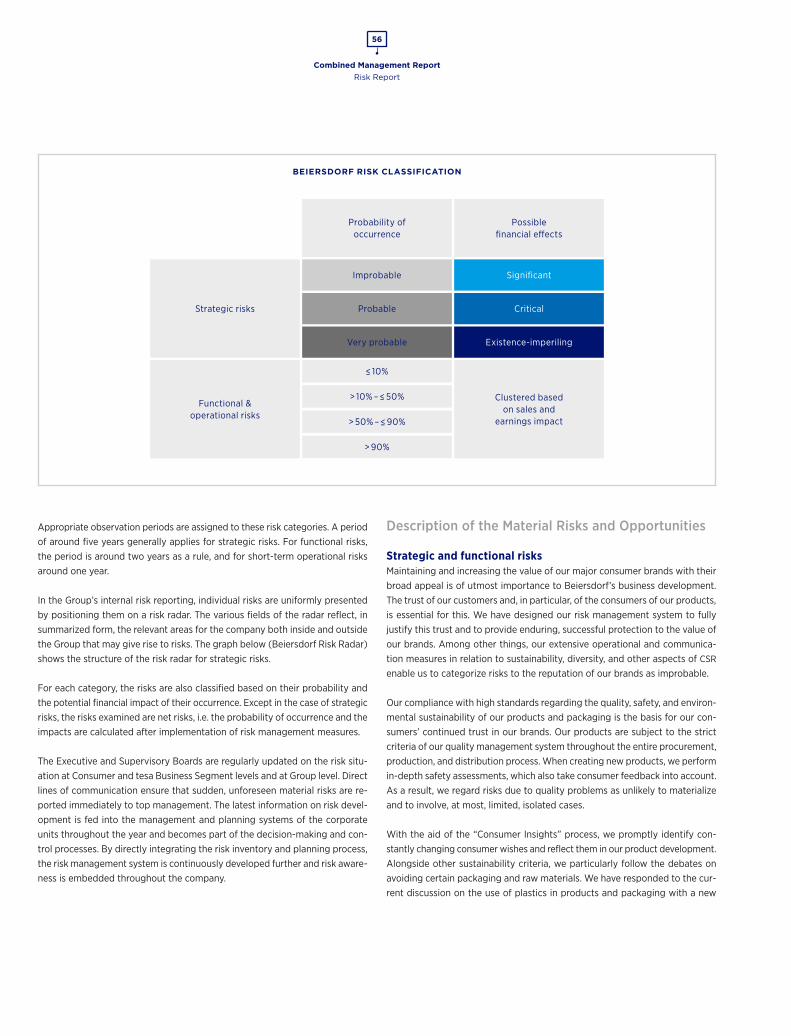
Combined Management Report
56
Risk Report
Appropriate observation periods are assigned to these risk categories. A period of around five years generally applies for strategic risks. For functional risks, the period is around two years as a rule, and for short-term operational risks around one year.
In the Group’s internal risk reporting, individual risks are uniformly presented by positioning them on a risk radar. The various fields of the radar reflect, in summarized form, the relevant areas for the company both inside and outside the Group that may give rise to risks. The graph below (Beiersdorf Risk Radar) shows the structure of the risk radar for strategic risks.
For each category, the risks are also classified based on their probability and the potential financial impact of their occurrence. Except in the case of strategic risks, the risks examined are net risks, i.e. the probability of occurrence and the impacts are calculated after implementation of risk management measures.
The Executive and Supervisory Boards are regularly updated on the risk situ-ation at Consumer and tesa Business Segment levels and at Group level. Direct lines of communication ensure that sudden, unforeseen material risks are re-ported immediately to top management. The latest information on risk devel-opment is fed into the management and planning systems of the corporate units throughout the year and becomes part of the decision-making and con-trol processes. By directly integrating the risk inventory and planning process, the risk management system is continuously developed further and risk aware-ness is embedded throughout the company.
Description of the Material Risks and Opportunities
Strategic and functional risksMaintaining and increasing the value of our major consumer brands with their broad appeal is of utmost importance to Beiersdorf’s business development. The trust of our customers and, in particular, of the consumers of our products, is essential for this. We have designed our risk management system to fully justify this trust and to provide enduring, successful protection to the value of our brands. Among other things, our extensive operational and communica-tion measures in relation to sustainability, diversity, and other aspects of CSR enable us to categorize risks to the reputation of our brands as improbable.
Our compliance with high standards regarding the quality, safety, and environ-mental sustainability of our products and packaging is the basis for our con-sumers’ continued trust in our brands. Our products are subject to the strict criteria of our quality management system throughout the entire procurement, production, and distribution process. When creating new products, we perform in-depth safety assessments, which also take consumer feedback into account. As a result, we regard risks due to quality problems as unlikely to materialize and to involve, at most, limited, isolated cases.
With the aid of the “Consumer Insights” process, we promptly identify con-stantly changing consumer wishes and reflect them in our product development. Alongside other sustainability criteria, we particularly follow the debates on avoiding certain packaging and raw materials. We have responded to the cur-rent discussion on the use of plastics in products and packaging with a new
BEIERSDORF RISK CLASSIFICATION
Probability of occurrence
Possible financial effects
Strategic risks
Improbable
Probable
Very probable
Functional & operational risks
–< 10%
> 50% – –< 90%
> 10% – –< 50%
> 90%
Clustered based on sales and
earnings impact
Significant
Critical
Existence-imperiling
Combined Management Report
57
Risk Report
plastic cycle strategy. Direct communication with consumers via digital social media is becoming an ever more important aspect of this. As a result, we have also comprehensively reviewed and re-oriented our use of media and market-ing, for example. We regard the risks from changes in consumer behavior as critical and probable. In relation to the above-mentioned environmental and sustainability aspects, they can even be regarded as very probable.
Strong brands that balance innovation and continuity and have a clear bene-fit for consumers are our response to the ever-intensifying global competition on price, cost, quality, and innovation. As well as intensively seeking potential cost reductions throughout the value chain, we also continuously review the effectiveness of all marketing and sales activities, for instance in the perfor-mance-based management of our sales terms and promotions. In doing so, we are also responding to increasing retail concentration. By specifically promoting largely independent management of our smaller, sometimes region-specific brands such as HIDROFUGAL, 8x4, and SKIN STORIES, we are responding to the continuing growth in significance of rival brands at local and regional level, whose emergence we regard overall as critical and very probable.
Expertise-based brands that constantly provide consumers with relevant new products require a high degree of up-front investment in innovation and market-ing. The continuous expansion of our trademark and patent portfolio is there-fore of utmost importance. We protect our intellectual property proactively and comprehensively. By closely aligning the Group functions involved in this with the operational business, we identify commercial opportunities from our research and development activities at an early stage and safeguard them long-term using industrial property rights. Of course, we also acknowledge and respect existing third-party rights when developing our new products. In gen-eral, we regard the risk of third-party attacks on our trademarks or product names and the use of certain ingredients as critical and probable. At the same time, we are convinced that this will not significantly hinder us from continuing to successfully introduce relevant innovations into the market.
Our management focus on the sustainable success of our market activities ensures that we invest in promising markets in terms of brands, products, and regions. In addition to the acquisition of the COPPERTONE brand, which was successfully completed in the reporting year, activities range from the screen-ing of new business fields and selective participation in start-ups (including “accelerator programs”) to the establishment of new affiliates, such as Pakistan and Myanmar, or partnerships in countries not previously covered. At the same time, we ensure that we are generating the funds needed for these activities in the long term. Without this management, we would regard the risk of in-vesting also in less promising markets as critical and probable.
We counter procurement risks relating to delivery reliability and price for raw materials, commodities, and services by continuously monitoring our markets and suppliers and using appropriate contract management. Strategic partner-ships are an important element of actively managing our supplier portfolio. Here, we take into account the growing global political and economic uncertainties
by developing new business models that ensure lasting access to our procure-ment markets. We are focusing particularly on special local and regional supply chains. At the same time, we ensure that the overall structure of our global production and logistics provides both sufficient flexibility in terms of capacity and the necessary infrastructure as well as corresponding availability of quali-fied staff and further training opportunities. In general, we regard the strate-gic and functional risks in this context as of average significance but rather improbable.
We have continued to work intensively on our project to increase the security, availability, reliability, and efficiency of our IT systems against internal and external attacks, as well as on measures relating to the Group-wide business continuity management system to secure operations at all times. The project is due to run for several years. We therefore now categorize risks to Beiersdorf in connection with the setup and functionality of our IT as significant rather than critical, but still regard them as rather probable.
The completed installation of a Europe-wide data protection system is helping us ever more each day to ensure safe handling of our company’s sensitive data as well as that of our business partners and consumers, such as when devel-oping and using our social media presence or creating new software solutions. At the same time, it allows us to successfully implement the increased infor-mation and documentation requirements. We are currently examining the requirements and opportunities for rolling this system out to other regions.
Alongside this, we counter our internal compliance risk and the further growing external compliance risks by providing clear rules of conduct and transparent management structures, accompanied by comprehensive training and moni-toring activities, such as for protecting the confidentiality of internal data. Finally, occupational safety, environmental, and business interruption risks in our production and logistics activities are minimized by frequently updated process control checks and location-specific audits. We generally regard risks in these areas as less significant and relatively improbable.
Partnerships and other contacts with universities enable us to build early links to qualified potential new employees, for whom we have special trainee pro-grams to prepare them for a career at Beiersdorf. Our uniform global talent management process identifies and develops talented specialists and manage-ment personnel at all levels and supports the appointment of qualified staff in key positions throughout the company as these become vacant. Risks in the context of our global recruitment activities remain an insignificant issue for us.
We counter the risk of bad debts through detailed monitoring of our customer relationships, active receivables management, and the selective use of trade credit insurance. Currency, interest rate, and liquidity risks are subject to active treasury management based on a global directive. They are managed and hedged centrally to a very large extent, taking into account the specific re-quirements for the organizational separation of the trading, settlement, and controlling functions.
Combined Management Report
58
Risk Report
Potential default risks relating to the investment of the Group’s liquid funds are limited by only making investments with defined, reliable counterparties. Coun-terparty risk is monitored on the basis of ratings and the counterparties’ liable capital, as well as continuously updated risk indicators. These parameters are used to determine maximum amounts for investments with partner banks and securities issuers (counterparty limits), which are compared regularly with the investments actually made throughout the Group. We have invested the majority of our liquidity in low-risk investments (such as government/corporate bonds and covered bonds). The investment strategy is regularly agreed with our internal supervisory body and with the Supervisory Board. Thus, we con-sider market risks from the investment of our free liquidity to be insignificant and relatively improbable.
Our financial risk management is characterized by the clear allocation of re-sponsibilities, central rules for limiting financial risks as a matter of principle, and the conscious alignment of the instruments deployed with the require-ments of our business activities. Specific, additional information on the extent of the currency, interest rate, default, and liquidity risks described above can be found in Note 27 of the notes to the consolidated financial statements, “Additional Disclosures on Financial Instruments, Financial Risk Management, and Derivative Financial Instruments.”
Short-term operational risks and opportunities Operational risks and opportunities are continuously monitored as part of the financial planning, forecasting, and reporting process at the local, regional, and central level. This ensures that all sales and earnings effects regarded as rela-tively likely are directly and appropriately incorporated into our financial re-porting, taking into account the measures implemented and planned (e. g. recognition of provisions).
This applies in particular to the risks associated with Brexit. Coordinated by a multifunctional task force, we are working on all the relevant processes and have prepared for a variety of scenarios via mitigating activities. The effects of Brexit – even an unregulated Brexit – on the business of our company in the United Kingdom, for example through higher customs duties or changes in exchange rates, are not considered to be critical for the Group as a whole.
A monthly review of key financial figures for the Group companies is conduct-ed, led by the Group Controlling function together with Risk Management and Internal Audit. This is designed to enable potential critical developments to be addressed swiftly and precisely with those involved and corrective action to be initiated where appropriate.
The net operational risks currently remaining arise from legal and tax proceed-ings and from tax audits. These risks are prudently quantified by both internal and external experts to the extent possible, and the necessary provisions are provided for in the financial accounts. Assessing the course and outcome of legal disputes is associated with considerable uncertainty. Based on the infor-mation currently available, it is highly unlikely that these disputes will result in significant charges for the Group.
Further information and details on the extent of the risks described here can be found in Note 28 of the notes to the consolidated financial statements, “Contingent Liabilities, Other Financial Obligations, and Legal Risks.”
Summary of the Risk Situation
Compared with the previous year, there has been no significant structural change in our assessment of the likelihood of occurrence and/or potential finan-cial impact of the above risks and opportunities. Overall, even considering the updated estimations, there is no fundamental change to the risk situation. Based on the current assessment, the Beiersdorf Group is therefore not exposed to any risks that could endanger its continued existence.
Accounting-Related Internal Control System
The aim of the accounting-related internal control system is to implement appropriate principles, procedures, and controls to ensure the correctness and reliability of accounting and financial reporting in the financial statements and management report of the Beiersdorf Group and Beiersdorf AG in line with the legal regulations and relevant accounting standards.
The scope and orientation of the internal control system have been shaped by the Executive Board based on the Group-specific requirements. The accounting- related internal control system consists of the following components: control environment, risk assessment process, control activities, information, commu-nication, and monitoring.
An analysis was used to identify the items and positions containing the material risks for the financial statements. The underlying processes were then assigned to these. Preventive, monitoring, and detective measures designed to ensure security and control in accounting, information processing, and the operational functions have been defined Group-wide for these processes. Among other things, the measures include the separation of functions, manu-al and IT-based approval processes using the dual control principle, IT checks, access restrictions and authorization concepts for the IT system, and systems- based processes for handling Group accounting data. These measures were updated during the reporting year.
Shared service centers provide uniform handling of the core accounting pro-cesses at Beiersdorf AG and most of its affiliates. In some cases, they achieve this with the help of fully automated processes. Standardized IT systems are used to support financial reporting for the companies included in the consoli-dated financial statements and consolidation. Procedural instructions, stand-ardized reporting formats, and IT-based reporting and consolidation processes support financial reporting.
Combined Management Report
59
Risk Report | Report on Expected Developments
The consolidated financial statements are based on accounting directives spec-ified by Beiersdorf AG. These guidelines are updated on an ongoing basis through continuous analysis of the relevance and impact of changes in the regulatory environment.
The accounting process and compliance with the control requirements and accounting directives by the companies included in the consolidated financial statements are regularly reviewed.
It remains the case that even putting in place appropriate, effective systems does not guarantee the correct, complete, and timely recording of information in the accounts with absolute certainty. It is impossible to entirely rule out per-sonal judgments, erroneous controls, criminal acts, or other circumstances. Should these occur, they could limit the effectiveness and reliability of the internal control system.
Independent Monitoring
The supervisory bodies and the Internal Audit department are integrated into the Beiersdorf Group’s internal control system with audit activities that are in-dependent of the Group’s operations. Internal Audit systematically evaluates the integrity of financial accounting, the effectiveness of the accounting-related internal control system and of the risk and opportunity management system, and compliance. As a process-independent organizational unit, it uses a risk-based approach to reviewing the business processes, the systems and controls that have been put in place, and the financial accounting of transactions. The audit findings are used for ongoing enhancement of the company’s manage-ment and of preventive and detective controls. In accordance with § 317 (4) HGB, the Group auditor also evaluates the effectiveness of the risk early warn-ing and monitoring system. Internal Audit and the Group auditor regularly report the audit results to the supervisory bodies.
The Audit Committee of Beiersdorf AG monitors, in particular, the accounting process and the effectiveness of the internal control system, the risk manage-ment system, and the internal audit system.
Report on Expected Developments
Expected Macroeconomic Developments
For 2020, we expect global economic growth to be slightly down on the prior- year level, with the uncertainty of the ongoing trade conflicts acting as a major brake. Geopolitical unrest, EU-skeptical movements in European countries, and uncertainty about the long-term consequences of Brexit, as well as the future economic policy of the United States will also have a continuing negative impact on the development of the global economy.
In Europe, we expect growth to fall slightly short of the prior-year level. Low interest rates, a slightly expansionary fiscal policy, and stable domestic demand thanks to a robust labor market will continue to prop up growth. However, there is a danger that domestic demand will also weaken, causing the downturn in industry to spread to the service sector. The long-term impact of Brexit, trade conflicts, Italian budgetary policy, and a possible change in course by the European Central Bank are a continuing source of uncertainty.
In Germany, we expect growth to slightly exceed the prior-year level. Invest-ment, increased government expenditure, and stable consumer spending are likely once again to be the main factors supporting the economy. Uncertainty surrounds export performance given the trade disputes and unknown conse-quences of Brexit.
For the US economy, we expect the growth rate to fall short of that seen in the previous year. Rising uncertainty due to the trade dispute with China will hold investment growth back, and a slowdown also threatens the service sector. Consumer spending and the Fed’s rate cuts appear to be holding this downward trend at bay. The potential impact of economic policy is difficult to predict.
In Japan, we anticipate a substantial fall in growth. Output may be bolstered by a new fiscal package and the stimulus provided by the Summer Olympics, but slowdowns in investment and consumer spending, primarily as a result of the VAT rise in fall 2019, will have a substantial negative impact.
In the emerging markets, we expect growth overall to be in line with the pre-vious year. For the Chinese economy, we expect growth to be slightly below the prior-year level, underpinned again by an expansionary fiscal policy. The ongoing trade dispute with the United States, the risk of a depreciating ren-minbi, and the continued high level of indebtedness in state-owned enterprises continue to cause uncertainty. Furthermore, the impact of the corona virus epidemic cannot yet be estimated. In India, we expect noticeably higher growth again after a weaker year in 2019. In the Middle East, we expect trade barriers and other protectionist measures to continue to slow economic growth in the region. For the Southeast Asian emerging markets, we expect growth to be slightly down on the previous year’s level due to lower growth in production
Combined Management Report
60
Report on Expected Developments
and persistently low export demand. In Brazil, we anticipate that the economy will continue the recovery expected for 2019 with a noticeable surge in growth. There is uncertainty about the effectiveness of the new government’s eco-nomic stimulus measures. In Russia, we expect a slight rise in economic growth after a weak performance in the previous year.
Procurement Market Trends
The commodity markets are likely to pick up again in 2020. This is due to very volatile oil prices, partly as a result of the output reduction decided by the Organization of the Petroleum Exporting Countries (OPEC), and a host of political uncertainties such as the unrest in the Middle East and the current trade disputes between the United States and China as well as the United States and the European Union, as well as Brexit.
Prices for natural preliminary raw materials will be pushed above their current low level and will rise moderately. An increase in demand for more sustainable materials will also lead to generally tighter commodity markets and potentially higher costs. Certain materials will only be available at a premium. Prices of commodities and packaging materials are increasingly decoupling from base materials.
Beiersdorf will continue to work intensively on programs to achieve lasting reductions in procurement costs. This includes continuously optimizing the overall cost structure of our products. On the whole, however, we expect the cost of materials to rise slightly in 2020.
Sales Market Trends
We believe that the global growth rate in the cosmetics market – the market relevant for Beiersdorf – will remain at the prior-year level in 2020. We expect only modest growth in the major European and North American markets. The emerging markets will contribute positively to the overall performance.
For tesa, we continue to expect largely stable sales trends in Europe, though political developments represent an element of unpredictability. In North America, we again expect a more positive development from the automotive industry in 2020. After strong growth in 2019, we anticipate a continued pos-itive trend in Latin America. In Asia, we anticipate moderate growth, which will be coupled very closely to the performance of the Chinese economy. The declining automotive market globally and the rather cautious expectations in the electronics industry are resulting in slightly muted growth expectations.
Our Market Opportunities
Market performance will remain mixed in 2020 and competition will continue to increase in some markets. By implementing our C.A.R.E.+ strategy system-atically, we want to meet the challenges ahead of us to unlock Beiersdorf’s potential and to be able to further deliver sustainable growth. We see strong opportunities both in systematically expanding our presence in the emerging markets and in consolidating our position in European markets.
We will build on our sound financial structure and strong earnings position to-gether with our dedicated and highly qualified employees to continue exploit-ing future opportunities with our internationally successful brand portfolio. Extensive research and development activities resulting in successful, consum-er-driven innovations will be flanked by targeted marketing measures, strength-ening our brand core and creating enduring confidence among our consumers.
For tesa, the electronics industry business in Asia remains attractive; however, its project-based nature continues to entail a high risk of volatility. Growth expectations for the coming year are slightly above the market trend. This applies to business with both consumers and industrial customers. tesa expects to bolster its market position with continued investment in research and development, and therefore in innovative products.
Business Developments
Our assessment of business developments in the coming year is based on the above assumptions in conjunction with our specifically defined measures. Any potential impact from the corona virus epidemic in China on our business is not quantifiable yet, thus not reflected in this business outlook.
In the Consumer Business Segment, Beiersdorf expects sales growth to out-perform the market at 3 – 5% in fiscal year 2020. The EBIT margin from ongo-ing operations (excluding special factors) is expected to be in the range of 14.0 – 14.5%.
In the tesa Business Segment, we are predicting slightly positive sales growth in 2020. The EBIT margin from ongoing operations (excluding special factors) is expected to remain at the prior year's level.
Based on the forecasts of the two business segments, Group sales growth is expected to be around 3 – 5%. We expect the consolidated EBIT margin from on-going operations (excluding special factors) to remain at the prior year’s level.
Hamburg, February 11, 2020 Beiersdorf AG
The Executive Board
Combined Management Report
61
Remuneration Report
Remuneration Report and Other Disclosures
Remuneration Report
The remuneration report explains the structure and amount of the remunera-tion paid to the members of the Executive Board and the Supervisory Board. It takes into account the legal requirements and the recommendations of the German Corporate Governance Code in the version dated February 7, 2017 (the Code) applicable to fiscal year 2019. It is a component of the annual and consolidated financial statements as well as the combined management report for Beiersdorf AG and the Group.
1. Remuneration of the Executive Board
The Supervisory Board addressed the structure and appropriateness of Executive Board remuneration, as well as individual remuneration questions, on February 1, February 21, February 26, April 17, June 27, September 3, and December 3, 2019. On January 31, 2020, the Supervisory Board determined the remuneration of the Executive Board for fiscal year 2019. Remuneration decisions were prepared by the Presiding Committee.
OverviewThe remuneration system for the Executive Board takes into account the tasks and performance of the individual members of the Executive Board and the Executive Board as a whole, the company’s economic and financial situation, its performance and outlook, as well as its relevant peer group under stock corporation law and the Code. The remuneration structure is geared toward sustainable enterprise development.
The remuneration of the Executive Board in 2019 continued to comprise essentially four components:
• a fixed basic remuneration component,• a short-term Variable Bonus with annual targets,• a long-term bonus based on enterprise value performance (Enterprise Value
Component/LTP), as well as• customary ancillary benefits.
The predominant multi-year element of variable remuneration and its largely forward-looking basis of calculation consists of the Enterprise Value Component (see section c) below).
Remuneration of the Executive Board in 2019 in More Detaila) Fixed RemunerationThe fixed annual remuneration is paid in 12 equal installments. It is generally reviewed for appropriateness from time to time.
b) Variable BonusThe members of the Executive Board receive a Variable Bonus that is based on the performance of the Consumer Business Segment. This is paid in full after the Annual General Meeting of the year following that in which it is granted. As specified by the Supervisory Board and depending on the level of goal achievement in each case, 20% of the Variable Bonus for fiscal year 2019 is determined by sales growth (sales component), 30% by market share (market share component), 30% by the achievement of strategic business goals (strategic component), and 20% by the achievement of personal goals by Executive Board members (personal component). The size of the sales com-ponent is calculated based on sales growth in the Consumer Business Segment. The Supervisory Board adjusts the calculation for influences resulting from currency effects and M&A. The market share component is determined by the increase in market share in the skin care categories in the countries with the highest sales. The strategic component is based on certain initiatives for per-sonalized skin care, digitalization, and sustainability, with each of these areas contributing 10%. The personal component consists partly of a common HR goal relating to succession planning and diversity, which contributes 10%. The remaining 10% attributable to the personal component is determined by per-sonal goals for each Executive Board member based on their functional and/or regional responsibilities. Following due assessment of the circumstances, the Supervisory Board lays down percentages for target achievement for each of the components, with intermediate figures being interpolated on a straight-line basis. The individual components lapse if goal achievement is less than 70%. No further increases are made for any of the components if the goals are exceeded by more than 200% (cap). The Supervisory Board may increase or decrease the Variable Bonus by up to 20% in order to take extraordinary developments into account. Bonus entitlements can also be transferred to the long-term Enterprise Value Component.
c) Enterprise Value ComponentExecutive Board members share in the increase in enterprise value for the Consumer Business Segment in the form of a multi-year bonus. This is based on a mathematical formula drawn from the annual financial statements at the beginning and end of their term of office. Each Executive Board member is allocated a notional share of the enterprise value (Enterprise Value Component or Base Virtual Units) at the start of their period of appointment or reappoint-ment. The Executive Board member will be paid their share of the percentage increase in the Enterprise Value Component during their term of office once their period of appointment or reappointment has ended and following, where applicable, an additional vesting period (“bonus period”), if the Annual General Meeting approves the Executive Board member’s actions.
The increase in enterprise value corresponds to the percentage share of the Executive Board member’s (notionally allocated) Enterprise Value Component
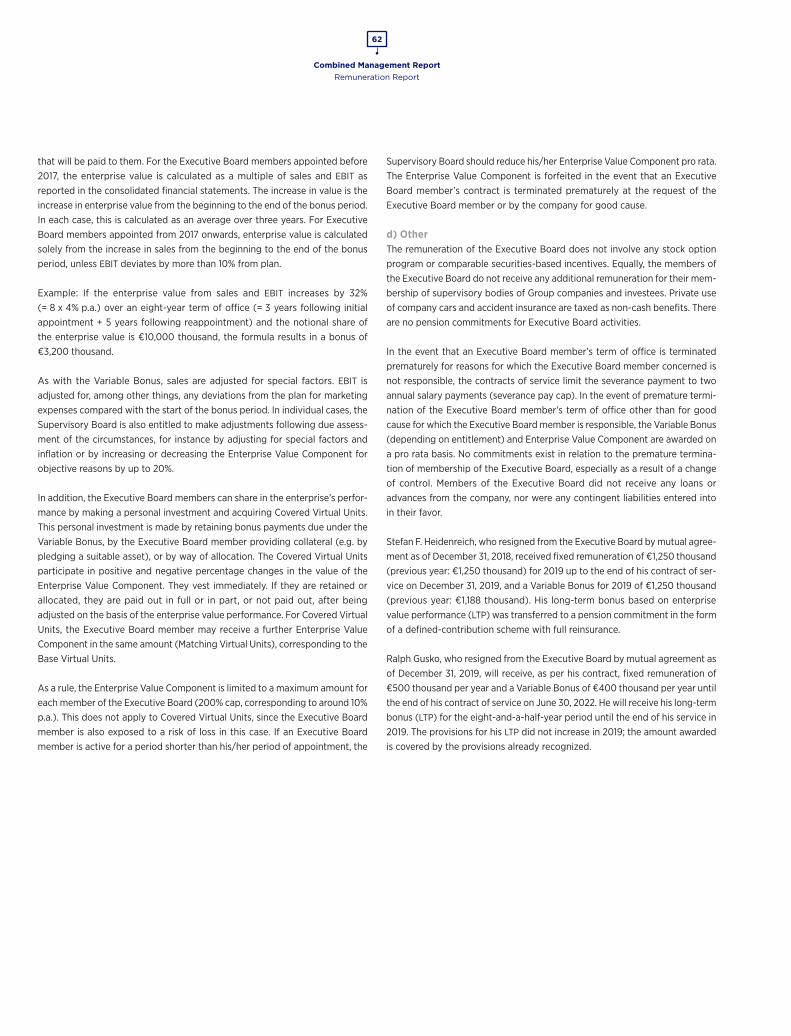
Combined Management Report
62
Remuneration Report
that will be paid to them. For the Executive Board members appointed before 2017, the enterprise value is calculated as a multiple of sales and EBIT as reported in the consolidated financial statements. The increase in value is the increase in enterprise value from the beginning to the end of the bonus period. In each case, this is calculated as an average over three years. For Executive Board members appointed from 2017 onwards, enterprise value is calculated solely from the increase in sales from the beginning to the end of the bonus period, unless EBIT deviates by more than 10% from plan.
Example: If the enterprise value from sales and EBIT increases by 32% (= 8 x 4% p.a.) over an eight-year term of office (= 3 years following initial appointment + 5 years following reappointment) and the notional share of the enterprise value is €10,000 thousand, the formula results in a bonus of €3,200 thousand.
As with the Variable Bonus, sales are adjusted for special factors. EBIT is adjusted for, among other things, any deviations from the plan for marketing expenses compared with the start of the bonus period. In individual cases, the Supervisory Board is also entitled to make adjustments following due assess-ment of the circumstances, for instance by adjusting for special factors and inflation or by increasing or decreasing the Enterprise Value Component for objective reasons by up to 20%.
In addition, the Executive Board members can share in the enterprise’s perfor-mance by making a personal investment and acquiring Covered Virtual Units. This personal investment is made by retaining bonus payments due under the Variable Bonus, by the Executive Board member providing collateral (e.g. by pledging a suitable asset), or by way of allocation. The Covered Virtual Units participate in positive and negative percentage changes in the value of the Enterprise Value Component. They vest immediately. If they are retained or allocated, they are paid out in full or in part, or not paid out, after being adjusted on the basis of the enterprise value performance. For Covered Virtual Units, the Executive Board member may receive a further Enterprise Value Component in the same amount (Matching Virtual Units), corresponding to the Base Virtual Units.
As a rule, the Enterprise Value Component is limited to a maximum amount for each member of the Executive Board (200% cap, corresponding to around 10% p.a.). This does not apply to Covered Virtual Units, since the Executive Board member is also exposed to a risk of loss in this case. If an Executive Board member is active for a period shorter than his/her period of appointment, the
Supervisory Board should reduce his/her Enterprise Value Component pro rata. The Enterprise Value Component is forfeited in the event that an Executive Board member’s contract is terminated prematurely at the request of the Executive Board member or by the company for good cause.
d) OtherThe remuneration of the Executive Board does not involve any stock option program or comparable securities-based incentives. Equally, the members of the Executive Board do not receive any additional remuneration for their mem-bership of supervisory bodies of Group companies and investees. Private use of company cars and accident insurance are taxed as non-cash benefits. There are no pension commitments for Executive Board activities.
In the event that an Executive Board member’s term of office is terminated prematurely for reasons for which the Executive Board member concerned is not responsible, the contracts of service limit the severance payment to two annual salary payments (severance pay cap). In the event of premature termi-nation of the Executive Board member’s term of office other than for good cause for which the Executive Board member is responsible, the Variable Bonus (depending on entitlement) and Enterprise Value Component are awarded on a pro rata basis. No commitments exist in relation to the premature termina-tion of membership of the Executive Board, especially as a result of a change of control. Members of the Executive Board did not receive any loans or advances from the company, nor were any contingent liabilities entered into in their favor.
Stefan F. Heidenreich, who resigned from the Executive Board by mutual agree-ment as of December 31, 2018, received fixed remuneration of €1,250 thousand (previous year: €1,250 thousand) for 2019 up to the end of his contract of ser-vice on December 31, 2019, and a Variable Bonus for 2019 of €1,250 thousand (previous year: €1,188 thousand). His long-term bonus based on enterprise value performance (LTP) was transferred to a pension commitment in the form of a defined-contribution scheme with full reinsurance.
Ralph Gusko, who resigned from the Executive Board by mutual agreement as of December 31, 2019, will receive, as per his contract, fixed remuneration of €500 thousand per year and a Variable Bonus of €400 thousand per year until the end of his contract of service on June 30, 2022. He will receive his long-term bonus (LTP) for the eight-and-a-half-year period until the end of his service in 2019. The provisions for his LTP did not increase in 2019; the amount awarded is covered by the provisions already recognized.

Combined Management Report
63
Remuneration Report
e) Overviews of Individual Executive Board Remuneration
TOTAL REMUNERATION OF THE EXECUTIVE BOARD FOR ACTIVITIES IN FISCAL YEAR 2019 (IN € THOUSAND)
Fixed basic remuneration Variable Bonus Other remuneration1 Sum
Change in provisions for Enterprise Value
Component Total2
2018 2019 2018 2019 2018 2019 2018 2019 2018 2019 2018 2019
Stefan De Loecker 500 1,000 1,3853 1,390 371 9 2,256 2,399 1,327 2,394 3,5834 4,793
Ralph Gusko (until December 31, 2019) 500 500 360 400 118 254 978 1,154 –8265 – 152 1,154
Thomas Ingelfinger 450 450 315 462 8 36 773 948 432 275 1,205 1,223
Zhengrong Liu 500 500 285 417 40 39 825 956 1,061 634 1,886 1,590
Ramon A. Mirt (from March 1, 2019) – 417 – 348 – 1,1136 – 1,878 – 581 – 2,4597
Asim Naseer (from January 1, 2019) – 500 – 402 – 377 – 1,279 – 529 – 1,808
Dessi Temperley 240 480 158 417 182 15 580 912 182 442 762 1,354
Vincent Warnery 500 500 375 450 33 14 908 964 1,232 1,873 2,140 2,837
Total8 4,180 4,347 4,201 4,286 773 1,857 9,154 10,490 2,093 6,728 11,247 17,218
The following table shows the Virtual Units allocated to the Executive Board members and the amounts set aside in the years since they were granted in each case.
VIRTUAL UNITS AND PROVISIONS (IN € THOUSAND)
2018 2019
Base
Virtual UnitCovered
Virtual UnitMatching
Virtual UnitTotal amount set
aside in 2018Base
Virtual UnitCovered
Virtual Unit9
Matching Virtual Unit
Total amount set aside in 2019
Stefan De Loecker 12,000 1,250 2,250 66110 40,000 – – 3,055
Ralph Gusko (until December 31, 2019) 10,000 1,900 1,900 4,78411 10,000 1,900 1,900 4,500
Thomas Ingelfinger 5,500 1,270 1,270 2,205 5,500 1,330 1,330 2,480
Zhengrong Liu 10,000 1,950 1,500 3,205 10,000 2,075 1,500 3,839
Ramon A. Mirt (from March 1, 2019) – – – – 12,000 – – 581
Asim Naseer (from January 1, 2019)12 – – – – 6,000 1,590 – 529
Dessi Temperley 6,000 438 438 182 6,000 513 513 624
Vincent Warnery 10,000 1,144 2,144 2,55913 10,000 1,219 2,219 4,43213
Total14 68,500 18,546 50,096 35,381 99,500 8,627 7,462 20,040
1 Other remuneration includes the costs of/non-cash benefits arising from non-cash remuneration components and other ancillary benefits, such as the provision of a company car and insurance in line with standard market terms, including any taxes assumed on these items, and relocation expenses, if any.
2 Payment of the amounts set aside for Enterprise Value Components included in the total remuneration is linked to a number of preconditions, and in particular to a corresponding sustainable increase in the company’s enterprise value and to approval of the Executive Board member’s actions (see section c) above). The amount set aside for Vincent Warnery already includes an increase in the Enterprise Value Component, which will be awarded to him from February 1, 2020 with effect as of contract commencement (see also footnote 13).
3 This figure includes an amount of €1,000 thousand (target amount) awarded to Stefan De Loecker as a multi-year bonus in 2018. 4 €1,383 thousand of this amount was granted to Stefan De Loecker as remuneration for his activities at Group companies up until June 30, 2018.5 The total amounts set aside up to and including 2017 for the Enterprise Value Components awarded to Ralph Gusko were greater than the amount payable to him on his departure. The provisions were thus reversed
accordingly in 2018. 6 This figure includes an amount of €417 thousand (target amount) awarded to Ramon A. Mirt as a multi-year bonus in 2019. Target achievement is calculated based on the average annual growth rate in accordance
with corporate planning in his regions and also based on the increase in market share throughout his term of office as a member of the Executive Board.7 €2,089 thousand of this amount was granted to Ramon A. Mirt as remuneration for his activities at Group companies.8 The totals for the previous year additionally include the payments made to members who left the Executive Board in 2018. For Stefan F. Heidenreich – fixed basic remuneration: €1,250 thousand,
Variable Bonus: €1,188 thousand, other remuneration: €12 thousand, total: €2,450 thousand, change in provisions for Enterprise Value Component: €–1,262 thousand, total: €1,188 thousand. For Jesper Andersen – fixed basic remuneration: €240 thousand, Variable Bonus: €135 thousand, other remuneration: €9 thousand, total: €384 thousand, change in provisions for Enterprise Value Component: €–53 thousand, total: €331 thousand.
9 This figure includes both the Covered Virtual Units acquired by way of personal investment and the following Covered Virtual Units granted in 2019 by way of allocation: Thomas Ingelfinger €60 thousand; Asim Naseer €90 thousand; Zhengrong Liu €125 thousand; Dessi Temperley €75 thousand; Vincent Warnery €75 thousand.
10 Stefan De Loecker was paid a share of the Enterprise Value Component amounting to €2,986 thousand in 2018, as contractually agreed. This was taken into account in the total amount for which a provision was recognized in 2018.
11 This figure includes the personal investments made in the form of retained bonus payments due under the Variable Bonus.12 The figures for the Virtual Units for Asim Naseer are based on the target amounts of the long-term Enterprise Value Components awarded to him. The notional share of the enterprise value was thus calculated
mathematically. 13 This already includes an increase in the Covered Virtual Units to €2,000 thousand and an increase in the Matching Virtual Units to €4,000 thousand, which will be awarded to Vincent Warnery from February 1, 2020
with effect as of contract commencement.14 The totals additionally include the payments made to members who left the Executive Board in 2018. For Stefan F. Heidenreich – Base Virtual Unit: €10,000 thousand, Covered Virtual Unit: €10,000 thousand,
Matching Virtual Unit: €40,000 thousand, total amount set aside in 2018: €21,000 thousand. For Jesper Andersen – Base Virtual Unit: €5,000 thousand, Covered Virtual Unit: €594 thousand, Matching Virtual Unit: €594 thousand, total amount set aside in 2018: €785 thousand.
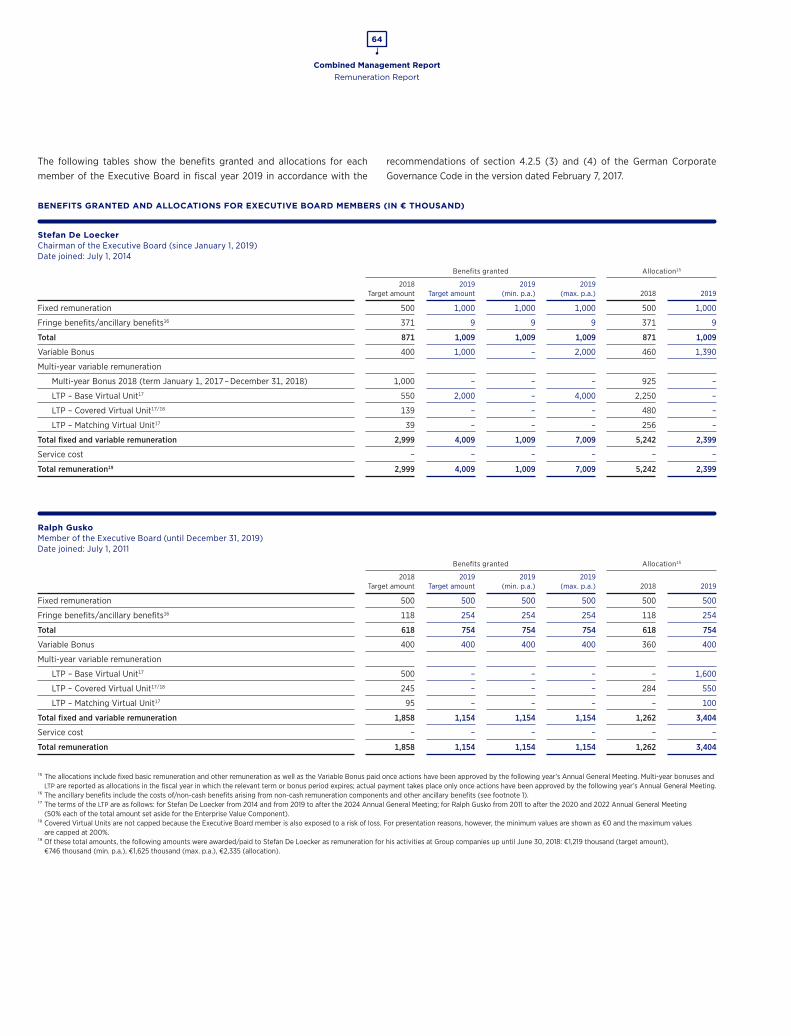
Combined Management Report
64
Remuneration Report
The following tables show the benefits granted and allocations for each member of the Executive Board in fiscal year 2019 in accordance with the
recommendations of section 4.2.5 (3) and (4) of the German Corporate Governance Code in the version dated February 7, 2017.
BENEFITS GRANTED AND ALLOCATIONS FOR EXECUTIVE BOARD MEMBERS (IN € THOUSAND)
Stefan De LoeckerChairman of the Executive Board (since January 1, 2019) Date joined: July 1, 2014
Benefits granted Allocation15
2018
Target amount2019
Target amount2019
(min. p.a.)2019
(max. p.a.) 2018 2019
Fixed remuneration 500 1,000 1,000 1,000 500 1,000
Fringe benefits/ancillary benefits16 371 9 9 9 371 9
Total 871 1,009 1,009 1,009 871 1,009
Variable Bonus 400 1,000 – 2,000 460 1,390
Multi-year variable remuneration
Multi-year Bonus 2018 (term January 1, 2017 – December 31, 2018) 1,000 – – – 925 –
LTP – Base Virtual Unit17 550 2,000 – 4,000 2,250 –
LTP – Covered Virtual Unit17/18 139 – – – 480 –
LTP – Matching Virtual Unit17 39 – – – 256 –
Total fixed and variable remuneration 2,999 4,009 1,009 7,009 5,242 2,399
Service cost – – – – – –
Total remuneration19 2,999 4,009 1,009 7,009 5,242 2,399
Ralph GuskoMember of the Executive Board (until December 31, 2019) Date joined: July 1, 2011
Benefits granted Allocation15
2018
Target amount2019
Target amount2019
(min. p.a.)2019
(max. p.a.) 2018 2019
Fixed remuneration 500 500 500 500 500 500
Fringe benefits/ancillary benefits16 118 254 254 254 118 254
Total 618 754 754 754 618 754
Variable Bonus 400 400 400 400 360 400
Multi-year variable remuneration
LTP – Base Virtual Unit17 500 – – – – 1,600
LTP – Covered Virtual Unit17/18 245 – – – 284 550
LTP – Matching Virtual Unit17 95 – – – – 100
Total fixed and variable remuneration 1,858 1,154 1,154 1,154 1,262 3,404
Service cost – – – – – –
Total remuneration 1,858 1,154 1,154 1,154 1,262 3,404
15 The allocations include fixed basic remuneration and other remuneration as well as the Variable Bonus paid once actions have been approved by the following year’s Annual General Meeting. Multi-year bonuses and LTP are reported as allocations in the fiscal year in which the relevant term or bonus period expires; actual payment takes place only once actions have been approved by the following year’s Annual General Meeting.
16 The ancillary benefits include the costs of/non-cash benefits arising from non-cash remuneration components and other ancillary benefits (see footnote 1).17 The terms of the LTP are as follows: for Stefan De Loecker from 2014 and from 2019 to after the 2024 Annual General Meeting; for Ralph Gusko from 2011 to after the 2020 and 2022 Annual General Meeting
(50% each of the total amount set aside for the Enterprise Value Component).18 Covered Virtual Units are not capped because the Executive Board member is also exposed to a risk of loss. For presentation reasons, however, the minimum values are shown as €0 and the maximum values
are capped at 200%.19 Of these total amounts, the following amounts were awarded/paid to Stefan De Loecker as remuneration for his activities at Group companies up until June 30, 2018: €1,219 thousand (target amount),
€746 thousand (min. p.a.), €1,625 thousand (max. p.a.), €2,335 (allocation).

Combined Management Report
65
Remuneration Report
BENEFITS GRANTED AND ALLOCATIONS FOR EXECUTIVE BOARD MEMBERS (IN € THOUSAND, CONTINUED)
Thomas IngelfingerMember of the Executive Board Date joined: July 1, 2014
Benefits granted Allocation20
2018
Target amount2019
Target amount2019
(min. p.a.)2019
(max. p.a.) 2018 2019
Fixed remuneration 450 450 450 450 450 450
Fringe benefits/ancillary benefits21 8 36 36 36 8 36
Total 458 486 486 486 458 486
Variable Bonus 350 350 – 700 315 462
Multi-year variable remuneration
LTP – Base Virtual Unit22 275 275 – 550 – –
LTP – Covered Virtual Unit22/23 124 127 – 193 – –
LTP – Matching Virtual Unit22 64 67 – 133 – –
Total fixed and variable remuneration 1,271 1,305 486 2,062 773 948
Service cost – – – – – –
Total remuneration 1,271 1,305 486 2,062 773 948
Zhengrong LiuMember of the Executive Board/Labor Relations Director Date joined: July 1, 2014
Benefits granted Allocation20
2018
Target amount2019
Target amount2019
(min. p.a.)2019
(max. p.a.) 2018 2019
Fixed remuneration 500 500 500 500 500 500
Fringe benefits/ancillary benefits21 40 39 39 39 40 39
Total 540 539 539 539 540 539
Variable Bonus 300 300 – 600 285 417
Multi-year variable remuneration
LTP – Base Virtual Unit22 500 500 – 1,000 – –
LTP – Covered Virtual Unit22/23 223 229 – 333 – –
LTP – Matching Virtual Unit22 75 75 – 150 – –
Total fixed and variable remuneration 1,638 1,643 539 2,622 825 956
Service cost – – – – – –
Total remuneration 1,638 1,643 539 2,622 825 956
20 See footnote 15 on the reporting of remuneration components as allocation.21 The ancillary benefits include the costs of/non-cash benefits arising from non-cash remuneration components and other ancillary benefits (see footnote 1). 22 The terms of the LTP are as follows: for Thomas Ingelfinger from 2014 to after the 2023 Annual General Meeting; for Zhengrong Liu from 2014 to after the 2024 Annual General Meeting.23 See footnote 18 on the reporting of the Covered Virtual Units.
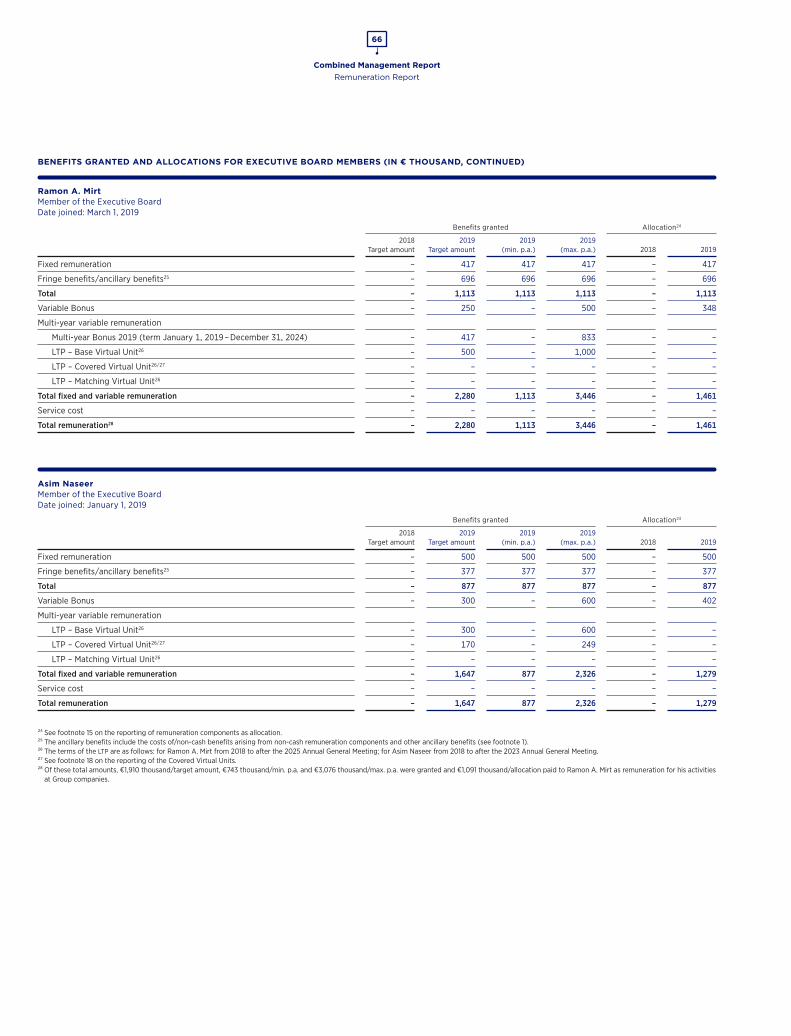
Combined Management Report
66
Remuneration Report
BENEFITS GRANTED AND ALLOCATIONS FOR EXECUTIVE BOARD MEMBERS (IN € THOUSAND, CONTINUED)
Ramon A. MirtMember of the Executive Board Date joined: March 1, 2019
Benefits granted Allocation24
2018
Target amount2019
Target amount2019
(min. p.a.)2019
(max. p.a.) 2018 2019
Fixed remuneration – 417 417 417 – 417
Fringe benefits/ancillary benefits25 – 696 696 696 – 696
Total – 1,113 1,113 1,113 – 1,113
Variable Bonus – 250 – 500 – 348
Multi-year variable remuneration
Multi-year Bonus 2019 (term January 1, 2019 – December 31, 2024) – 417 – 833 – –
LTP – Base Virtual Unit26 – 500 – 1,000 – –
LTP – Covered Virtual Unit26/27 – – – – – –
LTP – Matching Virtual Unit26 – – – – – –
Total fixed and variable remuneration – 2,280 1,113 3,446 – 1,461
Service cost – – – – – –
Total remuneration28 – 2,280 1,113 3,446 – 1,461
Asim NaseerMember of the Executive Board Date joined: January 1, 2019
Benefits granted Allocation24
2018
Target amount2019
Target amount2019
(min. p.a.)2019
(max. p.a.) 2018 2019
Fixed remuneration – 500 500 500 – 500
Fringe benefits/ancillary benefits25 – 377 377 377 – 377
Total – 877 877 877 – 877
Variable Bonus – 300 – 600 – 402
Multi-year variable remuneration
LTP – Base Virtual Unit26 – 300 – 600 – –
LTP – Covered Virtual Unit26/27 – 170 – 249 – –
LTP – Matching Virtual Unit26 – – – – – –
Total fixed and variable remuneration – 1,647 877 2,326 – 1,279
Service cost – – – – – –
Total remuneration – 1,647 877 2,326 – 1,279
24 See footnote 15 on the reporting of remuneration components as allocation.25 The ancillary benefits include the costs of/non-cash benefits arising from non-cash remuneration components and other ancillary benefits (see footnote 1).26 The terms of the LTP are as follows: for Ramon A. Mirt from 2018 to after the 2025 Annual General Meeting; for Asim Naseer from 2018 to after the 2023 Annual General Meeting.27 See footnote 18 on the reporting of the Covered Virtual Units.28 Of these total amounts, €1,910 thousand/target amount, €743 thousand/min. p.a. and €3,076 thousand/max. p.a. were granted and €1,091 thousand/allocation paid to Ramon A. Mirt as remuneration for his activities
at Group companies.

Combined Management Report
67
Remuneration Report
BENEFITS GRANTED AND ALLOCATIONS FOR EXECUTIVE BOARD MEMBERS (IN € THOUSAND, CONTINUED)
Dessi TemperleyMember of the Executive Board/CFO Date joined: July 1, 2018
Benefits granted Allocation29
2018
Target amount2019
Target amount2019
(min. p.a.)2019
(max. p.a.) 2018 2019
Fixed remuneration 240 480 480 480 240 480
Fringe benefits/ancillary benefits30 182 15 15 15 182 15
Total 422 495 495 495 422 495
Variable Bonus 150 300 – 600 158 417
Multi-year variable remuneration
LTP – Base Virtual Unit31 150 300 – 600 – –
LTP – Covered Virtual Unit31/32 49 101 – 126 – –
LTP – Matching Virtual Unit31 11 26 – 51 – –
Total fixed and variable remuneration 782 1,222 495 1,872 580 912
Service cost – – – – – –
Total remuneration 782 1,222 495 1,872 580 912
Vincent WarneryMember of the Executive Board Date joined: February 15, 2017
Benefits granted Allocation29
2018
Target amount2019
Target amount2019
(min. p.a.)2019
(max. p.a.) 2018 2019
Fixed remuneration 500 500 500 500 500 500
Fringe benefits/ancillary benefits30 33 14 14 14 33 14
Total 533 514 514 514 533 514
Variable Bonus 300 300 – 600 375 450
Multi-year variable remuneration
LTP – Base Virtual Unit31 500 500 – 1,000 – –
LTP – Covered Virtual Unit31/32 132 136 – 197 – –
LTP – Matching Virtual Unit31 107 111 – 222 – –
Total fixed and variable remuneration 1,572 1,561 514 2,533 908 964
Service cost – – – – – –
Total remuneration 1,572 1,561 514 2,533 908 964
29 See footnote 15 on the reporting of remuneration components as allocation.30 The ancillary benefits include the costs of/non-cash benefits arising from non-cash remuneration components and other ancillary benefits (see footnote 1).31 The terms of the LTP are as follows: for Dessi Temperley from 2018 to after the 2022 Annual General Meeting; for Vincent Warnery from 2017 to after the 2023 Annual General Meeting.32 See footnote 18 on the reporting of the Covered Virtual Units.
f) Former Members of the Executive Board and Their Surviving DependentsPayments to former members of the Executive Board and their surviving de-pendents totaled €4,523 thousand (previous year: €3,769 thousand). Provi-sions for pension commitments to former members of the Executive Board and their surviving dependents totaled €58,588 thousand (previous year: €36,822 thousand).
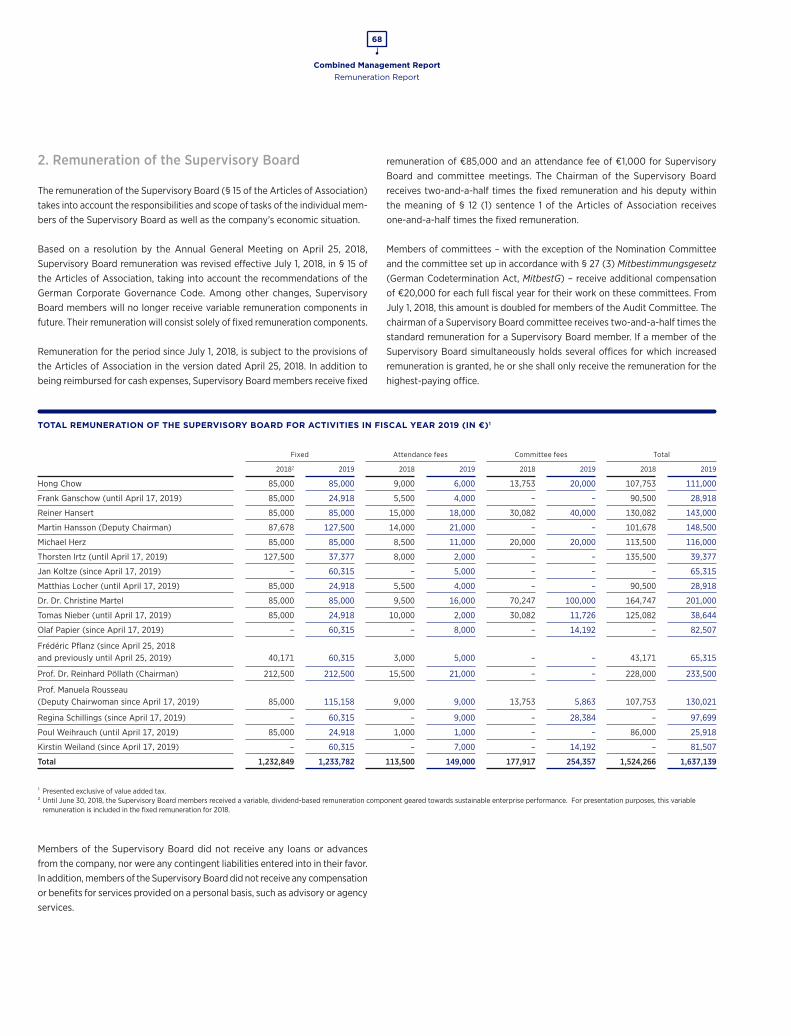
Combined Management Report
68
Remuneration Report
2. Remuneration of the Supervisory Board
The remuneration of the Supervisory Board (§ 15 of the Articles of Association) takes into account the responsibilities and scope of tasks of the individual mem-bers of the Supervisory Board as well as the company’s economic situation.
Based on a resolution by the Annual General Meeting on April 25, 2018, Supervisory Board remuneration was revised effective July 1, 2018, in § 15 of the Articles of Association, taking into account the recommendations of the German Corporate Governance Code. Among other changes, Supervisory Board members will no longer receive variable remuneration components in future. Their remuneration will consist solely of fixed remuneration components.
Remuneration for the period since July 1, 2018, is subject to the provisions of the Articles of Association in the version dated April 25, 2018. In addition to being reimbursed for cash expenses, Supervisory Board members receive fixed
remuneration of €85,000 and an attendance fee of €1,000 for Supervisory Board and committee meetings. The Chairman of the Supervisory Board receives two-and-a-half times the fixed remuneration and his deputy within the meaning of § 12 (1) sentence 1 of the Articles of Association receives one-and-a-half times the fixed remuneration.
Members of committees – with the exception of the Nomination Committee and the committee set up in accordance with § 27 (3) Mitbestimmungsgesetz (German Codetermination Act, MitbestG) – receive additional compensation of €20,000 for each full fiscal year for their work on these committees. From July 1, 2018, this amount is doubled for members of the Audit Committee. The chairman of a Supervisory Board committee receives two-and-a-half times the standard remuneration for a Supervisory Board member. If a member of the Supervisory Board simultaneously holds several offices for which increased remuneration is granted, he or she shall only receive the remuneration for the highest-paying office.
TOTAL REMUNERATION OF THE SUPERVISORY BOARD FOR ACTIVITIES IN FISCAL YEAR 2019 (IN €)1
Fixed Attendance fees Committee fees Total
20182 2019 2018 2019 2018 2019 2018 2019
Hong Chow 85,000 85,000 9,000 6,000 13,753 20,000 107,753 111,000
Frank Ganschow (until April 17, 2019) 85,000 24,918 5,500 4,000 – – 90,500 28,918
Reiner Hansert 85,000 85,000 15,000 18,000 30,082 40,000 130,082 143,000
Martin Hansson (Deputy Chairman) 87,678 127,500 14,000 21,000 – – 101,678 148,500
Michael Herz 85,000 85,000 8,500 11,000 20,000 20,000 113,500 116,000
Thorsten Irtz (until April 17, 2019) 127,500 37,377 8,000 2,000 – – 135,500 39,377
Jan Koltze (since April 17, 2019) – 60,315 – 5,000 – – – 65,315
Matthias Locher (until April 17, 2019) 85,000 24,918 5,500 4,000 – – 90,500 28,918
Dr. Dr. Christine Martel 85,000 85,000 9,500 16,000 70,247 100,000 164,747 201,000
Tomas Nieber (until April 17, 2019) 85,000 24,918 10,000 2,000 30,082 11,726 125,082 38,644
Olaf Papier (since April 17, 2019) – 60,315 – 8,000 – 14,192 – 82,507
Frédéric Pflanz (since April 25, 2018 and previously until April 25, 2019) 40,171 60,315 3,000 5,000 – – 43,171 65,315
Prof. Dr. Reinhard Pöllath (Chairman) 212,500 212,500 15,500 21,000 – – 228,000 233,500
Prof. Manuela Rousseau (Deputy Chairwoman since April 17, 2019) 85,000 115,158 9,000 9,000 13,753 5,863 107,753 130,021
Regina Schillings (since April 17, 2019) – 60,315 – 9,000 – 28,384 – 97,699
Poul Weihrauch (until April 17, 2019) 85,000 24,918 1,000 1,000 – – 86,000 25,918
Kirstin Weiland (since April 17, 2019) – 60,315 – 7,000 – 14,192 – 81,507
Total 1,232,849 1,233,782 113,500 149,000 177,917 254,357 1,524,266 1,637,139
1 Presented exclusive of value added tax.2 Until June 30, 2018, the Supervisory Board members received a variable, dividend-based remuneration component geared towards sustainable enterprise performance. For presentation purposes, this variable
remuneration is included in the fixed remuneration for 2018.
Members of the Supervisory Board did not receive any loans or advances from the company, nor were any contingent liabilities entered into in their favor. In addition, members of the Supervisory Board did not receive any compensation or benefits for services provided on a personal basis, such as advisory or agency services.
Combined Management Report
69
Report by the Executive Board on Dealings among Group Companies | Disclosures Pursuant to Takeover Law
Report by the Executive Board on Dealings among Group Companies
In accordance with § 312 Aktiengesetz (German Stock Corporation Act, AktG), the Executive Board has issued a report on dealings among Group companies which contains the following concluding declaration: “According to the circum-stances known to us at the time transactions were executed or measures were taken or not taken, Beiersdorf Aktiengesellschaft received appropriate consid-eration for every transaction and has not been disadvantaged by the fact that measures were taken or not taken.”
Disclosures Pursuant to Takeover Law
The disclosures required under § 315a (1) Handelsgesetzbuch (German Commercial Code, HGB) and § 289a (1) HGB are presented below.
Please refer to the notes to the consolidated financial statements for the dis-closures on the composition of the subscribed capital and the disclosures on direct or indirect interests in the share capital exceeding 10% of the voting rights.
The appointment and removal from office of members of the Executive Board are governed by §§ 84 and 85 AktG, § 31 Mitbestimmungsgesetz (German Codetermination Act, MitbestG), and § 7 of the Articles of Association. In accordance with § 7 (1) of the Articles of Association, the Executive Board consists of at least three members; apart from this provision, the Supervisory Board determines the number of members of the Executive Board. The Arti-cles of Association may be amended in accordance with §§ 179 and 133 AktG and with § 16 of the Articles of Association. Under § 16 (1) of the Articles of Association, the Supervisory Board is authorized to resolve amendments and additions to the Articles of Association that concern the latter’s wording only. Under § 5 (6) of the Articles of Association, the Supervisory Board is author-ized in particular to amend and reformulate § 5 of the Articles of Association (Share Capital) following each utilization of authorized or contingent capital.
The Annual General Meeting on March 31, 2015, authorized the Executive Board to increase the share capital with the approval of the Supervisory Board in the period until March 30, 2020, by up to a total of €92 million (Authorized Capital I: €42 million; Authorized Capital II: €25 million; Authorized Capital III: €25 million) by issuing new no-par-value bearer shares on one or several occasions. In this context, the dividend rights for new shares may be determined in deviation from § 60 (2) AktG.
Shareholders must be granted preemptive rights. However, the Executive Board is authorized, with the approval of the Supervisory Board, to disapply share-holders’ preemptive rights in the following cases:
1. to eliminate fractions created as a result of capital increases against cash contributions (Authorized Capital I, II, III);
2. to the extent necessary to grant the holders/creditors of convertible bonds or bonds with warrants issued by Beiersdorf Aktiengesellschaft, or companies in which it holds a direct or indirect majority interest, rights to subscribe for new shares in the amount to which they would be entitled after exercising their conversion or option rights, or after fulfilling their conversion obligation (Authorized Capital I, II, III);
3. if the total amount of share capital attributable to the new shares for which preemptive rights are to be disapplied does not exceed 10% of the share capital existing at the time this authorization comes into effect or – in the event that this amount is lower – at the time the new shares are issued and the issue price of the new shares is not materially lower than the quoted market price of the existing listed shares at the time when the issue price is finalized, which should be as near as possible to the time the shares are placed. If, during the term of the authorized capital, other authorizations to issue or sell shares in the company or to issue rights that enable or oblige the holder to subscribe for shares in the company are exercised while dis-applying preemptive rights pursuant to or in accordance with § 186 (3) sentence 4 AktG, this must be counted toward the above-mentioned 10% limit (Authorized Capital II);
4. in the case of capital increases against non-cash contributions for the purpose of acquiring companies, business units of companies, or equity interests in companies (Authorized Capital III).
The Executive Board may only exercise the above authorizations to disapply preemptive rights to the extent that the total proportionate interest in the share capital attributable to the shares issued while disapplying preemptive rights does not exceed 20% of the share capital at the time these authorizations become effective or at the time these authorizations are exercised. If other authorizations to issue or sell shares in the company or to issue rights that enable or oblige the holder to subscribe for shares in the company are exer-cised while disapplying preemptive rights during the term of the authorized capital until such time as it is utilized, this must be counted towards the above-mentioned limit.
Combined Management Report
70
Disclosures Pursuant to Takeover Law
The Executive Board was also authorized to determine the further details of the capital increase and its implementation with the approval of the Super visory Board.
In addition, the Annual General Meeting on March 31, 2015, resolved to contin-gently increase the share capital by up to a total of €42 million, composed of up to 42 million no-par-value bearer shares. The contingent capital increase will be implemented only to the extent that:
1. the holders or creditors of conversion and/or option rights attached to convertible bonds and/or bonds with warrants issued in the period until March 30, 2020, by Beiersdorf Aktiengesellschaft, or companies in which it holds a direct or indirect majority interest, choose to exercise their conversion or option rights, or
2. the holders or creditors of convertible bonds giving rise to a conversion obligation issued in the period until March 30, 2020, by Beiersdorf Aktien-gesellschaft, or companies in which it holds a direct or indirect majority interest, comply with such obligation,
and the contingent capital is required for this in accordance with the terms and conditions of the bonds.
The new shares bear dividend rights from the beginning of the fiscal year in which they are created as a result of the exercise of conversion or option rights, or as a result of compliance with a conversion obligation.
The Executive Board was authorized to determine the further details of the implementation of a contingent capital increase.
The Annual General Meeting on March 31, 2015, also authorized the company in accordance with § 71 (1) no. 8 AktG to purchase own shares in the total amount of up to 10% of the existing share capital in the period up to March 30, 2020. The shares shall be purchased via the stock exchange or via a public pur-chase offer addressed to all shareholders, or a public invitation to tender shares. The Annual General Meeting authorized the Executive Board to sell in whole or in part the own shares purchased on the basis of the above-mentioned or a prior authorization with the approval of the Supervisory Board while disapply-ing the shareholders’ preemptive rights, including in a way other than via the stock exchange or via a purchase offer to all shareholders, to the extent that these shares are sold for cash at a price that does not fall materially below the
market price of the same class of shares of the company at the time of the sale. The Executive Board was also authorized to sell in whole or in part the own shares acquired in accordance with the above-mentioned or a previous author-ization with the approval of the Supervisory Board against non-cash consider-ation while disapplying the preemptive rights of shareholders, particularly to utilize them as consideration or partial consideration in the context of a merger or the acquisition of companies, equity interests in companies (including increases in equity interests), or business units of companies. Moreover, the Executive Board is authorized, with the approval of the Supervisory Board, to utilize these own shares in whole or in part, while disapplying the preemptive rights of shareholders, in order to satisfy the subscription and/or conversion rights from convertible bonds and/or bonds with warrants issued by the com-pany or companies in which it holds a direct or indirect majority interest. The Executive Board is further authorized, in the event that own shares are sold to all shareholders, to disapply the preemptive rights of shareholders where this is necessary to eliminate any fractions that may arise. The Executive Board may only make use of the above authorizations to disapply preemptive rights when utilizing own shares to the extent that the total proportion of shares utilized without preemptive rights does not exceed 20% of the share capital either at the time of the resolution by the Annual General Meeting or at the time these authorizations are exercised. If, during the term of this authorization to utilize own shares, other authorizations to issue or sell shares in the company or to issue rights that enable or oblige the holder to acquire shares in the company are exercised while disapplying preemptive rights, this must be counted toward the above-mentioned limit.
Finally, the Executive Board was authorized to retire the own shares acquired in accordance with the above-mentioned or a prior authorization with the approval of the Supervisory Board without requiring an additional resolution by the Annual General Meeting.
The creation of the authorized and contingent capital is intended to put the company in the position of being able to react to growth opportunities and capital market opportunities quickly and flexibly. The authorization to purchase and utilize own shares enables the company in particular to also offer shares in the company to institutional or other investors and/or to expand the share-holder base of the company, as well as to utilize the purchased own shares as consideration or partial consideration for the acquisition of companies or equity interests in companies (including increases in equity interests), or as part of a merger, i.e. against non-cash consideration.
Consolidated Financial Statements
71
Pages 71 – 114
Consolidated Financial
Statements
Consolidated Financial Statementsp. 72 Income Statement
p. 72 Statement of Comprehensive Income
p. 73 Balance Sheet
p. 74 Cash Flow Statement
p. 75 Statement of Changes in Equity
Notes to the Consolidated Financial Statementsp. 76 Segment Reporting
p. 76 Regional Reporting
p. 77 Significant Accounting Policies
p. 84 Consolidated Group, Acquisitions, and Divestments
p. 85 Notes to the Income Statement
p. 88 Notes to the Balance Sheet
p. 103 Other Disclosures
p. 107 Report on Post-Balance Sheet Date Events
p. 107 Beiersdorf AG Boards
Attestationsp. 109 Independent Auditor’s Report
p. 114 Responsibility Statement by the Executive Board
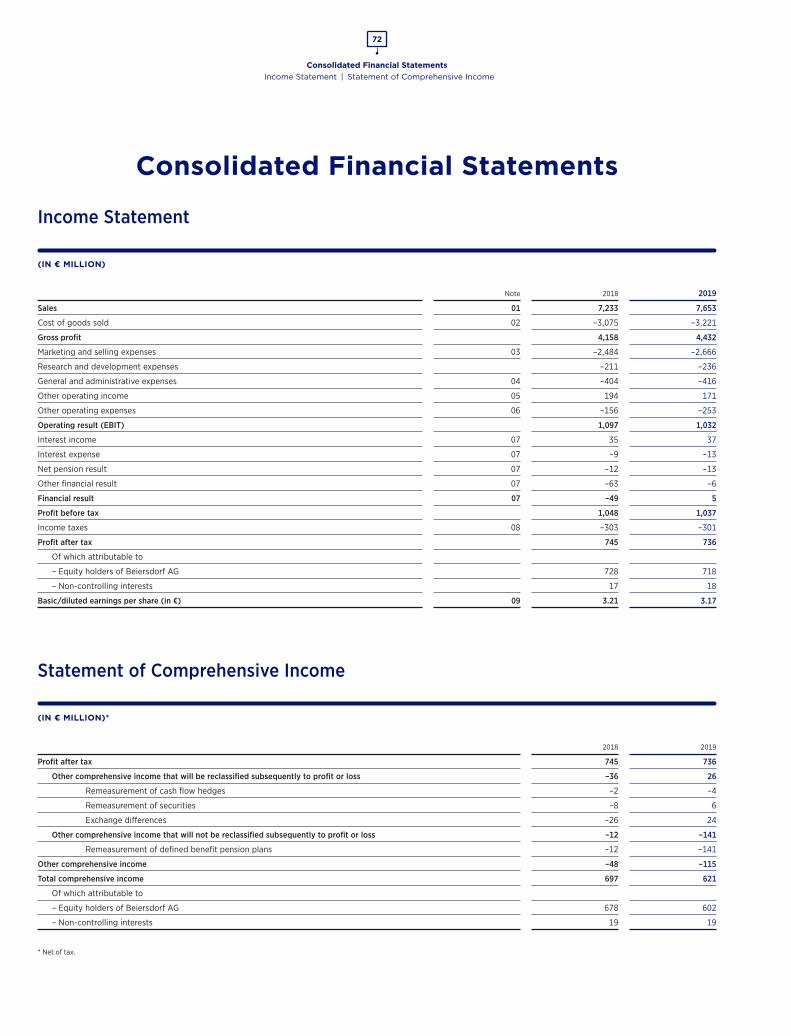
Consolidated Financial Statements
72
Income Statement | Statement of Comprehensive Income
Income Statement
(IN € MILLION)
Note 2018 2019
Sales 01 7,233 7,653
Cost of goods sold 02 –3,075 –3,221
Gross profit 4,158 4,432
Marketing and selling expenses 03 –2,484 –2,666
Research and development expenses –211 –236
General and administrative expenses 04 –404 –416
Other operating income 05 194 171
Other operating expenses 06 –156 –253
Operating result (EBIT) 1,097 1,032
Interest income 07 35 37
Interest expense 07 –9 –13
Net pension result 07 –12 –13
Other financial result 07 –63 –6
Financial result 07 –49 5
Profit before tax 1,048 1,037
Income taxes 08 –303 –301
Profit after tax 745 736
Of which attributable to
– Equity holders of Beiersdorf AG 728 718
– Non-controlling interests 17 18
Basic/diluted earnings per share (in €) 09 3.21 3.17
Statement of Comprehensive Income
(IN € MILLION)*
2018 2019
Profit after tax 745 736
Other comprehensive income that will be reclassified subsequently to profit or loss –36 26
Remeasurement of cash flow hedges –2 –4
Remeasurement of securities –8 6
Exchange differences –26 24
Other comprehensive income that will not be reclassified subsequently to profit or loss –12 –141
Remeasurement of defined benefit pension plans –12 –141
Other comprehensive income –48 –115
Total comprehensive income 697 621
Of which attributable to
– Equity holders of Beiersdorf AG 678 602
– Non-controlling interests 19 19
* Net of tax.
Consolidated Financial Statements
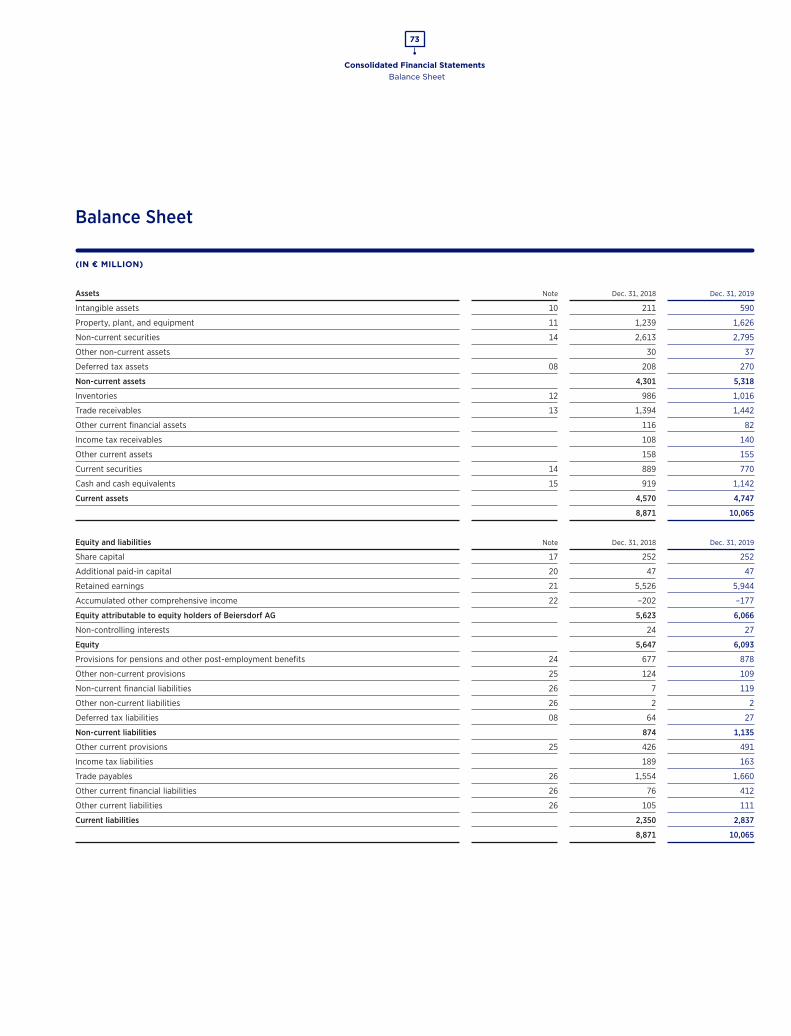
Consolidated Financial Statements
73
Balance Sheet
Balance Sheet
(IN € MILLION)
Assets Note Dec. 31, 2018 Dec. 31, 2019
Intangible assets 10 211 590
Property, plant, and equipment 11 1,239 1,626
Non-current securities 14 2,613 2,795
Other non-current assets 30 37
Deferred tax assets 08 208 270
Non-current assets 4,301 5,318
Inventories 12 986 1,016
Trade receivables 13 1,394 1,442
Other current financial assets 116 82
Income tax receivables 108 140
Other current assets 158 155
Current securities 14 889 770
Cash and cash equivalents 15 919 1,142
Current assets 4,570 4,747
8,871 10,065
Equity and liabilities Note Dec. 31, 2018 Dec. 31, 2019
Share capital 17 252 252
Additional paid-in capital 20 47 47
Retained earnings 21 5,526 5,944
Accumulated other comprehensive income 22 –202 –177
Equity attributable to equity holders of Beiersdorf AG 5,623 6,066
Non-controlling interests 24 27
Equity 5,647 6,093
Provisions for pensions and other post-employment benefits 24 677 878
Other non-current provisions 25 124 109
Non-current financial liabilities 26 7 119
Other non-current liabilities 26 2 2
Deferred tax liabilities 08 64 27
Non-current liabilities 874 1,135
Other current provisions 25 426 491
Income tax liabilities 189 163
Trade payables 26 1,554 1,660
Other current financial liabilities 26 76 412
Other current liabilities 26 105 111
Current liabilities 2,350 2,837
8,871 10,065
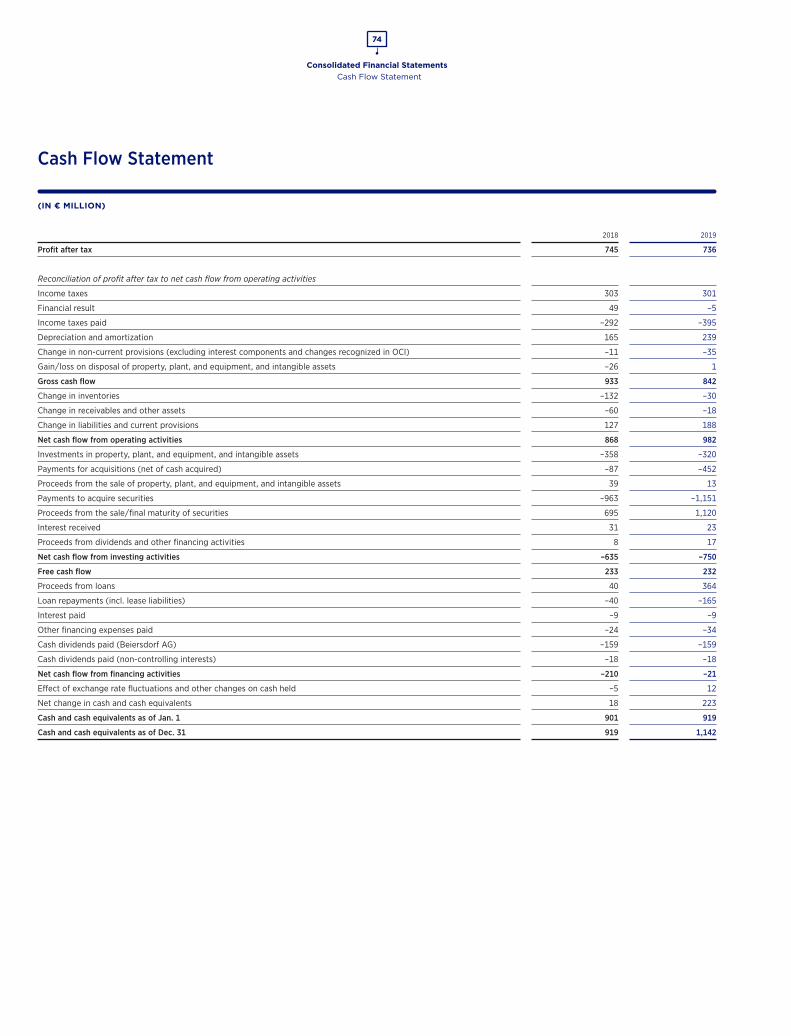
Consolidated Financial Statements
74
Cash Flow Statement
Cash Flow Statement
(IN € MILLION)
2018 2019
Profit after tax 745 736
Reconciliation of profit after tax to net cash flow from operating activities
Income taxes 303 301
Financial result 49 –5
Income taxes paid –292 –395
Depreciation and amortization 165 239
Change in non-current provisions (excluding interest components and changes recognized in OCI) –11 –35
Gain/loss on disposal of property, plant, and equipment, and intangible assets –26 1
Gross cash flow 933 842
Change in inventories –132 –30
Change in receivables and other assets –60 –18
Change in liabilities and current provisions 127 188
Net cash flow from operating activities 868 982
Investments in property, plant, and equipment, and intangible assets –358 –320
Payments for acquisitions (net of cash acquired) –87 –452
Proceeds from the sale of property, plant, and equipment, and intangible assets 39 13
Payments to acquire securities –963 –1,151
Proceeds from the sale/final maturity of securities 695 1,120
Interest received 31 23
Proceeds from dividends and other financing activities 8 17
Net cash flow from investing activities –635 –750
Free cash flow 233 232
Proceeds from loans 40 364
Loan repayments (incl. lease liabilities) –40 –165
Interest paid –9 –9
Other financing expenses paid –24 –34
Cash dividends paid (Beiersdorf AG) –159 –159
Cash dividends paid (non-controlling interests) –18 –18
Net cash flow from financing activities –210 –21
Effect of exchange rate fluctuations and other changes on cash held –5 12
Net change in cash and cash equivalents 18 223
Cash and cash equivalents as of Jan. 1 901 919
Cash and cash equivalents as of Dec. 31 919 1,142
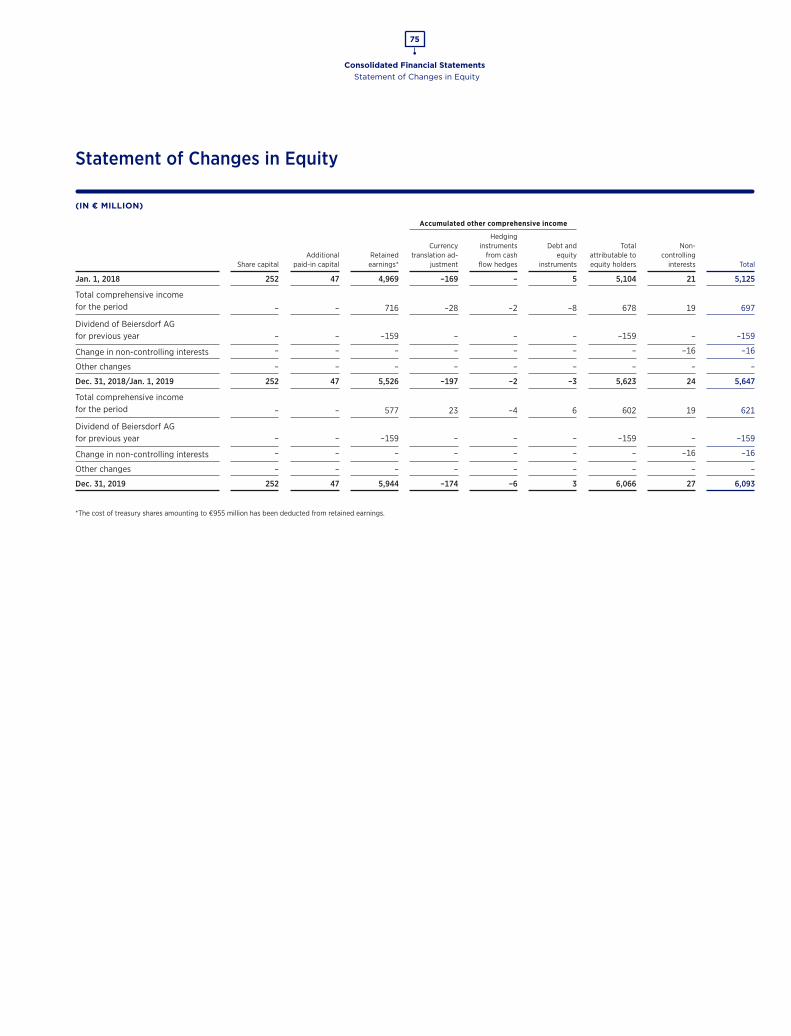
Consolidated Financial Statements
75
Statement of Changes in Equity
Statement of Changes in Equity
(IN € MILLION)
Accumulated other comprehensive income
Share capitalAdditional
paid-in capitalRetained earnings*
Currency translation ad-
justment
Hedging instruments
from cash flow hedges
Debt and equity
instruments
Total attributable to equity holders
Non- controlling
interests Total
Jan. 1, 2018 252 47 4,969 –169 – 5 5,104 21 5,125
Total comprehensive income for the period – – 716 –28 –2 –8 678 19 697
Dividend of Beiersdorf AG for previous year – – –159 – – – –159 – –159
Change in non-controlling interests – – – – – – – –16 –16
Other changes – – – – – – – – –
Dec. 31, 2018/Jan. 1, 2019 252 47 5,526 –197 –2 –3 5,623 24 5,647
Total comprehensive income for the period – – 577 23 –4 6 602 19 621
Dividend of Beiersdorf AG for previous year – – –159 – – – –159 – –159
Change in non-controlling interests – – – – – – – –16 –16
Other changes – – – – – – – – –
Dec. 31, 2019 252 47 5,944 –174 –6 3 6,066 27 6,093
*The cost of treasury shares amounting to €955 million has been deducted from retained earnings.

Consolidated Financial Statements
76
Consolidated Financial StatementsSegment Reporting | Regional Reporting
Segment Reporting
(IN € MILLION)
Consumer tesa Group
2018 2019 2018 2019 2018 2019
Net sales 5,890 6,274 1,343 1,379 7,233 7,653
Change (nominal) (in %) 1.6 6.5 6.8 2.7 2.5 5.8
Change (organic) (in %) 5.0 4.8 6.8 0.8 5.4 4.1
Share of Group sales (in %) 81.4 82.0 18.6 18.0 100 100
EBITDA*** 1,006 1,007 256 263 1,262 1,270
Operating result (EBIT) 887 839 210 193 1,097 1,032
as % of sales 15.1 13.4 15.7 13.9 15.2 13.5
Operating result (EBIT, excluding special factors)* 903 883 210 212 1,113 1,095
as % of sales 15.3 14.1 15.7 15.3 15.4 14.3
Gross operating capital* 2,963 3,738 1,055 1,092 4,018 4,830
Operating liabilities* 1,921 2,097 263 251 2,184 2,348
EBIT return on net operating capital* (in %) 85.2 51.2 26.6 22.9 59.9 41.6
Gross cash flow 741 667 192 175 933 842
Capital expenditure** 320 700 143 65 463 765
Depreciation and amortization*** 119 168 46 71 165 239
Research and development expenses 155 177 56 59 211 236
Employees (as of Dec. 31) 15,142 15,728 4,917 4,926 20,059 20,654
Regional Reporting
(IN € MILLION)
Europe Americas Africa/Asia/Australia Group
2018 2019 2018 2019 2018 2019 2018 2019
Net sales 3,673 3,757 1,267 1,372 2,293 2,524 7,233 7,653
Change (nominal) (in %) 2.9 2.3 –3.1 8.3 5.1 10.1 2.5 5.8
Change (organic) (in %) 4.0 1.8 2.3 4.1 9.4 7.8 5.4 4.1
Share of Group sales (in %) 50.8 49.1 17.5 17.9 31.7 33.0 100.0 100.0
EBITDA*** 757 708 151 146 354 416 1,262 1,270
Operating result (EBIT) 637 564 132 109 328 359 1,097 1,032
as % of sales 17.3 15.0 10.4 7.9 14.3 14.2 15.2 13.5
Operating result (EBIT, excluding special factors)* 637 591 132 125 344 379 1,113 1,095
as % of sales 17.3 15.7 10.4 9.1 15.0 15.0 15.4 14.3
Capital expenditure** 246 412 138 269 79 84 463 765
Depreciation and amortization*** 121 145 18 37 26 57 165 239
Employees (as of Dec. 31) 11,709 11,727 3,011 3,476 5,339 5,451 20,059 20,654
* See the disclosures contained in the section entitled “Notes to the Segment Reporting.”** Figures comprise investments in intangible assets and property, plant, and equipment including acquisitions.
*** Due to the first-time application of IFRS 16 in fiscal year 2019, prior-year figures are not comparable (initial depreciation of right-of-use assets).
Notes to the Consolidated Financial Statements
Consolidated Financial Statements
77
Significant Accounting Policies
Significant Accounting Policies
Information on the Company and on the Group
The registered office of Beiersdorf AG is located at Unnastrasse 48 in Hamburg (Germany), and the company is registered with the commercial register of the Hamburg Local Court under the number HRB 1787. Beiersdorf AG is included in the consolidated financial statements of maxingvest ag.
The activities of Beiersdorf AG and its affiliates (“Beiersdorf Group”) consist primarily of the manufacture and distribution of branded consumer goods in the area of skin and body care, and of the manufacture and distribution of technical adhesive tapes.
The consolidated financial statements of Beiersdorf AG for the fiscal year from January 1 to December 31, 2019, were prepared by the Executive Board on February 11, 2020, and subsequently submitted to the Supervisory Board for examination and approval.
General Principles
The consolidated financial statements of Beiersdorf AG have been prepared in accordance with the International Financial Reporting Standards (IFRSs) issued by the International Accounting Standards Board (IASB), including the IFRS In-terpretations issued by the International Financial Reporting Interpretations Committee (IFRIC) and the supplementary provisions of German commercial law required to be applied under § 315e (1) Handelsgesetzbuch (German Com-mercial Code, HGB). All IFRSs and IFRICs endorsed by the European Commis-sion and required to be applied as of December 31, 2019, were applied.
The consolidated financial statements were prepared using the historical cost convention. Exceptions to this rule relate to financial instruments assigned to the categories “at fair value through other comprehensive income” (FVOCI) and “at fair value through profit or loss” (FVPL), and derivative financial instru-ments, which are all measured at fair value.
The consolidated income statement was prepared using the cost of sales method.
Estimates and Assumptions
Preparation of the consolidated financial statements requires management to make estimates and assumptions to a limited extent that affect the amount and presentation of recognized assets and liabilities, income and expenses, and contingent liabilities. Such estimates and assumptions reflect all currently avail-
able information. Significant estimates and assumptions were made in particu-lar in relation to the following accounting policies: impairment testing of good-will and indefinite-lived intangible assets (Note 10 “Intangible Assets”), impair-ments of financial assets (Note 27 “Additional Disclosures on Financial Instru-ments, Financial Risk Management, and Derivative Financial Instruments”), the actuarial assumptions for the defined benefit expense as well as for the present value of pension commitments (Note 24 “Provisions for Pensions and Other Post-employment Benefits”), the determination of the amount of eligible de-ferred tax assets (Note 08 “Income Taxes”), and the recognition of other pro-visions (Note 25 “Other Provisions”). Given the uncertainty that exists when recognizing the legal risks arising from claims for damages in particular (Note 28 “Contingent Liabilities, Other Financial Obligations, and Legal Risks”), sig-nificant discretion must be exercised in evaluating whether and to what extent potential damages have arisen and how large the claim could be. In determin-ing the amount of possible damages, there is particular discretion in relation to determining the nature of the factors “overcharge” and “pass-on rate” on which the calculation is based. Furthermore, estimates and assumptions are made in particular when determining the useful lives of intangible assets and property, plant, and equipment, and when measuring inventories.
Actual amounts may differ from these estimates. Changes to estimates are rec-ognized in profit or loss when more recent knowledge becomes available.
Consolidation Principles
Acquisition accounting uses the purchase method, under which the cost of the business combination is allocated to the identifiable assets acquired and iden-tifiable liabilities and contingent liabilities assumed, measured at their fair values at the acquisition date. The cost of an acquisition is the sum of the con-sideration transferred, measured at fair value at the acquisition date, and the non-controlling interests in the acquiree. For each business combination, the non-controlling interests in the acquiree are measured either at fair value or at the proportionate share of the acquiree’s identifiable net assets. Any excess of the cost of the business combination over the acquirer’s interest in the net fair values of identifiable assets, liabilities, and contingent liabilities is recognized as goodwill. Costs incurred in the course of the business combination are rec-ognized as an expense.
Profit and equity of subsidiaries attributable to non-controlling interests are presented separately in the consolidated income statement and as a compo-nent of equity in the consolidated balance sheet. Losses at a subsidiary are attributed to the non-controlling interests even if this results in a negative bal-ance. In the case of successive purchases of the shares of subsidiaries, the dif-ference between the cost of the new shares and the non-controlling interests previously recognized in the Group for these shares is recognized in other com-prehensive income. In a business combination achieved in stages, the effects from acquisition-date fair value remeasurement of previously held equity
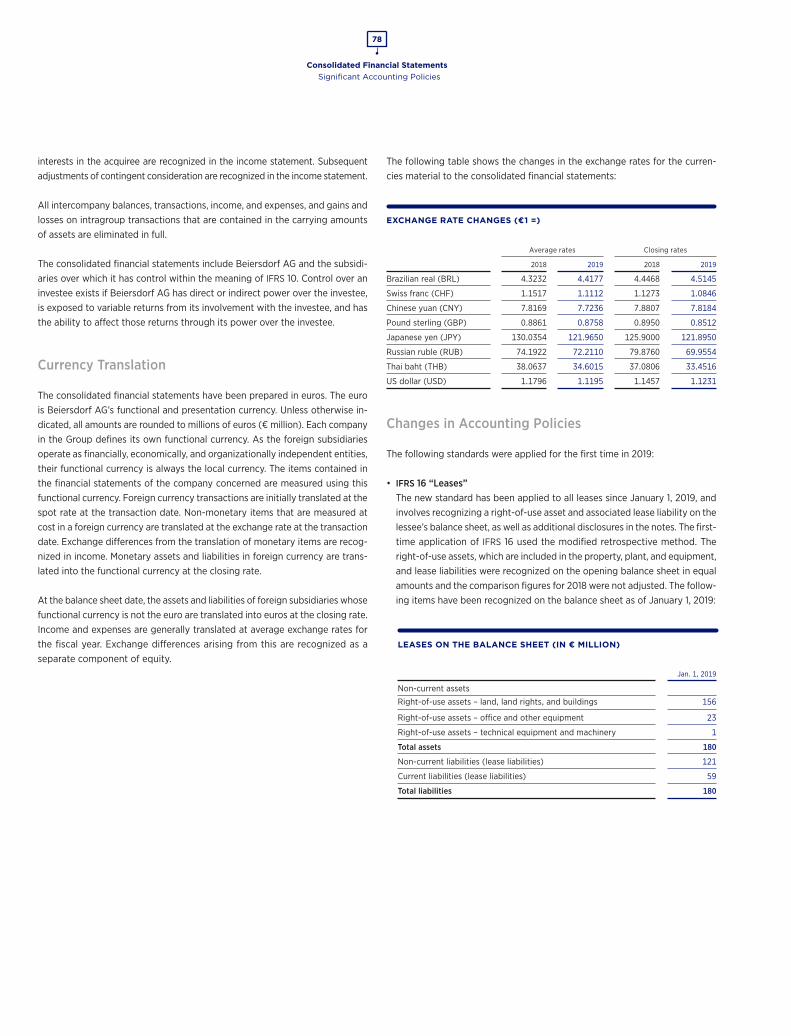
Consolidated Financial Statements
78
Significant Accounting Policies
interests in the acquiree are recognized in the income statement. Subsequent adjustments of contingent consideration are recognized in the income statement.
All intercompany balances, transactions, income, and expenses, and gains and losses on intragroup transactions that are contained in the carrying amounts of assets are eliminated in full.
The consolidated financial statements include Beiersdorf AG and the subsidi-aries over which it has control within the meaning of IFRS 10. Control over an investee exists if Beiersdorf AG has direct or indirect power over the investee, is exposed to variable returns from its involvement with the investee, and has the ability to affect those returns through its power over the investee.
Currency Translation
The consolidated financial statements have been prepared in euros. The euro is Beiersdorf AG’s functional and presentation currency. Unless otherwise in-dicated, all amounts are rounded to millions of euros (€ million). Each company in the Group defines its own functional currency. As the foreign subsidiaries operate as financially, economically, and organizationally independent entities, their functional currency is always the local currency. The items contained in the financial statements of the company concerned are measured using this functional currency. Foreign currency transactions are initially translated at the spot rate at the transaction date. Non-monetary items that are measured at cost in a foreign currency are translated at the exchange rate at the transaction date. Exchange differences from the translation of monetary items are recog-nized in income. Monetary assets and liabilities in foreign currency are trans-lated into the functional currency at the closing rate.
At the balance sheet date, the assets and liabilities of foreign subsidiaries whose functional currency is not the euro are translated into euros at the closing rate. Income and expenses are generally translated at average exchange rates for the fiscal year. Exchange differences arising from this are recognized as a separate component of equity.
The following table shows the changes in the exchange rates for the curren-cies material to the consolidated financial statements:
EXCHANGE RATE CHANGES (€1 =)
Average rates Closing rates
2018 2019 2018 2019
Brazilian real (BRL) 4.3232 4.4177 4.4468 4.5145
Swiss franc (CHF) 1.1517 1.1112 1.1273 1.0846
Chinese yuan (CNY) 7.8169 7.7236 7.8807 7.8184
Pound sterling (GBP) 0.8861 0.8758 0.8950 0.8512
Japanese yen (JPY) 130.0354 121.9650 125.9000 121.8950
Russian ruble (RUB) 74.1922 72.2110 79.8760 69.9554
Thai baht (THB) 38.0637 34.6015 37.0806 33.4516
US dollar (USD) 1.1796 1.1195 1.1457 1.1231
Changes in Accounting Policies
The following standards were applied for the first time in 2019:
• IFRS 16 “Leases” The new standard has been applied to all leases since January 1, 2019, and involves recognizing a right-of-use asset and associated lease liability on the lessee’s balance sheet, as well as additional disclosures in the notes. The first-time application of IFRS 16 used the modified retrospective method. The right-of-use assets, which are included in the property, plant, and equipment, and lease liabilities were recognized on the opening balance sheet in equal amounts and the comparison figures for 2018 were not adjusted. The follow-ing items have been recognized on the balance sheet as of January 1, 2019:
LEASES ON THE BALANCE SHEET (IN € MILLION)
Jan. 1, 2019
Non-current assets
Right-of-use assets – land, land rights, and buildings 156
Right-of-use assets – office and other equipment 23
Right-of-use assets – technical equipment and machinery 1
Total assets 180
Non-current liabilities (lease liabilities) 121
Current liabilities (lease liabilities) 59
Total liabilities 180
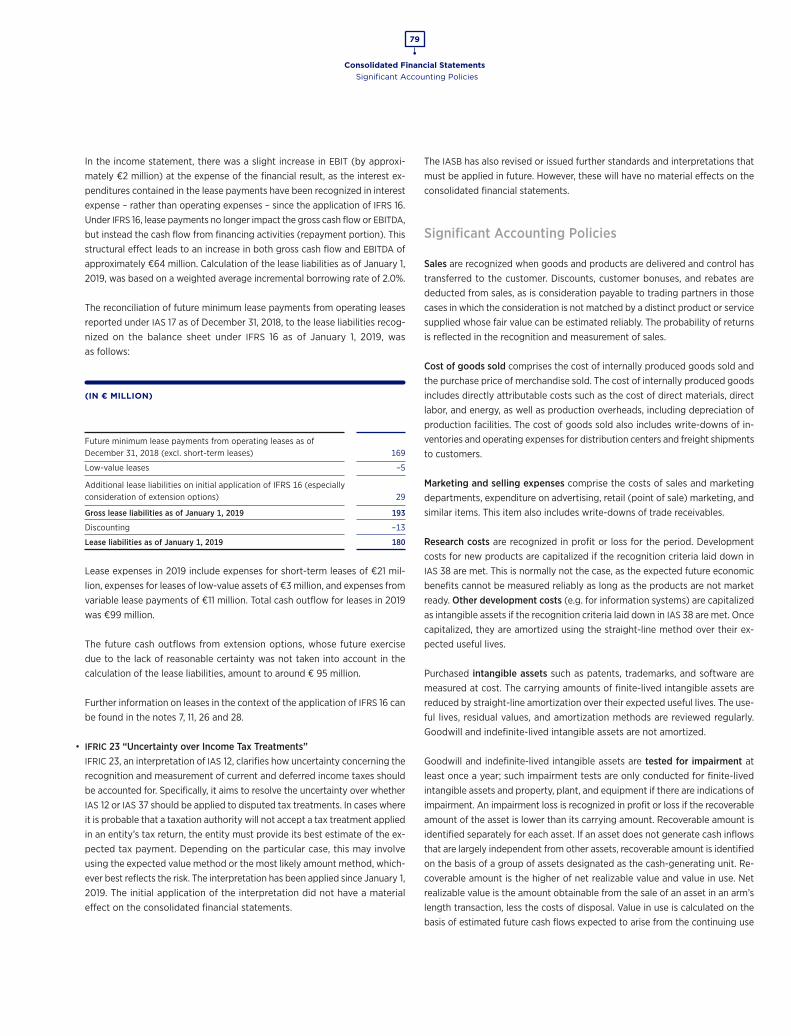
Consolidated Financial Statements
79
Significant Accounting Policies
In the income statement, there was a slight increase in EBIT (by approxi-mately €2 million) at the expense of the financial result, as the interest ex-penditures contained in the lease payments have been recognized in interest expense – rather than operating expenses – since the application of IFRS 16. Under IFRS 16, lease payments no longer impact the gross cash flow or EBITDA, but instead the cash flow from financing activities (repayment portion). This structural effect leads to an increase in both gross cash flow and EBITDA of approximately €64 million. Calculation of the lease liabilities as of January 1, 2019, was based on a weighted average incremental borrowing rate of 2.0%.
The reconciliation of future minimum lease payments from operating leases reported under IAS 17 as of December 31, 2018, to the lease liabilities recog-nized on the balance sheet under IFRS 16 as of January 1, 2019, was as follows:
(IN € MILLION)
Future minimum lease payments from operating leases as of December 31, 2018 (excl. short-term leases) 169
Low-value leases –5
Additional lease liabilities on initial application of IFRS 16 (especially consideration of extension options) 29
Gross lease liabilities as of January 1, 2019 193
Discounting –13
Lease liabilities as of January 1, 2019 180
Lease expenses in 2019 include expenses for short-term leases of €21 mil-lion, expenses for leases of low-value assets of €3 million, and expenses from variable lease payments of €11 million. Total cash outflow for leases in 2019 was €99 million.
The future cash outflows from extension options, whose future exercise due to the lack of reasonable certainty was not taken into account in the calculation of the lease liabilities, amount to around € 95 million.
Further information on leases in the context of the application of IFRS 16 can be found in the notes 7, 11, 26 and 28.
• IFRIC 23 “Uncertainty over Income Tax Treatments” IFRIC 23, an interpretation of IAS 12, clarifies how uncertainty concerning the recognition and measurement of current and deferred income taxes should be accounted for. Specifically, it aims to resolve the uncertainty over whether IAS 12 or IAS 37 should be applied to disputed tax treatments. In cases where it is probable that a taxation authority will not accept a tax treatment applied in an entity’s tax return, the entity must provide its best estimate of the ex-pected tax payment. Depending on the particular case, this may involve using the expected value method or the most likely amount method, which-ever best reflects the risk. The interpretation has been applied since January 1, 2019. The initial application of the interpretation did not have a material effect on the consolidated financial statements.
The IASB has also revised or issued further standards and interpretations that must be applied in future. However, these will have no material effects on the consolidated financial statements.
Significant Accounting Policies
Sales are recognized when goods and products are delivered and control has transferred to the customer. Discounts, customer bonuses, and rebates are deducted from sales, as is consideration payable to trading partners in those cases in which the consideration is not matched by a distinct product or service supplied whose fair value can be estimated reliably. The probability of returns is reflected in the recognition and measurement of sales.
Cost of goods sold comprises the cost of internally produced goods sold and the purchase price of merchandise sold. The cost of internally produced goods includes directly attributable costs such as the cost of direct materials, direct labor, and energy, as well as production overheads, including depreciation of production facilities. The cost of goods sold also includes write-downs of in-ventories and operating expenses for distribution centers and freight shipments to customers.
Marketing and selling expenses comprise the costs of sales and marketing departments, expenditure on advertising, retail (point of sale) marketing, and similar items. This item also includes write-downs of trade receivables.
Research costs are recognized in profit or loss for the period. Development costs for new products are capitalized if the recognition criteria laid down in IAS 38 are met. This is normally not the case, as the expected future economic benefits cannot be measured reliably as long as the products are not market ready. Other development costs (e.g. for information systems) are capitalized as intangible assets if the recognition criteria laid down in IAS 38 are met. Once capitalized, they are amortized using the straight-line method over their ex-pected useful lives.
Purchased intangible assets such as patents, trademarks, and software are measured at cost. The carrying amounts of finite-lived intangible assets are reduced by straight-line amortization over their expected useful lives. The use-ful lives, residual values, and amortization methods are reviewed regularly. Goodwill and indefinite-lived intangible assets are not amortized.
Goodwill and indefinite-lived intangible assets are tested for impairment at least once a year; such impairment tests are only conducted for finite-lived intangible assets and property, plant, and equipment if there are indications of impairment. An impairment loss is recognized in profit or loss if the recoverable amount of the asset is lower than its carrying amount. Recoverable amount is identified separately for each asset. If an asset does not generate cash inflows that are largely independent from other assets, recoverable amount is identified on the basis of a group of assets designated as the cash-generating unit. Re-coverable amount is the higher of net realizable value and value in use. Net realizable value is the amount obtainable from the sale of an asset in an arm’s length transaction, less the costs of disposal. Value in use is calculated on the basis of estimated future cash flows expected to arise from the continuing use
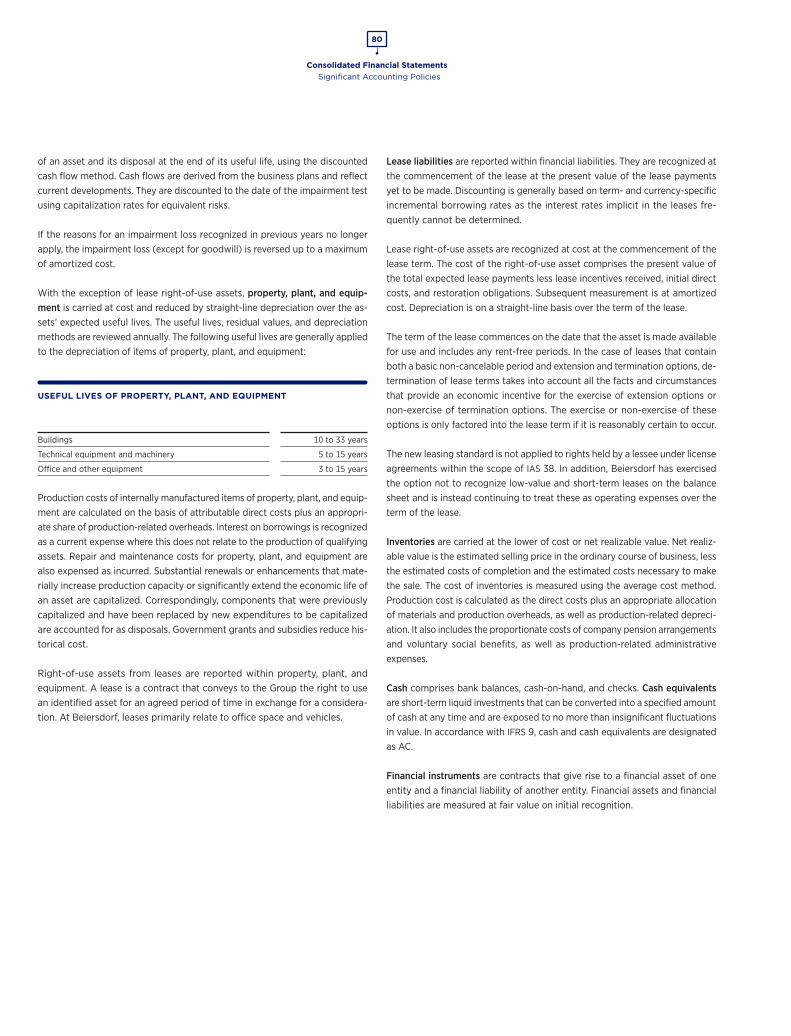
Consolidated Financial Statements
80
Significant Accounting Policies
of an asset and its disposal at the end of its useful life, using the discounted cash flow method. Cash flows are derived from the business plans and reflect current developments. They are discounted to the date of the impairment test using capitalization rates for equivalent risks.
If the reasons for an impairment loss recognized in previous years no longer apply, the impairment loss (except for goodwill) is reversed up to a maximum of amortized cost.
With the exception of lease right-of-use assets, property, plant, and equip-ment is carried at cost and reduced by straight-line depreciation over the as-sets’ expected useful lives. The useful lives, residual values, and depreciation methods are reviewed annually. The following useful lives are generally applied to the depreciation of items of property, plant, and equipment:
USEFUL LIVES OF PROPERTY, PLANT, AND EQUIPMENT
Buildings 10 to 33 years
Technical equipment and machinery 5 to 15 years
Office and other equipment 3 to 15 years
Production costs of internally manufactured items of property, plant, and equip-ment are calculated on the basis of attributable direct costs plus an appropri-ate share of production-related overheads. Interest on borrowings is recognized as a current expense where this does not relate to the production of qualifying assets. Repair and maintenance costs for property, plant, and equipment are also expensed as incurred. Substantial renewals or enhancements that mate-rially increase production capacity or significantly extend the economic life of an asset are capitalized. Correspondingly, components that were previously capitalized and have been replaced by new expenditures to be capitalized are accounted for as disposals. Government grants and subsidies reduce his-torical cost.
Right-of-use assets from leases are reported within property, plant, and equipment. A lease is a contract that conveys to the Group the right to use an identified asset for an agreed period of time in exchange for a considera-tion. At Beiersdorf, leases primarily relate to office space and vehicles.
Lease liabilities are reported within financial liabilities. They are recognized at the commencement of the lease at the present value of the lease payments yet to be made. Discounting is generally based on term- and currency-specific incremental borrowing rates as the interest rates implicit in the leases fre-quently cannot be determined.
Lease right-of-use assets are recognized at cost at the commencement of the lease term. The cost of the right-of-use asset comprises the present value of the total expected lease payments less lease incentives received, initial direct costs, and restoration obligations. Subsequent measurement is at amortized cost. Depreciation is on a straight-line basis over the term of the lease.
The term of the lease commences on the date that the asset is made available for use and includes any rent-free periods. In the case of leases that contain both a basic non-cancelable period and extension and termination options, de-termination of lease terms takes into account all the facts and circumstances that provide an economic incentive for the exercise of extension options or non-exercise of termination options. The exercise or non-exercise of these options is only factored into the lease term if it is reasonably certain to occur.
The new leasing standard is not applied to rights held by a lessee under license agreements within the scope of IAS 38. In addition, Beiersdorf has exercised the option not to recognize low-value and short-term leases on the balance sheet and is instead continuing to treat these as operating expenses over the term of the lease.
Inventories are carried at the lower of cost or net realizable value. Net realiz-able value is the estimated selling price in the ordinary course of business, less the estimated costs of completion and the estimated costs necessary to make the sale. The cost of inventories is measured using the average cost method. Production cost is calculated as the direct costs plus an appropriate allocation of materials and production overheads, as well as production-related depreci-ation. It also includes the proportionate costs of company pension arrangements and voluntary social benefits, as well as production-related administrative expenses.
Cash comprises bank balances, cash-on-hand, and checks. Cash equivalents are short-term liquid investments that can be converted into a specified amount of cash at any time and are exposed to no more than insignificant fluctuations in value. In accordance with IFRS 9, cash and cash equivalents are designated as AC.
Financial instruments are contracts that give rise to a financial asset of one entity and a financial liability of another entity. Financial assets and financial liabilities are measured at fair value on initial recognition.
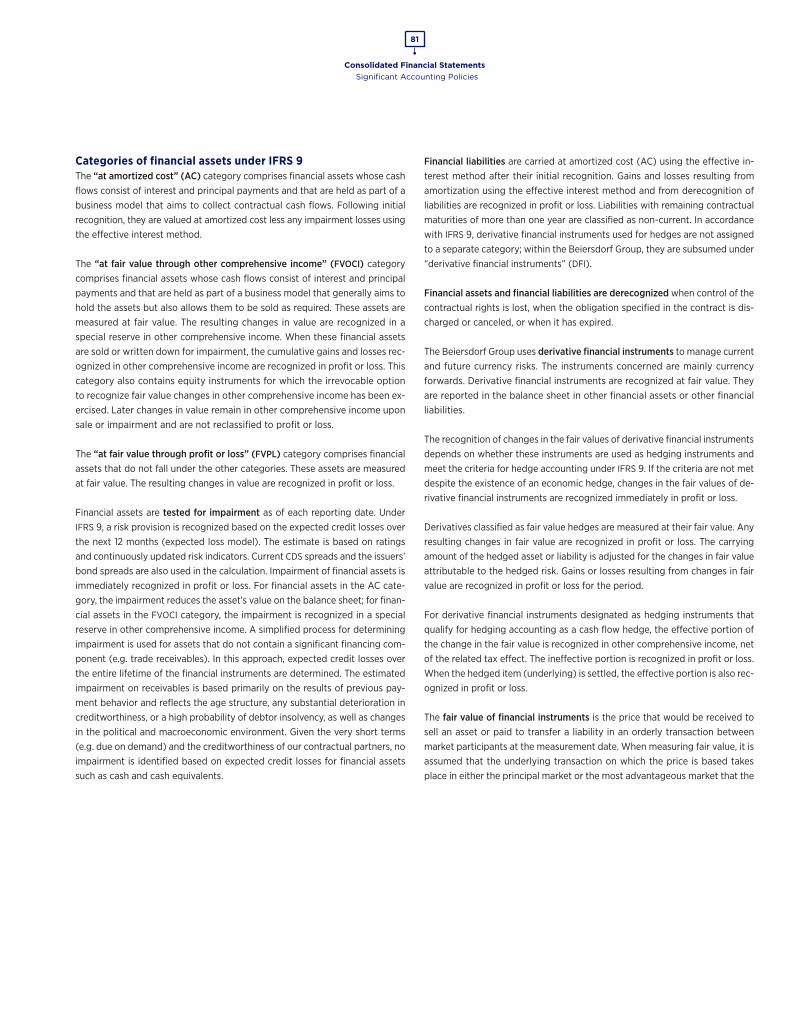
Consolidated Financial Statements
81
Significant Accounting Policies
Categories of financial assets under IFRS 9The “at amortized cost” (AC) category comprises financial assets whose cash flows consist of interest and principal payments and that are held as part of a business model that aims to collect contractual cash flows. Following initial recognition, they are valued at amortized cost less any impairment losses using the effective interest method.
The “at fair value through other comprehensive income” (FVOCI) category comprises financial assets whose cash flows consist of interest and principal payments and that are held as part of a business model that generally aims to hold the assets but also allows them to be sold as required. These assets are measured at fair value. The resulting changes in value are recognized in a special reserve in other comprehensive income. When these financial assets are sold or written down for impairment, the cumulative gains and losses rec-ognized in other comprehensive income are recognized in profit or loss. This category also contains equity instruments for which the irrevocable option to recognize fair value changes in other comprehensive income has been ex-ercised. Later changes in value remain in other comprehensive income upon sale or impairment and are not reclassified to profit or loss.
The “at fair value through profit or loss” (FVPL) category comprises financial assets that do not fall under the other categories. These assets are measured at fair value. The resulting changes in value are recognized in profit or loss.
Financial assets are tested for impairment as of each reporting date. Under IFRS 9, a risk provision is recognized based on the expected credit losses over the next 12 months (expected loss model). The estimate is based on ratings and continuously updated risk indicators. Current CDS spreads and the issuers’ bond spreads are also used in the calculation. Impairment of financial assets is immediately recognized in profit or loss. For financial assets in the AC cate-gory, the impairment reduces the asset’s value on the balance sheet; for finan-cial assets in the FVOCI category, the impairment is recognized in a special reserve in other comprehensive income. A simplified process for determining impairment is used for assets that do not contain a significant financing com-ponent (e.g. trade receivables). In this approach, expected credit losses over the entire lifetime of the financial instruments are determined. The estimated impairment on receivables is based primarily on the results of previous pay-ment behavior and reflects the age structure, any substantial deterioration in creditworthiness, or a high probability of debtor insolvency, as well as changes in the political and macroeconomic environment. Given the very short terms (e.g. due on demand) and the creditworthiness of our contractual partners, no impairment is identified based on expected credit losses for financial assets such as cash and cash equivalents.
Financial liabilities are carried at amortized cost (AC) using the effective in-terest method after their initial recognition. Gains and losses resulting from amortization using the effective interest method and from derecognition of liabilities are recognized in profit or loss. Liabilities with remaining contractual maturities of more than one year are classified as non-current. In accordance with IFRS 9, derivative financial instruments used for hedges are not assigned to a separate category; within the Beiersdorf Group, they are subsumed under “derivative financial instruments” (DFI).
Financial assets and financial liabilities are derecognized when control of the contractual rights is lost, when the obligation specified in the contract is dis-charged or canceled, or when it has expired.
The Beiersdorf Group uses derivative financial instruments to manage current and future currency risks. The instruments concerned are mainly currency forwards. Derivative financial instruments are recognized at fair value. They are reported in the balance sheet in other financial assets or other financial liabilities.
The recognition of changes in the fair values of derivative financial instruments depends on whether these instruments are used as hedging instruments and meet the criteria for hedge accounting under IFRS 9. If the criteria are not met despite the existence of an economic hedge, changes in the fair values of de-rivative financial instruments are recognized immediately in profit or loss.
Derivatives classified as fair value hedges are measured at their fair value. Any resulting changes in fair value are recognized in profit or loss. The carrying amount of the hedged asset or liability is adjusted for the changes in fair value attributable to the hedged risk. Gains or losses resulting from changes in fair value are recognized in profit or loss for the period.
For derivative financial instruments designated as hedging instruments that qualify for hedging accounting as a cash flow hedge, the effective portion of the change in the fair value is recognized in other comprehensive income, net of the related tax effect. The ineffective portion is recognized in profit or loss. When the hedged item (underlying) is settled, the effective portion is also rec-ognized in profit or loss.
The fair value of financial instruments is the price that would be received to sell an asset or paid to transfer a liability in an orderly transaction between market participants at the measurement date. When measuring fair value, it is assumed that the underlying transaction on which the price is based takes place in either the principal market or the most advantageous market that the
Consolidated Financial Statements
82
Significant Accounting Policies
Beiersdorf Group has access to. The price is measured using the assumptions that market participants would base pricing on. All financial instruments recog-nized at fair value in the financial statements are categorized into the following hierarchy levels in accordance with IFRS 13:
• Level 1: Fair values that are measured using quoted prices in active markets
• Level 2: Fair values that are measured using valuation techniques whose significant inputs are based on directly or indirectly observable market data
• Level 3: Fair values that are measured using valuation techniques whose significant inputs are not based on observable market data
Financial instruments regularly measured at fair value are reassessed at the end of the fiscal year to determine whether reclassifications have to be made between the levels of the hierarchy.
Provisions for pensions and other post-employment benefits comprise the provisions for defined benefit plans within the Group. Obligations are meas-ured using the projected unit credit method. The expected benefits are spread over the entire length of service of the employees. The actuarial computation of the pension provisions is based on market rates of interest as well as pro-jected wage/salary and pension increases, and staff turnover trends. Measure-ment is performed using the relevant local inputs. In Germany, the mortality rate was based on Heubeck’s 2018 G mortality tables, while international rates were based on locally recognized mortality tables. The various discount rates used are based on the yields of high-quality corporate bonds with appropri-ate maturities and currencies and a minimum of an AA rating. Actuarial reports are prepared annually. All assumptions are reviewed for appropriateness at each reporting date.
The amount recognized as a provision comprises the total present value of the defined benefit obligation less the fair value of plan assets available for imme-diate settlement of obligations. If the fair value of plan assets exceeds the present value of the defined benefit obligation, net assets are only recognized up to the amount of the asset ceiling.
Past service cost is recognized as a component of EBIT in line with the principle of functional allocation, while net interest income is recognized in the financial result. Actuarial gains and losses resulting from changes in actuarial assumptions and deviations between earlier actuarial assumptions and actual developments, as well as from changes in the return on plan assets, are recognized immedi-ately and in full under retained earnings in consolidated equity. They are not recognized in profit or loss later on, but rather remain in consolidated equity.
In the case of defined contribution plans, contributions are made on a statu-tory, contractual, or voluntary basis to public or private pension insurance plans. The Group does not have any other payment obligations above and beyond the contributions. The contributions are recognized in profit or loss as a com-ponent of EBIT.
Other provisions take account of all identifiable future payment obligations, risks, and uncertain obligations of the Group resulting from current legal or constructive obligations arising from past events where the amount of the ob-ligation can be measured reliably. Such other provisions are mainly due within one year. Non-current provisions expected to be settled after more than one year are discounted insofar as the interest effect is material.
Current income tax assets and liabilities for current and future periods are rec-ognized at the expected amount. The tax rates and tax legislation enacted at the reporting date are used to calculate the amount.
Deferred taxes result from temporary differences between the tax base of as-sets and liabilities and their carrying amounts in the IFRS balance sheet, and from tax loss carryforwards. Deferred taxes are measured using the balance sheet liability method on the basis of the tax rates expected to be enacted in the individual countries when the temporary differences reverse. These rates are based on the legislation in force at the balance sheet date. No deferred taxes are recognized for differences arising on the initial recognition of assets and liabilities that are not the result of business combinations and do not affect either accounting or taxable profit.
Deferred tax assets in respect of temporary differences, tax loss carryforwards, and tax credits are recognized where it is probable that sufficient taxable profit will be available in future periods against which they can be utilized. Recognized deferred taxes are tested for recoverability every year. Income taxes relating to items recognized in other comprehensive income are not recognized in the income statement but in other comprehensive income.
Current tax assets and liabilities, and deferred tax assets and liabilities, are off-set against each other if the Group has a legally enforceable right to offset the actual tax assets against actual tax liabilities and these relate to income taxes levied on the same taxable entity by the same taxation authority.

Consolidated Financial Statements
83
Significant Accounting Policies
SUMMARY OF SELECTED MEASUREMENT POLICIES
Balance sheet item Measurement policy
Assets
Goodwill Lower of cost or recoverable amount
Other intangible assets
indefinite-lived Lower of cost or recoverable amount
finite-lived (Amortized) cost
Property, plant, and equipment (Amortized) cost
Financial assets
“Amortized cost” (AC) (Amortized) cost
“At fair value in other comprehensive income” (FVOCI) At fair value in other comprehensive income
“At fair value through profit or loss” (FVPL) At fair value through profit or loss
Inventories Lower of cost or net realizable value
Trade receivables (Amortized) cost
Cash and cash equivalents Nominal amount
Non-current assets and disposal groups held for sale Lower of (amortized) cost or net realizable value
Equity and liabilities
Provisions
Provisions for pensions and other post-employment benefits Projected unit credit method
Other provisions Settlement amount (best estimate)
Financial liabilities (Amortized) cost
Trade payables (Amortized) cost
Other liabilities Settlement amount
Notes to the Cash Flow Statement
The cash flow statement has been prepared in accordance with IAS 7 and is classified into net cash flows from operating, investing, and financing activi-ties.
Net cash flow from operating activities is determined using the indirect method, while net cash flows from investing and financing activities are determined using the direct method.
Cash funds are composed of cash and cash equivalents that can be converted into cash at any time and that are exposed to no more than insignificant fluc-tuations in value.
Notes to the Segment Reporting
Segment reporting in the Beiersdorf Group is based on the management of business operations. The breakdown of the Group into the Consumer and tesa Business Segments reflects the internal organizational structure and the re-porting to the Executive Board and the Supervisory Board.
The Beiersdorf Group measures the success of its segments on the basis of sales growth and operating result (EBIT), adjusted for non-recurring, non-operating
transactions (EBIT excluding special factors) in conjunction with the corre-sponding EBIT margin.
In order to show the global breakdown of business activities in the Beiersdorf Group, information on the geographic regions is presented in addition to the operating segments. The external sales shown for the regions are based on the domiciles of the respective companies.
Group companies domiciled in Germany generated sales of €1,474 million in 2019 (previous year: €1,463 million) and reported non-current assets (not in-cluding financial instruments, deferred taxes, and plan assets) of €1,182 million (previous year: €868 million).
Organic sales growth is the nominal sales growth adjusted for exchange rate effects and structural effects from acquisitions and divestments.
EBIT excluding special factors represents the operating result (EBIT), adjusted for non-operating one-off business transactions.
EBITDA represents the operating result (EBIT) before depreciation, amortization, and impairment losses.
The EBIT margin on net operating capital is the ratio of the operating result (EBIT) to net operating capital.

Consolidated Financial Statements
84
Significant Accounting Policies | Consolidated Group, Acquisitions, and Divestments
Gross cash flow is the excess of operating income over operating expenses before any further appropriation of funds.
Net operating capital of €2,482 million (previous year: €1,834 million) consists of gross operating capital less operating liabilities. The following table shows the reconciliation of net operating capital to the balance sheet items:
RECONCILIATION OF NET OPERATING CAPITAL TO
BALANCE SHEET ITEMS (IN € MILLION)
Assets Dec. 31, 2018 Dec. 31, 2019
Intangible assets 211 590
Property, plant, and equipment 1,239 1,626
Inventories 986 1,016
Trade receivables 1,394 1,442
Other receivables and other assets (not including tax receivables) 188 156
Gross operating capital 4,018 4,830
Gross non-operating assets 4,853 5,235
Total balance sheet assets 8,871 10,065
Equity and liabilities Dec. 31, 2018 Dec. 31, 2019
Other provisions 550 600
Trade payables 1,554 1,660
Other liabilities (not including income tax liabilities) 80 88
Operating liabilities 2,184 2,348
Equity 5,647 6,093
Non-operating liabilities 1,040 1,624
Total balance sheet equity and liabilities 8,871 10,065
Consolidated Group, Acquisitions, and Divestments
Consolidated Group
In addition to Beiersdorf AG, the consolidated financial statements include 19 (previous year: 19) German and 159 (previous year: 154) international companies whose financial and business policies Beiersdorf AG is able to control either directly or indirectly.
In the year under review, five new companies were included in the consoli-dated financial statements.
Beiersdorf AG’s Shareholdings
Disclosures of Beiersdorf AG’s shareholdings are made in the section entitled “Additional Information.” The list shows those companies/equity interests in which Beiersdorf AG holds 5% or more of the shares and/or voting rights. This list largely corresponds to the information disclosed in the previous year.
Significant Acquisitions
Beiersdorf acquired the sun care business COPPERTONE for a price of €495 mil-lion (USD 555 million) with a purchase agreement dated May 13, 2019. The ac-quisition was financed from Beiersdorf’s own liquid funds. With this takeover, Beiersdorf continued to expand its position as a globally successful provider of sun protection products. The acquired sun care brand is sold in the United States, Canada, and China. The worldwide business with the divisions sales and marketing, research and development, as well as the production plant in Cleve-land (Tennessee, United States) with a total of 450 employees was taken over.
The acquired COPPERTONE business contributed €15 million to Group sales in the period from September to December 2019. Due to seasonality, the operat-ing result for this period is negative at €13 million. In addition, acquisition and integration costs had a negative impact of €25 million on the result. The sales of the COPPERTONE business for the whole year (12 months) totaled approxi-mately €180 million.
The business was acquired through an asset deal. The figures in these consol-idated financial statements were prepared before purchase price allocation as the information required for the final purchase price allocation was still being obtained and verified.
PROVISIONAL ALLOCATION OF THE PURCHASE PRICE FOR THE
ACQUISITION OF THE COPPERTONE BUSINESS (IN € MILLION)
Purchase price 495
Property, plant, and equipment 57
Inventories 50
Intangible assets (including goodwill) 388
An indicative purchase price allocation determined that the provisional item “Intangible assets” shown above represents the following identifiable assets in addition to goodwill (the figures in brackets show the possible ranges of fair values after finalization of the purchase price allocation based on current knowledge): trademark rights (€161 million to €215 million), customer base (€35 million to €46 million), and technology and patents (€19 million to €28 million). For the finite-lived identifiable intangible assets, amortization of €3 million has already been taken into account in the 2019 consolidated finan-cial statements. An allocation of intangible assets to the cash-generating units in the Consumer business segment has not yet taken place. Changes to the
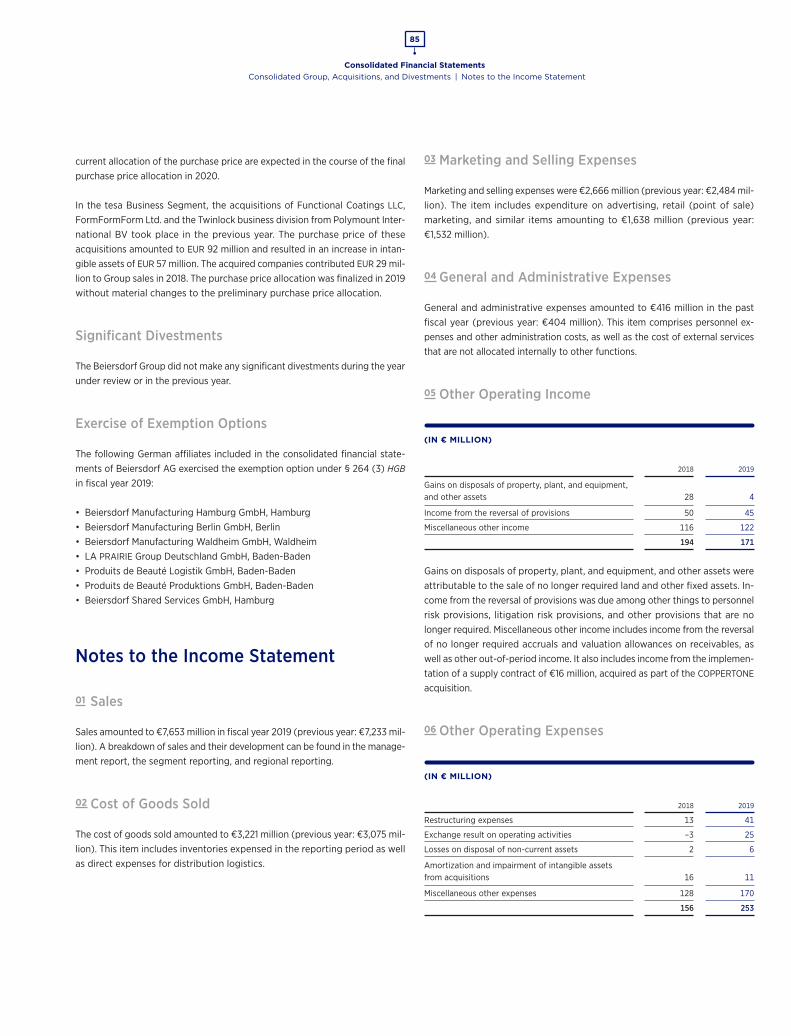
Consolidated Financial Statements
85
Consolidated Group, Acquisitions, and Divestments | Notes to the Income Statement
current allocation of the purchase price are expected in the course of the final purchase price allocation in 2020.
In the tesa Business Segment, the acquisitions of Functional Coatings LLC, FormFormForm Ltd. and the Twinlock business division from Polymount Inter-national BV took place in the previous year. The purchase price of these acquisitions amounted to EUR 92 million and resulted in an increase in intan-gible assets of EUR 57 million. The acquired companies contributed EUR 29 mil-lion to Group sales in 2018. The purchase price allocation was finalized in 2019 without material changes to the preliminary purchase price allocation.
Significant Divestments
The Beiersdorf Group did not make any significant divestments during the year under review or in the previous year.
Exercise of Exemption Options
The following German affiliates included in the consolidated financial state-ments of Beiersdorf AG exercised the exemption option under § 264 (3) HGB in fiscal year 2019:
• Beiersdorf Manufacturing Hamburg GmbH, Hamburg• Beiersdorf Manufacturing Berlin GmbH, Berlin• Beiersdorf Manufacturing Waldheim GmbH, Waldheim• LA PRAIRIE Group Deutschland GmbH, Baden-Baden• Produits de Beauté Logistik GmbH, Baden-Baden• Produits de Beauté Produktions GmbH, Baden-Baden• Beiersdorf Shared Services GmbH, Hamburg
Notes to the Income Statement
01 Sales
Sales amounted to €7,653 million in fiscal year 2019 (previous year: €7,233 mil-lion). A breakdown of sales and their development can be found in the manage-ment report, the segment reporting, and regional reporting.
02 Cost of Goods Sold
The cost of goods sold amounted to €3,221 million (previous year: €3,075 mil-lion). This item includes inventories expensed in the reporting period as well as direct expenses for distribution logistics.
03 Marketing and Selling Expenses
Marketing and selling expenses were €2,666 million (previous year: €2,484 mil-lion). The item includes expenditure on advertising, retail (point of sale) marketing, and similar items amounting to €1,638 million (previous year: €1,532 million).
04 General and Administrative Expenses
General and administrative expenses amounted to €416 million in the past fiscal year (previous year: €404 million). This item comprises personnel ex-penses and other administration costs, as well as the cost of external services that are not allocated internally to other functions.
05 Other Operating Income
(IN € MILLION)
2018 2019
Gains on disposals of property, plant, and equipment, and other assets 28 4
Income from the reversal of provisions 50 45
Miscellaneous other income 116 122
194 171
Gains on disposals of property, plant, and equipment, and other assets were attributable to the sale of no longer required land and other fixed assets. In-come from the reversal of provisions was due among other things to personnel risk provisions, litigation risk provisions, and other provisions that are no longer required. Miscellaneous other income includes income from the reversal of no longer required accruals and valuation allowances on receivables, as well as other out-of-period income. It also includes income from the implemen-tation of a supply contract of €16 million, acquired as part of the COPPERTONE acquisition.
06 Other Operating Expenses
(IN € MILLION)
2018 2019
Restructuring expenses 13 41
Exchange result on operating activities –3 25
Losses on disposal of non-current assets 2 6
Amortization and impairment of intangible assets from acquisitions 16 11
Miscellaneous other expenses 128 170
156 253
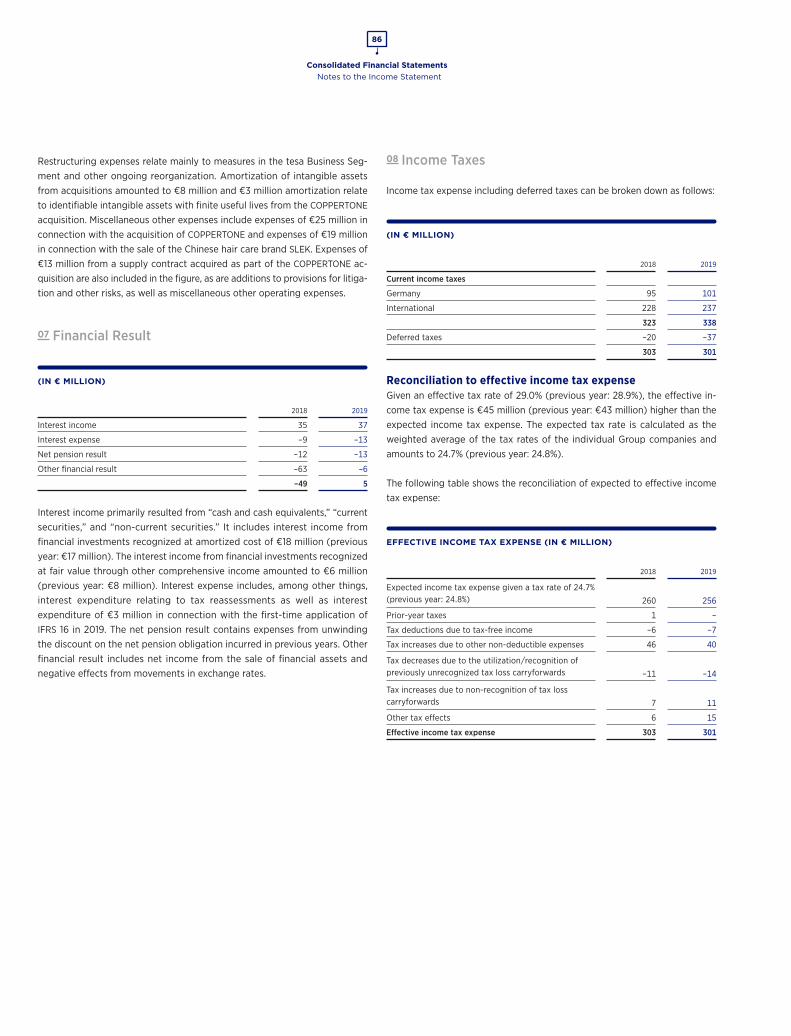
Consolidated Financial Statements
86
Notes to the Income Statement
Restructuring expenses relate mainly to measures in the tesa Business Seg-ment and other ongoing reorganization. Amortization of intangible assets from acquisitions amounted to €8 million and €3 million amortization relate to identifiable intangible assets with finite useful lives from the COPPERTONE acquisition. Miscellaneous other expenses include expenses of €25 million in connection with the acquisition of COPPERTONE and expenses of €19 million in connection with the sale of the Chinese hair care brand SLEK. Expenses of €13 million from a supply contract acquired as part of the COPPERTONE ac-quisition are also included in the figure, as are additions to provisions for litiga-tion and other risks, as well as miscellaneous other operating expenses.
07 Financial Result
(IN € MILLION)
2018 2019
Interest income 35 37
Interest expense –9 –13
Net pension result –12 –13
Other financial result –63 –6
–49 5
Interest income primarily resulted from “cash and cash equivalents,” “current securities,” and “non-current securities.” It includes interest income from financial investments recognized at amortized cost of €18 million (previous year: €17 million). The interest income from financial investments recognized at fair value through other comprehensive income amounted to €6 million (previous year: €8 million). Interest expense includes, among other things, interest expenditure relating to tax reassessments as well as interest expenditure of €3 million in connection with the first-time application of IFRS 16 in 2019. The net pension result contains expenses from unwinding the discount on the net pension obligation incurred in previous years. Other financial result includes net income from the sale of financial assets and negative effects from movements in exchange rates.
08 Income Taxes
Income tax expense including deferred taxes can be broken down as follows:
(IN € MILLION)
2018 2019
Current income taxes
Germany 95 101
International 228 237
323 338
Deferred taxes –20 –37
303 301
Reconciliation to effective income tax expenseGiven an effective tax rate of 29.0% (previous year: 28.9%), the effective in-come tax expense is €45 million (previous year: €43 million) higher than the expected income tax expense. The expected tax rate is calculated as the weighted average of the tax rates of the individual Group companies and amounts to 24.7% (previous year: 24.8%).
The following table shows the reconciliation of expected to effective income tax expense:
EFFECTIVE INCOME TAX EXPENSE (IN € MILLION)
2018 2019
Expected income tax expense given a tax rate of 24.7% (previous year: 24.8%) 260 256
Prior-year taxes 1 –
Tax deductions due to tax-free income –6 –7
Tax increases due to other non-deductible expenses 46 40
Tax decreases due to the utilization/recognition of previously unrecognized tax loss carryforwards –11 –14
Tax increases due to non-recognition of tax loss carryforwards 7 11
Other tax effects 6 15
Effective income tax expense 303 301
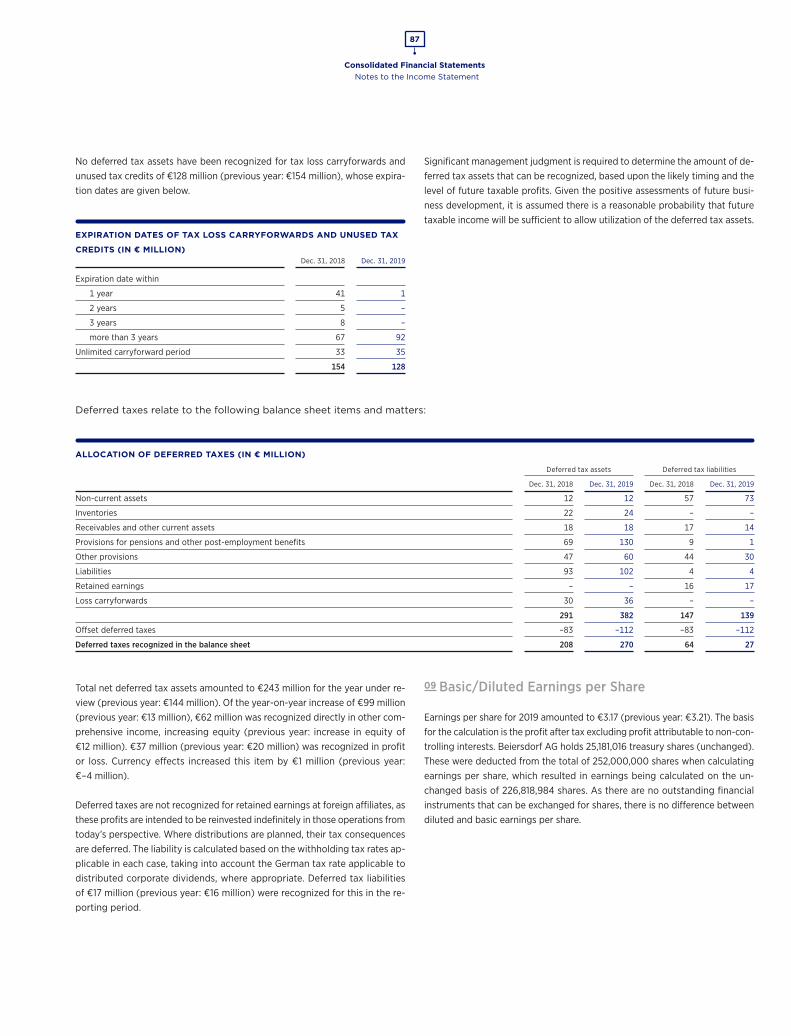
Consolidated Financial Statements
87
Notes to the Income Statement
No deferred tax assets have been recognized for tax loss carryforwards and unused tax credits of €128 million (previous year: €154 million), whose expira-tion dates are given below.
EXPIRATION DATES OF TAX LOSS CARRYFORWARDS AND UNUSED TAX
CREDITS (IN € MILLION) Dec. 31, 2018 Dec. 31, 2019
Expiration date within
1 year 41 1
2 years 5 –
3 years 8 –
more than 3 years 67 92
Unlimited carryforward period 33 35
154 128
Significant management judgment is required to determine the amount of de-ferred tax assets that can be recognized, based upon the likely timing and the level of future taxable profits. Given the positive assessments of future busi-ness development, it is assumed there is a reasonable probability that future taxable income will be sufficient to allow utilization of the deferred tax assets.
Deferred taxes relate to the following balance sheet items and matters:
ALLOCATION OF DEFERRED TAXES (IN € MILLION)
Deferred tax assets Deferred tax liabilities
Dec. 31, 2018 Dec. 31, 2019 Dec. 31, 2018 Dec. 31, 2019
Non-current assets 12 12 57 73
Inventories 22 24 – –
Receivables and other current assets 18 18 17 14
Provisions for pensions and other post-employment benefits 69 130 9 1
Other provisions 47 60 44 30
Liabilities 93 102 4 4
Retained earnings – – 16 17
Loss carryforwards 30 36 – –
291 382 147 139
Offset deferred taxes –83 –112 –83 –112
Deferred taxes recognized in the balance sheet 208 270 64 27
Total net deferred tax assets amounted to €243 million for the year under re-view (previous year: €144 million). Of the year-on-year increase of €99 million (previous year: €13 million), €62 million was recognized directly in other com-prehensive income, increasing equity (previous year: increase in equity of €12 million). €37 million (previous year: €20 million) was recognized in profit or loss. Currency effects increased this item by €1 million (previous year: €–4 million).
Deferred taxes are not recognized for retained earnings at foreign affiliates, as these profits are intended to be reinvested indefinitely in those operations from today’s perspective. Where distributions are planned, their tax consequences are deferred. The liability is calculated based on the withholding tax rates ap-plicable in each case, taking into account the German tax rate applicable to distributed corporate dividends, where appropriate. Deferred tax liabilities of €17 million (previous year: €16 million) were recognized for this in the re-porting period.
09 Basic/Diluted Earnings per Share
Earnings per share for 2019 amounted to €3.17 (previous year: €3.21). The basis for the calculation is the profit after tax excluding profit attributable to non-con-trolling interests. Beiersdorf AG holds 25,181,016 treasury shares (unchanged). These were deducted from the total of 252,000,000 shares when calculating earnings per share, which resulted in earnings being calculated on the un-changed basis of 226,818,984 shares. As there are no outstanding financial instruments that can be exchanged for shares, there is no difference between diluted and basic earnings per share.
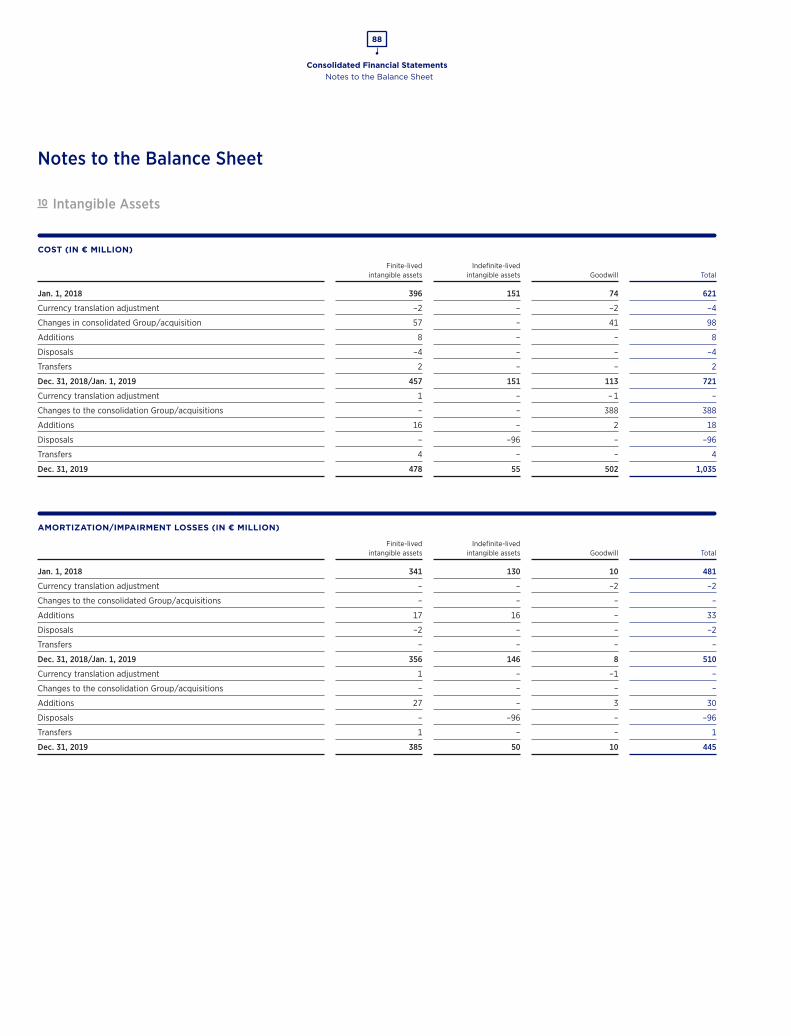
Consolidated Financial Statements
88
Notes to the Balance Sheet
Notes to the Balance Sheet
10 Intangible Assets
COST (IN € MILLION)
Finite-lived
intangible assetsIndefinite-lived
intangible assets Goodwill Total
Jan. 1, 2018 396 151 74 621
Currency translation adjustment –2 – –2 –4
Changes in consolidated Group/acquisition 57 – 41 98
Additions 8 – – 8
Disposals –4 – – –4
Transfers 2 – – 2
Dec. 31, 2018/Jan. 1, 2019 457 151 113 721
Currency translation adjustment 1 – – 1 –
Changes to the consolidation Group/acquisitions – – 388 388
Additions 16 – 2 18
Disposals – –96 – –96
Transfers 4 – – 4
Dec. 31, 2019 478 55 502 1,035
AMORTIZATION/IMPAIRMENT LOSSES (IN € MILLION)
Finite-lived
intangible assetsIndefinite-lived
intangible assets Goodwill Total
Jan. 1, 2018 341 130 10 481
Currency translation adjustment – – –2 –2
Changes to the consolidated Group/acquisitions – – – –
Additions 17 16 – 33
Disposals –2 – – –2
Transfers – – – –
Dec. 31, 2018/Jan. 1, 2019 356 146 8 510
Currency translation adjustment 1 – –1 –
Changes to the consolidation Group/acquisitions – – – –
Additions 27 – 3 30
Disposals – –96 – –96
Transfers 1 – – 1
Dec. 31, 2019 385 50 10 445
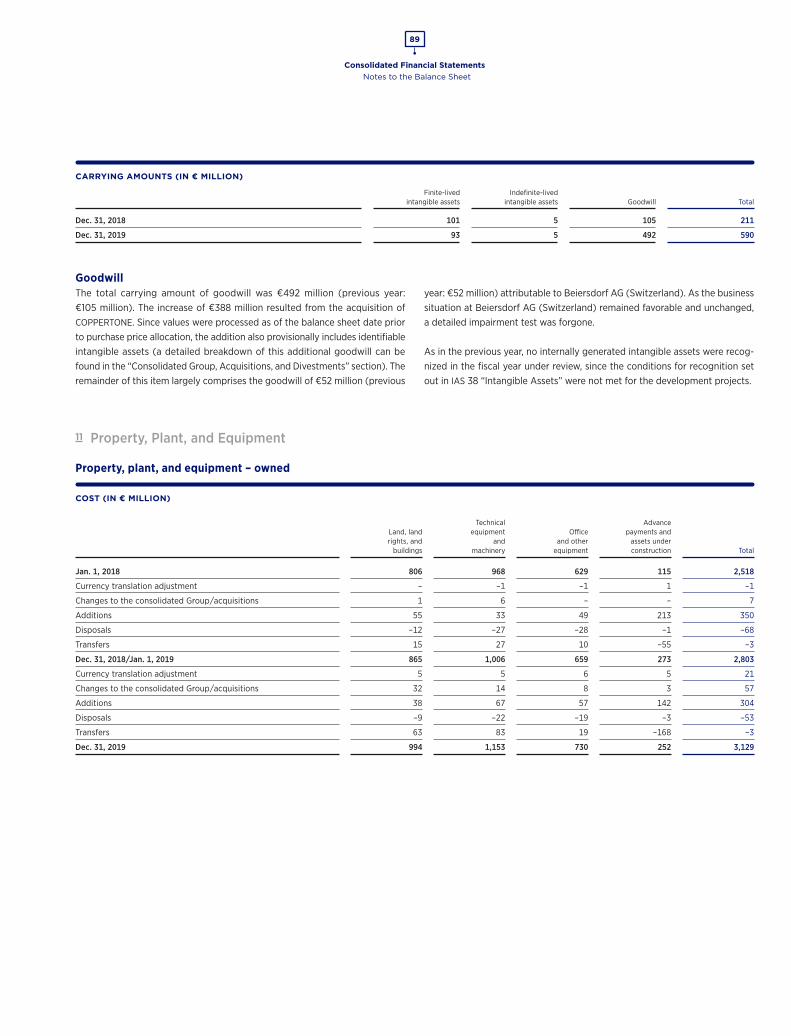
Consolidated Financial Statements
89
Notes to the Balance Sheet
CARRYING AMOUNTS (IN € MILLION)
Finite-lived
intangible assetsIndefinite-lived
intangible assets Goodwill Total
Dec. 31, 2018 101 5 105 211
Dec. 31, 2019 93 5 492 590
GoodwillThe total carrying amount of goodwill was €492 million (previous year: €105 million). The increase of €388 million resulted from the acquisition of COPPERTONE. Since values were processed as of the balance sheet date prior to purchase price allocation, the addition also provisionally includes identifiable intangible assets (a detailed breakdown of this additional goodwill can be found in the “Consolidated Group, Acquisitions, and Divestments” section). The remainder of this item largely comprises the goodwill of €52 million (previous
year: €52 million) attributable to Beiersdorf AG (Switzerland). As the business situation at Beiersdorf AG (Switzerland) remained favorable and unchanged, a detailed impairment test was forgone.
As in the previous year, no internally generated intangible assets were recog-nized in the fiscal year under review, since the conditions for recognition set out in IAS 38 “Intangible Assets” were not met for the development projects.
11 Property, Plant, and Equipment
Property, plant, and equipment – owned
COST (IN € MILLION)
Land, land rights, and
buildings
Technical equipment
and machinery
Office and other
equipment
Advance payments and
assets under construction Total
Jan. 1, 2018 806 968 629 115 2,518
Currency translation adjustment – –1 –1 1 –1
Changes to the consolidated Group/acquisitions 1 6 – – 7
Additions 55 33 49 213 350
Disposals –12 –27 –28 –1 –68
Transfers 15 27 10 –55 –3
Dec. 31, 2018/Jan. 1, 2019 865 1,006 659 273 2,803
Currency translation adjustment 5 5 6 5 21
Changes to the consolidated Group/acquisitions 32 14 8 3 57
Additions 38 67 57 142 304
Disposals –9 –22 –19 –3 –53
Transfers 63 83 19 –168 –3
Dec. 31, 2019 994 1,153 730 252 3,129
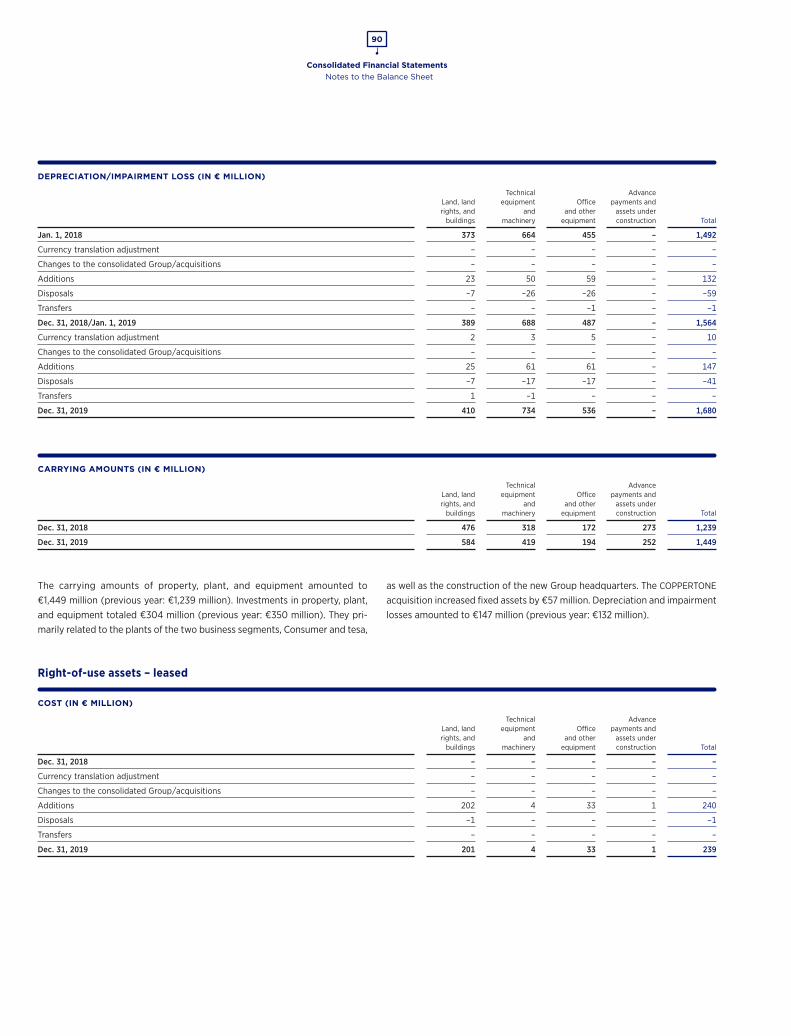
Consolidated Financial Statements
90
Notes to the Balance Sheet
DEPRECIATION/IMPAIRMENT LOSS (IN € MILLION)
Land, land rights, and
buildings
Technical equipment
and machinery
Office and other
equipment
Advance payments and
assets under construction Total
Jan. 1, 2018 373 664 455 – 1,492
Currency translation adjustment – – – – –
Changes to the consolidated Group/acquisitions – – – – –
Additions 23 50 59 – 132
Disposals –7 –26 –26 – –59
Transfers – – –1 – –1
Dec. 31, 2018/Jan. 1, 2019 389 688 487 – 1,564
Currency translation adjustment 2 3 5 – 10
Changes to the consolidated Group/acquisitions – – – – –
Additions 25 61 61 – 147
Disposals –7 –17 –17 – –41
Transfers 1 –1 – – –
Dec. 31, 2019 410 734 536 – 1,680
CARRYING AMOUNTS (IN € MILLION)
Land, land rights, and
buildings
Technical equipment
and machinery
Office and other
equipment
Advance payments and
assets under construction Total
Dec. 31, 2018 476 318 172 273 1,239
Dec. 31, 2019 584 419 194 252 1,449
The carrying amounts of property, plant, and equipment amounted to €1,449 million (previous year: €1,239 million). Investments in property, plant, and equipment totaled €304 million (previous year: €350 million). They pri-marily related to the plants of the two business segments, Consumer and tesa,
as well as the construction of the new Group headquarters. The COPPERTONE acquisition increased fixed assets by €57 million. Depreciation and impairment losses amounted to €147 million (previous year: €132 million).
Right-of-use assets – leased
COST (IN € MILLION)
Land, land rights, and
buildings
Technical equipment
and machinery
Office and other
equipment
Advance payments and
assets under construction Total
Dec. 31, 2018 – – – – –
Currency translation adjustment – – – – –
Changes to the consolidated Group/acquisitions – – – – –
Additions 202 4 33 1 240
Disposals –1 – – – –1
Transfers – – – – –
Dec. 31, 2019 201 4 33 1 239
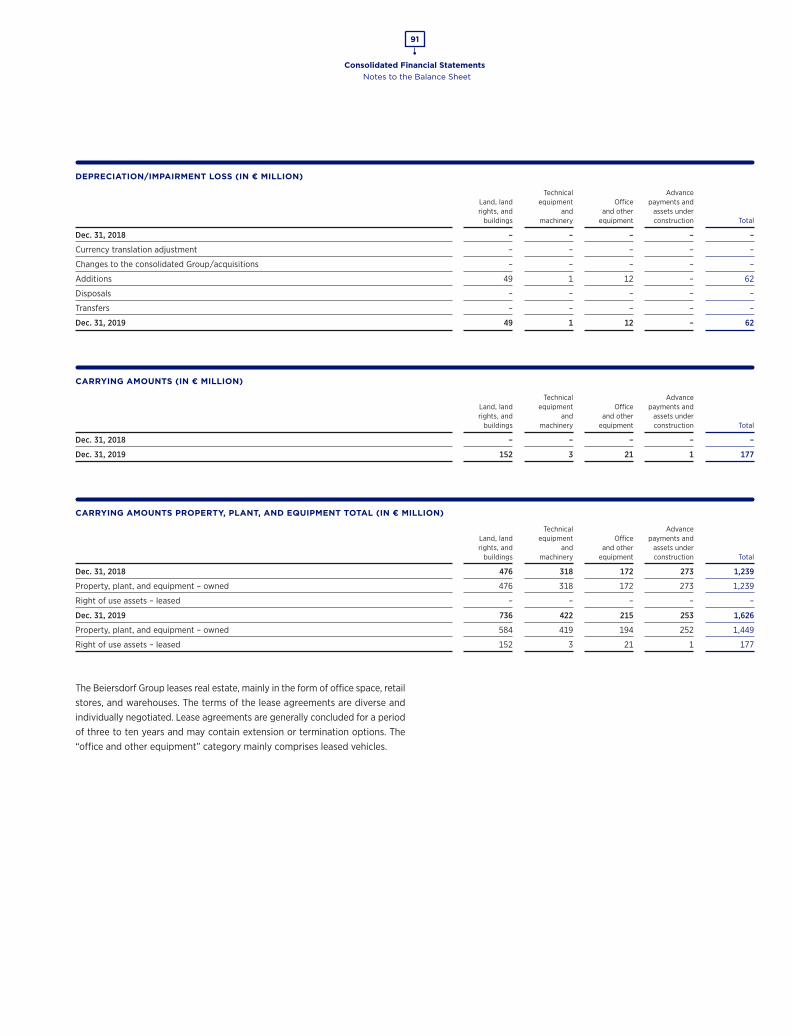
Consolidated Financial Statements
91
Notes to the Balance Sheet
DEPRECIATION/IMPAIRMENT LOSS (IN € MILLION)
Land, land rights, and
buildings
Technical equipment
and machinery
Office and other
equipment
Advance payments and
assets under construction Total
Dec. 31, 2018 – – – – –
Currency translation adjustment – – – – –
Changes to the consolidated Group/acquisitions – – – – –
Additions 49 1 12 – 62
Disposals – – – – –
Transfers – – – – –
Dec. 31, 2019 49 1 12 – 62
CARRYING AMOUNTS (IN € MILLION)
Land, land rights, and
buildings
Technical equipment
and machinery
Office and other
equipment
Advance payments and
assets under construction Total
Dec. 31, 2018 – – – – –
Dec. 31, 2019 152 3 21 1 177
CARRYING AMOUNTS PROPERTY, PLANT, AND EQUIPMENT TOTAL (IN € MILLION)
Land, land rights, and
buildings
Technical equipment
and machinery
Office and other
equipment
Advance payments and
assets under construction Total
Dec. 31, 2018 476 318 172 273 1,239
Property, plant, and equipment – owned 476 318 172 273 1,239
Right of use assets – leased – – – – –
Dec. 31, 2019 736 422 215 253 1,626
Property, plant, and equipment – owned 584 419 194 252 1,449
Right of use assets – leased 152 3 21 1 177
The Beiersdorf Group leases real estate, mainly in the form of office space, retail stores, and warehouses. The terms of the lease agreements are diverse and individually negotiated. Lease agreements are generally concluded for a period of three to ten years and may contain extension or termination options. The “office and other equipment” category mainly comprises leased vehicles.
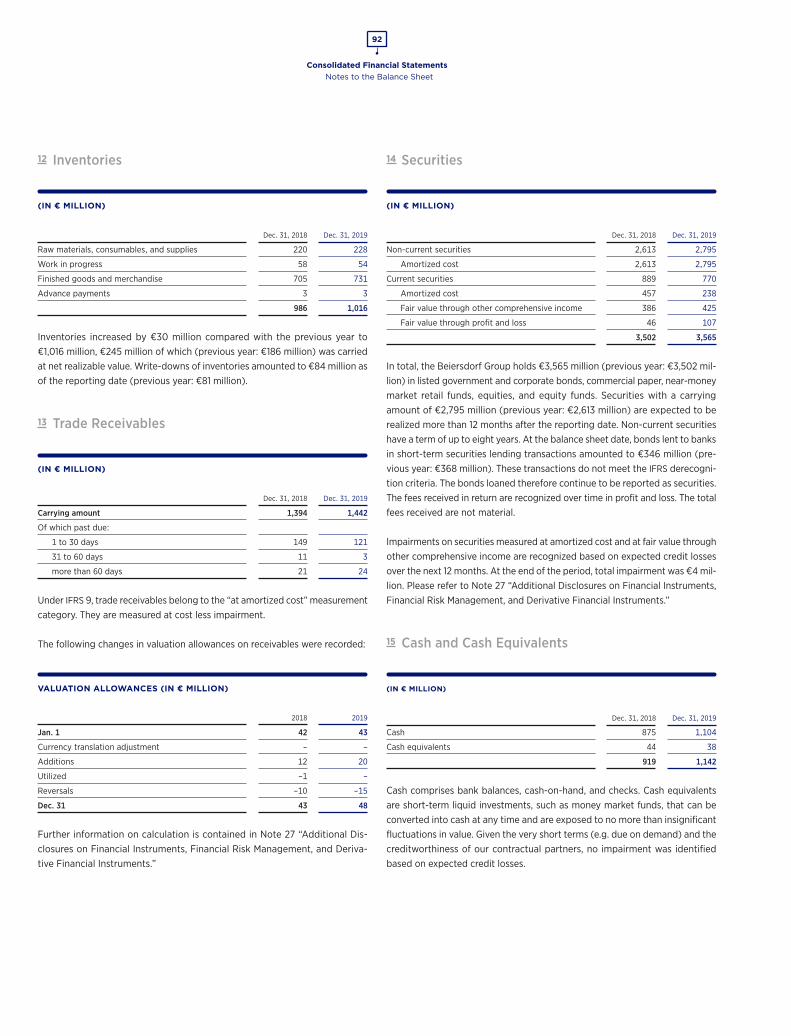
Consolidated Financial Statements
92
Notes to the Balance Sheet
12 Inventories
(IN € MILLION)
Dec. 31, 2018 Dec. 31, 2019
Raw materials, consumables, and supplies 220 228
Work in progress 58 54
Finished goods and merchandise 705 731
Advance payments 3 3
986 1,016
Inventories increased by €30 million compared with the previous year to €1,016 million, €245 million of which (previous year: €186 million) was carried at net realizable value. Write-downs of inventories amounted to €84 million as of the reporting date (previous year: €81 million).
13 Trade Receivables
(IN € MILLION)
Dec. 31, 2018 Dec. 31, 2019
Carrying amount 1,394 1,442
Of which past due:
1 to 30 days 149 121
31 to 60 days 11 3
more than 60 days 21 24
Under IFRS 9, trade receivables belong to the “at amortized cost” measurement category. They are measured at cost less impairment.
The following changes in valuation allowances on receivables were recorded:
VALUATION ALLOWANCES (IN € MILLION)
2018 2019
Jan. 1 42 43
Currency translation adjustment – –
Additions 12 20
Utilized –1 –
Reversals –10 –15
Dec. 31 43 48
Further information on calculation is contained in Note 27 “Additional Dis-closures on Financial Instruments, Financial Risk Management, and Deriva-tive Financial Instruments.”
14 Securities
(IN € MILLION)
Dec. 31, 2018 Dec. 31, 2019
Non-current securities 2,613 2,795
Amortized cost 2,613 2,795
Current securities 889 770
Amortized cost 457 238
Fair value through other comprehensive income 386 425
Fair value through profit and loss 46 107
3,502 3,565
In total, the Beiersdorf Group holds €3,565 million (previous year: €3,502 mil-lion) in listed government and corporate bonds, commercial paper, near-money market retail funds, equities, and equity funds. Securities with a carrying amount of €2,795 million (previous year: €2,613 million) are expected to be realized more than 12 months after the reporting date. Non-current securities have a term of up to eight years. At the balance sheet date, bonds lent to banks in short-term securities lending transactions amounted to €346 million (pre-vious year: €368 million). These transactions do not meet the IFRS derecogni-tion criteria. The bonds loaned therefore continue to be reported as securities. The fees received in return are recognized over time in profit and loss. The total fees received are not material.
Impairments on securities measured at amortized cost and at fair value through other comprehensive income are recognized based on expected credit losses over the next 12 months. At the end of the period, total impairment was €4 mil-lion. Please refer to Note 27 “Additional Disclosures on Financial Instruments, Financial Risk Management, and Derivative Financial Instruments.”
15 Cash and Cash Equivalents
(IN € MILLION)
Dec. 31, 2018 Dec. 31, 2019
Cash 875 1,104
Cash equivalents 44 38
919 1,142
Cash comprises bank balances, cash-on-hand, and checks. Cash equivalents are short-term liquid investments, such as money market funds, that can be converted into cash at any time and are exposed to no more than insignificant fluctuations in value. Given the very short terms (e.g. due on demand) and the creditworthiness of our contractual partners, no impairment was identified based on expected credit losses.
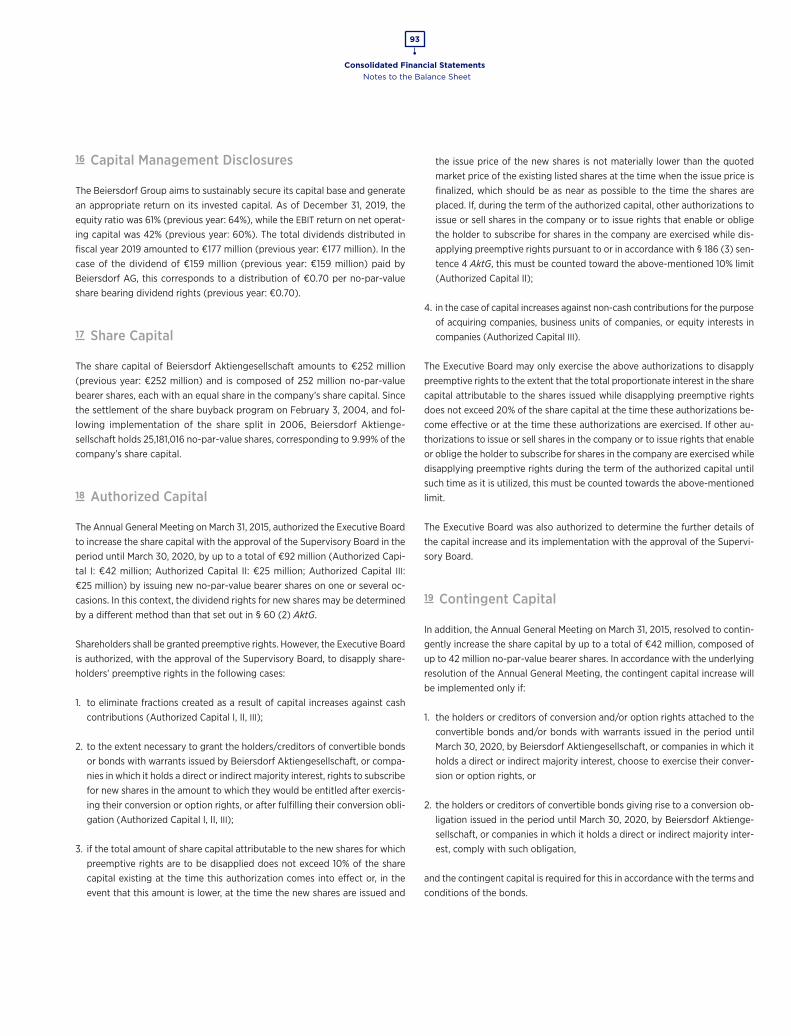
Consolidated Financial Statements
93
Notes to the Balance Sheet
16 Capital Management Disclosures
The Beiersdorf Group aims to sustainably secure its capital base and generate an appropriate return on its invested capital. As of December 31, 2019, the equity ratio was 61% (previous year: 64%), while the EBIT return on net operat-ing capital was 42% (previous year: 60%). The total dividends distributed in fiscal year 2019 amounted to €177 million (previous year: €177 million). In the case of the dividend of €159 million (previous year: €159 million) paid by Beiersdorf AG, this corresponds to a distribution of €0.70 per no-par-value share bearing dividend rights (previous year: €0.70).
17 Share Capital
The share capital of Beiersdorf Aktiengesellschaft amounts to €252 million (previous year: €252 million) and is composed of 252 million no-par-value bearer shares, each with an equal share in the company’s share capital. Since the settlement of the share buyback program on February 3, 2004, and fol-lowing implementation of the share split in 2006, Beiersdorf Aktienge-sellschaft holds 25,181,016 no-par-value shares, corresponding to 9.99% of the company’s share capital.
18 Authorized Capital
The Annual General Meeting on March 31, 2015, authorized the Executive Board to increase the share capital with the approval of the Supervisory Board in the period until March 30, 2020, by up to a total of €92 million (Authorized Capi-tal I: €42 million; Authorized Capital II: €25 million; Authorized Capital III: €25 million) by issuing new no-par-value bearer shares on one or several oc-casions. In this context, the dividend rights for new shares may be determined by a different method than that set out in § 60 (2) AktG.
Shareholders shall be granted preemptive rights. However, the Executive Board is authorized, with the approval of the Supervisory Board, to disapply share-holders’ preemptive rights in the following cases:
1. to eliminate fractions created as a result of capital increases against cash contributions (Authorized Capital I, II, III);
2. to the extent necessary to grant the holders/creditors of convertible bonds or bonds with warrants issued by Beiersdorf Aktiengesellschaft, or compa-nies in which it holds a direct or indirect majority interest, rights to subscribe for new shares in the amount to which they would be entitled after exercis-ing their conversion or option rights, or after fulfilling their conversion obli-gation (Authorized Capital I, II, III);
3. if the total amount of share capital attributable to the new shares for which preemptive rights are to be disapplied does not exceed 10% of the share capital existing at the time this authorization comes into effect or, in the event that this amount is lower, at the time the new shares are issued and
the issue price of the new shares is not materially lower than the quoted market price of the existing listed shares at the time when the issue price is finalized, which should be as near as possible to the time the shares are placed. If, during the term of the authorized capital, other authorizations to issue or sell shares in the company or to issue rights that enable or oblige the holder to subscribe for shares in the company are exercised while dis-applying preemptive rights pursuant to or in accordance with § 186 (3) sen-tence 4 AktG, this must be counted toward the above-mentioned 10% limit (Authorized Capital II);
4. in the case of capital increases against non-cash contributions for the purpose of acquiring companies, business units of companies, or equity interests in companies (Authorized Capital III).
The Executive Board may only exercise the above authorizations to disapply preemptive rights to the extent that the total proportionate interest in the share capital attributable to the shares issued while disapplying preemptive rights does not exceed 20% of the share capital at the time these authorizations be-come effective or at the time these authorizations are exercised. If other au-thorizations to issue or sell shares in the company or to issue rights that enable or oblige the holder to subscribe for shares in the company are exercised while disapplying preemptive rights during the term of the authorized capital until such time as it is utilized, this must be counted towards the above-mentioned limit.
The Executive Board was also authorized to determine the further details of the capital increase and its implementation with the approval of the Supervi-sory Board.
19 Contingent Capital
In addition, the Annual General Meeting on March 31, 2015, resolved to contin-gently increase the share capital by up to a total of €42 million, composed of up to 42 million no-par-value bearer shares. In accordance with the underlying resolution of the Annual General Meeting, the contingent capital increase will be implemented only if:
1. the holders or creditors of conversion and/or option rights attached to the convertible bonds and/or bonds with warrants issued in the period until March 30, 2020, by Beiersdorf Aktiengesellschaft, or companies in which it holds a direct or indirect majority interest, choose to exercise their conver-sion or option rights, or
2. the holders or creditors of convertible bonds giving rise to a conversion ob-ligation issued in the period until March 30, 2020, by Beiersdorf Aktienge-sellschaft, or companies in which it holds a direct or indirect majority inter-est, comply with such obligation,
and the contingent capital is required for this in accordance with the terms and conditions of the bonds.
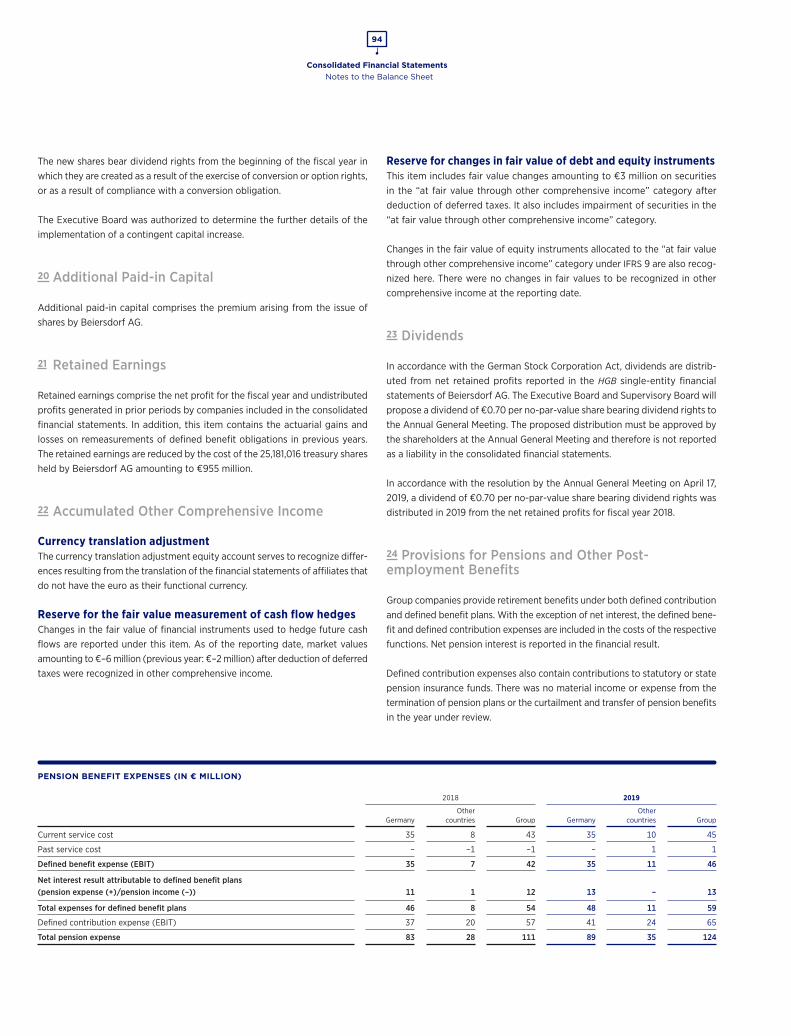
Consolidated Financial Statements
94
Notes to the Balance Sheet
The new shares bear dividend rights from the beginning of the fiscal year in which they are created as a result of the exercise of conversion or option rights, or as a result of compliance with a conversion obligation.
The Executive Board was authorized to determine the further details of the implementation of a contingent capital increase.
20 Additional Paid-in Capital
Additional paid-in capital comprises the premium arising from the issue of shares by Beiersdorf AG.
21 Retained Earnings
Retained earnings comprise the net profit for the fiscal year and undistributed profits generated in prior periods by companies included in the consolidated financial statements. In addition, this item contains the actuarial gains and losses on remeasurements of defined benefit obligations in previous years. The retained earnings are reduced by the cost of the 25,181,016 treasury shares held by Beiersdorf AG amounting to €955 million.
22 Accumulated Other Comprehensive Income
Currency translation adjustmentThe currency translation adjustment equity account serves to recognize differ-ences resulting from the translation of the financial statements of affiliates that do not have the euro as their functional currency.
Reserve for the fair value measurement of cash flow hedgesChanges in the fair value of financial instruments used to hedge future cash flows are reported under this item. As of the reporting date, market values amounting to €–6 million (previous year: €–2 million) after deduction of deferred taxes were recognized in other comprehensive income.
Reserve for changes in fair value of debt and equity instrumentsThis item includes fair value changes amounting to €3 million on securities in the “at fair value through other comprehensive income” category after deduction of deferred taxes. It also includes impairment of securities in the “at fair value through other comprehensive income” category.
Changes in the fair value of equity instruments allocated to the “at fair value through other comprehensive income” category under IFRS 9 are also recog-nized here. There were no changes in fair values to be recognized in other comprehensive income at the reporting date.
23 Dividends
In accordance with the German Stock Corporation Act, dividends are distrib-uted from net retained profits reported in the HGB single-entity financial statements of Beiersdorf AG. The Executive Board and Supervisory Board will propose a dividend of €0.70 per no-par-value share bearing dividend rights to the Annual General Meeting. The proposed distribution must be approved by the shareholders at the Annual General Meeting and therefore is not reported as a liability in the consolidated financial statements.
In accordance with the resolution by the Annual General Meeting on April 17, 2019, a dividend of €0.70 per no-par-value share bearing dividend rights was distributed in 2019 from the net retained profits for fiscal year 2018.
24 Provisions for Pensions and Other Post-employment Benefits
Group companies provide retirement benefits under both defined contribution and defined benefit plans. With the exception of net interest, the defined bene-fit and defined contribution expenses are included in the costs of the respective functions. Net pension interest is reported in the financial result.
Defined contribution expenses also contain contributions to statutory or state pension insurance funds. There was no material income or expense from the termination of pension plans or the curtailment and transfer of pension benefits in the year under review.
PENSION BENEFIT EXPENSES (IN € MILLION)
2018 2019
GermanyOther
countries Group GermanyOther
countries Group
Current service cost 35 8 43 35 10 45
Past service cost – –1 –1 – 1 1
Defined benefit expense (EBIT) 35 7 42 35 11 46
Net interest result attributable to defined benefit plans (pension expense (+)/pension income (–)) 11 1 12 13 – 13
Total expenses for defined benefit plans 46 8 54 48 11 59
Defined contribution expense (EBIT) 37 20 57 41 24 65
Total pension expense 83 28 111 89 35 124
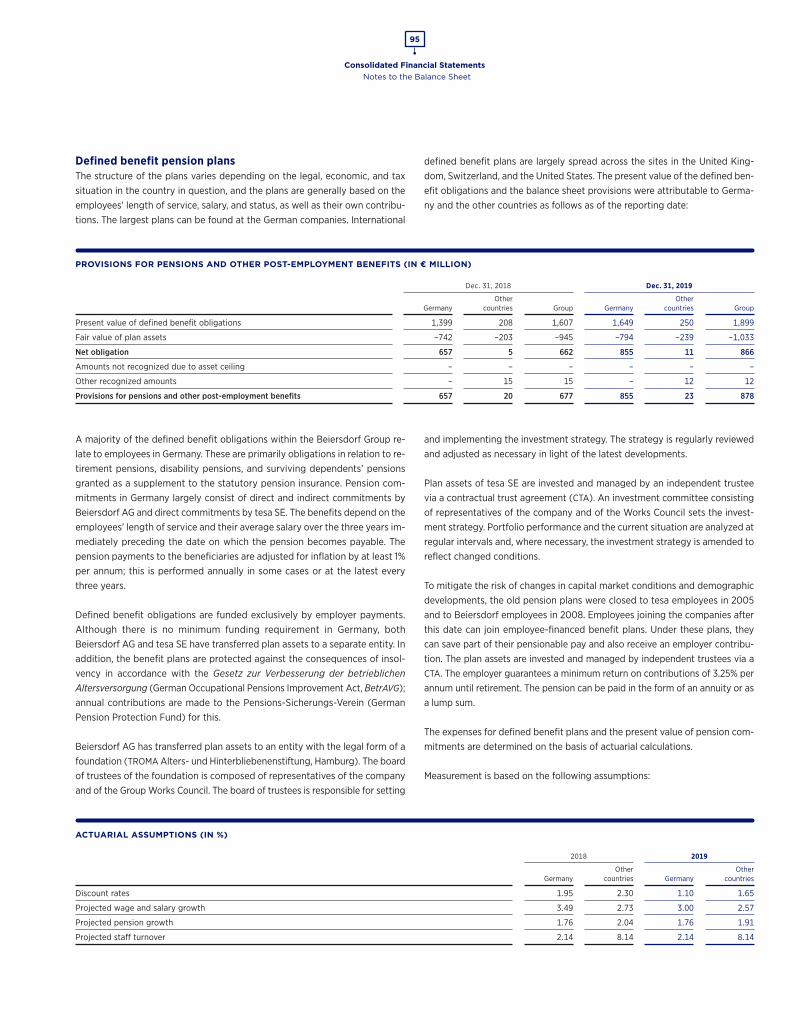
Consolidated Financial Statements
95
Notes to the Balance Sheet
Defined benefit pension plansThe structure of the plans varies depending on the legal, economic, and tax situation in the country in question, and the plans are generally based on the employees’ length of service, salary, and status, as well as their own contribu-tions. The largest plans can be found at the German companies. International
defined benefit plans are largely spread across the sites in the United King-dom, Switzerland, and the United States. The present value of the defined ben-efit obligations and the balance sheet provisions were attributable to Germa-ny and the other countries as follows as of the reporting date:
PROVISIONS FOR PENSIONS AND OTHER POST-EMPLOYMENT BENEFITS (IN € MILLION)
Dec. 31, 2018 Dec. 31, 2019
GermanyOther
countries Group GermanyOther
countries Group
Present value of defined benefit obligations 1,399 208 1,607 1,649 250 1,899
Fair value of plan assets –742 –203 –945 –794 –239 –1,033
Net obligation 657 5 662 855 11 866
Amounts not recognized due to asset ceiling – – – – – –
Other recognized amounts – 15 15 – 12 12
Provisions for pensions and other post-employment benefits 657 20 677 855 23 878
A majority of the defined benefit obligations within the Beiersdorf Group re-late to employees in Germany. These are primarily obligations in relation to re-tirement pensions, disability pensions, and surviving dependents’ pensions granted as a supplement to the statutory pension insurance. Pension com-mitments in Germany largely consist of direct and indirect commitments by Beiersdorf AG and direct commitments by tesa SE. The benefits depend on the employees’ length of service and their average salary over the three years im-mediately preceding the date on which the pension becomes payable. The pension payments to the beneficiaries are adjusted for inflation by at least 1% per annum; this is performed annually in some cases or at the latest every three years.
Defined benefit obligations are funded exclusively by employer payments. Although there is no minimum funding requirement in Germany, both Beiersdorf AG and tesa SE have transferred plan assets to a separate entity. In addition, the benefit plans are protected against the consequences of insol-vency in accordance with the Gesetz zur Verbesserung der betrieblichen Altersversorgung (German Occupational Pensions Improvement Act, BetrAVG); annual contributions are made to the Pensions-Sicherungs-Verein (German Pension Protection Fund) for this.
Beiersdorf AG has transferred plan assets to an entity with the legal form of a foundation (TROMA Alters- und Hinterbliebenenstiftung, Hamburg). The board of trustees of the foundation is composed of representatives of the company and of the Group Works Council. The board of trustees is responsible for setting
and implementing the investment strategy. The strategy is regularly reviewed and adjusted as necessary in light of the latest developments.
Plan assets of tesa SE are invested and managed by an independent trustee via a contractual trust agreement (CTA). An investment committee consisting of representatives of the company and of the Works Council sets the invest-ment strategy. Portfolio performance and the current situation are analyzed at regular intervals and, where necessary, the investment strategy is amended to reflect changed conditions.
To mitigate the risk of changes in capital market conditions and demographic developments, the old pension plans were closed to tesa employees in 2005 and to Beiersdorf employees in 2008. Employees joining the companies after this date can join employee-financed benefit plans. Under these plans, they can save part of their pensionable pay and also receive an employer contribu-tion. The plan assets are invested and managed by independent trustees via a CTA. The employer guarantees a minimum return on contributions of 3.25% per annum until retirement. The pension can be paid in the form of an annuity or as a lump sum.
The expenses for defined benefit plans and the present value of pension com-mitments are determined on the basis of actuarial calculations.
Measurement is based on the following assumptions:
ACTUARIAL ASSUMPTIONS (IN %)
2018 2019
GermanyOther
countries GermanyOther
countries
Discount rates 1.95 2.30 1.10 1.65
Projected wage and salary growth 3.49 2.73 3.00 2.57
Projected pension growth 1.76 2.04 1.76 1.91
Projected staff turnover 2.14 8.14 2.14 8.14
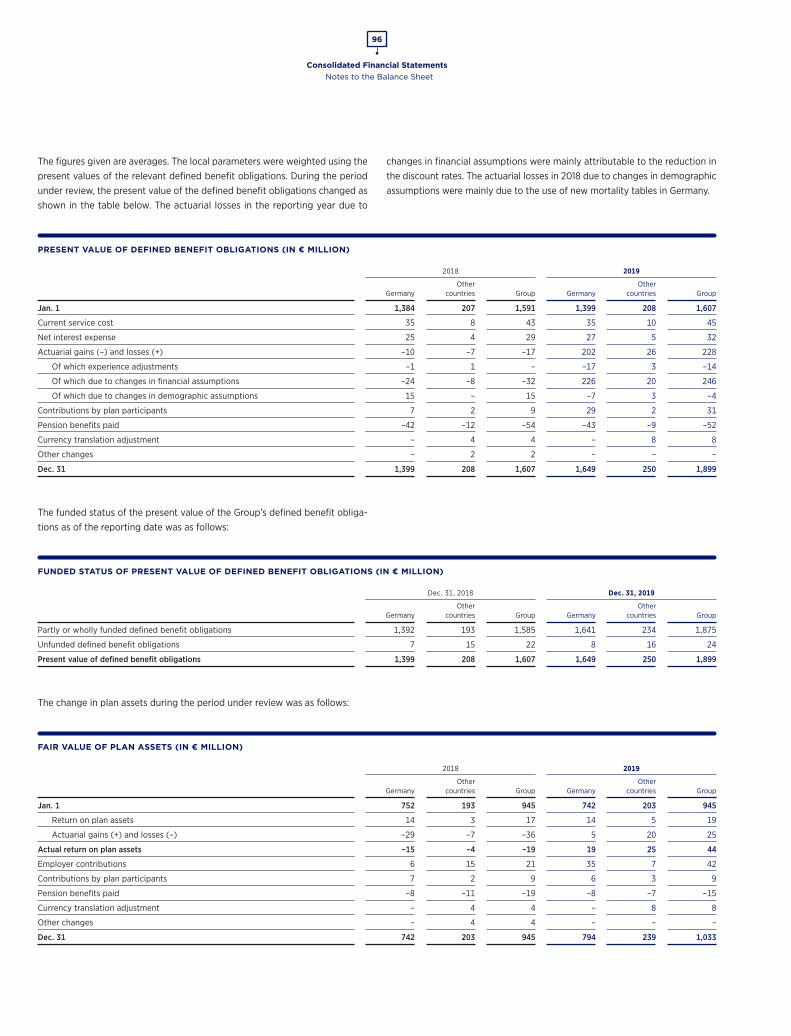
Consolidated Financial Statements
96
Notes to the Balance Sheet
The figures given are averages. The local parameters were weighted using the present values of the relevant defined benefit obligations. During the period under review, the present value of the defined benefit obligations changed as shown in the table below. The actuarial losses in the reporting year due to
changes in financial assumptions were mainly attributable to the reduction in the discount rates. The actuarial losses in 2018 due to changes in demographic assumptions were mainly due to the use of new mortality tables in Germany.
PRESENT VALUE OF DEFINED BENEFIT OBLIGATIONS (IN € MILLION)
2018 2019
GermanyOther
countries Group GermanyOther
countries Group
Jan. 1 1,384 207 1,591 1,399 208 1,607
Current service cost 35 8 43 35 10 45
Net interest expense 25 4 29 27 5 32
Actuarial gains (–) and losses (+) –10 –7 –17 202 26 228
Of which experience adjustments –1 1 – –17 3 –14
Of which due to changes in financial assumptions –24 –8 –32 226 20 246
Of which due to changes in demographic assumptions 15 – 15 –7 3 –4
Contributions by plan participants 7 2 9 29 2 31
Pension benefits paid –42 –12 –54 –43 –9 –52
Currency translation adjustment – 4 4 – 8 8
Other changes – 2 2 – – –
Dec. 31 1,399 208 1,607 1,649 250 1,899
The funded status of the present value of the Group’s defined benefit obliga-tions as of the reporting date was as follows:
FUNDED STATUS OF PRESENT VALUE OF DEFINED BENEFIT OBLIGATIONS (IN € MILLION)
Dec. 31, 2018 Dec. 31, 2019
GermanyOther
countries Group GermanyOther
countries Group
Partly or wholly funded defined benefit obligations 1,392 193 1,585 1,641 234 1,875
Unfunded defined benefit obligations 7 15 22 8 16 24
Present value of defined benefit obligations 1,399 208 1,607 1,649 250 1,899
The change in plan assets during the period under review was as follows:
FAIR VALUE OF PLAN ASSETS (IN € MILLION)
2018 2019
GermanyOther
countries Group GermanyOther
countries Group
Jan. 1 752 193 945 742 203 945
Return on plan assets 14 3 17 14 5 19
Actuarial gains (+) and losses (–) –29 –7 –36 5 20 25
Actual return on plan assets –15 –4 –19 19 25 44
Employer contributions 6 15 21 35 7 42
Contributions by plan participants 7 2 9 6 3 9
Pension benefits paid –8 –11 –19 –8 –7 –15
Currency translation adjustment – 4 4 – 8 8
Other changes – 4 4 – – –
Dec. 31 742 203 945 794 239 1,033
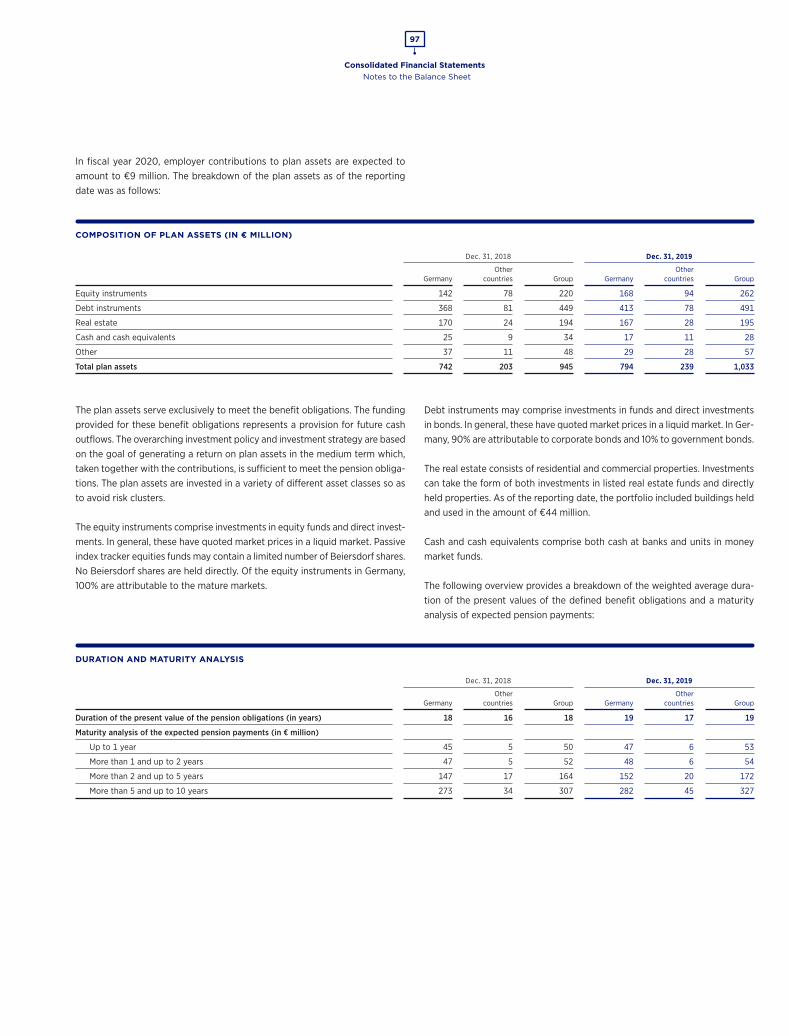
Consolidated Financial Statements
97
Notes to the Balance Sheet
In fiscal year 2020, employer contributions to plan assets are expected to amount to €9 million. The breakdown of the plan assets as of the reporting date was as follows:
COMPOSITION OF PLAN ASSETS (IN € MILLION)
Dec. 31, 2018 Dec. 31, 2019
GermanyOther
countries Group GermanyOther
countries Group
Equity instruments 142 78 220 168 94 262
Debt instruments 368 81 449 413 78 491
Real estate 170 24 194 167 28 195
Cash and cash equivalents 25 9 34 17 11 28
Other 37 11 48 29 28 57
Total plan assets 742 203 945 794 239 1,033
The plan assets serve exclusively to meet the benefit obligations. The funding provided for these benefit obligations represents a provision for future cash outflows. The overarching investment policy and investment strategy are based on the goal of generating a return on plan assets in the medium term which, taken together with the contributions, is sufficient to meet the pension obliga-tions. The plan assets are invested in a variety of different asset classes so as to avoid risk clusters.
The equity instruments comprise investments in equity funds and direct invest-ments. In general, these have quoted market prices in a liquid market. Passive index tracker equities funds may contain a limited number of Beiersdorf shares. No Beiersdorf shares are held directly. Of the equity instruments in Germany, 100% are attributable to the mature markets.
Debt instruments may comprise investments in funds and direct investments in bonds. In general, these have quoted market prices in a liquid market. In Ger-many, 90% are attributable to corporate bonds and 10% to government bonds.
The real estate consists of residential and commercial properties. Investments can take the form of both investments in listed real estate funds and directly held properties. As of the reporting date, the portfolio included buildings held and used in the amount of €44 million.
Cash and cash equivalents comprise both cash at banks and units in money market funds.
The following overview provides a breakdown of the weighted average dura-tion of the present values of the defined benefit obligations and a maturity analysis of expected pension payments:
DURATION AND MATURITY ANALYSIS
Dec. 31, 2018 Dec. 31, 2019
GermanyOther
countries Group GermanyOther
countries Group
Duration of the present value of the pension obligations (in years) 18 16 18 19 17 19
Maturity analysis of the expected pension payments (in € million)
Up to 1 year 45 5 50 47 6 53
More than 1 and up to 2 years 47 5 52 48 6 54
More than 2 and up to 5 years 147 17 164 152 20 172
More than 5 and up to 10 years 273 34 307 282 45 327
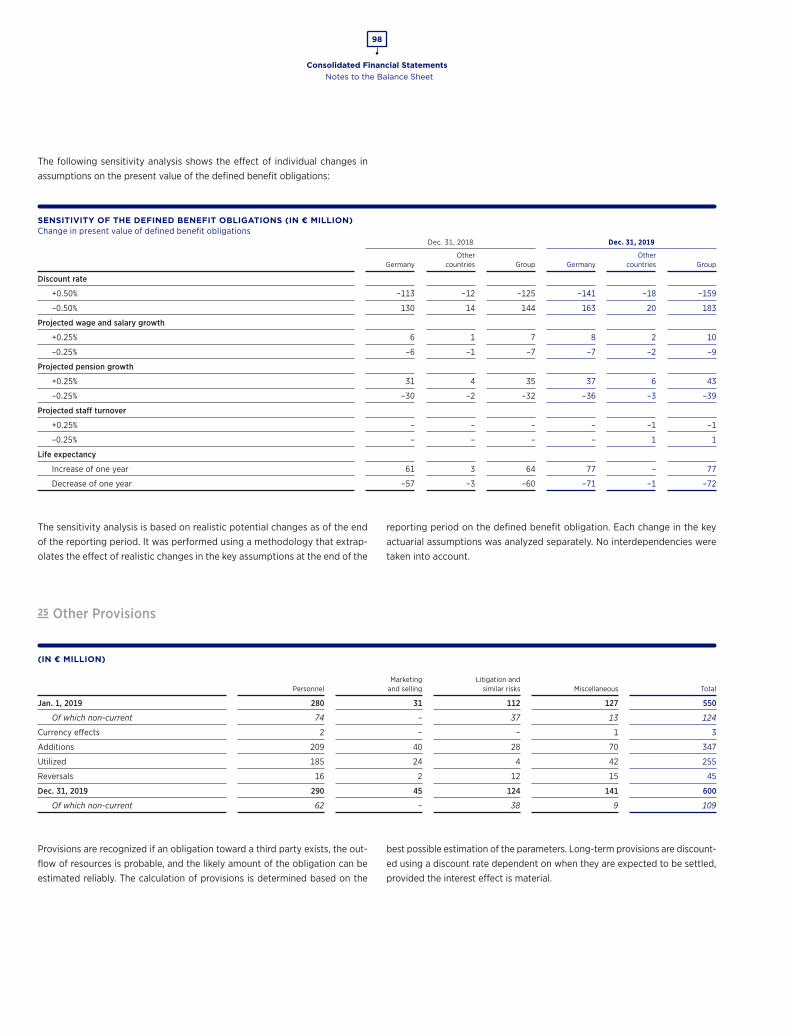
Consolidated Financial Statements
98
Notes to the Balance Sheet
The following sensitivity analysis shows the effect of individual changes in assumptions on the present value of the defined benefit obligations:
SENSITIVITY OF THE DEFINED BENEFIT OBLIGATIONS (IN € MILLION)Change in present value of defined benefit obligations
Dec. 31, 2018 Dec. 31, 2019
GermanyOther
countries Group GermanyOther
countries Group
Discount rate
+0.50% –113 –12 –125 –141 –18 –159
–0.50% 130 14 144 163 20 183
Projected wage and salary growth
+0.25% 6 1 7 8 2 10
–0.25% –6 –1 –7 –7 –2 –9
Projected pension growth
+0.25% 31 4 35 37 6 43
–0.25% –30 –2 –32 –36 –3 –39
Projected staff turnover
+0.25% – – – – –1 –1
–0.25% – – – – 1 1
Life expectancy
Increase of one year 61 3 64 77 – 77
Decrease of one year –57 –3 –60 –71 –1 –72
The sensitivity analysis is based on realistic potential changes as of the end of the reporting period. It was performed using a methodology that extrap-olates the effect of realistic changes in the key assumptions at the end of the
reporting period on the defined benefit obligation. Each change in the key actuarial assumptions was analyzed separately. No interdependencies were taken into account.
25 Other Provisions
(IN € MILLION)
PersonnelMarketing
and sellingLitigation and
similar risks Miscellaneous Total
Jan. 1, 2019 280 31 112 127 550
Of which noncurrent 74 – 37 13 124
Currency effects 2 – – 1 3
Additions 209 40 28 70 347
Utilized 185 24 4 42 255
Reversals 16 2 12 15 45
Dec. 31, 2019 290 45 124 141 600
Of which noncurrent 62 – 38 9 109
Provisions are recognized if an obligation toward a third party exists, the out-flow of resources is probable, and the likely amount of the obligation can be estimated reliably. The calculation of provisions is determined based on the
best possible estimation of the parameters. Long-term provisions are discount-ed using a discount rate dependent on when they are expected to be settled, provided the interest effect is material.
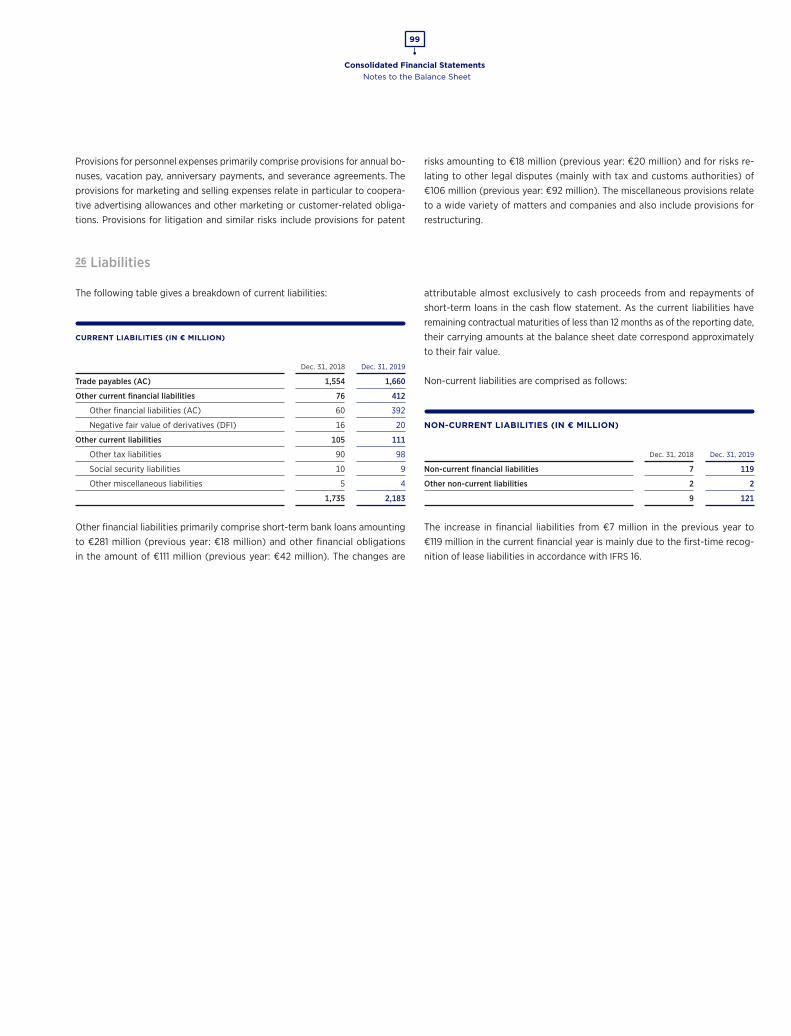
Consolidated Financial Statements
99
Notes to the Balance Sheet
Provisions for personnel expenses primarily comprise provisions for annual bo-nuses, vacation pay, anniversary payments, and severance agreements. The provisions for marketing and selling expenses relate in particular to coopera-tive advertising allowances and other marketing or customer-related obliga-tions. Provisions for litigation and similar risks include provisions for patent
risks amounting to €18 million (previous year: €20 million) and for risks re-lating to other legal disputes (mainly with tax and customs authorities) of €106 million (previous year: €92 million). The miscellaneous provisions relate to a wide variety of matters and companies and also include provisions for restructuring.
26 Liabilities
The following table gives a breakdown of current liabilities:
CURRENT LIABILITIES (IN € MILLION)
Dec. 31, 2018 Dec. 31, 2019
Trade payables (AC) 1,554 1,660
Other current financial liabilities 76 412
Other financial liabilities (AC) 60 392
Negative fair value of derivatives (DFI) 16 20
Other current liabilities 105 111
Other tax liabilities 90 98
Social security liabilities 10 9
Other miscellaneous liabilities 5 4
1,735 2,183
Other financial liabilities primarily comprise short-term bank loans amounting to €281 million (previous year: €18 million) and other financial obligations in the amount of €111 million (previous year: €42 million). The changes are
attributable almost exclusively to cash proceeds from and repayments of short-term loans in the cash flow statement. As the current liabilities have remaining contractual maturities of less than 12 months as of the reporting date, their carrying amounts at the balance sheet date correspond approximately to their fair value.
Non-current liabilities are comprised as follows:
NON-CURRENT LIABILITIES (IN € MILLION)
Dec. 31, 2018 Dec. 31, 2019
Non-current financial liabilities 7 119
Other non-current liabilities 2 2
9 121
The increase in financial liabilities from €7 million in the previous year to €119 million in the current financial year is mainly due to the first-time recog-nition of lease liabilities in accordance with IFRS 16.
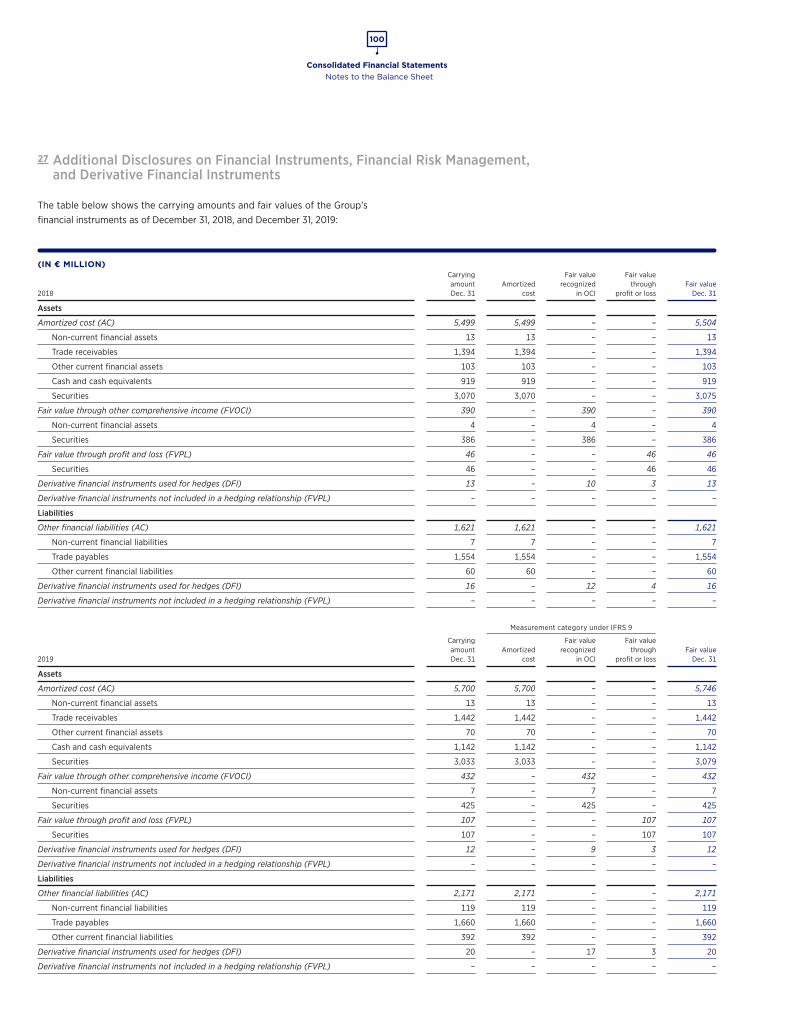
Consolidated Financial Statements
100
Notes to the Balance Sheet
27 Additional Disclosures on Financial Instruments, Financial Risk Management, and Derivative Financial Instruments
The table below shows the carrying amounts and fair values of the Group’s financial instruments as of December 31, 2018, and December 31, 2019:
(IN € MILLION)
2018
Carrying amount Dec. 31
Amortized cost
Fair value recognized
in OCI
Fair value through
profit or lossFair value
Dec. 31
Assets
Amortized cost (AC) 5,499 5,499 – – 5,504
Non-current financial assets 13 13 – – 13
Trade receivables 1,394 1,394 – – 1,394
Other current financial assets 103 103 – – 103
Cash and cash equivalents 919 919 – – 919
Securities 3,070 3,070 – – 3,075
Fair value through other comprehensive income (FVOCI) 390 – 390 – 390
Non-current financial assets 4 – 4 – 4
Securities 386 – 386 – 386
Fair value through profit and loss (FVPL) 46 – – 46 46
Securities 46 – – 46 46
Derivative financial instruments used for hedges (DFI) 13 – 10 3 13
Derivative financial instruments not included in a hedging relationship (FVPL) – – – – –
Liabilities
Other financial liabilities (AC) 1,621 1,621 – – 1,621
Non-current financial liabilities 7 7 – – 7
Trade payables 1,554 1,554 – – 1,554
Other current financial liabilities 60 60 – – 60
Derivative financial instruments used for hedges (DFI) 16 – 12 4 16
Derivative financial instruments not included in a hedging relationship (FVPL) – – – – –
Measurement category under IFRS 9
2019
Carrying amount Dec. 31
Amortized cost
Fair value recognized
in OCI
Fair value through
profit or lossFair value
Dec. 31
Assets
Amortized cost (AC) 5,700 5,700 – – 5,746
Non-current financial assets 13 13 – – 13
Trade receivables 1,442 1,442 – – 1,442
Other current financial assets 70 70 – – 70
Cash and cash equivalents 1,142 1,142 – – 1,142
Securities 3,033 3,033 – – 3,079
Fair value through other comprehensive income (FVOCI) 432 – 432 – 432
Non-current financial assets 7 – 7 – 7
Securities 425 – 425 – 425
Fair value through profit and loss (FVPL) 107 – – 107 107
Securities 107 – – 107 107
Derivative financial instruments used for hedges (DFI) 12 – 9 3 12
Derivative financial instruments not included in a hedging relationship (FVPL) – – – – –
Liabilities
Other financial liabilities (AC) 2,171 2,171 – – 2,171
Non-current financial liabilities 119 119 – – 119
Trade payables 1,660 1,660 – – 1,660
Other current financial liabilities 392 392 – – 392
Derivative financial instruments used for hedges (DFI) 20 – 17 3 20
Derivative financial instruments not included in a hedging relationship (FVPL) – – – – –
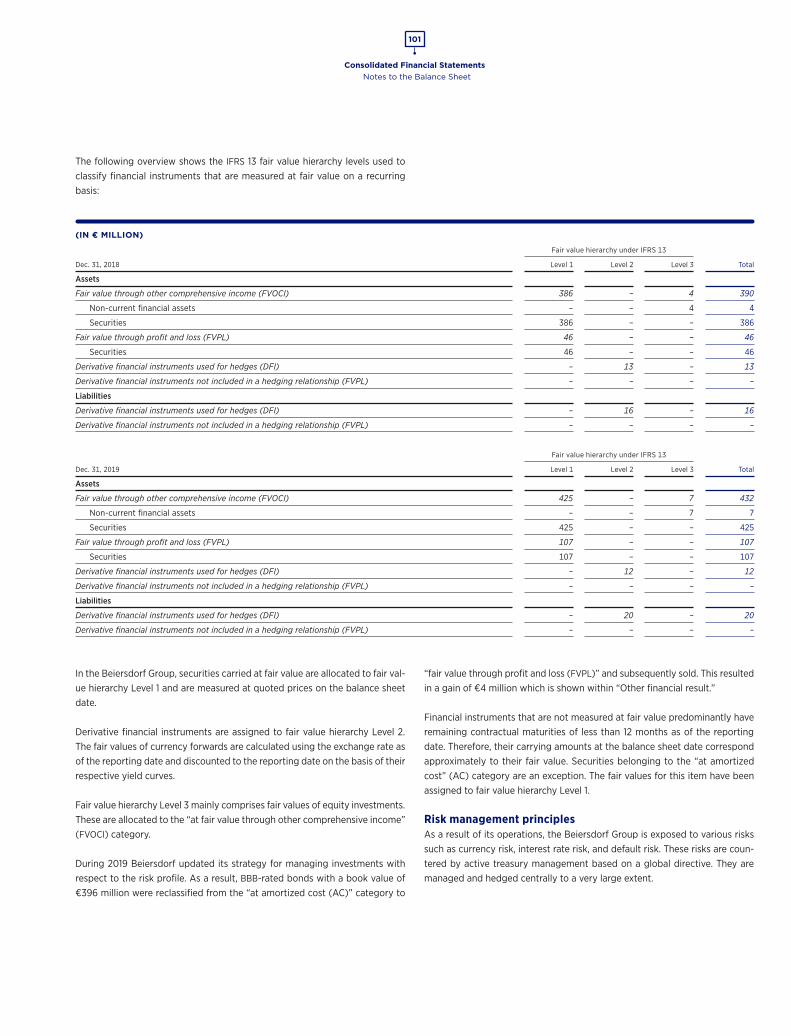
Consolidated Financial Statements
101
Notes to the Balance Sheet
The following overview shows the IFRS 13 fair value hierarchy levels used to classify financial instruments that are measured at fair value on a recurring basis:
(IN € MILLION)
Fair value hierarchy under IFRS 13
Dec. 31, 2018 Level 1 Level 2 Level 3 Total
Assets
Fair value through other comprehensive income (FVOCI) 386 – 4 390
Non-current financial assets – – 4 4
Securities 386 – – 386
Fair value through profit and loss (FVPL) 46 – – 46
Securities 46 – – 46
Derivative financial instruments used for hedges (DFI) – 13 – 13
Derivative financial instruments not included in a hedging relationship (FVPL) – – – –
Liabilities
Derivative financial instruments used for hedges (DFI) – 16 – 16
Derivative financial instruments not included in a hedging relationship (FVPL) – – – –
Fair value hierarchy under IFRS 13
Dec. 31, 2019 Level 1 Level 2 Level 3 Total
Assets
Fair value through other comprehensive income (FVOCI) 425 – 7 432
Non-current financial assets – – 7 7
Securities 425 – – 425
Fair value through profit and loss (FVPL) 107 – – 107
Securities 107 – – 107
Derivative financial instruments used for hedges (DFI) – 12 – 12
Derivative financial instruments not included in a hedging relationship (FVPL) – – – –
Liabilities
Derivative financial instruments used for hedges (DFI) – 20 – 20
Derivative financial instruments not included in a hedging relationship (FVPL) – – – –
In the Beiersdorf Group, securities carried at fair value are allocated to fair val-ue hierarchy Level 1 and are measured at quoted prices on the balance sheet date.
Derivative financial instruments are assigned to fair value hierarchy Level 2. The fair values of currency forwards are calculated using the exchange rate as of the reporting date and discounted to the reporting date on the basis of their respective yield curves.
Fair value hierarchy Level 3 mainly comprises fair values of equity investments. These are allocated to the “at fair value through other comprehensive income” (FVOCI) category.
During 2019 Beiersdorf updated its strategy for managing investments with respect to the risk profile. As a result, BBB-rated bonds with a book value of €396 million were reclassified from the “at amortized cost (AC)” category to
“fair value through profit and loss (FVPL)” and subsequently sold. This resulted in a gain of €4 million which is shown within “Other financial result.”
Financial instruments that are not measured at fair value predominantly have remaining contractual maturities of less than 12 months as of the reporting date. Therefore, their carrying amounts at the balance sheet date correspond approximately to their fair value. Securities belonging to the “at amortized cost” (AC) category are an exception. The fair values for this item have been assigned to fair value hierarchy Level 1.
Risk management principlesAs a result of its operations, the Beiersdorf Group is exposed to various risks such as currency risk, interest rate risk, and default risk. These risks are coun-tered by active treasury management based on a global directive. They are managed and hedged centrally to a very large extent.
Consolidated Financial Statements
102
Notes to the Balance Sheet
Derivative financial instruments are used to hedge the operational business and material financial transactions. The transactions are conducted exclusive-ly with marketable instruments. IFRS 7 requires sensitivity analyses, which show the effects of hypothetical changes in relevant risk variables on profit or loss and equity, to be used in presenting market risk. For the Beiersdorf Group, this mainly relates to currency risk. The effects are ascertained by applying the hypothetical changes in risk variables to the portfolio of financial instruments as of the balance sheet date. It is assumed that the portfolio at the reporting date is representative for the year as a whole.
Currency riskCurrency risk is the risk of fluctuations in the fair value or future cash flows of a financial instrument as a result of changes in exchange rates.
Currency risk within the meaning of IFRS 7 arises through monetary financial instruments that are reported in a currency other than the functional currency. Exchange rate differences arising from the translation of financial statements of affiliates into the Group currency are not included. Relevant risk variables are therefore basically all non-functional currencies in which financial instru-ments are held by the Beiersdorf Group. As a result of the Beiersdorf Group’s international orientation with an emphasis on the eurozone, the euro serves as the key currency. Consequently, the Beiersdorf Group is exposed to risks through financing measures and operational activities when other currencies fluctuate against the euro.
As a matter of principle, currency risks relating to cross-border intragroup fi-nancing are hedged centrally in full and at matching maturities using currency forwards (fair value hedges). Owing to these hedging activities, the Beiersdorf Group is not exposed to any significant currency risks in its financing activities as of the balance sheet date. Gains and losses on these currency forwards are offset in full by gains and losses on the hedged items.
With regard to operations, a majority of cash flows in non-functional currencies in the Beiersdorf Group are generally hedged for the next 12 months using standard currency forwards. These transactions are recorded, measured, and managed centrally in the treasury management system. As a result, the Beiersdorf Group is not exposed to any significant currency risks in its opera-tions as of the balance sheet date.
Since material non-derivative financial instruments are either denominated directly in the functional currency or transformed into the functional currency through the use of derivatives, changes in the exchange rate do not have any material effects on profit and loss or equity. Consequently, the Beiersdorf Group is primarily only exposed to risks arising from currency forwards which are designated as hedging instruments and which meet the criteria for recogni-tion as cash flow hedges on forecasted transactions. Changes in market prices largely affect the hedging reserve in equity and the fair values of the hedging transactions.
The fair value of the currency forwards at the balance sheet date was €–8 mil-lion (previous year: €–3 million), and their notional value was €1,698 million (previous year: €1,860 million). As in the previous year, all of the forward con-tracts have a remaining maturity of up to one year. The notional values represent the aggregate of all purchase and selling amounts for derivatives. The notional values shown are not netted.
If the euro had appreciated by 10% against all currencies as of December 31, 2019, the fair values of the currency forwards recognized directly within the hedging reserves in equity would have increased by €41 million (previous year: €49 million). If the euro had depreciated by 10%, the fair values of the currency forwards recognized directly within the hedging reserves in equity would have decreased by €67 million (previous year: €65 million). An appreciation or de-preciation of the euro would not have a material impact on the consolidated financial statements when valuing currency forwards recognized in profit and loss. This is because the resulting changes in the hedged items would compen-sate for the effects of any changes in the market values.
Interest rate riskInterest rate risk is the risk that the fair value or future cash flows of a financial instrument may fluctuate as a result of changes in market interest rates.
Beiersdorf has only a small volume of non-current financial instruments that are not measured at amortized cost and does not have any interest rate deriv-atives. Changes in fair values are therefore of no more than minor significance for the Beiersdorf Group. These are subject to interest rate risk within the meaning of IFRS 7 for the entire fiscal year.
If the interest rates at the quarter-ends of the fiscal year had been 100 basis points higher (lower) in each case than the yield curve, the financial result would have been €9 million (previous year: €8 million) higher (lower). This would have had no impact on accumulated other comprehensive income within equity.
Default riskThe Beiersdorf Group is exposed to default risk within the scope of its financ-ing activities and in its operations. The maximum default risk can be seen from the carrying amount of each financial asset recognized in the balance sheet. The total carrying amount of the financial assets was €6,251 million as of De-cember 31, 2019 (previous year: €5,948 million).
The simplified process is used for determining impairments on trade receivables under IFRS 9. In this approach, expected credit losses over the entire lifetime of the financial instruments are determined. Expected losses are estimated based on analyses of historical defaults and the age structure of the receivables as well as current economic developments and an assessment of the credit quality of individual customers.
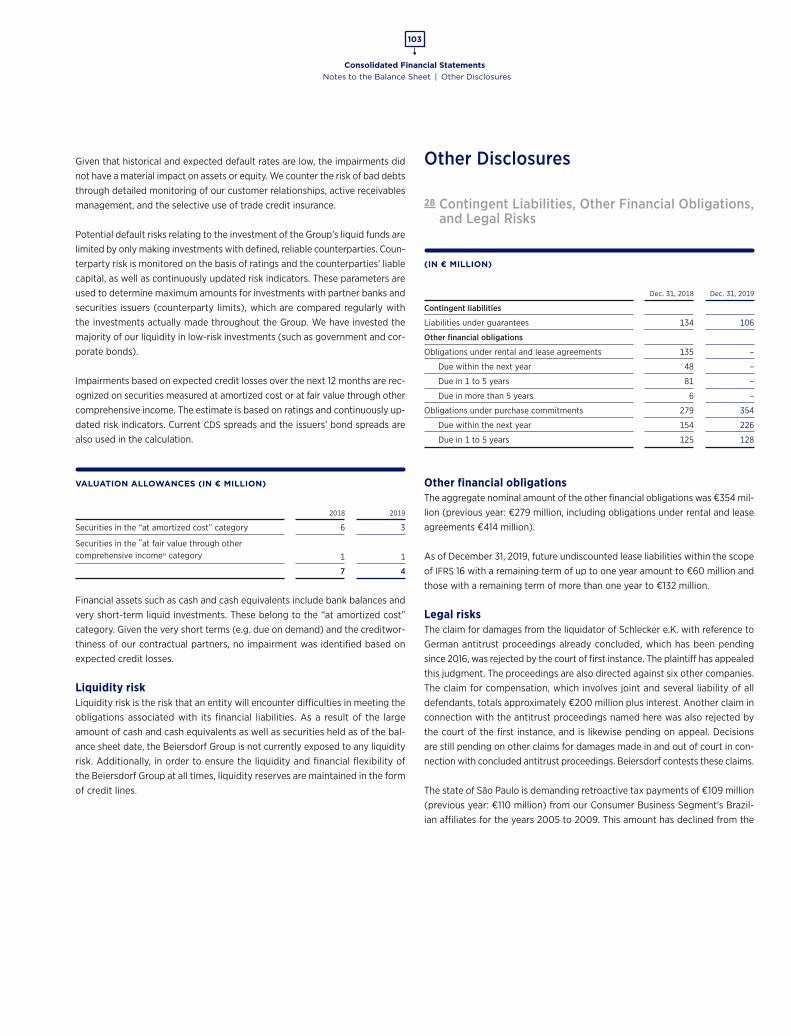
Consolidated Financial Statements
103
Notes to the Balance Sheet | Other Disclosures
Given that historical and expected default rates are low, the impairments did not have a material impact on assets or equity. We counter the risk of bad debts through detailed monitoring of our customer relationships, active receivables management, and the selective use of trade credit insurance.
Potential default risks relating to the investment of the Group’s liquid funds are limited by only making investments with defined, reliable counterparties. Coun-terparty risk is monitored on the basis of ratings and the counterparties’ liable capital, as well as continuously updated risk indicators. These parameters are used to determine maximum amounts for investments with partner banks and securities issuers (counterparty limits), which are compared regularly with the investments actually made throughout the Group. We have invested the majority of our liquidity in low-risk investments (such as government and cor-porate bonds).
Impairments based on expected credit losses over the next 12 months are rec-ognized on securities measured at amortized cost or at fair value through other comprehensive income. The estimate is based on ratings and continuously up-dated risk indicators. Current CDS spreads and the issuers’ bond spreads are also used in the calculation.
VALUATION ALLOWANCES (IN € MILLION)
2018 2019
Securities in the “at amortized cost” category 6 3
Securities in the “at fair value through other comprehensive income” category 1 1
7 4
Financial assets such as cash and cash equivalents include bank balances and very short-term liquid investments. These belong to the “at amortized cost” category. Given the very short terms (e.g. due on demand) and the creditwor-thiness of our contractual partners, no impairment was identified based on expected credit losses.
Liquidity riskLiquidity risk is the risk that an entity will encounter difficulties in meeting the obligations associated with its financial liabilities. As a result of the large amount of cash and cash equivalents as well as securities held as of the bal-ance sheet date, the Beiersdorf Group is not currently exposed to any liquidity risk. Additionally, in order to ensure the liquidity and financial flexibility of the Beiersdorf Group at all times, liquidity reserves are maintained in the form of credit lines.
Other Disclosures
28 Contingent Liabilities, Other Financial Obligations, and Legal Risks
(IN € MILLION)
Dec. 31, 2018 Dec. 31, 2019
Contingent liabilities
Liabilities under guarantees 134 106
Other financial obligations
Obligations under rental and lease agreements 135 –
Due within the next year 48 –
Due in 1 to 5 years 81 –
Due in more than 5 years 6 –
Obligations under purchase commitments 279 354
Due within the next year 154 226
Due in 1 to 5 years 125 128
Other financial obligationsThe aggregate nominal amount of the other financial obligations was €354 mil-lion (previous year: €279 million, including obligations under rental and lease agreements €414 million).
As of December 31, 2019, future undiscounted lease liabilities within the scope of IFRS 16 with a remaining term of up to one year amount to €60 million and those with a remaining term of more than one year to €132 million.
Legal risksThe claim for damages from the liquidator of Schlecker e.K. with reference to German antitrust proceedings already concluded, which has been pending since 2016, was rejected by the court of first instance. The plaintiff has appealed this judgment. The proceedings are also directed against six other companies. The claim for compensation, which involves joint and several liability of all defendants, totals approximately €200 million plus interest. Another claim in connection with the antitrust proceedings named here was also rejected by the court of the first instance, and is likewise pending on appeal. Decisions are still pending on other claims for damages made in and out of court in con-nection with concluded antitrust proceedings. Beiersdorf contests these claims.
The state of São Paulo is demanding retroactive tax payments of €109 million (previous year: €110 million) from our Consumer Business Segment’s Brazil-ian affiliates for the years 2005 to 2009. This amount has declined from the
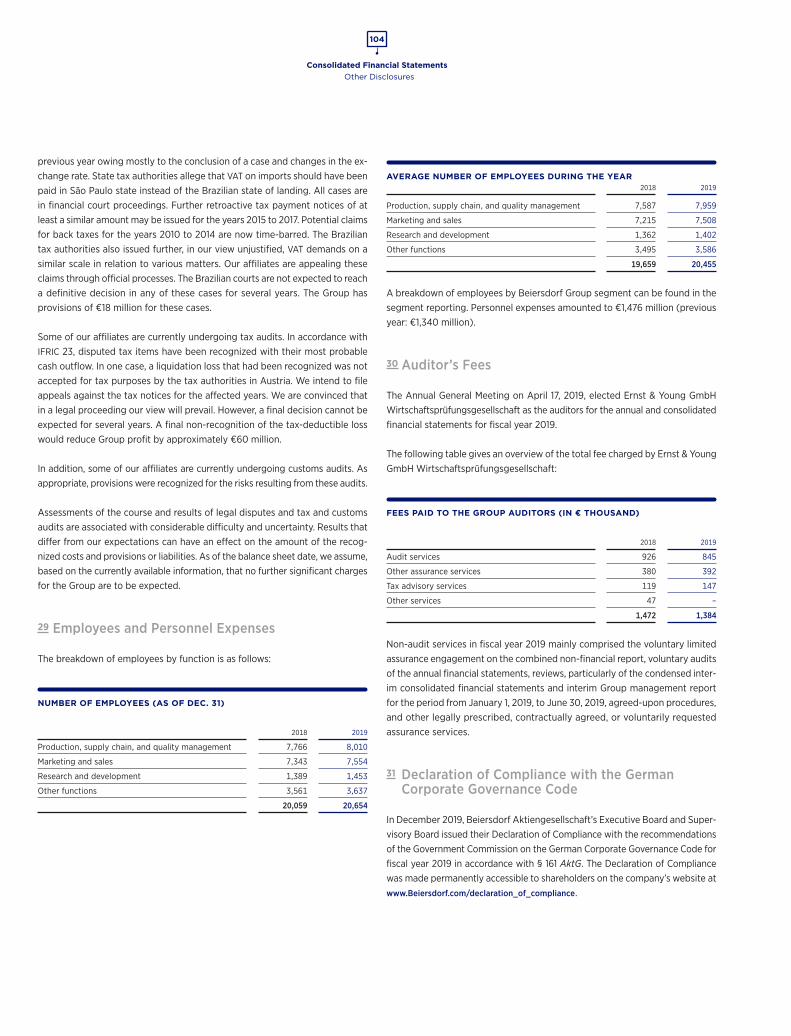
Consolidated Financial Statements
104
Other Disclosures
previous year owing mostly to the conclusion of a case and changes in the ex-change rate. State tax authorities allege that VAT on imports should have been paid in São Paulo state instead of the Brazilian state of landing. All cases are in financial court proceedings. Further retroactive tax payment notices of at least a similar amount may be issued for the years 2015 to 2017. Potential claims for back taxes for the years 2010 to 2014 are now time-barred. The Brazilian tax authorities also issued further, in our view unjustified, VAT demands on a similar scale in relation to various matters. Our affiliates are appealing these claims through official processes. The Brazilian courts are not expected to reach a definitive decision in any of these cases for several years. The Group has provisions of €18 million for these cases.
Some of our affiliates are currently undergoing tax audits. In accordance with IFRIC 23, disputed tax items have been recognized with their most probable cash outflow. In one case, a liquidation loss that had been recognized was not accepted for tax purposes by the tax authorities in Austria. We intend to file appeals against the tax notices for the affected years. We are convinced that in a legal proceeding our view will prevail. However, a final decision cannot be expected for several years. A final non-recognition of the tax-deductible loss would reduce Group profit by approximately €60 million.
In addition, some of our affiliates are currently undergoing customs audits. As appropriate, provisions were recognized for the risks resulting from these audits.
Assessments of the course and results of legal disputes and tax and customs audits are associated with considerable difficulty and uncertainty. Results that differ from our expectations can have an effect on the amount of the recog-nized costs and provisions or liabilities. As of the balance sheet date, we assume, based on the currently available information, that no further significant charges for the Group are to be expected.
29 Employees and Personnel Expenses
The breakdown of employees by function is as follows:
NUMBER OF EMPLOYEES (AS OF DEC. 31)
2018 2019
Production, supply chain, and quality management 7,766 8,010
Marketing and sales 7,343 7,554
Research and development 1,389 1,453
Other functions 3,561 3,637
20,059 20,654
AVERAGE NUMBER OF EMPLOYEES DURING THE YEAR 2018 2019
Production, supply chain, and quality management 7,587 7,959
Marketing and sales 7,215 7,508
Research and development 1,362 1,402
Other functions 3,495 3,586
19,659 20,455
A breakdown of employees by Beiersdorf Group segment can be found in the segment reporting. Personnel expenses amounted to €1,476 million (previous year: €1,340 million).
30 Auditor’s Fees
The Annual General Meeting on April 17, 2019, elected Ernst & Young GmbH Wirtschaftsprüfungsgesellschaft as the auditors for the annual and consolidated financial statements for fiscal year 2019.
The following table gives an overview of the total fee charged by Ernst & Young GmbH Wirtschaftsprüfungsgesellschaft:
FEES PAID TO THE GROUP AUDITORS (IN € THOUSAND)
2018 2019
Audit services 926 845
Other assurance services 380 392
Tax advisory services 119 147
Other services 47 –
1,472 1,384
Non-audit services in fiscal year 2019 mainly comprised the voluntary limited assurance engagement on the combined non-financial report, voluntary audits of the annual financial statements, reviews, particularly of the condensed inter-im consolidated financial statements and interim Group management report for the period from January 1, 2019, to June 30, 2019, agreed-upon procedures, and other legally prescribed, contractually agreed, or voluntarily requested assurance services.
31 Declaration of Compliance with the German Corporate Governance Code
In December 2019, Beiersdorf Aktiengesellschaft’s Executive Board and Super-visory Board issued their Declaration of Compliance with the recommendations of the Government Commission on the German Corporate Governance Code for fiscal year 2019 in accordance with § 161 AktG. The Declaration of Compliance was made permanently accessible to shareholders on the company’s website at www.Beiersdorf.com/declaration_of_compliance .
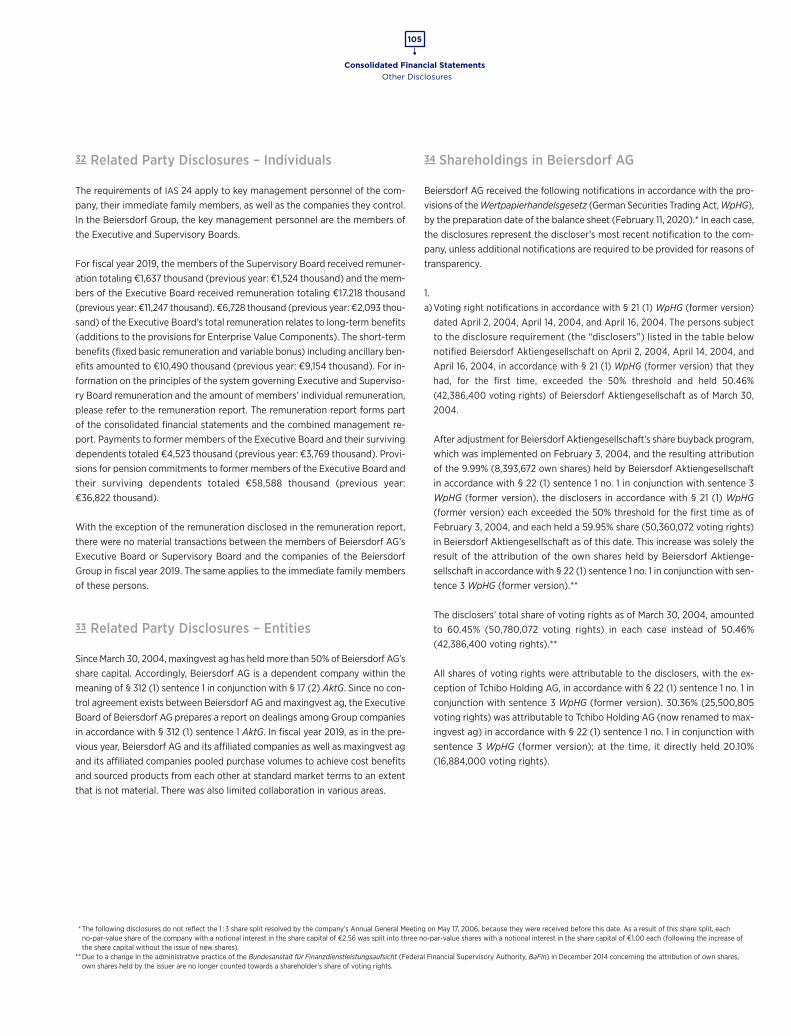
Consolidated Financial Statements
105
Other Disclosures
32 Related Party Disclosures – Individuals
The requirements of IAS 24 apply to key management personnel of the com-pany, their immediate family members, as well as the companies they control. In the Beiersdorf Group, the key management personnel are the members of the Executive and Supervisory Boards.
For fiscal year 2019, the members of the Supervisory Board received remuner-ation totaling €1,637 thousand (previous year: €1,524 thousand) and the mem-bers of the Executive Board received remuneration totaling €17.218 thousand (previous year: €11,247 thousand). €6,728 thousand (previous year: €2,093 thou-sand) of the Executive Board’s total remuneration relates to long-term benefits (additions to the provisions for Enterprise Value Components). The short-term benefits (fixed basic remuneration and variable bonus) including ancillary ben-efits amounted to €10,490 thousand (previous year: €9,154 thousand). For in-formation on the principles of the system governing Executive and Superviso-ry Board remuneration and the amount of members’ individual remuneration, please refer to the remuneration report. The remuneration report forms part of the consolidated financial statements and the combined management re-port. Payments to former members of the Executive Board and their surviving dependents totaled €4,523 thousand (previous year: €3,769 thousand). Provi-sions for pension commitments to former members of the Executive Board and their surviving dependents totaled €58,588 thousand (previous year: €36,822 thousand).
With the exception of the remuneration disclosed in the remuneration report, there were no material transactions between the members of Beiersdorf AG’s Executive Board or Supervisory Board and the companies of the Beiersdorf Group in fiscal year 2019. The same applies to the immediate family members of these persons.
33 Related Party Disclosures – Entities
Since March 30, 2004, maxingvest ag has held more than 50% of Beiersdorf AG’s share capital. Accordingly, Beiersdorf AG is a dependent company within the meaning of § 312 (1) sentence 1 in conjunction with § 17 (2) AktG. Since no con-trol agreement exists between Beiersdorf AG and maxingvest ag, the Executive Board of Beiersdorf AG prepares a report on dealings among Group companies in accordance with § 312 (1) sentence 1 AktG. In fiscal year 2019, as in the pre-vious year, Beiersdorf AG and its affiliated companies as well as maxingvest ag and its affiliated companies pooled purchase volumes to achieve cost benefits and sourced products from each other at standard market terms to an extent that is not material. There was also limited collaboration in various areas.
34 Shareholdings in Beiersdorf AG
Beiersdorf AG received the following notifications in accordance with the pro-visions of the Wertpapierhandelsgesetz (German Securities Trading Act, WpHG), by the preparation date of the balance sheet (February 11, 2020).* In each case, the disclosures represent the discloser’s most recent notification to the com-pany, unless additional notifications are required to be provided for reasons of transparency.
1.a) Voting right notifications in accordance with § 21 (1) WpHG (former version)
dated April 2, 2004, April 14, 2004, and April 16, 2004. The persons subject to the disclosure requirement (the “disclosers”) listed in the table below notified Beiersdorf Aktiengesellschaft on April 2, 2004, April 14, 2004, and April 16, 2004, in accordance with § 21 (1) WpHG (former version) that they had, for the first time, exceeded the 50% threshold and held 50.46% (42,386,400 voting rights) of Beiersdorf Aktiengesellschaft as of March 30, 2004. After adjustment for Beiersdorf Aktiengesellschaft’s share buyback program, which was implemented on February 3, 2004, and the resulting attribution of the 9.99% (8,393,672 own shares) held by Beiersdorf Aktiengesellschaft in accordance with § 22 (1) sentence 1 no. 1 in conjunction with sentence 3 WpHG (former version), the disclosers in accordance with § 21 (1) WpHG (former version) each exceeded the 50% threshold for the first time as of February 3, 2004, and each held a 59.95% share (50,360,072 voting rights) in Beiersdorf Aktiengesellschaft as of this date. This increase was solely the result of the attribution of the own shares held by Beiersdorf Aktienge-sellschaft in accordance with § 22 (1) sentence 1 no. 1 in conjunction with sen-tence 3 WpHG (former version).**
The disclosers’ total share of voting rights as of March 30, 2004, amounted to 60.45% (50,780,072 voting rights) in each case instead of 50.46% (42,386,400 voting rights).**
All shares of voting rights were attributable to the disclosers, with the ex-ception of Tchibo Holding AG, in accordance with § 22 (1) sentence 1 no. 1 in conjunction with sentence 3 WpHG (former version). 30.36% (25,500,805 voting rights) was attributable to Tchibo Holding AG (now renamed to max-ingvest ag) in accordance with § 22 (1) sentence 1 no. 1 in conjunction with sentence 3 WpHG (former version); at the time, it directly held 20.10% (16,884,000 voting rights).
* The following disclosures do not reflect the 1 : 3 share split resolved by the company’s Annual General Meeting on May 17, 2006, because they were received before this date. As a result of this share split, each no-par-value share of the company with a notional interest in the share capital of €2.56 was split into three no-par-value shares with a notional interest in the share capital of €1.00 each (following the increase of the share capital without the issue of new shares).
** Due to a change in the administrative practice of the Bundesanstalt für Finanzdienstleistungsaufsicht (Federal Financial Supervisory Authority, BaFin) in December 2014 concerning the attribution of own shares, own shares held by the issuer are no longer counted towards a shareholder’s share of voting rights.
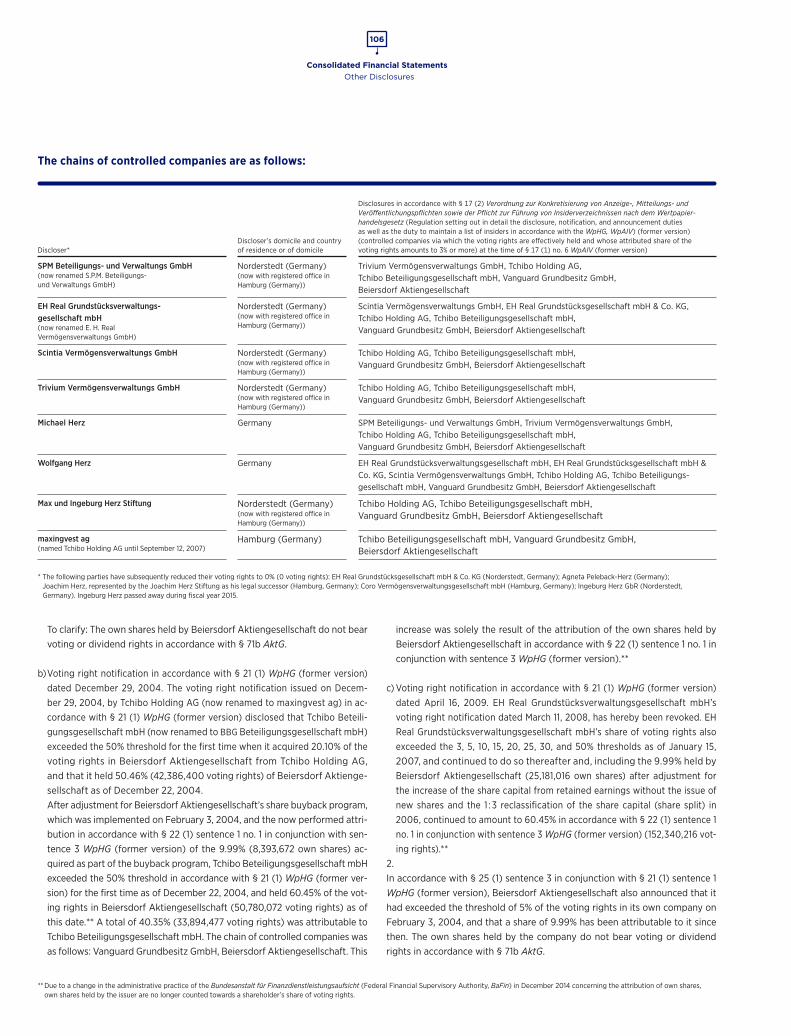
Consolidated Financial Statements
106
Other Disclosures
The chains of controlled companies are as follows:
Discloser*
Discloser’s domicile and country of residence or of domicile
Disclosures in accordance with § 17 (2) Verordnung zur Konkretisierung von Anzeige, Mitteilungs und Veröffentlichungspflichten sowie der Pflicht zur Führung von Insiderverzeichnissen nach dem Wertpapierhandelsgesetz (Regulation setting out in detail the disclosure, notification, and announcement duties as well as the duty to maintain a list of insiders in accordance with the WpHG, WpAIV) (former version) (controlled companies via which the voting rights are effectively held and whose attributed share of the voting rights amounts to 3% or more) at the time of § 17 (1) no. 6 WpAIV (former version)
SPM Beteiligungs- und Verwaltungs GmbH (now renamed S.P.M. Beteiligungs- und Verwaltungs GmbH)
Norderstedt (Germany)(now with registered office in Hamburg (Germany))
Trivium Vermögensverwaltungs GmbH, Tchibo Holding AG,Tchibo Beteiligungsgesellschaft mbH, Vanguard Grundbesitz GmbH,Beiersdorf Aktiengesellschaft
EH Real Grundstücksverwaltungs- gesellschaft mbH (now renamed E. H. Real Vermögensverwaltungs GmbH)
Norderstedt (Germany)(now with registered office in Hamburg (Germany))
Scintia Vermögensverwaltungs GmbH, EH Real Grundstücksgesellschaft mbH & Co. KG, Tchibo Holding AG, Tchibo Beteiligungsgesellschaft mbH,Vanguard Grundbesitz GmbH, Beiersdorf Aktiengesellschaft
Scintia Vermögensverwaltungs GmbH Norderstedt (Germany)(now with registered office in Hamburg (Germany))
Tchibo Holding AG, Tchibo Beteiligungsgesellschaft mbH,Vanguard Grundbesitz GmbH, Beiersdorf Aktiengesellschaft
Trivium Vermögensverwaltungs GmbH Norderstedt (Germany)(now with registered office in Hamburg (Germany))
Tchibo Holding AG, Tchibo Beteiligungsgesellschaft mbH,Vanguard Grundbesitz GmbH, Beiersdorf Aktiengesellschaft
Michael Herz Germany SPM Beteiligungs- und Verwaltungs GmbH, Trivium Vermögensverwaltungs GmbH,Tchibo Holding AG, Tchibo Beteiligungsgesellschaft mbH,Vanguard Grundbesitz GmbH, Beiersdorf Aktiengesellschaft
Wolfgang Herz Germany EH Real Grundstücksverwaltungsgesellschaft mbH, EH Real Grundstücksgesellschaft mbH & Co. KG, Scintia Vermögensverwaltungs GmbH, Tchibo Holding AG, Tchibo Beteiligungs-gesellschaft mbH, Vanguard Grundbesitz GmbH, Beiersdorf Aktiengesellschaft
Max und Ingeburg Herz Stiftung Norderstedt (Germany)(now with registered office in Hamburg (Germany))
Tchibo Holding AG, Tchibo Beteiligungsgesellschaft mbH, Vanguard Grundbesitz GmbH, Beiersdorf Aktiengesellschaft
maxingvest ag (named Tchibo Holding AG until September 12, 2007)
Hamburg (Germany) Tchibo Beteiligungsgesellschaft mbH, Vanguard Grundbesitz GmbH,Beiersdorf Aktiengesellschaft
* The following parties have subsequently reduced their voting rights to 0% (0 voting rights): EH Real Grundstücksgesellschaft mbH & Co. KG (Norderstedt, Germany); Agneta Peleback-Herz (Germany); Joachim Herz, represented by the Joachim Herz Stiftung as his legal successor (Hamburg, Germany); Coro Vermögensverwaltungsgesellschaft mbH (Hamburg, Germany); Ingeburg Herz GbR (Norderstedt, Germany). Ingeburg Herz passed away during fiscal year 2015.
To clarify: The own shares held by Beiersdorf Aktiengesellschaft do not bear voting or dividend rights in accordance with § 71b AktG.
b) Voting right notification in accordance with § 21 (1) WpHG (former version) dated December 29, 2004. The voting right notification issued on Decem-ber 29, 2004, by Tchibo Holding AG (now renamed to maxingvest ag) in ac-cordance with § 21 (1) WpHG (former version) disclosed that Tchibo Beteili-gungsgesellschaft mbH (now renamed to BBG Beteiligungsgesellschaft mbH) exceeded the 50% threshold for the first time when it acquired 20.10% of the voting rights in Beiersdorf Aktiengesellschaft from Tchibo Holding AG, and that it held 50.46% (42,386,400 voting rights) of Beiersdorf Aktienge-sellschaft as of December 22, 2004.After adjustment for Beiersdorf Aktiengesellschaft’s share buyback program, which was implemented on February 3, 2004, and the now performed attri-bution in accordance with § 22 (1) sentence 1 no. 1 in conjunction with sen-tence 3 WpHG (former version) of the 9.99% (8,393,672 own shares) ac-quired as part of the buyback program, Tchibo Beteiligungsgesellschaft mbH exceeded the 50% threshold in accordance with § 21 (1) WpHG (former ver-sion) for the first time as of December 22, 2004, and held 60.45% of the vot-ing rights in Beiersdorf Aktiengesellschaft (50,780,072 voting rights) as of this date.** A total of 40.35% (33,894,477 voting rights) was attributable to Tchibo Beteiligungsgesellschaft mbH. The chain of controlled companies was as follows: Vanguard Grundbesitz GmbH, Beiersdorf Aktiengesellschaft. This
increase was solely the result of the attribution of the own shares held by Beiersdorf Aktiengesellschaft in accordance with § 22 (1) sentence 1 no. 1 in conjunction with sentence 3 WpHG (former version).**
c) Voting right notification in accordance with § 21 (1) WpHG (former version) dated April 16, 2009. EH Real Grundstücksverwaltungsgesellschaft mbH’s voting right notification dated March 11, 2008, has hereby been revoked. EH Real Grundstücksverwaltungsgesellschaft mbH’s share of voting rights also exceeded the 3, 5, 10, 15, 20, 25, 30, and 50% thresholds as of January 15, 2007, and continued to do so thereafter and, including the 9.99% held by Beiersdorf Aktiengesellschaft (25,181,016 own shares) after adjustment for the increase of the share capital from retained earnings without the issue of new shares and the 1 : 3 reclassification of the share capital (share split) in 2006, continued to amount to 60.45% in accordance with § 22 (1) sentence 1 no. 1 in conjunction with sentence 3 WpHG (former version) (152,340,216 vot-ing rights).**
2. In accordance with § 25 (1) sentence 3 in conjunction with § 21 (1) sentence 1 WpHG (former version), Beiersdorf Aktiengesellschaft also announced that it had exceeded the threshold of 5% of the voting rights in its own company on February 3, 2004, and that a share of 9.99% has been attributable to it since then. The own shares held by the company do not bear voting or dividend rights in accordance with § 71b AktG.
** Due to a change in the administrative practice of the Bundesanstalt für Finanzdienstleistungsaufsicht (Federal Financial Supervisory Authority, BaFin) in December 2014 concerning the attribution of own shares, own shares held by the issuer are no longer counted towards a shareholder’s share of voting rights.
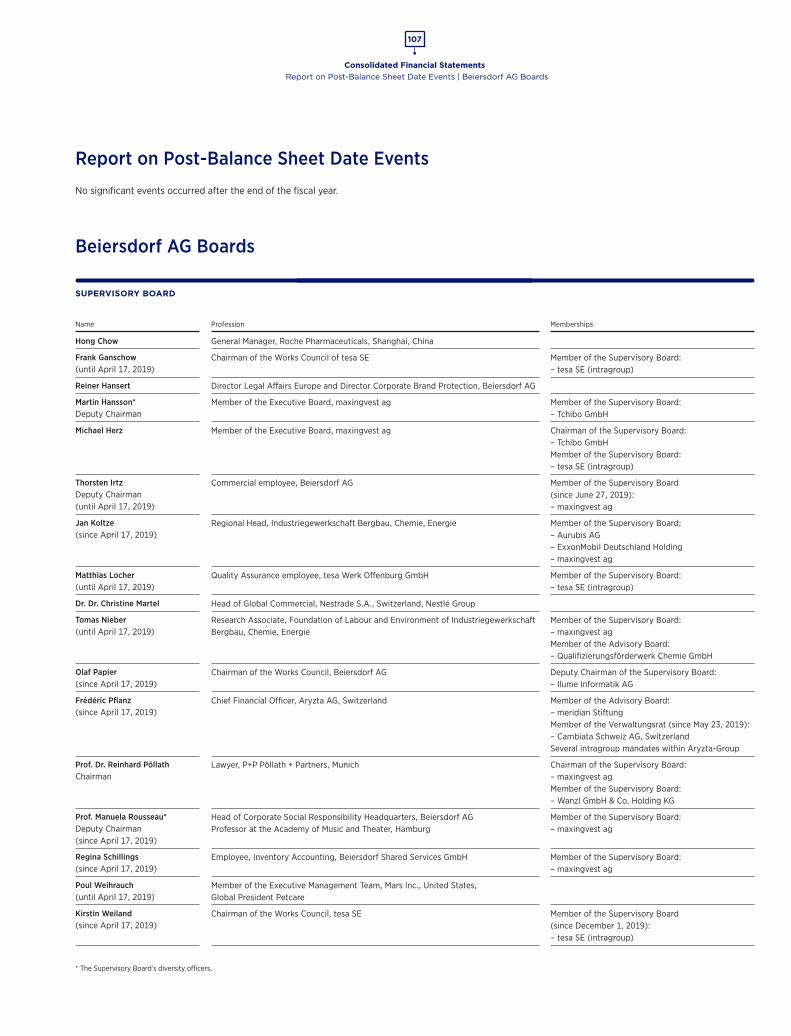
Consolidated Financial Statements
107
Report on Post-Balance Sheet Date Events | Beiersdorf AG Boards
Beiersdorf AG Boards
SUPERVISORY BOARD
Name Profession Memberships
Hong Chow General Manager, Roche Pharmaceuticals, Shanghai, China
Frank Ganschow(until April 17, 2019)
Chairman of the Works Council of tesa SE Member of the Supervisory Board:– tesa SE (intragroup)
Reiner Hansert Director Legal Affairs Europe and Director Corporate Brand Protection, Beiersdorf AG
Martin Hansson*Deputy Chairman
Member of the Executive Board, maxingvest ag Member of the Supervisory Board:– Tchibo GmbH
Michael Herz Member of the Executive Board, maxingvest ag Chairman of the Supervisory Board:– Tchibo GmbHMember of the Supervisory Board:– tesa SE (intragroup)
Thorsten IrtzDeputy Chairman(until April 17, 2019)
Commercial employee, Beiersdorf AG Member of the Supervisory Board (since June 27, 2019): – maxingvest ag
Jan Koltze(since April 17, 2019)
Regional Head, Industriegewerkschaft Bergbau, Chemie, Energie Member of the Supervisory Board: – Aurubis AG– ExxonMobil Deutschland Holding– maxingvest ag
Matthias Locher(until April 17, 2019)
Quality Assurance employee, tesa Werk Offenburg GmbH Member of the Supervisory Board:– tesa SE (intragroup)
Dr. Dr. Christine Martel Head of Global Commercial, Nestrade S.A., Switzerland, Nestlé Group
Tomas Nieber(until April 17, 2019)
Research Associate, Foundation of Labour and Environment of Industriegewerkschaft Bergbau, Chemie, Energie
Member of the Supervisory Board:– maxingvest agMember of the Advisory Board:– Qualifizierungsförderwerk Chemie GmbH
Olaf Papier(since April 17, 2019)
Chairman of the Works Council, Beiersdorf AG Deputy Chairman of the Supervisory Board:– Ilume Informatik AG
Frédéric Pflanz(since April 17, 2019)
Chief Financial Officer, Aryzta AG, Switzerland Member of the Advisory Board:– meridian StiftungMember of the Verwaltungsrat (since May 23, 2019):– Cambiata Schweiz AG, SwitzerlandSeveral intragroup mandates within Aryzta-Group
Prof. Dr. Reinhard PöllathChairman
Lawyer, P+P Pöllath + Partners, Munich Chairman of the Supervisory Board:– maxingvest agMember of the Supervisory Board:– Wanzl GmbH & Co. Holding KG
Prof. Manuela Rousseau*Deputy Chairman(since April 17, 2019)
Head of Corporate Social Responsibility Headquarters, Beiersdorf AGProfessor at the Academy of Music and Theater, Hamburg
Member of the Supervisory Board:– maxingvest ag
Regina Schillings(since April 17, 2019)
Employee, Inventory Accounting, Beiersdorf Shared Services GmbH Member of the Supervisory Board:– maxingvest ag
Poul Weihrauch(until April 17, 2019)
Member of the Executive Management Team, Mars Inc., United States, Global President Petcare
Kirstin Weiland(since April 17, 2019)
Chairman of the Works Council, tesa SE Member of the Supervisory Board (since December 1, 2019):– tesa SE (intragroup)
* The Supervisory Board’s diversity officers.
Report on Post-Balance Sheet Date Events
No significant events occurred after the end of the fiscal year.
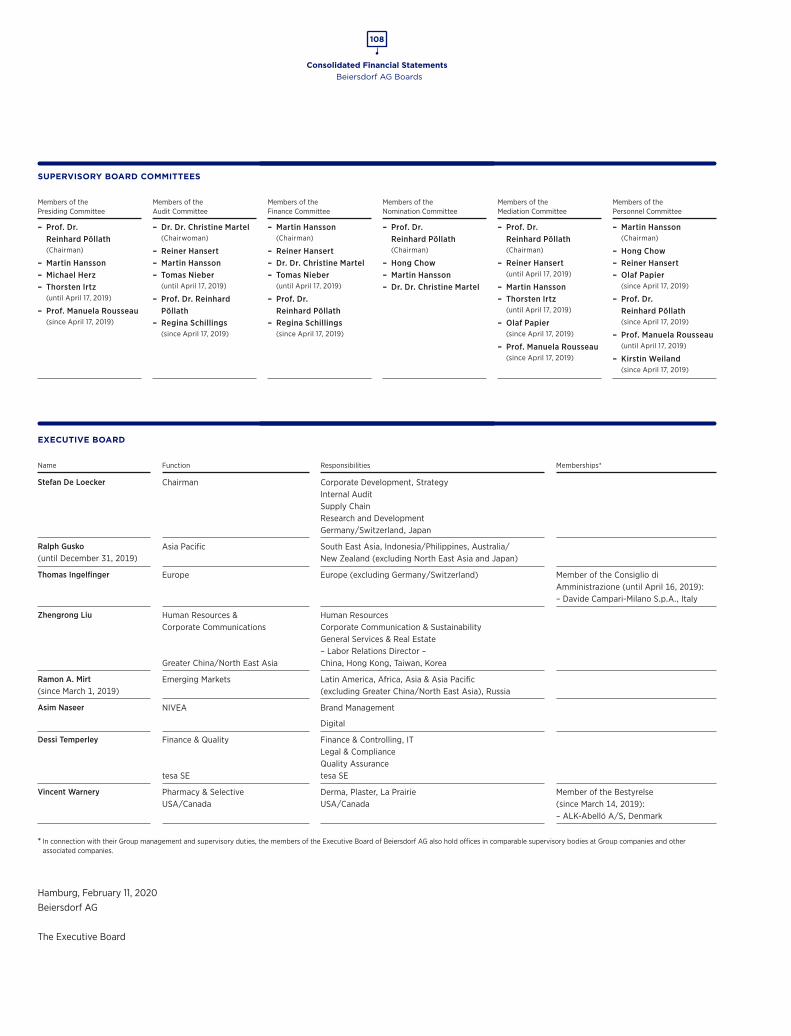
Consolidated Financial Statements
108
Beiersdorf AG Boards
SUPERVISORY BOARD COMMITTEES
Members of the Presiding Committee
Members of the Audit Committee
Members of the Finance Committee
Members of the Nomination Committee
Members of the Mediation Committee
Members of the Personnel Committee
– Prof. Dr. Reinhard Pöllath(Chairman)
– Martin Hansson – Michael Herz – Thorsten Irtz
(until April 17, 2019)
– Prof. Manuela Rousseau(since April 17, 2019)
– Dr. Dr. Christine Martel(Chairwoman)
– Reiner Hansert – Martin Hansson – Tomas Nieber
(until April 17, 2019)
– Prof. Dr. Reinhard Pöllath
– Regina Schillings(since April 17, 2019)
– Martin Hansson(Chairman)
– Reiner Hansert – Dr. Dr. Christine Martel – Tomas Nieber
(until April 17, 2019)
– Prof. Dr. Reinhard Pöllath
– Regina Schillings(since April 17, 2019)
– Prof. Dr. Reinhard Pöllath(Chairman)
– Hong Chow – Martin Hansson – Dr. Dr. Christine Martel
– Prof. Dr. Reinhard Pöllath(Chairman)
– Reiner Hansert(until April 17, 2019)
– Martin Hansson – Thorsten Irtz
(until April 17, 2019)
– Olaf Papier(since April 17, 2019)
– Prof. Manuela Rousseau(since April 17, 2019)
– Martin Hansson(Chairman)
– Hong Chow – Reiner Hansert – Olaf Papier
(since April 17, 2019)
– Prof. Dr. Reinhard Pöllath(since April 17, 2019)
– Prof. Manuela Rousseau(until April 17, 2019)
– Kirstin Weiland(since April 17, 2019)
EXECUTIVE BOARD
Name Function Responsibilities Memberships*
Stefan De Loecker Chairman Corporate Development, StrategyInternal AuditSupply ChainResearch and DevelopmentGermany/Switzerland, Japan
Ralph Gusko(until December 31, 2019)
Asia Pacific South East Asia, Indonesia/Philippines, Australia/ New Zealand (excluding North East Asia and Japan)
Thomas Ingelfinger Europe Europe (excluding Germany/Switzerland) Member of the Consiglio diAmministrazione (until April 16, 2019):– Davide Campari-Milano S.p.A., Italy
Zhengrong Liu Human Resources &Corporate Communications
Greater China/North East Asia
Human ResourcesCorporate Communication & SustainabilityGeneral Services & Real Estate– Labor Relations Director –China, Hong Kong, Taiwan, Korea
Ramon A. Mirt(since March 1, 2019)
Emerging Markets Latin America, Africa, Asia & Asia Pacific (excluding Greater China/North East Asia), Russia
Asim Naseer NIVEA Brand Management
Digital
Dessi Temperley Finance & Quality
tesa SE
Finance & Controlling, ITLegal & ComplianceQuality Assurancetesa SE
Vincent Warnery Pharmacy & SelectiveUSA/Canada
Derma, Plaster, La PrairieUSA/Canada
Member of the Bestyrelse (since March 14, 2019):– ALK-Abelló A/S, Denmark
* In connection with their Group management and supervisory duties, the members of the Executive Board of Beiersdorf AG also hold offices in comparable supervisory bodies at Group companies and other associated companies.
Hamburg, February 11, 2020 Beiersdorf AG
The Executive Board

Consolidated Financial Statements
109
Independent Auditor’s Report
Attestations
Independent Auditor’s Report
To Beiersdorf Aktiengesellschaft
Report on the audit of the consolidated financial statements and of the group management report
OpinionsWe have audited the consolidated financial statements of Beiersdorf Aktienge-sellschaft, Hamburg, and its subsidiaries (the Group), which comprise the con-solidated balance sheet as at December 31, 2019, and the consolidated income statement, consolidated statement of comprehensive income, consolidated cash flow statement and consolidated statement of changes in equity for the fiscal year from January 1 to December 31, 2019, and notes to the consolidated financial statements, including a summary of significant accounting policies. In addition, we have audited the group management report of Beiersdorf Ak-tiengesellschaft, which is combined with the management report of the com-pany, for the fiscal year from January 1 to December 31, 2019. In accordance with the German legal requirements we have not audited the components of the group management report stated in the annex.
In our opinion, on the basis of the knowledge obtained in the audit,
• the accompanying consolidated financial statements comply, in all material respects, with the IFRSs as adopted by the EU, and the additional require-ments of German commercial law pursuant to Sec. 315e (1) of the German Commercial Code (HGB) and, in compliance with these requirements, give a true and fair view of the assets, liabilities, and financial position of the Group as at December 31, 2019, and of its financial performance for the fiscal year from January 1 to December 31, 2019, and
• the accompanying group management report as a whole provides an appro-priate view of the Group’s position. In all material respects, this group man-agement report is consistent with the consolidated financial statements, complies with German legal requirements and appropriately presents the opportunities and risks of future development. Our opinion on the group management report does not cover the components of the group manage-ment report stated in the annex.
Pursuant to Sec. 322 (3) sentence 1 HGB, we declare that our audit has not led to any reservations relating to the legal compliance of the consolidated finan-cial statements and of the group management report.
Basis for the audit opinions We conducted our audit of the consolidated financial statements and of the group management report in accordance with Sec. 317 HGB and the EU Audit Regulation (No 537/2014, referred to subsequently as “EU Audit Regulation”) and in compliance with German Generally Accepted Standards for Financial Statement Audits promulgated by the Institut der Wirtschaftsprüfer [Institute of Public Auditors in Germany] (IDW). Our responsibilities under those require-ments and principles are further described in the “Auditor’s responsibilities for the audit of the consolidated financial statements and of the group manage-ment report” section of our auditor’s report. We are independent of the Group entities in accordance with the requirements of European law and German com-mercial and professional law, and we have fulfilled our other German profes-sional responsibilities in accordance with these requirements. In addition, in accordance with Article 10 (2) f) of the EU Audit Regulation, we declare that we have not provided non-audit services prohibited under Article 5 (1) of the EU Audit Regulation. We believe that the audit evidence we have obtained is sufficient and appropriate to provide a basis for our opinions on the consoli-dated financial statements and on the group management report.
Key audit matters in the audit of the consolidated financial statements Key audit matters are those matters that, in our professional judgment, were of most significance in our audit of the consolidated financial statements for the fiscal year from January 1 to December 31, 2019. These matters were ad-dressed in the context of our audit of the consolidated financial statements as a whole, and in forming our opinion thereon; we do not provide a separate opinion on these matters.
Below, we describe what we consider to be the key audit matters:
Recognizing revenue from the sale of goods and products
Reasons why the matter was determined to be a key audit matterThe consolidated financial statements of Beiersdorf AG recognize revenue from the sale of goods and products, less discounts, customer bonuses, and rebates, and taking into account returns, when control over the goods and products has transferred to the customer. Considerations payable to trading partners are also deducted from revenue in those cases in which the consideration is not matched by a distinct product or service supplied and its fair value can be es-timated reliably. Given the large number of different contractual arrangements
Consolidated Financial Statements
110
Independent Auditor’s Report
in relation to discounts, customer bonuses, rebates, and the terms and condi-tions of returns, and the judgment to be exercised in evaluating the expected discounts, customer bonuses and rebates, as well as returns, there is an elevat-ed risk of material misstatement in the recognition of revenue from the sale of goods and products.
Auditor’s responseAs part of our audit, we examined the accounting policies applied in the con-solidated financial statements of Beiersdorf AG for the recognition of revenue from the sale of goods and products using the criteria defined in IFRS 15. We walked through the process for revenue recognition implemented by the ex-ecutive directors of Beiersdorf AG and the accruals for expected discounts, customer bonuses, rebates, and expected returns using individual transactions from order receipt to recognition in the consolidated financial statements, and tested the controls implemented in this process. Moreover, we performed an examination on a test basis to determine whether the contractually agreed and awarded discounts, customer bonuses, and rebates, actual returns, as well as payments to trading partners without identifiable consideration were deducted from sales revenue on an accrual basis. To prove the existence of sales revenue, we performed, among other things, an examination to establish whether it led to the recognition of trade receivables and whether these receivables were in turn settled by payments received. Using a comparison of plan and actual figures for the assumptions made in previous years to calculate expected returns of goods and products, and taking into account the contractual agree-ments made with customers, we analyzed the calculation of still expected returns of goods and products and their deduction from sales revenue.
Our audit procedures did not give rise to any reservations in respect of the recognition of revenue from the sale of goods and products.
Reference to related disclosuresFor the accounting policies applied in relation to the recognition of revenue from the sale of goods and products and for the associated disclosures on the exercise of judgment, we refer to the information in the notes to the consoli-dated financial statements, section “Significant Accounting Policies” in the chapter of the same name.
Current and deferred income taxes, import sales taxes and customs duties
Reasons why the matter was determined to be a key audit matterThe Beiersdorf AG Group operates its business activities in different legal jurisdictions, with the associated complexity in relation to the recognition of current and deferred income taxes and the accounting treatment of risks from
import sales taxes and customs duties, namely the transfer prices applied, intragroup financing, and changing tax and customs laws. The calculation of provisions for income tax liabilities, the calculation of deferred tax items, and the accounting treatment of risks from import sales taxes and customs duties require the executive directors of Beiersdorf AG to exercise significant judg-ment in evaluating tax- and customs-related matters and to estimate tax and customs law risks as well as the recoverability of deferred taxes.
Auditor’s responseAs part of its assessment of tax and customs law risks, the executive directors of Beiersdorf AG regularly engage external tax experts to provide professional statements on individual matters. We involved our tax and customs experts with knowledge of the relevant local legal systems and regulations in the ju-risdictions concerned to evaluate the tax- and customs-related assessments made by the executive directors of Beiersdorf AG, taking into account any pro-fessional statements from external experts where these had been provided. We also examined the correspondence with the competent tax and customs authorities and the latest status of ongoing appeal proceedings and court cases. We examined the assumptions used to calculate current income tax pro-visions and deferred taxes and to account for risks from import sales taxes and customs duties, taking particular account of the transfer prices used, on the basis of our knowledge and experience of the current application of the rele-vant legal provisions by authorities and courts. We examined the assumptions about the recoverability of deferred tax assets by testing the plausibility of the underlying forecasts using the development of the relevant companies’ results over recent years and publicly available information on the expected develop-ment of the markets concerned. We also evaluated the information in the notes to the consolidated financial statements of Beiersdorf AG on current and de-ferred income taxes and risks from import sales taxes and customs duties.
Our audit procedures did not give rise to any reservations in respect of the recognition of current and deferred income taxes or the accounting treatment of risks from import sales taxes and customs duties.
Reference to related disclosuresFor the accounting policies applied in relation to current and deferred income taxes and the accounting treatment of risks from import sales taxes and customs duties, and for the associated disclosures on the exercise of judgment by the executive directors as well as the sources of estimation uncertainty, we refer to the information in the notes to the consolidated financial statements, sec-tion “Significant Accounting Policies” in the chapter of the same name; note 8 in the chapter “Notes to the Income Statement;” and note 28 in the chapter “Other Disclosures.”

Consolidated Financial Statements
111
Independent Auditor’s Report
Legal disputes in connection with concluded antitrust proceedings
Reasons why the matter was determined to be a key audit matterIn October 2016, Beiersdorf AG was served with a claim for damages from the insolvency administrator of Anton Schlecker e. K. i.I., Ehingen, Donau, in con-nection with German antitrust proceedings already concluded. Claims have been made against six other companies in addition to Beiersdorf AG. The claim by the insolvency administrator of Anton Schlecker e. K. i.I., Ehingen, Donau, which involves joint and several liability of all defendants, totals approximately EUR 200 million plus interest. This claim was dismissed by the court of first in-stance in fiscal 2018. The insolvency administrator of Anton Schlecker e. K. i.I., Ehingen, Donau, has filed an appeal against this ruling. In connection with the already concluded antitrust proceedings, other customers of the Beiersdorf AG Group in Germany and other countries filed claims for damages against the Beiersdorf AG Group or announced claims out of court in fiscal years 2016 and 2017. One of these claims was likewise dismissed by the court of first instance in the 2018 fiscal year. Given the uncertainty that exists, accounting for the legal risks from the damages claims filed in the consolidated financial statements requires the executive directors of Beiersdorf AG to exercise significant judg-ment in evaluating whether and to what extent potential damages have arisen and the scale on which claims under joint and several liability may be enforced. In determining the amount of possible damages, there is considerable judgment in relation to the assumptions concerning the amount of the “overcharge” and the level of the “pass-on rate.” The overcharge is the percentage difference be-tween the prices actually observed on the market and the prices that would be expected in the absence of a cartel. The pass-on rate is the percentage of the supplier price increases that was passed on to customers.
Auditor’s responseIn assessing the legal risks, the executive directors of Beiersdorf AG commis-sioned external lawyers to provide professional statements evaluating the legal basis for the claims filed and the potential joint and several liability, as well as reports from external experts calculating the extent of potential damages. With the support of our legal experts, we examined the existing claims for damages, statements of defense, replies to the statements of defense, rulings by the court of first instance, and other correspondence to determine whether these had been taken into account in the risk assessment by the executive directors of Beiersdorf AG. Furthermore, we obtained an understanding of the calculation of possible damages, and particularly of the assumptions based on econo-metric models in relation to the amount of the overcharge and the level of the pass-on rate, by discussing the external expert’s methodology with the exter-nal expert and evaluating it. We also evaluated the professional qualifications of the external expert. In addition, our audit procedures involved assessing the disclosures in the notes to the consolidated financial statements of Beiersdorf AG on the legal risks arising from the damages claims filed.
Our audit procedures did not give rise to any reservations in respect of the ac-counting treatment of the legal risks arising from legal disputes in connection with antitrust proceedings already concluded.
Reference to related disclosuresFor the disclosures concerning legal risks in connection with one concluded case of antitrust proceedings, we refer to the information in the notes to the consolidated financial statements, note 28 in the chapter “Other Disclosures.”
Other information
The Supervisory Board is responsible for its own report. The executive directors are responsible for the remaining other information. Other information com-prises the components of the group management report stated in the annex, as well as the other components of the annual report, with the exception of the audited consolidated financial statements, the group management report and our related auditor’s report, in particular the Executive Board’s Responsi-bility Statement in accordance with Sec. 297 (2) sentence 4 HGB, the report by the Supervisory Board in accordance with Sec. 171 (2) of the German Stock Cor-poration Act (AktG), and the sections “We are Beiersdorf,” “The Year at a Glance,” “Letter from the Chairman,” “Beiersdorf’s Shares and Investor Relations,” and “Corporate Governance Report” in the annual report. We had obtained a ver-sion of this other information by the time this auditor’s report was issued.
Our opinions on the consolidated financial statements and on the group man-agement report do not cover the other information, and consequently we do not express an opinion or any other form of assurance conclusion thereon.
In connection with our audit, our responsibility is to read the other information and, in so doing, to consider whether the other information
• is materially inconsistent with the consolidated financial statements, with the group management report or our knowledge obtained in the audit, or
• otherwise appears to be materially misstated.
If, on the basis of the activities that we have performed, we conclude that there has been a material misstatement of this other information, we are obliged to report that fact. We have nothing to report in this respect.
Responsibilities of the executive directors and the Super-visory Board for the consolidated financial statements and the group management reportThe executive directors are responsible for the preparation of the consolidat-ed financial statements that comply, in all material respects, with IFRSs as adopted by the EU and the additional requirements of German commercial law pursuant to Sec. 315e (1) HGB and that the consolidated financial state-ments, in compliance with these requirements, give a true and fair view of the assets, liabilities, financial position, and financial performance of the Group. In addition, the executive directors are responsible for such internal control as they have determined necessary to enable the preparation of consolidat-ed financial statements that are free from material misstatement, whether due to fraud or error.
Consolidated Financial Statements
112
Independent Auditor’s Report
In preparing the consolidated financial statements, the executive directors are responsible for assessing the Group’s ability to continue as a going concern. They also have the responsibility for disclosing, as applicable, matters related to going concern. In addition, they are responsible for financial reporting based on the going concern basis of accounting, unless there is an intention to liqui-date the Group or to cease operations, or there is no realistic alternative but to do so.
Furthermore, the executive directors are responsible for the preparation of the group management report that, as a whole, provides an appropriate view of the Group’s position and is, in all material respects, consistent with the consol-idated financial statements, complies with German legal requirements, and ap-propriately presents the opportunities and risks of future development. In ad-dition, the executive directors are responsible for such arrangements and meas-ures (systems) as they have considered necessary to enable the preparation of a group management report that is in accordance with the applicable German legal requirements, and to be able to provide sufficient appropriate evidence for the assertions in the group management report.
The Supervisory Board is responsible for overseeing the Group’s financial re-porting process for the preparation of the consolidated financial statements and of the group management report.
Auditor’s responsibilities for the audit of the consolidated financial statements and of the group management reportOur objectives are to obtain reasonable assurance about whether the consoli-dated financial statements as a whole are free from material misstatement, whether due to fraud or error, and whether the group management report as a whole provides an appropriate view of the Group’s position and, in all mate-rial respects, is consistent with the consolidated financial statements and the knowledge obtained in the audit, complies with the German legal requirements, and appropriately presents the opportunities and risks of future development, as well as to issue an auditor’s report that includes our opinions on the consoli-dated financial statements and on the group management report.
Reasonable assurance is a high level of assurance, but is not a guarantee that an audit conducted in accordance with Sec. 317 HGB and the EU Audit Regula-tion and in compliance with German Generally Accepted Standards for Finan-cial Statement Audits promulgated by the Institut der Wirtschaftsprüfer will always detect a material misstatement. Misstatements can arise from fraud or error and are considered material if, individually or in the aggregate, they could reasonably be expected to influence the economic decisions of users taken on the basis of these consolidated financial statements and this group manage-ment report.
We exercise professional judgment and maintain professional skepticism throughout the audit. We also:
• Identify and assess the risks of material misstatement of the consolidated financial statements and of the group management report, whether due to fraud or error, design and perform audit procedures responsive to those risks, and obtain audit evidence that is sufficient and appropriate to provide a basis for our opinions. The risk of not detecting a material misstatement resulting from fraud is higher than for one resulting from error, as fraud may involve collusion, forgery, intentional omissions, misrepresentations, or the override of internal control.
• Obtain an understanding of internal control relevant to the audit of the con-solidated financial statements and of arrangements and measures (systems) relevant to the audit of the group management report in order to design audit procedures that are appropriate in the circumstances, but not for the purpose of expressing an opinion on the effectiveness of these systems.
• Evaluate the appropriateness of accounting policies used by the executive directors and the reasonableness of estimates made by the executive direc-tors and related disclosures.
• Conclude on the appropriateness of the executive directors’ use of the going concern basis of accounting and, based on the audit evidence obtained, whether a material uncertainty exists related to events or conditions that may cast significant doubt on the Group’s ability to continue as a going concern. If we conclude that a material uncertainty exists, we are required to draw attention in the auditor’s report to the related disclosures in the consolidated financial statements and in the group management report or, if such disclosures are inadequate, to modify our respective opinions. Our conclusions are based on the audit evidence obtained up to the date of our auditor’s report. However, future events or conditions may cause the Group to cease to be able to continue as a going concern.
• Evaluate the overall presentation, structure, and content of the consolidat-ed financial statements, including the disclosures, and whether the consoli-dated financial statements present the underlying transactions and events in a manner that the consolidated financial statements give a true and fair view of the assets, liabilities, financial position, and financial performance of the Group in compliance with IFRSs as adopted by the EU and the addi-tional requirements of German commercial law pursuant to Sec. 315e (1) HGB.
Consolidated Financial Statements
113
Independent Auditor’s Report
• Obtain sufficient appropriate audit evidence regarding the financial informa-tion of the entities or business activities within the Group to express opinions on the consolidated financial statements and on the group management re-port. We are responsible for the direction, supervision, and performance of the group audit. We remain solely responsible for our opinions.
• Evaluate the consistency of the group management report with the consol-idated financial statements, its conformity with the law, and the view of the Group’s position it provides.
• Perform audit procedures on the prospective information presented by the executive directors in the group management report. On the basis of suffi-cient appropriate audit evidence we evaluate, in particular, the significant assumptions used by the executive directors as a basis for the prospective information, and evaluate the proper derivation of the prospective informa-tion from these assumptions. We do not express a separate opinion on the prospective information and on the assumptions used as a basis. There is a substantial unavoidable risk that future events will differ materially from the prospective information.
We communicate with those charged with governance regarding, among other matters, the planned scope and timing of the audit and significant audit find-ings, including any significant deficiencies in internal control that we identify during our audit.
We also provide those charged with governance with a statement that we have complied with the relevant independence requirements, and communicate with them all relationships and other matters that may reasonably be thought to bear on our independence and where applicable, related safeguards.
From the matters communicated with those charged with governance, we determine those matters that were of most significance in the audit of the con-solidated financial statements of the current period and are therefore the key audit matters. We describe these matters in our auditor’s report unless law or regulation precludes public disclosure about the matter.
Other legal and regulatory requirements
Further Information pursuant to Article 10 of the EU Audit Regulation We were elected as group auditor by the annual general meeting on April 17, 2019. We were engaged by the Supervisory Board on May 22, 2019. We have been the group auditor of Beiersdorf AG without interruption since fiscal year 2006.
We declare that the opinions expressed in this auditor’s report are consistent with the additional report to the audit committee pursuant to Art. 11 of the EU Audit Regulation (long-form audit report).
German Public Auditor responsible for the engagement The German Public Auditor responsible for the engagement is Kristian Ludwig.
Annex to the auditor’s report: Components of the group management report that have not been auditedWe have not audited the following components of the group management report:• The separate non-financial report• The Corporate Governance Report
In addition, we have not audited the following disclosures that are not typical of or required in a management report. They are disclosures that are not prescribed by Sec. 315 and 315a HGB or Sec. 315b to 315d HGB.• Special full-page graph, “Acquisition of Brand Icon COPPERTONE”
in the “Business and Strategy” chapter• The section on “Innovations” in the “Research and Development” chapter• Special full-page graph, “Research success Thiamidol” in the “Research
and Development” chapter• “Sustainability” chapter• “People at Beiersdorf” chapter.
Hamburg, February 12, 2020Ernst & Young GmbHWirtschaftsprüfungsgesellschaft
Ludwig JeschonneckGerman Public Auditor German Public Auditor
Consolidated Financial Statements
114
Responsibility Statement by the Executive Board
Responsibility Statement by the Executive Board
To the best of our knowledge, and in accordance with the applicable reporting principles, the consolidated financial statements give a true and fair view of the assets, liabilities, financial position, and profit or loss of the Group, and the Group Management Report, which has been combined with the Management Report for Beiersdorf Aktiengesellschaft, includes a fair review of the development and performance of the business and the position of the Group, together with a description of the material opportunities and risks associated with the expected development of the Group.
Hamburg, February 11, 2020 The Executive Board
Stefan De LoeckerChairman of the Executive Board
Thomas IngelfingerMember of the Executive Board
Dessi TemperleyMember of the Executive Board
Asim NaseerMember of the Executive Board
Vincent WarneryMember of the Executive Board
Zhengrong LiuMember of the Executive Board
Ramon A. MirtMember of the Executive Board
Additional Information
115
Pages 115 – 120
p. 116 Ten-year Overview
p. 117 Beiersdorf AG’s Shareholdings
p. 120 Contact Information
Financial Calendar (Cover)
Additional Information
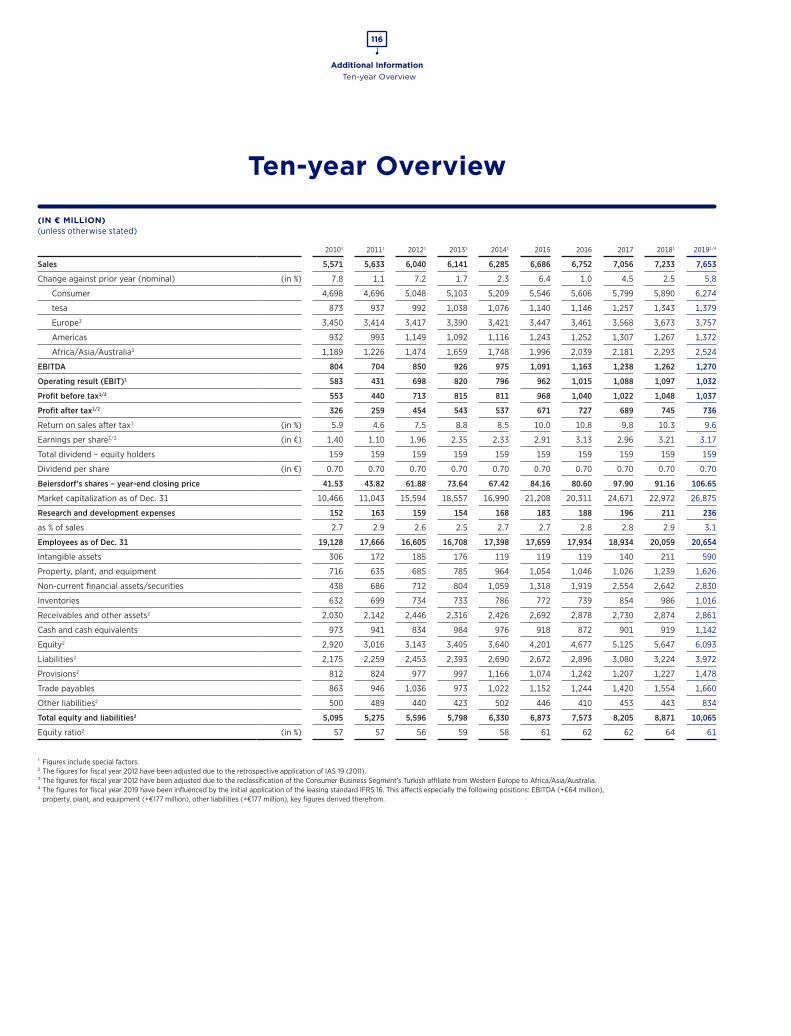
Additional Information
116
Ten-year Overview
Ten-year Overview
(IN € MILLION)(unless otherwise stated)
20101 20111 20121 20131 20141 2015 2016 2017 20181 20191/4
Sales 5,571 5,633 6,040 6,141 6,285 6,686 6,752 7,056 7,233 7,653
Change against prior year (nominal) (in %) 7.8 1.1 7.2 1.7 2.3 6.4 1.0 4.5 2.5 5.8
Consumer 4,698 4,696 5,048 5,103 5,209 5,546 5,606 5,799 5,890 6,274
tesa 873 937 992 1,038 1,076 1,140 1,146 1,257 1,343 1,379
Europe3 3,450 3,414 3,417 3,390 3,421 3,447 3,461 3,568 3,673 3,757
Americas 932 993 1,149 1,092 1,116 1,243 1,252 1,307 1,267 1,372
Africa/Asia/Australia3 1,189 1,226 1,474 1,659 1,748 1,996 2,039 2,181 2,293 2,524
EBITDA 804 704 850 926 975 1,091 1,163 1,238 1,262 1,270
Operating result (EBIT)1 583 431 698 820 796 962 1,015 1,088 1,097 1,032
Profit before tax1/2 553 440 713 815 811 968 1,040 1,022 1,048 1,037
Profit after tax1/2 326 259 454 543 537 671 727 689 745 736
Return on sales after tax1 (in %) 5.9 4.6 7.5 8.8 8.5 10.0 10.8 9.8 10.3 9.6
Earnings per share1/2 (in €) 1.40 1.10 1.96 2.35 2.33 2.91 3.13 2.96 3.21 3.17
Total dividend – equity holders 159 159 159 159 159 159 159 159 159 159
Dividend per share (in €) 0.70 0.70 0.70 0.70 0.70 0.70 0.70 0.70 0.70 0.70
Beiersdorf’s shares – year-end closing price 41.53 43.82 61.88 73.64 67.42 84.16 80.60 97.90 91.16 106.65
Market capitalization as of Dec. 31 10,466 11,043 15,594 18,557 16,990 21,208 20,311 24,671 22,972 26,875
Research and development expenses 152 163 159 154 168 183 188 196 211 236
as % of sales 2.7 2.9 2.6 2.5 2.7 2.7 2.8 2.8 2.9 3.1
Employees as of Dec. 31 19,128 17,666 16,605 16,708 17,398 17,659 17,934 18,934 20,059 20,654
Intangible assets 306 172 185 176 119 119 119 140 211 590
Property, plant, and equipment 716 635 685 785 964 1,054 1,046 1,026 1,239 1,626
Non-current financial assets/securities 438 686 712 804 1,059 1,318 1,919 2,554 2,642 2,830
Inventories 632 699 734 733 786 772 739 854 986 1,016
Receivables and other assets2 2,030 2,142 2,446 2,316 2,426 2,692 2,878 2,730 2,874 2,861
Cash and cash equivalents 973 941 834 984 976 918 872 901 919 1,142
Equity2 2,920 3,016 3,143 3,405 3,640 4,201 4,677 5,125 5,647 6,093
Liabilities2 2,175 2,259 2,453 2,393 2,690 2,672 2,896 3,080 3,224 3,972
Provisions2 812 824 977 997 1,166 1,074 1,242 1,207 1,227 1,478
Trade payables 863 946 1,036 973 1,022 1,152 1,244 1,420 1,554 1,660
Other liabilities2 500 489 440 423 502 446 410 453 443 834
Total equity and liabilities2 5,095 5,275 5,596 5,798 6,330 6,873 7,573 8,205 8,871 10,065
Equity ratio2 (in %) 57 57 56 59 58 61 62 62 64 61
1 Figures include special factors. 2 The figures for fiscal year 2012 have been adjusted due to the retrospective application of IAS 19 (2011).3 The figures for fiscal year 2012 have been adjusted due to the reclassification of the Consumer Business Segment’s Turkish affiliate from Western Europe to Africa/Asia/Australia.4 The figures for fiscal year 2019 have been influenced by the initial application of the leasing standard IFRS 16. This affects especially the following positions: EBITDA (+€64 million),
property, plant, and equipment (+€177 million), other liabilities (+€177 million), key figures derived therefrom.
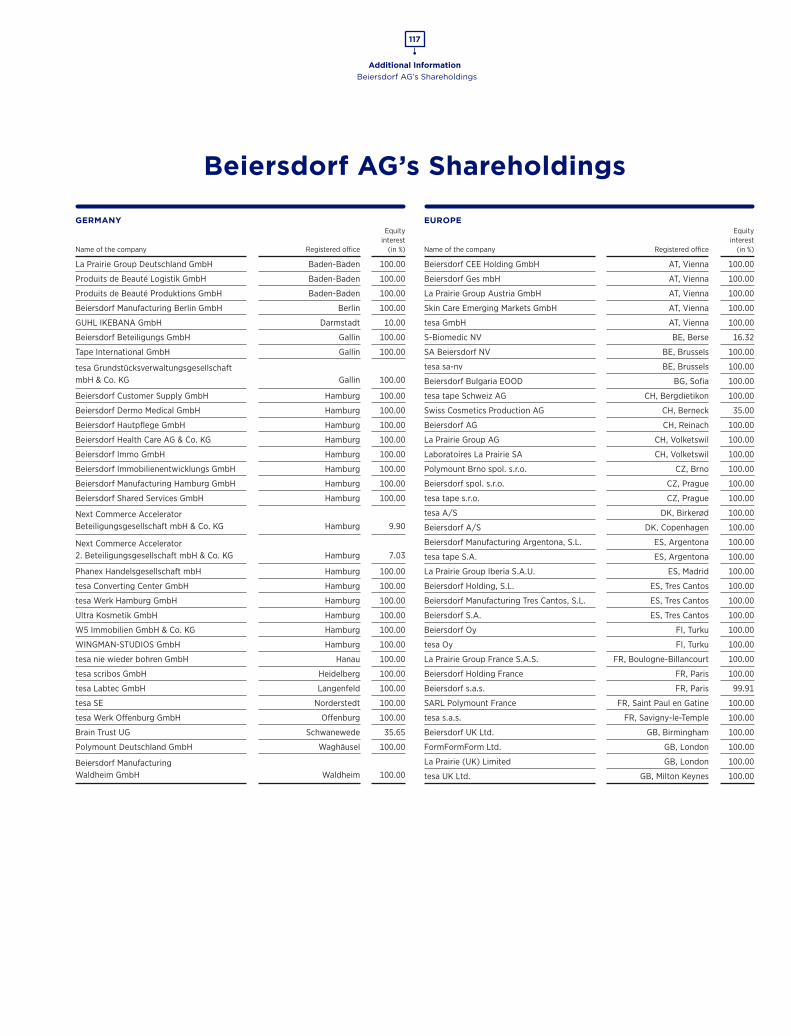
Additional Information
117
Beiersdorf AG’s Shareholdings
GERMANY
Name of the company Registered office
Equity interest
(in %)
La Prairie Group Deutschland GmbH Baden-Baden 100.00
Produits de Beauté Logistik GmbH Baden-Baden 100.00
Produits de Beauté Produktions GmbH Baden-Baden 100.00
Beiersdorf Manufacturing Berlin GmbH Berlin 100.00
GUHL IKEBANA GmbH Darmstadt 10.00
Beiersdorf Beteiligungs GmbH Gallin 100.00
Tape International GmbH Gallin 100.00
tesa Grundstücksverwaltungsgesellschaft mbH & Co. KG Gallin 100.00
Beiersdorf Customer Supply GmbH Hamburg 100.00
Beiersdorf Dermo Medical GmbH Hamburg 100.00
Beiersdorf Hautpflege GmbH Hamburg 100.00
Beiersdorf Health Care AG & Co. KG Hamburg 100.00
Beiersdorf Immo GmbH Hamburg 100.00
Beiersdorf Immobilienentwicklungs GmbH Hamburg 100.00
Beiersdorf Manufacturing Hamburg GmbH Hamburg 100.00
Beiersdorf Shared Services GmbH Hamburg 100.00
Next Commerce Accelerator Beteiligungsgesellschaft mbH & Co. KG Hamburg 9.90
Next Commerce Accelerator 2. Beteiligungsgesellschaft mbH & Co. KG Hamburg 7.03
Phanex Handelsgesellschaft mbH Hamburg 100.00
tesa Converting Center GmbH Hamburg 100.00
tesa Werk Hamburg GmbH Hamburg 100.00
Ultra Kosmetik GmbH Hamburg 100.00
W5 Immobilien GmbH & Co. KG Hamburg 100.00
WINGMAN-STUDIOS GmbH Hamburg 100.00
tesa nie wieder bohren GmbH Hanau 100.00
tesa scribos GmbH Heidelberg 100.00
tesa Labtec GmbH Langenfeld 100.00
tesa SE Norderstedt 100.00
tesa Werk Offenburg GmbH Offenburg 100.00
Brain Trust UG Schwanewede 35.65
Polymount Deutschland GmbH Waghäusel 100.00
Beiersdorf Manufacturing Waldheim GmbH Waldheim 100.00
Beiersdorf AG’s Shareholdings
EUROPE
Name of the company Registered office
Equity interest
(in %)
Beiersdorf CEE Holding GmbH AT, Vienna 100.00
Beiersdorf Ges mbH AT, Vienna 100.00
La Prairie Group Austria GmbH AT, Vienna 100.00
Skin Care Emerging Markets GmbH AT, Vienna 100.00
tesa GmbH AT, Vienna 100.00
S-Biomedic NV BE, Berse 16.32
SA Beiersdorf NV BE, Brussels 100.00
tesa sa-nv BE, Brussels 100.00
Beiersdorf Bulgaria EOOD BG, Sofia 100.00
tesa tape Schweiz AG CH, Bergdietikon 100.00
Swiss Cosmetics Production AG CH, Berneck 35.00
Beiersdorf AG CH, Reinach 100.00
La Prairie Group AG CH, Volketswil 100.00
Laboratoires La Prairie SA CH, Volketswil 100.00
Polymount Brno spol. s.r.o. CZ, Brno 100.00
Beiersdorf spol. s.r.o. CZ, Prague 100.00
tesa tape s.r.o. CZ, Prague 100.00
tesa A/S DK, Birkerød 100.00
Beiersdorf A/S DK, Copenhagen 100.00
Beiersdorf Manufacturing Argentona, S.L. ES, Argentona 100.00
tesa tape S.A. ES, Argentona 100.00
La Prairie Group Iberia S.A.U. ES, Madrid 100.00
Beiersdorf Holding, S.L. ES, Tres Cantos 100.00
Beiersdorf Manufacturing Tres Cantos, S.L. ES, Tres Cantos 100.00
Beiersdorf S.A. ES, Tres Cantos 100.00
Beiersdorf Oy FI, Turku 100.00
tesa Oy FI, Turku 100.00
La Prairie Group France S.A.S. FR, Boulogne-Billancourt 100.00
Beiersdorf Holding France FR, Paris 100.00
Beiersdorf s.a.s. FR, Paris 99.91
SARL Polymount France FR, Saint Paul en Gatine 100.00
tesa s.a.s. FR, Savigny-le-Temple 100.00
Beiersdorf UK Ltd. GB, Birmingham 100.00
FormFormForm Ltd. GB, London 100.00
La Prairie (UK) Limited GB, London 100.00
tesa UK Ltd. GB, Milton Keynes 100.00
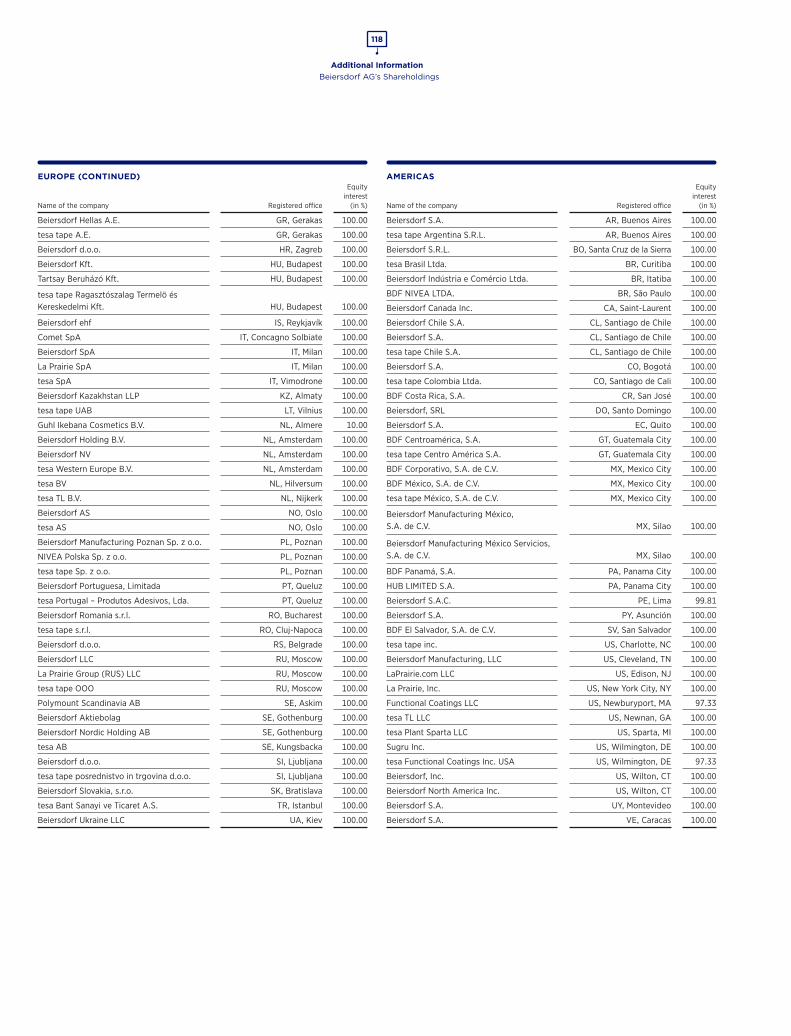
Additional Information
118
Beiersdorf AG’s Shareholdings
EUROPE (CONTINUED)
Name of the company Registered office
Equity interest
(in %)
Beiersdorf Hellas A.E. GR, Gerakas 100.00
tesa tape A.E. GR, Gerakas 100.00
Beiersdorf d.o.o. HR, Zagreb 100.00
Beiersdorf Kft. HU, Budapest 100.00
Tartsay Beruházó Kft. HU, Budapest 100.00
tesa tape Ragasztószalag Termelö és Kereskedelmi Kft. HU, Budapest 100.00
Beiersdorf ehf IS, Reykjavík 100.00
Comet SpA IT, Concagno Solbiate 100.00
Beiersdorf SpA IT, Milan 100.00
La Prairie SpA IT, Milan 100.00
tesa SpA IT, Vimodrone 100.00
Beiersdorf Kazakhstan LLP KZ, Almaty 100.00
tesa tape UAB LT, Vilnius 100.00
Guhl Ikebana Cosmetics B.V. NL, Almere 10.00
Beiersdorf Holding B.V. NL, Amsterdam 100.00
Beiersdorf NV NL, Amsterdam 100.00
tesa Western Europe B.V. NL, Amsterdam 100.00
tesa BV NL, Hilversum 100.00
tesa TL B.V. NL, Nijkerk 100.00
Beiersdorf AS NO, Oslo 100.00
tesa AS NO, Oslo 100.00
Beiersdorf Manufacturing Poznan Sp. z o.o. PL, Poznan 100.00
NIVEA Polska Sp. z o.o. PL, Poznan 100.00
tesa tape Sp. z o.o. PL, Poznan 100.00
Beiersdorf Portuguesa, Limitada PT, Queluz 100.00
tesa Portugal – Produtos Adesivos, Lda. PT, Queluz 100.00
Beiersdorf Romania s.r.l. RO, Bucharest 100.00
tesa tape s.r.l. RO, Cluj-Napoca 100.00
Beiersdorf d.o.o. RS, Belgrade 100.00
Beiersdorf LLC RU, Moscow 100.00
La Prairie Group (RUS) LLC RU, Moscow 100.00
tesa tape OOO RU, Moscow 100.00
Polymount Scandinavia AB SE, Askim 100.00
Beiersdorf Aktiebolag SE, Gothenburg 100.00
Beiersdorf Nordic Holding AB SE, Gothenburg 100.00
tesa AB SE, Kungsbacka 100.00
Beiersdorf d.o.o. SI, Ljubljana 100.00
tesa tape posrednistvo in trgovina d.o.o. SI, Ljubljana 100.00
Beiersdorf Slovakia, s.r.o. SK, Bratislava 100.00
tesa Bant Sanayi ve Ticaret A.S. TR, Istanbul 100.00
Beiersdorf Ukraine LLC UA, Kiev 100.00
AMERICAS
Name of the company Registered office
Equity interest
(in %)
Beiersdorf S.A. AR, Buenos Aires 100.00
tesa tape Argentina S.R.L. AR, Buenos Aires 100.00
Beiersdorf S.R.L. BO, Santa Cruz de la Sierra 100.00
tesa Brasil Ltda. BR, Curitiba 100.00
Beiersdorf Indústria e Comércio Ltda. BR, Itatiba 100.00
BDF NIVEA LTDA. BR, São Paulo 100.00
Beiersdorf Canada Inc. CA, Saint-Laurent 100.00
Beiersdorf Chile S.A. CL, Santiago de Chile 100.00
Beiersdorf S.A. CL, Santiago de Chile 100.00
tesa tape Chile S.A. CL, Santiago de Chile 100.00
Beiersdorf S.A. CO, Bogotá 100.00
tesa tape Colombia Ltda. CO, Santiago de Cali 100.00
BDF Costa Rica, S.A. CR, San José 100.00
Beiersdorf, SRL DO, Santo Domingo 100.00
Beiersdorf S.A. EC, Quito 100.00
BDF Centroamérica, S.A. GT, Guatemala City 100.00
tesa tape Centro América S.A. GT, Guatemala City 100.00
BDF Corporativo, S.A. de C.V. MX, Mexico City 100.00
BDF México, S.A. de C.V. MX, Mexico City 100.00
tesa tape México, S.A. de C.V. MX, Mexico City 100.00
Beiersdorf Manufacturing México, S.A. de C.V. MX, Silao 100.00
Beiersdorf Manufacturing México Servicios, S.A. de C.V. MX, Silao 100.00
BDF Panamá, S.A. PA, Panama City 100.00
HUB LIMITED S.A. PA, Panama City 100.00
Beiersdorf S.A.C. PE, Lima 99.81
Beiersdorf S.A. PY, Asunción 100.00
BDF El Salvador, S.A. de C.V. SV, San Salvador 100.00
tesa tape inc. US, Charlotte, NC 100.00
Beiersdorf Manufacturing, LLC US, Cleveland, TN 100.00
LaPrairie.com LLC US, Edison, NJ 100.00
La Prairie, Inc. US, New York City, NY 100.00
Functional Coatings LLC US, Newburyport, MA 97.33
tesa TL LLC US, Newnan, GA 100.00
tesa Plant Sparta LLC US, Sparta, MI 100.00
Sugru Inc. US, Wilmington, DE 100.00
tesa Functional Coatings Inc. USA US, Wilmington, DE 97.33
Beiersdorf, Inc. US, Wilton, CT 100.00
Beiersdorf North America Inc. US, Wilton, CT 100.00
Beiersdorf S.A. UY, Montevideo 100.00
Beiersdorf S.A. VE, Caracas 100.00

Additional Information
119
Beiersdorf AG’s Shareholdings
AFRICA/ASIA/AUSTRALIA
Name of the company Registered office
Equity interest
(in %)
Beiersdorf Middle East FZCO AE, Dubai 100.00
Beiersdorf Near East FZ-LLC AE, Dubai 100.00
Beiersdorf Australia Ltd. AU, North Ryde, NSW 100.00
Beiersdorf Health Care Australia Pty. Ltd. AU, North Ryde, NSW 100.00
La Prairie Group Australia Pty. Ltd. AU, Rosebery, NSW 100.00
tesa tape Australia Pty. Ltd. AU, Sydney, NSW 100.00
Beiersdorf Hong Kong Limited CN, Hong Kong 100.00
La Prairie Hong Kong Limited CN, Hong Kong 100.00
tesa tape (Hong Kong) Limited CN, Hong Kong 100.00
Beiersdorf Trading (Shanghai) Co., Ltd. CN, Shanghai 100.00
La Prairie (Shanghai) Co., Ltd. CN, Shanghai 100.00
NIVEA (Shanghai) Company Limited CN, Shanghai 100.00
tesa tape (Shanghai) Co., Ltd. CN, Shanghai 100.00
tesa Plant (Suzhou) Co., Ltd. CN, Suzhou 100.00
tesa tape (Suzhou) Co., Ltd. CN, Suzhou 100.00
Beiersdorf Daily Chemical (Wuhan)
Co., Ltd. CN, Wuhan 100.00
Beiersdorf Personal Care (China) Co., Ltd. CN, Xiantao 100.00
Beiersdorf Egypt for Trading JSC EG, Cairo 100.00
Beiersdorf LLC EG, Cairo 100.00
Beiersdorf Nivea Egypt LLC EG, Cairo 100.00
Beiersdorf Ghana Limited GH, Accra 100.00
P.T. Beiersdorf Indonesia ID, Jakarta 80.00
Alpa-BDF Ltd. IL, Herzeliya 60.00
Beiersdorf India Pvt. Limited IN, Mumbai 51.00
Beiersdorf India Service Private Limited IN, Mumbai 100.00
NIVEA India Pvt. Ltd. IN, Mumbai 100.00
tesa tapes (India) Private Limited IN, Navi Mumbai 100.00
Beiersdorf Holding Japan Yugen Kaisha JP, Tokyo 100.00
La Prairie Japan K.K. JP, Tokyo 100.00
Nivea-Kao Co., Ltd. JP, Tokyo 60.00
tesa tape K.K. JP, Tokyo 100.00
Beiersdorf East Africa Limited KE, Nairobi 100.00
Alkynes Co. Ltd. KR, Gyeonggi-do 25.01
Beiersdorf Korea Limited KR, Seoul 100.00
La Prairie Korea Limited KR, Seoul 100.00
LYCL Inc. KR, Seoul 24.98
tesa tape Korea Limited KR, Seoul 100.00
Beiersdorf S.A. MA, Casablanca 100.00
Beiersdorf (Myanmar) Ltd. MM, Rangoon 100.00
tesa tape (Malaysia) Sdn. Bhd. MY, Kajang 96.25
tesa tape Industries (Malaysia) Sdn. Bhd. MY, Kajang 96.25
AFRICA/ASIA/AUSTRALIA (CONTINUED)
Name of the company Registered office
Equity interest
(in %)
Beiersdorf (Malaysia) SDN. BHD. MY, Petaling Jaya 100.00
Beiersdorf Nivea Consumer Products Nigeria Limited NG, Lagos 100.00
Beiersdorf Pakistan (Private) Limited PK, Lahore 100.00
Beiersdorf Philippines Incorporated PH, Bonifacio Global City 100.00
Turath Al-Bashara for Trading Limited (Skin Heritage for Trading) SA, Jeddah 70.00
Beiersdorf Singapore Pte. Ltd. SG, Singapore 100.00
tesa tape Asia Pacific Pte. Ltd. SG, Singapore 100.00
Beiersdorf (Thailand) Co., Ltd. TH, Bangkok 100.00
tesa tape (Thailand) Limited TH, Bangkok 90.57
NIVEA Beiersdorf Turkey Kozmetik Sanayi ve Ticaret A.S. TR, Istanbul 100.00
La Prairie (Taiwan) Limited TW, Taipei 100.00
NIVEA (Taiwan) Ltd. TW, Taipei 100.00
tesa Vietnam Limited VN, Hanoi 100.00
Beiersdorf Vietnam Limited Liability Company VN, Ho Chi Minh City 100.00
Beiersdorf Consumer Products (Pty.) Ltd. ZA, Umhlanga 100.00
Additional Information
120
Contact Information
Contact Information
Published by
Beiersdorf Aktiengesellschaft Unnastraße 48 20245 Hamburg Germany
Editorial Team and Concept
Corporate Communications Telephone: +49-40-4909-2001 E-mail: [email protected]
Additional Information
Corporate Communications Telephone: +49-40-4909-2001 E-mail: [email protected]
Investor Relations Telephone: +49-40-4909-5000 E-mail: [email protected]
Beiersdorf on the Internet www.beiersdorf.com
Contributors
Design/Realization 3st kommunikation, Mainz
Typesetting Knecht GmbH, Ockenheim
In consideration of sustainability aspects, the Annual Report is no longer provided as a printed, but only as an online version.The online versions of the financial publications of Beiersdorf are available at www.beiersdorf.com/financial_reports.
This Annual Report is also available in German.

2020
Financial Calendar
2021
April 29Annual General Meeting
February / MarchPublication of
Annual Report 2020, Annual Press Conference, Financial Analyst Meeting
August 6Half-Year Report
2020
AugustHalf-Year Report
2021
AprilAnnual General Meeting
October 28 Quarterly Statement
January to September 2020
OctoberQuarterly Statement
January to September 2021
May 5Quarterly Statement
January to March 2020
MayQuarterly Statement
January to March 2021

Beiersdorf Aktiengesellschaft Unnastrasse 48, 20245 Hamburg, Germany Tel.: + 49 40 4909-0, Fax: + 49 40 4909-3434 Internet: www.beiersdorf.com