annual gas questionnaire presentation · pdf filea brief introduction ... structure of the...
TRANSCRIPT

© OECD/IEA 2015
Annual Natural Gas
Questionnaire
Overview
IEA/APERC/Viet Nam Workshop on the Legal Basis for Energy Data Collection
Hanoi, 02 December 2015
Prepared by: Federico de Luca, IEA
Presented by: Edito Barcelona
APERC ESTO

© OECD/IEA 2015
A brief introduction to natural gas statistics
Definitions
Global trends in natural gas
Production, supply and consumption
Structure of the annual gas questionnaire
Structure and presentation
Basic concepts
Overview of the tables
Relationships between flows
Data treatment
Submission
Verification
Specific problems
Access to natural gas data
Natural Gas Statistics
Presentation overview

© OECD/IEA 2015
Gases occurring in underground deposits, whether liquefied or gaseous, consisting mainly of methane.
Natural Gas Statistics
Introduction
Natural Gas
Associated gas Found in association with crude oil
Non-associated gas Originating from fields producing gas only
Colliery gas Methane removed from coal mines and coal seams

© OECD/IEA 2015
Natural Gas
Gaseous gas LNG
Same substance
The volume of natural gas varies with temperature and pressure
Cooled to -160°C and 1 atm
Different physical state
Measured at 15°C and 1 atm (standard conditions)
The volume of LNG is a 600th of that of gaseous gas
Natural Gas Statistics
Introduction

© OECD/IEA 2015
0
2 000
4 000
6 000
8 000
10 000
12 000
14 000
1971 1977 1983 1989 1995 2001 2007 2013
Natural Gas Other fuels
World total primary energy supply (1971-2013)
16% 21%
893 Mtoe
2 901 Mtoe
Natural Gas Statistics
Introduction

© OECD/IEA 2015
1971 2014
Natural gas production from 1973 to 2014
3.2 x
Natural Gas Statistics
Introduction
1 107 bcm
3 524 bcm

© OECD/IEA 2015
807 bcm 73.0%
1 269 bcm 36.0%
1971 2014
OECD share of World’s natural gas production from 1973 to 2014
1.6 x
Natural Gas Statistics
Introduction
-0.5 x

© OECD/IEA 2015
1 product = Natural gas
Natural Gas Statistics
Annual questionnaire
2. Processing
3. Dissemination
1. Collection
The data cycle

© OECD/IEA 2015
Marketed
production
Vented
Gas flared or
reinjected Removal of liquids
in natural gas
processing plants
Removal of
sulphur and
Impurities
Extraction of crude oil
and associated gas
Extraction of
non-associated gas
Other separation
(offshore wells)
Wellhead
separation
(onshore wells)
NGL
Crude oil
Associated
gas
Non-
associated
gas
Colliery gas Coal mines
Natural Gas Statistics
Annual questionnaire - Production
Oil
questionnaire
Natural gas
questionnaire
“Raw” gas
Dry, marketable gas
Oil

© OECD/IEA 2015
Marketed
production
Imports
Exports
Stock build
Inland
consumption
Transport
Transformation
Industry Residential,
commercial,
agriculture etc.
Stock draw
Distribution
losses
Energy
sector
Natural Gas Statistics
Annual questionnaire – Supply and consumption
From other
sources
International
marine
bunkers

© OECD/IEA 2015
Production From other sources Imports Exports Stock changes
Statistical difference
Transformation … Energy sector … Final consumption Transport … Industry … Other sectors …
Demand Inland consumption (observed)
Supply Inland consumption (calculated)
Natural Gas Statistics
Annual questionnaire – Questionnaire structure

© OECD/IEA 2015
Production From other sources Imports Exports Stock changes
Statistical difference Transformation … Energy sector … Final consumption Transport … Industry … Other Sectors …
Table 3 Table 4
Table 1
Table 2b
Table 2a
Natural Gas Statistics
Annual questionnaire – Questionnaire structure

© OECD/IEA 2015
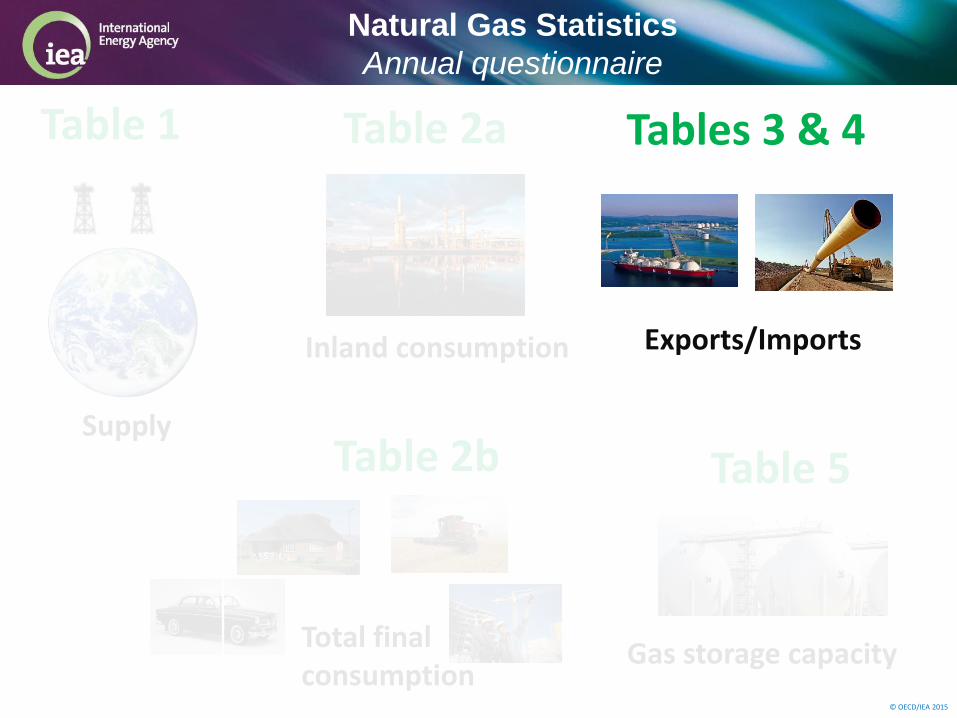
Table 2b
Inland consumption
Table 1 Table 2a Tables 3 & 4
Supply
Total final consumption
Exports/Imports
Table 5
Gas storage capacity
Natural Gas Statistics
Annual questionnaire – Questionnaire structure

© OECD/IEA 2015
Table 2b
Inland consumption
Table 2a Tables 3 & 4
Supply
Total final consumption
Exports/Imports
Table 5
Gas storage capacity
Table 1
Natural Gas Statistics
Annual questionnaire – Questionnaire structure

© OECD/IEA 2015
Year & Country
Natural Gas Statistics
Annual questionnaire – Supply of natural gas, Table 1
Calculated
Important data point!
© OECD/IEA 2015
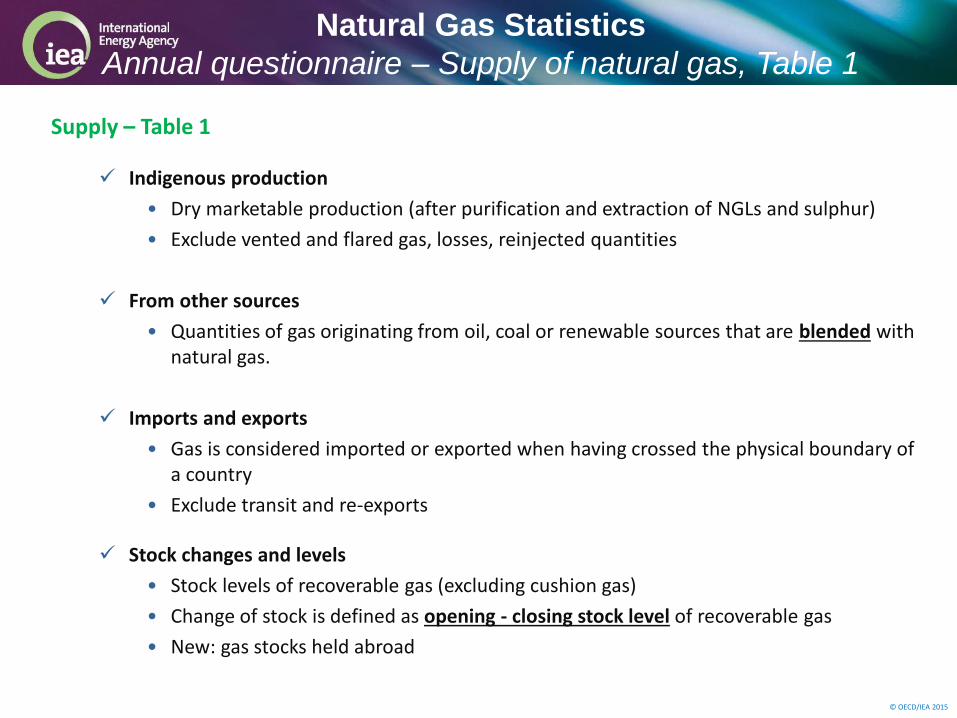
Supply – Table 1
Indigenous production
• Dry marketable production (after purification and extraction of NGLs and sulphur)
• Exclude vented and flared gas, losses, reinjected quantities
From other sources
• Quantities of gas originating from oil, coal or renewable sources that are blended with natural gas.
Imports and exports
• Gas is considered imported or exported when having crossed the physical boundary of a country
• Exclude transit and re-exports
Stock changes and levels
• Stock levels of recoverable gas (excluding cushion gas)
• Change of stock is defined as opening - closing stock level of recoverable gas
• New: gas stocks held abroad
Natural Gas Statistics
Annual questionnaire – Supply of natural gas, Table 1

© OECD/IEA 2015
Units: Natural gas data are collected in
Volume: million m3 under standard conditions (15°Celsius and 1 atm)
Energy unit: TJ - gross calorific value
Conversion
Specific kJ/m3 calorific value
• Indigenous production
• From other sources
• Imports
• Exports
• International marine bunkers
• Stock changes
• Inland consumption (calculated)
• Inland consumption (observed)
Natural Gas Statistics
Annual questionnaire

© OECD/IEA 2015
Natural Gas Statistics
Annual questionnaire
Table 2b
Inland consumption
Table 2a Tables 3 & 4
Supply
Total final consumption
Exports/Imports
Table 5
Gas storage capacity
Table 1

© OECD/IEA 2015
Unit: TJ (GCV)
Consumption
A
Inland Demand (Total Consumption) 1
Transformation Sector 2
Main Activity Producer Electricity Plants 3
Autoproducer Electricity Plants 4
Main Activity Producer CHP Plants 5
Autoproducer CHP Plants 6
Main Activity Producer Heat Plants 7
Autoproducer Heat Plants 8
Gas Works (Transformation) 9
Coke Ovens (Transformation) 10
Blast Furnaces (Transformation) 11
Gas-to-Liquids (GTL) Plants (Transformation) 12
Non-specified (Transformation) 13
Energy Sector 14
Coal Mines 15
Oil and Gas Extraction 16
Petroleum Refineries 17
Coke Ovens (Energy) 18
Blast Furnaces (Energy) 19
Gas Works (Energy) 20
Own Use in Electricity, CHP and Heat Plants 21
Liquefaction (LNG) / Regasification Plants 22
Gas-to-Liquids (GTL) Plants (Energy) 23
Non-specified (Energy) 24
Distribution Losses 25
Total Final Consumption 26
Only TJ. Conversion to mcm by using the GCV from
the gross inland deliveries
(observed) in table 1.
Transfor-mation sector
Energy sector
Inland demand (total consumption)
Distribution losses
Total final consumption
Natural Gas Statistics
Annual questionnaire – Inland Consumption, Table 2a
© OECD/IEA 2015
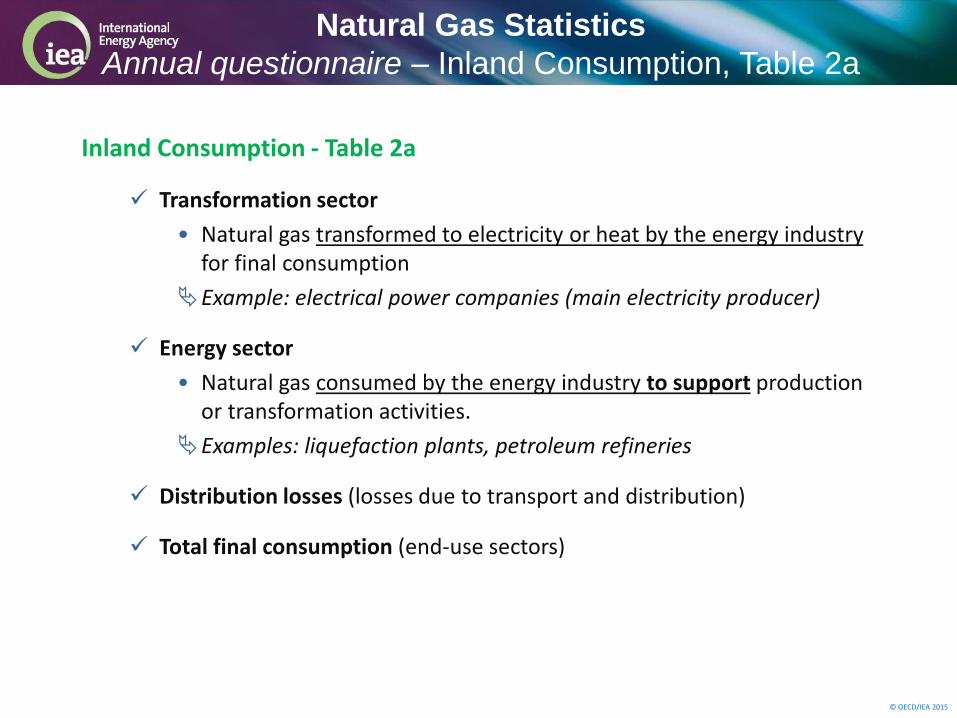
Inland Consumption - Table 2a
Transformation sector
• Natural gas transformed to electricity or heat by the energy industry for final consumption
Example: electrical power companies (main electricity producer)
Energy sector
• Natural gas consumed by the energy industry to support production or transformation activities.
Examples: liquefaction plants, petroleum refineries
Distribution losses (losses due to transport and distribution)
Total final consumption (end-use sectors)
Natural Gas Statistics
Annual questionnaire – Inland Consumption, Table 2a

© OECD/IEA 2015
Natural Gas Statistics
Annual questionnaire
Table 2b
Inland consumption
Table 2a Tables 3 & 4
Supply
Total final consumption
Exports/Imports
Table 5
Gas storage capacity
Table 1

© OECD/IEA 2015
Unit: TJ (GCV)
Energy Use Non-Energy Use
A B
Total Final Consumption 1
Transport Sector 2
Road 3
of which Biogas 4
Pipeline Transport 5
Non-specified (Transport) 6
Industry Sector 7
Iron and Steel 8
Chemical (including Petrochemical) 9
Non-Ferrous Metals 10
Non-Metallic Minerals 11
Transport Equipment 12
Machinery 13
Mining and Quarrying 14
Food, Beverages and Tobacco 15
Paper, Pulp and Printing 16
Wood and Wood Products 17
Construction 18
Textiles and Leather 19
Non-specified (Industry) 20
Other Sectors 21
Commercial and Public Services 22
Residential 23
Agriculture/Forestry 24
Fishing 25
Non-specified (Other) 26
Energy use Total final consumption
Non-energy use
Transport sector
Industry sector
Other sectors
TJ (GCV)
Natural Gas Statistics
Annual questionnaire – Total final consumption, Table 2b

© OECD/IEA 2015
Final consumption - Table 2b
Different uses
• Energy use
Natural gas used as a fuel
Example: natural gas used for residential heating
• Non-energy use
Natural gas used as a raw material
Example: Natural gas used as a feedstock to make hydrogen
Sectors
• Industry sector (steel plants, cement plants, …)
• Transport sector (CNG in fuel stations, …)
• Other sectors (households, commercial and public services…)
Natural Gas Statistics
Annual questionnaire – Total final consumption, Table 2b

© OECD/IEA 2015
Sector\Plant type Electricity plants CHP plants Heat plants
Transformation (Table 2a)
Main activity producer
All electricity produced
and all gas used
Electricity and
heat produced
and all gas used
All heat
produced and all
gas used
Autoproducer Electricity
produced and
only heat sold
with
corresponding
gas used
Only heat sold
with
corresponding
gas used
Industry (Table 2b)
Main activity producer
NO DATA
REPORTED HERE
NO DATA REPORTED HERE
Autoproducer Natural gas consumed in heat and
CHP plants for the production of
heat used by the enterprise itself.
Natural Gas Statistics
Annual questionnaire – Inland Consumption, Table 2a/b
© OECD/IEA 2015
Natural Gas Statistics
Annual questionnaire
Table 2b
Inland consumption
Table 2a Tables 3 & 4
Supply
Total final consumption
Exports/Imports
Table 5
Gas storage capacity
Table 1

© OECD/IEA 2015
Million m3 TJ (GCV)
COUNTRY OF
DESTINATION
Total Exports of which: LNG Total Exports of which: LNG
A B C D
Australia 1
Austria 2
Belarus 3
….
Pipeline +
LNG =
Natural Gas Statistics
Annual questionnaire - Imports/Exports, Table 3/4

© OECD/IEA 2015
Imports / Exports - Tables 3,4
Requested data
• Mcm and TJ
• Total imports/exports and LNG imports/exports
• Pipeline amounts are calculated
Geographical breakdown
• 81 import origins
• 73 export destinations
Trade
• Report ultimate origin or destination
• Transit trade is not included
Natural Gas Statistics
Annual questionnaire - Imports/Exports, Table 3/4

© OECD/IEA 2015
Country A
Country B
A special case in trade reporting:
1) Imports LNG 3) Exports gaseous gas
This is not transit and should be reported in both the import and export tables
Natural Gas Statistics
Annual questionnaire - Imports/Exports, Table 3/4
2) Regasification

© OECD/IEA 2015
Table 1
Supply
Natural Gas Statistics
Annual questionnaire
Table 2b
Inland consumption
Table 2a Tables 3 & 4
Total final consumption
Exports/Imports
Table 5
Gas storage capacity

© OECD/IEA 2015
Security of supply: an important policy issue in gas consuming countries In case of supply disruption it is important to know the available storage facilities in a region.
Natural Gas Statistics
Annual questionnaire – Gas storage capacity, Table 5
Name Type
Working capacity:
million cubic metres (GNG) OR
thousand cubic metres (LNG)
Peak output:
mcm/day (GNG) OR
No. of tanks (LNG)
TOTAL 0 0

© OECD/IEA 2015
Gas storage capacity – Table 5 Location/name of the storage Types of storage
• Depleted oil and gas fields • Aquifers • Salt cavities • For LNG: above/below ground
Technical characteristics
• Working capacity: total gas storage capacity minus cushion gas • Peak output: maximum rate at which gas can be withdrawn from storage • For LNG: above/below ground
Natural Gas Statistics
Annual questionnaire – Gas storage capacity, Table 5

© OECD/IEA 2015
Table 3
Imports by Origin
Table 3 Imports by Origin
Table 4
Exports by Destination
Table 4 Exports by Destination
Table 2
Inland Consumption = Transformation + Energy + Distribution
Losses + Total Final Consumption
Table 2 Inland Consumption
= Transformation + Energy + Distribution
Losses + Total Final Consumption
Table 1
Supply
Table 1
Supply
Imports = Total Imports
Exports = Total Exports
Inland Consumption (observed)
= Inland Consumption
Table 2a
Net Inland Consumption by Sector
Table 2a
Inland
Consumption by Sector
Table 2b
Total Final Consumption by sector
Energy - use Non - energy use
Table 2b
Total Final Consumption by sector
Energy - use Non - energy use
Electricity and Heat
questionnaire
Table 6a - 6c
Electricity and Heat
questionnaire Table 6c
Inputs to Gross Electricity and Heat Production
Oil questionnaire
Table 1
Oil questionnaire
Table 1
LPG
Coal questionnaire
Table 1
Coal questionnaire
Table 1
Renewables questionnaire
Table 1
Renewables questionnaire
Table 1
Biogases
Manufactured gases
Natural Gas Statistics
Inter-questionnaire relationships

© OECD/IEA 2015
What happens when the data arrives at the IEA?
Natural Gas Statistics
Data processing
© OECD/IEA 2015
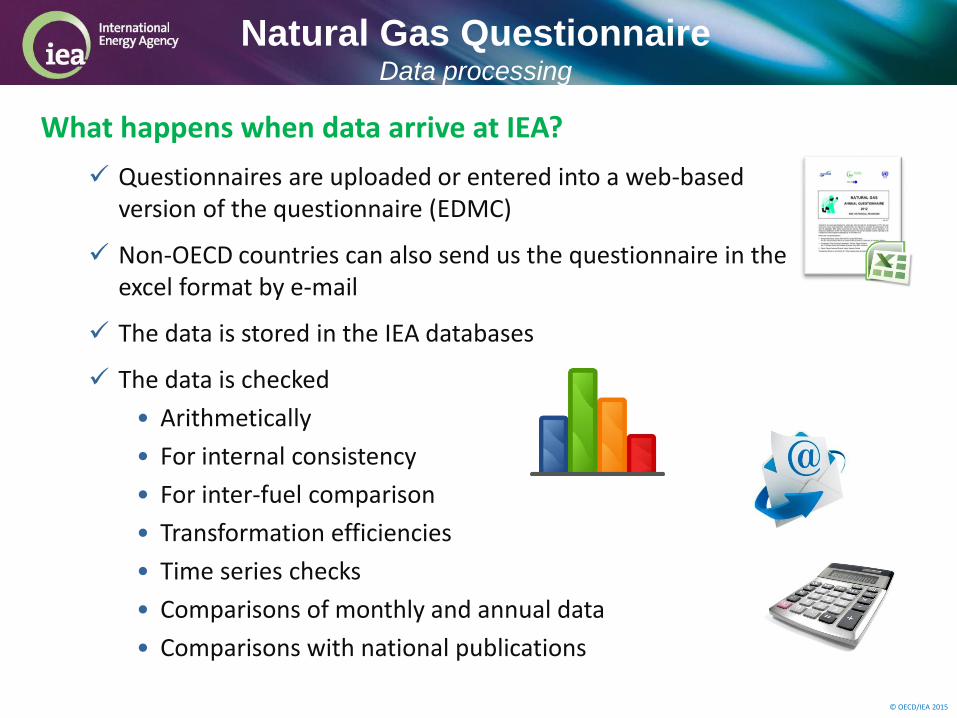
What happens when data arrive at IEA?
Questionnaires are uploaded or entered into a web-based version of the questionnaire (EDMC)
Non-OECD countries can also send us the questionnaire in the excel format by e-mail
The data is stored in the IEA databases
The data is checked
• Arithmetically
• For internal consistency
• For inter-fuel comparison
• Transformation efficiencies
• Time series checks
• Comparisons of monthly and annual data
• Comparisons with national publications
Natural Gas Questionnaire Data processing

© OECD/IEA 2015
Gases with different GCVs
• Inability of the questionnaire to distinguish between gases with high and low calorific values used in separate or parallel gas systems. Instead, countries have to report an “average” gas.
Trade
• Increasing difficulties with liberalised markets.
• Transit trade is sometimes reported as import/export.
• Spot purchases.
• Exchange contracts/swaps.
Units
• Measurement in mcm under standard conditions: sometimes reported using normal conditions or 20° Celsius.
• Data in TJ often reported by NCV rather than GCV.
Some problems specific to gas reporting
Natural Gas Questionnaire Data processing
© OECD/IEA 2015
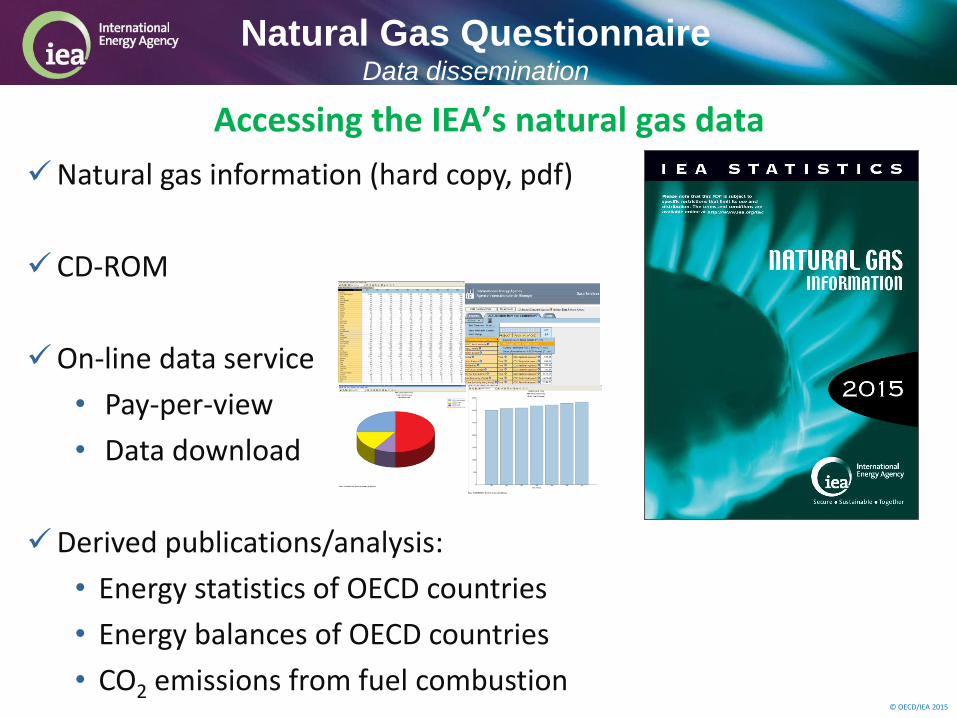
Natural gas information (hard copy, pdf)
CD-ROM
On-line data service
• Pay-per-view
• Data download
Derived publications/analysis:
• Energy statistics of OECD countries
• Energy balances of OECD countries
• CO2 emissions from fuel combustion
Accessing the IEA’s natural gas data
Natural Gas Questionnaire Data dissemination

© OECD/IEA 2015
Natural Gas Questionnaire
Exercises

© OECD/IEA 2015
Natural Gas Questionnaire
Exercise preparation: Key points
• Units of measurement
• Calorific values
• Weighted average
• Production
• Trade: imports and exports
• Electricity and heat generation

© OECD/IEA 2015
Conversion Factors
Natural Gas Questionnaire
In the questionnaire, data must be reported:
For energy: TJ on the basis of Gross calorific value (GCV)
For volume: Mm3 in the standard condition
Volume varies with temperature and pressure
Normal Condition 0 ⁰C (273.15 K), 760 mm Hg (1 atm)
Units of Measurement
Standard Condition 15 ⁰C (288.15 K), 760 mm Hg (1 atm)
1 m3
0.948 m3 x 0.948
x 1.055
Same energy content

© OECD/IEA 2015
Natural Gas Questionnaire
Calorific values
The calorific value is heat value obtained from one volume unit of gas (e.g. TJ/Mm3)
Gross calorific value (GCV) includes all the heat released by the fuel
Net calorific value (NCV) excludes the latent heat of vaporization
The difference between NCV and GCV is typically about 10% for natural gas.
For natural gas: NCV ≈ 0.9 GCV

© OECD/IEA 2015
Natural Gas Questionnaire
Calorific values
Gases from different sources can have different calorific values
Use a weighted average that takes into account the proportional magnitude of each component rather than treating the components equally

© OECD/IEA 2015
Natural Gas Questionnaire
Weighted Average Calorific Value
Example:
Country A
Fields Production Calorific Value Energy
Site 1 10 Mm3 30 TJ/Mm3 300 TJ
Site 2 20 Mm3 35 TJ/Mm3 700 TJ
Total 30 Mm3 ? 1 000 TJ

© OECD/IEA 2015
Example:
Country A
Natural Gas Questionnaire
Weighted Average Calorific Value
Fields Production Calorific Value Energy
Site 1 10 Mm3 30 TJ/Mm3 300 TJ
Site 2 20 Mm3 35 TJ/Mm3 700 TJ
Total 30 Mm3 33.3 TJ/Mm3 1 000 TJ

© OECD/IEA 2015
Natural Gas Questionnaire
Weighted Average Calorific Value
Definition:
where: CV = Calorific value (e.g. kJ/m3)
Quantity = Physical quantity (e.g. m3)

© OECD/IEA 2015
Natural Gas Questionnaire
Production Flow

© OECD/IEA 2015
Natural Gas Questionnaire
Trade: Imports and Exports
Imports: ultimate origin of gas (country of production)
Exports: ultimate destination (country of consumption)
Transit and re-exports are not included in trade balances
Example: Russia exports 200 mcm of natural gas. The pipeline goes through Ukraine before reaching Poland. Ukraine consumes 100 mcm and the rest goes to Poland. Then, Poland consumes 50 mcm of the natural gas and exports 50 mcm to Czech Republic.

© OECD/IEA 2015
Natural Gas Questionnaire
Russian Federation
Ukraine 100 mcm consumed
50 mcm
Czech Rep. 50 mcm
consumed
Poland 50 mcm
consumed
100 mcm
200 mcm

© OECD/IEA 2015
Natural Gas Questionnaire
Trade: Imports and Exports
Example: Russia
Ukraine imports 100 mcm from Russia
Poland imports 50 mcm from Russia
Czech Rep. imports 50 mcm from Russia
Country Exports
Czech Rep. 50 mcm
Poland 50 mcm
Ukraine 100 mcm

© OECD/IEA 2015
Natural Gas Questionnaire
Electricity and Heat Generation
Generation plants are classified by output:
Electricity-only plants
CHP (Combined heat and power) plants
Heat-only plants
Generation plants are also classified by main function:
Main activity producers (e.g. nuclear power plants)
Autoproducers (e.g. steel mills producing electricity)

© OECD/IEA 2015
Natural Gas Questionnaire
Thank you