analysis of agricultural credit in india by ashok k. jha
TRANSCRIPT

ANALYSIS OF AGRICULTURAL CREDIT IN INDIA
by
Ashok K. Jha
A dissertation submitted in partial fulfilment of the requirements for the degree of Master of Agricultural Development Economics in the
Australian National University
May, 1979

ii
DECLARATION
Except where otherwise indicated, this dissertation is my own work.
May, 1979
JAshok K. Jha

iii
CONTENTSPage
ACKNOWLEDGEMENTSviABSTRACT
LIST OF TABLES Vli:L
LIST OF APPENDICES x
CHAPTER
1 WHY AGRICULTURAL CREDIT 11.1 Agriculture and Development 11.2 Importance of Agriculture in India 21.3 Relevance of Agricultural Credit 61.4 Objectives of the Study 11
2 THE DEMAND AND SUPPLY OF AGRICULTURAL CREDIT 12
2.1 Demand and Requirement 122.2 Supply of Credit 20
2.2.1 Formal Sources I: Government 232.2.1 Formal Sources II: Co-operatives 262.2.3 Formal Sources III: Commercial Banks 32
2.3 Credit Gap3 THE PRICE OF CREDIT 36
3.1 Are Agricultural Interest Rates High 363.2 Theory of Agricultural Interest Rates 37
3.2.1 Opportunity and Administrative Costs 383.2.2 Risk Premium 383.2.3 Inflationary Premium 423.2.4 Monopoly Profit 43
3.3 Examination of Factors Which InfluenceDetermination of Interest Rates 45
3.4 Rural Interest Rates in India 513.5 Interest Rates for Small Farmer Lending 56

iv
CHAPTER Page
4 FACTORS AFFECTING PERFORMANCE OF INSTITUTIONAL CREDIT 65
4.1 Indicators of Success 654.2 Ranking of States 664.3 Analysis of Factors 69
4.3.1 Literacy 694.3.2 Land Reforms 704.3.3 Irrigation 724.3.4 Consumption of Chemical Fertilizers 744.3.5 Rural Electrification 744.3.6 Co-operative Marketing 75
4.4 Implications of Association 78
5 SMALL FARMER CREDIT 80
5.1 Primacy 805.2 Inadequacy of Credit 825.3 Reasons for Inadequacy 865.4 Analysis of Steps to Increase Small Farmer Lending 96
6 CONCLUSIONS 1056.1 Summary 1056.2 Policy Implications 109
APPENDICES 115
REFERENCES 124

V
ACKNOWLEDGEMENTS
I must thank the Australian National University, the Government
of India and the Government of Andhra Pradesh for making this study
possible.Most gratefully I acknowledge the assistance given to me by my
supervisor, Dr R.T. Shand for his painstaking guidance and useful comments.
I wish to record my great intellectual debt to Dr D.P. Chaudhri and Dr
Kym Anderson for an enormous contribution to this study in many tangible
and intangible ways.Finally, I should like to express my sincere gratitude to Mrs
Bridget Boucher for coordinating the typing, to Mrs Wendy Adcock and
Mrs Daphne Boucher for a careful typing of the manuscript and to Mrs Sally Wilson for her assistance in numerous ways.

vi
ABSTRACT
The relevance of agricultural credit is augmented in the
context of the increasing emphasis on rural development and mitigation
of poverty. This study aims to examine certain important facets
connected with agricultural credit in India. It is a macro analysis
at the National and State levels. Data from Reserve Bank of India's
surveys for 1951-52, 1961-62 and 1971-72 have been primarily used.
Despite the plethora of credit institutions established in
recent years, the bulk of agricultural credit still comes from non-formal
sources. Examination of credit disbursement in different States by
institutional agencies suggests their competitiveness rather than
complementarity and indicates a widening of the existing inter-regional disparities. Better institutional credit arrangements and a high level of literacy, satisfactory performance in implementation of land reforms,
use of irrigation particularly well irrigation, use of chemical fertilizers, progress in rural electrification and development of marketing facilities
are significantly correlated.
The analysis shows that credit inadequacy is quantitative as well as qualitative. However, contrary to the widely held view, the
quantitative shortfall cannot be explained by low interest rates in the
agricultural sector. Qualitatively, accessibility of credit to small
farmers continues to be impeded, although its importance is recognised.
Arguments, such as high default rates, generally advanced to explain
insufficient small farmer credit, do not stand the test of close scrutiny.
The view that interest rates be raised to expand small farmer credit has
little merit and in fact analysis indicates that

vii
there is scope for adopting differential rates of interest in
favour of small farmers.
The policy prescriptions suggested include a revamping of
management of credit institutions to increase credit supply in the
agricultural sector. It is recommended that a separate credit channel
exclusively for small farmers be established. This should function in
close association with Small Farmers' Development Agencies so that the
benefits of effective supervised credit become available to small farmers.

viii
LIST OF TABLES
Table Title Page
1.1 Classification of Workers, 1961 and 1971 - ALL INDIA 31.2 Agriculture's Contribution to National Income at
1960-61 Prices 31.3 Share of Agriculture in Total Imports and Exports 41.4 International Comparison of Indian Agriculture 52.1 Borrowing per Cultivator Family 192.2 Analysis of Cultivator Borrowing By Purpose 192.3 Proportion of Agricultural Borrowing From Different
Agencies 222.4 Proportion of Borrowing From Non-Formal Sources 222.5 Loans and Outstandings By Cultivators From Government
in 1961-2 252.6 Borrowings from Government as a Percentage of Total
Borrowings of Various Size Groups of Cultivators in 1970-71 26
2.7 Progress of Primary Agricultural Credit Societies 282.8 Other Activities of Primary Agricultural Societies 292.9 Classification of Loans by PACS According to Size of
Holding 292.10 Short Term Loans by Purpose Issued by PACS 302.11 Medium Term Loans by Purpose Issued by PACS 312.12 Progress of Land Development Banks 322.13 Branch Expansion of Commercial Banks 332.14 Quarterly Expansion of Bank Branches 332.15 Distribution of Commercial Bank Agricultural Lending
According to Holding Size 343.1 Ranking of States According to Interest Rates and
Factors Influencing Interest Rates 473.2 All India Cash Loans Borrowed by Cultivators From All
Sources During 1961-2 Classified by Rates of Interest 523.3 Average Rates of Interest on Borrowings for Various Farm
Size Categories by Sources 553.4 Borrowings From Moneylenders by Size Groups at
Different Rates of Interest (1970-1) 563.5 Progress Under the Differential Rate of Interest Scheme 64

ix
Table Title Page
4.1 Ranking of Various States in Terms of PACS Credit byVarious Indicators 67
4.2 Ranking of Various States in Terms of Commercial BankAgricultural Credit 68
4.3 Ranking of States According to Various Factors 714.4 Ranking of States According to Performance in Co
operative Marketing 775.1 Average Borrowings and Outstandings of Cultivators
1961-62 845.2 Borrowings from Institutions and Non Institutions
According to Size of Holdings: 1970-71 855.3 Percentage of Borrowers Obtaining Credit by Source:
1970-71 855.4 Percentage of Borrowing for Various Purposes by Asset
Groups (1961-62) 965.5 Number of Farmers' Service Societies in Different States
as on 31.12.76 995.6 Spread of Regional Rural Banks Among States (as on
30.6.1977) 1015.7 Extent of Assistance to Weaker Sections in 12 RRBs 102

X
a p p e n d i c e s
Annexure Title Page
I Application for Loan 115
II Extract of Settlement Fair Adangal 117
III Extract of 10(1) Revenue Account 118
IV Extract of (No.2) Cultivation Account 119
V Statement of Property That is to be Mortgaged 120
VI Property of the Applicant other than the Property Offered for Mortgage 121
VII Statement of Income and Expenditure 122

1.
CHAPTER 1
WHY AGRICULTURAL CREDIT
1.1 Agriculture and DevelopmentDevelopment as a concept has undergone a metamorphosis in
the last decade. The earlier preoccupation with aggregates like per
capita income or gross national product has yielded to an increasing
emphasis on the qualitative aspects, and particularly on the welfare of
the rural poor. This concern is reflected in the definitions of rural
development adopted by international agencies in recent times. The
World Bank defined it as "a strategy designed to improve the economic
and social life of a specific group of people, the rural poor". [77]
The International Labour Organisation [78] stresses the basic needs aspects which consists of minimum requirements (food, shelter, clothing
etc.) and essential services (drinking water, health, education etc.).
This shift in emphasis has been accelerated by the realisation
that past development policies, which essentially reflected the bimodal
or "trickle down" theory of development, failed to make a discernible impression on the problem of rural poverty as any benefits were cornered
by the better off segments of rural society. In part it is due to an appreciation by development economists of the fact that 80% of the world's poor live in the rural areas, whereas developmental efforts have
had a distinct urban bias thereby accentuating the urban-rural dichotomy.
This has led to an increased awareness that models of growth based entirely
on a rapid expansion of the industrial sector are self-defeating, and
unless measures to increase the effective demand of the rural sector
are undertaken, the process of industrialisation is likely to grind to a halt. This was brought home rather strikingly in India in the mid 1960s
which witnessed the paradox of inflation being accompanied by industrial

2 .
r e c e s s i o n . The a n t i t h e t i c a l c h a r a c t e r o f d e v e lo p m e n ta l s t r a t e g i e s h a s
been s u c c i n c t l y b r o u g h t o u t i n I n d i a i n t h e 1970s when d e s p i t e a
s a t i s f a c t o r y l e v e l o f a g r i c u l t u r a l g row th m easu red in te rm s o f
a g g r e g a t e s , and a b u f f e r s to c k o f o v e r 20 m i l l i o n to n s o f f o o d g r a in s in
Government w a re h o u se s , t h e i n c i d e n c e o f r u r a l p r o v e r t y h a s been
e x a c e r b a t e d w h i le a t t h e same t im e i n d u s t r i a l grow th h a s been b e d e v i l e d
by i n s u f f i c i e n t e f f e c t i v e demand. T h is w eakness h as o n ly b e l a t e d l y been
r e c o g n i s e d in t h e l a t e s t F iv e Year P la n [1 ] .
P o v e r ty i n I n d i a has been q u a n t i f i e d by Dandekar and Ruth [2]
and C la rk [ 3 ] . A c c o rd in g t o b o th e s t i m a t e s , be tw een 24 t o 40% o f t h e
r u r a l p o o r l i v e i n h u n g e r . Minhas [4] a p p ro a c h in g th e p ro b lem from th e
p o i n t o f v iew o f a b a s i c minimum income n e c e s s a r y t o s u s t a i n e x i s t e n c e ,
found t h a t be tw een 40 t o 50% o f t h e r u r a l p o p u l a t i o n l i v e s below th e
p o v e r ty l i n e .1 .2 Im p o r ta n c e o f A g r i c u l t u r e i n I n d i a
The above a n a l y s i s i s a p r e d i c a t i o n o f t h e im p o r ta n c e o f t h e
r u r a l s e c t o r i n t h e I n d i a n economy. W ith in t h e r u r a l s e c t o r , th e
p rom inence o f a g r i c u l t u r e can be gauged by th e f o l l o w in g i n d i c e s .

3.
TABLE 1.1
CLASSIFICATION OF WORKERS, 1961 and 1971 - ALL INDIA
Class of 1961 1971Workers Total Workers
(millions)Percentage to total
Total Workers Percentage (millions) to total
(1) (2) (3) (4) (5)
Cultivators 99.6 52.8 78.3 43.4Agricultural labourers 31.5 16.7 47.5 26.3Other Workers 57.6 30.5 54.7 30.3
TOTAL Workers 188.7 100.0 180.5 100.0
Source: Census of India 1971'*’
Table 1.1 shows that around 70% of the work force was engaged in the
agricultural sector in both 1961 and 1971.
TABLE 1.2
AGRICULTURE'S CONTRIBUTION TO NATIONAL INCOME AT 1960-61 PRICES
1961 1971
National Income (Rs in crore) 13263 19033
National Income from Agriculture 6580 8137
Income from Agriculture as a % of total National Income
49.6 42.8
Source: Indian Agriculture in brief. (20)
Table 1.2 shows that despite a decline in the contribution of agriculture
1 The fact that the total number of workers declined from 188.7 millions in 1961 to 180.5 million is due to a change in the definition of workers in the two Censuses.

4 .
i n N a t io n a l Income o v e r r e c e n t y e a r s , i t a c c o u n te d f o r n e a r l y 43% o f th e
t o t a l N a t io n a l Income i n 1971. A g r i c u l t u r a l e x p o r t s a c c o u n te d f o r a round
40% o f t o t a l e x p o r t s w hich h i g h l i g h t s a f u r t h e r c o n t r i b u t i o n o f
a g r i c u l t u r e in t h e I n d ia n economy (T ab le 1 .3 ) w h i le im p o r ts (m o s t ly
u n d e r PL 480) were s l i g h t l y l e s s a t a b o u t 33%. I t s h o u ld be m a n i f e s t l y
e v i d e n t from T a b le s 1 . 1 , 1 .2 and 1 .3 t h a t d e ve lopm en t programmes w hich
i m p l i c i t l y o r e x p l i c i t l y ig n o re t h e r e l e v a n c e o f t h e a g r i c u l t u r a l s e c t o r
in t h e economy w i l l s u c c e e d o n ly i n i n c r e a s i n g th e i n c i d e n c e o f r u r a l
p o v e r t y .
TABLE 1 .3
SHARE OF AGRICULTURE IN TOTAL IMPORTS AND EXPORTS
Year % s h a r e o f a g r i c u l t u r e i n t o t a l e x p o r t s
% s h a r e o f a g r i c u l t u r e i n t o t a l im p o r ts
1970-71 37 .1 37 .2
1971-72 37 .4 3 1 .8
1972-73 38 .3 2 5 .9
1973-74 4 0 .3 31 .1
1974-75 4 2 .3 34 .0
S o u rce : I n d ia n A g r i c u l t u r e i n B r i e f . (20)
A s tu d y [79] o f 74 d e v e lo p in g c o u n t r i e s u s in g s t e p - w i s e
r e g r e s s i o n and d i s c r i m i n a n t a n a l y s i s f o r th e p e r i o d 1957-62 c o n c lu d e d
t h a t t h e d e g re e o f im provem ent i n a g r i c u l t u r a l p r o d u c t i v i t y i s an
i m p o r ta n t f a c t o r i n t h e d i s c r i m i n a n t f u n c t i o n a c c o u n t in g f o r d i f f e r e n t
l e v e l s o f growth o f p e r c a p i t a Gross N a t io n a l P r o d u c t o f d i f f e r e n t
c o u n t r i e s . But does an i n c r e a s e in a g r i c u l t u r a l p r o d u c t i v i t y im p ly a
p a r i p a s s u improvement in t h e i n c i d e n c e o f r u r a l p o v e r ty ? A r e c e n t
a n a l y s i s w hich a t t e m p te d t o examine t h e r e l a t i o n s h i p be tw een r u r a l

5.
poverty and agricultural performance in India between the period 1956-7
to 1973-4, found that the "all-India evidence is entirely consistent
with the hypothesis that the incidence of rural poverty is inversely
related to agricultural performance measured in terms of agricultural
NDP (Net Domestic Product) per rural person" [80].
Despite the comparative significance of the agricultural
sector, Indian agriculture is characterised by low yields (Table 1.4).
Since these data relate to the entire economy, they conceal wide
inter-regional variations. For instance, rice and wheat yields in Punjab were over 2000 kgs/hectare and the consumption of inorganic
fertilisers in 1974-5 in Punjab was 47.3 kgs/hectare, i.e. more than
three times the national average [20]. Nevertheless, the international
figures in Table 1.4 serve to underscore the point that Indian agriculture is comparatively backward.
TABLE 1.4INTERNATIONAL COMPARISON OF INDIAN AGRICULTURE
Countries Yields Rice (1974)
in kilograms/hectare Wheat (1974) Maize
Fertiliser consump- (1974) tion in kilograms/
hectare (1972-73).N P2°5 k2° Total
(1) (2) (3) (4) (5) (6) (7) (8)
India 1592 1172 967 10 3 2 15Japan 5838 - - 117 115 96 328U.S.A. 4978 1842 4478 40 24 21 85
Sources: Cols. (2), (3), (4) - FAO Production YearbookCols. (5) , (6) , (7), (8) - Indian Agriculture in Brief. (20)
A number of reasons have been adduced to explain the backward
ness of Indian agriculture. Those often cited as being responsible include

6.
the failure of land reforms, inappropriate price policy and inadequate
education. It is true that land reforms in terms of a modest ceiling
on land ownership would permit transfer of productive assets to smallerfarmers and also might increase agricultural production since farm
management studies point to a higher productivity of smaller farms.
This approach however ascribes remedial properties to land reforms
which it does not possess. Even if all the available surplus land
were distributed to the rural poor, their average holding would be less
than 0.60 acres per capita [4]. This by itself is not likely to have a
tangible impact on the problem of rural poverty. Other critics
including Lipton [5] place the blame on foodgrain prices, contending
that their depression is detrimental to the rural sector. Whether
price policy is in fact an effective instrument for influencing total
agricultural output is debated [6]. It is certainly a questionableprescription for India, a country where the bulk of the rural population
2are net purchasers of grain. These higher foodgrain prices will at best benefit the larger farmers with substantial marketable surplus.
The low level of formal education is also proposed as the main
impediment to rural progress [7]. According to this view agriculturalproduction in India can be doubled merely by improving formal education
to the levels in Japan. However, the high dropout rate of over 60% in
primary education in India and the fact that around 60% of the secondary
schools have less than 160 students would provide evidence to challenge
the view that the supply of education has been a constricting factor.1.3 Relevance of Agricultural Credit
In the context of these divergent views and theories, what
is the role of agricultural credit? Agricultural production involves
the process of biological growth under infinitely varying conditions.
2 Over 60% of farmers are small holding less than 5 acres each. Studies

7.
Differences in soil, available plant nutrients and soil-water relation
ships and their interaction with crop varieties of differing genetic
potential and susceptibility to pests and diseases all contribute to a complexity of the process. What role does credit pay in this? It is
held that in a situation characterised by stagnant technology, farmers
over time will acquire the appropriate amount of capital so that
credit, especially production credit, will not generally be an important
constraining variable except in periods of unexpected crisis [8]. This
lends credence to the point of view rejecting the importance of
accessibility of credit of peasant farmers before they are "able to
put even one foot on the ladder to increased productivity and increased
income" [9]. Some others, [81, 82] on the other hand, have given due
prominence to the role of capital in development.
In India, the introduction of the High Yielding Varieties in the mid 1960s for a number of important crops has appreciably altered existing input-output co-efficients. There was a major increase in the proportions of purchased inputs to total inputs, associated with the responsiveness of new crop varieties to chemical fertilisers under
conditions of effective management of water, pests and diseases. These changes gave a fresh impetus to the role of credit. While the success
of this new agricultural technology rests on the optimal allocation of
these various inputs, for most farmers the capacity to make the
appropriate choices with purchased inputs has hinged on the financial
question of access to credit. Unfortunately the criticism that
development has been discussed primarily in terms of rural "goods" to
the exclusion of financial aspects [10] is as valid today as it was
twenty five years ago.
(91, 92) show that the proportion of output marketed is directly relatedto holdings size and is less than 50% for small farmers.

8.
Credit is a powerful economic tool as it facilitates a
borrower's shift to a higher production possibility curve with a greater
command over resources. Capital with scientific knowledge has in fact
been described as the key combination for growth in Indian agriculture
[15] and not land or labour, since the frontiers of land have more or
less been reached and labour is an abundant resource whose marginal
product, in the absence of capital to raise it, is near zero. A policy
of allocation and distribution of capital is therefore an important means
towards achieving developmental objectives. It should however be
emphasised that mere availability of credit will not persuade farmers
to adopt a particular technology [11]. Farm credit is a necessary but
not a sufficient condition for agricultural development [8].
It is possible to distinguish between two basic elements in the decision making process regarding adoption of innovations. The first element is the decision or willingness to adopt and the second is the ability to adopt. Prima facie, the decision to adopt is a function
of the farmer's assessment of the profitability of an enterprise and his subjective evaluation of the associated risks. The ability to adopt will
depend on a wide range of factors like credit availability, irrigation, facilities etc. necessary for the enterprise and which indeed also
serve to reduce the risks of adoption and hence have a bearing on the
decision to adopt.
In a country like India, where the bulk of the farmers
cultivate less than 5 acres, credit availability is a major factor
influencing the rate of adoption of the new technology as the costs
of cultivation associated with it are high and are generally beyond the
capacity of most farmers to meet from their own resources. Credit
available at reasonable rates, at the correct time and in adequate

9.
quantities not only affects the farmers' ability to adopt in a
favourable way, but has an important influence on his decision to
adopt, especially in the case of small farmers. If the farmer
borrows from institutional sources (e.g. co-operatives) and if his
crop was to fail, he knows he can obtain the necessary consumption
credit from non-formal sources to provide him with his requirements
till the next crop. But if institutional credit is not available, and
if he had to obtain production finance from non-formal sources, not only
would it reduce the profitability of the proposed venture (owing to
the higher interest rates involved) but in the event of crop failure,
his channels for obtaining consumption credit would be restricted.
To this extent, therefore, institutional credit acts as a cushion
against risks enabling the farmer to transfer a part of the risk on to the credit institution.
A number of empirical studies have vouchsafed the importance of credit in raising agricultural production and productivity through adoption of better methods. Lowdermilk's [12] study of diffusion of
dwarf wheat varieties in Pakistan's Punjab shows that credit availability is significantly related to the level of use of nitrogenous fertiliser for the new wheat varieties. Schlüter [13] found a relationship between
the use of co-op. credit and adoption of new varieties in India but was
not definite about the line of causality between the use of co-op. credit
and adoption. Another study of Haryana State in India shows that credit
is a crucial variable for adoption of new farm technology [14].
But has institutional credit been adequate for modernising
Indian agriculture? Desai and Desai's study [83] of a district in Gujrat indicated the unusual finding that the existing availability of

10.
credit plus fanners own funds are sufficient to enable them to adopt new
technology. They were of the view that the larger farmers obtained
more institutional credit than their requirement which left considerable
scope for the re-allocation of credit to other farmers. However,
another study conducted jointly by the Australian National University
and the Planning Commission of India, which covered the High Yielding
Varieties Programme in India for the period 1970-75, while noting that
the expansion of credit facilities had a bearing on the performance of
the Programme, concluded that "in very few areas the cultivators were
able to secure adequate credit for their purposes from institutional
sources"[84]. This limitation applied particularly to small and
marginal farmers.
We have alluded to the fact that credit is a necessary but
not a sufficient condition for agricultural development. In fact in a limited sense, policies of input subsidisation or output price support
can be considered to be alternatives to agricultural credit. Input subsidies will result in a lowering of the cost of cultivation, and
thereby reduce the requirement for credit. Output price support will enable farmers to obtain a higher income from the same level of
production and will increase their capacity for self-finance and hence
lower their requirement for credit. Given the existence of profitable
technology and the dissemination of the benefits of this technology to
the farmers, credit acts as a catalytic agent in the process of
agricultural development, provided certain other conditions are met.
These other conditions include(a) adequate and timely supplies of requisites, e.g. seeds,
fertilisers, pesticides,(b) market access,

11.
(c) existence of a satisfactory land tenure system.
Existence of a profitable technology as well as availability
of credit would become redundant if suitable arrangements for the
supply of inputs are not made. Lack of a market for the produce will
likewise encumber the use of credit for adoption of new technology.
Finally, a land tenure system characterised by insecurity for tenants or
unfavourable sharecropping conditions may inhibit farmers from adopting
yield increasing technology while on the other hand the absentee landlord
may be disinclined to invest capital if arrangements are such that it
benefits only the tenant.1.4 Objectives of the Study
Thus although it is true that credit is not Alladin's lamp requiring only rubbing to release the forces of agricultural development,
it is equally true that no meaningful discussion of development, especially agricultural development, is complete without taking cognisance of credit. Keeping this in view, the objectives of this study are (1) to investigate both quantitatively and qualitatively the demand and supply aspects of agricultural credit in India, (2) to analyse the performance of institutions purveying agricultural credit (a) in absolute
terms, (b) in terms of inter-state variations and (c) in terms of delivery of credit to small farmers and lastly (3) to examine factors
which influence the price of credit.

12.
CHAPTER 2
THE DEMAND AND SUPPLY OF AGRICULTURAL CREDIT
2.1 Demand and Requirement
Conceptually, the demand for agricultural credit is a
derived demand - derived from the demand for investment on the one
hand and the demand for consumption on the other. Investment credit
itself can be split up into (a) current expenditure on the farm,
e.g. seeds, fertilisers etc. and (b) capital expenditure on the farm,
e.g. establishment of irrigation facilities, on farm development works,
etc. The demand for investment credit itself is a function of the cost
of credit and the marginal efficiency of capital which in turn is
dependent on the profitability of technology, the awareness of the farmers and their degree of risk aversion.
If production is primarily for home consumption i.e. in an economy where subsistence agriculture is preponderant, the significance of market risk will be greatly diminished as farmers will be free from market influences. If subsistence agriculture is coupled with static
technology, the relevance of risk would be further diminished, as
farmers’ expectations regarding the movement of key variables would be a fairly accurate vision of reality, the speculations having been
sharpened by historical experience over the years. This is, of course,
not to imply the total exclusion of the risk factor. Even if farmers
are fully aware of the magnitude of the ex-post returns from a
particular set of inputs and in addition, it is assumed that they treat
these ex-post returns as the best estimates of the ex-ante returns, it would still be difficult to predict their responses, without taking
cognizance of their subjective attitudes to risk.
Capital and current expenditure on the farm are themselves

13.
inter-related. An increase in the demand for capital expenditure
would usually lead to an expectation of an accompanying rise in the
demand for current outlays on the farm and vice versa, since it
enables higher production possibilities, so that the two components
of investment credit would tend to move in the same direction and
reinforce each other.
The demand for consumption credit too is a complex phenomenon.
It depends partly on economic forces such as farm input-output
relationships and partly on sociological factors such as social customs
which dictate consumptions habits. Given the consumption habits, the
lower the input:output ratio, (which itself is a function of the invest
ment on the farm) the greater will be farmers savings, and so the less
the demand for consumption credit. In view of the inter-relationships, outlined above, it is difficult to construct a demand schedule for credit because it is a composite demand.
The requirement of agricultural production credit can
however, be postulated by a simple relationship as follows:
where Q represents requirements for production credit
Ip represents value of all production inputs
Ip represents value of inputs obtained on the farm
S represents savings of the farm enterprise.FTraditional agriculture is characterised by low levels of output due
to low productivity of traditional inputs with the bulk of inputs being
obtained on the farm. Thus I may be expected to be low, 1^ to be high
(but it cannot be higher than I ) and to be low or even negative
reflecting low income levels and high demands of consumption on
available income which in turn mirrors social customs e.g. lavish

14.
weddings, expensive funerals etc.
Assuming given production functions, Ip and I will be
given (being determined by the techniques of production) so that
Q = f(S ). But S itself is a function of consumption expenditure (C )F F Eso that Q = f(C ). Therefore to discuss agricultural production credit Ein isolation and ignore the requirements of consumption credit is to
misrepresent the rural scene. If the assumption of given production
functions is dropped and the introduction of new technology is taken
into account, 1^ is likely to rise and 1^ to decline as the proportion
of purchased inputs to total inputs will tend to increase.^ But
since new profitable technology brings with it a higher output, the movement of S will depend on the inter-temporal consumption profile
the farmers which in turn depends on the marginal propensity to consume.If remains constant, Q will increase, if increases due to higher productivity not accompanied by a proportional increase in consumption expenditure, it will exert a downward pull on Q. If, on the other hand, S declines owing perhaps to higher consumption possibilities
brought about by higher incomes, it will tend to reinforce the upward movement of Q due to changes in I and I . Thus although no a priori
conclusion can be drawn about the effect of the introduction of new technology on the requirements of credit, since the marginal propensity
to consume is close to unity in developing countries, it would be
fairly safe to prognosticate increased credit requirements on the basis
the anticipated movements of Ip and 1^. However, one aspect is abundantly
To an extent there will be a degree of replacement of traditional farm inputs by new farm inputs, but overall Ip will tend to decline as pruchased inputs are increasingly substituted for inputs traditionally available on the farm.

15.
clear. An increase in the volume and extent of indebtedness is not
necessarily an economically repugnant development as implied by
Crawford, [16] in fact it may well indicate a favourable trend of2adoption of better production practices.
At a time when developing countries are increasingly switching
their attention to creating institutions for the timely and adequate
supply of the credit needs of farmers, it is pertinent to examine
whether the shift in emphasis is justified. The "need-creed" view
of credit stresses the importance of credit for modernising agriculture.
In essence the argument is that savings in traditional agriculture
are relatively small while modernisation brings with it a greater
requirement for working capital as well as fixed investment. This increased requirement can only be met by large doses of credit injected
into the rural sector. In contrast, it is countered [76] that the above view is unnecessarily exaggerated in that it presumes that massive doses of expensive inputs hold the key to increased production/productivity.
Often what is required is a mere improvement in crop husbandry techniques. Besides, the transition from a traditional low productivity phase to a modern high productivity era is not accomplished overnight.
In so far as the change is gradual which is consistent with the high degree of risk-aversion normally associated with peasant agriculture,
the requirement of additional funds in any particular time period will
be small and can easily be met from the higher incomes and therefore
higher savings of the farmers.^ In essence therefore the implication is
It would be an undesirable development if the increased indebtedness was not accompanied by an improvement in the capacity to repay.
This seems to ignore the point that a minor improvement in production techniques may make only a small difference to income. Given the fact that the marginal propensity to consume is generally close to unity, it is unlikely that savings will increase.

16.
that credit is necessary only when farmers lacking purchased inputs
are unable to generate sufficient domestic savings either because the
inputs required are large or indivisible or because there is a long
gestation period between investment and returns. This view lends
credence to the proposition that credit is an "accelerator" of agricul
tural development rather than essential to it [17].
Without entering into the polemics of the significance of >
credit or otherwise, it is interesting to observe that both strands of
thought pursued to their logical conclusion would seem to suggest the
hypothesis that the demand for credit is unlikely to alter appreciably
in the absence of new profitable technology i.e. in a situation
characterised by stagnant technology. Acceptance of this dictum, apartfrom reinforcing the Shultzian belief in farmers' rationality and
efficiency of resource allocation in traditional agriculture [18] wouldalso serve to put the role of credit in agricultural development in itsproper perspective. An empirical examination of the above hypothesisbristles with conceptual difficulties. The most important concept hereis "stagnant technology". What constitutes new and profitable technology
as opposed to stagnant technology is a matter of definition. For this
purpose it is assumed that prior to the introduction of the High
Yielding Varieties Programme in 1966-67, Indian agriculture was4characterised by stagnant technology. If credit is not a significantly
important variable in such a situation, then the cultivators debt should
This delineation in time may be objected to on the grounds that technology was not really stagnant in the pre HYVP era. Although there is some substance in the objection, there is little doubt that significant changes in technology were the direct result of the introduction of the HYVP.

17.
remain almost unchanged during the period and any increase in the debt
should be largely explained by other factors such as an increase in
loans for consumption.^
Data from the All India Rural Credit Survey 1951-52 [23]
and the All India Rural Debt and Investment Survey 1962-62 [58] shows
that the outstanding debt per cultivator increased from Rs 364 in
1951-2 to Rs 473 in 1961-2 i.e. a growth rate of 3% per annum or 30%
over the decade. This increase may merely reflect inflation, so for
purposes of comparison, the figures for 1961-2 have to be deflated for
the price increase. According to the Consumer Prices (General Index)
[20] there was an increase of 20% in prices during the decade. Therefore, out of the 30% increase in the debt per cultivator between 1951 and 1961, 20% can be expalined by inflation.
A purpose-wise analysis of borrowing for the two surveys discloses that household and non-farm expenses accounted for 57.9% of the total borrowings of cultivators in 1951-52, but that this increased to 64.3% in 1961-62, i.e. by 6%. Therefore about 6% of the increase in
the debt per cultivator is explained by the increased loans for
consumption. A likely reason for the growing indebtedness for meeting
consumption needs can be ascribed to higher expectations brought about
by the increasing monetisation of the rural economy as a result of and
in turn leading to opening up of the rural area. Thus 26% of the 30%
It could be argued that with the increase in rural population the size of holdings would decrease leading to a reduction in the marketed surplus and hence a greater requirement of both consumption and production credit. However, it is well known that the land frontier in India was reached only in the 1960s and the average size of holdings did not alter appreciably. Therefore this limitation is not applicable.

18.
increase in the debt per cultivator can be attributed to inflation and
an increase in consumption loans. The balance 4% increase was
probably due to a host of other factors including an increase in the
total cropped area. Perhaps a small component of the balance was due
to an increase in production credit reflecting minor changes in production
techniques over the period. Therefore the hypothesis that the requirement
for production credit is likely to remain constant in a technologically
stagnant period would appear to be valid within the limitations imposed
by the definition of such a period.
This conclusion is reinforced by an analysis of the increasein rural indebtedness between 1951-2 and 1971-2. Total rural indebtedness
in 1971-2 was Rs 39210 millions which was an increase of 423% over0
1951 [21]. During the same period, population increased by 52%, there
was an 120% increase in prices due to inflation as measured by the Consumer Prices (General Index), and total cropped area increased by 26% [20] making a total of 198% increase attributable to increases in
population, prices and area. A substantial proportion of the balance of
225% increase in rural indebtedness can no doubt be attributed to significant changes in production technology ushered in by the HYVP introduced in the mid 1960s. This is supported by studies which show
that the costs of cultivation due to the introduction of "modern" inputs
after the mid 1960s have risen steeply [22].
Tables 2.1 and 2.2 show the borrowing per cultivator family
A more accurate indicator would be the increase in the number of cultivators rather than the increase in population. However, since the definition of cultivators underwent a change in the 1971 Census, data relating to the number of cultivators are not comparable.

19.
and details of borrowing according to purpose.
TABLE 2.1
BORROWING PER CULTIVATOR FAMILY
Year Borrowing per Family (Rs)1951-2 2091961-2 2051970-1 376
Sources: RBI: All India Rural Credit Survey (AIRCS) 1951-2 (23)RBI: All India Rural Debt and Investment Survey (AIRDIS) 1961-2 (5ENational Council of Applied Economic Research (NCAER): CreditRequirements for Agriculture. (42)
TABLE 2.2
ANALYSIS OF CULTIVATOR BORROWING BY PURPOSE
Purpose Per cent of 1951-2
amoun1961-2
borrowed in 1970-1
Capital expenditure on farm 31.5 22.1 29.8Current expenditure on farm 10.6 13.5 22.6Household and non-farm expenses 57.9 64.3 47.6
100.0 100.0 100.0
Source: Same as Table 2.1
It is interesting to observe that the borrowing for capital expenditure
on the farm declined from 31.5% in 1951-2 to 22.2% in 1961-2 despite a relative increase in the borrowing for current expenditure on the farm.
This decline was not only in per centage terms but in absolute terms
It is conceivable that to an extent, which is difficult to quantify, the equality in 1951 and 1961 figures reflect problems associated with supply of credit which underscores the inequality of demand and supply.

20.
as well. In fact it has been noted that "on an average the capital
expenditure on agriculture per cultivating household was Rs 124 in
1961-2 as compared to Rs 181 in 1952-2" [19]. This decline of 46% in
the average investment on the farm as brought out by the figures was in
reality much greater if allowance is made for inflation, which as
indicated earlier, was 20% during the decade. Perhaps the fact that during the decade land reform legislation was put on the Statute books
in most States but very little attempt was made to implement the reforms, provides the answer to this alarming development. The fear of "land to
the tiller" type of slogans dissuaded landlords from making capital
improvments on their land while at the same time since land was not
actually transferred to the tenants or the security of tenure materially enhanced, it prevented the tenants from investing on the farm.
2.2 Supply of Credit:
The channels of agricultural credit in India can broadly be
divided into two - institutional (or formal) and non-institutional (or informal). Chart 1 indicates the various agencies distributing credit. Despite the plethora of institutional agencies, non-formal sources continue to be the most important conduit (Table 2.3). Three facets
of agricultural credit in India deserve comment. Firstly, institutional
sources provide only one-third of the credit requirements. Secondly,
co-operatives continue to be the main institutional source and
thirdly, even though the commercial banks' share of borrowings increased from less than 1% to 2.4%, their overall contribution was still quite
meagre in 1971-2.
Amongst the non-institutional sources, moneylenders (agricultural and professional) constitute the largest source of supply

CHANNELS O
F AGRICULT
URAL
CREDIT
to(D
< Q
U CQiH U
PI o
-P 0 <1>in u
o w-p ^ o ß• H O CQ U O CQin CQ
U 0)•P c
u >,
21.
Large
Sized
Primary
Farmers
Primary
& Central
Multi-Purpose
Agricultural
Service
Coop L
and
Development
Societies
Credit
Societies
Banks

22.
TABLE 2.3
PROPORTION OF AGRICULTURAL BORROWINGS FROM DIFFERENT AGENCIES
Agency (Percentages; 1951-2
all1961-
cultivators)-2 1971-2
Government 3.3 ) 2.6 ) 7.1 )Cooperatives 3.1 j 7.3 15.5 j 18.7 22.0 j 31.5Commercial Banks 0.9 ) 0.6 ) 2.4 )Non-formal sources 92.7 81.3 68.5
Sources: AIRCS 1951-2 (23)AIRDIS 1961-2 (58)RBI: All India Debt and Investment Survey 1971-2
(Table 2.4). A significant point to note here is that between 1951-2 and 1961-2, the share of agricultural moneylenders increased from 25% to 36%.
TABLE 2.4PROPORTION OF BORROWINGS FROM NON-FORMAL SOURCES
Agency (Percentages; all cultivators) 1951-2 1961-2 1971-2
Friends and Relatives 14.2 8.8 13.1Landlords and Others 3.3 14.5 10.5Agricultural Moneylenders 24.9 36.0 23.0Professional Moneylenders 44.8 13.2 13.1Traders and Agents
Commission 5.5 8.8 8.8
92.7 81.3 68.5
Source: Same as Table 2.3
The explanation offered by the All India Rural Credit Review Committee
1969 [19] that "(it) reflects the growing prosperity of the large

23.
cultivators" appears to be inconsistent. Surely if "modem practices"
available at that time were reasonably profitable, the surplus funds
would have been ploughed back into agriculture, unless of course, the
rates of interest charged were exorbitantly high - a factor not borne
out by the Survey of 1961-2. A more plausible explanation for the growing
importance of agriculturist moneylenders would seem to be because
firstly, a number of legal steps were taken to curb the activities of
professional moneylenders. Secondly, agriculturists found it more
profitable to lend investable funds rather than to invest them on
their farms, which apart from reflecting the uncertainties caused by
the apprehension of land reforms, points to what has been hypothesised
earlier, i.e. the requirement for credit especially production credit
is likely to be low in the absence of new profitable technology.
2.2.1 Formal Sources I: Government
Before the role of the Government as a provider of credit is discussed, it would be germane to point out that according to the Indian Constitution, agriculture is a State subject. State Government loans to cultivators began essentially as distress taccavi - which
were loans extended by the Government to mitigate the hardships caused by natural calamities, e.g. famines, floods, fires etc. But gradually
and ostensibly because of the slow development of other institutional
agencies, taccavi loans began to be extended to agriculture also by
all State Governments having variants of the Land Improvement Loans Act of 1883 and the Agriculturists' Loans Act of 1884 on their statute
books.
Generally taccavi loans are much sought after by cultivators

2 4 .
b e c a u s e th e y c a r r y a low r a t e o f i n t e r e s t , do n o t a lw ays have t o be
r e p a i d on t im e , have s im p le r s e c u r i t y r e q u i r e m e n ts th a n o t h e r s o u rc e s
o f i n s t i t u t i o n a l c r e d i t and a r e a v a i l a b l e even to th o s e who a r e n o t
e l i g i b l e f o r i n s t i t u t i o n a l c r e d i t from o t h e r s o u r c e s . I t i s i n t e r e s t i n g
t h a t t a c c a v i lo a n s whose c o n t in u a n c e h a s been v ig o r o u s l y s u p p o r t e d by
v a r i o u s S t a t e G overnm ents a s a t r a n s i t i o n a l c h a n n e l o f c r e d i t
( t r a n s i t i o n a l t i l l such t im e as c o o p e r a t i v e s and o t h e r i n s t i t u t i o n a l
a g e n c i e s a r e b u i l t up) i n f a c t b e a r s no r e l a t i o n to t h e a c t u a l0
d e v e lo p m en t o f o t h e r a g e n c i e s in a S t a t e . For i n s t a n c e , t h e h i g h e s t
p e r c e n ta g e i . e . 8.3% o f t a c c a v i b o r ro w in g s and 20.4% o f o u t s t a n d i n g s o f
Government lo a n s were in M a h a ra s h t r a w here c o o p e r a t i v e and com m erc ia l
bank c r e d i t was r e l a t i v e l y w e l l d e v e lo p e d , w hereas in B ih a r w here t h e s e
i n s t i t u t i o n s have n o t been d e v e lo p e d t o t h e same e x t e n t , Government
l o a n s a c c o u n te d f o r 1% o f t o t a l b o r ro w in g s and 4.4% o f t o t a l o u t s t a n d i n g s .
T h is g i v e s r i s e t o t h e s u s p i c i o n t h a t t h e r a i s o n d ' e t r e o f t h e s e lo a n s
i s n o t w hat i t i s s t a t e d t o be - a s u s p i c i o n w hich t e n d s t o be s t r e n g t h e n e d
by d a t a throw n up by a s tu d y c o n d u c te d by th e N a t io n a l C o u n c i l o f A p p l ie d
Economic R e se a rc h (NCAER) f o r 1970-1 [4 2 ] . A cco rd ing t o t h i s s t u d y ,
t h e h i g h e s t p e r c e n ta g e o f b o r ro w in g s from Government - a t v e ry low r a t e s
o f i n t e r e s t - a s a p e r c e n ta g e o f t o t a l b o r ro w in g s , was n o t by s m a l l
f a rm e r s b u t by fa rm e rs i n t h e m idd le c a t e g o r y (T ab le 2 . 6 ) .
I n t e r e s t i n g l y , even i n 1 9 5 1 -2 , t h e b i g c u l t i v a t o r s b o rrow ed n e a r l y
f o u r t im e s th e amount b o rrow ed by th e medium c u l t i v a t o r s and r o u g h ly t e n
t im e s t h a t o f t h e s m a l l from Government [2 3 ] . I t i s t h e r e f o r e d i f f i c u l t
t o d i s p u t e t h e v iew o f t h e A l l I n d i a R u ra l C r e d i t Survey Committee 1951-2
In a s e n s e , t h e b u lk o f a l l i n s t i t u t i o n a l c r e d i t comes from Government ( S t a t e and C e n t r a l ) . However, w h i le funds f o r t a c c a v i a r e e n t i r e l y from Government r e s o u r c e s , a p a r t o f t h e funds o f c o o p e r a t i v e and com m erc ia l ban k s a r e from p u b l i c d e p o s i t s .

25
that taccavi was "... little else than the ill-performed disbursement
of inadequate moneys by an ill-suited agency".
TABLE 2.5
LOANS AND OUTSTANDINGS BY CULTIVATORS FROM GOVERNMENT IN 1961-2
Cash loans borrowed from Cash loans outstanding Government as a percent- from Government as a
State age of total loans percentage of totalborrowed in 1961-2 outstandings as on
30.6.62
1. Andhra Pradesh 0.5 1.82. Assam 4.5 10.13. Bihar 1.0 4.44. Gujrat 1.1 3.95. Jammu & Kashmir - 0.36. Kerala 1.1 4.67. Madhya Pradesh 1.2 4.58. Madras 2.7 3.19. Maharashtra 8.3 20.410. Mysone 6.2 4.611. Orissa 4.2 12.212. Punjab 2.1 3.813. Rajasthan - 0.8 2.914. Uttar Pradesh 2.6 3.315. West Bengal 2.1 16.4
All India 2.6 5.5
Source: AIRDIS 1961-2 (58)

26.
TABLE 2.6
BORROWINGS FROM GOVERNMENT AS A PERCENTAGE OF TOTAL BORROWINGS OF VARIOUS SIZE GROUPS OF CULTIVATORS IN 1970-71
Size (in hectares) Borrowing from Government as a Percentage of total borrowing
0-2 3.22-4 5.34-6 4.16 and above 2.4All holdings 3.6
Source: NCAER (42)
2.2.2 Formal Sources II: Cooperatives
(a) Societies
The cooperative credit arrangements in India which date back to the Acts of 1904 were a synthesis of the ideas of the Rochdale Pioneers and the principles embodied in the Raiffeisen societies. The principles of open membership, one-man-one vote were derived from the former, while the concept of unlimited liability can be traced to the latter. Cooperation in India was based on official initiative with the
underlying hope that cooperatives established under official initiative
would soon begin to act as voluntary organisations. It was therefore
"not so much a movement as a governmental policy" [24]. The emphasis
in cooperation in the earlier phases was on credit (and continues to
be so even today) primarily to curb the economic and socially undesirable
repercussions of the activities of moneylenders and additionally to
instigate the process of agricultural development by mobilising the
financial surpluses especially of the larger farmers in the rural

27 .
sector and ensuring its investment in the same sector.
The primary agricultural credit societies (PACS) essentially
advance short and medium term loans. Table 2.7 gives a summary of the
progress of activitiesof PACS. By 1973-74, there were 154,000 PACS
'covering' about 95% of the villages in the country. Interestingly,
and for obvious reasons, the Raiffeisen principle of unlimited liability
has increasingly made way for limited liability of the societies. In
1951-2 the ratio of limited liabiility to unlimited liability societies
was 4:10, while in 1973-74 the ratio had changed to 35:10. The number
of dormant societies has been decreasing over time due to revitalisation
measures taken up in the mid 1960s. However, a continuing depressing
feature has been the large incidence of overdues. The percentage of
overdues to outstandings has been rising since 1961-2.
Certain aspects of credit from PACS merit attention. First,while the total loans issued between 1970-1 and 1973-4 increased by32%, the proportion of borrowing members to cultivator householdsincreased by only 1% which indicates that loans have largely gone to thesame members every year. In this context, while Lipton's [5] assertionthat almost every villager "repays" yearly and borrows again a day later,
may be an exaggerated account, it does give rise to the reasonable
suspicion that a large volume of these "borrowings" are in reality book
adjustments. Second, loans issued are heavily skewed in favour of
short term (ST) credit. The proportion of ST loans to total loans9issued has been around 90%. Third, out of 1.54 lakh societies in
1973-4, only about 60,000 societies (40%) had paid secretaries to manage
9 A lakh is the equivalent of 100,000.

28.
TABLE 2.7
PROGRESS OF PRIMARY AGRICULTURAL CREDIT SOCIETIES
1951-52 1961-62 1970-71 1973-74
1. No. of societies (lakhs) 1.08 2.12 1.6 1.542. No. of villages covered (lakhs) - 4.23 5.35 5.453. Membership (lakhs) 48 170 310 3504. No. of dormant socieites (000s) - 41 20 185. % of borrowing members to
cultivator households17.8 36 37
6. Total share capital (Rs crores) 9 58 - -7. Govt, contribution to share cap. - 6 - -8. Owned funds (Rs crores) 18 76 - -9. Deposits (Rs crores) 4 15 69 8910. Short terms loans issued (Rs crores) - 183 519 69011. MT loans issued (Rs crores) - 20 58 7112. Total loans issued (Rs crores) 24 203 577 76013. Loans outstanding (Rs crores) 34 219 784 80614. Overdues (Rs crores) 9 44 322 44315. % of overdues to outstandings 25.3 20.3 41.0 4216. Av. share cap. per member (Rs) 19 34 66 7817. Av. Deposit/member (Rs) 9 9 22 2618. Av. loans advanced per member 51 119 514 58319. Av. membership per society 44 80 193 22720. Av. share cap. per society (Rs 000) 0.8 3 13 1721. Av. deposit/society (Rs 000) 0.4 0.7 4 5.822. Av. loans advanced per society
(Rs 000)2 10
Sources: RBI: All india Rural Credit ReviewRBI: Statistical Statement Relating
Committee to Coop
(AIRCRC) Movement
1969 (19) in India (40
their affairs. Fourth, out of Rs 322 crores overdue in 1970-71, 15% was
overdue for more than 3 years and about 50% was overdue for less than one
10 A crore represents 10 million.

29 .
one year. Fifth, in addition to supplying agricultural credit, the
PACS also undertook other activities such as sale of farm requisities and
consumer goods (Table 2.8) It is noteworthy that the proportion of its
TABLE 2.8
OTHER ACTIVITIES OF PRIMARY AGRICULTURAL SOCIETIES (Rs in crones)
Activities 1970-1 1973-4
Value of farm requisities supplied 128.6 224.1Consumer goods distributed 93 183.3Agricultural produce marketed 13.5 19.9
TOTAL 235.1 427.3
Source: Statistical Statements relating to Coop Movement in India. (40)
other activities to loan activities increased from 41% in 1970-1 to
57% in 1973-4. Sixth, a classification of loans according to size
issued by PACS (computed from Table 2.9) discloses that loans to small
TABLE 2.9
CLASSIFICATION OF LOANS BY PACS ACCORDING TO SIZE OF HOLDINGS(Rs in crones)
Size 1970-1 1973-4 Percentage increase
Up to 1 hectare 58.37 61.94 61-2 hectares 90.11 124.32 382-4 hectares 138.53 176.07 274-8 hectares 137.11 146.47 7Above 8 hectares 106.97 91.38 -15Tenants 18.98 20.60 8Agric. labourers 5.56 7.64 37Others 1.37 2.99 118Total 577.88 761.67 32
Source: Statistical Statements relating to Coop Movement in India. (40)

30.
farmers (less than 2 hectares) were 26% of total loans in 1970-1
but declined to 24% in 1973-4 even though total loans advanced
increased by 32% between 1970-1 and 1973-4.
Tables 2.10 and 2.11 give the short and medium term loans
classified by purpose. Seasonal agricultural operations accounted for
the bulk (over 90%) of the short term loans while the purchase of
pump sets and cattle were the two most material items under medium
loans. Gross cropped area for the entire country was 161.5 million
hectares while total loans issued by the PACS were Rs 7600 million in
1973-4 which gives an average per hectare credit availability of a
mere Rs 47.
TABLE 2.10
SHORT TERM LOANS BY PURPOSE ISSUED BY PACS (Rs in crones)
Purpose 1970-1 1973-74
1. Seasonal agricultural operations 469.68 643.51(90%) (93%)
2. Purchase of agricultural implements 5.43 2.55(1%) (0%)
3. Marketing of crops 17.28 15.11(3%) (2%)
4. Processing of agricultural produce 6.80 1.92(1%) (0%)
5. Industrial purposes 0.3 0.4(0.6%) (0%)
6. Consumption loans 5.24 5.67(1%) (0.8%)
7. Other purposes 14.58 21.38(3%) (3%)
8. Total 519.31 690.52
Figures in brackets are percentage to total.Source: Statistical Statements relating to Coop Movement in India.(40)

31.
TABLE 2.11
MEDIUM TEEM LOANS BY PURPOSE ISSUED BY PACS (Rs in crones)
Purpose 1970-1 1973-4
1. Sinking of or repair to wells 7.96 6.87(14%) (10%)
2. Purchase of machinery (pump sets) 9.10 10.43(16%) (15%)
3. Purchase of cattle 8.44 9.99(14%) (14%)
4. Minor improvements to land 4.86 5.69(8%) (8%)
5. Other agricultural purposes 20.61 22.47(35%) (32%)
6. Other purposes 7.56 15.68(13%) (22%)
7. Total 58.54 71.15
Figures in brackets are percentages to total.Source: Statistical Statements relating to Coop Movement in India.(40)
(b) Land Development Banks
Land Development Banks (LDBs) supply the long term credit
requirements (occasionally, also the medium term) of the agricultural
sector. While a uniform pattern of organisation does not exist for
the entire country, most States have a Central LDB at the State level and
primary LDBs at the district or taluka levels. In some States a unitary
structure prevails with a Central LDB at the State level and its
branches operating at district and lower levels. Initially, the bulk
of the loans issued by LDBs were for discharge of prior debts and
redemption of mortgages [23] (in fact the banks were called land mortgage
banks in the earlier days). Table 2.12 indicates the performance of Land
Development Banks over time - it is only after the 1960s that the volume
of lending increased substantially.

32.
TABLE 2.12
PROGRESS OF LAND DEVELOPMENT BANKS
1950-1 1960-1 1970-1 1973-4
1. No. of banks(a) Central 5 18 19 19(b) Primary 286 463 865 857
2. Loans advanced during the year to individuals (Rs crones)
1.38 11.62 170.36 158.09
3. Loans outstanding with individuals
6.59 37.74 786.51 828.25
Source: Indian Agriculture in Brief (15th edition) (20)
2.2.3 Formal Sources III: Commercial Banks
Reference was made above (Table 2.3) that prior to the seventies, the proportion of agricultural credit distributed by commercial banks to total credit was less than 1%. However since 1969 (after the nationalisation of 14 major commercial banks) efforts have been made to expand commercial bank credit to agriculture. Noticeable amongst these efforts has been the expansion in numbers of branches
of these banks (Table 2.13). Impressive as this may seem, certain negative features invite attention. First, after the initial euphoria of nationalisation, the pace of branch expansion declined
considerably. This is highlighted by a comparison between 1969 and
1973 on the one hand and between 1973 and 1978 on the other. This
contrast is further sharpened if from the June 1978 figures, 1,277
branches of the Regional Rural Banks (started in October 1975) and
1,500 branches of the non-nationalised branches are excluded. Second,
an analysis of the timing of opening of new branches is very intriguing
(Table 2.14). The frantic expansion in the last quarter of every year

33.
TABLE 2.13
BRANCH EXPANSION OF COMMERCIAL BANKS
Centre June 1969 June 1972 June '1978
11Rural 1832 (22.4) 5561 (36.2) 11802 (42.112Semi Urban 3322 (40.1) 4723 (30.8) 7586 (27.1
Urban and ^Metropolitan
3108 (37.5) 5078 (33.0) 8628 (30.8
Total 8262 (100) 15362 (100) 28016 (100)
Figures in brackets are percentages to total. Source: RBI: Annual Reports. (25)
TABLE 2.14
QUARTERLY EXPANSION OF BANK BRANCHES
CalendarYear
Increase during quarter ending March June September December
Total Annual Increases
1970 335 775 388 665 21651971 357 472 313 659 18011972 324 311 409 710 17541973 285 338 409 732 17641974 197 2 36 397 847 16771975 203 347 501 1223 22741976 244 522 792 1643 32011977 420 727 ‘ 856 1338 3341
Source: RBI: Annual Reports.(25)
would seem to suggest that banks have adopted a branch expansion policy
as an end in itself more as a "target-chasing-window-dressing" manoeuvre
^ Rural centres are those with a population of less than 10,000.12 Semi-urban centres are those with a population between 10,000 and
100,000.
Those with a population of over 100,000.13

34.
to present a "rosy picture of branch expansion in their year-end
annual account" [25] rather than as a means of increasing their
activities in the rural sector. Third, combining rural and semi-
urban branches (Table 2.13) shows that their growth was from 62.5%
of total number of branches in 1969 to 69.2% in 1978 which is not a
particularly impressive rate of growth and indicates that rural branches
have grown at the cost of semi-urban branches. Fourth, an analysis of
direct institutional finance to agriculture for the year ending June 1977
reveals that the short term to long term lending ratio which was 2.38
for all institutional credit taken together, was only 1.26 for
commercial bank credit. This points to the preference of commercial
banks for term loans e.g. tractor loans. Fifth, as with loans from cooperatives, there is a bias in commercial bank lending in favour of larger farmers, especially with term loans (Table 2.15).
TABLE 2.15
DISTRIBUTION OF COMMERCIAL BANK AGRICULTURAL LENDING ACCORDING TO HOLDING SIZE(In percentages:
k1975-76)
Type of Loan Total Up to 2.5 acres
2.5 to 5 acres
5 to 10 acres
10 acres and above
Short term 100 32.4 21.8 19.7 26.1Term 100 11.8 11.7 14.7 61.8
Source: RBI Annual Reports (25)
2.3 Credit Gap:
Thus far consideration has been given to the supply and
requirements of credit for agriculture. It is difficult to
establish whether the supply has been adequate to meet the requirements

3 5 .
p r i m a r i l y b e c a u s e o f t h e in s u r m o u n ta b le d i f f i c u l t y o f e s t i m a t i n g th e
demand f o r c r e d i t . Demand i s e s s e n t i a l l y a f u n c t i o n o f t h e p r i c e
( c o s t o f c r e d i t ) and t h e r e t u r n ( th e m a r g in a l e f f i c i e n c y o f c a p i t a l )
b o th o f w hich a r e d i f f i c u l t t o d e te r m in e and q u a n t i f y e s p e c i a l l y
when consum ption c r e d i t i s i n c l u d e d i n t h e a n a l y s i s . The m a r g in a l
e f f i c i e n c y o f c a p i t a l demanded by im p o v e r is h e d fa rm e r s a t a lm o s t any
p r i c e t o keep body and s o u l t o g e t h e r i s n o t am enable t o d i r e c t o r
s im p le c o m p u ta t io n . B ut t h e f a c t t h a t a l a r g e p e r c e n ta g e o f t h e
o v e r a l l c r e d i t s u p p ly i s from n o n - fo rm a l s o u r c e s a t h ig h p r i c e s ,
i s s u g g e s t i v e o f t h e c o n c lu s io n t h a t o v e r a l l r e q u i r e m e n ts a t a
r e a s o n a b le p r i c e a r e i n e x c e s s o f s u p p ly .
I f t h e r e q u i r e m e n t o f c r e d i t f o r m ee t in g consum ption n eed s
i s e x c lu d e d , t h e n i t i s c o m p a r a t iv e ly e a s y t o a s s e s s t h e o v e r a l l
p r o d u c t i o n c r e d i t r e q u i r e m e n t . The A l l I n d i a R u ra l C r e d i t Review
Com m ittee 1969 had e s t i m a t e d Rs 2000 c r o r e s as t h e s h o r t te rm c r e d i t
r e q u i r e m e n t f o r 1973 -74 , Rs 300 c r o r e s a s t h e medium te rm r e q u i r e m e n t
f o r e a ch y e a r o v e r t h e p e r i o d 1969-70 t o 1973-74 and Rs 100 c r o r e s as
t h e a n n u a l lo n g te rm r e q u i r e m e n t o v e r t h e same p e r i o d . A g a in s t t h i s ,w
t h e s u p p ly o f s h o r t te rm c r e d i t by c o o p e r a t i v e s i n 1973-74 was
Rs 690 c r o r e s and even i f t h e b o r ro w in g s from com m erc ia l banks and
Government ( t a c c a v i ) i s i n c l u d e d , t h e s u p p ly would s t i l l be l e s s th a n
50% o f t h e p r o j e c t e d r e q u i r e m e n t s . F o r te rm lo a n s (medium and long)
t h e s u p p ly was Rs 71 c r o r e s by p r im a ry c o o p e r a t i v e s o c i e t i e s , Rs 158
c r o r e s by l a n d d e v e lo p m en t ban k s and Rs 60 c r o r e s by com m erc ia l banks
making a t o t a l o f Rs 289 c r o r e s i . e . a s h o r t f a l l o f 28%. Thus t h e c r e d i t
gap f o r p r o d u c t i o n c r e d i t was t h e w i d e s t f o r s h o r t te rm c r e d i t .

3 6 .
CHAPTER 3
THE PRICE OF CREDIT
3 .1 Are A g r i c u l t u r a l I n t e r e s t R a te s High?
C o n s id e r a b l e c o n t r o v e r s y s u r r o u n d s th e i n t e r e s t r a t e s o f
l o a n s i n t h e a g r i c u l t u r a l s e c t o r . Some a c c e p t i n t e r e s t r a t e s a s h ig h
and have s o u g h t t o f i n d e x p l a n a t i o n s f o r them [51] w h i le o t h e r s [45] have
t a k e n th e v iew t h a t i n t e r e s t r a t e s a r e much l e s s e x t o r t i o n a t e th a n w hat
i s a c c e p te d by th e fo rm e r . A g a in , low i n t e r e s t r a t e s f o r a g r i c u l t u r a l
lo a n s a r e w id e ly c i t e d a s an i m p o r ta n t r e a s o n f o r t h e low volume o f
l e n d i n g to a g r i c u l t u r e i n g e n e r a l and s m a l l f a rm e rs in p a r t i c u l a r [4 7 ] .
The te rm s low o r h ig h a r e d i f f i c u l t t o d e f i n e and d i s c u s s i o n
f r e q u e n t l y becomes a m a t t e r o f v a lu e ju d g em e n t. The l i t e r a t u r e on th e
s u b j e c t i s l i b e r a l l y p e p p e re d w i th t h e w ords ' l o w ' , ' h i g h ' ' a p p r o p r i a t e '
e t c . , b u t few a t t e m p t s have been made t o u n r a v e l t h e G ord ion k n o t and
a r r i v e a t any s p e c i f i c r a t e o r ran g e o f r a t e s . A cco rd in g t o t h e W orld
Bank [63] one benchm ark f o r m e a su r in g th e a p p r o p r i a t e n e s s o f r a t e s i s
t h e p r i c e t h a t a Development F in a n ce Company would have t o pay t o
m o b i l i s e funds " p lu s a r e a s o n a b le s p r e a d " . T h i s , a s p o i n t e d o u t byw
t h e Bank i t s e l f , can be a s c e r t a i n e d o n ly when f i n a n c i a l m a rk e ts a r e
c o m p e t i t i v e and w e l l d e v e lo p e d - c o n s i d e r a t i o n s w hich do n o t g e n e r a l l y
h o ld f o r d e v e lo p in g c o u n t r i e s where f r a g m e n t a t i o n o f f i n a n c i a l m a rk e ts
i s t h e r u l e r a t h e r th a n th e e x c e p t io n [7 5 ] .
In I n d i a u rb an f i n a n c i a l m a rk e ts a r e r e a s o n a b ly w e l l d e v e lo p e d
oweing t o t h e i n d u s t r i a l s e c t o r ' s g ro w th . One means o f j u d g in g
a g r i c u l t u r a l i n t e r e s t r a t e s i s t h e r e f o r e t o compare them w i th th o s e
o f f e r e d t o i n d u s t r y and commerce. The r e l e n d i n g r a t e s o f t h e two
D evelopm ent F in a n ce Companies in I n d i a - t h e ICICI ( I n d u s t r i a l C r e d i t
and In v e s tm e n t C o r p o r a t io n o f In d ia ) and t h e IDBI ( I n d u s t r i a l D evelopm ent

37.
Bank of India) in 1974 for medium and long term loans varied between
8.5 to 12% with a simple average of 10.25%. At the same time, the
weighted average of the interest rates on commercial bank credit
provided as direct finance to agriculture were at a higher rate of
10.8% [64]. Even if allowance is made for the fact that commercial
banks accounted for only 18% of the institutional credit to agriculture,
the bulk of institutional credit coming from cooperatives which carry
a slightly lower rate, (about 0.5% less) the overall average rate for
industry and agriculture works out to be at approximately the same level.
Thus if it can be assumed that the interest rates in industry reflect the true scarcity of capital, then the institutional rates in agriculture
cannot be said to be low by comparison. However, non-institutional credit
at substantially higher rates account for over 60% of the agricultural
loans, so it could be argued that the rates in agriculture are higherand that a case for lower rates could be made out.
3.2 Theory of Agricultural Interest RatesTheoretically, the rate of interest charged on agricultural
loans reflects (a) the lenders' opportunity costs, (b) the administrativecost of delivery and collection, (c) the risk premium arising from lossesfrom loan defaults, (d) the inflationary premium which is the exposure
to loss in the real loan portfolio value as a result of inflation and(e) monopoly profit if the lender functions in a monopolistic market.
The interest rate can therefore be represented by the functional
relationship:I = f(0, A, S, P, M) _ (i)
where I = rate of interest
0 = lenders opportunity costs

38.
A = administrative costs
S = risk premium
P = inflationary premium
M = monolopy profit
3-2.1 Opportunity and Administrative Costs;
The opportunity cost of money from the lender's viewpoint is
the "pure" rate of interest [52] and it may be taken to be the rate of
return on gilt edged bonds, or more simply the Bank Rate. The
administrative costs depend on a number of factors such as the amount and period of the loan, staffing pattern etc. It can be reduced if
(i) loans cover larger amounts, (ii) loans are for extended periods,
(iii) lending is to groups of borrowers who then distribute the loans amongst themselves^ (iv) efforts are made to implement the simple but not always favoured method of effective cost-return analysis in personnel management.
3.2.2 Risk Premium:V
The risk premium is applied to take account of the fact that a proportion of loans are not repaid. Following Bhaduri [51] if
r = the rate of interest to be charged
and q = the proportion of loans the lender expects will be defaulted, and assuming that this expectation is realised and
that defaulting is less than 100%,Yi = r (1 - q)
where Yi is the interest income accruing to the lender per unit of loan
This in fact was one of the theoretical justifications given for the introduction of cooperative credit.

3 9 .
a d v a n ce d .
B ut h i s o v e r a l l income (Y) from le n d in g p e r u n i t o f lo a n
t r a n s a c t i o n w i l l be i n t e r e s t income (Yi) minus th e c a p i t a l l o s s q , i . e .
Y = Yi - q
= r (1-q) - q
o r r = (Y + q)(1 - q)
I f f o r e x am p le , th e o p p o r t u n i t y c o s t o f c a p i t a l i s 10% and i t i s assum ed
t o be e q u a l t o Y, i . e . Y = o . lO and t h e d e f a u l t r a t e i s 25% i . e . q = 0 .2 5 ,
t h e n th e r a t e o f i n t e r e s t to be c h a rg e d t o com pensa te f o r t h e r i s k o f
d e f a u l t w i l l b e :
( .1 0 + .25)r = --------------------1 - .25
= 46.7%
B ut t h i s does n o t mean t h a t t h e income a c c r u in g t o t h e l e n d e r i s 46.7% o f
t h e p r i n c i p a l a d v a n ce d . Even though t h e r a t e o f i n t e r e s t c h a rg e d i s
46.7%, h i s income (Y) p e r u n i t o f t h e lo a n i s l i m i t e d t o 10% - th e
b a la n c e 36.7% i s t h e r i s k premium and m e re ly c o v e rs t h e l o s s o f p r i n c i p a l
due t o d e f a u l t .
A l t e r n a t i v e l y ,
c _ q (Q + o)1 - q
where S = r i s k premium
q = d e f a u l t r a t e
Q = p r i n c i p a l
and C = o p p o r t u n i t y c o s t s
U sing th e same f i g u r e s in t h e e a r l i e r exam ple and a ssum ing p r i n c i p a l to
be 100,
25 (100 + 10)S ” 75
36.7%
40.
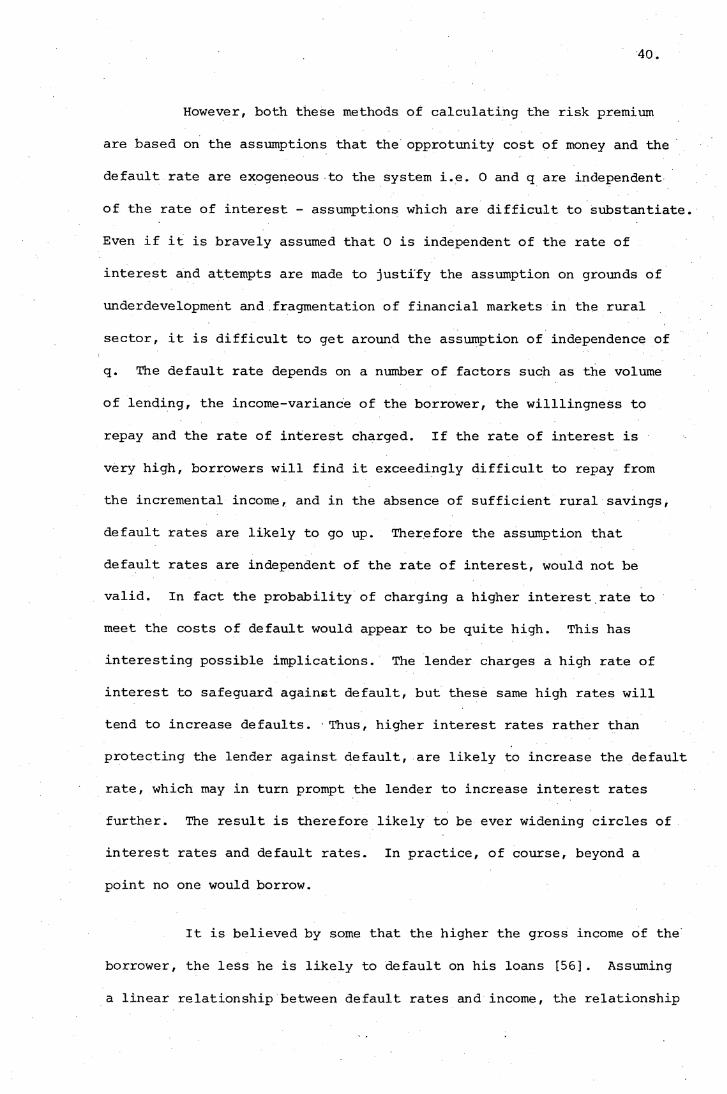
However, both these methods of calculating the risk premium
are based on the assumptions that the opprotunity cost of money and the
default rate are exogeneous to the system i.e. 0 and q are independent
of the rate of interest - assumptions which are difficult to substantiate.
Even if it is bravely assumed that 0 is independent of the rate of
interest and attempts are made to justify the assumption on grounds of
underdevelopment and fragmentation of financial markets in the rural
sector, it is difficult to get around the assumption of independence of
q. The default rate depends on a number of factors such as the volume
of lending, the income-variance of the borrower, the willlingness to
repay and the rate of interest charged. If the rate of interest is
very high, borrowers will find it exceedingly difficult to repay from
the incremental income, and in the absence of sufficient rural savings,
default rates are likely to go up. Therefore the assumption that
default rates are independent of the rate of interest, would not be valid. In fact the probability of charging a higher interest rate to meet the costs of default would appear to be quite high. This has interesting possible implications. The lender charges a high rate of
interest to safeguard against default, but these same high rates will tend to increase defaults. Thus, higher interest rates rather than
protecting the lender against default, are likely to increase the default
rate, which may in turn prompt the lender to increase interest rates further. The result is therefore likely to be ever widening circles of interest rates and default rates. In practice, of course, beyond a point no one would borrow.
It is believed by some that the higher the gross income of the
borrower, the less he is likely to default on his loans [56]. Assuming
a linear relationship between default rates and income, the relationship

41.
can be diagrammatically represented as follows:
Figure 1
Per CentageRepayment
Gross Income (Y)
If OA is the minimum subsistence level of income, then for income less
than OA, there will be no repayments. (However, as argued later,
empirical evidence does not bear out this neat functional relationship).
But it may be argued that the rate of interest is inversely
related to the rate of repayment - other factors being constant, the
better the repayment record of a borrower or class of borrowers, the
lower will be the risk premium, and therefore lower the rate of
interest. Diagrammatically,
Repayment(R)
Figure 2
Interest (I)
The curve can be expected to be asymmetric to the two axes as, on the
one hand, no matter how good the record of repayment, the rate of
interest cannot be zero, and on the other hand, the interest rate would

4 2 .
be i n d e t e r m i n a t e a t z e ro o r n e a r z e ro l e v e l s o f repaym en t s in c e l e n d e r s
a r e u n l i k e l y t o l e n d i f repaym en t i s z e r o .
Combining th e f u n c t i o n a l r e l a t i o n s h i p s d e p i c t e d i n F ig u r e s 2
and 3, i . e .
R = f (Y) (2)
and I = f (R) (3)
I = f" (Y) (4)
l e a d s t o t h e c o n c lu s io n t h a t i n t e r e s t i s a f u n c t i o n o f t h e g r o s s income
o f t h e b o r ro w e r . I t may be i n d i c a t e d t h a t i t i s a n a l y s i s o f t h i s n a t u r e ,
t o g e t h e r w i th o t h e r a rg u m e n ts , t h a t a r e o f t e n employed t o j u s t i f y h i g h e r
i n t e r e s t r a t e s f o r s m a l l fa rm e r l e n d i n g . B u t t h e f la w i n t h e a n a l y s i s
i s t h a t e m p i r i c a l e v id e n c e from a number o f d e v e lo p in g c o u n t r i e s does
n o t s u p p o r t f u n c t i o n a l r e l a t i o n s h i p ( 2 ) .
3 . 2 . 3 I n f l a t i o n a r y Premium :
I n f l a t i o n a r y premium i s d e s ig n e d t o p r o t e c t t h e r e a l v a lu e
o f t h e l e n d e r s funds from l o s s e s due t o i n f l a t i o n . T h e o r e t i c a l l y , i f
Q i s t h e amount l e n t f o r n y e a r s , and
R t h e n e t y e a r l y re p a y m e n t , and
i t h e r a t e o f d i s c o u n t (= o p p o r t u n i t y c o s t o f c a p i t a l )
th e n th e p r e s e n t v a lu e o f repaym en ts r e c e i v e d o v e r n y e a r s i s
I _J*__(1 + i ) n
T h is m e re ly e ch o es t h e f a c t t h a t th e f u t u r e i s d i s c o u n t e d i . e . a Rupee
r e c e i v e d a y e a r from now i s w o r th l e s s th a n a Rupee to d a y . I t does n o t
a c c o u n t f o r i n f l a t i o n .
Assuming a c o n s t a n t r a t e o f i n f l a t i o n o f x% p e r annum, th e n
th e p r e s e n t v a lu e o f repaym en ts i s

4 3 .
(1 + i ) n ( l + x ) n [ (1 + i ) (1 + x ) ] n
T h e r e f o r e t h e o v e r a l l r a t e o f d i s c o u n t from t h e l e n d e r s ' p o i n t o f v iew
i s th e r a t e o f i n f l a t i o n m u l t i p l i e d by t h e o p p o r t u n i t y c o s t o f c a p i t a l .
F o r ex am p le , i f i = 10% and x = 5% th en t h e r a t e o f d i s c o u n t i s
(1 .1 0 ) (1 .0 5 ) - 1 = 15.5%. The money o r t h e nom ina l r a t e o f i n t e r e s t
minus t h e i n f l a t i o n a r y premium i s e q u a l t o t h e ' r e a l ' r a t e o f i n t e r e s t .
3 . 2 . 4 Monopoly P r o f i t
An e x p l a n a t i o n o f t h e u s u r i o u s r a t e s o f i n t e r e s t c h a rg e d in
t h e r u r a l s e c t o r i s b a s e d on th e f r a g m e n ta t io n o f th e r u r a l f i n a n c i a l
m a rk e ts and th e r e s u l t a n t monopoly power o f t h e l e n d e r [5 1 ] . As
c o l l a t e r a l such as s t a n d i n g c r o p s , p ro m ise o f f u t u r e l a b o u r e t c . a r e
n o t a c c e p t e d i n t h e o r g a n i s e d money m a r k e t , t h e i n d i g e n t f a rm e rs a r e
f o r c e d t o s e ek c r e d i t in t h e u n o r g a n i s e d s e c t o r . B h a d u r i [51] a rg u e s
t h a t i t i s t h i s l a c k o f a l t e r n a t i v e s from th e b o r r o w e r ' s v i e w p o in t ,
w hich e n a b le s th e l e n d e r t o u n d e rv a lu e t h e c o l l a t e r a l o f f e r e d t o t h e
p o i n t where t h e v a lu e o f t h e c o l l a t e r a l t r a n s f e r r e d e x c ee d s th e v a lu eV
o f t h e lo a n so t h a t t h e r i s k o f d e f a u l t i s p a s s e d e n t i r e l y on t o th e
b o r ro w e r . As a f u r t h e r s a f e g u a r d , i t i s a rg u e d , t h e l e n d e r t e n d s t o
i n c r e a s e t h e i n t e r e s t r a t e s t o a l e v e l where t h e repaym en t e x c ee d s t h e
v a lu e o f c o l l a t e r a l t r a n s f e r r e d .
At t h i s ' e x t o r t i o n a t e ' r a t e t h e b o r ro w e r would c o n s id e r
rep a y m en t r a t i o n a l o n ly i f h i s v a l u a t i o n o f t h e c o l l a t e r a l i s h i g h e r
th a n th e v a l u a t i o n p l a c e d on i t by t h e l e n d e r - he may c o n s id e r i t 'w i s e '
t o d e f a u l t i f t h e b u rd e n o f repaym en t p l u s i n t e r e s t ex c ee d s h i s p e r s o n a l
v a l u a t i o n o f th e c o l l a t e r a l . T h e r e f o r e , c o n c lu d e s B h a d u r i , t h e r u r a l

44.
moneylender uses interest rates to accumulate assets "through the
transfer of undervalued collateral deliberately brought about by large scale default".
The above analysis is based on monopolistic imperfections on the supply side coupled with a highly interest-inelastic demand for
credit. While one would not like to dismiss the monopolistic powers
of rural lenders in India (especially in the remote tribal areas) it
is equally true that with the advent bf higher agricultural productivity,
the monopolistic power of lenders has been considerably reduced.
Moreover, the assumption that lenders are anxious for borrowers to
default so as to transfer assets (land) is no longer valid because of land ceiling regulations.
By contrast, it is interesting that Long's [53] analysis shows that in India in 1951-2, the monopoly power of lenders in the agricultural loan market was not very great and high rural interest rates were due primarily on account of capital scarcity, costly administration of farm loans, greater risk of loss through default and the seasonality in the
demand for credit. A more decent survey [54] of 77 villages in the eastern State of West Bengal, found that although production loans and advances were increasingly given by landlords, two-thirds of these advances were interest free. This would tend to refute the view that
landowners give loans primarily by way of usury and not because of their
interest in increasing production [55] . Moreover, this survey also disclosed that about two-thirds of the tenants obtained consumption loans from landlords and about one-third of these did not involve interest
payments. However, it would be tenable to accept the view, that the
closer the farmer is to minimum subsistence levels of living the higher

45.
the interest rate is likely to be, 157] for loans demanded in such a
situation would be essentially for consumption and are highly interest-
inelastic.
3• 3 Examination of Factors which Influence Determination of Interest Rates;
Opportunity and Administrative Costs
It has been postulated above that I = f(0, A, S, P, M) . An
attempt is made to examine this relationship with reference to data
from the various Indian States.. Taking opportunity costs to represent
the Bank Rate and since the Bank Rate is the same for all States, it
can be assumed that the opportunity costs do not vary from State to
State. Similarly, it can also be assumed that the administrative costs
are the same in all the States as the structure and organisation of instutitonal credit do not vary and the forms of non-institutional credit are also identical.
Monopoly Power:
The risk premium, 'the inflationary premium and monopoly profit
s are not amenable to direct measurement but proxies can be used. It is difficult to quantify the extent of monopoly power, but it can be argued that the more developed institutional credit is in an area, the less
likely would be the monopoly power of moneylenders. Hence the spread of
institutional credit and specifically, a rising percentage of loans
borrowed from institutional sources to total loans borrowed, can be taken to indicate declining monopoly power. But it has been argued above that
an inverse (negative) relationship can be expected between the rate of
interest and the spread of institutional credit, which suggests a positive

46 .
relationship between the degree of monopoly power and the rate of
interest.
From the data on borrowings by cultivators during 1961-2 [58]
classified according to the rate of interest, the average interest rate
for each State can be computed by assuming that the distribution is
normal within each class interval i.e. the mid-point of each interval is
truly representative. The States can then be ranked according to the
average rate of interest. Similarly the States can be ranked according
to the percentage of loans borrowed from institutional sources which
incidentally reflects the development of institutional credit (Table 3.1).
Spearman's coefficient of rank correlation (r') between the interest
rates and the percentage of loans borrowed from institutional sources2yields a figure of -0.44. This tends to confirm the theoretical
expectation of an inverse relationship between the development of institutional credit and interest rates and in turn signifies a positive relationship between interest rates and the degree of monopoly power. Indeed the All India Rural Credit Review Committee's rough calculations showed that the rate of interest declined in 1961-2 from its level in
V
1951-2 and one of the factors cited for this decline was the larger
dependence of cultivators on institutional credit [19].
Risk Premium:
The incidence and extent of the premium added to take account
of risk depends on a host of factors ranging from the type and severity
The significance of the value of r' has been tested by applying the two-tail test of significance at 5% level. Since the computed r' isless than - 1•96 , the null hypothesis is rejected, confirming what in-1has been argued theoretically.
2

RAN
KIN
G
OF
STA
TES
ACC
ORD
ING
TO
IN
TER
EST
RATE
S AN
D FA
CTO
RS
INFL
UEN
CIN
G
INT
ERES
T RA
TES
47
Xg (—1 r H ^ c N C O L n r n r o L n r H i o r ^ f t ^ c N Og rH 1—1 i—1 rH rH H H«
0 4-4f t 0 a)
0 C ' ö rHf t -H c P Prd P rö P cd P- P C - H > CD i D c N C O i n r H i O f t O O O i o r ' - c o i o f t c N C Oc (d in 4 o f t o • • • • • # • • • • • • • • • •CD - p C P S 0 rH o ^ i n c o o o c O r H c N f t o o r ^ r o f t r ' f tO to rd u G P '— " H n \ r cm m i o cm cm cm cm cnP P 0 CD - H 0-iCD P r H t oP4 O
P i oC ft m f t 4 , ( N d , H C M H h H l O C O l D r O ^ 1
2 rH rH rH r H rH
■pc<D X r ^ o ^ f t ^ c M f t c O f H c o L n o o o i D f t ^e <u l n c n i n r ^ o o r o c N i n f t ' v O O v D r o ' ^ j ' O ' X )> i b 00 • • • # • • • • • • • • • • • •i d C l O O H i n H o c o c o r g c o ^ f t m o o f tf t H h c m h c m h i o h h c m h c m c m c m c o c o c ma)
&
Xc ord p - r o cn ' d’ l i i n f t r ^ H O O r P f H i m c N
« rH rH
(D C -O - H to nC rd (D t o f t c o n i n c N h hrd 4-1 P ü 1 f t f ' ~ ^ • • t o f t m o f t ft « o f t
• H 0 t J 1 *H (Ti CD A A A
P TS P i d rH rH p-" • • i n o f t i n o i n o *04 f t .rd O f t c n C M C M f t Z Z l O f t f t C M f t O Z 00 H> 0 rH m r H LO rH O rH
IP rH rH
C i n f t f t i n f t H o o r ' - i n r H c N ^ r o ' n r ' X i c N 1
rd 1— 1 r—1 r H r H 1—1 r Ht C
\
r Ha; rdf t crd CO no 0- p g a) - H co CNC rd £ e - P <D r ^ c N i o c o i o o f t ' n j ’ r ^ f t c o i o r ' i o o n 'CD 0 0 0 P o • • • • • • • • • • • • • • • •O H P P - P P ^ i ' i o f t i O H r ^ c o o i o r ' O c N ^ f t f t c oP p 4-4 - H C r H C M H H H C M d ' C M C M H r H r HCD 44 0 P 0
f t o x i 1 to coc
• H
c -̂-N
g ft C O C N r H ' ^ ' i n f t f t f t C N i H L n O l O ' n r f t 1« r H 1—1 r H r H r H rH
p
(D COft <D f t f t o o i n c o c o i n i n c M ,'d’ c N ( N r ' ~ r ' ' f t r HCO rd P CD f t r ~ f t r H C 0 ' 3 , r H c N i n f t i £ > i O L n i n L n r 'P P CD P CN • • • • • • • • • • • • • • • •
0 (D P rd ---- ’ H O H M ' H C O c D H C O t D f t f t H i n H HP > c « 1— 1 Cn] ( N r H r H r H 1—1 1—1 1— 1 1—1rd <C H> cd
•rH pP p cr H Ä CDP • co pu P t ^ c d to <d a> cd p P
E p c d f t t d P P c o c d t o cd• c d c d p c d c d • P cd 0 co - n cd • • -h
CD P-r CO PC -1—> P f t O C C 0 H C - n f t W OP -̂v • c o -h C » cd • <d cd :h p 0 g • * Crd r HP '—"ft • • • • • • 1—1.......................................O H CM ft 4 1 i n H
r H CN ro ^ ID VD [ C D ( J ) H H H H H H < I
Col
s.
(2)
, (4
) ,
(8)
, (1
0)
com
pute
d fr
om A
ll
Ind
ia
Ru
ral
Deb
t an
d In
ves
tmen
t S
urv
ey
1961
-2
(Res
erv
e B
ank
of
Ind
ia)
(58)
Co
l.
(6)
Ind
ex
Num
ber
of
Wh
ole
sale
P
rice
s in
In
dia
(G
ovet
nmen
t o
f In
dia
) (a
s re
po
rte
d
in
Gh
alak
, S
: "R
ura
l C
red
itan
d th
e C
ost
o
f B
orro
win
g"
in
Fin
ance
in
D
evel
op
ing
Co
un
trie
s -
Ay
re,
P.C
.I.
(ed
.)
Fra
nk
Cas
s &
Co.
L
ondo
n,
1977
) C
ols
. (3
),
(5),
(7
),
(9),
(1
1)
com
pute
d fr
om o
the
r co
lum
ns.

4a.
of natural hazards that an area may be prone to, to the general
attitudes of the people as far as debt redemption is concerned. While it
is comparatively easy to list all such factors, measurement of their
effects is extremely complex. However, it can be argued that the
repayment performance of borrowers does to a large extent influence the
assessment of risk in the minds of lenders. Thus repayment record can
be used as a proxy for risk.
Taking the average repayment per cultivator household as a
percentage of the average outstanding loans per cultivator household, a
Repayment Index can be computed as in Table 3.1. A glance at this Index
and the average rates of interest in various States would tend to confirmthe association postulated between the two variables i.e. the lower this
Index, the higher the risk and hence the higher the rate of interest.For instance, Bihar has one of the lowest figures for repayment and therate of interest is the highest. Spearman's coefficient of rank
3correlation is -0.2 which confirms the a priori reasoning that repayment
is inversely related to the rate of interest. But since risk isinversely related to payment, it follows that risk is positively
\
associated with interest.
Risk from the lender's viewpoint also depends on the financial
standing of the borrower and the type of security offered. Therefore
the type of security offered can be taken to be another proxy for 4risk. A lender's concept of security is equivalent to that of risk
4Data relating to interest rates according to the financial standing of the borrowers (either income or stock of assets) is not available and hence an examination of the association between interest rates and financial standing, though interesting, is not possible.
Significant at 5% level of significance.3

49.
cover - the more a loan is secured the less risk is associated with
lending. Even institutional sources attach importance to securities
as shown by the fact that, even though, under the crop loan system, the
loan is secured on crop liens and the credit limits are fixed on the
basis of the scale of finance and acreage, several borrowers "were
found to draw loans only up to the extent of the security limits".
Loans in excess of surety limits were made only on the security of
tangible assets, preferably immovable property [60].
The 1961-2 All India Credit Survey classified loans according
to the various types of security offered, viz.:
(1) Personal security
(2) Surety security or third party guarantee(3) Crops(4) First charge on immovable property(5) Mortgage on immovable property(6) Bullion and ornaments
(7) Shares of companies, Government securities and insurance policies
(8) Agricultural comm&dites
(9) Other movable property
(10) Any other security.
Since loans made on security of types 7, 8, 9, and 10 were negligible
(their combined total amounting to only 0.5% of aggregate loans) they
can be discarded from the analysis. By far the most common form of
security was personal, which reflects both the importance of non-
institutional credit sources in the system and the fact that loans were
generally for short periods. Mortgage of immovable property was next
in importance followed by third party guarantee and first charge on

50.
immovable property. Only 1.7% of aggregate loans were secured on bullion and ornaments while crops as security accounted for only 0.9%
which indicates that the system of crop loans was still in its infancy at that time.
The safest security for the lender is that which confers rights on immovable property either by outright mortgage or by creating
a first charge. Therefore a 1 igh percentage of loans outstanding on
the security of immovable property reflects, on the one hand a higher
degree of risk necessitating this comparatively safer form of security.
On the other hand, in a dynamic sense, it indicates a reduction of risk
since once the loans have been effected on such 'safe' security, the risk is automatically reduced. The overall effect on the rate of interest will depend upon the relative strengths of the two forces - one tending to push up the rates and the other to depress it. In fact Spearman's co-efficient of rank correlation between the average rates of interest in 1961-62 in the various States and the percentage of out
standing loans on security of immovable property yielded a co-efficient\of +0.01 suggesting perhaps that the two pulls almost neutralise each
other.
Inflationary Premium:
In an inflationary situation lenders are likely to try to
protect the real value of their loan portfolio from the effects of the
declining value of currency. They would be influenced by the expected
rate of inflation (rather than the real rate) in assessing what rate of
loading should be added to the rate of interest on loans. It is,
however, difficult to determine and quantify their expectations. But

51.
since expectations can be assumed to be based on past actual inflation
rates (with perhaps a time lag) these could be used as a proxy.
Foodgrain price data from 1959 to 1963 were used and their
variances were obtained for each State and were ranked (Table 3.1).
Foodgrain prices were used as an inflation indicator since in the rural areas foodgrains constitute a very high proportion of the total family
expenditure. On theoretical grounds it may be anticipated that the
higher the rate of inflation, the higher the rate of interest. In
fact Spearman's co-efficient of rank correlation between the average
rate of interest State-wise and the variance of foodgrain prices was +0.45^ which confirms the theoretical reasoning of a positive relationship between interest rates and inflation.
3 • 4 Rural Interest Rates in India:
On the basis of the above analysis, an attempt is made below to interpret the pattern of rates of interest in rural India. According
to the All India Rural Debt and Investment Survey [58] cash loans borrowed at different rates >of interest in 1961-2 were as indicated in
Table 3.2. below.
From the data of Table 3.2 the average rate of interest for
India was calculated using the weighted arithmetic mean. This average
rate was 11.71% per annum for 1961-2. Even given that the Bank Rate
was around 4% in 1961, it seems likely that the survey has underestimated
actual interest rates, especially if account is taken of the fact that
institutional credit was only about 15% of the total and non-institutional
5 Significant at 5% level of significance.

52.
TABLE 3.2ALL INDIA CASH
DURINGLOANS BORROWED BY CULTIVATORS 1961-2 CLASSIFIED BY RATES OF
FROM ALL INTEREST
SOURCES
Rate of Interest. (%) Percentage of amount Total amount borrowedper annum borrowed to total (Rs in crores)
Nil 25.0 258.323 Vg or less 0.2 1.773 V8 to 6% 6.7 69.366h to 93/8 15.5 160.1693/8 to 12% 18.7 193.0712% to 18 Vf 8.1 84.07183/4 to 25 16.5 170.9525 to 37*2 4.9 50.37Above 37̂ 5 1.5 15.83Unspecified 2.8 28.81Not calculable 0.1
100.01.39
Source: All India Rural Debt and Investment Survey 1961-2 (ReserveBank of India) . (58)
sources which lend at high rates were the major source. This underestimation is probably due bo the fact that there are various types of loans for which interest is not specified explicitly. For example,
loans which bind the borrower to sell his produce to the lender at a
particular price may appear to be interest free, but may actually carry
a high rate of interest, the level of which depends upon the difference
between the selling price and the market rate. Another common method
of obtaining loans is for borrowers (labourers in this case) to pledge
their harvest wages. They subsequently sell the produce received as
wages to repay the loan typically straight after harvest, when prices
are low. Here, too, the rate of interest is not evident and may well
be very high.

53 .
To appreciate the complexities involved in determining rural
interest rates it is necessary to be familiar with the different types of repayment obligations involved in rural loans in India. Broadly,
these are:
(1) The loan and the repayment are in cash. This is the most
straightforward arrangement and the rate of interest is easily
calculable;
(2) The loan and the repayment are in terms of crop. Such loans
are normally extended when crop prices are high while
repayment is required immediately after harvest, when prices
are low, and works to the advantage of the borrower. This
arrangement renders interest rate calculations difficult;
(3) The loan is in terms of inputs (fertiliser, seeds, water) and repayment is from the harvested crop. This is quite a typical
type of loan transaction between landlords and tenants. To compute the rate of interest it would be necessary to transform both loan and repayment into monetary terms.
However, this raises certain conceptual difficulties. The landlord may have 'purchased the inputs when prices were low but loans them when prices are high. Which price should be
used for the transformation - the purchase price or that
prevailing at the time when the loan was effected?
(4) The loan is in money terms and the repayment is in crop terms.
In certain cases, computation of interest is rendered extremely
difficult by the fact that the borrower repays by entering
into a usufructuary mortgage of fruit trees with the lender.
For the duration of the loan, the fruits of the trees, e.g.
mango, coconut etc. are enjoyed by the lender.

54.
(5) The cash or crop loan is repaid in terms of labour rendered
either by the borrower or by a member of his household.
While a survey of 275 villages in Eastern India reported theg
incidence of "bonded labour" to be insignificant [61] it did
find a high incidence of indebtedness of the labourer to his
employer. In a very large number of such cases where the
labourer takes an advance (loan) from his employer, he works
at a lower wage rate than the market wage rate during the time
of repayment.
Thus in almost all kinds of credit relationships prevalent in7rural India, the rate of interest is difficult to determine. Kurup's
[62] analysis of a South Indian State revealed that nearly two-thirds
of the loans do not explicitly specify a particular rate of interest -
it is concealed and difficult to compute accurately. According to Rudra [54] loans from moneylenders usually carry an interest rate of between 10-20% per month or 120-240% per year. Long's [53] results show that on an average Indian farmers were paying an interest of 12.3% per annum for their credit in 1951-2 as opposed to the then prevailing
Government bond rate of 3.4% per annum. A more recent assessment made by the World Bank [8] found the nominal or money rate of interest from
Bonded labour refers to the practice of a particular labourer or farm servant being tied to the creditor till the loan taken by the former is repaid. In certain areas it was not uncommon for the labourer to be in 'bondage' even after his death - the debt passed down to his children. The practice had been outlawed in most States by 1976.In view of this in all probability, the actual rates of interest estimated by the All India Rural Credit Survey 1961-2 are underestimated. This does not, however, materially affect the earlier theoretical analysis regarding association between monopoly power etc. and the State wise rate of interest, if we make the not too unrealistic assumption that the underestimation of interest rates by the Survey was uniform for all the States.

5 5 .
institutions to be 10%, and from others to be 25%. As the average rate
of inflation was computed to be 10%, the real rate of interest was stated by the Bank to be 0% for institutional credit and 15% for non-
institutional credit. A survey conducted by NCAER [42] for around the
same period i.e. 1970-1 shows the average rates of interest on
borrowings of different size groups from various sources as follows:
TABLE 3.3
AVERAGE RATES OF INTEREST ON BORROWINGS FOR VARIOUS FARM SIZE
CATEGORIES BY SOURCES
Size of Holdings (hectares) Govt. Coops Comm.
Banks
SOURCESMoneylenders
FriendsAllSources
0-2 8.9 8.9 7.2 22.5 0 16.02-4 9.0 9.1 8.1 20.9 0 14.34-6 8.3 9.0 9.4 23.3 0 14.96 and above 8.4 9.0 9.2 16.3 0 9.0All holdings 8.8 9.0 8.4 21.8 0 14.8
Source: NCAER: Credit Requirements for Agriculture. (42)
The average rate of interest for loans from institutions was 8.7%
(computed from Table 3.3) and from non-institutions was 21.8% making an
overall average of 14.8%. These averages do not, however, reflect the
rates that each category of borrowers have to pay since the quantum of
loans issued by each source to each category is not the same. For
instance, the percentage distribution of borrowings from moneylenders
(Table 3.4) shows that borrowings from moneylenders who constitute the
largest source of finance, is at different rates for different categories
of farmers. Small farmers (with holdings from 0 to 2 hectares) obtained
67.2% of their credit from moneylenders at over 18% interest while farmers

56.
with over 6 hectares had to pay over 18% for only 30.6% of their loans
from moneylenders. This fits the general hypothesis of an inverse
TABLE 3.4
BORROWINGS FROM MONEYLENDERS BY SIZE GROUPS AT DIFFERENT RATES OF INTEREST (1970-1)
Rates of Interest (in percentages) 0-2
SIZE OF HOLDINGS 2-4
(hectares)4-6 Over 6
Up to 6 1.6 0.2 5.7 1.96-8 5.2 0.1 - -
8-10 4.2 3.1 3.3 2.410-12 14.8 18.8 2.4 36.312-15 5.0 11.3 2.1 2.515-18 2.0 3.6 25.0 26.318-24 67 ~(48.7 51.7 4°*6 30 (25.7
Over 24 * (18.5 11.2 20.9 30 *6( 4.4100.0 100.0 100.0 100.0
Source: NCAER: Credit Requirements for Agriculture.(42)
relationship between the size of the borrower and interest rates so that small farmers not only obtain a larger proportion of their loans from
moneylenders, but acquire them at higher rates of interest. Thus although institutions charge more or less the same rates for different categories of farmers, small farmers pay an overall higher rate for
their credit because a larger proportion of their loans come from non-
institutional sources whose general rates are higher and who charge higher
rates from small farmers.
Interest Rates for Small Farmer Lending:
A number of arguments are advanced for raising interest rates
of agricultural loans in general and for small farmer loans in particular.

57 .
It is contended that higher interest rates would not only enable lending
institutions to be economically viable but would also help in mopping
up rural savings. Potentially more funds would then become available
for lending to small farmers. This is a tangential argument as it
presupposes (a) that institutions are not viable because of low rates
i.e. the rates do not cover the average costs of lending; (b) that an
increase in rates will increase rural deposits and (c) that an increase
in rural deposits will automatically result in a larger volume of
lending in the rural sector, especially to the small farmers. The first
assumption may well be valid for the low rates do not take account of
high default rates. There is, however, little evidence to support the
second presumption. In fact in India there was an increase in interest
rates of agricultural credit socieites between 1951-2 and 1967-8, but deposits
as a percentage of working capital declined from 9.7% to 6.3% in the same period [19]. On the other hand, evidence amply shows that despite a steady growth in the volume of deposits tapped by the commercial banks in rural areas,^ there has been no accompanying pari passu increase in
their lending to the rural sector. The banks have been content with excess liquidity [65] and have been net exporters of capital from the rural sector [19]. Thus increased deposit mobilisation is not synonymous with increased lending in general nor does it ipso facto imply
an increase in small farmer lending.
Another argument is that low interest rates which are designed
ostensibly to help small farmers, actually assist the larger farmers
since they receive the bulk of the credit [66] and these subsidised rates
8 The share of rural branches in total deposits of banks increased from 3.1% in June 1969 to 9.7% in December 1977.

58 .
therefore result in income distribution becoming more skewed as the
larger farmers receive more of the subsidy. This is linked with the
"iron law of interest rate restrictions" [67] according to which the
lower the rates, the less likely small farmers are to obtain credit
as it would tend to become concentrated in a few hands. The implication
is that at law rates, demand exceeds supply, and unless there is an
effective rationing system, larger farmers because of their stronger
economic and political influence, manage to secure the majority of it.
Although superficially appealing, a closer examination of this argument
reveals its speciousness. First, as indicated elsewhere, interest rates
in the agricultural sector are not lower by comparison with the
industrial sector. Second, the fact that larger farmers manage to obtain
a proportionately larger quantum of credit is a criticism not of the
intrinsic merits or demerits of the interest rate structure, but of the conception and implementation of institutional credit programmes. If, as argued, rates are designed to help small farmers but in effect do not, then surely something must be wrong with the disbursement system?
It is also contended that small farmers adopt new technology only if the expected rates of return are very high, so an increase in interest
rates will not adversely affect farmers' profitability, and that in any
case small farmers are used to the high interest rates of moneylenders
[19]. This is a tenuous if not strange line of reasoning. There is
little reason or merit in justifying high interest rates for small
farmers on the grounds that they are accustomed to higher rates of
moneylenders as one of the basic objectives of providing institutional
credit is to make it available at cheaper rates. Besides, as is well
known, farmers are generally risk averse as their "certainty equivalents"
are less than their "expected money values" [68]. So to induce them to

59 .
to adopt new and profitable technology, expected returns have to be
greater than those from existing modes of production. It is also generally recognised that risk aversion is a decreasing function of
wealth (size of holdings) so for a given technology, small farmers need
a bigger inducement in terms of higher expected profits to coax them to
adopt it. A higher interest rate would reduce the size of the expected
profits and would deter a larger number of small farmers from adopting
innovations.
It is affirmed that low rates imply underpricing of capital
and so tend to encourage capital intensive techniques in labour surplus
economies as the rates do not correctly reflect the scarcity of capital [47]. First, even if this is accepted as a valid postulate its
validity would have to embrace the entire economy since the interest rates are not lower in agriculture than in industry. Second, it is relevant more for larger farmers than smaller ones since it is the
aformer who go in for capital intensive techniques e.g. tractorisation.
Perhaps the only substantial argument for higher rates of interest for small farmer lending is that the administrative costs of
lending to them are greater and therefore they should be charged a
higher rate. Although administrative costs of lending are not
unvariable and can be reduced if suitable steps are taken, the fact
remains that the costs per unit of loan do decline with increasing
loan size. This, as will be discussed later, is a limiting factor
if there is no "excess capacity" in the lending institutions. But against this there are a number of good and sufficient arguments for
lower rates for small farmers.
a As indicated earlier, over 90% of institutional credit is short term crop loans and this percentage is higher for smaller farmers. Thus although there would be some adverse income distribution consequences, they are unlikely to be very serious.

60.
One peripheral argument offered to justify lower rates in
agriculture in general and small farmers in particular is that the
terms of trade have moved adversely for agriculture in relation to
other sectors and therefore lower rates in agriculture would act as a
stabilising and compensating factor. This urban bias in India has been
indicated by Crawford [16] for the 1950s and by Lipton [69] for
subsequent years. An analysis of the inter-sectoral terms of trade
[70] does not however, support this hypothesis and in fact discloses
that over the period the relative terms for agriculture moved favourably.
Even if, however, the urban bias theory is conceded, it is difficult to
justify lower rates on that count alone. Justification merely on this ground reduces to using the credit mechanism for correcting distortions
due to faulty pricing policies. Clearly, the "first best" solution would
be to review and correct those pricing policies.
On equity grounds, a strong case for lower rates of interest for small farmer credit in India can be made out if account is taken of the fact that (a) the bulk of small farmer loans come from moneylenders at higher rates of interest, (b) there is a concealed subsidy in the provision of services like irrigation, electricity, extension, education
etc. which have largely benefitted the bigger farmers and (c) the
only tangible direct taxation of agriculture - land revenue - is in
practice regressive, the incidence being greater on the smaller farmers [71].
On economic grounds too, it is contended here that if credit
is based on considerations of higher marginal value product of variable capita
on smaller farms, then there is much to be said in favour of adopting selective credit policies in favour of small farmers.
The persuasiveness of arguments for selective credit policies

61.
in favour of small farmers is greatly increased if due account is taken
of the shift in emphasis in the basic goals of development towards income redistribution and achieving greater employment. Essentially,
the aim of such selective credit policies is to channel a particular
volume of credit to specific areas or segments of the population that
are identified in the broad development goals as the "target areas or
peoples. The instruments of such policies fall under two broad categories.
The first set are policies that affect the supply of credit e.g.
subsidies to lenders, differential reserve requirements etc. The second
set are those that influence the demand for credit e.g. interest rate
subsidies. We shall primarily be concerned with the latter and in the
form most widely used, viz. differential rates of interest.
Theoretically, one can propose at least four situations in which there is an economic argument for differential rates of interest:
(1) Where the prevailing rate of interest is greater than the
social rate of return [72].(2) Where there is a divergence between the private and social
rates of return of capital, with the social rate being greater
than the private rate of return, but where credit institutions ignore social profitability so that the cost is considered
to be higher than the true social cost.
(3) Since loans are generally based on the credit-worthiness of
the borrower with those financially strong being charged
lower rates, the gap between social and private profitability
is accentuated. This divergence can be attenuated by
differential rates.
(4) Where as a matter of economic (and social) policy it is
considered desirable to raise the standard of living of

62.
certain disadvantaged sections.
Thus the underlying basis of differential rates of interest
stems from market imperfections which are due to the fragmentation of
rural financial markets in developing countries like India and which
therefore necessitate intervention. Proponents of laissez faire usually
prefer a tax-cum-subsidy policy to differential rates of interest. This
is based on the fear that while differential rates of interest would
distort the capital market and so impose welfare costs [73], a Robin
Hood policy of taxing the rich to subsidise the poor would not suffer
from such a debility. The point would be well taken if the credit
markets were perfect to start with, but since imperfection and
inefficiency are the characteristic features of such markets in India, the criticism is purely academic. Moreover, a tax-cum-subsidy policy
though theoretically attractive, loses on the grounds of higher administrative expense and impracticality of implementation.
In the widely variable economic milieu prevailing in India, till recently selectiveness in credit was sought through directives
issued by the Reserve Bank of India to State Cooperative Banks to ensure that not less than 20% of the short-term advances during the year went to small/marginal farmers. The All India Rural Credit Review Committee [19]
which recognised the problem of inadequacy of credit for small farmers,
suggested selectivity of credit policies based on a graded scale of
finance for different categories of farmers. The suggestion was that
small farmers be granted loans up to the full entitlement worked on the
basis of scales of finance and acreage, while for medium farmers
(between 5-10 acres) the maximum may be limited to 75% of their
entitlement and for large farmers, to 50% of the entitlement. The
suggestion was not implemented in full. Under the "Small Farmers Window

63.
scheme introduced in January 1978 individual loans up to Rs 2500 by
commercial banks to small farmers are eligible for refinance from the
Reserve Bank of India at a lower rate of interest and the banks in turn
are required to charge a lower rate from small farmers.
A selective credit instrument which has been in existence for
some time is the Differential Rate of Interest (DRI) scheme. It was
introduced in 1972 with the objective of catering for the credit needs
of small farmers and other weaker sections. Under the scheme, eligible
categories of borrowers are provided loans by commercial banks at 4%9rate of interest. Eligibility is restricted to those whose income does
not exceed Rs 2000 per annum in rural areas (Rs 3000 in urban areas)
and the size of the holding does not exceed 2.5 acres of unirrigated land
or 1 acre of irrigated land. Generally, the maximum quantum of the loan is Rs 1500 for short-term and Rs 5000 for term loans. In order to ensure that funds actually flow to the small farmers etc., it has been stipulated that commercial banks will lend a minimum of 0.5%'*’̂
of their aggregate advances in the previous year, under the scheme.To ensure that people in the rural areas derive the maximum benefit
from the scheme and that the bulk of the advances are not pre-empted
by urban areas, it is incumbent on the banks to route at least two-thirds
of their advances through their rural branches. The progress under the
scheme is shown in Table 3.5 below.
Although the overall progress has been satisfactory in the
sense that the minimum stipulated percentage of advances has been
The Bank Rate in 1972 was 6%, but has now increased to 9%, so that the differential has gone up from 2% to 5%.
10 This was increased to 1% in November 1978.

64.
TABLE 3.5PROGRESS UNDER THE DIFFERENTIAL RATE OF INTEREST SCHEME
Year Percentage of DRI advances to total advances
1972 0.021973 0.221974 0.231975 0.311976 0.561977 0.601978 0.58* (*estimated)
Source: Government of India: Report of the Working Group ofDifferential Rate of Interest Scheme (October 1978). (88)
achieved> in terms of overall impact in extending credit to small farmers,
the scheme has at best, barely scratched the surface. - Ln 1971 commercial banks accounted for only 2.4% of the total credit supplied in the rural
sector, so the DRI scheme covers at best 0.5% of 2.4% or an insignificant 0.012% of the total supply.

65 .
CHAPTER 4
FACTORS AFFECTING PERFORMANCE OF INSTITUTIONAL CREDIT 4.1 Indicators of Success
The analysis in Chapter 2 of the supply of credit utilised
aggregate country-wide data which conceals much inter-State variation
in credit supply and in the performance of credit institutions. An
investigation of inter-State variations is apposite not merely because
it facilitates a fuller understanding of the issue but also because such
an examination will enable analysis of the reasons for the variations.
The latter, in turn has a bearing on factors that affect the performance
of institutional credit agencies.
It is argued here that a successful credit institution is one which (a) is economically sustainable and in which repayment is efficient.
Sustainability implies that the institution is capable of generating its own funds by raising depositis. The relevance of repayment
efficiency is obvious for if the repayment record is unsatisfactory, the institution's relending ability will be severely impaired; (b) has a
wide coverage in terms of cultivators and area; and (c) makes credit
available to those previously excluded. This is a measure of the dynamism of the institution since one of the objectives of any credit programme
is to reach out to new clients.
Indicators of these elements of success may be taken to be
(i) the level of deposits per member and (ii) the arrear rate or the overdues: demand ratio, for the first component, (iii) Ratio of
members to total cultivators; (iv) percentage of borrowing members to total cultivator households and (v) the per hectare loan amount.
These three indicators portray the second element. (vi) The percentage
variation (increas or decrease) in the number of borrowing members
between any two or more specified time periods could

66.
be adopted as an index of the third element.4.2 Ranking of States
Using these indicators, the various States'̂ in India have been
ranked according to their performance with respect to each indicator
(Table 4.1) for PACS credit. If weights are allotted to each indicator,
then it would be possible to get a combined rank which would depict the
relative success of PACS in the various States. The final rank (col. 8,
Table 4.1) has been calculated by allotting equal weights to each
indicator.
A similar exercise can be done for the performance of
commercial banks in various states. Quite obviously indices such as
membership per cultivator, or percentage of borrowing members to
total cultivator households are not relevant for commercial banks.
Those chosen to guage the performance of commercial banks in various States are (i) the per hectare loan amount and (ii) the level of oustanding loans per hectare. Using these indices the various States have been ranked (Table 4.2) and by giving equal weight to each of
these indices, a combined final rank has been computed (col. 4, Table 4.2).
A comparison of the final ranking of States with respect to
PACS credit and the final rank with regard to commercial bank credit
would tend to suggest that commercial bank credit has gone largely to
those States which are relatively better served by cooperative credit.
In fact Spearman's co-efficient of rank correlation between the two final ranks works out to a very high +0.77. The co-efficient between
Only the 17 major States have been taken into consideration. The Union Territories and the five hill States of Nagaland, Sikkim, Manipur, Meghalaya and Tirpura have been excluded as they were constituted recently and are small in terms of population.

Source: Computations based on data from RBI, Statistical Statements Relating to the Cooperative Movement in India(Pt. 1, Credit Societies).
(40)
I 1 !_■ \ 1 j • I -■ I j I j' O a ' l n ^ U N J H O V O O D ' J ( V i a i ^ l J ( O H
a gCD
_ w or t fu n
w. . ̂ • , bet I—l. b b
( t P CU Ü1 pjhi CD CD hi
* f f "H pi -P b bQj t\J
GCD
4b O b
G . _£> cd G b <-' p a cd
b b P co CDb g p b b ^ ^ a i tcd cd a tu oo d mCD b CD —' CDb CD —vi d ' oob —'hi
t-3 a S > . . - - .cd cd cd b cd d cd3 b CD CD hi <-J- hiH- CD b b b hi CDb hi ’C d ‘
CD CD CD
b G G b hi hi CD CD CD CD CD CD CD CD CDb S '
CD CD r+ r+ CD
G G h - d 3 bCD l_J.
S-&CD 1—1
GbCDaCDCDb
> £ W O £ K G c np b hi p b r t d
> aCD CD
b b b cd g r t ,- i - p J hc
CD >-< CD CD
S ' CD o S 'p G b hi
CDaCDCDb
b b hi p
G G b t-3 G Wp d ro p p p3 b b § h< i_ j.
I_I- p p - t<J
r+ COd P b b p
b p
P G p
b p
b CD b 3H-hi
b a ppa .d
> S co G CDb p H- p d .q , n, b u . u . hi r+ b bH r1 Hr* ru fM w •-< n» o i in
a g ad p r t p
_> P P hi *< b CO
Öd p p r t
b b U D (J\ G hi hi — CD P p
b Qi Dj CD CD CD CDb b
r+ r+PG
b hi
— CD CO CD
p hi P CDb
P rt CD hi
O G G hi P P
3 b 3 ^ d p
G b G b CD d
b P P u . b O b p
£> P
GPCDb3bhi
b pp
a s ÖJ G G
rt hi CD 3P b hi Phi
H- hi b o b p
CD £i id pb id hi b
G hi b P pP P CDb CD CD
CD C/5CD bb
> öd G a O a G GCD b P • hi p p r tCD b 3 b
&l-J. r t
P P g öd CD p P3 hi d CD CD hi CD hi
b p p r tG b GP id p hi
b b hi b p• p CD
CD CDb CD CDu> C/d b
b
h-3 O G b S G tdp d p cd p p d
' b . i_i. n b hi p p b! b bp
ad
pCD
bpb
i_ i .pb
G b G b P P
hi hiS id o h-3
d p b . gs - s
b p b h<j p b . i H- po P b rt P P b b
G S Gb p p3 CD 3 P b 3 o h< d b pp p> b id
hiid P
b id G o d
hi p CD CD CD
p CD CD
" S 'b p
p d phi b hi b b .p p p rt b b
P
CDCD
b
>bCDbhipidhipaCDCDb
& b b P
apad
>3 G G a p r t P CD 3 r+ b - CD
‘ PCD
P b p b b hi p r t öd
a id b CD b G
P hi CD P
CDCDCDb
o a Ghi PE’gcdp p
id ti P CD CD CDb
b P b ' P ti
G a G > b G S O G b h 3 G br t b r t
G <2n CD
bb G P P CD b CD b 3 b hi
id b P hi CD P
CD CD CD b CD
b p d P P3 b b . b . hjP P hiO hi PJ CDb P r t r t b
CD b p
I §
b b brt on b P
p h< b b . p b p b
& papCD d
b a > G
■s' o
a cdCD >Td
1 8 CD b hi rt
cn
bG■u01
b
CDhiCDbb
i didCDhi
a 0n CD Hi
G d Gb 0 b öd PG d rt fl> 0 hi
Ln - J CD b hi O—' O CD < in hi CD
1 b p 0 bb 0 rt ft
o C rtb H- b PCD b b GCD G G CD
b ><G 3 - J O
? §b rt
< > P < hi CD b hi p p rt G b CD 0b id
CDH- hi b O
CDa bO rt
G G H- P b b P b b
RANKING OF VARIOUS STATES IN TERMS OF PACS CREDIT BY VARIOUS INDICATORS

68 .
TABLE 4.2
RANKING OF VARIOUS STATES IN TERMS OF COMMERCIAL BANK AGRICULTURAL CREDIT
Rank Per Hectare Loan 1975-6
Per Hectare Outstanding (June 1976)
Combined Final Rank
(1) (2) (3) (4)
1 Kerala Kerala Kerala2 Tamil Nadu Tamil Nadu Tamil Nadu3 Karnataka Karnataka Karnataka4 Andhra Pradesh Andhra Pradesh Andhra Pradesh5 Punjab Punjab Punjab6 Haryana Haryana Haryana7 Gujrat Maharashtra Gujrat8 Maharashtra Gujrat Maharashtra (7)9 Himachal Pradesh West Bengal Himachal Pradesh10 Uttar Pradesh Himachal Pradesh West Bengal11 West Bengal Uttar Pradesh Uttar Pradesh12 Bihar Bihar Bihar13 Madhya Pradesh Madhya Pradesh Madhya Pradesh14 Orissa Rajasthan Rajasthan15 Rajasthan Orissa Orissa (14)16 Jammu & Kashmir Jammu & Kashmir Jammu & Kashmir17 Assam Assam Assam
Source: Dantwata Committee.(50)

69.
the per hectare loan amount of cooperative credit and the per hectare
loan amount of commercial bank credit is even higher, being +0.88. This
supports the conclusion that commercial banks' performance in lending to
agriculture has been relatively better precisely in those areas where
the cooperative structure has been stronger.
This has three ramifications. First,it suggests that one of the
effects of the expansion of commercial bank credit has been to widen
inter-regional disparities in terms of credit availability already
evident in relation to cooperative credit. Second, it belies the
Government's hope that commercial banks would provide credit especially
in those areas not covered adequately by cooperatives so that there
would be complementarity rather than competition between the two types of institutions. Third, it supports the view that whatever conclusions
are derived for the success of cooperative credit could ipso facto beextended to commercial bank credit.
4.3 Analysis of FactorsIn the light of the above analysis an important question is
why cooperatives and commercial banks have performed better in some
States and not in others.. I.t is generally believed that cooperatives have worked best in areas where literacy is high, where landholdings are homogeneous and where land reforms have been carried out [8]. To
these could be added certain other factors which generally aid adoption
of new technology and thereby assist in the modernisation of agriculture
viz. irrigation, fertiliser usage and electrification.
4.3.1 Literacy:
The role of literacy or formal education in economic development
in general and agricultural development in particular has been widely

70.
recognised. The innovative, allocative, worker and external effects of
formal education have been highlighted [26, 27] to the extent that the
view is held that formal education in terms of literacy and school
enrollment ratios explain about one third of the difference in agricultural
productivity between U.S.A. and India and nearly one half of that between Japan and India [7]. While it is not appropriate here to discuss
the merits of this proposition, it could be intuitively argued that the
development of cooperation itself is a function of education. In fact Chaudhri's study [74] of the States of Punjab and Haryana indicates
that secondary education of cultivators has a positive influence on
membership of cooperative societies. A positive correlation between
literacy and performance of States in terms of cooperative credit may be anticipated. In fact Spearman's co-efficient of rank correlation (r1)
between them is +0.622 indicating a positive and high degree of association between credit and literacy (Table 4.3).
4.3.2 Land Reforms:
Non-economic factors like land reforms have been emphasised [28] as an important variable in development. Land reforms encompass
a host of agrarian relationships from the mechanics of tenant-landlord
relationship to ceilings on agricultural land and consolidation of
holdings. Access to credit either through the existence of well developed institutional sources or satisfactory channels of off farm remittances
tends to mitigate the stifling limitations of an inequitable agrarian
structure [29]. On the other hand, the implementation of land reforms
provides an economic incentive to the cultivators to adopt better
2 This value of r' is significant at 5% level of significance.

So
urces:
Co
ls. (2
), (3) ,
(4) , (6) :
Ba
sic
Sta
tistic
s
rela
ting
to
th
e
Ind
ian
E
conomy
(Cen
tre fo
r M
on
itorin
g
Ind
ian
Bom
bay 1
97
7).
(89)C
ol.
(7):
Ind
ian
A
gric
ultu
re
in
Brie
f -
Go
vern
men
t o
f In
dia
-
15
th
ed
ition
. (20)
ml .
(8} : A
aend
a n
ote
s o
f C
hie
f M
iniste
rs' C
on
ference
on L
and R
eforms
- M
inistry
o
f F
. &
A. ,
19
70
. (90)
MOO301
I—‘ I—> H -* 1 —■ ! —‘ I—' I —>1—1
g 1_I. O" r t Q j Q j H- bj
P ‘Cpj
*pjWS'3H-P
PI P PJ Oj PJ
PJ PI P P
a 2 hj O 2 pu * ^ J “ P 3 PJ
P- CD3 cn
(D W CD S ' cn
pja Oj(D
W S ' S '
PJ_ o r t ? t t PJ P) (D ** P 3 pj op
PJ pj P I - 1 pj Oj CD M 3
r t u . h
. »3d pj pj
<-j- O' 3pjP
r t PJ
CD P
P PJP P PJ
f t S ' E? pj < Ppj pj
wPI S '
Z Z 50 o Opj pj s d pi—i. i_J. p- 3
P) P U) ‘
ffi > P- W
P pj pOj P) ft)WS'
S
rtS 'r+ S
cn PJ rt rt
PJOS'SPPJPPJOjCDcnS'
CDcnrtWfDScOSP
* toCDP PJ pj P P
H - S r+ S ' O j r t
S ' PJ P PJ
in ZS' PJ r t Oj P d PJ
a i-3 x pjpj pj d3 3 3
p dPi
PJ pPpjOj CD
PJ Oj PJ
Z S
Z Oj
3 3H- c< i_j.M S &
PJ
W3 S' S' 3
H- 3
c-i s: z a opj n>3 cn 3 rt
td ^ cd
s^ cQ pj P) cn p S'
CD 3 PJ P O
W 8 5̂ 2 S dH - P S H - P j p j p j p j d p j 3 H - Q j S ' 3 3 Cb P 3 <-J- S cn t? pj H - S pjcn
cn S' p> P>PPJ3SOjCDcnS'
3PJPJ30OjCDcnS'
P PJ b£ rt
Z PJs WOj PJ d
> o z s: so * si3 PJ P- pj
H- & « g gcncn b;; n> pj pj S
cO *d S • b-> *d— ^ MH H P W W P
— CD cn S'
o sS ' r t pjpj p)b-1 ^
PJ
CD n 3 P) 3 I - d
3 § &►dsPJ O j CD cn S'
Z » W > o i-3pj pj p- S d sS' J-J- S' Oj 3
S!P) cn S'3 — H- 00 S ^
PJ PJ PJ bi cn b( b(PJ r t PJcn S'§ g 2 S’p P>
G Z cn > p)rt Pj d O P CD O'rt S' c-J- rt CD P p :0 0 p S' pj o >P P pj p CD CD s: p
0 rt — CO p H S CD CDPJ cn -J P rt P SP S' ^ P cn p PJ P0 rt 1 0 H- cQ cn HOj P to d cQ CD PCD PJ P • PJ Pcn O cn H-S' CD S' cQ
cn p ; o pjp
a K PJrt PJ drt P s 0PJ p; c_|. P
H K § Z bd pj PJ •Ojd —
b-1 NJ
PJO'
H- Pi_ l. pT p -
P in W
> 50 cn pj cn bj.
rtS'
r tr tSP
►dP
pj d H- S S PJ CD 3 i_j. 3 Oj P S' P............................. ■ § § s
p . (_i. p ;
£T M & gZ pj pj —Oj M d w
PJ PJ O j b JS P) p; cn CD
s >n pjb-1 PJ Z
PJoS ' pj
S' sp pj
Oj PJ j— CD cn h m S' H S ' 3— H-
p
H* >d S 'P S r t
b j pj p
Oj S CD S ' cn S'
9&*<PJ
>dPsOjCDcnS'
tdH-S'0p
sc oH - d
O pj S ' r t
PJcnS'3P-P
d)PpjOjCDcnS'
s sS CD S ' cn PJ r t Ppj td cn cd S ' S r t uQ P PJ pj h—1
*0§ § p - >_iHZ0Ojd
&
5 ̂ > O S td <SCD P 3pj P - p j b -1 PJ
P CDp - cn
p . pjS 3
r t pj P
cn 5dd pjl_J. LJ. p
5̂ Z PJ 0
Z — CD 0 P S Oj u> P rQd s~" w s
^ p
pPJ
►dppjOj
S S 'cn pj p;r t r t PJ S ' PJ
z sc a sc >dPJ P- r t 0 dS ' 3 r t P SP) pJ P) i_ j.3 a ̂ &
zpj cn S ' CD 3 cn H - S ' P
bo ^ pj p
Oj PJ CD cn S'
PJ — t) Qj P p CD —
cn
T L
a s 'CDcnS'
5̂ Z > 5d
ISp-r tCDPPJOPI
OPO bO
b O CDP b bh p
-—- VO CD OCO - J Oj cn CD' - ' C o p S
> 0I4̂ . P
CD
r t cn pj cn iO
CD
cnpocncn
Hppp -
ntb>
op< p - p p 0 IQ CD cn
pCO
— I
opobbCDOj
PJ o CD Op sr t cn
p % p - t J cn r t CD P - P osbCDp
pCO-JtoIU)

7 2 .
t e c h n i q u e s and new p r o d u c t i o n t e c h n o lo g y w hich in t u r n i n c r e a s e s t h e i r
r e q u i r e m e n t s f o r c r e d i t . Assuming t h a t i n c r e a s e d r e q u i r e m e n ts a re
r e f l e c t e d i n b e t t e r s u p p ly , a p o s i t i v e c o r r e l a t i o n be tw een th e
p e r fo rm a n c e o f S t a t e s r a n k e d a c c o r d in g t o im p le m e n ta t io n o f l a n d re fo rm s
and t h e i r p e r fo rm a n c e in c o o p e r a t i v e c r e d i t may be e x p e c t e d .
A lth o u g h te n a n c y r e g u l a t i o n s a r e a good i n d i c a t o r o f la n d
r e f o r m s , t h e r e g u l a t i o n s th e m s e lv e s c a n n o t be q u a n i t i f i e d , and even
t h e q u a n t i f i c a t i o n o f t h e e x t e n t o f t e n a n c y i s f r a u g h t w i th c o m p u ta t io n a l
3d i f f i c u l t i e s , p r i m a r i l y b e c a u s e i n a s i t u a t i o n c h a r a c t e r i s e d by an
e x c e s s i v e demand f o r l a n d , t e n a n c y a g re e m e n ts a re se ldom r e c o r d e d .
S t a t i s t i c s r e l a t i n g t o p r o g r e s s i n c o n s o l i d a t i o n o f h o l d i n g s , w hich a r e
more a c c u r a t e , have t h e r e f o r e been u se d (T ab le 4 . 3 ) . S p e a rm a n 's
c o - e f f i c i e n t o f ran k c o r r e l a t i o n be tw een c o n s o l i d a t i o n o f h o l d in g s p e r
n e t c ro p p e d a r e a and p e r fo rm a n c e o f c o o p e r a t i v e c r e d i t y i e l d s a
4c o - e f f i c i e n t o f +0 .70 w hich shows t h a t S t a t e s where c o o p e r a t i v e c r e d i t
h a s been s u c c e s s f u l a r e a l s o S t a t e s where l a n d re fo rm s ( c o n s o l i d a t i o n
o f h o l d in g s ) have been im p lem e n te d .
4 . 3 . 3 I r r i g a t i o n :
A v a i l a b i l i t y o f a s s u r e d i r r i g a t i o n c o u ld be e x p e c t e d t o i n c r e a s e
For i n s t a n c e , a c c o r d in g t o t h e A g r i c u l t u r a l Census o f 1971, t h e p e r c e n ta g e o f l e a s e d in a r e a t o t o t a l c u l t i v a t e d a r e a was 4.8% f o r t h e e n t i r e c o u n t r y , t h e i n c i d e n c e o f such l e a s i n g v a r y in g from 30% in t h e S t a t e o f Jammu and Kashmir t o 0.3% in B i h a r . The N a t io n a l Sample Survey on th e o t h e r h a n d , e s t i m a t e d t h e a l l - I n d i a f i g u r e to be 10.6%, w i th t h e r e l e v a n t f i g u r e s f o r Jammu and Kashm ir b e in g 8% and f o r B ih a r 14.5%! A p a r t from th e wide d i s c r e p a n c y , i t i s l i k e l y t h a t b o th s e t s o f f i g u r e s a r e u n d e r e s t i m a t e s .
S i g n i f i c a n t a t 5% l e v e l .

73.
the requirements of credit by making it technically feasible to
undertake double or multiple cropping and by enabling adoption of
better varieties such as the High Yielding Varieties (HYV). Since
HYVs in order to be economically attractive require substantial irrigation in conjunction with other inputs, an improvement in irrigation
facilities would reduce the risks associated with their adoption and at
the same time increase the requirement for credit to meet the cost of
increased use of other inputs. Moreover, the very provision of irrigation
(private) entails a large capital outlay and therefore a larger requirement
of credit if savings are inadequate. Theoretically therefore, the incidence of irrigation should tend to be positively correlated with
the incidence of successful cooperative credit. In fact Spearman's
co-efficient of rank correlation between gross irrigated area as a percentage of gross cropped area (Table 4.3) and States ranked according
to success of cooperative credit is +0.36.
This low co-efficient is perhaps due to the fact that the irrigation variable "gross irrigated area as a percentage of gross cropped area" is inclusive of all sources of irrigation, and so covers the preponderant Government sources. As is well known, Government
irrigation sources in the country were, and to a large extent still are, protective rather than intensive, and therefore this variable
fails to capture the full effects of irrigation, as for example, well irrigation with its greater degree of control over water is likely to
do. In fact if ranking of States by gross irrigated area as a percentage
of gross cropped area is combined with the ranking of States according
to area irrigated by wells as a percentage of area irrigated by other
sources (Table 4.3, col. 5) and this combined rank correlated with
performance of cooperative credit, then the value of the co-efficient

74.
increases to +0.6, which is significant at 5% level of significance.
4.3.4 Consumption of Chemical Fertilisers:
Use of chemical fertilisers is to a large extent facilitated
by the availability of irrigation. Since the incidence of irrigation
itself is associated with successful cooperative credit, on this ground alone it may be anticipated that States with high fertiliser consumption
would be States where cooperative credit is relatively successful.
Apart from the association between cooperative credit and irrigation is
the fact that short term loans extended by cooperatives usually have a
cash and a kind component and the kind component is generally in the form
of fertilisers. This would tend to strengthen the expectation of a high
degree of association between consumption of fertilisers and cooperative
credit. Spearman's co-efficient of rank correlation between State-wise consumption of all chemical fertilisers per unit of gross cropped area
and successful cooperative credit is computed to be +0.58 which confirms
the a priori reasoning as the value of r' is significant at 5% level of significance.
4.3.5 Rural Electrification:
Rural electrification affects the requirements of agricultural
credit indirectly. One indirect effect is through irrigation.
Electrification facilitates energisation of irrigation wells and the
prospect of being able to do so serves as an encouragement to farmers to invest in well irrigation. The positive association between well
irrigation and successful cooperative credit has already been referred
to earlier. In addition, rural electrification would increase the

75.
expenditure on excavation and energisation of wells and thereby enhance
the requirement for credit still further. Other indirect effects not
generally perceived relate to the role of electrification in dissemination of new technology through radio/television. Even the extension staff
charged with the responsibility of visiting villages and educating
farmers in better practices tend to choose those which are electrified.
These visits are conducive to encouraging the farmers willingness and
influencing their decision to adopt better practices, but to be able to
do so, they require credit. For these reasons, a positive association
between rural electrification and successful cooperative credit in the
various States may be anticipated - in fact the co-efficient of rank
correlation between the two is +0.78 which is significant at 5% level
of significance.
4.3.6 Cooperative Marketing;
An interesting feature of the cooperative credit system has been the attempted linkage between credit and marketing societies.As a result of the recommendations of the All India Rural Credit Survey 1951-2 [23] , cooperative marketing was promoted seriously from the Second
Five Year Plan (1956) onwards though its origins can be traced back to the Cooperative Societies Act 1912 which indicated non-credit forms of
cooperation, including marketing.
Theoretically, cooperative marketing is intended to help
break the "credit connection" of the moneylenders by attracting farmers away from them, especially small farmers who lean heavily on moneylenders
for credit and have been morally or contractually bound to sell their
produce to them at prices that are often low. The private trader-cum-
moneylender in turn, by treating his credit and marketing functions as a
76.
composite whole is able to increase his stranglehold on the farmers.
By granting loans at high interest rates, the moneylender more than
covers his cost so that in the face of competition from cooperative marketing it is easy for him to lower his margin, and if necessary,
suffer a temporary loss from marketing, secure in the knowledge that this will be adequately covered by profit from credit arrangements. It was a
realisation of this intricate relationship which prompted the Rural Credit
Survey [23] to suggest that all credit societies should be affiliated
to marketing societies so that the crop loans advanced by the former
would be recovered by the latter. It was thought that this linkage
between the two would help the credit societies in recovery of loans and
the marketing societies in enhancing the volume of their business. In
fact in some States, e.g. Andhra Pradesh, farmers were tempted by the prospect of loans on a liberal scale if they undertook to market their production through the marketing societies, while in some others, e.g.
Punjab, the carrot was in the form of lower interest rates if the farmers repayed through the marketing societies [85].
Because of this linkage and the inducements offered, one may expect States with successful cooperative credit structure to be also States where cooperative marketing has made better headway.
In Table 4.4 (col. 2) the States in India have been ranked
according to the value of agricultural produce purchased per primary
cooperative marketing society. Purchase of agricultural produce is the
single most important function of marketing societies as by doing so
the farmers are assured of a better price since the societies by virtue
of their better holding capacity are able to save the farmers,
especially the smaller ones, from forced post-harvest distress sales.

So
urce:
Com
puted fro
m
RB
I: S
tatis
tica
l S
tate
me
nts
rela
ting
to
th
e
Co
op
era
tive
M
ovement
in
Ind
ia:
Pa
rt II
(No
n-C
redit
So
cie
ties)
Bom
bay, 1
97
1.
(40)
1—1 1—• 1—■ 1—* 1—j 1—* 1—1f f i i n ^ w W H O ^ c o -J CT> (J1 ^ U> K> 3
ff. S 6?O EC 3 P P 3 p- p 3 co p j i-j.s § &
P
s:CDC/lr+tdcd3
02P3
pP
3ppa n> u1 EG
egP -3PonrP
ECP-3CDOEGCD3
XPCDCDCDcoEG
2CDCO3
wCD3
02CL CD CD 3 COeg
3PCDaCDcoe g
r t >-j . CD P P CD
3 3 P CD CL CD COeg
P -3
zCDCL3
3 3:P pj EG Q j CD EGp p :CD CD
EGCDpCD3CD
•3 O CD 3 g (_j .P -I-12:CDCL3
Z EG & pP 3 3 .
s &
CD 3to
p p : pCD CD
o Ed cnP CD 3p - (_l. i_i.CO CD P CO CO CD CD r+ r+ EG
EG 2 EG CD CD CD
9 5f sP P P r + CD 5 Es" CO CD CD EG
rt p CD
3 3§ § p- i—i- 3 CDEgzCDa3
toP-EGCDp to
CD 3
023 CDP 3CDCLCDCOEG
33
pCD
3pCDCLCDCOEG
opP-COCOCD
c2 Ed r t CD3 3 -CD CD
EG s CD CD
g &cd p :r t CD CD
EG cn EC CD c CDP 3. P ID P G 3 p p CD r t 3
3 S 3§ § • §
&EGCD
EG Z > Ed
noocn t iO •oH-CD
P
<P33CD
O333POEGPCOCDCO
302
OI
3
ooot>
to P 3 CD (0O 3
O S P- O 3 02U> 3 P ^ CD P
3 EGp : CD *2
3 P- 3
02
-J> O02P3O3333PP3
CO0O3CD3
p :
ooots
too3Cl 3
CDt ! 02
O3
n o o t s3 CD CO P• P
3— p -K> O— 3
CO
<P33CD
O3
>02P3O3333PP3
3!33P
g MCL 3
O3
sppEGCD333
02
'LL
TAB
LE 4
.4
RA
NK
ING
O
F STA
TES A
CC
OR
DIN
G
TO
PERFORM
AN
CE IN
C
OO
PERA
TIVE
MA
RK
ETING

78.
This would tend to increase the incentive to adopt higher cost new
technology and increase the demand for institutional credit. Spearman's
co-efficient of rank correlation between States ranked according to
cooperative credit performance (Table 4.1) and ranking of States according
to purchases of agricultural produce by cooperative marketing societies
yields a co-efficient of +0.50 which shows that successful cooperative
credit and cooperative marketing go hand in hand.
Purchase of agricultural produce, although a fundamental
function, is only one of the activities of cooperative marketing societies
Hence a more accurate barometer of their performance would be to consider
their other crucial marketing and distribution operations e.g. sales of
agricultural produce and sales of agricultural requisites (cols. 3 and 4 respectively in Table 4.4). Taking into account all these marketing
and distribution operations, the States can be ranked according to their combined performance in terms of cooperative marketing (col. 5, Table 4.4) As this is a better reflection of the performance of cooperative marketing, the anticipation is that Spearman's co-efficient of rank correlation between this and cooperative credit performance of States would be higher than that previously obtained. The co-efficient is
computed to be +0.69^ highlighting once again the close positiveassociation between cooperative credit and cooperative marketing.
4.4 Implications of AssociationFrom the preceding paragraphs it is seen that successful
cooperative credit is positively and highly correlated with literacy,
land reforms, irrigation etc. It is necessary, however, to enter a
caveat here. A high correlation co-efficient does not necessarily imply
5 Significant at 5% level of significance.

79.
any functional relationship between the variables under study, just as
a zero co-efficient does not necessarily imply statistical independence [30, 31]. Correlation theory does not establish or prove any causal
relationship and a high correlation co-efficient may be indicative of
simple causation or two-way causation, or influence of external factors
or even mere coincidence.
It would therefore be pernicious to conclude that literacy,
land reforms etc. are the factors responsible for the better performance
of cooperative credit in certain States. Land reforms etc. may be a
lead or a lag variable or a lead and a lag variable in the causation
chain. In the absence of evidence to establish a more precise relation
ship between the various inter-related variables which influence
functioning of credit institutions, a more pragmatic approach would be to view the statistical co-efficients in conjunction with the theoretical analysis and at best draw conditional conclusions. Undoubtedly, this is an area where there is great scope for a more probing analysis with the help of detailed time series and cross-sectional data.
80.
CHAPTER 5
SMALL FARMER CREDIT
5.1 Primacy
The primacy of the need for small farmer credit in India stems
from three sources. The first and overwhelming source is the sheer
numbers. According to the Agricultural Census of 1970-71, out of 70.5
million operational holdings in the country, almost 50 million or 70%
were below 2 hectares (20). The second relates to productivity.
Despite the arguments to the contrary by some (36, 37) it is generally
recognised that there is an inverse relationship between holding size
and productivity (32, 33, 34, 35) which has far reaching implications
for optimality in allocation of resources, including credit. Large farms usually produce more per unit of labour than the smaller ones but
the latter produce more per unit of land. But since land is the scarce resource (the physical limit of expansion of the land frontier having been reached in the 1950s) is is obvious that concentration of develop
mental efforts on small farms will not only yield better results in terms of production, but also result in a more intensive utilisation of the country's relatively abundant factor - labour. Third, even if the
inverse size-productivity relationship was not an observed or accepted
phenomenon, the issues involving small farmer credit would still be of
considerable importance in relation to the global shift in the meaning
and strategies of rural development in the 1970s. The large majority of rural poor in India comprise marginal farmers with less than 0.5
hectares of land and small farmers with holdings between 0.5 to 2 hectares.

81.
These constitute the 'target group' and any programmes for development
to be even mildly successful and self-sustaining must be directed at them.
Before we examine issues connected with small farmer credit in
India, it is useful to be clear as to the definition of a small farmer.
Physical size of holdings, income, output, investment, marketed surplus,
ratio of family to hired labour are criteria often employed to categorise
small farmers. Without examining their relative merits, it should be
noted that while a particular criterion may be appropriate for one
specific purpose it may be inept for others, e.g. size criterion may fit
a policy prescription for redistribution of surplus land, while income
may be more apt if the consideration is whether to exempt a certain category of farmers from a proposed agricultural income tax.
From a credit standpoint, a distinction can be drawn between the following categories of small farmers: (i) those who are economicallyviable'*' and have easy access to institutional credit (ii) those whose
farms are potentially viable if given access to technology, inputs,
markets, credit etc. (iii) those whose farms are potentially viable but need special treatment, e.g. subsidies for a certain length of time (iv) those with such poor resource endowments that they would not be
viable without a permanent subsidy, e.g. marginal farmers who become
financially self-supporting only if their farm income is supplemented
by income from other subsidiary occupations.
1 Viability has a wide range of possible connotations. Here it is used to refer to farmers whose income is adequate to meet the needs of the household and farm enterprise.

82.
The above demarcation reconciles the apparently contradictory
propositions sometimes offered in relation to small farmer credit. For
instance at one end of the spectrum are conclusions such as 'if a new technology requiring small seasonal outlays - such as a high yielding
variety in an irrigated area - is not being accepted by small farmers,
the explanation probably involves profits and risks and not the lack of
credit.1 (38). The implied assumption is that if market signals are
strong and technology divisible, most small farmers are able to and do
in fact invest their own resources. This is a valid proposition only
if the reference is to small farmers in the first category. At the other
end of the continuum, the lament is that it is the lack of credit that generally preempts small farmers from taking advantage of the technolog
ical innovations (39) and hinders the rate of progress of the 'Green Revolution'. This line of reasoning too is well-founded only if the
allusion is to small farmers other than in the first category.5.2 Inadequacy of Credit
Within the above conceptual framework, an analysis of therequirements and supply of small farmer credit is very revealing. The
inappropriateness of a single measure of size has already been indicated,
but unless specifically indicated we will follow the normal Govt, practice
of defining small farmers in terms of size of holding and lump together2all those with less than 2 hectares as small farmers. The All India
Debt and Investment Surveys of 1961-62 and 1971-72 classified cultivators
according to their assets.
2 It is realised of course that 2 hectares in the fertile Gangetic plain is an entirely different proposition from 2 hectares in the semi-arid regions of north western India.

83.
Data for 1961-62 (Table 5.1) shows that the ratio of average
borrowing/outstanding of small farmers were less than that of the large
farmers. It could be argued that this was so precisely because they
were small in terms of overall acreage. The fact that the area cultivated by them constituted only about 23% of the total might lead one to
the conclusion that they were in no way being disadvantaged vis-a-vis3large farmers in terms of credit availability. This however, can be
rejected for the following reasons. First, big cultivators command
larger resources of their own and so their dependance on credit is less.
Second, small farms have generally been found to be more intensively4cultivated so their per acre requirement of credit would be greater.
Third, as Table 5.1 shows, average borrowing per acre of small farmers
from co-operatives is about half that of larger farmers. This is significant since as discussed earlier, institutional sources provided
only 18.7% of the credit requirements and of this, co-operatives provided the lions share (15.5%). It is significant because it demonstrates that a larger chunk of even the meagre quantum of credit obtained by small farmers was at a higher cost since it is well established that the
rate of interest charged by non institutional sources is much higher.
3 This conclusion can be derived from Table 5.1. Assuming that those asset groups up to Rs2500-5000 represent small and marginal farmers, their percentage outstanding to total was 22.3. Similarly, their percentage borrowing to total was 21.2. These compare favourably with the percentage of the total area cultivated by that group which was 23.
4 It could be argued that the intensity of cultivation of small farms is with reference to own labour only. While this is conceded, it cannot be denied that to increase productivity per acre, labour has to be combined with the use of other inputs and this requires capital.

84.
TABLE 5.1
AVERAGE BORROWINGS AND OUTSTANDINGS OF CULTIVATORS 1961-62 (per household in Rs)
Asset Group (Rs) AverageOutstanding (Rs)
(1)
Average Borrowing (Rs)
(2)
Average Borrowing Per Acre From
Co-ops (3)
Less than 500 127 45 1.81500 - 1000 171 70 2.38
1000 - 2500 240 98 2.812500 - 5000 365 156 3.665000 -10000 539 251 4.4210000 -20000 844 386 5.3620000 & above 1763 737 7.33All Groups 473 205 4.81
Source; All India Rural Debt and Investment Survey - 1961-62.(58)
A number of steps were introduced to improve availability of
credit to small farmers, especially in the late 1960s and 1970s. However, progress has been marginal. The NCAER study for 1970-71 (Table 5.2) shows that small farmers obtained only 21% of their credit requirements from institutional sources and resorted for 66% of their
needs to high cost moneylenders. The largest farmers who could afford
to pay more, obtained only 24% of their loans from moneylenders.
Other evidence from the same study reinforces the argument
(Table 5.3). Only 22.5% of small farmers were able to borrow from
co-operatives and fared no better even from the Govt, which notionally

85.
TABLE 5.2
BORROWINGS FROM INSTITUTIONS AND NON INSTITUTIONS ACCORDING TO SIZE OF HOLDINGS : 1970-71
(in percentages)
Source Below 2 Hect. 2-4 Hect. 4-6 Hect. 6 and above
Institutional 21.4 34.8 37.4 32.3Non institutional 77.2 65.2 62.6 67.7
Moneylenders etc. 66.2 59.6 54.9 23.6
Source: NCAER (42)
TABLE 5.3
PERCENTAGE OF BORROWERS OBTAINING CREDITBY SOURCE : 1970-71
Size of Holdings (Hectares)
Govt,. Co-ops C.Banks MoneylendersFriends
andRelatives
rvjio 12.1 22.5 1.0 77.0 13.62 - 4 21.5 33.9 3.2 68.3 8.74 - 6 7.9 59.1 6.3 66.1 5.7Over 6 7.6 40.0 5.3 40.8 32.9
Source: NCAER : Credit Requirements for Agriculture. (42)
is meant for them. More recent statistics of 1975-76 relating to loans
and advances of primary agricultural credit societies showed that only
29.6% of the loans of these societies went to small farmers (40). Thus
despite a number of measures taken in the recent years, the broad

86.
conclusion of the All India Rural Review Committee reached in 1969 that 'the small farmers are handicapped in the matter of access to credit'
(19), is as valid in the late 1970s as it was then. In fairness,
however, it should be pointed out that in some States (e.g. Maharashtra)
where the co-operative structure has had a firm foundation, it has been
lately observed that small farmers received more than their due share
in comparison with medium and large owners (41). But even in these
States it has been recognised that the extent of their membership in
co-operatives is much less than that of medium and large farmers.5.3 Reasons for Inadequacy
A pertinent question at this point is why do existing institutions
lend so little to the small farmers. A number of factors both on the
supply and demand sides have contributed to this. On the supply side,
it reflects small farmers general lack of 'creditworthiness' as per
ceived by the lender. Despite guidelines to the effect that loans should be based not on the principle of 'creditworthiness of the borrower' but on the 'creditworthiness of the proposal' commercial banks and cooperatives still follow the former maxim especially in the case of term
loans. There is thus a more than warranted degree of security consciousness amongst lenders which works to the detriment of the small
farmers. Insistence on collateral penalises the small farmer who is
progressive and capable of repaying loans from increased production.
Reliance on possible liquidation of pledged collateral to recover loans
(rather than on an analysis of the borrower's ability to repay from the
incremental income)apart from being an anachronistic practice which
incidently does little to lift the image of the calibre of management
of these institutions, is in reality a chimerical 'advantage'.

87.
The extra security that institutions imagine this gives them
is illusory. Although data for the entire country is lacking on this,
statistics from six primary agricultural societies in two districts of
Andhra Pradesh show that despite the usual quota of defaults, not a
single farmer, big or small, was dispossessed to recover outstanding
dues despite large overdues. Even the Credit Review Committee had
observed a decade ago.... 'the significance of the security of land
is not so much that it can be realised....' (19). Thus the insurance
value of land as collateral on which so much reliance is placed by
institutions is doubtful.
According to the Credit Review Committee, the most important
reason for the relative neglect of small farmers is 'prejudice and
indifference towards the small man' (19) by the management of co-operative
institutions which is in the hands of larger farmers right from the grass roots level. This not only results in small farmer interests being inadequately represented but in effect makes a mockery of the principle
of open membership of co-operatives. It is not surprising therefore
to find that only 16.6% of small farmers were members of agricultural co-operatives in 1970-71 (42). Although in the Co-operatives Societies Act there is a provision for appeal to the RCS or his nominee if a farmer on proper application is not admitted as a member, the societies tend
to circumvent this provision by not formally rejecting the application
but keeping it pending indefinitely. Some States (notably Andhra
Pradesh) have got around these filibustering tactics by stipulating that unless a decision to the contrary is communicated to the applicant
within 60 days, he is deemed to have become a member. Mere membership,

88.
though an important first step, does not, however, imply that the
loan sought would be granted.
Even if the farmer is admitted as a member insistence on a
high ratio of share capital to credit by co-operatives (generally
between 1:8 to 1:10) often prevents small farmers from taking advantage
of credit facilities for lack of the required share capital to become
eligible for the loan required. A simple example will illustrate how
this acts as a handicap. Assume that a small farmer has 3 acres of
land and requires a crop loan of Rs. 500 per acre. For the total
loan of Rs. 1500, he will require to contribute Rs. 150 towards the share capital at a time when his resources are particularly scarce.It should be pointed out, however, that recently there have been relax
ations of this and for small farmers the share ratio has been
lowered to 1:20.
Juxtaposed to this problem is the question of valuation of land. For long term loans, land development and commercial banks insist
on hypothecation of land as security. But the valuation of land for
this purpose is typically depressed as it is based on sales statistics
which, for a variety of reasons, seldom reflect true values. This is compounded by the fact that the maximum loan admissible is limited to
50% of the value of the security for long term loans (43). The restrict
ion imposed by these practices can be gauged from an example of a
hypothetical farmer with 3 acres of land. If the price per acre is Rs. 5000, the market valuation of his land is Rs. 15,000. But according
to sales statistics the valuation may be only Rs. 3000 per acre or Rs. 9000

89.
in all (a reduction of 40% which is not unusually high). The maximum loan entitlement of the farmer would be 50% of Rs. 9000 or Rs. 4500.So if he applies for a loan of Rs. 2500 to excavate an irrigation well
and requires another Rs. 3000 for a pumpset to energise it he will
find that he can either have the well or the pumpset, not both, despite
having landed property worth Rs. 15,000. This results in under
financing of small farmers which in turn leads to a waste of resources
since inadequate credit does not lead to the expected incremental income
generation.
Another factor which tends to dissuade institutions from
lending to small farmers relates to the fear that small farmers have very
little margin for failure, i.e. the gap between income and expenditure
is very small so even a minor contingency can upset the production plans and create problems of repayment. However, a number of studies have shown that this apprehension is ill-founded. Default rates depend on a number of factors. The inverse relationship between the size of the gross income of the borrower and default is valid only under the assump
tion that the borrower tries to repay the loan or in Bessel's (44)
terminology, the social risk, which reflects lack of desire to repay,
is zero. In other words, the ability to repay is matched by the willingness to repay. That this assumption does not hold good in a
number of developing countries and that it is the big farmers whose
default to loan ratio is highest has been well documented (45, 39). In
fact the country papers presented at the AID Spring Review of Small
Farmers credit suggest 'that for programs with relatively good repayment
records in particular, but also as a general rule, small farmers have

90.
not been more delinquent than the larger farmers and often have been less delinquent'. (47). In India, evidence is not uniform. Some
studies (46) show that the major defaults on co-operative credit were
by the larger farmers. This is especially true in areas where the
repayment performance in the co-operatives had been particularly un
satisfactory. Moreover, there is, what may be described as a 'vicious
circle of overdues'. Institutions hesitate in lending adequately to
small farmers for fear that they may not be able to repay. The in
adequate loan forces the farmers to seek higher cost loans from money
lenders to make up the balance of their requirements. Since loans
from moneylenders carry a higher rate of interest and the farmers know
that they will have to rely on this source in times of urgent need, they prefer to repay the moneylenders dues first and default on cooperative loans and substantiate the fears. Small wonder then that a
study conducted by the Reserve Bank of India in one of the districts in Andhra Pradesh found that one of the major causes of co-operative over- dues was the preference shown by members to repay the loans from non institutional sources (19).
Another reason for the low volume of lending to small farmers
has been attributed to the higher administrative costs involved in making a large number of small loans as opposed to a small number of
large loans. Linked to this is the fact that evaluation of credit
programmes in the past have tended to be a mere financial accounting
exercise of loan delivery and loan repayment and it is easier and
quicker to deliver large amounts of loans to a relatively smaller number
of large farmers. Much has been made of higher administrative costs

91.
in recent economic literature to explain away low volume of lending to small farmers but this should not be accepted unquestioningly for closer scrutiny reveals that it is not always a limiting factor.
While it is true that short term loans are fixed with reference to
the crop-cum-acreage of the borrowing cultivators and therefore the
larger the acreage of the borrower, the greater would be the loan
transaction per borrower, but whether lending to the smaller cultivators
would in effect increase the administrative costs would depend on
whether there is any 'excess capacity' in loan administration of the
lender. Assuming that the fixed costs of the bank (credit society)
would not change, the administrative costs would be a function of the
variable costs. The most significant component of the variable costs
is salaries etc. of the loan supervisor(s). If the supervisor is not being fully utilised, i.e. there is 'excess capacity', then the inclusion of the small farmers in the clientele of the bank will not
5materially affect total administrative costs. The picture would of course be different, if there was no excess capacity so that increasing
the number of loanees would entail enlisting the services of additional supervisors. One of the arguments for higher interest rates for rural
lending especially to small farmers draws its inspiration from this
factor of higher administrative costs and has been discussed in Chapter 3.
So far we have dealt with the supply aspects of institutional
credit for small farmers. Equally important are constraints on the
5 An unpublished study conducted by Small Farmers' Development Agency, Cuddapah, did not find any uniform positive relationship between administrative costs incurred by commercial banks and small farmer lending. In fact the bank with the lowest administrative cost per unit of loan had the highest percentage of small farmer lending.

92.
demand side. Paradoxically, small farmers may actually demand less
credit than they need from institutional sources for a wide variety of reasons. Despite attempts to streamline procedures for sanction and
disbursement of loans, the time taken and the bureaucratic procedures
involved in obtaining loans from institutions drives the small farmer
to seek his requirement from moneylenders. For instance, the various
stages from application to receipt of a short term crop-loan from a
primary co-operative credit society are as follows:
(1) Preparation of credit limit statement (application)
by the society on the basis of written or oral
application by the farmer - members.
(2) Approval of the statement by the general body or the managing committee of the society.
(3) Transfer of the statement to the Co-op. Central Bank for sanction of funds beyond the resources of the society.
(4) Scrutiny and verification of the statement by a
Bank inspector with reference to particulars in
the application as well as the financial position of the society. The inspector passes on his
recommendations to the Manager/Secretary of the
Bank.
(5) The Manager submits the application for consideration
by the Board of Directors (or a Loan Committee if it has been constituted). The Board sanctions the
loan provided the society is eligible (i.e. it

93 .
has paid back the prescribed proportion of previous
year's demand).
(6) The Co-op. Central Bank often requires its credit
limit sanctioned by the State Co-op. Bank to be
financially able to disburse the amount.
(7) Provided the above steps are successfully taken,
disbursement to the farmer is effected by the
society. The cash component is given as such
while the kind component (usually fertilizers) is
either distributed by the society or issued as
cheques in favour of the marketing society dealing
with fertilizers.
With a procedure as cumbersome as this (which incidently applies to all States with minor variations) delays can and do occur. It is true of course that the delays affect the large farmers also, but because the latter are not totally dependent on outside finance, the timing of their seasonal agricultural operations are not hindered.
Furthermore, institutional credit has very little flexibility
in repayment and the collateral requirements and procedures for medium
and long term loans are very tedious, time consuming and expensive in
terms of actual financial expenditure and opportunity costs of the
farmers time spent in obtaining the loan. For instance, just a list
of documents to be attached to an application form (Annexure I) is
staggering. The documents normally required in Andhra Pradesh are:
(1) Extract of Settlement Fair Adangal (Annexure II).
94,
(2) Extract of 10 (I) Revenue Account (Annexure III).
(3) Extract of farmer-wise cultivation account (No 2
Account) (Annexure IV).
(4) Statement of the Property that is to be mortgaged
to the Bank (Annexure V).
(5) Statement of Property of applicant other than the
property offered for mortgage (Annexure VI).
(6) Sketches with boundaries if the property offered
for mortgage is a part-field.
(7) Statement of Income and Expenditure (Annexure VII).
(8) Sale deeds if property is self acquired.
(9) Encumberance certificate for 13 years.
(10) Land Revenue receipts.
If all the expenditure time and frustrations are capitalised and the shadow charges for the small farmer in dealing with a bank are computed the balance of advantage may well lie in obtaining the loan from the
moneylenders since although there is a considerable difference in the notional rates of interest, the net rates after accounting for the costs incurred in obtaining credit may not be substantially different.
Perhaps the most important set of reasons for limited credit
demand for credit from institutional sources by small farmers relates
to the inadequacy of amounts that they can obtain from those sources and
the fact that perhaps their most vital requirement, viz. consumption
credit is not extended by institutional sources. It has already been
indicated elsewhere how the valuation procedure results in small farmers

95 .
not getting the amounts of credit they require by unduly restricting
their eligibility for term loans. Even for short term loans the
scale of finance per acre is too low. It is ironic that the AIRCRC
1969 found that 'the scales of finance are fixed at very high levels'
(19). While this may have been sustainable in 1969 it definitely was
not valid in 1979. As noted by the Report of the Working Group on
Rural Banks (1975), one of the weaknesses of the co-operative structure
has been that 'the scale of finance actually disbursed by the co
operatives has not been in conformity with the requirements of technology-ß
intensive agriculture' (48). Apart from the fact that inadequate
credit becomes infructuous as it does not lead to the expected pro
ductivity increases, the small farmers are forced to rely on the
moneylenders.
7Moreover, as a matter of policy, credit institutions supply only production credit while consumption credit is an important component in the loan portfolio of farmers (Table 5.4). Treating household expenditure synonomously with consumption credit, it may be seen (Table
5.4) that the smallest farmers utilise the highest proportion of credit
for consumption needs. It is paradoxical that institutions, especially
co-operatives, which were established in the rural sector with the
avowed objective of weaning cultivators especially small farmers away
from moneylenders, have not catered to the most important category of requirement.
6 It may be noted that commercial banks, the other institutional source, derive their scales of finance from co-operatives.
7 In the last 3 years or so, attempts have been made to supply consumption credit as well. These developments are referred to later.

96.
TABLE 5.4
PERCENTAGE OF BORROWING FOR VARIOUS PURPOSES BY ASSET GROUPS(1961.62).
Asset Group AverageBorrowing
PerHousehold
Capital Expd. On Farm
Current Expd. On Farm
Capital Expd. on Non-Farm
Current House- Expd. on hold Non-Farm Expd.
RepaymentofDebt
Less than 500 45 9.3 7.8 - 1.6 71.6 5.3500 - 1000 70 17 9.1 0.1 3.3 60.8 5.11000 - 2500 98 19.2 8.8 0.7 2.5 59.0 5.32500 - 5000 156 21.6 11.3 0.7 3.1 53.5 5.35000 - 10000 251 22.7 12.6 0.8 6.6 47.1 5.810000 - 20000 386 23.8 14.3 1.3 5.1 43.6 6.420000 & above 737 23.6 18.8 2.3 8.9 33.4 5.8All Groups 205 22.1 13.5 1.2 5.6 46.6 5.7
Source: AIRDIS (58)
Thus, as a result of the inadequacy of production credit and
a direct avoidance of consumption credit by the institutions, the farmersturn to the moneylenders. This, interestingly, may have ramificationsnot widely recognized. The small farmer obtains a portion of his total
credit requirments from institutions, but since he is in debt to themoneylender who supplies the bulk of his credit requirements at rates which
are albeit high, he may use the institutional credit fully or partly to
repay the moneylender. Such repayment increases the moneylenders' funds,
enabling him to extend his operations. So indirectly, institutionalacredit may buttress the very moneylender it was meant to replace.
Analysis of Steps to Increase Small Farmer CreditThe fact that the small farmers have not been getting their due
share of credit has been universally recognized in credit surveys. TheAIRCRC (1969) diagnosed the problem to be not so much that the larger
a This "misutilization" has been pointed out by the All India Rural Credit Review Committee (19).

97.
fanners obtained more credit than their requirements, but that a sub
stantial portion of the small fanners did not obtain co-operative credit
at all, and the lucky few who did, received too little of it in
relation to their needs. The National Commission on Agriculture
reiterated this concern when it indicated that the principle cause of
poverty among small and marginal fanners was their low resource base
and their inability to take advantage of modern technology (49). As
a result of these and similar views, certain steps have been taken in
the 1970s to increase the volume of lending to small farmers.
The first of these steps was the establishment of Small Farmers
Development Agencies on a pilot basis country-wide in 1971-72. Registered
as societies under the Societies Act, the Agencies were expected to act
as catalytic agents to obtain finance from the credit institutions and
assist the small farmer in its proper utilisation. In areas where the
co-operative structure was weak, the Agencies provided the share capital
contribution on behalf of the small farmers, issued loans to the District
Co-operative Central Banks to strengthen their financial position and to
maintain their non-overdue cover. Since one of the reasons adduced by
credit institutions for insufficient lending to small farmers was the
high administrative costs involved, the Agencies funded the hiring of
additional supervisors on a tapering basis to meet the demands of small
farmer credit. As a result of the efforts of these Agencies the lending
institutions were encouraged to drop their insistence on the credit-
worthiness of the borrower and adopt the more progressive guideline of
the credit-worthiness of the proposal. The success of the programme
(over 4 million small/marginal farmers had been identified and more than

98.
2 million actually benefited by March 1975) (20) prompted the National
Commission on Agriculture (44) to recommend their extension, so that
they now cover about 40% of the districts in the country.
The National Commission on Agriculture recommended the establish
ment of Farmers Service Societies (FSS) to cater mainly to the credit
needs of small and marginal farmers. They were to cover a development
block or population of 10,000. Starting in 1973-74 it was expected
that they would provide consumption as well as production credit together
with the full package of services and technical guidance. The Commission
had recommended the establishment of 2520 Societies over a period of 6
years and a capacity to form 1000 new Societies per year thereafter.
While membership was not to be restricted to small farmers only, management would be vested in a Board on which two-thirds of members
would be from the weaker sections, including small farmers. By the end of December 1976, there were 311 FSS, out of which 181 were sponsored by commercial banks and 130 by co-operatives. Their Statewise distribution vas
uneven with one State (Karnataka) accounting for 37% and five States
(Andhra Pradesh, Gujarat, Karnataka, Uttar Pradesh and West Bengal) accounting for 72% of the Societies (Table 5.5).
The actual functioning of the FSS has left much to be desired
as brought out in a recent study by the RBI. The study disclosed:
(i) that the stipulated representation to the weaker sections on the Board of Directors was not adhered to (ii) a large number (about 1/3)
of the FSS did not provide any services or technical guidance to members
(iii) their business was very meagre (iv) about 50% of them did not

99.
TABLE 5.5NUMBER OF FARMERS' SERVICE SOCIETIES IN DIFFERENT STATES AS ON 31.12.76
States Sponsored By Commercial Banks
Sponsored By Co-op Banks
Total
1. Andhra Pradesh 15 6 212. Bihar 4 - 43. Gujarat 1 32 334. Haryana 5 1 65. Himachal Pradesh - - -6. Jaminer & Kashmir 1 - 17. Karnataka 87 29 1168. Kerala - 10 109. Maharashtra 15 4 1910.Manipur 1 1 211.Madhya Pradesh 16 9 2512.Rajasthan 5 - 513.Tamil Nadu - 11 1114.Tripura 1 - 115.Uttar Pradesh 12 16 2816.West Bengal 18 8 2617.Orissa - 1 118.Others - 2 2
Total 181 130 311
Source: RBI : Report on Review Committee on Regional Rural Banks.(50)
provide medium term loans for agriculture and less than 2% issued any
long term loans (v) more than 90% had not issued consumption loans
(vi) more than 50% had overdues exceeding 50% of demand (vii) about 80%
of them had not undertaken any marketing of agricultural produce of

100,
their members. One may therefore concur with the conclusion that
'most of them appear to be a highly diluted version of the grand design
of the NCA and are hardly distinguishable from the reformed PACS' (50).
Taking its cue from the Report of the Banking Commission 1972,
the Working Group on Rural Banks 1975 recommended the organisation of a
new institution - Regional Rural Banks (RRB) - which would combine the
better features of both the co-operatives and commercial banks 'while
avoiding the disabilities that are inherent to them' (48). The raison
d'etre of the rural banks grew from the realisation that despite efforts
by the co-operatives and commercial banks, the institutional credit
disbursed has not benefited small and marginal farmers significantly, and
one of the more important objectives of the rural banks was to effectively
cover this group. Since the aim was to supplement and not supplant
existing institutions, the Working Group suggested that initially the
banks be set up in areas where co-operatives and commercial banks have
not made much headway and where there is considerable scope for rural
development. It was expected that Farmers Service Societies could be
financed by these banks - a branch of the rural bank could be tied to
5-10 FSS.
Starting in October 1975, 48 RRBs were established by mid 1977
of which 20 are confined to a district, 20 have a jurisdiction of 2
districts, 7 cover 3 districts and one has 4, giving a coverage in all
of 85 districts out of around 350 districts in the country (Table 5.6).
By June 1977 of the total outstanding loans of Rs. 19.58 crores in the
RRBs, 57% were to small/marginal farmers while most of the balance went
to rural artisans and others.

101.
TABLE 5.6
SPREAD OF REGIONAL RURAL BANKSAMONG STATES (AS ON 30.6. 1977)
States No. of RRBs
No. of Branches
RRBs
Percentage of of
DistrictsCovered
Percentageof
PopulationCovered
1. Andhra Pradesh 3 86 24.0 27.92. Haryana 2 40 16.7 17.73. Karnataka 3 43 26.3 32.04. Kerala 2 31 30.0 29.65. Uttar Pradesh 10 173 23.2 29.26. Bihar 7 67 45.2 62.97. Madhya Pradesh 4 62 18.6 22.78. Orissa 4 72 29.4 51.69. Rajasthan 3 62 26.9 30.210.Tamil Nadu 1 8 14.3 14.711.Assam 1 11 42.9 45.612.Jammu & Kashmir 1 26 10.0 15.913.Tripura 1 8 33.3 100.014.Maharashtra 1 14 15.4 12.115.West Bengal 4 56 53.8 48.016.Himachal Pradesh 1 8 10.0 14.9
Total 48 767 26.1 32.6
Source: RBI : Report of Review Committee on RRBs. (50)
While it would be uncharitable to judge the effectiveness of
these rural banks at such an early date, certain attempts have been made
to assess their operations. The Review Committee on Regional Rural
Banks (1978) evaluated the performance of 12 RRBs with reference toindices such as spread of branches, deposit mobilisation, credit deposit

102.
ratio, recovery performance etc. Some interesting features thrown
up by this evaluation were:(1) agricultural loans formed 69% of total loans,
out of which 46% was for term loans and 23% for
crop loans, while consumption loans accounted for
only 1%. However, their coverage of the small/
marginal farmers and other weaker sections was
inadequate (Table 5.7).
TABLE 5.7
EXTENT OF ASSISTANCE TO WEAKER SECTIONS IN 12 RRBs
Name of RRBPercentage of to the total
this type of borrowers financed estimated number in that category
Small/MarginalFarmers
AgriculturalLabourers
RuralArtisans
1. Bellary 7.3 - 5.22. Bhojpur-Rohtas 6.3 0.0 3.43. Hoshangabad 4.3 0.1 9.64. Jaipur 12.0 6.4 30.35. Koraput 0.8 1.6 2.26. Moradabad 0.9 1.2 1.17. Champaran 4.3 0.1 8.68. Bhiwani 1.4 7.8 0.19. Gorakhpur-Deoria 2.7 0.6 0.6lO.Cannanore 0.7 0.4 0.111.Khammam-Nalgonda 4.1 0.2 0.812.Mallabhum 0.1 0.0 0.0
Source: RBI : Report of the Review Committee on RRBs. (50)

103.
(2) Their credit deposit ratio was 130% compared to 64% of the commercial banks in the same area.
(3) The overdues to demand ratio was 16%.
(4) The interest rates charged by commercial banks
for advances were generally lower than those
charged by RRBs. This is an anomalous situation
as it implies that credit to small farmers was supplied at a higher rate than that supplied by
commercial banks which cater mostly for larger
farmers.
(5) Central Govt, nominees were frequently absent
from meetings of the Board of Directors of the Bank.
Based on these indicators of performance, the Review Committee concluded that 'with some modifications in their organisation and functions (RRBs) can become a very useful component in the totality of rural credit
structure 1. In fact the committee went on to recommend the phasing out of rural branches of commercial banks (of which there were 8756) in favour of RRBs. RRBs are considered better suited because of their
comparative simplicity, lower costs of operation, local involvement
through appropriate staffing pattern etc.
However, while one may not like to dampen the enthusiasm and
confidence shown by the Committee in the RRBs, indications are that this
institutional initiative is likely to strike problems as others before
it with consumption credit. Despite the importance of consumption
credit in the overall credit requirement especially for small farmers,

104.
the original Working Group had adopted a very ambivalent attitude
towards it. Without strong direction the result was that only 0.5-1%
of the loans have been made for consumption purposes. This is a very
serious shortcoming especially in view of legislations enacted by
various States aimed at eradication of rural indebtedness to the exploit
ative moneylenders. Thus if and when the supply of such credit from
informal sources dries up, there is likely to be a greater degree of
surreptitious diversion of credit from production to consumption which
may well in course of time endanger the functioning of the RRBs. It
is contended here that the basic lesson of rural credit, i.e. the
necessity to link production and consumption credit does not appear to have been learned.

105
CHAPTER 6
CONCLUSIONS
6.1 Summary
In this study an attempt has been made to analyse the importance
of agricultural credit in the process of development in India. It is
conceded that credit is not a panacea, that to promote development it is
necessary to pursue a wide range of measures and that credit is only one
of the many factors involved. For instance, a credit financed expansion
in the demand for inputs, not matched by a corresponding increase in
input supplies, will only result in a price rise, with little impact on
production and may even adversely affect distribution. However, it is
equally true that in the calculus of policy determination, to minimise
the role of credit for reasons of exigency and analytical neatness is to
underplay its significance. The increasing levels of rural unemployment
and poverty are grim testimony of the misdirection of past agricultural
credit policies. Unfortunately, however, except for a few surveys by
the Reserve Bank of India, very little comprehensive work has been done
in the field of agricultural credit in India. This has had the effect
of imposing a severe limitation of data upon this study.
The relative neglect of credit in overall developmental strategies
can perhaps be attributed to the conceptual and computational difficulties
in determining the demand for credit. This demand is composite and
derived, being the sum of the demands for consumption and production
(investment). At best, using for instance, a production function approach,

106
the marginal productivity of production credit can be calculated and it
can be hypothesised that if the marginal productivity is greater than
the cost, then the level of credit used is below optimum and vice versa (86). However, because of the fungibility of consumption and production
credit, it is difficult to estimate the overall marginal productivity of
credit.
This interchangeability is illustrated by the fact that provision
of production credit releases farmers' own funds for consumption and
tends to reduce the demand for consumption credit. Again, traditional
agriculture is characterized by a high proportion of inputs obtained from
the farm, so the requirement of credit is essentially to meet the
consumption needs of farmers. Modernisation is accompanied by the
addition of purchased inputs which implies a shift towards a greater requirement of production finance. This linkage between production and consumption credit implies that to estimate whether credit use is
optimal, it is essential to be able to estimate the marginal productivity of consumption credit. But what is the marginal productivity of consumption credit required to ensure ones continued physical existence
or satisfying compelling social obligations? Because of this problem
of measurement, no attempt has been made in this study to evaluate the
composite demand for credit except to argue that this composite require
ment is not likely to alter appreciably in the absence of introduction
of new technology.Analysis of credit supply reveals a credit gap in the rural
sector which is both quantitative and qualitative. Quantitatively,
agriculture does not get adequate finance and qualitatively, whatever
107
it does get is obtained at a high price, with the small farmers being
the most disadvantaged. Although the share of institutional credit
in the total credit supply has increased over the years, it is still
only around one-third of total credit disbursed by all sources.
Cooperatives are the major institutional source; commercial banks whose
foray into the field of agricultural credit is recent, have been found
to be more active precisely in those areas where cooperatives are
functioning more efficiently. The flow of Government credit too has
followed a similar pattern and indicates a widening of inter-regional
disparities in credit distribution. Despite the importance of credit
for small farmers, they are constrained and have to depend on higher
cost moneylenders for their requirement. One of the reasons for this
is that credit institutions provide only production credit whereas,
traditionally at least the major requirement was for consumption credit.
The reasons for this low volume of credit to the agricultural sector in general, and within this sector, to small farmers in particular, have been investigated. Our analysis shows that the inadequacy of
institutional agricultural credit cannot be explained by low interest rates as the rates were found to be higher in agriculture than in
industry and commerce.
It has been postulated here that the rate of interest is a
function of lender's opportunity and administrative costs, risk premium,
inflationary premium, and monopoly profit. An attempt has been made
to examine the contribution of these variables in the determination of interest rates. The contribution of opportunity costs and administrative
costs could not be measured owing to lack of data. Using proxies for

108
other variables, calculation of Spearman's co-efficient of rank
correlation (r') between each variable and the rate of interest, resulted
in significant values of r'. Since the values of r' for monopoly
power and inflationary premium were more than twice that of risk, it
can be concluded that within the limitations of data, monopoly power
(and inflation) rather than risk, are more important in the determination
of interest rates. This is indicative of the under-development and
fragmentation of rural financial markets.
The arguments for higher rates of interest for small farmer
credit have been examined and it has been argued here that they are not
tenable in the Indian context. Only under certain conditions, there is
some justification for higher rates on grounds of higher administrative costs. On the other hand, on equity and economic grounds, there is a
strong justification for differential rates of interest in favour of
small farmers.
Finally, an attempt has been made to ascertain and analyse
conditions which are conducive for the better operation of institutional credit agencies. Analysis of inter-State data shows that better
institutional credit arrangements and higher level of literacy, satisfactory performance in implementation of land reforms, use of
irrigation particularly well irrigation, use of chemical fertilizers,
progress in rural electrification and development of marketing are
positively and significantly associated. Although data are inadequate
to establish any causal relationship, they do tend to reinforce the view
that a mere expansion of credit without an improvement in input supplies,
rural organisation, marketing etc. is not likely to yield results.

109
6.2 Policy Implications
Since inadequacy of institutional credit for agriculture cannot
be explained by lower interest rates, to suggest policies for increasing
the volume of credit to the agricultural sector, it is pertinent to
examine why the credit flow to the rural areas is inadequate. One
possible answer lies in issues connected with the management of rural
credit institutions.
The co-operatives in India were not established by the people
to serve their felt needs. They were imposed from above. One of the
objectives was to develop leadership at the grass roots level, and hence
the management functions of primary societies were vested in their
Presidents, who are generally local politicians from the rural elite. Their interest in the performance of these societies is marginal and incidental to their main political ambitions and often the two do not coincide. Frequently, the Presidents use their office to give access
to or deny credit purely on grounds of political expediency. At the
district and State levels, although day to day management is notionally vested in a full time Manager/Secretary, the elected Chairmen supposedly
being concerned only with policy, in actual practice there is seldom a
clear demarcation in functions. Moreover, the Managers are largely on
short term deputation from the Co-operative Department, a factor which, apart from making for discontinuity in management, also impedes the
creation of a trained management pool.
The policy prescription that emerges from the above analysis is
clearly to divorce co-operative credit from politics instead of expending
110
effort, as in the past, on seemingly endless debates regarding the
optimum size or number of activities of co-operatives. It is realised
of course, that implementation of this would be difficult given the
existing political framework. But drastic remedies are required
otherwise the crippling effects of the alarmingly high overdues (nearing
50% of outstandings) are likely to paralyse these institutions.
Commercial banks (the other major institutional source) have
been more concerned with branch expansion policy under the implicit
expectation that this will lead to a substantially higher volume of
lending. That this expectation has not been fulfilled, is, in the
opinion of the author, attributable largely to the style and quality of
management. The rural bank branches have tended to be exact replicas
of their urban counterparts; from buildings and staffing patterns to organisational procedures. This superimposition is inappropriate as the environment and basic objectives of banks in the two sectors are not identical. The low levels of literacy in rural areas, the mental
reservations of farmers vis-a-vis use of banks, and the unique characteristics of agricultural production, call for a different approach
which the existing 'decolam counter culture' (48) is ill-equipped to
provide.
This is compounded by the staffing pattern and their attitudes.
The staff are generally recruited from urban areas and have urban back
grounds which acts as a constraint on meaningful interaction with
illiterate farmers. On the one hand, farmers feel ill at ease discussing
their requirements with the staff, and on the other hand since the staff
are themselves not locally recruited, they find it difficult to identify

Ill
and empathize with prospective client farmers. The basic attitudes
of the bank staff are not helpbul in this. Transfer to a rural branch
is viewed with trepidation, as a punishment or at best, as a necessary
evil. Staff are therefore not keen to take any initiatives, but try
to maintain the status quo. In fulfilling their responsibilities, they
remain impatient to revert to the urban areas. With this attitude, it
is hardly surprising that commercial banks have been net exporters of
capital from the rural to the urban areas and that a large proportion of
their lending has been for term loans, e.g. tractor loans.
The policy implication here is that there should be adminis
trative separation of rural from urban bank branches. Since the
background, skills, knowledge and temperament of personnel required for
efficient operation in rural areas is different, recruitment and training
of staff should be designed to meet these requirements.
It is, however, doubtful if a mere revamping of management of
the existing credit institutions will result in appreciably more credit
going to small farmers. Despite a number of experiments and the
establishment of agencies such as the Farmers' Service Societies, and
Regional Rural Banks to cater to their needs, their position to date has
not improved. Farmers' Service Societies were expected to look after
the credit needs of small farmers by providing them with credit, technical
services and marketing arrangements, but have been unsuccessful. The
coverage of small farmers by Regional Rural Banks is inadequate and
consumption loans form only 1% of total loans issued by them.
Small farmers have not only been denied adequate credit but

112
have also been handicapped in obtaining services such as extension,
marketing etc. One method of adequately catering for their needs is
to set up a separate credit channel exclusively for them. The
intention of this proposal is not to add one more to the plethora of
existing credit institutions. The objective could be achieved by
restructuring Regional Rural Banks in such a way as to make them
effective.
At present these banks are sponsored by co-operatives and
commercial banks which exert a major influence on their operations, and
there is a great danger that the disabilities of the co-operatives
and commercial banks will permeate Regional Rural Banks (RRBs) unless the organisational association between them is severed. Therefore, it is suggested that the restructured RRBs be organised as autonomous
corporations, one for each State with branches at the district and lower field levels.
This would impart a greater flexibility to their operations.
Personnel could be recruited locally so that they would be familiar with
local conditions. This would not only help to reduce educated rural
unemployment but would also help in keeping administrative costs down since they need not be paid the high salaries that are available to staff
in commercial banks.
To be effective a small farmer credit programme needs to learn
from the operation and experience of the moneylenders. The popularity of informal sources is due to their accessibility, flexibility, adapt
ability, simplicity and the fact that they provide consumption as well

113
as production credit. These services are possible because of the
moneylenders' intricate knowledge of local production possibilities,
of the character of individual borrowers and of the value of assets
offered as security. With the modifications suggested, the RRBs would
be able to use similar methods of operation to those followed by
informal credit sources.
It is envisaged that these reorganised RRBs would function in
close association with Small Farmer Development Agencies (SFDA) so that
small farmers would obtain supervised credit"*" which would include credit,
technical and financial management advice and marketing facilities.
These proposals may draw criticism on the ground that they would increase
the costs of lending. This need not be so, however, as (i) Farmers
Service Societies would become redundant and their closure would reduce
overall costs of credit disbursement; (ii) RRBs are already in existence;
(iii) SFDAs have been in operation for some years and cover about 40%
of the districts in the country; (iv) any increase in administrative
costs, would be counter-balanced by a reduction in default rates to be
expected with the closely supervised credit arrangement. Furthermore,
in view of the special position that small farmers occupy in the economy,
even if there were a slight increase in costs this could be traded off
against the benefits that would follow from an effective extension of
credit to small farmers. Viewed in the context of laws to curb the
1 At present supervision of credit in India has meant the incorporation of a kind component (usually fertilizers) in the distribution of crop loans. This is apparently based on the premise that farmers will misutilise loans if given in cash. Even if the validity of this assumption is not questioned, it ignores the fact that fertilizers are a very marketable commodity, and there is nothing to prevent farmers from obtaining cash by sale of fertilizers. Such 'supervision' is misconceived and only serves to increase the cost of credit.

114
activities of moneylenders, there is an urgent need to fill up the
vacuum in the supply of credit to small farmers. Reliance on pro
grammes that involve only marginal change to the present unsatisfactory
arrangements is likely to perpetuate the existing misallocation of
resources.

ANNEXURE 1
115
THE _________________CO-OPERATIVE AGRICULTURAL DEVELOPMENT BANK LTD.No.
Date of receipt: L.A.No.referred to Supervisor
Total amount of feescollected: Date:
Secretary's initials:
APPLICATION FOR LOAN
Date:
ToThe Secretary,
The __________________Co-operative Agricultural DevelopmentBank Limited,
The loan application of Sri/Smt.
a resident of ______________ village in the taluk of ___agriculturist and a member of your bank with General No.
I request that a loan of Rs. _______ may be sanctioned to me for
the development of my land on the mortgage of lands mentioned in this
application and the produce raised on it annually. I have read the conditions stipulated in the annexed loan application and the by-laws
of your Bank and other regulation stipulated therein. I shall abide
by them and also agree to abide by any modifications that are made in the
future. I am taking this loan for the benefit of my family as manager
of the members of the joint family on my behalf and on behalf of my
brothers, sons, daughters etc. of the joint family. I furnish herewith
the full particulars relating to the loan application. I am remitted
Rs. towards the administrative and other fees.
SIGNATURE OF THE APPLICANT

ANNEXURE 1 (contd)
STATEMENT OF THE MEMBER116
ToThe Co-operative Agricultural Development Bank Ltd.
I, ______ ______________________________________ , member No.______of your Bank, resident of ______________________village, _____________ taluk,solemnly affirm and state that:
(1) I stated that the total amount of loans I previously owed asRs.__________. The loans mentioned are due to the persons shown againstthem only. No other loans are due by me to any other person. It issolemnly affirmed that I do not have any other loans except those mentioned in the application and in case it is found, otherwise, I shall abide by the civil and criminal actions taken by your bank besides agreeing not to object the action of the bank for foreclosing the loan to be given to me by the bank and to recover the amounts of loss incurred by the bank on account of me by bringing the properties offered by me as mortgage to the bank and other movable and immovable properties belonging to me to sale.I also hereby affirm that I will not borrow loans till the final discharge of the loan applied for from your bank.
(2) I have taken this loan, solemnly affirming that except mortgagingthe properties to the bank previously under document No. ___________ dated____________ , I have not mortgaged nor alienated these properties to anyothers nor there are any auctions or executions by any civil court or Revenue Department. If at a later date, any other alienations or any other liabilities are noticed, excepting those mentioned in the application, I shall abide by the civil or criminal action to be taken by your bank.
(3) I shall not offer the properties offered by me to the Bank or the produce raised annually on it to any other person as security till the loan taken by me from your Bank is completely discharged.
(4) I do not owe any amount to the Government towards kist or cess on any of the land owned by me as on date. I am enclosing the relevant receipts herewith. In future also, I shall remit the kist amount and cess on all the lands owned by me in time and shall produce the receipts every year by first May, in case the bank desires so. In case of failure,I agree to the action to be taken by the bank for collecting the entire loan without reference to the instalment on this plea alone.
(5) I have furnished the details of the development I am going todo at page No. ____. I request you to grant me a loan of Rs.______ afterverifying them. I shall repay such loan amount in ____ years in equatedannual instalments together with interest at the rate fixed by you.
(6) The persons of the joint family interested in the property shall join as ' B' Class members and execute the mortgage bond along with me.
Yours faithfully,Village:
Date: SIGNATURE OF THE APPLICANT.
The applicant swore before me that the above mentioned particulars are true and signed the statement.
SIGNATURE OF THE VILLAGE OFFICER

EXTR
ACT
OF S
ETTL
EMEN
T FA
IR A
DANG
AL P
REPA
RED
IN T
HE Y
EAR
RELA
TING
TO
VILL
AGE
iä
o54 so• a)
o <d 2 rsrd qj 4-) i-4 44 +jcd -H C4 EH
qjx i4->
44o
+jCO
3
a)+Jcdcd ft cd
§54cdPi
oft
*• QJ CO 4-> ft Cd O touU X)
44 c0 o 32: o1 a) f t+J E44 cd oH 54 U
r4 I—I
O I—I
ft
CO
4)
117
TJ4-5 ÖQJ rd 44i—1 HTJ QJQJ 4-5 4444 to • 0
1 cd QJÖ S X QJ•H 0 Ü C2cd 54 n 54 0Pd O E 53 •Hrd O 4454 4-> 54 CO cd0 aj 0 ft£ ft *. •H>i 44 5454 54 54 QJ 54a O O £ ■H
•H54s §x a4-> Ho>1 54Pd O
QJ>54P! 54 54CO QJ CD
rQ 4->d § p h 3 (Ü O 2 ft
>iQJ>5453 CO
-MÖQJCO0554
CO•H 54 CO QJ

ANNEXURE III
118
EXTRACT OF 10 (1) ACCOUNT FOR _________ FASLI (CULTIVATION YEAR)RELATING TO __________________ VILLAGE OF ________________ TALUKIN DISTRICT SETTLEMENT REGISTER
Name of the Person:
Particulars of years
1
Survey No. Totaland Sub- DRY______ WET kistdivisionNo. of the Extent kist Extent kistfield
2 3 4 5 6 7
N.B.
8

EXTR
ACT
OF N
O. 2
ACCO
UNT
(AGR
ICUL
TURI
ST-W
ISE
CULT
IVAT
ION
ACCO
UNT)
OF
THE
___
____
____
____
____
____
__ V
ILLA
GE O
FTA
LUK
IN
DIST
RICT
FOR
THE
CUL
TIVA
TION
YEA
R __
____
____
Xft3eCD&
I Cn CD ft Ö U CD "H -H ft W 'H 3 -rj C/3 > O
COXftfd£CDDh
CD ft Cn CD fd U I— I * H rft ft •H ft > O
CD X! ft4-1 OCDft ft fd Oe ft•H U -PCO 4-1 W 0X4-> I -PÖ ft COO ft (d (D HS o S3 >
43rH
LD i— I
ft H X P H UCD X! CD +J
I 4-1Z O4-1oXftaoa
aoftu
co•Hftcd>
nr—I
CM I— I
rH I— I
orH
***
43CD -P fd > ■H P I— Ift)ÜCO•H
COCD X X C ft -HO Ö •H Pft P fd a ft a) s>1 CD rHqo
ft CD O XCOCD P
- OCO -n
ftH
fd CD ft coop X ft) s 0 X P ft CD •H 43S qCDftfdto43
COc •0 CD CO ft ft fd CDft COcd q
ft X fd H P H
ftoCOrH•HidpCD43CDXP
COCOCDrHfdppidftftoft
pcCDPX(Da)Xp
ftoftcd q u fdft HpO CO co fdCo•HP<dtp•Hftft•H43 Ö fd I—IftoCO I— I •H fd p CDa
o
xCO>1 I— ICO p 0 •H >CD ft ft ft ftCO -H 43§ SH O
X CD P XP S
COCDÜftP0COÖO•HPfdtp•H
119

STA
TEM
ENT
OF
THE
PRO
PER
TY
THA
T IS
TO
BE
M
ORT
GA
GED
TO
TH
E BA
NK
I
S N H V w a H II
s o q o j q u e s o j d p u p i p -[0 oq ß u x p jo o o o Joqum N j
Ao a jr s q o o o j o onquA o q o u rrx o jd d Y !
SpUPX Oqq UO 9 UIOOUI III
x n op 0 SP0 p JO uoxq.PATq.xno umo jo q q o q M
IPSP03
SwpPSwC403<
q .upoxxddp I oqq oq ß u x q p x o J q u o q x g i
*ON Ä0 AXUS I oqq ux pupx s,q .upoxxddp i
oqq S0TX opxs qoxq/A uo iII-------------------------------------------------------------1I
■on ÄOAxns oqq jo q.uoqxo xuqoj, 1II-------------------------------------------------------------1I I
joqum N ä o a ju s
q.uPOTxddp joqq. q o p u p x oqq oq s o x jo p u n o g i
•on Ao a jr s oqq ux so x p p u u j s .q u p o x p d d p oqq 'o p x s qoxqw uo
----------------------------------------------------1I
•o n 'S oqq j o quoqxo xeqoj. jI----------------------------------------------------1I
p p o jj sqq jo ouiPN jI
----------------------------------------------------1
00I—I
rH
VDr—I
inrH
rH
mrH
CMrH
rHrH
q u p o x p d d p oq ß u x q p x o x q u o q x g i r"
• on Ao a jr s 1 ^
qo/A xo ä j q ! <n
q s u d o q q ux [ sp u p p u ipu i j o x jp p u x u rp z jo q q o q M j
oßppXTA 9q q J ° ouiPN [ H
•H CDC/3 tn03 xdCD S CD03 i—i03 f t S0 0 0a G
ft f t03 03
•H CD >if t f t 6
G CD 4h•H f t 0
f tCD f tP 0 03cd f t CD
ftft 03G xd CDd G ftÜ cd ft
•H rHi—1 0ft CD ftf t 03cd CD ft
f t GCD ft CDf t ef t G -P
0 pf t cd0 03 f t
G CD>1 cd Qft 0p i—1 CDCD qf t •H G0 > CDP 0 >f t u C3
o PSxd cdCD EH Pc 00 0
•H G ftf t pg (D qCD P 0e cd u(D CD rH> P •H0 CD >
A f t •H<3 f t uCD xd >if t G Gft cd cdft f t >1cd G f tf t CDft P 03
2 Gxd p 0g CD "H
> •pQ qO ü
-p <Du CD XCD f t CDP ftP P0 0 0o f t
03CD (D GP q 0<d xd •H
ftCD • CD U> 03 q q0 P G cdf t cd CDcd CD > 44
>c CD 0xd Pcd m 03ft H xd G03 G 0
•H ft cd •HG 03 rH ftP cd oq h 4-1 cd
4-1 0CD 0
03 ft 03 GP ft Pcd cd CD-H P CD Pq 0 p cdo ft p
•H cd CD1 ft ft p1 p c 0 CD1 Cd CD G ft1 cq i • ft1 >1 CD CD1 CD o P Cn ft1 ft -n cd xd cd1 ft g CD ft1 Q CD CD rH ft1 W ft p £1 H cd xd <D 0 xd1 Em ft g ft G G1 H Eh cd Pc M s1 Eh1 PS1 W X---Ni r ) i—1 rsi ro
120
SIG
NA
TUR
E O
F TH
E V
ILLA
GE
OFF
ICE
R
SIG
NA
TUR
E O
F TH
E A
PPL
ICA
NT

Name o
f the
village
Dry
or w
et
Survey No.
Extent
Self c
ultivated
Income
or l
eased
1 dJ 1 11 ■P P 1 1 <31 P fd 1 i 01 QJ 1 1 01 Oh 03 1 i f t1 0 Q) 1 il P QJ 43 f t 1 1 441 Oh f t 0 H 1 1 O1 •P -H U 1 1 00l 03 d H I 1 QJ1 Q) P P f t 1 1 O1 d 0 d f t 1 i dl 0 f t O 1 i fdi •H -P 1 i i—i1 •P d CO f t 1 i fd1 £3 QJ P U 1 1 CQ1 QJ S fd < 1 i1 B > i H f t 1 i1 0 d f t 1 i1 QJ - n O H 1 i1 > £3 -H > 1 i1 0 QJ 4-1 l 03
• 1 f t n f t 1 1 44 0) COPQ l fd o3 fd O 1 1 f t P QJ 03
r - i £3 f t 1 1 QJ 43 d2 l QJ fd f t 1 1 CO 44 44 fd
l 43 QJ f t 1 1 f t 44 i—1l 44 £3 43 f t 1 1 0 0l 0 44 f t 1 44 Pl 44 -H < 1 l 03 co QJi fd CO 03 2 1 1 QJ 03 QJ 43l f t 0 d f t 1 1 Cn d f t 44 r -l 4-> QJ fd H 1 I td fd fd 0l CO W 1 i f t f t f ti 03 CO 4-1 1 1 44 44 pl CD 0 d • 1 1 P QJ P 0l •h f t fd 4-1 1 1 0 43 0l 44 O O 1 1 B 44 B 32l •H d 'H QJ 1 1 dl 4-1 *H i—1 P 1 i 4h d co cdl P f t P 1 1 H 0 fd 43l QJ CO f t 0 1 1i U -H fd Ü 1 1
<H P 0
0) f t tn -P 0 O tx>4-> 0 P 03
§ %
030dO•H4->d0B0>0
■a
ft £0)
43-P
0-P0tn0cm-Pp
0)B> i
434*dfd43043 -P
BOp44
030
•HI-1
O -HB £
0 0 43 43 f t 4J
P CO O d
44 0 O03 -H 0P 0 QJ >
44 O f t f to fd
Ci ’H Ohfd P
QJd 43 fd -P 0 O rHQ) g
-P 43 -P
O -H ■P S
VO
ID
ro
CM
i 1 QJ 1 1Eh i 1 CO QJ 1 12 i 1 0 43 1 1< i 1 £1 44 d 1 1U i 1 P fd VO 1 1H i 1 d 44 0 1 1ft i 1 f t 0 f t 1 1f t
a
iii
11I
11I
11I
Wii
111 44
111
111 QJa i w 1 d d 1 1 ft
Eh i Q i d QJ 1 1 44i Z 1 0 42 LT) | 1ft i Jx I B fd 1 1 CO 44
O i f t 1 3 44 1 1 d 0i 1 1 1 fd
w i f t 1 1 1 o cof t i - 1 1 1 f t COf t i Eh 1 1 1 QJEh i 2 1 QJ 1 1 <u d< i «3 1 44 1 1 f t 442 i U i fd f t 1 1 44 Oe> i f t 1 Q 1 1 0H i f t 1 1 l 44 Pw i ft 1 1 1 0 P
i f t 1 QJ 1 1 0i 5 1 f t QJ 1 1 CO u Wi 1 fd 44 1 1 p fti 1 f t 0 1 1 fd 0 Di 1 44 2 1 1 f t f t f ti 1 P 1 1 d 44 <i 1 0 >1 1 1 Ü 2i i e p 1 1 •H o CJi 1 0 1 1 P 44 Hi 1 44 CO ro | 1 P UJi 1 0 co 1 1 f t 0 44i 1 -H 1 1 w Oh »-Ii 1 CO g 1 1 (J 0i 1 f t o 1 1 H 0 wi 1 f t p 1 1 f t f ti 1 fd f t • 1 1 f t 44 Bi 1 44 u 1 1 oi 1 OJ P 44 1 1 0 03i 1 Q 0 QJ 1 1 > 1 44 0i 1 1 1 f t d -Hi 1 1 1 f t •H 44i 1 1 1 D 0i 1 1 1 CX 03 -Hi 1 1 1 2 0 44i 1 1 1 f t P 0i 1 1 1 ■H 0i 1 1 1 f t di 1 1 1 f t U* 03i 1 1 44 1 f t d di 1 1 QJ 1 0 0i 1 1 f t 1 f ti 1 1 Ü 1 O > i 44i 1 1 0 1 h di 1 1 W 1 f t rH 0i 1 1 1 f t 0 Üi 1 1 QJ 1 < d -Hi 1 1 > 1 o 0 Hi 1 1 f t 44 1 H 0 Ohi i d 1 44 d 1 f t P Ohi 1 o 1 fd QJ 1 H 0 0i 1 CO 1 P g 1 f t Ohi i p d 1 QJ 2 1 f t 0i i QJ d 1 f t p 1 f t 0 f ti 1 f t 0 1 0 QJ 1 u > 44i i f t 1 1 > 1 0i 1 QJ 1 0 0 1 f t > ii 1 43 QJ 1 o u 1 f ti 1 44 43 CM 1 to 1 Hi 1 44 1 B B d 1 0i 1 44 1 0 0 fd 1 44 >i 1 0 03 1 P P 0 1 0 0i 1 QJ 1 44 44 f t 1 f t f ti 1 QJ d 1 1 44 (di 1 B co 1 CO CO p 1i 1 fd CO 1 d d QJ 1 03 03i 1 2 f t 1 fd td f t 1 0 0i 1 1 0 0 44 1 •H f ti 1 1 id f t O 1 44 0i 1 1 •H -H •i 1 0 1 1 44 £ 0i 1 2 f t 1 v 1 P P Bi 1 td 43 U 1 0 d idI i m 1 -—- s— I n 4h 0
121
SIGN
ATURE
OF T
HE A
PPLICANT

ANNEXURE VII122
STATEMENT OF INCOME AND EXPENDITURE
Rs.
ANNUAL INCOME
(1) On lands offered for mortgage.
(2) On other lands.
(3) On other properties.
(4) On profession, business etc. ___TOTAL:
ANNUAL EXPENDITURE
1. Agricultural expenses
(a) On lands offered for mortgage.
(b) On other lands.
2. Taxes
(a) On lands offered for mortgage.
(b) On other lands.
(c) Other taxes.
3. Family expenses
4 Other expenses ___TOTAL:
NET INCOME
SIGNATURE OF THE APPLICANT

ANNEXURE VII(cont<
123
DETAILS OF DEVELOPMENT PROPOSED ON THE LANDS BY THE APPLICANT
( The details of the various developments proposed by the applicant and the expenditure to be incurred should be mentioned in detail. The details of lands, their Survey Numbers and their extent on which the developments are proposed should be mentioned. The additional income that could be derived should also be mentioned with details.)
SIGNATURE OF THE APPLICANT

124
REFERENCES
1. Planning Commission 1978. Draft Five Year Plan 1978-83. Govt, ofIndia, New Delhi.
2. Dandekar, V.M. and Rath, N. 1971. 'Poverty in India', Economic andPolitical Weekly, Jan. 18.
3. Clark, Colin 1972. 'Extent of Hunger in India', Economic and PoliticalWeekly, Sept. 30.
4. Minhas, B.S. 1974. Planning and the Poor. S. Chand and Co. Delhi.
5. Lipton, M. 1974. 'Agriculture: Urban Bias and Rural Planning',inCrisis of Indian Planning - Streeton, P. and Lipton, M. (ed) London.
6. Mangahas, M., Recto, A.E., Ruttan, V.W. 1966. 'Price and MarketRelationship for Rice and Corn in the Philippines', Jour, of Farm Economics, Vol. 48, Aug.
Hayami, Y. 1969. 'Sources of Agricultural Productivity Gap Among Selected Countries', Amer. Jour, of Agric. Econ., Aug.
8. World Bank 1975. Agricultural Credit Sector Policy Paper. Washington.9. Howse, C.J. 1974. 'Agricultural Development Without Credit', Agric.
Administration, Vol. 1(4).10. Gurley, J.G. and Shaw, E.S. 1955. 'Financial Aspects of Economic
Development', Amer. Eco. Review, Vol. 45, Sept.
11- FAO 1975. Agricultural Credit for Development. Rome.12. Lowdermilk, M.K. 1972. 'Diffusion of Dwarf Wheat Production Technology
in Pakistan's Punjab', AID Spring Review of Small Farmer Credit, Vol. 14.
13. Schlüter, M.G. 1973. 'Role of Co-operative Credit in Small FarmAdoption of New Cereal Varieties in India', AID Spring Review of Small Farmer Credit, Vol. 10.
14. Dahia, L.N. 1975. 'Impact of Cash Availability on Farm Income andDemand for Cash', Asian Econ. Review, Vol. 17 (1/2/3).
15. Hanumantha Rao, C.H. 1970. 'Farm Size and Credit Policy', Econ. and Political Weekly, Review of Agric., Dec. 26.
Crawford, John (Sir) 1969. 'India' in 'Agricultural Development in Asia', R.T. Shand (editor), ANU Press, Canberra.
16.

125
17. Mosher, A.T. 1965. Getting Agriculture Moving. Praeger, New York.18. Shultz, T.W. 1964. Transforming Traditional Agriculture. Yale Univ
Press.19. Reserve Bank of India 1969. Report of the All India Rural Credit
Review Committee. Bombay.20. Govt. oJE India 1976. Indian Agriculture in Brief. 15th edition -
Directorate of Economics and Statistics, Ministry of Agriculture and Irrigation, New Delhi.
21. Gopalan, M. 1976. 'Current Trends in Rural Indebtedness', EasternEconomist, Vol. 66(17).
22. Day, R. and Singh, I. 1971. 'A Micro-Economic Chronicle of the GreenRevolution', Indian Jour, of Agricultural Economics, Feb.
23. Reserve Bank of India 1954. All India Rural Credit Survey. Vol. IIBombay.
24. Hough, E.M. 1953. The Co-operative Movement in India Before Partitionand in Independent India. Oxford Univ. Press, London.
25. Shetty, S.L. 1978. 'Performance of Commercial Banks Since Nationalisationof Major Banks', Economic and Political Weekly, Spl. Number, Aug.
26. Nelson, R.R. and Phelps, E.S. 1974. 'Investment in Humans, TechnologicalDiffusion and Economic Growth', American Econ. Review, Vol. 56(2).
27. Chaudhri, D.P. 1968. Education and Agricultural Productivity in India.Ph.D. dissertation, Univ. of Delhi as reported in Shultz, T.W.:The Value of the Ability to Deal with Disequilibria. Jour, of Econ. Literature, Sept 1975.
28. Myrdal, G. 1968. Asian Drama; An Enquiry into the Poverty of Nations.Vol. II Penguin Press, London.
29. Joshi, P.C. 1975. Land Reforms in India. Allied Publishers, New Delhi.
30. Goldberger, A. 1964. Econometric Theory. Wiley, New York.
31. Christ, C. 1966. Econometric Models and Methods. Wiley, New York.
32. Sen, A.K. 1962. 'An Aspect of Indian Agriculture', Economic and PoliticalWeekly, Feb. Annual Number.
33. Saini, G.R. 1971. 'Holding Size, Productivity and Some Related Aspectsof Indian Agriculture', Economic and Political Weekly, June 26.
34 ■ Khusro, A.M. 1968. Returns to Scale in Indian Agriculture. in Khusro:Readings in Agricultural Development, Allied Publishers, New Delhi.
Sen, A.K. 1975. Employment, Technology and Development. Oxford Univ. Press.
35.

126
36. Rao, A.P. 1967. 'Size of Holding and Productivity', Economic andPolitical Weekly, Nov. 11.
37. Rudra, A. 1968. 'More on Returns to Scale in Indian Agriculture',Econ. and Political Weekly, Review of Agriculture, Oct. 26.
38. AID 1973. Spring Review of Small Farmer Credit. Vol. 20, Washington.
39. Donald, G. 1976. Credit for Small Farmers in Developing Countries.Boulder.
40. Reserve Bank of India 1976. Statistical Statements Relating to theCo-operative Movement in India. Bombay.
41. Dantwala, M.L. 1976. 'Agricultural Policy in India Since Independence',Indian Jour, of Agric. Economics, Vol. 31(4).
42. National Council of Applied Economic Research 1974. Credit Requirementsfor Agriculture, New Delhi.
43. Reserve Bank of India 1970. Studies in Agricultural Credit. Bombay.
44. Bessel, J.E. 1975. 'Appraisal of Credit Worthiness of Emergent CommercialFarms in Developing Agriculture', Agricultural Administration,Vol. 2(4).
45. Lipton, M. 1976. 'Agricultural Finance and Rural Credit in PoorCountries', World Development, Vol. 4(7).
46. Shah, A.C. 1971. 'Institutional Credit for Agriculture', Indian Jour.of Agric. Economics, Dec.
47. Gonsalez-Vega, C. 1972. 'Interest Rate Policies and Small Farmer CreditPrograms in LDCs', AID Spring Review of Small Farmer Credit,Vol. 19, Washington.
48. Govt, of India 1975. Report of the Working Group on Rural Banks.Ministry of Finance, New Delhi.
49. National Commission on Agriculture 1973. Interim Report on Reorientationof Programmes of Small Farmers and Marginal Farmers and Agricultural Labourers Development Agencies. New Delhi.
50. Reserve Bank of India 1978. Report of the Review Committee on RegionalRural Banks. Bombay.
51. Bhaduri, A. 1977. 'On the Formation of Usurious Interest Rate, in BackwardAgriculture', Cambridge Journal of Economics, Vol. 1.
52. Bottomley, A. 1964. 'The Determination of Pure Rates of Interest in Under-developed Areas', Review of Economics and Statistics, Vol. 46.
Long, M. 1968. 'Interest Rates and the Structure of Agricultural Credit Markets', Oxford Economic Papers, Vol. 20(2).
53.

127
54. Rudra, A. 1975. 'Loans as a Part of Agrarian Relations', Economic andPolitical Weekly, Vol. 10(28).
55. Prasad, P.H. 1974. 'Reactionary Role of Usurers' Capital in Rural India',Economic and Political Weekly, Spl. No. August.
56. Bottomley, A. 1975. 'Interest Rate Determination in Underdeveloped RuralAreas', American Jour, of Agricultural Economics, Vol. 57(2).
57. Sen-Gupta, J.K. 1957. 'Role of Monetisation in Agriculture', IndianJournal of Agricultural Economics, Vol. 12(4).
58. Reserve Bank of India 1965. All India Rural Debt and Investment Survey,1961-2. RBI Bulletin, Sept.
59. Ghatak, A. 1975. 'Rural Interest Rates in the Indian Economy', Journalof Development Studies.
60. Govt, of India 1972. Report of the Banking Commission. Delhi.
61. Rudra, A. 1978. 'Interlinkage of Land, Labour and Credit Relations',Economic and Political Weekly, Annual Number, Feb.
62. Kurup, T.V.N. 1976. 'Price of Rural Credit. An Empirical Analysis ofKerala', Economic and Political Weekly, July 3.
63. World Bank 1976. Development Finance Companies. Sector Policy Paper,April.
64. Shetty, S.L. 1976. 'Deployment of Commercial Bank and Other InstitutionalCredit: A Note on Structural Changes', Economic and PoliticalWeekly, May 8.
65. Ramakrishna, K.T. 1974. 'Nationalised Banks and Neglected Sectors: AReview', Asian Econ. Review, Vol. 16(3).
66. Abbot, J.C. 1976. 'Credit for Food Policy in LDCs', Food Policy, May.67. Gonsalez-Vega, C. 1977. 'Interest Rate Restrictions and Income
Distribution', American Jour, of Agricultural Economics, Vol. 59(5).
68. Anderson, J., Dillon, J.L. and Hardekar, B. 1977. Agricultural DecisionAnalysis. Iowa State University Press.
69. Lipton, M. 1975. 'Urban Bias and Food Policy in Poor Countries', FoodPolicy, Vol. 1, Nov.
70. Thamarajakshi, R. 1968. 'Inter-Sectoral Terms of Trade and Marketed Surplus of Agricultural Produce, 1951-2 to 1965-6', Economic and Political Weekly, June 28.
Lakdawala, D.T. 1975. 'Direct Taxation of Agriculture', Indian Jour, of Agricultural Economics, Vol. 30(4).
71.

128
72. Jalan, B. 1971. 'Differential Interest Rates', Economic and PoliticalWeekly, Sept. 4.
73. Meitzer, A.H. 1967. 'Major Issues in the Regulation of FinancialInstitutions', Journal of Political Economy, Aug. Supplement.
74. Chaudhari,D.P. Education, Innovations and Agricultural Development.A Study of North India (1961-72) - Forthcoming Book.
75. McKinnon, R.I. 1973. Money and Capital in Economic Development.Washington.
76. Von Pischke, J.D. 1978. 'When is Smallholder Credit Necessary?'Development Digest, Vol. 16(3).
77. World Bank 1975. The Assault on World Poverty. John HopkinsUniversity Press.
78. International Labour Organisation 1977. 'Employment, Growth and BasicNeeds', extracted in Development Digest, Vol. 15(1).
79. Adelman, I. and Morris, C. 1968. 'An Econometric Model of Socio-Economicand Political Change in Underdeveloped Countries', American Economic Review, Vol. 58(5), December.
80. Ahluwalia, M.S. 1978. 'Rural Poverty and Agricultural Performance inIndia', Journal of Development Studies, Vol. 14(3), April.
81. Nurkse, R. 1963. Problems of Capital Formation in UnderdevelopedCountries. Oxford University Press, New York.
82. Bauer, P.T. and Yamey, B.S. 1957. The Economics of UnderdevelopedCountries. Chicago University Press, Chicago.
83. Desai, B.M. and Desai, D.K. 1970. 'Is Inadequacy of Institutional Credita Problem in Changing Agriculture?' Economic and Political Weekly, Review of Agriculture, Sept.
84. The Australian National University and Planning Commission, Governmentof India 1977. The High Yielding Varieties Programme in India, 1970-75. New Delhi.
85. Gupta, A. 1975. Marketing of Agricultural Produce in India. Bombay.
86. Jones, T.L. 1971. Agricultural Credit Institutions. in Institutionsin Agricultural Development, Iowa State University Press.
87. Reserve Bank of India 1977. All India Debt and Investment Survey 1971-72,Bombay.
88. Government of India. 1978. Report of the Working Group of DifferentialRate of Interest Scheme, New Delhi.
89. Centre for Monitoring Indian Economy. 1977. Basic Statistics Relating to the Indian Economy. Bombay.
Government of India. 1970. Agenda Notes of Chief Ministers' Conference on Land Reforms, New Delhi.
90.

129
91. Mandal, G.C. & Ghosh, M.G., 1968. 'Study of Marketed Surplus of Paddyat Farm Level in four East Indian villages', Indian Journal of Agricultural Economics, Sept.
92. Parthasarathy, P.B. & Kamalakar, M., 1975. 'Marketable and MarketedSurplus in Paddy and Groundnut on Small Farms', Indian Journal of Agricultural Economics, Sept.