an embedded markov chain modeling method for … · an embedded markov chain modeling method for...
TRANSCRIPT

An Embedded Markov Chain Modeling Method for
Movement-Based Location Update Scheme
Peipei Liu1, Yu Liu
2, Liangquan Ge
1, and Chuan Chen
1
1 School of Information Science & Technology, Chengdu University of Technology, Chengdu, 610059, China
2 Beijing Railway Bureau, Beijing, 100860, China
Email: {xpiy, chenchuan718}@163.com; [email protected]; [email protected]
Abstract—In this paper, an embedded Markov chain model is
proposed to analyze the signaling cost of the Movement-Based
Location Update (MBLU) scheme under which a Location
Update (LU) occurs whenever the number of cells crossed
reaches a threshold, called movement threshold. Compared with
existing literature, this paper has the following advantages. 1)
This paper proposes an embedded Markov chain model in
which the cell residence time follows Hyper-Erlang distribution.
2) This paper considers the Location Area (LA) architecture. 3)
This paper emphasize the dependency between the cell and LA
residence times using a fluid flow model. Close-form
expressions for the signaling cost produced by LU and paging
operations are derived, and their accuracy is validated by
simulation. Based on the derived analytical expressions, we
conduct numerical studies to investigate the impact of diverse
parameters on the signaling cost. Index Terms—Embedded markov chain, hyper-erlang
distribution, Location Management (LM), Movement-Based
Location Update (MBLU).
I. INTRODUCTION
A. Motivation In a cellular network, the current location of a User
Equipment (UE) is tracked by the network so that the UE
can successfully receive the incoming calls. Location
management is responsible for tracking the current
location of the UE. LM contains two basic operations, i.e.,
Location Update (LU) and paging. LU is the process
through which an UE periodically updates its location
information in the network database. Paging is the
process through which the network sends broadcasting
messages in a paging area to page a called UE. In Global
System for Mobile Communication (GSM), the coverage
Areas (LAs) each of which consists of a number of cells.
The network adopts a two-tier architecture including
Home Location Register (HLR) and Visitor Location
Register (VLR) databases. The HLR and VLR databases
respectively record an UE’s permanent and temporary
Manuscript received April 3, 2015; revised July 20, 2015.
This work was supported by The National High-tech R&D Program
of China (863 Program) under Grant No. 2012AA061803-06 and The
Huimin project of Science and Technology of Chengdu under Grant
No.2014-HM01-00160-SF. Corresponding author email: [email protected].
doi:10.12720/jcm.10.7.512-519
information, such as location information, identity
information and so on.
LM schemes are divided into two categories, i.e., static
and dynamic LM schemes. Under the static LM scheme,
a LU is performed only when an UE crosses an LA
boundary, and the paging area for all the UEs is the same,
i.e., an LA. The static LM scheme is not cost effective,
because the mobility characteristics of individual UEs are
neglected. Suppose that a UE has frequent incoming calls,
frequent LUs are propitious to reduce the paging cost.
While for a UE with high mobility, reducing the number
of LUs contributes to decrease the LU cost. Thus, an
effective LM scheme should consider the mobility
characteristics of individual UEs.
To overcome the defects of the static scheme, three
dynamic LM schemes are proposed, i.e., Distance-Based
Location Update (DBLU) scheme [1], Time-Based
Location Update (TBLU) scheme [2], and Movement-
Based Location Update (MBLU) scheme [3]-[13]. Under
the three dynamic LU schemes, a LU is performed
whenever the traveled distance, elapsed time, and crossed
cells reaches the predefined threshold, called distance
threshold, time threshold and movement threshold,
respectively. A large number of studies showed that the
MBLU scheme is the most cost-effective and
computation-efficient as it does not need to consider the
network topology [3]-[6]. This paper proposes a
mathematical model to investigate the performance of the
MBLU scheme.
B. Existing Studies
Based on whether the LA architecture, the existing
studies about the MBLU scheme are mainly divided into
two categories.
Studies [3]-[6] belong to this group considering LA
architecture. Li et al. in [3] first proposed a mathematical
model to analyze the performance of MBLU scheme with
HLR/VLR architecture in GSM networks. However, the
proposed model in [3] neglected the VLR LUs deduced
by LA boundary crossings, which is proved by Wang et
al. in [5]. On the basis of the proposed model in [3],
Rodriguez-Dagnino et al. in [4] utilized renewal theory to
analyze the signaling cost, but the defect appearing in [3]
still exist. Besides, both the two models assumed that the
cell boundary was independent with LA boundary, such
that one cell may belong to more than one LA. Wang et
512
Journal of Communications Vol. 10, No. 7, July 2015
©2015 Journal of Communications
of the network is partitioned into non-overlapped Location

al. in [5] proposed a new mathematical model to describe
the VLR LU due to the movement threshold achieving or
the LA boundary crossing. However, [3]-[5] neglected
the dependency between the cell residence time and LA
residence time, such that the derived results are not
accurate. Studies [2], [7]-[13] belong to this group
without considering the LA architecture. Although these
studies proposed some optimal paging schemes and new
analyzing approaches [8], [9], the mathematical models
were imperfect. Recently, Wang et al. in [6] proposed a
mathematical model with two call handling models to
analyze the signaling cost. In addition, the size of paging
area has been determined in [6]. However, the proposed
model considered that the cell residence time follows
exponential distribution, which does not accurately
describe the real network. On the basis of [6], this paper
proposes a comprehensive mathematical model to
investigate the performance of the MBLU scheme
through relaxing the limitation that the cell residence time
follows exponential distribution. As the size of paging
area has been determined in [6], this paper pays only
attention to the LU.
C. Our Contributions
The main contributions of this paper are as follows. 1)
An embedded Markov chain model is proposed to
investigate the MBLU scheme. In the proposed model,
the cell residence time follows Hyper-Erlang distribution
(HERD), which can capture the mobility and traffic
characteristics of each UE. In addition, this paper does
not use the residual life theorem used in the literature [3]-
[5], [7]-[14]. This theorem is contradictory in many cases.
2) HLR/VLR architectures are considered. 3) This paper
uses fluid flow model to depict the dependency between
cell residence time and LA residence time. Compared
with the existing models, the proposed model in this
paper is the most cost-efficient. The model developed and
results derived in this paper are instrumental to the
implementation of the MBLU schemes in wireless
communication networks.
The rest of this paper is organized as follows. Sect. 2
introduces system model, including LA structure, HERD,
and fluid flow model. Sect. 3 first tests the accuracy of
the proposed model and then investigates the impact of
various parameters on the signaling cost. Sect. 4
concludes this paper.
II. SYSTEM MODEL
A. LA Structure
The LA structure employed in this paper is depicted in
Fig. 1. As shown in Fig. 1, this paper considers that all
the cells in the network are regular hexagons of the same
size, and each cell has six neighbor cells. The innermost
cell denoted by (0,0) is the last registered cell, and it is
surrounded by ring 1. The coordinate ( , )i j
denotes the
( 1)thj cell in the thi ring. It follows that
0, 0,
0,1,...,
6 1, .
if ij
i otherwise
Denote by R the radius of an LA, e.g., 5R in Fig. 1.
Denote by ( )N R the number of cells in a LA. It follows
from Fig. 1 that
2 ( ) 3 3 1,2,...1, RN R R R
Fig. 1. LA structure with .
B. HERD
HERD is the sum of m independent Erlang
distributions. Denote by i The initial probability of j
stage, 0 1j
,1,2,...,j m
and
1 2 1m . Erlang distribution contains r
stages [15], [16]. Denote by iT, 1,2,...,i r , the time
spent in i stage, each of which has probility density
function (pdf), 1,2,...,jt
je j m
.Suppose that at the end
of the first stage, after time 1T, the second stage is started
and so on, event occurring at the end of the thr stage.
Thus, the event-time, denoted by X , is 1 2 rT T T .
The stage of each Erlang distribution of HERD is denoted
by jr. Without loss of generality, we assume that
1 2 mr r r . Denote by j
the scale parameter of the
thj Erlang distribution. Denote the pdf and the Laplace
transform of HERD by ( )h t
and*( )h s
, respectively. It
follows that
1
1
1
( )( ) , 0,
( 1)!
*( .
)
j
j
j
rmtj
j jjj
rm
jj
jj
th t e t
r
h ss
(1)
513
Journal of Communications Vol. 10, No. 7, July 2015
©2015 Journal of Communications
Denote the mean and variance of HERD by and ,
it follows that
1
,
mj
jjj
rE
(2)
2
1
.
mj
j
jj
r
(3)
C. Fluid Flow Model
Fluid flow model has been used to depict the boundary
crossing rate of an UE in a closed region in [14], [17]. To
use the fluid flow model to calculate the boundary
crossing rate, the following two assumptions are
necessary. 1) The velocities of the UE at different
locations are independent and identically distributed
(i.i.d.). 2) The movement direction of an UE in a closed
region is uniformly distributed over [0,2 ) , and UEs are
uniformly distributed throughout the entire closed region.
Denote by v , l , and a the average speed of an UE, the
perimeter of the closed region, and the area of the closed
region, respectively. It follows from [6], [14], [17] that
vl
a
(4)
For a hexagonal shaped cell, denote by c the cell
boundary crossing rate, it follows that
cc
c
vl
a
where cl and
ca represent the perimeter and area of a cell,
respectively. Similarly, denote by L the LA boundary
crossing rate, it follows that
LL
L
vl
a
where Ll and
La represent the perimeter and area square
of an LA, respectively. This paper considers the situation
in which a cell boundary and a LA boundary coincide.
Let be the probability an UE crosses a cell boundary
but does not cross an LA boundary. Since L 1 c ,
we can derive that
L L1 1 c
c c L
al
l a
Denote by the side length of a cell. Referred to the
LA structure in Sect.Ⅱ-A and paper [6], it follows that
L
L
2
2
1,
3 1 1
6 2 12 1,
6
3 5 2.
3 3 1
c c
c
c
a a
a N R a R R
RlR
l
R R
R R
This paper uses the fluid flow model to emphasize the
dependency between the cell residence time and the LA
residence time. [6] has proved that when the cell
residence time follows an exponential distribution, the
LA residence time must also be so. This paper will adopt
the conclusion proved in [6].
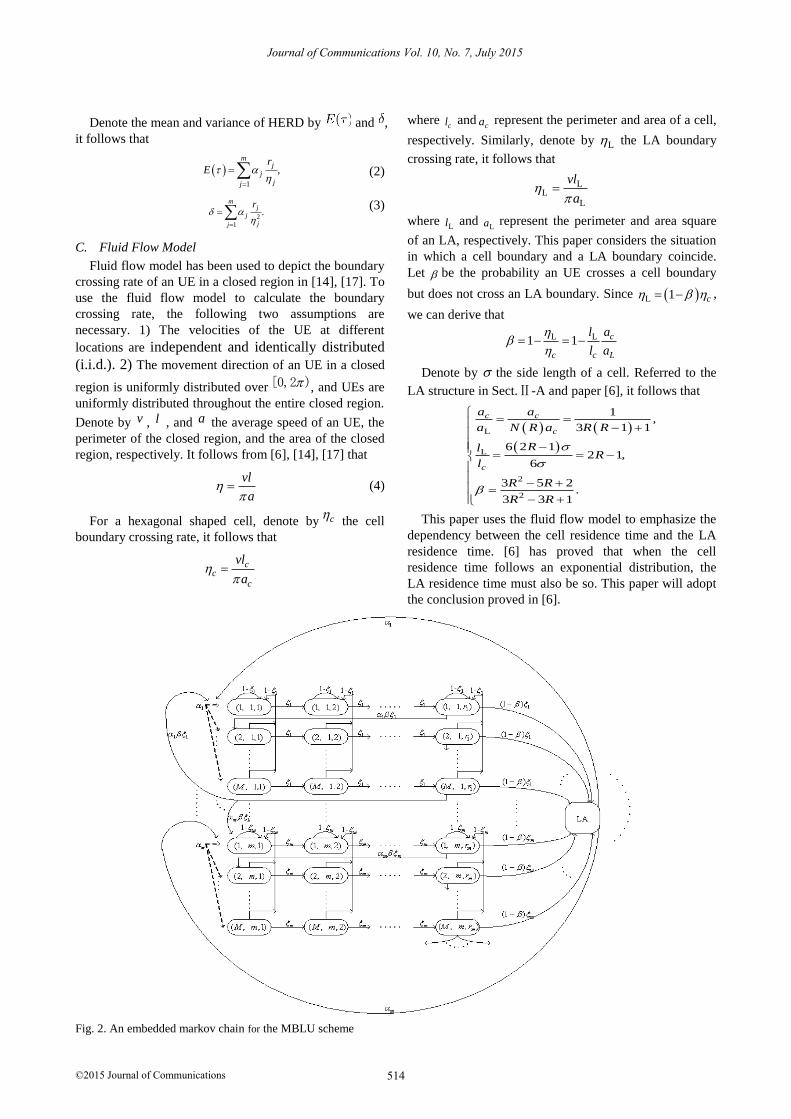
Fig. 2. An embedded markov chain for the MBLU scheme
514
Journal of Communications Vol. 10, No. 7, July 2015
©2015 Journal of Communications
III. SIGNALING COST OF THE MBLU SCHEME
A. Embedded Markov Chain
This paper considers that the call arrival process is
Poisson process with rate c and cell residence time
follows HERD. Denote by ct the call-inter arrival time.
Fig. 2 shows an embedded Markov chain for the MBLU
scheme. Here each stage of an Erlang distribution denotes
a state in the chain. State LA represents the state an UE
moves into a new LA during ct . Denote by t and LAt
the stage and the LA residence times, respectively. The
movement counter records the number of movements
starting from zero. Each state indicates the value of the
counter. After the call, the chain returns to the state in
which the counter resets. When one Erlang distribution
residence time expires, the UE crosses a cell boundary.
Denote by , ,i j k the state in which the movement
counter reaches i in the thk stage of the thj Erlang
distribution, 1,2,...,i M , 1,2,...,j m , and 1,2,..., jk r .
Denote by the state space of the embedded Markov
chain shown in Fig. 2. Denote by the event that an UE
crosses a cell but does not cross an LA boundary, and by
the complementary event of . From Sect. 2.1,
denotes the probability that happens. j represents the
probability that the call inter arrival time large than the
stage residence time, it follows that
jj
j c
For a purpose of demonstration, take part of the HERD
as an example. The following four reasons could cause
the state transition. 1) If the call inter-arrival time is
smaller than the stage residence time, namely, ct t ,
LA , after the call the chain transmits to the
corresponding state in which the counter is one. 2) If the
call inter-arrival time is larger than the stage residence
time, namely, ct t . If , ,i j k and jk r , the chain
transmits to the next state , , 1i j k . While jk r and
occurs, the chain transmits to 1,1,1i . 3) If the call
inter-arrival time is larger than the cell residence time,
and the event occurs, the chain transmits to the state
LA. An UE initiates a LU operation towards both VLR
and HLR, and then the chain transmits to the initial state
in which the counter is one. 4) If the call inter-arrival
time is larger than the cell residence time, and at the same
time the counter achieves the threshold and the event
occurs, the chain transmits to the initial state in which the
counter is one. An UE initiates a LU operation towards
VLR. According to the above depiction and the
proposition in paper [18], the one-step transition
probabilities of the embedded Markov chain can be
shown as
1
1
1,1,1 1
1,1,1 1
1,1, 1
1,1, 1
1 1,1, 1 1
1 1,1, 1
Pr 1,1,1 1,1,1 Pr 1 ,
Pr 1,1,1 1,1,2 Pr ,
Pr 1,1, 1,1, Pr 1 ,
Pr 1,1, 1,1, 1 Pr ,
Pr 1,1, 2,1,1 Pr , ,
Pr 1,1, 2, ,1 Pr , ,
Pr 1,1,
c
c
c i
c i
c r
c r j
t t
t t
i i t t
i i t t
r t t
r j t t
1
1
1
1
1 1,1, 1
,1, 1
,1, 1
1 ,1, 1 1
1 ,1, 1
1 ,1, 1
LA Pr , 1 ,
Pr ,1, ,1, 1 Pr ,
Pr ,1, 1,1, Pr 1 ,
Pr ,1, 1,1,1 Pr , ,
Pr ,1, 1, ,1 Pr , ,
Pr ,1, LA Pr , 1 ,
Pr
c r
c k i
c k i
c k r
c k r j
c k r
r t t
k i k i t t
k i i t t
k r k t t
k r k j t t
k r t t
1
1
1
1 ,1, 1 1
1 ,1, 1
1 ,1, 1
1
,1, 1,1,1 Pr , ,
Pr ,1, 1, ,1 Pr , ,
Pr ,1, LA Pr , 1 ,
Pr LA 1,1,1 ,
Pr LA 1, ,1 ,
c M r
c M r j
c M r
j
M r t t
M r j t t
M r t t
j
where 12,3,..., ri , 2,3,...,j m , and 2,3,..., 1k M .
Denote by ' the equilibrium probability of ' , ' ,
and i the sum of the states of the thi Erlang
distribution, e.g.,
1r
1 ,1, .
1 1
M
j i
i j
(5)
Assume that ,1,11
M
ii
A
. The following three
equations can be derived
VLR , ,
1
,i
m
i M m r
i
1
,
m
e i i
i
E E
1LA 1 ,1, , ,
1 11 1 ,
m
M M
i r m i m ri i
where
LA and VLR respectively represent the
equilibrium probability of state LA and the state in which
the counter reaching the threshold, and eE represents
the average time between state transitions. Similarly, we
list some examples to illustrate the relationship between
the states. From Fig. 2, a part of the balance equations of
the chain can be shown as
11,1,1 1 LA 1 VLR1 .A
The relationship of each state within one Erlang
distribution is
1
1
2,1,1 1 1, ,
1
2,1,2 2,1,1 1
12,1, 2,1,1 1
,
,
.
i
m
i i r
i
rr
515
Journal of Communications Vol. 10, No. 7, July 2015
©2015 Journal of Communications

We can derive that for
The relationship of each state among all Erlang
distributions is
2,1,1 1 1, ,
1
2,2,1 2 1, ,
1
2, ,1 1, ,
1
,
,
.
i
i
i
m
i i r
i
m
i i r
i
m
m m i i r
i
We can derive that
22,2,1 2,1,1
1
2, ,1 2,1,11
,
.mm
The general formula is
, ,1 ,1,11
, 2,3,..., 1,2,..., j
i j i i M j m
It follows by the same way that
1 1
11, ,1 LA VLR
1
11, , LA VLR
1
1 ,
1 .
j j j
j
jj j j j
j
r r rjj r j j j j j
j
A
A
We can derive that
1LA 1
1
1 21
1
1
1
1 1
1
1
.
mm
m
m
A A
A
A
(6)
Now we deduce the relationship of each state of A .
1 1 1
1
2 2
2
2,1,1 1 1, ,
1
1 1 11,1, 1 LA 1 VLR1 1 1
11 21,2, 2 VLR2 2
2 1
111, , VLR
1
,
1 ,
1 ,
1 .
i
m m
m
m
i i r
i
r r rr
r rr
r rmm r m m m
m
A
A
A
Let
1a i
m r
i ii. We can derive that
2,1,1 1 1 LA 1 VLR= 1 a a a .A
It follows that
3,1,1 2,1,1
2 2,1,1 2,1,1
a ,
a .M MM
It follows that
1
1VLR
1
1 a a
1 a
M
MA
(7)
Denote by the state residence time in state ,
. It follows that
LA 0,
min ,ct t
The mean residence time of each state can be
expressed as
1
jj c
E
Denote by e the time between state transitions. It
follows that
,e
1
.
m
e j j
j
E E
We can derive that
1
1
1
11 1
1
1 1,1,1 1,1,2 1,1,
2,1,1 2,1,2 2,1,
,1,1 ,1,2 ,1,
1 11 1
1 1 LA 1 VLA1 1 1
1 12,1,1
1
1 1 1
1 1 1
1 1
1
r
r
M M M r
rr r
r r
r A A
1
M,1,11
1
1
r A
It follows that
1 22 2
2 1
1
1
,
.mM m
m
r A
r A
According the above formulas, we derive that
1
1 1
mi
e iii
rE A
Define HLRn and VLRn as the expected number of HLR
LUs and VLR LUs per unit time, respectively. It follows
that
LA
HLR
1
1,
me i
iii
nE r
(8)
1
VLR
1
1 a 1 a.
1 a
M M
mM i
iii
nr
(9)
516
Journal of Communications Vol. 10, No. 7, July 2015
©2015 Journal of Communications

Define HLRN and VLRN as the expected number of
HLR LUs and VLR LUs during call inter-arrival time,
respectively. It follows that
HLR HLR
1
1 1m
c ic i
ii
N nr
(10)
1
VLR
1
1 a 1 a.
1 a
M M
mM i
c iii
Nr
(11)
Eq. (10) and (11) will be proved in Appendix.
B. Signaling Cost
Denote by HLR /
VLR the unit cost of performing a
HLR/VLR LU during ct . This paper considers the
paging scheme derived in [6]. Denote byPAN and
paging the
paging area size and the unit cost of paging a cell,
respectively. Denote bytotalC the total signaling cost
during ct . It follows that
total VLR VLR HLR HLR paging PA.C N N N
IV. PERFORMANCE EVALUATOIN
A. Accuracy Verification of the Analytical Formulas
Through Simulation
In this subsection, the accuracy of the analytical
formulas is tested by simulation. Moreover, we
compare the numerical results of signaling cost
obtained from [3]-[5] with the numerical results of
signaling cost obtained from this paper. [3]-[6]
considered the LA architecture, but papers [3]-[5]
neglected the VLR LUs produced by LA boundary
crossings. To embody the fairness, this paper adopts
the method proposed in paper [6] in which the VLR
LUs are added due to LA boundary crossings. This
paper simulates a number of call arrivals, denoted by
callN , to obtain a performance metric. In the
simulation, some parameters are assumed, HLR 160 ,
VLR 350 , 5paging , 5R , 0.001c , 0.005c and
4call 1 10N .
Fig. 3 compares the simulation results of signaling cost
obtained from simulation with the numerical results of
signaling cost obtained from [3]-[5] and this paper. In Fig.
3, we can get the following conclusions. 1) The analytical
results are close to the simulation results, indicating that
the analytical formulas derived in this paper are right. 2)
The signaling cost is a downward convex function as
movement threshold increases, manifesting that there is
an optimal movement threshold which can minimize the
signaling cost. 3) In some situations there is observable
disparity between the analytical results obtained in [3–5]
and the simulation result. 4) With the increase of
movement threshold, the difference between the signaling
costs obtained in [3]-[5] decreases.
Fig. 3. Accuracy validation and comparison with existing
studies.
The proposed model in [6] considered that the cell
residence time follows exponential distribution, which
does not accurately describe the real network. This paper
relaxes the limitation that the cell residence time follows
exponential distribution. The HERD can represent any
distributions through setting different parameters, so that
the proposed model in this paper more closes to the
real network than that of [6].
B. Impact of Various Parameters on LU Cost
In this subsection, the impact of various parameters on
the LU cost per call arrival under the MBLU scheme is
investigated. Fig. 4-Fig. 6 show the LU cost vs.
movement threshold with different parameters. In Fig. 4-
Fig. 6, the following conclusions can be got.
Fig. 4. LU cost vs. movement threshold with different paging
rates.
Fig. 5. LU cost vs. movement threshold with different size of
LAs.
517
Journal of Communications Vol. 10, No. 7, July 2015
©2015 Journal of Communications

Fig. 6. LU cost vs. movement threshold with different variances
of HERD.
a) Fig. 4 shows the LU cost as a function of
movement threshold when 0.001c , 0.01 , and
0.05 . In Fig. 4, LU cost decreases as the
movement threshold increases when c and R are
fixed. In addition, when the movement threshold is
fixed, the smaller the c , the larger the LU cost. In
the case of small c , a large number of cells will
be crossed during the call inter-arrival time, so that
the number of LUs increases. While the movement
threshold is large, the LU cost basically keeps level,
because the number of LUs is very small.
b) Fig. 5 shows the LU cost as a function of
movement threshold when 5,10R , and15 . In Fig.
5, when the values of c and are fixed, the
larger the R , the less the LU cost. This
phenomenon can be explained. As aforementioned,
LUs contain two components, i.e., the VLR LUs
caused by reaching the movement threshold and
the VLR LUs and HLR LUs by crossing LA
boundaries. Under the same movement threshold,
when the LA size increases, the number of LA
boundary crossings decreases during the call inter-
arrival time, so that less VLR LUs and HLR LUs
will be performed.
c) Fig. 6 shows the LU cost as a function of
movement threshold when 26.7 10 , 38.1 10 ,
and 41.6 10 . In Fig. 6, three carves overlap,
manifesting that the variance of HERD does not
affect the LU cost. This conclusion indicates that
the assumption that the cell residence time follows
a HERD is more general.
V. CONCLUSIONS
Attributing to the developed mathematical model,
analytical formulas for the signaling cost of the MBLU
scheme are derived, and their accuracy is checked by
simulation. With these analytical formulas, numerical
studies are conducted to evaluate the impact of the LU
cost. In these numerical studies, the following
conclusions are observed. 1) Compared with the existing
literature, the proposed model is the most accurate and is
superior to existing models. 2) The signaling cost is a
downward convex function of movement threshold. 3)
The larger the LA radius (i.e., R ), the less the LU cost. 4)
The variance of Hyper-Erlang distribution (i.e., HERD)
does not affect the LU cost. The model developed and
results derived in this paper can guide the implementation
of the MBLU scheme in wireless networks.
APPENDIX
The Proofs of (10) and (11)
Since the cell residence time follows a HERD, the
number of cell boundary crossings during ct can be
expressed as
1
1c
mi
c iii
E tn
E r
where E has been given in (2).
A. The Proof of HLR (10)
Under the fluid flow model, the number of LA
boundary crossings follows a binomial distribution with
,1n . Therefore, the average number of HLR LUs
during can be expressed as
1
HLR
11
mi
c iii
r
N n
which proves (10).
B. The Proof of VLR (11)
There are two events that can cause a VLR LU, i.e.,
with one event being an LA boundary crossing and the
other event being the movement threshold achieving.
Denote by VLRP the probability that an LU occurs due to
cell boundary crossings. Denote by P M the probability
that the movement counter reaches state M after which
an LU occurs. It follows that
VLR 1MP P . (12)
As shown in Fig. 2, we have
0 , , ,
1
1
1 1
,
,
i i
m
M i r
i
e
m
ie i
ii
E
P ME
rE A
1
1
2
2
11 1
,1, VLR
12 2
,2, VLR
1
, , VLR
,a
,a
.a
m
m
r
M r
r
M r
rm m
M m r
After some mathematical operations, we have
VLR
1 1 VLR
1
,
m
ii
ii
e
r
P ME A
(13)
518
Journal of Communications Vol. 10, No. 7, July 2015
©2015 Journal of Communications
where
1
1VLR
1
1 a a
1 a
M
MA
(14)
Therefore, combined (12), (13) with (14), we have
1
VLR VLR
1
1 a 1 a,
1 a
M M
mM i
c iii
N nPr
which proves VLRN .
REFERENCES
[1] K. Li, “Analysis of distance-based location management in
wireless communication networks,” IEEE Trans. Parallel Distrib.
Syst., vol. 24, no. 2, pp. 225–238, Feb. 2013.
[2] A. Bar-Noy, I. Kessler, and M. Sidi, “Mobile users: To update or
not update?” Wirel. Netw., vol. 1, no. 2, pp. 175–186, 1995.
[3] J. Li, Y. Pan, and X. Jia, “Analysis of dynamic location
management for PCS networks,” IEEE Trans. Veh. Technol., vol.
51, no. 5, pp. 1109–1119, Sep. 2002.
[4] R. M. Rodriguez-Dagnino and H. Takagi, “Movement-based
location management for general cell residence times in wireless
networks,” IEEE Trans. Veh. Technol., vol. 56, no. 5, pp. 2713–
2722, Sep. 2007.
[5] X. Wang, P. Fan, J. Li, and Y. Pan, “Modeling and cost analysis of
movement-based location management for PCS networks with
HLR/VLR architecture, general location area and cell residence
time distributions,” IEEE Trans. Veh. Technol., vol. 57, no. 6, pp.
3815–3831, Nov. 2008.
[6] X. Wang, X. Lei, P. Fan, R. Hu, and S. J. Horng, “Cost analysis of
movement-based location management in PCS networks: An
embedded markov chain approach,” IEEE Trans. Veh. Technol.,
vol. 63, no. 4, pp. 1886-1902, 2014.
[7] I. F. Akyildiz, J. S. M. Ho, and Y. B. Lin, “Movement-based
location update and selective paging for PCS networks,”
IEEE/ACM Trans. Netw., vol. 4, no. 4, pp. 629–638, Aug. 1996.
[8] Y. Fang, “Movement-based mobility management and trade off
analysis for wireless mobile networks,” IEEE Trans. Comput., vol.
52, no. 6, pp. 791–803, Jun. 2003.
[9] K. Li, “Cost analysis and minimization of movement-based
location management schemes in wireless communication
networks: A renewal process approach,” Wirel. Netw., vol. 17, no.
4, pp. 1031–1053, May 2011.
[10] Y. Zhu and V. C. M. Leung, “Joint distribution of numbers of
location updates and cell boundary crossings in movement-based
location management schemes,” IEEE Commun. Lett., vol. 11, no.
12, pp. 943–945, Dec. 2007.
[11] Y. Zhang, J. Zheng, L. Zhang, Y. Chen, and M. Ma, “Modeling
location management in wireless networks with generally
distributed parameters,” Comput. Commun., vol. 29, no. 12, pp.
2386–2395, Aug. 2006.
[12] J. Li, H. Kameda, and K. Li, “Optimal dynamic mobility
management for PCS networks,” IEEE/ACM Trans. Netw., vol. 8,
no. 3, pp. 319–327, Jun. 2000.
[13] V. C. Giner, “On lookahead strategy for movement-based location
update: A general formulation,” in Proc. PERFORM, pp. 153–166,
2010.
[14] F. V. Baumann and I. G. Niemegeers, “An evaluation of location
management procedures,” in Proc. IEEE UPC, San Diego, CA, pp.
359–364, Oct. 1994.
[15] Y. Fang, “Hyper-Erlang distribution model and its application in
wireless mobile networks,” Wirel. Netw., vol. 7, no. 3, pp. 211–
217, May 2001.
[16] Y. Fang, “Hyper-Erlang distributions and traffic modeling in
wireless and mobile networks,” in Proc. WCNC, pp. 398–402, Sep.
1999.
[17] V. C. Giner, V. Pla, and P. Escalle-Garcia, “Mobility models for
mobility management,” Network Performance Engineering, ser.
Next Generation Internet, D. Kouvatsos, Ed., 2011, pp. 716–745.
[18] X. Wang and P. Fan, “Channel holding time in wireless cellular
communications with general distributed session time and dwell
time,” IEEE Commun. Lett., vol. 11, no. 2, pp. 158–160, Feb.
2007.
Pei-Pei Liu was born in Liaoning Province,
China, in 1978. He received the B.S. degree
(communication engineering) and Ph.D.
degree (Communication and information
system) from the Southwest Jiaotong
University (SWJTU), Chengdu, in 2001 and
2008, respectively. She is currently working
in the Chengdu University of Technology
(CDUT) as lecturer. Her main research
interests include radio resource management, digital signal processing.
Yu Liu was born in Hebei Province, China, in
1987. He received the B.S. degree from the
Hebei Normal University (HBNU), Hebei, in
2011 and the M.S. degree from the Southwest
Jiaotong University (SWJTU), Chengdu, in
2014, both in communication engineering.
She is currently working in the Beijing
Railway Bureau as engineer. Her research
interests include radio resource management,
information theory.
Liang-Quan Ge was born in Sichuan
Province, China, in 1962. He received the B.S.
degree and M.S. degree from the Chengdu
University of Technology (CDUT), Chengdu,
in 1983 and 1987, respectively. He received
the Ph.D. degree from the China University of
Geosciences (CUG), Beijing, in 1995. He is
currently working in the Chengdu University
of Technology (CDUT) as professor. His
research interests include Nuclear technology and Applications, digital
signal processing.
Chuan-Chen was born in Jilin Province,
China, in 1982. He received the B.S. degree
from the Changchun University of Science
and Technology (CUST), Jilin, in 2005 and
the M.S. degree from the Chengdu University
of Technology (CDUT), Chengdu, in 2009,
both in Electronic and Information
Engineering. She is currently working in the
Chengdu University of Technology (CDUT)
as lecturer. Her research interests include digital signal processing, and
multimedia communication.
519
Journal of Communications Vol. 10, No. 7, July 2015
©2015 Journal of Communications