an economic analysis of the gauteng freeway · pdf fileeconomic analysis of the gauteng...
TRANSCRIPT

An Economic Analysis of the Gauteng Freeway
Improvement Scheme
Prepared for:
Provincial Government of Gauteng
South African National Roads Agency (Pty) Ltd
Prepared by:
Barry Standish, Graduate School of Business, University of Cape Town
In Association with
Antony Boting, Strategic Economic Solutions
Andrew Marsay, Arup Consulting
August 2010

Economic Analysis of the Gauteng Freeway Improvement Scheme i
Executive Summary
Headline Findings
1. This report has considered the economic case for upgrading and expanding the
Gauteng freeway network. It has applied three methods of analysis:
Cost benefit analysis. This is the primary measure of the project‟s viability and
gives a robust indication of the value that the project can deliver to the national
economy
Micro-economic analysis. This looks at the same costs and benefits but from the
perspective of a range of different stakeholders. It notes that within the overall
picture of benefit there are losers as well as gainers
Macro-economic analysis. This looks at the effect of the project on the national
and regional economies, including job creation and economic efficiency effects. It
is therefore important from a policy perspective.
2. The cost benefit analysis results are summarised in Table ES.1. They shows that the
upgrading of the existing network offers significant benefit to cost ratios (BCRs). The
project also offers higher internal rates of return to investment (IRRs) than can be
achieved on most commercial investments; and the net present values of benefits vs.
costs (NPVs) are strongly positive. The project involving new freeways has the higher
NPV because the larger network is involved in the assessment. The financial analysis
shows the financial benefits to road users, not to the project proponent, while the
economic analysis shows the benefits to society at large.
Table ES.1 Economic Cost benefit analysis for a 50c per km toll tariff
Scheme BCR IRR NPV (Rbn)
Upgrade 8.4 37% 209.8
3. All three of the measures, BCR, IRR or NPV, indicate that the upgrading of the
Gauteng freeway network was based on sound economic principles. The scheme is
set to return society a positive net present value of R210bn over the next 20 years. It
has an internal rate of return of 37% which, in itself, is a significant IRR. Finally, and
probably most importantly it returns a benefit cost ratio of 8.4. This means that for

Economic Analysis of the Gauteng Freeway Improvement Scheme ii
each one rand of cost, initial capital works and ongoing maintenance and running
costs, society benefits by R8.40.
4. While the tolling approach allows for funding within the current commercial remit of
SANRAL, as can be expected the economic benefits would have been even higher if
they were to be funded in part or wholly from the National Treasury. This is because
tolling reduces user benefits by the cost of the tolling infrastructure. However, this
does not take into account the risks attached to the potential increase in tax; the
sovereigns credit ratings and thus the sovereigns cost of borrowing. The advantages
of tolling are both the user pays principle and that projects will usually be implemented
more rapidly than would otherwise be the case. It is realised, of course, that the
allocation of funding from the Treasury does take into account the needs and priorities
of the country from an economic and social perspective. It should be noted that toll
roads are a small portion – currently 3120 km out of about 110 000 km of surfaced
roads or 16 170 of national roads – of the national road network and that the
remainder of the national road network is non-toll and funded by the Treasury.
5. The advantage of the tolling approach to funding is that it relieves Government of the
financial burden of direct funding, forces users to „feel‟ the cost of travel, and also
provides a valuable tool to optimise the operational management of the network.
6. It should be noted that tolling is not an optimum solution from SANRAL‟s perspective.
It is as an instrument that SANRAL uses to maintain the road network. While tolling
may reduce road user benefits – this should be balanced with the consequences of
the roads not being in a good condition.
7. However it is sub-optimal in national economic terms. Some form of direct funding
approach, even if still channelled through SANRAL as agent, would optimise the
economic benefits to “SA (Pty) Ltd”.
8. The micro-economic analysis is designed to draw attention to the impacts of the
tolling system on different categories of users. While the cost benefit analysis shows
that the balance is overwhelmingly positive, this section draws attention to the impacts
on the following categories:
Lower income groups would be unable to afford as much use of the network as
other groups and would remain dependent on public transport. Frequent users will
be eligible for frequent user discounts.

Economic Analysis of the Gauteng Freeway Improvement Scheme iii
Public transport vehicles using the network would have higher costs unless
arrangements are made to mitigate the impact on fares. In this instance generous
discounts have been proposed. Public transport vehicles will, also, be eligible for
frequent user discounts and toll fees are tax deductible.
On non-congested parts of the network toll payments would exceed user benefits
in the early years. The corollary to this is that without the improvements the
network would have remained congested and the perceived benefits would not be
realised. In addition people travelling in the evening and on weekends would face
increased costs.
Effects on businesses would generally be strongly positive because of the
improved accessibility. A very small minority of businesses may suffer losses
through reduced passing trade.
International research experience suggests that in addition to normal accessibility
improvements, businesses in a growing economy like Gauteng would benefit from
increased efficiency in their labour markets. This may add 30 percent 50 percent
extra to conventionally assessed benefits
Some properties would decline in value as a result of reduced amenity arising from
proximity to new or expanded freeways. But this in itself be an opportunity to
change the usage of the property and realize a “new” benefit. Many other
properties would rise in value because of improved accessibility.
9. The macro-economic analysis shows that the investment in upgrading or expanding
the freeway network would bring about additional growth in the national and especially
Gauteng regional economies. As a result there would be substantial job and business
creation impacts over and above those associated with the construction contracts
themselves.
Background to the macro-economic analysis
10. Gauteng is the industrial and financial centre of the South African economy. It
contributes a disproportionate share to the total gross domestic product and is home
to nearly twenty percent the population. One of the potential key constraints to
economic growth in Gauteng is an inadequate transport network. There has been a
deteriorating rail network, increasing traffic congestion and inadequate public

Economic Analysis of the Gauteng Freeway Improvement Scheme iv
transport. In addition, the actual quality of the road pavement has been deteriorating
because of inadequate maintenance funding.
11. As part of the solution to this problem the Provincial Government of Gauteng, the
South African National Roads Agency (Pty) Ltd (SANRAL) and relevant local
authorities are proposing to make significant improvements to the freeway network in
the province. These improvements include increasing the capacity of the existing
network, encouraging the use of high occupancy vehicles and adding new roads
where necessary. This is being planned within the ambit of an integrated transport
solution, including public transport (rail/BRT/etc) and TDM and ITS.

Economic Analysis of the Gauteng Freeway Improvement Scheme v
Freeway improvement scheme consistent with policy
12. These proposals fit well with existing policy. The 1996 White Paper regards primary
roads as elements of the country‟s "economic" infrastructure on which a measurable
economic or financial return should be achievable, and where the principle of user
charging or cost recovery from direct users would be applied as far as possible.
Because of transport‟s role in supporting broader economic and social development
the White Paper also indicates that government would be willing to consider a range of
approaches to transport infrastructure procurement depending on the availability of
fiscal resources and on the potential impacts on economic development.
13. At the provincial level a range of initiatives has been undertaken in recent years which
are resulting in a clearer transport policy framework generally together with other more
detailed work that is leading to clarification of the functionality of the different road
categories. Policy is still in the process of being formulated however and, as is also the
case at the national level, general policy considerations relating to the role of transport
in supporting economic and social development have progressed further than specific
matters regarding the role of and functional categorisation of different types of road.
The main conclusions that are drawn from an analysis of existing policy are:
The freeways‟ primary role is to provide support for broader economic integration
and social development policies and to help consolidate the Gauteng city region.
It would be contrary to national and provincial transport policies for freeway
upgrading or expansion to be procured in isolation from investment in public
transport/integrated with public transport.
The great majority of road-based public transport relies on routes other than
freeways because of it‟s primarily accessibility, as opposed to mobility, support
function.
The primary role of freeways with respect to public transport is to ensure that the
routes identified for public transport priority are not congested with traffic that
should be using the freeways.
The freeways‟ primary role in terms of the functionality of different road categories
is to provide capacity to accommodate growth of private, commercial and freight
traffic.

Economic Analysis of the Gauteng Freeway Improvement Scheme vi
Road-based public transport work in Gauteng suggests that HOV lanes on the
freeways, as part of an integrated approach, could be supported as a first phase in
enhancing the „person movement capacity‟ of the freeways.
International experience in cost benefit methodology
14. A review was undertaken of recent thinking on the economic analysis of transport
projects in other countries. This review benefited from the recent Eddington Transport
Study in the UK which was an 18 month long study by the Department for Transport
and the UK Treasury of the economic case for investment in transport infrastructure.
The conclusions drawn are:
Prioritise small infrastructure and service improvements before committing to
major network expansion because these smaller schemes tend to have the highest
BCRs.
„Wider Economic Benefits‟ based on the quantification of labour market efficiency
improvements in urban economies can add significantly to the benefits derived
directly from the travel time and operating cost savings caused by large
infrastructure interventions.
o Agglomeration benefits and other, labour market efficiency factors, can add
between 30 percent and 50 percent to economic benefits measured by
conventional methods;
o Such benefits tend to be highest in conditions of rapid economic growth.
Given the high rate of economic growth in Gauteng, the higher end of the
range for such benefits could be expected to apply in the case of the
freeway improvement scheme programme;
o The sections of the network most closely supporting concentrations of
employment would have the highest incremental gains from wider
economic benefits; links that are more specifically inter urban would have
lower gains.
Pricing of infrastructure leads to more efficient network use but may also result in
negative agglomeration and other labour market effects because road pricing
tends to counteract accessibility gains.

Economic Analysis of the Gauteng Freeway Improvement Scheme vii
Monetarisation of environmental externalities helps optimise the choice of
intervention.
National economic benefits are often not realised because infrastructure
investment decisions tend to be made on a local or sectoral rather than a national
cost benefit basis, or may be constrained by institutional funding mandates. An
independent appraisal body for nationally important projects could reduce delays
and allow the national benefits of major infrastructure decisions to be better
articulated allowing funding decision also to be made on a national basis, and be
less constrained by institutional funding mandates.
15. It is in this context that the Provincial Government of Gauteng, SANRAL and relevant
local authorities wish to understand the economic implications of upgrading the
existing Gauteng freeway network, adding capacity, adding new roads and tolling the
entire network.
Appraisal methods used
16. Three types of economic analysis have been used. These are a cost benefit analysis,
an analysis of microeconomic costs and benefits, and a macroeconomic analysis. In
doing these analyses two options are considered. The first is the so-called „do-nothing
option. This option is based on preserving current asset, minor improvements, and
periodic upgrades. There are no capacity increased in this option. The second is the
upgrading of the existing freeway network.
17. The freeway upgrade has an initial capital cost of R19.6bn. This would include
upgrading public transport facilities, the tolling system and customer service centres.
18. Cost benefit analysis is a means of taking all the direct costs and all the direct
benefits of a project and comparing these. It is the conventional method that is used in
project appraisal. The outcome of this analysis is the reporting of a net present value
(NPV), a benefit cost ratio (BCR) and an internal rate of return (IRR). In doing this one
performs both a financial and economic cost benefit analysis. The difference between
the financial and economic results is that the financial analysis looks at monetary costs
and benefits of the alternatives while the economic analysis includes the costs to
society.
19. This latter analysis is done by adjusting for shadow prices and wages and removing
the potential distortions caused by taxes and subsidies. A high BCR is usually a good

Economic Analysis of the Gauteng Freeway Improvement Scheme viii
indicator that it would be possible to raise finance to implement a project. In the case
of a private sector investment the good BCR would be part of the business case to
funders. If it is a public infrastructure project, a high BCR should give confidence that
it is worth funding the project directly from the Treasury.
20. The microeconomic analysis focuses on benefits like greater economic growth, labour
mobility and increased efficiencies. The costs would include changing property values,
negative impacts on poorer people and potential captive communities and businesses.
21. The third type of analysis is macroeconomic analysis. This focuses on the overall
contribution of the project to the national economy. It reports on contribution to GDP,
job creation, tax generation, etc.

Economic Analysis of the Gauteng Freeway Improvement Scheme ix
Funding options
22. A key issue is how to pay for the project. There is a school of thought that a cost-
effective way to pay is through a combination of fuel tax and special levies for heavy
vehicles, with the revenue from these levies applied directly to freeway expansion. The
special levies would be necessary because, while heavy vehicles do the most damage
to roads, these damages are not fully recovered in the fuel tax. However, the quantum
increase in such taxes and levies make the funding of the road network inequitable.
23. The major constraint on the effective implementation of such a scheme is the financial
policy on the part of government that fiscal integrity means that there should be no
earmarking of funds. Hence all revenues raised, including the fuel tax, go into a
common revenue fund and expenditures are made from this fund. Although in terms
of national accounting, government generally raises far more per year in fuel taxes
(and licence fees) than it spends on roads, the division of national revenues among
the various departmental calls on funds is determined according to economic and
social priorities of government rather than the sourcing of the revenue.
24. This is common, but not universal, practice among national governments. Some
countries have national road funds that are fully self funding from charges on road
users, whether fuel or other sources. Namibia, for example, has a national roads fund
to ensure that road construction and maintenance is adequately funded. But the
recent economic climate and the increase in fuel prices has left Namibia with a large
shortfall in its revenue to fund its road maintenance programme. Ultimately, the
amount of money spent on roads should not exceed the economic value as measured
in cost benefit analysis.
25. At present in South Africa, road expenditure, including the amounts spent on the
Gauteng upgrade scheme, is considerably lower than the cost benefit analysis results
show to be optimum. The effect of spending less than is economically optimal is that
the national economy grows less than it might otherwise.
26. The political reality of extensive poverty and hardship in the country, as well as the
need to address these issues have resulted in historic budgetary allocations in favour
of poverty alleviation (rightly so) and at the „expense‟ of other areas of expenditure –
like road maintenance. In consequence while tolling may be the second best way of
paying for roads, political and social realities suggest that it is the likely option.

Economic Analysis of the Gauteng Freeway Improvement Scheme x
27. There could be certain losses in efficiency as a result of this choice but there is also
the potential for gains in economic efficiency. The efficiency loss is the cost of
establishing and administering the tolling infrastructure. This would include the actual
cost of infrastructure as well as the compliance cost to vehicle owners. Efficiency
gains are the imposition of the user pay system and the potential for differential toll
tariffs. The first differential toll could see heavy vehicles paying for their fair share of
road damage. The second is the opportunity to introduce congestion tolling. The third
is the opportunity to implement the project more rapidly than waiting for State
allocation of funding.
28. Clearly there is a trade off between equity and efficiency. The least cost way of
funding any road project is through a fuel tax, either directly or indirectly channelled to
the construction of roads. This avoids all of the costs associated with tolling.
29. It is however not perfectly equitable because all users of fuel would be paying for the
project and might not necessarily benefit from the project. In the study an estimate
was made of the cost of tolling. It has been calculated that the actual cost of the toll
infrastructure adds, on average 8.5 cents per vehicle kilometre for the upgrade option.
This is the cost that would be incurred to pay for improved equity.
Results (1) - costs benefit analysis method
30. The first type of economic analysis reported on is the cost benefit analysis. The costs
included in the analysis were construction, maintenance and operating costs of the
roads and toll collection infrastructure; road user costs; the cost to the road users of
diverting off the toll roads; and the cost to the provincial and local authorities for road
damage caused by traffic diversion as well as the cost of diversion if the roads are not
upgraded. Economic CBAs are reported for the upgrade option over a twenty year
period where the economic analysis shows the benefits to society at large. The results
are given for various tolling rates, namely 0c per km (i.e. no tolling), 30c, 40c, 50c, 60c
and 70c per km for light vehicles.
31. Total costs increase from a Present Value (PV) of R17.5bn for a 0c per km toll to
R29.8bn for a 70c per km toll. While the costs increase as the tolling rate increases,
benefits on the other hand generally show a decrease. The benefits, as characterised
by road user cost savings when compared to the “Do nothing” case, decrease from a
PV of R244.8bn for 0c per km to R239.6bn for 70c per km – an insignificant 2%
Table ES.2 Economic Cost benefit analysis for a 50c per km toll tariff

Economic Analysis of the Gauteng Freeway Improvement Scheme xi
Scheme BCR IRR NPV (Rbn)
Upgrade 8.4 37% 209.8
32. All three of the measures, Benefit Cost Ratios (BCR), internal rate of return (IRR) and
Net Present Value (NPV), indicate that the upgrading of the Gauteng freeway network
was based on sound economic logic. Table ES.2 illustrates these values for a toll rate
of 50c per km. At this toll the scheme is set to return society a positive net present
value of R209bn over the next 20 years. It has an internal rate of return of 37% which,
in itself, is a remarkable high IRR. Finally, and probably most importantly it returns a
benefit cost ratio of 8.4. This means that for each one rand of cost, initial capital works
and ongoing maintenance and running costs, society benefits by R8.4.
33. The BCRs for all toll tariffs are above 8.0, indicating that the project is, from an
economic perspective, beneficial to society. The BCR reduces from 14.0 for the 0c
per km tolling rate to 8.4 for 30c, 8.3 for 40c, 8.4 for 50c, 8.1 for 60c and 8.0 for 70c.
The effect of tolling on the upgraded road network is therefore to reduce the BCR from
14.0 to between 8.0 and 8.4, depending on which tolling rate is chosen. The 0c per
km tolling scenario does not take into account the concomitant impact of the “Do
Nothing” option.
34. The Net Benefits or NPV, which is the difference between the benefits and the costs,
are all positive and vary between R209.8bn for a 70c per km tolling rate to R227.3bn
for a 0c per km tolling rate. The IRR‟s for all the tolling options are 37%, while for the
non-tolling option is 41%.
35. The cost benefit analysis was taken further and a series of individual journeys were
analysed. It was found that, apart from a few important exceptions, most users of the
toll roads during weekdays would have positive road user benefits. Further to this, it
was also found that in aggregate the toll roads generate overall road user benefits that
are greater than road user costs. Simply put this means that road user benefits would
be greater by driving on the upgraded toll road and paying the toll than on the existing
roads and not paying a toll. This is due to decreased congestion; faster travelling
times; lower road user costs and less probability of accidents.
36. Three sets of road user journeys were analysed. These are those journeys when no
tolling is charged on the entire network; the journeys on those sections of road where

Economic Analysis of the Gauteng Freeway Improvement Scheme xii
a toll tariff would be levied and; the journeys on those sections of freeway which are
not tolled within the context where most of the network is tolled.
37. Journeys when there is no tolling on the entire network: For the majority of
journeys and road users there are only benefits although there are some exceptions.
These exceptions are caused by additional traffic that is attracted onto the freeway
network because of the road upgrades and are:
On the N3, Buccleuch to the M2 Geldenhuys Interchange
o PM peak hour in the southerly direction, for all light vehicles from 2014 to
2020;
o Midday off-peak in the southerly direction, for all vehicles in 2025;
o AM peak hour in the northerly direction, for all light vehicles from 2020
onwards;
o PM peak hour in the northerly direction, for all light vehicles from 2020
onwards;
o Midday off-peak in the northerly direction, for light vehicle business
travellers in 2025.
On the R24, from OR Tambo International Airport to the N12:
o AM peak traffic in the westerly direction, for all light vehicles from 2020
onwards and for heavy vehicles in 2025;
o PM peak traffic in the westerly direction, for all light vehicles from 2020
onwards;
o Midday off-peak traffic in the westerly direction, for all light vehicles and
class 2 heavy vehicles in 2025.
On the N1, from 14th Avenue to Grasmere:
o PM peak traffic in the southerly direction, for light vehicle business
travellers in 2025;
o AM peak traffic in the northerly direction, for all light vehicles in 2025.
On the N1, from Brakfontein to Buccleuch:
o PM peak traffic in the northerly direction, for light vehicle business
travellers in 2020 to 2025;
Economic Analysis of the Gauteng Freeway Improvement Scheme xiii
o Midday off-peak traffic in the northerly direction, for light vehicle business
travellers in 2025.
On the R80 from Suiderberg to DF Malan:
o PM peak hour traffic in a northerly / westerly direction, all light vehicles in
2025.
38. Journeys on those sections of freeway that would be tolled:
On the whole people travelling during the morning and afternoon peak hours and
midday off peak times generally have lower costs. This changes for people
travelling in the evening and on weekends and they would find that their cost of
travelling has increased relative to the do-minimum option.
During the morning and afternoon peak hours there are two roads where road
users would generally have higher costs. These are on the R24 travelling between
OR Tambo International Airport to the N12 in the easterly direction and the N3
travelling between Buccleuch and the M2 Geldenhuys interchange in both
directions. During the afternoon peak road users would generally have higher
costs on the N1 when travelling between Brakfontein to Buccleuch in the northerly
direction.
For people travelling during the weekday off peak period it is only those who are
on the R24 travelling in an easterly direction between OR Tambo International
Airport and the N12 who would face higher costs.
Most people travelling during the evening or on weekends would have higher costs
at the toll equivalent of 40c and above. At a toll equivalent of 30c per km there are
more road users with lower costs than higher costs at these times.
39. Journeys on those sections of the freeway which are not tolled within the
context where most of the network is tolled: It is only in certain isolated instances
in morning and afternoon peak hour and midday off peak that road users have
increased costs. These costs are confined mainly to light vehicles and to the R80
between Soshanguve and Suiderberg, and between Suiderberg and DF Malan roads.
There are also some isolated incidents of increased costs for light vehicle users
travelling in an easterly direction on the N4 between Proefplaas and Donkerhoek road.
There are only reduced costs for all road users travelling during the evening and over
weekends.

Economic Analysis of the Gauteng Freeway Improvement Scheme xiv
40. It was also found that road user benefits accrue more than proportionately to heavy
vehicles rather than light vehicles. As the class of vehicle increases so does the
increased benefit.
Results (2) - micro-economic analysis
41. The second type of analysis that was undertaken was a microeconomic analysis. This
includes issues of affordability, impacts on individual drivers and their capacity to pay;
impacts on the cost of consumer goods; impacts on business generally and impacts
on specific business.
42. There is always some concern about the ability of society to carry the cost of major
infrastructural projects like the Gauteng freeway upgrade. Two estimates were made
to assess this issue. The first is the share of total toll revenue to that of the size of the
Gauteng economy. The second is the share of tolling relative to people‟s disposable
income. The analysis found that total toll revenue is expected to be 0.34% of projected
Gauteng GDP in 2011. In other words the toll burden from the freeway upgrade is the
equivalent of 34c for each R100 of GDP. It was also found that, in the same year, total
toll revenue is expected to be 0.43% of projected Gauteng household gross
disposable income in 2011. In other words the toll burden for light vehicles from the
freeway upgrade is the equivalent of 43c for each R100 of disposable income.
43. For private road users it can be argued that, for some people, there would not be an
“obvious” saving in vehicle operating costs in the early years of the toll road. It is
recognised that savings in some vehicle costs would be obvious and apparent – fuel
costs, time costs and lower accident rates, for example. Other costs, however, are far
less discrete over time and tend to be lump sum costs after a period of time – tyre
costs, suspension and steering repairs, etc. Hence the immediate discernable and
obvious saving in vehicle operating costs would be for fuel, time and, possibly,
accident costs. Other costs would accumulate in the future. Hence the reality would be
that total savings would only be realised some years into the future.
44. Therefore for cash flow purposes there would be less road user benefits in the early
years of the tolled roads, as these benefits would accumulate into the future. The
perception and reality would be that some drivers who currently do and would continue
to use the road on a regular basis could be vulnerable to the proposed tolling. In
addition less affluent owners of private vehicles may face road user costs that are
different to those used in the general calculations. In particular, less affluent people
would have lower (work related) time costs than others. In addition such people may

Economic Analysis of the Gauteng Freeway Improvement Scheme xv
choose to repair their vehicles themselves or may choose simply not to repair their
vehicles at all.
45. The analysis was based on a set of interviews conducted in 2009 that focussed on
class 1 vehicles using the freeways. This was a telephonic interview, based on the
registration numbers of vehicles using the freeways. Over 27 000 people were
interviewed. The following conclusions were made:
The majority of trips being made in light vehicles were done for either business or
commuting purposes.
It was found that 20% of people make monthly journeys on the freeway system of
less than 200km. Of the journeys made 51% of people travel 700km or less on the
Gauteng freeways. Conversely there are a number of people who make extensive
monthly journeys on the Gauteng freeways. Of the total number of people
interviewed 2% drive more than 2 500km a month, 5% drive between 2 000km and
2 500km, 9% drive between 1 600km and 1 999km a month and 33% drive
between 700km and 1 600km a month.
46. An analysis was undertaken purely on people who commute to work. This was done
because it was felt that these are the type of journey where people might be most
vulnerable to tolling because it is a journey where one has little choice in making the
journey. This was further corrected by removing anyone who had a company car
allowance; was driving on a Sunday; and had more than one occupant in the car.
There is no science in choosing such a number and the higher people‟s income the
higher this value could be because of their greater amount of discretionary income.
For the purposes of this analysis a value of tolls being equal or higher than 3%, 5%
and 10% of income were chosen. The following conclusions were drawn:
40% of the sample is expected to pay toll fees of less that R200 a month.
50% of commuters declaring an income of less than R4 999 a month are expected
to pay less than R200 a month in tolls. This is however in excess of 3% of monthly
income for these people.
18.9% of commuters are expected to pay tolls of between R200 and R400 a
month. This is 327 people in the sample of which 19 will be paying tolls greater
than 3% of their income and 2 will be paying tolls greater than 10% of their
income.
15% of commuters are expected to pay tolls of between R400 and R600 a month.
This is 265 people in the sample of which 32 people will be paying tolls greater

Economic Analysis of the Gauteng Freeway Improvement Scheme xvi
than 3% of their income, 19 will be paying tolls greater than 5% of their income
and 2 will be paying tolls in excess of 10% of their incomes.
11.5% of people are expected to pay tolls of between R600 and R800 a month.
This is 199 commuters in the sample of which 89 people will be paying tolls
greater than 3% of their income, 38 will be paying tolls greater than 5% of their
income and 4 will be paying tolls in excess of 10% of their incomes.
8.2% of people are expected to pay tolls of between R800 and R1 000 a month.
This is 141 commuters in the sample of which 42 people will be paying tolls
greater than 3% of their income, 58 will be paying tolls greater than 5% of their
income and 4 will be paying tolls in excess of 10% of their incomes.
4.9% of people are expected to pay tolls of between R1 000 and R1 300 a month.
This is 84 commuters in the sample of which 9 people will be paying tolls greater
than 3% of their income, 44 will be paying tolls greater than 5% of their income
and 5 will be paying tolls in excess of 10% of their incomes.
1% of people are expected to pay tolls of between R1 300 and R1 600 a month.
This is 18 commuters in the sample of which 3 people will be paying tolls greater
than 3% of their income, 9 will be paying tolls greater than 5% of their income and
6 will be paying tolls in excess of 10% of their incomes.
Of the total sample of 1 728 commuters there is the possibility that, based on the
survey:
o 390 people would be paying tolls equal to or greater than 3% of their
income. This is the equivalent of 22% of the sample;
o 191 people would be paying tolls equal to or greater than 5% of their
income. This is the equivalent of 11% of the sample;
o 23 people would be paying tolls equal to or greater than 10% of their
income. This is the equivalent of 1.3% of the sample.

Economic Analysis of the Gauteng Freeway Improvement Scheme xvii
47. Businesses are a major stakeholder in the outcome of the freeway upgrade and
expansion schemes. Business users of the freeways typically have a higher value of
time than either commuters generally or leisure users. The time and vehicle operating
cost savings are therefore of greater importance to this group as time savings
translate directly into business productivity gains. These productivity benefits are
expressions of the travel time and operating cost savings that arise from the new
capacity and resultant reduction in network congestion.
48. These business benefits would be expressed typically in some of the following ways:
With reduced congestion on the network distributors of goods are able to complete
more turnarounds per day resulting in higher turnover and productivity
More business appointments can be achieved per day resulting in improved
productivity
Greater reliability/timekeeping by staff translates into business productivity gains
Toll payments are tax deductible.
49. The Eddington Transport Study in the UK has shown that further business benefits,
not counted in the travel time and operating cost savings, may occur as businesses
respond to the fact that they now have access to larger, and possibly deeper, labour
markets. Eddington concluded that in rapidly growing urban economies these
secondary productivity gains can be very significant.
50. In this present study no attempt has been made to quantify these additional benefits
to business but it is should be noted that they can amount to as much as 50 percent
more than the sum of calculated benefits. This implies that the cost benefit measures
referred to above could in reality be considerably higher than indicated.
51. Public transport vehicles using the improved freeway network would also benefit
from travel time, vehicle operating cost and safety improvements. But, to the extent
that they also pay the tolls, their costs would rise and these may be passed on to
users, increasing the fares that they have to pay. Public transport users would be less
able than private users to balance savings in time and safety with fare levels paid and
may perceive themselves to be in a net negative position even if economic
calculations show otherwise. For lowest income users affordability would be an issue
too.

Economic Analysis of the Gauteng Freeway Improvement Scheme xviii
52. Although the economic balance would be positive overall, the issue is expected to be
mitigated by lower tolls charged for public transport vehicles. This is due in no small
measure since the scheme principally must promote public transport.
53. The significance of this issue also needs to be viewed in the light of the fact that the
freeways are generally not the primary routes used by public transport vehicles. This
was revealed in recent research undertaken by Gauteng Province (Strategic Roads
Network review). Partly as a consequence of this finding, Gauteng Province
embarked on a further study to determine priorities among the routes that public
transport vehicles do mainly use, including bus and proposed Bus Rapid Transit
routes.
54. An implication of this is that improvements to public transport road infrastructure
would primarily be addressed elsewhere than through the freeway upgrade project.
Nevertheless, the element of public transport optimisation through high occupancy
vehicle lane provision and probable lower toll charges, would mean that public
transport would not be disadvantaged by the scheme.
55. In addition to the largely positive impacts of actually using the freeway network, public
transport vehicles would experience additional benefits from the decongestion of the
non-freeway routes that they typically use, as a result of the diversion of some traffic
from these roads to the new capacity on the freeways.
56. Captive businesses and communities Although no quantification has been
undertaken of this concern, there would be a small number of businesses and
communities where the only practical route available may be a new tolled freeway. As
a consequence, use of the network would not be a free choice. While such groups
would experience the benefit of improved travel time, operating costs and safety, they
would not be doing so by choice and so in some cases their net benefit may be
negative.
57. It is anticipated that the numbers of parties affected in this way would be very small
and limited to certain existing residents and businesses along the routes of the new
freeways. It is only where access to a previously used route becomes barred by the
construction of the new route that this situation would apply.
58. The final set of microeconomic analysis relates to the potential impact of tolling on the
cost of consumer goods. This analysis was done by looking just at the cost of tolling
while ignoring all the benefits of the freeway upgrades. The conclusion was drawn that

Economic Analysis of the Gauteng Freeway Improvement Scheme xix
households with incomes less than R24 365 would face cost of living increases of
0.31%. This is the equivalent of 31 cents for each R100 spent on consumer goods.
Households with incomes between R24 365 and R55 159 would face cost of living
increases of 0.29%. Households with incomes in excess of R55 160 would have cost
of living increases of 0.29% due to the increased cost of consumer goods. Pensioners
would face cost of living increases of 0.28%. It can therefore be concluded that the
scheme will have little impact on the cost of consumer goods and will not be
inflationary.
Results (3) – macro-economic analysis
59. The last type of analysis that was undertaken was a macroeconomic analysis. While
there are a number of different types of macroeconomic effects, the two most
important are contribution to gross domestic product (GDP) and creation of jobs. The
importance of job creation is obvious. Increases in GDP are synonymous with
increases in peoples‟ economic standards of living. Increased GDP – i.e. increased
production – is experienced in the form of more jobs, higher wages and reduced
economic hardship. It is clearly an important measure.
Gross Domestic Product is the total value of all final goods and services produced
in the country. It is clearly fundamental to the economic quality of life of people in
the country.
o The initial capital expenditure on upgrading the existing roads as well as
constructing new roads was estimated to contribute as much as R7.4bn in
2008, R9.9bn in 2009 and 11.0bn in 2010. The contribution due to the
initial capital expenditure is then expected to reduce to R2.2bn in 2011 and
R194m in 2012 as the construction tapers off.
o The contribution from routine road maintenance is expected to contribute at
least R160m to GDP, while rehabilitation and periodic maintenance is
expected to add further to GDP in each of 2019, 2020, 2021, 2029 & 2030.
The contribution to GDP from ORT related maintenance and operating
costs is expected to increase from R610m in 2010 to R1.9bn in 2030.
o Once the toll roads are operational it is really the business time savings
that contribute the most to GDP. This contribution to GDP is expected to
increase from R3.27bn in 2010 to R7.69bn in 2030.
o GDP is important not just because it is income but also because income
has the capacity to add to wealth. Based on these projections, the toll road
Economic Analysis of the Gauteng Freeway Improvement Scheme xx
would have made a cumulative contribution to GDP of nearly R50bn by
2013, the projected end of construction. This cumulative total increases to
over R207bn by the end of 2030.
o In comparative terms it is estimated that the toll road project in Gauteng
added 0.32% to South African GDP in 2008 and 0.41% in 2009. It is
estimated that the project has the capacity to add 0.44% to GDP in 2010.
This contribution is then expected to drop from the start of the operations
phase. From 2013 the project is still expected to add 0.06% to GDP,
increasing to 0.11% in 2030.
Gross Geographic Product (GGP) is the provincial equivalent of national GDP. It is
estimated that the project would make a total contribution to Gauteng GGP of
R3.3bn in 2008, R4.4bn in 2009 and R5.1bn in 2010. By 2030 the project would
add R8.1bn to GGP. Based on these projections, the project would add a
cumulative R112.7bn to provincial GGP by 2030.
The project would result in changes to three types of jobs. The first are the direct
jobs that would be created over the project period. These are jobs directly on road
construction and operation of the toll road. The second are the so-called indirect
jobs that are due to multiplier effects of both the toll roads as well as from changes
in transport costs and road user costs. The third type of change in jobs results
from the structural economic changes attributable to the toll road. Of these jobs
only the first two can be measured with any degree of accuracy. The estimation of
indirect jobs is not necessarily an uncontentious issue. The estimates are based
on the official South African input output tables which show quite generous
estimates for indirect jobs. In the light of the historic „jobless‟ economic growth that
this country has had and in light of the recent recession we have tended to
downplay indirect job estimates. Therefore the indirect job estimates that are
reported below are based on a quarter of the multiplier estimates but should be
treated as the lower bound of these estimates.
o At the height of the construction period in 2010 as many as 15,957 people
were directly employed as a result of the project. This number is expected
to taper off as construction activities come to an end in 2013. From 2012
onwards it is expected that over 1,100 people would be directly employed
on either maintaining the road or maintaining and operating the toll system.
The number of jobs created from business time savings is expected to
increase from 3 341 in 2011 to 7 851 in 2030, in line with the increased

Economic Analysis of the Gauteng Freeway Improvement Scheme xxi
savings as the traffic numbers increase. The majority of the direct jobs
created during the construction period are created at the low income level,
thus having the ability to contribute significantly to poverty alleviation.
o During the construction period between 2008 and 2013 it is estimated that
as many as 21 394 indirect jobs have been or would be created throughout
South Africa. These indirect jobs are then expected to taper off to around
8 700 in 2012 before increasing again to 14 323 in 2020 and 23 263 in
2030.
o Total direct and indirect jobs are expected to have amounted to 23 499 in
2008, 31 552 in 2009 and 37 351 in 2010. It is expected that 13 734 direct
and indirect jobs would be created in 2012, increasing to 35 128 by 2030.
#424700
Economic Analysis of the Gauteng Freeway Improvement Scheme xxii
Table of Contents
Executive Summary ............................................................................................................ i
Headline Findings ........................................................................................................... i
Background to the macro-economic analysis ................................................................ iii
Freeway improvement scheme consistent with policy .................................................... v
International experience in cost benefit methodology .................................................... vi
Appraisal methods used ............................................................................................... vii
Funding options ............................................................................................................ ix
Results (1) - costs benefit analysis method .................................................................... x
Results (2) - micro-economic analysis ......................................................................... xiv
Results (3) – macro-economic analysis ....................................................................... xix
Table of Contents ........................................................................................................... xxii
List of Tables ................................................................................................................. xxv
Abbreviations ................................................................................................................. xxix
1 Introduction ................................................................................................................ 1
2 Scope of Works .......................................................................................................... 5
3 Policy Environment .................................................................................................... 8
3.1 National level ....................................................................................................... 8
3.2 Provincial level ................................................................................................... 10
3.2.1 ..... General policy framework ........................................................................... 11
3.2.2 ..... Specific policy guidance ............................................................................. 11
3.2.3 ..... Implications of the policy review for the project ........................................... 12
3.3 Road Infrastructure in Gauteng .......................................................................... 13
4 Making sense of the Economic Analysis .................................................................. 16
4.1 Macroeconomic Analysis ................................................................................... 16
4.1.1 ..... Construction and operation ......................................................................... 17

Economic Analysis of the Gauteng Freeway Improvement Scheme xxiii
4.1.2 ..... Network work capacity and road user benefits ............................................ 19
4.2 Economic cost benefit analysis .......................................................................... 19
4.3 Review of International Best Practice ................................................................. 21
4.3.1 ..... Early 1980s - Benefits in addition to normal CBA for motorway expansion . 22
4.3.2 ..... Early 1980s - Economic impacts of the Paris – Lyon TGV extension .......... 22
4.3.3 ..... The 1999 SACTRA report: “Transport and the Economy” ........................... 23
4.3.4 ..... The 2002 Commission for Integrated Transport review of regional multi-
modal transport studies ............................................................................................ 24
4.3.5 ..... The 2006 Eddington Transport Study ......................................................... 26
4.3.6 ..... Lessons for macro-economic cost benefit analysis in South Africa ............. 30
5 Toll collection Systems ............................................................................................. 32
5.1 Supply Side Issues ............................................................................................ 32
5.2 Demand Side Issues .......................................................................................... 34
6 Efficiency, Equity and Toll roads .............................................................................. 35
6.1 Sources of efficiency .......................................................................................... 35
6.1.1 ..... User pays principle ..................................................................................... 35
6.1.2 ..... Damage and distortions from heavy vehicles .............................................. 36
6.1.3 ..... Congestion tolling ....................................................................................... 36
6.2 Sources of inefficiencies .................................................................................... 36
6.2.1 ..... Toll collection costs..................................................................................... 36
6.2.2 ..... Diversions ................................................................................................... 37
7 A Cost Benefit Analysis ............................................................................................ 38
7.1 Results .............................................................................................................. 38
7.2 Sensitivity analysis ............................................................................................. 40
7.2.1 ..... Maintenance and Operating Costs .............................................................. 40
7.2.2 ..... Cost of Time ............................................................................................... 40
7.3 Road user costs and benefits............................................................................. 42
7.3.1 ..... Methodological approach ............................................................................ 42
Economic Analysis of the Gauteng Freeway Improvement Scheme xxiv
7.3.2 ..... Quantifying vehicle operating costs and road users costs ........................... 43
7.3.3 ..... Quantifying vehicle operating costs ............................................................ 44
7.3.4 ..... Quantifying road user costs ........................................................................ 46
7.4 Individual road user costs and benefits .............................................................. 51
7.4.1 ..... Two Specific Journeys ................................................................................ 52
7.4.2 ..... Summarised reporting on other journeys .................................................... 57
8 Microeconomic impacts ............................................................................................ 67
8.1 Overall Affordability ............................................................................................ 67
8.2 Private road users .............................................................................................. 68
8.3 Impact on business ............................................................................................ 77
8.4 Impact on public transport .................................................................................. 79
8.5 Captive business and communities .................................................................... 80
8.6 Impact on the cost of consumer goods .............................................................. 80
9 Macroeconomic Impacts .......................................................................................... 88
9.1 Capacity increases and lower transport costs .................................................... 88
9.2 Contribution to Gross Domestic Product ............................................................ 88
9.3 Contribution to Gross Geographic Product......................................................... 90
9.4 Job Creation ...................................................................................................... 91
9.5 Other macroeconomic effects ............................................................................ 92
10 Conclusion ............................................................................................................... 94
11 References ............................................................................................................ 106
Appendix A: Toll Tariffs ................................................................................................. 109
Appendix B: Road User Savings on Specific Road Sections ......................................... 110

Economic Analysis of the Gauteng Freeway Improvement Scheme xxv
List of Tables
Table 1: Costs of the upgrade scheme (R millions, 2010 prices) ....................................... 7
Table 2: Generic Comparison of Different Toll Systems ................................................... 33
Table 3: Economic cost benefit analysis ......................................................................... 39
Table 4: Sensitivity analysis on Maintenance & Operating Costs .................................... 40
Table 5: Effect of varying the Costs of Time .................................................................... 41
Table 6: Vehicle Operating Costs per km from HDM4 Database ...................................... 44
Table 7: Equivalent E80 per vehicle type ....................................................................... 45
Table 8: Cost of time per vehicle (rands per hour) ........................................................... 47
Table 9: Do nothing Road User Costs for the N1: Proefplaas to Brakfontein (Proefplaas
to Lynwood Section, Southbound) ................................................................................... 49
Table 10: Upgrade Option Road User Costs for the N1: Proefplaas to Brakfontein
(Proefplaas to Lynwood Section, Southbound) ................................................................ 50
Table 11: Change in Road User Costs for a Journey from Pretoria to Isando via the N1,
M3, N12 & R24 ................................................................................................................ 54
Table 12: Road user benefits from OR Tambo Airport to the Diepkloof I/C ..................... 56
Table 13: Increased costs and benefits on upgraded freeways for no toll ....................... 58
Table 14: Morning Peak Journeys on Roads with Tolls ................................................... 59
Table 15: Afternoon Peak Journeys on Roads with Tolls ................................................ 61
Table 16: Midday Off Peak Journeys on Roads with Tolls .............................................. 62
Table 17: Evening Journeys on Roads with Tolls ............................................................ 63
Table 18: Weekend Journeys on Roads with Tolls .......................................................... 64
Table 19: Potential Burden of Tolling ............................................................................... 68
Table 20: Travel frequency and journey purpose 1 .......................................................... 70
Economic Analysis of the Gauteng Freeway Improvement Scheme xxvi
Table 21: Travel frequency and journey purpose 2 .......................................................... 71
Table 22: Travel frequency and travel time 1 ................................................................... 72
Table 23: Travel frequency and travel time, work commuters .......................................... 73
Table 24: Frequent User Discounts Used in the Analysis ................................................. 74
Table 25: Monthly Travel Cost as Percentage of Income ................................................. 75
Table 26: Toll Cost as a Percentage of Income with 3%, 5% and 10% highlighted .......... 75
Table 27: Monthly income and Toll Cost: Absolute Numbers ........................................... 76
Table 28: Monthly income and Toll Cost: Percentage Distribution.................................... 77
Table 29: Increased cost of fruit and vegetables .............................................................. 83
Table 30: Increased cost of dry goods ............................................................................. 84
Table 31: Spending patterns by income category ............................................................ 85
Table 32: Increased costs on consumer goods of a toll tariff without taking any benefits
into account ..................................................................................................................... 86
Table 33: Highest increase in cost of consumer goods being moved from north of Pretoria
to Soweto via Isando........................................................................................................ 86
Table 34: Contribution to Gross Domestic Product ......................................................... 88
Table 35: Relative contribution to the national economy ................................................. 90
Table 36: Contribution to Gross Domestic Product ......................................................... 90
Table 37: Direct job creation ........................................................................................... 91
Table 38: Composition of direct jobs ............................................................................... 91
Table 39: Indirect job creation ......................................................................................... 92
Table 40: Total (direct plus indirect) job creation ............................................................. 92
Table 41: Contribution to Taxes ...................................................................................... 93
Table 42: Contribution to Indirect Household Income ...................................................... 93

Economic Analysis of the Gauteng Freeway Improvement Scheme xxvii

Economic Analysis of the Gauteng Freeway Improvement Scheme xxviii
List of Figures
Figure 1: Toll Scheme ........................................................................................................ 6
Figure 2: The average consumer spending pattern ......................................................... 85
Figure 3: Detailed Contribution to GDP ........................................................................... 89

Economic Analysis of the Gauteng Freeway Improvement Scheme xxix
Abbreviations
BCR: Benefit Cost ratio
BRT: Bus rapid transit
CBA: Cost Benefit Analysis
CfIT: UK Commission for Integrated Transport
DOT: National Department of Transport‟s
FIS: Freeway Improvement Scheme
GDP: Gross Domestic Product
GGP: Gross Geographic Product
GRDP: Gauteng Roads Development Plan
HOV: High occupancy vehicles
ICW: Initial construction works
ITS: Intelligent Traffic System
ORT: Open road tolling
NLTSF: The National Land Transport Strategic Framework of 2006
NLTTA: The National Land Transport Transition Act of 2000
NPV: Net Present Value
RIFSA: The Road Infrastructure Strategic Framework
SACTRA: UK Standing Advisory Council on Trunk Road Assessment
SANRAL: South African National Roads Agency (Pty) Ltd
SWYMMS: South and West Yorkshire Multi-modal Study
SWYSM: South and West Yorkshire Strategic Model

Economic Analysis of the Gauteng Freeway Improvement Scheme xxx
TDM: Traffic demand management
V/C: volume capacity
WEB: Wider Economic Benefits
Economic Analysis of the Gauteng Freeway Improvement Scheme 1
1 Introduction
Gauteng is the industrial and financial centre of the South African economy. It contributes a
disproportionate share to the total gross domestic product (GDP) and is home to nearly
twenty percent of the population. Under ASGISA, the growth in the economy is set to
accelerate. One of the potential key constraints to economic growth in some parts of the
country is an inadequate transport network. This is particularly true in Gauteng where there
has been a deteriorating rail network, increasing traffic congestion and inadequate public
transport. In addition the actual quality of the road pavement has been deteriorating because
of inadequate funding from the National Treasury.
As part of the solution to this problem the Provincial Government of Gauteng and the South
African National Roads Agency (Pty) Ltd (SANRAL) have made significant improvements to
the freeway network in the province. These improvements include increasing the capacity of
the existing network, encouraging the use of high occupancy vehicles (HOVs) and adding
new roads where necessary.
The Provincial Government of Gauteng and SANRAL wish to understand the economic
implications of upgrading the existing Gauteng freeway network, adding capacity, adding
new roads and tolling the entire network. There are a variety of different types of economic
analysis. These include cost benefit analysis, microeconomic analysis, and macroeconomic
analysis.
The economic analysis was started in 2007, prior to the beginning of the freeway upgrades,
and a draft report was presented in 2008. The one area of concern in the draft report was the
results of the microeconomic analysis. The microeconomic analysis in the draft report was
based on the Gauteng travel survey that was conducted in 2002 (Gauteng Department of
Public Transport, Roads and Works, 2002) as well as the road side interviews that were
conducted in November 2006. Neither the survey nor the road side interviews proved
satisfactory for the purposes of the analysis. One of the key issues that needed to be
examined is affordability. In other words, the freeways would be upgraded and this would
improve traffic flows, etc, and would be welcome by most drivers. The real issue is to
determine how many drivers would not be able to afford to pay for these proposed upgrades.
To do this it was necessary to have some correlation between a driver‟s income, the distance
that the driver travels, the purpose of the journey and trip frequency on the highway network.
In The road side interviews had all of this information with the exception of income. The
survey had all of this information about all drivers in Gauteng but did not differentiate
between those who did and did not use the highway network (and those therefore subject to
Economic Analysis of the Gauteng Freeway Improvement Scheme 2
tolling). In order to address these constraints SANRAL conducted a new set of interviews in
2009 that focussed on class 1 vehicles using the freeways.
The consequence was that the economic report could only be finalised in 2010 once the
interviews had been processed. During that time the nature of the scheme also changed
including the basis on which heavy vehicles would be tolled. In the initial and subsequent
analysis both the traffic engineers and economists worked with three classes of heavy
vehicles with the classes being differentiated by number of axles. Subsequent to that
analysis it has been decided to toll heavy vehicles on volumetric size rather than number of
axles. Hence in this report three classes of heavy vehicles are analysed while there will be
only two classes of tolling for heavy vehicles.
It will be shown that:
From a policy perspective the proposals are a good fit with current transport and
roads policy.
There is a trade off between paying for roads with a fuel tax, which increases
economic efficiency, and tolling with increases economic equity. The actual cost of
the tolling infrastructure is an average of 8.5 cents per vehicle kilometre.
The cost benefit analysis indicates that upgrading and tolling the freeway network is
justified on economic grounds.
In analysing individual journeys it will be shown that during weekdays in aggregate
the toll roads generate overall road user benefits that are greater than road user
costs. However, the opposite occurs during the evenings and over weekends.
Three sets of journeys will be analysed. These are those journeys when no tolling is
charged on the entire network; the journeys on those sections of road where a toll
tariff would be levied and; the journeys on those sections of freeway which are not
tolled within the context where most of the network is tolled.
From a microeconomic perspective it will be shown that:
o a large group of people make extensive journeys in Gauteng on a regular if
not every day basis.
o ??% of road users will pay monthly tolls of less than R200 a month.
o there is a group of people who could be financially vulnerable to tolling.

Economic Analysis of the Gauteng Freeway Improvement Scheme 3
o There is a negligible impact on the cost of consumer goods as a result of
tolling.
o The overall impact on business would be positive although some businesses
may be impacted in a negative way.
o There is likely to be only a marginal impact on public transport
Gross Domestic Product would have made a cumulative increase of R39.2bn by 2011
for the expansion option. This cumulative total increases to over R167bn by the end
of 2027. In comparative terms the toll road project in Gauteng has the capacity to add
0.7% to South African GDP in 2008 and 2009. This percentage contribution
increases as the business savings increase, and in 2027 the project is expected to
add 0.27% to GDP.
The toll road would result in increased jobs.
o At the height of the construction period in 2010 as many as 15,957 people
were directly employed as a result of the project. This number is expected to
taper off as construction activities come to an end in 2013. From 2012
onwards it is expected that over 1,100 people would be directly employed on
either maintaining the road or maintaining and operating the toll system. The
number of jobs created from business time savings is expected to increase
from 3 341 in 2011 to 7 851 in 2030, in line with the increased savings as the
traffic numbers increase. The majority of the direct jobs created during the
construction period are created at the low income level, thus having the ability
to contribute significantly to poverty alleviation.
o During the construction period between 2008 and 2013 it is estimated that as
many as 21 394 indirect jobs have been or would be created throughout South
Africa. These indirect jobs are then expected to taper off to around 8 700 in
2012 before increasing again to 14 323 in 2020 and 23 263 in 2030.
o Total direct and indirect jobs are expected to have amounted to 23 499 in
2008, 31 552 in 2009 and 37 351 in 2010. It is expected that 13 734 direct
and indirect jobs would be created in 2012, increasing to 35 128 by 2030.
This report has ten sections:
Section 1 introduces the study.

Economic Analysis of the Gauteng Freeway Improvement Scheme 4
Section 2 describes the scope of work.
Section 3 lays out the policy environment.
Section 4 gives a general description of economic analysis, sets out some recent
developments in economic analysis and sets the scene for the reporting of the results
to the analysis.
Section 5 gives a brief description of tolling systems.
Section 6 reviews the efficiency of paying for roads though tolling or a dedicated fuel
tax.
Section 7 reports the results to the cost benefit analysis.
Section 8 reports the results of the microeconomic analysis
Section 9 reports the results of the macroeconomic analysis.
Finally, Section 10 concludes the report.

Economic Analysis of the Gauteng Freeway Improvement Scheme 5
2 Scope of Works
The analysis in this report considers two options. The first is the so-called „do-nothing‟ option.
This is the option of, in this case, literally do nothing to the existing freeway system apart
from periodic maintenance. The second is the scope of works that has been undertaken and
is referred to as the „upgrade option‟ in this report.
The toll scheme comprises a combination of existing road network and capacity expansion.
There is the possibility that there will be the development of new freeways in the future but
this has not been taken into account in this analysis. The existing road network
improvements comprise the ring road network, the Ben Schoeman highway and the R21 and
R24 links to the OR Tambo International Airport.
The detailed section descriptions below should be read in conjunction with Figure 1. Sections
to be upgraded as part of the initial construction works (ICW):
N1
N3
N12
N14
R21
R24
A large portion of the network has been integrated in the scheme for purposes of
maintenance, ITS, the provision of lighting and future upgrading. These routes include the
N14, N1 Eastern Bypass (Pretoria), N4 up to Hans Strijdom and the N12 south of
Johannesburg.

Economic Analysis of the Gauteng Freeway Improvement Scheme 6
Figure 1: Toll Scheme
Platinum Freeway (under construction)
PRETORIA
N4 PWV1
PROEFPLAAS
IC
EEUFEES
IC
FLYING SAUCER
IC
BRAKFONTEIN
IC
BUCCLEUCH
ICMAIN ROAD
IC
CORLETTE
DRIVEIC
GELDENHUIS
IC
ARMADALE
IC
VOSLOORUS
IC
N4
R21
R21
PW
V 9
PW
V 5
N12
N12
N17
N3
R59N1
N12
JOHANNESBURG
R28
Legend
Existing roads to be
considered for upgrading
Planned freeways to be
considered for
construction
Reference point
Interchange
BLUE IQ IDZ‟S
Build-up Areas
Industrial Areas
Open SpaceFigure 1.1: N1/N3 PRETORIA TO JOHANNESBURG FREEWAY CORRIDOR
3 0 3 6 9 Kilometer
N1
R24
N1
PWV1
N1
Tolled national freeways
Other national/provincial
freeways
To Free State
To Mpumalanga
To Mpumalanga
To Botswana
To Northern Province
N1
M1
N3
CORRIDOR
MANAGEMENTCENTRE
JHB INTERNATIONAL
AIRPORT
Economic Analysis of the Gauteng Freeway Improvement Scheme 7
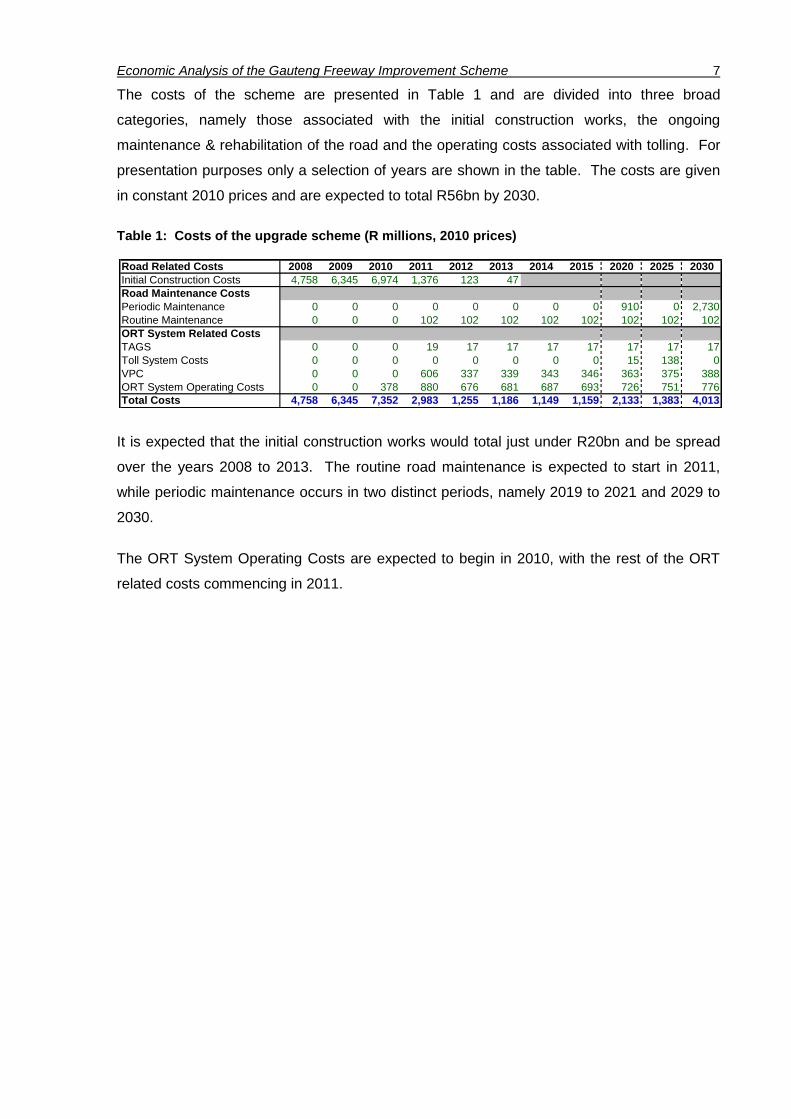
The costs of the scheme are presented in Table 1 and are divided into three broad
categories, namely those associated with the initial construction works, the ongoing
maintenance & rehabilitation of the road and the operating costs associated with tolling. For
presentation purposes only a selection of years are shown in the table. The costs are given
in constant 2010 prices and are expected to total R56bn by 2030.
Table 1: Costs of the upgrade scheme (R millions, 2010 prices)
It is expected that the initial construction works would total just under R20bn and be spread
over the years 2008 to 2013. The routine road maintenance is expected to start in 2011,
while periodic maintenance occurs in two distinct periods, namely 2019 to 2021 and 2029 to
2030.
The ORT System Operating Costs are expected to begin in 2010, with the rest of the ORT
related costs commencing in 2011.
Road Related Costs 2008 2009 2010 2011 2012 2013 2014 2015 2020 2025 2030
Initial Construction Costs 4,758 6,345 6,974 1,376 123 47
Road Maintenance Costs
Periodic Maintenance 0 0 0 0 0 0 0 0 910 0 2,730
Routine Maintenance 0 0 0 102 102 102 102 102 102 102 102
ORT System Related Costs
TAGS 0 0 0 19 17 17 17 17 17 17 17
Toll System Costs 0 0 0 0 0 0 0 0 15 138 0
VPC 0 0 0 606 337 339 343 346 363 375 388
ORT System Operating Costs 0 0 378 880 676 681 687 693 726 751 776
Total Costs 4,758 6,345 7,352 2,983 1,255 1,186 1,149 1,159 2,133 1,383 4,013

Economic Analysis of the Gauteng Freeway Improvement Scheme 8
3 Policy Environment
This section sets out the policy context within which the project is taking place. It includes
national, provincial and city/region considerations. It will be shown that the freeway
improvement scheme being appraised is an accurate expression of current transport policy
and roads policy in particular.
3.1 National level
The national Department of Transport‟s (DOT) Strategic Plan for 2007-2010, states that DOT
has a constitutional responsibility for „maximizing the contribution of transport to the
economic and social development of society by providing fully integrated transport operations
and infrastructure‟ and that “Transport, [is] the heartbeat of South Africa’s economic growth
and social development”.
This responsibility is articulated through a legislative framework of some 66 Acts of
Parliament, as well as in policy White Papers and other government strategy reviews.
Although the facilitating legislation for highway construction is contained in various National
Roads Acts and their amendments, the principal national policy framework for land transport
is contained in the 1996 White Paper on Transport Policy; the National Land Transport
Transition Act (NLTTA) of 2000, the National Land Transport Strategic Framework (NLTSF)
of 2006, and finally the Road Infrastructure Strategic Framework (RIFSA), also of 2006.
The 1996 White Paper states that the main policy goals of transport including the road
network are:
to support the goals of the Reconstruction and Development Programme meeting
basic needs, growing the economy, developing human resources, and democratising
decision making.
To improve the safety, security, reliability, quality, and speed of transporting goods
and people.
To improve South Africa's competitiveness and that of its transport infrastructure and
operations.
To invest in infrastructure or transport systems in ways which satisfy social,
economic, or strategic investment criteria.

Economic Analysis of the Gauteng Freeway Improvement Scheme 9
To achieve the above objectives in a manner which are economically and
environmentally sustainable with minimal negative side effects.
The White Paper regards primary roads as elements of the country‟s "economic"
infrastructure on which a measurable economic or financial return should be achievable, and
where the principle of user charging or cost recovery from direct users will be applied as far
as possible. In the case of roads this „may take the form of a fuel tax, which is a surrogate
user charge, and where viable or appropriate, tolling which is a direct user charge‟.
Because of transport‟s role in supporting broader economic and social development the
White Paper also indicates that Government would be willing to consider a range of
approaches to transport infrastructure procurement depending on the availability of fiscal
resources and on the potential impacts on economic development. These approaches
include:
public ownership and operation,
public ownership and operation via state agency (such as the present SANRAL)
including concessions within this framework,
private ownership and operation.
The approach adopted in the analysis is consistent with this broad summary of White Paper
policy. It seeks to quantify the benefits to society of the project by measuring the safety,
security, reliability, quality, and speed of transporting goods and people within Gauteng. It
shows how these improvements will contribute to both short term job creation and longer
term employment prospects through mediated through a more strongly growing economy.
The NLTTA of 2000 gives legal expression to the broad policy objectives of the White Paper,
explains the roles and powers of the different levels of government and sets out regulations
to govern land transport in South Africa. Its principal relevance to the macro-economic
appraisal of the GFIS is that it places a higher priority on public transport provision than on
private transport and as such highlights social objectives of transport policy more directly
than it does the economic policy aims. While setting out in detail the mechanisms and
institutional responsibilities designed to achieve these public transport objectives, NLTTA
tends to leave open the way in which the primary road network should contribute to these
objectives.
The first result of this work is contained in the Road Infrastructure Strategic Framework
(RIFSA). This framework aims at improving road network management partly through the

Economic Analysis of the Gauteng Freeway Improvement Scheme 10
reclassification of the entire road network in a system of strategic national, secondary and
access roads with the aim of aligning infrastructure developments with Government‟s
broader economic and social objectives. The RIFSA process will eventually result in a clear
redefinition of the social and economic function of each level of the road network, including
the freeway system. At present there is insufficient clarity from this process to adequately
define the expected role of the freeways generally and the freeway improvement scheme in
particular.
The NLTSF of 2006 starts to address this issue of functionality when it notes that roads serve
the vast majority of all transport requirements in South Africa, and that their primary function
is to facilitate effective economic development especially in the urban areas. The detailed
implications of this stipulation for roads policy are still being worked out at national DOT level
and NLTSF refers to work currently in hand to comprehensively redefine the functions of
different categories of roads.
Because of the present incompleteness of the national policy development process, the
project is taking place within a generally rather than specifically tailored policy context and
this has resulted in some uncertainty as to the precise role of the project. The issue on which
greater clarity of policy is needed is the functionality for the different categories of roads
especially as regards the division between public transport and private / freight transport use.
The project is being progressed against a background of still emerging policy perspectives,
but with a broad commitment to addressing public as well as private transport needs.
3.2 Provincial level
At the Provincial level a range of initiatives has been undertaken in recent years which are
resulting in a clearer transport policy framework generally together with other more detailed
work that is leading to clarification of the functionality of the different road categories.
Policy is still in the process of being formulated however and, as is also the case at the
national level, general policy considerations relating to the role of transport in supporting
economic and social development have progressed further than specific matters regarding
the role of and functional categorisation of different types of road.
A consequence of this is that some SANRAL decisions, particularly regarding the public
transport functionality of the project may have been taken without due consideration of the
functionality of the various categories of roads. The commitment to include high occupancy
vehicles (HOV) lanes on the network is an example of public transport prioritisation based on
general policy rather than on detailed assessment of the requirements of road-based public
Economic Analysis of the Gauteng Freeway Improvement Scheme 11
transport in the Province. The detailed work on which such an assessment can be based is
currently in the process of reporting and this paper includes provisional findings which would
require stakeholder ratification.
3.2.1 General policy framework
At the general level the following documents are the most relevant:
Gauteng Growth and Development Strategy (transport to facilitate economic growth
and social policy objectives);
Gauteng Strategic Agenda for Transport (includes efficiency of infrastructure use with
focus on public transport capacity provision to limit road investment);
Gauteng Road Freight Corridor Study (identifies freight intensive routes and suggests
freight route prioritisation);
Gautrain Integration Report (includes recommendation that both freeway and
additional public transport investment needed to support broader objectives of the
project);
Gauteng bus routes rationalisation study (aims to align longer distance subsidised
bus routes with other public transport provision);
Gauteng Strategic Roads Development Plan (emphasises need for freeway
expansion).
To bring these strategic policy objectives down to the practical, implementation level, an
ongoing process called „Better Roads for Gauteng‟ has been initiated. This process will
eventually define a new high level strategic network based on a road classification system
that is aligned with that proposed in the national RIFSA study process.
3.2.2 Specific policy guidance
The Better Roads for Gauteng process is being conducted in phases. These are:
Phase 1a, June 2006: Strategic Roads Network Review on the role of freeways and other
higher level roads, with the focus on prioritisation of intra-provincial mobility routes. This
work drew together, national, provincial and local government level stakeholders in a
collective, workshop-based process that reviewed the previous PWV framework for freeway
expansion. All proposed upgrade and new build links in Gauteng‟s freeway network were

Economic Analysis of the Gauteng Freeway Improvement Scheme 12
scored and then ranked using a set of technical and policy oriented criteria. The principal
outcomes were:
Broad consensus achieved on priorities for upgrading and expanding the network;
The freeway network provides a mobility more than an accessibility function;
Its principal role is to serve private, commercial and freight functionality;
Public transport functionality on the freeways is important but secondary;
A public transport route prioritisation exercise should also be undertaken;
Road classification decisions to be informed by the outcomes of both exercises.
Phase 1b, June 2007: Road-based Public Transport Routes Review. This was a similar
process again involving national, provincial and local government stakeholders but in a
review of routes for road-based public transport focusing on the accessibility as opposed to
mobility function. It drew on work already done by metro and provincial authorities on
strategic public transport networks and includes proposed bus rapid transit (BRT) routes.
The assessment criteria used were tailored to public transport functionality. The main
outcomes were:
Broad consensus achieved on province wide priorities for public transport route
upgrade;
Over fifty public transport road routes were collectively appraised and ranked;
The Johannesburg and Tshwane BRT routes featured in the top ten priorities;
The concept of varying degrees of dedicated public transport infrastructure was
introduced;
Phase 2, Gauteng Highway Standards, which would define technical standards for roads
of different functionality, aligning with the RIFSA national route categorization work.
3.2.3 Implications of the policy review for the project
The main implications for the project are:
The freeways‟ primary role is to provide support for broader economic integration and
social development policies and to help consolidate the Gauteng city region.

Economic Analysis of the Gauteng Freeway Improvement Scheme 13
It would be contrary to national and provincial transport policies for freeway upgrading
or expansion to be procured in isolation from investment in public transport.
The great majority of road-based public transport relies on routes other than freeways
because of it‟s primarily accessibility, as opposed to mobility, support function.
The primary role of freeways with respect to public transport is to ensure that the
routes identified for public transport priority are not congested with traffic that should
be using the freeways.
The freeways‟ primary role in terms of the functionality of different road categories is
to provide capacity to accommodate growth of private, commercial and freight traffic.
Road-based public transport work in Gauteng suggests that HOV lanes on the
freeways could be supported as a first phase in enhancing the „person movement
capacity‟ of the freeways by means of longer distance public transport services
provided on freeways in HOV lanes.
3.3 Road Infrastructure in Gauteng
There are potentially three critical issues that are faced by the existing road infrastructure in
Gauteng. These are historic planning which no longer fits with existing transport needs;
deteriorating pavement quality and traffic congestion.
The existing road network was planned under apartheid priorities and land use expectations.
“Today, the important link and support mechanism between land use and transport
infrastructure has largely been lost as a result of underinvestment in road provision as well
as a result of land use trends deviating from assumptions made at the time the PWV network
was conceptualised.
As a result many road corridors are no longer performing their originally intended functions.
Roads designed for mobility are now performing access functions. The question of
institutional responsibility has further clouded the question of road functionality and as such,
the process of determining functionality will assist in resolving this key question of
accountability.
Public transport was also not recognized as a major component of the overall transport
network. Finally there is the increasing pressure of congestion which needs to be addressed
not by building more roads but better management of road space and private car use.”
(Gauteng Roads Development Plan (GRDP) p19)

Economic Analysis of the Gauteng Freeway Improvement Scheme 14
The GRDP indicates that in total there are over 34 000km of roads in Gauteng. Of these
466km are national roads, 4 820km are provincial roads and the remainder are municipal
roads. What is of importance is that the bulk of these roads were built before 1994 and the
road network has not kept pace with the double pressure of population and economic growth
since that time. “Only 30% of the proposed freeway network from the old PWV major road
network has been constructed and only 65% of the proposed K-routes exist in one form or
another” (GRDP p5).
“Data from the inventory of the Pavement Management System shows that about 80% of the
total road network in Gauteng has a pavement structure older than 20 years, which is
normally considered the design life of a pavement. In other words, 3 100km have already
reached the end of their design life. In the 20 years since 1985, the proportion of sub-
standard condition roads has increased from 4% to 24%, and the proportion of those in
acceptable or better condition has reduced from 96% to 76%.
In order to maintain and preserve the provincial road network diligently, about 100km to
200km of road (for a 40- to 20-year life span target respectively) should be reconstructed or
rehabilitated each year. Since 1990, the rate of repair has decreased markedly, averaging
only 22km per year (GRDP p5). This is having a twofold effect:
First, there is now a sense of urgency in the need to repair the road network. It is well
known that the longer a road is left without being maintained the greater is the
eventual cost of the repairs. The repair cost does not grow in line with the time of
delay in repair but exponentially.
Second, there is growing congestion on the road network. On most of the major
freeway arterials the morning peak period moves earlier and earlier each year with
the number of trips out of peak time approaching, as with the Ben Schoeman
Highway, about 70% of peak flows. The GRDP (p8) estimates that by 2010 the
volume capacity (V/C) greater than 0.85 would increase from 979km to 2 299km of
the major road network. The consequence of this is that average travel speeds would
fall by 25% and more than 116km of the road network would be carrying 10 000
vehicles in peak hour (compared to 44km currently).
The conclusion that must be drawn from this is that a crisis is imminent. The traffic
congestion is evident to anyone who drives in Gauteng and the increase in the congestion is
even more evident to those who drive in Gauteng on a more irregular basis. The second,
less imminent but just as real part of the crisis is the deterioration in the riding quality of the
roads and the increasing urgency in the need to address the issue.

Economic Analysis of the Gauteng Freeway Improvement Scheme 15
What follows from this is that if the Gauteng freeway network were expanded it would
facilitate some important economic expansion. In particular it would help with:
The industrial development zones at City Deep and OR Tambo;
Accessibility to OR Tambo generally
The Mabopane Centurion Development Corridor (MCDC); and
The Wadeville – Alrode Industrial Corridor
The City of Johannesburg‟s proposal to achieve CBD-like consolidation in the
Diepsloot, Fourways, Olievenhoutbosch and Sunninghill/Kyalami areas to the north of
Sandton
The development of the Kya Sands/Cosmo City and Lanseria airport development
nodes
West Rand District Municipality‟s aspirations for economic development along the
N14 corridor
In a previous study that was undertaken for the Provincial Government of Gauteng it was
shown that:
“Failure to address and plan for the impact of demand growth on the road and transport
infrastructure would result in increase in the structural constraints facing many sectors of the
economy, thereby decreasing the potential growth rates that could be achieved. The
forecasting model was re-evaluated on this basis, with the structural constraints facing each
sector that relies on road transport being progressively raised, and the growth rates being
determined, the net difference in GGVA at constant 2000 prices between the approach that
assumes that the road and transport infrastructure will not constitute a significant constraint
on the economic growth of Gauteng, and the approach that assumes that it will, amounts to
R68 billion over the period 2004 to 2025 in constant 1995 Rands. Assuming an average rate
of inflation of 4% per annum, this would translate into around R155 billion in the money of the
day.” (Botha 2005 p20/1).

Economic Analysis of the Gauteng Freeway Improvement Scheme 16
4 Making sense of the Economic Analysis
There are a variety of different types of economic analysis, some of which can be quantified
and some of which cannot. The analyses that can be quantified include cost benefit analysis,
microeconomic costs and benefits, and macroeconomic analysis. Those which cannot be
quantified include debates about the trade off between economic efficiency and economic
equity.
The purpose of this section is to outline the meaning of the different types of analyses and
debate the merits or otherwise of upgrading the Gauteng Freeway Network and charging a
toll for this upgrade. The discussion on cost benefit also looks at some recent international
work and its applicability to South Africa.
4.1 Macroeconomic Analysis
The size of a national or regional economy is measured in terms of the sum total of all
economic activities taking place within the area concerned, both in the public and private
sectors. For countries like South Africa, this necessarily includes measures of informal
sector activity as well. The name given to the measure of the size of the economy is Gross
Domestic Product (GDP) for the country as a whole or Gross Geographic Product (GGP) for
a province or other sub division of the nation. The unit of measurement is the national
currency.
Underlying the measurement of GDP or GGP is the understanding that all economic activity
is dependent on the physical and institutional support systems that enable an economy to
operate effectively. These include the various levels of governmental structure, the legal
system, and the administrative, financial and educational infrastructure in the country. In
terms of physical infrastructure, all economic activity depends on water supply,
telecommunication, and transport infrastructure. Without all of these systems being in place
the economy could not operate.
While there are a number of different types of macroeconomic effects, the two most
important are contribution to gross domestic product (GDP) and creation of jobs. The
importance of job creation is obvious. Increases in GDP are synonymous with increases in
peoples‟ economic standards of living. Increased GDP – i.e. increased production – is
experienced in the form of more jobs, higher wages and reduced economic hardship. It is
clearly an important measure.

Economic Analysis of the Gauteng Freeway Improvement Scheme 17
The effects of any infrastructure project on the size of the GDP arise as a result of the myriad
ways in which businesses, public service providers ordinary people find their normal daily
activities affected, hopefully for the better, by the changes brought about by the new
infrastructure.
The actual task of calculating the macroeconomic impact of the projects demands a detailed
and multifaceted approach not least because of the so-called multiplier effects. It is well
recognised that the simple act of spending – constructing a road, for example, - leads to
other economic effects. Demand for steel and cement can lead to increased production in
those industries. Increased demand for steel and cement, in turn, leads to increased demand
for mining output which uses wood, water, electricity and so on. These are the so-called
multiplier effects. While this process unfolds, each industry employs people and pays wages.
Employees, in turn, spend their wages and cause further multiplier effects through the
economy. Measuring this is further complicated by the fact that different industries demand
different types of skills. This leads to different wage structures across the various industries.
People earning different wages have different spending patterns. Thus, the change in overall
spending patterns is dependent on which industries are affected.
4.1.1 Construction and operation
Input-output analysis was used for the measurement of the macroeconomic impact of the
construction and operation of the proposed toll roads. This approach demands that all
expenditure in and around the toll roads be identified and estimated. This expenditure, in
turn, needs to be linked to the Standard Industrial Classification of all Economic Activity (SIC
codes). In addition, if employment is part of the expenditure then estimates must be made of
the likely items of expenditure as a result of wage payments. Allowances must also be made
for the fact that workers at different income levels have different spending patterns.
The expenditure areas that were identified are:
Constructing and upgrading the roads and the electronic tolling equipment.
Ongoing capital expenditures such as upgrading of the roads and facilities.
Operating and maintaining the toll collection infrastructure. This includes patrolling the
roads and providing emergency services.
Administrative costs, such as legal and technical advice, administration of contracts,
monitoring of the toll equipment, etc.

Economic Analysis of the Gauteng Freeway Improvement Scheme 18
Five steps are required to measure the overall economic impact of the construction and
upgrade phase of the roads and the associated infrastructure.
First, to identify an appropriate bill of materials. The standard composition of a Bill of
Quantities for a road construction project was used, with the proportion and allocation of
costs for the different roads and subsections verified by the estimators for the project.
Second, to determine the relative proportions of profit, labour, plant and material for each
line item in the bill of materials.
Third, to assign each item of material and plant in the bill of quantities to the appropriate
SIC code.
Fourth, to decompose labour and profit into income categories and apportion the total
wages and profits to each income category. Following this, estimates of expenditure
patterns by income category are used to determine total spending patterns.
Finally, all the items in the SIC coded bill of materials are brought together. The total
multiplier effect of the construction phase is calculated as the aggregate product SIC
coded spending on plant and material, as well as SIC coded spending by workers
multiplied through the national multipliers. The national multipliers are known through the
South African input output tables.
The overall economic impact operation and maintenance was undertaken in a manner similar
to that outlined for capital expenditure. The operation and maintenance of the toll roads is
divided into:
Rehabilitation and periodic maintenance costs;
Routine maintenance costs;
TAGS for the ORT system;
Toll system costs;
Violations processing centre (VPC);
ORT system operating costs.
For the purpose of determining multiplier effects each category of expenditure was
consolidated into a single economic model. Following from this all expenditure was
decomposed and classified according to its appropriate SIC classification.
Economic Analysis of the Gauteng Freeway Improvement Scheme 19
4.1.2 Network work capacity and road user benefits
The following steps were taken to calculate the macroeconomic effects of changes in
network capacity and the saving in business time.
The immediate savings to road users and the immediate savings to users of the road
network were as described in Section 7.3.
The business time savings were then isolated from the road user savings. All other
savings are either non-financial savings (e.g. leisure time) or the savings would merely be
spent elsewhere in the economy (e.g. savings in petrol would be spent on other
consumer goods). The only saving that could be quantified and spent more productively
elsewhere is therefore business time savings.
The savings in business time was then distributed into the economy according to typical
business sector spending patterns and the multiplied impact calculated.
4.2 Economic cost benefit analysis
Cost Benefit Analysis (CBA) treats the national economy, or a provincial economy, as an
entity in and of itself. It assumes, with some important caveats1, that what is demonstrably
good for the economy as a whole is a reasonable approximation of what would be good for
the majority of the people living and working in that area.
When large infrastructure investments like the proposed Gauteng freeway improvement
scheme are contemplated, decision makers need to know what impact the new, or improved,
infrastructure would have on the economy as a whole and hence how much benefit can be
assumed to accrue to the people of the province. The main linkage is via the changes in
transport costs and travel time that occur when infrastructure improvements take place which
transmit changes in the level of economic activity in areas benefiting from the new
infrastructure.
It is important at the outset to outline the general methodology that has been used in the
economic study and point out those issues which have been excluded. The study has
employed an economic cost benefit analysis that has taken a number of costs and benefits
into account. These are:
1 For example, policy makers also need to know how projects that may be good for the economy as a whole may affect different
sectors of the population differently and also how the physical environment is affected.

Economic Analysis of the Gauteng Freeway Improvement Scheme 20
capital costs of building and/or upgrading alternative alignments;
costs of maintaining the roads to specific standards (which is determined by the
status of the road with national roads having a higher standard than secondary
roads);
savings in vehicle operating costs that result from a better quality road and easier
driving conditions;
travel time savings arising from a reduction in road congestion;
reduced loss of life and injuries that are associated with improved road provision;
potential traffic diversions and their effect on municipal and provincial road
maintenance budgets.
One area of dispute is whether the impact on property values should be included. This can
result from increased investment in commercial and residential property in such areas with
consequent changes in property values. Although it is possible to make estimates of the
scale of such effects, because they are the direct consequence of transport cost reductions,
economic theory suggests that they would have been largely captured via the calculation of
the transport cost savings. To include property value effects in addition to the transport cost
benefits would therefore, strictly speaking, be double counting.
The outcome of this analysis is the reporting of a net present value (NPV), a benefit cost ratio
(BCR) and an internal rate of return (IRR) for those cases where the route is compared to a
do minimum alternative. A NPV shows the total value of future costs and benefits reduced to
a present day value. This is done by using a social discount rate of 8% as specified by the
National Treasury. The BCR measures the changes in benefits and costs that would result
from an investment. BCRs are typically used when there are many competing alternatives
and projects need to be funded from a limited set of resources. Finally, the IRR is the
discount rate that returns a NPV of zero and shows the likely economic returns to society of a
project in relation to other investment opportunities.
If the evaluated benefits of a project are indeed greater than the overall project costs then the
BCR ratio would be greater than 1. A BCR greater than 1 indicates that the completed
project would constitute an economic asset; a BCR less than 1 implies that the project would
be an economic liability. The higher the BCR the less risk there is that the proposed
investment could turn out to be less than beneficial economically. Low BCR‟s, even if

Economic Analysis of the Gauteng Freeway Improvement Scheme 21
greater than 1, provide a warning that a project could be risky and may turn out to become
an economic liability instead of an asset.
A high BCR is usually a good indicator that it would be possible to raise finance to implement
a project. In the case of a private sector investment the good BCR would be part of the
business case to funders. If it is a public infrastructure project, a high BCR should give
confidence that it is worth funding the project directly from its Treasury or, alternatively, to
make suitable institutional arrangements for the involvement of the private sector in the
project‟s funding.
An economic analysis includes the true costs to society. This is done by adjusting for
shadow prices and wages and removing the distortions caused by taxes and subsidies. An
economic cost benefit analysis focuses purely on direct costs and benefits and does not
taken any indirect costs and benefits into account. Indirect costs and benefits would include
those costs and benefits obtained through multiplier effects. For example, the upgrading of a
road would have spin off effects for the construction industry and the building materials
supply industries. These, in turn, would have backward linkages with other commodity
suppliers and retail industries. In addition to this a number of other potential economic
impacts have not been taken into account in the CBA analysis. These include any positive or
negative impacts on business and the potential impacts on captive communities.
The proposal is considered in relation to the do nothing alternative. The CBA was developed
based on best practice and in consultation with the guidelines of the Manual for Cost Benefit
Analysis in South Africa (Conningarth, 2007). The CBA makes use of the NPV method of
discounting all costs and benefits as a means for comparing the various options. The
analysis has been conducted from a country wide, i.e. South African, perspective.
To explore the economic value of any investment programme, the analyst must identify the
costs of and the benefits to investment in the project when compared to the situation that
would have prevailed if no such investment had been made. This latter situation is commonly
referred to as the base case or do minimum situation. Such an approach allows one both to
determine the (least-cost) solution and to identify the benefits in such a way that they can be
compared across the economy as an aid to the rational and efficient allocation of resources.
4.3 Review of International Best Practice
This section summarises research on the economic impact of transport infrastructure
construction, based mainly on UK work but with some reference to the French experience.
The aim is to determine whether there is evidence for benefits in addition to those estimated

Economic Analysis of the Gauteng Freeway Improvement Scheme 22
by direct transport cost and travel time savings. Another is to advise on the applicability in
South Africa of methods for taking account of such benefits.
4.3.1 Early 1980s - Benefits in addition to normal CBA for motorway expansion
During a significant phase of motorway extension in the UK in the 1970s considerable efforts
were made to estimate, and then monitor, the likely macro-economic impacts of the M62
Yorkshire to Lancashire route and also the extension of the M4 motorway further into South
Wales. By this time the UK Department of Transport‟s „COBA‟ manual on cost benefit
analysis for road project appraisal was well developed. The benefits calculated at the time
were: vehicle operating cost savings, travel time savings and safety benefits. Environment
was addressed on a rather ad hoc, issue by issue, basis.
Post construction reviews of the economic appraisals of the two motorways in the early
1980s were faced with the reality that a great deal of economic activity appeared to have
been spawned by the motorway construction especially around the junctions close to urban
areas. After much discussion, the national Treasury produced a detailed analysis that
argued from micro-economic principle that there was no basis for believing that the observed
economic development effects were anything other than rational responses to reduced
vehicle operating costs and travel time. They stated that the new economic activity was best
regarded as displaced/relocated investment that could well have happened elsewhere in the
country in the absence of the new infrastructure.
It was argued further that the only way in which benefits could emerge in addition to those
which the COBA analysis estimated, would be if the location at which the new economic
activity was taking place had some economic production advantages over other, equally
accessible locations. In other words there would have to be some comparative advantage in
production at the new location that was not previously able to be realised because transport
costs were too high. At the time Treasury thought that such effects were minimal and anyway
could not be measured.
4.3.2 Early 1980s - Economic impacts of the Paris – Lyon TGV extension
At more or less the same time the French rail operator, SNCF, was promoting an economic
case for extending its high speed TGV rail network from Paris to Lyon. Again, the discussion
centred on whether any benefits in addition to those estimated by the travel time and safety
savings could be allowed.
Economic Analysis of the Gauteng Freeway Improvement Scheme 23
SNCF argued that additional benefits would indeed emerge. Their view was similar to that
rejected in the above UK Treasury analysis. It centred on the fact that the time savings
brought about by the TGV service were so great that they would stimulate the emergence, or
at least the strengthening, of the higher value service industry sectors in Lyon that were then
far more typical of the Parisian economy. It was argued that, in addition to making pre-
existing commercial relations between the two cities more efficient, (as a result of transport
cost and travel time reduction) skills and business opportunities that would otherwise have
remained latent in Lyon would emerge. In macro-economic terms, SNCF was arguing that
the benefits estimated by transport cost analysis alone would indeed be supplemented by
gains based on enhanced urban economic efficiency.
At the time, the UK Department of Transport and the Treasury were both aware of these
arguments but were not persuaded that there was a convincing micro-economic basis for the
claimed additional macro-economic benefits.
4.3.3 The 1999 SACTRA report: “Transport and the Economy”
In the later 1980s further motorway construction became the subject of increasing public
opposition in Britain, primarily for environmental reasons. The planned extension of the M3
motorway southwards towards Southampton through the Twyford Down area of natural
beauty became the focus of this opposition. The project was completed in the early 1990s
but, partly as a result of this opposition and partly because of the early 1990s economic
recession, Government shelve all plans for further trunk road and motorway expansion.
Then, as the national economy began to grow strongly again in the late 1990s, the debate
about how to accommodate the traffic growth that accompanied economic growth had to be
reopened. Continued environmental objections to new infrastructure capacity creation, and
also the new Government‟s strong policy commitment to lowering traffic generation from new
development, resulted in the focus of the debate being on finding ways to accommodate new
development with minimal traffic growth.
This focus became the agenda for a detailed, government-sponsored research programme
undertaken from 1996 by the „Standing Advisory Council on Trunk Road Assessment‟,
(SACTRA). The aim of their research was to resolve questions such as:
To what extent do transport improvements lead to increased economic activity?
Can traffic growth be "decoupled" from such economic growth: or, put alternatively,
can traffic be reduced without having a negative impact on the economy?
Economic Analysis of the Gauteng Freeway Improvement Scheme 24
Are all of the economic impacts captured in current appraisal techniques?
Should appraisal techniques be amended and if so, how?
The final report submitted in June 1999 made the following main points:
Transport improvements do lead to increased economic activity but conventional cost
benefit analysis methods remained the best proxy for capturing the scale of such
benefits
It was acknowledged, however, that this measure of benefits assumes a situation of
perfect competition in the economy and that transport cost benefit analysis does not
account for any adjustments towards greater market efficiency (or inefficiency) that
might emerge
Any such additional effects are likely to be dependent on specific local circumstances
Further research was recommended into how to determine the nature of such effects
It may be possible to accommodate some economic growth without significantly
adding to traffic growth by application of intensive traffic demand management (TDM)
measures
The cautiously worded report was broadly welcomed and led to considerable efforts on the
part of the UK‟s Highways Agency to institute better highway capacity management systems.
The report‟s emphasis on TDM measures also gave a degree of comfort to opponents of
road capacity expansion that their objectives could be met without seriously compromising
economic growth.
4.3.4 The 2002 Commission for Integrated Transport review of regional multi-
modal transport studies
A further development was a series of regional multi-modal transport studies which began in
1999. The goal of this program was to develop twenty year plans that would consider
interactions among all modes of travel as well as interactions between land use patterns and
transport. A significant feature of the programme was that methodologies were developed to
try to „level the playing field‟ between road and other modes of transport in terms of cost
benefit analysis.
The methodologies involved the quantification of a wider range of benefits including the
congestion reducing impacts of transferring travel demand among the various modes and
Economic Analysis of the Gauteng Freeway Improvement Scheme 25
also more explicit acknowledgement of employment benefits. Even though under
conventional methodology these benefits would have been regarded as being simply the
expressions of transport cost reductions a Treasury approved scoring system was developed
that allowed their inclusion in appraisals in order to give quantified expression to policy
objectives of traffic reduction and employment creation. Environmental cost and benefits
were also scored but not monetarised in these earlier studies.
After two years progress the Government asked its Commission for Integrated Transport
(CfIT) to review the conclusions of those studies that had reported to date. The CfIT found:
that Government‟s policy objective of achieving a shift away from road-based
solutions was being realised with well over 50% of all investments proposed being in
rail and other public transport proposals, but
that the BCRs achieved for almost all of these non-road solutions were typically very
low. In most cases they did not meet the Treasury‟s benchmark for public investment
even when the additional, socially motivated benefits were included.
Highway projects, on the other hand, were found to consistently score much higher
on the same broad-based BCRs, sometimes having double figure ratios.
Nevertheless, Government still found itself uncertain about committing to a major programme
of infrastructure upgrade. The Department for Transport subsequently commissioned further
detailed research into transport appraisal techniques in particular looking at impacts on the
productivity of urban economies and labour markets.
It also convened a Parliamentary Committee hearing „The Value of Rail‟ to review what
benefit the country was receiving from continued capital investment in subsidy payments for
the rail system. This yielded greater clarity regarding the scale of investment needed to
secure an improved rail network but no consensus for any major network expansion. Instead
Government decided that decisions regarding rail investment should as far as possible be
taken in regional forums where the costs of different approaches to transport improvement
could faced up to by local stakeholders.
The multi-modal studies continued to report and one, the South and West Yorkshire Multi-
modal Study (SWYMMS) has undertaken detailed testing of preliminary findings using a
comprehensive land use transport interaction model called the SWYSM or South and West
Yorkshire Strategic Model.

Economic Analysis of the Gauteng Freeway Improvement Scheme 26
4.3.5 The 2006 Eddington Transport Study
With continued economic growth the need for investment in additional transport infrastructure
capacity became ever more urgent in that congestion was, in some areas, becoming a brake
on economic growth. Major new rail capacity appeared unlikely as Government had
effectively delegated decisions regarding new schemes to the regions which would not have
access to significant capital resources. As for new highway capacity, Government could not
look to its Highways Agency because its mandate was for network management not network
expansion.
It was clear that if any significant expansion in transport infrastructure capacity was to occur
then Government would need to thoroughly motivate a case. The result was the
appointment of Sir Rod Eddington, to coordinate a detailed study with a brief to develop a
sound case for investment in transport infrastructure. The study, which reported in
December 2006 focused on the following main issues:
A general and historic review of the ways in which transport affects economic
development
A review of methods used and factors considered in measuring transport‟s economic
impacts
A consideration of the circumstances in which transports economic impacts will be
greatest
Proposals for improving the institutional mechanisms for delivering transport
improvements
4.3.5.1 The role of transport in economic development
Eddington‟s review points to periods in history when transport has been responsible for
supporting „step changes‟ in levels of economic activity. This has occurred when
technological change results in major efficiently improvements. Examples are the railway
revolution and more recently road-based passenger and freight transport. In periods between
major technological developments, the economic benefits mediated by transport
interventions are smaller and, by comparison incremental in nature. Measurement of the
benefits requires far more sophisticated methods than might be relevant when measuring a
step change.

Economic Analysis of the Gauteng Freeway Improvement Scheme 27
Eddington notes that mature economies, including Britain, generally have well developed
transport infrastructure networks and that consequently very detailed work is needed to
estimate the economic benefit of interventions.
4.3.5.2 Review of appraisal methods and the significance of ‘Wider Economic
Benefits’
Eddington covers much the same ground as is summarised above but examines the case for
there being additional, productivity-related economic benefits on top of those calculated by
conventional techniques based on transport cost and time reductions.
The principle contribution of the whole report is indeed its very detailed review of methods for
quantifying the wider economic benefits associated with economic productivity gains. These
are the same benefits that earlier work in both the UK and France had hinted at but which
were either not regarded as significant or were not able to be measured.
The „Wider Economic Benefits‟ that were measured in addition to normal time/cost items are:
Agglomeration benefits: a measure that links improvements in business productivity
to changes in the breadth and depth of labour markets to which businesses have
access
Increased labour market entrants: as lower costs of access attract current non-
participants
Increased labour market productivity: as people in employment have access to a
wider range of jobs and become more efficiently employed
Increased productivity in imperfectly competitive markets: as firms may adjust
their network of suppliers and clients in response to transport efficiencies.
In each case the benefits are in addition to those measured conventionally by transport time
and cost reductions. This is because the impacts of the immediate cost reductions are
assumed to apply to static patterns of participation in a region‟s economy. The Wider
Economic Benefits (WEB), measure efficiency improvements beyond simply cost reductions
for current networks of business and employment relations. In the research modelling
conducted for the Eddington report the typical impact of these additional, productivity related
benefits were as follows:
Additional benefits may be between 30% and 50% more than that calculated by
conventional CBA;

Economic Analysis of the Gauteng Freeway Improvement Scheme 28
The agglomeration benefits typically account for 70% of total additional benefits;
Because these (mainly labour market) benefits appear to be proportional to
accessibility improvements, and because accessibility is measured in terms of
generalised cost of travel, the benefits turn out to be negative for projects involving
commercial road pricing/demand management approaches.
For projects funded in this commercial manner, the agglomeration benefits appear to
be displaced by commensurately large „road pricing revenues‟ accruing to the agent
responsible for the project, whether public or private.
This last point suggests that the chosen funding route has a major effect on whether
„commercial operator optimisation‟ or „user benefit optimisation‟ results from highway
construction.
The Eddington report also reviews and incorporates into its conclusions, innovative research
into methods of monetarising certain environmental externalities including carbon footprint,
air quality, noise and landscape. The main finding here was that although the environmental
externalities of transport interventions are generally negative they are usually not sufficiently
so to compromise the viability of schemes with otherwise strongly positive BCRs.
4.3.5.3 Circumstances in which transport interventions would have the biggest
impact
The Eddington study also considers under what circumstances it could be expected that the
impacts of transport interventions would be greatest. Whereas conventional appraisal
methodology can only indicate that the scale of benefit is proportional to the extent of the
transport cost savings delivered by an intervention, the WEBs offers more interesting
pointers. This is because what is being measured in the WEB approach is the enhanced
expression of pre-existing economic potential within the region affected by the transport
intervention. The implication of this analysis is that the scale of the WEBs would vary
according to the nature of pre-existing economic potential. Even more specifically, it
suggests that the WEB impacts would be greatest where pre-existing economic potential is
showing greatest dynamism, in other words where economic growth is already occurring,
independently of any new transport interventions. In light of this insight, Eddington suggests
that in order to achieve the highest economic impact, transport interventions should be
focused on supporting the economies of growing urban areas.

Economic Analysis of the Gauteng Freeway Improvement Scheme 29
The report also argues that in a trade-dependent economy like the UK, improvements to
interurban corridors and links between key points of entry to the economy, such as ports and
airports, and these areas of high economic growth, are also likely to yield higher macro-
economic benefits.
4.3.5.4 Institutional mechanisms for delivering transport improvements
Eddington also argues strongly for the establishment of an „Independent Planning
Commission‟ with powers to take decisions on transport interventions of national importance.
It was noted that the implementation of the strategic transport interventions needed to
support further growth in key urban areas was often severely hampered and excessively
delayed by the multiplicity of institutions involved in the process. In Eddington‟s view, the
introduction of transparent, but much streamlined approvals procedures would yield
substantial economic benefits by significantly reducing the time between project conception
and implementation.
An independent body would also allow investment decisions to capture, and actually take
account of, costs and benefit information from a fuller national perspective rather than the
potentially narrower perspective of a mandated infrastructure institution or local authority.
4.3.5.5 Summary of Eddington’s findings
In summary, the key lessons from the Eddington Transport Study are as follows:
Transport interventions, including infrastructure projects, often yield benefits many
times their costs whether using conventional welfare measures based on transport
time and cost reduction or methodologies that relate GDP impact to the scale of
transport investment.
The highest benefit cost ratios are usually achieved from schemes that deal with
bottlenecks in existing transport networks thus allowing existing infrastructure to
perform more efficiently.
Wider economic benefits, such as economic agglomeration effects, may add between
30% and 50% to benefits achieved using conventional measures. These are
especially significant when interventions are in support of growing urban areas and
points of access such as ports.
Pricing of infrastructure use increases the efficiency with which it is used and yields
major financial benefits. (But, as indicated earlier, [pp 24/25] pricing also has strong
Economic Analysis of the Gauteng Freeway Improvement Scheme 30
distributive impact in that it transfers benefit away from users to the pricing agency.
The ultimate value of a road pricing approach to road funding will therefore depend
on the level of the price and also what happens to the funds raised).
Many transport interventions retain high positive benefit cost ratios even after the
ratios are reduced as a result of monetarised cost of environmental externalities.
Streamlined institutional arrangements are needed to fast-track transport
interventions that are of strategic importance for national economic growth.
While Eddington advocates improved utilisation of existing infrastructure as a first
intervention priority, a key message of the study is that fully quantified macro-economic
analysis also provides a very sound basis for action in terms of major transport infrastructure
expansion.
4.3.6 Lessons for macro-economic cost benefit analysis in South Africa
Cost benefit appraisal methodology in South Africa would benefit from adopting the following
lessons from the Eddington work:
Prioritise small infrastructure and service improvements before committing to major
network expansion because these smaller schemes tend to have the highest BCRs. This
would include interventions such as shoulder lane utilisation; junction capacity
improvements; electronic management and information systems, etc. SANRAL is doing this
already in advance of implementing the project.
Inclusion of Wider Economic Benefits based on efficiency improvements in urban
economies can add significantly to the benefits of large infrastructure interventions. The
feasibility of undertaking such analysis in the Gauteng area is currently being assessed.
In the meantime the following key conclusions should be noted:
Wider economic benefits including agglomeration and other, labour market efficiency
factors, could add between 30 percent and 50 percent to economic benefits
measured by conventional methods;
Given the high rate of economic growth in Gauteng, the higher end of the range for
such benefits could be expected to apply in the case of the FIS programme;

Economic Analysis of the Gauteng Freeway Improvement Scheme 31
The sections of the network most closely supporting concentrations of employment
would have the highest incremental gains from wider economic benefits; links that are
more specifically inter-urban would have lower gains.
Pricing of infrastructure leads to more efficient network use but may result in negative
benefits in terms of agglomeration and other labour market effects, (possibly transferring
benefits away from employees and towards infrastructure operators). The Gauteng FIS is a
combination of pricing and capacity expansion. It is therefore likely to have a less negative
impact on agglomeration and other wider benefits than a pure demand management
approach but would still be suboptimal in terms of achievement of wider benefits.
While pricing of infrastructure does result in more efficient operation, it also reduces the
value of the travel time and other user benefits. Because the agglomeration and other wider
labour market efficiency effects are mediated via improvements in generalised cost of travel,
pricing the infrastructure too highly may result in reduction or even wiping out of value of
these improvements. The effect is extremely efficient operational performance of the
infrastructure but greatly reduced secondary labour market benefits.
In effect, benefit is transferred away from businesses that might otherwise benefit from
improved labour productivity to the network operator.
Pricing of environmental externalities helps optimise choice of intervention. While
environmental externalities of freeway projects are usually negative, the monetarisation work
undertaken by Eddington shows that many infrastructure projects retain strongly positive
BCRs even after environmental costs have been taken into account. At present
environmental effects are dealt with in South Africa as an „off cost benefit balance sheet‟
item. The result is that potentially arbitrary decisions have to be made regarding the extent
to which environmental impacts should impede infrastructure expansion, and the amount of
investment in the mitigation of such impacts. Monetarisation of these impacts could reduce
the level of uncertainty in decisions.
An independent appraisal body for nationally important projects could reduce delays and
allow infrastructure investment decisions to be made on a national, rather than a local or
sectoral cost benefit basis, and also be less constrained by institutional funding mandates.

Economic Analysis of the Gauteng Freeway Improvement Scheme 32
5 Toll collection Systems
The intention of this section is give a brief introduction to the different methods of tolling that
were considered for the project. These are tolling using traditional toll plazas or open road
tolling (ORT).
The traditional toll plaza system is familiar to anyone in Gauteng who uses the N4. Here you
drive up to a plaza, pay the required fee and continue the journey. Often there are frequent
user discounts or local area discounts. In turn this type of system can be either an open or
closed tolling system. A closed tolling system aims to toll every vehicle on the road. While
this is straight forward in a rural environment in an urban environment it means having plazas
on every ramp of the entire freeway system. This is usually financially inefficient and the
result is typically an open tolling system where there are a number of mainline plazas and a
limited number of ramp plazas. The latter are either to limit diversion away from a mainline
plaza or because the ramp carries a high volume of traffic.
One of the key disadvantages of the plaza system for urban roads is the potential for long
delays at the plazas, particularly at peak periods. A potential solution to this problem is to
have a number of lanes that use some kind of electronic toll collection (ETC). This could be
an optical number plate reader or a transponder of some sort. Here, registered users of the
toll road slow down but do not need to stop.
The alternative to this type of tolling system is to use some form of ORT. This is a system
that uses electronic toll collection that partially or totally does away with the need for
traditional toll plazas. Here there are gantries that span the road at regular intervals which
again could use a potential variety of electronic means to record which vehicles are using the
road and how far the vehicles are travelling. (It also potentially allows for the tracking of
stolen vehicles and the monitoring of vehicle speeds).
In considering the use of ORT there are both demand and supply side issues. Demand side
deals with issues relating to people who would use the ORT system while the supply side
deals with those responsible for purchasing, implementing and maintaining the ORT system.
5.1 Supply Side Issues
Analysing the continuum it can be seen that the first and possibly the most important issue
that needs to be addressed is the choice of the toll collection system that would be installed.
This is important as it would affect not only the implementation costs but the maintenance
and enforcement costs as well.

Economic Analysis of the Gauteng Freeway Improvement Scheme 33
Table 2: Generic Comparison of Different Toll Systems2
Manual Operation Hybrid Operation Fully Automated ETC
Maintenance High Medium-High Low
Congestion Relief Low Medium High
Required
Enforcement
Low Medium-Low High
A fully automated ORT system requires little maintenance “While a conventional interchange
requires 25 full-time employees, at a cost of up to one-third of the toll collection revenue, the
ETC option would require only one maintenance person and account support”3 Note however
the fully automated ETC system would required a labour intensive enforcement system often
also requiring local traffic police assistance4. The Hybrid options make use of Express or
Managed lanes; here toll users who have subscribed to the system need not wait to pay but
pass through with the ETC automatically debiting their account. Once again effective
enforcement procedures must be in place5.
When an ORT system is implemented it requires that consumers that use the system have
some type of on board unit (OBU). This raises two issues. Firstly who would install the OBU‟s
and also where would this installation take place. While secondly and most importantly, who
would bear the cost of purchasing, installing and maintaining the OBU. It is issues such as
this that have a high impact on the demand side decision to join the ETC system or not.
Some international trends indicate that subsidisation would be preferable.
As discussed by Chen (2007) one of the major issues surrounding low subscription is that
consumers are not fully aware of the benefit if the join the system. It is thus important that a
marketing campaign be conducted to educate the public about the potential benefits. Chen
further suggests that this needs to be an ongoing campaign.
At present no international standards of best practice with regards to ETC can be found, due
to different government intervention between countries. In Japan the ETC system is entirely
funded and run by the Government, while in the USA there have been moves to privatise toll
collection systems (http://www.itscanada.ca).
2 Note that this table was compiled by using different internet sources namely (http://www.itscanada.ca) &
(http://www.calccit.org/itsdecision/serv_and_tech/Electronic_toll_collection). 3 (http://www.calccit.org/itsdecision/serv_and_tech/Electronic_toll_collection).
4 (http://www.itslessons.its.dot.gov/its/benecost.nsf
5http://www.itslessons.its.dot.gov/its/benecost.nsf)&(http://www.calccit.org/itsdecision/serv_and_tech/Electronic_toll_collection).

Economic Analysis of the Gauteng Freeway Improvement Scheme 34
The last supply side issue that needs to be addressed is that specific legal procedures must
be in-place not only to ensure that those not paying toll fees are dealt with but also to ensure
that the consumers‟ right to privacy is respected.
5.2 Demand Side Issues
An important issue that underpins the success of an ETC system is whether consumers
would join. A key factor in this decision is the cost that the consumer would have to bear and
also the perceived benefit that consumer would receive. “The most prominent suggestion for
improving the ETC system is cost related: availability of toll discounts (for those that are part
of the system) as well as cheaper OBU’s” (Montalbo 2007). Linked to this is the marketing
and public acceptance programme that should be aimed at educating the consumers about
the benefits of the new system. Montalbo showed further that approximately 55% of
consumers that opted not to join the ETC system did so due to high initial cost, while
approximately only 23% opted not to use the system due to infrequent use of the carriage
way. From this it is clear that cost to the consumer is a key factor in ensuring that the ETC
system succeeds.
Interestingly an issue that needs to be taken into account when marketing the ETC system is
that “Commuters do not always value time savings as highly as planners would like. In
addition, minor time savings exhibited on a few of the newest ETC facilities do not justify the
cost of obtaining and maintaining and OBU and a toll account”6. It is thus necessary to, when
marketing the product to the consumers to ensure that a package of benefits is marketed and
not just “Time Savings”.
6 (http://www.itscanada.ca).

Economic Analysis of the Gauteng Freeway Improvement Scheme 35
6 Efficiency, Equity and Toll roads
This section explores the interrelationship that exists between economic efficiency, equity
and the tolling of roads. The discipline of economics distinguishes between three types of
economic efficiencies. These are productive, allocative and dynamic efficiency. Productive
efficiency occurs when the factors of production within a country are used in their most
efficient way. Allocative efficiency refers to the actual mix of production and output. Dynamic
efficiency is the degree to which productive and allocative efficiency interact with other
factors to generate economic growth. Since transport is a derived demand (only some people
drive purely for the pleasure of driving) the focus here is on productive efficiency.
The section starts by focusing on the ways in which the project would contribute to the
generation of economic efficiencies. This is followed by the identification of source of
inefficiency for the project and a conclusion about the trade off between equity and efficiency.
6.1 Sources of efficiency
The project has the potential to contribute to the generation of productive efficiency in at least
three ways.
6.1.1 User pays principle
The requirement that the tolling system be economically efficient is captured in the
government transport policy document, “Moving South Africa”. In the overview this includes
the objective: „Recover full costs from users‟. This is elucidated in two parts. The first
requires that users are charged for the full cost of their use of infrastructure and operations
used, and for all externalities they generate. The second requires that users not be charged
above full costs in order to support infrastructure and operations that do not provide them
with benefits (Moving South Africa p17).
In effect this requires that each road user pay a fee equal to the incremental costs that user
imposes on the roads and on other road users. The charge can also incorporate an element
to cover amortisation of the sunk costs involved, however no group of users should be cross-
subsidising other users. Hence tolling increases equity because only those people who use
the roads actually pay for them. Funding the roads through an increase in the fuel tax
reduces equity because the benefits from the roads are localised (to specific users) while the
costs are borne by anyone who pays for fuel.
Economic Analysis of the Gauteng Freeway Improvement Scheme 36
6.1.2 Damage and distortions from heavy vehicles
Before toll roads there was little way in which heavy vehicles could be charged fully for the
use of a road. Vehicle licences and fuel tax are not adequate here because they do not
increase in proportion between light and heavy vehicles relative to the degree of damage that
these vehicles cause. The consequence is that light vehicle owners are subsidising heavy
vehicles by paying more than their „user cost‟ portion of the road.
This subsidy further distorts the transport system through its impact on the rail network.
Spoornet, for example, not only covers the running costs of its own haulage operations, but
is also responsible for all track construction and maintenance. In addition, hauliers do not pay
for road damages or any clean ups (e.g. chemical spills) that are necessitated by accidents
involving trucks while rail operators cover all of the cost when accidents occur.
6.1.3 Congestion tolling
Vehicles impose four main costs on the rest of society – accident externalities, environmental
pollution, road damage, and congestion. As these are costs that are borne by society but not
by the driver this means that the journey is costing the individual less than it is costing
society. Now, while these issues are largely irrelevant on open rural roads, they become
particularly important as road congestion increases. The incidence of accidents increases,
and the slower moving traffic increases air and noise pollution, and adds to road user costs.
It is clear that congestion is a source of economic inefficiency.
The project has the capacity to address these economic inefficiencies by introducing
congestion tolling. This requires a toll that varies with time of day. While such congestion
tolling has not been introduced on any of South Africa‟s toll roads to date they do warrant
consideration because of their capacity to generate economic efficiencies.
6.2 Sources of inefficiencies
In contrast to the sources of efficiencies outlined above the project also has the capacity to
generate a number of inefficiencies.
6.2.1 Toll collection costs
Paying for roads through taxes or a dedicated fuel fund is simply cheaper than imposing tolls
on a road even if this is through an ORT system. The cost of collection is far lower because it
does not incur the cost of toll collection system.

Economic Analysis of the Gauteng Freeway Improvement Scheme 37
It has been calculated that the actual cost of the toll infrastructure adds, on average 8.5 cents
per vehicle kilometre. This is the cost that would be incurred to pay for improved equity.
6.2.2 Diversions
The increased possibility of vehicles diverting because of the proposed tolling would
generate economic inefficiencies as social costs diverge from private costs. Tolling an open
highway may shift some costs onto the province and local residents as vehicles divert onto
secondary roads to avoid tolls.
Where an open access tolling system on a trunk route is combined with unmonitored,
uncontrolled and untolled side roads, there is an incentive for drivers to use them. Since such
alternate routes are generally narrower and have lighter foundations, whenever tolling shifts
a heavy vehicle to a side road it increases road damage, reduces revenue recovery, slows
traffic flows and increases accident risk. The damage a vehicle does to a road rises
exponentially with that vehicle‟s mass and axle loading. It also rises if the road being used
has light foundations, i.e. a road not designed for heavy vehicle use. Tolling that leads to
heavy vehicle diversion to minor roads may thus feasibly reduce efficiency.
While it can probably be expected that there would be some diversions in the early years of
the project it can also be expected that the additional capacity that would be added to the
freeway system would attract traffic off the rest of the road network. Conversely, in the
absence of adding capacity to the freeway network it is a fact that sections of these roads are
already at or close to full carrying capacity during morning and afternoon peak hour. Growth
in vehicle ownership would then have the effect of increasing diversions to the rest of the
road network and an increase in the time that peak traffic continues.

Economic Analysis of the Gauteng Freeway Improvement Scheme 38
7 A Cost Benefit Analysis
This section reports on the economic cost benefit analysis of the project. The following costs
were included in the analysis:
The construction, maintenance and operations costs of the roads and toll collection
infrastructure.
Road user costs (which include vehicle operating costs, time costs and accidents).
The cost of diversions to the road users who would divert off the toll roads and onto
the network.
The cost, if any, to the Provincial /metropolitan Authorities who would be responsible
for the increased cost of maintaining their network due to traffic diversion.
The results are given for various tolling rates, namely 0c per km (i.e. no tolling), 30c, 40c,
50c, 60c and 70c per km for light vehicles. The ratio between tolls paid by light vehicles and
tolls paid by other vehicles is 2.5 times for a class B vehicle and 4.5 times for a class C
vehicle. In order to reduce the degree of verbiage in this report tolls for heavy vehicles are
referred to as „toll equivalent‟ meaning that, for example, a 30c toll for a light vehicle would
be 75c for a class B vehicle and a 40c light vehicle toll would be a R1.00 toll for a class B
vehicle.
The results for heavy vehicles from the traffic model were given on an axle based system
rather than a volumetric based system. Hence the results are given for class 2, 3 and 4
heavy vehicles rather than classes B & C. However, the toll ratio for class C is the same as
for class 4 while class B is between classes 2 and 3. The toll ratios for classes 2, 3 and 4
are 2, 3.25 & 4.5 respectively.
7.1 Results
The overall economic costs and benefits of upgrading and tolling relative to the do nothing
option are given in Table 3.
These are the light vehicle tolling rates and will be referred to as the equivalent tolling rates
for heavy vehicles. The toll tariffs applicable to heavy vehicles would be multiplies of these
light vehicle tolling rates.

Economic Analysis of the Gauteng Freeway Improvement Scheme 39
All tolling strategies, apart from the no tolling option (0c per km) have the same initial
construction costs and operating & maintenance costs. For the no tolling option there is a
reduced initial construction cost (PV of R1.7bn) from not having to implement the tolling
system and reduced operating and maintenance costs (PV of R10.1bn).
The costs to local authorities increase as the tolling rate increases. This occurs because as
the toll increases so more and more vehicles would divert off the toll roads and onto the rest
of the road network. This results in a higher annual maintenance cost to the municipal and
provincial road authorities.
Table 3: Economic cost benefit analysis
Total costs therefore increase from a PV of R17.5bn for a 0c per km toll to R29.8bn for a 70c
per km toll. While the costs increase as the tolling rate increases, benefits on the other hand
generally show a decrease. The benefits, as characterised by road user cost savings when
compared to the “Do nothing” case, decrease from a PV of R244.8bn for 0c per km to
R239.6bn for 70c per km. The two exceptions to this are the increase when moving from 0c
per km to 30c per km and from 40c per km to 50c per km. The reason for these two
exceptions has to do with the different behaviour among the different classes of road users.
If tolling is introduced and the rate changes from 0c to 30c per km commuters and other light
vehicles divert off the toll road, while business travellers and heavy vehicles remain on the
toll roads who can then travel at a greater speed. This results in a higher value of time
savings because business travellers and heavy vehicles have a higher cost of time than
commuters and other light vehicle users. This pattern only occurs for certain increments in
the tolling rate because generally as the toll rate increases so more vehicles would divert off
the toll roads. The vehicles that remain on the toll roads are already travelling at the official
speed limit and cannot (in theory) travel any faster.
The Benefit Cost Ratios (BCR), are all above 8.0, indicating that the project is, from an
economic perspective, beneficial to society. The BCR reduces from 14.0 for the 0c per km
tolling rate to 8.4 for 30c, 8.3 for 40c, 8.4 for 50c, 8.1 for 60c and 8.0 for 70c. The effect of
0c 30c 40c 50c 60c 70c
Initial Construction Costs 14,689 16,410 16,410 16,410 16,410 16,410
Operating & Maintenance Costs 2,793 12,902 12,902 12,902 12,902 12,902
Cost to Local Authorities 0 193 270 344 398 459
Total Costs (R million) 17,483 29,505 29,582 29,656 29,710 29,772
Road User Cost Savings 244,761 248,019 244,401 247,967 240,831 239,580
Total Benefits (R million) 244,761 248,019 244,401 247,967 240,831 239,580
Net Benefits (R million) 227,279 218,514 214,819 218,311 211,121 209,808
BCR 14.0 8.4 8.3 8.4 8.1 8.0
IRR 41% 37% 37% 37% 37% 37%
Toll Rate per kmResults of Cost Benefit
Analysis

Economic Analysis of the Gauteng Freeway Improvement Scheme 40
tolling on the upgraded road network is therefore to reduce the BCR from 14.0 to between
8.0 and 8.4, depending on which tolling rate is chosen.
The Net Benefits or NPV, which is the difference between the benefits and the costs, are all
positive and vary between R209.8bn for a 70c per km tolling rate to R227.3bn for a 0c per
km tolling rate. The IRR‟s for all the tolling options are 37%, while for the non-tolling option is
41%.
7.2 Sensitivity analysis
A sensitivity analysis was performed on two key variables that were used in the analysis.
These are the maintenance and operating costs and the cost of time. The sensitivity
analyses is done only for a 50c toll.
7.2.1 Maintenance and Operating Costs
The maintenance & operating costs are important in the overall costs of the project.
Although the initial construction costs have PV‟s that are higher than that of the maintenance
& operating costs, the initial construction costs have been largely incurred and doing a
sensitivity analysis on them would be of no value. This sensitivity analysis looks at the effect
of increasing the maintenance & operating costs. The results are shown in Table 4.
Table 4: Sensitivity analysis on Maintenance & Operating Costs
Doubling the operating & maintenance costs reduces the BCR for the 50c toll from 8.4 to 5.8.
Tripling the operating & maintenance costs reduces the BCR further to 4.5. Under both
cases the BCR is still higher than one, indicating that the project remains economically
viable.
The conclusion drawn from this sensitivity analysis is that a threefold increase in operating &
maintenance costs does not invalidate the economic viability of this project.
7.2.2 Cost of Time
In the analysis different road users are, based on their declared income, given different
values of time. Business travellers have costs of time equal to their income, whereas
commuters and other travellers have lower costs of time. According to the World Bank
Sensitivity O&M BCR
1.0x O&M Costs 12,902 8.4
2.0x O&M Costs 25,804 5.8
3.0x O&M Costs 38,706 4.5

Economic Analysis of the Gauteng Freeway Improvement Scheme 41
guidelines on economic analysis non-business road users should be allocated a cost of time
equal to a third of their income. This sensitivity examines the impact of varying the costs of
time.
Table 5: Effect of varying the Costs of Time
It can be seen from Table 5 that halving the cost of time has the effect of reducing the BCR
from 8.4 to 4.4. Halving the cost of time nearly halves the BCR, so it can be concluded that
the cost of time would need to be reduced to one eighth for the BCR to approach 1 and for
the project to become economically unviable.
Conversely, increasing the cost of time increases the BCR. This is similar to applying a
motorway bonus to road user benefits. A motorway bonus incorporates those perceived
benefits that road users attach to using a toll road, over and above the vehicle operating cost
savings, time savings and reduction in accidents. Examples of motorway bonuses would be
safety perceptions attached to driving at night on a well-lit road rather than deviating through
dark areas and having to stop at traffic lights. The BCR would increase from 8.4 to 10.3 if
the motorway bonus were as much as 25% of the cost of time.
The overall conclusion of this sensitivity analysis is the while varying the cost of time does
have an effect on the overall results it does not change the overall conclusion that the project
is economically viable and beneficial to society.
1.25x Cost of Time 55.54 210.72 56.55 66.38 10.3
1.0x Cost of Time 44.43 168.58 45.24 53.11 8.4
0.75x Cost of Time 33.33 126.43 33.93 39.83 6.4
0.5x Cost of Time 22.22 84.29 22.62 26.55 4.4
LV
Commuters
Cost of Time
(R/hour)
LV
BusinessLV Other
Heavy
VehiclesBCR
Economic Analysis of the Gauteng Freeway Improvement Scheme 42
7.3 Road user costs and benefits
One of the critical issues in the economic assessment of the project is how tolling the roads
would impact on people and business. There are a variety of potential impacts.
The first is that people would now pay a toll to use the freeway network.
The second is that there would be potential cost savings to road users because the
increased capacity and surface upgrades reduce vehicle operating costs and
accident costs.
Increased capacity would reduce traffic congestion and therefore reduce travel times
on the proposed toll roads and the costs associated with travel.
The increased capacity of the project could attract additional traffic. If this occurs
there would be less traffic on the rest of the road network. This would lead to reduced
congestion and lower travel costs for road users and lower road maintenance costs
for local authorities.
There is the potential for the proposed tolling to cause traffic diversions. Where this
occurs there would be slower travelling times, increased chance of accidents and the
costs associated with these changes. There would be increased road maintenance
costs to local authorities if there were substantial heavy vehicle deviations.
The section starts with a brief description of methodology. Second, estimated costs and
benefits to individual road users are reported on.
7.3.1 Methodological approach
The approach followed was to determine the current and future road user costs for individual
and total vehicle usage for the seven potential options. These are the do nothing option, the
upgrade but not tolling option and the upgrade option with five different tolling rates (30c,
40c, 50c 60c and 70c per km tolling rate). The difference between these costs, less any toll
tariff that would be paid, is the net financial cost or benefit to the road user.
There are a number of factors that complicate estimating the changes in costs:
The tolled and untolled roads would have different carrying capacities and different
riding surfaces. The proposed toll roads make provision for initial and ongoing
increases in carrying capacity. In turn it has been assumed that the untolled roads

Economic Analysis of the Gauteng Freeway Improvement Scheme 43
would have no capacity increases but sufficient maintenance to keep a reasonable
road surface. In consequence there would be different road user costs for the tolled
and untolled roads.
Increased capacity would attract traffic to the upgraded roads where the toll tariff
determines the degree of attraction. If the toll tariff were raised too high it would push
traffic onto the rest of the road network. The result of attracting or repelling traffic
affects the riding quality of the road particularly if there are changes in flows of heavy
vehicles.
There are several computer software programmes available that assist in calculating benefits
to road users for alternative road transport projects. One of the most well known software
programmes is the Highway Design and Maintenance Standard Model 4 (HDM4)7. It was
developed by the World Bank and is used extensively by traffic engineers in South Africa.
The HDM4 computer model takes its starting point as the concept of “pavement life cycle
analysis” and is able to generate vehicle operating costs (VOC) and road user costs (RUC)
per kilometre of road for various classes of vehicles, road alignments, traffic flows and
pavement conditions.
The methodological approach used here follows the logic of the HDM4 software for the
calculation of vehicle operating costs and road user charges but does not use HDM4
explicitly. Rather a spreadsheet modelling approach was used to replicate the HDM4
algorithms and output. The main reason for following this approach was because HDM4 is
very „black-box‟ in its presentation and does not have the transparency or flexibility of a
spreadsheet model.
7.3.2 Quantifying vehicle operating costs and road users costs
Technically two different costs are defined in the use of a vehicle. The first are the so-called
vehicle operating costs. These are specific to the cost of using a vehicle. Second are road
user costs. Road user costs include vehicle operating costs but also include costs of
potential accidents and time costs. The methodological approaches to these two costs are
discussed below.
7 www.worldbank.org/transport/roads/rd_tools/hdm4.htm

Economic Analysis of the Gauteng Freeway Improvement Scheme 44
7.3.3 Quantifying vehicle operating costs
Vehicle operating costs (VOC) are direct costs incurred by the owner or driver of a vehicle.
Specifically these include fuel, capital, maintenance, tyres and oil. These costs vary
according to the type of vehicle that is operated as well as the type of road and terrain
covered by the road. In addition to this, the age of the road and the type of traffic the road
has been subjected to also affect operating costs. SANRAL supplied the information used in
these calculations as an output from the HDM4 software.
Different types of roads in different topographical locations result in different basic VOC and
Road User Costs (RUC). The freeways are made up of different types of road as a result of
varying levels of traffic. The VOCs for each section of road were treated separately according
to the type of road and the data was read from the HDM4 database, which is incorporated
into the model. An example of the VOC‟s from the database is shown in Table 6. Most of
the roads in the analysis have been treated as either 4, 6 or 8 lane freeways in rolling terrain.
Table 6: Vehicle Operating Costs per km from HDM4 Database
Vehicle Class DUAL4F VOC DUAL6R VOC PAVED2PR VOC
Class 1 Light Vehicles R3.01 R3.01 R3.01
Class 2 Heavy Vehicles R8.05 R8.08 R8.93
Class 3 Heavy Vehicles R10.67 R10.69 R20.33
Class 4 Heavy Vehicles R20.25 R20.33 R23.54
For any given road, VOCs are determined by the quality of the road surface. Good road
surfaces result in lower vehicle operating costs while bad road surfaces result in higher
costs. The quality of the road surface is given by the so-called Present Serviceability Index
(PSI) factor. The road quality deteriorates over time due to both vehicle usage and weather
damage. Typically new or upgraded roads would have a PSI of 4.0 and a PSI of 2.5 to 2.0
under normal traffic conditions by the end of its design life. For the purposes of this analysis
the upgraded roads are assumed to have a PSI of 4.0, while the un-upgraded roads are
assumed to have a PSI of 2.5.
VOC and RUC need to be adjusted for different road qualities and congestion values. The
quality of the riding surface of the existing road is inferior to that of a newly built or upgraded
road. The PSI of a road is calculated from the following formula (CB Roads):
PSI(t) = PSInew – (PSInew – PSIend) x (E80(t) / Design E80)n
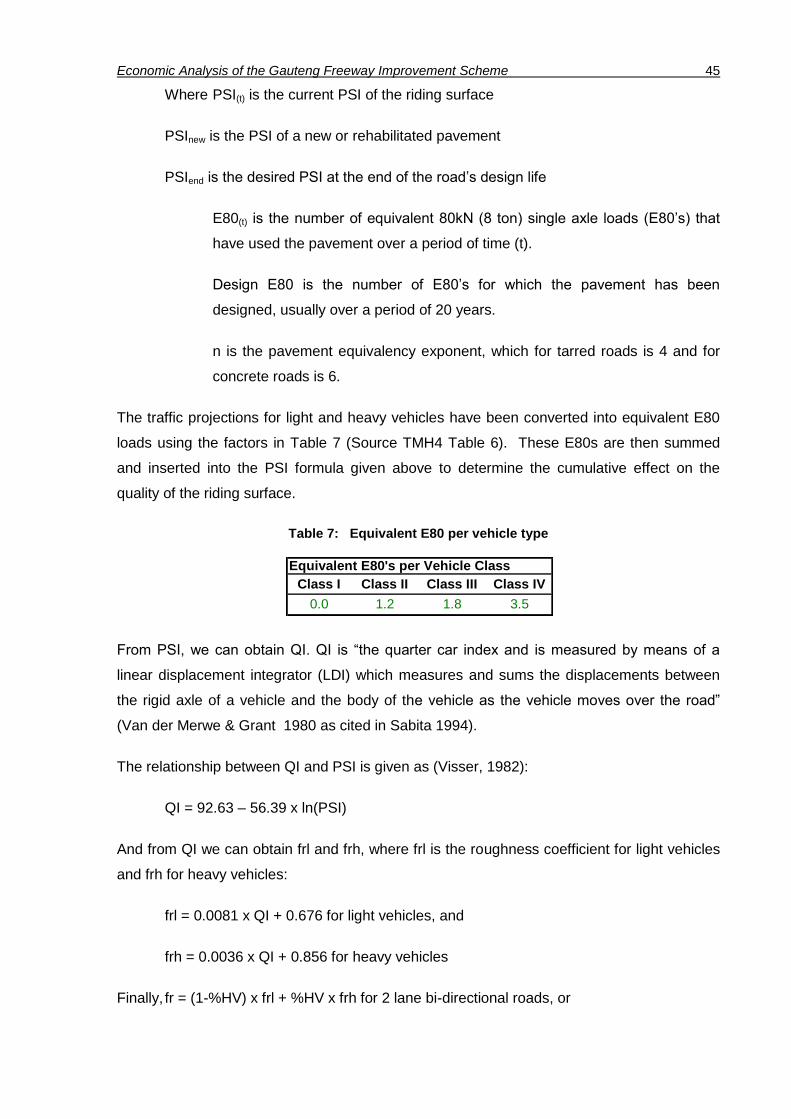
Economic Analysis of the Gauteng Freeway Improvement Scheme 45
Where PSI(t) is the current PSI of the riding surface
PSInew is the PSI of a new or rehabilitated pavement
PSIend is the desired PSI at the end of the road‟s design life
E80(t) is the number of equivalent 80kN (8 ton) single axle loads (E80‟s) that
have used the pavement over a period of time (t).
Design E80 is the number of E80‟s for which the pavement has been
designed, usually over a period of 20 years.
n is the pavement equivalency exponent, which for tarred roads is 4 and for
concrete roads is 6.
The traffic projections for light and heavy vehicles have been converted into equivalent E80
loads using the factors in Table 7 (Source TMH4 Table 6). These E80s are then summed
and inserted into the PSI formula given above to determine the cumulative effect on the
quality of the riding surface.
Table 7: Equivalent E80 per vehicle type
From PSI, we can obtain QI. QI is “the quarter car index and is measured by means of a
linear displacement integrator (LDI) which measures and sums the displacements between
the rigid axle of a vehicle and the body of the vehicle as the vehicle moves over the road”
(Van der Merwe & Grant 1980 as cited in Sabita 1994).
The relationship between QI and PSI is given as (Visser, 1982):
QI = 92.63 – 56.39 x ln(PSI)
And from QI we can obtain frl and frh, where frl is the roughness coefficient for light vehicles
and frh for heavy vehicles:
frl = 0.0081 x QI + 0.676 for light vehicles, and
frh = 0.0036 x QI + 0.856 for heavy vehicles
Finally, fr = (1-%HV) x frl + %HV x frh for 2 lane bi-directional roads, or
Equivalent E80's per Vehicle Class
Class I Class II Class III Class IV
0.0 1.2 1.8 3.5

Economic Analysis of the Gauteng Freeway Improvement Scheme 46
fr = 0.8 + 0.3 x (1-%HV) x frl + 0.9 x %HV x frh for multi lane roads
The proportion of heavy vehicles in the daily traffic is given as %HV.
By multiplying the VOC with fr, one can obtain the Vehicle Operating Costs for a particular
quality road and for a particular traffic count. The model does this for each link for the before
and after upgrading options, i.e. VOCBEFORE and VOCAFTER per link. The VOC‟s are
unique on each link because of the different proportion of vehicle classes that occur there,
the different type of road and the varying quality of the riding surface. This is done for the
five discreet time slots that have been analysed, namely weekday morning peak, afternoon
peak, midday off peak, night time and weekends. Each of these time periods have their own
vehicle traffic composition.
7.3.4 Quantifying road user costs
Road user costs are the sum of vehicle operating costs, potential costs of accidents and the
cost of time. As has been shown above, type of road and terrain as well as the quality of the
road surface affect vehicle operating costs. The HDM4 approach to accident costs is to allow
cost changes depending on road and terrain type. Accident costs also increase as a result of
increasing traffic congestion. Accident costs are given as a fixed value for road and terrain
type and as a variable factor (the so-called fc) for congestion where fc is the congestion
factor. Finally, time costs are considered because of the opportunity cost of a journey and
are typically measured as earnings foregone.
Accident costs are determined from a SANRAL database, based on accident related
statistics. The accident statistics are classified by the number of fatal, serious and light
accidents and the damage per 100 million vehicle kilometres for different types of roads. This
is done according to the type of intersections encountered on the road (at grade or grade
separated) and according to the type of shoulder on the road (paved or unpaved). The
length of the road link is multiplied by the appropriate accident statistic to obtain the potential
cost of an accident per commuter.
The key issue for changes in road user costs relates to traffic congestion. As congestion
increases so too does the probability of an accident and the opportunity cost of the journey.
The upgrading and capacity increases will allow these roads to carry more traffic with less
congestion than would be the case if the roads had been maintained at their current capacity
and riding quality. In order to measure these changed road user costs resort was made to
HDM4 type methodology for the measurement of the cost of accidents. For measuring the
cost of time the traffic engineers supplied predicted speeds for different options for each link

Economic Analysis of the Gauteng Freeway Improvement Scheme 47
on the roads. Taking the speed saving and applying a cost of time value and vehicle
occupancy rate allowed for a value to be placed on the savings in road user costs. The five
time periods that were analysed have their own traffic congestion and travel speeds.
The cost of time and vehicle occupancy rates were based the road side interview conducted
in 2009 and the results increased to 2010 values using the increases in GDP per capita over
the same time period. The time costs have been divided into working time and non-working
time costs for class 1 vehicle owners and working time costs for all other classes. According
to K.W. Gwouldiam (1997), as cited in Belli et al (1998), working time only applies to people
driving on work-related business and does not include commuting to and from work. The
same report suggests that non-working time be taken as one third that of working time. The
number of people per car during peak and off peak times is determined from the roadside
interviews to produce the total cost of time per vehicle per hour. The traffic engineers have
supplied the speed of the different classes of vehicles over the length of the link of road
under consideration, which thus determines the time spent per length of road link. The cost
of time per vehicle per road link is then calculated. The actual values used in the cost of time
calculations are given in Table 8.
Table 8: Cost of time per vehicle (rands per hour)
Congestion also has an impact on the Road User Costs. The capacity of the road would be
increased with its upgrading, and the effect of the reduced congestion would magnify the
difference in the vehicle operating costs for the before and after upgrading options, as well as
the accident costs. At low vehicle flows, there is no magnification, but once the number of
vehicles on the road starts exceeding 40% of the road capacity then there is a difference as
shown in the formulae below:
If V/C <= 0.4, then fc = 1.00
0.4 < V/C <= 1.00, then fc = (V/C + 0.6) 1.15
V/C > 1.00 then fc = 1.6 1.15
Where: V/C is the number of vehicles as a proportion of the capacity of the road and fc is
the multiplication factor for the road user costs.
The final Road User Costs (RUC) are then obtained from
From 2009 RSI 2009 R/hr 2010 R/hr
LV Commuting Time 165.44 177.66
LV Non-Working Time 168.45 180.90
LV Working Time 156.98 168.58

Economic Analysis of the Gauteng Freeway Improvement Scheme 48
RUC = (Accident Costs x fc + Time Costs + VOC x fr x fc) x length of road
Road User Costs can now be obtained for the before and after upgrading options. The
difference in before and after, multiplied by the length of road that the user would be
commuting on, should be more than the toll fee charged if the proposal is to be of a benefit to
that road user.
It will also be recognised that as traffic congestion varies according to the day and according
to the season, allowances need to be made as to how these impact on road user costs. To
this end five types of estimates have been made. They are for individual vehicles travelling in
weekday morning peak hour traffic, afternoon peak hour traffic, midday offpeak traffic, night
time traffic and weekend traffic.
The quantification of the change in road user costs follows from the calculations of the road
PSI and the vehicle operating cost outlined in the section above. From these calculations we
know the vehicle operating costs for the tolled and untolled roads for each link along each
road. From the traffic engineers we also know the volume of traffic on each link and vehicle
speed (again recognising that volumes and travelling speeds differ according to the tolled
and untolled option).
Hence the difference in road user benefits are the reduced road user costs as a result of the
upgrading of each section and link. The overall change in road user costs is therefore the
difference between the cost of driving on the untolled road without upgrades and difference
in road user costs and benefits of driving on the upgraded and tolled road.
A practical example of this methodological approach is illustrated in Table 9 and Table 10.
These tables illustrate the VOC and RUC for the section on the N1 from Proefplaas to the
Brakfontein Interchange. Table 9 gives the estimated costs and benefits for the road without
any upgrading while Table 10 conducts the identical exercise for a road that is upgraded.
The most important numbers in these tables are those for “Individual Road User Costs”. Here
a comparison of the numbers on the two tables indicates the cost savings due to upgrading.
No toll tariff is removed in these calculations because the proponents preferred location is
not on this section. For those sections where a gantry is located the benefits are reduced by
that toll.
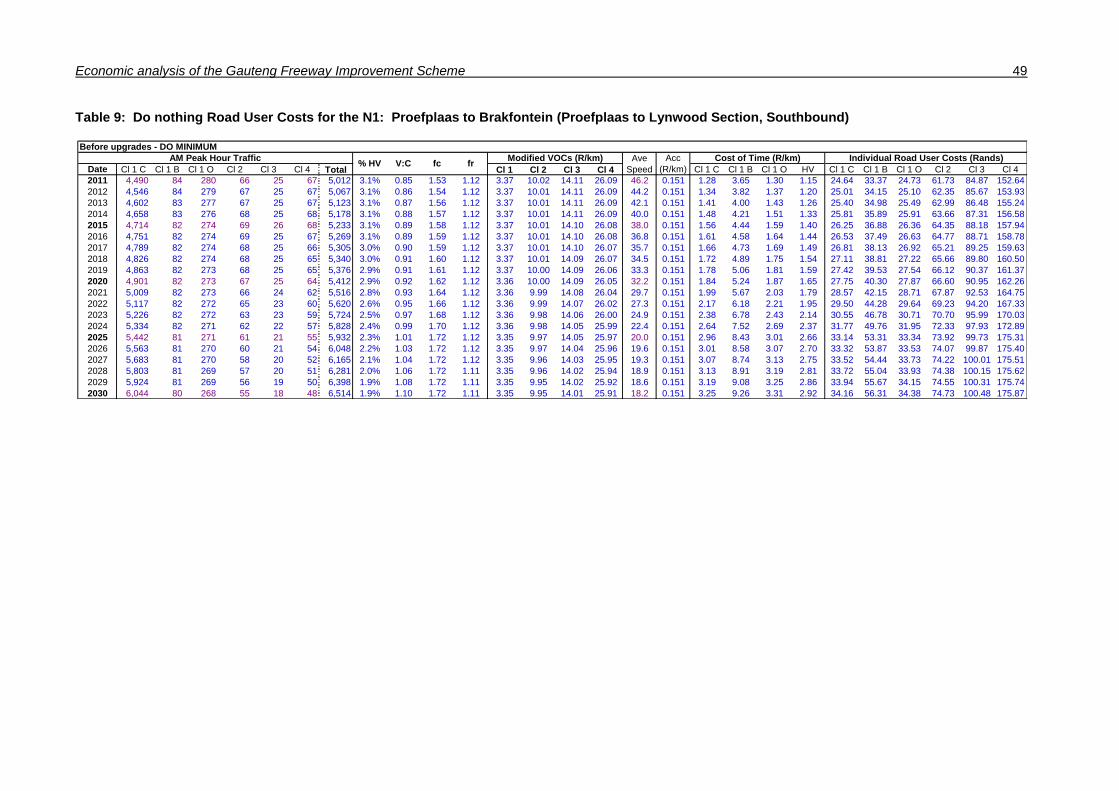
Economic analysis of the Gauteng Freeway Improvement Scheme 49
Table 9: Do nothing Road User Costs for the N1: Proefplaas to Brakfontein (Proefplaas to Lynwood Section, Southbound)
Date Cl 1 C Cl 1 B Cl 1 O Cl 2 Cl 3 Cl 4 Total Cl 1 Cl 2 Cl 3 Cl 4 Cl 1 C Cl 1 B Cl 1 O HV Cl 1 C Cl 1 B Cl 1 O Cl 2 Cl 3 Cl 4
2011 4,490 84 280 66 25 67 5,012 3.1% 0.85 1.53 1.12 3.37 10.02 14.11 26.09 46.2 0.151 1.28 3.65 1.30 1.15 24.64 33.37 24.73 61.73 84.87 152.64
2012 4,546 84 279 67 25 67 5,067 3.1% 0.86 1.54 1.12 3.37 10.01 14.11 26.09 44.2 0.151 1.34 3.82 1.37 1.20 25.01 34.15 25.10 62.35 85.67 153.93
2013 4,602 83 277 67 25 67 5,123 3.1% 0.87 1.56 1.12 3.37 10.01 14.11 26.09 42.1 0.151 1.41 4.00 1.43 1.26 25.40 34.98 25.49 62.99 86.48 155.24
2014 4,658 83 276 68 25 68 5,178 3.1% 0.88 1.57 1.12 3.37 10.01 14.11 26.09 40.0 0.151 1.48 4.21 1.51 1.33 25.81 35.89 25.91 63.66 87.31 156.58
2015 4,714 82 274 69 26 68 5,233 3.1% 0.89 1.58 1.12 3.37 10.01 14.10 26.08 38.0 0.151 1.56 4.44 1.59 1.40 26.25 36.88 26.36 64.35 88.18 157.94
2016 4,751 82 274 69 25 67 5,269 3.1% 0.89 1.59 1.12 3.37 10.01 14.10 26.08 36.8 0.151 1.61 4.58 1.64 1.44 26.53 37.49 26.63 64.77 88.71 158.78
2017 4,789 82 274 68 25 66 5,305 3.0% 0.90 1.59 1.12 3.37 10.01 14.10 26.07 35.7 0.151 1.66 4.73 1.69 1.49 26.81 38.13 26.92 65.21 89.25 159.63
2018 4,826 82 274 68 25 65 5,340 3.0% 0.91 1.60 1.12 3.37 10.01 14.09 26.07 34.5 0.151 1.72 4.89 1.75 1.54 27.11 38.81 27.22 65.66 89.80 160.50
2019 4,863 82 273 68 25 65 5,376 2.9% 0.91 1.61 1.12 3.37 10.00 14.09 26.06 33.3 0.151 1.78 5.06 1.81 1.59 27.42 39.53 27.54 66.12 90.37 161.37
2020 4,901 82 273 67 25 64 5,412 2.9% 0.92 1.62 1.12 3.36 10.00 14.09 26.05 32.2 0.151 1.84 5.24 1.87 1.65 27.75 40.30 27.87 66.60 90.95 162.26
2021 5,009 82 273 66 24 62 5,516 2.8% 0.93 1.64 1.12 3.36 9.99 14.08 26.04 29.7 0.151 1.99 5.67 2.03 1.79 28.57 42.15 28.71 67.87 92.53 164.75
2022 5,117 82 272 65 23 60 5,620 2.6% 0.95 1.66 1.12 3.36 9.99 14.07 26.02 27.3 0.151 2.17 6.18 2.21 1.95 29.50 44.28 29.64 69.23 94.20 167.33
2023 5,226 82 272 63 23 59 5,724 2.5% 0.97 1.68 1.12 3.36 9.98 14.06 26.00 24.9 0.151 2.38 6.78 2.43 2.14 30.55 46.78 30.71 70.70 95.99 170.03
2024 5,334 82 271 62 22 57 5,828 2.4% 0.99 1.70 1.12 3.36 9.98 14.05 25.99 22.4 0.151 2.64 7.52 2.69 2.37 31.77 49.76 31.95 72.33 97.93 172.89
2025 5,442 81 271 61 21 55 5,932 2.3% 1.01 1.72 1.12 3.35 9.97 14.05 25.97 20.0 0.151 2.96 8.43 3.01 2.66 33.14 53.31 33.34 73.92 99.73 175.31
2026 5,563 81 270 60 21 54 6,048 2.2% 1.03 1.72 1.12 3.35 9.97 14.04 25.96 19.6 0.151 3.01 8.58 3.07 2.70 33.32 53.87 33.53 74.07 99.87 175.40
2027 5,683 81 270 58 20 52 6,165 2.1% 1.04 1.72 1.12 3.35 9.96 14.03 25.95 19.3 0.151 3.07 8.74 3.13 2.75 33.52 54.44 33.73 74.22 100.01 175.51
2028 5,803 81 269 57 20 51 6,281 2.0% 1.06 1.72 1.11 3.35 9.96 14.02 25.94 18.9 0.151 3.13 8.91 3.19 2.81 33.72 55.04 33.93 74.38 100.15 175.62
2029 5,924 81 269 56 19 50 6,398 1.9% 1.08 1.72 1.11 3.35 9.95 14.02 25.92 18.6 0.151 3.19 9.08 3.25 2.86 33.94 55.67 34.15 74.55 100.31 175.74
2030 6,044 80 268 55 18 48 6,514 1.9% 1.10 1.72 1.11 3.35 9.95 14.01 25.91 18.2 0.151 3.25 9.26 3.31 2.92 34.16 56.31 34.38 74.73 100.48 175.87
AM Peak Hour Traffic Modified VOCs (R/km)% HV V:C fc fr
Ave
Speed
Cost of Time (R/km) Individual Road User Costs (Rands)Acc
(R/km)
Before upgrades - DO MINIMUM

Economic analysis of the Gauteng Freeway Improvement Scheme 50
Table 10: Upgrade Option Road User Costs for the N1: Proefplaas to Brakfontein (Proefplaas to Lynwood Section, Southbound)
Date Cl 1 C Cl 1 B Cl 1 O Cl 2 Cl 3 Cl 4 Total Cl 1 Cl 2 Cl 3 Cl 4 Cl 1 C Cl 1 B Cl 1 O HV Cl 1 C Cl 1 B Cl 1 O Cl 2 Cl 3 Cl 4
2011 5,647 126 339 91 35 91 6,330 3.4% 0.83 1.51 1.06 3.18 9.45 13.31 24.62 61.3 0.151 0.97 2.75 0.98 0.87 22.15 28.73 22.21 56.77 78.31 141.40
2012 5,751 123 340 93 36 92 6,436 3.4% 0.85 1.53 1.06 3.18 9.45 13.31 24.61 58.0 0.151 1.02 2.91 1.04 0.92 22.56 29.53 22.63 57.55 79.34 143.13
2013 5,856 120 341 96 36 93 6,541 3.4% 0.86 1.55 1.06 3.18 9.45 13.31 24.61 54.6 0.151 1.08 3.09 1.10 0.97 23.00 30.39 23.07 58.36 80.38 144.88
2014 5,960 117 342 98 36 93 6,647 3.4% 0.87 1.56 1.06 3.18 9.45 13.31 24.61 51.3 0.151 1.16 3.29 1.18 1.04 23.47 31.34 23.55 59.19 81.46 146.66
2015 6,064 114 344 100 37 94 6,752 3.4% 0.89 1.58 1.06 3.18 9.45 13.31 24.61 47.9 0.151 1.24 3.52 1.26 1.11 23.98 32.40 24.06 60.06 82.57 148.48
2016 6,104 113 343 100 37 94 6,791 3.4% 0.89 1.59 1.06 3.18 9.45 13.31 24.61 46.8 0.151 1.27 3.60 1.29 1.13 24.16 32.78 24.24 60.36 82.95 149.10
2017 6,145 113 341 100 36 93 6,829 3.4% 0.90 1.59 1.06 3.18 9.44 13.30 24.60 45.7 0.151 1.30 3.69 1.32 1.16 24.34 33.17 24.43 60.66 83.34 149.73
2018 6,186 113 340 99 36 92 6,867 3.3% 0.90 1.60 1.06 3.18 9.44 13.30 24.60 44.6 0.151 1.33 3.78 1.35 1.19 24.53 33.57 24.62 60.98 83.73 150.37
2019 6,226 113 339 99 36 92 6,905 3.3% 0.91 1.60 1.06 3.18 9.44 13.30 24.59 43.5 0.151 1.36 3.87 1.39 1.22 24.72 34.00 24.81 61.29 84.13 151.01
2020 6,267 112 338 98 36 91 6,943 3.2% 0.91 1.61 1.06 3.18 9.44 13.30 24.59 42.4 0.151 1.40 3.97 1.42 1.25 24.92 34.44 25.02 61.61 84.54 151.65
2021 6,463 112 339 97 35 89 7,136 3.1% 0.94 1.64 1.06 3.17 9.43 13.29 24.57 37.9 0.151 1.56 4.44 1.59 1.40 25.90 36.54 26.01 63.22 86.57 154.93
2022 6,660 111 340 96 35 87 7,329 3.0% 0.96 1.67 1.06 3.17 9.43 13.28 24.55 33.5 0.151 1.77 5.04 1.80 1.59 27.04 39.10 27.16 64.97 88.75 158.36
2023 6,856 110 340 95 34 86 7,522 2.9% 0.99 1.70 1.05 3.17 9.42 13.27 24.54 29.0 0.151 2.04 5.82 2.08 1.83 28.42 42.35 28.56 66.95 91.15 162.02
2024 7,053 110 341 94 33 84 7,715 2.7% 1.02 1.72 1.05 3.17 9.41 13.26 24.52 24.5 0.151 2.42 6.89 2.46 2.17 29.95 46.43 30.11 68.59 92.96 164.31
2025 7,249 109 342 93 33 82 7,908 2.6% 1.04 1.72 1.05 3.17 9.41 13.25 24.51 20.0 0.151 2.96 8.43 3.01 2.66 31.94 52.11 32.13 70.35 94.70 166.01
2026 7,477 109 343 92 32 80 8,133 2.5% 1.07 1.72 1.05 3.16 9.40 13.24 24.49 19.5 0.151 3.04 8.64 3.09 2.72 32.20 52.89 32.41 70.56 94.90 166.16
2027 7,704 108 343 91 32 79 8,357 2.4% 1.10 1.72 1.05 3.16 9.40 13.24 24.48 19.0 0.151 3.12 8.87 3.17 2.79 32.48 53.71 32.69 70.79 95.12 166.34
2028 7,932 107 344 90 31 77 8,581 2.3% 1.13 1.72 1.05 3.16 9.39 13.23 24.46 18.5 0.151 3.20 9.11 3.26 2.87 32.78 54.58 32.99 71.04 95.35 166.53
2029 8,159 107 345 89 30 75 8,805 2.2% 1.16 1.72 1.05 3.16 9.39 13.22 24.45 18.0 0.151 3.29 9.36 3.35 2.95 33.10 55.50 33.32 71.30 95.59 166.74
2030 8,386 106 345 88 30 74 9,030 2.1% 1.19 1.72 1.05 3.16 9.38 13.21 24.44 17.5 0.151 3.38 9.62 3.44 3.03 33.43 56.47 33.66 71.58 95.86 166.97
Individual Road User Costs (Rands)% HV V:C fc fr
Modified VOCs (R/km) Ave
Speed
Acc
(R/km)
Cost of Time (R/km)
After upgrades - 50c per km toll
AM Peak Hour Traffic

Economic analysis of the Gauteng Freeway Improvement Scheme 51
7.4 Individual road user costs and benefits
This section reports on the estimated changes in road user costs for individual journeys
for certain selected locations. The reporting in this section is complicated as a result of the
very large numbers of permutations of different road sections, different types of vehicles,
different times of the day or night and the fact that the analysis is done, in this section, for
the next fifteen years. Two reporting methods are used to address this level of detail:
The first is to report changes in road user costs for two journeys. These are the
journey from Pretoria to Isando (effectively OR Tambo International Airport) and
from Isando to Soweto. These journeys have been chosen because they are two
of the potentially longer journeys on the freeway network.
The second is to report all other journeys at a more aggregated level. This
aggregation still conveys the key conclusions without reporting every detail. The
actual detail is however given in Appendix B.
As with the cost benefit analysis it needs to be stressed that the changes in road user
costs are the costs compared to the do-nothing option. Hence if there is, for example, a
finding that road user costs are lower, in other words there is a road user benefit, then
these costs are lower compared to the do nothing option. They might well be higher than
travelling costs of five years ago. The toll tariffs that have been used in the analysis are
presented in Appendix A. These are given in 2010 values. The benefits (or in some cases
increased costs) have taken the toll tariff into account and are also expressed in 2010
terms.
The journeys are divided into three categories. These are for the upgraded network:
without any tolling on the entire network;
on sections of road where a toll tariff would be levied and;
on sections of road which are not tolled within the context where most of the
network is tolled.
The journey was analysed in both directions.
The changes in road user costs are given annually for the six different road user classes
for 2010 to 2015 and then in five-yearly intervals until 2025. The six different road user
classes are:
light vehicle commuters, (called Cl 1 C in the tables)

Economic analysis of the Gauteng Freeway Improvement Scheme 52
light vehicle business travellers, (Cl 1 B)
other light vehicle road users; (Cl 1 O) and
three classes of heavy vehicles (Cl 2; Cl 3, and Cl 4).
Journeys are analysed for five time periods. These are:
weekday morning peak,
weekday afternoon peak,
midday off-peak,
weekday evening and
weekends.
7.4.1 Two Specific Journeys
This section presents the results of the analysis of two specific journeys. These are the
journey from Pretoria to Isando (in close proximity to OR Tambo International Airport) and
from Isando to Soweto. The reason that these two journeys have been selected for
specific presentation is because they are two of the longer journeys that might be
undertaken on the freeway network.
The results in this section are a combination of parts of the road user benefits discussed
in sections 7.4.2.2 to 7.4.2.3 below.
7.4.1.1 Pretoria to Isando (southerly direction)
The costs and benefits accruing to road users on the journey from Pretoria to the OR
Tambo airport via the N1, M3, N12 and R24 are presented in Table 11.
It can be seen from the table that at a 30c equivalent toll rate:
all road users have reduced costs for all years examined at the morning and
afternoon peak hours;
all road users have reduced costs at the midday off peak times and over
weekends;
during the evenings all light vehicle users have increased costs, whereas heavy
vehicles have reduced costs.
As the toll tariff increases so the cost reduction becomes smaller and, in the later years,
becomes an increased cost. For the 40c per km toll this switching occurs in 2025 for
class 1 commuters and other vehicles users during the morning peak traffic. Weekend
Economic analysis of the Gauteng Freeway Improvement Scheme 53
users begin to experience increased costs in the earlier years, but these change to
reduced costs in the later years.
This trend continues and at a 70c toll equivalent light vehicle users have increased costs
from 2020 onwards for the morning peak hour and 2025 for both the afternoon peak hour
and midday off peak traffic. Weekend users experience increased costs from 2011 until
2015. All people travelling in the evening have increased costs at a 40c and above toll
equivalent.
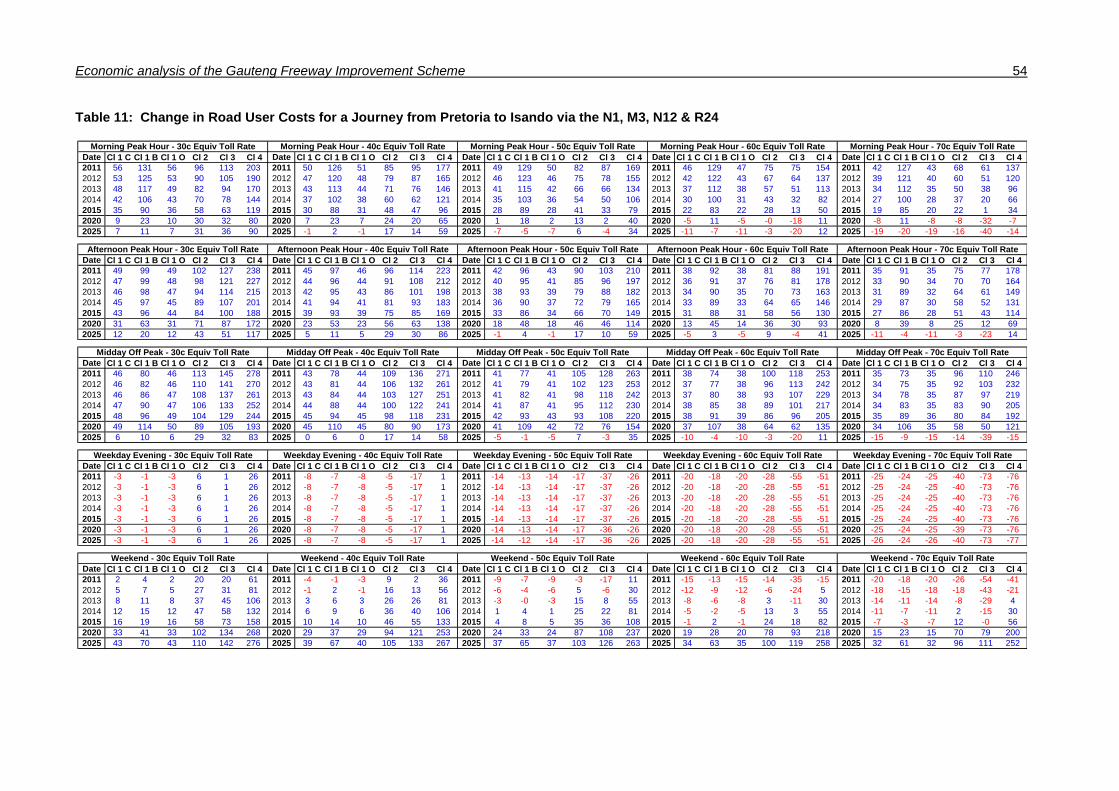
Economic analysis of the Gauteng Freeway Improvement Scheme 54
Table 11: Change in Road User Costs for a Journey from Pretoria to Isando via the N1, M3, N12 & R24
Date Cl 1 C Cl 1 B Cl 1 O Cl 2 Cl 3 Cl 4 Date Cl 1 C Cl 1 B Cl 1 O Cl 2 Cl 3 Cl 4 Date Cl 1 C Cl 1 B Cl 1 O Cl 2 Cl 3 Cl 4 Date Cl 1 C Cl 1 B Cl 1 O Cl 2 Cl 3 Cl 4 Date Cl 1 C Cl 1 B Cl 1 O Cl 2 Cl 3 Cl 4
2011 56 131 56 96 113 203 2011 50 126 51 85 95 177 2011 49 129 50 82 87 169 2011 46 129 47 75 75 154 2011 42 127 43 68 61 137
2012 53 125 53 90 105 190 2012 47 120 48 79 87 165 2012 46 123 46 75 78 155 2012 42 122 43 67 64 137 2012 39 121 40 60 51 120
2013 48 117 49 82 94 170 2013 43 113 44 71 76 146 2013 41 115 42 66 66 134 2013 37 112 38 57 51 113 2013 34 112 35 50 38 96
2014 42 106 43 70 78 144 2014 37 102 38 60 62 121 2014 35 103 36 54 50 106 2014 30 100 31 43 32 82 2014 27 100 28 37 20 66
2015 35 90 36 58 63 119 2015 30 88 31 48 47 96 2015 28 89 28 41 33 79 2015 22 83 22 28 13 50 2015 19 85 20 22 1 34
2020 9 23 10 30 32 80 2020 7 23 7 24 20 65 2020 1 18 2 13 2 40 2020 -5 11 -5 -0 -18 11 2020 -8 11 -8 -8 -32 -7
2025 7 11 7 31 36 90 2025 -1 2 -1 17 14 59 2025 -7 -5 -7 6 -4 34 2025 -11 -7 -11 -3 -20 12 2025 -19 -20 -19 -16 -40 -14
Date Cl 1 C Cl 1 B Cl 1 O Cl 2 Cl 3 Cl 4 Date Cl 1 C Cl 1 B Cl 1 O Cl 2 Cl 3 Cl 4 Date Cl 1 C Cl 1 B Cl 1 O Cl 2 Cl 3 Cl 4 Date Cl 1 C Cl 1 B Cl 1 O Cl 2 Cl 3 Cl 4 Date Cl 1 C Cl 1 B Cl 1 O Cl 2 Cl 3 Cl 4
2011 49 99 49 102 127 238 2011 45 97 46 96 114 223 2011 42 96 43 90 103 210 2011 38 92 38 81 88 191 2011 35 91 35 75 77 178
2012 47 99 48 98 121 227 2012 44 96 44 91 108 212 2012 40 95 41 85 96 197 2012 36 91 37 76 81 178 2012 33 90 34 70 70 164
2013 46 98 47 94 114 215 2013 42 95 43 86 101 198 2013 38 93 39 79 88 182 2013 34 90 35 70 73 163 2013 31 89 32 64 61 149
2014 45 97 45 89 107 201 2014 41 94 41 81 93 183 2014 36 90 37 72 79 165 2014 33 89 33 64 65 146 2014 29 87 30 58 52 131
2015 43 96 44 84 100 188 2015 39 93 39 75 85 169 2015 33 86 34 66 70 149 2015 31 88 31 58 56 130 2015 27 86 28 51 43 114
2020 31 63 31 71 87 172 2020 23 53 23 56 63 138 2020 18 48 18 46 46 114 2020 13 45 14 36 30 93 2020 8 39 8 25 12 69
2025 12 20 12 43 51 117 2025 5 11 5 29 30 86 2025 -1 4 -1 17 10 59 2025 -5 3 -5 9 -4 41 2025 -11 -4 -11 -3 -23 14
Date Cl 1 C Cl 1 B Cl 1 O Cl 2 Cl 3 Cl 4 Date Cl 1 C Cl 1 B Cl 1 O Cl 2 Cl 3 Cl 4 Date Cl 1 C Cl 1 B Cl 1 O Cl 2 Cl 3 Cl 4 Date Cl 1 C Cl 1 B Cl 1 O Cl 2 Cl 3 Cl 4 Date Cl 1 C Cl 1 B Cl 1 O Cl 2 Cl 3 Cl 4
2011 46 80 46 113 145 278 2011 43 78 44 109 136 271 2011 41 77 41 105 128 263 2011 38 74 38 100 118 253 2011 35 73 35 96 110 246
2012 46 82 46 110 141 270 2012 43 81 44 106 132 261 2012 41 79 41 102 123 253 2012 37 77 38 96 113 242 2012 34 75 35 92 103 232
2013 46 86 47 108 137 261 2013 43 84 44 103 127 251 2013 41 82 41 98 118 242 2013 37 80 38 93 107 229 2013 34 78 35 87 97 219
2014 47 90 47 106 133 252 2014 44 88 44 100 122 241 2014 41 87 41 95 112 230 2014 38 85 38 89 101 217 2014 34 83 35 83 90 205
2015 48 96 49 104 129 244 2015 45 94 45 98 118 231 2015 42 93 43 93 108 220 2015 38 91 39 86 96 205 2015 35 89 36 80 84 192
2020 49 114 50 89 105 193 2020 45 110 45 80 90 173 2020 41 109 42 72 76 154 2020 37 107 38 64 62 135 2020 34 106 35 58 50 121
2025 6 10 6 29 32 83 2025 0 6 0 17 14 58 2025 -5 -1 -5 7 -3 35 2025 -10 -4 -10 -3 -20 11 2025 -15 -9 -15 -14 -39 -15
Date Cl 1 C Cl 1 B Cl 1 O Cl 2 Cl 3 Cl 4 Date Cl 1 C Cl 1 B Cl 1 O Cl 2 Cl 3 Cl 4 Date Cl 1 C Cl 1 B Cl 1 O Cl 2 Cl 3 Cl 4 Date Cl 1 C Cl 1 B Cl 1 O Cl 2 Cl 3 Cl 4 Date Cl 1 C Cl 1 B Cl 1 O Cl 2 Cl 3 Cl 4
2011 -3 -1 -3 6 1 26 2011 -8 -7 -8 -5 -17 1 2011 -14 -13 -14 -17 -37 -26 2011 -20 -18 -20 -28 -55 -51 2011 -25 -24 -25 -40 -73 -76
2012 -3 -1 -3 6 1 26 2012 -8 -7 -8 -5 -17 1 2012 -14 -13 -14 -17 -37 -26 2012 -20 -18 -20 -28 -55 -51 2012 -25 -24 -25 -40 -73 -76
2013 -3 -1 -3 6 1 26 2013 -8 -7 -8 -5 -17 1 2013 -14 -13 -14 -17 -37 -26 2013 -20 -18 -20 -28 -55 -51 2013 -25 -24 -25 -40 -73 -76
2014 -3 -1 -3 6 1 26 2014 -8 -7 -8 -5 -17 1 2014 -14 -13 -14 -17 -37 -26 2014 -20 -18 -20 -28 -55 -51 2014 -25 -24 -25 -40 -73 -76
2015 -3 -1 -3 6 1 26 2015 -8 -7 -8 -5 -17 1 2015 -14 -13 -14 -17 -37 -26 2015 -20 -18 -20 -28 -55 -51 2015 -25 -24 -25 -40 -73 -76
2020 -3 -1 -3 6 1 26 2020 -8 -7 -8 -5 -17 1 2020 -14 -13 -14 -17 -36 -26 2020 -20 -18 -20 -28 -55 -51 2020 -25 -24 -25 -39 -73 -76
2025 -3 -1 -3 6 1 26 2025 -8 -7 -8 -5 -17 1 2025 -14 -12 -14 -17 -36 -26 2025 -20 -18 -20 -28 -55 -51 2025 -26 -24 -26 -40 -73 -77
Date Cl 1 C Cl 1 B Cl 1 O Cl 2 Cl 3 Cl 4 Date Cl 1 C Cl 1 B Cl 1 O Cl 2 Cl 3 Cl 4 Date Cl 1 C Cl 1 B Cl 1 O Cl 2 Cl 3 Cl 4 Date Cl 1 C Cl 1 B Cl 1 O Cl 2 Cl 3 Cl 4 Date Cl 1 C Cl 1 B Cl 1 O Cl 2 Cl 3 Cl 4
2011 2 4 2 20 20 61 2011 -4 -1 -3 9 2 36 2011 -9 -7 -9 -3 -17 11 2011 -15 -13 -15 -14 -35 -15 2011 -20 -18 -20 -26 -54 -41
2012 5 7 5 27 31 81 2012 -1 2 -1 16 13 56 2012 -6 -4 -6 5 -6 30 2012 -12 -9 -12 -6 -24 5 2012 -18 -15 -18 -18 -43 -21
2013 8 11 8 37 45 106 2013 3 6 3 26 26 81 2013 -3 -0 -3 15 8 55 2013 -8 -6 -8 3 -11 30 2013 -14 -11 -14 -8 -29 4
2014 12 15 12 47 58 132 2014 6 9 6 36 40 106 2014 1 4 1 25 22 81 2014 -5 -2 -5 13 3 55 2014 -11 -7 -11 2 -15 30
2015 16 19 16 58 73 158 2015 10 14 10 46 55 133 2015 4 8 5 35 36 108 2015 -1 2 -1 24 18 82 2015 -7 -3 -7 12 -0 56
2020 33 41 33 102 134 268 2020 29 37 29 94 121 253 2020 24 33 24 87 108 237 2020 19 28 20 78 93 218 2020 15 23 15 70 79 200
2025 43 70 43 110 142 276 2025 39 67 40 105 133 267 2025 37 65 37 103 126 263 2025 34 63 35 100 119 258 2025 32 61 32 96 111 252
Morning Peak Hour - 40c Equiv Toll Rate
Afternoon Peak Hour - 40c Equiv Toll Rate
Midday Off Peak - 40c Equiv Toll Rate
Weekday Evening - 40c Equiv Toll Rate
Weekend - 40c Equiv Toll Rate
Morning Peak Hour - 30c Equiv Toll Rate
Afternoon Peak Hour - 30c Equiv Toll Rate
Midday Off Peak - 30c Equiv Toll Rate
Weekday Evening - 30c Equiv Toll Rate
Weekend - 30c Equiv Toll Rate
Morning Peak Hour - 60c Equiv Toll Rate
Afternoon Peak Hour - 60c Equiv Toll Rate
Midday Off Peak - 60c Equiv Toll Rate
Weekday Evening - 60c Equiv Toll Rate
Weekend - 60c Equiv Toll Rate
Morning Peak Hour - 50c Equiv Toll Rate
Afternoon Peak Hour - 50c Equiv Toll Rate
Midday Off Peak - 50c Equiv Toll Rate
Weekday Evening - 50c Equiv Toll Rate
Weekend - 50c Equiv Toll Rate
Morning Peak Hour - 70c Equiv Toll Rate
Afternoon Peak Hour - 70c Equiv Toll Rate
Midday Off Peak - 70c Equiv Toll Rate
Weekday Evening - 70c Equiv Toll Rate
Weekend - 70c Equiv Toll Rate

Economic analysis of the Gauteng Freeway Improvement Scheme 55
7.4.1.2 Isando to Soweto (westerly direction)
The costs and benefits accruing to road users on a journey from the OR Tambo Airport to
Soweto (the Diepkloof Interchange) via the R24 and the N12 are presented in Table 12.
It can be seen that, on the whole, all road users experience benefits for all years and all
toll tariffs during the morning and afternoon peak hours and during the midday off peak
time. The exception is in the afternoon peak hour in 2025 when some vehicles have
increased costs at the 60c and 70c toll equivalent.
A different picture emerges for evening and weekends travel, when most users have
higher costs. For a 40c and above toll equivalent all users experience increased costs at
all times, while at a toll equivalent tariff of 30c class 2 and class 4 heavy vehicles have
lower costs. Light vehicles and class 2 heavy vehicles experience have increased costs
at the 30 toll equivalent.

Economic analysis of the Gauteng Freeway Improvement Scheme 56
Table 12: Road user benefits from OR Tambo Airport to the Diepkloof I/C
Date Cl 1 C Cl 1 B Cl 1 O Cl 2 Cl 3 Cl 4 Date Cl 1 C Cl 1 B Cl 1 O Cl 2 Cl 3 Cl 4 Date Cl 1 C Cl 1 B Cl 1 O Cl 2 Cl 3 Cl 4 Date Cl 1 C Cl 1 B Cl 1 O Cl 2 Cl 3 Cl 4 Date Cl 1 C Cl 1 B Cl 1 O Cl 2 Cl 3 Cl 4
2011 23 30 23 68 90 179 2011 21 28 21 65 83 171 2011 18 25 18 59 74 160 2011 15 22 15 54 64 148 2011 13 22 13 52 60 144
2012 23 30 23 68 89 178 2012 21 30 21 66 84 174 2012 18 27 18 60 75 162 2012 15 24 16 55 66 151 2012 14 24 14 53 61 146
2013 23 31 23 68 89 176 2013 22 31 22 66 85 175 2013 19 28 19 61 76 163 2013 16 26 16 57 68 155 2013 15 25 15 54 62 148
2014 23 32 23 67 88 174 2014 22 32 22 67 86 175 2014 19 29 19 61 76 162 2014 17 28 17 58 70 157 2014 15 27 15 55 64 150
2015 23 33 23 67 87 172 2015 23 34 23 67 86 176 2015 19 30 19 61 75 162 2015 18 29 18 59 71 158 2015 16 28 16 56 64 152
2020 21 31 21 59 76 152 2020 19 30 19 57 71 148 2020 15 25 15 48 57 127 2020 14 26 14 48 56 130 2020 11 22 11 42 46 118
2025 17 28 17 48 61 124 2025 14 25 14 43 51 112 2025 11 23 11 37 42 100 2025 9 21 9 34 36 93 2025 8 21 8 33 32 92
Date Cl 1 C Cl 1 B Cl 1 O Cl 2 Cl 3 Cl 4 Date Cl 1 C Cl 1 B Cl 1 O Cl 2 Cl 3 Cl 4 Date Cl 1 C Cl 1 B Cl 1 O Cl 2 Cl 3 Cl 4 Date Cl 1 C Cl 1 B Cl 1 O Cl 2 Cl 3 Cl 4 Date Cl 1 C Cl 1 B Cl 1 O Cl 2 Cl 3 Cl 4
2011 28 50 28 66 84 163 2011 26 48 26 63 77 154 2011 23 47 24 59 70 146 2011 22 48 22 56 65 141 2011 20 47 20 52 57 133
2012 28 53 29 67 84 161 2012 26 51 26 62 76 152 2012 24 50 24 58 69 143 2012 22 50 23 55 62 136 2012 21 50 21 51 55 128
2013 29 56 30 67 84 160 2013 27 55 27 62 76 150 2013 25 54 25 58 68 140 2013 23 53 23 54 60 130 2013 21 54 22 51 53 123
2014 31 61 31 67 83 158 2014 28 59 29 62 75 147 2014 26 58 26 58 67 137 2014 24 57 24 52 57 124 2014 22 58 23 50 51 118
2015 32 66 33 67 83 156 2015 30 64 30 62 74 144 2015 27 64 28 57 65 133 2015 24 61 25 51 54 117 2015 24 64 24 49 49 112
2020 38 92 39 63 72 128 2020 41 105 42 64 71 127 2020 40 106 40 60 63 117 2020 34 96 34 50 48 96 2020 29 91 29 39 32 71
2025 6 16 7 19 21 51 2025 4 15 5 15 13 43 2025 4 19 4 11 5 30 2025 0 16 0 3 -9 10 2025 -7 2 -7 -8 -25 -11
Date Cl 1 C Cl 1 B Cl 1 O Cl 2 Cl 3 Cl 4 Date Cl 1 C Cl 1 B Cl 1 O Cl 2 Cl 3 Cl 4 Date Cl 1 C Cl 1 B Cl 1 O Cl 2 Cl 3 Cl 4 Date Cl 1 C Cl 1 B Cl 1 O Cl 2 Cl 3 Cl 4 Date Cl 1 C Cl 1 B Cl 1 O Cl 2 Cl 3 Cl 4
2011 16 20 16 52 68 139 2011 13 18 13 47 59 129 2011 11 16 11 42 50 117 2011 8 13 8 37 41 105 2011 5 11 5 31 31 93
2012 18 23 18 58 76 154 2012 16 22 16 54 68 144 2012 13 19 13 49 59 134 2012 11 17 11 44 51 123 2012 8 15 8 39 42 112
2013 20 26 20 63 82 165 2013 18 25 18 59 75 157 2013 16 23 16 54 67 147 2013 13 21 13 49 58 137 2013 10 18 10 45 50 126
2014 22 29 22 67 88 175 2014 20 28 20 64 82 170 2014 18 26 18 59 74 160 2014 15 24 15 55 66 150 2014 13 22 13 50 57 139
2015 24 32 24 70 92 183 2015 22 31 22 68 87 179 2015 20 30 20 65 81 173 2015 18 28 18 60 73 163 2015 15 26 15 56 65 153
2020 29 50 30 73 94 182 2020 27 48 28 70 88 176 2020 25 44 25 67 82 170 2020 24 46 24 66 79 168 2020 22 45 23 64 74 165
2025 36 73 36 74 91 170 2025 33 71 34 69 83 160 2025 30 69 31 63 73 146 2025 22 55 22 47 49 110 2025 24 62 24 51 52 119
Date Cl 1 C Cl 1 B Cl 1 O Cl 2 Cl 3 Cl 4 Date Cl 1 C Cl 1 B Cl 1 O Cl 2 Cl 3 Cl 4 Date Cl 1 C Cl 1 B Cl 1 O Cl 2 Cl 3 Cl 4 Date Cl 1 C Cl 1 B Cl 1 O Cl 2 Cl 3 Cl 4 Date Cl 1 C Cl 1 B Cl 1 O Cl 2 Cl 3 Cl 4
2011 -4 -4 -4 0 -4 8 2011 -7 -8 -7 -7 -16 -7 2011 -11 -12 -11 -15 -29 -26 2011 -15 -15 -15 -23 -42 -44 2011 -19 -19 -19 -30 -53 -59
2012 -4 -4 -4 0 -4 8 2012 -7 -8 -7 -7 -16 -7 2012 -11 -12 -11 -15 -29 -26 2012 -15 -15 -15 -23 -42 -44 2012 -19 -19 -19 -30 -53 -60
2013 -4 -4 -4 0 -4 8 2013 -7 -8 -7 -7 -16 -7 2013 -11 -12 -11 -15 -29 -26 2013 -15 -15 -15 -23 -42 -44 2013 -19 -19 -19 -30 -53 -60
2014 -4 -4 -4 0 -4 9 2014 -7 -8 -7 -7 -16 -7 2014 -11 -12 -11 -15 -29 -26 2014 -15 -15 -15 -23 -42 -44 2014 -19 -19 -19 -30 -53 -60
2015 -4 -4 -4 0 -4 9 2015 -7 -8 -7 -7 -16 -7 2015 -11 -12 -11 -15 -29 -26 2015 -15 -15 -15 -23 -42 -44 2015 -19 -19 -19 -30 -53 -60
2020 -4 -4 -4 0 -4 8 2020 -7 -8 -7 -7 -16 -7 2020 -11 -12 -11 -15 -29 -26 2020 -15 -15 -15 -23 -42 -44 2020 -19 -19 -19 -30 -53 -60
2025 -4 -4 -4 0 -4 8 2025 -7 -8 -7 -7 -16 -8 2025 -11 -12 -11 -15 -29 -27 2025 -15 -16 -15 -23 -42 -45 2025 -19 -19 -19 -30 -54 -61
Date Cl 1 C Cl 1 B Cl 1 O Cl 2 Cl 3 Cl 4 Date Cl 1 C Cl 1 B Cl 1 O Cl 2 Cl 3 Cl 4 Date Cl 1 C Cl 1 B Cl 1 O Cl 2 Cl 3 Cl 4 Date Cl 1 C Cl 1 B Cl 1 O Cl 2 Cl 3 Cl 4 Date Cl 1 C Cl 1 B Cl 1 O Cl 2 Cl 3 Cl 4
2011 -4 -4 -4 0 -5 8 2011 -7 -8 -7 -7 -17 -9 2011 -11 -11 -11 -15 -28 -25 2011 -15 -15 -15 -22 -41 -42 2011 -18 -19 -18 -30 -53 -59
2012 -4 -4 -4 0 -4 9 2012 -7 -8 -7 -7 -16 -8 2012 -11 -11 -11 -14 -28 -24 2012 -15 -15 -15 -22 -40 -41 2012 -18 -19 -18 -29 -52 -58
2013 -3 -4 -3 1 -3 11 2013 -7 -7 -7 -6 -15 -6 2013 -11 -11 -11 -14 -27 -22 2013 -14 -15 -14 -21 -39 -39 2013 -18 -18 -18 -29 -52 -57
2014 -3 -3 -3 2 -2 12 2014 -7 -7 -7 -6 -14 -4 2014 -10 -11 -10 -13 -26 -20 2014 -14 -14 -14 -20 -38 -37 2014 -18 -18 -18 -28 -51 -55
2015 -3 -3 -3 2 -1 14 2015 -7 -7 -7 -5 -13 -2 2015 -10 -10 -10 -12 -25 -19 2015 -14 -14 -14 -20 -37 -35 2015 -18 -18 -18 -27 -50 -53
2020 -2 -2 -2 5 2 20 2020 -5 -6 -5 -2 -9 6 2020 -9 -9 -9 -9 -20 -10 2020 -13 -13 -13 -16 -32 -27 2020 -16 -17 -16 -24 -45 -45
2025 -2 -2 -2 5 3 22 2025 -5 -5 -5 -0 -7 9 2025 -8 -8 -8 -6 -16 -3 2025 -11 -11 -11 -12 -26 -15 2025 -14 -14 -14 -19 -37 -30
Morning Peak Hour - 30c Equiv Toll Rate Morning Peak Hour - 40c Equiv Toll Rate Morning Peak Hour - 50c Equiv Toll Rate Morning Peak Hour - 60c Equiv Toll Rate Morning Peak Hour - 70c Equiv Toll Rate
Afternoon Peak Hour - 30c Equiv Toll Rate Afternoon Peak Hour - 40c Equiv Toll Rate Afternoon Peak Hour - 50c Equiv Toll Rate Afternoon Peak Hour - 60c Equiv Toll Rate Afternoon Peak Hour - 70c Equiv Toll Rate
Midday Off Peak - 30c Equiv Toll Rate Midday Off Peak - 40c Equiv Toll Rate Midday Off Peak - 50c Equiv Toll Rate Midday Off Peak - 60c Equiv Toll Rate Midday Off Peak - 70c Equiv Toll Rate
Weekday Evening - 30c Equiv Toll Rate Weekday Evening - 40c Equiv Toll Rate Weekday Evening - 50c Equiv Toll Rate Weekday Evening - 60c Equiv Toll Rate Weekday Evening - 70c Equiv Toll Rate
Weekend - 30c Equiv Toll Rate Weekend - 40c Equiv Toll Rate Weekend - 50c Equiv Toll Rate Weekend - 60c Equiv Toll Rate Weekend - 70c Equiv Toll Rate

Economic Analysis of the Gauteng Freeway Improvement Scheme 57
7.4.2 Summarised reporting on other journeys
As can be seen from the preceding section there is an extraordinary level of detail
required in the reporting. This was judged to be an unnecessary amount of detail and,
apart from the two journeys reported in detail above, a more summarised reporting is
given below. However, as mentioned, all the relevant detail can be found in Appendix B.
A summary table has been developed to reduce the amount of detail. The summary table
is colour coded. If a particular journey is coloured dark green this means that road users
have reduced costs for all years. A light green colour means that there are some cases
where costs increase but most of the time costs are lower. Pink means that there are
more cases of increased costs then decreased costs. Red means increased costs for all
years to 2025. All light vehicles have been aggregated and all heavy vehicles have been
aggregated.
7.4.2.1 Upgraded Network with No Tolling
This section deals with the journeys on the upgraded roads for the case where the roads
are not tolled. For the majority of journeys and road users there are only benefits
although there are some exceptions. These exceptions are:
On the M3, Buccleuch to the M2 Geldenhuys Interchange
o PM peak hour in the southerly direction, for all light vehicles from 2014 to
2020;
o Midday off-peak in the southerly direction, for all vehicles in 2025;
o AM peak hour in the northerly direction, for all light vehicles from 2020
onwards;
o PM peak hour in the northerly direction, for all light vehicles from 2020
onwards;
o Midday off-peak in the northerly direction, for light vehicle business
travellers in 2025.
On the R24, from OR Tambo International Airport to the N12:
o AM peak traffic in the westerly direction, for all light vehicles from 2020
onwards and for heavy vehicles in 2025;
o PM peak traffic in the westerly direction, for all light vehicles from 2020
onwards;
o Midday off-peak traffic in the westerly direction, for all light vehicles and
class 2 heavy vehicles in 2025.

Economic Analysis of the Gauteng Freeway Improvement Scheme 58
On the N1, from 14th Avenue to Grasmere:
o PM peak traffic in the southerly direction, for light vehicle business
travellers in 2025;
o AM peak traffic in the northerly direction, for all light vehicles in 2025.
On the N1, from Brakfontein to Buccleuch:
o PM peak traffic in the northerly direction, for light vehicle business
travellers in 2020 to 2025;
o Midday off-peak traffic in the northerly direction, for light vehicle business
travellers in 2025.
On the R80 from Suiderberg to DF Malan:
o PM peak hour traffic in a northerly / westerly direction, all light vehicles in
2025.
Table 13: Increased costs and benefits on upgraded freeways for no toll
The sections of road on which road users would experience increased costs are shown in
Table 13. The increased costs are caused by additional traffic that is attracted onto the
freeway network because of the road upgrades. The increased capacity of the freeway
network on these specific sections is not enough, when compared to the do minimum
case, to cater for the increased traffic in the later years.
Road Section Road User AM Peak PM Peak Off Peak Nights Weekend AM Peak PM Peak Off Peak Nights Weekend
Light Vehicles
Heavy Vehicles
Light Vehicles
Heavy Vehicles
Light Vehicles
Heavy Vehicles
Light Vehicles
Heavy Vehicles
Light Vehicles
Heavy Vehicles
Light Vehicles
Heavy Vehicles
Light Vehicles
Heavy Vehicles
Light Vehicles
Heavy Vehicles
Light Vehicles
Heavy Vehicles
Light Vehicles
Heavy Vehicles
Light Vehicles
Heavy Vehicles
Light Vehicles
Heavy Vehicles
Light Vehicles
Heavy Vehicles
Light Vehicles
Heavy Vehicles
Light Vehicles
Heavy Vehicles
Light Vehicles
Heavy Vehicles
Light Vehicles
Heavy Vehicles
R80: Suiderberg to
DF Malan
N3: Geldenhuys
I/C to Barry Marais
N12: N1 Diepkloof
to N3 Elands I/C
N4: Proefplaas to
Donkerhoek
N14: Jan Smuts to
Brakfontein
N14: Brakfontein to
Hendrick Potgieter
N12: N3 Gillooly's
to Kingsway
N12: N1 Misgund
to Old Potch Rd
R59: Reading to
Henley Rd
R80: Soshanguve
to Suiderberg
Southbound / Eastbound Northbound / Westbound
N1: Proefplaas to
Brakfontein
N1: Brakfontein to
Buccleuch
N1: Buccleuch to
14th Avenue
N1: 14th Avenue to
Grasmere
R21: Flying Saucer
to N12
R24: ORT IA to
N12
N3: Buccleuch to
M2 Geldenhuys I/C

Economic Analysis of the Gauteng Freeway Improvement Scheme 59
In the table the dark green cells show those sections of road, at different times of the
week, where all traffic streams only experience reduced costs. The light green cells
indicate those sections of road that mostly experience reduced costs, but in certain
instances there are increased costs (as described above). However, the number of
instances where the traffic stream experiences reduced costs still outweighs those
instances where they experience increased costs.
7.4.2.2 With Tolling Case: Tolled Road Sections
This section reports, in summary form, on the increased or decreased costs to road users
on those sections of road where a toll is levied.
Morning Peak Journeys
Details of the morning peak hour journeys are contained in Table 14. It can be seen that
for the majority of road sections the road users will either experience reduced costs for all
years or for most years, as illustrated by the dark green and light green shading
respectively. This is true for all toll tariffs.
Table 14: Morning Peak Journeys on Roads with Tolls
Some road sections only experience reduced costs for all years for all toll tariffs and for
both light and heavy vehicles. These are the ones illustrated by the dark green shading
and are:
N1: Proefplaas to Brakfontein, in the northerly direction;
Road Section Road User 30c 40c 50c 60c 70c 30c 40c 50c 60c 70c
Light Vehicles
Heavy Vehicles
Light Vehicles
Heavy Vehicles
Light Vehicles
Heavy Vehicles
Light Vehicles
Heavy Vehicles
Light Vehicles
Heavy Vehicles
Light Vehicles
Heavy Vehicles
Light Vehicles
Heavy Vehicles
Light Vehicles
Heavy Vehicles
Light Vehicles
Heavy Vehicles
Southbound / Eastbound Northbound / Westbound
N3: Buccleuch to
M2 Geldenhuys I/C
N3: Geldenhuys
I/C to Barry Marais
N12: N1 Diepkloof
to N3 Elands I/C
N12: N3 Gillooly's
to Kingsway
N1: Proefplaas to
Brakfontein
N1: Brakfontein to
Buccleuch
N1: Buccleuch to
14th Avenue
N1: 14th Avenue to
Grasmere
R21: Flying Saucer
to N12

Economic Analysis of the Gauteng Freeway Improvement Scheme 60
N1: Brakfontein to Buccleuch, in the northerly direction;
N1: Buccleuch to 14th Avenue, in the southerly direction;
N1: 14th Avenue to Grasmere, in the southerly direction and for heavy vehicles in
the northerly direction;
N3: Geldenhuys interchange to Barry Marais, in the northerly directions;
N12: N1 Diepkloof to N3 Elands interchange, both directions;
N12: N3 Gillooly‟s to Kingsway, both directions.
Road users on the N3: Buccleuch interchange to the M2 Geldenhuys interchange have
mostly reduced costs in both directions at an equivalent toll rate of 30c per km but this
changes to mostly experiencing increased costs as soon as the equivalent toll rate
increases to 40c per km and above. Heavy vehicles on this section of road only have
increased costs at a heavy vehicle equivalent toll rate of 50c per km and above.
Lastly, light vehicle users on the N3: Geldenhuys interchange to Barry Marais have
reduced costs at 30c, 40c and 50c toll rates per km. Some but not all have lower costs at
a 60c per km toll but all have higher costs at a toll rate of 70c per km.
Afternoon Peak Journeys
Details of the afternoon peak hour journeys are shown in Table 15. As with the morning
peak hour journeys there are some road sections where users have lower costs for all
years and for all toll tariffs. These road sections, as indicated by the dark green blocks,
are:
N1: Buccleuch to 14th Avenue, in a northerly direction;
N1: 14th Avenue to Grasmere, in a northerly direction;
N3: Geldenhuys interchange to Barry Marais, in both directions;
N12: N1 Diepkloof to N3 Elands interchange, in an easterly direction;
N12: N3 Gillooly‟s to Kingsway in both directions.

Economic Analysis of the Gauteng Freeway Improvement Scheme 61
Table 15: Afternoon Peak Journeys on Roads with Tolls
Most of the users on the other roads have lower costs. There are, however, two
exceptions. These are:
The N1: Brakfontein to Buccleuch in a northerly direction. At toll rate or equivalent
of 30c per km both light and heavy vehicle users have lower costs. However, from
40c onwards light vehicle users experience mainly higher costs. Heavy vehicles
experience mainly increased costs at an equivalent toll tariff of 50c per km
although there are some with lower costs. However from 60c per km and above
there are only increased costs.
The N3: Buccleuch to M2 Geldenhuys interchange in both directions. Light
vehicles have mostly increased costs for all toll tariffs, except for the 30c per km
toll rate in the southerly direction where, on the whole there are lower costs.
Heavy vehicles have mostly lower costs in the southerly direction at an equivalent
toll rate of 30c per km, then mainly increased costs at the 40c, 50c and 60c
equivalent toll rates and then only increased costs at the 70c equivalent toll rate.
Heavy vehicles travelling in the opposite direction have higher costs for all toll
tariffs.
Midday Off Peak Journeys
Details of the midday off peak journeys are shown in Table 16. The dark green cells in
the table indicate that on most road sections road users have lower costs, even after
paying a toll. The light green cells indicate those road sections where there are mainly
Road Section Road User 30c 40c 50c 60c 70c 30c 40c 50c 60c 70c
Light Vehicles
Heavy Vehicles
Light Vehicles
Heavy Vehicles
Light Vehicles
Heavy Vehicles
Light Vehicles
Heavy Vehicles
Light Vehicles
Heavy Vehicles
Light Vehicles
Heavy Vehicles
Light Vehicles
Heavy Vehicles
Light Vehicles
Heavy Vehicles
Light Vehicles
Heavy Vehicles
N1: Buccleuch to
14th Avenue
N1: 14th Avenue to
Grasmere
R21: Flying Saucer
to N12
N3: Buccleuch to
M2 Geldenhuys I/C
N3: Geldenhuys
I/C to Barry Marais
N12: N1 Diepkloof
to N3 Elands I/C
N12: N3 Gillooly's
to Kingsway
Southbound / Eastbound Northbound / Westbound
N1: Proefplaas to
Brakfontein
N1: Brakfontein to
Buccleuch
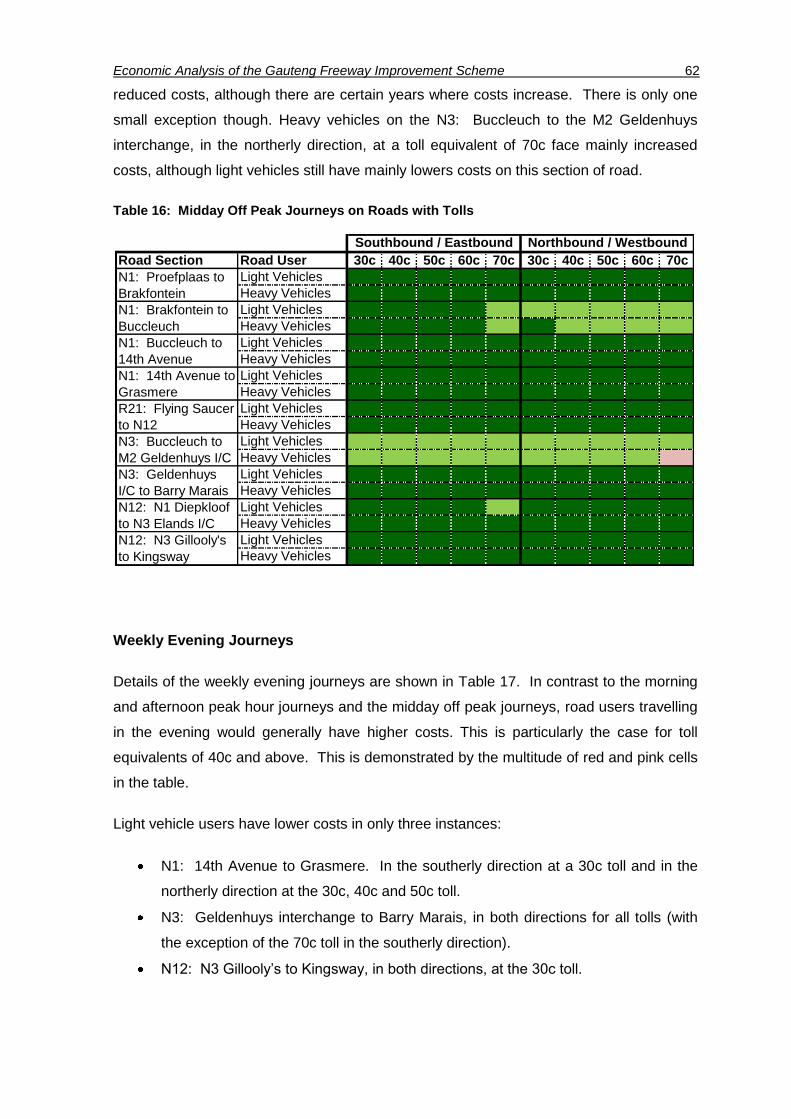
Economic Analysis of the Gauteng Freeway Improvement Scheme 62
reduced costs, although there are certain years where costs increase. There is only one
small exception though. Heavy vehicles on the N3: Buccleuch to the M2 Geldenhuys
interchange, in the northerly direction, at a toll equivalent of 70c face mainly increased
costs, although light vehicles still have mainly lowers costs on this section of road.
Table 16: Midday Off Peak Journeys on Roads with Tolls
Weekly Evening Journeys
Details of the weekly evening journeys are shown in Table 17. In contrast to the morning
and afternoon peak hour journeys and the midday off peak journeys, road users travelling
in the evening would generally have higher costs. This is particularly the case for toll
equivalents of 40c and above. This is demonstrated by the multitude of red and pink cells
in the table.
Light vehicle users have lower costs in only three instances:
N1: 14th Avenue to Grasmere. In the southerly direction at a 30c toll and in the
northerly direction at the 30c, 40c and 50c toll.
N3: Geldenhuys interchange to Barry Marais, in both directions for all tolls (with
the exception of the 70c toll in the southerly direction).
N12: N3 Gillooly‟s to Kingsway, in both directions, at the 30c toll.
Road Section Road User 30c 40c 50c 60c 70c 30c 40c 50c 60c 70c
Light Vehicles
Heavy Vehicles
Light Vehicles
Heavy Vehicles
Light Vehicles
Heavy Vehicles
Light Vehicles
Heavy Vehicles
Light Vehicles
Heavy Vehicles
Light Vehicles
Heavy Vehicles
Light Vehicles
Heavy Vehicles
Light Vehicles
Heavy Vehicles
Light Vehicles
Heavy Vehicles
Northbound / Westbound
N1: Proefplaas to
Brakfontein
N1: Brakfontein to
Buccleuch
N1: Buccleuch to
14th Avenue
N3: Buccleuch to
M2 Geldenhuys I/C
N3: Geldenhuys
I/C to Barry Marais
N12: N1 Diepkloof
to N3 Elands I/C
N12: N3 Gillooly's
to Kingsway
N1: 14th Avenue to
Grasmere
R21: Flying Saucer
to N12
Southbound / Eastbound

Economic Analysis of the Gauteng Freeway Improvement Scheme 63
Table 17: Evening Journeys on Roads with Tolls
Heavy vehicles mostly have increased costs but not in as many instances as for light
vehicles. Heavy vehicles have mostly lower costs at the 30c toll equivalent except for:
N1: Proefplaas to Brakfontein, in the northerly direction;
N1: Buccleuch to 14th Avenue, in the northerly direction;
N3: Buccleuch to the M2 Geldenhuys interchange, in a northerly direction;
N12: N1 Diepkloof to N3 Elands interchange, in the westerly direction.
For heavy vehicles these cost reductions begin to taper off at the toll equivalent of 40c
and above. It is only really on the N1: 14th Avenue to Grasmere (both directions), the N3:
Geldenhuys interchange to Barry Marais (both directions) and to a lesser extent the N3
Gillooly‟s to Kingsway (both directions) that heavy vehicles have lowers costs at a toll
equivalent of 40c and above.
Weekend Journeys
Details for weekend journeys are shown in Table 18. It is apparent from the table that
people using the roads on weekends have higher costs than for weekday journeys but
less so than for journeys in the evening.
At a toll equivalent of 30c most road users have either mainly reduced costs or totally
reduced costs. There are three exceptions:
Road Section Road User 30c 40c 50c 60c 70c 30c 40c 50c 60c 70c
Light Vehicles
Heavy Vehicles
Light Vehicles
Heavy Vehicles
Light Vehicles
Heavy Vehicles
Light Vehicles
Heavy Vehicles
Light Vehicles
Heavy Vehicles
Light Vehicles
Heavy Vehicles
Light Vehicles
Heavy Vehicles
Light Vehicles
Heavy Vehicles
Light Vehicles
Heavy Vehicles
Southbound / Eastbound Northbound / Westbound
N1: Proefplaas to
Brakfontein
N1: Brakfontein to
Buccleuch
N1: Buccleuch to
14th Avenue
N1: 14th Avenue to
Grasmere
R21: Flying Saucer
to N12
N3: Buccleuch to
M2 Geldenhuys I/C
N3: Geldenhuys
I/C to Barry Marais
N12: N1 Diepkloof
to N3 Elands I/C
N12: N3 Gillooly's
to Kingsway
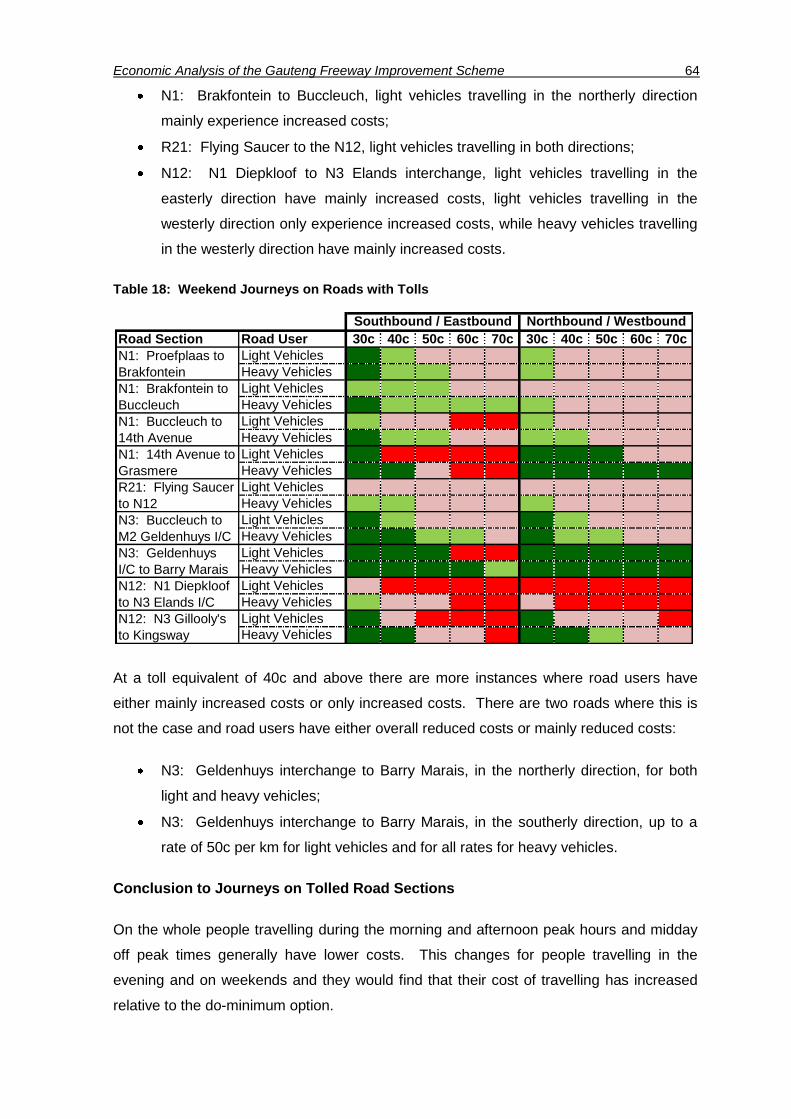
Economic Analysis of the Gauteng Freeway Improvement Scheme 64
N1: Brakfontein to Buccleuch, light vehicles travelling in the northerly direction
mainly experience increased costs;
R21: Flying Saucer to the N12, light vehicles travelling in both directions;
N12: N1 Diepkloof to N3 Elands interchange, light vehicles travelling in the
easterly direction have mainly increased costs, light vehicles travelling in the
westerly direction only experience increased costs, while heavy vehicles travelling
in the westerly direction have mainly increased costs.
Table 18: Weekend Journeys on Roads with Tolls
At a toll equivalent of 40c and above there are more instances where road users have
either mainly increased costs or only increased costs. There are two roads where this is
not the case and road users have either overall reduced costs or mainly reduced costs:
N3: Geldenhuys interchange to Barry Marais, in the northerly direction, for both
light and heavy vehicles;
N3: Geldenhuys interchange to Barry Marais, in the southerly direction, up to a
rate of 50c per km for light vehicles and for all rates for heavy vehicles.
Conclusion to Journeys on Tolled Road Sections
On the whole people travelling during the morning and afternoon peak hours and midday
off peak times generally have lower costs. This changes for people travelling in the
evening and on weekends and they would find that their cost of travelling has increased
relative to the do-minimum option.
Road Section Road User 30c 40c 50c 60c 70c 30c 40c 50c 60c 70c
Light Vehicles
Heavy Vehicles
Light Vehicles
Heavy Vehicles
Light Vehicles
Heavy Vehicles
Light Vehicles
Heavy Vehicles
Light Vehicles
Heavy Vehicles
Light Vehicles
Heavy Vehicles
Light Vehicles
Heavy Vehicles
Light Vehicles
Heavy Vehicles
Light Vehicles
Heavy Vehicles
N1: Buccleuch to
14th Avenue
Southbound / Eastbound Northbound / Westbound
N1: Proefplaas to
Brakfontein
N1: Brakfontein to
Buccleuch
N1: 14th Avenue to
Grasmere
R21: Flying Saucer
to N12
N3: Buccleuch to
M2 Geldenhuys I/C
N3: Geldenhuys
I/C to Barry Marais
N12: N1 Diepkloof
to N3 Elands I/C
N12: N3 Gillooly's
to Kingsway

Economic Analysis of the Gauteng Freeway Improvement Scheme 65
During the morning and afternoon peak hours there are two roads where road users
would generally have higher costs. These are on the N3 travelling between Buccleuch
and the M2 Geldenhuys interchange in both directions and on the N1 when travelling
between Brakfontein to Buccleuch in the northerly direction during the afternoon peak. An
analysis of N3: Buccleuch to M2 Geldenhuys interchange indicates increased traffic (an
hence lower travelling speeds) on the Buccleuch – Marlboro link, Marlboro - London Rd
link and the Linksfield – Gillooly‟s link. A similar analysis of the N1: Buccleuch to
Brakfontein road section indicates higher traffic volumes (and hence lower speeds) on the
Buccleuch – Woodmead and Samrand – Olifantsfontein links (in the northern direction).
For people travelling during the weekday off peak period most road users would face
reduced costs, except for the isolated case of heavy vehicles on the N3: Buccleuch to M2
Geldenhuys interchange at an equivalent toll tariff of 70c per km.
Most of the people travelling during the evening or on weekends would have higher costs
at the toll equivalent of 40c and above. At a toll equivalent of 30c per km there are more
road users with lower costs than higher costs at these times.
7.4.2.3 With Tolling Case: Untolled Road Sections
This section of the report analysed journeys on road sections that are part of the freeway
upgrade but that will not currently be tolled. These include the following road sections:
R24: OR Tambo International Airport to the N12
N14: Jan Smuts to Brakfontein
N14: Brakfontein to Hendrik Potgieter
N12: N1 Misgund to Old Potch Road
N4: Proefplaas to Donkerhoek
R59: Reading to Henley Road
R80 (PWV9): Soshanguve to Suiderberg
R80: Suiderberg to D.F. Malan
Most of the journeys for all road users experience reduced costs only. There are some
exceptions where road users do experience increased costs for some years:
R24: OR Tambo International Airport to the N12:
o Light and heavy vehicles travelling in the easterly direction during the
morning peak and midday off-peak, at all toll rates;
Economic Analysis of the Gauteng Freeway Improvement Scheme 66
o Light vehicles travelling in the easterly direction during the afternoon peak
at all toll rates, and light vehicles travelling in the westerly direction during
the afternoon peak at the 40c and 50c toll rates.
N4: Proefplaas to Donkerhoek:
o In the westerly direction for the AM peak hour traffic, business commuters
experience increased costs for the following instances:
40c toll rate, 2011 to 2015;
50c toll rate, 2011 & 2012;
60c toll rate, 2011 & 2012;
70c toll rate, 2011 to 2015.
o In the easterly direction for the PM peak hour traffic, business commuters
experience increased costs for the 60c per km toll rate in 2020;
The R80 (PWV9): Soshanguve to Suiderberg:
o In the southbound direction, during off-peak midday traffic business
travellers at the toll equivalent of 60c and above in 2025;
o In the northbound direction, during off-peak midday traffic business
travellers at the 60c toll in 2025;
The R80: Suiderberg to D.F. Malan in the westerly direction for PM peak hour
traffic, all light vehicles and class 2 heavy vehicles in 2025.
In most cases the increased costs are less than R1.00. It is only on the R24: OR Tambo
International Airport to N12 in the westerly direction and the PM peak hour traffic in 2025
on the R80 between Suiderberg and D.F. Malan that the increased costs exceed R1.00.
These are both one of the few instances where there were increased costs on sections of
the freeway that are upgraded but not tolled. The cause of this is that the upgrades attract
more traffic to those sections of the freeway and there are no tolls to cause traffic to divert
off those sections of the freeway.
To conclude, it is only in certain isolated instances in morning and afternoon peak hour
and midday off peak that people have increased costs. These costs are confined mainly
to light vehicles and to the R24: OR Tambo International Airport to the N12, the R80
between Soshanguve and Suiderberg, and between Suiderberg and DF Malan roads.
There are also some isolated incidents of increased costs for light vehicle users travelling
in an easterly direction on the N4 between Proefplaas and Donkerhoek road. There are
reduced costs for all road users travelling during the evening and over weekends.
Economic Analysis of the Gauteng Freeway Improvement Scheme 67
8 Microeconomic impacts
The previous section has demonstrated that in many cases there are more benefits to
road users than there are costs in the project. Hence the general conclusion that can be
drawn is that proposed tolling is good for private motorists, business vehicles and public
transport. However, there are a number of potential microeconomic impacts that should
be explored. These include impacts on individual drivers and their capacity to pay; impact
on jobs and wages; impacts on the cost of consumer goods; impacts on business
generally and impacts on specific business.
8.1 Overall Affordability
There is always some concern about the ability of society to carry the cost of major
infrastructural projects like the Gauteng freeway upgrade. The purpose of this section is to
determine the relative size of the freeway upgrade to the Gauteng economy as a whole
and relative size of tolling to people‟s disposable income. Table 19 has been constructed
for the purposes of this assessment.
Two estimates are made in the table. The first is the share of total toll revenue to that of
the Gauteng economy. The second is the share of tolling relative to people‟s disposable
income. In 2011, the first year of proposed tolling, toll revenues from all vehicles is
expected to total R3.3bn. Gauteng has an estimated share of 41.6% of South African
GDP. This means that in 2011 the Gauteng share of South African GDP is expected to be
R978.8bn. Total toll revenue is therefore 0.34% of projected Gauteng GDP in 2011. In
other words the toll burden from the freeway upgrade is the equivalent of 34c for each
R100 of GDP.
It will further be recognised that the calculation made above does not take into account
any of the economic benefits that have been realised by the construction industry in
undertaking the initial construction works. It also does not take into account any of the
road user benefits, including improved business productivity, resulting from reduced
congestion, reduced accidents and quicker travelling times.
The second estimate relates directly to how much money individual people have for the
purpose of spending and how much of this could, potentially, be absorbed by tolling. To
this end household disposable income has been used as a proxy for how much money
people have available for spending. Total expected toll revenues from light vehicles have
been used as the toll burden although it does include business travellers, most of whom
would not pay tolls in their personal capacity. In 2011, the first year of proposed tolling, toll

Economic Analysis of the Gauteng Freeway Improvement Scheme 68
revenues from light vehicles is expected to total R2.7bn. Gauteng has an estimated share
of 41.6% of South African household income. This means that in 2011 the Gauteng share
of South African household gross disposable income is expected to be R624.9bn. Total
toll revenue is therefore 0.43% of projected Gauteng household gross disposable income
in 2011. In other words the toll burden from the freeway upgrade for light vehicles is the
equivalent of 43c for each R100 of disposable income.
A final calculation is included in the table and that is the likely toll tariff burden on people
falling into LSM 7 to 10. This category has been used because these are the types of
people who are more likely to own private vehicles and use them on the highways. In
Gauteng LSM 7 to 10 constitute 90.2% of total household income. As a consequence the
toll tariff burden on this group of people is expected to be in the region of 0.48% in 2011.
Table 19: Potential Burden of Tolling
8.2 Private road users
The previous section has demonstrated that in almost all cases there are more benefits to
road users than there are costs in the project. Hence the general conclusion that can be
Toll Burden in Gauteng in 2011(Rm)
South African GDP projected 2011 1
2,352,943
Gauteng Share of GDP 2
41.6%
Gauteng GGP in 2011 978,824
Total Annual Toll Revenue in 2011 3,308
Toll Revenue as a percentage of Gauteng GGP 0.34%
SA Household Gross Disposable Income (HGDI) projected 2011 31,502,188
Gauteng share of HGDI 241.6%
Gauteng HGDI in 2011 624,910
Total Annual Toll Revenue from Light Vehicles in 2011 2,686
Toll Revenue from Light Vehicles as a % of Gauteng HGDI 0.43%
LSM 7 - 10 share of Gauteng income 90.2%
LSM 7 - 10 HGDI in 2011 563,669
Total Annual Toll Revenue from Light Vehicles in 2011 2,686
Toll Revenue from Light Vehicles as a % of Gauteng HGDI LSM 7 - 10 0.48%
Notes and Sources:
1. SA Reserve Bank Quarterly Bulletin June 2010. First quarter GDP grown at 2.5%.
2. Calculated from the 2007 Community Survey, based on household income
3. SA Reserve Bank Quarterly Bulletin June 2010. 2009 PDI grown at 5%
Gross Domestic Product
Household Disposable Income (all households)
Household Disposable Income (LSM 7 to 10)

Economic Analysis of the Gauteng Freeway Improvement Scheme 69
drawn is that proposed tolling is good for private motorists, business vehicles and public
transport. However, at least two arguments can be made in mitigation against some of the
general conclusions that have been drawn.
First, it can be argued that, for some people, there would not be an obvious saving in
vehicle operating costs in the early years of the toll road. It is recognised that savings in
some vehicle costs would be obvious and apparent – fuel costs, time costs and lower
accident rates, for example. Other costs, however, are far less discrete over time and tend
to be lump sum costs after a period of time – tyre costs, suspension and steering repairs,
etc. Hence the immediate and obvious saving in vehicle operating costs would be for fuel,
time and, possibly, accident costs. Other costs would accumulate in the future. Hence
while the above section shows road user benefits in each year the reality is that the
savings would only be realised some years into the future. Therefore for cash flow
purposes there would be less road user benefits in the early years of the tolled roads, as
these benefits would accumulate into the future. The perception and reality would be that
some drivers who currently do and would continue to use the road on a regular basis
could be vulnerable to the proposed tolling.
Second, less affluent owners of private vehicles or those who are cash constrained may
face road user costs that are different to those used in the general calculations. In
particular, less affluent people would have lower time costs than others. In addition such
people may choose to repair their vehicles themselves or may choose simply not to repair
their vehicles at all. Hence, for example, minor accident damage may simply be left and
not repaired. Mechanical repairs may be more rudimentary or make use of second hand
or salvaged parts.
In order to explore these issues an analysis was made of the composition of traffic
currently using the Freeway network. The initial analysis was done by making use of the
Gauteng travel survey that was conducted in 2002 (Gauteng Department of Public
Transport, Roads and Works, 2002) as well as the road side interviews that were
conducted in November 2006.
Neither the survey nor the road side interviews proved satisfactory for the purposes of the
analysis. One of the key issues that needed to be examined is affordability. In other
words, the freeways would be upgraded and this would improve traffic flows, etc, and
would be welcome by most drivers. The real issue is to determine how many drivers
would not be able to afford to pay for these proposed upgrades. To do this it was
necessary to have some correlation between a driver‟s income, the distance that the
driver travels, the purpose of the journey and trip frequency on the highway network. In

Economic Analysis of the Gauteng Freeway Improvement Scheme 70
The road side interviews had all of this information with the exception of income. The
survey had all of this information about all drivers in Gauteng but did not differentiate
between those who did and did not use the highway network (and those therefore subject
to tolling).
In order to address these constraints SANRAL conducted a new set of interviews in 2009
that focussed on class 1 vehicles using the freeways. This was a telephonic interview,
based on the registration numbers of vehicles using the freeways. Over 27 000 people
were interviewed. The analysis in this section is based on this new set of interviews.
Trip frequency and the purpose of the journey from the interviews are presented in Table
20 and Table 21. The largest category of people using the freeways are those doing it for
the purpose of work commuting (32% of all interviews), followed by people who were
„going home‟ (26%). It is not clear if these are people returning from work or returning
home from other business. It is more likely the former. This is followed, at 19% by people
visiting friends or relatives, at 11%, by „refusal, personal, private, unspecified‟, at 6% by
people going shopping and, at 4% by people going to entertainment of various kinds.
For the purpose of determining who would be potentially vulnerable to tolling the
conclusion that is drawn is that the focus should be on work commuters. It can be
expected that those travelling for employers business would not bear the burden of the toll
(it may be that this is passed on to consumers in the form of higher prices – this is
examined further in section 8.6).
Table 20: Travel frequency and journey purpose 1
Table 21 gives some more of the detail of those drivers who are potentially vulnerable to
tolling. Here it will be seen that 39% of drivers make less than 10 trips a month on the
freeways, 21% make between 10 and 40 monthly trips and 39% of all drivers used the
Travel frequency and journey purpose
Sample size: 27 300
Journey purpose <10 10-20 20-30 30-40 40-50 50-60 >60 Grand Total
Airport/ O.R. TAMBO 1% 1% 0% 0% 0% 0% 0% 0%
Church/ Religious 0% 0% 0% 0% 0% 0% 0% 0%
Doctor/ Hospital 1% 1% 0% 0% 0% 0% 0% 0%
Dropping kids off at school/ extra murials 0% 0% 0% 0% 0% 0% 0% 0%
Going home 21% 29% 33% 31% 29% 25% 33% 26%
Going to office/ work/ any business related 38% 18% 25% 27% 31% 50% 24% 32%
Going to shops/ Shopping 8% 6% 5% 5% 5% 0% 6% 6%
Holiday/ weekend away 1% 1% 1% 1% 1% 0% 3% 1%
Other 0% 0% 0% 0% 0% 0% 0% 0%
Refusal/ Personal/ Private/ Unspecify 9% 16% 12% 12% 12% 17% 12% 11%
Restaurant/ movies/ lunch/ evening out 2% 2% 3% 4% 5% 0% 3% 4%
Visiting friends/ relatives 20% 27% 21% 19% 17% 8% 18% 19%
Grand Total 100% 100% 100% 100% 100% 100% 100% 100%
Number of trips per month
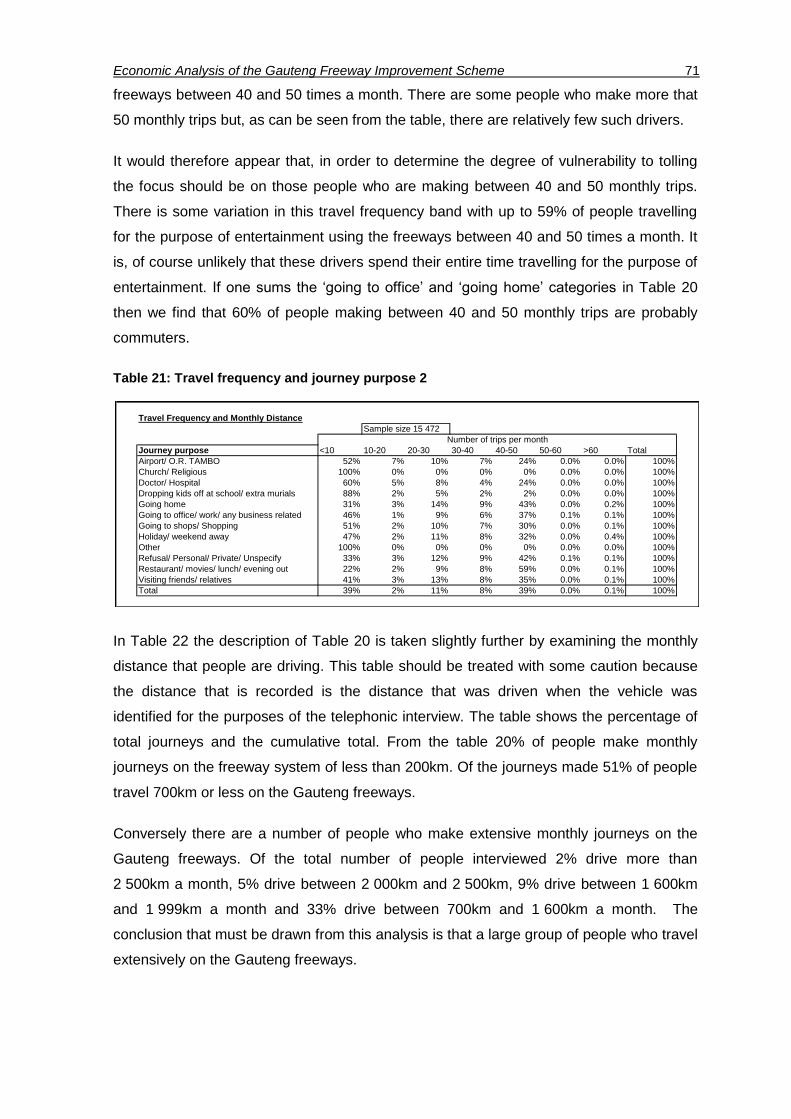
Economic Analysis of the Gauteng Freeway Improvement Scheme 71
freeways between 40 and 50 times a month. There are some people who make more that
50 monthly trips but, as can be seen from the table, there are relatively few such drivers.
It would therefore appear that, in order to determine the degree of vulnerability to tolling
the focus should be on those people who are making between 40 and 50 monthly trips.
There is some variation in this travel frequency band with up to 59% of people travelling
for the purpose of entertainment using the freeways between 40 and 50 times a month. It
is, of course unlikely that these drivers spend their entire time travelling for the purpose of
entertainment. If one sums the „going to office‟ and „going home‟ categories in Table 20
then we find that 60% of people making between 40 and 50 monthly trips are probably
commuters.
Table 21: Travel frequency and journey purpose 2
In Table 22 the description of Table 20 is taken slightly further by examining the monthly
distance that people are driving. This table should be treated with some caution because
the distance that is recorded is the distance that was driven when the vehicle was
identified for the purposes of the telephonic interview. The table shows the percentage of
total journeys and the cumulative total. From the table 20% of people make monthly
journeys on the freeway system of less than 200km. Of the journeys made 51% of people
travel 700km or less on the Gauteng freeways.
Conversely there are a number of people who make extensive monthly journeys on the
Gauteng freeways. Of the total number of people interviewed 2% drive more than
2 500km a month, 5% drive between 2 000km and 2 500km, 9% drive between 1 600km
and 1 999km a month and 33% drive between 700km and 1 600km a month. The
conclusion that must be drawn from this analysis is that a large group of people who travel
extensively on the Gauteng freeways.
Travel Frequency and Monthly Distance
Sample size 15 472
Journey purpose <10 10-20 20-30 30-40 40-50 50-60 >60 Total
Airport/ O.R. TAMBO 52% 7% 10% 7% 24% 0.0% 0.0% 100%
Church/ Religious 100% 0% 0% 0% 0% 0.0% 0.0% 100%
Doctor/ Hospital 60% 5% 8% 4% 24% 0.0% 0.0% 100%
Dropping kids off at school/ extra murials 88% 2% 5% 2% 2% 0.0% 0.0% 100%
Going home 31% 3% 14% 9% 43% 0.0% 0.2% 100%
Going to office/ work/ any business related 46% 1% 9% 6% 37% 0.1% 0.1% 100%
Going to shops/ Shopping 51% 2% 10% 7% 30% 0.0% 0.1% 100%
Holiday/ weekend away 47% 2% 11% 8% 32% 0.0% 0.4% 100%
Other 100% 0% 0% 0% 0% 0.0% 0.0% 100%
Refusal/ Personal/ Private/ Unspecify 33% 3% 12% 9% 42% 0.1% 0.1% 100%
Restaurant/ movies/ lunch/ evening out 22% 2% 9% 8% 59% 0.0% 0.1% 100%
Visiting friends/ relatives 41% 3% 13% 8% 35% 0.0% 0.1% 100%
Total 39% 2% 11% 8% 39% 0.0% 0.1% 100%
Number of trips per month

Economic Analysis of the Gauteng Freeway Improvement Scheme 72
Table 22: Travel frequency and travel time 1
This conclusion is further reinforced by the findings presented in Table 23 which shows a
similar analysis to that of Table 22 except that it focuses purely on work commuters rather
than on all drivers. Here it can be seen that while there is some variation between the
distances that commuter drive on the freeways compared to all drivers the differences are
not particularly marked. Here, for example, 50% rather than 51% travel up to 700km a
month.
Monthly Distance
Sample size 15 472
(km) % of total Cumulative total
>100 10% 10%
100-199 10% 20%
200-299 8% 28%
300-399 6% 33%
400-499 8% 41%
500-599 5% 46%
600-699 5% 51%
700-799 5% 56%
800-899 5% 61%
900-999 3% 65%
1000-1199 7% 71%
1200-1399 8% 79%
1400-1599 5% 84%
1600-1999 9% 93%
2000-2500 5% 98%
>2500 2% 100%
Total 100%

Economic Analysis of the Gauteng Freeway Improvement Scheme 73
Table 23: Travel frequency and travel time, work commuters
The final calculation that is made is to determine the likely toll burden at different income
levels. The cost of tolling is based on a toll of 71.5c per km adjusted for two types of
discounts. These are an electronic tag discount of 20% and frequent user discounts as
given in Table 24. Off peak and other discounts are not included in the analysis. The
analysis is again based on the telephonic interviews that were conducted and the results
are reported in Table 27 and Table 28. It is well known that questions about income are
problematic in any survey. This appears to have been true of the telephonic survey as
well. The first problem is that many people refuse to disclose their income. Hence it can
be seen that of the total of over 27 000 interviews only 5 524 people were prepared to
disclose their incomes. The second is that people often report an income that is at
variance with their true income.
Monthly Distance: Commuters
Sample size 9244
(km) % of total Cumulative total
>100 9% 9%
100-199 10% 19%
200-299 8% 27%
300-399 6% 33%
400-499 8% 41%
500-599 5% 46%
600-699 5% 50%
700-799 5% 56%
800-899 5% 61%
900-999 3% 64%
1000-1199 7% 70%
1200-1399 8% 79%
1400-1599 5% 84%
1600-1999 9% 92%
2000-2500 5% 98%
>2500 2% 100%
Total 100%
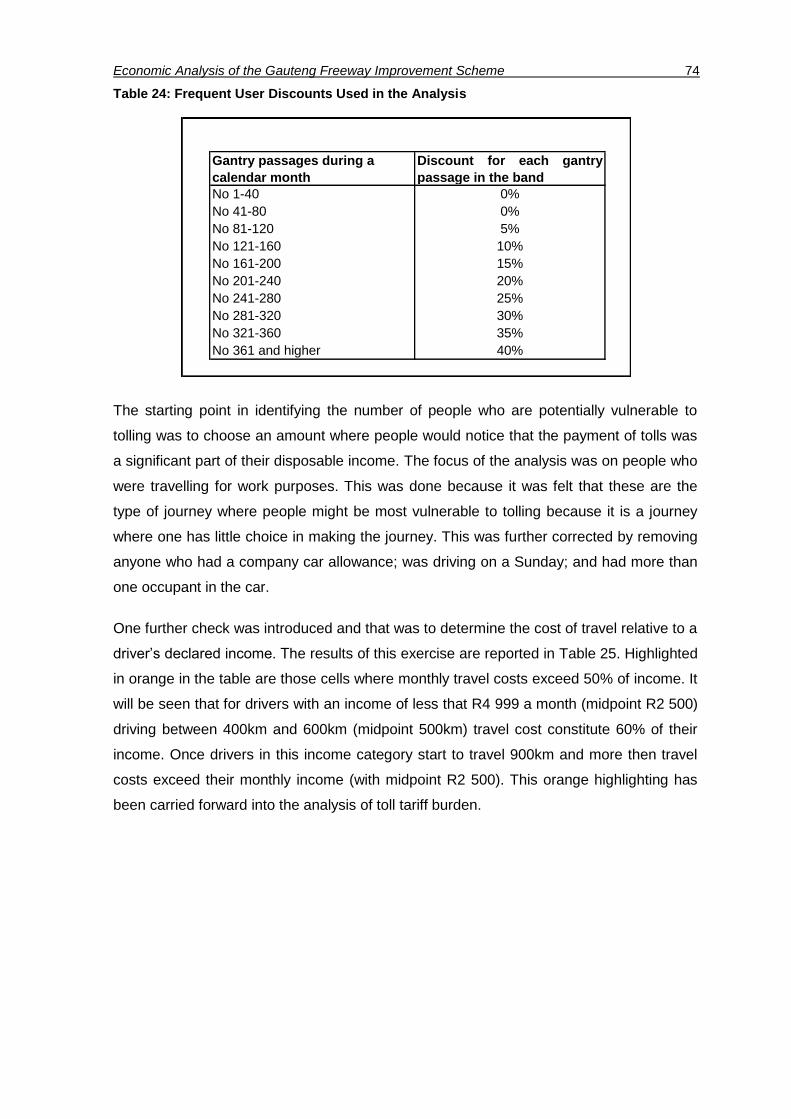
Economic Analysis of the Gauteng Freeway Improvement Scheme 74
Table 24: Frequent User Discounts Used in the Analysis
The starting point in identifying the number of people who are potentially vulnerable to
tolling was to choose an amount where people would notice that the payment of tolls was
a significant part of their disposable income. The focus of the analysis was on people who
were travelling for work purposes. This was done because it was felt that these are the
type of journey where people might be most vulnerable to tolling because it is a journey
where one has little choice in making the journey. This was further corrected by removing
anyone who had a company car allowance; was driving on a Sunday; and had more than
one occupant in the car.
One further check was introduced and that was to determine the cost of travel relative to a
driver‟s declared income. The results of this exercise are reported in Table 25. Highlighted
in orange in the table are those cells where monthly travel costs exceed 50% of income. It
will be seen that for drivers with an income of less that R4 999 a month (midpoint R2 500)
driving between 400km and 600km (midpoint 500km) travel cost constitute 60% of their
income. Once drivers in this income category start to travel 900km and more then travel
costs exceed their monthly income (with midpoint R2 500). This orange highlighting has
been carried forward into the analysis of toll tariff burden.
Gantry passages during a
calendar month
Discount for each gantry
passage in the band
No 1-40 0%
No 41-80 0%
No 81-120 5%
No 121-160 10%
No 161-200 15%
No 201-240 20%
No 241-280 25%
No 281-320 30%
No 321-360 35%
No 361 and higher 40%

Economic Analysis of the Gauteng Freeway Improvement Scheme 75
Table 25: Monthly Travel Cost as Percentage of Income
There is no science in choosing a measure of a toll tariff burden and the higher people‟s
income the higher this value could be because of their greater amount of discretionary
income. For the purposes of this analysis a value of toll being equal or higher than 3%,
5% and 10% of income were chosen. This is illustrated as the shaded part of Table 26
where the midpoint of monthly toll costs and income categories have been used for the
calculation. The light shading is where tolls exceed 3% of income, the medium shading
where tolls exceed 5% and the dark shading where tolls exceed 10% of income. This
shading is carried over to Table 27 and Table 28 which report on the actual number and
percentage of drivers in each category.
Table 26: Toll Cost as a Percentage of Income with 3%, 5% and 10% highlighted
The following conclusions can be made about the information in Table 27 and Table 28
where the focus is on single occupant vehicles being used for work commuting where the
driver does not have a company travel allowance:
40% of the sample is expected to pay toll fees of less that R200 a month.
Monthly Travel Cost as a % of income
Monthly income <200 200-400 400-600 600-800 800-1000 1000-1300 1300-1600
Midpoint km 100 300 500 700 900 1150 1450
2500 12% 36% 60% 84% 108% 138% 175%
6500 5% 14% 23% 32% 42% 53% 67%
9500 3% 10% 16% 22% 29% 36% 46%
12500 2% 7% 12% 17% 22% 28% 35%
13000 2% 7% 12% 16% 21% 27% 34%
18000 2% 5% 8% 12% 15% 19% 24%
22500 1% 4% 7% 9% 12% 15% 19%
27500 1% 3% 5% 8% 10% 13% 16%
45000 1% 2% 3% 5% 6% 8% 10%
Monthly Travel Cost as % of income
Monthly income and Toll Cost
Sample size 5,524
Monthly income 100 300 500 700 900 1150 1450 Total
2500 4% 12.0% 20.0% 28.0% 36.0% 46.0% 58.0% 60
6500 2% 4.6% 7.7% 10.8% 13.8% 17.7% 22.3% 152
9500 1% 3.2% 5.3% 7.4% 9.5% 12.1% 15.3% 251
12500 1% 2.4% 4.0% 5.6% 7.2% 9.2% 11.6% 280
13000 1% 2.3% 3.8% 5.4% 6.9% 8.8% 11.2% 410
18000 1% 1.7% 2.8% 3.9% 5.0% 6.4% 8.1% 730
22500 0% 1.3% 2.2% 3.1% 4.0% 5.1% 6.4% 1,130
27500 0% 1.1% 1.8% 2.5% 3.3% 4.2% 5.3% 703
45000 0% 0.7% 1.1% 1.6% 2.0% 2.6% 3.2% 1,808
Total 2,678 884 732 566 347 260 57 5,524
Monthly Toll Cost (with discount)

Economic Analysis of the Gauteng Freeway Improvement Scheme 76
50% of commuters declaring an income of less than R4 999 a month are expected
to pay less than R200 a month in tolls. This is however in excess of 3% of monthly
income for these people.
18.9% of commuters are expected to pay tolls of between R200 and R400 a
month. This is 327 people in the sample of which 19 will be paying tolls greater
than 3% of their income and 2 will be paying tolls greater than 10% of their
income.
Table 27: Monthly income and Toll Cost: Absolute Numbers
15% of commuters are expected to pay tolls of between R400 and R600 a month.
This is 265 people in the sample of which 32 people will be paying tolls greater
than 3% of their income, 19 will be paying tolls greater than 5% of their income
and 2 will be paying tolls in excess of 10% of their incomes. However in the latter
case these two drivers have declared that the cost of their travel on Gauteng
highways exceeds 50% of their income.
11.5% of people are expected to pay tolls of between R600 and R800 a month.
This is 199 commuters in the sample of which 89 people will be paying tolls
greater than 3% of their income, 38 will be paying tolls greater than 5% of their
income and 4 will be paying tolls in excess of 10% of their incomes.
8.2% of people are expected to pay tolls of between R800 and R1 000 a month.
This is 141 commuters in the sample of which 42 people will be paying tolls
greater than 3% of their income, 58 will be paying tolls greater than 5% of their
income and 4 will be paying tolls in excess of 10% of their incomes.
4.9% of people are expected to pay tolls of between R1 000 and R1 300 a month.
This is 84 commuters in the sample of which 9 people will be paying tolls greater
than 3% of their income, 44 will be paying tolls greater than 5% of their income
and 5 will be paying tolls in excess of 10% of their incomes. Of the latter 5 there
Monthly income and Toll Cost (Single occupant vehicle, Work purpose Journey)
Sample size 1,728
Monthly income <200 200-400 400-600 600-800 800-1000 1000-1300 1300-1600 Total
Up to R4,999 5 2 2 1 10
R5,000-R7,999 11 2 8 3 4 2 2 32
R8,000-R10,999 36 17 11 6 7 3 80
R11,000-R13,999 32 16 14 13 15 3 1 94
R14,000-R15,999 46 33 18 19 14 14 3 147
R16,000-R19,999 91 55 41 38 22 12 3 262
R20,000-R24,999 150 67 69 51 26 15 3 381
R25,000-R29,999 89 48 24 24 16 9 3 213
R30,000+ 234 87 78 44 37 26 3 509
Total 694 327 265 199 141 84 18 1,728
Monthly Toll Cost (with discount)

Economic Analysis of the Gauteng Freeway Improvement Scheme 77
are 2 people who have declared travel costs as being in excess of 50% of their
declared income.
Table 28: Monthly income and Toll Cost: Percentage Distribution
1% of people are expected to pay tolls of between R1 300 and R1 600 a month.
This is 18 commuters in the sample of which 3 people will be paying tolls greater
than 3% of their income, 9 will be paying tolls greater than 5% of their income and
6 will be paying tolls in excess of 10% of their incomes.
Of the total sample of 1 728 commuters there is the possibility that, based on the
survey:
o 390 people would be paying tolls equal to or greater than 3% of their
income. This is the equivalent of 22% of the sample;
o 191 people would be paying tolls equal to or greater than 5% of their
income. This is the equivalent of 11% of the sample;
o 23 people would be paying tolls equal to or greater than 10% of their
income. This is the equivalent of 1.3% of the sample. However of this
group 7 have travel costs that exceed 50% of their income.
8.3 Impact on business
Two main categories of travel affect business: travel to work journeys of all workers; and
travel for the purposes of work, primarily during the day. The travel for work journeys
includes business travel for people as well as freight transport for the purpose of
distribution and supply of all the economic activities in the Gauteng economy.
Impacts on these business activities will be mediated principally by the effect that the
freeway upgrade or expansion schemes have on the generalised cost of travel.
Generalised cost is a measure that combines financial cost of travel with the travel time,
operating costs and safety. The micro-economic analysis has shown that for the great
Percent of Sample: Toll Cost as a Percentage of Income
(Single occupant vehicle, Work purpose Journey)
Monthly income <200 200-400 400-600 600-800 800-1000 1000-1300 1300-1600
Up to R4,999 50.0% 20.0% 20.0% 10.0% 0.0% 0.0% 0.0%
R5,000-R7,999 34.4% 6.3% 25.0% 9.4% 12.5% 6.3% 6.3%
R8,000-R10,999 45.0% 21.3% 13.8% 7.5% 8.8% 3.8% 0.0%
R11,000-R13,999 34.0% 17.0% 14.9% 13.8% 16.0% 3.2% 1.1%
R14,000-R15,999 31.3% 22.4% 12.2% 12.9% 9.5% 9.5% 2.0%
R16,000-R19,999 34.7% 21.0% 15.6% 14.5% 8.4% 4.6% 1.1%
R20,000-R24,999 39.4% 17.6% 18.1% 13.4% 6.8% 3.9% 0.8%
R25,000-R29,999 41.8% 22.5% 11.3% 11.3% 7.5% 4.2% 1.4%
R30,000+ 46.0% 17.1% 15.3% 8.6% 7.3% 5.1% 0.6%
40.2% 18.9% 15.3% 11.5% 8.2% 4.9% 1.0%
Monthly Toll Cost (with discount)

Economic Analysis of the Gauteng Freeway Improvement Scheme 78
majority of users of the tolled network, the net position is one of gain. As a result, the
schemes will have a net positive impact on business in that almost all travel will be less
expensive in overall economic value terms.
This reduction in generalised cost of travel translates directly into business productivity
improvements. These business benefits would be expressed typically in some of the
following ways:
Greater reliability/timekeeping by staff translates into business productivity gains
With reduced congestion on the network distributors of goods are able to complete
more turnarounds per day resulting in higher turnover and productivity
More business appointments can be achieved per day resulting in improved
productivity
All of these benefits are incorporated in the calculations that go towards the cost benefit
analysis results.
The Eddington Transport Study in the UK has shown that further business benefits, not
counted in the travel time and operating cost savings, may occur as businesses respond
to the fact that they now have access to larger, and possibly deeper, labour markets.
Eddington concluded that in rapidly growing urban economies these secondary
productivity gains can be very significant.
Eddington refers to these benefits as „agglomeration‟ gains. These benefits arise because
firms located in relatively dense areas but served by good transport links are able to
access a larger pool of labour than those either in less dense areas or where transport
access is poorer. When accessibility is improved significantly the labour pool to which
firms have access is expanded; more people can reach their premises within a set time
than was the case previously. This means that, over time, businesses can adjust their
employment structure to take advantage of the wider range of people and skills available
to them.
Particularly in situations where growth potential is already present, these secondary
labour market productivity gains can be very significant. In this present study no attempt
has been made to quantify these additional benefits to business but it is should be noted
that they can amount to between 30 and 50 percent more than the sum of benefits
calculated by conventional means. Gauteng is experiencing very rapid economic growth
at present and the growth potentially achievable is being constrained by congestion. In

Economic Analysis of the Gauteng Freeway Improvement Scheme 79
these circumstances, the secondary productivity gains demonstrated in the Eddington
Transport Study could be expected to be towards the higher end of the suggested range.
This implies that the cost benefit measures referred to in Section 7 could in reality be
considerably higher than indicated.
8.4 Impact on public transport
Public transport vehicles using the improved freeway network would also benefit from
travel time, vehicle operating cost and safety improvements. But, to the extent that they
also pay the tolls, their costs would rise and these may be passed on to users, increasing
the fares that they have to pay. Public transport users would be less able than private
users to balance savings in time and safety with fare levels paid and may perceive
themselves to be in a net negative position even if economic calculations show otherwise.
For lowest income users affordability would be an issue too if toll charges are passed on
to passenger fares.
Although according to the detailed analysis of user benefits, the economic balance would
be positive overall, the issue is expected to require mitigation either via lower tolls being
charged to public transport vehicles or road space prioritisation measures for higher
occupancy vehicles, or both.
An important consideration in assessing the significance of this issue is the fact that the
freeways are generally not the primary routes used by public transport vehicles. This was
revealed in recent research undertaken by Gauteng Province (Strategic Roads Network
review). Partly as a consequence of this finding, Gauteng Province embarked on a further
study to determine priorities among the routes that public transport vehicles do indeed
mainly use, including existing bus and taxi routes and proposed Bus Rapid Transit routes.
An implication of this is that infrastructure improvements for the benefit of public transport
road vehicles would mainly be addressed elsewhere than via the freeway upgrade project.
Nevertheless, the element of public transport optimisation through HOV lane provision
and probable lower toll charges would mean that public transport users and operators
would not be disadvantaged by the scheme.
In addition to the largely positive impacts of actually using the freeway network, public
transport vehicles would experience additional benefits from the decongestion of the non-
freeway routes that they typically use, as a result of the diversion of some traffic from
Economic Analysis of the Gauteng Freeway Improvement Scheme 80
these roads to the newly provided capacity on the freeways. Discounts will be offered to
public transport operators.
8.5 Captive business and communities
Although no attempt at quantification has been undertaken of this concern, there would be
a small number of businesses and communities where the only practical route available
may be a new tolled freeway. As a consequence, use of the network would not be a free
choice. While such groups may still experience the benefit of improved travel time,
operating costs and safety, they would not be doing so by choice and so in some cases
their net benefit may be negative.
It is anticipated that the numbers of parties affected in this way would be very small and
limited to certain existing residents and businesses along the routes of the proposed new
freeways. It is only where access to a previously used route becomes barred by the
construction of the new route that this situation would apply.
8.6 Impact on the cost of consumer goods
There are always concerns that a toll road would increase the cost of consumer goods
and possibly destroy jobs and reduce wages. Given that the cost benefit analysis showed
positive results, consumer goods prices should theoretically be less with the project than
without it.
Nevertheless, in order to test the limits the following assessment quantifies the effects of
tolling while ignoring all the benefits of the freeway upgrades.
Such an assessment can be undertaken at various levels of detail where this detail is
determined largely by the amount of available information, the time frame for the study
and resources made available for the study. A full assessment of these issues would
demand a detailed and minute analysis of the impact of the roads on every sector, at
least, if not also on individual companies. Bear in mind that this type of information is
usually considered confidential by all companies, affected or not. An assessment of this
nature is beyond the scope, the time frame or resources available for such a study.
Issues of employment are addressed in the macroeconomic section where direct and
indirect job creation is quantified for some aspects of the project. These include
construction jobs, jobs during operation and potential jobs as a result of increases in
network speed. There is also the potential for permanent job losses. Permanent job losses
could occur if the transport cost increases of the project are sufficient to undermine the

Economic Analysis of the Gauteng Freeway Improvement Scheme 81
financial viability of individual companies or entire sectors. Following from this, because
wages are a function of the demand and supply of labour, the study was not able to
determine the overall changes in demand and supply of labour or draw conclusions about
the likely impact of the project on wages.
In order to measure the possible impact on the cost of consumer goods a hypothetical
journey was established. The intention in this exercise was to measure the highest
possible changes in the cost of consumer goods. To this end a number of possible
permutations of vehicle size, load value and origin and destination were analysed.
This analysis is based on the following key points and assumptions:
The toll tariff that has been used is the actual toll tariff that has been used by the
traffic engineers.
All road user benefits from the project are ignored. In other words the exercise is
undertaken as if the existing roads were simply tolled without any rehabilitation or
capacity upgrades. This would overstate the size of the impact on the cost of
consumer goods.
The analysis ignores the fact that some consumer goods would not be affected by
tolls because they are not moved on the freeway network but either by rail or on
secondary roads. This would overstate the size of the impact on the cost of
consumer goods.
It is assumed that all toll tariffs after VAT and company tax are passed on to the
final consumer. Some of the cost increases could be absorbed by the producer
either because of the known resistance of major supermarket chains to cost
increases or because of competition from products that are either imported or from
other areas not affected by tolling. This would overstate the size of the impact on
the cost of consumer goods.
The toll tariff on the return journey has also been included because the vehicle
may, for example, be returning empty or carrying farm supplies back to the farm.
This would overstate the size of the impact on the cost of consumer goods if the
return vehicle is carrying goods destined for sale out of the province.
The analysis does not take into account other possible cost increases like the
increased cost of staff being transported to work or the travel costs of sales

Economic Analysis of the Gauteng Freeway Improvement Scheme 82
representatives. This would understate the size of the impact on the cost of
consumer goods.
The methodology that was followed in this section was to base it on a hypothetical vehicle
fleet and location of a transport company based at Isando close to OR Tambo
International Airport which is responsible for delivering goods to the stores of a major retail
chain8. Typically cargo is brought to Isando in vehicles of varying size. Here the cargo is
sorted or repackaged before being sent to its final destination. We chose to analyse one
of the longer journeys for cargo being brought to Isando. This was from north of Pretoria
along the Ben Schoeman highway. The cargo was then delivered to one of the poorer
parts of the province in the form of Soweto. For both journeys it was assumed that the
vehicle returned to Isando and north of Pretoria without any cargo. The total toll tariff was
then added to the cost of the cargo. The final step in the analysis was to apportion these
cost increases across people‟s spending patterns to determine the overall increase in the
cost of living. This final step was done for different income categories because different
income levels have different spending patterns.
Two types of food stuffs were analysed – fruit and vegetables, and dry goods. The reason
for the choices was that fruit and vegetables were moved in smaller vehicles while dry
goods were typically moved in larger vehicles. For fruit and vegetables the average value
of cargo was R15 000 with a typical minimum of R13 000. Dry goods have an average
value of R120 000 with a minimum trip value of R110 000.
The estimates that were made are reported below. As a means of understanding the
tables, the first column of Table 29 estimates the increased cost of moving fruit and
vegetables in a class 2 vehicle. Here the value of the cargo is R12 000. The toll tariff from
north of Pretoria to Isando is R45.72. After deducting VAT and company tax this adds
0.47% to the cost of the cargo. The cargo is then sorted, packed into another class 2
vehicle and delivered to retail outlets in Soweto. The toll tariff to Soweto is R36.33. This
adds a further 0.30% to the cost of the fruit and vegetables. In total both journeys add
0.77% to the cost of fruit and vegetables. The second and third columns of the table follow
similar logic for larger vehicles. Clearly the larger the vehicle and the greater value of the
cargo so the proportionate costs decline. Cargo carried in class 3 vehicles would cost
0.28% more and 0.23% more in class 4 vehicles.
8 This analysis is based on similar work undertaken in the Western Cape.

Economic Analysis of the Gauteng Freeway Improvement Scheme 83
Table 29 reports on the impact on the cost of fruit and vegetables while Table 30 reports
on the estimates for dry goods.
As a means of understanding the tables, the first column of Table 29 estimates the
increased cost of moving fruit and vegetables in a class 2 vehicle. Here the value of the
cargo is R12 000. The toll tariff from north of Pretoria to Isando is R45.72. After deducting
VAT and company tax this adds 0.47% to the cost of the cargo. The cargo is then sorted,
packed into another class 2 vehicle and delivered to retail outlets in Soweto. The toll tariff
to Soweto is R36.33. This adds a further 0.30% to the cost of the fruit and vegetables. In
total both journeys add 0.77% to the cost of fruit and vegetables. The second and third
columns of the table follow similar logic for larger vehicles. Clearly the larger the vehicle
and the greater value of the cargo so the proportionate costs decline. Cargo carried in
class 3 vehicles would cost 0.28% more and 0.23% more in class 4 vehicles.
Table 29: Increased cost of fruit and vegetables
The possible impact on the cost of dry goods is given in Table 30. The methodology and
journey types are the same. Because of the higher value of dry goods relative to their
mass the lower value loads are omitted. Dry goods that are transported from Pretoria to
the depot and then delivered to Soweto would have a cost increase of 0.12% when
R140 000 of cargo is moved by a class 3 vehicle. If a class 4 vehicle is used (class 3 with
a trailer) then the cost increase is 0.11% if the cargo has a value of R200 000.
Impact on the cost of Fruit and Vegetables
1 2 3
Origin
Value of incoming load 12,000 60,000 100,000
Vehicle class 2 3 4
Distance (km) 61 61 61
Tolls on inward journey 45.72 74.30 102.87
Tolls on outward journey 45.72 74.30 102.87
Less: VAT 12.80 20.80 28.80
Less: Company tax 22.02 35.78 49.54
Less: Reduced maintenance
Net cost of tolling 56.62 92.01 127.39
Toll as a percentage of load value 0.47% 0.15% 0.13%
Destination
Value of outgoing load 15,000 60,000 100,000
Vehicle class 2 3 4
Distance (km) 36 36 36
Tolls on inward journey 36.33 59.04 81.74
Tolls on outward journey 36.33 59.04 81.74
Less: VAT 10.17 16.53 22.89
Less: Company tax 17.50 28.43 39.37
Less: Reduced maintenance
Net cost of tolling 44.99 73.12 101.23
Toll as a percentage of load value 0.30% 0.12% 0.10%
Percentage increase in cost of fruit & vegetables 0.77% 0.28% 0.23%
North of Pretoria to Isando
Isando to Soweto
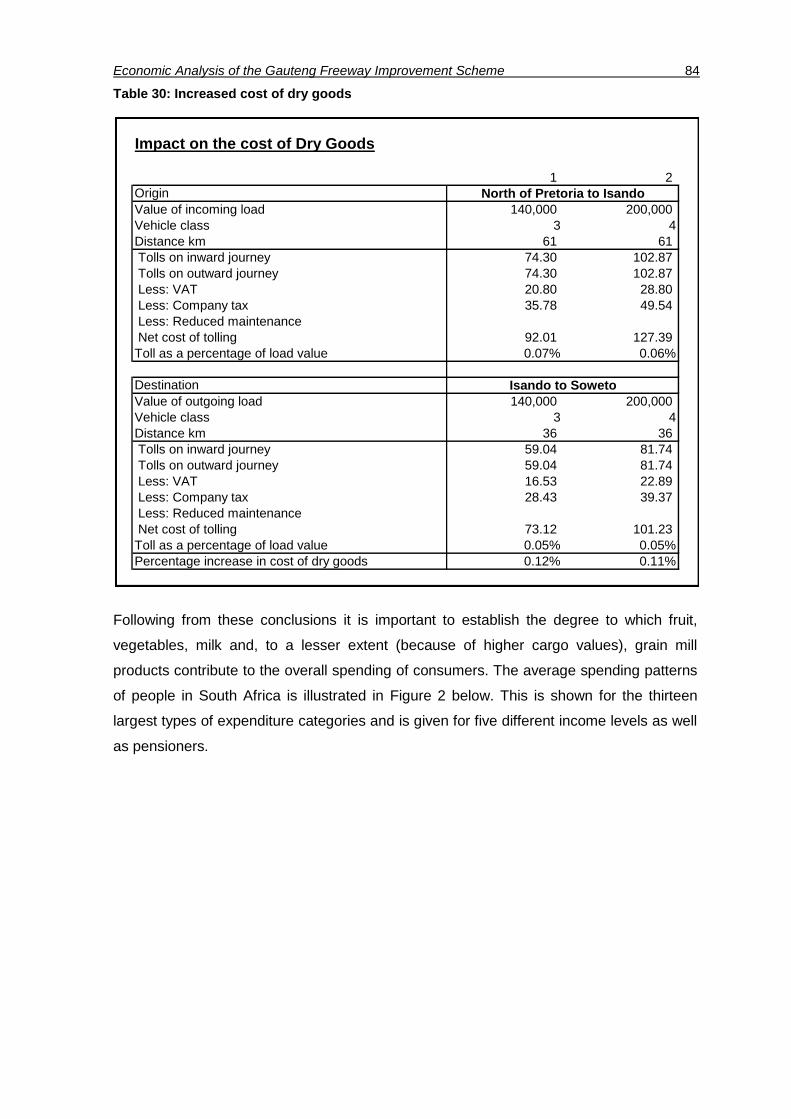
Economic Analysis of the Gauteng Freeway Improvement Scheme 84
Table 30: Increased cost of dry goods
Following from these conclusions it is important to establish the degree to which fruit,
vegetables, milk and, to a lesser extent (because of higher cargo values), grain mill
products contribute to the overall spending of consumers. The average spending patterns
of people in South Africa is illustrated in Figure 2 below. This is shown for the thirteen
largest types of expenditure categories and is given for five different income levels as well
as pensioners.
Impact on the cost of Dry Goods
1 2
Origin
Value of incoming load 140,000 200,000
Vehicle class 3 4
Distance km 61 61
Tolls on inward journey 74.30 102.87
Tolls on outward journey 74.30 102.87
Less: VAT 20.80 28.80
Less: Company tax 35.78 49.54
Less: Reduced maintenance
Net cost of tolling 92.01 127.39
Toll as a percentage of load value 0.07% 0.06%
Destination
Value of outgoing load 140,000 200,000
Vehicle class 3 4
Distance km 36 36
Tolls on inward journey 59.04 81.74
Tolls on outward journey 59.04 81.74
Less: VAT 16.53 22.89
Less: Company tax 28.43 39.37
Less: Reduced maintenance
Net cost of tolling 73.12 101.23
Toll as a percentage of load value 0.05% 0.05%
Percentage increase in cost of dry goods 0.12% 0.11%
North of Pretoria to Isando
Isando to Soweto
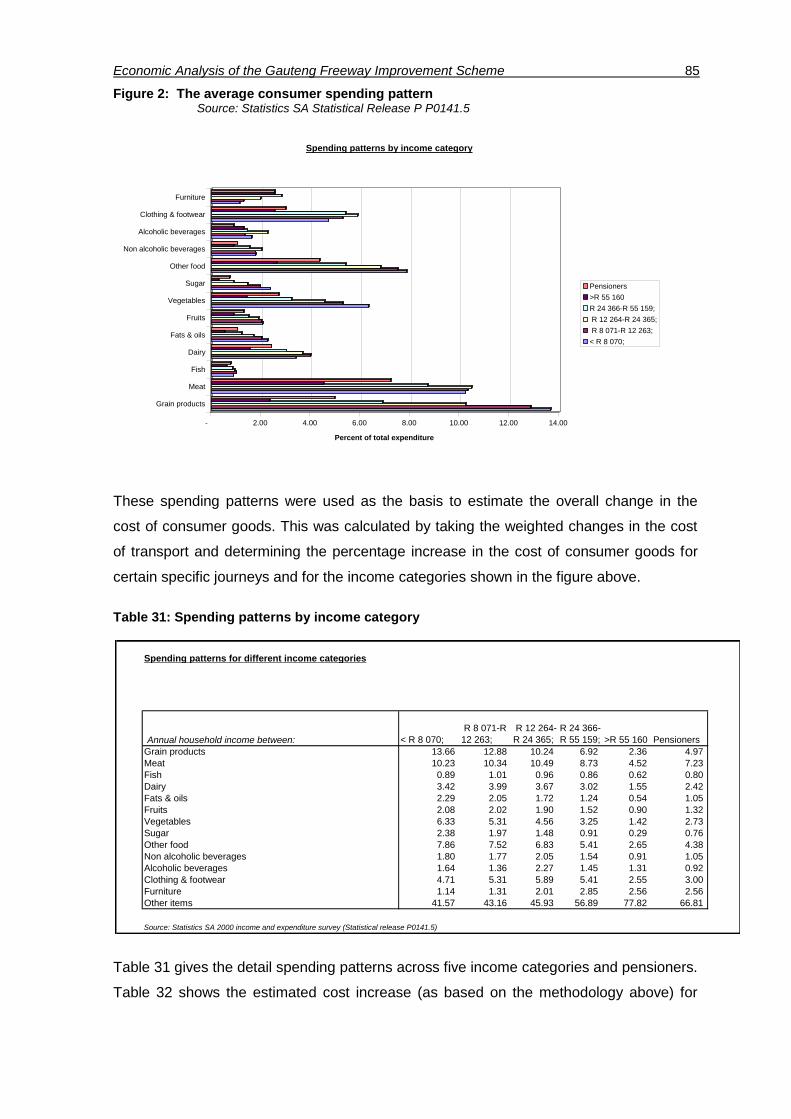
Economic Analysis of the Gauteng Freeway Improvement Scheme 85
Figure 2: The average consumer spending pattern Source: Statistics SA Statistical Release P P0141.5
These spending patterns were used as the basis to estimate the overall change in the
cost of consumer goods. This was calculated by taking the weighted changes in the cost
of transport and determining the percentage increase in the cost of consumer goods for
certain specific journeys and for the income categories shown in the figure above.
Table 31: Spending patterns by income category
Table 31 gives the detail spending patterns across five income categories and pensioners.
Table 32 shows the estimated cost increase (as based on the methodology above) for
- 2.00 4.00 6.00 8.00 10.00 12.00 14.00
Percent of total expenditure
Grain products
Meat
Fish
Dairy
Fats & oils
Fruits
Vegetables
Sugar
Other food
Non alcoholic beverages
Alcoholic beverages
Clothing & footwear
Furniture
Spending patterns by income category
Pensioners
>R 55 160
R 24 366-R 55 159;
R 12 264-R 24 365;
R 8 071-R 12 263;
< R 8 070;
Spending patterns for different income categories
Annual household income between: < R 8 070;
R 8 071-R
12 263;
R 12 264-
R 24 365;
R 24 366-
R 55 159; >R 55 160 Pensioners
Grain products 13.66 12.88 10.24 6.92 2.36 4.97
Meat 10.23 10.34 10.49 8.73 4.52 7.23
Fish 0.89 1.01 0.96 0.86 0.62 0.80
Dairy 3.42 3.99 3.67 3.02 1.55 2.42
Fats & oils 2.29 2.05 1.72 1.24 0.54 1.05
Fruits 2.08 2.02 1.90 1.52 0.90 1.32
Vegetables 6.33 5.31 4.56 3.25 1.42 2.73
Sugar 2.38 1.97 1.48 0.91 0.29 0.76
Other food 7.86 7.52 6.83 5.41 2.65 4.38
Non alcoholic beverages 1.80 1.77 2.05 1.54 0.91 1.05
Alcoholic beverages 1.64 1.36 2.27 1.45 1.31 0.92
Clothing & footwear 4.71 5.31 5.89 5.41 2.55 3.00
Furniture 1.14 1.31 2.01 2.85 2.56 2.56
Other items 41.57 43.16 45.93 56.89 77.82 66.81
Source: Statistics SA 2000 income and expenditure survey (Statistical release P0141.5)
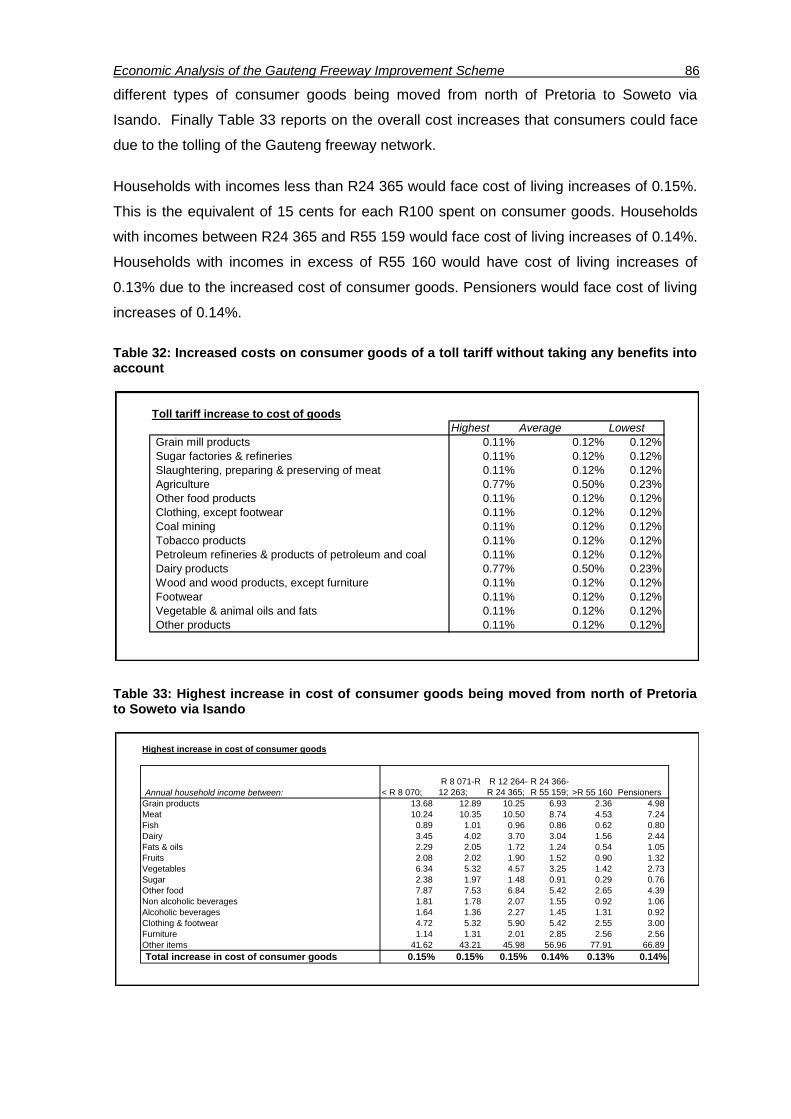
Economic Analysis of the Gauteng Freeway Improvement Scheme 86
different types of consumer goods being moved from north of Pretoria to Soweto via
Isando. Finally Table 33 reports on the overall cost increases that consumers could face
due to the tolling of the Gauteng freeway network.
Households with incomes less than R24 365 would face cost of living increases of 0.15%.
This is the equivalent of 15 cents for each R100 spent on consumer goods. Households
with incomes between R24 365 and R55 159 would face cost of living increases of 0.14%.
Households with incomes in excess of R55 160 would have cost of living increases of
0.13% due to the increased cost of consumer goods. Pensioners would face cost of living
increases of 0.14%.
Table 32: Increased costs on consumer goods of a toll tariff without taking any benefits into account
Table 33: Highest increase in cost of consumer goods being moved from north of Pretoria to Soweto via Isando
Toll tariff increase to cost of goods
Highest Average Lowest
Grain mill products 0.11% 0.12% 0.12%
Sugar factories & refineries 0.11% 0.12% 0.12%
Slaughtering, preparing & preserving of meat 0.11% 0.12% 0.12%
Agriculture 0.77% 0.50% 0.23%
Other food products 0.11% 0.12% 0.12%
Clothing, except footwear 0.11% 0.12% 0.12%
Coal mining 0.11% 0.12% 0.12%
Tobacco products 0.11% 0.12% 0.12%
Petroleum refineries & products of petroleum and coal 0.11% 0.12% 0.12%
Dairy products 0.77% 0.50% 0.23%
Wood and wood products, except furniture 0.11% 0.12% 0.12%
Footwear 0.11% 0.12% 0.12%
Vegetable & animal oils and fats 0.11% 0.12% 0.12%
Other products 0.11% 0.12% 0.12%
Highest increase in cost of consumer goods
Annual household income between: < R 8 070;
R 8 071-R
12 263;
R 12 264-
R 24 365;
R 24 366-
R 55 159; >R 55 160 Pensioners
Grain products 13.68 12.89 10.25 6.93 2.36 4.98
Meat 10.24 10.35 10.50 8.74 4.53 7.24
Fish 0.89 1.01 0.96 0.86 0.62 0.80
Dairy 3.45 4.02 3.70 3.04 1.56 2.44
Fats & oils 2.29 2.05 1.72 1.24 0.54 1.05
Fruits 2.08 2.02 1.90 1.52 0.90 1.32
Vegetables 6.34 5.32 4.57 3.25 1.42 2.73
Sugar 2.38 1.97 1.48 0.91 0.29 0.76
Other food 7.87 7.53 6.84 5.42 2.65 4.39
Non alcoholic beverages 1.81 1.78 2.07 1.55 0.92 1.06
Alcoholic beverages 1.64 1.36 2.27 1.45 1.31 0.92
Clothing & footwear 4.72 5.32 5.90 5.42 2.55 3.00
Furniture 1.14 1.31 2.01 2.85 2.56 2.56
Other items 41.62 43.21 45.98 56.96 77.91 66.89
Total increase in cost of consumer goods 0.15% 0.15% 0.15% 0.14% 0.13% 0.14%
Economic Analysis of the Gauteng Freeway Improvement Scheme 87
In drawing the conclusions above it is important to appreciate the findings in the light of
the limitations of the methodology. These are repeated below.
All road user benefits from the project are ignored. In other words the exercise is
undertaken as if the existing roads were simply tolled without rehabilitation or
capacity upgrades. This would overstate the size of the impact on the cost of
consumer goods.
The analysis ignores that some consumer goods would not be affected by tolls
because they are not moved on the freeway system. This would overstate the size
of the impact on the cost of consumer goods.
It is assumed that all toll tariffs are passed on to the final consumer. Some of the
cost increases could be absorbed by the producer either because of the known
resistance of major supermarket chains to cost increases or because of
competition from products that are either imported or from other areas not affected
by tolling. This would overstate the size of the impact on the cost of consumer
goods.
The toll tariff on the return journey has also been included because the vehicle
may, for example, be travelling back empty or carrying farm supplies back to the
farm. This would overstate the size of the impact on the cost of consumer goods if
the return vehicle is carrying goods destined for sale out of the province.
The analysis does not take into account other possible cost increases like the
increased cost of staff being transported to work, the travel costs of sales
representatives or other deliveries that may be subjected to paying tolls. This
would understate the size of the impact on the cost of consumer goods.
The exercise was done for a depot located at Isando. Cost could be different for
different locations.
The overall conclusion which is drawn from this analysis is that the project probably would
increase the cost of consumer goods but having tested the highest limit of this increase
the effect would be very small indeed.

Economic Analysis of the Gauteng Freeway Improvement Scheme 88
9 Macroeconomic Impacts
While there are a number of different types of macroeconomic effects, the two most
important are contribution to gross domestic product (GDP) and creation of jobs. The
importance of job creation is obvious. Increases in GDP are synonymous with increases in
peoples‟ economic standards of living. Increased GDP – i.e. increased production – is
experienced in the form of more jobs, higher wages and reduced economic hardship. It is
clearly an important measure.
The actual task of calculating the macroeconomic impact of the project is described in
detail in Section 4. The macroeconomic results that are reported here are for the 50c per
km equivalent toll tariff only.
9.1 Capacity increases and lower transport costs
There are a number of potential changes in transport costs as a result of the proposed toll
roads. There are likely to be lower road user costs to users of the existing roads even
after tolling compared to the „do minimum‟ alternative. In addition to this there are likely to
be reduced costs on the road transport system generally as the increased capacity of the
toll roads would result in reduced congestion on the road network. Of course in some
instances there could be increased network costs should the tolling of the roads result in
local diversion of traffic on to secondary roads.
9.2 Contribution to Gross Domestic Product
Gross Domestic Product is the total value of all final goods and services produced in the
country. It is clearly fundamental to the economic quality of life of people in the country. It
is also the most important and all encompassing measure of the macroeconomic effect of
the proposed toll road. Table 34 reports on the contribution to GDP and the composition
of this change. The table presents values for each year from 2008 to 2015 and then in
five yearly intervals thereafter.
Table 34: Contribution to Gross Domestic Product
Contribution to Gross Domestic Product - South Africa
Rand million, 2010 prices
Financial Year 2008 2009 2010 2011 2012 2013 2014 2015 2020 2025 2030
Initial Capital Expenditure 7,422 9,914 10,987 2,163 194 73
Road Rehab and Maintenance 0 160 160 160 160 160 1,582 160 4,427
ORT Related Costs 610 2,424 1,658 1,671 1,686 1,702 1,805 2,061 1,902
Business Time Savings 3,270 3,542 3,856 4,224 4,662 5,469 4,465 7,685
Total Contribution 7,422 9,914 11,597 8,018 5,554 5,760 6,070 6,524 8,856 6,686 14,014
Cumulative Contribution 7,422 17,336 28,933 36,950 42,504 48,264 54,334 60,858 101,482 140,510 192,363

Economic Analysis of the Gauteng Freeway Improvement Scheme 89
The initial capital expenditure on upgrading the existing roads as well as constructing new
roads was estimated to contribute as much as R7.4bn in 2008, R9.9bn in 2009 and
11.0bn in 2010. The contribution due to the initial capital expenditure is then expected to
reduce to R2.2bn in 2011 and R194m in 2012 as the construction tapers off.
The contribution from routine road maintenance is expected to contribute at least R160m
to GDP, while rehabilitation and periodic maintenance is expected to add further to GDP
in each of 2019, 2020, 2021, 2029 & 2030. The contribution to GDP from ORT related
maintenance and operating costs is expected to increase from R610m in 2010 to R1.9bn
in 2030.
Once the toll roads are operational it is really the business time savings that contribute the
most to GDP. This contribution to GDP is expected to increase from R3.27bn in 2010 to
R7.69bn in 2030. These contributions are illustrated in Figure 3, where the relative
contributions of the initial capital works and the dominance of the business time savings
are clearly shown.
Figure 3: Detailed Contribution to GDP
GDP is important not just because it is income but also because income has the capacity
to add to wealth. Based on these projections, the proposed toll road would have made a
cumulative contribution to GDP of nearly R50bn by 2013, the projected end of
construction. This cumulative total increases to over R207bn by the end of 2030.
0
2,000
4,000
6,000
8,000
10,000
12,000
14,000
16,000
2008 2009 2010 2011 2012 2013 2014 2015 2016 2017 2018 2019 2020 2021 2022 2023 2024 2025 2026 2027 2028 2029 2030
Co
ntr
ibu
tio
n t
o G
DP
(R m
illi
on
s)
Initial Capital Expenditure Road Rehab and Maintenance ORT Related Costs Business Time Savings

Economic Analysis of the Gauteng Freeway Improvement Scheme 90
Table 35 indicates the relative contribution that the proposed toll roads would make to the
national economy.
Table 35: Relative contribution to the national economy
In comparative terms it is estimated that the proposed toll road project in Gauteng added
0.32% to South African GDP in 2008 and 0.41% in 2009. It is estimated that the project
has the capacity to add 0.44% to GDP in 2010. This contribution is then expected to drop
from the start of the operations phase. From 2013 the project is still expected to add
0.06% to GDP, increasing to 0.11% in 2030.
9.3 Contribution to Gross Geographic Product
Gross Geographic Product (GGP) is the provincial equivalent of national GDP. Naturally
while many of the direct effects would be felt within the province there would be indirect
effects on other provinces. The project contribution to provincial GGP is reported in Table
36 below.
Table 36: Contribution to Gross Domestic Product
After taking account of all multiplier effects it is estimated that the project would make a
total contribution to Gauteng GGP of R3.3bn in 2008, R4.4bn in 2009 and R5.1bn in 2010.
By 2030 the project would add R8.1bn to GGP. Based on these projections, the project
would have added a cumulative R112.7bn to provincial GGP by 2030.
The Contribution of the Proposed Toll Roads to GDP
Excludes Road User Cost Savings
2008 2009 2010 2011 2012 2013 2014 2015 2020 2025 2030
South African GDP (Rbn) 2,284 2,408 2,648 2,754 2,865 2,979 3,098 3,222 3,920 4,770 5,803
Toll Road Contribution (R bn) 7.4 9.9 11.6 4.7 2.0 1.9 1.8 1.9 3.4 2.2 6.3
% Contribution by Toll Roads 0.32% 0.41% 0.44% 0.17% 0.07% 0.06% 0.06% 0.06% 0.09% 0.05% 0.11%
Assumptions:
1. South African GDP (2008 & 2009) - Source: Statistics South Africa
2. Nominal GDP between 2009 and 2010 increased by 10%
3. Real GDP growth per annum thereafter taken as 4%
Contribution to Gross Geographic Product - South Africa
Rand million, 2010 prices
Financial Year 2008 2009 2010 2011 2012 2013 2014 2015 2020 2025 2030
Initial Capital Expenditure 3,281 4,377 4,792 944 85 32
Road Rehab and Maintenance 0 68 68 68 68 68 669 68 1,872
ORT Related Costs 355 1,407 962 969 978 987 1,043 1,161 1,103
Business Time Savings 2,173 2,353 2,562 2,807 3,097 3,634 2,967 5,107
Total Contribution 3,281 4,377 5,147 4,592 3,467 3,631 3,852 4,152 5,346 4,195 8,082
Cumulative Contribution 3,281 7,658 12,805 17,397 20,864 24,495 28,347 32,499 57,338 81,819 112,745

Economic Analysis of the Gauteng Freeway Improvement Scheme 91
9.4 Job Creation
The proposed toll road would result in changes to three types of jobs. The first are the
direct jobs that would be created over the project period. These are jobs directly on road
construction and operation of the toll road. The second are the so-called indirect jobs that
are due to multiplier effects of both the proposed toll roads as well as from changes in
transport costs and road user costs. The third type of change in jobs results from the
structural economic changes attributable to the proposed toll road. There can be job
increases because the upgrading of the toll roads results in greater business and
commercial opportunities and more employment. There can be job losses or job
relocations as a toll road impacts, for example, on a captive industrial area and reduces
the customer base.
Table 37 reports on the direct job creation, Table 39 on the indirect jobs that are created
as a result of the project, while Table 40 is a sum of the direct and indirect job creation.
Table 37: Direct job creation
Table 37 indicates that during the height of the construction period in 2010 as many as
15,957 people were directly employed as a result of the project. This number is expected
to taper off as construction activities come to an end in 2013. From 2012 onwards it is
expected that over 1,100 people would be directly employed on either maintaining the
road or maintaining and operating the toll system. The number of jobs created from
business time savings is expected to increase from 3 341 in 2011 to 7 851 in 2030, in line
with the increased savings as the traffic numbers increase.
Table 38: Composition of direct jobs
Table 38 lists the composition of the direct construction jobs in 2008 to 2013. It can be
seen from the table that the majority of the direct jobs created during the construction
Contribution to Direct Jobs - Gauteng
Financial Year 2008 2009 2010 2011 2012 2013 2014 2015 2020 2025 2030
Initial Capital Expenditure 10,477 14,051 15,579 3,041 272 103
Road Rehab and Maintenance 0 102 102 102 102 102 1,013 102 2,833
ORT Related Costs 378 1,505 1,030 1,037 1,047 1,057 1,121 1,281 1,180
Business Time Savings 3,341 3,618 3,939 4,315 4,762 5,586 4,561 7,851
Total Contribution 10,477 14,051 15,957 7,989 5,022 5,182 5,464 5,921 7,719 5,944 11,864
Job Category 2008 2009 2010 2011 2012 2013
Low Skilled 9,217 12,386 13,940 2,716 243 92
Medium Skilled 1,086 1,433 1,384 274 25 9
High Skilled 174 232 255 50 5 2
Total Jobs 10,477 14,051 15,579 3,041 272 103

Economic Analysis of the Gauteng Freeway Improvement Scheme 92
period are created at the low skilled level (and by implication thus the low income level),
thus having the ability to contribute significantly to poverty alleviation.
The estimation of indirect jobs is not necessarily an uncontentious issue. The estimates
are based on the official South African input output tables which show quite generous
estimates for indirect jobs. In the light of the historic „jobless‟ economic growth that this
country has had and in light of the job losses incurred during the recession we have
tended to downplay indirect job estimates. Therefore the indirect job estimates that are
reported below are based on 25% of the multiplier estimates, but should be treated as the
lower bound of these estimates.
Table 39: Indirect job creation
Table 39 illustrates the potential indirect job creation. During the construction period
between 2008 and 2013 it is estimated that as many as 21 394 indirect jobs have been or
would be created throughout South Africa. These indirect jobs are then expected to taper
off to around 8 700 in 2012 before increasing again to 14 323 in 2020 and 23 263 in 2030.
Table 40: Total (direct plus indirect) job creation
Total direct and indirect jobs, as illustrated in Table 40, are expected to have amounted to
23 499 in 2008, 31 552 in 2009 and 37 351 in 2010. It is expected that 13 734 direct and
indirect jobs would be created in 2012, increasing to 35 128 by 2030.
9.5 Other macroeconomic effects
Apart from the key macroeconomic effects discussed above, there are many other
macroeconomic effects that would flow from the construction, upgrading and operation of
the proposed toll roads. These include the generation of income tax, company tax and
indirect household income. Table 41 reports on total income tax that would be generated
and Table 42 on the indirect generation of household income.
Contribution to Indirect Jobs - South Africa
Rand million, 2010 prices
Financial Year 2008 2009 2010 2011 2012 2013 2014 2015 2020 2025 2030
Initial Capital Expenditure 13,022 17,500 20,580 4,038 362 137
Road Rehab and Maintenance 0 291 291 291 291 291 2,876 291 8,047
ORT Related Costs 813 3,244 2,220 2,237 2,258 2,279 2,431 2,896 2,545
Business Time Savings 5,391 5,839 6,357 6,964 7,686 9,016 7,361 12,671
Total Contribution 13,022 17,500 21,394 12,964 8,712 9,022 9,513 10,256 14,323 10,548 23,263
Contribution to Total Jobs - South Africa
Rand million, 2010 prices
Financial Year 2008 2009 2010 2011 2012 2013 2014 2015 2020 2025 2030
Initial Capital Expenditure 23,499 31,552 36,160 7,079 634 240
Road Rehab and Maintenance 0 393 393 393 393 393 3,889 393 10,880
ORT Related Costs 1,191 4,748 3,250 3,274 3,305 3,336 3,551 4,177 3,725
Business Time Savings 8,732 9,457 10,295 11,279 12,447 14,602 11,922 20,522
Total Contribution 23,499 31,552 37,351 20,953 13,734 14,203 14,977 16,177 22,043 16,492 35,128
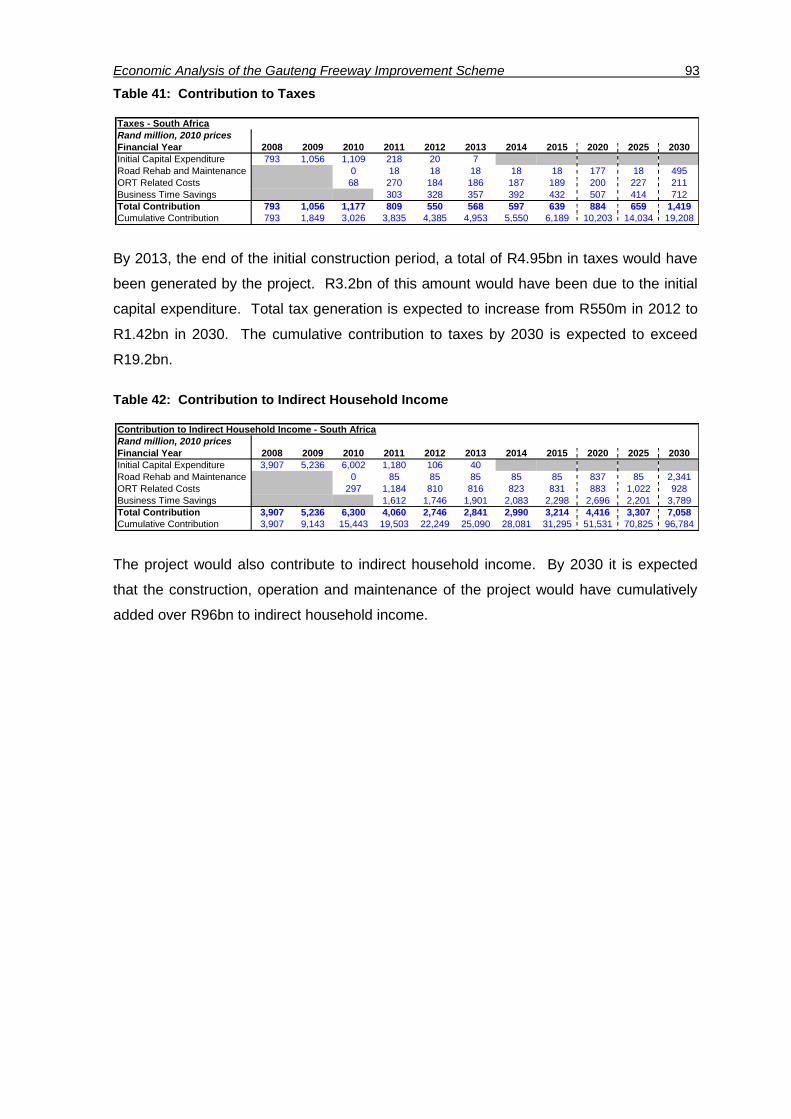
Economic Analysis of the Gauteng Freeway Improvement Scheme 93
Table 41: Contribution to Taxes
By 2013, the end of the initial construction period, a total of R4.95bn in taxes would have
been generated by the project. R3.2bn of this amount would have been due to the initial
capital expenditure. Total tax generation is expected to increase from R550m in 2012 to
R1.42bn in 2030. The cumulative contribution to taxes by 2030 is expected to exceed
R19.2bn.
Table 42: Contribution to Indirect Household Income
The project would also contribute to indirect household income. By 2030 it is expected
that the construction, operation and maintenance of the project would have cumulatively
added over R96bn to indirect household income.
Taxes - South Africa
Rand million, 2010 prices
Financial Year 2008 2009 2010 2011 2012 2013 2014 2015 2020 2025 2030
Initial Capital Expenditure 793 1,056 1,109 218 20 7
Road Rehab and Maintenance 0 18 18 18 18 18 177 18 495
ORT Related Costs 68 270 184 186 187 189 200 227 211
Business Time Savings 303 328 357 392 432 507 414 712
Total Contribution 793 1,056 1,177 809 550 568 597 639 884 659 1,419
Cumulative Contribution 793 1,849 3,026 3,835 4,385 4,953 5,550 6,189 10,203 14,034 19,208
Contribution to Indirect Household Income - South Africa
Rand million, 2010 prices
Financial Year 2008 2009 2010 2011 2012 2013 2014 2015 2020 2025 2030
Initial Capital Expenditure 3,907 5,236 6,002 1,180 106 40
Road Rehab and Maintenance 0 85 85 85 85 85 837 85 2,341
ORT Related Costs 297 1,184 810 816 823 831 883 1,022 928
Business Time Savings 1,612 1,746 1,901 2,083 2,298 2,696 2,201 3,789
Total Contribution 3,907 5,236 6,300 4,060 2,746 2,841 2,990 3,214 4,416 3,307 7,058
Cumulative Contribution 3,907 9,143 15,443 19,503 22,249 25,090 28,081 31,295 51,531 70,825 96,784
Economic Analysis of the Gauteng Freeway Improvement Scheme 94
10 Conclusion
One of the potential key constraints to economic growth in Gauteng is an inadequate
transport network. As part of the solution to this problem the Provincial Government of
Gauteng and the South African National Roads Agency (Pty) Ltd (SANRAL) have mde
significant improvements to the freeway network in the province and wish to understand
the economic implications of upgrading the existing Gauteng freeway network, adding
capacity and tolling the entire network.
One of the key issues is how to pay for the rehabilitation and upgrading. The most cost-
effective way to pay for this rehabilitation and upgrading is through a combination of fuel
tax and special levies for heavy vehicles. The special levies are necessary because, while
heavy vehicles do the most damage to roads, these damages are not fully recovered in
the fuel tax. The major constraint on the effective implementation of such a scheme is the
financial policy on the part of government that fiscal integrity means that there should be
no earmarking of funds. Hence all revenues raised, including the fuel tax, go into a
common revenue fund and expenditures are made from this fund.
The political reality of extensive poverty and hardship in the country, as well as the need
to address these issues have resulted in budgetary allocations in favour of poverty
alleviation, etc, and at the expense of other areas of expenditure – like road maintenance.
In consequence while tolling is a second best way of paying for roads, political realities
suggest that it is the likely option.
Clearly there is a trade off between equity and efficiency. The least cost way of funding
any road project is through a fuel tax. This avoids all of the costs associated with tolling. It
is however not necessarily equitable because all users of fuel would be paying for the
project and might not necessarily benefit from the project. In the study an estimate was
made of the cost of tolling. It has been calculated that the actual cost of the toll
infrastructure adds, on average 8.5 cents per vehicle kilometre for the upgrade option.
This is the cost that would be incurred to pay for improved equity.
The first type of economic analysis reported on is the cost benefit analysis. The costs
included in the analysis were construction, maintenance and operating costs of the roads
and toll collection infrastructure; road user costs; the cost to the road users of diverting off
the toll roads; and the cost to the provincial and local authorities for road damage caused
by traffic diversion as well as the cost of diversion if the roads are not upgraded.
Economic CBAs are reported for the upgrade option over a twenty year period where the
Economic Analysis of the Gauteng Freeway Improvement Scheme 95
economic analysis shows the benefits to society at large. The results are given for various
tolling rates, namely 0c per km (i.e. no tolling), 30c, 40c, 50c, 60c and 70c per km for light
vehicles.
Total costs increase from a Present Value (PV) of R17.5bn for a 0c per km toll to R29.8bn
for a 70c per km toll. While the costs increase as the tolling rate increases, benefits on
the other hand generally show a decrease. The benefits, as characterised by road user
cost savings when compared to the “Do nothing” case, decrease from a PV of R244.8bn
for 0c per km to R239.6bn for 70c per km.
All three of the measures, Benefit Cost Ratios (BCR), internal rate of return (IRR) and Net
Present Value (NPV), indicate that the upgrading of the Gauteng freeway network was
based on sound economic logic. Table ES.2 illustrates these values for a toll rate of 50c
per km. At this toll the scheme is set to return society a positive net present value of
R209bn over the next 20 years. It has an internal rate of return of 37% which, in itself, is a
remarkable high IRR. Finally, and probably most importantly it returns a benefit cost ratio
of 8.4. This means that for each one rand of cost, initial capital works and ongoing
maintenance and running costs, society benefits by R8.4.
The BCRs for all toll tariffs are above 8.0, indicating that the project is, from an economic
perspective, beneficial to society. The BCR reduces from 14.0 for the 0c per km tolling
rate to 8.4 for 30c, 8.3 for 40c, 8.4 for 50c, 8.1 for 60c and 8.0 for 70c. The effect of tolling
on the upgraded road network is therefore to reduce the BCR from 14.0 to between 8.0
and 8.4, depending on which tolling rate is chosen.
The Net Benefits or NPV, which is the difference between the benefits and the costs, are
all positive and vary between R209.8bn for a 70c per km tolling rate to R227.3bn for a 0c
per km tolling rate. The IRR‟s for all the tolling options are 37%, while for the non-tolling
option is 41%.
The cost benefit analysis was taken further and a series of individual journeys were
analysed. It was found that, apart from a few important exceptions, most users of the toll
roads during weekdays would have positive road user benefits. Further to this, it was also
found that in aggregate the toll roads generate overall road user benefits that are greater
than road user costs. Simply put this means that road user benefits would be greater by
driving on the upgraded toll road and paying the toll than on the existing roads and not
paying a toll. This is due to decreased congestion; faster travelling times; lower road user
costs and less probability of accidents.

Economic Analysis of the Gauteng Freeway Improvement Scheme 96
Three sets of road user journeys were analysed. These are those journeys when no
tolling is charged on the entire network; the journeys on those sections of road where a
toll tariff would be levied and; the journeys on those sections of freeway which are not
tolled within the context where most of the network is tolled.
Journeys when there is no tolling on the entire network: For the majority of journeys and
road users there are only benefits although there are some exceptions. These exceptions
are caused by additional traffic that is attracted onto the freeway network because of the
road upgrades and are:
On the M3, Buccleuch to the M2 Geldenhuys Interchange
o PM peak hour in the southerly direction, for all light vehicles from 2014 to
2020;
o Midday off-peak in the southerly direction, for all vehicles in 2025;
o AM peak hour in the northerly direction, for all light vehicles from 2020
onwards;
o PM peak hour in the northerly direction, for all light vehicles from 2020
onwards;
o Midday off-peak in the northerly direction, for light vehicle business
travellers in 2025.
On the R24, from OR Tambo International Airport to the N12:
o AM peak traffic in the westerly direction, for all light vehicles from 2020
onwards and for heavy vehicles in 2025;
o PM peak traffic in the westerly direction, for all light vehicles from 2020
onwards;
o Midday off-peak traffic in the westerly direction, for all light vehicles and
class 2 heavy vehicles in 2025.
On the N1, from 14th Avenue to Grasmere:
o PM peak traffic in the southerly direction, for light vehicle business
travellers in 2025;
o AM peak traffic in the northerly direction, for all light vehicles in 2025.
On the N1, from Brakfontein to Buccleuch:

Economic Analysis of the Gauteng Freeway Improvement Scheme 97
o PM peak traffic in the northerly direction, for light vehicle business
travellers in 2020 to 2025;
o Midday off-peak traffic in the northerly direction, for light vehicle business
travellers in 2025.
On the R80 from Suiderberg to DF Malan:
o PM peak hour traffic in a northerly / westerly direction, all light vehicles in
2025.
Journeys on those sections of freeway that would be tolled:
On the whole people travelling during the morning and afternoon peak hours and
midday off peak times generally have lower costs. This changes for people
travelling in the evening and on weekends and they would find that their cost of
travelling has increased relative to the do-minimum option.
During the morning and afternoon peak hours there are two roads where road
users would generally have higher costs. These are on the N3 travelling between
Buccleuch and the M2 Geldenhuys interchange in both directions and on the N1
when travelling between Brakfontein to Buccleuch in the northerly direction during
the afternoon peak. An analysis of N3: Buccleuch to M2 Geldenhuys interchange
indicates increased traffic (an hence lower travelling speeds) on the Buccleuch –
Marlboro link, Marlboro - London Rd link and the Linksfield – Gillooly‟s link. A
similar analysis of the N1: Buccleuch to Brakfontein road section indicates higher
traffic volumes (and hence lower speeds) on the Buccleuch – Woodmead and
Samrand – Olifantsfontein links (in the northern direction).
For people travelling during the weekday off peak period most road users would
face reduced costs, except for the isolated case of heavy vehicles on the N3:
Buccleuch to M2 Geldenhuys interchange at an equivalent toll tariff of 70c per km.
Most of the people travelling during the evening or on weekends would have
higher costs at the toll equivalent of 40c and above. At a toll equivalent of 30c per
km there are more road users with lower costs than higher costs at these times.
Journeys on those sections of the freeway which are not tolled within the context where
most of the network is tolled: It is only in certain isolated instances in morning and
afternoon peak hour and midday off peak that people have increased costs. These costs
are confined mainly to light vehicles and to the R24: OR Tambo International Airport to

Economic Analysis of the Gauteng Freeway Improvement Scheme 98
the N12, the R80 between Soshanguve and Suiderberg, and between Suiderberg and DF
Malan roads. There are also some isolated incidents of increased costs for light vehicle
users travelling in an easterly direction on the N4 between Proefplaas and Donkerhoek
road. There are reduced costs for all road users travelling during the evening and over
weekends.
It was also found that road user benefits accrue more than proportionately to heavy
vehicles rather than light vehicles. As the class of vehicle increases so does the increased
benefit.
The second type of analysis that was undertaken was a microeconomic analysis. This
includes issues of affordability, impacts on individual drivers and their capacity to pay;
impacts on the cost of consumer goods; impacts on business generally and impacts on
specific business.
There is always some concern about the ability of society to carry the cost of major
infrastructural projects like the Gauteng freeway upgrade. Two estimates were made to
assess this issue. The first is the share of total toll revenue to that of the size of the
Gauteng economy. The second is the share of tolling relative to people‟s disposable
income. The analysis found that total toll revenue is expected to be 0.34% of projected
Gauteng GDP in 2011. In other words the toll burden from the freeway upgrade is the
equivalent of 34c for each R100 of GDP. It was also found that, in the same year, total toll
revenue is expected to be 0.43% of projected Gauteng household gross disposable
income in 2011. In other words the toll burden for light vehicles from the freeway upgrade
is the equivalent of 43c for each R100 of disposable income.
For private road users it can be argued that, for some people, there would not be an
obvious saving in vehicle operating costs in the early years of the toll road. It is recognised
that savings in some vehicle costs would be obvious and apparent – fuel costs, time costs
and lower accident rates, for example. Other costs, however, are far less discrete over
time and tend to be lump sum costs after a period of time – tyre costs, suspension and
steering repairs, etc. Hence the immediate and obvious saving in vehicle operating costs
would be for fuel, time and, possibly, accident costs. Other costs would accumulate in the
future. Hence the reality would be that savings would only be realised some years into the
future.
Therefore for cash flow purposes there would be less road user benefits in the early years
of the tolled roads, as these benefits would accumulate into the future. The perception and
reality would be that some drivers who currently do and would continue to use the road on
Economic Analysis of the Gauteng Freeway Improvement Scheme 99
a regular basis could be vulnerable to the proposed tolling. In addition less affluent owners
of private vehicles may face road user costs that are different to those used in the general
calculations. In particular, less affluent people would have lower time costs than others. In
addition such people may choose to repair their vehicles themselves or may choose
simply not to repair their vehicles at all.
The analysis was based on a set of interviews conducted in 2009 that focussed on class 1
vehicles using the freeways. This was a telephonic interview, based on the registration
numbers of vehicles using the freeways. Over 27 000 people were interviewed. The
following conclusions were made:
The majority of trips being made in light vehicles were done for either business or
commuting purposes.
It was found that 20% of people make monthly journeys on the freeway system of
less than 200km. Of the journeys made 51% of people travel 700km or less on the
Gauteng freeways. Conversely there are a number of people who make extensive
monthly journeys on the Gauteng freeways. Of the total number of people
interviewed 2% drive more than 2 500km a month, 5% drive between 2 000km and
2 500km, 9% drive between 1 600km and 1 999km a month and 33% drive
between 700km and 1 600km a month.
An analysis was undertaken purely on people who commute to work. This was done
because it was felt that these are the type of journey where people might be most
vulnerable to tolling because it is a journey where one has little choice in making the
journey. This was further corrected by removing anyone who had a company car
allowance; was driving on a Sunday; and had more than one occupant in the car. There is
no science in choosing such a number and the higher people‟s income the higher this
value could be because of their greater amount of discretionary income. For the purposes
of this analysis a value of tolls being equal or higher than 3%, 5% and 10% of income
were chosen. The following conclusions were drawn:
40% of the sample is expected to pay toll fees of less that R200 a month.
50% of commuters declaring an income of less than R4 999 a month are expected
to pay less than R200 a month in tolls. This is however in excess of 3% of monthly
income for these people.
18.9% of commuters are expected to pay tolls of between R200 and R400 a
month. This is 327 people in the sample of which 19 will be paying tolls greater

Economic Analysis of the Gauteng Freeway Improvement Scheme 100
than 3% of their income and 2 will be paying tolls greater than 10% of their
income.
15% of commuters are expected to pay tolls of between R400 and R600 a month.
This is 265 people in the sample of which 32 people will be paying tolls greater
than 3% of their income, 19 will be paying tolls greater than 5% of their income
and 2 will be paying tolls in excess of 10% of their incomes. However in the latter
case these two drivers have declared that the cost of their travel on Gauteng
highways exceeds 50% of their income.
11.5% of people are expected to pay tolls of between R600 and R800 a month.
This is 199 commuters in the sample of which 89 people will be paying tolls
greater than 3% of their income, 38 will be paying tolls greater than 5% of their
income and 4 will be paying tolls in excess of 10% of their incomes.
8.2% of people are expected to pay tolls of between R800 and R1 000 a month.
This is 141 commuters in the sample of which 42 people will be paying tolls
greater than 3% of their income, 58 will be paying tolls greater than 5% of their
income and 4 will be paying tolls in excess of 10% of their incomes.
4.9% of people are expected to pay tolls of between R1 000 and R1 300 a month.
This is 84 commuters in the sample of which 9 people will be paying tolls greater
than 3% of their income, 44 will be paying tolls greater than 5% of their income
and 5 will be paying tolls in excess of 10% of their incomes. Of the latter 5 there
are 2 people who have declared travel costs as being in excess of 50% of their
declared income.
1% of people are expected to pay tolls of between R1 300 and R1 600 a month.
This is 18 commuters in the sample of which 3 people will be paying tolls greater
than 3% of their income, 9 will be paying tolls greater than 5% of their income and
6 will be paying tolls in excess of 10% of their incomes.
Of the total sample of 1 728 commuters there is the possibility that, based on the
survey:
o 390 people would be paying tolls equal to or greater than 3% of their
income. This is the equivalent of 22% of the sample;
o 191 people would be paying tolls equal to or greater than 5% of their
income. This is the equivalent of 11% of the sample;
o 23 people would be paying tolls equal to or greater than 10% of their
income. This is the equivalent of 1.3% of the sample. However of this
group 7 have travel costs that exceed 50% of their income.

Economic Analysis of the Gauteng Freeway Improvement Scheme 101
Businesses are a major stakeholder in the outcome of the freeway upgrade and
expansion schemes. Business users of the freeways typically have a higher value of time
than either commuters generally or leisure users. The time and vehicle operating cost
savings are therefore of greater importance to this group as time savings translate directly
into business productivity gains. These productivity benefits are expressions of the travel
time and operating cost savings that arise from the new capacity and resultant reduction
in network congestion.
These business benefits would be expressed typically in some of the following ways:
With reduced congestion on the network distributors of goods are able to complete
more turnarounds per day resulting in higher turnover and productivity
More business appointments can be achieved per day resulting in improved
productivity
Greater reliability/timekeeping by staff translates into business productivity gains
The Eddington Transport Study in the UK has shown that further business benefits, not
counted in the travel time and operating cost savings, may occur as businesses respond
to the fact that they now have access to larger, and possibly deeper, labour markets.
Eddington concluded that in rapidly growing urban economies these secondary
productivity gains can be very significant.
In this present study no attempt has been made to quantify these additional benefits to
business but it is should be noted that they can amount to as much as 50% more than the
sum of benefits calculated by conventional means. This implies that the cost benefit
measures referred to above could in reality be considerably higher than indicated there.
Public transport vehicles using the improved freeway network would also benefit from
travel time, vehicle operating cost and safety improvements. But, to the extent that they
also pay the tolls, their costs would rise and these may be passed on to users, increasing
the fares that they have to pay. Public transport users would be less able than private
users to balance savings in time and safety with fare levels paid and may perceive
themselves to be in a net negative position even if economic calculations show otherwise.
For lowest income users affordability would be an issue too.
Although the economic balance would be positive overall, the issue is expected to be
mitigated by lower tolls charged to public transport vehicles.

Economic Analysis of the Gauteng Freeway Improvement Scheme 102
The significance of this issue also needs to be viewed in the light of the fact that the
freeways are generally not the primary routes used by public transport vehicles. This was
revealed in recent research undertaken by Gauteng Province (Strategic Roads Network
review). Partly as a consequence of this finding, Gauteng Province embarked on a further
study to determine priorities among the routes that public transport vehicles do mainly
use, including bus and proposed Bus Rapid Transit routes.
An implication of this is that improvements to public transport road infrastructure would
primarily be addressed elsewhere than via the freeway upgrade project. Nevertheless,
the element of public transport optimisation through HOV lane provision and probable
lower toll charges, would mean that public transport would not be disadvantaged by the
scheme.
In addition to the largely positive impacts of actually the freeway network, public transport
vehicles would experience additional benefits from the decongestion of the non-freeway
routes that they typically use, as a result of the diversion of some traffic from these roads
to the new capacity on the freeways.
Captive businesses and communities: Although no quantification has been undertaken of
this concern, there would be a small number of businesses and communities where the
only practical route available may be a new tolled freeway. As a consequence, use of the
network would not be a free choice. While such groups would experience the benefit of
improved travel time, operating costs and safety, they would not be doing so by choice
and so in some cases their net benefit may be negative.
It is anticipated that the numbers of parties affected in this way would be very small and
limited to certain existing residents and businesses along the routes of the proposed new
freeways. It is only where access to a previously used route becomes barred by the
construction of the new route that this situation would apply.
Positive property market effects are not additional to the benefits measured by travel time
savings. Rather they are an expression of those savings.
Amenity losses arising from proximity to the new or expanded freeways are not taken into
account in this analysis and any mitigation that might be agreed via the social cost benefit
analysis would, strictly, need to be deducted from the total benefit recorded here. But, as
indicated, this is likely to be relatively small and not make a noticeable difference to the
overall positive result.
Economic Analysis of the Gauteng Freeway Improvement Scheme 103
The final set of microeconomic analysis relates to the potential impact of tolling on the
cost of consumer goods. This analysis was done by looking just at the cost of tolling while
ignoring all the benefits of the freeway upgrades. The conclusion was drawn that
households with incomes less than R24 365 would face cost of living increases of 0.15%.
This is the equivalent of 15 cents for each R100 spent on consumer goods. Households
with incomes between R24 365 and R55 159 would face cost of living increases of 0.14%.
Households with incomes in excess of R55 160 would have cost of living increases of
0.13% due to the increased cost of consumer goods. Pensioners would face cost of living
increases of 0.14%. It can therefore be concluded that the scheme will have little impact
on the cost of consumer goods and will not be inflationary.
The last type of analysis that was undertaken was a macroeconomic analysis. While there
are a number of different types of macroeconomic effects, the two most important are
contribution to gross domestic product (GDP) and creation of jobs. The importance of job
creation is obvious. Increases in GDP are synonymous with increases in peoples‟
economic standards of living. Increased GDP – i.e. increased production – is experienced
in the form of more jobs, higher wages and reduced economic hardship. It is clearly an
important measure.
There are a number of potential changes in transport costs as a result of the proposed toll
roads. There are likely to be lower road user costs to users of the existing roads even
after tolling compared to the „do minimum‟ alternative. In addition there are likely to be
reduced costs on the road transport system generally as the increased capacity of the toll
roads would result in reduced congestion on the road network. Of course in some
instances there could be increased network costs should the tolling of the roads result in
local diversion of traffic on to secondary roads.
Gross Domestic Product is the total value of all final goods and services produced
in the country. It is clearly fundamental to the economic quality of life of people in
the country.
o The initial capital expenditure on upgrading the existing roads as well as
constructing new roads was estimated to contribute as much as R7.4bn in
2008, R9.9bn in 2009 and 11.0bn in 2010. The contribution due to the
initial capital expenditure is then expected to reduce to R2.2bn in 2011 and
R194m in 2012 as the construction tapers off.
o The contribution from routine road maintenance is expected to contribute at
least R160m to GDP, while rehabilitation and periodic maintenance is

Economic Analysis of the Gauteng Freeway Improvement Scheme 104
expected to add further to GDP in each of 2019, 2020, 2021, 2029 & 2030.
The contribution to GDP from ORT related maintenance and operating
costs is expected to increase from R610m in 2010 to R1.9bn in 2030.
o Once the toll roads are operational it is really the business time savings
that contribute the most to GDP. This contribution to GDP is expected to
increase from R3.27bn in 2010 to R7.69bn in 2030.
o GDP is important not just because it is income but also because income
has the capacity to add to wealth. Based on these projections, the toll road
would have made a cumulative contribution to GDP of nearly R50bn by
2013, the projected end of construction. This cumulative total increases to
over R207bn by the end of 2030.
o In comparative terms it is estimated that the toll road project in Gauteng
added 0.32% to South African GDP in 2008 and 0.41% in 2009. It is
estimated that the project has the capacity to add 0.44% to GDP in 2010.
This contribution is then expected to drop from the start of the operations
phase. From 2013 the project is still expected to add 0.06% to GDP,
increasing to 0.11% in 2030.
Gross Geographic Product (GGP) is the provincial equivalent of national GDP. It is
estimated that the project would make a total contribution to Gauteng GGP of
R3.3bn in 2008, R4.4bn in 2009 and R5.1bn in 2010. By 2030 the project would
add R8.1bn to GGP. Based on these projections, the project would add a
cumulative R112.7bn to provincial GGP by 2030.
The project would result in changes to three types of jobs. The first are the direct
jobs that would be created over the project period. These are jobs directly on road
construction and operation of the toll road. The second are the so-called indirect
jobs that are due to multiplier effects of both the toll roads as well as from changes
in transport costs and road user costs. The third type of change in jobs results
from the structural economic changes attributable to the toll road. Of these jobs
only the first two can be measured with any degree of accuracy. The estimation of
indirect jobs is not necessarily an uncontentious issue. The estimates are based
on the official South African input output tables which show quite generous
estimates for indirect jobs. In the light of the historic „jobless‟ economic growth that
this country has had and in light of the recent recession we have tended to
downplay indirect job estimates. Therefore the indirect job estimates that are
reported below are based on a quarter of the multiplier estimates but should be
treated as the lower bound of these estimates.

Economic Analysis of the Gauteng Freeway Improvement Scheme 105
o At the height of the construction period in 2010 as many as 15,957 people
were directly employed as a result of the project. This number is expected
to taper off as construction activities come to an end in 2013. From 2012
onwards it is expected that over 1,100 people would be directly employed
on either maintaining the road or maintaining and operating the toll system.
The number of jobs created from business time savings is expected to
increase from 3 341 in 2011 to 7 851 in 2030, in line with the increased
savings as the traffic numbers increase. The majority of the direct jobs
created during the construction period are created at the low income level,
thus having the ability to contribute significantly to poverty alleviation.
o During the construction period between 2008 and 2013 it is estimated that
as many as 21 394 indirect jobs have been or would be created throughout
South Africa. These indirect jobs are then expected to taper off to around
8 700 in 2012 before increasing again to 14 323 in 2020 and 23 263 in
2030.
o Total direct and indirect jobs are expected to have amounted to 23 499 in
2008, 31 552 in 2009 and 37 351 in 2010. It is expected that 13 734 direct
and indirect jobs would be created in 2012, increasing to 35 128 by 2030.

Economic Analysis of the Gauteng Freeway Improvement Scheme 106
11 References
CSIR, 2007: Imperatives for a toll road freeway network for Gauteng.
SANRAL, 2006: Gauteng Transport Network Integration process: Proposal for a Gauteng
Freeway Improvement Scheme, June
StatSA 2007 http://www.statssa.gov.za/PublicationsHTML /P0277December2006
/html/P0277December2006.html
Black, P., Hartzenberg, T. & Standish, B. (2000), Economics: Principles and Practices, A
Southern African Perspective, Cape Town: Pearson Education South Africa.
Bulmer-Thomas, V. (1982). Input Output Analysis in Developing Countries. New York:
John Wiley and Sons Ltd.
Button, K. (1990). Environmental Externalities and Transport Policy. Oxford Review of
Economic Policy, Vol. 6(2
Cavelle, D. & Creightney, R. 1993. Transport and Economic Performance : A Survey of
Developing Countries. Technical Paper No. 232. Africa Technical Department Series.
Washington D.C.: World Bank.
Conningarth, (2007) Manual for Cost Benefit Analysis in South Africa
Dept. of Transport Official statement, Senior General Manager Policy, Strategy and
Implementation. Pretoria. 14 November, 1998.
Department for Transport/HM Treasury, (2006) The Eddington Transport Study –
transport’s role in sustaining the UK’s productivity and competitiveness
Engineering News 2002 SA needs to come to terms with road versus rail dilemma Vol. 21
(37): p17
Federal Highway Administration Comprehensive Truck Size and Weight Study: synthesis
of truck size and weight issues.. March 1995. Volume 2, Ch 2. p 22/23.
http://ntl.bts.gov/data/vol2-chapter2.pdf
Gannon, C. & Liu, Z. 1997. Poverty and Transport. Discussion Paper TWU-30.
Washington D.C.: World Bank

Economic Analysis of the Gauteng Freeway Improvement Scheme 107
Garber NJ and Black KA, Advanced Technologies for Improving Large Truck Safety on
Two-Lane Secondary Roads. Virginia Transportation Research Council, No FHWA/VA-95-
R17, March 1995. http://ntl.bts.gov/DOCS?435.html
Gauteng Department of Public Transport, Roads and Works (2002): Gauteng household
travel survey
Glaister, S., Starkie, D. and Thompson, D. (1990) The Assessment: Economic Policy for
Transport, Oxford Review of Economic Policy, Vol6. No.2.
Gwouldiam, K. W. (1977): The Value of Time in Economic Evaluation of Transport
Projects: lessons from Recent Research, Infrastructure notes, Transport Note No. OT-5.
The World Bank.
Hakim S. Seidenstat P. and Bowman G.W. (eds) 1996. Privatizing Transport Systems.
Praeger, Westport.
Kotler, P. (1997) Marketing Management: analysis, planning, implementation and control.
Prentice Hall
Leontief, W. (1986). Input-Output Economics. Second edition. New York: Oxford
University Press, Inc.
Miller, R.E. & Blair, P.D. (1985). Input-Output Analysis: Foundations and Extensions.
Englewood Cliffs, New Jersey: Prentice-Hall inc.
Moving South Africa - Integrated General Principles 17. Integrated General Principles Of
The Strategy. Department of Transport. Moving South Africa. GENERAL PRINCIPLES
Muller, A.P.(1992) The importance of promoting tourism and its multiplier for local
authorities. The South African Treasurer; Vol. 64, Iss 4, p.68-69, Apr, 1992.
Newbery, D. (1990) Pricing and Congestion: Economic Principles Relevant To Pricing
Roads, Oxford Review of Economic Policy, Vol6. No.2.
North, D.C. (1955) “Location Theory and Regional Economic Growth.” Journal of Political
Economy, pp 243-258.
O‟Connor, R. & Henry, E. W. (1975). Input-output analysis and its applications. London
and High Wycombe: Charles Griffin & Company Limited.
Economic Analysis of the Gauteng Freeway Improvement Scheme 108
Provincial Administration of the Western Cape (PAWC). 2006. Western Cape Provincial
Growth and Development Strategy. PAWC, Cape Town.
Sabita (1994) CB-Roads, Description of Methodologies, version 5.1, August 1994.
South Africa (Republic of), Central Statistical Services. Input-Output Tables, 1993.
Government Printers – Pretoria.
Standish, B. (2000),.The Economic Value of Incremental Employment in the South African
Construction Sector. Report prepared for the International Labour Organisation,
ILO/ASSIST, Pretoria.
Statistics SA: Final supply and use tables, 1993, Report No. 04 – 04 – 01
Statistics South Africa (SSA). 1996. Census 1996. SSA, Pretoria.
United Nations Publication (1966). Problems of Input-Output Tables and Analysis. United
Nations, New York.
Van der Merwe C.J. & Grant, M.C., 1980, A simple instrument for the assessment of road
riding quality, technical report RC/8/80, Pretoria, DRTT of CSIR.
Van Seventer, D.E.N. Decomposition of interdependencies in the South African economy.
Journal for studies in economics and econometrics; Vol. 14, Iss 3, p.53-72, Nov, 1990.
Visser, A.T, 1982, A correlation study of roughness measurements with an index obtained
from a road profile measured with rod and level, technical report RC/2/82, Pretoria, NITRR
of CSIR.

Economic Analysis of the Gauteng Freeway Improvement Scheme 109
Appendix A: Toll Tariffs
Tolled
Gantry Description Light H2 H3 H4 Distance
37 Hans Stijdom - Flying Saucer 5.87 11.75 19.09 26.43 11.745
7 New Road - Olifantsfontein 5.63 11.26 18.30 25.34 11.26
1 Lynwood - Proefplaas 5.77 11.53 18.74 25.94 11.53
3 Botha - Flying Saucer 4.72 9.43 15.32 21.22 9.43
5 Rooihuiskraal - Brakfontein 4.52 9.04 14.69 20.34 9.04
9 Rivonia - Buccleuch 4.31 8.61 13.99 19.37 8.61
11 Hans Strijdom - William Nicol 5.30 10.60 17.23 23.85 10.6
13 Metro Boulevard - Bayers Naude 4.87 9.73 15.81 21.89 9.73
15 N17 - Maraisburg 4.31 8.61 13.99 19.37 8.61
18 Marlboro - Buccleuch 3.51 7.02 11.41 15.80 7.02
20 Modderfontein - London 3.91 7.81 12.69 17.57 7.81
22 Van Buuren - Gillooly's 3.87 7.74 12.58 17.42 7.74
24 N17 - Elands 3.85 7.70 12.51 17.33 7.7
25 Grey Ave - Heidelberg Rd 3.85 7.70 12.51 17.33 7.7
29 Kliprivier - Comaro 4.99 9.98 16.22 22.46 9.98
28 Ridgeway - Diepkloof 4.99 9.98 16.22 22.46 9.98
17 Golden Highway - Old Potch 2.90 5.80 9.43 13.05 5.8
2 Rigel - Flying Saucer 5.77 11.53 18.74 25.94 11.53
4 John Vorster - Brakfontein 4.72 9.43 15.32 21.22 9.43
6 Samrand - Olifantsfontein 4.52 9.04 14.69 20.34 9.04
8 Allandale - Buccleuch 5.63 11.26 18.30 25.34 11.26
38 Irene - Flying Saucer 5.87 11.75 19.09 26.43 11.745
39 Irene - Olifantsfontein 3.11 6.23 10.12 14.01 6.225
40 Olifantsfontein - Irene 3.11 6.23 10.12 14.01 6.225
41 Bapsfontein - Olifantsfontein 7.05 14.10 22.91 31.73 14.1
42 Bapsfontein - R23 Benoni 7.05 14.10 22.91 31.73 14.1
45 Barbara Road - O R Tambo 4.36 8.72 14.17 19.62 8.72
43 Griffiths - O R Tambo 5.99 11.98 19.47 26.96 11.98
44 Griffiths - N12 Rietfontein 5.99 11.98 19.47 26.96 11.98
33 Jet Park - R21 Rietfontein 5.30 10.59 17.21 23.83 10.59
32 R24 - Gillooly's 5.30 10.59 17.21 23.83 10.59
23 Geldenhuis - Elands 3.87 7.74 12.58 17.42 7.74
21 Linksfield - Gillooly's 3.91 7.81 12.69 17.57 7.81
19 Marlboro - London 3.51 7.02 11.41 15.80 7.02
10 Rivonia - William Nicol 4.31 8.61 13.99 19.37 8.61
12 Hans Strijdom - Beyers Naude 5.30 10.60 17.23 23.85 10.6
14 Gordon - Maraisburg 4.87 9.73 15.81 21.89 9.73
16 Soweto Highway - Randshow 4.31 8.61 13.99 19.37 8.61
35 Atlas Road - Tom Jones 4.18 8.36 13.59 18.81 8.36
34 Atlas Road - Rondebult 4.18 8.36 13.59 18.81 8.36
31 Reading - Voortrekker 4.01 8.02 13.03 18.05 8.02
30 Reading - Comaro 4.01 8.02 13.03 18.05 8.02
Tariffs based on 50c per km for light vehicles

Economic Analysis of the Gauteng Freeway Improvement Scheme 110
Appendix B: Road User Savings on Specific Road Sections

Economic Analysis of the Gauteng Freeway Improvement Scheme 111
N1: Preofplaas to Brakfontein (Southbound)
Date Cl 1 C Cl 1 B Cl 1 O Cl 2 Cl 3 Cl 4 Date Cl 1 C Cl 1 B Cl 1 O Cl 2 Cl 3 Cl 4 Date Cl 1 C Cl 1 B Cl 1 O Cl 2 Cl 3 Cl 4 Date Cl 1 C Cl 1 B Cl 1 O Cl 2 Cl 3 Cl 4 Date Cl 1 C Cl 1 B Cl 1 O Cl 2 Cl 3 Cl 4
2011 26 61 27 44 53 92 2011 24 59 24 40 45 82 2011 23 58 23 37 40 75 2011 22 58 22 35 37 71 2011 20 56 20 31 30 62
2012 24 56 24 40 47 82 2012 21 53 21 35 39 72 2012 20 52 20 32 34 66 2012 19 53 19 30 30 61 2012 17 51 17 26 24 52
2013 20 49 21 35 40 72 2013 18 46 18 30 32 61 2013 17 46 17 27 28 56 2013 16 46 16 25 23 49 2013 14 44 14 21 17 41
2014 16 40 17 29 33 61 2014 14 36 14 24 25 50 2014 13 37 13 22 21 45 2014 12 37 12 19 16 37 2014 10 35 10 15 9 29
2015 12 27 12 23 27 52 2015 9 24 9 18 19 41 2015 9 26 9 16 15 36 2015 7 25 7 12 8 27 2015 5 23 5 8 2 18
2020 5 11 5 16 19 42 2020 5 12 5 15 16 39 2020 3 10 3 10 8 28 2020 -0 6 -0 4 -1 15 2020 -1 7 -1 2 -5 10
2025 5 11 5 14 16 37 2025 3 9 3 10 10 29 2025 1 6 1 6 2 18 2025 -1 4 -1 2 -4 9 2025 -3 2 -3 -2 -11 -1
Date Cl 1 C Cl 1 B Cl 1 O Cl 2 Cl 3 Cl 4 Date Cl 1 C Cl 1 B Cl 1 O Cl 2 Cl 3 Cl 4 Date Cl 1 C Cl 1 B Cl 1 O Cl 2 Cl 3 Cl 4 Date Cl 1 C Cl 1 B Cl 1 O Cl 2 Cl 3 Cl 4 Date Cl 1 C Cl 1 B Cl 1 O Cl 2 Cl 3 Cl 4
2011 29 60 30 59 74 133 2011 28 59 29 57 70 129 2011 27 58 27 54 66 124 2011 25 57 26 51 60 116 2011 24 56 24 49 56 111
2012 29 59 29 56 70 126 2012 28 59 28 54 66 121 2012 26 58 27 52 62 116 2012 25 57 25 48 56 109 2012 23 56 24 46 51 103
2013 28 58 28 53 65 117 2013 26 58 27 50 61 112 2013 25 58 26 48 57 107 2013 24 56 24 45 51 99 2013 22 55 23 42 46 94
2014 26 57 27 49 60 108 2014 25 57 26 47 56 102 2014 24 57 24 44 51 97 2014 23 56 23 41 46 89 2014 21 55 21 38 41 83
2015 25 56 25 45 55 98 2015 24 55 24 43 50 92 2015 23 56 23 40 46 87 2015 21 54 22 37 40 79 2015 20 54 20 34 35 73
2020 15 33 15 30 36 68 2020 12 30 13 25 28 57 2020 11 28 11 21 22 49 2020 9 27 9 17 15 40 2020 6 24 6 13 8 30
2025 9 22 9 20 22 45 2025 7 18 7 14 14 34 2025 4 16 4 10 7 23 2025 3 15 3 7 1 17 2025 1 13 1 2 -5 7
Date Cl 1 C Cl 1 B Cl 1 O Cl 2 Cl 3 Cl 4 Date Cl 1 C Cl 1 B Cl 1 O Cl 2 Cl 3 Cl 4 Date Cl 1 C Cl 1 B Cl 1 O Cl 2 Cl 3 Cl 4 Date Cl 1 C Cl 1 B Cl 1 O Cl 2 Cl 3 Cl 4 Date Cl 1 C Cl 1 B Cl 1 O Cl 2 Cl 3 Cl 4
2011 22 36 22 55 72 137 2011 21 34 21 53 69 133 2011 19 33 19 51 64 128 2011 18 32 18 48 59 123 2011 17 30 17 46 56 119
2012 23 38 23 56 72 136 2012 22 37 22 53 68 132 2012 20 36 20 51 64 127 2012 19 34 19 48 59 122 2012 17 33 17 46 55 117
2013 24 41 24 56 72 135 2013 22 40 23 54 68 131 2013 21 39 21 51 64 126 2013 20 37 20 49 59 121 2013 18 36 18 46 55 116
2014 25 45 25 56 73 135 2014 24 44 24 54 68 130 2014 22 43 22 52 64 125 2014 21 42 21 49 60 120 2014 19 40 20 47 55 115
2015 26 50 27 57 73 135 2015 25 49 25 55 69 130 2015 24 48 24 53 65 125 2015 23 47 23 50 60 120 2015 21 46 21 48 56 114
2020 26 57 27 50 61 110 2020 25 56 25 47 56 103 2020 24 55 24 44 51 97 2020 22 54 22 41 46 90 2020 21 54 21 39 41 85
2025 17 40 17 31 36 66 2025 15 38 15 27 30 58 2025 13 37 13 23 23 49 2025 12 36 12 20 18 43 2025 10 34 10 16 11 33
Date Cl 1 C Cl 1 B Cl 1 O Cl 2 Cl 3 Cl 4 Date Cl 1 C Cl 1 B Cl 1 O Cl 2 Cl 3 Cl 4 Date Cl 1 C Cl 1 B Cl 1 O Cl 2 Cl 3 Cl 4 Date Cl 1 C Cl 1 B Cl 1 O Cl 2 Cl 3 Cl 4 Date Cl 1 C Cl 1 B Cl 1 O Cl 2 Cl 3 Cl 4
2011 -1 0 -1 0 -3 3 2011 -3 -2 -3 -4 -10 -6 2011 -6 -4 -6 -8 -17 -16 2011 -8 -6 -8 -12 -23 -25 2011 -10 -8 -10 -17 -30 -34
2012 -1 0 -1 0 -3 3 2012 -3 -2 -3 -4 -10 -6 2012 -6 -4 -6 -8 -17 -16 2012 -8 -6 -8 -12 -23 -25 2012 -10 -8 -10 -17 -30 -34
2013 -1 0 -1 0 -3 3 2013 -3 -2 -3 -4 -10 -6 2013 -6 -4 -6 -8 -17 -16 2013 -8 -6 -8 -12 -23 -25 2013 -10 -8 -10 -17 -30 -34
2014 -1 0 -1 0 -3 3 2014 -3 -2 -3 -4 -10 -6 2014 -6 -4 -6 -8 -17 -16 2014 -8 -6 -8 -12 -23 -25 2014 -10 -8 -10 -17 -30 -34
2015 -1 0 -1 0 -3 3 2015 -3 -2 -3 -4 -10 -6 2015 -6 -4 -6 -8 -17 -16 2015 -8 -6 -8 -12 -23 -25 2015 -10 -8 -10 -17 -30 -34
2020 -1 0 -1 0 -3 3 2020 -3 -2 -3 -4 -10 -6 2020 -6 -4 -6 -8 -17 -16 2020 -8 -6 -8 -12 -23 -25 2020 -10 -8 -10 -17 -30 -34
2025 -1 0 -1 0 -3 3 2025 -3 -2 -3 -4 -10 -6 2025 -6 -4 -6 -8 -17 -16 2025 -8 -6 -8 -12 -23 -25 2025 -10 -8 -10 -17 -30 -34
Date Cl 1 C Cl 1 B Cl 1 O Cl 2 Cl 3 Cl 4 Date Cl 1 C Cl 1 B Cl 1 O Cl 2 Cl 3 Cl 4 Date Cl 1 C Cl 1 B Cl 1 O Cl 2 Cl 3 Cl 4 Date Cl 1 C Cl 1 B Cl 1 O Cl 2 Cl 3 Cl 4 Date Cl 1 C Cl 1 B Cl 1 O Cl 2 Cl 3 Cl 4
2011 1 2 1 6 5 18 2011 -1 0 -1 1 -2 8 2011 -4 -2 -4 -3 -9 -1 2011 -6 -4 -6 -7 -15 -10 2011 -8 -6 -8 -11 -22 -20
2012 1 3 1 8 8 23 2012 -1 1 -1 4 1 14 2012 -3 -1 -3 -1 -6 4 2012 -5 -3 -5 -5 -13 -5 2012 -7 -5 -7 -9 -19 -14
2013 2 4 2 10 11 29 2013 0 2 0 6 4 19 2013 -2 0 -2 2 -3 10 2013 -4 -2 -4 -3 -10 0 2013 -6 -4 -6 -7 -16 -9
2014 3 5 3 12 14 34 2014 1 3 1 8 7 25 2014 -1 1 -1 4 0 16 2014 -3 -1 -3 -0 -6 6 2014 -5 -3 -5 -5 -13 -3
2015 4 6 4 15 18 42 2015 2 4 2 11 11 32 2015 -0 2 -0 7 4 23 2015 -2 -0 -2 2 -3 13 2015 -4 -2 -4 -2 -9 4
2020 12 16 12 37 48 96 2020 10 14 10 33 42 88 2020 9 13 9 30 37 81 2020 7 11 7 27 31 74 2020 5 9 5 23 25 66
2025 18 30 18 45 58 111 2025 17 29 17 43 54 107 2025 15 28 16 41 50 103 2025 14 26 14 38 46 98 2025 13 25 13 36 42 94
Afternoon Peak Hour - 30c Equiv Toll Rate Afternoon Peak Hour - 40c Equiv Toll Rate Afternoon Peak Hour - 50c Equiv Toll Rate Afternoon Peak Hour - 60c Equiv Toll Rate Afternoon Peak Hour - 70c Equiv Toll Rate
Morning Peak Hour - 30c Equiv Toll Rate Morning Peak Hour - 40c Equiv Toll Rate Morning Peak Hour - 50c Equiv Toll Rate Morning Peak Hour - 60c Equiv Toll Rate Morning Peak Hour - 70c Equiv Toll Rate
Weekend - 30c Equiv Toll Rate Weekend - 40c Equiv Toll Rate Weekend - 50c Equiv Toll Rate Weekend - 60c Equiv Toll Rate Weekend - 70c Equiv Toll Rate
Weekday Evening - 30c Equiv Toll Rate Weekday Evening - 40c Equiv Toll Rate Weekday Evening - 50c Equiv Toll Rate Weekday Evening - 60c Equiv Toll Rate Weekday Evening - 70c Equiv Toll Rate
Midday Off Peak - 30c Equiv Toll Rate Midday Off Peak - 40c Equiv Toll Rate Midday Off Peak - 50c Equiv Toll Rate Midday Off Peak - 60c Equiv Toll Rate Midday Off Peak - 70c Equiv Toll Rate

Economic Analysis of the Gauteng Freeway Improvement Scheme 112
N1: Proefplaas to Brakfontein (Northbound)
Date Cl 1 C Cl 1 B Cl 1 O Cl 2 Cl 3 Cl 4 Date Cl 1 C Cl 1 B Cl 1 O Cl 2 Cl 3 Cl 4 Date Cl 1 C Cl 1 B Cl 1 O Cl 2 Cl 3 Cl 4 Date Cl 1 C Cl 1 B Cl 1 O Cl 2 Cl 3 Cl 4 Date Cl 1 C Cl 1 B Cl 1 O Cl 2 Cl 3 Cl 4
2011 25 47 25 53 67 123 2011 23 46 23 50 62 117 2011 21 44 22 47 57 111 2011 20 43 20 44 52 105 2011 19 43 19 43 49 102
2012 24 47 24 51 64 119 2012 23 46 23 48 60 113 2012 21 45 21 46 55 108 2012 20 44 20 43 50 101 2012 19 43 19 41 47 98
2013 24 47 24 50 62 115 2013 22 46 22 47 58 109 2013 21 45 21 45 54 105 2013 19 43 20 42 48 98 2013 18 43 19 40 45 94
2014 23 46 23 48 60 111 2014 22 45 22 45 55 105 2014 21 45 21 44 52 101 2014 19 43 19 40 46 94 2014 18 43 18 38 42 89
2015 23 46 23 46 58 106 2015 21 45 21 44 53 100 2015 20 45 21 42 50 98 2015 18 43 19 39 44 90 2015 17 43 18 36 40 85
2020 19 40 19 37 46 85 2020 17 38 17 34 40 78 2020 15 37 16 31 35 71 2020 13 35 14 27 28 62 2020 12 34 12 25 24 57
2025 15 35 15 28 33 62 2025 13 33 13 24 26 52 2025 11 31 11 20 19 43 2025 9 30 10 17 14 36 2025 7 27 7 12 6 26
Date Cl 1 C Cl 1 B Cl 1 O Cl 2 Cl 3 Cl 4 Date Cl 1 C Cl 1 B Cl 1 O Cl 2 Cl 3 Cl 4 Date Cl 1 C Cl 1 B Cl 1 O Cl 2 Cl 3 Cl 4 Date Cl 1 C Cl 1 B Cl 1 O Cl 2 Cl 3 Cl 4 Date Cl 1 C Cl 1 B Cl 1 O Cl 2 Cl 3 Cl 4
2011 22 50 22 38 46 82 2011 20 49 21 35 40 75 2011 19 48 19 33 35 69 2011 19 50 19 32 33 67 2011 16 47 17 27 26 57
2012 20 46 20 35 42 76 2012 19 46 19 32 37 69 2012 17 45 18 30 32 63 2012 17 46 17 28 28 59 2012 15 44 15 24 22 50
2013 18 42 18 32 38 69 2013 17 41 17 29 32 62 2013 15 41 16 27 28 57 2013 14 42 15 24 23 51 2013 13 40 13 21 17 43
2014 16 37 16 29 34 64 2014 14 36 14 26 28 56 2014 13 36 13 24 24 51 2014 12 35 12 20 18 43 2014 10 34 10 17 13 36
2015 13 30 13 26 31 60 2015 11 28 12 23 25 52 2015 11 29 11 21 21 46 2015 8 27 9 16 14 37 2015 7 26 7 13 9 30
2020 11 27 11 21 23 46 2020 6 16 6 13 13 32 2020 4 15 4 10 7 23 2020 -0 7 -0 3 -2 11 2020 -3 3 -3 -2 -11 0
2025 5 11 5 14 16 37 2025 2 8 2 9 8 25 2025 -0 5 -0 4 1 15 2025 -1 4 -1 2 -4 8 2025 -4 2 -4 -3 -11 -1
Date Cl 1 C Cl 1 B Cl 1 O Cl 2 Cl 3 Cl 4 Date Cl 1 C Cl 1 B Cl 1 O Cl 2 Cl 3 Cl 4 Date Cl 1 C Cl 1 B Cl 1 O Cl 2 Cl 3 Cl 4 Date Cl 1 C Cl 1 B Cl 1 O Cl 2 Cl 3 Cl 4 Date Cl 1 C Cl 1 B Cl 1 O Cl 2 Cl 3 Cl 4
2011 18 26 18 49 64 124 2011 17 25 17 47 61 122 2011 15 24 16 46 58 119 2011 14 23 14 44 54 115 2011 13 21 13 41 49 109
2012 18 28 18 49 64 124 2012 17 27 17 48 62 122 2012 16 26 16 46 58 119 2012 15 25 15 44 55 116 2012 14 24 14 42 51 112
2013 19 30 19 49 64 123 2013 18 29 18 48 62 121 2013 17 29 17 47 59 119 2013 16 28 16 45 55 116 2013 15 27 15 43 51 112
2014 20 33 20 49 64 122 2014 19 32 19 48 61 120 2014 18 32 18 47 59 118 2014 17 31 17 45 55 115 2014 16 30 16 44 52 112
2015 21 37 21 50 64 121 2015 20 37 20 49 61 119 2015 19 36 20 48 59 117 2015 18 35 18 46 55 114 2015 17 35 17 44 52 111
2020 25 54 25 46 56 101 2020 24 54 24 44 52 96 2020 22 53 23 41 47 90 2020 21 53 22 39 43 85 2020 20 52 20 37 39 80
2025 15 35 15 28 32 60 2025 13 34 13 24 26 53 2025 13 35 13 22 22 48 2025 7 25 7 13 9 28 2025 6 26 7 11 5 23
Date Cl 1 C Cl 1 B Cl 1 O Cl 2 Cl 3 Cl 4 Date Cl 1 C Cl 1 B Cl 1 O Cl 2 Cl 3 Cl 4 Date Cl 1 C Cl 1 B Cl 1 O Cl 2 Cl 3 Cl 4 Date Cl 1 C Cl 1 B Cl 1 O Cl 2 Cl 3 Cl 4 Date Cl 1 C Cl 1 B Cl 1 O Cl 2 Cl 3 Cl 4
2011 -1 0 -1 -0 -3 3 2011 -4 -2 -4 -4 -10 -7 2011 -6 -4 -6 -9 -17 -16 2011 -8 -6 -8 -13 -24 -26 2011 -10 -8 -10 -17 -31 -36
2012 -1 0 -1 -0 -3 3 2012 -4 -2 -4 -4 -10 -7 2012 -6 -4 -6 -9 -17 -16 2012 -8 -6 -8 -13 -24 -26 2012 -10 -8 -10 -17 -31 -36
2013 -1 0 -1 -0 -3 3 2013 -4 -2 -4 -4 -10 -7 2013 -6 -4 -6 -8 -17 -16 2013 -8 -6 -8 -13 -24 -26 2013 -10 -8 -10 -17 -31 -36
2014 -1 0 -1 -0 -3 3 2014 -4 -2 -4 -4 -10 -7 2014 -6 -4 -6 -8 -17 -16 2014 -8 -6 -8 -13 -24 -26 2014 -10 -8 -10 -17 -31 -36
2015 -1 0 -1 -0 -3 3 2015 -4 -2 -4 -4 -10 -7 2015 -6 -4 -6 -8 -17 -16 2015 -8 -6 -8 -13 -24 -26 2015 -10 -8 -10 -17 -31 -36
2020 -1 0 -1 0 -3 3 2020 -4 -2 -4 -4 -10 -7 2020 -6 -4 -6 -8 -17 -16 2020 -8 -6 -8 -13 -24 -26 2020 -10 -8 -10 -17 -31 -36
2025 -1 0 -1 0 -3 4 2025 -3 -2 -3 -4 -10 -6 2025 -6 -4 -6 -8 -17 -16 2025 -8 -6 -8 -13 -24 -26 2025 -10 -8 -10 -17 -31 -36
Date Cl 1 C Cl 1 B Cl 1 O Cl 2 Cl 3 Cl 4 Date Cl 1 C Cl 1 B Cl 1 O Cl 2 Cl 3 Cl 4 Date Cl 1 C Cl 1 B Cl 1 O Cl 2 Cl 3 Cl 4 Date Cl 1 C Cl 1 B Cl 1 O Cl 2 Cl 3 Cl 4 Date Cl 1 C Cl 1 B Cl 1 O Cl 2 Cl 3 Cl 4
2011 -1 1 -1 0 -3 4 2011 -3 -2 -3 -4 -9 -5 2011 -5 -4 -5 -8 -16 -15 2011 -8 -6 -8 -12 -23 -24 2011 -10 -8 -10 -16 -30 -34
2012 -1 1 -1 1 -2 5 2012 -3 -1 -3 -3 -9 -4 2012 -5 -3 -5 -8 -15 -14 2012 -7 -6 -7 -12 -22 -23 2012 -9 -8 -9 -16 -29 -33
2013 -1 1 -1 2 -1 7 2013 -3 -1 -3 -2 -7 -2 2013 -5 -3 -5 -7 -14 -11 2013 -7 -5 -7 -11 -21 -21 2013 -9 -7 -9 -15 -28 -30
2014 -0 1 -0 3 0 10 2014 -3 -1 -3 -2 -6 0 2014 -5 -3 -5 -6 -13 -9 2014 -7 -5 -7 -10 -20 -19 2014 -9 -7 -9 -14 -27 -28
2015 -0 2 -0 3 2 12 2015 -2 -0 -2 -1 -5 2 2015 -4 -3 -4 -5 -12 -7 2015 -6 -5 -6 -9 -19 -17 2015 -9 -7 -9 -13 -26 -26
2020 4 6 4 14 16 39 2020 1 4 2 10 10 30 2020 -1 2 -1 6 3 20 2020 -3 -1 -3 1 -4 11 2020 -5 -3 -5 -3 -11 1
2025 11 14 11 34 44 90 2025 10 13 10 32 40 85 2025 8 11 8 29 36 80 2025 6 10 7 27 31 75 2025 5 8 5 24 26 68
Weekend - 30c Equiv Toll Rate Weekend - 40c Equiv Toll Rate Weekend - 50c Equiv Toll Rate Weekend - 60c Equiv Toll Rate Weekend - 70c Equiv Toll Rate
Weekday Evening - 30c Equiv Toll Rate Weekday Evening - 40c Equiv Toll Rate Weekday Evening - 50c Equiv Toll Rate Weekday Evening - 60c Equiv Toll Rate Weekday Evening - 70c Equiv Toll Rate
Midday Off Peak - 30c Equiv Toll Rate Midday Off Peak - 40c Equiv Toll Rate Midday Off Peak - 50c Equiv Toll Rate Midday Off Peak - 60c Equiv Toll Rate Midday Off Peak - 70c Equiv Toll Rate
Afternoon Peak Hour - 30c Equiv Toll Rate Afternoon Peak Hour - 40c Equiv Toll Rate Afternoon Peak Hour - 50c Equiv Toll Rate Afternoon Peak Hour - 60c Equiv Toll Rate Afternoon Peak Hour - 70c Equiv Toll Rate
Morning Peak Hour - 30c Equiv Toll Rate Morning Peak Hour - 40c Equiv Toll Rate Morning Peak Hour - 50c Equiv Toll Rate Morning Peak Hour - 60c Equiv Toll Rate Morning Peak Hour - 70c Equiv Toll Rate

Economic Analysis of the Gauteng Freeway Improvement Scheme 113
N1: Brakfontein to Buccleuch (Southbound)
Date Cl 1 C Cl 1 B Cl 1 O Cl 2 Cl 3 Cl 4 Date Cl 1 C Cl 1 B Cl 1 O Cl 2 Cl 3 Cl 4 Date Cl 1 C Cl 1 B Cl 1 O Cl 2 Cl 3 Cl 4 Date Cl 1 C Cl 1 B Cl 1 O Cl 2 Cl 3 Cl 4 Date Cl 1 C Cl 1 B Cl 1 O Cl 2 Cl 3 Cl 4
2011 25 56 25 44 53 93 2011 24 56 24 41 48 88 2011 22 55 23 39 43 82 2011 21 55 22 36 39 76 2011 19 52 19 33 34 71
2012 25 56 25 43 52 92 2012 23 56 24 40 47 85 2012 22 55 22 38 42 80 2012 21 55 21 35 38 74 2012 19 52 19 32 33 68
2013 23 54 24 40 48 85 2013 22 54 22 37 43 78 2013 21 53 21 35 38 72 2013 20 53 20 32 34 66 2013 18 52 19 30 29 60
2014 21 51 21 35 40 71 2014 20 51 20 32 35 64 2014 19 50 19 29 30 58 2014 18 51 18 27 26 52 2014 16 50 17 24 21 46
2015 19 47 19 29 32 57 2015 17 47 17 26 27 49 2015 16 46 16 23 22 43 2015 15 47 15 20 17 36 2015 14 48 15 18 12 30
2020 5 9 5 15 17 39 2020 3 8 3 11 11 31 2020 2 8 2 8 5 23 2020 -0 7 0 4 -1 14 2020 -1 7 -1 1 -6 7
2025 10 23 10 21 24 49 2025 8 21 8 17 17 39 2025 6 19 6 13 11 30 2025 4 16 4 9 4 21 2025 2 15 2 5 -2 13
Date Cl 1 C Cl 1 B Cl 1 O Cl 2 Cl 3 Cl 4 Date Cl 1 C Cl 1 B Cl 1 O Cl 2 Cl 3 Cl 4 Date Cl 1 C Cl 1 B Cl 1 O Cl 2 Cl 3 Cl 4 Date Cl 1 C Cl 1 B Cl 1 O Cl 2 Cl 3 Cl 4 Date Cl 1 C Cl 1 B Cl 1 O Cl 2 Cl 3 Cl 4
2011 15 28 15 34 42 82 2011 14 27 14 32 39 78 2011 13 27 13 31 36 75 2011 11 26 12 28 31 70 2011 10 26 11 26 28 66
2012 16 31 16 35 44 83 2012 15 30 15 33 40 79 2012 14 30 14 31 36 75 2012 12 29 13 29 32 71 2012 11 29 12 27 28 66
2013 17 34 17 36 45 85 2013 16 34 16 34 41 80 2013 15 34 15 32 37 76 2013 14 33 14 30 33 71 2013 13 33 13 28 29 67
2014 19 39 19 38 47 87 2014 18 39 18 36 43 82 2014 16 38 17 34 38 77 2014 15 38 16 32 34 72 2014 14 38 15 29 30 67
2015 21 46 21 40 48 88 2015 20 46 20 38 44 83 2015 19 45 19 35 39 77 2015 18 45 18 33 36 73 2015 16 44 17 31 31 67
2020 24 54 25 45 54 97 2020 22 50 22 39 46 85 2020 20 49 20 36 41 78 2020 19 49 19 33 35 71 2020 16 45 17 29 28 62
2025 4 9 4 13 15 35 2025 3 8 3 9 9 26 2025 0 5 0 5 1 16 2025 -2 3 -2 1 -5 8 2025 -4 1 -4 -3 -12 -2
Date Cl 1 C Cl 1 B Cl 1 O Cl 2 Cl 3 Cl 4 Date Cl 1 C Cl 1 B Cl 1 O Cl 2 Cl 3 Cl 4 Date Cl 1 C Cl 1 B Cl 1 O Cl 2 Cl 3 Cl 4 Date Cl 1 C Cl 1 B Cl 1 O Cl 2 Cl 3 Cl 4 Date Cl 1 C Cl 1 B Cl 1 O Cl 2 Cl 3 Cl 4
2011 14 23 14 38 49 97 2011 14 23 14 37 47 96 2011 13 23 13 37 46 96 2011 12 22 12 36 43 93 2011 11 21 11 34 40 91
2012 14 24 15 37 48 94 2012 14 24 14 36 45 92 2012 13 23 13 36 43 91 2012 12 23 12 34 40 88 2012 11 22 11 32 37 85
2013 15 25 15 37 47 91 2013 14 25 14 35 44 88 2013 13 25 13 34 41 86 2013 12 24 12 32 37 82 2013 11 23 11 31 34 79
2014 15 27 15 36 46 88 2014 14 27 14 34 42 84 2014 13 26 13 33 39 81 2014 12 25 12 31 35 77 2014 11 25 11 29 31 73
2015 15 29 16 36 45 86 2015 14 29 15 33 41 81 2015 13 28 13 31 36 76 2015 12 28 12 29 32 72 2015 11 27 11 27 29 67
2020 23 53 24 42 50 90 2020 22 52 22 39 45 83 2020 21 51 21 36 40 77 2020 19 51 20 33 35 70 2020 18 50 18 31 31 65
2025 7 15 7 16 19 40 2025 5 15 5 13 13 32 2025 3 11 3 8 5 22 2025 3 15 3 6 1 16 2025 -0 10 -0 2 -6 6
Date Cl 1 C Cl 1 B Cl 1 O Cl 2 Cl 3 Cl 4 Date Cl 1 C Cl 1 B Cl 1 O Cl 2 Cl 3 Cl 4 Date Cl 1 C Cl 1 B Cl 1 O Cl 2 Cl 3 Cl 4 Date Cl 1 C Cl 1 B Cl 1 O Cl 2 Cl 3 Cl 4 Date Cl 1 C Cl 1 B Cl 1 O Cl 2 Cl 3 Cl 4
2011 -2 -2 -2 1 -2 6 2011 -4 -4 -4 -3 -8 -3 2011 -6 -6 -6 -8 -15 -13 2011 -8 -8 -8 -12 -22 -22 2011 -10 -10 -10 -16 -29 -31
2012 -2 -2 -2 1 -2 6 2012 -4 -4 -4 -3 -8 -3 2012 -6 -6 -6 -8 -15 -13 2012 -8 -8 -8 -12 -22 -22 2012 -10 -10 -10 -16 -29 -31
2013 -2 -2 -2 1 -2 6 2013 -4 -4 -4 -3 -8 -3 2013 -6 -6 -6 -8 -15 -13 2013 -8 -8 -8 -12 -22 -22 2013 -10 -10 -10 -16 -29 -31
2014 -2 -2 -2 1 -2 6 2014 -4 -4 -4 -3 -8 -3 2014 -6 -6 -6 -8 -15 -13 2014 -8 -8 -8 -12 -22 -22 2014 -10 -10 -10 -16 -29 -31
2015 -2 -2 -2 1 -2 6 2015 -4 -4 -4 -3 -8 -3 2015 -6 -6 -6 -8 -15 -13 2015 -8 -8 -8 -12 -22 -22 2015 -10 -10 -10 -16 -29 -31
2020 -2 -2 -2 1 -2 6 2020 -4 -4 -4 -3 -8 -3 2020 -6 -6 -6 -8 -15 -13 2020 -8 -8 -8 -12 -22 -22 2020 -10 -10 -10 -16 -29 -31
2025 -2 -2 -2 1 -2 6 2025 -4 -4 -4 -3 -8 -3 2025 -6 -6 -6 -8 -15 -12 2025 -8 -8 -8 -12 -22 -22 2025 -10 -10 -10 -16 -29 -32
Date Cl 1 C Cl 1 B Cl 1 O Cl 2 Cl 3 Cl 4 Date Cl 1 C Cl 1 B Cl 1 O Cl 2 Cl 3 Cl 4 Date Cl 1 C Cl 1 B Cl 1 O Cl 2 Cl 3 Cl 4 Date Cl 1 C Cl 1 B Cl 1 O Cl 2 Cl 3 Cl 4 Date Cl 1 C Cl 1 B Cl 1 O Cl 2 Cl 3 Cl 4
2011 -0 -0 -0 4 3 15 2011 -2 -2 -2 0 -3 6 2011 -5 -4 -5 -4 -10 -3 2011 -7 -6 -7 -8 -16 -12 2011 -9 -8 -9 -12 -23 -22
2012 1 2 1 9 10 27 2012 -1 -1 -1 5 3 18 2012 -3 -3 -3 1 -4 9 2012 -5 -5 -5 -3 -10 -1 2012 -7 -7 -7 -8 -17 -10
2013 3 4 3 15 18 42 2013 1 2 1 11 11 33 2013 -1 -0 -1 7 5 24 2013 -3 -2 -3 3 -2 14 2013 -5 -4 -5 -2 -9 5
2014 5 6 5 21 26 57 2014 3 4 3 17 20 48 2014 1 2 1 12 13 39 2014 -1 -0 -1 8 6 30 2014 -3 -2 -3 4 -0 20
2015 8 8 8 27 35 73 2015 6 6 6 23 28 63 2015 3 4 3 19 21 54 2015 1 2 1 14 15 45 2015 -1 0 -1 10 8 36
2020 14 18 14 43 58 114 2020 13 17 13 42 54 111 2020 12 15 12 40 51 107 2020 10 14 10 37 46 101 2020 9 13 9 35 42 97
2025 17 30 18 42 54 103 2025 16 29 16 40 50 99 2025 15 29 16 40 48 99 2025 15 29 15 39 47 98 2025 14 28 14 38 44 96
Afternoon Peak Hour - 30c Equiv Toll Rate
Morning Peak Hour - 30c Equiv Toll Rate
Weekend - 30c Equiv Toll Rate
Midday Off Peak - 40c Equiv Toll Rate Midday Off Peak - 50c Equiv Toll Rate Midday Off Peak - 60c Equiv Toll Rate
Weekday Evening - 30c Equiv Toll Rate
Midday Off Peak - 30c Equiv Toll Rate
Weekend - 40c Equiv Toll Rate Weekend - 50c Equiv Toll Rate Weekend - 60c Equiv Toll Rate Weekend - 70c Equiv Toll Rate
Weekday Evening - 40c Equiv Toll Rate Weekday Evening - 50c Equiv Toll Rate Weekday Evening - 60c Equiv Toll Rate Weekday Evening - 70c Equiv Toll Rate
Midday Off Peak - 70c Equiv Toll Rate
Afternoon Peak Hour - 40c Equiv Toll Rate Afternoon Peak Hour - 50c Equiv Toll Rate Afternoon Peak Hour - 60c Equiv Toll Rate Afternoon Peak Hour - 70c Equiv Toll Rate
Morning Peak Hour - 40c Equiv Toll Rate Morning Peak Hour - 50c Equiv Toll Rate Morning Peak Hour - 60c Equiv Toll Rate Morning Peak Hour - 70c Equiv Toll Rate

Economic Analysis of the Gauteng Freeway Improvement Scheme 114
N1: Brakfontein to Buccleuch (Northbound)
Date Cl 1 C Cl 1 B Cl 1 O Cl 2 Cl 3 Cl 4 Date Cl 1 C Cl 1 B Cl 1 O Cl 2 Cl 3 Cl 4 Date Cl 1 C Cl 1 B Cl 1 O Cl 2 Cl 3 Cl 4 Date Cl 1 C Cl 1 B Cl 1 O Cl 2 Cl 3 Cl 4 Date Cl 1 C Cl 1 B Cl 1 O Cl 2 Cl 3 Cl 4
2011 6 9 6 20 24 53 2011 4 7 4 17 19 47 2011 3 6 3 14 14 40 2011 1 4 1 11 10 35 2011 -0 3 -0 8 5 29
2012 6 9 6 19 24 52 2012 5 8 5 17 20 49 2012 3 6 3 15 16 42 2012 1 5 1 12 10 36 2012 -0 3 -0 9 5 30
2013 6 9 6 19 24 52 2013 5 8 5 17 20 48 2013 3 7 3 15 16 44 2013 2 5 2 12 11 38 2013 0 4 0 9 6 31
2014 6 9 6 19 24 51 2014 5 8 5 17 20 48 2014 3 7 3 15 16 44 2014 2 5 2 12 11 37 2014 0 4 0 9 6 30
2015 6 9 6 19 24 51 2015 5 8 5 17 20 48 2015 4 7 4 15 17 44 2015 2 6 2 12 11 36 2015 -0 4 -0 8 5 29
2020 8 11 8 25 31 66 2020 5 8 5 20 24 55 2020 3 6 4 17 18 48 2020 2 6 2 14 14 43 2020 -0 3 -0 10 7 32
2025 16 31 16 35 44 84 2025 14 28 14 31 37 74 2025 12 28 12 28 33 69 2025 10 25 10 24 25 58 2025 8 24 8 20 19 51
Date Cl 1 C Cl 1 B Cl 1 O Cl 2 Cl 3 Cl 4 Date Cl 1 C Cl 1 B Cl 1 O Cl 2 Cl 3 Cl 4 Date Cl 1 C Cl 1 B Cl 1 O Cl 2 Cl 3 Cl 4 Date Cl 1 C Cl 1 B Cl 1 O Cl 2 Cl 3 Cl 4 Date Cl 1 C Cl 1 B Cl 1 O Cl 2 Cl 3 Cl 4
2011 3 10 3 7 6 18 2011 1 9 1 4 0 10 2011 0 8 0 1 -4 4 2011 -1 7 -1 -2 -10 -3 2011 -3 6 -3 -5 -15 -10
2012 2 7 2 6 5 16 2012 0 6 0 3 -1 8 2012 -1 5 -1 -0 -6 2 2012 -3 4 -2 -3 -12 -6 2012 -4 4 -4 -7 -17 -13
2013 0 3 0 4 2 12 2013 -1 2 -1 1 -3 5 2013 -3 1 -3 -2 -9 -2 2013 -4 0 -4 -6 -14 -10 2013 -6 -0 -6 -9 -20 -17
2014 -2 -2 -2 2 -0 9 2014 -3 -3 -3 -2 -6 1 2014 -5 -4 -5 -5 -12 -7 2014 -6 -5 -6 -9 -18 -15 2014 -8 -5 -8 -12 -23 -22
2015 -4 -9 -4 -1 -3 6 2015 -6 -10 -6 -4 -9 -2 2015 -8 -12 -8 -8 -15 -10 2015 -9 -12 -9 -11 -20 -18 2015 -10 -12 -10 -14 -25 -25
2020 -7 -21 -7 1 2 18 2020 -8 -21 -8 -2 -4 10 2020 -10 -23 -10 -6 -10 1 2020 -13 -27 -13 -11 -18 -9 2020 -14 -27 -14 -14 -24 -17
2025 1 1 1 10 11 30 2025 -1 -1 -1 6 5 21 2025 -3 -3 -3 2 -2 12 2025 -5 -5 -5 -2 -9 3 2025 -7 -7 -7 -6 -15 -7
Date Cl 1 C Cl 1 B Cl 1 O Cl 2 Cl 3 Cl 4 Date Cl 1 C Cl 1 B Cl 1 O Cl 2 Cl 3 Cl 4 Date Cl 1 C Cl 1 B Cl 1 O Cl 2 Cl 3 Cl 4 Date Cl 1 C Cl 1 B Cl 1 O Cl 2 Cl 3 Cl 4 Date Cl 1 C Cl 1 B Cl 1 O Cl 2 Cl 3 Cl 4
2011 8 14 8 21 26 55 2011 7 13 7 20 23 51 2011 6 13 6 19 20 50 2011 5 12 5 18 18 48 2011 4 11 4 16 15 45
2012 7 14 7 19 23 49 2012 6 13 6 17 20 45 2012 5 12 5 16 17 43 2012 4 12 4 15 14 41 2012 3 11 3 13 11 37
2013 7 13 7 17 20 43 2013 5 13 5 15 17 40 2013 4 12 5 14 13 36 2013 4 12 4 12 10 34 2013 2 11 2 10 7 30
2014 6 14 6 15 17 38 2014 5 13 5 13 14 34 2014 4 13 4 11 10 30 2014 3 12 3 10 7 27 2014 2 11 2 8 3 22
2015 6 14 6 13 14 32 2015 5 14 5 11 11 28 2015 3 13 4 9 6 23 2015 3 13 3 7 3 20 2015 1 12 1 5 -1 15
2020 5 14 5 9 9 22 2020 4 14 4 7 4 15 2020 2 14 2 4 -1 9 2020 1 12 1 1 -7 1 2020 -0 12 -0 -2 -11 -4
2025 -6 -17 -6 3 3 20 2025 -7 -19 -7 -1 -3 12 2025 -8 -18 -9 -4 -8 4 2025 -12 -23 -12 -9 -16 -6 2025 -13 -25 -13 -13 -22 -15
Date Cl 1 C Cl 1 B Cl 1 O Cl 2 Cl 3 Cl 4 Date Cl 1 C Cl 1 B Cl 1 O Cl 2 Cl 3 Cl 4 Date Cl 1 C Cl 1 B Cl 1 O Cl 2 Cl 3 Cl 4 Date Cl 1 C Cl 1 B Cl 1 O Cl 2 Cl 3 Cl 4 Date Cl 1 C Cl 1 B Cl 1 O Cl 2 Cl 3 Cl 4
2011 -2 -2 -2 1 -1 7 2011 -4 -4 -4 -3 -8 -3 2011 -6 -6 -6 -7 -14 -11 2011 -8 -8 -8 -11 -21 -21 2011 -10 -10 -10 -15 -27 -29
2012 -2 -2 -2 1 -1 7 2012 -4 -4 -4 -3 -8 -3 2012 -6 -6 -6 -7 -14 -11 2012 -8 -8 -8 -11 -21 -21 2012 -10 -10 -10 -15 -28 -29
2013 -2 -2 -2 1 -1 7 2013 -4 -4 -4 -3 -8 -3 2013 -6 -6 -6 -7 -14 -11 2013 -8 -8 -8 -11 -21 -21 2013 -10 -10 -10 -15 -28 -30
2014 -2 -2 -2 1 -1 7 2014 -4 -4 -4 -3 -8 -3 2014 -6 -6 -6 -7 -14 -11 2014 -8 -8 -8 -11 -21 -21 2014 -10 -10 -10 -15 -28 -30
2015 -2 -2 -2 1 -1 7 2015 -4 -4 -4 -3 -8 -3 2015 -6 -6 -6 -7 -14 -11 2015 -8 -8 -8 -11 -21 -21 2015 -10 -10 -10 -15 -28 -30
2020 -2 -2 -2 1 -1 7 2020 -4 -4 -4 -3 -8 -3 2020 -6 -6 -6 -7 -15 -12 2020 -8 -8 -8 -11 -21 -21 2020 -10 -10 -10 -16 -28 -30
2025 -2 -2 -2 1 -1 7 2025 -4 -4 -4 -3 -8 -3 2025 -6 -6 -6 -7 -15 -12 2025 -8 -8 -8 -11 -21 -21 2025 -10 -10 -10 -15 -28 -30
Date Cl 1 C Cl 1 B Cl 1 O Cl 2 Cl 3 Cl 4 Date Cl 1 C Cl 1 B Cl 1 O Cl 2 Cl 3 Cl 4 Date Cl 1 C Cl 1 B Cl 1 O Cl 2 Cl 3 Cl 4 Date Cl 1 C Cl 1 B Cl 1 O Cl 2 Cl 3 Cl 4 Date Cl 1 C Cl 1 B Cl 1 O Cl 2 Cl 3 Cl 4
2011 -2 -2 -2 0 -2 5 2011 -4 -4 -4 -4 -9 -4 2011 -6 -6 -6 -8 -15 -13 2011 -8 -8 -8 -12 -22 -22 2011 -10 -10 -10 -16 -29 -32
2012 -2 -2 -2 0 -2 6 2012 -4 -4 -4 -4 -9 -4 2012 -6 -6 -6 -8 -15 -13 2012 -8 -8 -8 -12 -22 -22 2012 -10 -10 -10 -16 -29 -32
2013 -2 -2 -2 0 -2 6 2013 -4 -4 -4 -4 -9 -4 2013 -6 -6 -6 -8 -15 -13 2013 -8 -8 -8 -12 -22 -22 2013 -10 -10 -10 -16 -29 -32
2014 -2 -2 -2 1 -2 6 2014 -4 -4 -4 -3 -8 -3 2014 -6 -6 -6 -7 -15 -12 2014 -8 -8 -8 -12 -22 -21 2014 -10 -10 -10 -16 -28 -31
2015 -1 -1 -1 2 -0 9 2015 -3 -3 -3 -2 -7 -0 2015 -5 -5 -5 -6 -13 -9 2015 -7 -7 -7 -10 -20 -18 2015 -10 -9 -10 -15 -27 -28
2020 4 4 4 17 21 47 2020 2 2 2 13 15 39 2020 0 1 0 9 9 31 2020 -2 -1 -2 5 2 22 2020 -4 -3 -4 1 -4 13
2025 5 6 5 19 24 52 2025 4 5 4 17 20 49 2025 2 4 2 15 16 44 2025 1 3 1 13 13 41 2025 -0 2 -0 11 9 38
Weekend - 30c Equiv Toll Rate Weekend - 40c Equiv Toll Rate Weekend - 50c Equiv Toll Rate Weekend - 60c Equiv Toll Rate Weekend - 70c Equiv Toll Rate
Weekday Evening - 70c Equiv Toll RateWeekday Evening - 30c Equiv Toll Rate Weekday Evening - 40c Equiv Toll Rate Weekday Evening - 50c Equiv Toll Rate Weekday Evening - 60c Equiv Toll Rate
Midday Off Peak - 30c Equiv Toll Rate Midday Off Peak - 40c Equiv Toll Rate Midday Off Peak - 50c Equiv Toll Rate Midday Off Peak - 60c Equiv Toll Rate Midday Off Peak - 70c Equiv Toll Rate
Afternoon Peak Hour - 30c Equiv Toll Rate Afternoon Peak Hour - 40c Equiv Toll Rate Afternoon Peak Hour - 50c Equiv Toll Rate Afternoon Peak Hour - 60c Equiv Toll Rate Afternoon Peak Hour - 70c Equiv Toll Rate
Morning Peak Hour - 30c Equiv Toll Rate Morning Peak Hour - 40c Equiv Toll Rate Morning Peak Hour - 50c Equiv Toll Rate Morning Peak Hour - 60c Equiv Toll Rate Morning Peak Hour - 70c Equiv Toll Rate

Economic Analysis of the Gauteng Freeway Improvement Scheme 115
N1: Buccleuch to 14th Avenue (Westbound / Southbound)
Date Cl 1 C Cl 1 B Cl 1 O Cl 2 Cl 3 Cl 4 Date Cl 1 C Cl 1 B Cl 1 O Cl 2 Cl 3 Cl 4 Date Cl 1 C Cl 1 B Cl 1 O Cl 2 Cl 3 Cl 4 Date Cl 1 C Cl 1 B Cl 1 O Cl 2 Cl 3 Cl 4 Date Cl 1 C Cl 1 B Cl 1 O Cl 2 Cl 3 Cl 4
2011 11 16 11 32 41 83 2011 10 15 10 30 38 79 2011 9 14 9 29 35 77 2011 8 14 8 29 34 78 2011 7 13 7 27 30 74
2012 11 16 11 31 40 80 2012 9 15 10 29 36 76 2012 9 14 9 28 34 75 2012 8 14 8 28 33 75 2012 7 13 7 26 30 72
2013 10 15 10 30 38 78 2013 9 15 9 28 35 74 2013 8 14 9 27 33 73 2013 8 14 8 27 31 73 2013 7 13 7 26 29 70
2014 10 15 10 29 37 75 2014 9 14 9 27 34 71 2014 8 14 8 27 32 71 2014 8 14 8 26 30 70 2014 7 14 7 25 28 69
2015 10 15 10 28 36 72 2015 9 14 9 26 32 69 2015 8 14 8 26 31 69 2015 7 14 7 25 29 67 2015 7 14 7 24 27 67
2020 13 18 13 36 47 93 2020 11 16 11 32 41 85 2020 10 15 10 32 39 84 2020 9 15 9 31 37 83 2020 8 14 8 29 34 81
2025 12 16 12 37 49 98 2025 11 14 11 35 44 92 2025 10 13 10 33 41 89 2025 9 13 9 33 40 90 2025 7 11 7 29 34 82
Date Cl 1 C Cl 1 B Cl 1 O Cl 2 Cl 3 Cl 4 Date Cl 1 C Cl 1 B Cl 1 O Cl 2 Cl 3 Cl 4 Date Cl 1 C Cl 1 B Cl 1 O Cl 2 Cl 3 Cl 4 Date Cl 1 C Cl 1 B Cl 1 O Cl 2 Cl 3 Cl 4 Date Cl 1 C Cl 1 B Cl 1 O Cl 2 Cl 3 Cl 4
2011 12 29 12 21 24 45 2011 10 28 11 18 19 38 2011 10 29 10 16 15 35 2011 9 30 10 15 13 32 2011 9 31 9 14 9 28
2012 11 28 11 20 22 43 2012 10 28 10 17 17 36 2012 9 28 9 15 14 32 2012 9 30 9 14 11 29 2012 9 31 9 13 8 26
2013 10 26 11 18 20 40 2013 9 26 9 16 15 33 2013 8 26 8 14 12 28 2013 8 29 9 13 9 26 2013 8 31 8 12 7 23
2014 9 23 9 16 18 36 2014 8 22 8 14 13 30 2014 7 22 7 11 9 24 2014 7 27 8 11 7 21 2014 8 30 8 11 5 20
2015 6 16 6 14 16 34 2015 5 15 5 11 10 27 2015 4 15 4 9 6 21 2015 6 23 6 9 4 17 2015 6 26 6 8 2 15
2020 1 0 1 9 10 27 2020 -2 -3 -2 4 3 18 2020 -3 -5 -3 1 -3 10 2020 -6 -8 -6 -4 -10 0 2020 -9 -13 -9 -8 -17 -9
2025 2 2 2 13 15 37 2025 0 0 0 9 9 28 2025 -1 -1 -1 5 3 20 2025 -3 -3 -3 1 -4 11 2025 -5 -5 -5 -3 -10 3
Date Cl 1 C Cl 1 B Cl 1 O Cl 2 Cl 3 Cl 4 Date Cl 1 C Cl 1 B Cl 1 O Cl 2 Cl 3 Cl 4 Date Cl 1 C Cl 1 B Cl 1 O Cl 2 Cl 3 Cl 4 Date Cl 1 C Cl 1 B Cl 1 O Cl 2 Cl 3 Cl 4 Date Cl 1 C Cl 1 B Cl 1 O Cl 2 Cl 3 Cl 4
2011 13 19 13 38 49 97 2011 13 20 13 39 50 101 2011 14 20 14 41 52 107 2011 14 21 14 43 54 114 2011 14 21 14 45 56 121
2012 13 19 13 36 47 92 2012 13 20 13 37 47 95 2012 13 20 13 38 48 100 2012 13 21 13 40 50 105 2012 13 21 13 42 51 111
2013 12 19 13 34 44 87 2013 12 20 12 35 44 89 2013 12 20 12 36 45 93 2013 12 21 12 37 45 97 2013 12 21 12 38 46 101
2014 12 20 12 32 41 82 2014 12 20 12 32 41 83 2014 12 21 12 33 41 86 2014 12 21 12 34 41 88 2014 11 21 12 35 41 92
2015 12 20 12 31 39 77 2015 11 21 11 30 38 77 2015 11 21 11 31 37 79 2015 11 21 11 31 36 80 2015 11 22 11 31 36 82
2020 12 26 12 24 28 55 2020 11 26 11 23 26 53 2020 11 27 11 22 23 51 2020 10 27 10 21 20 48 2020 10 28 10 20 19 47
2025 10 24 10 21 24 47 2025 7 20 8 15 15 35 2025 8 23 8 15 13 33 2025 3 16 4 7 3 17 2025 5 21 5 9 3 19
Date Cl 1 C Cl 1 B Cl 1 O Cl 2 Cl 3 Cl 4 Date Cl 1 C Cl 1 B Cl 1 O Cl 2 Cl 3 Cl 4 Date Cl 1 C Cl 1 B Cl 1 O Cl 2 Cl 3 Cl 4 Date Cl 1 C Cl 1 B Cl 1 O Cl 2 Cl 3 Cl 4 Date Cl 1 C Cl 1 B Cl 1 O Cl 2 Cl 3 Cl 4
2011 -1 -1 -1 3 2 12 2011 -3 -3 -3 -1 -5 3 2011 -5 -5 -5 -5 -11 -5 2011 -7 -7 -7 -8 -17 -14 2011 -9 -9 -9 -12 -23 -23
2012 -1 -1 -1 3 2 12 2012 -3 -3 -3 -1 -5 3 2012 -5 -5 -5 -5 -11 -5 2012 -7 -7 -7 -8 -17 -14 2012 -9 -9 -9 -12 -23 -22
2013 -1 -1 -1 3 2 12 2013 -3 -3 -3 -1 -4 3 2013 -5 -5 -5 -5 -11 -5 2013 -7 -7 -7 -8 -17 -14 2013 -9 -9 -9 -12 -23 -22
2014 -1 -1 -1 3 2 12 2014 -3 -3 -3 -1 -4 3 2014 -5 -5 -5 -5 -11 -5 2014 -7 -7 -7 -8 -17 -14 2014 -9 -9 -9 -12 -23 -22
2015 -1 -1 -1 3 2 12 2015 -3 -3 -3 -1 -4 3 2015 -5 -5 -5 -5 -11 -5 2015 -7 -7 -7 -8 -17 -14 2015 -9 -9 -9 -12 -23 -22
2020 -1 -1 -1 3 2 12 2020 -3 -3 -3 -1 -4 3 2020 -5 -5 -5 -5 -11 -5 2020 -7 -7 -7 -8 -17 -14 2020 -8 -8 -8 -12 -23 -22
2025 -1 -1 -1 3 2 12 2025 -3 -3 -3 -1 -5 3 2025 -5 -5 -5 -5 -11 -5 2025 -7 -7 -7 -8 -17 -14 2025 -9 -9 -9 -12 -23 -23
Date Cl 1 C Cl 1 B Cl 1 O Cl 2 Cl 3 Cl 4 Date Cl 1 C Cl 1 B Cl 1 O Cl 2 Cl 3 Cl 4 Date Cl 1 C Cl 1 B Cl 1 O Cl 2 Cl 3 Cl 4 Date Cl 1 C Cl 1 B Cl 1 O Cl 2 Cl 3 Cl 4 Date Cl 1 C Cl 1 B Cl 1 O Cl 2 Cl 3 Cl 4
2011 -0 -0 -0 4 3 15 2011 -2 -2 -2 0 -3 6 2011 -4 -4 -4 -3 -9 -2 2011 -6 -6 -6 -7 -15 -11 2011 -8 -8 -8 -11 -22 -20
2012 -0 -0 -0 5 4 17 2012 -2 -2 -2 1 -2 8 2012 -4 -4 -4 -3 -8 -0 2012 -6 -6 -6 -7 -14 -9 2012 -8 -8 -8 -10 -21 -18
2013 0 0 0 6 6 19 2013 -2 -2 -2 2 -0 11 2013 -4 -3 -4 -2 -7 2 2013 -6 -5 -6 -5 -13 -6 2013 -7 -7 -7 -9 -19 -15
2014 1 1 1 8 8 24 2014 -1 -1 -1 4 2 15 2014 -3 -3 -3 0 -4 7 2014 -5 -5 -5 -4 -10 -2 2014 -7 -7 -7 -8 -17 -11
2015 1 2 1 9 11 28 2015 -0 -0 -0 6 4 20 2015 -2 -2 -2 2 -2 11 2015 -4 -4 -4 -2 -8 3 2015 -6 -6 -6 -6 -14 -6
2020 3 4 3 15 18 42 2020 1 2 1 11 12 33 2020 -0 -0 -0 7 6 25 2020 -2 -2 -2 3 -0 16 2020 -4 -4 -4 -1 -7 8
2025 4 4 4 16 20 46 2025 2 3 2 13 15 39 2025 0 1 0 9 9 30 2025 -2 -1 -2 5 3 22 2025 -4 -3 -4 2 -4 13
Morning Peak Hour - 30c Equiv Toll Rate Morning Peak Hour - 40c Equiv Toll Rate
Midday Off Peak - 30c Equiv Toll Rate Midday Off Peak - 40c Equiv Toll Rate
Weekend - 30c Equiv Toll Rate Weekend - 40c Equiv Toll Rate
Weekday Evening - 30c Equiv Toll Rate Weekday Evening - 40c Equiv Toll Rate Weekday Evening - 50c Equiv Toll Rate Weekday Evening - 60c Equiv Toll Rate Weekday Evening - 70c Equiv Toll Rate
Morning Peak Hour - 50c Equiv Toll Rate Morning Peak Hour - 60c Equiv Toll Rate Morning Peak Hour - 70c Equiv Toll Rate
Afternoon Peak Hour - 30c Equiv Toll Rate Afternoon Peak Hour - 40c Equiv Toll Rate Afternoon Peak Hour - 50c Equiv Toll Rate Afternoon Peak Hour - 60c Equiv Toll Rate Afternoon Peak Hour - 70c Equiv Toll Rate
Weekend - 50c Equiv Toll Rate Weekend - 60c Equiv Toll Rate Weekend - 70c Equiv Toll Rate
Midday Off Peak - 50c Equiv Toll Rate Midday Off Peak - 60c Equiv Toll Rate Midday Off Peak - 70c Equiv Toll Rate

Economic Analysis of the Gauteng Freeway Improvement Scheme 116
Buccleuch to 14th Avenue (Eastbound / Northbound)
Date Cl 1 C Cl 1 B Cl 1 O Cl 2 Cl 3 Cl 4 Date Cl 1 C Cl 1 B Cl 1 O Cl 2 Cl 3 Cl 4 Date Cl 1 C Cl 1 B Cl 1 O Cl 2 Cl 3 Cl 4 Date Cl 1 C Cl 1 B Cl 1 O Cl 2 Cl 3 Cl 4 Date Cl 1 C Cl 1 B Cl 1 O Cl 2 Cl 3 Cl 4
2011 9 28 10 16 15 33 2011 7 25 7 11 7 23 2011 6 27 7 9 2 17 2011 5 28 5 6 -4 9 2011 4 28 4 3 -10 2
2012 9 27 10 16 16 35 2012 7 25 7 12 8 25 2012 6 27 6 9 2 18 2012 5 27 5 5 -4 9 2012 3 27 4 3 -10 2
2013 10 27 10 17 17 38 2013 7 26 8 13 9 27 2013 6 26 6 9 3 19 2013 5 26 5 6 -4 10 2013 3 26 3 3 -10 3
2014 10 27 10 18 19 40 2014 8 26 8 14 11 31 2014 6 26 6 10 4 22 2014 4 25 5 6 -3 12 2014 3 25 3 2 -10 3
2015 10 27 10 18 19 40 2015 8 26 8 14 12 31 2015 6 25 6 10 4 21 2015 4 24 4 6 -4 11 2015 2 23 2 2 -11 2
2020 3 11 3 8 6 21 2020 1 10 1 3 -2 10 2020 0 13 0 1 -8 3 2020 -5 5 -5 -7 -20 -14 2020 -4 11 -4 -8 -23 -18
2025 -3 -7 -3 4 3 21 2025 -6 -10 -6 -1 -6 8 2025 -9 -13 -9 -7 -15 -5 2025 -12 -16 -12 -13 -25 -18 2025 -15 -19 -15 -19 -34 -31
Date Cl 1 C Cl 1 B Cl 1 O Cl 2 Cl 3 Cl 4 Date Cl 1 C Cl 1 B Cl 1 O Cl 2 Cl 3 Cl 4 Date Cl 1 C Cl 1 B Cl 1 O Cl 2 Cl 3 Cl 4 Date Cl 1 C Cl 1 B Cl 1 O Cl 2 Cl 3 Cl 4 Date Cl 1 C Cl 1 B Cl 1 O Cl 2 Cl 3 Cl 4
2011 13 26 13 33 40 81 2011 11 24 11 29 33 73 2011 10 24 10 27 29 69 2011 8 23 8 24 24 64 2011 7 22 7 22 20 60
2012 13 27 14 32 39 79 2012 11 25 11 28 31 69 2012 10 25 10 26 27 65 2012 8 23 8 22 21 58 2012 7 23 7 20 16 53
2013 13 28 14 31 37 76 2013 11 26 11 26 29 65 2013 10 26 10 24 24 60 2013 8 24 8 20 18 52 2013 6 23 6 18 13 47
2014 14 30 14 31 36 73 2014 11 27 11 25 27 61 2014 10 27 10 23 22 55 2014 7 25 8 19 15 46 2014 6 24 6 16 9 40
2015 14 31 14 30 35 70 2015 11 28 11 24 25 56 2015 10 28 10 21 20 51 2015 7 26 8 17 12 41 2015 6 25 6 14 6 34
2020 18 43 19 35 41 78 2020 17 43 17 32 34 70 2020 15 42 16 29 28 63 2020 12 39 12 22 18 49 2020 11 40 12 21 14 45
2025 40 98 40 60 70 118 2025 36 93 36 52 57 100 2025 34 93 35 49 52 93 2025 33 93 33 46 45 84 2025 30 90 31 40 36 72
Date Cl 1 C Cl 1 B Cl 1 O Cl 2 Cl 3 Cl 4 Date Cl 1 C Cl 1 B Cl 1 O Cl 2 Cl 3 Cl 4 Date Cl 1 C Cl 1 B Cl 1 O Cl 2 Cl 3 Cl 4 Date Cl 1 C Cl 1 B Cl 1 O Cl 2 Cl 3 Cl 4 Date Cl 1 C Cl 1 B Cl 1 O Cl 2 Cl 3 Cl 4
2011 11 16 12 37 47 98 2011 10 14 10 34 42 92 2011 8 13 8 32 38 89 2011 7 11 7 30 33 85 2011 5 9 5 26 27 78
2012 12 16 12 37 48 99 2012 10 15 10 35 43 95 2012 9 14 9 33 39 91 2012 7 12 7 30 34 87 2012 5 10 5 28 29 82
2013 11 16 11 36 45 94 2013 10 15 10 34 42 93 2013 9 14 9 34 40 93 2013 7 13 7 31 35 88 2013 6 11 6 28 30 82
2014 11 16 11 34 43 90 2014 10 15 10 33 40 89 2014 9 15 9 33 39 91 2014 8 14 8 32 35 88 2014 6 12 6 29 30 83
2015 10 16 11 32 40 85 2015 9 15 9 31 38 84 2015 9 15 9 31 36 86 2015 8 14 8 31 34 86 2015 6 13 6 29 30 83
2020 12 22 12 31 38 79 2020 11 22 11 30 35 77 2020 10 21 10 29 32 77 2020 9 21 9 28 29 75 2020 8 20 8 27 27 74
2025 21 47 21 40 47 89 2025 18 45 19 35 39 78 2025 17 45 17 33 34 73 2025 15 43 15 29 27 64 2025 13 41 13 24 20 55
Date Cl 1 C Cl 1 B Cl 1 O Cl 2 Cl 3 Cl 4 Date Cl 1 C Cl 1 B Cl 1 O Cl 2 Cl 3 Cl 4 Date Cl 1 C Cl 1 B Cl 1 O Cl 2 Cl 3 Cl 4 Date Cl 1 C Cl 1 B Cl 1 O Cl 2 Cl 3 Cl 4 Date Cl 1 C Cl 1 B Cl 1 O Cl 2 Cl 3 Cl 4
2011 -4 -4 -4 -3 -8 -2 2011 -7 -7 -7 -9 -18 -15 2011 -10 -10 -10 -15 -27 -29 2011 -13 -13 -13 -21 -37 -41 2011 -15 -15 -15 -26 -46 -54
2012 -4 -4 -4 -3 -8 -2 2012 -7 -7 -7 -9 -18 -15 2012 -10 -10 -10 -15 -27 -28 2012 -13 -13 -13 -21 -36 -41 2012 -16 -16 -16 -26 -46 -54
2013 -4 -4 -4 -3 -8 -2 2013 -7 -7 -7 -9 -18 -15 2013 -10 -10 -10 -15 -27 -28 2013 -13 -13 -13 -21 -36 -41 2013 -16 -16 -16 -26 -46 -55
2014 -4 -4 -4 -3 -8 -2 2014 -7 -7 -7 -9 -18 -15 2014 -10 -10 -10 -15 -27 -28 2014 -13 -13 -13 -21 -36 -41 2014 -16 -16 -16 -27 -46 -55
2015 -4 -4 -4 -3 -8 -2 2015 -7 -7 -7 -9 -18 -15 2015 -10 -10 -10 -15 -27 -28 2015 -13 -13 -13 -21 -36 -41 2015 -16 -16 -16 -27 -46 -55
2020 -4 -4 -4 -3 -8 -2 2020 -7 -7 -7 -9 -17 -15 2020 -10 -10 -10 -15 -27 -28 2020 -13 -13 -13 -21 -37 -41 2020 -16 -16 -16 -26 -46 -55
2025 -4 -4 -4 -3 -8 -2 2025 -7 -7 -7 -9 -18 -15 2025 -10 -10 -10 -15 -27 -28 2025 -13 -13 -13 -21 -36 -41 2025 -15 -15 -15 -26 -46 -54
Date Cl 1 C Cl 1 B Cl 1 O Cl 2 Cl 3 Cl 4 Date Cl 1 C Cl 1 B Cl 1 O Cl 2 Cl 3 Cl 4 Date Cl 1 C Cl 1 B Cl 1 O Cl 2 Cl 3 Cl 4 Date Cl 1 C Cl 1 B Cl 1 O Cl 2 Cl 3 Cl 4 Date Cl 1 C Cl 1 B Cl 1 O Cl 2 Cl 3 Cl 4
2011 -2 -2 -2 1 -3 8 2011 -5 -5 -5 -5 -12 -5 2011 -8 -8 -8 -11 -21 -18 2011 -11 -11 -11 -17 -31 -31 2011 -14 -14 -14 -22 -40 -44
2012 -2 -1 -2 3 1 15 2012 -4 -4 -4 -2 -9 2 2012 -7 -7 -7 -8 -18 -12 2012 -10 -10 -10 -14 -28 -25 2012 -13 -13 -13 -20 -37 -38
2013 -1 -0 -1 6 4 21 2013 -4 -3 -4 0 -5 8 2013 -6 -6 -6 -6 -15 -5 2013 -9 -9 -9 -12 -24 -19 2013 -12 -12 -12 -18 -34 -32
2014 0 1 0 8 8 28 2014 -3 -2 -3 3 -1 15 2014 -6 -5 -6 -3 -11 1 2014 -8 -8 -8 -9 -20 -12 2014 -11 -11 -11 -15 -30 -25
2015 1 2 1 12 12 35 2015 -2 -1 -2 6 3 23 2015 -4 -4 -4 -0 -7 9 2015 -7 -7 -7 -6 -16 -4 2015 -10 -10 -10 -12 -25 -17
2020 7 9 7 26 33 72 2020 5 7 5 22 26 64 2020 2 4 2 18 18 54 2020 -0 2 -0 13 11 44 2020 -3 -1 -3 8 2 33
2025 9 15 9 29 36 76 2025 8 14 8 27 31 72 2025 6 13 7 25 28 71 2025 5 12 5 24 25 69 2025 4 10 4 22 21 67
Weekend - 30c Equiv Toll Rate Weekend - 40c Equiv Toll Rate Weekend - 50c Equiv Toll Rate Weekend - 60c Equiv Toll Rate Weekend - 70c Equiv Toll Rate
Weekday Evening - 30c Equiv Toll Rate Weekday Evening - 40c Equiv Toll Rate Weekday Evening - 50c Equiv Toll Rate Weekday Evening - 60c Equiv Toll Rate Weekday Evening - 70c Equiv Toll Rate
Midday Off Peak - 30c Equiv Toll Rate Midday Off Peak - 40c Equiv Toll Rate Midday Off Peak - 50c Equiv Toll Rate Midday Off Peak - 60c Equiv Toll Rate Midday Off Peak - 70c Equiv Toll Rate
Afternoon Peak Hour - 30c Equiv Toll Rate Afternoon Peak Hour - 40c Equiv Toll Rate Afternoon Peak Hour - 50c Equiv Toll Rate Afternoon Peak Hour - 60c Equiv Toll Rate Afternoon Peak Hour - 70c Equiv Toll Rate
Morning Peak Hour - 30c Equiv Toll Rate Morning Peak Hour - 40c Equiv Toll Rate Morning Peak Hour - 50c Equiv Toll Rate Morning Peak Hour - 60c Equiv Toll Rate Morning Peak Hour - 70c Equiv Toll Rate

Economic Analysis of the Gauteng Freeway Improvement Scheme 117
N1: 14th Avenue to Grasmere (Southbound)
Date Cl 1 C Cl 1 B Cl 1 O Cl 2 Cl 3 Cl 4 Date Cl 1 C Cl 1 B Cl 1 O Cl 2 Cl 3 Cl 4 Date Cl 1 C Cl 1 B Cl 1 O Cl 2 Cl 3 Cl 4 Date Cl 1 C Cl 1 B Cl 1 O Cl 2 Cl 3 Cl 4 Date Cl 1 C Cl 1 B Cl 1 O Cl 2 Cl 3 Cl 4
2011 20 33 20 49 64 121 2011 19 32 19 47 60 116 2011 18 31 18 45 57 114 2011 17 31 17 45 56 114 2011 16 30 16 43 52 109
2012 20 33 20 48 62 117 2012 18 32 18 45 58 112 2012 17 31 18 44 55 110 2012 17 31 17 43 53 108 2012 15 30 16 41 49 103
2013 19 33 19 46 60 113 2013 18 33 18 44 56 108 2013 17 32 17 43 53 106 2013 16 32 17 41 50 103 2013 15 31 15 39 46 98
2014 19 34 19 45 58 109 2014 18 33 18 43 54 104 2014 17 33 17 42 51 102 2014 16 32 16 40 48 98 2014 15 31 15 37 43 93
2015 19 34 19 44 56 105 2015 18 34 18 41 51 99 2015 17 34 17 40 50 98 2015 16 33 16 38 45 92 2015 15 32 15 36 41 87
2020 21 40 21 45 57 105 2020 18 36 18 39 48 93 2020 18 37 18 39 47 93 2020 17 38 17 38 44 90 2020 15 36 15 34 38 81
2025 21 47 22 39 48 86 2025 18 42 18 33 39 73 2025 20 48 20 35 40 76 2025 19 47 19 33 36 71 2025 16 44 16 28 29 61
Date Cl 1 C Cl 1 B Cl 1 O Cl 2 Cl 3 Cl 4 Date Cl 1 C Cl 1 B Cl 1 O Cl 2 Cl 3 Cl 4 Date Cl 1 C Cl 1 B Cl 1 O Cl 2 Cl 3 Cl 4 Date Cl 1 C Cl 1 B Cl 1 O Cl 2 Cl 3 Cl 4 Date Cl 1 C Cl 1 B Cl 1 O Cl 2 Cl 3 Cl 4
2011 19 32 20 48 62 117 2011 18 31 18 44 56 109 2011 16 30 17 42 52 105 2011 16 30 16 41 50 103 2011 14 29 15 39 46 98
2012 19 32 19 46 60 113 2012 17 31 17 43 54 105 2012 16 30 16 41 51 101 2012 15 30 15 39 47 98 2012 14 29 14 37 43 93
2013 19 32 19 44 57 108 2013 17 31 17 41 52 101 2013 16 31 16 40 49 98 2013 15 30 15 37 45 93 2013 14 30 14 35 41 88
2014 18 32 18 43 55 103 2014 17 31 17 40 50 97 2014 16 32 16 39 47 94 2014 15 30 15 36 42 88 2014 14 30 14 34 39 84
2015 18 32 18 41 52 98 2015 16 31 17 38 48 93 2015 16 32 16 37 45 91 2015 14 31 14 34 40 83 2015 13 31 14 32 36 79
2020 14 33 14 27 31 59 2020 12 31 12 22 24 47 2020 12 33 12 22 22 46 2020 9 27 9 16 13 34 2020 9 30 9 14 10 29
2025 -7 -24 -7 3 6 26 2025 -5 -16 -5 4 5 24 2025 -5 -13 -5 3 2 20 2025 -8 -19 -9 -2 -6 11 2025 -8 -16 -8 -2 -7 10
Date Cl 1 C Cl 1 B Cl 1 O Cl 2 Cl 3 Cl 4 Date Cl 1 C Cl 1 B Cl 1 O Cl 2 Cl 3 Cl 4 Date Cl 1 C Cl 1 B Cl 1 O Cl 2 Cl 3 Cl 4 Date Cl 1 C Cl 1 B Cl 1 O Cl 2 Cl 3 Cl 4 Date Cl 1 C Cl 1 B Cl 1 O Cl 2 Cl 3 Cl 4
2011 10 11 10 34 45 92 2011 9 10 9 32 42 87 2011 8 9 8 30 38 83 2011 6 8 7 28 34 79 2011 5 6 5 26 30 75
2012 11 13 11 37 49 98 2012 10 12 10 35 45 94 2012 9 11 9 33 42 90 2012 8 9 8 31 38 86 2012 6 8 7 29 35 82
2013 12 14 12 38 51 102 2013 11 13 11 37 48 99 2013 10 12 10 35 45 96 2013 9 11 9 33 41 92 2013 8 10 8 31 38 88
2014 13 15 13 40 53 105 2014 12 15 12 38 50 103 2014 11 14 11 38 48 102 2014 10 13 10 36 45 98 2014 9 12 9 34 41 94
2015 14 17 14 42 55 109 2015 13 16 13 40 52 106 2015 12 15 12 39 50 105 2015 11 14 11 38 47 102 2015 10 13 10 36 45 100
2020 16 24 16 43 56 109 2020 15 24 15 42 54 107 2020 14 23 15 41 52 106 2020 13 22 14 40 49 104 2020 13 22 13 39 48 104
2025 18 36 18 38 47 87 2025 15 33 15 32 39 75 2025 17 38 17 35 41 80 2025 12 30 12 25 27 59 2025 14 35 14 29 30 67
Date Cl 1 C Cl 1 B Cl 1 O Cl 2 Cl 3 Cl 4 Date Cl 1 C Cl 1 B Cl 1 O Cl 2 Cl 3 Cl 4 Date Cl 1 C Cl 1 B Cl 1 O Cl 2 Cl 3 Cl 4 Date Cl 1 C Cl 1 B Cl 1 O Cl 2 Cl 3 Cl 4 Date Cl 1 C Cl 1 B Cl 1 O Cl 2 Cl 3 Cl 4
2011 1 1 1 9 10 27 2011 -1 -1 -1 5 4 18 2011 -3 -3 -3 1 -3 9 2011 -5 -5 -5 -3 -9 0 2011 -7 -7 -7 -7 -16 -10
2012 1 1 1 9 10 27 2012 -1 -1 -1 5 4 18 2012 -3 -3 -3 1 -3 9 2012 -5 -5 -5 -3 -9 0 2012 -7 -7 -7 -7 -16 -10
2013 1 1 1 9 10 27 2013 -1 -1 -1 5 4 18 2013 -3 -3 -3 1 -3 9 2013 -5 -5 -5 -3 -9 0 2013 -7 -7 -7 -7 -16 -9
2014 1 1 1 9 10 27 2014 -1 -1 -1 5 4 18 2014 -3 -3 -3 1 -2 9 2014 -5 -5 -5 -3 -9 0 2014 -7 -7 -7 -7 -15 -9
2015 1 1 1 9 10 27 2015 -1 -1 -1 5 4 18 2015 -3 -3 -3 1 -2 10 2015 -5 -5 -5 -3 -9 0 2015 -7 -7 -7 -7 -15 -9
2020 1 1 1 9 10 27 2020 -1 -1 -1 5 4 18 2020 -3 -3 -3 1 -2 10 2020 -5 -5 -5 -3 -9 0 2020 -7 -7 -7 -7 -16 -10
2025 1 1 1 9 10 27 2025 -1 -1 -1 5 4 18 2025 -3 -3 -3 1 -2 10 2025 -5 -5 -5 -4 -10 -2 2025 -7 -7 -7 -7 -16 -10
Date Cl 1 C Cl 1 B Cl 1 O Cl 2 Cl 3 Cl 4 Date Cl 1 C Cl 1 B Cl 1 O Cl 2 Cl 3 Cl 4 Date Cl 1 C Cl 1 B Cl 1 O Cl 2 Cl 3 Cl 4 Date Cl 1 C Cl 1 B Cl 1 O Cl 2 Cl 3 Cl 4 Date Cl 1 C Cl 1 B Cl 1 O Cl 2 Cl 3 Cl 4
2011 1 1 1 9 10 27 2011 -1 -1 -1 5 4 19 2011 -2 -2 -2 2 -2 11 2011 -4 -4 -4 -2 -8 2 2011 -6 -6 -6 -6 -14 -6
2012 1 1 1 9 10 27 2012 -1 -1 -1 5 4 19 2012 -3 -2 -3 2 -2 10 2012 -4 -4 -4 -2 -8 2 2012 -6 -6 -6 -6 -14 -6
2013 1 1 1 9 10 27 2013 -1 -1 -1 5 4 19 2013 -3 -3 -3 1 -2 10 2013 -4 -4 -4 -2 -8 2 2013 -6 -6 -6 -6 -14 -6
2014 1 1 1 9 10 27 2014 -1 -1 -1 5 4 18 2014 -3 -3 -3 1 -2 10 2014 -4 -4 -4 -2 -8 2 2014 -6 -6 -6 -6 -14 -6
2015 1 1 1 9 10 27 2015 -1 -1 -1 5 4 18 2015 -3 -3 -3 1 -2 10 2015 -4 -4 -4 -2 -8 2 2015 -6 -6 -6 -6 -14 -6
2020 1 1 1 9 10 27 2020 -1 -1 -1 5 4 18 2020 -3 -3 -3 1 -2 9 2020 -4 -4 -4 -2 -8 1 2020 -6 -6 -6 -6 -14 -7
2025 1 2 1 10 11 29 2025 -0 -0 -0 6 5 20 2025 -2 -2 -2 2 -1 11 2025 -4 -4 -4 -2 -7 3 2025 -6 -6 -6 -5 -13 -5
Morning Peak Hour - 30c Equiv Toll Rate Morning Peak Hour - 40c Equiv Toll Rate Morning Peak Hour - 50c Equiv Toll Rate
Midday Off Peak - 30c Equiv Toll Rate Midday Off Peak - 40c Equiv Toll Rate Midday Off Peak - 50c Equiv Toll Rate
Weekend - 30c Equiv Toll Rate
Weekday Evening - 30c Equiv Toll Rate Weekday Evening - 40c Equiv Toll Rate Weekday Evening - 50c Equiv Toll Rate Weekday Evening - 60c Equiv Toll Rate Weekday Evening - 70c Equiv Toll Rate
Morning Peak Hour - 60c Equiv Toll Rate Morning Peak Hour - 70c Equiv Toll Rate
Afternoon Peak Hour - 30c Equiv Toll Rate Afternoon Peak Hour - 40c Equiv Toll Rate Afternoon Peak Hour - 50c Equiv Toll Rate Afternoon Peak Hour - 60c Equiv Toll Rate Afternoon Peak Hour - 70c Equiv Toll Rate
Weekend - 40c Equiv Toll Rate Weekend - 50c Equiv Toll Rate Weekend - 60c Equiv Toll Rate Weekend - 70c Equiv Toll Rate
Midday Off Peak - 60c Equiv Toll Rate Midday Off Peak - 70c Equiv Toll Rate
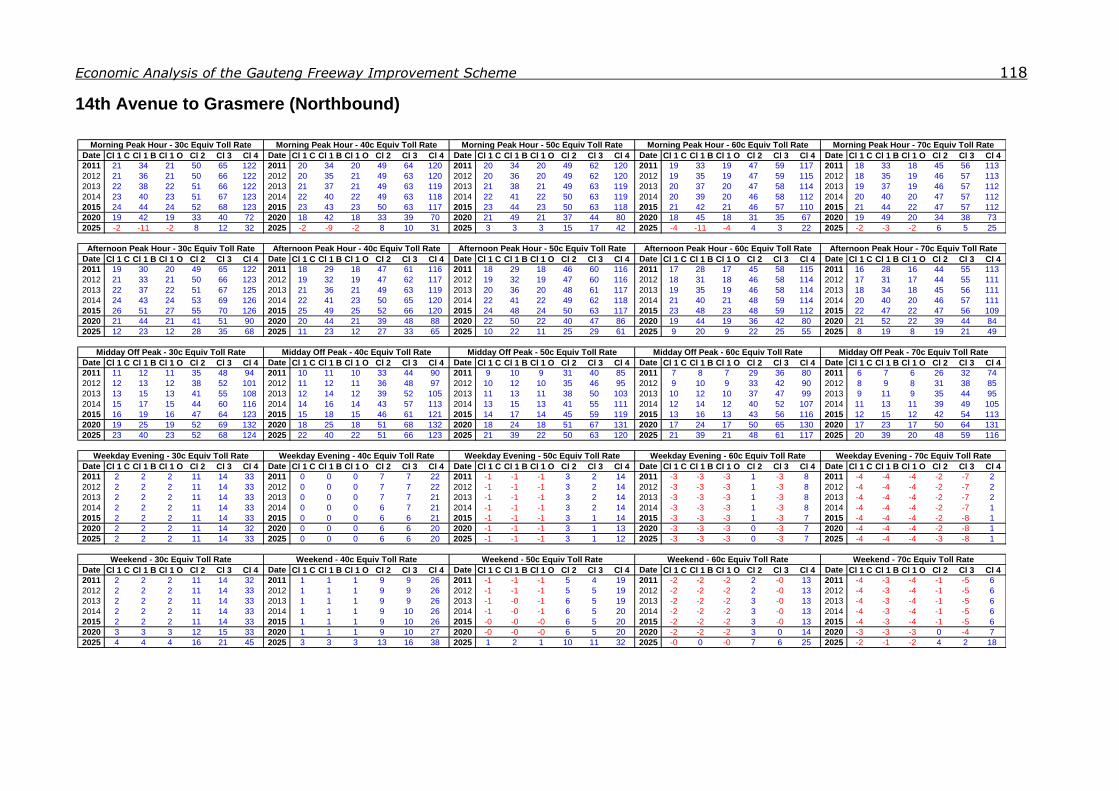
Economic Analysis of the Gauteng Freeway Improvement Scheme 118
14th Avenue to Grasmere (Northbound)
Date Cl 1 C Cl 1 B Cl 1 O Cl 2 Cl 3 Cl 4 Date Cl 1 C Cl 1 B Cl 1 O Cl 2 Cl 3 Cl 4 Date Cl 1 C Cl 1 B Cl 1 O Cl 2 Cl 3 Cl 4 Date Cl 1 C Cl 1 B Cl 1 O Cl 2 Cl 3 Cl 4 Date Cl 1 C Cl 1 B Cl 1 O Cl 2 Cl 3 Cl 4
2011 21 34 21 50 65 122 2011 20 34 20 49 64 120 2011 20 34 20 49 62 120 2011 19 33 19 47 59 117 2011 18 33 18 45 56 113
2012 21 36 21 50 66 122 2012 20 35 21 49 63 120 2012 20 36 20 49 62 120 2012 19 35 19 47 59 115 2012 18 35 19 46 57 113
2013 22 38 22 51 66 122 2013 21 37 21 49 63 119 2013 21 38 21 49 63 119 2013 20 37 20 47 58 114 2013 19 37 19 46 57 112
2014 23 40 23 51 67 123 2014 22 40 22 49 63 118 2014 22 41 22 50 63 119 2014 20 39 20 46 58 112 2014 20 40 20 47 57 112
2015 24 44 24 52 68 123 2015 23 43 23 50 63 117 2015 23 44 23 50 63 118 2015 21 42 21 46 57 110 2015 21 44 22 47 57 112
2020 19 42 19 33 40 72 2020 18 42 18 33 39 70 2020 21 49 21 37 44 80 2020 18 45 18 31 35 67 2020 19 49 20 34 38 73
2025 -2 -11 -2 8 12 32 2025 -2 -9 -2 8 10 31 2025 3 3 3 15 17 42 2025 -4 -11 -4 4 3 22 2025 -2 -3 -2 6 5 25
Date Cl 1 C Cl 1 B Cl 1 O Cl 2 Cl 3 Cl 4 Date Cl 1 C Cl 1 B Cl 1 O Cl 2 Cl 3 Cl 4 Date Cl 1 C Cl 1 B Cl 1 O Cl 2 Cl 3 Cl 4 Date Cl 1 C Cl 1 B Cl 1 O Cl 2 Cl 3 Cl 4 Date Cl 1 C Cl 1 B Cl 1 O Cl 2 Cl 3 Cl 4
2011 19 30 20 49 65 122 2011 18 29 18 47 61 116 2011 18 29 18 46 60 116 2011 17 28 17 45 58 115 2011 16 28 16 44 55 113
2012 21 33 21 50 66 123 2012 19 32 19 47 62 117 2012 19 32 19 47 60 116 2012 18 31 18 46 58 114 2012 17 31 17 44 55 111
2013 22 37 22 51 67 125 2013 21 36 21 49 63 119 2013 20 36 20 48 61 117 2013 19 35 19 46 58 114 2013 18 34 18 45 56 111
2014 24 43 24 53 69 126 2014 22 41 23 50 65 120 2014 22 41 22 49 62 118 2014 21 40 21 48 59 114 2014 20 40 20 46 57 111
2015 26 51 27 55 70 126 2015 25 49 25 52 66 120 2015 24 48 24 50 63 117 2015 23 48 23 48 59 112 2015 22 47 22 47 56 109
2020 21 44 21 41 51 90 2020 20 44 21 39 48 88 2020 22 50 22 40 47 86 2020 19 44 19 36 42 80 2020 21 52 22 39 44 84
2025 12 23 12 28 35 68 2025 11 23 12 27 33 65 2025 10 22 11 25 29 61 2025 9 20 9 22 25 55 2025 8 19 8 19 21 49
Date Cl 1 C Cl 1 B Cl 1 O Cl 2 Cl 3 Cl 4 Date Cl 1 C Cl 1 B Cl 1 O Cl 2 Cl 3 Cl 4 Date Cl 1 C Cl 1 B Cl 1 O Cl 2 Cl 3 Cl 4 Date Cl 1 C Cl 1 B Cl 1 O Cl 2 Cl 3 Cl 4 Date Cl 1 C Cl 1 B Cl 1 O Cl 2 Cl 3 Cl 4
2011 11 12 11 35 48 94 2011 10 11 10 33 44 90 2011 9 10 9 31 40 85 2011 7 8 7 29 36 80 2011 6 7 6 26 32 74
2012 12 13 12 38 52 101 2012 11 12 11 36 48 97 2012 10 12 10 35 46 95 2012 9 10 9 33 42 90 2012 8 9 8 31 38 85
2013 13 15 13 41 55 108 2013 12 14 12 39 52 105 2013 11 13 11 38 50 103 2013 10 12 10 37 47 99 2013 9 11 9 35 44 95
2014 15 17 15 44 60 116 2014 14 16 14 43 57 113 2014 13 15 13 41 55 111 2014 12 14 12 40 52 107 2014 11 13 11 39 49 105
2015 16 19 16 47 64 123 2015 15 18 15 46 61 121 2015 14 17 14 45 59 119 2015 13 16 13 43 56 116 2015 12 15 12 42 54 113
2020 19 25 19 52 69 132 2020 18 25 18 51 68 132 2020 18 24 18 51 67 131 2020 17 24 17 50 65 130 2020 17 23 17 50 64 131
2025 23 40 23 52 68 124 2025 22 40 22 51 66 123 2025 21 39 22 50 63 120 2025 21 39 21 48 61 117 2025 20 39 20 48 59 116
Date Cl 1 C Cl 1 B Cl 1 O Cl 2 Cl 3 Cl 4 Date Cl 1 C Cl 1 B Cl 1 O Cl 2 Cl 3 Cl 4 Date Cl 1 C Cl 1 B Cl 1 O Cl 2 Cl 3 Cl 4 Date Cl 1 C Cl 1 B Cl 1 O Cl 2 Cl 3 Cl 4 Date Cl 1 C Cl 1 B Cl 1 O Cl 2 Cl 3 Cl 4
2011 2 2 2 11 14 33 2011 0 0 0 7 7 22 2011 -1 -1 -1 3 2 14 2011 -3 -3 -3 1 -3 8 2011 -4 -4 -4 -2 -7 2
2012 2 2 2 11 14 33 2012 0 0 0 7 7 22 2012 -1 -1 -1 3 2 14 2012 -3 -3 -3 1 -3 8 2012 -4 -4 -4 -2 -7 2
2013 2 2 2 11 14 33 2013 0 0 0 7 7 21 2013 -1 -1 -1 3 2 14 2013 -3 -3 -3 1 -3 8 2013 -4 -4 -4 -2 -7 2
2014 2 2 2 11 14 33 2014 0 0 0 6 7 21 2014 -1 -1 -1 3 2 14 2014 -3 -3 -3 1 -3 8 2014 -4 -4 -4 -2 -7 1
2015 2 2 2 11 14 33 2015 0 0 0 6 6 21 2015 -1 -1 -1 3 1 14 2015 -3 -3 -3 1 -3 7 2015 -4 -4 -4 -2 -8 1
2020 2 2 2 11 14 32 2020 0 0 0 6 6 20 2020 -1 -1 -1 3 1 13 2020 -3 -3 -3 0 -3 7 2020 -4 -4 -4 -2 -8 1
2025 2 2 2 11 14 33 2025 0 0 0 6 6 20 2025 -1 -1 -1 3 1 12 2025 -3 -3 -3 0 -3 7 2025 -4 -4 -4 -3 -8 1
Date Cl 1 C Cl 1 B Cl 1 O Cl 2 Cl 3 Cl 4 Date Cl 1 C Cl 1 B Cl 1 O Cl 2 Cl 3 Cl 4 Date Cl 1 C Cl 1 B Cl 1 O Cl 2 Cl 3 Cl 4 Date Cl 1 C Cl 1 B Cl 1 O Cl 2 Cl 3 Cl 4 Date Cl 1 C Cl 1 B Cl 1 O Cl 2 Cl 3 Cl 4
2011 2 2 2 11 14 32 2011 1 1 1 9 9 26 2011 -1 -1 -1 5 4 19 2011 -2 -2 -2 2 -0 13 2011 -4 -3 -4 -1 -5 6
2012 2 2 2 11 14 33 2012 1 1 1 9 9 26 2012 -1 -1 -1 5 5 19 2012 -2 -2 -2 2 -0 13 2012 -4 -3 -4 -1 -5 6
2013 2 2 2 11 14 33 2013 1 1 1 9 9 26 2013 -1 -0 -1 6 5 19 2013 -2 -2 -2 3 -0 13 2013 -4 -3 -4 -1 -5 6
2014 2 2 2 11 14 33 2014 1 1 1 9 10 26 2014 -1 -0 -1 6 5 20 2014 -2 -2 -2 3 -0 13 2014 -4 -3 -4 -1 -5 6
2015 2 2 2 11 14 33 2015 1 1 1 9 10 26 2015 -0 -0 -0 6 5 20 2015 -2 -2 -2 3 -0 13 2015 -4 -3 -4 -1 -5 6
2020 3 3 3 12 15 33 2020 1 1 1 9 10 27 2020 -0 -0 -0 6 5 20 2020 -2 -2 -2 3 0 14 2020 -3 -3 -3 0 -4 7
2025 4 4 4 16 21 45 2025 3 3 3 13 16 38 2025 1 2 1 10 11 32 2025 -0 0 -0 7 6 25 2025 -2 -1 -2 4 2 18
Weekend - 30c Equiv Toll Rate Weekend - 40c Equiv Toll Rate Weekend - 50c Equiv Toll Rate Weekend - 60c Equiv Toll Rate Weekend - 70c Equiv Toll Rate
Weekday Evening - 60c Equiv Toll Rate Weekday Evening - 70c Equiv Toll RateWeekday Evening - 30c Equiv Toll Rate Weekday Evening - 40c Equiv Toll Rate Weekday Evening - 50c Equiv Toll Rate
Midday Off Peak - 30c Equiv Toll Rate Midday Off Peak - 40c Equiv Toll Rate Midday Off Peak - 50c Equiv Toll Rate Midday Off Peak - 60c Equiv Toll Rate Midday Off Peak - 70c Equiv Toll Rate
Afternoon Peak Hour - 30c Equiv Toll Rate Afternoon Peak Hour - 40c Equiv Toll Rate Afternoon Peak Hour - 50c Equiv Toll Rate Afternoon Peak Hour - 60c Equiv Toll Rate Afternoon Peak Hour - 70c Equiv Toll Rate
Morning Peak Hour - 60c Equiv Toll Rate Morning Peak Hour - 70c Equiv Toll RateMorning Peak Hour - 30c Equiv Toll Rate Morning Peak Hour - 40c Equiv Toll Rate Morning Peak Hour - 50c Equiv Toll Rate
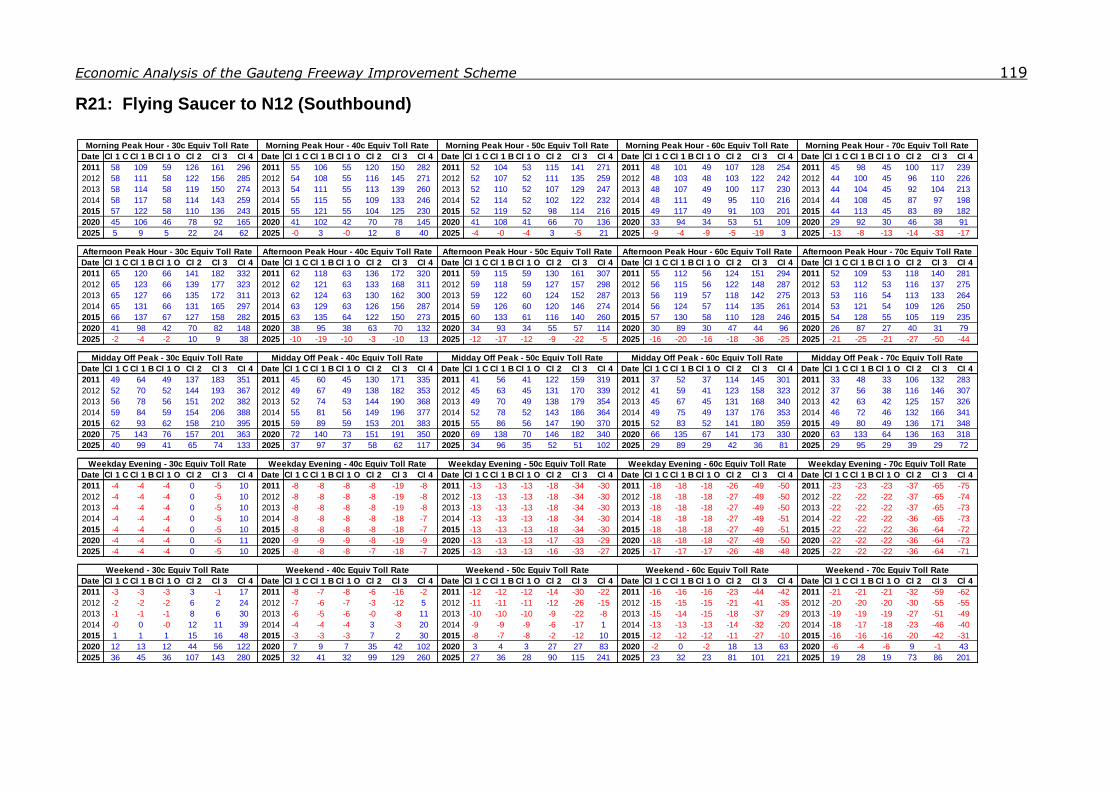
Economic Analysis of the Gauteng Freeway Improvement Scheme 119
R21: Flying Saucer to N12 (Southbound)
Date Cl 1 C Cl 1 B Cl 1 O Cl 2 Cl 3 Cl 4 Date Cl 1 C Cl 1 B Cl 1 O Cl 2 Cl 3 Cl 4 Date Cl 1 C Cl 1 B Cl 1 O Cl 2 Cl 3 Cl 4 Date Cl 1 C Cl 1 B Cl 1 O Cl 2 Cl 3 Cl 4 Date Cl 1 C Cl 1 B Cl 1 O Cl 2 Cl 3 Cl 4
2011 58 109 59 126 161 296 2011 55 106 55 120 150 282 2011 52 104 53 115 141 271 2011 48 101 49 107 128 254 2011 45 98 45 100 117 239
2012 58 111 58 122 156 285 2012 54 108 55 116 145 271 2012 52 107 52 111 135 259 2012 48 103 48 103 122 242 2012 44 100 45 96 110 226
2013 58 114 58 119 150 274 2013 54 111 55 113 139 260 2013 52 110 52 107 129 247 2013 48 107 49 100 117 230 2013 44 104 45 92 104 213
2014 58 117 58 114 143 259 2014 55 115 55 109 133 246 2014 52 114 52 102 122 232 2014 48 111 49 95 110 216 2014 44 108 45 87 97 198
2015 57 122 58 110 136 243 2015 55 121 55 104 125 230 2015 52 119 52 98 114 216 2015 49 117 49 91 103 201 2015 44 113 45 83 89 182
2020 45 106 46 78 92 165 2020 41 102 42 70 78 145 2020 41 108 41 66 70 136 2020 33 94 34 53 51 109 2020 29 92 30 46 38 91
2025 5 9 5 22 24 62 2025 -0 3 -0 12 8 40 2025 -4 -0 -4 3 -5 21 2025 -9 -4 -9 -5 -19 3 2025 -13 -8 -13 -14 -33 -17
Date Cl 1 C Cl 1 B Cl 1 O Cl 2 Cl 3 Cl 4 Date Cl 1 C Cl 1 B Cl 1 O Cl 2 Cl 3 Cl 4 Date Cl 1 C Cl 1 B Cl 1 O Cl 2 Cl 3 Cl 4 Date Cl 1 C Cl 1 B Cl 1 O Cl 2 Cl 3 Cl 4 Date Cl 1 C Cl 1 B Cl 1 O Cl 2 Cl 3 Cl 4
2011 65 120 66 141 182 332 2011 62 118 63 136 172 320 2011 59 115 59 130 161 307 2011 55 112 56 124 151 294 2011 52 109 53 118 140 281
2012 65 123 66 139 177 323 2012 62 121 63 133 168 311 2012 59 118 59 127 157 298 2012 56 115 56 122 148 287 2012 53 112 53 116 137 275
2013 65 127 66 135 172 311 2013 62 124 63 130 162 300 2013 59 122 60 124 152 287 2013 56 119 57 118 142 275 2013 53 116 54 113 133 264
2014 65 131 66 131 165 297 2014 63 129 63 126 156 287 2014 59 126 60 120 146 274 2014 56 124 57 114 135 261 2014 53 121 54 109 126 250
2015 66 137 67 127 158 282 2015 63 135 64 122 150 273 2015 60 133 61 116 140 260 2015 57 130 58 110 128 246 2015 54 128 55 105 119 235
2020 41 98 42 70 82 148 2020 38 95 38 63 70 132 2020 34 93 34 55 57 114 2020 30 89 30 47 44 96 2020 26 87 27 40 31 79
2025 -2 -4 -2 10 9 38 2025 -10 -19 -10 -3 -10 13 2025 -12 -17 -12 -9 -22 -5 2025 -16 -20 -16 -18 -36 -25 2025 -21 -25 -21 -27 -50 -44
Date Cl 1 C Cl 1 B Cl 1 O Cl 2 Cl 3 Cl 4 Date Cl 1 C Cl 1 B Cl 1 O Cl 2 Cl 3 Cl 4 Date Cl 1 C Cl 1 B Cl 1 O Cl 2 Cl 3 Cl 4 Date Cl 1 C Cl 1 B Cl 1 O Cl 2 Cl 3 Cl 4 Date Cl 1 C Cl 1 B Cl 1 O Cl 2 Cl 3 Cl 4
2011 49 64 49 137 183 351 2011 45 60 45 130 171 335 2011 41 56 41 122 159 319 2011 37 52 37 114 145 301 2011 33 48 33 106 132 283
2012 52 70 52 144 193 367 2012 49 67 49 138 182 353 2012 45 63 45 131 170 339 2012 41 59 41 123 158 323 2012 37 56 38 116 146 307
2013 56 78 56 151 202 382 2013 52 74 53 144 190 368 2013 49 70 49 138 179 354 2013 45 67 45 131 168 340 2013 42 63 42 125 157 326
2014 59 84 59 154 206 388 2014 55 81 56 149 196 377 2014 52 78 52 143 186 364 2014 49 75 49 137 176 353 2014 46 72 46 132 166 341
2015 62 93 62 158 210 395 2015 59 89 59 153 201 383 2015 55 86 56 147 190 370 2015 52 83 52 141 180 359 2015 49 80 49 136 171 348
2020 75 143 76 157 201 363 2020 72 140 73 151 191 350 2020 69 138 70 146 182 340 2020 66 135 67 141 173 330 2020 63 133 64 136 163 318
2025 40 99 41 65 74 133 2025 37 97 37 58 62 117 2025 34 96 35 52 51 102 2025 29 89 29 42 36 81 2025 29 95 29 39 29 72
Date Cl 1 C Cl 1 B Cl 1 O Cl 2 Cl 3 Cl 4 Date Cl 1 C Cl 1 B Cl 1 O Cl 2 Cl 3 Cl 4 Date Cl 1 C Cl 1 B Cl 1 O Cl 2 Cl 3 Cl 4 Date Cl 1 C Cl 1 B Cl 1 O Cl 2 Cl 3 Cl 4 Date Cl 1 C Cl 1 B Cl 1 O Cl 2 Cl 3 Cl 4
2011 -4 -4 -4 0 -5 10 2011 -8 -8 -8 -8 -19 -8 2011 -13 -13 -13 -18 -34 -30 2011 -18 -18 -18 -26 -49 -50 2011 -23 -23 -23 -37 -65 -75
2012 -4 -4 -4 0 -5 10 2012 -8 -8 -8 -8 -19 -8 2012 -13 -13 -13 -18 -34 -30 2012 -18 -18 -18 -27 -49 -50 2012 -22 -22 -22 -37 -65 -74
2013 -4 -4 -4 0 -5 10 2013 -8 -8 -8 -8 -19 -8 2013 -13 -13 -13 -18 -34 -30 2013 -18 -18 -18 -27 -49 -50 2013 -22 -22 -22 -37 -65 -73
2014 -4 -4 -4 0 -5 10 2014 -8 -8 -8 -8 -18 -7 2014 -13 -13 -13 -18 -34 -30 2014 -18 -18 -18 -27 -49 -51 2014 -22 -22 -22 -36 -65 -73
2015 -4 -4 -4 0 -5 10 2015 -8 -8 -8 -8 -18 -7 2015 -13 -13 -13 -18 -34 -30 2015 -18 -18 -18 -27 -49 -51 2015 -22 -22 -22 -36 -64 -72
2020 -4 -4 -4 0 -5 11 2020 -9 -9 -9 -8 -19 -9 2020 -13 -13 -13 -17 -33 -29 2020 -18 -18 -18 -27 -49 -50 2020 -22 -22 -22 -36 -64 -73
2025 -4 -4 -4 0 -5 10 2025 -8 -8 -8 -7 -18 -7 2025 -13 -13 -13 -16 -33 -27 2025 -17 -17 -17 -26 -48 -48 2025 -22 -22 -22 -36 -64 -71
Date Cl 1 C Cl 1 B Cl 1 O Cl 2 Cl 3 Cl 4 Date Cl 1 C Cl 1 B Cl 1 O Cl 2 Cl 3 Cl 4 Date Cl 1 C Cl 1 B Cl 1 O Cl 2 Cl 3 Cl 4 Date Cl 1 C Cl 1 B Cl 1 O Cl 2 Cl 3 Cl 4 Date Cl 1 C Cl 1 B Cl 1 O Cl 2 Cl 3 Cl 4
2011 -3 -3 -3 3 -1 17 2011 -8 -7 -8 -6 -16 -2 2011 -12 -12 -12 -14 -30 -22 2011 -16 -16 -16 -23 -44 -42 2011 -21 -21 -21 -32 -59 -62
2012 -2 -2 -2 6 2 24 2012 -7 -6 -7 -3 -12 5 2012 -11 -11 -11 -12 -26 -15 2012 -15 -15 -15 -21 -41 -35 2012 -20 -20 -20 -30 -55 -55
2013 -1 -1 -1 8 6 30 2013 -6 -5 -6 -0 -8 11 2013 -10 -10 -10 -9 -22 -8 2013 -15 -14 -15 -18 -37 -29 2013 -19 -19 -19 -27 -51 -49
2014 -0 0 -0 12 11 39 2014 -4 -4 -4 3 -3 20 2014 -9 -9 -9 -6 -17 1 2014 -13 -13 -13 -14 -32 -20 2014 -18 -17 -18 -23 -46 -40
2015 1 1 1 15 16 48 2015 -3 -3 -3 7 2 30 2015 -8 -7 -8 -2 -12 10 2015 -12 -12 -12 -11 -27 -10 2015 -16 -16 -16 -20 -42 -31
2020 12 13 12 44 56 122 2020 7 9 7 35 42 102 2020 3 4 3 27 27 83 2020 -2 0 -2 18 13 63 2020 -6 -4 -6 9 -1 43
2025 36 45 36 107 143 280 2025 32 41 32 99 129 260 2025 27 36 28 90 115 241 2025 23 32 23 81 101 221 2025 19 28 19 73 86 201
Morning Peak Hour - 30c Equiv Toll Rate Morning Peak Hour - 40c Equiv Toll Rate
Midday Off Peak - 30c Equiv Toll Rate Midday Off Peak - 40c Equiv Toll Rate
Weekend - 30c Equiv Toll Rate Weekend - 40c Equiv Toll Rate
Weekday Evening - 30c Equiv Toll Rate Weekday Evening - 40c Equiv Toll Rate Weekday Evening - 50c Equiv Toll Rate Weekday Evening - 60c Equiv Toll Rate Weekday Evening - 70c Equiv Toll Rate
Morning Peak Hour - 50c Equiv Toll Rate Morning Peak Hour - 60c Equiv Toll Rate Morning Peak Hour - 70c Equiv Toll Rate
Afternoon Peak Hour - 30c Equiv Toll Rate Afternoon Peak Hour - 40c Equiv Toll Rate Afternoon Peak Hour - 50c Equiv Toll Rate Afternoon Peak Hour - 60c Equiv Toll Rate Afternoon Peak Hour - 70c Equiv Toll Rate
Weekend - 50c Equiv Toll Rate Weekend - 60c Equiv Toll Rate Weekend - 70c Equiv Toll Rate
Midday Off Peak - 50c Equiv Toll Rate Midday Off Peak - 60c Equiv Toll Rate Midday Off Peak - 70c Equiv Toll Rate

Economic Analysis of the Gauteng Freeway Improvement Scheme 120
R21: Flying Saucer to N12 (Northbound)
Date Cl 1 C Cl 1 B Cl 1 O Cl 2 Cl 3 Cl 4 Date Cl 1 C Cl 1 B Cl 1 O Cl 2 Cl 3 Cl 4 Date Cl 1 C Cl 1 B Cl 1 O Cl 2 Cl 3 Cl 4 Date Cl 1 C Cl 1 B Cl 1 O Cl 2 Cl 3 Cl 4 Date Cl 1 C Cl 1 B Cl 1 O Cl 2 Cl 3 Cl 4
2011 69 119 69 157 205 377 2011 66 116 66 152 196 366 2011 63 114 64 148 188 358 2011 60 111 61 143 179 347 2011 57 108 57 136 167 333
2012 71 126 71 158 205 375 2012 68 123 68 152 195 363 2012 65 120 65 148 187 355 2012 62 117 62 143 178 344 2012 58 114 59 136 167 330
2013 73 133 73 158 204 372 2013 69 130 70 152 194 359 2013 67 127 67 148 186 351 2013 64 124 64 142 176 339 2013 60 121 61 136 165 325
2014 75 141 76 158 203 368 2014 72 138 72 152 193 355 2014 69 136 70 148 185 346 2014 66 133 66 142 175 334 2014 62 130 63 136 164 320
2015 78 151 79 159 203 363 2015 74 148 75 152 192 349 2015 72 146 72 148 184 341 2015 68 143 69 142 173 328 2015 65 140 66 136 163 315
2020 64 148 65 109 130 226 2020 62 146 63 103 121 214 2020 59 146 60 99 112 204 2020 56 144 57 93 101 190 2020 53 141 54 86 89 174
2025 -1 8 -0 3 -3 11 2025 -5 3 -5 -5 -17 -7 2025 -10 -2 -9 -15 -32 -29 2025 -13 -4 -13 -22 -45 -46 2025 -16 -4 -16 -29 -57 -63
Date Cl 1 C Cl 1 B Cl 1 O Cl 2 Cl 3 Cl 4 Date Cl 1 C Cl 1 B Cl 1 O Cl 2 Cl 3 Cl 4 Date Cl 1 C Cl 1 B Cl 1 O Cl 2 Cl 3 Cl 4 Date Cl 1 C Cl 1 B Cl 1 O Cl 2 Cl 3 Cl 4 Date Cl 1 C Cl 1 B Cl 1 O Cl 2 Cl 3 Cl 4
2011 79 135 80 181 237 434 2011 77 133 77 177 230 427 2011 74 130 74 171 220 414 2011 70 128 71 166 210 402 2011 67 125 68 161 201 392
2012 80 142 80 175 228 414 2012 77 140 78 172 221 407 2012 74 138 75 166 211 396 2012 71 135 72 161 202 384 2012 68 132 69 155 192 373
2013 79 150 80 166 214 385 2013 77 148 78 162 206 376 2013 74 146 75 157 196 365 2013 71 143 72 152 187 354 2013 68 141 69 147 178 344
2014 80 160 81 157 199 353 2014 77 159 78 152 190 342 2014 74 157 75 147 181 332 2014 72 155 72 142 171 321 2014 69 153 70 137 162 310
2015 82 176 83 149 185 322 2015 79 174 80 143 174 309 2015 77 172 78 138 166 299 2015 74 171 75 133 156 288 2015 71 169 72 128 147 276
2020 47 113 48 78 91 161 2020 41 105 42 67 75 138 2020 37 101 38 60 62 120 2020 35 102 36 55 52 108 2020 32 101 33 48 40 93
2025 9 15 9 31 37 86 2025 4 10 4 22 23 66 2025 -0 6 -0 13 8 46 2025 -5 2 -4 5 -6 27 2025 -9 -3 -9 -3 -20 8
Date Cl 1 C Cl 1 B Cl 1 O Cl 2 Cl 3 Cl 4 Date Cl 1 C Cl 1 B Cl 1 O Cl 2 Cl 3 Cl 4 Date Cl 1 C Cl 1 B Cl 1 O Cl 2 Cl 3 Cl 4 Date Cl 1 C Cl 1 B Cl 1 O Cl 2 Cl 3 Cl 4 Date Cl 1 C Cl 1 B Cl 1 O Cl 2 Cl 3 Cl 4
2011 47 60 47 134 180 346 2011 43 57 43 127 168 331 2011 39 53 40 120 156 314 2011 35 49 35 112 142 296 2011 31 44 31 103 129 277
2012 52 69 52 144 193 368 2012 48 65 48 137 181 353 2012 44 62 45 130 170 338 2012 41 58 41 123 157 322 2012 37 54 37 116 145 307
2013 57 78 57 152 204 386 2013 53 75 53 146 193 374 2013 50 71 50 140 182 359 2013 46 68 46 133 170 344 2013 42 64 42 126 158 328
2014 61 88 61 159 212 398 2014 58 86 58 154 203 389 2014 55 83 55 148 193 377 2014 51 79 51 142 182 363 2014 48 76 48 136 171 350
2015 65 100 65 162 215 401 2015 62 98 63 158 207 393 2015 59 95 60 154 199 385 2015 56 92 57 149 190 374 2015 53 89 54 144 181 365
2020 81 161 82 161 205 364 2020 78 159 79 156 196 354 2020 76 157 77 152 187 345 2020 73 155 74 146 178 333 2020 70 152 71 141 168 322
2025 38 91 39 66 77 140 2025 35 90 36 60 65 125 2025 33 91 34 54 54 109 2025 24 75 25 41 36 85 2025 27 87 27 41 32 80
Date Cl 1 C Cl 1 B Cl 1 O Cl 2 Cl 3 Cl 4 Date Cl 1 C Cl 1 B Cl 1 O Cl 2 Cl 3 Cl 4 Date Cl 1 C Cl 1 B Cl 1 O Cl 2 Cl 3 Cl 4 Date Cl 1 C Cl 1 B Cl 1 O Cl 2 Cl 3 Cl 4 Date Cl 1 C Cl 1 B Cl 1 O Cl 2 Cl 3 Cl 4
2011 -4 -4 -4 1 -4 12 2011 -8 -8 -8 -8 -18 -7 2011 -13 -13 -13 -18 -35 -31 2011 -18 -18 -18 -27 -49 -52 2011 -22 -22 -22 -35 -63 -70
2012 -4 -4 -4 1 -4 12 2012 -8 -8 -8 -8 -18 -7 2012 -13 -13 -13 -18 -35 -31 2012 -18 -18 -18 -27 -49 -51 2012 -22 -22 -22 -35 -63 -70
2013 -4 -4 -4 1 -4 12 2013 -8 -8 -8 -8 -18 -7 2013 -13 -13 -13 -18 -35 -31 2013 -18 -18 -18 -27 -49 -51 2013 -22 -22 -22 -35 -63 -70
2014 -4 -4 -4 1 -5 12 2014 -8 -8 -8 -8 -18 -7 2014 -13 -13 -13 -18 -34 -30 2014 -18 -18 -18 -26 -49 -50 2014 -22 -22 -22 -35 -63 -70
2015 -4 -4 -4 1 -5 11 2015 -8 -8 -8 -8 -18 -7 2015 -13 -13 -13 -18 -34 -30 2015 -17 -17 -17 -26 -48 -50 2015 -22 -22 -22 -35 -63 -70
2020 -4 -4 -4 -0 -6 9 2020 -8 -8 -8 -7 -18 -6 2020 -13 -13 -13 -17 -33 -28 2020 -18 -18 -18 -27 -49 -51 2020 -22 -22 -22 -35 -63 -71
2025 -4 -4 -4 -0 -6 9 2025 -8 -8 -8 -8 -18 -7 2025 -13 -13 -13 -17 -33 -28 2025 -18 -18 -18 -26 -49 -50 2025 -22 -22 -22 -36 -64 -71
Date Cl 1 C Cl 1 B Cl 1 O Cl 2 Cl 3 Cl 4 Date Cl 1 C Cl 1 B Cl 1 O Cl 2 Cl 3 Cl 4 Date Cl 1 C Cl 1 B Cl 1 O Cl 2 Cl 3 Cl 4 Date Cl 1 C Cl 1 B Cl 1 O Cl 2 Cl 3 Cl 4 Date Cl 1 C Cl 1 B Cl 1 O Cl 2 Cl 3 Cl 4
2011 -4 -4 -4 0 -5 10 2011 -9 -8 -9 -8 -19 -9 2011 -13 -13 -13 -17 -34 -30 2011 -18 -17 -18 -26 -49 -50 2011 -22 -22 -22 -35 -63 -70
2012 -4 -4 -4 1 -4 13 2012 -8 -8 -8 -7 -18 -6 2012 -13 -13 -13 -16 -33 -27 2012 -17 -17 -17 -25 -47 -47 2012 -22 -21 -22 -34 -62 -67
2013 -3 -3 -3 3 -2 16 2013 -8 -8 -8 -6 -16 -4 2013 -12 -12 -12 -15 -31 -24 2013 -17 -17 -17 -24 -46 -44 2013 -21 -21 -21 -33 -60 -64
2014 -3 -3 -3 4 -1 19 2014 -7 -7 -7 -5 -15 -1 2014 -12 -12 -12 -14 -29 -21 2014 -16 -16 -16 -23 -44 -41 2014 -21 -21 -21 -32 -58 -61
2015 -3 -2 -3 5 1 22 2015 -7 -7 -7 -4 -13 2 2015 -11 -11 -11 -13 -28 -18 2015 -16 -16 -16 -22 -42 -38 2015 -20 -20 -20 -31 -57 -59
2020 3 3 3 19 21 58 2020 -2 -1 -2 10 7 39 2020 -6 -6 -6 2 -7 19 2020 -11 -10 -11 -7 -22 -1 2020 -15 -15 -15 -16 -36 -21
2025 24 28 24 77 101 205 2025 20 24 20 68 87 185 2025 15 20 15 60 73 165 2025 11 15 11 51 59 146 2025 6 11 6 42 44 126
Weekend - 30c Equiv Toll Rate Weekend - 40c Equiv Toll Rate Weekend - 50c Equiv Toll Rate Weekend - 60c Equiv Toll Rate Weekend - 70c Equiv Toll Rate
Weekday Evening - 30c Equiv Toll Rate Weekday Evening - 40c Equiv Toll Rate Weekday Evening - 50c Equiv Toll Rate Weekday Evening - 60c Equiv Toll Rate Weekday Evening - 70c Equiv Toll Rate
Midday Off Peak - 50c Equiv Toll Rate Midday Off Peak - 60c Equiv Toll Rate Midday Off Peak - 70c Equiv Toll RateMidday Off Peak - 30c Equiv Toll Rate Midday Off Peak - 40c Equiv Toll Rate
Afternoon Peak Hour - 30c Equiv Toll Rate Afternoon Peak Hour - 40c Equiv Toll Rate Afternoon Peak Hour - 50c Equiv Toll Rate Afternoon Peak Hour - 60c Equiv Toll Rate Afternoon Peak Hour - 70c Equiv Toll Rate
Morning Peak Hour - 30c Equiv Toll Rate Morning Peak Hour - 40c Equiv Toll Rate Morning Peak Hour - 50c Equiv Toll Rate Morning Peak Hour - 60c Equiv Toll Rate Morning Peak Hour - 70c Equiv Toll Rate
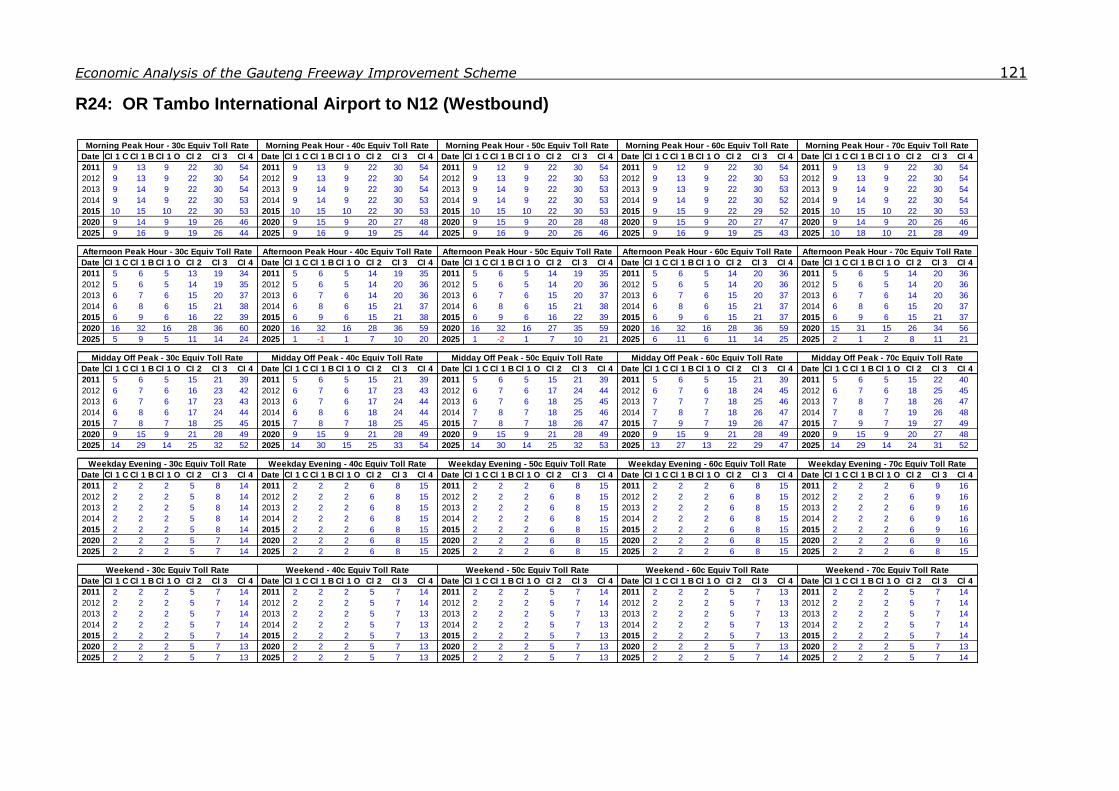
Economic Analysis of the Gauteng Freeway Improvement Scheme 121
R24: OR Tambo International Airport to N12 (Westbound)
Date Cl 1 C Cl 1 B Cl 1 O Cl 2 Cl 3 Cl 4 Date Cl 1 C Cl 1 B Cl 1 O Cl 2 Cl 3 Cl 4 Date Cl 1 C Cl 1 B Cl 1 O Cl 2 Cl 3 Cl 4 Date Cl 1 C Cl 1 B Cl 1 O Cl 2 Cl 3 Cl 4 Date Cl 1 C Cl 1 B Cl 1 O Cl 2 Cl 3 Cl 4
2011 9 13 9 22 30 54 2011 9 13 9 22 30 54 2011 9 12 9 22 30 54 2011 9 12 9 22 30 54 2011 9 13 9 22 30 54
2012 9 13 9 22 30 54 2012 9 13 9 22 30 54 2012 9 13 9 22 30 53 2012 9 13 9 22 30 53 2012 9 13 9 22 30 54
2013 9 14 9 22 30 54 2013 9 14 9 22 30 54 2013 9 14 9 22 30 53 2013 9 13 9 22 30 53 2013 9 14 9 22 30 54
2014 9 14 9 22 30 53 2014 9 14 9 22 30 53 2014 9 14 9 22 30 53 2014 9 14 9 22 30 52 2014 9 14 9 22 30 54
2015 10 15 10 22 30 53 2015 10 15 10 22 30 53 2015 10 15 10 22 30 53 2015 9 15 9 22 29 52 2015 10 15 10 22 30 53
2020 9 14 9 19 26 46 2020 9 15 9 20 27 48 2020 9 15 9 20 28 48 2020 9 15 9 20 27 47 2020 9 14 9 20 26 46
2025 9 16 9 19 26 44 2025 9 16 9 19 25 44 2025 9 16 9 20 26 46 2025 9 16 9 19 25 43 2025 10 18 10 21 28 49
Date Cl 1 C Cl 1 B Cl 1 O Cl 2 Cl 3 Cl 4 Date Cl 1 C Cl 1 B Cl 1 O Cl 2 Cl 3 Cl 4 Date Cl 1 C Cl 1 B Cl 1 O Cl 2 Cl 3 Cl 4 Date Cl 1 C Cl 1 B Cl 1 O Cl 2 Cl 3 Cl 4 Date Cl 1 C Cl 1 B Cl 1 O Cl 2 Cl 3 Cl 4
2011 5 6 5 13 19 34 2011 5 6 5 14 19 35 2011 5 6 5 14 19 35 2011 5 6 5 14 20 36 2011 5 6 5 14 20 36
2012 5 6 5 14 19 35 2012 5 6 5 14 20 36 2012 5 6 5 14 20 36 2012 5 6 5 14 20 36 2012 5 6 5 14 20 36
2013 6 7 6 15 20 37 2013 6 7 6 14 20 36 2013 6 7 6 15 20 37 2013 6 7 6 15 20 37 2013 6 7 6 14 20 36
2014 6 8 6 15 21 38 2014 6 8 6 15 21 37 2014 6 8 6 15 21 38 2014 6 8 6 15 21 37 2014 6 8 6 15 20 37
2015 6 9 6 16 22 39 2015 6 9 6 15 21 38 2015 6 9 6 16 22 39 2015 6 9 6 15 21 37 2015 6 9 6 15 21 37
2020 16 32 16 28 36 60 2020 16 32 16 28 36 59 2020 16 32 16 27 35 59 2020 16 32 16 28 36 59 2020 15 31 15 26 34 56
2025 5 9 5 11 14 24 2025 1 -1 1 7 10 20 2025 1 -2 1 7 10 21 2025 6 11 6 11 14 25 2025 2 1 2 8 11 21
Date Cl 1 C Cl 1 B Cl 1 O Cl 2 Cl 3 Cl 4 Date Cl 1 C Cl 1 B Cl 1 O Cl 2 Cl 3 Cl 4 Date Cl 1 C Cl 1 B Cl 1 O Cl 2 Cl 3 Cl 4 Date Cl 1 C Cl 1 B Cl 1 O Cl 2 Cl 3 Cl 4 Date Cl 1 C Cl 1 B Cl 1 O Cl 2 Cl 3 Cl 4
2011 5 6 5 15 21 39 2011 5 6 5 15 21 39 2011 5 6 5 15 21 39 2011 5 6 5 15 21 39 2011 5 6 5 15 22 40
2012 6 7 6 16 23 42 2012 6 7 6 17 23 43 2012 6 7 6 17 24 44 2012 6 7 6 18 24 45 2012 6 7 6 18 25 45
2013 6 7 6 17 23 43 2013 6 7 6 17 24 44 2013 6 7 6 18 25 45 2013 7 7 7 18 25 46 2013 7 8 7 18 26 47
2014 6 8 6 17 24 44 2014 6 8 6 18 24 44 2014 7 8 7 18 25 46 2014 7 8 7 18 26 47 2014 7 8 7 19 26 48
2015 7 8 7 18 25 45 2015 7 8 7 18 25 45 2015 7 8 7 18 26 47 2015 7 9 7 19 26 47 2015 7 9 7 19 27 49
2020 9 15 9 21 28 49 2020 9 15 9 21 28 49 2020 9 15 9 21 28 49 2020 9 15 9 21 28 49 2020 9 15 9 20 27 48
2025 14 29 14 25 32 52 2025 14 30 15 25 33 54 2025 14 30 14 25 32 53 2025 13 27 13 22 29 47 2025 14 29 14 24 31 52
Date Cl 1 C Cl 1 B Cl 1 O Cl 2 Cl 3 Cl 4 Date Cl 1 C Cl 1 B Cl 1 O Cl 2 Cl 3 Cl 4 Date Cl 1 C Cl 1 B Cl 1 O Cl 2 Cl 3 Cl 4 Date Cl 1 C Cl 1 B Cl 1 O Cl 2 Cl 3 Cl 4 Date Cl 1 C Cl 1 B Cl 1 O Cl 2 Cl 3 Cl 4
2011 2 2 2 5 8 14 2011 2 2 2 6 8 15 2011 2 2 2 6 8 15 2011 2 2 2 6 8 15 2011 2 2 2 6 9 16
2012 2 2 2 5 8 14 2012 2 2 2 6 8 15 2012 2 2 2 6 8 15 2012 2 2 2 6 8 15 2012 2 2 2 6 9 16
2013 2 2 2 5 8 14 2013 2 2 2 6 8 15 2013 2 2 2 6 8 15 2013 2 2 2 6 8 15 2013 2 2 2 6 9 16
2014 2 2 2 5 8 14 2014 2 2 2 6 8 15 2014 2 2 2 6 8 15 2014 2 2 2 6 8 15 2014 2 2 2 6 9 16
2015 2 2 2 5 8 14 2015 2 2 2 6 8 15 2015 2 2 2 6 8 15 2015 2 2 2 6 8 15 2015 2 2 2 6 9 16
2020 2 2 2 5 7 14 2020 2 2 2 6 8 15 2020 2 2 2 6 8 15 2020 2 2 2 6 8 15 2020 2 2 2 6 9 16
2025 2 2 2 5 7 14 2025 2 2 2 6 8 15 2025 2 2 2 6 8 15 2025 2 2 2 6 8 15 2025 2 2 2 6 8 15
Date Cl 1 C Cl 1 B Cl 1 O Cl 2 Cl 3 Cl 4 Date Cl 1 C Cl 1 B Cl 1 O Cl 2 Cl 3 Cl 4 Date Cl 1 C Cl 1 B Cl 1 O Cl 2 Cl 3 Cl 4 Date Cl 1 C Cl 1 B Cl 1 O Cl 2 Cl 3 Cl 4 Date Cl 1 C Cl 1 B Cl 1 O Cl 2 Cl 3 Cl 4
2011 2 2 2 5 7 14 2011 2 2 2 5 7 14 2011 2 2 2 5 7 14 2011 2 2 2 5 7 13 2011 2 2 2 5 7 14
2012 2 2 2 5 7 14 2012 2 2 2 5 7 14 2012 2 2 2 5 7 14 2012 2 2 2 5 7 13 2012 2 2 2 5 7 14
2013 2 2 2 5 7 14 2013 2 2 2 5 7 13 2013 2 2 2 5 7 13 2013 2 2 2 5 7 13 2013 2 2 2 5 7 14
2014 2 2 2 5 7 14 2014 2 2 2 5 7 13 2014 2 2 2 5 7 13 2014 2 2 2 5 7 13 2014 2 2 2 5 7 14
2015 2 2 2 5 7 14 2015 2 2 2 5 7 13 2015 2 2 2 5 7 13 2015 2 2 2 5 7 13 2015 2 2 2 5 7 14
2020 2 2 2 5 7 13 2020 2 2 2 5 7 13 2020 2 2 2 5 7 13 2020 2 2 2 5 7 13 2020 2 2 2 5 7 13
2025 2 2 2 5 7 13 2025 2 2 2 5 7 13 2025 2 2 2 5 7 13 2025 2 2 2 5 7 14 2025 2 2 2 5 7 14
Morning Peak Hour - 30c Equiv Toll Rate Morning Peak Hour - 40c Equiv Toll Rate Morning Peak Hour - 50c Equiv Toll Rate
Midday Off Peak - 30c Equiv Toll Rate Midday Off Peak - 40c Equiv Toll Rate Midday Off Peak - 50c Equiv Toll Rate
Weekend - 30c Equiv Toll Rate
Weekday Evening - 30c Equiv Toll Rate Weekday Evening - 40c Equiv Toll Rate Weekday Evening - 50c Equiv Toll Rate Weekday Evening - 60c Equiv Toll Rate Weekday Evening - 70c Equiv Toll Rate
Morning Peak Hour - 60c Equiv Toll Rate Morning Peak Hour - 70c Equiv Toll Rate
Afternoon Peak Hour - 30c Equiv Toll Rate Afternoon Peak Hour - 40c Equiv Toll Rate Afternoon Peak Hour - 50c Equiv Toll Rate Afternoon Peak Hour - 60c Equiv Toll Rate Afternoon Peak Hour - 70c Equiv Toll Rate
Weekend - 40c Equiv Toll Rate Weekend - 50c Equiv Toll Rate Weekend - 60c Equiv Toll Rate Weekend - 70c Equiv Toll Rate
Midday Off Peak - 60c Equiv Toll Rate Midday Off Peak - 70c Equiv Toll Rate

Economic Analysis of the Gauteng Freeway Improvement Scheme 122
R24: OR Tambo International Airport to N12 (Eastbound)
Date Cl 1 C Cl 1 B Cl 1 O Cl 2 Cl 3 Cl 4 Date Cl 1 C Cl 1 B Cl 1 O Cl 2 Cl 3 Cl 4 Date Cl 1 C Cl 1 B Cl 1 O Cl 2 Cl 3 Cl 4 Date Cl 1 C Cl 1 B Cl 1 O Cl 2 Cl 3 Cl 4 Date Cl 1 C Cl 1 B Cl 1 O Cl 2 Cl 3 Cl 4
2011 3 2 3 8 11 21 2011 2 2 2 8 11 20 2011 3 2 3 8 12 21 2011 3 2 3 8 11 21 2011 3 2 3 8 12 21
2012 2 2 2 7 10 19 2012 2 2 2 7 10 19 2012 2 2 2 7 10 19 2012 2 2 2 7 10 19 2012 2 2 2 7 10 19
2013 2 2 2 7 10 18 2013 2 1 2 7 9 17 2013 2 1 2 7 9 17 2013 2 1 2 6 9 17 2013 2 1 2 6 9 17
2014 2 1 2 6 9 17 2014 2 1 2 6 8 16 2014 2 1 2 6 8 15 2014 2 1 2 6 8 15 2014 2 1 2 5 8 15
2015 2 1 2 6 8 15 2015 1 1 1 5 8 14 2015 1 0 1 5 7 13 2015 1 0 1 5 7 13 2015 1 0 1 5 7 13
2020 -1 -5 -1 1 3 7 2020 -1 -5 -1 1 2 6 2020 -1 -5 -1 2 3 8 2020 -2 -6 -2 1 2 5 2020 -1 -6 -1 1 2 6
2025 -7 -20 -7 -5 -4 -2 2025 -7 -21 -7 -5 -5 -3 2025 -8 -24 -8 -7 -6 -5 2025 -7 -20 -7 -5 -5 -3 2025 -10 -29 -10 -9 -8 -7
Date Cl 1 C Cl 1 B Cl 1 O Cl 2 Cl 3 Cl 4 Date Cl 1 C Cl 1 B Cl 1 O Cl 2 Cl 3 Cl 4 Date Cl 1 C Cl 1 B Cl 1 O Cl 2 Cl 3 Cl 4 Date Cl 1 C Cl 1 B Cl 1 O Cl 2 Cl 3 Cl 4 Date Cl 1 C Cl 1 B Cl 1 O Cl 2 Cl 3 Cl 4
2011 4 4 4 11 15 29 2011 4 4 4 11 16 29 2011 4 4 4 11 16 29 2011 4 4 4 11 16 29 2011 4 4 4 12 16 30
2012 3 3 3 10 14 26 2012 4 4 4 10 15 27 2012 4 4 4 10 14 27 2012 4 4 4 10 14 27 2012 4 4 4 11 15 28
2013 3 3 3 9 13 24 2013 3 3 3 10 14 25 2013 3 3 3 10 13 25 2013 3 3 3 9 13 24 2013 3 3 3 10 14 25
2014 3 2 3 8 12 22 2014 3 2 3 9 12 23 2014 3 2 3 9 12 23 2014 3 2 3 8 11 21 2014 3 2 3 9 12 23
2015 2 1 2 7 10 20 2015 2 2 2 8 11 21 2015 2 2 2 8 11 21 2015 2 1 2 7 10 19 2015 2 2 2 8 11 20
2020 1 -2 1 5 8 16 2020 -0 -4 -0 3 5 12 2020 -1 -5 -1 2 4 10 2020 -0 -4 -0 3 5 11 2020 -0 -4 -0 4 6 12
2025 -2 -12 -2 3 7 16 2025 -4 -15 -4 1 4 12 2025 -4 -14 -4 2 4 13 2025 -3 -12 -3 3 6 16 2025 -3 -13 -3 3 6 15
Date Cl 1 C Cl 1 B Cl 1 O Cl 2 Cl 3 Cl 4 Date Cl 1 C Cl 1 B Cl 1 O Cl 2 Cl 3 Cl 4 Date Cl 1 C Cl 1 B Cl 1 O Cl 2 Cl 3 Cl 4 Date Cl 1 C Cl 1 B Cl 1 O Cl 2 Cl 3 Cl 4 Date Cl 1 C Cl 1 B Cl 1 O Cl 2 Cl 3 Cl 4
2011 3 3 3 10 14 26 2011 4 4 4 10 15 27 2011 4 4 4 11 15 28 2011 4 4 4 12 16 30 2011 4 4 4 12 17 31
2012 3 3 3 10 14 25 2012 3 3 3 10 14 26 2012 4 4 4 11 15 27 2012 4 4 4 11 16 29 2012 4 4 4 11 16 30
2013 3 3 3 9 13 24 2013 3 3 3 10 14 25 2013 3 3 3 10 14 26 2013 4 4 4 11 15 27 2013 4 4 4 11 15 28
2014 3 3 3 9 13 23 2014 3 3 3 9 13 24 2014 3 3 3 10 14 25 2014 3 3 3 10 14 26 2014 3 3 3 10 14 27
2015 3 3 3 9 12 22 2015 3 3 3 9 12 23 2015 3 3 3 9 13 24 2015 3 3 3 9 13 25 2015 3 3 3 10 14 25
2020 1 0 1 4 6 12 2020 1 0 1 4 6 12 2020 1 0 1 4 6 12 2020 1 -0 1 4 6 11 2020 1 0 1 4 6 12
2025 -3 -8 -3 -1 -1 1 2025 -3 -10 -3 -3 -2 -2 2025 -3 -8 -3 -1 -1 1 2025 -3 -9 -3 -2 -2 -1 2025 -4 -10 -4 -3 -3 -3
Date Cl 1 C Cl 1 B Cl 1 O Cl 2 Cl 3 Cl 4 Date Cl 1 C Cl 1 B Cl 1 O Cl 2 Cl 3 Cl 4 Date Cl 1 C Cl 1 B Cl 1 O Cl 2 Cl 3 Cl 4 Date Cl 1 C Cl 1 B Cl 1 O Cl 2 Cl 3 Cl 4 Date Cl 1 C Cl 1 B Cl 1 O Cl 2 Cl 3 Cl 4
2011 2 2 2 5 7 14 2011 2 2 2 6 8 14 2011 2 2 2 5 7 13 2011 2 2 2 5 8 14 2011 2 2 2 5 8 14
2012 2 2 2 5 7 14 2012 2 2 2 6 8 14 2012 2 2 2 5 7 13 2012 2 2 2 5 8 14 2012 2 2 2 5 8 14
2013 2 2 2 5 7 14 2013 2 2 2 5 8 14 2013 2 2 2 5 7 13 2013 2 2 2 5 8 14 2013 2 2 2 5 8 14
2014 2 2 2 5 7 14 2014 2 2 2 5 8 14 2014 2 2 2 5 7 13 2014 2 2 2 5 8 14 2014 2 2 2 5 8 14
2015 2 2 2 5 7 14 2015 2 2 2 5 8 14 2015 2 2 2 5 7 13 2015 2 2 2 5 8 14 2015 2 2 2 5 8 14
2020 2 2 2 5 7 14 2020 2 2 2 6 8 14 2020 2 2 2 5 7 14 2020 2 2 2 6 8 14 2020 2 2 2 6 8 15
2025 2 2 2 5 7 13 2025 2 2 2 5 8 14 2025 2 2 2 5 7 13 2025 2 2 2 5 8 14 2025 2 2 2 6 8 15
Date Cl 1 C Cl 1 B Cl 1 O Cl 2 Cl 3 Cl 4 Date Cl 1 C Cl 1 B Cl 1 O Cl 2 Cl 3 Cl 4 Date Cl 1 C Cl 1 B Cl 1 O Cl 2 Cl 3 Cl 4 Date Cl 1 C Cl 1 B Cl 1 O Cl 2 Cl 3 Cl 4 Date Cl 1 C Cl 1 B Cl 1 O Cl 2 Cl 3 Cl 4
2011 2 2 2 5 7 13 2011 2 2 2 5 7 13 2011 2 2 2 5 7 13 2011 2 2 2 5 7 13 2011 2 2 2 5 7 13
2012 2 2 2 5 7 13 2012 2 2 2 5 7 13 2012 2 2 2 5 7 13 2012 2 2 2 5 7 13 2012 2 2 2 5 7 13
2013 2 2 2 5 7 13 2013 2 2 2 5 7 13 2013 2 2 2 5 7 13 2013 2 2 2 5 7 13 2013 2 2 2 5 7 13
2014 2 2 2 5 7 13 2014 2 2 2 5 7 13 2014 2 2 2 5 7 13 2014 2 2 2 5 7 13 2014 2 2 2 5 7 13
2015 2 2 2 5 7 13 2015 2 2 2 5 7 13 2015 2 2 2 5 7 13 2015 2 2 2 5 7 13 2015 2 2 2 5 7 13
2020 2 2 2 5 7 13 2020 2 2 2 5 7 13 2020 2 2 2 5 7 13 2020 2 2 2 5 7 13 2020 2 2 2 5 7 13
2025 2 2 2 7 9 17 2025 2 2 2 7 10 18 2025 2 2 2 7 10 18 2025 2 2 2 7 10 18 2025 2 3 2 7 10 19
Morning Peak Hour - 30c Equiv Toll Rate Morning Peak Hour - 40c Equiv Toll Rate Morning Peak Hour - 50c Equiv Toll Rate Morning Peak Hour - 60c Equiv Toll Rate Morning Peak Hour - 70c Equiv Toll Rate
Afternoon Peak Hour - 30c Equiv Toll Rate Afternoon Peak Hour - 40c Equiv Toll Rate Afternoon Peak Hour - 50c Equiv Toll Rate Afternoon Peak Hour - 60c Equiv Toll Rate Afternoon Peak Hour - 70c Equiv Toll Rate
Midday Off Peak - 30c Equiv Toll Rate Midday Off Peak - 40c Equiv Toll Rate Midday Off Peak - 50c Equiv Toll Rate Midday Off Peak - 60c Equiv Toll Rate Midday Off Peak - 70c Equiv Toll Rate
Weekday Evening - 30c Equiv Toll Rate Weekday Evening - 40c Equiv Toll Rate Weekday Evening - 50c Equiv Toll Rate Weekday Evening - 60c Equiv Toll Rate Weekday Evening - 70c Equiv Toll Rate
Weekend - 30c Equiv Toll Rate Weekend - 40c Equiv Toll Rate Weekend - 50c Equiv Toll Rate Weekend - 60c Equiv Toll Rate Weekend - 70c Equiv Toll Rate

Economic Analysis of the Gauteng Freeway Improvement Scheme 123
N3: Buccleuch to M2 Geldenhuys Interchange (Southbound)
Date Cl 1 C Cl 1 B Cl 1 O Cl 2 Cl 3 Cl 4 Date Cl 1 C Cl 1 B Cl 1 O Cl 2 Cl 3 Cl 4 Date Cl 1 C Cl 1 B Cl 1 O Cl 2 Cl 3 Cl 4 Date Cl 1 C Cl 1 B Cl 1 O Cl 2 Cl 3 Cl 4 Date Cl 1 C Cl 1 B Cl 1 O Cl 2 Cl 3 Cl 4
2011 0 4 0 1 -1 2 2011 -1 3 -1 -2 -6 -4 2011 -0 7 -0 -1 -5 -1 2011 -1 6 -1 -2 -9 -6 2011 -1 7 -1 -3 -10 -7
2012 0 4 0 1 -1 3 2012 -1 4 -1 -1 -5 -2 2012 -0 6 -0 -1 -5 -1 2012 -2 5 -1 -3 -10 -7 2012 -2 7 -2 -4 -11 -8
2013 0 4 0 1 -1 4 2013 -0 5 -0 -0 -4 0 2013 -0 6 -0 -1 -5 -1 2013 -2 4 -2 -4 -11 -9 2013 -2 6 -2 -4 -12 -10
2014 1 5 1 2 -0 4 2014 0 6 0 1 -3 2 2014 -0 6 -0 -1 -5 -1 2014 -3 3 -3 -5 -12 -11 2014 -2 5 -2 -5 -13 -11
2015 1 5 1 2 0 5 2015 1 7 1 2 -1 4 2015 -0 6 -0 -1 -5 -1 2015 -3 1 -3 -6 -13 -13 2015 -3 4 -3 -6 -14 -13
2020 -0 3 -0 1 -1 4 2020 -1 3 -1 -0 -3 1 2020 -2 2 -2 -3 -9 -6 2020 -3 2 -2 -4 -11 -8 2020 -4 2 -4 -7 -15 -14
2025 -0 -1 -0 4 4 14 2025 -3 -5 -3 -0 -3 5 2025 -4 -5 -4 -2 -5 2 2025 -4 -6 -4 -3 -8 -2 2025 -5 -5 -5 -5 -11 -5
Date Cl 1 C Cl 1 B Cl 1 O Cl 2 Cl 3 Cl 4 Date Cl 1 C Cl 1 B Cl 1 O Cl 2 Cl 3 Cl 4 Date Cl 1 C Cl 1 B Cl 1 O Cl 2 Cl 3 Cl 4 Date Cl 1 C Cl 1 B Cl 1 O Cl 2 Cl 3 Cl 4 Date Cl 1 C Cl 1 B Cl 1 O Cl 2 Cl 3 Cl 4
2011 4 14 4 6 5 12 2011 3 12 3 3 0 6 2011 2 13 3 2 -2 3 2011 1 12 1 -0 -7 -3 2011 1 13 1 -2 -9 -6
2012 3 10 3 4 2 8 2012 1 8 1 1 -2 2 2012 0 9 1 -1 -6 -2 2012 -1 8 -1 -3 -10 -8 2012 -1 9 -1 -4 -13 -12
2013 1 6 1 2 -1 4 2013 -1 4 -1 -2 -6 -3 2013 -2 3 -2 -4 -10 -9 2013 -3 3 -3 -6 -13 -13 2013 -3 4 -3 -8 -16 -18
2014 -2 -0 -2 -2 -4 -2 2014 -3 -2 -3 -5 -10 -9 2014 -5 -5 -5 -8 -15 -16 2014 -5 -3 -5 -10 -18 -20 2014 -6 -3 -6 -12 -21 -25
2015 -4 -8 -4 -5 -8 -6 2015 -6 -10 -6 -8 -13 -14 2015 -9 -16 -9 -13 -20 -22 2015 -9 -12 -9 -14 -22 -26 2015 -10 -12 -10 -16 -26 -31
2020 -9 -24 -9 -5 -6 2 2020 -9 -21 -9 -7 -9 -3 2020 -10 -22 -10 -9 -14 -9 2020 -13 -29 -14 -14 -20 -18 2020 -13 -25 -13 -15 -24 -23
2025 2 2 2 11 13 31 2025 1 1 1 8 8 24 2025 -1 -1 -1 5 4 18 2025 -2 -2 -2 2 -1 11 2025 -4 -4 -4 -1 -6 4
Date Cl 1 C Cl 1 B Cl 1 O Cl 2 Cl 3 Cl 4 Date Cl 1 C Cl 1 B Cl 1 O Cl 2 Cl 3 Cl 4 Date Cl 1 C Cl 1 B Cl 1 O Cl 2 Cl 3 Cl 4 Date Cl 1 C Cl 1 B Cl 1 O Cl 2 Cl 3 Cl 4 Date Cl 1 C Cl 1 B Cl 1 O Cl 2 Cl 3 Cl 4
2011 8 19 8 15 17 33 2011 7 19 7 14 15 31 2011 7 19 7 13 12 29 2011 6 19 6 11 9 25 2011 5 19 5 10 8 24
2012 7 18 7 14 15 30 2012 7 18 7 13 13 28 2012 6 18 6 11 10 25 2012 5 18 5 10 7 22 2012 5 18 5 9 5 20
2013 7 17 7 12 13 26 2013 6 18 6 11 10 24 2013 5 17 6 10 8 21 2013 5 17 5 8 5 17 2013 4 17 4 7 3 15
2014 6 16 6 10 11 22 2014 5 16 5 9 8 19 2014 5 17 5 8 6 17 2014 4 16 4 6 2 13 2014 3 16 3 5 0 10
2015 5 15 5 9 8 18 2015 5 15 5 7 6 15 2015 4 15 4 6 3 12 2015 3 15 3 4 -0 8 2015 2 15 3 3 -3 5
2020 1 8 1 1 -2 0 2020 -1 6 -0 -2 -7 -7 2020 -3 2 -3 -6 -13 -15 2020 -3 5 -2 -7 -15 -17 2020 -3 5 -3 -8 -18 -21
2025 -16 -41 -16 -14 -17 -13 2025 -18 -44 -18 -18 -22 -22 2025 -20 -46 -20 -21 -27 -28 2025 -23 -52 -23 -26 -35 -40 2025 -23 -50 -23 -27 -37 -42
Date Cl 1 C Cl 1 B Cl 1 O Cl 2 Cl 3 Cl 4 Date Cl 1 C Cl 1 B Cl 1 O Cl 2 Cl 3 Cl 4 Date Cl 1 C Cl 1 B Cl 1 O Cl 2 Cl 3 Cl 4 Date Cl 1 C Cl 1 B Cl 1 O Cl 2 Cl 3 Cl 4 Date Cl 1 C Cl 1 B Cl 1 O Cl 2 Cl 3 Cl 4
2011 -1 -1 -1 3 2 10 2011 -2 -2 -2 -0 -3 3 2011 -4 -4 -4 -4 -8 -4 2011 -5 -5 -5 -7 -13 -11 2011 -7 -7 -7 -10 -18 -18
2012 -1 -1 -1 3 2 10 2012 -2 -2 -2 -0 -3 3 2012 -4 -4 -4 -4 -8 -4 2012 -5 -5 -5 -7 -13 -11 2012 -7 -7 -7 -10 -18 -18
2013 -1 -1 -1 3 2 10 2013 -2 -2 -2 -0 -3 3 2013 -4 -4 -4 -4 -8 -4 2013 -5 -5 -5 -7 -13 -11 2013 -7 -7 -7 -10 -18 -18
2014 -1 -1 -1 3 2 10 2014 -2 -2 -2 -0 -3 3 2014 -4 -4 -4 -4 -8 -4 2014 -5 -5 -5 -7 -13 -11 2014 -7 -7 -7 -10 -18 -18
2015 -1 -1 -1 3 2 10 2015 -2 -2 -2 -0 -3 3 2015 -4 -4 -4 -4 -8 -4 2015 -5 -5 -5 -7 -13 -11 2015 -7 -7 -7 -10 -18 -18
2020 -1 -1 -1 3 2 10 2020 -2 -2 -2 -0 -3 3 2020 -4 -4 -4 -4 -8 -4 2020 -5 -5 -5 -7 -13 -11 2020 -7 -7 -7 -10 -18 -18
2025 -1 -1 -1 3 2 10 2025 -2 -2 -2 -0 -3 3 2025 -4 -4 -4 -4 -8 -4 2025 -5 -5 -5 -7 -13 -11 2025 -7 -7 -7 -10 -18 -18
Date Cl 1 C Cl 1 B Cl 1 O Cl 2 Cl 3 Cl 4 Date Cl 1 C Cl 1 B Cl 1 O Cl 2 Cl 3 Cl 4 Date Cl 1 C Cl 1 B Cl 1 O Cl 2 Cl 3 Cl 4 Date Cl 1 C Cl 1 B Cl 1 O Cl 2 Cl 3 Cl 4 Date Cl 1 C Cl 1 B Cl 1 O Cl 2 Cl 3 Cl 4
2011 1 1 1 7 8 22 2011 -0 -0 -0 4 3 15 2011 -2 -2 -2 1 -2 8 2011 -3 -3 -3 -2 -7 1 2011 -5 -5 -5 -5 -11 -6
2012 2 2 2 8 10 25 2012 0 0 0 5 5 18 2012 -1 -1 -1 2 0 11 2012 -3 -3 -3 -1 -5 4 2012 -4 -4 -4 -4 -10 -3
2013 2 2 2 10 12 29 2013 1 1 1 7 7 22 2013 -1 -1 -1 4 2 16 2013 -2 -2 -2 1 -3 9 2013 -4 -4 -4 -2 -7 2
2014 3 3 3 12 15 34 2014 1 2 1 9 10 27 2014 -0 0 -0 6 5 20 2014 -2 -1 -2 3 0 13 2014 -3 -3 -3 -0 -5 7
2015 4 4 4 14 18 39 2015 2 2 2 11 13 32 2015 1 1 1 8 8 25 2015 -1 -1 -1 5 3 18 2015 -2 -2 -2 2 -2 12
2020 6 7 6 22 28 59 2020 5 6 5 19 24 54 2020 4 5 4 17 20 48 2020 2 3 2 14 15 41 2020 1 2 1 11 10 34
2025 6 8 6 21 27 56 2025 6 8 6 21 27 57 2025 6 8 6 22 27 60 2025 5 7 5 22 27 62 2025 5 6 5 21 24 59
Morning Peak Hour - 30c Equiv Toll Rate Morning Peak Hour - 40c Equiv Toll Rate
Midday Off Peak - 30c Equiv Toll Rate Midday Off Peak - 40c Equiv Toll Rate
Weekend - 30c Equiv Toll Rate Weekend - 40c Equiv Toll Rate
Weekday Evening - 30c Equiv Toll Rate Weekday Evening - 40c Equiv Toll Rate Weekday Evening - 50c Equiv Toll Rate Weekday Evening - 60c Equiv Toll Rate Weekday Evening - 70c Equiv Toll Rate
Morning Peak Hour - 50c Equiv Toll Rate Morning Peak Hour - 60c Equiv Toll Rate Morning Peak Hour - 70c Equiv Toll Rate
Afternoon Peak Hour - 30c Equiv Toll Rate Afternoon Peak Hour - 40c Equiv Toll Rate Afternoon Peak Hour - 50c Equiv Toll Rate Afternoon Peak Hour - 60c Equiv Toll Rate Afternoon Peak Hour - 70c Equiv Toll Rate
Weekend - 50c Equiv Toll Rate Weekend - 60c Equiv Toll Rate Weekend - 70c Equiv Toll Rate
Midday Off Peak - 50c Equiv Toll Rate Midday Off Peak - 60c Equiv Toll Rate Midday Off Peak - 70c Equiv Toll Rate

Economic Analysis of the Gauteng Freeway Improvement Scheme 124
N3: Buccleuch to M2 Geldenhuys Interchange (Northbound)
Date Cl 1 C Cl 1 B Cl 1 O Cl 2 Cl 3 Cl 4 Date Cl 1 C Cl 1 B Cl 1 O Cl 2 Cl 3 Cl 4 Date Cl 1 C Cl 1 B Cl 1 O Cl 2 Cl 3 Cl 4 Date Cl 1 C Cl 1 B Cl 1 O Cl 2 Cl 3 Cl 4 Date Cl 1 C Cl 1 B Cl 1 O Cl 2 Cl 3 Cl 4
2011 4 15 4 6 3 12 2011 2 14 2 3 -2 5 2011 0 12 0 -2 -9 -5 2011 -1 12 -1 -4 -13 -10 2011 -3 11 -2 -7 -19 -18
2012 4 14 4 6 3 11 2012 2 13 2 2 -3 3 2012 0 12 0 -2 -10 -6 2012 -1 12 -1 -4 -15 -12 2012 -3 11 -3 -8 -20 -19
2013 4 14 4 5 2 10 2013 2 13 2 1 -4 1 2013 -0 12 0 -2 -11 -7 2013 -1 11 -1 -5 -16 -14 2013 -3 11 -3 -8 -21 -21
2014 4 15 4 5 2 9 2014 2 13 2 1 -5 -0 2014 0 12 0 -3 -11 -8 2014 -2 11 -2 -6 -17 -16 2014 -3 11 -3 -9 -22 -22
2015 4 15 4 5 1 8 2015 2 13 2 0 -6 -2 2015 0 13 0 -3 -12 -10 2015 -2 11 -2 -7 -18 -19 2015 -3 12 -3 -9 -23 -24
2020 -10 -21 -10 -12 -17 -17 2020 -12 -22 -12 -16 -24 -27 2020 -12 -18 -12 -16 -27 -30 2020 -17 -27 -17 -25 -39 -48 2020 -16 -22 -16 -26 -42 -52
2025 -7 -18 -7 -2 -4 7 2025 -9 -20 -9 -7 -11 -3 2025 -12 -22 -12 -11 -19 -13 2025 -14 -24 -14 -16 -26 -24 2025 -16 -27 -16 -20 -33 -34
Date Cl 1 C Cl 1 B Cl 1 O Cl 2 Cl 3 Cl 4 Date Cl 1 C Cl 1 B Cl 1 O Cl 2 Cl 3 Cl 4 Date Cl 1 C Cl 1 B Cl 1 O Cl 2 Cl 3 Cl 4 Date Cl 1 C Cl 1 B Cl 1 O Cl 2 Cl 3 Cl 4 Date Cl 1 C Cl 1 B Cl 1 O Cl 2 Cl 3 Cl 4
2011 -0 8 -0 -4 -10 -12 2011 -2 7 -2 -8 -17 -21 2011 -3 7 -3 -10 -22 -27 2011 -5 6 -5 -15 -29 -37 2011 -8 3 -8 -20 -36 -48
2012 -1 7 -1 -4 -11 -12 2012 -3 5 -3 -8 -17 -21 2012 -4 5 -4 -11 -22 -28 2012 -6 3 -6 -16 -30 -38 2012 -8 1 -8 -20 -37 -48
2013 -2 4 -2 -5 -11 -12 2013 -3 4 -3 -8 -17 -20 2013 -5 3 -5 -12 -23 -28 2013 -7 0 -7 -17 -31 -40 2013 -9 -1 -9 -21 -37 -48
2014 -2 2 -2 -5 -11 -12 2014 -4 2 -4 -8 -17 -19 2014 -6 0 -6 -12 -23 -28 2014 -8 -3 -8 -18 -32 -40 2014 -10 -3 -10 -21 -38 -48
2015 -3 -1 -3 -5 -11 -11 2015 -4 0 -4 -8 -16 -18 2015 -7 -3 -7 -13 -24 -28 2015 -10 -7 -10 -19 -33 -41 2015 -11 -6 -11 -21 -38 -48
2020 -5 -7 -5 -7 -13 -13 2020 -9 -11 -9 -13 -22 -26 2020 -11 -15 -11 -19 -30 -37 2020 -13 -15 -13 -22 -36 -45 2020 -16 -19 -16 -28 -45 -58
2025 -13 -32 -13 -11 -14 -9 2025 -15 -34 -15 -16 -22 -19 2025 -15 -30 -16 -18 -27 -27 2025 -18 -33 -18 -23 -35 -38 2025 -19 -32 -19 -26 -41 -46
Date Cl 1 C Cl 1 B Cl 1 O Cl 2 Cl 3 Cl 4 Date Cl 1 C Cl 1 B Cl 1 O Cl 2 Cl 3 Cl 4 Date Cl 1 C Cl 1 B Cl 1 O Cl 2 Cl 3 Cl 4 Date Cl 1 C Cl 1 B Cl 1 O Cl 2 Cl 3 Cl 4 Date Cl 1 C Cl 1 B Cl 1 O Cl 2 Cl 3 Cl 4
2011 9 23 9 17 19 39 2011 7 22 8 14 14 33 2011 6 20 6 11 8 26 2011 4 19 4 9 3 20 2011 3 19 3 6 -1 15
2012 9 23 9 17 18 37 2012 8 23 8 14 13 31 2012 6 21 6 11 7 24 2012 4 21 5 8 2 18 2012 3 20 3 5 -2 12
2013 9 25 9 16 17 35 2013 8 24 8 14 12 29 2013 6 23 6 10 7 22 2013 5 22 5 8 1 16 2013 3 21 3 5 -4 10
2014 9 26 10 16 17 34 2014 8 25 8 13 11 27 2014 6 24 7 10 6 20 2014 5 23 5 7 0 14 2014 4 23 4 4 -5 7
2015 10 28 10 16 16 32 2015 8 27 9 13 11 26 2015 7 26 7 10 5 19 2015 5 25 6 7 -0 12 2015 4 24 4 4 -6 5
2020 5 19 5 6 3 11 2020 3 18 4 3 -3 3 2020 2 18 2 -0 -8 -4 2020 1 17 1 -3 -14 -12 2020 -1 15 -1 -7 -20 -20
2025 -5 -6 -5 -7 -12 -12 2025 -7 -6 -7 -11 -20 -23 2025 -9 -10 -9 -16 -27 -33 2025 -13 -17 -13 -23 -37 -47 2025 -13 -11 -12 -23 -40 -51
Date Cl 1 C Cl 1 B Cl 1 O Cl 2 Cl 3 Cl 4 Date Cl 1 C Cl 1 B Cl 1 O Cl 2 Cl 3 Cl 4 Date Cl 1 C Cl 1 B Cl 1 O Cl 2 Cl 3 Cl 4 Date Cl 1 C Cl 1 B Cl 1 O Cl 2 Cl 3 Cl 4 Date Cl 1 C Cl 1 B Cl 1 O Cl 2 Cl 3 Cl 4
2011 -3 -3 -3 -2 -6 -2 2011 -5 -5 -5 -7 -14 -12 2011 -8 -8 -8 -11 -21 -22 2011 -10 -10 -10 -16 -29 -33 2011 -12 -12 -12 -20 -36 -42
2012 -3 -3 -3 -2 -6 -2 2012 -5 -5 -5 -7 -14 -12 2012 -8 -8 -8 -11 -21 -22 2012 -10 -10 -10 -16 -29 -33 2012 -12 -12 -12 -20 -36 -42
2013 -3 -3 -3 -2 -6 -2 2013 -5 -5 -5 -7 -14 -12 2013 -8 -8 -8 -11 -21 -22 2013 -10 -10 -10 -16 -29 -33 2013 -12 -12 -12 -21 -36 -42
2014 -3 -3 -3 -3 -6 -2 2014 -5 -5 -5 -7 -14 -12 2014 -8 -8 -8 -12 -21 -22 2014 -10 -10 -10 -16 -29 -33 2014 -12 -12 -12 -21 -36 -42
2015 -3 -3 -3 -3 -6 -2 2015 -5 -5 -5 -7 -14 -12 2015 -8 -8 -8 -12 -21 -22 2015 -10 -10 -10 -16 -29 -33 2015 -12 -12 -12 -21 -36 -42
2020 -3 -3 -3 -2 -6 -2 2020 -5 -5 -5 -7 -14 -12 2020 -8 -8 -8 -12 -21 -22 2020 -10 -10 -10 -16 -29 -32 2020 -12 -12 -12 -21 -36 -43
2025 -3 -3 -3 -2 -6 -2 2025 -5 -5 -5 -7 -14 -12 2025 -8 -8 -8 -12 -21 -22 2025 -10 -10 -10 -16 -29 -33 2025 -12 -12 -12 -21 -37 -44
Date Cl 1 C Cl 1 B Cl 1 O Cl 2 Cl 3 Cl 4 Date Cl 1 C Cl 1 B Cl 1 O Cl 2 Cl 3 Cl 4 Date Cl 1 C Cl 1 B Cl 1 O Cl 2 Cl 3 Cl 4 Date Cl 1 C Cl 1 B Cl 1 O Cl 2 Cl 3 Cl 4 Date Cl 1 C Cl 1 B Cl 1 O Cl 2 Cl 3 Cl 4
2011 0 0 0 6 6 21 2011 -2 -2 -2 2 -1 11 2011 -4 -4 -4 -3 -9 1 2011 -7 -6 -7 -7 -16 -10 2011 -9 -9 -9 -12 -24 -20
2012 1 1 1 8 9 26 2012 -1 -1 -1 4 1 16 2012 -4 -3 -4 -1 -6 6 2012 -6 -6 -6 -5 -13 -5 2012 -8 -8 -8 -10 -21 -15
2013 2 2 2 10 12 31 2013 -1 -0 -1 6 4 21 2013 -3 -3 -3 1 -3 11 2013 -5 -5 -5 -3 -11 0 2013 -8 -7 -8 -8 -18 -10
2014 2 3 2 12 14 36 2014 -0 0 0 8 7 26 2014 -2 -2 -2 3 -0 16 2014 -5 -4 -5 -1 -8 6 2014 -7 -6 -7 -6 -15 -5
2015 3 4 3 15 17 42 2015 1 1 1 10 10 32 2015 -1 -1 -1 6 3 22 2015 -4 -3 -4 1 -5 12 2015 -6 -5 -6 -4 -12 1
2020 7 9 7 25 32 68 2020 6 7 6 23 28 64 2020 4 6 4 20 23 58 2020 2 4 2 17 17 51 2020 0 2 0 14 12 45
2025 8 13 8 24 29 62 2025 7 12 7 23 28 62 2025 7 12 7 23 26 63 2025 6 12 6 23 25 64 2025 5 11 5 22 23 63
Weekend - 30c Equiv Toll Rate Weekend - 40c Equiv Toll Rate Weekend - 50c Equiv Toll Rate Weekend - 60c Equiv Toll Rate Weekend - 70c Equiv Toll Rate
Weekday Evening - 30c Equiv Toll Rate Weekday Evening - 40c Equiv Toll Rate Weekday Evening - 50c Equiv Toll Rate Weekday Evening - 60c Equiv Toll Rate Weekday Evening - 70c Equiv Toll Rate
Midday Off Peak - 40c Equiv Toll Rate Midday Off Peak - 50c Equiv Toll Rate Midday Off Peak - 60c Equiv Toll Rate Midday Off Peak - 70c Equiv Toll RateMidday Off Peak - 30c Equiv Toll Rate
Afternoon Peak Hour - 30c Equiv Toll Rate Afternoon Peak Hour - 40c Equiv Toll Rate Afternoon Peak Hour - 50c Equiv Toll Rate Afternoon Peak Hour - 60c Equiv Toll Rate Afternoon Peak Hour - 70c Equiv Toll Rate
Morning Peak Hour - 30c Equiv Toll Rate Morning Peak Hour - 40c Equiv Toll Rate Morning Peak Hour - 50c Equiv Toll Rate Morning Peak Hour - 60c Equiv Toll Rate Morning Peak Hour - 70c Equiv Toll Rate

Economic Analysis of the Gauteng Freeway Improvement Scheme 125
N3: Geldenhuys Interchange to Barry Marais (Southbound)
Date Cl 1 C Cl 1 B Cl 1 O Cl 2 Cl 3 Cl 4 Date Cl 1 C Cl 1 B Cl 1 O Cl 2 Cl 3 Cl 4 Date Cl 1 C Cl 1 B Cl 1 O Cl 2 Cl 3 Cl 4 Date Cl 1 C Cl 1 B Cl 1 O Cl 2 Cl 3 Cl 4 Date Cl 1 C Cl 1 B Cl 1 O Cl 2 Cl 3 Cl 4
2011 5 5 5 19 25 52 2011 3 3 3 16 20 45 2011 2 2 2 13 16 40 2011 1 1 1 10 11 34 2011 -1 -1 -1 8 7 28
2012 5 5 5 19 25 53 2012 3 4 3 16 20 46 2012 2 2 2 13 16 40 2012 1 1 1 11 11 34 2012 -1 -1 -1 8 7 28
2013 5 5 5 19 25 53 2013 4 4 4 16 20 46 2013 2 2 2 14 16 40 2013 1 1 1 11 11 35 2013 -1 -0 -1 8 7 29
2014 5 5 5 19 25 53 2014 4 4 4 16 20 47 2014 2 2 2 14 16 40 2014 1 1 1 11 11 35 2014 -1 -0 -1 8 7 29
2015 5 5 5 19 24 52 2015 4 4 4 16 20 46 2015 2 2 2 14 16 40 2015 1 1 1 11 12 36 2015 -1 -0 -1 8 7 29
2020 4 4 4 16 20 45 2020 2 3 2 13 16 39 2020 1 1 1 11 12 33 2020 -0 -0 -0 8 7 28 2020 -2 -2 -2 5 2 21
2025 4 4 4 16 20 45 2025 3 3 3 14 18 42 2025 2 1 2 12 14 37 2025 -0 -0 -0 8 8 29 2025 -1 -1 -1 7 6 27
Date Cl 1 C Cl 1 B Cl 1 O Cl 2 Cl 3 Cl 4 Date Cl 1 C Cl 1 B Cl 1 O Cl 2 Cl 3 Cl 4 Date Cl 1 C Cl 1 B Cl 1 O Cl 2 Cl 3 Cl 4 Date Cl 1 C Cl 1 B Cl 1 O Cl 2 Cl 3 Cl 4 Date Cl 1 C Cl 1 B Cl 1 O Cl 2 Cl 3 Cl 4
2011 17 22 17 49 65 126 2011 16 22 16 47 63 123 2011 15 21 15 45 59 118 2011 14 20 14 44 56 115 2011 13 19 13 42 53 112
2012 18 24 18 51 68 130 2012 17 23 17 49 65 127 2012 16 23 16 47 62 122 2012 15 22 15 46 59 119 2012 14 22 15 44 56 117
2013 19 26 19 52 70 133 2013 18 25 18 50 67 129 2013 17 25 17 49 64 126 2013 16 24 16 47 61 122 2013 16 24 16 46 58 120
2014 20 29 20 53 71 135 2014 19 28 19 51 68 130 2014 18 27 18 50 65 128 2014 17 26 17 48 62 124 2014 17 27 17 47 60 122
2015 21 32 21 55 73 137 2015 20 30 20 52 69 132 2015 19 30 19 51 66 130 2015 18 29 18 49 63 125 2015 18 31 18 49 61 124
2020 32 49 33 81 108 200 2020 31 47 31 78 103 192 2020 30 46 30 75 99 187 2020 29 46 29 74 96 185 2020 27 44 27 71 92 178
2025 38 74 39 77 99 175 2025 39 78 40 79 101 179 2025 37 75 37 73 92 166 2025 38 79 38 74 91 165 2025 35 75 36 70 86 159
Date Cl 1 C Cl 1 B Cl 1 O Cl 2 Cl 3 Cl 4 Date Cl 1 C Cl 1 B Cl 1 O Cl 2 Cl 3 Cl 4 Date Cl 1 C Cl 1 B Cl 1 O Cl 2 Cl 3 Cl 4 Date Cl 1 C Cl 1 B Cl 1 O Cl 2 Cl 3 Cl 4 Date Cl 1 C Cl 1 B Cl 1 O Cl 2 Cl 3 Cl 4
2011 7 7 7 23 31 64 2011 5 6 5 21 27 58 2011 4 5 4 18 22 52 2011 3 3 3 16 18 47 2011 1 2 1 13 14 41
2012 7 7 7 24 32 65 2012 6 6 6 22 27 60 2012 4 5 4 19 23 54 2012 3 4 3 16 19 49 2012 2 2 2 14 15 43
2013 7 8 7 25 32 66 2013 6 7 6 22 28 61 2013 4 5 4 19 24 55 2013 3 4 3 17 20 50 2013 2 3 2 15 15 44
2014 7 8 7 25 33 68 2014 6 7 6 23 29 63 2014 5 6 5 20 25 57 2014 3 5 3 18 21 51 2014 2 3 2 15 16 46
2015 8 9 8 26 34 70 2015 6 8 6 24 31 66 2015 5 6 5 21 26 60 2015 4 5 4 19 22 54 2015 3 4 3 16 18 49
2020 10 12 10 33 45 89 2020 9 11 9 31 41 84 2020 8 10 8 29 37 80 2020 7 9 7 27 34 75 2020 6 8 6 25 31 72
2025 18 21 18 52 70 134 2025 17 21 17 50 67 131 2025 15 19 15 47 62 124 2025 13 16 13 43 56 115 2025 13 17 13 43 55 115
Date Cl 1 C Cl 1 B Cl 1 O Cl 2 Cl 3 Cl 4 Date Cl 1 C Cl 1 B Cl 1 O Cl 2 Cl 3 Cl 4 Date Cl 1 C Cl 1 B Cl 1 O Cl 2 Cl 3 Cl 4 Date Cl 1 C Cl 1 B Cl 1 O Cl 2 Cl 3 Cl 4 Date Cl 1 C Cl 1 B Cl 1 O Cl 2 Cl 3 Cl 4
2011 4 4 4 17 22 48 2011 3 3 3 14 17 41 2011 2 2 2 13 15 40 2011 0 0 0 10 11 34 2011 -1 -1 -1 8 7 30
2012 4 4 4 17 22 48 2012 3 3 3 14 17 41 2012 2 2 2 13 15 40 2012 0 0 0 10 11 34 2012 -1 -1 -1 9 7 30
2013 4 4 4 17 22 48 2013 3 3 3 14 17 41 2013 2 2 2 13 15 40 2013 0 0 0 10 11 34 2013 -1 -1 -1 9 7 30
2014 4 4 4 17 22 48 2014 3 3 3 14 17 42 2014 2 2 2 13 15 40 2014 1 1 1 11 11 34 2014 -1 -1 -1 9 8 30
2015 4 4 4 17 22 48 2015 3 3 3 14 17 42 2015 2 2 2 13 15 40 2015 1 1 1 11 11 34 2015 -1 -1 -1 9 8 31
2020 4 4 4 17 22 48 2020 3 3 3 14 17 42 2020 2 2 2 13 15 40 2020 1 1 1 11 11 34 2020 -1 -1 -1 9 8 31
2025 4 4 4 17 22 48 2025 3 3 3 14 18 42 2025 2 2 2 12 14 38 2025 1 1 1 11 11 34 2025 -1 -1 -1 9 8 30
Date Cl 1 C Cl 1 B Cl 1 O Cl 2 Cl 3 Cl 4 Date Cl 1 C Cl 1 B Cl 1 O Cl 2 Cl 3 Cl 4 Date Cl 1 C Cl 1 B Cl 1 O Cl 2 Cl 3 Cl 4 Date Cl 1 C Cl 1 B Cl 1 O Cl 2 Cl 3 Cl 4 Date Cl 1 C Cl 1 B Cl 1 O Cl 2 Cl 3 Cl 4
2011 4 4 4 15 19 43 2011 2 2 2 12 14 35 2011 0 0 0 9 9 28 2011 -1 -1 -1 6 4 21 2011 -3 -3 -3 3 -1 15
2012 4 4 4 15 19 43 2012 2 2 2 12 14 35 2012 0 0 0 9 9 28 2012 -1 -1 -1 6 4 21 2012 -3 -3 -3 3 -1 15
2013 4 4 4 15 19 43 2013 2 2 2 12 14 35 2013 0 0 0 9 9 28 2013 -1 -1 -1 6 4 22 2013 -3 -3 -3 3 -1 15
2014 4 4 4 15 19 43 2014 2 2 2 12 14 36 2014 0 0 0 9 9 29 2014 -1 -1 -1 6 4 22 2014 -3 -3 -3 3 -1 15
2015 4 4 4 15 19 43 2015 2 2 2 12 14 36 2015 0 0 0 9 9 29 2015 -1 -1 -1 6 4 22 2015 -3 -3 -3 3 -0 16
2020 4 4 4 16 21 46 2020 2 2 2 13 16 38 2020 1 1 1 10 11 31 2020 -1 -1 -1 7 6 24 2020 -2 -2 -2 4 1 18
2025 4 4 4 16 20 44 2025 2 2 2 13 15 37 2025 1 1 1 10 10 30 2025 -1 -1 -1 7 5 24 2025 -2 -2 -2 4 0 17
Morning Peak Hour - 30c Equiv Toll Rate Morning Peak Hour - 40c Equiv Toll Rate Morning Peak Hour - 50c Equiv Toll Rate
Midday Off Peak - 30c Equiv Toll Rate Midday Off Peak - 40c Equiv Toll Rate Midday Off Peak - 50c Equiv Toll Rate
Weekend - 30c Equiv Toll Rate
Weekday Evening - 30c Equiv Toll Rate Weekday Evening - 40c Equiv Toll Rate Weekday Evening - 50c Equiv Toll Rate Weekday Evening - 60c Equiv Toll Rate Weekday Evening - 70c Equiv Toll Rate
Morning Peak Hour - 60c Equiv Toll Rate Morning Peak Hour - 70c Equiv Toll Rate
Afternoon Peak Hour - 30c Equiv Toll Rate Afternoon Peak Hour - 40c Equiv Toll Rate Afternoon Peak Hour - 50c Equiv Toll Rate Afternoon Peak Hour - 60c Equiv Toll Rate Afternoon Peak Hour - 70c Equiv Toll Rate
Weekend - 40c Equiv Toll Rate Weekend - 50c Equiv Toll Rate Weekend - 60c Equiv Toll Rate Weekend - 70c Equiv Toll Rate
Midday Off Peak - 60c Equiv Toll Rate Midday Off Peak - 70c Equiv Toll Rate
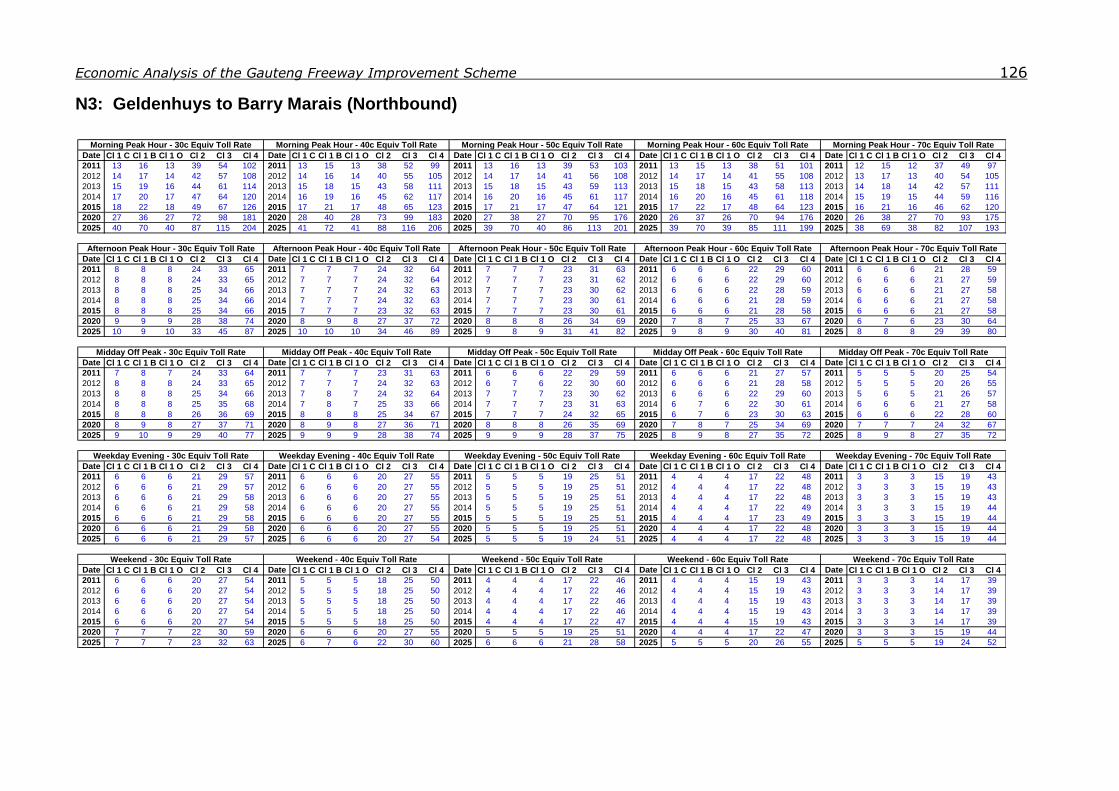
Economic Analysis of the Gauteng Freeway Improvement Scheme 126
N3: Geldenhuys to Barry Marais (Northbound)
Date Cl 1 C Cl 1 B Cl 1 O Cl 2 Cl 3 Cl 4 Date Cl 1 C Cl 1 B Cl 1 O Cl 2 Cl 3 Cl 4 Date Cl 1 C Cl 1 B Cl 1 O Cl 2 Cl 3 Cl 4 Date Cl 1 C Cl 1 B Cl 1 O Cl 2 Cl 3 Cl 4 Date Cl 1 C Cl 1 B Cl 1 O Cl 2 Cl 3 Cl 4
2011 13 16 13 39 54 102 2011 13 15 13 38 52 99 2011 13 16 13 39 53 103 2011 13 15 13 38 51 101 2011 12 15 12 37 49 97
2012 14 17 14 42 57 108 2012 14 16 14 40 55 105 2012 14 17 14 41 56 108 2012 14 17 14 41 55 108 2012 13 17 13 40 54 105
2013 15 19 16 44 61 114 2013 15 18 15 43 58 111 2013 15 18 15 43 59 113 2013 15 18 15 43 58 113 2013 14 18 14 42 57 111
2014 17 20 17 47 64 120 2014 16 19 16 45 62 117 2014 16 20 16 45 61 117 2014 16 20 16 45 61 118 2014 15 19 15 44 59 116
2015 18 22 18 49 67 126 2015 17 21 17 48 65 123 2015 17 21 17 47 64 121 2015 17 22 17 48 64 123 2015 16 21 16 46 62 120
2020 27 36 27 72 98 181 2020 28 40 28 73 99 183 2020 27 38 27 70 95 176 2020 26 37 26 70 94 176 2020 26 38 27 70 93 175
2025 40 70 40 87 115 204 2025 41 72 41 88 116 206 2025 39 70 40 86 113 201 2025 39 70 39 85 111 199 2025 38 69 38 82 107 193
Date Cl 1 C Cl 1 B Cl 1 O Cl 2 Cl 3 Cl 4 Date Cl 1 C Cl 1 B Cl 1 O Cl 2 Cl 3 Cl 4 Date Cl 1 C Cl 1 B Cl 1 O Cl 2 Cl 3 Cl 4 Date Cl 1 C Cl 1 B Cl 1 O Cl 2 Cl 3 Cl 4 Date Cl 1 C Cl 1 B Cl 1 O Cl 2 Cl 3 Cl 4
2011 8 8 8 24 33 65 2011 7 7 7 24 32 64 2011 7 7 7 23 31 63 2011 6 6 6 22 29 60 2011 6 6 6 21 28 59
2012 8 8 8 24 33 65 2012 7 7 7 24 32 64 2012 7 7 7 23 31 62 2012 6 6 6 22 29 60 2012 6 6 6 21 27 59
2013 8 8 8 25 34 66 2013 7 7 7 24 32 63 2013 7 7 7 23 30 62 2013 6 6 6 22 28 59 2013 6 6 6 21 27 58
2014 8 8 8 25 34 66 2014 7 7 7 24 32 63 2014 7 7 7 23 30 61 2014 6 6 6 21 28 59 2014 6 6 6 21 27 58
2015 8 8 8 25 34 66 2015 7 7 7 23 32 63 2015 7 7 7 23 30 61 2015 6 6 6 21 28 58 2015 6 6 6 21 27 58
2020 9 9 9 28 38 74 2020 8 9 8 27 37 72 2020 8 8 8 26 34 69 2020 7 8 7 25 33 67 2020 6 7 6 23 30 64
2025 10 9 10 33 45 87 2025 10 10 10 34 46 89 2025 9 8 9 31 41 82 2025 9 8 9 30 40 81 2025 8 8 8 29 39 80
Date Cl 1 C Cl 1 B Cl 1 O Cl 2 Cl 3 Cl 4 Date Cl 1 C Cl 1 B Cl 1 O Cl 2 Cl 3 Cl 4 Date Cl 1 C Cl 1 B Cl 1 O Cl 2 Cl 3 Cl 4 Date Cl 1 C Cl 1 B Cl 1 O Cl 2 Cl 3 Cl 4 Date Cl 1 C Cl 1 B Cl 1 O Cl 2 Cl 3 Cl 4
2011 7 8 7 24 33 64 2011 7 7 7 23 31 63 2011 6 6 6 22 29 59 2011 6 6 6 21 27 57 2011 5 5 5 20 25 54
2012 8 8 8 24 33 65 2012 7 7 7 24 32 63 2012 6 7 6 22 30 60 2012 6 6 6 21 28 58 2012 5 5 5 20 26 55
2013 8 8 8 25 34 66 2013 7 8 7 24 32 64 2013 7 7 7 23 30 62 2013 6 6 6 22 29 60 2013 5 6 5 21 26 57
2014 8 8 8 25 35 68 2014 7 8 7 25 33 66 2014 7 7 7 23 31 63 2014 6 7 6 22 30 61 2014 6 6 6 21 27 58
2015 8 8 8 26 36 69 2015 8 8 8 25 34 67 2015 7 7 7 24 32 65 2015 6 7 6 23 30 63 2015 6 6 6 22 28 60
2020 8 9 8 27 37 71 2020 8 9 8 27 36 71 2020 8 8 8 26 35 69 2020 7 8 7 25 34 69 2020 7 7 7 24 32 67
2025 9 10 9 29 40 77 2025 9 9 9 28 38 74 2025 9 9 9 28 37 75 2025 8 9 8 27 35 72 2025 8 9 8 27 35 72
Date Cl 1 C Cl 1 B Cl 1 O Cl 2 Cl 3 Cl 4 Date Cl 1 C Cl 1 B Cl 1 O Cl 2 Cl 3 Cl 4 Date Cl 1 C Cl 1 B Cl 1 O Cl 2 Cl 3 Cl 4 Date Cl 1 C Cl 1 B Cl 1 O Cl 2 Cl 3 Cl 4 Date Cl 1 C Cl 1 B Cl 1 O Cl 2 Cl 3 Cl 4
2011 6 6 6 21 29 57 2011 6 6 6 20 27 55 2011 5 5 5 19 25 51 2011 4 4 4 17 22 48 2011 3 3 3 15 19 43
2012 6 6 6 21 29 57 2012 6 6 6 20 27 55 2012 5 5 5 19 25 51 2012 4 4 4 17 22 48 2012 3 3 3 15 19 43
2013 6 6 6 21 29 58 2013 6 6 6 20 27 55 2013 5 5 5 19 25 51 2013 4 4 4 17 22 48 2013 3 3 3 15 19 43
2014 6 6 6 21 29 58 2014 6 6 6 20 27 55 2014 5 5 5 19 25 51 2014 4 4 4 17 22 49 2014 3 3 3 15 19 44
2015 6 6 6 21 29 58 2015 6 6 6 20 27 55 2015 5 5 5 19 25 51 2015 4 4 4 17 23 49 2015 3 3 3 15 19 44
2020 6 6 6 21 29 58 2020 6 6 6 20 27 55 2020 5 5 5 19 25 51 2020 4 4 4 17 22 48 2020 3 3 3 15 19 44
2025 6 6 6 21 29 57 2025 6 6 6 20 27 54 2025 5 5 5 19 24 51 2025 4 4 4 17 22 48 2025 3 3 3 15 19 44
Date Cl 1 C Cl 1 B Cl 1 O Cl 2 Cl 3 Cl 4 Date Cl 1 C Cl 1 B Cl 1 O Cl 2 Cl 3 Cl 4 Date Cl 1 C Cl 1 B Cl 1 O Cl 2 Cl 3 Cl 4 Date Cl 1 C Cl 1 B Cl 1 O Cl 2 Cl 3 Cl 4 Date Cl 1 C Cl 1 B Cl 1 O Cl 2 Cl 3 Cl 4
2011 6 6 6 20 27 54 2011 5 5 5 18 25 50 2011 4 4 4 17 22 46 2011 4 4 4 15 19 43 2011 3 3 3 14 17 39
2012 6 6 6 20 27 54 2012 5 5 5 18 25 50 2012 4 4 4 17 22 46 2012 4 4 4 15 19 43 2012 3 3 3 14 17 39
2013 6 6 6 20 27 54 2013 5 5 5 18 25 50 2013 4 4 4 17 22 46 2013 4 4 4 15 19 43 2013 3 3 3 14 17 39
2014 6 6 6 20 27 54 2014 5 5 5 18 25 50 2014 4 4 4 17 22 46 2014 4 4 4 15 19 43 2014 3 3 3 14 17 39
2015 6 6 6 20 27 54 2015 5 5 5 18 25 50 2015 4 4 4 17 22 47 2015 4 4 4 15 19 43 2015 3 3 3 14 17 39
2020 7 7 7 22 30 59 2020 6 6 6 20 27 55 2020 5 5 5 19 25 51 2020 4 4 4 17 22 47 2020 3 3 3 15 19 44
2025 7 7 7 23 32 63 2025 6 7 6 22 30 60 2025 6 6 6 21 28 58 2025 5 5 5 20 26 55 2025 5 5 5 19 24 52
Weekend - 60c Equiv Toll Rate Weekend - 70c Equiv Toll RateWeekend - 30c Equiv Toll Rate Weekend - 40c Equiv Toll Rate Weekend - 50c Equiv Toll Rate
Weekday Evening - 40c Equiv Toll Rate Weekday Evening - 50c Equiv Toll Rate Weekday Evening - 60c Equiv Toll Rate Weekday Evening - 70c Equiv Toll RateWeekday Evening - 30c Equiv Toll Rate
Midday Off Peak - 30c Equiv Toll Rate Midday Off Peak - 40c Equiv Toll Rate Midday Off Peak - 50c Equiv Toll Rate Midday Off Peak - 60c Equiv Toll Rate Midday Off Peak - 70c Equiv Toll Rate
Afternoon Peak Hour - 60c Equiv Toll Rate Afternoon Peak Hour - 70c Equiv Toll RateAfternoon Peak Hour - 30c Equiv Toll Rate Afternoon Peak Hour - 40c Equiv Toll Rate Afternoon Peak Hour - 50c Equiv Toll Rate
Morning Peak Hour - 40c Equiv Toll Rate Morning Peak Hour - 50c Equiv Toll Rate Morning Peak Hour - 60c Equiv Toll Rate Morning Peak Hour - 70c Equiv Toll RateMorning Peak Hour - 30c Equiv Toll Rate

Economic Analysis of the Gauteng Freeway Improvement Scheme 127
N14: Jan Smuts to Brakfontein (Northbound)
Date Cl 1 C Cl 1 B Cl 1 O Cl 2 Cl 3 Cl 4 Date Cl 1 C Cl 1 B Cl 1 O Cl 2 Cl 3 Cl 4 Date Cl 1 C Cl 1 B Cl 1 O Cl 2 Cl 3 Cl 4 Date Cl 1 C Cl 1 B Cl 1 O Cl 2 Cl 3 Cl 4 Date Cl 1 C Cl 1 B Cl 1 O Cl 2 Cl 3 Cl 4
2011 18 27 18 43 59 104 2011 18 27 18 43 59 104 2011 18 26 18 42 58 103 2011 17 26 17 41 56 99 2011 17 25 17 40 54 97
2012 19 30 19 44 60 105 2012 19 30 19 44 60 106 2012 19 30 19 44 59 105 2012 18 29 18 42 57 101 2012 18 29 18 42 56 100
2013 21 34 21 45 61 106 2013 21 35 21 46 61 108 2013 21 34 21 45 61 107 2013 20 33 20 44 59 103 2013 20 33 20 44 59 103
2014 23 41 23 47 63 108 2014 23 41 23 48 64 110 2014 23 41 23 48 63 110 2014 23 40 23 46 62 106 2014 23 40 23 47 62 107
2015 26 52 27 50 65 109 2015 27 52 27 50 66 111 2015 27 52 27 50 66 111 2015 26 51 26 49 64 108 2015 27 52 27 50 65 110
2020 16 35 17 28 36 60 2020 16 33 16 28 35 58 2020 16 34 16 28 36 58 2020 17 35 17 28 36 60 2020 16 34 16 28 35 58
2025 8 13 8 20 27 48 2025 10 15 10 22 30 54 2025 8 13 8 20 27 48 2025 9 14 9 21 28 50 2025 9 15 9 22 30 53
Date Cl 1 C Cl 1 B Cl 1 O Cl 2 Cl 3 Cl 4 Date Cl 1 C Cl 1 B Cl 1 O Cl 2 Cl 3 Cl 4 Date Cl 1 C Cl 1 B Cl 1 O Cl 2 Cl 3 Cl 4 Date Cl 1 C Cl 1 B Cl 1 O Cl 2 Cl 3 Cl 4 Date Cl 1 C Cl 1 B Cl 1 O Cl 2 Cl 3 Cl 4
2011 13 23 13 25 34 58 2011 14 27 14 28 37 63 2011 12 23 12 25 33 56 2011 14 26 14 27 36 61 2011 11 20 11 23 30 52
2012 12 23 12 25 33 56 2012 14 27 14 27 36 61 2012 13 23 13 25 33 56 2012 14 26 14 26 35 59 2012 12 21 12 23 31 52
2013 12 23 12 24 31 54 2013 14 27 14 26 35 59 2013 13 25 13 25 33 56 2013 13 26 14 26 34 57 2013 12 23 12 24 31 53
2014 12 22 12 23 30 52 2014 14 27 14 26 34 56 2014 13 26 13 25 33 55 2014 13 26 13 25 33 56 2014 13 25 13 24 31 53
2015 11 22 12 22 30 50 2015 14 28 14 25 32 54 2015 14 28 14 26 33 55 2015 13 26 13 25 32 54 2015 13 27 14 25 32 54
2020 8 10 8 20 27 49 2020 8 10 8 20 27 49 2020 8 10 8 20 27 50 2020 7 10 7 18 25 46 2020 7 10 7 19 26 47
2025 17 30 17 34 45 78 2025 16 29 16 33 44 76 2025 17 31 17 34 45 78 2025 17 31 17 34 45 77 2025 17 30 17 34 44 76
Date Cl 1 C Cl 1 B Cl 1 O Cl 2 Cl 3 Cl 4 Date Cl 1 C Cl 1 B Cl 1 O Cl 2 Cl 3 Cl 4 Date Cl 1 C Cl 1 B Cl 1 O Cl 2 Cl 3 Cl 4 Date Cl 1 C Cl 1 B Cl 1 O Cl 2 Cl 3 Cl 4 Date Cl 1 C Cl 1 B Cl 1 O Cl 2 Cl 3 Cl 4
2011 14 20 14 35 47 85 2011 14 19 14 33 46 82 2011 13 19 14 33 45 81 2011 13 19 13 33 45 81 2011 13 19 13 32 44 79
2012 14 21 14 35 47 85 2012 14 20 14 34 46 82 2012 14 20 14 33 45 81 2012 14 20 14 33 45 81 2012 13 19 13 32 44 79
2013 14 21 14 35 47 85 2013 14 21 14 34 46 82 2013 14 20 14 33 46 81 2013 14 20 14 33 45 81 2013 14 20 14 33 45 80
2014 15 22 15 35 47 84 2014 14 21 14 34 46 82 2014 14 21 14 34 46 82 2014 14 21 14 33 46 81 2014 14 21 14 33 45 80
2015 15 22 15 35 47 84 2015 14 22 15 34 46 82 2015 14 22 14 34 46 82 2015 14 22 14 34 46 82 2015 14 21 14 33 45 80
2020 17 27 17 37 50 89 2020 17 27 17 37 50 89 2020 16 27 17 37 50 88 2020 16 26 16 36 49 86 2020 16 26 16 37 49 87
2025 19 39 19 34 44 74 2025 19 38 19 34 44 73 2025 19 38 19 34 44 74 2025 20 40 20 35 46 76 2025 20 42 21 36 47 78
Date Cl 1 C Cl 1 B Cl 1 O Cl 2 Cl 3 Cl 4 Date Cl 1 C Cl 1 B Cl 1 O Cl 2 Cl 3 Cl 4 Date Cl 1 C Cl 1 B Cl 1 O Cl 2 Cl 3 Cl 4 Date Cl 1 C Cl 1 B Cl 1 O Cl 2 Cl 3 Cl 4 Date Cl 1 C Cl 1 B Cl 1 O Cl 2 Cl 3 Cl 4
2011 3 3 3 8 11 21 2011 3 3 3 8 11 21 2011 3 3 3 8 11 21 2011 3 3 3 8 11 21 2011 3 3 3 8 11 21
2012 3 3 3 8 11 21 2012 3 3 3 8 11 21 2012 3 3 3 8 11 21 2012 3 3 3 8 11 21 2012 3 3 3 8 11 21
2013 3 3 3 8 11 21 2013 3 3 3 8 11 21 2013 3 3 3 8 11 21 2013 3 3 3 8 11 21 2013 3 3 3 8 11 21
2014 3 3 3 8 11 21 2014 3 3 3 8 11 21 2014 3 3 3 8 11 21 2014 3 3 3 8 11 21 2014 3 3 3 8 11 21
2015 3 3 3 8 11 21 2015 3 3 3 8 11 21 2015 3 3 3 8 11 21 2015 3 3 3 8 11 21 2015 3 3 3 8 11 21
2020 3 3 3 8 11 21 2020 3 3 3 8 11 21 2020 3 3 3 8 11 21 2020 3 3 3 8 11 21 2020 3 3 3 8 11 21
2025 3 3 3 8 11 21 2025 3 3 3 8 11 21 2025 3 3 3 8 11 21 2025 3 3 3 8 11 21 2025 3 3 3 8 11 21
Date Cl 1 C Cl 1 B Cl 1 O Cl 2 Cl 3 Cl 4 Date Cl 1 C Cl 1 B Cl 1 O Cl 2 Cl 3 Cl 4 Date Cl 1 C Cl 1 B Cl 1 O Cl 2 Cl 3 Cl 4 Date Cl 1 C Cl 1 B Cl 1 O Cl 2 Cl 3 Cl 4 Date Cl 1 C Cl 1 B Cl 1 O Cl 2 Cl 3 Cl 4
2011 5 5 5 15 21 38 2011 5 5 5 15 21 38 2011 5 5 5 15 21 38 2011 5 5 5 15 21 38 2011 5 5 5 15 21 38
2012 6 6 6 16 23 42 2012 6 6 6 16 23 42 2012 6 6 6 16 23 42 2012 6 6 6 16 23 42 2012 6 6 6 16 23 42
2013 6 6 6 18 25 46 2013 6 6 6 18 25 46 2013 6 6 6 18 25 46 2013 6 6 6 18 25 46 2013 6 6 6 18 25 46
2014 7 7 7 20 27 50 2014 7 7 7 20 27 50 2014 7 7 7 20 27 50 2014 7 7 7 19 27 50 2014 7 7 7 19 27 50
2015 7 8 7 21 30 55 2015 7 8 7 21 30 54 2015 7 8 7 21 29 54 2015 7 8 7 21 29 54 2015 7 8 7 21 29 53
2020 10 11 10 29 40 73 2020 10 11 10 28 40 73 2020 10 11 10 28 39 72 2020 10 11 10 27 38 70 2020 10 10 10 27 38 70
2025 13 15 13 34 48 87 2025 12 15 12 34 47 85 2025 12 15 12 34 47 85 2025 12 15 12 33 46 84 2025 12 14 12 32 44 80
Morning Peak Hour - 30c Equiv Toll Rate Morning Peak Hour - 40c Equiv Toll Rate
Midday Off Peak - 30c Equiv Toll Rate Midday Off Peak - 40c Equiv Toll Rate
Weekend - 30c Equiv Toll Rate Weekend - 40c Equiv Toll Rate
Weekday Evening - 30c Equiv Toll Rate Weekday Evening - 40c Equiv Toll Rate Weekday Evening - 50c Equiv Toll Rate Weekday Evening - 60c Equiv Toll Rate Weekday Evening - 70c Equiv Toll Rate
Morning Peak Hour - 50c Equiv Toll Rate Morning Peak Hour - 60c Equiv Toll Rate Morning Peak Hour - 70c Equiv Toll Rate
Afternoon Peak Hour - 30c Equiv Toll Rate Afternoon Peak Hour - 40c Equiv Toll Rate Afternoon Peak Hour - 50c Equiv Toll Rate Afternoon Peak Hour - 60c Equiv Toll Rate Afternoon Peak Hour - 70c Equiv Toll Rate
Weekend - 50c Equiv Toll Rate Weekend - 60c Equiv Toll Rate Weekend - 70c Equiv Toll Rate
Midday Off Peak - 50c Equiv Toll Rate Midday Off Peak - 60c Equiv Toll Rate Midday Off Peak - 70c Equiv Toll Rate

Economic Analysis of the Gauteng Freeway Improvement Scheme 128
N14: Jan Smuts to Brakfontein (Southbound)
Date Cl 1 C Cl 1 B Cl 1 O Cl 2 Cl 3 Cl 4 Date Cl 1 C Cl 1 B Cl 1 O Cl 2 Cl 3 Cl 4 Date Cl 1 C Cl 1 B Cl 1 O Cl 2 Cl 3 Cl 4 Date Cl 1 C Cl 1 B Cl 1 O Cl 2 Cl 3 Cl 4 Date Cl 1 C Cl 1 B Cl 1 O Cl 2 Cl 3 Cl 4
2011 17 34 17 32 42 70 2011 17 34 17 31 41 68 2011 17 34 17 32 42 70 2011 19 37 19 35 45 76 2011 18 37 19 34 44 73
2012 17 33 17 31 40 68 2012 17 33 17 30 39 66 2012 17 33 17 31 40 67 2012 18 36 18 33 43 72 2012 18 36 18 33 43 72
2013 16 33 17 30 39 65 2013 16 32 16 30 38 64 2013 16 32 16 30 39 65 2013 17 34 17 31 41 68 2013 18 35 18 32 42 70
2014 16 32 16 29 38 63 2014 16 32 16 29 37 62 2014 16 31 16 29 37 63 2014 16 32 16 30 38 64 2014 17 35 18 32 41 68
2015 16 31 16 28 36 60 2015 15 31 16 28 36 60 2015 15 30 15 28 36 60 2015 15 31 15 28 36 60 2015 17 34 17 31 40 67
2020 16 32 16 28 36 60 2020 17 34 17 30 38 64 2020 15 31 16 28 36 60 2020 18 36 18 31 40 66 2020 14 28 14 25 33 54
2025 13 23 13 27 35 61 2025 15 28 15 29 38 64 2025 14 26 14 27 35 60 2025 11 19 11 23 31 55 2025 13 23 13 27 36 62
Date Cl 1 C Cl 1 B Cl 1 O Cl 2 Cl 3 Cl 4 Date Cl 1 C Cl 1 B Cl 1 O Cl 2 Cl 3 Cl 4 Date Cl 1 C Cl 1 B Cl 1 O Cl 2 Cl 3 Cl 4 Date Cl 1 C Cl 1 B Cl 1 O Cl 2 Cl 3 Cl 4 Date Cl 1 C Cl 1 B Cl 1 O Cl 2 Cl 3 Cl 4
2011 19 31 19 42 57 100 2011 19 31 19 42 57 100 2011 19 31 19 42 57 100 2011 19 30 19 41 56 98 2011 19 31 19 42 57 100
2012 20 33 20 42 57 99 2012 20 33 20 43 57 100 2012 20 33 20 43 57 100 2012 19 33 20 42 56 98 2012 20 33 20 42 57 99
2013 21 36 21 43 57 99 2013 21 37 21 43 58 100 2013 21 37 21 43 58 100 2013 21 36 21 43 57 98 2013 21 36 21 43 57 99
2014 22 40 22 43 57 97 2014 22 41 22 44 58 99 2014 22 41 22 44 58 99 2014 22 41 22 43 57 97 2014 22 40 22 43 57 97
2015 23 46 24 43 56 95 2015 24 47 24 44 58 97 2015 24 48 24 44 58 97 2015 24 47 24 44 57 96 2015 24 46 24 43 57 95
2020 8 13 8 19 26 46 2020 9 15 9 19 26 46 2020 10 18 10 21 28 49 2020 11 21 11 22 29 50 2020 13 26 13 24 31 52
2025 8 13 8 18 25 44 2025 8 14 8 19 25 45 2025 8 14 8 19 25 44 2025 8 13 8 18 24 43 2025 9 15 9 20 27 47
Date Cl 1 C Cl 1 B Cl 1 O Cl 2 Cl 3 Cl 4 Date Cl 1 C Cl 1 B Cl 1 O Cl 2 Cl 3 Cl 4 Date Cl 1 C Cl 1 B Cl 1 O Cl 2 Cl 3 Cl 4 Date Cl 1 C Cl 1 B Cl 1 O Cl 2 Cl 3 Cl 4 Date Cl 1 C Cl 1 B Cl 1 O Cl 2 Cl 3 Cl 4
2011 14 19 14 34 47 84 2011 14 19 14 34 47 84 2011 14 19 14 34 47 84 2011 14 19 14 34 47 84 2011 14 19 14 34 47 84
2012 14 21 14 35 48 85 2012 14 21 14 35 48 85 2012 14 20 14 34 47 84 2012 14 20 14 35 47 85 2012 14 20 14 35 47 85
2013 15 22 15 35 48 86 2013 15 22 15 35 48 86 2013 15 21 15 35 48 85 2013 15 22 15 35 48 86 2013 15 22 15 35 48 86
2014 15 23 15 36 49 88 2014 15 23 15 36 49 87 2014 15 23 15 35 48 86 2014 15 23 15 36 49 86 2014 15 23 15 36 49 87
2015 16 25 16 37 50 89 2015 16 25 16 37 50 88 2015 16 24 16 36 49 87 2015 16 25 16 36 49 87 2015 16 25 16 36 49 88
2020 23 45 24 45 59 100 2020 24 45 24 46 60 101 2020 24 45 24 45 60 101 2020 24 45 24 45 60 101 2020 23 44 23 45 59 99
2025 11 21 11 22 30 51 2025 11 20 11 22 29 49 2025 11 21 12 23 30 52 2025 12 24 13 24 31 53 2025 11 21 11 22 29 50
Date Cl 1 C Cl 1 B Cl 1 O Cl 2 Cl 3 Cl 4 Date Cl 1 C Cl 1 B Cl 1 O Cl 2 Cl 3 Cl 4 Date Cl 1 C Cl 1 B Cl 1 O Cl 2 Cl 3 Cl 4 Date Cl 1 C Cl 1 B Cl 1 O Cl 2 Cl 3 Cl 4 Date Cl 1 C Cl 1 B Cl 1 O Cl 2 Cl 3 Cl 4
2011 3 3 3 8 11 21 2011 3 3 3 8 11 21 2011 3 3 3 8 11 21 2011 3 3 3 8 11 21 2011 3 3 3 8 11 21
2012 3 3 3 8 11 21 2012 3 3 3 8 11 21 2012 3 3 3 8 11 21 2012 3 3 3 8 11 21 2012 3 3 3 8 11 21
2013 3 3 3 8 11 21 2013 3 3 3 8 11 21 2013 3 3 3 8 11 21 2013 3 3 3 8 11 21 2013 3 3 3 8 11 21
2014 3 3 3 8 11 21 2014 3 3 3 8 11 21 2014 3 3 3 8 11 21 2014 3 3 3 8 11 21 2014 3 3 3 8 11 21
2015 3 3 3 8 11 21 2015 3 3 3 8 11 21 2015 3 3 3 8 11 21 2015 3 3 3 8 11 21 2015 3 3 3 8 11 21
2020 3 3 3 8 11 21 2020 3 3 3 8 11 21 2020 3 3 3 8 11 21 2020 3 3 3 8 11 21 2020 3 3 3 8 11 21
2025 3 3 3 8 11 21 2025 3 3 3 8 11 21 2025 3 3 3 8 11 21 2025 3 3 3 8 11 21 2025 3 3 3 8 11 21
Date Cl 1 C Cl 1 B Cl 1 O Cl 2 Cl 3 Cl 4 Date Cl 1 C Cl 1 B Cl 1 O Cl 2 Cl 3 Cl 4 Date Cl 1 C Cl 1 B Cl 1 O Cl 2 Cl 3 Cl 4 Date Cl 1 C Cl 1 B Cl 1 O Cl 2 Cl 3 Cl 4 Date Cl 1 C Cl 1 B Cl 1 O Cl 2 Cl 3 Cl 4
2011 4 4 4 12 17 32 2011 4 4 4 12 17 32 2011 4 4 4 12 17 32 2011 4 4 4 12 17 32 2011 4 4 4 12 17 32
2012 4 5 4 13 18 34 2012 4 5 4 13 18 34 2012 4 5 4 13 18 34 2012 4 5 4 13 18 34 2012 4 5 4 13 18 34
2013 5 5 5 14 19 35 2013 5 5 5 14 19 35 2013 5 5 5 14 19 35 2013 5 5 5 14 19 35 2013 5 5 5 14 19 35
2014 5 5 5 14 20 37 2014 5 5 5 14 20 37 2014 5 5 5 14 20 37 2014 5 5 5 14 20 37 2014 5 5 5 14 20 37
2015 5 5 5 15 21 38 2015 5 5 5 15 21 38 2015 5 5 5 15 21 38 2015 5 5 5 15 21 38 2015 5 5 5 15 21 38
2020 7 7 7 19 27 50 2020 7 7 7 19 27 50 2020 7 7 7 19 27 50 2020 7 7 7 19 27 50 2020 7 7 7 19 27 49
2025 9 10 9 25 35 65 2025 9 9 9 25 35 64 2025 9 9 9 25 35 64 2025 9 9 9 25 35 64 2025 9 9 9 25 34 63
Morning Peak Hour - 30c Equiv Toll Rate Morning Peak Hour - 40c Equiv Toll Rate Morning Peak Hour - 50c Equiv Toll Rate Morning Peak Hour - 60c Equiv Toll Rate Morning Peak Hour - 70c Equiv Toll Rate
Afternoon Peak Hour - 30c Equiv Toll Rate Afternoon Peak Hour - 40c Equiv Toll Rate Afternoon Peak Hour - 50c Equiv Toll Rate Afternoon Peak Hour - 60c Equiv Toll Rate Afternoon Peak Hour - 70c Equiv Toll Rate
Midday Off Peak - 30c Equiv Toll Rate Midday Off Peak - 40c Equiv Toll Rate Midday Off Peak - 50c Equiv Toll Rate Midday Off Peak - 60c Equiv Toll Rate Midday Off Peak - 70c Equiv Toll Rate
Weekday Evening - 30c Equiv Toll Rate Weekday Evening - 40c Equiv Toll Rate Weekday Evening - 50c Equiv Toll Rate Weekday Evening - 60c Equiv Toll Rate Weekday Evening - 70c Equiv Toll Rate
Weekend - 30c Equiv Toll Rate Weekend - 40c Equiv Toll Rate Weekend - 50c Equiv Toll Rate Weekend - 60c Equiv Toll Rate Weekend - 70c Equiv Toll Rate

Economic Analysis of the Gauteng Freeway Improvement Scheme 129
N14: Brakfontein to Hendrick Potgieter (Westbound)
Date Cl 1 C Cl 1 B Cl 1 O Cl 2 Cl 3 Cl 4 Date Cl 1 C Cl 1 B Cl 1 O Cl 2 Cl 3 Cl 4 Date Cl 1 C Cl 1 B Cl 1 O Cl 2 Cl 3 Cl 4 Date Cl 1 C Cl 1 B Cl 1 O Cl 2 Cl 3 Cl 4 Date Cl 1 C Cl 1 B Cl 1 O Cl 2 Cl 3 Cl 4
2011 38 49 38 99 137 249 2011 37 48 38 98 135 244 2011 38 48 38 98 136 246 2011 37 48 38 98 135 245 2011 37 48 37 96 133 241
2012 39 52 39 101 139 251 2012 39 51 39 99 137 247 2012 39 51 39 99 137 248 2012 38 51 39 99 136 246 2012 38 50 38 98 135 243
2013 40 54 40 102 140 253 2013 40 54 40 101 139 250 2013 40 54 40 101 139 250 2013 40 53 40 100 138 248 2013 39 53 39 99 137 246
2014 42 58 42 103 142 255 2014 41 58 42 103 141 254 2014 41 58 41 102 141 252 2014 41 57 41 102 139 250 2014 41 57 41 101 139 249
2015 43 62 43 105 144 258 2015 43 62 43 105 144 257 2015 43 62 43 104 143 255 2015 42 61 42 103 141 253 2015 42 61 42 103 141 252
2020 43 66 43 99 135 239 2020 41 64 42 97 131 233 2020 42 64 42 98 132 235 2020 41 62 41 95 130 230 2020 41 63 42 97 132 234
2025 60 103 60 127 170 296 2025 59 102 59 125 167 291 2025 59 102 60 126 168 293 2025 59 102 60 126 168 292 2025 57 98 57 122 163 283
Date Cl 1 C Cl 1 B Cl 1 O Cl 2 Cl 3 Cl 4 Date Cl 1 C Cl 1 B Cl 1 O Cl 2 Cl 3 Cl 4 Date Cl 1 C Cl 1 B Cl 1 O Cl 2 Cl 3 Cl 4 Date Cl 1 C Cl 1 B Cl 1 O Cl 2 Cl 3 Cl 4 Date Cl 1 C Cl 1 B Cl 1 O Cl 2 Cl 3 Cl 4
2011 35 50 35 84 115 206 2011 34 49 34 83 114 204 2011 34 49 34 82 112 201 2011 33 48 33 81 110 197 2011 33 47 33 79 108 194
2012 37 55 37 87 119 212 2012 36 54 36 86 118 210 2012 36 54 36 85 116 207 2012 35 53 36 84 115 204 2012 35 52 35 83 113 201
2013 39 61 40 91 123 219 2013 39 61 39 90 123 217 2013 39 61 39 89 121 215 2013 38 60 38 88 120 212 2013 38 59 38 87 119 210
2014 43 70 43 95 128 225 2014 43 70 43 94 127 223 2014 42 69 42 93 125 220 2014 42 69 42 92 124 218 2014 41 68 41 91 123 215
2015 48 83 48 100 133 230 2015 47 83 48 99 132 229 2015 47 82 47 98 130 226 2015 46 82 47 97 129 224 2015 46 81 46 96 128 222
2020 51 99 51 97 127 215 2020 48 91 48 92 121 205 2020 48 92 48 92 121 204 2020 47 91 48 91 119 202 2020 46 88 46 89 116 197
2025 19 25 19 51 70 127 2025 19 24 19 50 69 125 2025 18 23 18 49 68 124 2025 18 23 18 49 67 123 2025 20 26 20 52 72 131
Date Cl 1 C Cl 1 B Cl 1 O Cl 2 Cl 3 Cl 4 Date Cl 1 C Cl 1 B Cl 1 O Cl 2 Cl 3 Cl 4 Date Cl 1 C Cl 1 B Cl 1 O Cl 2 Cl 3 Cl 4 Date Cl 1 C Cl 1 B Cl 1 O Cl 2 Cl 3 Cl 4 Date Cl 1 C Cl 1 B Cl 1 O Cl 2 Cl 3 Cl 4
2011 14 16 14 40 56 102 2011 14 16 14 40 56 103 2011 15 17 15 41 57 105 2011 14 16 14 40 56 103 2011 14 16 14 39 55 101
2012 19 22 19 53 74 135 2012 19 22 19 53 74 135 2012 18 21 18 51 71 130 2012 18 21 18 50 70 128 2012 18 21 18 49 69 126
2013 23 27 23 63 88 161 2013 23 27 23 62 87 159 2013 22 26 22 61 85 155 2013 22 26 22 60 84 153 2013 22 25 22 59 83 151
2014 27 31 27 72 101 183 2014 26 31 26 71 99 181 2014 26 31 26 70 98 178 2014 26 30 26 70 97 177 2014 25 30 25 69 96 174
2015 29 35 29 79 110 200 2015 29 35 29 79 109 199 2015 29 35 29 78 108 198 2015 29 35 29 78 108 197 2015 29 35 29 77 107 195
2020 39 58 39 92 126 224 2020 38 57 38 91 124 222 2020 38 57 38 90 123 219 2020 37 56 37 89 121 215 2020 37 55 37 87 119 211
2025 55 110 56 102 132 221 2025 55 111 56 102 132 221 2025 54 108 55 99 129 216 2025 53 106 54 98 127 213 2025 52 104 53 96 124 208
Date Cl 1 C Cl 1 B Cl 1 O Cl 2 Cl 3 Cl 4 Date Cl 1 C Cl 1 B Cl 1 O Cl 2 Cl 3 Cl 4 Date Cl 1 C Cl 1 B Cl 1 O Cl 2 Cl 3 Cl 4 Date Cl 1 C Cl 1 B Cl 1 O Cl 2 Cl 3 Cl 4 Date Cl 1 C Cl 1 B Cl 1 O Cl 2 Cl 3 Cl 4
2011 9 10 9 25 35 65 2011 9 10 9 25 36 65 2011 9 10 9 26 36 67 2011 9 10 9 26 37 68 2011 10 11 10 27 38 70
2012 9 10 9 25 35 65 2012 9 10 9 25 36 65 2012 9 10 9 26 36 67 2012 9 10 9 26 37 68 2012 10 11 10 27 38 70
2013 9 10 9 25 35 65 2013 9 10 9 25 36 65 2013 9 10 9 26 36 67 2013 9 10 9 26 37 68 2013 10 11 10 27 38 70
2014 9 10 9 25 35 65 2014 9 10 9 25 36 65 2014 9 10 9 26 36 67 2014 9 10 9 26 37 68 2014 10 11 10 27 38 70
2015 9 10 9 25 35 65 2015 9 10 9 25 36 65 2015 9 10 9 26 36 67 2015 9 10 9 26 37 68 2015 10 11 10 27 38 70
2020 9 10 9 25 35 65 2020 9 10 9 25 35 65 2020 9 10 9 26 36 66 2020 9 10 9 26 37 68 2020 10 11 10 27 38 70
2025 9 10 9 25 35 64 2025 9 10 9 25 35 64 2025 9 10 9 25 35 65 2025 9 10 9 26 36 66 2025 9 11 9 27 38 70
Date Cl 1 C Cl 1 B Cl 1 O Cl 2 Cl 3 Cl 4 Date Cl 1 C Cl 1 B Cl 1 O Cl 2 Cl 3 Cl 4 Date Cl 1 C Cl 1 B Cl 1 O Cl 2 Cl 3 Cl 4 Date Cl 1 C Cl 1 B Cl 1 O Cl 2 Cl 3 Cl 4 Date Cl 1 C Cl 1 B Cl 1 O Cl 2 Cl 3 Cl 4
2011 9 10 9 25 36 65 2011 9 10 9 26 36 66 2011 9 10 9 26 36 67 2011 9 10 9 26 36 67 2011 9 10 9 27 37 68
2012 9 10 9 25 36 65 2012 9 10 9 26 36 66 2012 9 10 9 26 36 67 2012 9 10 9 26 36 67 2012 9 10 9 27 37 68
2013 9 10 9 25 35 65 2013 9 10 9 26 36 66 2013 9 10 9 26 36 67 2013 9 10 9 26 36 67 2013 9 10 9 26 37 68
2014 9 10 9 25 35 65 2014 9 10 9 26 36 66 2014 9 10 9 26 36 67 2014 9 10 9 26 36 67 2014 9 10 9 26 37 68
2015 9 10 9 25 35 65 2015 9 10 9 26 36 66 2015 9 10 9 26 36 67 2015 9 10 9 26 36 67 2015 9 10 9 26 37 68
2020 9 10 9 26 36 66 2020 9 10 9 26 36 66 2020 9 10 9 26 36 66 2020 9 10 9 26 36 66 2020 9 10 9 26 37 67
2025 9 11 9 25 35 63 2025 9 11 9 25 35 63 2025 9 11 9 25 35 64 2025 9 11 9 25 35 64 2025 9 11 9 25 35 64
Morning Peak Hour - 30c Equiv Toll Rate Morning Peak Hour - 40c Equiv Toll Rate Morning Peak Hour - 50c Equiv Toll Rate
Midday Off Peak - 30c Equiv Toll Rate Midday Off Peak - 40c Equiv Toll Rate Midday Off Peak - 50c Equiv Toll Rate
Weekend - 30c Equiv Toll Rate
Weekday Evening - 30c Equiv Toll Rate Weekday Evening - 40c Equiv Toll Rate Weekday Evening - 50c Equiv Toll Rate Weekday Evening - 60c Equiv Toll Rate Weekday Evening - 70c Equiv Toll Rate
Morning Peak Hour - 60c Equiv Toll Rate Morning Peak Hour - 70c Equiv Toll Rate
Afternoon Peak Hour - 30c Equiv Toll Rate Afternoon Peak Hour - 40c Equiv Toll Rate Afternoon Peak Hour - 50c Equiv Toll Rate Afternoon Peak Hour - 60c Equiv Toll Rate Afternoon Peak Hour - 70c Equiv Toll Rate
Weekend - 40c Equiv Toll Rate Weekend - 50c Equiv Toll Rate Weekend - 60c Equiv Toll Rate Weekend - 70c Equiv Toll Rate
Midday Off Peak - 60c Equiv Toll Rate Midday Off Peak - 70c Equiv Toll Rate

Economic Analysis of the Gauteng Freeway Improvement Scheme 130
N14: Brakfontein to Hendrick Potgieter (Eastbound)
Date Cl 1 C Cl 1 B Cl 1 O Cl 2 Cl 3 Cl 4 Date Cl 1 C Cl 1 B Cl 1 O Cl 2 Cl 3 Cl 4 Date Cl 1 C Cl 1 B Cl 1 O Cl 2 Cl 3 Cl 4 Date Cl 1 C Cl 1 B Cl 1 O Cl 2 Cl 3 Cl 4 Date Cl 1 C Cl 1 B Cl 1 O Cl 2 Cl 3 Cl 4
2011 46 83 46 94 125 215 2011 45 82 46 92 122 211 2011 45 81 45 91 121 208 2011 45 81 45 91 120 207 2011 44 79 44 88 117 201
2012 47 86 48 96 127 219 2012 46 85 47 94 125 215 2012 46 84 46 93 124 213 2012 46 84 46 93 123 212 2012 45 82 45 91 120 206
2013 49 90 49 99 130 224 2013 48 88 48 96 127 219 2013 48 87 48 96 126 217 2013 48 87 48 96 126 217 2013 47 86 47 94 124 212
2014 51 95 51 101 134 229 2014 50 92 50 99 130 223 2014 49 92 50 98 129 221 2014 50 92 50 98 130 222 2014 49 90 49 97 127 218
2015 54 101 54 105 138 234 2015 52 99 53 102 134 228 2015 52 98 52 101 133 227 2015 52 98 53 102 134 228 2015 51 97 52 100 132 224
2020 60 114 60 116 152 258 2020 59 111 60 115 152 258 2020 60 114 61 118 155 263 2020 57 108 58 112 148 252 2020 60 112 60 117 154 262
2025 42 68 42 93 126 221 2025 42 68 42 93 126 222 2025 42 68 42 94 126 222 2025 42 68 42 93 126 221 2025 42 68 42 93 126 221
Date Cl 1 C Cl 1 B Cl 1 O Cl 2 Cl 3 Cl 4 Date Cl 1 C Cl 1 B Cl 1 O Cl 2 Cl 3 Cl 4 Date Cl 1 C Cl 1 B Cl 1 O Cl 2 Cl 3 Cl 4 Date Cl 1 C Cl 1 B Cl 1 O Cl 2 Cl 3 Cl 4 Date Cl 1 C Cl 1 B Cl 1 O Cl 2 Cl 3 Cl 4
2011 39 69 39 81 108 186 2011 38 68 38 79 105 181 2011 38 67 38 78 103 178 2011 37 67 37 76 101 175 2011 37 66 37 76 100 173
2012 39 70 40 81 108 186 2012 39 70 39 79 105 182 2012 38 69 39 78 103 178 2012 38 69 38 77 102 175 2012 37 68 38 76 101 173
2013 40 73 40 81 108 185 2013 40 72 40 80 106 182 2013 39 72 39 78 104 178 2013 39 71 39 77 102 175 2013 38 71 39 76 101 173
2014 41 76 41 82 108 185 2014 41 76 41 81 107 183 2014 40 75 40 79 104 178 2014 40 74 40 78 103 176 2014 39 74 40 77 102 174
2015 43 81 43 84 110 188 2015 43 81 43 83 110 187 2015 42 79 42 81 107 182 2015 42 79 42 81 106 180 2015 41 78 41 79 104 177
2020 50 96 50 95 124 211 2020 48 93 49 92 120 204 2020 49 95 49 93 121 205 2020 48 92 48 91 119 201 2020 49 95 49 92 120 203
2025 48 90 48 93 123 209 2025 50 98 51 96 126 212 2025 45 84 45 88 116 198 2025 47 89 48 93 122 208 2025 48 92 48 92 121 205
Date Cl 1 C Cl 1 B Cl 1 O Cl 2 Cl 3 Cl 4 Date Cl 1 C Cl 1 B Cl 1 O Cl 2 Cl 3 Cl 4 Date Cl 1 C Cl 1 B Cl 1 O Cl 2 Cl 3 Cl 4 Date Cl 1 C Cl 1 B Cl 1 O Cl 2 Cl 3 Cl 4 Date Cl 1 C Cl 1 B Cl 1 O Cl 2 Cl 3 Cl 4
2011 25 52 25 43 55 90 2011 25 52 25 43 55 90 2011 25 52 25 43 55 91 2011 25 51 25 43 55 90 2011 24 51 24 40 52 84
2012 30 58 30 58 75 128 2012 30 58 30 57 75 128 2012 29 57 30 56 73 123 2012 29 56 29 54 70 118 2012 28 56 28 52 68 114
2013 35 63 35 70 93 160 2013 34 62 34 69 91 157 2013 34 62 34 67 89 153 2013 33 61 33 66 87 149 2013 33 61 33 64 85 145
2014 39 68 39 82 109 189 2014 38 67 39 80 107 186 2014 38 67 38 79 106 183 2014 37 66 38 78 104 179 2014 37 66 37 77 102 177
2015 43 73 43 93 125 218 2015 43 73 43 92 123 215 2015 42 72 43 91 122 214 2015 42 72 42 90 120 210 2015 42 72 42 89 120 208
2020 48 88 49 97 129 222 2020 47 86 48 95 126 215 2020 47 86 47 93 123 211 2020 46 85 46 91 120 206 2020 45 84 46 90 119 203
2025 65 135 66 113 145 239 2025 66 137 67 115 148 244 2025 65 135 66 113 144 237 2025 64 134 65 111 143 235 2025 63 131 64 109 140 230
Date Cl 1 C Cl 1 B Cl 1 O Cl 2 Cl 3 Cl 4 Date Cl 1 C Cl 1 B Cl 1 O Cl 2 Cl 3 Cl 4 Date Cl 1 C Cl 1 B Cl 1 O Cl 2 Cl 3 Cl 4 Date Cl 1 C Cl 1 B Cl 1 O Cl 2 Cl 3 Cl 4 Date Cl 1 C Cl 1 B Cl 1 O Cl 2 Cl 3 Cl 4
2011 22 49 23 37 47 75 2011 23 49 23 37 47 76 2011 23 49 23 37 47 76 2011 23 49 23 38 48 78 2011 23 50 23 38 48 78
2012 22 49 23 37 47 75 2012 23 49 23 37 47 76 2012 23 49 23 37 47 76 2012 23 49 23 38 48 78 2012 23 50 23 38 48 78
2013 22 49 23 37 46 75 2013 23 49 23 37 47 76 2013 23 49 23 37 47 76 2013 23 49 23 38 48 78 2013 23 50 23 38 49 79
2014 22 49 23 37 46 75 2014 23 49 23 37 47 76 2014 23 49 23 37 47 76 2014 23 49 23 38 48 78 2014 23 50 23 38 49 79
2015 22 49 23 37 46 75 2015 23 49 23 37 47 76 2015 23 49 23 37 47 76 2015 23 49 23 38 48 77 2015 23 50 23 39 49 80
2020 22 49 23 37 46 74 2020 22 49 23 37 47 75 2020 22 49 23 37 47 75 2020 23 49 23 37 47 77 2020 23 50 23 38 49 79
2025 22 49 23 36 46 74 2025 22 49 23 37 46 75 2025 22 49 23 37 46 74 2025 23 49 23 37 47 76 2025 23 50 23 38 48 78
Date Cl 1 C Cl 1 B Cl 1 O Cl 2 Cl 3 Cl 4 Date Cl 1 C Cl 1 B Cl 1 O Cl 2 Cl 3 Cl 4 Date Cl 1 C Cl 1 B Cl 1 O Cl 2 Cl 3 Cl 4 Date Cl 1 C Cl 1 B Cl 1 O Cl 2 Cl 3 Cl 4 Date Cl 1 C Cl 1 B Cl 1 O Cl 2 Cl 3 Cl 4
2011 23 49 23 37 47 76 2011 23 49 23 37 47 77 2011 23 49 23 37 47 77 2011 23 49 23 38 48 77 2011 23 50 23 38 49 79
2012 23 49 23 37 47 76 2012 23 49 23 37 47 77 2012 23 49 23 37 47 77 2012 23 49 23 38 48 77 2012 23 50 23 38 49 79
2013 23 49 23 37 47 76 2013 23 49 23 37 47 77 2013 23 49 23 37 47 77 2013 23 49 23 38 48 77 2013 23 50 23 38 49 79
2014 23 49 23 37 47 76 2014 23 49 23 37 47 77 2014 23 49 23 37 47 77 2014 23 49 23 37 47 77 2014 23 50 23 38 48 78
2015 23 49 23 37 47 76 2015 23 49 23 37 47 77 2015 23 49 23 37 47 77 2015 23 49 23 37 47 77 2015 23 50 23 38 48 78
2020 23 49 23 37 47 76 2020 23 49 23 37 47 76 2020 23 49 23 37 47 76 2020 23 49 23 37 47 76 2020 23 49 23 38 48 77
2025 25 52 26 45 58 96 2025 25 52 26 45 58 96 2025 25 52 26 45 58 97 2025 25 52 26 45 57 95 2025 24 51 24 41 53 87
Morning Peak Hour - 30c Equiv Toll Rate Morning Peak Hour - 40c Equiv Toll Rate Morning Peak Hour - 50c Equiv Toll Rate Morning Peak Hour - 60c Equiv Toll Rate Morning Peak Hour - 70c Equiv Toll Rate
Afternoon Peak Hour - 30c Equiv Toll Rate Afternoon Peak Hour - 40c Equiv Toll Rate Afternoon Peak Hour - 50c Equiv Toll Rate Afternoon Peak Hour - 60c Equiv Toll Rate Afternoon Peak Hour - 70c Equiv Toll Rate
Midday Off Peak - 30c Equiv Toll Rate Midday Off Peak - 40c Equiv Toll Rate Midday Off Peak - 50c Equiv Toll Rate Midday Off Peak - 60c Equiv Toll Rate Midday Off Peak - 70c Equiv Toll Rate
Weekday Evening - 30c Equiv Toll Rate Weekday Evening - 40c Equiv Toll Rate Weekday Evening - 50c Equiv Toll Rate Weekday Evening - 60c Equiv Toll Rate Weekday Evening - 70c Equiv Toll Rate
Weekend - 30c Equiv Toll Rate Weekend - 40c Equiv Toll Rate Weekend - 50c Equiv Toll Rate Weekend - 60c Equiv Toll Rate Weekend - 70c Equiv Toll Rate

Economic Analysis of the Gauteng Freeway Improvement Scheme 131
N12: N1 Diepkloof to N3 Elands Interchange (Eastbound)
Date Cl 1 C Cl 1 B Cl 1 O Cl 2 Cl 3 Cl 4 Date Cl 1 C Cl 1 B Cl 1 O Cl 2 Cl 3 Cl 4 Date Cl 1 C Cl 1 B Cl 1 O Cl 2 Cl 3 Cl 4 Date Cl 1 C Cl 1 B Cl 1 O Cl 2 Cl 3 Cl 4 Date Cl 1 C Cl 1 B Cl 1 O Cl 2 Cl 3 Cl 4
2011 19 30 19 48 62 118 2011 19 31 19 49 63 123 2011 19 31 19 49 63 124 2011 18 31 18 49 62 124 2011 18 31 18 48 60 124
2012 19 31 19 47 61 115 2012 19 32 19 47 61 117 2012 18 32 19 47 60 118 2012 18 32 18 47 58 117 2012 17 32 17 46 56 117
2013 19 32 19 46 59 111 2013 19 33 19 46 58 112 2013 18 33 18 45 56 111 2013 18 33 18 44 55 110 2013 17 33 17 44 53 110
2014 19 34 19 45 57 108 2014 19 35 19 44 56 107 2014 18 35 18 43 53 105 2014 18 35 18 42 51 103 2014 17 35 17 42 50 103
2015 20 37 20 44 56 105 2015 19 37 19 43 53 102 2015 18 37 19 41 50 98 2015 18 37 18 40 48 97 2015 18 38 18 40 47 97
2020 16 35 17 33 41 76 2020 17 38 17 34 40 76 2020 17 41 17 33 38 73 2020 14 36 15 28 30 62 2020 16 42 16 30 32 67
2025 14 35 15 24 28 51 2025 17 48 18 25 26 46 2025 10 32 10 15 13 29 2025 8 28 8 10 5 17 2025 15 48 15 18 13 30
Date Cl 1 C Cl 1 B Cl 1 O Cl 2 Cl 3 Cl 4 Date Cl 1 C Cl 1 B Cl 1 O Cl 2 Cl 3 Cl 4 Date Cl 1 C Cl 1 B Cl 1 O Cl 2 Cl 3 Cl 4 Date Cl 1 C Cl 1 B Cl 1 O Cl 2 Cl 3 Cl 4 Date Cl 1 C Cl 1 B Cl 1 O Cl 2 Cl 3 Cl 4
2011 16 20 16 47 63 123 2011 16 20 16 47 62 123 2011 15 19 15 46 60 122 2011 14 18 14 45 57 119 2011 13 17 13 43 54 117
2012 17 22 17 48 63 123 2012 16 21 16 47 62 123 2012 15 20 15 46 60 122 2012 14 19 14 45 57 118 2012 13 19 13 44 55 118
2013 17 23 17 47 63 121 2013 16 22 16 47 62 122 2013 15 22 16 46 60 121 2013 14 20 14 44 56 117 2013 14 20 14 44 55 117
2014 17 24 17 47 62 120 2014 16 24 17 47 61 120 2014 16 23 16 46 59 119 2014 14 22 14 43 55 114 2014 14 21 14 44 54 115
2015 17 25 17 47 62 119 2015 17 25 17 47 61 119 2015 16 25 16 46 58 117 2015 14 23 15 43 53 111 2015 14 23 14 43 53 113
2020 14 25 14 36 46 88 2020 13 23 13 33 41 82 2020 13 24 13 33 40 82 2020 12 23 12 31 37 79 2020 11 23 11 29 33 75
2025 14 28 14 31 39 74 2025 12 25 12 27 32 64 2025 11 24 11 24 27 59 2025 11 28 11 25 27 59 2025 9 24 9 20 20 49
Date Cl 1 C Cl 1 B Cl 1 O Cl 2 Cl 3 Cl 4 Date Cl 1 C Cl 1 B Cl 1 O Cl 2 Cl 3 Cl 4 Date Cl 1 C Cl 1 B Cl 1 O Cl 2 Cl 3 Cl 4 Date Cl 1 C Cl 1 B Cl 1 O Cl 2 Cl 3 Cl 4 Date Cl 1 C Cl 1 B Cl 1 O Cl 2 Cl 3 Cl 4
2011 6 7 6 23 30 63 2011 5 5 5 20 25 56 2011 3 4 3 17 20 50 2011 1 2 1 13 14 42 2011 -0 0 -0 10 8 34
2012 8 8 8 27 35 72 2012 6 7 6 24 30 65 2012 5 5 5 21 25 59 2012 3 4 3 18 20 52 2012 1 2 1 14 14 44
2013 9 10 9 30 40 81 2013 7 8 7 27 35 75 2013 6 7 6 24 30 68 2013 4 5 4 21 25 62 2013 3 4 3 18 20 55
2014 10 11 10 33 44 89 2014 9 10 9 31 40 84 2014 7 8 7 28 35 78 2014 6 7 6 25 30 71 2014 4 5 4 22 25 65
2015 11 13 11 37 49 98 2015 10 11 10 34 45 93 2015 9 10 9 32 40 87 2015 7 9 7 29 35 81 2015 5 7 5 26 30 74
2020 16 20 17 49 66 127 2020 16 20 16 48 64 127 2020 15 19 15 48 62 126 2020 14 18 14 46 59 124 2020 13 17 13 44 56 120
2025 18 29 18 46 60 114 2025 17 28 17 44 57 110 2025 17 29 17 46 58 115 2025 16 29 16 44 54 111 2025 15 28 16 43 52 109
Date Cl 1 C Cl 1 B Cl 1 O Cl 2 Cl 3 Cl 4 Date Cl 1 C Cl 1 B Cl 1 O Cl 2 Cl 3 Cl 4 Date Cl 1 C Cl 1 B Cl 1 O Cl 2 Cl 3 Cl 4 Date Cl 1 C Cl 1 B Cl 1 O Cl 2 Cl 3 Cl 4 Date Cl 1 C Cl 1 B Cl 1 O Cl 2 Cl 3 Cl 4
2011 -2 -2 -2 0 -2 5 2011 -5 -5 -5 -6 -11 -10 2011 -6 -7 -6 -10 -18 -19 2011 -8 -9 -8 -14 -24 -29 2011 -10 -11 -10 -18 -30 -37
2012 -2 -2 -2 0 -2 5 2012 -5 -5 -5 -6 -11 -10 2012 -6 -7 -6 -10 -18 -20 2012 -8 -9 -8 -14 -24 -29 2012 -10 -11 -10 -18 -30 -37
2013 -2 -2 -2 0 -2 5 2013 -5 -5 -5 -6 -11 -10 2013 -6 -7 -6 -10 -18 -20 2013 -8 -9 -8 -14 -25 -29 2013 -10 -11 -10 -18 -30 -37
2014 -2 -2 -2 0 -2 5 2014 -5 -5 -5 -6 -11 -10 2014 -7 -7 -7 -10 -18 -20 2014 -8 -9 -8 -14 -25 -29 2014 -10 -11 -10 -18 -30 -37
2015 -2 -2 -2 0 -2 5 2015 -5 -5 -5 -6 -11 -10 2015 -7 -7 -7 -10 -18 -20 2015 -8 -9 -8 -14 -25 -29 2015 -10 -11 -10 -18 -30 -37
2020 -2 -2 -2 0 -2 5 2020 -5 -5 -5 -6 -12 -10 2020 -7 -7 -7 -10 -18 -20 2020 -8 -9 -8 -14 -25 -29 2020 -10 -11 -10 -18 -31 -37
2025 -2 -2 -2 0 -2 5 2025 -4 -5 -4 -6 -11 -10 2025 -7 -7 -7 -10 -19 -21 2025 -9 -9 -9 -14 -25 -29 2025 -10 -11 -10 -18 -30 -37
Date Cl 1 C Cl 1 B Cl 1 O Cl 2 Cl 3 Cl 4 Date Cl 1 C Cl 1 B Cl 1 O Cl 2 Cl 3 Cl 4 Date Cl 1 C Cl 1 B Cl 1 O Cl 2 Cl 3 Cl 4 Date Cl 1 C Cl 1 B Cl 1 O Cl 2 Cl 3 Cl 4 Date Cl 1 C Cl 1 B Cl 1 O Cl 2 Cl 3 Cl 4
2011 -2 -2 -2 -0 -3 3 2011 -4 -4 -4 -4 -9 -5 2011 -6 -6 -6 -8 -15 -14 2011 -8 -8 -8 -12 -21 -22 2011 -10 -10 -10 -16 -27 -31
2012 -2 -2 -2 -0 -3 3 2012 -4 -4 -4 -4 -9 -5 2012 -6 -6 -6 -8 -15 -13 2012 -8 -8 -8 -12 -21 -22 2012 -10 -10 -10 -16 -27 -31
2013 -2 -2 -2 -0 -3 3 2013 -4 -4 -4 -4 -9 -5 2013 -6 -6 -6 -8 -15 -13 2013 -8 -8 -8 -12 -21 -22 2013 -9 -10 -9 -16 -27 -31
2014 -2 -2 -2 -0 -3 3 2014 -4 -4 -4 -4 -9 -5 2014 -6 -6 -6 -8 -15 -13 2014 -8 -8 -8 -12 -21 -22 2014 -9 -10 -9 -16 -27 -31
2015 -2 -2 -2 -0 -3 3 2015 -4 -4 -4 -4 -9 -5 2015 -6 -6 -6 -8 -14 -13 2015 -8 -8 -8 -12 -21 -22 2015 -9 -10 -9 -16 -27 -31
2020 -1 -1 -1 2 0 9 2020 -3 -3 -3 -2 -6 1 2020 -5 -5 -5 -5 -11 -8 2020 -7 -7 -7 -9 -17 -16 2020 -9 -9 -9 -13 -24 -25
2025 1 1 1 7 8 22 2025 -1 -1 -1 4 2 15 2025 -3 -3 -3 1 -3 8 2025 -4 -4 -4 -3 -8 1 2025 -6 -6 -6 -6 -14 -7
Morning Peak Hour - 30c Equiv Toll Rate Morning Peak Hour - 40c Equiv Toll Rate
Midday Off Peak - 30c Equiv Toll Rate Midday Off Peak - 40c Equiv Toll Rate
Weekend - 30c Equiv Toll Rate Weekend - 40c Equiv Toll Rate
Weekday Evening - 30c Equiv Toll Rate Weekday Evening - 40c Equiv Toll Rate Weekday Evening - 50c Equiv Toll Rate Weekday Evening - 60c Equiv Toll Rate Weekday Evening - 70c Equiv Toll Rate
Morning Peak Hour - 50c Equiv Toll Rate Morning Peak Hour - 60c Equiv Toll Rate Morning Peak Hour - 70c Equiv Toll Rate
Afternoon Peak Hour - 30c Equiv Toll Rate Afternoon Peak Hour - 40c Equiv Toll Rate Afternoon Peak Hour - 50c Equiv Toll Rate Afternoon Peak Hour - 60c Equiv Toll Rate Afternoon Peak Hour - 70c Equiv Toll Rate
Weekend - 50c Equiv Toll Rate Weekend - 60c Equiv Toll Rate Weekend - 70c Equiv Toll Rate
Midday Off Peak - 50c Equiv Toll Rate Midday Off Peak - 60c Equiv Toll Rate Midday Off Peak - 70c Equiv Toll Rate

Economic Analysis of the Gauteng Freeway Improvement Scheme 132
N12: N1 Diepkloof to N3 Elands Interchange (Westbound)
Date Cl 1 C Cl 1 B Cl 1 O Cl 2 Cl 3 Cl 4 Date Cl 1 C Cl 1 B Cl 1 O Cl 2 Cl 3 Cl 4 Date Cl 1 C Cl 1 B Cl 1 O Cl 2 Cl 3 Cl 4 Date Cl 1 C Cl 1 B Cl 1 O Cl 2 Cl 3 Cl 4 Date Cl 1 C Cl 1 B Cl 1 O Cl 2 Cl 3 Cl 4
2011 15 17 15 45 60 118 2011 14 16 14 44 58 117 2011 12 15 12 42 54 112 2011 11 14 11 39 50 107 2011 10 13 10 38 48 105
2012 15 17 15 44 60 117 2012 14 17 14 45 59 118 2012 13 16 13 42 55 114 2012 12 14 12 40 51 110 2012 11 14 11 39 49 108
2013 14 17 14 44 59 115 2013 14 17 14 45 59 118 2013 13 16 13 43 55 114 2013 12 15 12 42 53 113 2013 11 14 11 40 50 110
2014 14 17 14 43 57 112 2014 14 18 15 45 59 118 2014 13 16 13 42 55 113 2014 13 16 13 43 54 115 2014 12 15 12 41 51 112
2015 14 18 14 42 56 110 2015 15 18 15 45 59 118 2015 13 17 13 42 54 112 2015 13 17 13 43 55 116 2015 12 16 12 42 52 113
2020 13 17 13 39 51 100 2020 12 17 12 38 50 100 2020 10 14 10 33 41 88 2020 11 15 11 36 44 96 2020 9 14 9 34 41 92
2025 10 14 10 30 39 79 2025 9 13 9 27 34 72 2025 7 11 7 24 29 65 2025 7 11 7 24 29 67 2025 6 11 6 24 27 66
Date Cl 1 C Cl 1 B Cl 1 O Cl 2 Cl 3 Cl 4 Date Cl 1 C Cl 1 B Cl 1 O Cl 2 Cl 3 Cl 4 Date Cl 1 C Cl 1 B Cl 1 O Cl 2 Cl 3 Cl 4 Date Cl 1 C Cl 1 B Cl 1 O Cl 2 Cl 3 Cl 4 Date Cl 1 C Cl 1 B Cl 1 O Cl 2 Cl 3 Cl 4
2011 20 34 20 46 59 112 2011 19 34 19 45 57 109 2011 18 33 18 43 54 107 2011 17 34 18 43 52 106 2011 17 33 17 41 49 103
2012 20 36 20 46 59 111 2012 20 36 20 45 57 108 2012 19 36 19 43 54 105 2012 18 36 18 42 51 103 2012 17 35 17 41 48 100
2013 21 39 21 46 59 110 2013 20 39 21 45 57 108 2013 19 39 20 44 53 104 2013 18 39 19 42 50 100 2013 18 39 18 41 48 98
2014 22 43 22 47 60 109 2014 22 44 22 46 57 107 2014 21 43 21 44 53 103 2014 19 42 20 42 49 97 2014 19 43 19 41 47 96
2015 24 48 24 48 60 109 2015 23 49 24 47 58 107 2015 22 48 23 45 54 102 2015 21 47 21 42 49 95 2015 21 48 21 41 47 94
2020 25 62 25 36 41 67 2020 28 73 29 40 44 74 2020 28 75 29 39 42 72 2020 26 72 26 35 35 62 2020 22 65 22 28 25 47
2025 4 9 4 10 11 26 2025 7 20 7 13 13 30 2025 8 27 8 13 10 25 2025 2 13 2 4 -1 10 2025 0 11 0 -0 -8 0
Date Cl 1 C Cl 1 B Cl 1 O Cl 2 Cl 3 Cl 4 Date Cl 1 C Cl 1 B Cl 1 O Cl 2 Cl 3 Cl 4 Date Cl 1 C Cl 1 B Cl 1 O Cl 2 Cl 3 Cl 4 Date Cl 1 C Cl 1 B Cl 1 O Cl 2 Cl 3 Cl 4 Date Cl 1 C Cl 1 B Cl 1 O Cl 2 Cl 3 Cl 4
2011 10 11 10 32 42 86 2011 8 9 8 29 38 80 2011 7 8 7 27 33 74 2011 5 6 5 23 27 66 2011 3 4 3 20 22 58
2012 12 13 12 37 49 98 2012 10 12 10 34 45 92 2012 9 10 9 31 40 86 2012 7 9 7 28 35 80 2012 5 7 5 25 29 72
2013 13 15 13 41 55 109 2013 12 14 12 39 51 105 2013 11 13 11 36 47 99 2013 9 11 9 34 42 92 2013 7 10 7 31 37 86
2014 15 17 15 45 60 118 2014 14 17 14 44 58 117 2014 12 15 13 41 54 111 2014 11 14 11 39 49 105 2014 9 12 9 36 44 99
2015 16 19 16 48 64 126 2015 16 19 16 48 64 126 2015 14 18 15 47 61 124 2015 13 16 13 44 56 118 2015 11 15 11 41 51 112
2020 18 25 18 48 64 122 2020 17 25 17 48 63 124 2020 17 25 17 49 64 127 2020 17 25 17 50 64 130 2020 17 25 17 51 64 134
2025 21 40 22 46 59 109 2025 21 41 21 45 56 106 2025 20 40 20 43 52 101 2025 17 36 17 37 43 88 2025 17 38 17 39 44 92
Date Cl 1 C Cl 1 B Cl 1 O Cl 2 Cl 3 Cl 4 Date Cl 1 C Cl 1 B Cl 1 O Cl 2 Cl 3 Cl 4 Date Cl 1 C Cl 1 B Cl 1 O Cl 2 Cl 3 Cl 4 Date Cl 1 C Cl 1 B Cl 1 O Cl 2 Cl 3 Cl 4 Date Cl 1 C Cl 1 B Cl 1 O Cl 2 Cl 3 Cl 4
2011 -2 -2 -2 -0 -3 3 2011 -4 -4 -4 -4 -9 -6 2011 -6 -6 -6 -9 -16 -16 2011 -8 -9 -8 -13 -23 -27 2011 -10 -10 -10 -17 -30 -36
2012 -2 -2 -2 -0 -3 3 2012 -4 -4 -4 -4 -9 -6 2012 -6 -6 -6 -9 -16 -16 2012 -8 -9 -8 -13 -23 -27 2012 -10 -10 -10 -17 -30 -36
2013 -2 -2 -2 -0 -3 3 2013 -4 -4 -4 -4 -9 -6 2013 -6 -6 -6 -9 -16 -16 2013 -8 -9 -8 -13 -24 -27 2013 -10 -11 -10 -17 -30 -36
2014 -2 -2 -2 -0 -3 3 2014 -4 -4 -4 -4 -9 -6 2014 -6 -6 -6 -9 -16 -16 2014 -8 -9 -8 -13 -24 -27 2014 -10 -11 -10 -17 -30 -36
2015 -2 -2 -2 -0 -3 3 2015 -4 -4 -4 -4 -9 -6 2015 -6 -6 -6 -9 -16 -16 2015 -8 -9 -8 -13 -24 -27 2015 -10 -11 -10 -18 -30 -36
2020 -2 -2 -2 -0 -3 3 2020 -4 -4 -4 -4 -9 -6 2020 -6 -6 -6 -9 -16 -16 2020 -8 -9 -8 -14 -24 -28 2020 -10 -11 -10 -18 -30 -37
2025 -2 -2 -2 -0 -3 3 2025 -4 -4 -4 -4 -9 -6 2025 -6 -6 -6 -9 -16 -16 2025 -8 -9 -8 -14 -24 -28 2025 -10 -11 -10 -18 -30 -37
Date Cl 1 C Cl 1 B Cl 1 O Cl 2 Cl 3 Cl 4 Date Cl 1 C Cl 1 B Cl 1 O Cl 2 Cl 3 Cl 4 Date Cl 1 C Cl 1 B Cl 1 O Cl 2 Cl 3 Cl 4 Date Cl 1 C Cl 1 B Cl 1 O Cl 2 Cl 3 Cl 4 Date Cl 1 C Cl 1 B Cl 1 O Cl 2 Cl 3 Cl 4
2011 -2 -2 -2 -0 -3 3 2011 -4 -4 -4 -4 -9 -5 2011 -6 -6 -6 -8 -15 -14 2011 -8 -8 -8 -12 -21 -23 2011 -10 -10 -10 -16 -27 -31
2012 -2 -2 -2 -0 -3 3 2012 -4 -4 -4 -4 -9 -5 2012 -6 -6 -6 -8 -15 -13 2012 -8 -8 -8 -12 -21 -22 2012 -10 -10 -10 -16 -27 -31
2013 -2 -2 -2 -0 -3 3 2013 -4 -4 -4 -4 -9 -5 2013 -6 -6 -6 -8 -15 -13 2013 -8 -8 -8 -12 -21 -22 2013 -10 -10 -10 -16 -27 -31
2014 -2 -2 -2 -0 -3 3 2014 -4 -4 -4 -4 -9 -5 2014 -6 -6 -6 -8 -15 -13 2014 -8 -8 -8 -11 -21 -22 2014 -10 -10 -10 -16 -27 -31
2015 -2 -2 -2 -0 -3 3 2015 -4 -4 -4 -4 -9 -5 2015 -6 -6 -6 -8 -15 -13 2015 -8 -8 -8 -11 -21 -22 2015 -10 -10 -10 -16 -27 -31
2020 -2 -2 -2 -0 -3 3 2020 -4 -4 -4 -4 -9 -5 2020 -6 -6 -6 -8 -15 -13 2020 -7 -8 -7 -11 -20 -21 2020 -9 -10 -9 -16 -27 -31
2025 -2 -2 -2 0 -2 5 2025 -4 -4 -4 -3 -8 -4 2025 -5 -6 -5 -7 -14 -12 2025 -7 -8 -7 -11 -20 -20 2025 -9 -9 -9 -15 -26 -29
Morning Peak Hour - 30c Equiv Toll Rate Morning Peak Hour - 40c Equiv Toll Rate Morning Peak Hour - 50c Equiv Toll Rate Morning Peak Hour - 60c Equiv Toll Rate Morning Peak Hour - 70c Equiv Toll Rate
Afternoon Peak Hour - 30c Equiv Toll Rate Afternoon Peak Hour - 40c Equiv Toll Rate Afternoon Peak Hour - 50c Equiv Toll Rate Afternoon Peak Hour - 60c Equiv Toll Rate Afternoon Peak Hour - 70c Equiv Toll Rate
Midday Off Peak - 30c Equiv Toll Rate Midday Off Peak - 40c Equiv Toll Rate Midday Off Peak - 50c Equiv Toll Rate Midday Off Peak - 60c Equiv Toll Rate Midday Off Peak - 70c Equiv Toll Rate
Weekday Evening - 30c Equiv Toll Rate Weekday Evening - 40c Equiv Toll Rate Weekday Evening - 50c Equiv Toll Rate Weekday Evening - 60c Equiv Toll Rate Weekday Evening - 70c Equiv Toll Rate
Weekend - 30c Equiv Toll Rate Weekend - 40c Equiv Toll Rate Weekend - 50c Equiv Toll Rate Weekend - 60c Equiv Toll Rate Weekend - 70c Equiv Toll Rate

Economic Analysis of the Gauteng Freeway Improvement Scheme 133
N12: N3 Gillooly’s to Kingsway (Eastbound)
Date Cl 1 C Cl 1 B Cl 1 O Cl 2 Cl 3 Cl 4 Date Cl 1 C Cl 1 B Cl 1 O Cl 2 Cl 3 Cl 4 Date Cl 1 C Cl 1 B Cl 1 O Cl 2 Cl 3 Cl 4 Date Cl 1 C Cl 1 B Cl 1 O Cl 2 Cl 3 Cl 4 Date Cl 1 C Cl 1 B Cl 1 O Cl 2 Cl 3 Cl 4
2011 8 11 8 27 35 72 2011 6 9 6 23 28 63 2011 5 8 5 20 23 55 2011 3 6 3 16 17 47 2011 1 5 1 13 11 39
2012 10 13 10 30 39 79 2012 8 11 8 26 33 70 2012 6 9 6 23 27 62 2012 4 8 4 19 21 54 2012 3 6 3 15 15 46
2013 10 14 10 32 42 85 2013 9 12 9 29 37 77 2013 7 11 7 25 31 70 2013 5 9 5 22 25 61 2013 4 8 4 18 19 53
2014 11 15 11 34 45 90 2014 10 14 10 32 40 84 2014 8 13 8 28 35 76 2014 6 11 6 24 28 68 2014 5 9 5 21 23 60
2015 12 16 12 36 47 94 2015 11 16 11 34 44 91 2015 9 14 9 31 39 83 2015 7 12 7 27 32 74 2015 6 11 6 24 27 67
2020 14 16 14 42 57 112 2020 12 15 12 40 53 107 2020 11 13 11 37 47 100 2020 9 12 9 35 44 96 2020 8 10 8 32 38 89
2025 16 21 16 46 61 119 2025 14 19 14 42 55 111 2025 14 22 14 40 51 105 2025 10 16 11 35 44 96 2025 9 14 9 32 38 89
Date Cl 1 C Cl 1 B Cl 1 O Cl 2 Cl 3 Cl 4 Date Cl 1 C Cl 1 B Cl 1 O Cl 2 Cl 3 Cl 4 Date Cl 1 C Cl 1 B Cl 1 O Cl 2 Cl 3 Cl 4 Date Cl 1 C Cl 1 B Cl 1 O Cl 2 Cl 3 Cl 4 Date Cl 1 C Cl 1 B Cl 1 O Cl 2 Cl 3 Cl 4
2011 23 49 23 45 55 100 2011 23 51 23 44 53 97 2011 22 51 22 41 48 90 2011 21 50 21 38 43 85 2011 19 50 20 36 38 78
2012 23 49 23 45 55 99 2012 23 52 24 44 53 97 2012 22 51 22 40 47 89 2012 21 50 21 38 43 84 2012 19 50 19 35 37 76
2013 23 50 24 45 55 99 2013 24 53 24 44 53 97 2013 22 51 22 40 46 88 2013 21 51 21 38 42 83 2013 19 49 19 34 36 74
2014 24 51 24 45 55 99 2014 24 55 25 45 53 97 2014 22 51 22 40 46 87 2014 21 51 21 38 42 83 2014 19 49 19 34 36 73
2015 24 52 24 45 55 99 2015 25 57 25 45 54 98 2015 22 51 22 39 45 86 2015 21 51 21 38 42 82 2015 19 49 19 33 35 72
2020 18 37 18 37 45 84 2020 14 31 14 31 36 72 2020 12 28 12 27 30 63 2020 10 27 11 23 25 56 2020 8 24 8 19 17 46
2025 12 22 12 29 36 71 2025 12 26 12 27 32 65 2025 10 23 10 23 26 56 2025 7 17 7 18 18 47 2025 4 13 4 13 11 37
Date Cl 1 C Cl 1 B Cl 1 O Cl 2 Cl 3 Cl 4 Date Cl 1 C Cl 1 B Cl 1 O Cl 2 Cl 3 Cl 4 Date Cl 1 C Cl 1 B Cl 1 O Cl 2 Cl 3 Cl 4 Date Cl 1 C Cl 1 B Cl 1 O Cl 2 Cl 3 Cl 4 Date Cl 1 C Cl 1 B Cl 1 O Cl 2 Cl 3 Cl 4
2011 21 28 21 58 78 150 2011 20 28 20 58 77 149 2011 20 28 20 57 74 148 2011 19 27 19 56 72 147 2011 18 27 18 55 70 145
2012 21 29 21 58 77 148 2012 20 29 21 57 76 147 2012 20 28 20 57 74 146 2012 19 28 19 56 72 145 2012 18 28 18 55 70 144
2013 21 30 21 58 77 146 2013 21 30 21 57 75 145 2013 20 29 20 56 73 145 2013 19 29 19 56 71 144 2013 18 29 19 55 69 143
2014 21 31 21 57 76 145 2014 21 31 21 56 74 143 2014 20 31 20 56 72 143 2014 19 30 20 55 70 142 2014 19 30 19 54 68 141
2015 22 32 22 57 75 143 2015 21 32 21 56 73 142 2015 20 32 21 56 72 143 2015 20 31 20 55 70 142 2015 19 31 19 54 68 139
2020 23 38 23 55 71 133 2020 22 37 22 53 68 131 2020 21 38 21 53 66 130 2020 20 37 20 51 63 127 2020 19 37 19 49 60 124
2025 28 56 28 55 69 125 2025 27 56 27 54 66 122 2025 25 55 26 51 61 115 2025 24 55 25 48 57 109 2025 23 54 24 46 53 105
Date Cl 1 C Cl 1 B Cl 1 O Cl 2 Cl 3 Cl 4 Date Cl 1 C Cl 1 B Cl 1 O Cl 2 Cl 3 Cl 4 Date Cl 1 C Cl 1 B Cl 1 O Cl 2 Cl 3 Cl 4 Date Cl 1 C Cl 1 B Cl 1 O Cl 2 Cl 3 Cl 4 Date Cl 1 C Cl 1 B Cl 1 O Cl 2 Cl 3 Cl 4
2011 0 0 0 7 7 22 2011 -1 -1 -1 3 1 14 2011 -3 -3 -3 -0 -4 6 2011 -5 -5 -5 -4 -11 -2 2011 -7 -7 -7 -8 -17 -11
2012 0 0 0 7 7 22 2012 -1 -1 -1 3 1 14 2012 -3 -3 -3 -0 -4 6 2012 -5 -5 -5 -4 -11 -2 2012 -7 -7 -7 -8 -17 -11
2013 0 0 0 7 7 21 2013 -1 -1 -1 3 1 14 2013 -3 -3 -3 -0 -5 6 2013 -5 -5 -5 -4 -11 -2 2013 -7 -7 -7 -8 -17 -11
2014 0 0 0 7 7 21 2014 -1 -1 -1 3 1 14 2014 -3 -3 -3 -0 -5 6 2014 -5 -5 -5 -4 -11 -2 2014 -7 -7 -7 -8 -17 -11
2015 0 0 0 7 7 21 2015 -1 -1 -1 3 1 14 2015 -3 -3 -3 -0 -5 6 2015 -5 -5 -5 -4 -11 -3 2015 -7 -7 -7 -8 -17 -11
2020 0 0 0 7 7 22 2020 -1 -1 -1 3 1 13 2020 -3 -3 -3 -0 -5 6 2020 -5 -5 -5 -4 -11 -3 2020 -7 -7 -7 -8 -17 -11
2025 0 0 0 7 7 21 2025 -2 -2 -2 3 1 13 2025 -3 -3 -3 -1 -5 5 2025 -5 -5 -5 -4 -11 -3 2025 -7 -7 -7 -8 -17 -12
Date Cl 1 C Cl 1 B Cl 1 O Cl 2 Cl 3 Cl 4 Date Cl 1 C Cl 1 B Cl 1 O Cl 2 Cl 3 Cl 4 Date Cl 1 C Cl 1 B Cl 1 O Cl 2 Cl 3 Cl 4 Date Cl 1 C Cl 1 B Cl 1 O Cl 2 Cl 3 Cl 4 Date Cl 1 C Cl 1 B Cl 1 O Cl 2 Cl 3 Cl 4
2011 0 0 0 7 7 22 2011 -1 -1 -1 3 1 13 2011 -3 -3 -3 -1 -5 5 2011 -5 -5 -5 -4 -11 -4 2011 -7 -7 -7 -8 -17 -12
2012 0 0 0 7 7 22 2012 -1 -1 -1 3 1 13 2012 -3 -3 -3 -1 -5 5 2012 -5 -5 -5 -4 -11 -4 2012 -7 -7 -7 -8 -17 -12
2013 1 1 1 7 8 23 2013 -1 -1 -1 3 2 14 2013 -3 -3 -3 -0 -5 6 2013 -5 -5 -5 -4 -11 -3 2013 -7 -7 -7 -8 -17 -11
2014 1 1 1 8 8 24 2014 -1 -1 -1 4 2 15 2014 -3 -3 -3 0 -4 7 2014 -5 -5 -5 -4 -10 -2 2014 -7 -7 -7 -8 -16 -10
2015 1 1 1 8 9 24 2015 -1 -1 -1 4 3 16 2015 -3 -3 -3 0 -4 8 2015 -5 -5 -5 -3 -10 -1 2015 -7 -7 -7 -7 -16 -9
2020 1 1 1 9 11 28 2020 -0 -0 -0 6 5 21 2020 -2 -2 -2 3 -0 14 2020 -4 -4 -4 -0 -6 7 2020 -6 -5 -6 -4 -11 -1
2025 3 4 3 14 17 39 2025 1 2 1 10 11 31 2025 -0 0 -0 7 5 24 2025 -2 -2 -2 3 -0 16 2025 -4 -3 -4 0 -5 10
Morning Peak Hour - 30c Equiv Toll Rate Morning Peak Hour - 40c Equiv Toll Rate Morning Peak Hour - 50c Equiv Toll Rate
Midday Off Peak - 30c Equiv Toll Rate Midday Off Peak - 40c Equiv Toll Rate Midday Off Peak - 50c Equiv Toll Rate
Weekend - 30c Equiv Toll Rate
Weekday Evening - 30c Equiv Toll Rate Weekday Evening - 40c Equiv Toll Rate Weekday Evening - 50c Equiv Toll Rate Weekday Evening - 60c Equiv Toll Rate Weekday Evening - 70c Equiv Toll Rate
Morning Peak Hour - 60c Equiv Toll Rate Morning Peak Hour - 70c Equiv Toll Rate
Afternoon Peak Hour - 30c Equiv Toll Rate Afternoon Peak Hour - 40c Equiv Toll Rate Afternoon Peak Hour - 50c Equiv Toll Rate Afternoon Peak Hour - 60c Equiv Toll Rate Afternoon Peak Hour - 70c Equiv Toll Rate
Weekend - 40c Equiv Toll Rate Weekend - 50c Equiv Toll Rate Weekend - 60c Equiv Toll Rate Weekend - 70c Equiv Toll Rate
Midday Off Peak - 60c Equiv Toll Rate Midday Off Peak - 70c Equiv Toll Rate
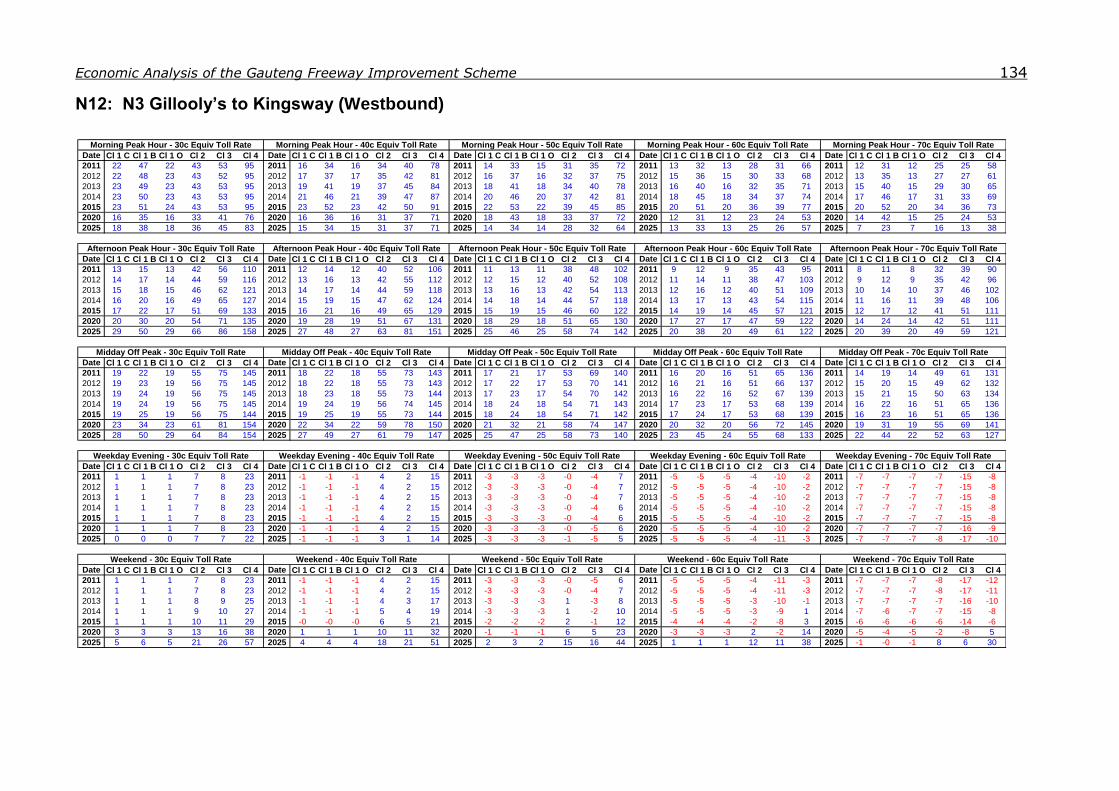
Economic Analysis of the Gauteng Freeway Improvement Scheme 134
N12: N3 Gillooly’s to Kingsway (Westbound)
Date Cl 1 C Cl 1 B Cl 1 O Cl 2 Cl 3 Cl 4 Date Cl 1 C Cl 1 B Cl 1 O Cl 2 Cl 3 Cl 4 Date Cl 1 C Cl 1 B Cl 1 O Cl 2 Cl 3 Cl 4 Date Cl 1 C Cl 1 B Cl 1 O Cl 2 Cl 3 Cl 4 Date Cl 1 C Cl 1 B Cl 1 O Cl 2 Cl 3 Cl 4
2011 22 47 22 43 53 95 2011 16 34 16 34 40 78 2011 14 33 15 31 35 72 2011 13 32 13 28 31 66 2011 12 31 12 25 25 58
2012 22 48 23 43 52 95 2012 17 37 17 35 42 81 2012 16 37 16 32 37 75 2012 15 36 15 30 33 68 2012 13 35 13 27 27 61
2013 23 49 23 43 53 95 2013 19 41 19 37 45 84 2013 18 41 18 34 40 78 2013 16 40 16 32 35 71 2013 15 40 15 29 30 65
2014 23 50 23 43 53 95 2014 21 46 21 39 47 87 2014 20 46 20 37 42 81 2014 18 45 18 34 37 74 2014 17 46 17 31 33 69
2015 23 51 24 43 53 95 2015 23 52 23 42 50 91 2015 22 53 22 39 45 85 2015 20 51 20 36 39 77 2015 20 52 20 34 36 73
2020 16 35 16 33 41 76 2020 16 36 16 31 37 71 2020 18 43 18 33 37 72 2020 12 31 12 23 24 53 2020 14 42 15 25 24 53
2025 18 38 18 36 45 83 2025 15 34 15 31 37 71 2025 14 34 14 28 32 64 2025 13 33 13 25 26 57 2025 7 23 7 16 13 38
Date Cl 1 C Cl 1 B Cl 1 O Cl 2 Cl 3 Cl 4 Date Cl 1 C Cl 1 B Cl 1 O Cl 2 Cl 3 Cl 4 Date Cl 1 C Cl 1 B Cl 1 O Cl 2 Cl 3 Cl 4 Date Cl 1 C Cl 1 B Cl 1 O Cl 2 Cl 3 Cl 4 Date Cl 1 C Cl 1 B Cl 1 O Cl 2 Cl 3 Cl 4
2011 13 15 13 42 56 110 2011 12 14 12 40 52 106 2011 11 13 11 38 48 102 2011 9 12 9 35 43 95 2011 8 11 8 32 39 90
2012 14 17 14 44 59 116 2012 13 16 13 42 55 112 2012 12 15 12 40 52 108 2012 11 14 11 38 47 103 2012 9 12 9 35 42 96
2013 15 18 15 46 62 121 2013 14 17 14 44 59 118 2013 13 16 13 42 54 113 2013 12 16 12 40 51 109 2013 10 14 10 37 46 102
2014 16 20 16 49 65 127 2014 15 19 15 47 62 124 2014 14 18 14 44 57 118 2014 13 17 13 43 54 115 2014 11 16 11 39 48 106
2015 17 22 17 51 69 133 2015 16 21 16 49 65 129 2015 15 19 15 46 60 122 2015 14 19 14 45 57 121 2015 12 17 12 41 51 111
2020 20 30 20 54 71 135 2020 19 28 19 51 67 131 2020 18 29 18 51 65 130 2020 17 27 17 47 59 122 2020 14 24 14 42 51 111
2025 29 50 29 66 86 158 2025 27 48 27 63 81 151 2025 25 46 25 58 74 142 2025 20 38 20 49 61 122 2025 20 39 20 49 59 121
Date Cl 1 C Cl 1 B Cl 1 O Cl 2 Cl 3 Cl 4 Date Cl 1 C Cl 1 B Cl 1 O Cl 2 Cl 3 Cl 4 Date Cl 1 C Cl 1 B Cl 1 O Cl 2 Cl 3 Cl 4 Date Cl 1 C Cl 1 B Cl 1 O Cl 2 Cl 3 Cl 4 Date Cl 1 C Cl 1 B Cl 1 O Cl 2 Cl 3 Cl 4
2011 19 22 19 55 75 145 2011 18 22 18 55 73 143 2011 17 21 17 53 69 140 2011 16 20 16 51 65 136 2011 14 19 14 49 61 131
2012 19 23 19 56 75 145 2012 18 22 18 55 73 143 2012 17 22 17 53 70 141 2012 16 21 16 51 66 137 2012 15 20 15 49 62 132
2013 19 24 19 56 75 145 2013 18 23 18 55 73 144 2013 17 23 17 54 70 142 2013 16 22 16 52 67 139 2013 15 21 15 50 63 134
2014 19 24 19 56 75 145 2014 19 24 19 56 74 145 2014 18 24 18 54 71 143 2014 17 23 17 53 68 139 2014 16 22 16 51 65 136
2015 19 25 19 56 75 144 2015 19 25 19 55 73 144 2015 18 24 18 54 71 142 2015 17 24 17 53 68 139 2015 16 23 16 51 65 136
2020 23 34 23 61 81 154 2020 22 34 22 59 78 150 2020 21 32 21 58 74 147 2020 20 32 20 56 72 145 2020 19 31 19 55 69 141
2025 28 50 29 64 84 154 2025 27 49 27 61 79 147 2025 25 47 25 58 73 140 2025 23 45 24 55 68 133 2025 22 44 22 52 63 127
Date Cl 1 C Cl 1 B Cl 1 O Cl 2 Cl 3 Cl 4 Date Cl 1 C Cl 1 B Cl 1 O Cl 2 Cl 3 Cl 4 Date Cl 1 C Cl 1 B Cl 1 O Cl 2 Cl 3 Cl 4 Date Cl 1 C Cl 1 B Cl 1 O Cl 2 Cl 3 Cl 4 Date Cl 1 C Cl 1 B Cl 1 O Cl 2 Cl 3 Cl 4
2011 1 1 1 7 8 23 2011 -1 -1 -1 4 2 15 2011 -3 -3 -3 -0 -4 7 2011 -5 -5 -5 -4 -10 -2 2011 -7 -7 -7 -7 -15 -8
2012 1 1 1 7 8 23 2012 -1 -1 -1 4 2 15 2012 -3 -3 -3 -0 -4 7 2012 -5 -5 -5 -4 -10 -2 2012 -7 -7 -7 -7 -15 -8
2013 1 1 1 7 8 23 2013 -1 -1 -1 4 2 15 2013 -3 -3 -3 -0 -4 7 2013 -5 -5 -5 -4 -10 -2 2013 -7 -7 -7 -7 -15 -8
2014 1 1 1 7 8 23 2014 -1 -1 -1 4 2 15 2014 -3 -3 -3 -0 -4 6 2014 -5 -5 -5 -4 -10 -2 2014 -7 -7 -7 -7 -15 -8
2015 1 1 1 7 8 23 2015 -1 -1 -1 4 2 15 2015 -3 -3 -3 -0 -4 6 2015 -5 -5 -5 -4 -10 -2 2015 -7 -7 -7 -7 -15 -8
2020 1 1 1 7 8 23 2020 -1 -1 -1 4 2 15 2020 -3 -3 -3 -0 -5 6 2020 -5 -5 -5 -4 -10 -2 2020 -7 -7 -7 -7 -16 -9
2025 0 0 0 7 7 22 2025 -1 -1 -1 3 1 14 2025 -3 -3 -3 -1 -5 5 2025 -5 -5 -5 -4 -11 -3 2025 -7 -7 -7 -8 -17 -10
Date Cl 1 C Cl 1 B Cl 1 O Cl 2 Cl 3 Cl 4 Date Cl 1 C Cl 1 B Cl 1 O Cl 2 Cl 3 Cl 4 Date Cl 1 C Cl 1 B Cl 1 O Cl 2 Cl 3 Cl 4 Date Cl 1 C Cl 1 B Cl 1 O Cl 2 Cl 3 Cl 4 Date Cl 1 C Cl 1 B Cl 1 O Cl 2 Cl 3 Cl 4
2011 1 1 1 7 8 23 2011 -1 -1 -1 4 2 15 2011 -3 -3 -3 -0 -5 6 2011 -5 -5 -5 -4 -11 -3 2011 -7 -7 -7 -8 -17 -12
2012 1 1 1 7 8 23 2012 -1 -1 -1 4 2 15 2012 -3 -3 -3 -0 -4 7 2012 -5 -5 -5 -4 -11 -3 2012 -7 -7 -7 -8 -17 -11
2013 1 1 1 8 9 25 2013 -1 -1 -1 4 3 17 2013 -3 -3 -3 1 -3 8 2013 -5 -5 -5 -3 -10 -1 2013 -7 -7 -7 -7 -16 -10
2014 1 1 1 9 10 27 2014 -1 -1 -1 5 4 19 2014 -3 -3 -3 1 -2 10 2014 -5 -5 -5 -3 -9 1 2014 -7 -6 -7 -7 -15 -8
2015 1 1 1 10 11 29 2015 -0 -0 -0 6 5 21 2015 -2 -2 -2 2 -1 12 2015 -4 -4 -4 -2 -8 3 2015 -6 -6 -6 -6 -14 -6
2020 3 3 3 13 16 38 2020 1 1 1 10 11 32 2020 -1 -1 -1 6 5 23 2020 -3 -3 -3 2 -2 14 2020 -5 -4 -5 -2 -8 5
2025 5 6 5 21 26 57 2025 4 4 4 18 21 51 2025 2 3 2 15 16 44 2025 1 1 1 12 11 38 2025 -1 -0 -1 8 6 30
Morning Peak Hour - 30c Equiv Toll Rate Morning Peak Hour - 40c Equiv Toll Rate Morning Peak Hour - 50c Equiv Toll Rate Morning Peak Hour - 60c Equiv Toll Rate Morning Peak Hour - 70c Equiv Toll Rate
Afternoon Peak Hour - 30c Equiv Toll Rate Afternoon Peak Hour - 40c Equiv Toll Rate Afternoon Peak Hour - 50c Equiv Toll Rate Afternoon Peak Hour - 60c Equiv Toll Rate Afternoon Peak Hour - 70c Equiv Toll Rate
Midday Off Peak - 30c Equiv Toll Rate Midday Off Peak - 40c Equiv Toll Rate Midday Off Peak - 50c Equiv Toll Rate Midday Off Peak - 60c Equiv Toll Rate Midday Off Peak - 70c Equiv Toll Rate
Weekday Evening - 30c Equiv Toll Rate Weekday Evening - 40c Equiv Toll Rate Weekday Evening - 50c Equiv Toll Rate Weekday Evening - 60c Equiv Toll Rate Weekday Evening - 70c Equiv Toll Rate
Weekend - 30c Equiv Toll Rate Weekend - 40c Equiv Toll Rate Weekend - 50c Equiv Toll Rate Weekend - 60c Equiv Toll Rate Weekend - 70c Equiv Toll Rate

Economic Analysis of the Gauteng Freeway Improvement Scheme 135
N12: N1 Misgund to Old Potch Road (Eastbound)
Date Cl 1 C Cl 1 B Cl 1 O Cl 2 Cl 3 Cl 4 Date Cl 1 C Cl 1 B Cl 1 O Cl 2 Cl 3 Cl 4 Date Cl 1 C Cl 1 B Cl 1 O Cl 2 Cl 3 Cl 4 Date Cl 1 C Cl 1 B Cl 1 O Cl 2 Cl 3 Cl 4 Date Cl 1 C Cl 1 B Cl 1 O Cl 2 Cl 3 Cl 4
2011 2 2 2 7 10 18 2011 3 3 3 8 12 21 2011 3 4 3 9 12 22 2011 3 4 3 8 12 22 2011 3 4 3 9 12 23
2012 2 2 2 7 10 19 2012 3 4 3 9 12 22 2012 3 4 3 9 12 22 2012 3 4 3 9 12 22 2012 3 4 3 9 13 23
2013 3 3 3 8 11 20 2013 3 4 3 9 13 23 2013 3 4 3 9 13 23 2013 3 4 3 9 12 23 2013 4 5 4 9 13 24
2014 3 3 3 8 12 21 2014 3 4 4 9 13 24 2014 3 4 3 9 13 23 2014 3 4 3 9 13 23 2014 4 5 4 10 14 25
2015 3 4 3 9 12 22 2015 4 5 4 10 14 25 2015 3 4 3 9 13 24 2015 3 4 3 9 13 24 2015 4 5 4 10 14 25
2020 3 4 3 9 12 21 2020 3 4 3 8 11 21 2020 4 6 4 10 13 23 2020 3 4 3 9 12 22 2020 4 6 4 10 13 24
2025 3 3 3 8 11 21 2025 3 3 3 8 11 21 2025 3 3 3 8 11 21 2025 3 3 3 9 12 22 2025 4 5 4 9 12 22
Date Cl 1 C Cl 1 B Cl 1 O Cl 2 Cl 3 Cl 4 Date Cl 1 C Cl 1 B Cl 1 O Cl 2 Cl 3 Cl 4 Date Cl 1 C Cl 1 B Cl 1 O Cl 2 Cl 3 Cl 4 Date Cl 1 C Cl 1 B Cl 1 O Cl 2 Cl 3 Cl 4 Date Cl 1 C Cl 1 B Cl 1 O Cl 2 Cl 3 Cl 4
2011 2 2 2 6 8 15 2011 2 2 2 6 8 15 2011 2 2 2 6 9 16 2011 2 2 2 6 9 16 2011 2 2 2 6 9 16
2012 2 2 2 6 8 14 2012 2 2 2 6 8 15 2012 2 2 2 6 9 16 2012 2 2 2 6 9 17 2012 2 2 2 7 9 17
2013 2 2 2 6 8 14 2013 2 2 2 6 8 15 2013 2 2 2 6 9 16 2013 2 2 2 6 9 17 2013 2 2 2 7 9 17
2014 2 2 2 6 8 14 2014 2 2 2 6 8 15 2014 2 2 2 6 9 16 2014 2 2 2 6 9 17 2014 2 2 2 7 9 17
2015 2 2 2 5 8 14 2015 2 2 2 6 8 15 2015 2 2 2 6 9 16 2015 2 2 2 6 9 17 2015 2 2 2 7 9 17
2020 3 3 3 7 10 19 2020 3 3 3 8 11 20 2020 3 3 3 8 11 19 2020 3 3 3 8 11 21 2020 3 4 3 9 12 23
2025 3 3 3 8 11 21 2025 3 4 3 9 12 22 2025 3 3 3 8 11 21 2025 3 3 3 9 13 24 2025 3 4 3 9 13 23
Date Cl 1 C Cl 1 B Cl 1 O Cl 2 Cl 3 Cl 4 Date Cl 1 C Cl 1 B Cl 1 O Cl 2 Cl 3 Cl 4 Date Cl 1 C Cl 1 B Cl 1 O Cl 2 Cl 3 Cl 4 Date Cl 1 C Cl 1 B Cl 1 O Cl 2 Cl 3 Cl 4 Date Cl 1 C Cl 1 B Cl 1 O Cl 2 Cl 3 Cl 4
2011 2 2 2 6 8 15 2011 2 2 2 6 8 16 2011 2 2 2 6 8 16 2011 2 2 2 6 9 16 2011 2 2 2 6 9 16
2012 2 2 2 6 9 16 2012 2 2 2 6 9 16 2012 2 2 2 6 9 16 2012 2 2 2 6 9 17 2012 2 2 2 6 9 17
2013 2 2 2 7 9 17 2013 2 2 2 7 9 17 2013 2 2 2 7 9 17 2013 2 2 2 7 9 17 2013 2 2 2 7 10 18
2014 2 2 2 7 9 17 2014 2 3 2 7 10 18 2014 2 3 2 7 10 18 2014 2 3 2 7 10 18 2014 2 3 2 7 10 18
2015 2 2 2 7 9 17 2015 2 3 2 7 10 18 2015 3 3 3 7 10 19 2015 3 3 3 7 10 19 2015 3 3 3 8 11 19
2020 2 3 2 7 10 18 2020 3 3 3 7 10 19 2020 3 3 3 8 11 20 2020 3 3 3 8 11 21 2020 3 3 3 8 12 22
2025 4 5 4 11 15 27 2025 4 5 4 11 15 27 2025 4 5 4 11 16 29 2025 4 5 4 11 16 29 2025 4 5 4 12 16 29
Date Cl 1 C Cl 1 B Cl 1 O Cl 2 Cl 3 Cl 4 Date Cl 1 C Cl 1 B Cl 1 O Cl 2 Cl 3 Cl 4 Date Cl 1 C Cl 1 B Cl 1 O Cl 2 Cl 3 Cl 4 Date Cl 1 C Cl 1 B Cl 1 O Cl 2 Cl 3 Cl 4 Date Cl 1 C Cl 1 B Cl 1 O Cl 2 Cl 3 Cl 4
2011 2 2 2 6 8 14 2011 2 2 2 5 7 14 2011 2 2 2 5 7 14 2011 2 2 2 5 7 14 2011 2 2 2 5 8 14
2012 2 2 2 6 8 14 2012 2 2 2 5 7 14 2012 2 2 2 5 7 14 2012 2 2 2 5 7 14 2012 2 2 2 5 8 14
2013 2 2 2 6 8 14 2013 2 2 2 5 7 14 2013 2 2 2 5 7 14 2013 2 2 2 5 7 13 2013 2 2 2 5 8 14
2014 2 2 2 6 8 15 2014 2 2 2 5 7 14 2014 2 2 2 5 7 14 2014 2 2 2 5 7 13 2014 2 2 2 5 8 14
2015 2 2 2 6 8 15 2015 2 2 2 5 7 14 2015 2 2 2 5 7 14 2015 2 2 2 5 7 13 2015 2 2 2 5 8 14
2020 2 2 2 6 8 15 2020 2 2 2 5 7 14 2020 2 2 2 5 7 14 2020 2 2 2 5 7 13 2020 2 2 2 5 8 14
2025 2 2 2 6 8 15 2025 2 2 2 5 8 14 2025 2 2 2 5 7 14 2025 2 2 2 5 7 13 2025 2 2 2 5 8 14
Date Cl 1 C Cl 1 B Cl 1 O Cl 2 Cl 3 Cl 4 Date Cl 1 C Cl 1 B Cl 1 O Cl 2 Cl 3 Cl 4 Date Cl 1 C Cl 1 B Cl 1 O Cl 2 Cl 3 Cl 4 Date Cl 1 C Cl 1 B Cl 1 O Cl 2 Cl 3 Cl 4 Date Cl 1 C Cl 1 B Cl 1 O Cl 2 Cl 3 Cl 4
2011 2 2 2 5 7 13 2011 2 2 2 5 7 14 2011 2 2 2 5 7 14 2011 2 2 2 5 7 14 2011 2 2 2 5 7 14
2012 2 2 2 5 7 13 2012 2 2 2 5 7 14 2012 2 2 2 5 7 14 2012 2 2 2 5 7 14 2012 2 2 2 5 7 14
2013 2 2 2 5 7 13 2013 2 2 2 5 7 14 2013 2 2 2 5 7 14 2013 2 2 2 5 7 14 2013 2 2 2 5 7 14
2014 2 2 2 5 7 13 2014 2 2 2 5 7 14 2014 2 2 2 5 7 14 2014 2 2 2 5 7 14 2014 2 2 2 5 7 14
2015 2 2 2 5 7 13 2015 2 2 2 5 7 13 2015 2 2 2 5 7 14 2015 2 2 2 5 7 14 2015 2 2 2 5 7 14
2020 2 2 2 5 7 13 2020 2 2 2 5 7 13 2020 2 2 2 5 7 13 2020 2 2 2 5 7 14 2020 2 2 2 5 7 13
2025 2 2 2 5 7 13 2025 2 2 2 5 7 13 2025 2 2 2 5 7 13 2025 2 2 2 5 7 13 2025 2 2 2 5 7 13
Morning Peak Hour - 30c Equiv Toll Rate Morning Peak Hour - 40c Equiv Toll Rate
Midday Off Peak - 30c Equiv Toll Rate Midday Off Peak - 40c Equiv Toll Rate
Weekend - 30c Equiv Toll Rate Weekend - 40c Equiv Toll Rate
Weekday Evening - 30c Equiv Toll Rate Weekday Evening - 40c Equiv Toll Rate Weekday Evening - 50c Equiv Toll Rate Weekday Evening - 60c Equiv Toll Rate Weekday Evening - 70c Equiv Toll Rate
Morning Peak Hour - 50c Equiv Toll Rate Morning Peak Hour - 60c Equiv Toll Rate Morning Peak Hour - 70c Equiv Toll Rate
Afternoon Peak Hour - 30c Equiv Toll Rate Afternoon Peak Hour - 40c Equiv Toll Rate Afternoon Peak Hour - 50c Equiv Toll Rate Afternoon Peak Hour - 60c Equiv Toll Rate Afternoon Peak Hour - 70c Equiv Toll Rate
Weekend - 50c Equiv Toll Rate Weekend - 60c Equiv Toll Rate Weekend - 70c Equiv Toll Rate
Midday Off Peak - 50c Equiv Toll Rate Midday Off Peak - 60c Equiv Toll Rate Midday Off Peak - 70c Equiv Toll Rate

Economic Analysis of the Gauteng Freeway Improvement Scheme 136
N12: N1 Misgund to Old Potch Road (Westbound)
Date Cl 1 C Cl 1 B Cl 1 O Cl 2 Cl 3 Cl 4 Date Cl 1 C Cl 1 B Cl 1 O Cl 2 Cl 3 Cl 4 Date Cl 1 C Cl 1 B Cl 1 O Cl 2 Cl 3 Cl 4 Date Cl 1 C Cl 1 B Cl 1 O Cl 2 Cl 3 Cl 4 Date Cl 1 C Cl 1 B Cl 1 O Cl 2 Cl 3 Cl 4
2011 2 2 2 6 8 14 2011 2 2 2 6 8 15 2011 2 2 2 6 8 15 2011 2 2 2 6 8 15 2011 2 2 2 6 8 15
2012 2 2 2 6 8 14 2012 2 2 2 6 8 15 2012 2 2 2 6 8 15 2012 2 2 2 6 8 15 2012 2 2 2 6 8 15
2013 2 2 2 6 8 15 2013 2 2 2 6 8 15 2013 2 2 2 6 8 15 2013 2 2 2 6 8 15 2013 2 2 2 6 8 15
2014 2 2 2 6 8 15 2014 2 2 2 6 8 15 2014 2 2 2 6 8 15 2014 2 2 2 6 8 15 2014 2 2 2 6 8 15
2015 2 2 2 6 8 15 2015 2 2 2 6 8 15 2015 2 2 2 6 8 15 2015 2 2 2 6 8 15 2015 2 2 2 6 8 15
2020 2 2 2 6 8 15 2020 2 2 2 6 8 15 2020 2 2 2 6 8 15 2020 2 2 2 6 8 15 2020 2 2 2 6 8 15
2025 3 3 3 8 11 20 2025 3 3 3 8 11 20 2025 3 4 3 8 11 21 2025 3 4 3 8 12 21 2025 3 4 3 8 11 21
Date Cl 1 C Cl 1 B Cl 1 O Cl 2 Cl 3 Cl 4 Date Cl 1 C Cl 1 B Cl 1 O Cl 2 Cl 3 Cl 4 Date Cl 1 C Cl 1 B Cl 1 O Cl 2 Cl 3 Cl 4 Date Cl 1 C Cl 1 B Cl 1 O Cl 2 Cl 3 Cl 4 Date Cl 1 C Cl 1 B Cl 1 O Cl 2 Cl 3 Cl 4
2011 2 3 2 7 10 18 2011 3 3 3 8 11 19 2011 3 3 3 8 11 19 2011 3 3 3 8 11 20 2011 3 4 3 8 11 21
2012 3 3 3 7 10 19 2012 3 3 3 8 11 20 2012 3 3 3 8 11 20 2012 3 3 3 8 11 20 2012 3 4 3 9 12 22
2013 3 2 3 8 11 20 2013 3 3 3 8 11 21 2013 3 3 3 8 11 21 2013 3 3 3 8 11 21 2013 3 4 3 9 12 22
2014 3 2 3 8 11 21 2014 3 2 3 8 11 21 2014 3 3 3 8 11 21 2014 3 2 3 8 11 21 2014 3 4 3 9 13 23
2015 3 2 3 8 12 22 2015 3 2 3 8 12 22 2015 3 2 3 8 12 22 2015 2 2 2 8 11 21 2015 3 4 3 9 13 24
2020 4 5 4 11 15 28 2020 5 6 5 12 16 29 2020 4 5 4 11 15 28 2020 4 5 4 11 15 28 2020 5 7 5 12 16 29
2025 3 3 3 9 12 23 2025 3 3 3 9 12 23 2025 3 3 3 9 12 23 2025 3 3 3 9 12 23 2025 3 3 3 9 12 23
Date Cl 1 C Cl 1 B Cl 1 O Cl 2 Cl 3 Cl 4 Date Cl 1 C Cl 1 B Cl 1 O Cl 2 Cl 3 Cl 4 Date Cl 1 C Cl 1 B Cl 1 O Cl 2 Cl 3 Cl 4 Date Cl 1 C Cl 1 B Cl 1 O Cl 2 Cl 3 Cl 4 Date Cl 1 C Cl 1 B Cl 1 O Cl 2 Cl 3 Cl 4
2011 2 2 2 6 9 16 2011 2 2 2 6 9 17 2011 2 2 2 7 10 18 2011 2 2 2 7 10 18 2011 2 3 2 7 10 19
2012 2 2 2 6 9 16 2012 2 2 2 6 9 17 2012 2 2 2 7 9 17 2012 2 2 2 7 10 18 2012 2 3 2 7 10 19
2013 2 2 2 6 9 16 2013 2 2 2 6 9 17 2013 2 2 2 7 9 17 2013 2 2 2 7 10 18 2013 2 3 2 7 10 18
2014 2 2 2 6 9 16 2014 2 2 2 6 9 17 2014 2 2 2 7 9 17 2014 2 3 2 7 10 18 2014 2 3 2 7 10 18
2015 2 2 2 6 9 16 2015 2 2 2 6 9 16 2015 2 2 2 7 9 17 2015 2 3 2 7 9 17 2015 2 3 2 7 10 18
2020 2 2 2 6 9 16 2020 2 2 2 6 9 16 2020 2 2 2 6 9 17 2020 2 2 2 7 9 17 2020 2 3 2 7 10 18
2025 5 6 5 12 16 29 2025 5 6 5 12 16 29 2025 5 7 5 12 17 30 2025 5 7 5 12 16 30 2025 5 7 5 13 17 31
Date Cl 1 C Cl 1 B Cl 1 O Cl 2 Cl 3 Cl 4 Date Cl 1 C Cl 1 B Cl 1 O Cl 2 Cl 3 Cl 4 Date Cl 1 C Cl 1 B Cl 1 O Cl 2 Cl 3 Cl 4 Date Cl 1 C Cl 1 B Cl 1 O Cl 2 Cl 3 Cl 4 Date Cl 1 C Cl 1 B Cl 1 O Cl 2 Cl 3 Cl 4
2011 2 2 2 5 7 14 2011 2 2 2 5 8 14 2011 2 2 2 5 7 14 2011 2 2 2 5 7 14 2011 2 2 2 5 7 14
2012 2 2 2 5 7 14 2012 2 2 2 5 8 14 2012 2 2 2 5 7 14 2012 2 2 2 5 7 14 2012 2 2 2 5 7 14
2013 2 2 2 5 7 14 2013 2 2 2 5 8 14 2013 2 2 2 5 7 14 2013 2 2 2 5 7 14 2013 2 2 2 5 7 14
2014 2 2 2 5 7 14 2014 2 2 2 5 8 14 2014 2 2 2 5 7 14 2014 2 2 2 5 7 14 2014 2 2 2 5 7 14
2015 2 2 2 5 7 14 2015 2 2 2 5 8 14 2015 2 2 2 5 7 14 2015 2 2 2 5 7 14 2015 2 2 2 5 7 14
2020 2 2 2 5 7 14 2020 2 2 2 5 8 14 2020 2 2 2 5 7 14 2020 2 2 2 5 7 14 2020 2 2 2 5 7 14
2025 2 2 2 5 7 14 2025 2 2 2 5 7 14 2025 2 2 2 5 7 14 2025 2 2 2 5 7 13 2025 2 2 2 5 7 13
Date Cl 1 C Cl 1 B Cl 1 O Cl 2 Cl 3 Cl 4 Date Cl 1 C Cl 1 B Cl 1 O Cl 2 Cl 3 Cl 4 Date Cl 1 C Cl 1 B Cl 1 O Cl 2 Cl 3 Cl 4 Date Cl 1 C Cl 1 B Cl 1 O Cl 2 Cl 3 Cl 4 Date Cl 1 C Cl 1 B Cl 1 O Cl 2 Cl 3 Cl 4
2011 2 2 2 5 7 13 2011 2 2 2 5 7 13 2011 2 2 2 5 7 13 2011 2 2 2 5 7 13 2011 2 2 2 5 7 13
2012 2 2 2 5 7 13 2012 2 2 2 5 7 13 2012 2 2 2 5 7 13 2012 2 2 2 5 7 13 2012 2 2 2 5 7 13
2013 2 2 2 5 7 13 2013 2 2 2 5 7 13 2013 2 2 2 5 7 14 2013 2 2 2 5 7 13 2013 2 2 2 5 7 13
2014 2 2 2 5 7 13 2014 2 2 2 5 7 13 2014 2 2 2 5 7 14 2014 2 2 2 5 7 13 2014 2 2 2 5 7 13
2015 2 2 2 5 7 13 2015 2 2 2 5 7 13 2015 2 2 2 5 7 14 2015 2 2 2 5 7 13 2015 2 2 2 5 7 13
2020 2 2 2 5 7 13 2020 2 2 2 5 7 13 2020 2 2 2 5 7 14 2020 2 2 2 5 7 14 2020 2 2 2 5 7 13
2025 2 2 2 5 7 13 2025 2 2 2 5 7 13 2025 2 2 2 5 7 14 2025 2 2 2 5 7 14 2025 2 2 2 5 7 14
Morning Peak Hour - 30c Equiv Toll Rate Morning Peak Hour - 40c Equiv Toll Rate Morning Peak Hour - 50c Equiv Toll Rate Morning Peak Hour - 60c Equiv Toll Rate Morning Peak Hour - 70c Equiv Toll Rate
Afternoon Peak Hour - 30c Equiv Toll Rate Afternoon Peak Hour - 40c Equiv Toll Rate Afternoon Peak Hour - 50c Equiv Toll Rate Afternoon Peak Hour - 60c Equiv Toll Rate Afternoon Peak Hour - 70c Equiv Toll Rate
Midday Off Peak - 30c Equiv Toll Rate Midday Off Peak - 40c Equiv Toll Rate Midday Off Peak - 50c Equiv Toll Rate Midday Off Peak - 60c Equiv Toll Rate Midday Off Peak - 70c Equiv Toll Rate
Weekday Evening - 30c Equiv Toll Rate Weekday Evening - 40c Equiv Toll Rate Weekday Evening - 50c Equiv Toll Rate Weekday Evening - 60c Equiv Toll Rate Weekday Evening - 70c Equiv Toll Rate
Weekend - 30c Equiv Toll Rate Weekend - 40c Equiv Toll Rate Weekend - 50c Equiv Toll Rate Weekend - 60c Equiv Toll Rate Weekend - 70c Equiv Toll Rate
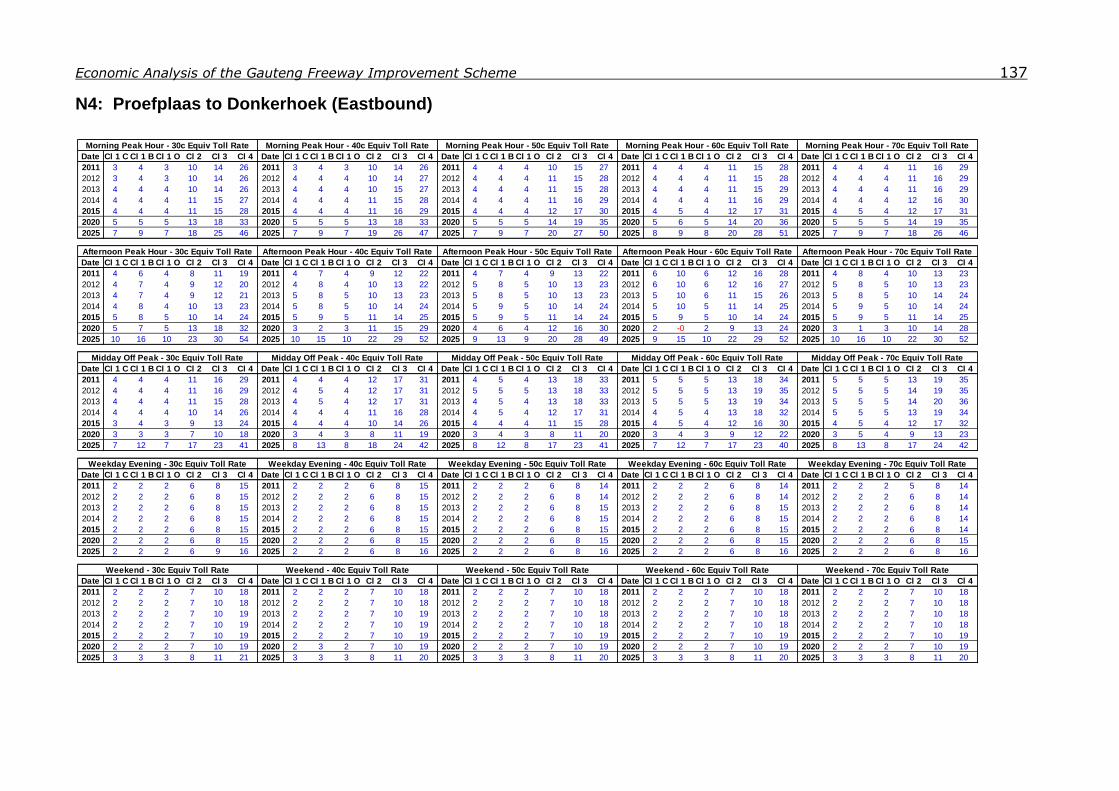
Economic Analysis of the Gauteng Freeway Improvement Scheme 137
N4: Proefplaas to Donkerhoek (Eastbound)
Date Cl 1 C Cl 1 B Cl 1 O Cl 2 Cl 3 Cl 4 Date Cl 1 C Cl 1 B Cl 1 O Cl 2 Cl 3 Cl 4 Date Cl 1 C Cl 1 B Cl 1 O Cl 2 Cl 3 Cl 4 Date Cl 1 C Cl 1 B Cl 1 O Cl 2 Cl 3 Cl 4 Date Cl 1 C Cl 1 B Cl 1 O Cl 2 Cl 3 Cl 4
2011 3 4 3 10 14 26 2011 3 4 3 10 14 26 2011 4 4 4 10 15 27 2011 4 4 4 11 15 28 2011 4 4 4 11 16 29
2012 3 4 3 10 14 26 2012 4 4 4 10 14 27 2012 4 4 4 11 15 28 2012 4 4 4 11 15 28 2012 4 4 4 11 16 29
2013 4 4 4 10 14 26 2013 4 4 4 10 15 27 2013 4 4 4 11 15 28 2013 4 4 4 11 15 29 2013 4 4 4 11 16 29
2014 4 4 4 11 15 27 2014 4 4 4 11 15 28 2014 4 4 4 11 16 29 2014 4 4 4 11 16 29 2014 4 4 4 12 16 30
2015 4 4 4 11 15 28 2015 4 4 4 11 16 29 2015 4 4 4 12 17 30 2015 4 5 4 12 17 31 2015 4 5 4 12 17 31
2020 5 5 5 13 18 33 2020 5 5 5 13 18 33 2020 5 5 5 14 19 35 2020 5 6 5 14 20 36 2020 5 5 5 14 19 35
2025 7 9 7 18 25 46 2025 7 9 7 19 26 47 2025 7 9 7 20 27 50 2025 8 9 8 20 28 51 2025 7 9 7 18 26 46
Date Cl 1 C Cl 1 B Cl 1 O Cl 2 Cl 3 Cl 4 Date Cl 1 C Cl 1 B Cl 1 O Cl 2 Cl 3 Cl 4 Date Cl 1 C Cl 1 B Cl 1 O Cl 2 Cl 3 Cl 4 Date Cl 1 C Cl 1 B Cl 1 O Cl 2 Cl 3 Cl 4 Date Cl 1 C Cl 1 B Cl 1 O Cl 2 Cl 3 Cl 4
2011 4 6 4 8 11 19 2011 4 7 4 9 12 22 2011 4 7 4 9 13 22 2011 6 10 6 12 16 28 2011 4 8 4 10 13 23
2012 4 7 4 9 12 20 2012 4 8 4 10 13 22 2012 5 8 5 10 13 23 2012 6 10 6 12 16 27 2012 5 8 5 10 13 23
2013 4 7 4 9 12 21 2013 5 8 5 10 13 23 2013 5 8 5 10 13 23 2013 5 10 6 11 15 26 2013 5 8 5 10 14 24
2014 4 8 4 10 13 23 2014 5 8 5 10 14 24 2014 5 9 5 10 14 24 2014 5 10 5 11 14 25 2014 5 9 5 10 14 24
2015 5 8 5 10 14 24 2015 5 9 5 11 14 25 2015 5 9 5 11 14 24 2015 5 9 5 10 14 24 2015 5 9 5 11 14 25
2020 5 7 5 13 18 32 2020 3 2 3 11 15 29 2020 4 6 4 12 16 30 2020 2 -0 2 9 13 24 2020 3 1 3 10 14 28
2025 10 16 10 23 30 54 2025 10 15 10 22 29 52 2025 9 13 9 20 28 49 2025 9 15 10 22 29 52 2025 10 16 10 22 30 52
Date Cl 1 C Cl 1 B Cl 1 O Cl 2 Cl 3 Cl 4 Date Cl 1 C Cl 1 B Cl 1 O Cl 2 Cl 3 Cl 4 Date Cl 1 C Cl 1 B Cl 1 O Cl 2 Cl 3 Cl 4 Date Cl 1 C Cl 1 B Cl 1 O Cl 2 Cl 3 Cl 4 Date Cl 1 C Cl 1 B Cl 1 O Cl 2 Cl 3 Cl 4
2011 4 4 4 11 16 29 2011 4 4 4 12 17 31 2011 4 5 4 13 18 33 2011 5 5 5 13 18 34 2011 5 5 5 13 19 35
2012 4 4 4 11 16 29 2012 4 5 4 12 17 31 2012 5 5 5 13 18 33 2012 5 5 5 13 19 35 2012 5 5 5 14 19 35
2013 4 4 4 11 15 28 2013 4 5 4 12 17 31 2013 4 5 4 13 18 33 2013 5 5 5 13 19 34 2013 5 5 5 14 20 36
2014 4 4 4 10 14 26 2014 4 4 4 11 16 28 2014 4 5 4 12 17 31 2014 4 5 4 13 18 32 2014 5 5 5 13 19 34
2015 3 4 3 9 13 24 2015 4 4 4 10 14 26 2015 4 4 4 11 15 28 2015 4 5 4 12 16 30 2015 4 5 4 12 17 32
2020 3 3 3 7 10 18 2020 3 4 3 8 11 19 2020 3 4 3 8 11 20 2020 3 4 3 9 12 22 2020 3 5 4 9 13 23
2025 7 12 7 17 23 41 2025 8 13 8 18 24 42 2025 8 12 8 17 23 41 2025 7 12 7 17 23 40 2025 8 13 8 17 24 42
Date Cl 1 C Cl 1 B Cl 1 O Cl 2 Cl 3 Cl 4 Date Cl 1 C Cl 1 B Cl 1 O Cl 2 Cl 3 Cl 4 Date Cl 1 C Cl 1 B Cl 1 O Cl 2 Cl 3 Cl 4 Date Cl 1 C Cl 1 B Cl 1 O Cl 2 Cl 3 Cl 4 Date Cl 1 C Cl 1 B Cl 1 O Cl 2 Cl 3 Cl 4
2011 2 2 2 6 8 15 2011 2 2 2 6 8 15 2011 2 2 2 6 8 14 2011 2 2 2 6 8 14 2011 2 2 2 5 8 14
2012 2 2 2 6 8 15 2012 2 2 2 6 8 15 2012 2 2 2 6 8 14 2012 2 2 2 6 8 14 2012 2 2 2 6 8 14
2013 2 2 2 6 8 15 2013 2 2 2 6 8 15 2013 2 2 2 6 8 15 2013 2 2 2 6 8 15 2013 2 2 2 6 8 14
2014 2 2 2 6 8 15 2014 2 2 2 6 8 15 2014 2 2 2 6 8 15 2014 2 2 2 6 8 15 2014 2 2 2 6 8 14
2015 2 2 2 6 8 15 2015 2 2 2 6 8 15 2015 2 2 2 6 8 15 2015 2 2 2 6 8 15 2015 2 2 2 6 8 14
2020 2 2 2 6 8 15 2020 2 2 2 6 8 15 2020 2 2 2 6 8 15 2020 2 2 2 6 8 15 2020 2 2 2 6 8 15
2025 2 2 2 6 9 16 2025 2 2 2 6 8 16 2025 2 2 2 6 8 16 2025 2 2 2 6 8 16 2025 2 2 2 6 8 16
Date Cl 1 C Cl 1 B Cl 1 O Cl 2 Cl 3 Cl 4 Date Cl 1 C Cl 1 B Cl 1 O Cl 2 Cl 3 Cl 4 Date Cl 1 C Cl 1 B Cl 1 O Cl 2 Cl 3 Cl 4 Date Cl 1 C Cl 1 B Cl 1 O Cl 2 Cl 3 Cl 4 Date Cl 1 C Cl 1 B Cl 1 O Cl 2 Cl 3 Cl 4
2011 2 2 2 7 10 18 2011 2 2 2 7 10 18 2011 2 2 2 7 10 18 2011 2 2 2 7 10 18 2011 2 2 2 7 10 18
2012 2 2 2 7 10 18 2012 2 2 2 7 10 18 2012 2 2 2 7 10 18 2012 2 2 2 7 10 18 2012 2 2 2 7 10 18
2013 2 2 2 7 10 19 2013 2 2 2 7 10 19 2013 2 2 2 7 10 18 2013 2 2 2 7 10 18 2013 2 2 2 7 10 18
2014 2 2 2 7 10 19 2014 2 2 2 7 10 19 2014 2 2 2 7 10 18 2014 2 2 2 7 10 18 2014 2 2 2 7 10 18
2015 2 2 2 7 10 19 2015 2 2 2 7 10 19 2015 2 2 2 7 10 19 2015 2 2 2 7 10 19 2015 2 2 2 7 10 19
2020 2 2 2 7 10 19 2020 2 3 2 7 10 19 2020 2 2 2 7 10 19 2020 2 2 2 7 10 19 2020 2 2 2 7 10 19
2025 3 3 3 8 11 21 2025 3 3 3 8 11 20 2025 3 3 3 8 11 20 2025 3 3 3 8 11 20 2025 3 3 3 8 11 20
Morning Peak Hour - 30c Equiv Toll Rate Morning Peak Hour - 40c Equiv Toll Rate Morning Peak Hour - 50c Equiv Toll Rate
Midday Off Peak - 30c Equiv Toll Rate Midday Off Peak - 40c Equiv Toll Rate Midday Off Peak - 50c Equiv Toll Rate
Weekend - 30c Equiv Toll Rate
Weekday Evening - 30c Equiv Toll Rate Weekday Evening - 40c Equiv Toll Rate Weekday Evening - 50c Equiv Toll Rate Weekday Evening - 60c Equiv Toll Rate Weekday Evening - 70c Equiv Toll Rate
Morning Peak Hour - 60c Equiv Toll Rate Morning Peak Hour - 70c Equiv Toll Rate
Afternoon Peak Hour - 30c Equiv Toll Rate Afternoon Peak Hour - 40c Equiv Toll Rate Afternoon Peak Hour - 50c Equiv Toll Rate Afternoon Peak Hour - 60c Equiv Toll Rate Afternoon Peak Hour - 70c Equiv Toll Rate
Weekend - 40c Equiv Toll Rate Weekend - 50c Equiv Toll Rate Weekend - 60c Equiv Toll Rate Weekend - 70c Equiv Toll Rate
Midday Off Peak - 60c Equiv Toll Rate Midday Off Peak - 70c Equiv Toll Rate

Economic Analysis of the Gauteng Freeway Improvement Scheme 138
N4: Proefplaas to Donkerhoek (Westbound)
Date Cl 1 C Cl 1 B Cl 1 O Cl 2 Cl 3 Cl 4 Date Cl 1 C Cl 1 B Cl 1 O Cl 2 Cl 3 Cl 4 Date Cl 1 C Cl 1 B Cl 1 O Cl 2 Cl 3 Cl 4 Date Cl 1 C Cl 1 B Cl 1 O Cl 2 Cl 3 Cl 4 Date Cl 1 C Cl 1 B Cl 1 O Cl 2 Cl 3 Cl 4
2011 1 1 1 3 5 9 2011 0 -1 0 2 3 6 2011 0 -1 0 2 3 5 2011 0 -0 0 2 3 6 2011 0 -1 0 2 3 6
2012 1 1 1 3 5 9 2012 0 -1 0 2 3 6 2012 0 -0 0 2 4 7 2012 1 -0 1 3 4 7 2012 0 -1 0 2 3 6
2013 1 1 1 4 5 9 2013 0 -1 0 2 3 6 2013 1 1 1 3 5 9 2013 1 0 1 3 4 8 2013 0 -0 0 2 4 7
2014 1 1 1 4 5 10 2014 0 -1 0 2 3 7 2014 1 2 1 4 6 11 2014 1 1 1 4 5 10 2014 1 -0 1 3 4 8
2015 1 1 1 4 5 10 2015 0 -1 0 2 4 7 2015 2 3 2 5 7 13 2015 1 2 1 4 6 11 2015 1 0 1 3 5 9
2020 3 1 3 10 14 26 2020 6 11 6 14 19 33 2020 6 10 6 13 18 32 2020 3 2 3 10 15 28 2020 6 9 6 13 18 32
2025 8 11 8 19 26 46 2025 7 11 7 19 25 46 2025 7 10 7 18 24 43 2025 7 11 7 18 25 45 2025 7 10 7 18 24 44
Date Cl 1 C Cl 1 B Cl 1 O Cl 2 Cl 3 Cl 4 Date Cl 1 C Cl 1 B Cl 1 O Cl 2 Cl 3 Cl 4 Date Cl 1 C Cl 1 B Cl 1 O Cl 2 Cl 3 Cl 4 Date Cl 1 C Cl 1 B Cl 1 O Cl 2 Cl 3 Cl 4 Date Cl 1 C Cl 1 B Cl 1 O Cl 2 Cl 3 Cl 4
2011 3 4 3 10 14 25 2011 3 4 3 10 14 25 2011 3 4 3 10 14 25 2011 3 3 3 9 13 24 2011 3 3 3 9 13 24
2012 4 4 4 10 14 26 2012 4 4 4 10 14 26 2012 4 4 4 10 14 26 2012 3 4 3 10 14 25 2012 3 4 3 10 13 25
2013 4 4 4 10 14 26 2013 4 4 4 10 14 26 2013 4 4 4 10 14 26 2013 3 4 3 10 14 25 2013 3 4 3 10 14 25
2014 4 4 4 10 14 26 2014 4 4 4 10 14 26 2014 4 4 4 10 14 26 2014 3 4 3 10 14 25 2014 3 4 3 10 14 25
2015 4 4 4 10 14 26 2015 4 4 4 10 14 26 2015 4 4 4 10 15 27 2015 4 4 4 10 14 25 2015 4 4 4 10 14 26
2020 5 7 6 15 21 38 2020 5 7 5 15 21 38 2020 5 6 5 15 20 37 2020 5 6 5 14 19 35 2020 5 6 5 14 19 35
2025 8 12 8 19 26 46 2025 8 12 8 18 25 44 2025 8 12 8 19 25 45 2025 8 13 8 19 26 47 2025 8 12 8 18 25 44
Date Cl 1 C Cl 1 B Cl 1 O Cl 2 Cl 3 Cl 4 Date Cl 1 C Cl 1 B Cl 1 O Cl 2 Cl 3 Cl 4 Date Cl 1 C Cl 1 B Cl 1 O Cl 2 Cl 3 Cl 4 Date Cl 1 C Cl 1 B Cl 1 O Cl 2 Cl 3 Cl 4 Date Cl 1 C Cl 1 B Cl 1 O Cl 2 Cl 3 Cl 4
2011 3 3 3 9 13 24 2011 3 3 3 9 13 23 2011 3 3 3 9 13 24 2011 3 3 3 9 13 23 2011 3 3 3 9 12 23
2012 3 3 3 9 12 22 2012 3 3 3 9 12 22 2012 3 3 3 9 12 22 2012 3 3 3 8 12 22 2012 3 3 3 8 12 21
2013 3 3 3 8 11 21 2013 3 3 3 8 11 21 2013 3 3 3 8 11 21 2013 3 3 3 8 11 20 2013 3 3 3 8 11 20
2014 3 3 3 8 11 20 2014 3 3 3 8 11 20 2014 3 3 3 8 11 20 2014 3 3 3 8 11 20 2014 3 3 3 7 10 19
2015 3 3 3 8 11 20 2015 3 3 3 8 11 20 2015 3 3 3 7 10 19 2015 3 3 3 7 10 19 2015 2 3 2 7 10 18
2020 2 2 2 5 8 14 2020 2 2 2 5 7 13 2020 2 2 2 5 7 13 2020 2 2 2 5 7 13 2020 2 2 2 5 6 12
2025 5 7 5 13 18 33 2025 5 7 5 13 18 33 2025 5 7 5 12 17 31 2025 5 6 5 12 16 29 2025 5 6 5 12 17 30
Date Cl 1 C Cl 1 B Cl 1 O Cl 2 Cl 3 Cl 4 Date Cl 1 C Cl 1 B Cl 1 O Cl 2 Cl 3 Cl 4 Date Cl 1 C Cl 1 B Cl 1 O Cl 2 Cl 3 Cl 4 Date Cl 1 C Cl 1 B Cl 1 O Cl 2 Cl 3 Cl 4 Date Cl 1 C Cl 1 B Cl 1 O Cl 2 Cl 3 Cl 4
2011 2 2 2 7 10 19 2011 2 2 2 7 10 19 2011 2 2 2 7 10 19 2011 2 2 2 7 10 18 2011 2 2 2 7 10 18
2012 2 2 2 7 10 19 2012 2 2 2 7 10 19 2012 2 2 2 7 10 19 2012 2 2 2 7 10 18 2012 2 2 2 7 10 18
2013 2 2 2 7 10 19 2013 2 2 2 7 10 19 2013 2 2 2 7 10 19 2013 2 2 2 7 10 18 2013 2 2 2 7 10 18
2014 2 2 2 7 10 19 2014 2 2 2 7 10 19 2014 2 2 2 7 10 19 2014 2 2 2 7 10 18 2014 2 2 2 7 10 18
2015 2 2 2 7 10 19 2015 2 2 2 7 10 19 2015 2 2 2 7 10 19 2015 2 2 2 7 10 18 2015 2 2 2 7 10 18
2020 2 2 2 7 10 19 2020 2 2 2 7 10 19 2020 2 2 2 7 10 19 2020 2 2 2 7 10 19 2020 2 2 2 7 10 19
2025 3 3 3 7 11 20 2025 2 2 2 7 10 19 2025 2 2 2 7 10 19 2025 2 2 2 7 10 19 2025 2 2 2 7 10 19
Date Cl 1 C Cl 1 B Cl 1 O Cl 2 Cl 3 Cl 4 Date Cl 1 C Cl 1 B Cl 1 O Cl 2 Cl 3 Cl 4 Date Cl 1 C Cl 1 B Cl 1 O Cl 2 Cl 3 Cl 4 Date Cl 1 C Cl 1 B Cl 1 O Cl 2 Cl 3 Cl 4 Date Cl 1 C Cl 1 B Cl 1 O Cl 2 Cl 3 Cl 4
2011 3 3 3 7 11 19 2011 3 3 3 7 11 19 2011 3 3 3 7 11 20 2011 3 3 3 7 11 20 2011 3 3 3 8 11 20
2012 3 3 3 7 11 19 2012 3 3 3 7 11 19 2012 3 3 3 7 11 20 2012 3 3 3 7 11 19 2012 3 3 3 7 11 20
2013 3 3 3 7 11 19 2013 3 3 3 7 11 19 2013 3 3 3 7 11 20 2013 3 3 3 7 11 19 2013 3 3 3 7 11 20
2014 3 3 3 7 11 19 2014 3 3 3 7 11 19 2014 3 3 3 7 11 20 2014 3 3 3 7 11 19 2014 3 3 3 7 11 19
2015 3 3 3 7 11 19 2015 3 3 3 7 11 19 2015 3 3 3 7 11 20 2015 3 3 3 7 11 19 2015 3 3 3 7 11 19
2020 3 3 3 7 11 20 2020 3 3 3 7 10 19 2020 3 3 3 7 11 19 2020 3 3 3 7 11 19 2020 3 3 3 7 10 19
2025 3 3 3 9 12 23 2025 3 3 3 9 12 23 2025 3 3 3 9 12 23 2025 3 3 3 9 12 23 2025 3 3 3 9 12 23
Morning Peak Hour - 30c Equiv Toll Rate Morning Peak Hour - 40c Equiv Toll Rate Morning Peak Hour - 50c Equiv Toll Rate Morning Peak Hour - 60c Equiv Toll Rate Morning Peak Hour - 70c Equiv Toll Rate
Afternoon Peak Hour - 30c Equiv Toll Rate Afternoon Peak Hour - 40c Equiv Toll Rate Afternoon Peak Hour - 50c Equiv Toll Rate Afternoon Peak Hour - 60c Equiv Toll Rate Afternoon Peak Hour - 70c Equiv Toll Rate
Midday Off Peak - 30c Equiv Toll Rate Midday Off Peak - 40c Equiv Toll Rate Midday Off Peak - 50c Equiv Toll Rate Midday Off Peak - 60c Equiv Toll Rate Midday Off Peak - 70c Equiv Toll Rate
Weekday Evening - 30c Equiv Toll Rate Weekday Evening - 40c Equiv Toll Rate Weekday Evening - 50c Equiv Toll Rate Weekday Evening - 60c Equiv Toll Rate Weekday Evening - 70c Equiv Toll Rate
Weekend - 30c Equiv Toll Rate Weekend - 40c Equiv Toll Rate Weekend - 50c Equiv Toll Rate Weekend - 60c Equiv Toll Rate Weekend - 70c Equiv Toll Rate
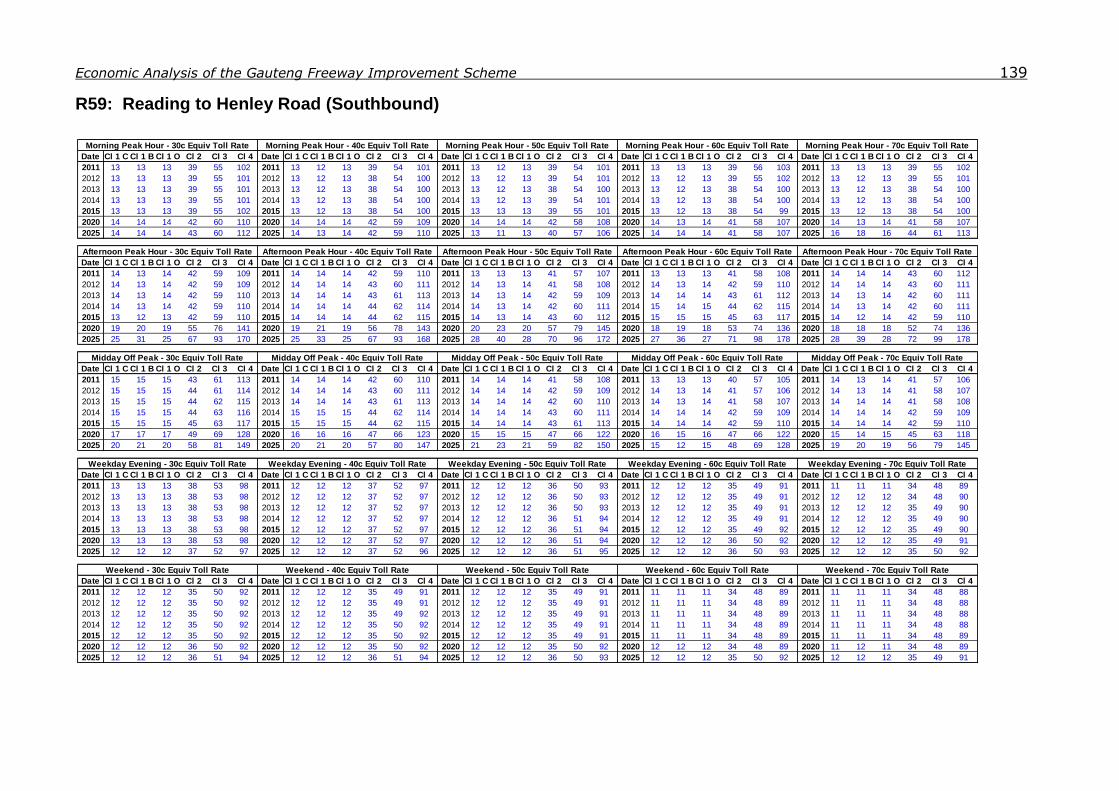
Economic Analysis of the Gauteng Freeway Improvement Scheme 139
R59: Reading to Henley Road (Southbound)
Date Cl 1 C Cl 1 B Cl 1 O Cl 2 Cl 3 Cl 4 Date Cl 1 C Cl 1 B Cl 1 O Cl 2 Cl 3 Cl 4 Date Cl 1 C Cl 1 B Cl 1 O Cl 2 Cl 3 Cl 4 Date Cl 1 C Cl 1 B Cl 1 O Cl 2 Cl 3 Cl 4 Date Cl 1 C Cl 1 B Cl 1 O Cl 2 Cl 3 Cl 4
2011 13 13 13 39 55 102 2011 13 12 13 39 54 101 2011 13 12 13 39 54 101 2011 13 13 13 39 56 103 2011 13 13 13 39 55 102
2012 13 13 13 39 55 101 2012 13 12 13 38 54 100 2012 13 12 13 39 54 101 2012 13 12 13 39 55 102 2012 13 12 13 39 55 101
2013 13 13 13 39 55 101 2013 13 12 13 38 54 100 2013 13 12 13 38 54 100 2013 13 12 13 38 54 100 2013 13 12 13 38 54 100
2014 13 13 13 39 55 101 2014 13 12 13 38 54 100 2014 13 12 13 39 54 101 2014 13 12 13 38 54 100 2014 13 12 13 38 54 100
2015 13 13 13 39 55 102 2015 13 12 13 38 54 100 2015 13 13 13 39 55 101 2015 13 12 13 38 54 99 2015 13 12 13 38 54 100
2020 14 14 14 42 60 110 2020 14 14 14 42 59 109 2020 14 14 14 42 58 108 2020 14 13 14 41 58 107 2020 14 13 14 41 58 107
2025 14 14 14 43 60 112 2025 14 13 14 42 59 110 2025 13 11 13 40 57 106 2025 14 14 14 41 58 107 2025 16 18 16 44 61 113
Date Cl 1 C Cl 1 B Cl 1 O Cl 2 Cl 3 Cl 4 Date Cl 1 C Cl 1 B Cl 1 O Cl 2 Cl 3 Cl 4 Date Cl 1 C Cl 1 B Cl 1 O Cl 2 Cl 3 Cl 4 Date Cl 1 C Cl 1 B Cl 1 O Cl 2 Cl 3 Cl 4 Date Cl 1 C Cl 1 B Cl 1 O Cl 2 Cl 3 Cl 4
2011 14 13 14 42 59 109 2011 14 14 14 42 59 110 2011 13 13 13 41 57 107 2011 13 13 13 41 58 108 2011 14 14 14 43 60 112
2012 14 13 14 42 59 109 2012 14 14 14 43 60 111 2012 14 13 14 41 58 108 2012 14 13 14 42 59 110 2012 14 14 14 43 60 111
2013 14 13 14 42 59 110 2013 14 14 14 43 61 113 2013 14 13 14 42 59 109 2013 14 14 14 43 61 112 2013 14 13 14 42 60 111
2014 14 13 14 42 59 110 2014 14 14 14 44 62 114 2014 14 13 14 42 60 111 2014 15 14 15 44 62 115 2014 14 13 14 42 60 111
2015 13 12 13 42 59 110 2015 14 14 14 44 62 115 2015 14 13 14 43 60 112 2015 15 15 15 45 63 117 2015 14 12 14 42 59 110
2020 19 20 19 55 76 141 2020 19 21 19 56 78 143 2020 20 23 20 57 79 145 2020 18 19 18 53 74 136 2020 18 18 18 52 74 136
2025 25 31 25 67 93 170 2025 25 33 25 67 93 168 2025 28 40 28 70 96 172 2025 27 36 27 71 98 178 2025 28 39 28 72 99 178
Date Cl 1 C Cl 1 B Cl 1 O Cl 2 Cl 3 Cl 4 Date Cl 1 C Cl 1 B Cl 1 O Cl 2 Cl 3 Cl 4 Date Cl 1 C Cl 1 B Cl 1 O Cl 2 Cl 3 Cl 4 Date Cl 1 C Cl 1 B Cl 1 O Cl 2 Cl 3 Cl 4 Date Cl 1 C Cl 1 B Cl 1 O Cl 2 Cl 3 Cl 4
2011 15 15 15 43 61 113 2011 14 14 14 42 60 110 2011 14 14 14 41 58 108 2011 13 13 13 40 57 105 2011 14 13 14 41 57 106
2012 15 15 15 44 61 114 2012 14 14 14 43 60 111 2012 14 14 14 42 59 109 2012 14 13 14 41 57 106 2012 14 13 14 41 58 107
2013 15 15 15 44 62 115 2013 14 14 14 43 61 113 2013 14 14 14 42 60 110 2013 14 13 14 41 58 107 2013 14 14 14 41 58 108
2014 15 15 15 44 63 116 2014 15 15 15 44 62 114 2014 14 14 14 43 60 111 2014 14 14 14 42 59 109 2014 14 14 14 42 59 109
2015 15 15 15 45 63 117 2015 15 15 15 44 62 115 2015 14 14 14 43 61 113 2015 14 14 14 42 59 110 2015 14 14 14 42 59 110
2020 17 17 17 49 69 128 2020 16 16 16 47 66 123 2020 15 15 15 47 66 122 2020 16 15 16 47 66 122 2020 15 14 15 45 63 118
2025 20 21 20 58 81 149 2025 20 21 20 57 80 147 2025 21 23 21 59 82 150 2025 15 12 15 48 69 128 2025 19 20 19 56 79 145
Date Cl 1 C Cl 1 B Cl 1 O Cl 2 Cl 3 Cl 4 Date Cl 1 C Cl 1 B Cl 1 O Cl 2 Cl 3 Cl 4 Date Cl 1 C Cl 1 B Cl 1 O Cl 2 Cl 3 Cl 4 Date Cl 1 C Cl 1 B Cl 1 O Cl 2 Cl 3 Cl 4 Date Cl 1 C Cl 1 B Cl 1 O Cl 2 Cl 3 Cl 4
2011 13 13 13 38 53 98 2011 12 12 12 37 52 97 2011 12 12 12 36 50 93 2011 12 12 12 35 49 91 2011 11 11 11 34 48 89
2012 13 13 13 38 53 98 2012 12 12 12 37 52 97 2012 12 12 12 36 50 93 2012 12 12 12 35 49 91 2012 12 12 12 34 48 90
2013 13 13 13 38 53 98 2013 12 12 12 37 52 97 2013 12 12 12 36 50 93 2013 12 12 12 35 49 91 2013 12 12 12 35 49 90
2014 13 13 13 38 53 98 2014 12 12 12 37 52 97 2014 12 12 12 36 51 94 2014 12 12 12 35 49 91 2014 12 12 12 35 49 90
2015 13 13 13 38 53 98 2015 12 12 12 37 52 97 2015 12 12 12 36 51 94 2015 12 12 12 35 49 92 2015 12 12 12 35 49 90
2020 13 13 13 38 53 98 2020 12 12 12 37 52 97 2020 12 12 12 36 51 94 2020 12 12 12 36 50 92 2020 12 12 12 35 49 91
2025 12 12 12 37 52 97 2025 12 12 12 37 52 96 2025 12 12 12 36 51 95 2025 12 12 12 36 50 93 2025 12 12 12 35 50 92
Date Cl 1 C Cl 1 B Cl 1 O Cl 2 Cl 3 Cl 4 Date Cl 1 C Cl 1 B Cl 1 O Cl 2 Cl 3 Cl 4 Date Cl 1 C Cl 1 B Cl 1 O Cl 2 Cl 3 Cl 4 Date Cl 1 C Cl 1 B Cl 1 O Cl 2 Cl 3 Cl 4 Date Cl 1 C Cl 1 B Cl 1 O Cl 2 Cl 3 Cl 4
2011 12 12 12 35 50 92 2011 12 12 12 35 49 91 2011 12 12 12 35 49 91 2011 11 11 11 34 48 89 2011 11 11 11 34 48 88
2012 12 12 12 35 50 92 2012 12 12 12 35 49 91 2012 12 12 12 35 49 91 2012 11 11 11 34 48 89 2012 11 11 11 34 48 88
2013 12 12 12 35 50 92 2013 12 12 12 35 49 92 2013 12 12 12 35 49 91 2013 11 11 11 34 48 89 2013 11 11 11 34 48 88
2014 12 12 12 35 50 92 2014 12 12 12 35 50 92 2014 12 12 12 35 49 91 2014 11 11 11 34 48 89 2014 11 11 11 34 48 88
2015 12 12 12 35 50 92 2015 12 12 12 35 50 92 2015 12 12 12 35 49 91 2015 11 11 11 34 48 89 2015 11 11 11 34 48 89
2020 12 12 12 36 50 92 2020 12 12 12 35 50 92 2020 12 12 12 35 50 92 2020 12 12 12 34 48 89 2020 11 12 11 34 48 89
2025 12 12 12 36 51 94 2025 12 12 12 36 51 94 2025 12 12 12 36 50 93 2025 12 12 12 35 50 92 2025 12 12 12 35 49 91
Morning Peak Hour - 30c Equiv Toll Rate Morning Peak Hour - 40c Equiv Toll Rate
Midday Off Peak - 30c Equiv Toll Rate Midday Off Peak - 40c Equiv Toll Rate
Weekend - 30c Equiv Toll Rate Weekend - 40c Equiv Toll Rate
Weekday Evening - 30c Equiv Toll Rate Weekday Evening - 40c Equiv Toll Rate Weekday Evening - 50c Equiv Toll Rate Weekday Evening - 60c Equiv Toll Rate Weekday Evening - 70c Equiv Toll Rate
Morning Peak Hour - 50c Equiv Toll Rate Morning Peak Hour - 60c Equiv Toll Rate Morning Peak Hour - 70c Equiv Toll Rate
Afternoon Peak Hour - 30c Equiv Toll Rate Afternoon Peak Hour - 40c Equiv Toll Rate Afternoon Peak Hour - 50c Equiv Toll Rate Afternoon Peak Hour - 60c Equiv Toll Rate Afternoon Peak Hour - 70c Equiv Toll Rate
Weekend - 50c Equiv Toll Rate Weekend - 60c Equiv Toll Rate Weekend - 70c Equiv Toll Rate
Midday Off Peak - 50c Equiv Toll Rate Midday Off Peak - 60c Equiv Toll Rate Midday Off Peak - 70c Equiv Toll Rate
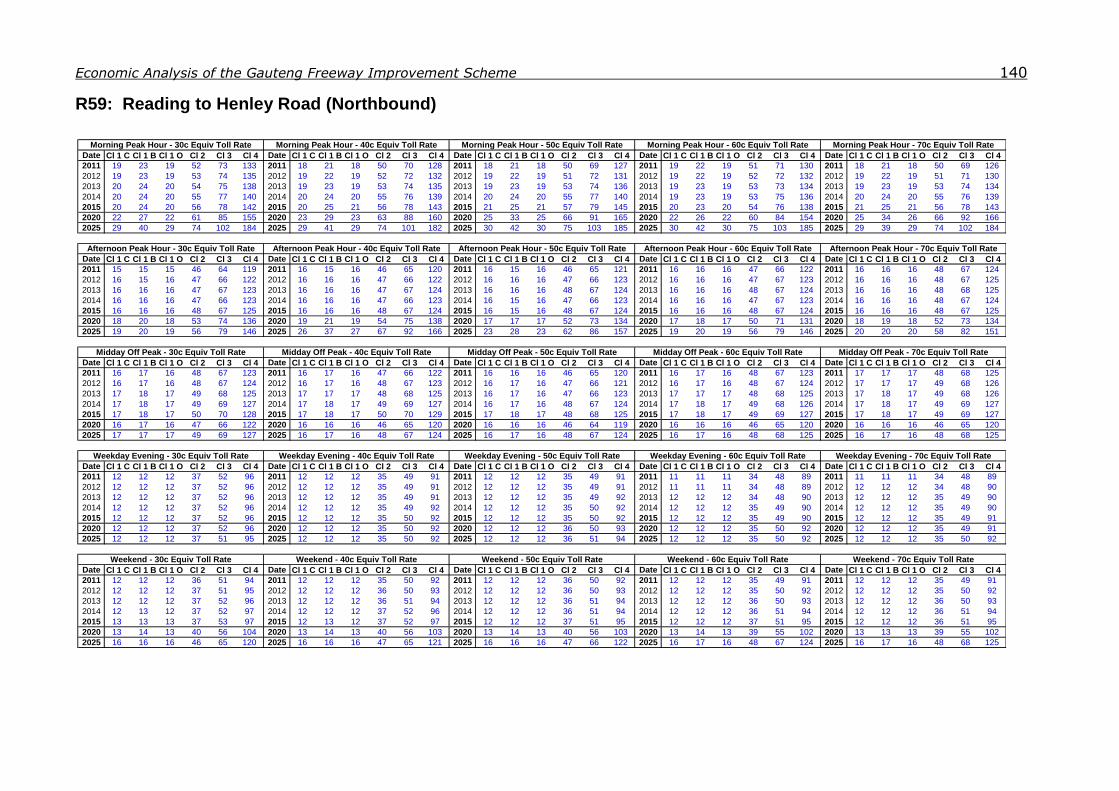
Economic Analysis of the Gauteng Freeway Improvement Scheme 140
R59: Reading to Henley Road (Northbound)
Date Cl 1 C Cl 1 B Cl 1 O Cl 2 Cl 3 Cl 4 Date Cl 1 C Cl 1 B Cl 1 O Cl 2 Cl 3 Cl 4 Date Cl 1 C Cl 1 B Cl 1 O Cl 2 Cl 3 Cl 4 Date Cl 1 C Cl 1 B Cl 1 O Cl 2 Cl 3 Cl 4 Date Cl 1 C Cl 1 B Cl 1 O Cl 2 Cl 3 Cl 4
2011 19 23 19 52 73 133 2011 18 21 18 50 70 128 2011 18 21 18 50 69 127 2011 19 22 19 51 71 130 2011 18 21 18 50 69 126
2012 19 23 19 53 74 135 2012 19 22 19 52 72 132 2012 19 22 19 51 72 131 2012 19 22 19 52 72 132 2012 19 22 19 51 71 130
2013 20 24 20 54 75 138 2013 19 23 19 53 74 135 2013 19 23 19 53 74 136 2013 19 23 19 53 73 134 2013 19 23 19 53 74 134
2014 20 24 20 55 77 140 2014 20 24 20 55 76 139 2014 20 24 20 55 77 140 2014 19 23 19 53 75 136 2014 20 24 20 55 76 139
2015 20 24 20 56 78 142 2015 20 25 21 56 78 143 2015 21 25 21 57 79 145 2015 20 23 20 54 76 138 2015 21 25 21 56 78 143
2020 22 27 22 61 85 155 2020 23 29 23 63 88 160 2020 25 33 25 66 91 165 2020 22 26 22 60 84 154 2020 25 34 26 66 92 166
2025 29 40 29 74 102 184 2025 29 41 29 74 101 182 2025 30 42 30 75 103 185 2025 30 42 30 75 103 185 2025 29 39 29 74 102 184
Date Cl 1 C Cl 1 B Cl 1 O Cl 2 Cl 3 Cl 4 Date Cl 1 C Cl 1 B Cl 1 O Cl 2 Cl 3 Cl 4 Date Cl 1 C Cl 1 B Cl 1 O Cl 2 Cl 3 Cl 4 Date Cl 1 C Cl 1 B Cl 1 O Cl 2 Cl 3 Cl 4 Date Cl 1 C Cl 1 B Cl 1 O Cl 2 Cl 3 Cl 4
2011 15 15 15 46 64 119 2011 16 15 16 46 65 120 2011 16 15 16 46 65 121 2011 16 16 16 47 66 122 2011 16 16 16 48 67 124
2012 16 15 16 47 66 122 2012 16 16 16 47 66 122 2012 16 16 16 47 66 123 2012 16 16 16 47 67 123 2012 16 16 16 48 67 125
2013 16 16 16 47 67 123 2013 16 16 16 47 67 124 2013 16 16 16 48 67 124 2013 16 16 16 48 67 124 2013 16 16 16 48 68 125
2014 16 16 16 47 66 123 2014 16 16 16 47 66 123 2014 16 15 16 47 66 123 2014 16 16 16 47 67 123 2014 16 16 16 48 67 124
2015 16 16 16 48 67 125 2015 16 16 16 48 67 124 2015 16 15 16 48 67 124 2015 16 16 16 48 67 124 2015 16 16 16 48 67 125
2020 18 20 18 53 74 136 2020 19 21 19 54 75 138 2020 17 17 17 52 73 134 2020 17 18 17 50 71 131 2020 18 19 18 52 73 134
2025 19 20 19 56 79 146 2025 26 37 27 67 92 166 2025 23 28 23 62 86 157 2025 19 20 19 56 79 146 2025 20 20 20 58 82 151
Date Cl 1 C Cl 1 B Cl 1 O Cl 2 Cl 3 Cl 4 Date Cl 1 C Cl 1 B Cl 1 O Cl 2 Cl 3 Cl 4 Date Cl 1 C Cl 1 B Cl 1 O Cl 2 Cl 3 Cl 4 Date Cl 1 C Cl 1 B Cl 1 O Cl 2 Cl 3 Cl 4 Date Cl 1 C Cl 1 B Cl 1 O Cl 2 Cl 3 Cl 4
2011 16 17 16 48 67 123 2011 16 17 16 47 66 122 2011 16 16 16 46 65 120 2011 16 17 16 48 67 123 2011 17 17 17 48 68 125
2012 16 17 16 48 67 124 2012 16 17 16 48 67 123 2012 16 17 16 47 66 121 2012 16 17 16 48 67 124 2012 17 17 17 49 68 126
2013 17 18 17 49 68 125 2013 17 17 17 48 68 125 2013 16 17 16 47 66 123 2013 17 17 17 48 68 125 2013 17 18 17 49 68 126
2014 17 18 17 49 69 127 2014 17 18 17 49 69 127 2014 16 17 16 48 67 124 2014 17 18 17 49 68 126 2014 17 18 17 49 69 127
2015 17 18 17 50 70 128 2015 17 18 17 50 70 129 2015 17 18 17 48 68 125 2015 17 18 17 49 69 127 2015 17 18 17 49 69 127
2020 16 17 16 47 66 122 2020 16 16 16 46 65 120 2020 16 16 16 46 64 119 2020 16 16 16 46 65 120 2020 16 16 16 46 65 120
2025 17 17 17 49 69 127 2025 16 17 16 48 67 124 2025 16 17 16 48 67 124 2025 16 17 16 48 68 125 2025 16 17 16 48 68 125
Date Cl 1 C Cl 1 B Cl 1 O Cl 2 Cl 3 Cl 4 Date Cl 1 C Cl 1 B Cl 1 O Cl 2 Cl 3 Cl 4 Date Cl 1 C Cl 1 B Cl 1 O Cl 2 Cl 3 Cl 4 Date Cl 1 C Cl 1 B Cl 1 O Cl 2 Cl 3 Cl 4 Date Cl 1 C Cl 1 B Cl 1 O Cl 2 Cl 3 Cl 4
2011 12 12 12 37 52 96 2011 12 12 12 35 49 91 2011 12 12 12 35 49 91 2011 11 11 11 34 48 89 2011 11 11 11 34 48 89
2012 12 12 12 37 52 96 2012 12 12 12 35 49 91 2012 12 12 12 35 49 91 2012 11 11 11 34 48 89 2012 12 12 12 34 48 90
2013 12 12 12 37 52 96 2013 12 12 12 35 49 91 2013 12 12 12 35 49 92 2013 12 12 12 34 48 90 2013 12 12 12 35 49 90
2014 12 12 12 37 52 96 2014 12 12 12 35 49 92 2014 12 12 12 35 50 92 2014 12 12 12 35 49 90 2014 12 12 12 35 49 90
2015 12 12 12 37 52 96 2015 12 12 12 35 50 92 2015 12 12 12 35 50 92 2015 12 12 12 35 49 90 2015 12 12 12 35 49 91
2020 12 12 12 37 52 96 2020 12 12 12 35 50 92 2020 12 12 12 36 50 93 2020 12 12 12 35 50 92 2020 12 12 12 35 49 91
2025 12 12 12 37 51 95 2025 12 12 12 35 50 92 2025 12 12 12 36 51 94 2025 12 12 12 35 50 92 2025 12 12 12 35 50 92
Date Cl 1 C Cl 1 B Cl 1 O Cl 2 Cl 3 Cl 4 Date Cl 1 C Cl 1 B Cl 1 O Cl 2 Cl 3 Cl 4 Date Cl 1 C Cl 1 B Cl 1 O Cl 2 Cl 3 Cl 4 Date Cl 1 C Cl 1 B Cl 1 O Cl 2 Cl 3 Cl 4 Date Cl 1 C Cl 1 B Cl 1 O Cl 2 Cl 3 Cl 4
2011 12 12 12 36 51 94 2011 12 12 12 35 50 92 2011 12 12 12 36 50 92 2011 12 12 12 35 49 91 2011 12 12 12 35 49 91
2012 12 12 12 37 51 95 2012 12 12 12 36 50 93 2012 12 12 12 36 50 93 2012 12 12 12 35 50 92 2012 12 12 12 35 50 92
2013 12 12 12 37 52 96 2013 12 12 12 36 51 94 2013 12 12 12 36 51 94 2013 12 12 12 36 50 93 2013 12 12 12 36 50 93
2014 12 13 12 37 52 97 2014 12 12 12 37 52 96 2014 12 12 12 36 51 94 2014 12 12 12 36 51 94 2014 12 12 12 36 51 94
2015 13 13 13 37 53 97 2015 12 13 12 37 52 97 2015 12 12 12 37 51 95 2015 12 12 12 37 51 95 2015 12 12 12 36 51 95
2020 13 14 13 40 56 104 2020 13 14 13 40 56 103 2020 13 14 13 40 56 103 2020 13 14 13 39 55 102 2020 13 13 13 39 55 102
2025 16 16 16 46 65 120 2025 16 16 16 47 65 121 2025 16 16 16 47 66 122 2025 16 17 16 48 67 124 2025 16 17 16 48 68 125
Morning Peak Hour - 30c Equiv Toll Rate Morning Peak Hour - 40c Equiv Toll Rate Morning Peak Hour - 50c Equiv Toll Rate Morning Peak Hour - 60c Equiv Toll Rate Morning Peak Hour - 70c Equiv Toll Rate
Afternoon Peak Hour - 30c Equiv Toll Rate Afternoon Peak Hour - 40c Equiv Toll Rate Afternoon Peak Hour - 50c Equiv Toll Rate Afternoon Peak Hour - 60c Equiv Toll Rate Afternoon Peak Hour - 70c Equiv Toll Rate
Midday Off Peak - 30c Equiv Toll Rate Midday Off Peak - 40c Equiv Toll Rate Midday Off Peak - 50c Equiv Toll Rate Midday Off Peak - 60c Equiv Toll Rate Midday Off Peak - 70c Equiv Toll Rate
Weekday Evening - 30c Equiv Toll Rate Weekday Evening - 40c Equiv Toll Rate Weekday Evening - 50c Equiv Toll Rate Weekday Evening - 60c Equiv Toll Rate Weekday Evening - 70c Equiv Toll Rate
Weekend - 30c Equiv Toll Rate Weekend - 40c Equiv Toll Rate Weekend - 50c Equiv Toll Rate Weekend - 60c Equiv Toll Rate Weekend - 70c Equiv Toll Rate

Economic Analysis of the Gauteng Freeway Improvement Scheme 141
R80 (PWV9): Soshanguve to Suiderberg (Southbound)
Date Cl 1 C Cl 1 B Cl 1 O Cl 2 Cl 3 Cl 4 Date Cl 1 C Cl 1 B Cl 1 O Cl 2 Cl 3 Cl 4 Date Cl 1 C Cl 1 B Cl 1 O Cl 2 Cl 3 Cl 4 Date Cl 1 C Cl 1 B Cl 1 O Cl 2 Cl 3 Cl 4 Date Cl 1 C Cl 1 B Cl 1 O Cl 2 Cl 3 Cl 4
2011 7 8 7 20 27 50 2011 7 9 7 20 28 51 2011 7 8 7 19 27 49 2011 7 7 7 19 27 49 2011 6 5 6 17 24 45
2012 7 8 7 20 27 50 2012 7 9 7 20 28 52 2012 7 8 7 20 28 50 2012 7 8 7 20 28 51 2012 6 6 6 18 26 47
2013 7 8 7 19 27 50 2013 8 9 8 21 29 52 2013 7 9 7 20 28 51 2013 7 9 7 20 28 52 2013 7 8 7 20 27 50
2014 7 8 7 19 27 50 2014 8 10 8 21 29 53 2014 8 9 8 21 29 53 2014 8 10 8 21 29 53 2014 8 9 8 21 29 53
2015 7 7 7 19 27 49 2015 8 10 8 21 29 54 2015 8 10 8 21 29 53 2015 8 11 8 22 30 55 2015 8 11 8 22 31 55
2020 7 8 7 19 27 49 2020 6 7 6 19 26 49 2020 7 10 7 20 28 50 2020 6 7 6 19 26 48 2020 8 10 8 20 28 51
2025 6 6 6 19 26 49 2025 7 7 7 19 27 50 2025 6 6 6 19 26 49 2025 6 6 6 19 27 49 2025 7 7 7 19 27 50
Date Cl 1 C Cl 1 B Cl 1 O Cl 2 Cl 3 Cl 4 Date Cl 1 C Cl 1 B Cl 1 O Cl 2 Cl 3 Cl 4 Date Cl 1 C Cl 1 B Cl 1 O Cl 2 Cl 3 Cl 4 Date Cl 1 C Cl 1 B Cl 1 O Cl 2 Cl 3 Cl 4 Date Cl 1 C Cl 1 B Cl 1 O Cl 2 Cl 3 Cl 4
2011 4 4 4 13 19 34 2011 4 4 4 13 19 35 2011 5 5 5 14 19 36 2011 5 5 5 14 19 36 2011 5 5 5 14 19 35
2012 5 5 5 14 19 35 2012 5 5 5 14 19 36 2012 5 5 5 14 20 36 2012 5 5 5 14 20 36 2012 5 5 5 14 19 36
2013 5 5 5 14 20 36 2013 5 5 5 14 20 36 2013 5 5 5 14 20 37 2013 5 5 5 14 20 37 2013 5 5 5 14 20 37
2014 5 5 5 14 20 37 2014 5 5 5 14 20 37 2014 5 5 5 14 20 37 2014 5 5 5 14 20 38 2014 5 5 5 14 20 37
2015 5 5 5 15 21 38 2015 5 5 5 15 21 38 2015 5 5 5 15 20 38 2015 5 5 5 15 21 38 2015 5 5 5 15 20 38
2020 5 5 5 14 19 35 2020 5 5 5 14 19 36 2020 5 5 5 14 19 35 2020 5 5 5 14 19 35 2020 5 6 5 14 19 35
2025 3 2 3 12 18 33 2025 3 0 3 12 17 33 2025 3 0 3 12 17 33 2025 3 2 3 12 18 33 2025 3 2 3 13 18 34
Date Cl 1 C Cl 1 B Cl 1 O Cl 2 Cl 3 Cl 4 Date Cl 1 C Cl 1 B Cl 1 O Cl 2 Cl 3 Cl 4 Date Cl 1 C Cl 1 B Cl 1 O Cl 2 Cl 3 Cl 4 Date Cl 1 C Cl 1 B Cl 1 O Cl 2 Cl 3 Cl 4 Date Cl 1 C Cl 1 B Cl 1 O Cl 2 Cl 3 Cl 4
2011 5 5 5 16 22 41 2011 5 5 5 16 22 41 2011 5 5 5 16 22 41 2011 5 5 5 16 22 42 2011 5 5 5 16 22 41
2012 5 5 5 16 22 41 2012 5 5 5 16 22 41 2012 5 5 5 16 22 41 2012 5 5 5 16 23 42 2012 5 5 5 16 22 41
2013 5 5 5 16 22 41 2013 5 5 5 16 22 41 2013 5 5 5 16 22 41 2013 5 5 5 16 23 42 2013 5 5 5 16 23 42
2014 5 5 5 16 23 42 2014 5 5 5 16 22 41 2014 5 5 5 16 22 42 2014 5 6 5 16 23 42 2014 5 6 5 16 23 42
2015 5 5 5 16 23 42 2015 5 5 5 16 22 41 2015 5 5 5 16 22 42 2015 6 6 6 16 23 42 2015 6 6 6 16 23 42
2020 5 6 5 16 23 42 2020 5 5 5 16 22 41 2020 5 5 5 16 23 42 2020 5 6 5 16 23 42 2020 5 5 5 16 23 42
2025 4 4 4 14 20 38 2025 4 2 4 14 20 37 2025 5 4 5 15 21 38 2025 2 -3 2 11 16 32 2025 3 -1 3 13 18 35
Date Cl 1 C Cl 1 B Cl 1 O Cl 2 Cl 3 Cl 4 Date Cl 1 C Cl 1 B Cl 1 O Cl 2 Cl 3 Cl 4 Date Cl 1 C Cl 1 B Cl 1 O Cl 2 Cl 3 Cl 4 Date Cl 1 C Cl 1 B Cl 1 O Cl 2 Cl 3 Cl 4 Date Cl 1 C Cl 1 B Cl 1 O Cl 2 Cl 3 Cl 4
2011 4 4 4 12 16 30 2011 4 4 4 12 16 30 2011 4 4 4 12 16 30 2011 4 4 4 12 16 30 2011 4 4 4 12 16 30
2012 4 4 4 12 16 30 2012 4 4 4 12 16 30 2012 4 4 4 12 16 30 2012 4 4 4 12 16 30 2012 4 4 4 12 16 30
2013 4 4 4 12 16 30 2013 4 4 4 12 16 30 2013 4 4 4 12 16 30 2013 4 4 4 12 16 30 2013 4 4 4 12 16 30
2014 4 4 4 12 16 30 2014 4 4 4 12 16 30 2014 4 4 4 12 16 30 2014 4 4 4 12 16 30 2014 4 4 4 12 16 30
2015 4 4 4 12 16 30 2015 4 4 4 12 16 30 2015 4 4 4 12 16 30 2015 4 4 4 12 16 30 2015 4 4 4 12 16 30
2020 4 4 4 12 16 30 2020 4 4 4 12 16 30 2020 4 4 4 12 16 30 2020 4 4 4 12 16 30 2020 4 4 4 12 16 30
2025 4 4 4 12 16 30 2025 4 4 4 12 16 30 2025 4 4 4 12 16 30 2025 4 4 4 12 16 30 2025 4 4 4 12 16 30
Date Cl 1 C Cl 1 B Cl 1 O Cl 2 Cl 3 Cl 4 Date Cl 1 C Cl 1 B Cl 1 O Cl 2 Cl 3 Cl 4 Date Cl 1 C Cl 1 B Cl 1 O Cl 2 Cl 3 Cl 4 Date Cl 1 C Cl 1 B Cl 1 O Cl 2 Cl 3 Cl 4 Date Cl 1 C Cl 1 B Cl 1 O Cl 2 Cl 3 Cl 4
2011 4 4 4 12 16 30 2011 4 4 4 12 16 30 2011 4 4 4 12 16 30 2011 4 4 4 12 16 30 2011 4 4 4 12 16 30
2012 4 4 4 12 16 30 2012 4 4 4 12 16 30 2012 4 4 4 12 16 30 2012 4 4 4 12 16 30 2012 4 4 4 12 16 30
2013 4 4 4 12 16 30 2013 4 4 4 12 16 30 2013 4 4 4 12 16 30 2013 4 4 4 12 16 30 2013 4 4 4 12 16 30
2014 4 4 4 12 16 30 2014 4 4 4 12 16 30 2014 4 4 4 12 16 30 2014 4 4 4 12 16 30 2014 4 4 4 12 16 30
2015 4 4 4 12 16 30 2015 4 4 4 12 16 30 2015 4 4 4 12 16 30 2015 4 4 4 12 16 30 2015 4 4 4 12 16 30
2020 4 4 4 12 17 31 2020 4 4 4 12 17 31 2020 4 4 4 12 17 31 2020 4 4 4 12 17 32 2020 4 4 4 12 17 32
2025 4 4 4 13 18 33 2025 4 4 4 13 18 34 2025 4 4 4 13 18 33 2025 4 4 4 13 18 34 2025 4 4 4 13 18 34
Morning Peak Hour - 30c Equiv Toll Rate Morning Peak Hour - 40c Equiv Toll Rate Morning Peak Hour - 50c Equiv Toll Rate
Midday Off Peak - 30c Equiv Toll Rate Midday Off Peak - 40c Equiv Toll Rate Midday Off Peak - 50c Equiv Toll Rate
Weekend - 30c Equiv Toll Rate
Weekday Evening - 30c Equiv Toll Rate Weekday Evening - 40c Equiv Toll Rate Weekday Evening - 50c Equiv Toll Rate Weekday Evening - 60c Equiv Toll Rate Weekday Evening - 70c Equiv Toll Rate
Morning Peak Hour - 60c Equiv Toll Rate Morning Peak Hour - 70c Equiv Toll Rate
Afternoon Peak Hour - 30c Equiv Toll Rate Afternoon Peak Hour - 40c Equiv Toll Rate Afternoon Peak Hour - 50c Equiv Toll Rate Afternoon Peak Hour - 60c Equiv Toll Rate Afternoon Peak Hour - 70c Equiv Toll Rate
Weekend - 40c Equiv Toll Rate Weekend - 50c Equiv Toll Rate Weekend - 60c Equiv Toll Rate Weekend - 70c Equiv Toll Rate
Midday Off Peak - 60c Equiv Toll Rate Midday Off Peak - 70c Equiv Toll Rate

Economic Analysis of the Gauteng Freeway Improvement Scheme 142
R80 (PWV9): Soshanguve to Suiderberg (Northbound)
Date Cl 1 C Cl 1 B Cl 1 O Cl 2 Cl 3 Cl 4 Date Cl 1 C Cl 1 B Cl 1 O Cl 2 Cl 3 Cl 4 Date Cl 1 C Cl 1 B Cl 1 O Cl 2 Cl 3 Cl 4 Date Cl 1 C Cl 1 B Cl 1 O Cl 2 Cl 3 Cl 4 Date Cl 1 C Cl 1 B Cl 1 O Cl 2 Cl 3 Cl 4
2011 4 4 4 13 18 34 2011 4 4 4 13 18 34 2011 4 4 4 13 18 34 2011 4 4 4 13 18 34 2011 4 4 4 13 19 35
2012 4 4 4 13 19 35 2012 4 4 4 13 19 34 2012 4 4 4 13 19 34 2012 4 4 4 13 19 35 2012 4 4 4 13 19 35
2013 4 4 4 13 19 35 2013 4 4 4 13 19 35 2013 4 4 4 13 19 35 2013 4 4 4 14 19 35 2013 5 4 5 14 19 36
2014 5 4 5 14 19 36 2014 4 4 4 14 19 35 2014 4 4 4 14 19 35 2014 5 5 5 14 19 36 2014 5 5 5 14 19 36
2015 5 4 5 14 19 36 2015 4 4 4 14 19 36 2015 5 4 5 14 19 36 2015 5 5 5 14 20 37 2015 5 5 5 14 20 36
2020 5 5 5 13 19 35 2020 4 4 4 13 18 34 2020 5 5 5 13 19 35 2020 4 5 4 13 19 35 2020 5 5 5 13 19 35
2025 4 3 4 12 18 33 2025 4 4 4 13 18 34 2025 4 4 4 13 18 34 2025 4 3 4 13 18 34 2025 4 3 4 13 18 34
Date Cl 1 C Cl 1 B Cl 1 O Cl 2 Cl 3 Cl 4 Date Cl 1 C Cl 1 B Cl 1 O Cl 2 Cl 3 Cl 4 Date Cl 1 C Cl 1 B Cl 1 O Cl 2 Cl 3 Cl 4 Date Cl 1 C Cl 1 B Cl 1 O Cl 2 Cl 3 Cl 4 Date Cl 1 C Cl 1 B Cl 1 O Cl 2 Cl 3 Cl 4
2011 7 7 7 19 27 50 2011 7 9 7 20 28 52 2011 7 9 7 20 28 52 2011 6 6 6 18 25 47 2011 7 8 7 20 28 51
2012 6 6 6 19 26 48 2012 7 8 7 20 28 51 2012 7 7 7 19 27 50 2012 6 6 6 18 25 47 2012 7 8 7 20 28 51
2013 6 6 6 18 26 47 2013 7 8 7 20 27 50 2013 6 6 6 18 25 47 2013 6 6 6 18 25 47 2013 7 8 7 20 28 51
2014 6 5 6 18 25 46 2014 7 7 7 19 27 50 2014 5 4 5 17 24 44 2014 6 5 6 18 25 47 2014 7 7 7 19 27 50
2015 5 4 5 17 25 46 2015 6 6 6 19 27 49 2015 4 1 4 16 23 44 2015 6 5 6 18 25 47 2015 6 6 6 19 27 50
2020 6 7 6 19 27 49 2020 5 4 5 18 25 47 2020 7 7 7 19 26 49 2020 6 5 6 18 25 47 2020 8 11 8 20 28 51
2025 6 6 6 19 27 49 2025 6 5 6 18 26 48 2025 6 5 6 18 26 48 2025 7 8 7 20 28 52 2025 6 6 6 19 27 50
Date Cl 1 C Cl 1 B Cl 1 O Cl 2 Cl 3 Cl 4 Date Cl 1 C Cl 1 B Cl 1 O Cl 2 Cl 3 Cl 4 Date Cl 1 C Cl 1 B Cl 1 O Cl 2 Cl 3 Cl 4 Date Cl 1 C Cl 1 B Cl 1 O Cl 2 Cl 3 Cl 4 Date Cl 1 C Cl 1 B Cl 1 O Cl 2 Cl 3 Cl 4
2011 5 5 5 16 22 41 2011 5 5 5 15 22 40 2011 5 5 5 15 22 40 2011 5 5 5 16 22 41 2011 5 5 5 15 22 41
2012 5 5 5 16 22 41 2012 5 5 5 15 22 40 2012 5 5 5 15 22 40 2012 5 5 5 16 22 41 2012 5 5 5 16 22 41
2013 5 5 5 16 22 41 2013 5 5 5 15 22 40 2013 5 5 5 15 22 40 2013 5 5 5 16 22 41 2013 5 5 5 16 22 41
2014 5 5 5 16 22 41 2014 5 5 5 15 21 40 2014 5 5 5 15 22 40 2014 5 5 5 15 22 40 2014 5 5 5 16 22 41
2015 5 5 5 16 22 41 2015 5 5 5 15 21 40 2015 5 5 5 15 22 40 2015 5 5 5 15 22 40 2015 5 5 5 16 22 41
2020 6 7 6 17 24 45 2020 6 7 6 17 24 45 2020 6 6 6 17 24 44 2020 6 6 6 16 23 43 2020 5 5 5 16 23 43
2025 7 10 7 19 26 47 2025 5 3 5 16 22 42 2025 6 6 6 17 24 44 2025 3 -1 3 13 20 38 2025 4 2 4 16 23 43
Date Cl 1 C Cl 1 B Cl 1 O Cl 2 Cl 3 Cl 4 Date Cl 1 C Cl 1 B Cl 1 O Cl 2 Cl 3 Cl 4 Date Cl 1 C Cl 1 B Cl 1 O Cl 2 Cl 3 Cl 4 Date Cl 1 C Cl 1 B Cl 1 O Cl 2 Cl 3 Cl 4 Date Cl 1 C Cl 1 B Cl 1 O Cl 2 Cl 3 Cl 4
2011 4 4 4 12 16 30 2011 4 4 4 12 16 30 2011 4 4 4 12 16 30 2011 4 4 4 12 16 30 2011 4 4 4 12 16 30
2012 4 4 4 12 16 30 2012 4 4 4 12 16 30 2012 4 4 4 12 16 30 2012 4 4 4 12 16 30 2012 4 4 4 12 16 30
2013 4 4 4 12 16 30 2013 4 4 4 12 16 30 2013 4 4 4 12 16 30 2013 4 4 4 12 16 30 2013 4 4 4 12 16 30
2014 4 4 4 12 16 30 2014 4 4 4 12 16 30 2014 4 4 4 12 16 30 2014 4 4 4 12 16 30 2014 4 4 4 12 16 30
2015 4 4 4 12 16 30 2015 4 4 4 12 16 30 2015 4 4 4 12 16 30 2015 4 4 4 12 16 30 2015 4 4 4 12 16 30
2020 4 4 4 12 16 30 2020 4 4 4 12 16 30 2020 4 4 4 12 16 30 2020 4 4 4 12 16 30 2020 4 4 4 12 16 30
2025 4 4 4 12 16 30 2025 4 4 4 12 16 30 2025 4 4 4 12 16 30 2025 4 4 4 12 16 30 2025 4 4 4 12 16 30
Date Cl 1 C Cl 1 B Cl 1 O Cl 2 Cl 3 Cl 4 Date Cl 1 C Cl 1 B Cl 1 O Cl 2 Cl 3 Cl 4 Date Cl 1 C Cl 1 B Cl 1 O Cl 2 Cl 3 Cl 4 Date Cl 1 C Cl 1 B Cl 1 O Cl 2 Cl 3 Cl 4 Date Cl 1 C Cl 1 B Cl 1 O Cl 2 Cl 3 Cl 4
2011 4 4 4 12 16 30 2011 4 4 4 12 16 30 2011 4 4 4 11 16 30 2011 4 4 4 11 16 30 2011 4 4 4 11 16 30
2012 4 4 4 12 16 30 2012 4 4 4 12 16 30 2012 4 4 4 12 16 30 2012 4 4 4 12 16 30 2012 4 4 4 11 16 30
2013 4 4 4 12 16 30 2013 4 4 4 12 16 30 2013 4 4 4 12 16 30 2013 4 4 4 12 16 30 2013 4 4 4 12 16 30
2014 4 4 4 12 16 30 2014 4 4 4 12 16 30 2014 4 4 4 12 16 30 2014 4 4 4 12 16 30 2014 4 4 4 12 16 30
2015 4 4 4 12 16 30 2015 4 4 4 12 16 30 2015 4 4 4 12 16 30 2015 4 4 4 12 16 30 2015 4 4 4 12 16 30
2020 4 4 4 12 17 31 2020 4 4 4 12 17 31 2020 4 4 4 12 16 30 2020 4 4 4 12 16 30 2020 4 4 4 12 16 30
2025 4 4 4 12 17 32 2025 4 4 4 12 17 31 2025 4 4 4 12 17 31 2025 4 4 4 12 17 31 2025 4 4 4 12 17 31
Morning Peak Hour - 30c Equiv Toll Rate Morning Peak Hour - 40c Equiv Toll Rate Morning Peak Hour - 50c Equiv Toll Rate Morning Peak Hour - 60c Equiv Toll Rate Morning Peak Hour - 70c Equiv Toll Rate
Afternoon Peak Hour - 30c Equiv Toll Rate Afternoon Peak Hour - 40c Equiv Toll Rate Afternoon Peak Hour - 50c Equiv Toll Rate Afternoon Peak Hour - 60c Equiv Toll Rate Afternoon Peak Hour - 70c Equiv Toll Rate
Midday Off Peak - 30c Equiv Toll Rate Midday Off Peak - 40c Equiv Toll Rate Midday Off Peak - 50c Equiv Toll Rate Midday Off Peak - 60c Equiv Toll Rate Midday Off Peak - 70c Equiv Toll Rate
Weekday Evening - 30c Equiv Toll Rate Weekday Evening - 40c Equiv Toll Rate Weekday Evening - 50c Equiv Toll Rate Weekday Evening - 60c Equiv Toll Rate Weekday Evening - 70c Equiv Toll Rate
Weekend - 30c Equiv Toll Rate Weekend - 40c Equiv Toll Rate Weekend - 50c Equiv Toll Rate Weekend - 60c Equiv Toll Rate Weekend - 70c Equiv Toll Rate

Economic Analysis of the Gauteng Freeway Improvement Scheme 143
R80: Suiderberg to D.F. Malan (Eastbound)
Date Cl 1 C Cl 1 B Cl 1 O Cl 2 Cl 3 Cl 4 Date Cl 1 C Cl 1 B Cl 1 O Cl 2 Cl 3 Cl 4 Date Cl 1 C Cl 1 B Cl 1 O Cl 2 Cl 3 Cl 4 Date Cl 1 C Cl 1 B Cl 1 O Cl 2 Cl 3 Cl 4 Date Cl 1 C Cl 1 B Cl 1 O Cl 2 Cl 3 Cl 4
2011 2 2 2 6 8 14 2011 2 2 2 6 8 15 2011 2 2 2 6 8 14 2011 2 2 2 5 7 14 2011 2 2 2 4 6 12
2012 2 2 2 5 8 14 2012 2 3 2 6 9 16 2012 2 2 2 6 8 15 2012 2 3 2 6 9 16 2012 2 2 2 5 7 12
2013 2 2 2 5 7 13 2013 2 3 2 6 9 16 2013 2 3 2 6 8 15 2013 3 3 3 7 10 17 2013 2 2 2 5 7 13
2014 2 2 2 5 7 13 2014 2 3 2 6 9 16 2014 2 3 2 6 8 15 2014 3 4 3 8 11 19 2014 2 2 2 6 8 14
2015 2 2 2 5 7 13 2015 2 3 2 6 9 16 2015 2 3 2 6 9 16 2015 3 4 3 8 12 21 2015 2 3 2 6 8 15
2020 2 3 2 5 8 14 2020 2 2 2 5 7 13 2020 2 3 2 6 9 15 2020 3 3 3 7 9 17 2020 2 2 2 5 7 12
2025 2 2 2 5 7 12 2025 1 1 1 4 6 11 2025 1 1 1 4 5 10 2025 2 3 2 6 8 14 2025 2 3 2 5 7 13
Date Cl 1 C Cl 1 B Cl 1 O Cl 2 Cl 3 Cl 4 Date Cl 1 C Cl 1 B Cl 1 O Cl 2 Cl 3 Cl 4 Date Cl 1 C Cl 1 B Cl 1 O Cl 2 Cl 3 Cl 4 Date Cl 1 C Cl 1 B Cl 1 O Cl 2 Cl 3 Cl 4 Date Cl 1 C Cl 1 B Cl 1 O Cl 2 Cl 3 Cl 4
2011 1 1 1 3 5 9 2011 1 1 1 4 5 10 2011 1 1 1 4 5 9 2011 1 1 1 4 6 11 2011 1 1 1 3 5 8
2012 1 1 1 4 5 9 2012 1 1 1 4 6 10 2012 1 1 1 4 5 10 2012 1 2 1 4 6 11 2012 1 1 1 4 5 9
2013 1 1 1 4 5 10 2013 1 1 1 4 6 11 2013 1 1 1 4 6 11 2013 2 2 2 4 6 11 2013 1 1 1 4 6 10
2014 1 1 1 4 6 10 2014 2 2 2 4 6 11 2014 2 2 2 4 6 11 2014 2 2 2 4 6 12 2014 2 2 2 4 6 11
2015 1 2 1 4 6 11 2015 2 2 2 5 6 12 2015 2 2 2 5 7 12 2015 2 2 2 5 6 12 2015 2 2 2 5 7 12
2020 2 2 2 5 7 12 2020 2 2 2 4 6 11 2020 2 2 2 4 6 11 2020 2 2 2 5 7 12 2020 1 1 1 3 5 9
2025 1 1 1 3 4 8 2025 1 0 1 2 3 6 2025 1 1 1 4 5 9 2025 1 1 1 4 5 9 2025 1 1 1 3 4 8
Date Cl 1 C Cl 1 B Cl 1 O Cl 2 Cl 3 Cl 4 Date Cl 1 C Cl 1 B Cl 1 O Cl 2 Cl 3 Cl 4 Date Cl 1 C Cl 1 B Cl 1 O Cl 2 Cl 3 Cl 4 Date Cl 1 C Cl 1 B Cl 1 O Cl 2 Cl 3 Cl 4 Date Cl 1 C Cl 1 B Cl 1 O Cl 2 Cl 3 Cl 4
2011 1 1 1 3 5 9 2011 1 1 1 3 5 9 2011 1 1 1 3 5 9 2011 1 1 1 3 5 9 2011 1 1 1 3 5 9
2012 1 1 1 3 5 9 2012 1 1 1 3 5 9 2012 1 1 1 3 5 9 2012 1 1 1 3 5 9 2012 1 1 1 3 5 9
2013 1 1 1 3 5 9 2013 1 1 1 3 5 8 2013 1 1 1 3 5 9 2013 1 1 1 3 5 9 2013 1 1 1 3 5 9
2014 1 1 1 3 5 9 2014 1 1 1 3 4 8 2014 1 1 1 3 5 9 2014 1 1 1 3 5 9 2014 1 1 1 3 5 9
2015 1 1 1 3 5 8 2015 1 1 1 3 4 8 2015 1 1 1 3 5 8 2015 1 1 1 3 5 8 2015 1 1 1 3 5 9
2020 1 1 1 3 5 9 2020 1 1 1 3 5 9 2020 1 1 1 3 5 9 2020 1 1 1 3 5 9 2020 1 1 1 3 5 9
2025 2 2 2 5 7 12 2025 2 2 2 5 7 12 2025 1 2 1 4 6 11 2025 2 2 2 4 6 11 2025 1 1 1 4 6 11
Date Cl 1 C Cl 1 B Cl 1 O Cl 2 Cl 3 Cl 4 Date Cl 1 C Cl 1 B Cl 1 O Cl 2 Cl 3 Cl 4 Date Cl 1 C Cl 1 B Cl 1 O Cl 2 Cl 3 Cl 4 Date Cl 1 C Cl 1 B Cl 1 O Cl 2 Cl 3 Cl 4 Date Cl 1 C Cl 1 B Cl 1 O Cl 2 Cl 3 Cl 4
2011 1 1 1 3 4 7 2011 1 1 1 3 4 7 2011 1 1 1 3 4 7 2011 1 1 1 3 4 7 2011 1 1 1 3 4 7
2012 1 1 1 3 4 7 2012 1 1 1 3 4 7 2012 1 1 1 3 4 7 2012 1 1 1 3 4 7 2012 1 1 1 3 4 7
2013 1 1 1 3 4 7 2013 1 1 1 3 4 7 2013 1 1 1 3 4 7 2013 1 1 1 3 4 7 2013 1 1 1 3 4 7
2014 1 1 1 3 4 7 2014 1 1 1 3 4 7 2014 1 1 1 3 4 7 2014 1 1 1 3 4 7 2014 1 1 1 3 4 7
2015 1 1 1 3 4 7 2015 1 1 1 3 4 7 2015 1 1 1 3 4 7 2015 1 1 1 3 4 7 2015 1 1 1 3 4 7
2020 1 1 1 3 4 7 2020 1 1 1 3 4 7 2020 1 1 1 3 4 7 2020 1 1 1 3 4 7 2020 1 1 1 3 4 7
2025 1 1 1 3 4 7 2025 1 1 1 3 4 7 2025 1 1 1 3 4 7 2025 1 1 1 3 4 7 2025 1 1 1 3 4 7
Date Cl 1 C Cl 1 B Cl 1 O Cl 2 Cl 3 Cl 4 Date Cl 1 C Cl 1 B Cl 1 O Cl 2 Cl 3 Cl 4 Date Cl 1 C Cl 1 B Cl 1 O Cl 2 Cl 3 Cl 4 Date Cl 1 C Cl 1 B Cl 1 O Cl 2 Cl 3 Cl 4 Date Cl 1 C Cl 1 B Cl 1 O Cl 2 Cl 3 Cl 4
2011 1 1 1 3 4 7 2011 1 1 1 3 4 7 2011 1 1 1 3 4 7 2011 1 1 1 3 4 7 2011 1 1 1 3 4 7
2012 1 1 1 3 4 7 2012 1 1 1 3 4 7 2012 1 1 1 3 4 7 2012 1 1 1 3 4 7 2012 1 1 1 3 4 7
2013 1 1 1 3 4 7 2013 1 1 1 3 4 7 2013 1 1 1 3 4 7 2013 1 1 1 3 4 7 2013 1 1 1 3 4 7
2014 1 1 1 3 4 7 2014 1 1 1 3 4 7 2014 1 1 1 3 4 7 2014 1 1 1 3 4 7 2014 1 1 1 3 4 7
2015 1 1 1 3 4 7 2015 1 1 1 3 4 7 2015 1 1 1 3 4 7 2015 1 1 1 3 4 7 2015 1 1 1 3 4 7
2020 1 1 1 3 4 7 2020 1 1 1 3 4 8 2020 1 1 1 3 4 8 2020 1 1 1 3 4 8 2020 1 1 1 3 4 8
2025 1 1 1 3 5 9 2025 1 1 1 3 5 9 2025 1 1 1 3 5 9 2025 1 1 1 4 5 9 2025 1 1 1 4 5 9
Morning Peak Hour - 50c Equiv Toll Rate Morning Peak Hour - 60c Equiv Toll Rate Morning Peak Hour - 70c Equiv Toll Rate
Afternoon Peak Hour - 30c Equiv Toll Rate Afternoon Peak Hour - 40c Equiv Toll Rate Afternoon Peak Hour - 50c Equiv Toll Rate Afternoon Peak Hour - 60c Equiv Toll Rate Afternoon Peak Hour - 70c Equiv Toll Rate
Morning Peak Hour - 30c Equiv Toll Rate Morning Peak Hour - 40c Equiv Toll Rate
Midday Off Peak - 30c Equiv Toll Rate Midday Off Peak - 40c Equiv Toll Rate
Weekend - 30c Equiv Toll Rate Weekend - 40c Equiv Toll Rate Weekend - 50c Equiv Toll Rate Weekend - 60c Equiv Toll Rate Weekend - 70c Equiv Toll Rate
Midday Off Peak - 50c Equiv Toll Rate Midday Off Peak - 60c Equiv Toll Rate Midday Off Peak - 70c Equiv Toll Rate
Weekday Evening - 30c Equiv Toll Rate Weekday Evening - 40c Equiv Toll Rate Weekday Evening - 50c Equiv Toll Rate Weekday Evening - 60c Equiv Toll Rate Weekday Evening - 70c Equiv Toll Rate

Economic Analysis of the Gauteng Freeway Improvement Scheme 144
R80: Suiderberg to D.F. Malan (Westbound)
Date Cl 1 C Cl 1 B Cl 1 O Cl 2 Cl 3 Cl 4 Date Cl 1 C Cl 1 B Cl 1 O Cl 2 Cl 3 Cl 4 Date Cl 1 C Cl 1 B Cl 1 O Cl 2 Cl 3 Cl 4 Date Cl 1 C Cl 1 B Cl 1 O Cl 2 Cl 3 Cl 4 Date Cl 1 C Cl 1 B Cl 1 O Cl 2 Cl 3 Cl 4
2011 1 1 1 4 6 11 2011 1 1 1 4 6 11 2011 2 2 2 5 6 12 2011 1 1 1 4 6 11 2011 2 2 2 5 6 12
2012 1 1 1 4 6 11 2012 1 1 1 4 6 11 2012 2 2 2 4 6 12 2012 2 2 2 5 6 12 2012 1 1 1 4 6 11
2013 1 1 1 4 6 11 2013 1 1 1 4 6 11 2013 1 2 1 4 6 11 2013 2 2 2 5 7 13 2013 1 1 1 4 6 11
2014 1 1 1 4 6 11 2014 1 1 1 4 6 11 2014 1 1 1 4 6 11 2014 2 2 2 5 7 14 2014 1 1 1 4 6 10
2015 1 1 1 4 6 11 2015 1 1 1 4 6 11 2015 1 1 1 4 6 11 2015 2 2 2 6 8 14 2015 1 1 1 4 5 10
2020 1 1 1 3 5 8 2020 1 2 1 4 6 10 2020 2 2 2 5 7 12 2020 2 2 2 6 8 15 2020 2 2 2 5 6 12
2025 2 1 2 5 7 13 2025 1 1 1 5 6 12 2025 1 1 1 4 6 12 2025 1 0 1 4 5 10 2025 1 1 1 5 7 13
Date Cl 1 C Cl 1 B Cl 1 O Cl 2 Cl 3 Cl 4 Date Cl 1 C Cl 1 B Cl 1 O Cl 2 Cl 3 Cl 4 Date Cl 1 C Cl 1 B Cl 1 O Cl 2 Cl 3 Cl 4 Date Cl 1 C Cl 1 B Cl 1 O Cl 2 Cl 3 Cl 4 Date Cl 1 C Cl 1 B Cl 1 O Cl 2 Cl 3 Cl 4
2011 2 2 2 5 8 14 2011 2 2 2 6 8 14 2011 2 2 2 6 8 15 2011 2 2 2 5 7 12 2011 2 2 2 5 7 13
2012 2 2 2 5 7 14 2012 2 2 2 5 8 14 2012 2 2 2 5 8 14 2012 2 2 2 5 7 12 2012 2 2 2 5 7 13
2013 2 2 2 5 7 13 2013 2 2 2 5 7 14 2013 2 2 2 5 7 13 2013 2 2 2 5 7 12 2013 2 2 2 5 7 13
2014 2 2 2 5 7 13 2014 2 2 2 5 7 13 2014 2 2 2 4 6 12 2014 2 2 2 5 7 13 2014 2 2 2 5 7 13
2015 2 2 2 5 7 13 2015 2 2 2 5 7 13 2015 1 1 1 4 6 10 2015 2 2 2 5 7 13 2015 2 2 2 5 7 13
2020 2 2 2 5 7 13 2020 1 2 1 4 6 11 2020 2 2 2 5 7 12 2020 2 3 2 5 8 14 2020 2 2 2 5 7 13
2025 -3 -9 -3 -1 0 4 2025 0 -1 0 3 4 8 2025 -3 -10 -3 -1 0 3 2025 -3 -9 -3 -0 1 4 2025 2 2 2 5 7 12
Date Cl 1 C Cl 1 B Cl 1 O Cl 2 Cl 3 Cl 4 Date Cl 1 C Cl 1 B Cl 1 O Cl 2 Cl 3 Cl 4 Date Cl 1 C Cl 1 B Cl 1 O Cl 2 Cl 3 Cl 4 Date Cl 1 C Cl 1 B Cl 1 O Cl 2 Cl 3 Cl 4 Date Cl 1 C Cl 1 B Cl 1 O Cl 2 Cl 3 Cl 4
2011 1 1 1 3 5 8 2011 1 1 1 3 5 8 2011 1 1 1 3 4 8 2011 1 1 1 3 4 8 2011 1 1 1 3 5 8
2012 1 1 1 3 5 8 2012 1 1 1 3 5 8 2012 1 1 1 3 4 8 2012 1 1 1 3 4 8 2012 1 1 1 3 5 8
2013 1 1 1 3 5 8 2013 1 1 1 3 5 8 2013 1 1 1 3 4 8 2013 1 1 1 3 4 8 2013 1 1 1 3 5 8
2014 1 1 1 3 5 8 2014 1 1 1 3 5 9 2014 1 1 1 3 4 8 2014 1 1 1 3 4 8 2014 1 1 1 3 5 8
2015 1 1 1 3 5 9 2015 1 1 1 3 5 9 2015 1 1 1 3 4 8 2015 1 1 1 3 4 8 2015 1 1 1 3 5 8
2020 1 1 1 3 5 9 2020 1 1 1 3 5 9 2020 1 1 1 3 5 8 2020 1 1 1 3 4 8 2020 1 1 1 3 5 8
2025 2 2 2 5 7 13 2025 2 3 2 6 8 14 2025 1 1 1 4 6 11 2025 2 2 2 5 7 13 2025 2 2 2 5 7 13
Date Cl 1 C Cl 1 B Cl 1 O Cl 2 Cl 3 Cl 4 Date Cl 1 C Cl 1 B Cl 1 O Cl 2 Cl 3 Cl 4 Date Cl 1 C Cl 1 B Cl 1 O Cl 2 Cl 3 Cl 4 Date Cl 1 C Cl 1 B Cl 1 O Cl 2 Cl 3 Cl 4 Date Cl 1 C Cl 1 B Cl 1 O Cl 2 Cl 3 Cl 4
2011 1 1 1 3 4 7 2011 1 1 1 3 4 7 2011 1 1 1 3 4 7 2011 1 1 1 3 4 7 2011 1 1 1 3 4 7
2012 1 1 1 3 4 7 2012 1 1 1 3 4 7 2012 1 1 1 3 4 7 2012 1 1 1 3 4 7 2012 1 1 1 3 4 7
2013 1 1 1 3 4 7 2013 1 1 1 3 4 7 2013 1 1 1 3 4 7 2013 1 1 1 3 4 7 2013 1 1 1 3 4 7
2014 1 1 1 3 4 7 2014 1 1 1 3 4 7 2014 1 1 1 3 4 7 2014 1 1 1 3 4 7 2014 1 1 1 3 4 7
2015 1 1 1 3 4 7 2015 1 1 1 3 4 7 2015 1 1 1 3 4 7 2015 1 1 1 3 4 7 2015 1 1 1 3 4 7
2020 1 1 1 3 4 7 2020 1 1 1 3 4 7 2020 1 1 1 3 4 7 2020 1 1 1 3 4 7 2020 1 1 1 3 4 7
2025 1 1 1 3 4 7 2025 1 1 1 3 4 7 2025 1 1 1 3 4 7 2025 1 1 1 3 4 7 2025 1 1 1 3 4 7
Date Cl 1 C Cl 1 B Cl 1 O Cl 2 Cl 3 Cl 4 Date Cl 1 C Cl 1 B Cl 1 O Cl 2 Cl 3 Cl 4 Date Cl 1 C Cl 1 B Cl 1 O Cl 2 Cl 3 Cl 4 Date Cl 1 C Cl 1 B Cl 1 O Cl 2 Cl 3 Cl 4 Date Cl 1 C Cl 1 B Cl 1 O Cl 2 Cl 3 Cl 4
2011 1 1 1 3 4 7 2011 1 1 1 3 4 7 2011 1 1 1 3 4 7 2011 1 1 1 3 4 7 2011 1 1 1 3 4 7
2012 1 1 1 3 4 7 2012 1 1 1 3 4 7 2012 1 1 1 3 4 7 2012 1 1 1 3 4 7 2012 1 1 1 3 4 7
2013 1 1 1 3 4 7 2013 1 1 1 3 4 7 2013 1 1 1 3 4 7 2013 1 1 1 3 4 7 2013 1 1 1 3 4 7
2014 1 1 1 3 4 7 2014 1 1 1 3 4 7 2014 1 1 1 3 4 7 2014 1 1 1 3 4 7 2014 1 1 1 3 4 7
2015 1 1 1 3 4 7 2015 1 1 1 3 4 7 2015 1 1 1 3 4 7 2015 1 1 1 3 4 7 2015 1 1 1 3 4 7
2020 1 1 1 3 4 7 2020 1 1 1 3 4 7 2020 1 1 1 3 4 7 2020 1 1 1 3 4 7 2020 1 1 1 3 4 7
2025 1 1 1 3 4 7 2025 1 1 1 3 4 7 2025 1 1 1 3 4 7 2025 1 1 1 3 4 7 2025 1 1 1 3 4 7
Morning Peak Hour - 30c Equiv Toll Rate Morning Peak Hour - 40c Equiv Toll Rate Morning Peak Hour - 50c Equiv Toll Rate Morning Peak Hour - 60c Equiv Toll Rate Morning Peak Hour - 70c Equiv Toll Rate
Afternoon Peak Hour - 30c Equiv Toll Rate Afternoon Peak Hour - 40c Equiv Toll Rate Afternoon Peak Hour - 50c Equiv Toll Rate Afternoon Peak Hour - 60c Equiv Toll Rate Afternoon Peak Hour - 70c Equiv Toll Rate
Midday Off Peak - 30c Equiv Toll Rate Midday Off Peak - 40c Equiv Toll Rate Midday Off Peak - 50c Equiv Toll Rate Midday Off Peak - 60c Equiv Toll Rate Midday Off Peak - 70c Equiv Toll Rate
Weekday Evening - 30c Equiv Toll Rate Weekday Evening - 40c Equiv Toll Rate Weekday Evening - 50c Equiv Toll Rate Weekday Evening - 60c Equiv Toll Rate Weekday Evening - 70c Equiv Toll Rate
Weekend - 60c Equiv Toll Rate Weekend - 70c Equiv Toll RateWeekend - 30c Equiv Toll Rate Weekend - 40c Equiv Toll Rate Weekend - 50c Equiv Toll Rate