an assessment of skill needs in engineering
TRANSCRIPT

An Assessment of SkillNeeds in Engineering
SKILLS DIALOGUES: L ISTENING TO EMPLOYERS
Copies of this publication can be obtained from:
DfEE PublicationsPO Box 5050Sherwood ParkAnnesleyNottinghamNG15 0DJ
Tel: 0845 60 222 60Fax:0845 60 333 60
Please quote ref: SD2 ISBN: 1 84185 400 X
© Crown copyright 2000
Produced by the Department forEducation and Employment
Extracts from this document may be reproduced for non-commercial education or training purposes on condition that the source is acknowledged.

Skills Dialogue
A comprehensive summary from employers of skills requirementsin engineering
Research undertaken by
Helen ConnorSally DenchPeter Bates
THE INSTITUTE FOR EMPLOYMENT STUDIESMantell Building
FalmerBrighton BN1 9RF
UK
iii
SKILLS DIALOGUES: L ISTENING TO EMPLOYERS
Contents
The Institute for Employment Studies ii
Contents iii
Skills Dialogues - introduction v
Preface to Engineering Skills Dialogue vi
Executive Summary vii
Overview vii
Engineering demand - a changing but diverse picture vii
A change in skill needs too ix
Is supply adequate? ix
Skill deficiencies x
Conclusions xi
1. Introduction 1
Scope and main focus 1
Engineering and the economy 3
Economic and business trends 3
Principal drivers of change 6
Importance of diversity 7
2. Demand for Engineering Skills 8
Current employment 8
Employment trends 9
Employment forecasts 11
Employment pattern 14
Changing occupational balance 14
Reasons for occupational shift 15
Skill trends 16
Specific occupational skill changes 19
3. Supply of Engineering Skills 21
Stocks of qualified people 21
Participation in formal education 23
Further education 24
Higher education 26
Training programmes 30

iv
SKILLS DIALOGUES: L ISTENING TO EMPLOYERS
4. Recruitment and Skill Deficiencies 33
Historical overview 33
Recruitment and vacancies 33
Recruitment difficulties 34
Pay levels 40
Skills required 42
Impact of recruitment difficulties 44
Skill gaps 45
Impact of skill gaps 49
Looking to the future 50
Appendix 1: Contributing Organisations 52
Appendix 2: References and Data Sources 54
Appendix 3: Additional Tables 57

v
SKILLS DIALOGUES: L ISTENING TO EMPLOYERS
Skills Dialogues – General Introduction
Skills Dialogues constitute a series of consultations with all major industrial andbusiness sectors, leading to the production of high quality authoritative skills assessmentsfor each of these broad sectors. Dialogues developed from recommendations in the2nd Report of the Skills Task Force, Delivering skills for all, as a means of providingbetter quality information on changes in skills supply and demand at a sectoral level.They draw on research undertaken by National Training Organisations (NTOs) throughSkills Foresight and other projects as well as a wide range of national research oncurrent and future skills needs. Recognising the UK remit of NTOs the dialogue reportsreflect the UK perspective as far as possible, although not all the available evidencewhich underpins the Dialogues is UK wide. Typically, the reports do not provide aregion by region analysis but they do attempt to illustrate any major regionaldifferences. The Skills Dialogues operate as a rolling biennial programme with the firstfull series of reports due to appear between Autumn 2000 and the end of 2001.
The purpose of the dialogues is to improve the quality of skills information available ata sector level, and to provide an effective voice for NTOs and employers in their sectorsin the planning and implementation of education and training provision and ininforming careers advice and guidance. They will ensure that industry sector views arewell articulated and represented to major stakeholders, such as the new Learning andSkills Council (LSC) and its local arms, Regional Development Agencies (RDAs) andcareers services. The dialogues are designed to draw on the work of individual NTOsbut to cover broader industrial groupings, so as to aid strategic planning and make theinformation base more manageable.
The assessments produced through the dialogues will also directly contribute to SectorWorkforce Development Plans, as the evidence on skill needs will underpin proposedaction and influence the nature of relationships with key partners. These plans will forma strategic statement of NTOs’ proposed activities, relationships with partners andstakeholders and targets for achievement.
Each report results from a process of consultation with the main organisations in thesector to identify the key issues, and a wide ranging analysis of existing material onskills supply and demand, and factors influencing skill trends. The evidence includessector specific analysis from the recent national research conducted on behalf of theNational Skills Task Force including the Employer Skills Survey (ESS) and Projections of Employment and Qualifications by the Institute for Employment Research as well asthe NTOs’ own Skills Foresight research. The material is brought together into a draftdiscussion document for a national seminar, which involves all the key interests in the sector, such as employers, NTOs, Further and Higher Education planning, fundingand qualifications’ bodies, trade unions, professional associations and governmentdepartments.
The final report takes on board the comments from all those involved in the Dialogueand provides a comprehensive analysis of the skill needs and an authoritative statementabout skills trends in the sector. We hope they will be useful to policy makers andplanners in other parts of the United Kingdom. For example, a series of skills monitoringand forecasting exercises are being undertaken in Northern Ireland and the work onthis and other Dialogues will inform the Northern Ireland research.
vi
SKILLS DIALOGUES: L ISTENING TO EMPLOYERS
Foreword
As the representative National Training Organisations for the engineering sector, wewelcomed the recommendations from the National Skills Task Force to set up aprogramme of skills dialogues across the major industrial and business sectors,provided the reports reflected the views of those in the sector. We felt that the skillsdialogues could bring valuable information and new insights on skills to those planningeducation and training provision.
This report has been developed as a partnership between NTOs, their employers, andGovernment, but has involved discussion with a wide range of partners, including someof the funding and planning bodies who will benefit from this information. It hasbrought together a wide range of information, including the research that we as NTOshave carried out along with new data on current and future skills needs in the sector.The result is a detailed and thorough assessment of the current and projected skillneeds in engineering, which will be a valuable source of information for both plannersand careers and information services.
With changes underway in post-16 education and training, it is important that NTOsand our employers work closely and effectively with both the Learning and SkillsCouncil, once it starts work in April 2001, and with the Regional DevelopmentAgencies.
We hope that the Dialogue report, together with our own Skills Foresight reports willprovide a valuable tool for all those involved in planning education and trainingprovision to meet current and future skill needs in vital engineering occupations.
Engineering and Marine Training Authority
Engineering Construction IndustryTraining Board
vii
SKILLS DIALOGUES: L ISTENING TO EMPLOYERS
Executive Summary
Overviewq Despite the long-term decline in much of engineering manufacturing, there
continues to be strong demand for engineering skills in the UK economy, especiallyin the fast-growing electronics and telecommunications industries. A number ofengineering employers are experiencing difficulties in filling vacancies, mainlybecause of a shortage of people with relevant skills and experience. Skill shortagesare apparent at all levels but especially at the higher end of the occupationalspectrum, among professional engineers, and also in skilled (craft) trades, includingelectronics and IT skills. The main skill gaps are in specific technical and practicalskills areas but personal and generic skills are also in short supply.
q These are some of the key messages produced by the Engineering Skills Dialogueand presented in this report. The Dialogue is principally concerned with thedemand and supply of skills in the engineering industry, though it also addressesengineering skills across the economy, but not in as much depth. It is recognisedthat the representation of engineering skills outside of the engineering industry isgrowing and that some of the issues relating to demand and supply of engineeringskills in other sectors may be different from those in engineering manufacturing.This Dialogue provides some information on the broader picture but because of alack of detailed statistical information in places, does not provide a full analysis.Also, there are noticeable differences between different engineering occupationsand different engineering sectors, for example between electronics and mechanicalengineering, which mean that specific supply and demand issues have moresignificance to some parts of the engineering industry than to others.
Engineering demand - a changing but diverse pictureq Engineering skills are required across the UK economy in a variety of sectors and
are used in many and diverse ways. It is estimated that around 2.5 million peopleare in occupations that have some engineering component, about half of whom(1.3 million) are in substantially engineering occupations. The majority of those arefound in engineering manufacturing, though a number of other sectors havesubstantial numbers.
q The engineering industry as a whole has shrunk and, at the same time, experiencedenormous structural change over the last few decades. One and a half million jobshave been lost since 1971, though the rate of decline slowed during the 1990sand a small increase of five per cent was seen between 1995 and 1998. It is nowa ‘leaner but fitter’ industry, and both productivity and output have been increasingin the 1990s. Despite all the upheaval it has experienced, engineering continuesto make a significant contribution to the UK economy and to exports in particular.
q The shape and structure of the industry has changed in many ways which haveimplications for skills. There has been a shift in the occupational balance towardsthe more highly-skilled and educated. Jobs have become more demanding at alllevels, and there is an increased use of cell and team working. There are nowfewer large firms because of downsizing and more out-sourcing. Small firms in
viii
supply chains are taking on more responsibility for higher-level and more complexwork, which in turn is changing their skill mix and relationships with suppliers andcustomers. The trend towards mergers and the internationalisation of many largeengineering businesses mean that operational and investment decisions are nowtaken more at a global level.
q While there has been a lot of change there has also been continuity: the industryremains predominantly male, with very little part-time working or self-employment,and this is not expected to change much in the foreseeable future.
q Engineering is a world of contrasts. It comprises one of the fastest growing andbest performing sectors of the UK economy (the electronics sector) and also one ofthe weakest performers (the metals manufacturing, moulding and fabricationsector). The skill requirements and pattern of employment of electronics arenotably different from those of many other engineering sectors. So too is thepattern in the engineering construction industry with its increasing focus onmanaging contractor organisations. Different engineering sectors are subject todifferent pressures, which in turn have implications for skills. Analyses of overalltrends can mask important differences.
q At a regional level, there are also considerable contrasts due to the varyingcomposition of engineering, in terms of sectors, size breakdowns and occupationpatterns, though all regions have some representation of all sectors of engineering.Key issues of strategic importance for engineering at a regional level, and prioritiesfor regional organisations, will therefore vary accordingly.
q While, overall, engineering employment levels are broadly stable at present, thefuture is less optimistic on the whole. A reduction of 13 per cent in employmentlevels in the engineering manufacturing sector is forecast between 1998 and 2004.This will be felt differentially across the sector, and some sectors, such aselectronics, are likely to continue to grow. In the wider economy, employment ofengineering professionals is forecast to grow by over two per cent per annum to2009 while a two per cent annual reduction is forecast in the employment ofengineering craft and metal working skilled trades.
q However, despite these downward trends overall, there will continue to be a strong demand for training and job opportunities in engineering, as estimates of ‘replacement demand’ (ie to replace workers leaving due to retirement, career change, etc.) outweigh the negative expansion demand forecasts at alloccupational levels. Some of the largest numerical net requirements to 2009 in occupations of relevance to engineering are forecast to be in the corporatemanager, science and technical professional and skilled metal and electrical trade groups.
SKILLS DIALOGUES: L ISTENING TO EMPLOYERS

ix
A change in skill needs tooq A number of drivers of change are acting in unison to change skill requirements in a
range of jobs. These include the increased use of technology, new materials andnew processes throughout industry, an increasing emphasis on customers andmeeting their requirements, new working practices, and the globalisation of manyaspects of business. These demand higher-level skills and education, and alsogreater breadth of skill and greater flexibility in the applications of skills.
q A range of new and specific technical skills is required to meet the demands oftechnology and of the business, but also of importance is the greater emphasisemployers put on personal and generic skills in all work areas. The key role ofmanagers and supervisors, and the importance of their generic skills, areincreasingly being recognised, though perhaps not sufficiently within many smallfirms. The role of line manager/team leader has become increasingly critical, andrequires a different mix of skills (both technical and communication skills).
q Companies are having to change their skill mix, through upskilling of existingemployees and recruiting at higher levels, at a time when some are experiencingjob losses in areas where more traditional skills have been deployed. Severalissues have been identified in the Dialogue as needing to be addressed including:
q the ability of the education sector to meet this need in terms of producing the ‘raw material’ that industry requires
q the ability of engineering to attract the highly qualified people it needs throughoffering appropriate employment packages, training schemes and satisfyingcareer opportunities
q the development of the qualifications framework further, especially at NVQLevel 3, to help meet industry’s needs better at the intermediate level.
q While a lot of change is happening there is also continuity, and though declining,craft skills continue to be needed (in large numbers), along with the underpinningknowledge that goes with them.
Is supply adequate?q The number of engineering employees who hold a vocational qualification or at
least a GCSE Grade C has risen significantly over the last decade, and nowrepresents over 80 per cent of the engineering industry’s workforce. This compareswith 66 per cent in 1988. There were 46,000 NVQ awards made in engineering in 1998/99, a growth of 80 per cent over the previous five years. Annual output offirst degree graduates in engineering and technology is just over 22,000, a similarlevel to 1995 though substantially higher than in 1988.
q International comparisons show that, despite the growth in output from further andhigher education, the UK is still deficient numerically at the intermediate level,though on a par with most countries in terms of university engineering graduateoutput.
SKILLS DIALOGUES: L ISTENING TO EMPLOYERS
x
q While the supply of qualified people in engineering has been growing over the lastdecade, engineering has clearly not been getting its share of the growing studentpopulation. Engineering also has had problems in attracting people of sufficientcalibre onto Modern Apprenticeship programmes. Several reasons lie behind thesesupply problems, including:
q a failure to attract enough of the right quality of young people to studyengineering, partly due to a poor image
q a declining interest in taking maths and physics at ‘A’ level
q continuing low take-up by women on engineering courses
q attractions of alternative options (especially studying IT)
q more encouragement given to young people to stay on at school than to follow vocational routes which involve workplace training.
q Engineering is also criticised for not developing personal and transferable skillssufficiently among graduates, losing too many of the most able students to otherjobs (eg in IT, the City) and also failing to utilise some of the engineering graduatesappropriately and develop their skills.
q Although a number of changes have been introduced to improve engineeringeducation and put more emphasis on broadening skills and flexibility of provision,more could be done, for example in improving work placement opportunitiesavailable to graduates and undergraduates. However, an issue identified as havinga negative effect on the quality of higher education is the difficulty manyuniversities face in recruiting young engineering staff.
q In-company training activity is varied: half of small engineering firms do not provideany training to their employees; and engineering employees at higher levels aremore likely to receive training from their employers. The main barriers perceived byemployers to providing more training are cost and access.
Skill deficienciesq The evidence from engineering employers shows that significant numbers have
problems filling vacancies due to a shortage of people with relevant skills andexperience, and that there are also areas of skill deficiency within the existingengineering workforce. These are at a range of levels, though more so in thehigher skill occupations where demand is much greater.
q It is estimated that around one in six engineering employers have hard-to-fillvacancies and these are found more commonly in the engineering areas: craft,technician, professional and managerial occupations. Two-thirds of all vacancies at craft and skilled operative level are hard-to-fill ones, as are over half of allvacancies at engineering professional level. Particular areas of difficulty identifiedinclude: design engineers, CNC programmers, electrical engineers, fitters, patternmakers and CNC setters and operators.
SKILLS DIALOGUES: L ISTENING TO EMPLOYERS
xi
q Difficulties are greater for engineering firms in filling vacancies at engineeringprofessional level and in some engineering craft trades than for firms in the widereconomy, with the exception of the construction industry which has the greatestdifficulties. However, recruitment difficulties in engineering are more likely to bedue to a shortage of people with the relevant skills and experience than to otherreasons. Three-quarters of the hard-to-fill vacancies in professional and technicaloccupations reported by engineering employers were due to skill shortages.
q Within engineering, electronics has greater recruitment difficulties at professionalengineer level and in electrical and electronic trades than other engineering sectors,though the picture is more similar in respect of shortages in other occupations.
q Engineering employers find it more difficult to recruit people with technical andpractical skills than other skills. These technical skills cover a wide range and oftenfairly generic terms are used, eg electrical, design. Limited evidence is availablewhich explores the nature of these difficulties in detail. It would be beneficial inhelping to understand more about skill gaps and their causes if they could beunpacked more, at a sectoral or local level.
q Other areas of skill shortage are in generic and interpersonal skills, again covering awide range. For technicians, IT and software skills are frequently mentioned, while among managers there appear to be difficulties finding people with goodmanagement skills. For craft, manager and sales occupations, communicationsskills are a problem.
q Skill deficiencies in the existing engineering workforce are also evident, in particularin the engineering occupations cited above as causing recruitment difficulties. Onein four engineering employers considers there is a gap between the skills of theircurrent workforce and those needed to meet their business objectives. The natureof these skill gaps also mirrors those experienced in recruitment difficulties, with anemphasis on practical and technical skills, but the personal and generic skills arealso mentioned. In particular, people management skills are seen to be veryimportant at all levels and it is here that deficiencies are commonly reported.
q Finally, skill deficiencies impact on engineering companies in different ways:primarily in the bringing of new products to market, and developing businesses, butalso in their ability to meet customer service and quality objectives and operatingcosts. Around one-quarter to one-third of engineering employers are experiencingdifficulties of these kinds because of skill deficiencies in their employees.
ConclusionsThese findings have wide-ranging implications, many quite detailed and specific toparticular sectors or skill levels. However, there are some important conclusions forengineering as a whole:
q There is a continuing, substantial need for training provision in engineering. Despitethe long-term decline in much of the sector, there continues to be strong demandfor engineering skills.
SKILLS DIALOGUES: L ISTENING TO EMPLOYERS

xii
q Within the broad picture, though, provision needs to match changes in demand,reflecting for example, the growing demand at engineering professional level and inelectronics and telecommunications. However, even where employment is falling,such as in craft and lower-skilled occupations, replacement demand (to replacethose retiring or changing careers) is strong. There is no justification for reductionsin the overall level of provision.
q It is important that course content, curriculum and qualifications reflect the wayskill needs are changing. A range of new and specific technical skills are requiredbut education and training provision needs to reflect also the importance employersattach to personal and generic skills in all areas of engineering. This applies bothto initial training of new recruits to the industry and to upskilling needed by thosealready working in it.
This has clear implications for publicly funded education and training and for providers.However, the industry itself needs to respond - for example, by improving workplacement opportunities, by improving in-company training (particularly in small firms)and by continuing to work on improving the attractiveness of the industry.
SKILLS DIALOGUES: L ISTENING TO EMPLOYERS
1
Introduction
1.1 This report, prepared by the Institute for Employment Studies, is the result of theEngineering Sector Skills Dialogue. It provides an assessment of trends in employmentand skill needs, and associated issues in the engineering sector and is the second in aseries of reports that will be published up to the end of 2001.
1.2 The report has brought together, research and evidence from a wide range of institutionsinvolved in engineering and draws on national data, including the new Skills Task ForceEmployers’ Skills Survey (ESS) and the Institute of Employment Research (IER)Projections of Occupations and Qualifications. It is principally concerned with thedemand and supply of skills in the engineering industry, however it also addressesengineering skills across the economy, though not in as much depth. Some of theissues relating to engineering skills in other sectors are different from those pertaining tothe engineering sector. This Dialogue provides some information on the broader picturebut does not provide a full analysis, mainly because there is considerably less availableinformation on the demand for engineering skills outside of the engineering industry.
1.3 The Dialogue has built on existing labour market research and skills information onengineering that is collected regularly and used by a range of organisations, rather thanundertake any new research. The working paper was discussed at a national seminar,held on 15th May 2000, involving the relevant NTOs, employers, professional bodies,funding agencies, RDAs, representatives of further and higher education and GovernmentDepartments. This final report takes in to account comments received as a result of theseminar and from others involved in the consultation.
This introductory chapter provides details of the scope and coverage of the EngineeringDialogue and introduces the context, main economic trends and other factors ofinfluence on engineering skill requirements. Discussion of the evidence on trends indemand is presented in Chapter 2, on the supply and availability of skills in Chapter 3,and on the main demand-supply imbalances in Chapter 4.
Scope and main focus1.4 Engineering skills are represented in most sectors of the economy and are used in
many and diverse ways - from the manufacture of a wide range of goods to supportingbusiness and communications infrastructures, public health and defence. The principalNTOs with responsibility for engineering occupations are the Engineering and MarineTraining Authority (EMTA), whose scope covers engineering manufacturing (employingaround 1.75 million people) and the Engineering Construction Industry Training Board(ECITB), which covers the design, construction and maintenance of plant of variouskinds (employing around 40,000 people). Within engineering manufacturing there aredistinct sectors, including electronics and telecommunications equipment andcomponents, aerospace, motor vehicle production, mechanical engineering andfoundries. In addition, there is a large number of other NTOs (at least 25) which havean interest in engineering skills, the main ones being: the Rail Industry Training Council(RITC), nto tele.com, Electricity Training Association, PINTOG (covering chemicals andprocessing industries), CITB (construction), ITNTO and e-commerce NTO, and Skillset(covering the TV and film industries).
SKILLS DIALOGUES: L ISTENING TO EMPLOYERS

2
1.5 Figure 1.1 illustrates this breadth of engineering employment by showing thedistribution of people employed in recognised ‘engineering occupations’. While it isacknowledged that a large number of occupations have some engineering component(eg electricians, gas fitters), those included in Figure 1.1 are occupational groupsidentified in the Standard Occupational Classification (SOC) coding system assubstantially engineering occupations, namely - professional level engineers andtechnologists, engineering technicians, engineering craft trades and machineoperatives/assembly workers (further details of these are shown in Table A3.1 inAppendix 3). Taken together, these occupational groups make up 1.3 million out of anestimated engineering population (if all jobs with some engineering focus are included)of around 2.5 million (source: OSC Eng, 1998). The largest proportion of them (58per cent) is found in engineering manufacturing, but a range of other sectors employsubstantial numbers, in particular the services sectors (eg IT, communications, publicservices, utilities). The latter includes technical or engineering consultancies, andspecifically managing contractors working on engineering construction projects (whichfall under the scope of the ECITB).
Figure 1.1: Distribution of engineering employment
Source: LFS, 1999
1.6 Engineers at professional level are even more broadly spread, with a lower proportionin engineering manufacturing (44 per cent) and a higher proportion in the servicessector, and computer and business services in particular (almost one in five). This isalso reflected in the Engineering Council’s membership statistics where just 25 percent of the registrants are employed in manufacturing industry1.
1.7 This Dialogue has aimed to cover the main sectors where engineers are employed;however, as mentioned above its main focus is on the engineering manufacturing andengineering construction industries, and their component parts (eg electronics). Someof the issues and conclusions arising from the evidence presented in the report are ofrelevance to engineering in a wide sense, while others relate specifically to the situationin the engineering sector. Skills issues in other sectors, including engineering skills, arelikely to be discussed also in other Dialogue Reports (eg construction, processingindustries, transport and information and communications technologies (ICT)).
SKILLS DIALOGUES: L ISTENING TO EMPLOYERS
1 Note that the Engineering Council’s registrants include a wide range of disciplines and because membership isvoluntary include only part of the total population. The data shown in Figure 1.1, based on the Labour ForceSurvey, and the Engineering Council data are not compatible.
58% Engineering manufacturing
14% Other manufacturing
7% Computer & business services
3% Public
4% Construction
2% Utilities
12% Other services

3
Engineering and the economy1.8 Engineering has traditionally occupied a major role in the UK economy, and continues
to do so despite a decline in the traditional manufacturing sector. This is because, asseen above, engineering skills are utilised throughout the economy and, in particular,are key to the development of technology-based industries and services.
q Total engineering industry output is valued at around £55 billion, representing eightper cent of total UK GDP (Wilson, 2000). This accounts for more than one-third oftotal UK exports, with mainland Europe the main destination (EEF, 1999).
q Specific engineering sub-sectors are among the best performing UK industries: egelectronics output, which has grown massively in the 1990s, now represents one ofthe largest manufacturing sector outputs (more than £30 billion). It also providessignificant exports (16 per cent of the UK’s total in 1996) (ITCE SSG, 1999).
q Engineering contributes to the success of a range of other industries in, forexample, the development of IT services and communications, new digitaltechnologies in broadcasting, medical research, and the development of thefinancial systems infrastructure of the City. It is impossible to quantify this widerimpact of engineering on the UK economy but it is significant and expected toincrease as the pace of technology and innovation increases and applicationsbecome more widespread.
Economic and business trends
Historical perspective1.9 Over the last two or three decades, the engineering manufacturing sector as a whole
has shrunk considerably. Large scale factory closures and downsizing, a consequencemainly of the effects of two major recessions, in the early 1980s and again in theearly 1990s, have led to the loss of over 1.5 million jobs in engineering since 1971.These losses have been felt more in the country’s old industrial heartlands inparticular, parts of the North West, North East, Midlands and Central Scotland. Theyhave also hit more at lower skill levels (discussed further in Section 2.5) and in thetraditional metals manufacture and mechanical equipment sectors.
1.10 The contrast between the newer, technology based, and the older traditional industriesis an important one. For example, output in the electronics sector grew by 62 percent between 1990 and 1998, compared with a fall of 4 per cent for manufacturingas a whole (ITCE SSG, 1999). Electronics has also benefited from major inwardinvestment by foreign companies and from strong world market growth, in particularthe European market for PC products in the 1990s. Although parts of electronicshave suffered from some volatility (in particular the semi-conductor industry), overall,electronics has shown much stronger growth than the rest of engineering during the1990s. The UK aerospace sector has also been much stronger economically thanother parts of engineering. The IT and business services sectors, which employsubstantial numbers of software, electronics and computer engineers, have been oneof the main growth areas in the UK economy, with the IT services sector alonedoubling its contribution to GDP since 1990 (ITNTO, 1999).
SKILLS DIALOGUES: L ISTENING TO EMPLOYERS

4
1.11 Alongside these overall trends have been enormous structural changes withinengineering manufacturing companies due to the development and application of newtechnology in processes and in products, putting pressure on both investment and theneed to re-skill and manage change effectively. Also, as in many other developednations, international competition and the development of global businesses has had aserious impact.
1.12 The engineering construction sector has also been affected by similar trends -international competitiveness, the need to control costs and improve response times,and the impact of new technology (in particular ICT). Most important has been thetrend for large client companies to downsize, and outsource more work, especiallymore repair and maintenance activities, to contractor organisations, and more recentlysome of the operations work also. There has been a noticeable increase in smallerrepair and maintenance contracts in contrast to the decrease in large engineering andconstruction projects. Political factors have also had an influence, includingGovernment energy policy, maturity of the North Sea oil market, the price of oil, andhealth and safety issues.
Current picture1.13 The engineering industry is now seen as being considerably ‘leaner and fitter’ than it
was two decades ago, and on the whole more stable economically. In terms of GDP,output has grown by 45 per cent since 1981 but productivity (GDP per head) hasmore than doubled, from a figure of 14.25 in 1981 to 30.28 in 1998. Variousbusiness surveys in 1999 showed a relatively stable situation overall, but they alsohighlighted continuing difficulties for many employers, especially in export markets.The strength of sterling is a major negative factor on which the recent spate ofredundancies and of job losses in major car plants have been blamed. According tothe EEF (4th Quarterly report, 1999)
‘the engineering sector has turned the corner but recovery has yet to show any realstrength … demand remains fragile and prospects uncertain.’
The situation in early 2000 appears to have deteriorated, with output in engineeringreported as falling in the first quarter (EEF, 2000).
1.14 There is also sectoral diversity: a North-South divide in new orders was reported in1999, and also much stronger order books for the electronics and electricalequipment and automotive sectors at that time (EEF, 1999), though for the latter thesituation has noticeably changed. Electronics employers (FEI) also confirm thestronger economic conditions in the electronics sector.
Future outlook1.15 Domestic demand is expected to strengthen in 2000 leading to a small growth in
engineering manufacturing output (1.8 per cent). This is despite the expectedcontinuing adverse effects of a strong pound. Overall figures, however, once againmask different trends between engineering sectors. The mechanical, metal goods andmotor vehicles sectors are all expected to contract in output between 1999 and2000, but recover a little by the end of the year (EEF, 1999), while electronics willcontinue to push ahead.
SKILLS DIALOGUES: L ISTENING TO EMPLOYERS

5
1.16 Looking further ahead, according to IER macro-economic forecasts (Wilson, 2000):
q The engineering sector will continue to recover, but led by growth in electronics, anddriven by technological change and strong growth in demand for communicationsand computer services and equipment.
q There will be a core of smaller, but leaner, industries which are likely to growmodestly, bolstered by increasing specialisation and a shift towards export markets.
q Overall engineering output (GDP) is forecast to grow at 2.8 per cent per annum to2004 and then higher, at 3.5 per cent to 2009. This will be underpinned by highgrowth in technology and research and development industries.
q These trends to 2009 compare with a slightly lower growth for the whole ofmanufacturing, and also a lower average growth figure for engineering in theprevious decade (1.7 per cent per annum, 1991-98).
1.17 According to the EEF (1997), the rate of technological, industrial and economicchange is expected to quicken in the next decade, and individual businesses will needto become more competitive and more specialised. There will be growth in IT systemsin all aspects of business, greater flexibility in working practices and less traditionaldemarcation, more ‘just in time’ and cellular manufacturing, and more globalbusinesses and a greater prevalence of international supply chains.
1.18 Several sources point to continued diversity across engineering, especially by sector:
q ‘Metals manufacturing, moulding and fabrication’ is identified as likely to be one ofthe weakest engineering performers over the next decade. Like other labourintensive industries it is becoming increasingly price sensitive (Wilson, 2000).
q The foundry sector, and especially high-volume foundries have been affected inparticular by the international market, and some are likely to disappear altogetheror move into more specialised areas (EMTA/ADAPT, 2000).
q Electronics and telecommunications are expected to benefit from projected stronggrowth, especially if it moves more into higher value, ‘knowledge-based’ areaswhere it can retain competitive advantage (ITCE SSG, 1999).
q The UK automotive components industry is likely to face a slowdown in orders as aconsequence of the exchange rate and difficulties in making efficiencyimprovements (EMTA/ADAPT LM Observatory sector reports, 2000). The latter isalso likely to impact on the assembly part of the industry too.
q Vehicle assemblers are likely to take increasing advantage of international sourcingto remain cost-competitive, and thus re-think their relationship with local suppliers.This is expected to have a serious knock-on effect across UK manufacturing. Thereis also a threat from over-capacity in the European car manufacturing industry.
q The aerospace sector is also looking to make changes to supply chains in order toremain cost-competitive. It will increasingly look to outsource production work (egmachining) at a global level to countries where labour is cheaper (SBAC, 2000).
SKILLS DIALOGUES: L ISTENING TO EMPLOYERS

6
q There is considerable uncertainty about major building projects going ahead (egnew power stations) which affects the future outlook for the engineeringconstruction industry (ECITB, 1999). Growth will be affected by political factorsrelating to investment in public transport, and energy policy.
Principal drivers of change1.19 The main factors influencing change have already been referred to above, and will be
discussed further in the remainder of the report in relation to particular skills andoccupations. The main ones are competitive pressures and profitability (often blamedon the high value of sterling) and the overall drive for quality, efficiency and meetinggreater customer expectations - to keep up with or ahead of the competition. Otherdrivers, often linked to these, include (and some of these are effects as well):
q New working practices (for example, cell and team working, clean working areas) -themselves influenced by a drive to increase efficiency; new ideas in managerialthinking; the requirements of new technologies and products.
q The growth of outsourcing and devolution of responsibilities down the supply chain -for example, in the automotive sector more work is being pushed down the supplychain leading to new skill requirements for supplier companies; and also in theengineering contracting sector (see section above).
q Technological change - leading to a shift towards higher-level occupations andgreater demand for higher-level skills. Specific changes include, for example: theautomation of production lines; the increased use of robotics and automatedprocesses; development of telecommunications; the increasing use of IT in stockcontrol systems, tele-sales and internet-sales; and the increasing amount ofelectronics components in equipment (eg railway signalling, digital broadcasting).
q An increasing emphasis on customer service, and customers being moredemanding (eg requiring speedier response).
q Globalisation - which has affected decisions by multi-national companies about thelocation of key functions of businesses, and hence key skills (eg concentratingresearch and development in one country) also led to a growth of inwardinvestment in the UK from foreign companies on greenfield sites which has createda focus of skilled people in certain locations. The continuing trend towards globalmergers places major economic decisions relating to investment in the hands of asmaller number of companies.
q Flatter organisational structures, as a consequence of drives to control costs andincrease efficiency, which lead to shorter career ladders and increased demand formanagement skills down the occupational hierarchy.
q Greater environmental concerns and increased safety awareness which putsattention on quality and standards, especially after major incidents involving loss oflife (eg Piper Alpha for oil rig operations; Paddington rail crash for signalling).
q Social pressures, for example an increasing resistance to working in jobs thatnecessitate long periods away from home (affecting engineering construction sitesin particular); and the need to develop better family-friendly employment policies.
SKILLS DIALOGUES: L ISTENING TO EMPLOYERS
7
Importance of diversity1.20 Clearly, there is a diverse picture across the engineering sector with some sectors,
noticeably electronics, doing much better than others. It is important also to note thediversity in terms of products and processes, and by size of establishment andbusiness outlook. (This is often why business surveys with slightly different coveragesshow different results). Over two-thirds of engineering manufacturing establishmentshave under 25 employees, yet 25 per cent of total employment is in large engineeringestablishments employing 500 people or more (EMTA, 1999).
1.21 The engineering sector contains many of the most dynamic, leading edge companiesin the UK today, as well as a large number of relatively low-tech, ‘metal-bashing’companies. They operate in both domestic and international markets (which aresubject to different pressures), and while many engineering businesses areindependent, and some still family owned, an increasing number are part of largemulti-national operations or international partnership arrangements. Inwardinvestment by foreign companies (eg Japanese, Korean, American) has been a featureof the 1990s, especially in micro-electronics, consumer electronics and theautomotive industry.
1.22 Thus, while there are common themes across the sector relating to business factorsthat affect employment and skill trends, there can be danger in over-generalisationsabout engineering, as individual companies can be faced with very different issues andconcerns according to size, sector, region and markets. (The differences between theengineering construction and manufacturing, and between electronics and the rest ofengineering have already been highlighted above). Where possible in this report, keydifferences between sectors of engineering have been identified, and especiallybetween electronics and the rest of engineering, as they are thought to be subject toquite different conditions.
SKILLS DIALOGUES: L ISTENING TO EMPLOYERS

8
Demand for Engineering Skills
2.1 In this chapter we review the evidence and discuss issues relating to the demand side- the main employment patterns and trends in the sector, in particular the changesrelating to requirements for skills and the underlying causes. The information onemployment and demand trends is drawn mainly from the Projections of Occupationsand Qualifications (Wilson, 2000), the EMTA Labour Market and Skills Surveys of1998 and 1999, the Employers’ Skills Survey (ESS) 1999, ECITB’s labour marketstudies and the EEF’s Business Trends Surveys. Information on skill trends is drawnfrom various, mainly qualitative, studies.
Current employment2.2 As mentioned in Chapter 1, different definitions are used by organisations in the
collection of engineering occupation employment statistics which are not comparableand thus cause difficulties in reaching an accurate estimate of total engineeringemployment. An occupational mapping study of the engineering sector (OSCEng,1998) estimated a population of around two and a half million people employed withinoccupations that have some engineering component, of which just over 40 per centwork within the main engineering industries. Analysis of the Labour Force Survey(1999), shows 1.3 million employed in core engineering occupations (see Figure 1.1and Table A3.1), 58 per cent of them in engineering manufacturing. Looked atanother way, 1.75 million are employed in engineering manufacturing (but not all inengineering occupations, as this includes administration and sales staff) as defined bythe EMTA scope, and a further 40,000 in the engineering construction industry (ECITBscope).
2.3 The Annual Employment Survey (AES) provides a breakdown of employment in theengineering manufacturing sector, though detailed sectoral information is not availableevery year. In 1996 there were 76,000 establishments. The key features of thisemployment by size and sector are:
q The vast majority of establishments are small (two out of three had less than 24employees, and only one per cent had 500+ employees (Table A3.2).
q However, 25 per cent of all engineering employees are in establishments with500+ employees.
q Metal products and mechanical equipment sectors are the two largest engineeringmanufacturing sectors (together accounting for 47 per cent of employment).
q Aerospace and motor vehicles (both sectors where economies of scale areimportant), have more larger sites than other sectors; metal products is morefocused on very small establishments.
2.4 In terms of geographical distribution, the West Midlands is the most significantemployment region for engineering manufacturing. It accounts for over 20 per cent ofthe total employment in England. The lowest share is found in London, and the NorthEast (both only four per cent of the total).
SKILLS DIALOGUES: L ISTENING TO EMPLOYERS

9
2.5 The composition of the engineering industry differs within each region, though allregions have some representation of all of the engineering sub-sectors (see TableA3.3). Notable regional features are:
q Mechanical equipment, metal products and motor vehicles sectors are heavilyrepresented in the West Midlands.
q Aerospace is focused more on the South East, South West, North West and Easternregions.
q The South East and Eastern regions both comprise a higher proportion ofelectronics establishments than elsewhere.
q London and the South East account for over half of the head office employment inthe engineering construction sector.
q London is the location of a high proportion of engineering and other technicalconsultancies and head offices.
2.6 As size of establishment varies by sector, so the sectoral composition in each regionexplains some of the size differences. For example, the South West has a higherproportion of employment in establishments with over 250 employees because of its focus on aerospace; while in Yorks and Humberside there are higher proportions of small firms because of the greater concentration there of mechanical and metalproducts establishments. It is important that regional bodies are aware of thesize/sector breakdown for engineering in their region and also the differences betweenthe regional pattern and the national picture so that key issues of strategic importancefor engineering in each region can be addressed.
2.7 A breakdown of employees in engineering manufacturing by age (EMTA, 1998) showsthat 15 per cent are aged between 16 and 24 years, and 35 per cent are aged 45years or over. When compared with the British workforce, the engineeringmanufacturing sector has a slightly older age profile. However, it is noticeably youngerin electronics, electrical engineering and motor vehicles than in other engineeringsectors. The engineering construction industry has an older age profile with anestimated 48 per cent aged 45 years or more, and even higher percentages amongcertain occupations such as pipefitters and erectors/riggers (ECITB, 1999).
Employment trends
Past trends2.8 As highlighted in the previous chapter, most sectors of engineering manufacturing have
been experiencing reductions in employment levels for most of the last few decades.The downward trend did slow during the 1990s and there has been some recoveryover the last few years. The largest falls in the 1980s were in the metals andmechanical engineering sectors, reflecting their poorer business performance. Allregions lost engineering jobs but the largest reductions were in London (Wilson,2000).
2.9 Another trend has been a reduction in the average size of engineering employers, aconsequence of the earlier large-scale closures of factories, downsizing and
SKILLS DIALOGUES: L ISTENING TO EMPLOYERS
10
outsourcing. This has changed the shape of the sector, such that a higher proportionof employees now works in establishments with under 250 employees (EMTA, 1999).
2.10 Since 1994, a recovery has been in place in engineering manufacturing andemployment overall rose five per cent between 1995 and 1998. Most regions haveseen growth in engineering manufacturing during this recent period, the exceptionbeing London (Wilson, 2000). Growth has been strongest in electronics, machinetools and motor vehicles, where inward investment by foreign companies has played amajor role, and in the case of electronics in particular, where global markets havebeen growing at a fast rate. There has been growth also in the engineeringconstruction industry, but this has been almost entirely due to a shift in employmentfrom client to contractor organisations as large companies in other sectors downsized.
2.11 Looking more widely at the demand for engineering skills across the economy, sectorsoutside of engineering, especially the IT and business services sectors, have shownmore buoyant demand trends over the long term than the engineering sector. Thereare now more opportunities for engineers, especially those at professional level, towork outside of the engineering manufacturing sector due to the growth and spread oftechnology across the economy (see Chapter 1). In the last three years (1995-98),the overall growth in employment in engineering occupations (all sectors) has beensurprisingly similar to that in the engineering sector (up by 3.9 per cent overall,according to the LFS, 1995-98). However, there are considerable variations betweensectors, with, for example, the IT sector having a higher growth of demand forengineers, especially software engineers, and parts of other manufacturing havingmuch slower demand growth rates.
Current trends2.12 Currently, the main picture is one of relative stability in the engineering sector overall,
though there are signs of a return to the overall declining long-term trend. Varioussurveys of engineering employers show little change overall in employment levels overthe last year:
q In the ESS survey in mid-1999, 44 per cent of employers in the engineeringmanufacturing sector reported that their total employment had not changed in thelast 12 months, and slightly more reported an increase (31 per cent) than adecrease (25 per cent). Any change that was recorded tended to be ‘a little’ ratherthan ‘a great deal’.
q The EMTA survey undertaken earlier in 1999 also showed little change, but herethe trend was more downwards rather than upwards; however, there are slightdifferences between the scope of the two surveys which may explain this variation.
q In the 12 months to September 1999, the EEF reported a decline in engineeringemployment of 4.4 per cent (This estimate is based on the Labour Force Survey).Nearly three-quarters of that reduction took place in the six months to March1999.
q There is surprisingly little difference apparent between engineering sectors: allsectors of engineering reported a decline in the 12 months to September 1999,though aerospace recorded a slight increase in the third quarter and electronics
SKILLS DIALOGUES: L ISTENING TO EMPLOYERS
11
recorded least reduction in employment levels over the period (EEF, 1999). In theEMTA survey, employers in aerospace were more likely than those in engineering asa whole to report an increase over the last 12 months, but electronics showed asimilar pattern to the rest of engineering. Thus, although the electronics sector isshowing much stronger business growth than engineering as a whole, it is notreflected to the same extent in recent employment trends.
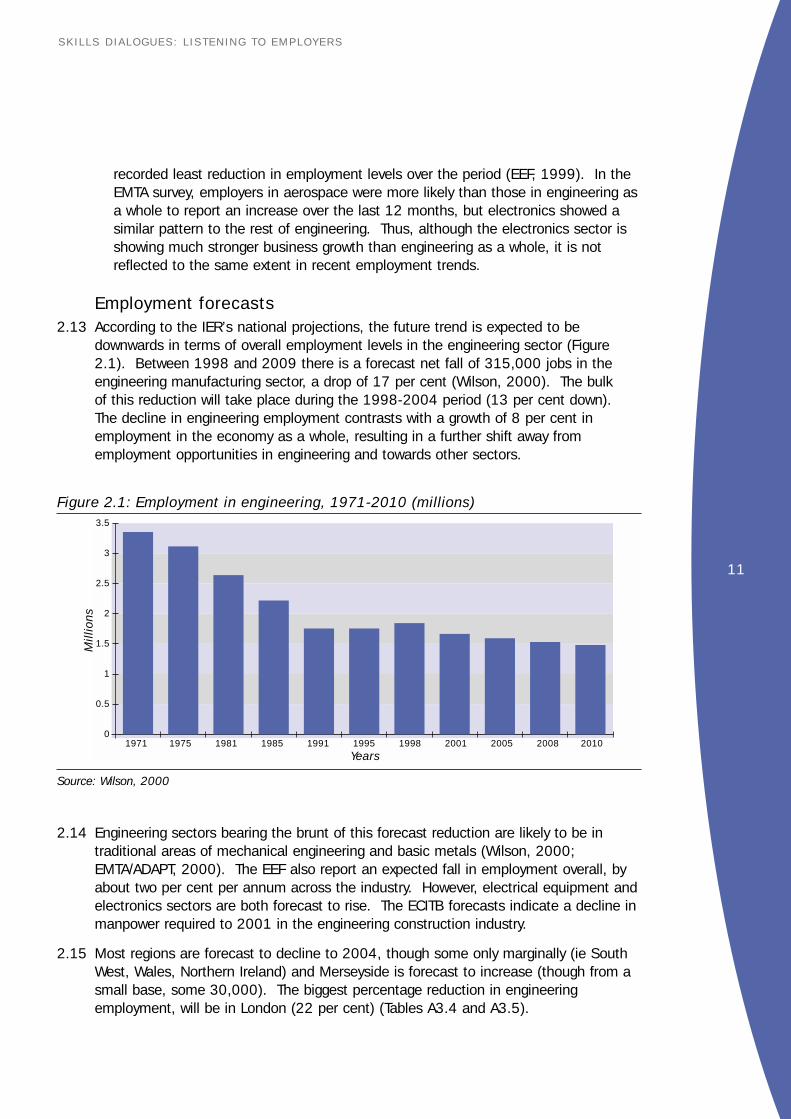
Employment forecasts2.13 According to the IER’s national projections, the future trend is expected to be
downwards in terms of overall employment levels in the engineering sector (Figure2.1). Between 1998 and 2009 there is a forecast net fall of 315,000 jobs in theengineering manufacturing sector, a drop of 17 per cent (Wilson, 2000). The bulk of this reduction will take place during the 1998-2004 period (13 per cent down). The decline in engineering employment contrasts with a growth of 8 per cent inemployment in the economy as a whole, resulting in a further shift away fromemployment opportunities in engineering and towards other sectors.
Figure 2.1: Employment in engineering, 1971-2010 (millions)
Source: Wilson, 2000
2.14 Engineering sectors bearing the brunt of this forecast reduction are likely to be intraditional areas of mechanical engineering and basic metals (Wilson, 2000;EMTA/ADAPT, 2000). The EEF also report an expected fall in employment overall, byabout two per cent per annum across the industry. However, electrical equipment andelectronics sectors are both forecast to rise. The ECITB forecasts indicate a decline inmanpower required to 2001 in the engineering construction industry.
2.15 Most regions are forecast to decline to 2004, though some only marginally (ie SouthWest, Wales, Northern Ireland) and Merseyside is forecast to increase (though from asmall base, some 30,000). The biggest percentage reduction in engineeringemployment, will be in London (22 per cent) (Tables A3.4 and A3.5).
SKILLS DIALOGUES: L ISTENING TO EMPLOYERS
3.5
3
2.5
2
1.5
1
0.5
01971 1975 1981 1985 1991 1995 1998 2001 2005 2008 2010
Mill
ions
Years
12
2.16 The employment reductions will be due mainly to technology change bringing aboutimprovements in productivity, through, for example, more flexible use of labour,changes in working practices and work organisation, but changes in markets and the effects of price competition will also be factors especially in certain sectors(Wilson, 2000).
2.17 Looking at the broader picture, a smaller reduction in the main engineeringoccupations across the economy is forecast, down in aggregate by five per centbetween 1998 and 2009. On the basis of current and past trends there is likely to be considerable variation between sectors outside of engineering. The current growthsectors of IT, business services and telecommunications are likely to continue to seegrowth in demand for engineers. However, detailed occupational projections at asector level to show this more fully are not available.
Importance of replacement demand2.18 However, this forecast reduction in employment levels does not mean that there will
be fewer job opportunities in engineering in the future. Employers will need to replaceworkers who leave as a result of retirement and career changes. Estimates of futureemployment levels provide a useful indication of change, but they can give amisleading impression of future demand in terms of job opportunities and relatedtraining needs.
SKILLS DIALOGUES: L ISTENING TO EMPLOYERS

13
Figure 2.2: Replacement demand and net requirements for selected occupations inengineering sector, 1998-2009 (per cent)
Source: Wilson, 2000
2.19 In the case of engineering, the total replacement demand forecast outweighs thenegative expansion demand in every occupational group, thus leading to a positive netrequirement overall. It is estimated that around 370,000 new job openings will ariseover the next decade in the engineering manufacturing sector. In occupational groupswhere significant losses are forecast (due to negative expansion demand), in particularskilled metal electrical trades, these are projected to be more than compensated forby replacement demand, mainly due to retirement. Some of the largest numerical netrequirements in the engineering sector are for corporate managers (71,000), scienceand technical professionals (34,000), business associate professionals (32,000),skilled metal and electrical trades (109,000), process plant and machine operatives(58,000), transport drivers and operatives (34,000) and elementary clerical andservice groups (52,000) (Figure 2.2).
SKILLS DIALOGUES: L ISTENING TO EMPLOYERS
Corporate Managers
Managers and Proprietors
Science/Tech Professionals
Teaching/Research Prof.
Business/Public Service Prof.
Science Associate Prof.
Bus/Public Serv. Assoc. Prof.
Admin. & Clerical Occupations
Secretarial & Related Occs.
Skilled Metal/Elec. Trades
Skilled Construct. Trades
Other Skilled Trades
Sales Occupations
Process Plant & Mach. Ops.
Transport Drivers and Ops.
Elementary: Trades/Plant/Mach
Elementary: Clerical/Service
0 10 20 30 40 50 60 70
Replacement Demand Net Requirement
14
Employment pattern2.20 Unlike other sectors (eg in the services industries) little overall change is expected in the
pattern of engineering employment in terms of employment status. It is expected to:
q remain predominantly male (over 70 per cent)
q employ mostly full-time workers (94 per cent)
q have relatively few self-employed people (only 7 per cent).
However, there will be changes in the occupational structure, and also further shifts inthe size structure towards smaller firms.
Changing occupational balance2.21 It is clear from various surveys that demand in some engineering occupations has
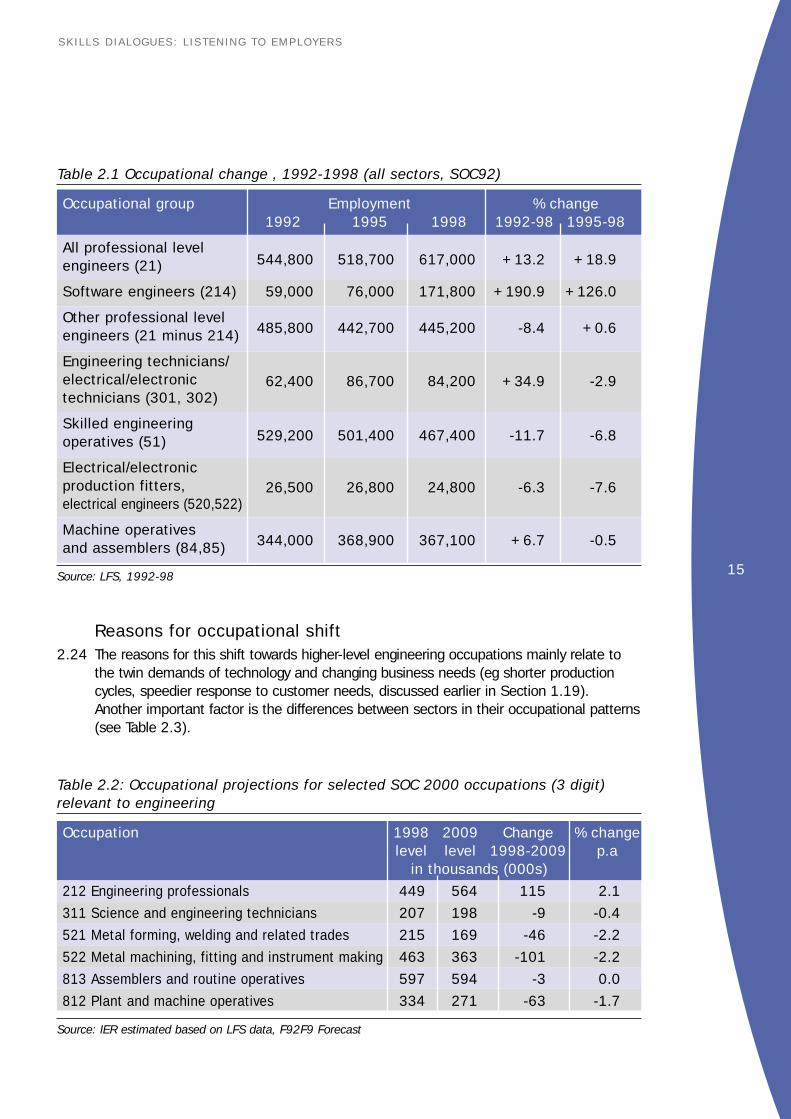
been growing faster than others. This is generally backed up by the availablestatistical evidence (in the LFS) though the pattern is not entirely consistent. Lookingacross the economy, the employment of engineering professionals, as a group,increased by 13 per cent between 1992 and 1998, but grew at a faster rate, by 18per cent, between 1995 and 1998. Much of this growth, however, is due to themassive growth in software engineers, up by almost 200 per cent between 1992 and1998. If they are excluded from the total there was actually a net fall of 8 per cent inthe employment of engineering professionals in the 1992-98 period, though thischanged to a small (0.5 per cent) increase between 1995 and 1998. Lower-leveloccupations have recorded reductions between 1995 and 1998 though these variedbetween occupations (Table 2.1).
2.22 The occupational balance in engineering is expected to continue to shift towardshigher-level occupations (in terms of skills and education levels), and reflects in part amore general pattern across the economy. Looking across the economy, the largestreductions in employment levels are expected to be in skilled metal and electricaltrades. This is in contrast to engineering professionals who are expected to increaseover the next decade (Table 2.2). But as shown above, even for declining occupationssuch as skilled metal and electrical trades (which include engineering craftsmen andwomen) losses are likely to be more than compensated for by replacement demand,leading to a significant number of new job openings in the years ahead.
SKILLS DIALOGUES: L ISTENING TO EMPLOYERS
15
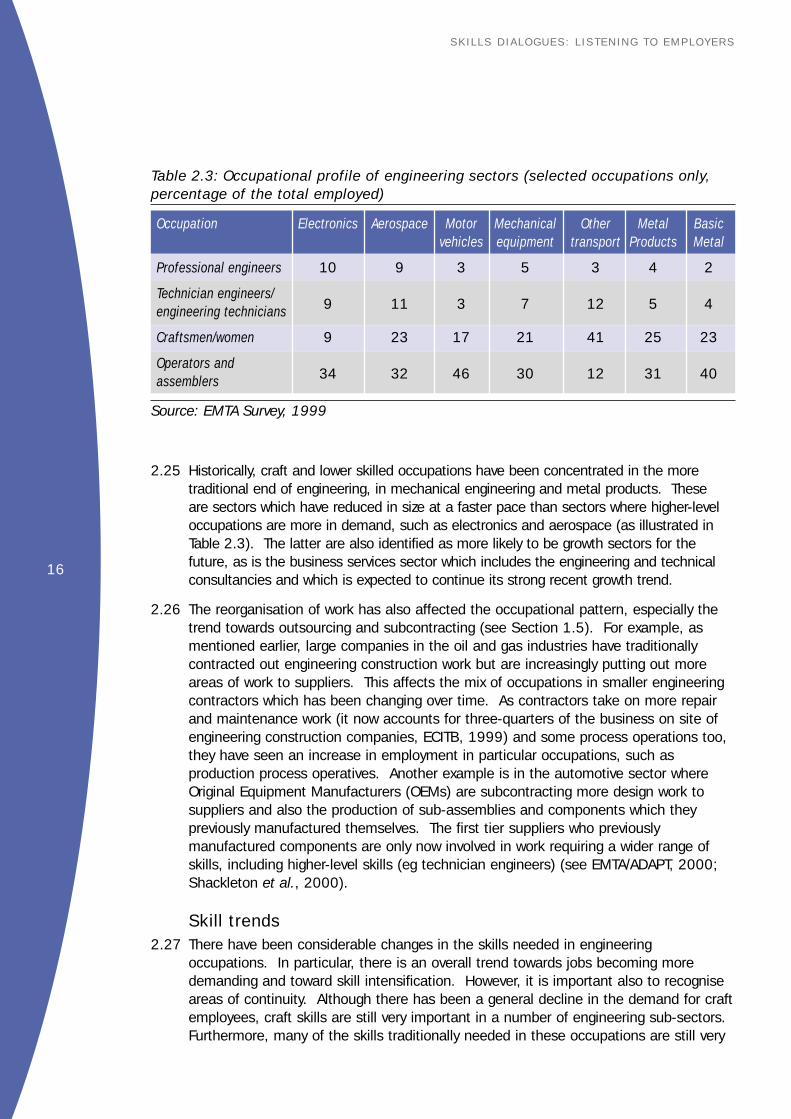
Reasons for occupational shift2.24 The reasons for this shift towards higher-level engineering occupations mainly relate to
the twin demands of technology and changing business needs (eg shorter productioncycles, speedier response to customer needs, discussed earlier in Section 1.19).Another important factor is the differences between sectors in their occupational patterns(see Table 2.3).
SKILLS DIALOGUES: L ISTENING TO EMPLOYERS
Table 2.1 Occupational change , 1992-1998 (all sectors, SOC92)
Occupational group Employment % change1992 1995 1998 1992-98 1995-98
All professional level 544,800 518,700 617,000 +13.2 +18.9engineers (21)
Software engineers (214) 59,000 76,000 171,800 +190.9 +126.0
Other professional level 485,800 442,700 445,200 -8.4 +0.6engineers (21 minus 214)
Engineering technicians/62,400 86,700 84,200 +34.9 -2.9electrical/electronic
technicians (301, 302)
Skilled engineering529,200 501,400 467,400 -11.7 -6.8operatives (51)
Electrical/electronic26,500 26,800 24,800 -6.3 -7.6production fitters,
electrical engineers (520,522)
Machine operatives344,000 368,900 367,100 +6.7 -0.5and assemblers (84,85)
Source: LFS, 1992-98
Table 2.2: Occupational projections for selected SOC 2000 occupations (3 digit)relevant to engineering
Occupation 1998 2009 Change % changelevel level 1998-2009 p.a
in thousands (000s)212 Engineering professionals 449 564 115 2.1
311 Science and engineering technicians 207 198 -9 -0.4
521 Metal forming, welding and related trades 215 169 -46 -2.2
522 Metal machining, fitting and instrument making 463 363 -101 -2.2
813 Assemblers and routine operatives 597 594 -3 0.0
812 Plant and machine operatives 334 271 -63 -1.7
Source: IER estimated based on LFS data, F92F9 Forecast
16
2.25 Historically, craft and lower skilled occupations have been concentrated in the moretraditional end of engineering, in mechanical engineering and metal products. These are sectors which have reduced in size at a faster pace than sectors where higher-leveloccupations are more in demand, such as electronics and aerospace (as illustrated inTable 2.3). The latter are also identified as more likely to be growth sectors for thefuture, as is the business services sector which includes the engineering and technicalconsultancies and which is expected to continue its strong recent growth trend.
2.26 The reorganisation of work has also affected the occupational pattern, especially thetrend towards outsourcing and subcontracting (see Section 1.5). For example, asmentioned earlier, large companies in the oil and gas industries have traditionallycontracted out engineering construction work but are increasingly putting out moreareas of work to suppliers. This affects the mix of occupations in smaller engineeringcontractors which has been changing over time. As contractors take on more repairand maintenance work (it now accounts for three-quarters of the business on site ofengineering construction companies, ECITB, 1999) and some process operations too,they have seen an increase in employment in particular occupations, such asproduction process operatives. Another example is in the automotive sector whereOriginal Equipment Manufacturers (OEMs) are subcontracting more design work tosuppliers and also the production of sub-assemblies and components which theypreviously manufactured themselves. The first tier suppliers who previouslymanufactured components are only now involved in work requiring a wider range ofskills, including higher-level skills (eg technician engineers) (see EMTA/ADAPT, 2000;Shackleton et al., 2000).
Skill trends2.27 There have been considerable changes in the skills needed in engineering
occupations. In particular, there is an overall trend towards jobs becoming moredemanding and toward skill intensification. However, it is important also to recogniseareas of continuity. Although there has been a general decline in the demand for craftemployees, craft skills are still very important in a number of engineering sub-sectors.Furthermore, many of the skills traditionally needed in these occupations are still very
SKILLS DIALOGUES: L ISTENING TO EMPLOYERS
Table 2.3: Occupational profile of engineering sectors (selected occupations only,percentage of the total employed)
Occupation Electronics Aerospace Motor Mechanical Other Metal Basicvehicles equipment transport Products Metal
Professional engineers 10 9 3 5 3 4 2
Technician engineers/9 11 3 7 12 5 4engineering technicians
Craftsmen/women 9 23 17 21 41 25 23
Operators and 34 32 46 30 12 31 40assemblers
Source: EMTA Survey, 1999
17
important. For example, toolmakers and welders still need many of the skills theyhave always needed to operate effectively. In several studies, employers reported howrecruits often did not have sufficient underpinning knowledge (Dench, 1999; PRIME,1998), largely because this had been reduced in training courses. For example, theydid not understand how different materials react in different conditions. This knowledge remains very important; indeed, it is often an essential basis fromwhich people are able to learn new skills and take on new ways of working.
2.28 A number of key themes emerge from studies exploring changing skill needs inengineering occupations. General trends in skill needs are outlined in the rest of thissection, although it should be stressed that the diversity in the sector can also beseen in the way changes in skill needs vary across the sector. In the following section,more occupationally specific changes are discussed.
New and specific technical skills2.29 Technical change is often evolutionary. However, there is a continual need for
employees to keep up with a range of technical changes. This affects employees atall levels, although the complexity of change increases with the occupational hierarchy.At some levels, the need is for skills in new process technologies. Professionalengineers, especially those involved in ‘leading edge’ and specialist activities have tokeep up with innovations and developments in design, materials and other factorswhich influence the nature of a product.
2.30 The 1998 EMTA survey explored the extent of use of different technologies. CNC andCAD were most commonly used, by 46 per cent and 43 per cent of establishmentsrespectively. EMTA’s and other studies have shown a need for a greater requirementof skills in these areas.
2.31 Studies of the automotive industry (for example, PRIME, 1998) provide examples ofthe need for employees, especially those at craft and technician level, to increase thedepth of their knowledge in new and developing technologies, for example robotics,and conveyor, welding and manufacturing control systems.
Computer literacy and IT skills2.32 There is a close association between technical change and the need for greater IT
skills. An increasing level of computer literacy is required of most engineeringoccupations, although again the complexity varies. At production levels it is basickeyboard skills and the ability to operate computerised processing technology which isimportant. At more senior and professional levels, computerised technology is involvedin the product itself and the design process. A recent study (Shackleton et al., 2000)reported an increasing use of electronic data transfer.
2.33 In telecommunications and electronics, there has been a particular move away fromtraditional mechanical and electrical skills towards an emphasis on IT skills. This islinked to both changes in the nature of the products and in the processes ofproduction.
2.34 In engineering construction, the impact of advanced IT and communicationstechnologies (ITC) is having a wide impact on administration and e-commerce and alsoin electronics (eg in diagnostic tools). This affects all skill levels. It is becoming
SKILLS DIALOGUES: L ISTENING TO EMPLOYERS

18
increasingly realistic for engineers in the engineering construction industry, forexample, to work from home on a project based anywhere in the world, and theconcept of virtual teams is becoming a reality (ECITB, 2000).
Multi-skilling and greater flexibility2.35 There is mixed evidence on the extent to which true multi-skilling is occurring, although
the 1998 EMTA survey found that 85 per cent of employers had introduced somemulti-skilling. In more traditional activities, multi-skilling is less common. However,there is widespread evidence that demarcations between jobs are increasinglyunacceptable and that, at a minimum, task flexibility is required.
2.36 A study of the automotive industry (PRIME, 1998), concluded that skilled electro-mechanical craftsmen/women needed to be multi-skilled; there was less demand forspecialised trades and a greater emphasis on electronic skills. Production employeeswere also becoming more multi-skilled, needing more mechanical, electronic and dataprocessing skills. Whether multi-skilled or not, people working in a range of engineeringoccupations are expected to be increasingly flexible. The nature of this varies frombeing able to work at the margins of a different specialism, to being prepared to pick upa range of different tasks, however mundane. For example, Shackleton et al. (2000)reports how shop floor workers are increasingly expected to multi task. This usuallymeans being able to operate more than one machine at once. More flexible workersare also needed in the engineering construction industry, partly to help control costs butalso as a consequence of investment in new technology. For example, many oilplatforms are now manned by smaller teams of more flexibly skilled workers.
The ability to deal with change2.37 Change, whether through the adoption of new technologies and working practices,
take overs and mergers, and new organisational structures is a fact of life for mostengineering employers. Employees at all levels need to be able to cope positively withthis, whether through their general attitudes or ability to learn new skills. Managers,especially senior managers, need ‘change management skills’, enabling them tointroduce and effectively manage change through their organisations. A study for theSociety of British Aerospace Companies (SBAC, 2000) identifies developing changemanagement skills as a key challenge for the future.
An ability to continue learning, re-skilling2.38 Implicit in the areas listed above is the need for engineering employees to continue
learning. Employers increasingly look for an ability to learn, but also an attitude ofmind which predisposes people to be interested in and proactive about learning. There is an increased demand for advanced training to be taken in a modular way, tomeet the needs of graduates to continue to update their skills regularly (and to do somore as the pace of technological change quickens).
The greater importance of personal and generic skills2.39 Various studies report the increasing importance of these skills. In undergraduate and
graduate studies, they are often described as ‘broadening skills’ and are in increasingdemand by employers (and by students). They are very wide-ranging in nature, andreflect changes in work organisation and working practices (in particular movestowards cell working and emphasis on teamwork), technological change and the
SKILLS DIALOGUES: L ISTENING TO EMPLOYERS

19
greater expectations placed on most employees. Overall, employees are expected tohave the following skills and abilities:
q communication
q teamworking and getting on with others, including being able to work in self-managed teams
q problem-solving and diagnosis, and at professional levels, greater abilities forforward thinking and ‘whole system’ thinking
q taking responsibility, showing initiative and becoming more involved
q organisation and management.
Understanding the business2.40 This has varying implications at different levels. For example, those involved in design
and innovation need to understand the business and its position and aims in the widermarket. However, as businesses have become tighter, leaner and placed a greateremphasis on reducing costs and increasing efficiency. it has become increasinglyimportant that employees at all levels understand the implications of their actions, orthat of their team, for others and the customers.
Customer service awareness2.41 Engineering sectors have become much more customer-focused, and this has
implications for the skills of employees. Many of these have been discussed above.For example, much greater emphasis is placed on communication skills, attention isrequired to delivery dates and, where a bespoke product is being made, to therequirements, interests and needs of the customer. Organisations making bespokeproducts or involved in supply chain activities are now under much greater scrutinyfrom their customers visits and audits might occur with little or no notice. Allemployees need to be informed and able to react appropriately to these changes.
Legislation and the environment2.42 This is an emerging area of increasing importance for many industries. For example, it
is likely to affect both design and production of cars in the future, through legislationwhich affects the industry directly, and also indirectly, through for example fuelemissions. Employees in a range of occupations will be expected to have theknowledge and skills to ensure that these issues are fully addressed.
Specific occupational skill changes2.43 There have also been a number of more specific changes affecting different
occupations, and these are discussed below.
Managers2.44 With an emphasis on efficiency and competition, the key role of managers is
increasingly being recognised and attention is being paid to the more generic skillsthat make a good manager. While technical skills and knowledge are part of this, theyare not enough on their own. Managers need, for example, to be able to managebudgets, people, teams, clients and customers operate strategically as well as on aday-to-day level and show leadership. Promotion to management has traditionally
SKILLS DIALOGUES: L ISTENING TO EMPLOYERS

20
been seen as the main form of recognition and reward. Some organisations arestruggling with how to motivate those people who are technically excellent but lack, orare uninterested in developing, people and managerial skills while some companies, forexample, have been experimenting with different promotion routes and sideways moves.
First-line managers/team leaders2.45 The role of the team leader has become increasingly critical, and is qualitatively
different from that of a traditional supervisor. Team leaders have much greaterresponsibility for managing their team, including project management, budgets, downtime, and people management. The non-technical aspects of the job are much moreimportant than in the past: for example, communication skills, the ability to motivateand deal with any staffing problems, including disciplinary issues. First-line managersalso have significant responsibilities in training their team, and this requires skillsbeyond simply having the technical knowledge and expertise to do a job.
Professionals and technicians2.46 Broader skills are needed at higher levels, technological excellence is no longer
enough. For example, professional engineers in manufacturing need to be able tocommunicate with colleagues (junior, at same level and senior to them), and also withclients, in technical and in non-technical language. They also more often nowadayswork in teams, work with production staff to address problems, and need anunderstanding of all or most of the production process, as well as the product.
2.47 In some sectors, there can be tensions between a requirement for specialists andgeneralists. For example, specialists might be needed to work with specific productsand technologies, to diagnose and address deep-seated production and designproblems. The automotive study (PRIME, 1998) identified a tension betweenspecialist needs and the need for design generalists who are able to adapt to differentsub-systems, emerging technologies and changes in the design stage. Otheremployers want professional and technical employees with general expertise so thatthey can work flexibly across the company. In electronics and telecommunications,graduates are expected to have analytical and conceptual abilities, to understandsystems and how to integrate them (Mason, 1999b).
2.48 Employer concerns about some graduates’ lack of ‘work-readiness’ and ‘businessunderstanding’ (Mason, 1999a) may reflect the greater emphasis that employers aregiving, because of commercial pressures, to seeking graduates who can ‘hit theground running’.
Production workers2.49 The evidence on production workers is mixed. Some suggests that they are
increasingly being deskilled, but other evidence suggests that they are being affectedboth by multi-skilling, teamworking and new technologies demanding higher-level skills.These different views again reflect the diversity within the engineering sector. In some sub-sectors and companies, production tasks have been largely automatedand deskilled. However, in others (for example, automotives and aerospace),production operatives are as affected by the demands of technological andorganisational changes as are other occupational groups.
SKILLS DIALOGUES: L ISTENING TO EMPLOYERS
21
SKILLS DIALOGUES: L ISTENING TO EMPLOYERS
Supply of Engineering Skills
3.1 In this chapter we review the evidence on engineering supply side issues. The mainfocus is the output from the education system and qualification trends. Trainingactivity, including in-company training and new Modern Apprenticeship programmesare also included.
3.2 In engineering, although the link between qualification and occupation is not as strongas in other areas, such as health or legal work, vocationally based training andqualifications have long been a feature. Certain qualifications are traditionallyassociated with particular occupations, especially at technician and professional levels,and can make a valuable contribution to meeting skill needs. The EngineeringCouncil’s regulations (SARTOR) for the formation of engineers specify particulareducation qualifications (discussed further in section 3.10). In general, however, andparticularly at lower occupational levels, engineering employers do not valuequalifications per se, but look for competent and experienced workers who may, ormay not, have formal qualifications. On the whole, many have a traditional outlooktowards qualifications and there is still a range of views across engineering about thevalue of the (not-so-new) S/NVQ framework, both positive and negative ones.
Stocks of qualified peoplePast trends
3.3 The main trend is that the number of employees in engineering holding vocationalqualifications is increasing (Mason, 1999a). This is in line with general trends in theemployed workforce (Wilson, 2000). Though it is difficult to measure trends preciselyover time because of changes to qualifications and occupational classifications, thestatistics in Table 3.1 (Taken from Mason, 1999a) give a good indication of theimprovements over the last ten years. The biggest change is in the percentage of theengineering workforce with no vocational qualification or general qualifications higherthan GCSE Grade D or equivalent which has halved, from 35 to 18 per cent, in tenyears. Those who hold vocational qualifications at higher or lower intermediate levelsand degree or above have risen from 43 per cent to 53 per cent. Within this, degreelevel qualifications rose from 8 to 11 per cent.
3.4 This change mainly reflects the supply side of the labour market as there has been arising level of educational attainment in the population and, in particular, increasingnumbers staying on in post-compulsory education. But, it also reflects the shift in thesector towards higher-level occupations (discussed in Chapter 2).
3.5 Compared with the workforce as a whole, the percentage of graduates (1998) in theengineering sector is lower (11 per cent) than for all industries (16 per cent), but thepercentage with higher or lower intermediate vocational qualifications is much higher(42 per cent) than for all industries (30 per cent). The percentages with no vocationalqualifications or general qualifications higher than GCSE Grade D or equivalent are verysimilar (Mason, 1999a). However, again these overall figures for engineering maskdifferences between engineering sectors. In electronics, for example, the workforce ismore polarised at the higher and lower levels: a much higher percentage of the

electronics industry’s workforce are degree-qualified (22 per cent) but slightly less (14per cent) have no vocational qualifications or GCSEs above Grade D, compared toengineering as a whole (Mason, 1999b).
3.6 There is difficulty in making international comparisons of educational levels because ofdifferences between countries in their educational and vocational systems.Historically, the UK engineering industry appears to have employed fewer people withintermediate qualifications than many other European countries especially Germany,but at degree level there is more similarity (see Mason, 1995; Prais, 1989). Acrossthe whole economy, approximately 380,000 people hold degree qualifications inengineering disciplines (either single or combined with other subjects, LFS, 1999), afigure that has not changed much over the last two years. (This includes all branchesof engineering but not science and technology subjects like materials).
Future trends3.7 Looking to the future, at the higher qualification levels, the available national
projections data (Wilson, 2000) show that the graduate penetration rate overall willincrease from 15 per cent for all occupations in 1998 to 20 per cent by 2009. Forthe two SOC groups of most relevance to engineering:
q science/engineering professionals: an increase in graduate penetration from 51 to57 per cent
q science associate professionals: an increase from 20 to 27 per cent.
3.8 This upward trend is related to ‘supply’ effects (ie more graduates being available andfinding jobs more easily than non-graduates) but is more likely to be due to the impactof increased demand in the industry for higher educational levels (Wilson, 2000).
22
SKILLS DIALOGUES: L ISTENING TO EMPLOYERS
Table 3.1: Highest qualification held by workforce in metal goods, engineering andvehicles industries (1998:SIC80 Div 3; 1998: SIC92 Groups 28-35) percentages
1988 1998
Degree and equiv. or above 8 11
Intermediate* 35 42
Basic vocational** 7 9
‘A’ level or equivalent 4 4
‘0’ level or equivalent 12 15
No voc qualification, or GCSE higher than grade D 35 18
* Includes BTEC/SCOTVEC Higher National and BTEC National awards, C&G advanced craft and craft awards,completed trade apprenticeships and equiv (1998 data includes NVQ Level 3 and 4 and GNVQ Advanced awards)
** Includes GNVQ Intermediate and Foundation awards, NVQ Level 1 and 2 (1998 data), BTEC general and firstawards, SCOTVEC National Certificate modules, C&G below craft level, YT, YTP certificates
Source: from Table 10, Mason, 1999a (based on Labour Force Surveys)
23
SKILLS DIALOGUES: L ISTENING TO EMPLOYERS
Participation in formal education3.9 There are two main educational outputs in relation to qualifications of relevance to this
report - from further education and from higher education. The main trends andissues related to each are discussed in separate sections below, but first we highlightsome important issues for both, relating to falling interest in engineering careers.
Falling share of student population3.10 In both sectors, there have been increasing numbers taking engineering courses over
the last ten years, but they represent a falling share of the total student population.Several reasons are put forward for this:
q Poor image of the industry: This has dogged engineering for decades andappears to be as much an issue today as it was in the 1970s. A number ofresearch studies have highlighted the industry’s unattractiveness to young people,in particular its poor image as a career and also a lack of knowledge aboutengineering jobs and engineering/technology matters in general. A 1998 survey ofYear 7-11 pupils showed that just one in seven would choose a career inengineering, and these were mainly boys (EMTA, 1998a). A recent EngineeringCouncil survey of members showed that around one-quarter would not recommendengineering as a career to a young man or woman, and among those that would(60 per cent) ‘excitement’, ‘pay’ and ‘status’ were hardly mentioned as features(Engineering Council, 1999).
Industry would like to see more initiatives to raise awareness and knowledge ofengineering careers through giving school students more direct experience of theengineering industry, for example through work experience and industrialplacements. A recent study on introducing Engineering GNVQ to schools showedpositive benefits among those participating which included more able students notusually given the opportunity to experience vocational courses (EEF, 2000).
q Choice of options: Another reason for the declining interest in engineering coursesrelates to the limited numbers choosing mathematics and science subjects atschool. Though numbers have been growing, only half of 16 year olds get GCSEmaths Grade C. Only around ten per cent of the cohort go on to study maths at ‘A’level (AEB). Maths ‘A’ level awards have remained broadly static, but physics hasdeclined by 13 per cent between 1993 and 1997, though the trend has sincelevelled. There is a perception that science and maths ‘A’ levels are harder and lessinteresting than others (Sharp et al., 1996). The majority of engineering courses atuniversities, especially the top ones, require maths and physics ‘A’ level, and often athird science ‘A’ level (Steedman et al., 2000). Then, for those with maths andscience qualifications, there are other alternative career options to consider.Computing and IT subject areas are often seen as more attractive in terms ofgraduate salaries and career prospects (ITCE SSG, 1999). Many do not requiremaths ‘A’ level, in contrast to engineering.
q Changing pattern of study: The Government’s focus on encouraging more youngpeople to stay on at school and progress to higher education is thought to havehad a detrimental effect on the ‘vocational route’. There has been a shift in thebalance of post-16 education towards higher education study caused by increased
staying on rates at school and the rapid expansion of higher education in the early1990s, along with changes in perceptions of the status of different qualifications.Thus, people who previously may have taken vocational qualifications at FE college(eg HNC, NVQ Level 2/3), on a part-time or full-time basis, are more likelynowadays to stay on at school and aspire to a university place. Those who takeHNC/HND qualifications usually end up completing a degree. Employers oftencomment about the disappearance of the ‘traditional FE student’. There is also anoticeable lack of progression between the NVQ lower levels (commented on byEngineering Council, 1998). Furthermore, the new GNVQ qualifications haveestablished themselves more as a route to HE entry. Compared to many othercountries, the UK has less output at sub-degree level. In the case of France, forexample, these increase engineering entrants by a factor of three (Steedman, etal., 2000).
In its initial proposals in response to the final report of the Skills Task Force, theGovernment intends to strengthen the vocational route and encourage greaterparticipation in vocational learning by developing career ladders of progression invocational study or apprenticeships through to foundation degrees. It is alsofocusing expansion of higher education in general at sub-degree level (in responseto the Dearing Report on HE, 1997). The Engineering Council is also aiming toaddress the perceived imbalance in the supply of engineers, which is weightedtowards the higher (Chartered) level, through its new regulations, SARTOR 97.These have the broad support of the industry. The regulations are designed toimprove access to Chartered and Incorporated status from different starting points,including FE qualifications.
q Low take-up by women: Only 11 per cent of engineering students in FE collegesare female (Individual Student Record [ISR]) and 14 per cent of undergraduates inhigher education (UCAS, 1999); a situation which has changed little during the1990s. The main reasons relate to the two above (image and alternative, moreattractive, options). Interestingly, women are much better represented at ‘A’ level inphysics and maths (23 per cent and 36 per cent respectively of the total awardsare to women) suggesting that the ‘put-off’ factors are working at both earlier andlater decision-making stages. Differences are also apparent between disciplines:chemical engineering does much better than other engineering disciplines with 24per cent of degree places taken by women.
Further education3.11 The FE sector continues to be in a state of flux due to changes in funding systems,
qualifications and types of provision. These, together with re-classification ofengineering subjects in student statistics and movements of programmes between theFE and HE sectors, make it difficult to gain a clear picture of long-term trends relatingto engineering. However, work by the FEFC to improve the available statistics, and arecent report on the engineering programme area (FEFC, 2000) have made it possibleto identify the following trends and issues:
q In 1997-98 7.2 per cent of the 4.4 million FE students were on engineeringcourses.
q The vast majority (80 per cent) study part-time.
24
SKILLS DIALOGUES: L ISTENING TO EMPLOYERS
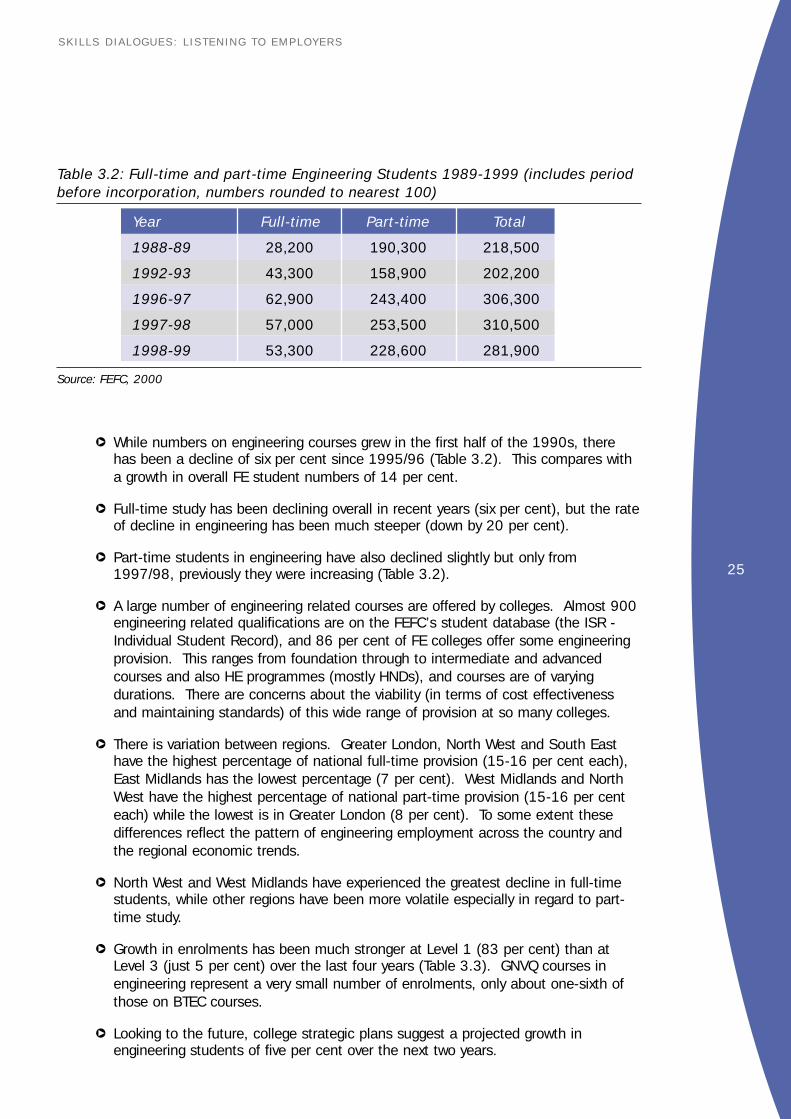
25
SKILLS DIALOGUES: L ISTENING TO EMPLOYERS
q While numbers on engineering courses grew in the first half of the 1990s, therehas been a decline of six per cent since 1995/96 (Table 3.2). This compares witha growth in overall FE student numbers of 14 per cent.
q Full-time study has been declining overall in recent years (six per cent), but the rateof decline in engineering has been much steeper (down by 20 per cent).
q Part-time students in engineering have also declined slightly but only from1997/98, previously they were increasing (Table 3.2).
q A large number of engineering related courses are offered by colleges. Almost 900engineering related qualifications are on the FEFC’s student database (the ISR -Individual Student Record), and 86 per cent of FE colleges offer some engineeringprovision. This ranges from foundation through to intermediate and advancedcourses and also HE programmes (mostly HNDs), and courses are of varyingdurations. There are concerns about the viability (in terms of cost effectivenessand maintaining standards) of this wide range of provision at so many colleges.
q There is variation between regions. Greater London, North West and South Easthave the highest percentage of national full-time provision (15-16 per cent each),East Midlands has the lowest percentage (7 per cent). West Midlands and NorthWest have the highest percentage of national part-time provision (15-16 per centeach) while the lowest is in Greater London (8 per cent). To some extent thesedifferences reflect the pattern of engineering employment across the country andthe regional economic trends.
q North West and West Midlands have experienced the greatest decline in full-timestudents, while other regions have been more volatile especially in regard to part-time study.
q Growth in enrolments has been much stronger at Level 1 (83 per cent) than atLevel 3 (just 5 per cent) over the last four years (Table 3.3). GNVQ courses inengineering represent a very small number of enrolments, only about one-sixth ofthose on BTEC courses.
q Looking to the future, college strategic plans suggest a projected growth inengineering students of five per cent over the next two years.
Table 3.2: Full-time and part-time Engineering Students 1989-1999 (includes periodbefore incorporation, numbers rounded to nearest 100)
Year Full-time Part-time Total
1988-89 28,200 190,300 218,500
1992-93 43,300 158,900 202,200
1996-97 62,900 243,400 306,300
1997-98 57,000 253,500 310,500
1998-99 53,300 228,600 281,900
Source: FEFC, 2000
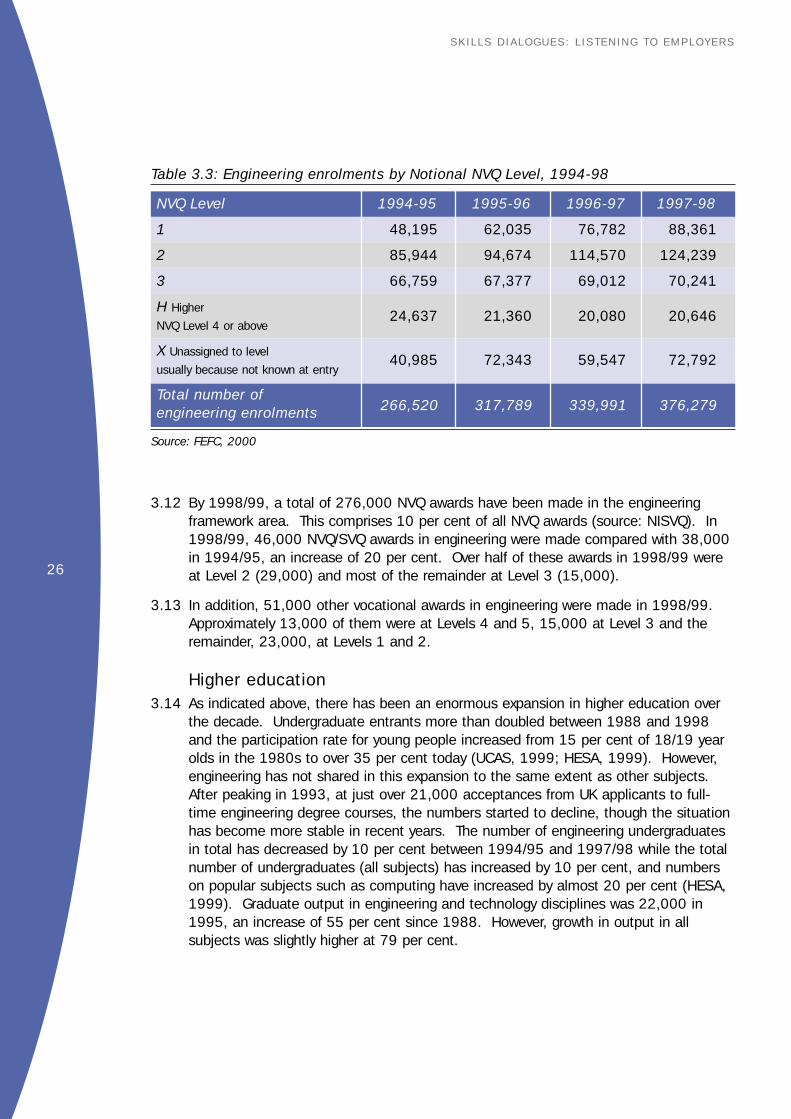
3.12 By 1998/99, a total of 276,000 NVQ awards have been made in the engineeringframework area. This comprises 10 per cent of all NVQ awards (source: NISVQ). In1998/99, 46,000 NVQ/SVQ awards in engineering were made compared with 38,000in 1994/95, an increase of 20 per cent. Over half of these awards in 1998/99 wereat Level 2 (29,000) and most of the remainder at Level 3 (15,000).
3.13 In addition, 51,000 other vocational awards in engineering were made in 1998/99.Approximately 13,000 of them were at Levels 4 and 5, 15,000 at Level 3 and theremainder, 23,000, at Levels 1 and 2.
Higher education3.14 As indicated above, there has been an enormous expansion in higher education over
the decade. Undergraduate entrants more than doubled between 1988 and 1998and the participation rate for young people increased from 15 per cent of 18/19 yearolds in the 1980s to over 35 per cent today (UCAS, 1999; HESA, 1999). However,engineering has not shared in this expansion to the same extent as other subjects.After peaking in 1993, at just over 21,000 acceptances from UK applicants to full-time engineering degree courses, the numbers started to decline, though the situationhas become more stable in recent years. The number of engineering undergraduatesin total has decreased by 10 per cent between 1994/95 and 1997/98 while the totalnumber of undergraduates (all subjects) has increased by 10 per cent, and numberson popular subjects such as computing have increased by almost 20 per cent (HESA,1999). Graduate output in engineering and technology disciplines was 22,000 in1995, an increase of 55 per cent since 1988. However, growth in output in allsubjects was slightly higher at 79 per cent.
26
SKILLS DIALOGUES: L ISTENING TO EMPLOYERS
Table 3.3: Engineering enrolments by Notional NVQ Level, 1994-98
NVQ Level 1994-95 1995-96 1996-97 1997-98
1 48,195 62,035 76,782 88,361
2 85,944 94,674 114,570 124,239
3 66,759 67,377 69,012 70,241
H Higher24,637 21,360 20,080 20,646
NVQ Level 4 or above
X Unassigned to level40,985 72,343 59,547 72,792
usually because not known at entry
Total number of266,520 317,789 339,991 376,279engineering enrolments
Source: FEFC, 2000
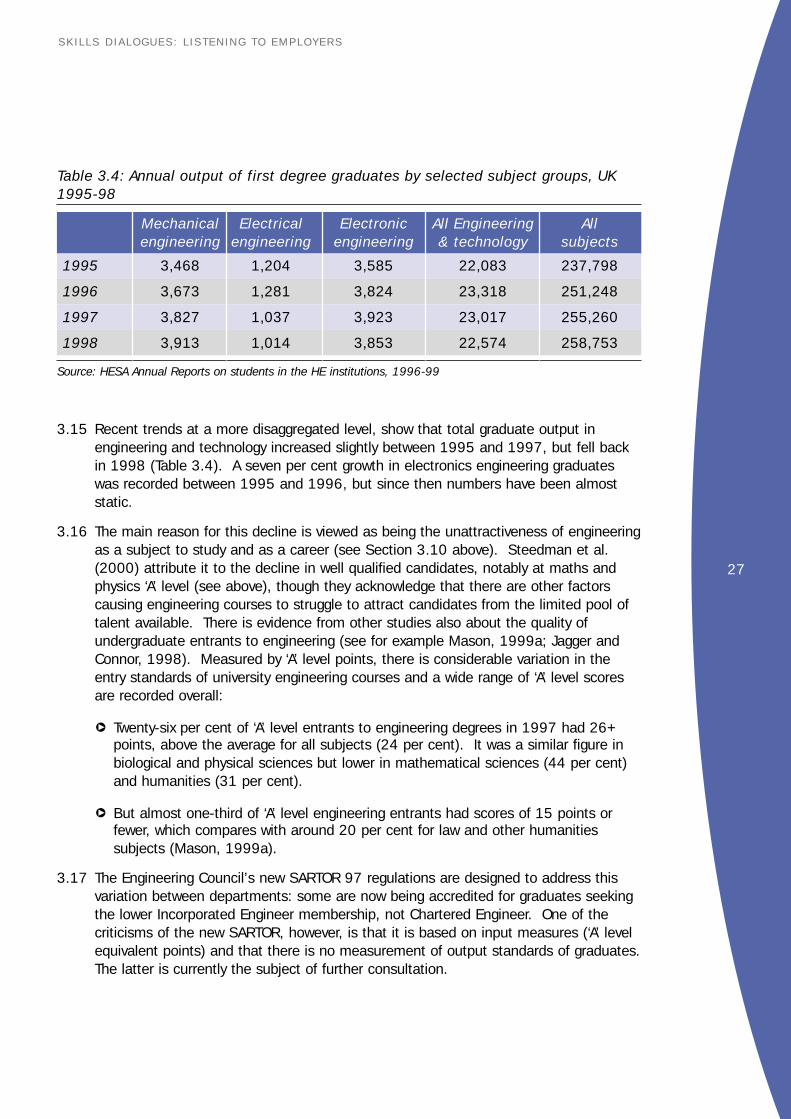
27
SKILLS DIALOGUES: L ISTENING TO EMPLOYERS
3.15 Recent trends at a more disaggregated level, show that total graduate output inengineering and technology increased slightly between 1995 and 1997, but fell backin 1998 (Table 3.4). A seven per cent growth in electronics engineering graduateswas recorded between 1995 and 1996, but since then numbers have been almoststatic.
3.16 The main reason for this decline is viewed as being the unattractiveness of engineeringas a subject to study and as a career (see Section 3.10 above). Steedman et al.(2000) attribute it to the decline in well qualified candidates, notably at maths andphysics ‘A’ level (see above), though they acknowledge that there are other factorscausing engineering courses to struggle to attract candidates from the limited pool oftalent available. There is evidence from other studies also about the quality ofundergraduate entrants to engineering (see for example Mason, 1999a; Jagger andConnor, 1998). Measured by ‘A’ level points, there is considerable variation in theentry standards of university engineering courses and a wide range of ‘A’ level scoresare recorded overall:
q Twenty-six per cent of ‘A’ level entrants to engineering degrees in 1997 had 26+points, above the average for all subjects (24 per cent). It was a similar figure inbiological and physical sciences but lower in mathematical sciences (44 per cent)and humanities (31 per cent).
q But almost one-third of ‘A’ level engineering entrants had scores of 15 points orfewer, which compares with around 20 per cent for law and other humanitiessubjects (Mason, 1999a).
3.17 The Engineering Council’s new SARTOR 97 regulations are designed to address thisvariation between departments: some are now being accredited for graduates seekingthe lower Incorporated Engineer membership, not Chartered Engineer. One of thecriticisms of the new SARTOR, however, is that it is based on input measures (‘A’ levelequivalent points) and that there is no measurement of output standards of graduates.The latter is currently the subject of further consultation.
Table 3.4: Annual output of first degree graduates by selected subject groups, UK1995-98
Mechanical Electrical Electronic All Engineering Allengineering engineering engineering & technology subjects
1995 3,468 1,204 3,585 22,083 237,798
1996 3,673 1,281 3,824 23,318 251,248
1997 3,827 1,037 3,923 23,017 255,260
1998 3,913 1,014 3,853 22,574 258,753
Source: HESA Annual Reports on students in the HE institutions, 1996-99
3.18 A number of studies of employers have highlighted criticisms about the quality of newgraduates, including engineering graduates, especially in terms of their lack ofpersonal transferable skills (AGR, 1999; Mason, 1999a). Employers report how manyengineering and technical graduates are deficient in communication and interpersonalskills, and an apparent ‘mismatch’ in the extent to which graduates are ‘work-ready’and understand how business operates. This partly reflects a greater expectation byemployers of new graduates’ work-relevant skills developed in their degree studies.
3.19 Unemployment of engineering graduates is slightly above the average, despite thereported high demand from employers, especially from electronics employers. In1998, unemployment of new engineering and technology graduates (HESA, 1999)stood at 6.6 per cent, slightly higher than the average of 5.7 per cent. Electronicsengineering graduates had a slightly higher unemployment figure, 8.4 per cent. It isnot clear why the unemployment rate for engineering is higher and it seems rather atodds with the recruitment experiences of many employers. Also, according to studiesof financial rates of returns for graduates, relative returns on engineering degrees roseby 1.5 per cent after inflation during the 1990s while average returns for all graduateswere not above inflation (Hansen and Vignoles, 1999.). One possible explanation mayrelate to the perceived poor quality of some engineering graduates who are more likelyto find difficulties obtaining employment. According to a DTI sponsored study(DTI/CEL/Barclays, 1999) unemployed engineering graduates tend to be older, achievea lower class of degree and are less likely to have relevant work experience.
3.20 There is a need (expressed by the Engineering Council and employers) to improve thework experience available to undergraduates, and also to newly graduating engineers.As a consequence of the lack of ‘quality’ work experience provision, some engineeringgraduates end up in non-engineering occupations, which can be interpreted as being aloss of some of their investment in education. Some effort is being made to addressthis through the development of Graduate Apprenticeships and transferable trainingloans. The DTI study also highlighted the lack of work experience among graduatesfrom pure science programmes (eg physics, maths).
3.21 One issue affecting the quality of undergraduate education is the difficulty whichuniversities experience in recruiting sufficient young lecturers and researchers inengineering. As shown earlier in Chapter 2, salaries are lower for engineers inteaching, and the low stipends for PhD students have also been criticised as beingunattractive.
Flows out3.22 An issue frequently raised by employers is that the best engineering graduates are
frequently ‘lost’ to the profession because of more attractive salary and careeropportunities offered by, for example, the City. Recent research by Mason (1999b)confirms this trend exists to some extent, especially the flow of electronics engineersinto IT areas. The First Destinations of Newly Qualified Graduates Statistics (HESA,1999) show that just over half of the engineering and technology graduates who enterUK employment, go into professional level occupations and a further 14 per cent gointo associate professional jobs. Thus a substantial number take up other jobs, inmanager and administrator occupations (12 per cent) and a range of lower-level jobs(19 per cent). These appear unrelated to engineering, though the available statistics
28
SKILLS DIALOGUES: L ISTENING TO EMPLOYERS

29
SKILLS DIALOGUES: L ISTENING TO EMPLOYERS
do not make it clear exactly what proportion is actually ‘lost’ to the profession. By discipline, mechanical engineers are more likely to take up professional leveloccupations than electronics engineers who are more likely to work in a wider range ofoccupations (HESA, 1999). By sector, there is little evidence of a ‘drain’ of engineersinto the financial sector per se - only three per cent of the engineering and technologygraduates in 1998 who entered UK employment went into financial activities.However, substantially more (26 per cent) joined the ‘business services’ sector (whichcovers property development, retailing, business and research activities) and 33 percent joined manufacturing industry. Others were spread in small numbers across arange of sectors. By discipline, electronics engineers and civil engineers were morelikely to join the business service sectors (around one-third of each did so) than otherengineers.
3.23 A specific type of flow is ‘brain drain’ - the leaving of highly qualified people to workabroad, often in the USA. This has been a periodic feature of the highly qualifiedscientific labour market, in particular specialists such as biotechnologists, particlephysicists, etc. In engineering it is less of an issue, though there have been well-publicised cases of individuals (eg in electronics engineering, robotics, etc.) who haveleft to work abroad, usually for considerably more money and better conditions. Thereis also increasing potential for mobility across Europe. The outflow to the USA isexpected to grow, in particular in shortage areas such as IT skills, as it has recentlyrelaxed immigration rules to help ease problems in the domestic labour market.
3.24 There is also a kind of ‘reverse brain drain’ as many EPSRC-funded research assistantposts at UK universities are filled by foreign nationals, from the EU, the Middle Eastand South East Asia. These often then stay on to develop long-term careers in theUK. This is because an academic career is less attractive to UK graduates who canearn more in the engineering industry or business services, and many engineeringpostgraduates do not stay in the academic sector.
3.25 Flows between regions within the UK are likely to be more of an issue, especially inthe relatively mobile professional level population. There have been problems in thepast relating to the North-South divide because of housing cost differentials.
Postgraduates3.26 Postgraduate education represents a small proportion of the total supply at the higher
level (8,000 students out of the total of 35,000 in engineering, mostly on MA andMSc courses or modules). But it has an important role in the advanced training ofengineers, in the maintenance of the research base in engineering, and also ininnovation through technology transfer.
3.27 Since the 1970s, the postgraduate sector has grown and changed substantially sothat it now encompasses a much greater variety of programmes and deliverymechanisms (Jagger and Connor, 1998). There is much more part-time provision andmore short courses specifically geared to the needs of industry, and fewer one yearfull-time MSc courses. The EPSRC, the main public funding source, plays a relativelysmall role now in funding postgraduate training of engineers and it has moved over theyears to providing more flexible resources to universities for training. An increasingvolume of support comes from industry through student sponsorship, especially for

part-time study and for individual modules taken by employees as part of ContinuingProfessional Development (CPD). The EPSRC’s newly introduced Masters TrainingPackages are designed to reflect the changing requirements of employers and giveindividual institutions/departments more flexibility in provision. This can includesupport to a range of full-time and part-time courses, and modular study, providedaccording to student and employer demand.
3.28 The EPSRC has also responded to demands, both at master and doctorate level, forpostgraduates to have more industrial experience and ‘broader’ skills, by introducing anew Engineering Doctorate (EngDoc) scheme. This is designed for people seeking acareer in engineering research management. Doctorate students are based in (andsponsored by) companies for four years, and the programme provides a blend ofresearch training and work experience. Established as a pilot programme in 1992 atfive centres, it has been expanded to ten centres since 1999, with 100 studentshipsper annum. Further expansion is planned from 2001, with up to 150 studentships at15 centres.
Training programmes3.29 In addition to issues around formal qualifications affecting the skill base of the sector,
there are other aspects of supply relating to work-based or company provided training.
Modern Apprenticeship3.30 Modern Apprenticeship (MA) was introduced to engineering in 1996. It is generally
regarded favourably, and seen as being more flexible than the traditionalapprenticeships, having potential for progression to higher qualifications. To date therehave been over 20,000 enrolments in the engineering manufacturing sector, whichrepresents around ten per cent of all MA starts. In addition, there have been150/200 places per annum in the engineering construction sector (managed byECITB). The majority of MA recruits are male and they tend to be younger (more aged16 and 17 years) than for the industry as a whole.
3.31 Numbers are perhaps not as high as EMTA and many in the engineering manufacturingindustry would wish (only around 7,000 new starts per year) and completion rates arealso quite low (32 per cent), though this figure is better than the average for allsectors. These compare with much higher student numbers in colleges (see above)and higher achievement rates of young people at Level 3 engineering qualifications. In engineering construction, the MA is organised differently, with apprentices being‘employed’ by the ECITB, and their training managed closely. Completion rates aremuch higher (at 86 per cent), but here, too, there are concerns about the calibre ofintake, despite large numbers of applicants across the country (c.2000).
3.32 Reasons for low take-up are related to a number of factors. The main one is likely tobe higher staying on rates at 16 combined with the poor image of engineering andwork-based learning. The higher calibre potential apprentices opt to take furtherqualifications (and are encouraged to do so by their schools and colleges). It is nothelped by the relatively poor (and in EMTA’s view often biased) careers advice andguidance on engineering and work-based training in manufacturing given to youngpeople (see above). An additional negative factor is the age restriction at 19 years forTEC funding. In the past, there may have been some antipathy towards MAs from
30
SKILLS DIALOGUES: L ISTENING TO EMPLOYERS

31
SKILLS DIALOGUES: L ISTENING TO EMPLOYERS
some employers because of their dislike of the NVQ framework (Senker, 1996) butthat is thought to be less of an issue today. However, some employers in theengineering construction industry are concerned about the lack of flexibility of the NVQframework, especially at Level 3 which is the required output for MAs. More breadthof competence, rather than the depth currently prescribed, would meet their needsbetter.
Other training3.33 There is a range of other training provided, both on and off-the-job, often done in a
more informal way (ie not leading to a qualification) and of short duration, which isalso a component of the supply side, and where there are issues affecting skilldeficiencies. It is not easy to find reliable statistics which show trends in the amountof training being given to different occupations in engineering. The recent PeopleSkills Scoreboard (EMTA/EEF, 1999) provides some benchmarking data but thecoverage is still relatively small, though growing (505 companies employing 236,000in 1999) and has existed for only two years. It suggests that:
q off-the-job training amounted to an average of £700 per employee, a figure thathas changed little since the previous year (when the first Scoreboard wasundertaken)
q training spend as a percentage of payroll was 2.7 per cent in 1999
q each employee received an average of 2.5 days per year off-the-job training, and1.56 days on-the-job training
q the more dynamic, more technically complex, sectors, such as aerospace have thehighest investment in training while the basic metals and metal products sectorshave the lowest.
3.34 The EMTA 1999 survey also provides information on training. Almost two-thirds ofemployers had funded or arranged training (off-the-job or on-the-job) for theiremployees in the previous year. Almost half of these were small site employers (5-24people). However, this does mean that half of the small companies in the engineeringsector are unlikely to be undertaking or funding any training, in contrast to the positionamong the large companies where nearly all were funding or providing training for theiremployees. Training occurred within all occupational groups but more companiesprovided training to managers, admin/clerical staff, craft workers andassembly/operator staff.
3.35 The statistics from the Labour Force Survey (LFS) also provide some evidence ontraining activity. For those in the relevant engineering occupations (see Table A3.1),the percentage receiving training in the previous 13 weeks ranged from 31 per cent ofthose in professional level occupations to just 13 per cent for those atassembler/operative level (Sep 99 LFS). On the whole, training activity declined asskill level declined. By sector, there were some variations, especially betweenmanufacturing and the public sector (or previously publicly owned). Considerablyhigher percentages of engineers working in public administration and defence and inthe public utilities (electricity, gas, water) reported being in receipt of training thanthose in the engineering manufacturing sector. This was evident for professional,

technician and craft level occupations. There was very little difference betweendifferent engineering sectors, however, with no evidence that hi-tech sectors such aselectronics were providing more training to their employees than more traditionalengineering sectors.
3.36 Looking over the last five years (1995-99), there is no discernible trend apparent inthe LFS data relating to training given to people in engineering occupations. Whilethere are slight variations from year to year, the percentages in the relevantoccupations receiving training from their employers have changed little over the period.There are no comparable data available prior to 1995.
3.37 One of the impacts of the economic cycle (highlighted in Chapter 1) has been thatduring times of recession, employers made cutbacks to training budgets, especially therelatively long craft and technician training. In aggregate these have had a profoundimpact on the supply of skills to the industry (Mason, 1999a). In particular theclosures of some large company training facilities during the 1980s recession, and thereluctance of some of the large companies to continue previous practice and train inexcess of their needs, have been a major disadvantage to small firms. Recentfinancial difficulties experienced by Engineering Group Training Schemes, which serveto provide training to small firms, have added to the problem. The evidence from theLFS relating to training differences between the public utilities, which on the whole aremore profitable than most of engineering manufacturing, add weight to the argumentwhich links attitudes towards training provision to profitability.32
SKILLS DIALOGUES: L ISTENING TO EMPLOYERS

33
SKILLS DIALOGUES: L ISTENING TO EMPLOYERS
Recruitment and Skill Deficiencies
4.1 This section explores the extent and nature of skill gaps, based on the availableevidence on recruitment difficulties and hard-to-fill vacancies, and employer viewsabout the proficiency of their workforce. Evidence is drawn mainly from the EMTAsurveys and a sector analysis of the national Employers’ Skills Survey (ESS), as theseare the two main sources of quantitative evidence on engineering skill problems. For this reason, this chapter is more focused on the engineering manufacturing sectorsthan some of the previous chapters. Various NTO Skills Foresight reports and anumber of other mainly qualitative studies have also been used.
Historical overview4.2 Traditionally, the main area of recruitment difficulty and skill shortage problems in
engineering has been in the craft and skilled trades. This is a recurrent theme in theliterature over many decades. It has been caused by a combination of events,including: employer decisions to cut back on expensive craft training during periods ofdeep recession (see end of previous chapter); the demise of the traditional craftapprentice training route; the closure of large company off-the-job training centreswhich specialised in foundation craft training; and the loss of many experienced andskilled craft workers to other sectors during the recessionary periods (to take up otherjobs and these people did not return when the climate improved). There have alsobeen shortages highlighted from time to time in the professional and technicaloccupations (eg electronics and software engineers in the first IT boom in the late1980s). In recent years, several reports have highlighted worsening problems atassociate professional level (ie technician engineer) (see for example DTI andEngineering Council). Another area giving concern is the lack of generic skills ofmanagers (see ECITB Skills Foresight report).
Recruitment and vacancies4.3 A range of different sources of information has been drawn on to provide an overall
picture of the level of recruitment and where difficulties are experienced. The varioussurveys ask different questions, have varying coverage and have been conducted atdifferent times. The timing of a survey is perhaps particularly crucial, as the level ofrecruitment and, very importantly, recruitment difficulties, is cyclical. There is,however, evidence that, given competitive pressures and the impact of technologicaland organisational change, recruitment difficulties are more deep-seated. Even attimes of relatively low recruitment, the filling of certain types of vacancy remainsproblematic.
4.4 The EMTA annual surveys collect information on the extent of recruitment inengineering manufacturing. In the year up to February 1998, 66 per cent ofestablishments had recruited some staff; 63 per cent in the following year. A labourmarket survey conducted for the rail industry in late 1998 reported 69 per cent ofrespondents recruiting in the previous year (RITC, 2000).
4.5 Another way of looking at recruitment is the number of employers with vacancies at aparticular point in time. The EMTA surveys found a slight decline in the proportion ofemployers with vacancies at the time of the survey; 21 per cent in 1999 compared to

34
SKILLS DIALOGUES: L ISTENING TO EMPLOYERS
28 per cent in 1998. The national Employers’ Skills Survey (ESS) showed that 27 percent of engineering manufacturing establishments had some vacancies at the time ofthe survey (late 1999), compared to 32 per cent of the whole sample (ie employersacross all sectors). This suggests a slightly lower level of recruitment activity inengineering, which is what would be expected given its greater economic difficulties(see Chapter 1). As expected, larger establishments were more likely to report havingvacancies and also larger numbers of vacant positions.
4.6 Employers in the ESS were more likely to be recruiting at craft and operative level thanin other occupational areas (Table A3.6 in Appendix 3), but this is linked to the higherlevels of employment in these occupations. When the number of vacancies is relatedto the number employed in each occupation, a fairly consistent level of recruitmentappears to be occurring across all occupations. Vacancies represented between oneand three per cent of employment in each occupation.
4.7 In total, an estimated 25,000 vacancies were reported by engineering employers inthe ESS (weighted data). This represents 1.8 per cent of total employment. This islower than the equivalent figure for all industries (3 per cent).
4.8 Electronics had similar vacancy levels overall compared with engineering as a whole,but at an occupational level more differences were evident:
q vacancies at engineering professional level represented 13 per cent of totalvacancies in electronics compared with 8 per cent in the rest of engineering
q vacancies for assembly/line workers represented 15 per cent of vacancies inelectronics compared with 10 per cent in the rest of engineering.
Recruitment difficulties4.9 Of greater interest for this Dialogue are the extent and nature of difficulties in
recruitment rather than vacancy levels. The majority of surveys use hard-to-fillvacancies as a proxy for this. While hard-to-fill vacancies are clearer to define than‘skill shortages’, there is still some ambiguity around their definition. For example, inthe ESS, employers reporting hard-to-fill vacancies were asked ‘broadly speaking howlong has a vacancy in each occupation lasted’, and a pattern of considerable variationemerged:
q Eight per cent of employers with hard-to-fill vacancies for professionals reportedthat they had taken up to one month to fill, 53 per cent one to three months and18 per cent more than six months.
q Sixteen per cent of employers reported that their hard-to-fill vacancies fortechnicians took up to one month to fill, 21 per cent more than six months.
q In craft occupations, 22 per cent of employers reported hard-to-fill vacancies takingup to one month and 30 per cent more than six months to fill.
q By contrast, the majority of operative vacancies (42 per cent) lasted up to onemonth and 11 per cent more than six months.
35
SKILLS DIALOGUES: L ISTENING TO EMPLOYERS
4.10 This does raise the issue of what is meant by hard-to-fill vacancies. Do they takelonger to fill than usual for a vacancy in that occupation; are they filled, but by peoplewho are not fully suitable; is extra effort required to fill these posts? Not all hard-to-fillvacancies are caused by skill related reasons (see below), they may be due to, forexample: the company’s location, pay being offered, employment conditions or workinghours.
Level of hard-to-fill vacancies4.11 Between the EMTA surveys in 1998 and 1999, there was a reduction in the proportion
of engineering employers reporting hard-to-fill vacancies, from 49 to 32 per cent. But according to ESS, a smaller proportion of engineering employers has hard-to-fillvacancies: 16 per cent. ESS was conducted later than the 1999 EMTA survey andthe lower level of hard-to-fill vacancies may indicate a further decline in the buoyancyof the sector1. Engineering employers reported almost 12,000 of their vacancies asbeing hard-to-fill, 46 per cent of all vacancies (ESS data).
4.12 The proportion of engineering employers reporting hard-to-fill vacancies in theengineering sector was the same as for all employers in the ESS; so too were therelative proportions of vacancies that were hard-to-fill ones. Similarly, comparingemployers in the 1999 EMTA survey (25+ employees) with all employers in the SkillNeeds in Britain Survey (IFF, 1998), shows similar levels of hard-to-fill vacancies. This suggests that recruitment difficulties overall are not any greater in engineeringcompared to other sectors. Nevertheless, having around one-sixth of engineeringemployers reporting hard-to-fill vacancies at a time when the sector is not particularlybuoyant is a serious issue and may suggest possibly more deep seated issues aroundthe availability of skills. Some of the establishments in the ESS case study researchreported that they were currently in the trough of a recession and that if demandpicked up to any significant extent, then they expected recruitment problems tosignificantly intensify.
Sector differences4.13 Employers in different sub-sectors of engineering are experiencing varying levels of
recruitment difficulties, and also different kinds of difficulty. The 1999 EMTA surveyfound that employers in the motor vehicles sector were most likely to have hard-to-fillvacancies, followed by mechanical equipment and electronics. A SBAC study,conducted in 1997 in the aerospace sector, reported 62 per cent of employers havinghard-to-fill vacancies over the past 12 months and 53 per cent at the time of thesurvey (SBAC, 1998). The ESS, however, showed very little difference betweenelectronics and the rest of engineering both in the proportion of employers reportinghard-to-fill vacancies and in the proportion of vacancies reported that were hard-to-fillones. This seems somewhat at odds with reports from electronics employers of thegreater difficulty being experienced there. However, more detailed analysis at anoccupational level shows a different picture.
Occupational differences4.14 Looking in more detail at the ESS analysis by occupation, a fairly consistent picture
emerges relating to differences between occupations (see Table 4.1). There are fouroccupations where the greatest difficulties are being experienced:1 The much higher proportion of employers reporting hard-to-fill vacancies in the EMTA survey might also be partly
attributable to differences in sampling and coverage between the two surveys.

q craft (65 per cent of vacancies are hard-to-fill)
q professional (53 per cent)
q technical/scientific (49 per cent)
q managers (43 per cent).
4.15 This generally reflects the findings of the EMTA surveys: the majority of hard-to-fillvacancies identified there were in technician, craft and professional occupations. The main difference is the lower level for managers. EMTA (1999) attribute this to thegreater likelihood of managers being recruited internally. However, both the EMTAsurvey and the ESS survey vary in their depth and coverage, which also may explainthe different responses.
4.16 Table 4.1 illustrates how different measures or indicators of the importance of hard-to-fill vacancies can provide varying pictures. For example, although a relatively highproportion of employers reported hard-to-fill vacancies in operative jobs, when theactual number of hard-to-fill vacancies is related to vacancies in these jobs, theyappear as less problematic. This suggests that problems in filling operative jobs aremore widespread across employers but are of lesser importance overall. This can alsobe seen in Table 4.2 where vacancies and hard-to-fill vacancies in each occupationare expressed as a proportion of the total for each category. This indicates the greaterproblems in craft and skilled trades in particular (25 per cent of all vacancies are incraft occupations but 35 per cent of hard-to-fill vacancies).
36
SKILLS DIALOGUES: L ISTENING TO EMPLOYERS
Table 4.1: Distribution of hard-to-fill vacancies by occupation in the engineeringsector
Employers with Base: number Hard-to-fill vacancies Base: numberhard-to-fill vacancies of employers as a percentage of of vacanciesas a percentage of with vacancies vacancies in each
those with vacancies occupationin each occupation
Managers and administrative 48 862 43 1,314
Professional 51 946 53 2,418
Technical and scientific 47 862 49 1,833
Clerical and secretarial 34 1,083 26 1,660
Craft and skilled operative 64 3,011 65 6,384
Sales 37 938 38 1,799
Operative and assembly 51 2,679 37 8,905
Other manual 44 343 35 1,003
Source: ESS, 1999
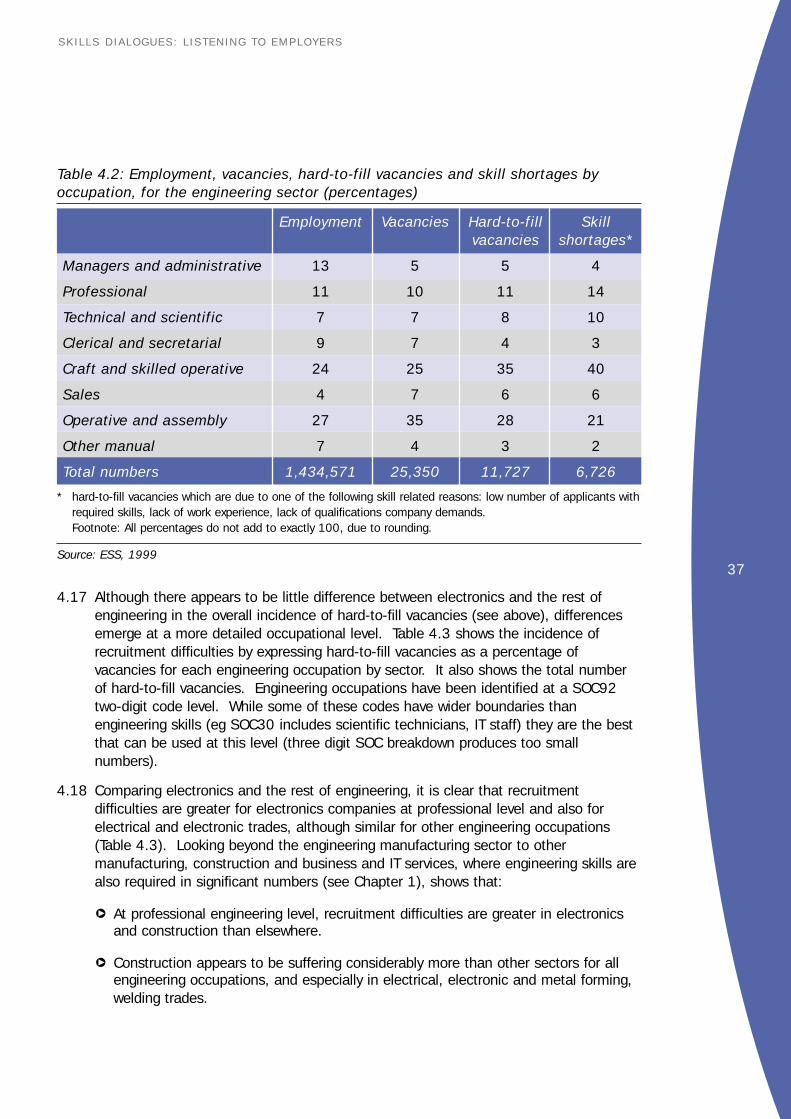
37
SKILLS DIALOGUES: L ISTENING TO EMPLOYERS
4.17 Although there appears to be little difference between electronics and the rest ofengineering in the overall incidence of hard-to-fill vacancies (see above), differencesemerge at a more detailed occupational level. Table 4.3 shows the incidence ofrecruitment difficulties by expressing hard-to-fill vacancies as a percentage ofvacancies for each engineering occupation by sector. It also shows the total numberof hard-to-fill vacancies. Engineering occupations have been identified at a SOC92two-digit code level. While some of these codes have wider boundaries thanengineering skills (eg SOC30 includes scientific technicians, IT staff) they are the bestthat can be used at this level (three digit SOC breakdown produces too smallnumbers).
4.18 Comparing electronics and the rest of engineering, it is clear that recruitmentdifficulties are greater for electronics companies at professional level and also forelectrical and electronic trades, although similar for other engineering occupations(Table 4.3). Looking beyond the engineering manufacturing sector to othermanufacturing, construction and business and IT services, where engineering skills arealso required in significant numbers (see Chapter 1), shows that:
q At professional engineering level, recruitment difficulties are greater in electronicsand construction than elsewhere.
q Construction appears to be suffering considerably more than other sectors for allengineering occupations, and especially in electrical, electronic and metal forming,welding trades.
Table 4.2: Employment, vacancies, hard-to-fill vacancies and skill shortages byoccupation, for the engineering sector (percentages)
Employment Vacancies Hard-to-fill Skillvacancies shortages*
Managers and administrative 13 5 5 4
Professional 11 10 11 14
Technical and scientific 7 7 8 10
Clerical and secretarial 9 7 4 3
Craft and skilled operative 24 25 35 40
Sales 4 7 6 6
Operative and assembly 27 35 28 21
Other manual 7 4 3 2
Total numbers 1,434,571 25,350 11,727 6,726
* hard-to-fill vacancies which are due to one of the following skill related reasons: low number of applicants withrequired skills, lack of work experience, lack of qualifications company demands.Footnote: All percentages do not add to exactly 100, due to rounding.
Source: ESS, 1999

q Other manufacturing and computer and business services also have more problemsin these craft trades than other occupations.
q Computer and business services appear to have more recruitment problems inassembly work, than at the professional engineering level.
4.19 It is worth noting however, although these other sectors require engineering skills, thelevel of hard-to-fill engineering vacancies compared to all of their hard-to-fill vacanciesis considerably lower than that for the engineering manufacturing sector.
Graduate recruitment difficulties4.20 There are frequently reported difficulties by graduate recruiters in engineering and
technical disciplines (see for example, AGR annual surveys). In a recent survey ofemployers of technical graduates covering a number of sectors (Mason, 1999c), 41 per cent of recent recruiters reported they had some difficulty in meeting theirrecruitment targets. Employers experiencing the most serious difficulties were inelectronics, with 20 per cent reporting it was very difficult to meet recruitment targetscompared with 11 per cent for all recruiters, and just 5 per cent in the financial sector.The main disciplines in shortage for most sectors were electronics, IT and computerscience. Similarly, the main areas of technical expertise lacking were software, IT andelectronics.
38
SKILLS DIALOGUES: L ISTENING TO EMPLOYERS
Table 4.3: Hard-to-fill vacancies as a percentage of vacancies in engineeringoccupations in different sectors
Electronics Rest of Other Computer & Constructionengineering manufacturing business
services
Professional - engineering technical61 49 45 47 62
(SOC21)
Assoc prof/scientific technicians50 49 35 56 69
(SOC30)
Metal machining, fitting etc. (SOC51) 57 51 66 58 67
Electrical/electronic trades (SOC52) 94 74 * 61 86
Metal forming, welding, and related* 75 60 * 88
trades (SOC53)
Metal working process operatives (SOC84) * 62 67 * *
Assemblers/ lineworkers (SOC85) 37 38 52 74 *
All of the above engineering occupations 58 56 53 55 82
Total number of hard-to-fill vacancies1,553 5,767 2,379 4,877 5,783
in these engineering occupations
Total number of hard-to-fill vacancies 2,650 9,286 22,885 32,181 19,223
* too small cell size, fewer than 250 vacancies (weighted)
Source: ESS, 1999

39
SKILLS DIALOGUES: L ISTENING TO EMPLOYERS
Skills related hard-to-fill vacancies4.21 A number of themes emerged when employers in the ESS were asked the reasons for
hard-to-fill vacancies, but the main one related to skill shortages. The three causesidentified as being more important to employers than the others (see Table A3.8 andTable 4.4) are:
q Low numbers of applicants with required skills (rather than qualifications) - thisaffects most occupations but especially professional and craft, over 50 per cent ofemployers (Table 4.4).
q Low numbers of applicants generally - again affecting most occupations (26-31 percent of employers).
q Lack of work experience - particularly for sales (40 per cent), and also managerand technician vacancies (one-third).
4.22 A fourth cause, lack of people with required qualifications, also featured as being ofimportance, but less so than the three identified above. Other causes were irregularand anti-social hours when recruiting managers, professionals and technicians, andattitudinal and motivational issues in relation to managers, sales and operativeapplicants (Table A3.8).
4.23 Taking the skill-related reasons together (ie low number of applicants with requiredskills, lack of work experience, and lack of qualifications employers demands) andapplying them to the hard-to-fill vacancies reported, gives greater emphasis to theproblems at professional, technician and craft occupations level (see Table 4.2).Three-quarters of hard-to-fill vacancies in professional and technician occupations, andalmost two-thirds in craft and skilled trades were attributed to ‘skills related reasons’.This compares with 42 per cent in operative and 44 per cent in clerical work.
Table 4.4: Main causes of hard-to fill vacancies by occupation, identified byengineering employers (percentage of employers citing each reason)
Low number Low number Lack of work Lack ofof people with of applicants experience qualificationsrequired skills generally
Managers 42 28 33 6
Professionals 56 26 21 13
Technician/ scientific 45 23 30 9
Craft 50 27 25 13
Operative 42 31 23 6
Source: ESS, 1999 (see more detail in Table A3.8)
4.24 The EMTA surveys also asked employers with recruitment difficulties about the reasonsfor these. Although it is difficult to make direct comparisons with the ESS results, theoverall themes are similar:
q the majority of EMTA survey respondents attributed their difficulties to a lack ofapplicants with the required qualifications and skills (53 per cent of those withrecruitment difficulties);
q this was followed by a general lack of applicants (24 per cent) and applicantslacking the necessary work experience (18 per cent).
4.25 The SBAC survey in aerospace (SBAC, 1998) also provides a similar picture, with themain reasons for recruitment difficulties being ‘not enough suitably skilled people,people lacking practical skills and a lack of people interested in the type of work’. This study also identified competition from other employers as a cause of recruitmentdifficulties.
4.26 ECITB in their Skills Foresight report (ECITB, 2000) identify the main areas of skillshortage in recruiting craftspeople to onshore sites, especially in key trades such aswelders and pipefitters. Offshore, the calibre of applicants to supervisory and othersenior positions is also reported as a concern, as is a shortage of highly specialisedengineering skills in head office functions.
Pay levels4.27 Changes in pay levels can also be used as an indicator of trends in the labour market
for certain occupations. In particular, a tightening of the labour market can beindicated by high wage inflation. There are various sources of information on paylevels of engineers, covering different groups of workers and different time periodsthough little of what is available supports the evidence of skill shortages amongdifferent engineering groups. It mainly highlights differences between electronics andother engineering sectors, and also shows the wide range of pay levels for differentoccupational groups, especially those in professional engineer jobs.
4.28 Taking the whole of engineering first, the level of pay settlements reported by EEFmember companies (covering a wide range of engineering activities, wider thanmanufacturing) remained relatively stable over the last six months (EEF, 2000). The three month moving average was at around 2.6 per cent (just above theGovernment inflation target of 2.5 per cent). There has been a high level of reportedpay freezes in engineering, averaging one in six of all settlements, which are thought toreflect the more difficult economic climate of the last 12 months or so.
4.29 Throughout the 1990s, pay settlements in engineering have been below those in thewider economy, and since 1996, the gap between pay settlements in engineering andthe services sector has grown.
4.30 Earnings data for different groups of engineering employees show that:
q The largest increases in the six month period (March-Sep 99) have been in theelectrical and electronic equipment sectors (based on NES data reported in EEF,2000), supporting other evidence of more shortage problems there.
40
SKILLS DIALOGUES: L ISTENING TO EMPLOYERS

41
SKILLS DIALOGUES: L ISTENING TO EMPLOYERS
q Among professional engineers, electrical engineers were the highest earning group(average gross including overtime, £32,000) followed by software and electronicengineers (£31,000), both occupations in high demand.
q Engineering directors received the highest increases in average earnings (ten percent), and their average salary was just over £66,000. The highest bonuspayments (as a percentage of salary) were also concentrated at the top end of thepay structure (REL, 1999).
q The Reward Group’s latest survey on the electronics industry showed that payawards averaged four per cent over the year to August 1999. The median salary ofdirectors was a little over £73,000, while supervisors/senior technicians earned£17,000. As might be expected the range of salaries was much greater at thehigher end of the pay structure.
q The Reward Group’s survey also showed that, at all levels, pay in the softwareindustry was higher than in the electronics components industry. The lowest payingelectronics sector was automatic test equipment. Directors working on computersoftware earned 28 per cent more on average than their colleagues in electronicscomponents.
q Analysis of data from the New Earnings Survey over time (1989-98) shows thatwage increase levels for engineering occupations have shown a similar pattern to alloccupations of initial relatively high increases in the 1989-91 period and thenrapidly falling away during the early 1990s with a slight recovery from 1995. There are variations between engineering occupations with, in some years, wagelevel increases generally above the all occupation average, and in others below it,but with no obvious trend patterns over time.
q Comparisons over time (1989-1999) with all occupations show that medianearnings of Chartered Engineers have grown at around the same rate as alloccupations but median earnings for Incorporated Engineers have grown moreslowly.
q The Engineering Council’s most recent survey in April 1999, showed a considerablesalary differential between Chartered Engineers (average salary of almost £45,000)and Incorporated Engineers (£33,000) and Engineering Technicians (£29,000).Earnings of Chartered Engineers however varied considerably by type of work withthe highest median pay reported by Directors/Chairmen (£54-56,000) and thelowest by those in teaching (£32,000), maintenance repair (£32,000) and designwork (£33,000). (Earnings here are basic salary plus bonuses).
q Compared to the salaries of other professional groups, salaries of CharteredEngineers are on a par with those of architects. Although salaries have beengrowing fast in the IT industry, average salaries of systems development people arestill below that of Chartered Engineers.
q The Institution of Electrical Engineers (IEE) Salary Survey shows that nearly aquarter of their members work in the electronics, computer andtelecommunications equipment industries but these are not the most highly paid

(total median remuneration £35,700). Pay was highest for members in thefinancial services sector (£50,000) though this represented only a tiny proportion ofmembers, and also high for those in broadcasting, telecommunications and postalservices where membership is greater (£44,000). It was lowest in the electricalmachinery and equipment sector (£31,000).
q Recent research on wage relativities of engineering and computer sciencegraduates shows that both groups earn a relatively large wage premium comparedto some other degree subjects (notably arts and humanities) but similar inmagnitude to that for physical science, and lower than the top earning subjects ofmedicine and mathematics (McIntosh, Hanson and Vignoles, 2000).
q But the same research also found clear evidence that the relative wage premiumfor an engineering/technology degree has increased during the 1990s at anapproximate rate of 1.5 per cent above the rate of inflation. As overall graduatewages have been keeping pace with inflation, and taking into consideration thereduction in supply of engineering graduates and continuing high demand(highlighted in earlier chapters), it suggests that market forces have been operating,improving the attractiveness of engineering in terms of earnings.
4.31 There are no separate data relating to pay trends for craftsmen/women which provideany evidence in support of shortages there.
Skills required4.32 The ESS goes further than simply identifying hard-to-fill vacancies, exploring in more
detail the skills which are hard to find. A number of points emerge from askingemployers which skills in particular they find hard to find in different occupations. Keyfindings are shown in Table 4.5 and the full analysis in Table A3.7 in Appendix A3.The main points are:
q The overriding evidence of a lack of technical and other practical skills, in almost alloccupations, but especially in the professional, technical, craft and operativeoccupations.
q A lack of advanced IT and software skills amongst technicians, and also managersand professionals. A lack of basic computer literacy amongst clerical and sales jobapplicants.
q The relative importance of deficiencies in communication skills, among managers,but also clerical and sales applicants; also, customer handling, numeracy andproblem solving skills.
q A shortage of managerial skills amongst applicants to managerial jobs.
q Applicants to sales jobs seem to lack the widest range of skills, including thosegenerally regarded as core to selling, for example, communication, technical andcustomer handling skills. Management, numeracy, problem solving and basiccomputer literacy were also reported to be lacking.
42
SKILLS DIALOGUES: L ISTENING TO EMPLOYERS

43
SKILLS DIALOGUES: L ISTENING TO EMPLOYERS
q A close association identified between the skills reported to be lacking in applicantsand those reported to be increasingly needed (see Section 2.27, Skill Trends).
4.33 Other studies look at the nature of hard-to-fill vacancies in different ways. Forexample, the SBAC 1998 study reported that hard-to-fill vacancies were almostexclusively in the engineering area, and the most commonly mentioned were: CNCmachinists, software engineers, skilled technicians and design engineers. The ESScase study report (Shackleton et al., 2000) concluded that the recruitment of shopfloor employees was largely not a problem, with recruitment being confined to locallabour markets. The main problems were at higher-level occupations, particularlyprofessional engineering graduates with four to five years commercial experience.There was a shortage of professional engineers with a combination of specifictechnical skills, commercial awareness, project management skills and other ‘soft’people management skills. It also found that the labour market was very tight forparticular engineering specialisms, including systems analysts and design engineers,creating high wage inflation. A small scale study of the electronics sector (covering 15companies) identified production technicians, GSM engineers, IT engineers and designengineers as being in short supply and constraining business (Senker and Brown,1998).
4.34 The available information on recruitment difficulties suggests both a number ofcommon themes, but also diversity across the sector. There is a general theme ofthere being a lack of suitably skilled and experienced people in the labour market.Although ‘generic skills’ or Key Skills are reported to be lacking, there is a consistentpicture across all occupations of a lack of technical and practical skills. While somestudies have started to analyse in greater detail the nature of these skill needs, moreinformation is needed from employers about what skills, of a specific technical natureand for which jobs, are really in short supply. It is in this respect that there is diversity;in the technical and practical skills needed by different occupations and in differentsectors. It should be acknowledged, however, that it can be difficult for employers todefine precisely what kind of technical skills are likely to be needed two or three years
Table 4.5: The skills that engineering employers find it most hard to find in manager,professional, technician and craft occupations (full details for all skills that are hardto find and all occupations shown in Table A3.7)
Managers Professional Technicians Craft
Advanced IT and software skills 14 15 30 6
Other technical and practical skills 59 47 74 73
Communication skills 36 8 9 11
Team working skills 23 8 6 15
Problem solving skills 29 15 14 16
Management skills 43 13 13 6
Source: ESS, 1999

ahead, especially in fast moving electronics and IT areas. This is why it is important toensure that people have a base of skills and underpinning knowledge so that they canreadily retrain to meet the needs of new technological developments.
Impact of recruitment difficulties4.35 Hard-to-fill vacancies across most occupations, not just in the most skilled and higher
level occupations, cause difficulties for engineering employers in relation to variousaspects of business (Table A3.9). Several important areas are identified from theESS:
q delays in developing new products
q loss of business or orders to competitors
q difficulties in meeting customer service objectives
q increased operating costs.
Very few employers reported that hard-to-fill vacancies had no impact.
4.36 The ESS engineering case study report (Shackleton et al., 2000) reported the crucialimportance of product innovation for long-term survival, and these data give somesupport to this. Delays in developing new products were reported as a consequenceof hard-to-fill vacancies in nearly all occupations by between 40 and 56 per cent ofemployers with such vacancies (see Table A3.9).
4.37 Recruitment problems among sales, professional and technical staff had an impact onmaintaining shares of business and competition: 51 per cent of employers reported animpact here of hard-to-fill sales vacancies, as did over 40 per cent in respect of hard-to-fill craft, technician and professional level vacancies. The growing importance ofmeeting customer requirements is also confirmed in the ESS. Over 50 per cent ofengineering employers reported an impact on meeting customer service objectives ofhaving hard-to-fill vacancies in manager, technician, craft and operative occupations.
4.38 The ESS data also confirm that vacancies at all levels are expected to impactnegatively on performance and competitiveness now and in the future. Similar themesarise as those highlighted above, though increased operating costs appear as moreimportant. This may reflect the current preoccupations of many businesses with pricecompetition, which is adversely affecting their business performance.
4.39 The consensus of opinion among electronics employers surveyed by Senker and Brown(1998) was that the UK remained a ‘favoured location’ for high technologyinvestments. However, there was growing concern that perceived shortages of labour,in particular a decline in the output from the education system and the quality ofengineers being produced, might compromise this. Multinationals might look more toinvesting in new plant in other countries rather than in the UK.
44
SKILLS DIALOGUES: L ISTENING TO EMPLOYERS

45
SKILLS DIALOGUES: L ISTENING TO EMPLOYERS
Skill gaps4.40 The other aspect of skill deficiencies is the existence of skill gaps amongst those
already employed by an organisation. Given the extent of change in technology,working practices and skill needs, it would be surprising if there were not someelement of deficiency amongst employees. Skill gaps in some establishments mightbe seen as a positive indicator of dynamism and change, as skill acquisition is unableto keep up with the speed of technological, product and organisational change.However, it is usually viewed more negatively as a limiting factor on businesses.
4.41 Just over one-quarter (26 per cent) of employers in the 1999 EMTA survey reportedthe existence of a gap between the skills of their current workforce and those neededto meet their objectives. This was slightly lower than in 1998 (32 per cent). Again,this is perhaps a surprisingly low percentage given the evidence from other studiesthat skill gaps have been having a detrimental effect on the engineering sector’ssuccess and progress. Those employers reporting a skills gap were asked in whichoccupations these gaps were having the greatest impact on the business:
q 43 per cent reported craft occupations
q 25 per cent operators and assemblers
q 23 per cent technicians
q 15 per cent professionals
q 11 per cent managers.
Table 4.6: Extent to which employees in each occupation are fully proficient at theirjob (row percentages, each row is based on establishments with that particularoccupation)
All Nearly all Over half Under half/very few
Managers 65 26 7 2
Professionals 69 25 5 2
Technical and scientific 65 27 6 2
Clerical 70 23 5 2
Craft and skilled operative 57 33 9 1
Sales 66 27 6 2
Operative 52 36 10 3
Other manual 6 26 7 2
Source: ESS, 1999
4.42 Again, these data need to be interpreted in the context of employment distribution. A smaller proportion of establishments employ professionals and technicians ratherthan craft and lower-skilled employees, and the concentrations of employment inspecific occupations vary, and therefore to some extent so does their perceivedimportance to an employer. It is not possible to look at this in the EMTA surveyanalysis. The evidence from other sources suggests that the importance given toproblems at craft and operator level may be overstated in the EMTA survey and thetechnician and professional problems understated. However, in the engineeringconstruction industry it is clear from the ECITB’s research that the main weaknessesare seen across a range of craft areas including welding and pipefitting, and in theflexibility of skills.
4.43 The ESS approaches this issue differently, looking at the extent to which employersthink that staff in each occupation are fully proficient. Generally high levels ofproficiency were reported amongst all occupational groups (Table 4.6). A lowerproportion of employers said that all their craft and operative employees wereproficient when compared with their other workers. The SBAC survey conducted in1997 in the aerospace sector found that 30 per cent of respondents believed that theskill levels of their employees were ‘medium to low’ and 25 per cent that the quality oftheir employees was ‘medium to low’ (SBAC, 1998).
4.44 It has been questioned whether managers are fully able to report the extent of skilldeficiencies, in particular amongst themselves. A circular situation can arise, wherebysome managers do not have the necessary skills and abilities both to take anorganisation forward and to identify skill gaps amongst their workforce. Indeed, theESS engineering case study report (Shackleton et al., 2000), concludes:
‘Nearly all the case studies recognised that they had skill deficiencies within theirorganisations but it was evident that certain of the case studies found it difficult toarticulate the extent of these gaps and the reasons why these skill gaps had arisen.... The fact that very few of the case studies identified that they were experiencingmanagement skill gaps is perhaps indicative of the fact that these crucial skill areasmay well remain unnoticed at the establishment level.’
4.45 When seeking evidence of specific skill shortages, the EMTA surveys illustrate theimportance of shortages in technical and engineering skills. Deficiencies in technicaland practical skills were most commonly reported in all engineering sub-sectors, whichsuggests a wide range of specific needs (see Table 4.7). Very few studies have reallyaddressed these sector specific needs. The 1999 survey did explore technicaldeficiencies in greater detail. The most commonly reported skill gaps were CNCmachine operations; mechanical engineering and CAD/CAM/CAE.
4.46 The ESS asked those respondents who did not report all or nearly all of their employeesas being fully proficient a series of questions to explore the nature and impact of thislack of proficiency (but, as Table 4.6 shows, the proportion of engineering employerswho were asked this question was very small). Nevertheless, some interesting pointsemerge relating to where there was a lack of proficiency overall (though it is notpossible to undertake a sectoral breakdown, as in Table 4.7, with these ESS data):
46
SKILLS DIALOGUES: L ISTENING TO EMPLOYERS

47
SKILLS DIALOGUES: L ISTENING TO EMPLOYERS
q A failure to train and develop staff: reported most frequently, and across nearlyall occupations. In particular it was reported as the most important cause of a lackof proficiency amongst managers, professionals, technical and scientific staff, sales,operative and other manual employees.
q The introduction of new products or services, new working practices andnew technologies: the next three commonly reported causes. These weregenerally important reasons for a lack of proficiency across all occupations but wereslightly less important amongst sales and other manual employees. Theintroduction of new technology was the most important reason amongst clericalemployees.
q Recruitment problems, poor labour retention, inability of workforce to keepup with change, and inability of older staff to acquire necessary knowledgeand skills: these factors were reported by between one-fifth and one-third ofemployers in each occupation.
Table 4.7: Areas of skill deficiency in existing workforce reported by engineeringemployers, analysed by sector (numbers in brackets are percentages ofestablishments reporting skill gaps)
Metal products 1. Practical skills (68) Electrical 1. Practical skills (55)2. Multi-skilled employees (41) engineering 2. Computer literacy (42)3. Skilled craftspeople (40) 3. Communication skills (39)4. Computer literacy (30) 4. Management skills (35)5. Communication skills (24) 5. Personal skills (32)6. Personal skills (23) 6. Skilled craftspeople (29)
Mechanical 1. Practical skills (63) Motor 1. Practical skills (67)engineering 2. Computer literacy (41) vehicles 2. Multi-skilled employees (44)
3. Communication skills (34) 3. Problem-solving skills (42)4. Management skills (29) 4=.Communication skills (41)5. Skilled craftspeople (26) 4=.Computer literacy6=.Personal skills (25) 4=.Personal skills (41)6=.Problem-solving skills (25)
Electronics 1. Practical skills (53) Aerospace 1. Practical skills (54)2. Computer literacy (39) 2=.Computer literacy (38)3. Communication skills (34) 2=.Problem-solving skills (38)4. Management skills (33) 4. Skilled craftspeople (35)5. Personal skills (32) 5. Management skills (32)6. Problem-solving skills (27) 6. Communication skills (29)
Source: Mason, 1999a derived from EMTA (1998, Table 6.4)

4.47 The types of skill deficiencies amongst existing employees were on the whole similar tothose found in relation to hard-to-fill vacancies. However, technical and practical skillswere reported to be lacking amongst specific occupations, rather than across theboard. They were most likely to be lacking amongst professional, technical, craft andoperative staff; those most closely involved in the design, innovation and productionprocesses. Also, employees across all occupations were reported to be lacking arange of generic skills. For example:
q Between one-third and half of employers thought that employees in eachoccupation lacked problem solving skills.
q Sixty per cent reported a lack of proficiency in management skills amongstmanagers. Between one-fifth and one-third reported a lack of management skillsin other occupations.
q Communication skills were thought to be lacking by 61 per cent amongstmanagers, 50 per cent amongst sales employees and between one-third and 47per cent in all other occupations.
q One-quarter reported a lack of literacy skills amongst operatives and one-fifthamongst other manual employees.
These internal skill deficiencies again include many of the skills which are reported tobe increasingly important amongst engineering employers.
4.48 Case studies and qualitative studies have explored these issues in greater depth, andsimilar themes emerge though rather more emphasis is generally put on the non-technical skill deficiencies than it is in the survey data. The ESS case study research(Shackleton et al., 2000) identified skill gaps relating mainly to intermediate/technician occupations, team leaders, management and professional occupations. At the intermediate/technician level, these ‘team leader’ skills included motivationalskills, communication skills, an ability to forward think and to think strategically. At theprofessional and managerial level, the skills gaps were associated with people who didnot have the required combination of technical and non-technical skills. In the non-technical skills area, skills identified were project management and peoplemanagement skills and possessing a rounded level of commercial awareness. Moreserious, possible emergent, skill gaps were seen as being senior management’s abilityto drive the business forward and transform business systems (eg manufacturingprocesses) for competitive advantage. Themes emerging from other studies include:
q improve communication skills, and develop leadership skills and changemanagement skills in the aerospace sector (SBAC, 2000); and
q project management, and a lack of leadership particularly, at high levels in headoffice companies in the engineering construction industry. This includes the inabilityof senior managers to recognise skill needs, weaknesses in generic management,and a failure to develop older engineers to get the best out of the available newtechnology (ECITB, 2000).
48
SKILLS DIALOGUES: L ISTENING TO EMPLOYERS
49
SKILLS DIALOGUES: L ISTENING TO EMPLOYERS
4.49 As in the recruitment problem area, there is relatively little detailed information on theprecise gaps in ‘technical and practical skills’. What evidence there is suggests thatthese vary by occupation, sector and individual employer. Interviews conducted for theWest Midlands Automotive Skills Taskforce do provide more detailed information on thenature of technical skills needed, although these relate only to one sub-sector. Theseincluded: assembly techniques; ergonomics; robotics; diagnosis; maintenance andrepair; spot welding; process and production management.
Impact of skill gaps4.50 The impact of skill gaps can be difficult to identify, and may not emerge for some time.
It can be relatively straightforward to identify deficiencies at production level, due todeadlines not being met, high levels of wastage etc. but other deficiencies are lesseasy to identify. Their impact might not be obvious until a company flounders, or losesmarket position. Furthermore, given the many pressures experienced by the industry,identifying the contribution of skill deficiencies is complex.
4.51 As with the impact of hard-to-fill vacancies, there were some differences between theimpact of internal skill deficiencies between occupations in the ESS. Whenengineering employers were asked about how a lack of proficiency in each occupationwas affecting the establishment, some themes emerged:
q Skill deficiencies were most commonly causing difficulties in meeting customerservice objectives, and this was caused by deficiencies in all occupations.
q Increased operating costs and delays in developing new services were the nextmost commonly reported impacts. Deficiencies amongst operatives were mostfrequently reported to be leading to increased operating costs.
q A loss of business or orders to competitors was being caused by between one-fifthand one-quarter of employers with deficiencies in most occupations. However, 38per cent with deficiencies in managers and 57 per cent in sales employeesreported this negative effect.
q Difficulties in meeting quality standards were reported by between one-quarter andone-third of employers experiencing deficiencies in each occupation.
4.52 Table 4.8 illustrates the possible future impact of skill deficiencies. These data suggest alesser impact than current deficiencies. However, the question was asked in a differentway, and employers might rationalise their response. Over four-fifths reported that noneof the possible impacts would occur as a result of skill deficiencies. Nevertheless, thedata in Table 4.8 do suggest a range of negative impacts on the performance of morethan half of engineering employers over the next few years. The anticipated impact ofskill deficiencies is slightly greater in engineering compared to all sectors in the economy.

Looking to the future4.53 Much of the data on recruitment difficulties and skill deficiencies groups ‘technical and
practical skills’ into one category. The 1999 EMTA study does begin to unpack this,however, the number of respondents becomes very low when this is done. It isidentifying the precise technical and practical skills which will be needed in the future,especially if, or as, different sub-sectors grow and decline. What is also clear from thedata reviewed is that the range of generic skills, identified to be of growing importance inChapter 2, will remain important.
50
SKILLS DIALOGUES: L ISTENING TO EMPLOYERS
Table 4.9: New or additional skills needed to move to higher quality product
Engineering (%)
Technical and practical skills (non-IT) 71
Team working skills 64
Management skills 56
Problem-solving 54
Customer handling 54
Communication skills 50
Basic computer literacy 43
Advanced IT or software skills 36
Numeracy skills 34
Literacy skills 33
Other 3
Weighted base 22,013
Source: ESS, 1999
Table 4.8: Impact of skill deficiencies over the next two or three years
Engineering (%) All employers (%)
Increased operating costs 33 26
Difficulties meeting customer service objectives 32 29
Loss of business or orders to competition 28 22
Delays developing new products or services 27 19
Difficulties introducing technological change 22 16
Difficulties meeting required quality standards 20 22
Difficulties meeting new working practices 20 18
Withdrawing from offering certain products or 14 11
services altogether
None of the above 43 49
Weighted base 30,545 533,572
Source: ESS, 1999

4.54 The ESS asked employers if they were about to implement new higher quality productareas or improve the quality of their existing operations. Just over one-quarter ofengineering employers reported plans to move to higher quality product areas. Theimplications of moving to higher quality product areas is that different skills will be needed,and respondents were asked which new or additional skills would be required to do this(Table 4.9).
4.55 Once again, the overriding importance of technical and practical skill emerges, althoughwe are unable to unpack the precise nature of these. However, Table 4.9 also illustrateswide ranging requirements for additional or new skills and reflects a number of themesidentified earlier in this report. In particular, additional or new teamworking, managerial,problem-solving, customer handling and communication skills will be required to enableemployers to improve quality.
4.56 Those with no plans to introduce higher quality product areas were asked if they had plansto achieve greater efficiency within their existing products. Table 4.10 reports the skillsneeded to achieve this greater efficiency. The pattern of need is very similar to thatillustrated in Table 4.9. However, technical and practical skills emerge as even moreimportant in increasing efficiency, while new or additional generic and management skillsare slightly less likely to be required.
51
SKILLS DIALOGUES: L ISTENING TO EMPLOYERS
Table 4.10: New or additional skills needed to achieve higher efficiency
%
Technical and practical skills (non-IT) 80
Team working skills 53
Problem solving 49
Customer handling 42
Management skills 40
Communication skills 36
Basic computer literacy 33
Numeracy skills 28
Literacy skills 25
Advanced IT or software skills 25
Foreign language skills 10
Other 5
Weighted base 29,065
Source: ESS, 1999

52
SKILLS DIALOGUES: L ISTENING TO EMPLOYERS
Appendix 1: Contributing Organisations
The following organisations contributed to the Dialogue Process in various ways:through providing specific labour market information, making available copies ofreports, giving their views on issues, participating in the seminar and commenting onthe draft report. The authors of this report are grateful for their valuable help andassistance in the project.
Advantage West Midlands
British Aerospace
Birmingham & Solihull TEC
Bolton Training Group
Business Link Birmingham
BMW Group
Brunel Training Group
Cambridge Econometrics
CSEU
Coventry and Warwickshire Chamber of Commerce
DTI
EdExcel
East Midlands Development Agency
Engineering Council
Engineering Employers Federation (EEF)
Engineering Construction Industry Training Board (ECITB)
EMTA
EPSRC
FEFC
Federation of Electronics Industries (FEI)
Frederick Wooley Ltd
Havering College
HESA
IMI

53
SKILLS DIALOGUES: L ISTENING TO EMPLOYERS
Institute for Employment Research, University of Warwick
Institute of Mechanical Engineers
ITNTO
Marconi Naval Systems
METCOM
National Federation of Engineering Colleges (NFEC)
North West Development Agency
nto tele.com
NTO National Council
One North East
PINTOG/Chemical Manufacturing and Processing
Rail Industry Training Council (RITC)
Rolls Royce Aerospace Group
South West RDA
Royal Academy of Engineering
Science, Engineering Maths and Technology Training Network
Skillset
Skills Unit, Department for Education and Employment
Society of Motor Manufacturers and Traders
ST Microelectronics Ltd
West Midlands Automotive Skills Taskforce
Wolverhampton Chamber & Business Link
54
SKILLS DIALOGUES: L ISTENING TO EMPLOYERS
Appendix 2: References and Data Sources
AGR (1999), Graduate Salaries and Vacancies Survey, 1999, Association of GraduateRecruiters, Warwick
Annual Employers Survey (AES), Office for National Statistics
Dearing R (1997), Higher Education in a learning Society, Report of the NCIHE, HMSO
Dench S (1999), Engineering Training Provision in Coventry and Warwickshire,Unpublished IES report to the Coventry and Warwickshire Chamber, 1999
DfEE (1998), The Learning age: Higher Education in the 21st century (Green paper),response to the Dearing Report, HMSO, London
DTI/CEL/Barclays (1999), Report on research on first destinations of 1998 graduates,DTI, London
Engineering Council (1998), Digest of Engineering Statistics 1998
Engineering Council (1999), Engineers for Britain: Digest of Engineering Statistics1999
Engineering Employers Federation (1997), A new millennium of learning forengineering, EEF, London
Engineering Employers Federation (1999), Engineering Trends, 3rd Quarter 1999, EEF,London
Engineering Employers Federation (2000), Engineering Trends, 4th Quarter 1999 and1st Quarter 2000, EEF, London
Engineering Employers Federation (2000), Introducing Engineering in Schools, EEF,London
ECITB (2000), Skills Foresight for the Engineering Construction Sector, 2000 (draft),Engineering Construction Training Board, Kings Langley
ECITB (1999), Engineering construction, Manpower requirement forecasts, EngineeringConstruction Training Board, Kings Langley
Employer Skills Survey (ESS), Special runs of the survey undertaken by IES as part of the dialogue project
EMTA/ADAPT (2000), Labour market Observatory sector reports, Engineering andMarine Training Authority (ADAPT project), (draft)
EMTA (1998a), Views of engineering as a career, Summary report, Engineering andMarine Training Authority/MORI
EMTA (1998b), Labour Market Survey of the Engineering Industry in Britain,Engineering and Marine Training Authority, Watford
EMTA (1999), Skills and Training Survey of the Engineering Industry in Britain,Engineering and Marine Training Authority, Watford
55
SKILLS DIALOGUES: L ISTENING TO EMPLOYERS
EMTA/EEF (1999), The 1999 People Skills Scoreboard for Engineering, CompanyReporting Limited, Edinburgh (also 1998 report)
FEFC (2000), Engineering Programme Review, Further Education Funding Council,Coventry
Hanson K, Vignole A (1999), International Comparisons of HE Entrance Requirementsfor Computer science and engineering graduates, London School of Economics,Centre for Economic Performance
HESA (1999, annual) First Destinations of Students leaving Higher EducationInstitutions, 1997/98, Higher Education Statistics Agency, Cheltenham
HESA (annual) Students in Higher Education Institutions, 1994/95, 1995/96,1996/97 and 1997/98, Higher Education Statistics Agency, Cheltenham
Hogarth T, Bosworth D, Wilson R and Shury J (2000), The extent, causes, andimplications of skill deficiencies, Institute for Employment Research
IDS (1999) Management Pay Reviews (Nos 225 Nov, 219 May, 226 Dec 1999),Income Data Services, London
IEE (1999) Salary Survey, Institution of Electrical Engineers, January 1999.
IFF (1998), Skill Needs in Britain 1998, IFF Research, London
Institute for Employment Research (IER) - Datapack provided by IER as part of thedialogue process containing detailed breakdowns of projections and historicaltrends relating to the engineering manufacture sector.
ITCE Skills Strategy Group (1999), Skill needs of the electronics sector, first report ofthe Information Technology, Communications and Electronics Skills Strategy Group,National Skills Task Force
ITNTO (1999), Skills 99: IT Skills Summary, Information Technology National TrainingOrganisation, London
Jagger N, Connor H (1998), Employers’ views on the provision of postgraduateengineers and material scientists, IES report to the EPSRC
Labour Force Survey (LFS), UK quarterly, Office for National Statistics
Mason G (1995), The new graduate supply-shock: recruitment and utilisation ofgraduates in British industry, NIESR report Series 9
Mason G (1999a), Engineering Skills Formation in Britain: cyclical and structuralissues, Research Paper 7 for National Skills Task Force
Mason G (1999b), Skills supply and demand in the ITCE industries, report to the ITCESkills Strategy Group, NIESR, London
Mason G (1999c), The Labour market for engineering, science and IT graduates: aretheir mismatches between supply and demand? DfEE Research Brief 112

McIntosh S, Hanson K, Vignoles A (2000), Relative Wages of Computer Scientists andEngineers in the UK Graduate Labour Market, London School of Economics andPolitical Science (forthcoming)
National Information System for Vocational Qualifications (NISVQ)
OSCEng (1998), Occupational Map of the Engineering Sector, Occupational StandardsCouncil for Engineering, London
Prais (1989), Qualified manpower in engineering: Britain and other advancedcountries, National Institute Economic review, 127, pp. 76-83
PRIME (1998), Automotive Manufacturers Skills Study (a survey of the skill needs offour motor vehicle manufacturers in the West Midlands). Survey sponsored byBirmingham TEC and the DTI
REL (1999) ‘Salary Survey of Engineers’, Remuneration Economics, July 1999
Reward Group (1999) Electronics Industry Rewards, The Reward Group, August 1999
RITC (2000), Skills for the future in the railway industry (Skills Foresight Report, draft2000)
SBAC (1998), ‘People Management in Aerospace’, The Competitiveness Challenge,Report Summary, SBAC, London
SBAC (2000), The Competitiveness Challenge: The UK aerospace people managementaudit 2000, Society of British Aerospace Companies, London
Senker P (1996) ‘The Development and Implementation of National VocationalQualifications: an Engineering Case Study’ New Technology Work and Employment,11(2)
Senker P and Brown R (1999), Survey of Engineering Skills Shortages in theElectronics Sector, IPRA Report to DTI
Shackleton R, Davis C, Buckley T, Hogarth T (2000), Engineering sector case studyreport, (draft report to DfEE)
Sharp C, Hutchison D, Davis C, Keys W (1996), The Take-up of AdvancedMathematics and Science Courses. Prepared for the School Curriculum andAssessment Authority by the National Foundation for Education Research.
Steedman H, Vignoles A, Bruniaux C, Wagner K and Hansen K (2000), InternationalComparisons of HE Quality: Engineering and Computer Science, Summary Report,London School of Economics, Centre for Economic Performance
UCAS (1999 annual), Annual Report and Statistical Tables, Universities and CollegesAdmissions Service
Wilson R (2000), Projections of Occupations and Qualifications, 1999/2000. DfEE/Institute of Employment Research, University of Warwick
56
SKILLS DIALOGUES: L ISTENING TO EMPLOYERS
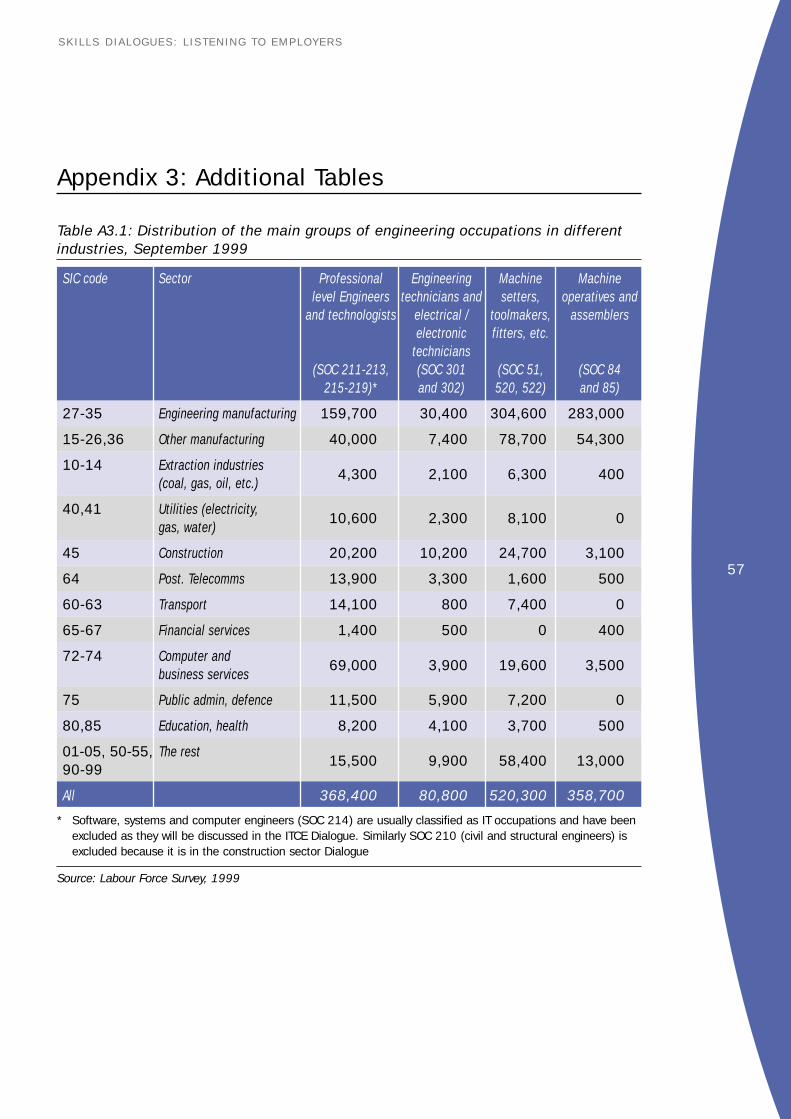
57
SKILLS DIALOGUES: L ISTENING TO EMPLOYERS
Appendix 3: Additional Tables
Table A3.1: Distribution of the main groups of engineering occupations in differentindustries, September 1999
SIC code Sector Professional Engineering Machine Machinelevel Engineers technicians and setters, operatives and
and technologists electrical / toolmakers, assemblerselectronic fitters, etc.
technicians(SOC 211-213, (SOC 301 (SOC 51, (SOC 84
215-219)* and 302) 520, 522) and 85)
27-35 Engineering manufacturing 159,700 30,400 304,600 283,000
15-26,36 Other manufacturing 40,000 7,400 78,700 54,300
10-14 Extraction industries4,300 2,100 6,300 400
(coal, gas, oil, etc.)
40,41 Utilities (electricity, 10,600 2,300 8,100 0
gas, water)
45 Construction 20,200 10,200 24,700 3,100
64 Post. Telecomms 13,900 3,300 1,600 500
60-63 Transport 14,100 800 7,400 0
65-67 Financial services 1,400 500 0 400
72-74 Computer and69,000 3,900 19,600 3,500
business services
75 Public admin, defence 11,500 5,900 7,200 0
80,85 Education, health 8,200 4,100 3,700 500
01-05, 50-55, The rest15,500 9,900 58,400 13,000
90-99
All 368,400 80,800 520,300 358,700
* Software, systems and computer engineers (SOC 214) are usually classified as IT occupations and have beenexcluded as they will be discussed in the ITCE Dialogue. Similarly SOC 210 (civil and structural engineers) isexcluded because it is in the construction sector Dialogue
Source: Labour Force Survey, 1999
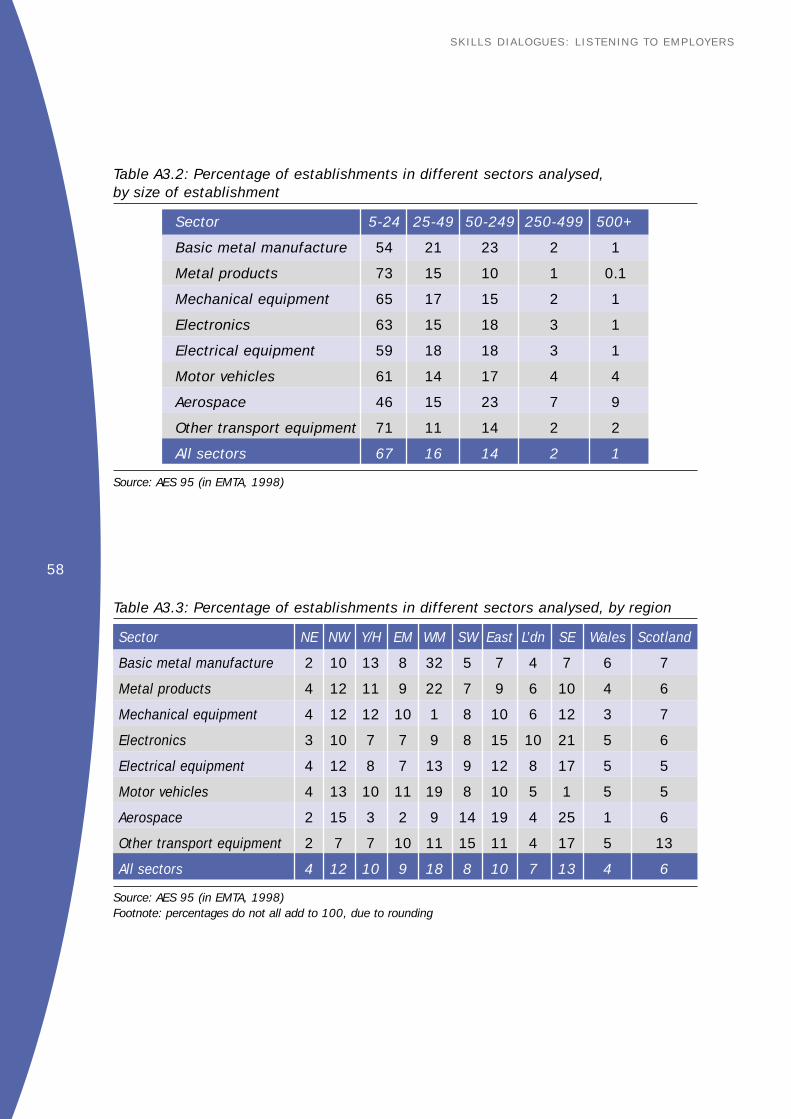
58
SKILLS DIALOGUES: L ISTENING TO EMPLOYERS
Table A3.2: Percentage of establishments in different sectors analysed, by size of establishment
Sector 5-24 25-49 50-249 250-499 500+
Basic metal manufacture 54 21 23 2 1
Metal products 73 15 10 1 0.1
Mechanical equipment 65 17 15 2 1
Electronics 63 15 18 3 1
Electrical equipment 59 18 18 3 1
Motor vehicles 61 14 17 4 4
Aerospace 46 15 23 7 9
Other transport equipment 71 11 14 2 2
All sectors 67 16 14 2 1
Source: AES 95 (in EMTA, 1998)
Table A3.3: Percentage of establishments in different sectors analysed, by region
Sector NE NW Y/H EM WM SW East L’dn SE Wales Scotland
Basic metal manufacture 2 10 13 8 32 5 7 4 7 6 7
Metal products 4 12 11 9 22 7 9 6 10 4 6
Mechanical equipment 4 12 12 10 1 8 10 6 12 3 7
Electronics 3 10 7 7 9 8 15 10 21 5 6
Electrical equipment 4 12 8 7 13 9 12 8 17 5 5
Motor vehicles 4 13 10 11 19 8 10 5 1 5 5
Aerospace 2 15 3 2 9 14 19 4 25 1 6
Other transport equipment 2 7 7 10 11 15 11 4 17 5 13
All sectors 4 12 10 9 18 8 10 7 13 4 6
Source: AES 95 (in EMTA, 1998)Footnote: percentages do not all add to 100, due to rounding

59
SKILLS DIALOGUES: L ISTENING TO EMPLOYERS
Table A3.4: Engineering employment trends in each English region (thousands)
Years London SE East SW WM EM Y+H NW M’side NE
1971 389.6 411.5 279.7 201.3 578.6 219.4 240.4 307.6 100.9 165.4
1981 251.7 357.7 258.4 200.0 424.2 197.0 190.3 238.4 61.9 140.7
1991 117.5 250.6 194.3 160.9 322.2 146.8 150.9 185.8 40.7 83.2
1995 88.1 225.5 169.4 151.9 303.6 141.2 139.2 167.1 31.2 75.6
1998 85.4 237.9 178.8 166.4 305.4 149.9 147.6 167.6 31.0 83.3
2004 66.3 208.8 154.3 157.7 263.4 127.9 133.3 142.2 32.3 72.5
2010 55.0 193.4 139.1 154.2 246.0 119.3 129.8 127.8 34.6 70.9
Source: IER Projections, 2000
Table A3.5: Engineering employment trends in UK countries
Years Wales Scotland N Ireland England
1971 125.7 265.4 49.2 2894.4
1981 104.5 197.1 40.0 2320.3
1991 86.1 149.8 32.6 1652.9
1995 91.0 140.3 33.4 1492.8
1998 94.5 140.8 35.6 1553.2
2004 85.1 120.6 33.9 1358.7
2010 79.0 108.3 31.8 1270.3
Source: IER Projections, 2000

60
SKILLS DIALOGUES: L ISTENING TO EMPLOYERS
Table A3.6: Distribution of vacancies by occupation
Occupation Employers with vacancies in each Weighted baseoccupation, as a percentage of (ie number of employers
those employing each occupation employing each occupation)
Managers and administrative 3 30,134
Professional 5 15,166
Technical and scientific 6 11,421
Clerical and secretarial 4 22,991
Craft and skilled operative 12 20,610
Personal service 1 1,467
Sales 6 9,451
Operative and assembly 14 13,871
Other manual 3 9,321
Source: ESS, 1999
Table A3.7: The skills that employers find it hard to find in different occupations
Managers Professional Technicians Clerical Craft Sales Operative Other manual
Basic computer literacy 3 4 11 25 4 21 6 -
Advanced IT and 14 15 30 8 6 3 5 -
software skills
Other technical and 59 47 74 29 73 43 62 49
practical skills
Communication skills 36 8 9 28 11 34 12 -
Customer handling skills 16 10 9 14 4 23 1 -
Team working skills 23 8 6 5 15 17 14 -
Foreign language skills 14 4 3 1 2 15 - -
Problem solving skills 29 15 14 6 16 16 14 -
Management skills 43 13 13 2 6 23 8 -
Numeracy skills 11 2 8 16 9 12 11 8
Literacy skills 11 - 2 9 10 3 6 8
Other 3 4 8 10 15 12 13 1
No specific skills 2 10 2 4 3 1 4 7
Don’t know 18 22 14 23 9 8 18 39
Weighted base 408 481 409 369 1,913 350 1,368 149
Source: ESS, 1999

61
SKILLS DIALOGUES: L ISTENING TO EMPLOYERS
Table A3.8: Causes identified by employers of hard-to-fill vacancies by occupation
Managers Professional Technicians Clerical Craft Sales Operative Other manual
Too much competition9 6 14 6 13 10 15 3
from other employers
Not enough people interested19 7 7 11 26 13 34 48
in this type of job
Company does not pay enough 6 6 9 16 11 12 13 9
Low number of people42 56 45 38 50 42 40 26
with required skills
Low number of applicantswith required attitude, 18 8 8 17 14 23 20 11motivation or personality
Low number of applicants28 26 23 24 27 18 31 27
generally
Lack of work experience 33 21 30 7 25 40 23 12
Lack of qualifications 6 13 9 2 13 13 6 -
Company location 3 4 4 5 <1 2 3 13
Irregular/anti-social hours 14 14 11 3 6 4 7 -
Unattractive conditions6 1 5 7 1 1 3 -
of work
Other - - - - 2 - - -
Don’t know - 10 9 14 5 9 3 14
Weighted base 408 481 409 369 1,913 350 1,368 149
Source: ESS, 1999

62
SKILLS DIALOGUES: L ISTENING TO EMPLOYERS
Table A3.9: Impact of recruitment difficulties in different occupations
Managers Professional Technicians Clerical Craft Sales Operative Othermanual
Loss of business or24 40 43 11 43 51 33 45
orders to competitors
Delays in new product42 56 56 20 46 42 45 40
developing
Withdrawal from2 23 11 4 19 12 16 38
certain markets
Difficulties in meetingcustomer service 51 42 56 25 60 37 63 38objectives
Difficulties meeting30 25 22 16 24 10 21 10
required quality standards
Increased operating costs 33 37 35 35 53 32 55 55
Difficulties introducing28 27 33 20 26 20 21 33
technological change
Difficulties introducing35 18 19 17 23 13 22 44
new working practices
None of these 2 1 2 - 1 - <1 -
Don’t know 10 9 12 49 9 15 11 34
Weighted base 408 481 409 369 1,913 804 1,368 149
Source: ESS, 1999

63
SKILLS DIALOGUES: L ISTENING TO EMPLOYERS