an analysis of cropland carbon sequestration estimates for north central monana
TRANSCRIPT

Climatic Change (2011) 108:301–331DOI 10.1007/s10584-010-0009-1
An analysis of cropland carbon sequestration estimatesfor North Central Monana
J. D. Watts · R. L. Lawrence · P. Miller ·C. Montagne
Received: 9 March 2009 / Accepted: 4 November 2010 / Published online: 5 February 2011© Springer Science+Business Media B.V. 2011
Abstract A pilot cropland carbon sequestration program within north centralMontana has allowed farmers to receive carbon credit for management adjustmentsassociated with changing from tillage-based agricultural systems to no-till. Carboncredit can also be obtained by adopting conservation reserve, where cropland isplanted into perennial vegetation. Summer fallowing is also considered within thecrediting process as credit is not given in years that a field is left un-vegetated. Thecarbon sequestration program has been advocated as a means to mitigate climatechange while providing an added source of income for Montana farmers. Thereis lack of data, however, pertaining to the percentage of lands within this regionthat have not converted to no-till management, lands under certain crop intensities(e.g. those that are cropped every growing season vs. those that use a fallow-crop-fallow system), or cropland that have converted to perennial vegetation outsideof the popular Conservation Reserve Program. Data is also sparse concerning theamount of soil organic carbon that might be sequestered given a conversion to no-till or conservation reserve. This study established regional percentage estimates ofcropland under no-till, various degrees of crop intensity, and conservation reservewithin north central Montana. Literature-based carbon sequestration estimates wereused to generate carbon gain data associated with the conversation to no-till and toconservation reserve. These estimates were then applied to the area-based croplandstatistics to estimate potential regional carbon sequestration associated with thesemanagement changes.
J. D. Watts (B)Department of Forestry, University of Montana, NTSG, Rm. 424, 32 Campus Drive,Missoula, MT 59803, USAe-mail: [email protected]
R. L. Lawrence · P. Miller · C. MontagneDepartment of Land Resources and Environmental Science,Montana State University, Bozeman, MT 59717, USA
R. L. Lawrencee-mail: [email protected]

302 Climatic Change (2011) 108:301–331
1 Introduction
Increased carbon mitigation efforts have arisen in response to global climate change.Terrestrial-based mitigation presents a practical and more immediate approach tocarbon (C) capture and storage, given the existing limitations to geologic-basedsequestration (Schrag 2007; Bachu 2008; Figueroa et al. 2008). Terrestrial seques-tration utilizes plant photosynthesisto remove existing carbon dioxide (CO2) fromthe atmosphere and to store the captured C within plant molecules. Afforestationand management changes within existing forests and rangeland have been advocatedas possible options for increased C storage (Turner et al. 1995; Schuman et al.2002). Cropland soils have also received considerable attention, influenced by itslarge global expanse (recently estimated at 1.53 billion-ha by Biradar et al. 2009)and documented losses in soil C due to cultivation (Lal et al. 1995). The potentialfor increased C storage within cropland soils has been proposed, primarily throughchanges in tillage management, cropping intensity, and the conversion of croplandsto perennial vegetation (Lal et al. 1998; Post and Kwon 2000; West and Post 2002).
1.1 Cropland C sequestration potential
Soils have long been recognized as important C sinks (Schlesinger 1977). Theglobal soil pool is estimated to hold 2,500 Gt C (1 Gt = 1 billion tonnes), 3.3times the amount of atmospheric C (Lal 2004). Cropland soils within the UnitedStates are reported to hold 2.7 Gt C (Houghton et al. 1999; Houghton and Hackler2000), an estimate reflecting cropland C loss after years of tillage and summerfallowing. Tillage practices incorporate mechanical disturbance for surface residuemanagement, weed control, and to prepare the soil for planting. Summer fallowrefers to the practice of leaving a field unvegetated during a growing season (weedand volunteer crop growth is controlled through tillage and herbicide applicationwithin traditional systems, while herbicide is solely used in no-till systems) and hastraditionally been implemented in non-irrigated croplands to build up soil moisturein the root zone for the subsequent crop.
The soil organic C (SOC) cycle is a complex system of input, storage, and release.Sequestration potential is largely controlled by climate, soil organisms, parent mate-rial, topography, and time (Schimel et al. 1994; Post et al. 2004). Land managementalso influences SOC flux. Cropland management techniques that facilitate the inputof organic materials into the soil and/or reduce decomposition rates serve to increaseSOC. Recent increases in cropland C storage have been attributed to managementchanges associated with the conversion from traditional, more intensive, tillagesystems to conservation tillage practices such as no-till (NT) and the conversion ofcropland into perennial plant cover (Eve et al. 2002). Increased crop intensity, orthe reduction of fallow, has also been advocated as a management change that couldresult in added soil C (Halvorson et al. 2002; Sherrod et al. 2003).
NT systems seed directly into the previous crop stubble and can disturb nomore than 15% (pre-2008 definitions have allowed for up to 25% disturbance) ofthe soil surface (NRCS 2008). Crop intensity is the inverse proportion of growingseasons that a field is summer fallowed instead of under live vegetation (cropped).

Climatic Change (2011) 108:301–331 303
Incentives to convert cropland into perennial grass within the United States havebeen provided primarily by the Conservation Reserve Program (CRP). The CRPprogram is administered by the US Natural Resource Conservation Service (NRCS)and provides monetary support to farmers who voluntarily convert degraded crop-land fields into perennial vegetative cover. Fields are required to remain withinthe CRP for ten to 15 years; managed grazing is allowed only once every three orfive years, depending on local CRP guidelines, and managed haying might also bepermitted as deemed appropriate by state-level administration (USDA-FSA 2007,2009). Incentives for the conversion of cropland to perennial grass outside of theCRP might exist but have not been addressed within published literature. For thepurposes of this study, we refer to croplands having been converted, for any reason,to perennial vegetation (mainly grass and grass/legume in north central Montana)as being under Conservation Reserve (CR), as distinguished from the more narrowCRP. We include the term “reserve” as these lands might at some point be convertedback to cropland after a period of rest from cultivation.
The amount of SOC that might be sequestered through changes in tillage, cropintensity, and the adoption of CR, varies greatly and can be area-specific. Esti-mated sequestration rates for the conversion from traditional tillage to conservationtillage management (mulch till, ridge till, NT, etc.) have ranged from 300–600 kgC ha−1 year−1 within the US Great Plains (Follett and McConkey 2000) to 100–300 kg C ha−1 year−1 in the Canadian prairies (McConkey et al. 1999). Researchhas shown that C sequestration potential is often greater in soils with higher Cdepletion and that storage amounts are finite and will increase until reaching systemequilibrium (West and Six 2007). A lower C sequestration potential might occurwithin cropping systems converting from more minimal forms of tillage to NT than insystems with a prior history of traditional, high disturbance, tillage. Minimum-tillage(MT) systems are not well defined but are generally considered to fall somewherebetween traditional tillage and NT systems in the amount of surface disturbance andcrop residue existing within the system. Implements used within MT systems mightinclude tandem disks, chisel plows, and field cultivators, but exclude moldboardplows. Sequestration rates for systems converting from MT to NT have not beenwell established within published literature.
Increased crop intensity reduces the amount of time that a field is under fallowduring the growing season. Active vegetation provides essential, C-rich, organicresidues into the soil system that offset C loss due to microbial activity and erosion(Potter et al. 1997; Staben et al. 1997; Paustian et al. 2000; Halvorson et al. 2002;Jarecki and Lal 2003). Residue inputs are trivial (i.e., weeds or volunteer crop)during fallow periods and a net system loss of SOC might result if the C accumulatedduring alternate cropped years is not substantial enough to mitigate for C losses. Thedegree of crop intensity incorporated within dryland settings is largely dependent onannual precipitation. Farmers in areas of low precipitation might be hesitant to plantcrops in two subsequent years as the soil moisture content might not be adequate forsupporting an economical harvest in the second year.
C accumulation following the conversion to grassland-based CR is often variableand has ranged from 0 to >400 kg ha−1 year−1 (Uri 2001; McLauchlan 2006). Higherreported sequestration rates have been attributed to soil moisture availability (Uri2001) and adequate nitrogen levels (Baer et al. 2000). The establishment of legumes

304 Climatic Change (2011) 108:301–331
in systems converted to perennial vegetation can help to increase soil nitrogenand subsequent SOC. One Wyoming study reported that levels of nitrogen andlabile SOC more rapidly increased in CRP fields where established legumes werepresent (Robles and Burke 1997). Alfalfa has been widely introduced into Montanaperennial systems due to its recognized quality as wildlife and cattle forage. A reviewof CRP lands in eastern Montana reported alfalfa to be highly competitive with warmand cool season grasses within the region (Jacobs and Nadwornick 2008), and isfrequently required as a component species.
1.2 C credits and regional sequestration potential
The US Department of Energy has established regional partnerships, includingthe Big Sky Carbon Sequestration Partnership (BSCSP), to investigate possibleways to offset anthropogenically produced CO2. A BSCSP-sponsored program, inconjunction with the National Carbon Offset Coalition (NCOC 2008), has promotedthe development of cropland-based C offset credits within north central Montanaand adjacent states (Young 2003; Capalbo 2005). Land owners enrolled within theprogram are paid on a per-area basis for the implementation of practices such asNT and grassland-based CR, according to C sequestration standards establishedby the Chicago Climate Exchange (CCX 2008a). Each C credit resulting from theimplementation of these practices represents the removal of 1 t CO2 from theatmosphere (Bayon et al. 2007) and are considered to be a commodity that might bepurchased directly from the source or traded within an exchange. C credits are notissued in years of summer fallowing or when residue management through burningor physical removal (haying) occurs. The system used by the CCX assigns C creditson a per-zone basis, using coarse regional approximations established by a soil Ctechnical advisory committee comprised of “leading experts from the academic soilsscience community” (CCX 2008b, p. 4).
C credits ideally would be assigned according to localized C data. These data,however, are usually unavailable, making it necessary to apply broad-scale C rates inplace of more location-specific sequestration estimates. The general lack of studiesestablishing region-specific C sequestration rates has been due largely to the greatcost and time involved in measuring and monitoring soil C (Smith 2004). Manyresearchers have instead used C models for sequestration estimates (Melillo et al.1995; Coleman and Jenkinson 1996; Parton et al. 2005; Bricklemyer et al. 2007),but it is often difficult to acquire adequate parameter data for large-area analyses.Some studies (Eve et al. 2002; Sperow et al. 2003) have avoided the use of regionalC models by applying available C rate estimates to land use practice statistics. Thistype of an approach, applying generalized averages to regional land-use percentages,likely is ideal for C sequestration analyses within Montana, given the difficulty ofobtaining the parameters needed for a model-based approach.
1.3 Land use data for regional sequestration estimates
Statistics concerning the percentage of agricultural land within north centralMontana under NT, CR falling outside of the CRP, and various crop intensity levelsare lacking. The US Department of Agriculture census data are limited to 5-year

Climatic Change (2011) 108:301–331 305
intervals and have not included information regarding tillage management or cropintensity. The Conservation Technology Information Center (CTIC) currently relieson sporadic voluntary data to estimate the amount of land under different tillagepractices. Data exist for CRP land under contract with the Montana Farm ServiceAgency (MFSA); these statistics, however, are typically not available for use outsidethe MFSA. The CRP data do not account for CR areas outside of CRP contract.
Cost-effective and timely options for the collection of regional tillage, cropintensity, and CR data must be considered as survey-based efforts are too expensiveand time-intensive to facilitate the annual collection of cropland statistics. Onealternative is satellite image analysis. Image analysis has been widely used in thecharacterization of land cover practices (Lefsky et al. 2002; Kerr and Ostrovsky 2003;Cohen and Goward 2004). Several studies have reported high classification accuracyin detecting CR vegetation (Price et al. 1997; Egbert et al. 1998, 2002; Watts et al.2009) and crop and fallow parcels (Xie et al. 2007; Watts et al. 2009) through imageclassification. An object-based analysis might also be used, rather than the traditionalper-pixel approach, as it allows for land cover classifications to be based on meaning-ful management units, such as agricultural fields (Watts et al. 2009), and can avoidproblematic mixed classifications within single management zones (Benz et al. 2004).
Image-based analysis is also highly advantageous for land use assessments asit provides population data for a given landscape (Lachowski and Johnson 2001).Survey-based approaches only provide a population sample, from which inferencesmust be made concerning the population. The sole reliance on population samplingcan be limiting, as they do not provide a fine-scale representation of spatial patternswithin a landscape (Kerr and Ostrovsky 2003). Increased analytical strength comesfrom the incorporation of image-based population data with randomly-sampled,field-based data for which specific information has been obtained. Localized sampledata representing field management types can be used within a supervised clas-sification to create models that predict class types (e.g., fallowed or vegetated) forindividual units across the population. This process often results in efficient (bothcost and time-wise) across-scale landscape analyses (Barrett and Curtis 1999; Gallego2004).
1.4 Assessing regional C sequestration potential
The objective of this study was to examine SOC storage potential within northcentral Montana through an approach similar to those used by Eve et al. (2002)and Sperow et al. (2003), specifically the application of available C-rate estimates toland use statistics. This was accomplished as a two-part process. Land use data weregenerated through a field survey and through Landsat image-based classificationsto establish the percentage of cropland within north central Montana under tillage,NT and CR management in 2007. Lands under CR management, for purposesof this study, included CRP lands and “other grasslands” having vegetation andmanagement practices similar to those within the CRP, but exclude managed pasturelands. A multi-year image analysis of crop and fallow practices was also conductedto determine four-year crop intensity patterns spanning from 2004–2007. The cropintensity values were assigned on a per-field basis and indicated the proportion ofyears that a field was classified as cropped, as opposed to summer fallow, over theobserved time period.

306 Climatic Change (2011) 108:301–331
The second step was to identify previously published SOC sequestration rates forsystems having converted from tillage-based systems to NT and from cropland tograssland-based CR within north central Montana. We also attempted to identifySOC rates associated with the conversion to NT in conjunction with changes in cropintensity. Generalized estimates of regional C sequestration potential resulting fromthe conversion of these systems were then established by applying the sequestrationrates to the regional land use information. Data were not available that specificallyseparated intensive tillage management from MT. Consequently three managementscenarios were evaluated. The first assumed that all tillage in the region consisted ofintensive tillage, the second assumed all tillage was MT, and the third assumed aneven mix amongst intensive tillage and MT classes.
2 Methods
2.1 Study area description
This study was limited to cropland and CR lands within north central Montana(Fig. 1) and spanned ∼780,000 ha. This region is considered to be semi-arid steppe(NRCS 2007a); regional topography ranges from gently rolling hills to relativelyflat prairie lands and soil type varies considerably (NRCS 2007b). Temperatureand especially precipitation also vary strongly within the region. Annual averageminimum temperatures have ranged from −0.7◦C Havre to −0.9◦C in Great Falls,with annual average maximum temperatures ranging from 12.7◦C in Havre to 15.5◦Cin Fort Benton (NWS 2007). Mean annual precipitation (MAP) has ranged from265 mm in Chester to 318 mm in Cut Bank and 373 mm in Great Falls (WRCC 2006).
Fig. 1 Geographic location of the remote sensing cropland validation study (within red circle),Montana, USA

Climatic Change (2011) 108:301–331 307
Dryland wheat is the primary crop (87%), followed by barley (11%), withinnorth central Montana (USDA-FSA 2007); the decision to plant spring or wintercrops is primarily driven by market price and soil moisture conditions. Other cropsmight occasionally be planted but have contributed to a minute proportion oftotal cropped hectares (CTIC 2004; USDA-NASS 2007). A fallow-crop rotation iscommon throughout the region.
Four regional subsets were identified for the image-based classification andanalysis of crop and fallow patterns. This step was necessary to enable timely datamanagement due to the computationally intensive, multi-step, process required todetermine field crop intensity based on multi-year crop and fallow classifications.
The resulting geographic sub-regions were selected to represent four differentprecipitation zones existing within north central Montana. The inclusion of differentprecipitation zones was important as the ability of a dryland system to support a moretemporally intensive cropping rotation (reduced summer fallow) is often dependenton annual precipitation amounts. Thus, a greater incorporation of fallow (lessercropping intensity) might be expected in regions of lower precipitation.
The subsets were located near Dutton (18,500 ha), Chester (11,250 ha), GreatFalls (13,014 ha), and between Big Sandy and Fort Benton (7,646 ha; Fig. 2).Chester represented a drier climate within the 2004–2007 period (∼250 mm), GreatFalls a relatively wetter climate (∼390 mm) (HPRCC 2008), while Dutton and BigSandy/Fort Benton areas were moderate (∼290–320 mm).
Fig. 2 A 2007 Landsat TM image scene displaying north central Montana cropland, with the cities ofHavre and Great Falls (yellow circles) provided as spatial reference. Data subset locations (outlinedin red) within representative regional precipitation gradients were used to identify crop and fallowpractices from 2004–2007

308 Climatic Change (2011) 108:301–331
2.2 Estimation of regional cropland land use management
2.2.1 Cropland survey
Field survey data were collected early June 2007. A GIS-based random point gener-ator was used to determine data site locations within the study region. The final fieldlocations were based on their proximity to public roadways to enable time-efficientsite visits and to avoid land access issues. Collected information included vegetativestatus (cropped or fallow), crop type, and tillage management (tilled or NT). Thedetermination of tillage management within a field included an examination ofstubble (stubble in a NT field should generally be in a relatively upright position)and soil surface disturbance. Many fields classified as tillage had high levels of surfaceresidue but also showed substantial surface disturbance.
Verbal communication with local farmers confirmed that MT, where only a lighttillage is incorporated for residue management purposes and weed control, is oftenused throughout the region. This level of disturbance might be relatively minimalcompared to a more intensive management but would still be considered “tillage”under US Natural Resource Conservation Service (NRCS) definitions (NRCS 2008).MT-related disturbances also violate guidelines specified within C-offset programs(NCOC 2008). Consequently we did not separate tillage class type beyond theNCOC-based binary split of NT or tillage.
Data for CR lands were obtained by randomly selecting samples from CRP dataprovided by the Montana Farm Service Agency (MFSA). Vegetation on these sitesconsisted primarily of grass, and mixed grass-alfalfa. Data were not available forlands converted from cropland to dryland perennial vegetation outside of the CRP,and for lands previously within the CRP. The collected CRP data were thoughtto adequately represent the spectral and textural surface characteristics of CRgrasslands for the purpose of developing image-based classification models used toclassify cropland from CR lands within north central Montana.
The resulting 2007 survey-based cropland data set included information for 78 NT-fallow, 138 NT-cropped, 48 tilled-fallow, and 148 tilled-cropped sites. The MFSA-based random sample included 127 CR field sites.
2.2.2 Satellite-based analyses
Regional, site-specific, land use statistics for CR and crop intensity were establishedthrough satellite image classifications. Particular care was taken to exclude non-agricultural lands (non-cropland and non-CRP) from the regional analysis through aseries of data masking procedures (Watts et al. 2009). Special attention was also givento the removal of areas not associated with cropland systems, including managedpasture lands and grasslands along roadways, railways, power lines, and riparianbuffer strips (Watts et al. 2009) using data obtained from the MFSA and the State-based Natural Resource Information Service. Data provided by the MFSA for CRPparcels, and classification results generated from the Crop vs. CR model (Table 1),were also used to remove CR lands from the cropland data set.
Classification models (Watts et al. 2009) were developed for CR and crop intensitymanagement using data collected through the 2007 cropland field survey (Table 1).Image-based classifications were also attempted for tillage and NT, but the resulting
Climatic Change (2011) 108:301–331 309
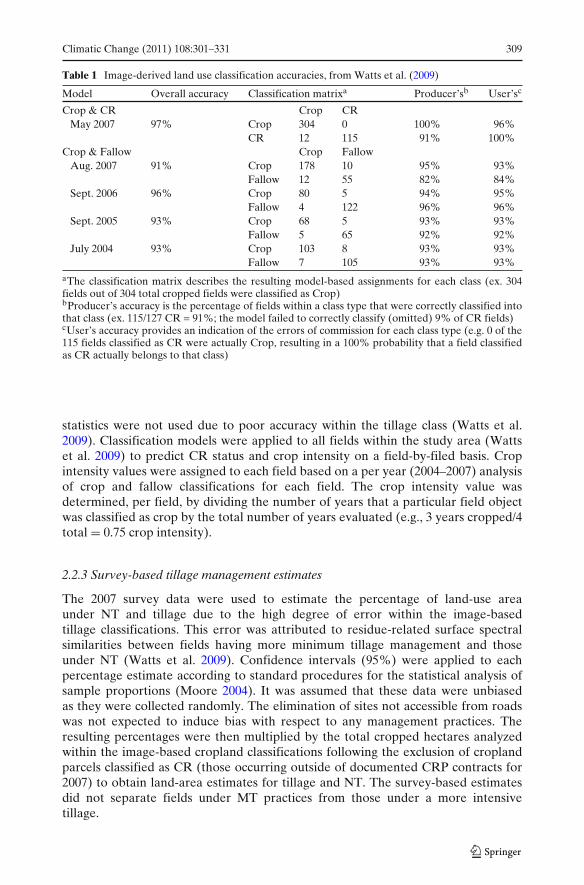
Table 1 Image-derived land use classification accuracies, from Watts et al. (2009)
Model Overall accuracy Classification matrixa Producer’sb User’sc
Crop & CR Crop CRMay 2007 97% Crop 304 0 100% 96%
CR 12 115 91% 100%Crop & Fallow Crop Fallow
Aug. 2007 91% Crop 178 10 95% 93%Fallow 12 55 82% 84%
Sept. 2006 96% Crop 80 5 94% 95%Fallow 4 122 96% 96%
Sept. 2005 93% Crop 68 5 93% 93%Fallow 5 65 92% 92%
July 2004 93% Crop 103 8 93% 93%Fallow 7 105 93% 93%
aThe classification matrix describes the resulting model-based assignments for each class (ex. 304fields out of 304 total cropped fields were classified as Crop)bProducer’s accuracy is the percentage of fields within a class type that were correctly classified intothat class (ex. 115/127 CR = 91%; the model failed to correctly classify (omitted) 9% of CR fields)cUser’s accuracy provides an indication of the errors of commission for each class type (e.g. 0 of the115 fields classified as CR were actually Crop, resulting in a 100% probability that a field classifiedas CR actually belongs to that class)
statistics were not used due to poor accuracy within the tillage class (Watts et al.2009). Classification models were applied to all fields within the study area (Wattset al. 2009) to predict CR status and crop intensity on a field-by-filed basis. Cropintensity values were assigned to each field based on a per year (2004–2007) analysisof crop and fallow classifications for each field. The crop intensity value wasdetermined, per field, by dividing the number of years that a particular field objectwas classified as crop by the total number of years evaluated (e.g., 3 years cropped/4total = 0.75 crop intensity).
2.2.3 Survey-based tillage management estimates
The 2007 survey data were used to estimate the percentage of land-use areaunder NT and tillage due to the high degree of error within the image-basedtillage classifications. This error was attributed to residue-related surface spectralsimilarities between fields having more minimum tillage management and thoseunder NT (Watts et al. 2009). Confidence intervals (95%) were applied to eachpercentage estimate according to standard procedures for the statistical analysis ofsample proportions (Moore 2004). It was assumed that these data were unbiasedas they were collected randomly. The elimination of sites not accessible from roadswas not expected to induce bias with respect to any management practices. Theresulting percentages were then multiplied by the total cropped hectares analyzedwithin the image-based cropland classifications following the exclusion of croplandparcels classified as CR (those occurring outside of documented CRP contracts for2007) to obtain land-area estimates for tillage and NT. The survey-based estimatesdid not separate fields under MT practices from those under a more intensivetillage.

310 Climatic Change (2011) 108:301–331
2.3 C sequestration rate estimates
Relevant research was reviewed for reported C sequestration rates pertaining tothe conversion from tillage to NT, tillage to NT as influenced by crop intensity,and the conversion from cropland to CR. C gains associated with the conversionfrom MT to NT were also evaluated due to concerns that these systems mightsequester less C following NT adoption than those previously under more intensivetillage, and therefore should be considered separately. The review primarily includedsequestration data based on physical measurements (hereafter referred to as theliterature-based data), with the exception of values derived from a C-gain model(McConkey et al. 1999) due to the lack of studies examining C sequestration ratesspecifically associated with the conversion from MT to NT systems. The C-gainmodel was also used to estimate C sequestration rates associated with changes in cropintensity as the literature-based studies mainly focused on systems converting froma 0.5 (crop-fallow) to a 1.0 (continuous crop) intensity. In addition, the rates usedby the CCX for C-crediting were evaluated to verify the adequate representation ofsequestration potential for lands in north central Montana under C contract.
2.3.1 Literature-based data
The literature-based C sequestration data utilized within this study were constrainedto those most representative of climatic regimes within north central Montana, withexception given to CR data that reflected areas under higher annual precipitationas climatically similar CR studies were not identified. Selected data were primarilytaken from studies that established sequestration rates by comparing baseline SOCdata with C measurements taken after management conversion. Post-hoc rates basedon side-by-side comparatives, where one location was kept under tillage while aneighboring location had switched to NT management, were also included only ifthey provided information directly relevant to the study area.
The final selection included eight studies associated with the conversion fromintensive tillage to NT (Table 2), one study that dealt with the conversion from MTto NT (Table 2), and three studies that established SOC sequestration rates resultingfrom the conversion from cropland to grassland-based CR (Table 3). Prior croplandmanagement within the tillage studies included some degree of summer fallowing.Implements used for cultivation purposes in “tilled” treatments within these studiesreportedly included tandem disk cultivator; sweeps and rod weeder; chisel ploughand mounted harrow.
The literature-based data often represented C measurements at variable depths.C data used within this study were constrained within the ∼0–20 cm soil depth forthe tillage studies and 0–15 cm for the CR studies, as most of the studies evaluatedsampled within these ranges. Measurements taken from the 0–20 cm depth likelyprovide an adequate representation of management-influenced SOC accumulation(Kay and VandenBygaart 2002) as tillage disturbances in dryland settings, and hencethe greatest amount of C depletion, typically occur within the top 0–15 cm ofsoil. The conversion from weight-based to area-based estimates (e.g., multiplyingg C by soil bulk density) was necessary for one study and incorporated soil bulkdensity measurements specified within the study text. Studies sometimes presentedsequestration rate estimates across fertilizer rate treatments; in these cases the

Climatic Change (2011) 108:301–331 311
Tab
le2
Cse
ques
trat
ion
rate
sfo
rN
T
Stud
yL
ocat
ion
Mea
nM
ean
Clim
atea
Soil
Man
agem
ent
Yea
rsSa
mpl
ing
Tot
al∼
Rat
ean
nual
annu
alte
xtur
ebco
mpa
riso
nsi
nce
dept
hSO
C(g
/m2 /y
ears
)pr
ecip
.te
mp.
mgm
t.(c
m)
Seq.
(cm
)(◦
C)
chan
ge(g
/m2 )
NT B
lack
and
Tan
aka
(199
7)So
uth
Cen
tral
405
CT
SiL
Till
toN
T-S
W/F
c7
0–15
.2∼−
304
e−4
3.4
Nor
thD
akot
aT
illto
NT
-SW
/WW
/SF
d∼9
1e13
.0B
rick
lem
yer
etal
.(20
07),
Nor
thC
entr
al26
5C
SSL
Till
vs.N
T-W
/F7
0–10
186
Avg
.26.
5(1
5.7–
47.1
)B
rick
lem
yer
(200
3)M
onta
na36
7.5
CL
,CT
illvs
.NT
-W/F
637
1A
vg.6
1.8
(36.
6–96
.6)
Cam
pbel
leta
l.(2
001)
Sask
atch
ewan
422
CT
CT
illto
NT
-W/F
100–
1539
339
.3T
illto
NT
-F/W
/W52
152
.1T
illto
NT
-W/W
/W19
519
.5H
alvo
rson
etal
.(20
02)
Sout
hC
entr
al41
12C
TSi
LT
illto
NT
-SW
/WW
/SF
130–
15.2
140
10.8
Nor
thD
akot
aSi
LT
illto
NT
-SW
/F−1
90−1
4.6
McC
onke
yet
al.(
2003
)Sa
skat
chew
an33
3.3
CS
SLM
Tvs
.NT
-W/W
,W/F
110–
1520
018
.2Si
LM
Tvs
.NT
-W/W
,W/F
1280
6.7
CM
Tvs
.NT
-W/W
,W/F
1125
022
.7Sa
inju
etal
.(20
07)
Nor
thE
ast
36∼6
CS
SLF
ST-S
W/S
Wvs
.NT
-SW
/SW
210–
2117
08.
1M
onta
naST
-SW
/Fvs
.NT
-SW
/SW
840
40.0
Wes
tand
Six
(200
7),
Nor
thE
ast
36∼6
CS
SLT
illto
NT
-SW
/B9
0–9
–37
.5–4
5.0
Aas
ean
dP
ikul
(199
5),
Mon
tana
Bla
ck(1
973)
Rat
esre
flec
tthe
conv
ersi
onof
tilla
ge-b
ased
crop
land
toN
Tas
infl
uenc
edby
crop
inte
nsit
y(t
heke
yfo
llow
sTab
le3)
.Stu
dycr
opla
ndm
anag
emen
tpri
orto
trea
tmen
tin
itia
tion
incl
uded
som
ede
gree
ofsu
mm
erfa
llow
ing
(mos
toft
ena
0.5
crop
inte
nsit
y)C
Tco
ol,
tem
pera
te;
CS
cool
,se
mi-
arid
;Si
Lsi
ltlo
am;
SLsa
ndy
loam
;C
Lcl
aylo
am;
Ccl
ay;
NT
no-t
ill;
SWsp
ring
whe
at;
WW
win
ter
whe
at;
Ww
heat
(typ
eun
defi
ned)
;SF
sunf
low
er;B
barl
eya C
limat
ety
peis
defi
ned
byth
eK
öppe
ncl
assi
fica
tion
syst
em,a
ccor
ding
toan
nual
prec
ipit
atio
nan
dte
mpe
ratu
reda
tapr
ovid
edw
ithi
nea
chst
udy
bSo
ilte
xtur
eis
desc
ribe
dac
cord
ing
toin
form
atio
npr
ovid
edw
ithi
nea
chst
udy
c SOC
rate
for
0kg
/Ntr
eatm
ent
dSO
Cra
tefo
r34
kg/N
trea
tmen
te B
ulk
dens
itie
sob
tain
edw
ithi
nth
esp
ecif
ied
stud
yw
ere
used
toca
lcul
ate
area
-bas
edSO
C

312 Climatic Change (2011) 108:301–331
Tab
le3
Cse
ques
trat
ion
rate
sfo
rC
R
Stud
yL
ocat
ion
Mea
nM
ean
Clim
atea
Soil
Com
pari
son
Lan
dY
ears
Sam
plin
gT
otal
∼R
ate
annu
alan
nual
text
ureb
type
char
acte
rist
ics
sinc
ede
pth
SOC
(g/m
2 /yea
rs)
prec
ip.
tem
p.m
gmt.
(cm
)Se
q.(c
m)
(◦C
)ch
ange
(g/m
2 )
CR
Bur
keet
al.(
1995
)N
orth
Eas
t36
16C
TSi
L,S
iCL
Till
toC
RB
lue
Gra
ma
530–
1082
–200
3.1
Col
orad
odo
min
ant.
Som
egr
azin
g.no
n-C
RP
Geb
hart
etal
.(19
94)
Kan
sas
5312
CT
SiL
Till
To
CR
Blu
este
m,G
ram
a,5
0–15
c47
9Sw
itch
gras
s.C
RP
Pos
tand
Kw
on(2
000)
,N
orth
Cen
tral
∼58
∼15
CT
No
data
Till
toC
RR
ussi
anW
ildry
e,8
0–7
148
6.86
Whi
teet
al.(
1976
)So
uth
Dak
ota
Cre
sted
Whe
atgr
ass,
Bro
me/
Whe
atgr
ass/
Alf
alfa
.Som
egr
azin
g.no
n-C
RP
18.8
714
.01d
34.1
5e
Rat
esre
flec
tthe
conv
ersi
onfr
omcr
opla
ndto
gras
slan
d-ba
sed
CR
CT
cool
,tem
pera
te;S
iLsi
ltlo
am;S
iCL
silt
clay
loam
a Clim
ate
type
isde
fine
dby
the
Köp
pen
clas
sifi
cati
onsy
stem
,acc
ordi
ngto
annu
alpr
ecip
itat
ion
and
tem
pera
ture
data
prov
ided
wit
hin
each
stud
ybSo
ilte
xtur
eis
desc
ribe
dac
cord
ing
toin
form
atio
npr
ovid
edw
ithi
nea
chst
udy
c Rat
esw
ere
adju
sted
tore
flec
tdep
thm
easu
rem
ents
com
mon
acro
ssth
est
udie
sev
alua
ted
dB
rom
e/W
heat
gras
s/A
lfal
faw
ith
full
seas
ongr
azin
ge B
rom
e/W
heat
gras
s/A
lfal
faw
ith
shor
tsea
son
graz
ing

Climatic Change (2011) 108:301–331 313
rate estimates reflecting optimal sequestration were used within our analyses. Csequestration rates were then averaged according to management and rotation type.
2.3.2 C-gain model data
Data generated from the C-gain model were used primarily to provide an estimatefor C sequestration in fields having changed from MT to NT, and for crop intensitychanges within intensive tillage-to-NT and MT-to-NT systems. A sequestrationrate associated with a conversion from intensive tillage to NT was also derivedfrom the C-gain model for purposes of comparison with the only literature-basedestimate.
The C-gain model was developed by McConkey et al. (1999) as a simple methodto estimate C gains for tillage systems (both traditional tillage and MT) adopting NTand/or higher cropping intensities. Intensive, “traditional,” tillage was defined forthe model as a system where both fall and spring tillage occurred, each resulting in100% surface disturbance (McConkey et al. 1999). MT was described as a systemusing both spring tillage and herbicides for weed control, in a manner that allowedfor most surface residues to be retained (McConkey et al. 1999).
The model includes a C-gain equation (Eq. 1) and a corresponding table of C-gain rate fractions existing for various system adjustments including the adoptionof NT in fields previously under tillage management (Ctillage), for years that fallowis eliminated from a system (Ccrop), and for adjustments in fertilization (Cfert)
(McConkey et al. 1999). Tabulated C-gain rate fractions are provided for three soiltexture categories corresponding to four soil climatic zones. An optional landscapecomponent is also provided to account for soil C movement due to erosion.
Cgain = (Ctillage + Ccrop + Cfert
)zone/texture × landscape (1)
The tabulated rate fraction values for the C-gain model were established based onstudy findings (McConkey et al. 1999) for long-term tillage conversion experimentswithin the Canadian prairies. Only the provided rates corresponding to the “Brownand Dark Brown” zone were used for this study as it was most climatically similarto north central Montana (Padbury et al. 2002). A medium soil texture was assumedfor the C-gain calculations, as was suggested by McConkey et al. (1999) to provide abalance between the higher sequestration that might occur in areas of fine-texturedsoil and a lower sequestration in more coarse soils. C-gain equation adjustments forchanges in fertilizer rate were not included into the calculations. The landscape factorwas also excluded from the C-gain calculations as it was deemed inappropriate to ourstudy scale.
The C-gain model was also used to provide SOC estimates for changes in cropintensity. Estimates were calculated for tillage-to-NT systems and for MT-to-NTsystems having crop intensity changes of 0.75 (3 of 4 years cropped as opposed tofallow) to 1.0 (continuous crop). Estimates were also made for tillage-to-NT andMT-to-NT systems converting from a 0.5 (2 of 4 years cropped) to 1.0 intensity forcomparative purposes. An empirical correction (a 0.5 discount) was given to the C-gain predictions for use in this study, as a consistent degree of inflation was observedcompared to the regionally-representative rates.

314 Climatic Change (2011) 108:301–331
2.3.3 Regional C sequestration estimates
Regional C estimates associated with the conversion from tillage (intensive andMT) to NT, changes in cropping intensity coinciding with a conversion to NT, andthe conversion of cropland to CR were obtained by multiplying sequestration rates(derived from either the literature or the C-gain model) for each category by the totalestimated hectares that corresponded to that particular management adjustment.The sequestration rates supplied by the CCX (CCX 2008b, c) were also appliedto generate current market-based estimates for tillage-to-NT and for cropland-to-CR conversions. The land-use area data used to estimate regional C sequestrationassociated with changes in tillage management were derived from the 2007 fieldsurvey; land-use areas for cropping intensity and the conversion to CR were derivedfrom satellite-image analyses.
Three different land-use scenarios were reflected within the sequestration es-timates for “tilled” systems converting to NT, due to lack of regional statisticsspecifically for MT management. These scenarios attempted to provide a range ofpossible regional sequestration potentials, based on the degrees of tillage manage-ment (intensive or minimum) that might exist prior to the adoption of NT.
The first management scenario assumed that all “tilled” lands were under amore traditional tillage system characterized by intensive soil disturbance. Twoof the studies included within this scenario reported negative sequestration ratesassociated with the conversion from tillage to NT in spring wheat/fallow systems(Black and Tanaka 1997; Halvorson et al. 2002). These studies occurred within thesame management area, and the resulting negative sequestration was attributed todiminished crop residues produced during the treatment periods (post-conversion toNT) compared to what had existed prior to treatment (Halvorson et al. 2002). Thesequestration rates derived from the literature-based data for the categories specificto systems with no increase in crop rotation intensity (within a 0.5 crop intensitysystem), and systems averaged across crop intensities, were therefore divided intotwo groups. The first group represented “ideal” conversions to NT that were notconfounded by reductions in SOC; the second group accounted for the possibility ofdecreased SOC that might occur in some systems resulting from some unbeknownstsystem-specific change that occurred coincidently or in conjunction with the adoptionof NT. The second tillage management scenario was based on the assumption that allof the “tilled” lands within the region were under MT, instead of intensive tillage, andutilized rates primarily derived from the C-gain model (McConkey et al. 1999). Thethird scenario assumed that intensive tillage and MT occurred equally throughoutthe study region and used sequestration amounts that were averaged across theliterature-based rates for intensive tillage and for MT.
3 Results
3.1 Land-use statistics
The satellite-based image classification analysis (Table 4) identified 24% of the studyarea as being under grassland-based CR management as opposed to cropland, aconsiderably higher percentage than the lands reported to be under CRP contract.

Climatic Change (2011) 108:301–331 315
Table 4 2007 cropland tillage and grassland-based CR statistics
Image classifications Field survey
Management type Hectares % % 95% CI Hectares 95% CI
NT vs. TillageNT – – 56 51–61 296,261 269,809–322,713Tillage – – 44 40–49 232,776 118,504–259,228Total land area 529,037a 100 100 – 529,037a –
Crop intensity0.5 33,249 66 – – – –0.75 14,820 29 – – – –1.0 2,344 5 – – – –
Total land area 50,413 100 – – – –Grassland-based CR
Non-CRP 174,199b 92 – – – –CRP 14,350c 8 – – – –Total land area 188,549 100 – – – –
Total land area for cropland and CR: 717,586 ha
Land use data for tillage and NT derived from satellite-based image analyses and 2007 roadsidesurvey results. Total land area within the CR analyses is the sum of total evaluated cropland andCRP hectare information provided by the MFSAaThis estimate was obtained following the exclusion of cropland parcels that were classified as CR(occurring outside of CRP contract)bThis estimate was derived by using the Crop vs. CR classification model (Table 1) to predict land-use type for parcels within the CRP program (2007) and for parcels considered to be under cropland.The spatial extent of cropland within the study area was determined through an evaluation of parcelland use information obtained from State-based Natural Resource Information Service (NRIS) GISdatacCRP population statistics for the study area were provided by the Montana Farm Service Agency
The 2007 cropland field survey estimated that 56% of the evaluated region hadpracticed NT management in 2007, while 44% had incorporated some other tillagemanagement.
Systems under a 0.5 crop intensity (from 2004–2007) included 66% of the analyzedcropland area (Table 4); 29% was under a 0.75 crop intensity, and 5% was under a1.0 crop intensity. There appeared to be no connection between crop intensity andlocalized MAP within the regional subsets. It had previously been expected that areashaving a greater MAP would be more likely to incorporate higher crop intensities, assoil moisture availability might constrain crop growth to a lesser degree than in areaswith a lower MAP. Assuming that crop intensity percentages within the geographicsub-regions were adequately representative of the greater study area, the regionallands under a 0.5 crop intensity (Table 5) were estimated at 195,532 ha for NT and153,632 ha for tillage. Lands under a 0.75 intensity were estimated to be 85,916 ha(NT) and 67,505 ha (Tillage), and 14,813 ha (NT) and 11,639 ha (Tillage) for landsunder a 1.0 intensity (Table 5).
3.2 Regional C sequestration estimates
3.2.1 Cropland to CR
The average sequestration rate reported for lands converted from cropland toperennial CR management was 10 g C m−2 year−1 for soil depths within the 0–15 cm

316 Climatic Change (2011) 108:301–331
Table 5 Regional crop intensity estimates, derived through the application of image classification-based crop intensity percentage (see Table 4) to total land area by type
Crop intensity estimates (Ha)
Management type 0.5 0.75 1.0
NT 195,532 (178,074–212,991) 85,916 (78,213–93,587) 14,813 (13,490–16,136Tillage 153,632 (139,666–171,090) 67,505 (61,368–75,176) 11,639 (10,581–12,961)
range (Table 6). This rate average was derived from studies that evaluated Csequestration in lands with various vegetation types, including smooth brome (Bro-mus inermis), blue grama (Bouteloua gracilis), bluestem (Andropogon gerardii),switchgrass (Panicum virgatum), Russian wildrye (P. virgatum), crested wheatgrass(Agropyron cristatum), and alfalfa (Medicago sativa). These species are consistentwith those that exist within CR in north central Montana. The studies used toobtain this rate average included lands that were converted to grassland under CRPguidelines (Gebhart et al. 1994), as well as those that were not (Burke et al. 1995; Postand Kwon 2000). These studies also included some lands where non-intensive grazingoccurred (White et al. 1976; Burke et al. 1995; Post and Kwon 2000). Minimal grazingmight also be expected on some CR lands evaluated within this study. The MAP forthe evaluated studies was ∼17 cm greater than might be expected to occur withinnorth central Montana. Hence we acknowledge that the sequestration potential forportions of this study region may be less than is reflected by the rate average.
It was estimated that 174,199 ha of agricultural land within the study region wereunder a CR-type management in 2007, in addition to the 14,350 ha that were undercontract with the CRP. The conversion of these lands together, from cropland to CR,was estimated to have sequestered 18,855 t C year−1. This estimate is much smaller(by 107,472 t C year−1) than what is allocated by the regional CCX (2008c) rate.
3.2.2 Tillage to NT
The sequestration rates reported from Saskatchewan, North Dakota, and Mon-tana studies showed a wide range for SOC storage potential associated with the
Table 6 Estimated C sequestration potential for the conversion of cropland to grassland-based CR
Management Rate Land area � SOC Referenced tabletype (t C ha−1 year−1) (ha) (t year−1) (studies footnoted)
Crop to CR 0.10 174,199 17,420 3a,b,c
0.67 116,713 CCX 2008cCrop to CR 0.10 14,350 1,435 3a,b,c
0.67 9,614 CCX 2008cTotal crop to CR 188,549 18,855 3a,b,c
126,327 CCX 2008c
These lands include “other” grasslands having characteristics similar to those within the CRP (A),and lands under the CRP in 2007 (B). See Table 4 for land area statisticsaBurke et al. (1995)bGebhart et al. (1994)cWhite et al. (1976), Post and Kwon (2000)

Climatic Change (2011) 108:301–331 317
conversion from tillage to NT within a soil depth of ∼0–20 cm. The literature-based rate average was 14 g C m−2 year−1in systems where the change to NTretained a 0.5 crop intensity (Table 7). This rate increased considerably (to 43 g Cm−2 year−1) when the negative sequestration rates reported by two North Dakotastudies were excluded (Black and Tanaka 1997; Halvorson et al. 2002); both of thesestudies evaluated systems under a spring wheat/fallow rotation and were locatedwithin the same area outside of Mandan. Only one study reflected C sequestrationestimates for a system where an intermediate intensity fallow/wheat/wheat system(0.67 crop intensity) was adopted in addition to the tillage-to-NT change. Thisstudy had a reported rate of 52 g C m−2 year−1 (Campbell et al. 2001); an area-based sequestration potential was not evaluated for this particular rate change, andinstead this rate was included within a rate that was derived by averaging across cropintensity rate categories. The literature-based results were also used to evaluate theconversion from an intensive tillage-based management under a 0.5 crop intensity toa NT system with a 1.0 crop intensity. The sequestration rate average for this categorywas 28 g C m−2 year−1 (Table 7). Only one study provided a rate (8 g C m−2 year−1)
for a system converting to NT while maintaining a 1.0 intensity (Sainju et al. 2007).Also evaluated were rates based on the C-gain model for tillage-to-NT systems
converting from a 0.5-to-1.0 and 0.75-to-1.0 crop intensities, and for systems convert-ing to NT while keeping a 1.0 crop intensity (Table 7). The 0.5-to-1.0 conversion ratewas 20 g C m−2 year−1, 8 g C m−2 year−1less than the literature-based value. The 0.75-to-1.0 rate was 15 g C m−2 year−1 and could not be compared to any literature-basedrate. The C-gain rate for a system converting to NT while keeping a 1.0 intensity was10 g C m−2 year−1, slightly higher than the literature-based rate.
It was estimated that 55,866–81,472 t C year−1 (Table 7) might be sequesteredfollowing the adoption of NT, if all lands under tillage within north central Montanawere assumed to be under intensive tillage management. This scenario used anacross-intensity estimate and did not separate sequestration potential based oneffects that a coincident adjustment in crop intensity might have on C gain. The lowestimate (55,866 t C year−1) was derived using averaged rates that included negativesequestration following the conversion to NT and assumed the inclusion of systemswhere unaccounted management adjustments occurred simultaneously during theNT adoption, resulting in an unforeseen decrease in SOC. The high estimate (81,472 tC year−1) assumed that systems had a seamless conversion to NT and that SOC lossdid not occur.
When partitioning lands according to crop intensity categories, the sequestrationpotential for those converting to NT while maintaining a 0.5 crop intensity wasestimated to range from 21,508 to 66,062 t C year−1 (Table 7). Again, the low valuerepresented a scenario that assumed some C loss following the conversion to NT,due to unaccounted changes within the systems, while the high value representedideal conversions without C loss.
The conversion of lands from a 0.5-to-1.0 crop intensity, in addition to theadoption of NT, was estimated to sequester 43,017 t C year−1 (Table 7). An estimated20,252 t C year−1 might be sequestered in systems converting from a 0.75-to-1.0intensity. For lands already under a 1.0 crop intensity, the sequestration potentialresulting from a conversion to NT was estimated at 931 t C year−1. The sum totalresulting regional sequestration potential if all lands were to convert to a 1.0 intensitywas roughly 54,074 t C year−1.

318 Climatic Change (2011) 108:301–331
Tab
le7
Est
imat
edC
sequ
estr
atio
npo
tent
ialf
orcr
opla
ndco
nver
ting
from
inte
nsiv
eti
llage
man
agem
entt
oN
T
Man
agem
ent
Cro
pin
tens
ity
adju
stm
ent
Rat
eL
and
area
(ha)
�SO
C(t
year
−1)
Ref
eren
ced
tabl
esty
pe(t
Cha
1ye
ar−1
)(s
tudi
esfo
otno
ted)
Till
toN
T0.
5C
rop
(no
�in
inte
nsit
y)a
0.14
153,
632
(139
,666
–171
,090
)21
,508
(19,
553–
23,9
53)
2d,e,
f,g
0.43
c66
,062
(60,
056–
73,5
69)
2e,f
�fr
om0.
5to
1.0
0.28
43,0
17(3
9,10
6–47
,905
)2d,
f,g,
h,i
�fr
om0.
5to
1.0
0.2
30,7
27(2
7,93
3–34
,218
)7j
�fr
om0.
75to
1.0
0.15
67,5
05(6
1,36
8–75
,176
)10
,126
(9,2
05–1
1,27
6)7j
1.0
crop
(no
�in
inte
nsit
y)a
0.08
11,6
39(1
0,58
1–12
,961
)93
1(8
46–1
,037
)2h
1.0
crop
(no
�in
inte
nsit
y)a
0.1
1,16
4(1
,058
–1,2
96)
7j
Ave
rage
dac
ross
crop
0.24
232,
776
(218
,504
–259
,228
)55
,866
(52,
441–
62,2
15)
2d−g,
h−l
inte
nsit
ies
(lit
erat
ure-
base
d)b
0.35
c81
,472
(76,
476–
90,7
30)
2d−g,
h−l
See
Tab
les
4an
d5
for
land
area
data
a Rep
rese
nts
ach
ange
from
till
toN
Tw
itho
utin
crea
sing
crop
inte
nsit
ybIn
dica
tes
the
excl
usio
nof
nega
tive
sequ
estr
atio
nra
tes
(Bla
ckan
dT
anak
a19
97;H
alvo
rson
etal
.200
2)c In
clud
esra
tes
aver
aged
acro
sssy
stem
sun
der
vari
ous
crop
inte
nsit
ies
(see
Tab
le2)
dB
lack
and
Tan
aka
(199
7)e B
rick
lem
yer
(200
3),B
rick
lem
yer
etal
.(20
07)
f Cam
pbel
leta
l.(2
001)
g Hal
vors
onet
al.(
2002
)hSa
inju
etal
.(20
07)
i Wes
tand
Six
(200
7),A
ase
and
Pik
ul(1
995)
,Bla
ck(1
973)
j McC
onke
yet
al.(
1999
)

Climatic Change (2011) 108:301–331 319
3.2.3 MT to NT
The only literature-based rates provided for systems converting from MT to NTmanagement were averaged across a 0.5 (crop-fallow) and a 1.0 (continuous) cropintensity (Table 2). These literature-based, intensity-averaged, rates ranged from6.7–22.7 g C m−2 year−1, with an average rate of 16 g C m−2 year−1. The C-gainmodel rate for systems converting from MT to NT while maintaining a 0.5 cropintensity was estimated at 10 g C m−2 year−1. The C-gain model rate for a MT-to-NT conversion with a coinciding increase from a 0.5 to 1.0 intensity was estimated tobe 15 g C m−2 year−1, and to be 10 g C m−2 year−1for a 0.75-to-1.0 system increase.The C-gain model rate estimate for MT-to-NT systems maintaining a 1.0 intensitywas estimated at 5 g C m−2 year−1.
If it were assumed that all tilled lands within north central Montana were underMT instead of intensive tillage, the conversion of these lands to NT without regardto adjustments in crop intensity was estimated to sequester 37,244 t C year−1 whenderived from the across-intensity rate average (Table 8). When separating theselands into categories by crop intensity management adjustments, the sequestrationpotential was estimated to be 15,363 t C year−1 for MT-to-NT systems maintaining a0.5 crop intensity, 23,045 t C year−1 for a systems with a 0.5-to-1.0 intensity increase,6,751 t C year−1 for those with a 0.75-to-1.0 increase, and 582 t C year−1 for systemsmaintaining a 1.0 intensity.
The sum total sequestration potential was estimated at 30,378 t C year−1, if alllands within the region (assumed to be under MT for this management scenario)converted to NT and a 1.0 crop intensity.
3.2.4 Across-tillage averages
Under a third scenario, where it was assumed that croplands within north cen-tral Montana equally incorporated intensive tillage and MT, the rates for inten-sive tillage-to-NT conversions and MT-to-NT conversions were averaged together(Table 9). The regional sequestration potential, when averaged across crop intensity,was estimated to range from 46,555–60,522 t C year−1 (Table 9). The low value forthis estimate reflects potential, unforeseen, effects from unaccounted managementadjustments that might occur in some systems at the same time as the conversionto NT, resulting in an overall reduction in SOM. The high value estimate reflectsan ideal, and more probable, system conversion to NT where net SOM loss doesnot occur. For lands that might convert to NT while maintaining a crop/fallowrotation (0.5 intensity) the sequestration potential was estimated to range from18,436–43,017 t C year−1. The sequestration potential for systems converting toNT while also including a 0.5-to-1.0 adjustment in crop intensity was estimated at33,799 t C year−1, at 8,776 t C year−1 for a 0.75-to-1.0 intensity adjustment, and815 t C year−1 for systems maintaining a 1.0 intensity (continuous crop). The CCXsequestration rate (Table 9) for croplands converting to NT does not distinguishbetween systems having various degrees of prior tillage management and CCX C-credit is not given for years under fallow. When considering a 4-year crop intensitycycle, the resulting CCX averaged rate for that period would be 22 g C m−2 year−1 forcontinuous cropping systems, 17 g C m−2 year−1 in system under a 0.75 crop intensity(3 of 4 years cropped), and 11 g C m−2 year−1 for systems with a 0.5 crop intensity

320 Climatic Change (2011) 108:301–331
Tab
le8
Est
imat
edC
sequ
estr
atio
npo
tent
ialf
orcr
opla
ndco
nver
ting
from
MT
toN
T
Man
agem
entt
ype
Cro
pin
tens
ity
adju
stm
ent
Rat
eL
and
area
(ha)
�SO
C(t
year
−1)
(tC
ha−1
year
−1)
MT
toN
T0.
5cr
op(n
o�
inin
tens
ity)
a0.
10b
153,
632
(139
,666
–171
,090
)15
,363
(13,
967–
17,1
09)
�fr
om0.
5to
1.0
0.15
b15
3,63
2(1
39,6
66–1
71,0
90)
23,0
45(2
0,95
0–25
,664
)�
from
0.75
to1.
00.
10b
67,5
05(6
1,36
8–75
,176
)6,
751
(6,1
37–7
,518
)1.
0cr
op(n
o�
inin
tens
ity)
a0.
05b
11,6
39(1
0,58
1–12
,961
)58
2(5
29–6
48)
Ave
rage
dac
ross
crop
inte
nsit
ies
0.16
c23
2,77
6(2
18,5
04–2
59,2
28)
37,2
44(3
4,96
1–41
,476
)(l
iter
atur
e-ba
sed)
See
Tab
les
4an
d5
for
land
area
data
a Rep
rese
nts
ach
ange
from
MT
toN
Tw
itho
uta
coin
cidi
ngin
crea
sein
crop
inte
nsit
ybM
cCon
key
etal
.(19
99)
c McC
onke
yet
al.(
2003
)

Climatic Change (2011) 108:301–331 321
Tab
le9
Cse
ques
trat
ion
pote
ntia
lfor
crop
land
conv
erti
ngfr
omti
llage
toN
T,a
vera
ged
acro
ssti
llage
man
agem
entt
ype
(int
ensi
veti
llage
and
MT
)
Man
agem
entt
ype
Cro
pin
tens
ity
adju
stm
ent
Rat
eL
and
area
(ha)
�SO
C(t
year
−1)
Ref
eren
ced
(tC
ha−1
year
−1)
tabl
e
Till
toN
T0.
5cr
op(n
o�
inin
tens
ity)
0.12
153,
632
(139
,666
–171
,090
)18
,436
(16,
760–
20,5
31)
7,8
(Ave
rage
dac
ross
0.28
a43
,017
(39,
106–
47,9
05)
tilla
gem
anag
emen
t)�
from
0.5
to1.
00.
2215
3,63
2(1
39,6
66–1
71,0
90)
33,7
99(3
0,72
7–37
,640
)7,
8�
from
0.75
to1.
00.
13b
67,5
05(6
1,36
8–75
,176
)8,
776
(7,9
78–9
,773
)7,
81.
0cr
op(n
o�
inin
tens
ity)
0.07
11,6
39(1
0,58
1–12
,961
)81
5(7
41–9
07)
7,8
Ave
rage
dac
ross
crop
inte
nsit
y0.
2023
2,77
6(2
18,5
04–2
59,2
28)
46,5
55(4
3,70
1–54
,438
)7,
80.
26a
60,5
22(5
6,81
1–67
,399
)C
ropp
edye
ars
0.22
c23
2,77
6(2
18,5
04–2
59,2
28)
51,2
11(4
8,07
1–57
,030
)C
CX
2008
b
Lit
erat
ure-
base
dra
teav
erag
esw
ere
give
npr
efer
ence
over
the
C-g
ain
rate
esti
mat
esw
hen
poss
ible
.See
Tab
le4
and
5fo
rla
ndar
eada
taa In
dica
tes
the
excl
usio
nof
nega
tive
sequ
estr
atio
nra
tes
(Bla
ckan
dT
anak
a19
97;H
alvo
rson
etal
.200
2)bO
nly
the
C-g
ain
rate
sw
ere
incl
uded
due
tola
ckof
liter
atur
e-ba
sed
stud
ies
exam
inin
gth
isco
nver
sion
inte
nsit
yc T
heC
CX
-bas
edra
tere
pres
ents
the
broa
d-sc
ale
conv
ersi
onfr
omva
riou
sde
gree
sof
tilla
gem
anag
emen
tto
NT
.CC
XC
-cre
dit
ison
lyal
loca
ted
duri
ngcr
oppe
dye
ars

322 Climatic Change (2011) 108:301–331
(2 of 4 years cropped). The CCX-based rates do not account for any increase in cropintensity that might have occurred in conjunction with a conversion to NT.
4 Discussion
North central Montana has been identified for its potential to sequester SOCthrough adjustments in cropland management, specifically the adoption of NTand reductions in summer fallowing, and the conversion of cropland to CR-basedsystems. Percentage estimates for cropland already incorporating these practiceson a voluntary basis, without financial incentives provided by C contracts, had notbeen previously established due to a lack of regional cropland statistics. Attempts toquantify the potential of north central Montana to sequester additional C throughthe incorporation of these management practices also had not occurred prior to thisstudy.
4.1 Land-use statistics
4.1.1 Conservation reserve
An estimated 26% of the evaluated region was under a grassland-based CR man-agement in 2007; only 2% of this area was documented as being under current CRPcontract. This percentage reflects observations noted during the 2007 land manage-ment survey where 16% of the visited fields designated as cropland, according state-based land use data, appeared to be in some form of “unmanaged” grassland. Aportion of these parcels may have been voluntarily abandoned and allowed grassencroachment, especially if crop production costs had exceeded harvest revenues.Harvest rates within drier portions of this region might not exceed eight bushelsof wheat per hectare, an amount that would not be financially sustainable in manysystems. Repeated years of minimal harvest in addition to rising diesel, fertilizer,and herbicide costs might influence a producer to cease managing less productiveareas. Also probable is that many of the non-CRP lands in 2007 included thosepreviously under the CRP that had not been reestablished as cropland. Grass stripsdirectly adjacent to cropped fields and those along fence lines and ditches betweenfields might have also been included within the documented non-CRP lands, as thesefragmented areas would have been in close enough proximity to active field areasthat they could have been included as part of a cropland management area for state-based accounting purposes.
The future conversion of croplands to CR within north central Montana is likelydependent on annual precipitation, production costs, agricultural markets, and Cmarkets. Marginal lands with poor harvest yields are more likely to be convertedto CR, encouraged by small financial incentives provided by the CRP or simplybecause production costs have outweighed profit. The removal of productive landsfrom cropping management is unlikely unless financial gains resulting from the CRPor C-credit programs become higher than net crop production revenues.
4.1.2 Cropland management
There is potential for an increased conversion to NT management, and to higherlevels of crop intensity, within north central Montana. It was estimated that 56% of

Climatic Change (2011) 108:301–331 323
the region used NT in 2007, while 44% remained under a tillage-based management.Conservation tillage statistics had previously estimated 37% of the region to beunder NT and 63% to be under tillage-based management (CTIC 2004). Differencesbetween these statistics and those obtained through this study suggest that NTadoption has increased throughout the region and may quickly become the new “con-vention” in cropland management. We make this statement with caution, however,as some degree of difference between the reported percentages could have resultedfrom unknown inaccuracies within each estimate and because additional sourcesof regional tillage statistics are lacking. Unfortunately, statistics that distinguishbetween regional lands under more intensive tillage management from those underMT have yet to be collected.
The collection of these statistics will allow future regional C sequestration esti-mates to be adjusted accordingly.
Only 5% of the evaluated cropland was estimated to have incorporated a 1.0crop intensity (continuous cropping) in 2007. Crop intensity percentages were notgreater in sub-regions with higher MAP, as had been expected. If this assumptionhad proven true, the Great Falls area would have had the largest proportion ofcropland under a 1.0 crop intensity while Chester, a notably drier area, would havehad the least amount of land under continuous crop. The study results showedthat these areas did not differ greatly in the amount of land under a 1.0 rotation(5% Great Falls, 7% Chester). Dutton and Big Sandy/Fort Benton had the highestpercentages (77% and 70%, respectively) of cropland under a 0.5 intensity (crop-fallow), although the annual precipitation in these areas was between that of Chesterand Great Falls. These findings suggest that the decision to incorporate a highercrop intensity might be more likely influenced by cultural practices than by localizedannual precipitation. Financial incentives through C-credit programs might providethe necessary stimulant for an increased regional adoption of higher crop rotationintensity, but the C-credit payments would have to be substantial enough to offsetany financial risk associated with continuous cropping within a dryland system.
4.2 Regional sequestration
The regional estimates presented within this study provide a foundation upon which amore precise accounting of sequestration potential might be built. The sequestrationrates used to generate the regional estimates represent systems with adequate Cstorage capacity, though the duration of C sequestration following an alterationin cropland management, or a conversion to CR, is debatable. SOC in a systemconverted from tillage to NT was predicted to peak 5–10 years following the change,reaching equilibrium after 15–20 years (West and Post 2002). Another estimatepredicted that equilibrium would require 40 years, 20 years at a constant ratefollowed by 20 years at a steadily declining rate until equilibrium is reached (Marlandet al. 2003). Fifty years has been suggested as adequate for SOC recovery followingconversion to grassland (Burke et al. 1995). Given these ranges, the presentedsequestration estimates are thought to be most appropriate for systems in early tomiddle stages of C recovery.
4.2.1 Conservation reserve
The regional lands under CR in 2007 were estimated to have a sequestrationpotential of 18,855 t C year−1 (69,198 t CO2 year−1). The literature-based SOC

324 Climatic Change (2011) 108:301–331
rates used to derive the rate average for this estimate were reported by studieshaving similar vegetation type and grazing activity to that within the study region.The average MAP for the literature-based studies was greater (∼17 cm) than whatis typically found in north central Montana. Precipitation plays a key role in theability of grasslands to sequester SOC (Uri 2001). It is therefore likely that thisregional sequestration estimate is somewhat higher than in actuality, as it is basedon sequestration rates representative of lands under greater MAP.
Vegetation type might be important to consider when analyzing C sequestrationpotential in CR lands. The two highest literature-based SOC rates occurred incrested wheatgrass and brome/wheatgrass/alfalfa systems (White et al. 1976), eachcharacterized by aggressive non-native, cool-season, grasses that had traditionallybeen popular when seeding into grass and range systems. The least amount of SOCsequestration was observed in a blue grama community (Burke et al. 1995). Bluegrama is a native grass that typically has dense, shallow, roots and slow establishment.
Nitrogen plays an important role in facilitating SOC increase within CR systems(Baer et al. 2000; Purakayastha et al. 2008). Legumes such as alfalfa are oftenincluded within CR systems and, not uncommonly, in rangeland because of nitrogenbenefits. Further evaluation is needed to determine what species have long term ad-vantages for C sequestration within northern grassland systems. One Canadian studycautioned that while certain species, such as crested wheatgrass and Russian wildrye,might out produce many native species in above-ground biomass, sustained below-ground C production can often be higher in established native grasses (Dormaar et al.1995). Therefore, the abundant above-ground biomass produced by more aggressivespecies might result in better C gains initially, but could be later outperformed bynative grass communities.
The influence of cattle on C sequestration must also be considered. Two of theliterature-based studies included lands that were under some degree of minimalgrazing management (White et al. 1976; Burke et al. 1995). The amount of grazingthat occurs within CR lands in north central Montana is undocumented, but isthought to be minimal and site-specific. Grazing, when applied appropriately, hasbeen shown to increase C sequestration in semi-arid grasslands through manuringand the incorporation of plant litter by animal hooves into surface soils (Reeder andSchuman 2002). While some grazing might be advantageous, overgrazing has beenshown to result in a decreased C sequestration where full season grazing appliedto a brome/wheatgrass/alfalfa community resulted in only 14 g C m−2 year−1, com-pared to 19 g C m−2 year−1 that occurred in the short season grazing treatment(White et al. 1976).
The sequestration rate currently used by CCX for lands having converted fromcropland to perennial grass is 67 g C m−2 year−1, substantially higher than any ofthe evaluated literature-based studies. Even the alfalfa-inclusive study with a highMAP and favorable grazing application conditions (White et al. 1976) reported33 g C m−2 year−1 less than what is allocated by the CCX rate. A Saskatchewanstudy with a MAP more similar to north central Montana reported a higher rate of40 g C m−2 year−1 within a managed alfalfa crop (Wu et al. 2003), but even this ratefalls short of the CCX value. We note that this particular study was excluded fromour analysis of sequestration rates as it would be unlikely to find pure, non-irrigated,alfalfa within a north central Montana CR system.

Climatic Change (2011) 108:301–331 325
Based on the findings within this study, the CCX rate of 67 g C m−2 year−1islikely unrepresentative of typical CR systems found within north central Montanaand throughout portions of the semi-arid northern Great Plains, particularly thoseregions represented within the literature-based studies from which our sequestrationrates were obtained. It is important to recognize that this CCX rate encompasses aregional area spanning over half the United States and incorporates many differentclimatic zones. While the current CCX rate might be appropriate for some regions,further refinement of C accreditation rates used within the CCX or future C creditprograms might be appropriate.
4.2.2 Cropland management
The most general evaluation of C sequestration potential within the region assumedthat the tillage management types (intensive tillage and MT) occurred equallythroughout the region and did not give individual consideration to crop intensity.This estimate showed that 46,555–60,522 t C year−1 (170,857–222,116 t CO2 year−1)
might be sequestered within the 0–20 cm soil depth. The predicted regional SOCsequestration was found to be more moderate for the MT-to-NT assumptions(37,244 t C year−1), and was expectedly higher under an intensive tillage-to-NTadjustment (55,866–81,472 t C year−1). The validity of C credit systems using asimple binary separation for tillage management type (“tillage” or NT) becomesquestionable, given these differences between intensive tillage-to-NT and MT-to-NTsystems.
Crop intensity adjustments coinciding with the adoption of NT were found tohave considerable effect on the regional sequestration predictions. The total regionalsequestration potential if all lands converted to NT management and a 1.0 cropintensity, also assuming an across-tillage scenario, was 43,390 t C year−1. Compar-atively, sequestration estimates for all regional lands converting to a 1.0 intensitywas 54,074 t C year−1 for intensive tillage-to-NT and 30,378 t C year−1 for MT-to-NT. These potentials resulting from the regional conversion to a 1.0 crop intensitywere more minimal than in the across-intensity scenario estimates, simply becauselower sequestration rates were allocated to lands already under 0.75 and 1.0 cropintensities.
Another factor, in addition to lesser sequestration potentials within 0.75 and 1.0systems, contributed to a lower regional estimate for the intensive tillage-to-NTscenario. The literature-based rate estimate for systems converting from a 0.5-to-1.0 crop intensity was only 28 g C m−2 year−1, compared to 14–43 g C m−2 year−1 forsystems retaining a 0.5 intensity. Reductions in summer fallowing have been highlyadvocated for increased C sequestration, however the 0.5-to-1.0 conversion rate wasnot substantially higher than the 0.5 intensity rate.
Systems incorporating fallow must produce more residues than continuous crop-ping systems in order to offset diminish C pools during periods where residue inputsare absent and to prevent a net decrease in SOC (Li and Feng 2002). This suggeststhat many of the observed 0.5 systems yielded substantially higher crop residue levelsthan the 1.0 systems. The differences in residue between the two system types mightbe attributed to water and nutrient management within dryland settings. Optimal

326 Climatic Change (2011) 108:301–331
soil water and fertility levels are critical in maintaining crop residue production, andin turn SOC increase (Follett 2001). Continuous crop production must be achievedin a manner that does not deplete soil moisture to a point where crop growth(and hence SOC input) becomes compromised. Careful consideration to particularcrop rotations suited for semi-arid regions with variable precipitation patterns isessential in facilitating a continuous cropping system that can adequately sustainplant biomass production and manage drought (Jones and Popham 1997; Angus andvan Herwaarden 2001; Miller et al. 2002; Krupinsky et al. 2007).
The current CCX crediting design recognizes the potential for SOC sequestrationin Montana dryland systems converting from “tillage” to NT. The design doesnot account for different forms of tillage management, specifically intensive tillageor MT, that might have occurred prior to NT adoption, nor does it account forany coinciding adjustment in crop rotation intensity. The CCX rating system doesencourage, indirectly, higher crop intensities within contracted NT fields as C creditsare not allocated during years of summer fallow.
A range of variability was found between the C sequestration rates reportedwithin this study and CCX rates, when the CCX rates were applied within a four-year rotation system. The CCX rate for systems using a 0.5 crop intensity was 8–60% (11 vs. 12–28 g C m−2 year−1) lower than the across-tillage rate average. On theother hand, the CCX rate for systems with a 0.75 crop intensity was 130% higher thanreported within this study (17 vs. 13 g C m−2 year−1). The CCX rate was equivalent tothe across-tillage rate (22 g C m−2 year−1) for systems converting to continuous crop.The CCX rate does not distinguish between systems within long term 1.0 rotations(estimated to sequester only 7 g C m−2 year−1) and those having recently adoptedcontinuously cropping. Future C credit systems should carefully consider the effectthat different levels of crop intensity might have on C sequestration within semi-aridcroplands and recognize that continuous cropping systems might not always produceoptimal C sequestration levels.
5 Conclusions and thoughts for future policy
C mitigation is a growing concern within the United States. Certain agriculturalmanagement changes, including the adoption of NT, reductions in summer fallowing,and the conversion of croplands to perennial CR grassland, have been advocatedas relatively simple ways to increase SOC sequestration. The regional adoption ofthese practices within a small portion of Montana (717,586 ha) might sequester∼240,055–291,314 t CO2 year−1, and represents the potential to offset 2.5% ofthe projected (2010) CO2 emissions from Montana-based coal and natural gasconsumption (CCAC 2007). Substantial economic benefits might also result fromthis added sequestration and are estimated at $ 1.6–2 million (USD), assuming $ 7per t CO2 (Paltsev et al. 2007).
Future attempts to determine regional C sequestration potential will benefitgreatly from consistent and reliable sources for land use data pertaining to tillagemanagement and crop intensity types, and CR lands occurring outside of CRPcontract. Increased accuracies within satellite-based classifications and increasedprocessing capabilities might make annual land use mapping, at a scale suitable forcropland sequestration purposes, feasible within the near future. It might be prudent,

Climatic Change (2011) 108:301–331 327
in the mean time, for state and national agencies to evaluate the inclusion of thesemanagement categories into existing agricultural surveys and census.
Further effort within the scientific community is needed to provide regionallyspecific C sequestration data, and to address the impact that variations in croplandmanagement might have on SOC sequestration. Specific focus should be given to:
1. Establishing C rates for CR systems occurring within the northern Great Plainsand within cool/temperate systems having a MAP < 400 mm. This should includean analysis of SOC optimization according to vegetation type, the inclusion oflegumes, and animal grazing.
2. Evaluating SOC rate differences resulting from intensive tillage-to-NT and MT-to-NT conversions. Less SOC is expected to occur in systems that used MTmanagement prior to NT adoption, as has been demonstrated in other studies,but further research is needed to evaluate these differences. Consequently,future mapping efforts should attempt to separate intensive tillage managementfrom MT. The additional refinement of tillage land use documentation will assistfuture studies in developing better estimates of regional sequestration potential.
3. Better determining the role of crop rotation intensity on SOC sequestrationwithin dryland cropping systems and land use patterns associated with cropintensity. The literature-based rates counter-intuitively suggest that SOC ratesmight be greater in some systems where a crop/fallow (0.5 intensity) rotationis used in conjunction with NT management, than in systems under continuouscropping (1.0 intensity). The effect of cropping sequence on residue productionand, consequently, SOC sequestration in continuously cropped dryland systemsalso warrants further examination.
4. Further examining the long-term duration of SOC sequestration potential indryland systems characterized by changes in tillage management, crop intensity,and the adoption of CR.
Additional action should be made by C-credit markets to address the current stateof knowledge for SOC sequestration within cropland and CR lands and to ensurethat C gains at contracted sites are adequately reflected by the assigned SOCrates. Broad rate estimates are often used to assign C credit. This approach canbe inadequate when determining regionally-specific sequestration potential. Greateraccuracy can be obtained by allocating C credits according to area-specific (Mooneyet al. 2007) and management-specific C data. The ability to obtain these data ina timely manner ultimately requires the ability to accurately, quickly, and cheaplymeasure soil C. Emerging technologies might make the rapid, in situ, determinationof soil C available in the near future (Gehl and Rice 2007; Vasques et al. 2009).In the mean time, however, C rate estimates, and regional estimates of SOC storagepotential, will remain limited to the coarser approximations evident within publishedliterature.
Acknowledgements We thank Dr. B. G. McConkey for his advice in the production of thismanuscript. This research was funded by the U.S. Department of Energy and the National EnergyTechnology Laboratory through Award number: DE-FC26-05NT42587. Neither the United StatesGovernment nor any agency thereof, nor any of their employees, makes any warranty, express orimplied, or assumes any legal liability or responsibility for the accuracy, completeness, or usefulnessof any information, apparatus, product, or process disclosed, or represents that its use wouldnot infringe privately owned rights. The views and opinions of authors expressed herein do notnecessarily state or reflect those of the United States Government or any agency thereof.

328 Climatic Change (2011) 108:301–331
References
Aase JK, Pikul JL (1995) Crop and soil response to long-term practices in the northern Great Plains.Agron J 87:652–656
Angus JF, van Herwaarden AF (2001) Increasing water use and water use efficiency in drylandwheat. Agron J 93:290–298
Bachu S (2008) CO2 storage in geological media: role, means, status, and barriers to deployment.Prog Energy Combust Sci 34:254–273
Baer SG, Rice CW, Blair JM (2000) Assessment of soil quality in fields with short and long termenrollment in the CRP. J Soil Water Conserv 33:142–152
Barrett EC, Curtis LF (1999) Monitoring the environment. Introduction to Environmental RemoteSensing. Stanley Thornes, Gloucester, p 457
Bayon R, Hawn A, Hamilton K (2007) Voluntary carbon markets: an international business guide towhat they are and how they work. Earthscan, London, p 164
Benz UC, Hofmann P, Willhauck G et al (2004) Multi-resolution, object-oriented fuzzy analysis ofremote sensing data for GIS-ready information. ISPRS J Photogramm Remote Sensing 58:239–258
Biradar CM, Thenkabail PS, Noojipady P et al (2009) A global map of rainfed cropland areas(GMRCA) at the end of last millennium using remote sensing. Int J Appl Earth Obs Geoinf11:114–129
Black AL (1973) Soil property changes associated with crop residue management in a wheat-fallowrotation. Proc SSSA 37:943–946
Black AL, Tanaka DL (1997) A conservation tillage-cropping system study in the Northern GreatPlains of the United States. In: Paul EA, Elliott ET, Paustian K, Cole C V (eds) Soil OrganicMatter in Temperate Agroecosystems. CRC, Boca Raton, pp 335–340
Bricklemyer RS (2003) Sensitivity of the Century model for estimating sequestered soil carbon usingcoarse and fine-scale map data sources in north central Montana. MS Thesis, Montana StateUniversity, Bozeman, p 136
Bricklemyer RS, Miller PR, Turk PJ et al (2007) Sensitivity of the Century model to scale-relatedsoil texture variability. Soil Sci Soc Am J 71:784–792
Burke IC, Lauenroth WK, Coffin DP (1995) Soil organic matter recovery in semiarid grasslands:implications for the conservation reserve program. Ecol Appl 3:793–801
Campbell CA, Selles F, Lafond GP, Zentner RP (2001) Adopting zero tillage management: impacton soil C and N under long-term crop rotations in a thin Black Chernozem. Can J Soil Sci 81:139–148
Capalbo SM (2005) Big Sky Carbon Sequestration Partnership phase II: proposal summary andoverview. Big Sky Carbon Sequestration Partnership, 7 pp
CCAC (2007) Montana climate change action plan: final report of the Governor’s climate changeadvisory committee. The Montana State Climate Change Advisory Committee, p 93
CCX (2008a) Overview and frequently asked questions: Chicago Climate Exchange offsets forcarbon capture and storage in agricultural soils. Chicago Climate Exchange White Pages, p 12
CCX (2008b) CCX agricultural soil carbon sequestration offset project guidelines. Chicago ClimateExchange White Pages, p 26
CCX (2008c) CCX agricultural grass soil carbon sequestration offset project guideline. ChicagoClimate Exchange White Pages, p 12
Cohen WB, Goward SN (2004) Landsat’s role in ecological applications of remote sensing. Bio-Science 54:535–545
Coleman K, Jenkinson DS (1996) RothC-26.2-A model for the turnover of carbon in soil. In: PowlsonDS, Smith JU (eds) Evaluation of soil organic matter models using existing, long-term datasets.NATO ASI Series I, vol 38. Springer, Berlin, pp 237–246
CTIC (2004) Montana cropland conservation tillage statistics by county. Conservation TechnologyInformation Center, West Lafayette
Dormaar JF, Naeth MA, Willms WD, Chanasyk DS (1995) Effect of native prairie, Crested wheat-grass (Agropyron cristatum (L.) Gaertn.) Russian wildrye (Elymus Junceus Fisch.) on soil chem-ical properties. J Range Manage 48:258–263
Egbert SL, Lee RY, Price KP, Boyce R (1998) Mapping conservation reserve program (CRP)grasslands using multi-seasonal Thematic Mapper imagery. Geocarto Int 13:1010–6049
Egbert SL, Park S, Price KP et al (2002) Using conservation reserve program maps derived fromsatellite imagery to characterize landscape structure. Comput Electron Agric 37:41–156

Climatic Change (2011) 108:301–331 329
Eve MD, Sperow M, Paustian K, Follett RF (2002) National-scale estimation of changes in soilcarbon stocks on agricultural lands. Environ Pollut 116:431–438
Figueroa JD, Fout T, Plasynski S, McIlvried H, Srivastava RD (2008) Advances in CO2 capturetechnology—the US Department of Energy’s Carbon Sequestration Program. Int J GreenhouseGas Control 2:9–20
Follett RF (2001) Soil management concepts and carbon sequestration in cropland soils. Soil Till Res61:77–92
Follett RF, McConkey B (2000) The role of cropland agriculture for C sequestration in the GreatPlains. Proc Great Plains Soil Fertility Conference 8:1–15
Gallego FJ (2004) Remote sensing and land cover area estimation. Int J Remote Sens 25:3019–3047Gebhart DL, Johnson HB, Mayeux HS, Polley HW (1994) The CRP increases soil organic carbon.
J Soil Water Conserv 49:488–492Gehl RJ, Rice CW (2007) Emerging technologies for in situ measurement of soil carbon. Climatic
Change 80:43–54Halvorson AD, Wienhold BJ, Black AL (2002) Tillage, nitrogen, and cropping system effects on soil
carbon sequestration. Soil Sci Soc Am J 66:906–912HPRCC (2008) Climate summary maps and archived station data. High Plains Regional Climate
Center. Available online at http://www.hprcc.unl.edu/. Accessed 10 Dec 2009Houghton RA, Hackler JL (2000) Changes in terrestrial carbon storage in the United States I: the
role of agriculture and forestry. Global Ecol Biogeogr 9:125–144Houghton RA, Hackler JL, Lawrence KT (1999) The US carbon budget: contributions from land-use
change. Science 285:574–578Jacobs J, Nadwornick R (2008) Review of conservation reserve program (CRP) native grass, forb,
and shrub establishment. Plant Materials Technical Note Number MT-40, US Department ofAgriculture Natural Resource Conservation Service, p 2
Jarecki MK, Lal R (2003) Crop management for soil carbon sequestration. Crit Rev Plant Sci 22:471–502
Jones OR, Popham TW (1997) Cropping and tillage systems for dryland grain production in thesouthern high plains. Agron J 89:222–232
Kay BD, VandenBygaart AJ (2002) Conservation tillage and depth stratification of porosity and soilorganic matter. Soil Till Res 66:107–118
Kerr JT, Ostrovsky M (2003) From space to species: ecological applications for remote sensing.Trends Ecol Evol 18:299–305
Krupinsky JM, Merrill SD, Tanaka DL et al (2007) Crop residue coverage of soil influenced by cropsequence in a no-till system. Agron J 99:921–930
Lachowski HM, Johnson VC (2001) Remote sensing applied to ecosystem management. In:Jensen ME, Bourgeron PS (eds) A guidebook for integrated ecological assessments. Springer,New York, pp 135–150
Lal R (2004) Soil carbon sequestration impacts on global climate change and food security. Science304:1623–1627
Lal R, Kimble J, Levine E (1995) Soil management and greenhouse effect. Lewis, Boca Raton,p 355
Lal R, Kimble JM, Follett R, Cole CV (1998) The potential of US cropland to sequester carbon andmitigate the greenhouse effect. CRC, Boca Raton, p 128
Lefsky MA, Cohen WB, Parker GG, Harding DJ (2002) Lidar remote sensing for ecosystem studies.BioScience 52:19–30
Li X, Feng Y (2002) Carbon sequestration potentials in agricultural soils. AIDIS-CANADA Envi-ronmental Project, p 11
Marland G, West TO, Schlamadinger B, Canella L (2003) Managing soil organic carbon in agricul-ture: the net effect on greenhouse gas emissions. Tellus B 55:613–621
McConkey BG, Liang BC, Campbell CA (1999) Estimating gains of soil carbon over 15-yr perioddue to changes in fallow frequency, tillage system, and fertilization practices for the CanadianPrairies (an expert opinion). Agriculture and Agri-Food Canada, Publication #379M0209,p 14
McConkey BG, Liang BC, Campbell CA et al (2003) Crop rotation and tillage impact on carbonsequestration in Canadian prairie soils. Soil Till Res 74:81–90
McLauchlan K (2006) Agricultural impacts on soil carbon and nutrients: a review. Ecosystems9:1364–1382
Melillo JM, Borchers J, Chaney J et al (1995) Vegetation/ecosystem modeling and analysisproject comparing biogeography and biogeochemistry models in a continental-scale study of

330 Climatic Change (2011) 108:301–331
terrestrial ecosystem response to climate change and CO2 doubling. Global Biogeochem Cy9:407–437
Miller PR, McConkey BG, Clayton GW et al (2002) Pulse crop adaptation in the northern GreatPlains. Agron J 94:261–272
Mooney S, Gerow K, Antle J et al (2007) Reducing standard errors by incorporating spatial autocor-relation into a measurement scheme for soil carbon credits. Climatic Change 80:55–72
Moore DS (2004) The basic practice of statistics. Freeman, New York, p 674NCOC (2008) Exchange soil offset eligible practices and offset issuance rates by zone: cropland
protocol guidelines. National Carbon Offset Coalition, Butte, p 23NRCS (2007a) Major biomes map. Natural Resource Conservation Service. Available online at
http://soils.usda.gov/use/worldsoils/mapindex/biomes.html. Accessed 12 Dec 2009NRCS (2007b) Interactive soil survey map. Natural Resources Conservation Service. Available
online at http://websoilsurvey.nrcs.usda.gov/app/WebSoilSurvey.aspx. Accessed 10 Dec 2009NRCS (2008) Tillage practice guide: a guide to USDA-NRCS practice standards 329 no till/strip
till/direct seed & 345 mulch till. USDA Practice Standard 329. Natural Resource ConservationService, United States Department of Agriculture, USA, p 1
NWS (2007) Past weather: local climate information. National Weather Service, National Oceanicand Atmospheric Administration. Available online at http://www.nws.noaa.gov. Accessed 3 May2008
Padbury G, Waltman S, Caprio J et al (2002) Agroecosystems and land resources of the northernGreat Plains. Agron J 94:251–261
Paltsev S, Jacoby HD, Reilly JM et al (2007) Assessment of US Cap-and-Trade proposals. WorkingPaper 13176. National Bureau of Economic Research, Cambridge, p 77
Parton WJ, Ojima DS, Schimel DS (2005) CENTURY: modeling ecosystem responses to climatechange, Version 4 (VEMAP 1995) Natural Resources Ecology Laboratory. Colorado State Uni-versity, USA. Available online at http://www.cgd.ucar.edu/vemap/abstracts/CENTURY.html.Accessed 20 Nov 2009
Paustian K, Six J, Elliott ET, Hunt HW (2000) Management options for reducing CO2 emissionsfrom agricultural soils. Biogeochemistry 48:147–163
Post WM, Kwon KC (2000) Soil carbon sequestration and land-use change: processes and potential.Global Change Biol 6:317–327
Post WM, Izaurralde RC, Jastrow JD et al (2004) Enhancement of carbon sequestration in US soils.BioScience 54:895–908
Potter KN, Jones OR, Torbert HA, Unger PW (1997) Crop rotation and tillage effects on organiccarbon sequestration in the semiarid southern Great Plains. Soil Sci 162:140–147
Price KP, Egbert SL, Nellis MD, Lee RY, Boyce R (1997) Mapping land cover in a High Plains agro-ecosystem using a multi-date Landsat Thematic Mapper modeling approach. Trans Kans AcadSci 100:21–33
Purakayastha TJ, Huggins DR, Smith JL (2008) Carbon sequestration in native prairie, perennialgrass, no-till, and cultivated palouse silt loam. Soil Sci Soc Am J 72:534–540
Reeder JD, Schuman GE (2002) Influence of livestock grazing on C sequestration in semi-arid mixedgrass and short-grass rangelands. Environ Pollut 116:457–463
Robles MD, Burke IC (1997) Legume, grass, and conservation reserve program effects on soilorganic matter recovery. Ecol Appl 7:345–357
Sainju UM, Caesar-TonThat T, Lenssen AW et al (2007) Long-term tillage and cropping sequenceeffects on dryland residue and soil carbon fractions. Soil Sci Soc Am J 71:1730–1739
Schimel DS, Braswell BH, Holland EA et al (1994) Climatic, edaphic, and biotic controls overstorage and turnover of carbon in soils. Global Biogeochem Cy 8:279–293
Schlesinger WH (1977) Carbon balance in terrestrial detritus. Annu Rev Ecol Syst 8:51–81Schuman GE, Janzen HH, Herrick JE (2002) Soil carbon dynamics and potential carbon sequestra-
tion by rangelands. Environ Pollut 116:391–396Schrag DP (2007) Preparing to capture carbon. Science 315:812–813Sherrod LA, Peterson GA, Westfall DG, Ahuja LR (2003) Cropping intensity enhances soil organic
carbon and nitrogen in a no-till agroecosystem. Soil Sci Soc Am J 67:1533–1543Smith P (2004) How long before a change in soil organic carbon can be detected? Glob Change Biol
10:1878–1883Sperow M, Eve M, Paustian K (2003) Potential soil C sequestration on U.S. agricultural soils.
Climatic Change 57:319–339Staben ML, Bezdicek DF, Fauci MF, Smith JL (1997) Assessment of soil quality in conservation
reserve program and wheat-fallow soils. Soil Sci Soc Am J 61:124–130

Climatic Change (2011) 108:301–331 331
Turner DP, Koerper ME, Harmon E, Lee JJ (1995) Carbon sequestration by forests of the UnitedStates. Current status and projections to the year 2040. Tellus Ser B 47:232–239
Uri ND (2001) The potential impact of conservation practices in US agriculture on global climatechange. J Sustain Agr 18:109–131
USDA-FSA (2007) Managed haying and grazing on conservation reserve program (CRP) acres(new provisions). USDA Service Center white pages. Farm Service Agency, United StatesDepartment of Agriculture, USA, p 2
USDA-FSA (2009) News release: FSA announces spring grazing on CRP acres. USDA ServiceCenter white pages. Farm Service Agency, United States Department of Agriculture, USA,p 1
USDA-NASS (2007) Field crops: 2007 and 2002. Census of Agriculture - United States data,Montana, Table 26. USDA National Agricultural Statistics Service, USA, p 10
Vasques GM, Grunwald S, Sickman JO (2009) Modeling of soil organic carbon fractions usingvisible-near-infrared spectroscopy. Soil Sci Soc Am J 73:176–184
Watts JD, Lawrence RL, Miller PR, Montagne C (2009) Monitoring of cropland practices for carbonsequestration purposes in north central Montana by Landsat remote sensing. Remote SensEnviron 113:1843–1852
West TO, Six J (2007) Considering the influence of sequestration duration and carbon saturation onestimates of soil carbon capacity. Climatic Change 80:25–41
West TO, Post WM (2002) Soil organic carbon sequestration rates by tillage and crop rotation:a global data analysis. Soil Sci Soc Am J 66:1930–1946
White EM, Krueger CR, Moore RA (1976) Changes in total N, organic matter, available P, and bulkdensities of a cultivated soil 8 years after tame pastures were established. Agron J 68:581–583
WRCC (2006) Historical climate information. Western Regional Climate Center. Available onlineat http://www.wrcc.dri.edu/CLIMATEDATA.html. Accessed 10 Nov 2009
Wu T, Schoenau JJ, Li F et al (2003) Effect of tillage and rotation on organic carbon forms ofchernozemic soils in Saskatchewan. J Plant Nutr Soil Sc 166:328–335
Xie H, Tian YQ, Granillo JA, Keller GR (2007) Suitable remote sensing method and data formapping and measuring active crop fields. Int J Remote Sens 28:395–411
Young LM (2003) Carbon sequestration in agriculture: the U.S. policy context. Am J Agr Econ85:1164–1170