air quality assessment report vicdom utica pit · 034048 vicdom utica air quality assessment...
TRANSCRIPT
Air Quality Assessment Report Vicdom Utica Pit
Prepared By:
R.J. Burnside & Associates Limited 6990 Creditview Road, Unit 2 Mississauga ON L5N 8R9
Prepared for:
Vicdom Sand & Gravel 3444 Brock Rd Uxbridge, ON L9P 1R4
September 2013
File No: 300034048 The material in this report reflects best judgement in light of the information available at the time of preparation. Any use which a third party makes of this report, or any reliance on or decisions made based on it, are the responsibilities of such third parties. R.J. Burnside & Associates Limited accepts no responsibility for damages, if any, suffered by any third party as a result of decisions made or actions based on this report.

Vicdom Utica Pit i Air Quality Assessment Report September 2013
R.J. Burnside & Associates Limited 300034048 034048 VicDom Utica Air Quality Assessment Report.docx
Table of Contents
Definitions ....................................................................................................................... iii
Executive Summary ....................................................................................................... iv
1.0 Introduction and Site Description ................................................................. 1 1.1 Purpose and Scope of the Air Quality Assessment .......................................... 1 1.2 Description of Processes and NAICS Code ..................................................... 1 1.3 Description of Products and Raw Materials ...................................................... 1 1.4 Process Flow Diagram ...................................................................................... 2 1.5 Operating Schedule .......................................................................................... 2
2.0 Initial Identification of Sources and Contaminants ..................................... 3 2.1 Operating Configuration .................................................................................... 3 2.2 Sources and Contaminants Identification Table ............................................... 3
3.0 Assessment of the Significance of Contaminants and Sources ................ 4 3.1 Identification of Negligible Contaminants and Sources .................................... 4 3.1.1 Rationale for Assessment ................................................................................. 4 3.1.1.1 PM10 and PM2.5 ................................................................................................. 4 3.1.1.2 Dustfall .............................................................................................................. 5 3.1.1.3 Combustion Emissions from the Diesel Engine ................................................ 5 3.2 Identification of Negligible Contaminants and Sources .................................... 5 3.2.1 Rationale for Assessment ................................................................................. 6 3.2.1.1 Aggregate Storage Piles ................................................................................... 6 3.2.1.2 Tailpipe Emissions from On-Site Mobile Equipment ......................................... 6 3.2.1.3 Overburden Stripping and Rehabilitation Activities ........................................... 6 3.2.1.4 Wind Erosion of Open Working Face ............................................................... 7
4.0 Operating Conditions, Emissions Estimating and Data Quality Emissions ........................................................................................................ 8
4.1 Description of Operating Conditions ................................................................. 8 4.2 Explanation of the Method Used to Calculate Emission Rates ......................... 8 4.3 Assessment of Data Quality ............................................................................. 9
5.0 Source Summary Table and Site Plan ........................................................ 10 5.1 Source Summary Table .................................................................................. 10 5.2 Site Plan ......................................................................................................... 10
6.0 Dispersion Modelling ................................................................................... 11 6.1 Dispersion Modelling Scenarios ..................................................................... 11 6.2 Dispersion Modelling Input Summary ............................................................. 11 6.2.1 Deposition ....................................................................................................... 11 6.2.2 Meteorology and Land Use Data .................................................................... 12 6.3 Terrain ............................................................................................................ 12 6.4 Area of Modelling Coverage ........................................................................... 12 6.5 Coordinate System ......................................................................................... 13 6.6 Averaging Time and Conversions ................................................................... 13 6.7 Dispersion Modelling Input and Output Files .................................................. 13

Vicdom Utica Pit ii Air Quality Assessment Report September 2013
R.J. Burnside & Associates Limited 300034048 034048 VicDom Utica Air Quality Assessment Report.docx
7.0 Emissions Summary Table and Conclusions ............................................ 14 7.1 Emissions Summary Table ............................................................................. 14 7.2 Assessment of Contaminants with no MOE POI Limits .................................. 14 7.3 Conclusions & Recommendations .................................................................. 15 7.4 Limitations and Use of Report ........................................................................ 16 Tables Table 1: Sources and Contaminants Identification Table Table 2: Source Summary Table Table 3: Dispersion Modelling Input Summary Table Table 4: Emissions Summary Table Figures Figure 1 Site Location Plan Figure 2 Land Use Zoning Plan Figure 3 Site Operational Plan Figure 4 Process Flow Diagram Appendices A Supporting Calculations B Dispersion Modelling Printouts C Equipment Data Sheets D Modelling Files on CD
Vicdom Utica Pit iii Air Quality Assessment Report September 2013
R.J. Burnside & Associates Limited 300034048 034048 VicDom Utica Air Quality Assessment Report.docx
Definitions
Vicdom Vicdom Sand & Gravel Site1 3900 Lakeridge Road, Part of Lot 15, Concession 7
and 8 and Part of the Road Allowances between Lots The ADMGO “Air Dispersion Modelling Guideline for Ontario”,
PIBS: 5165e Air Dispersion Model Air Dispersion Model described in Appendix to Ontario
Regulation 346. CAS# Chemical Abstract Society reference number EF Emission Factor ESDM Emissions Summary and Dispersion Model ESDM Procedure Document “Procedure for Preparing an Emission Summary and
Dispersion Modelling Report” dated March 2009, PIBS: 3614e03
ESDM Report Checklist “Emission Summary and Dispersion Modelling Checklist”, dated November 2005, PIBS: 5357e
Insignificant Negligible List of MOE POI Limits Schedule 3 of “SUMMARY of STANDARDS and
GUIDELINES to support Ontario Regulation 419: Air Pollution – Local Air Quality (including Schedule 6 of O. Reg. 419 on UPPER RISK THRESHOLDS)” Dated April 2012, PIBS: 6569e01
And “Jurisdictional Screening Level (JSL) List, A Screening
Tool for Ontario Regulation 419: Air Pollution – Local Air Quality”, 6547e.pdf dated February 2008.
MOE Ontario Ministry of the Environment NOx Nitrogen Oxides O. Reg. 346 Ontario Regulation 346 O. Reg. 419 Ontario Regulation 419/05 SPM Suspended Particulate Matter TSP Total Suspended Particulate PM Particulate Matter POI Point of Impingement (Contaminant) POR Point of Reception (Noise) Products of Combustion Contaminants emitted as a result of burning natural
gas Significant Non-negligible Source ID The alphanumeric string assigned to a discharge point
otherwise known as a “source reference number” in the “Acme Example” PIBS: 5987e.pdf.
1 The term Site is used specifically to clearly indicate the difference between the term facility used in O. Reg. 419 and the term Site which refers to the specific address and everything inside the property boundary.
Vicdom Utica Pit iv Air Quality Assessment Report September 2013
R.J. Burnside & Associates Limited 300034048 034048 VicDom Utica Air Quality Assessment Report.docx
Executive Summary
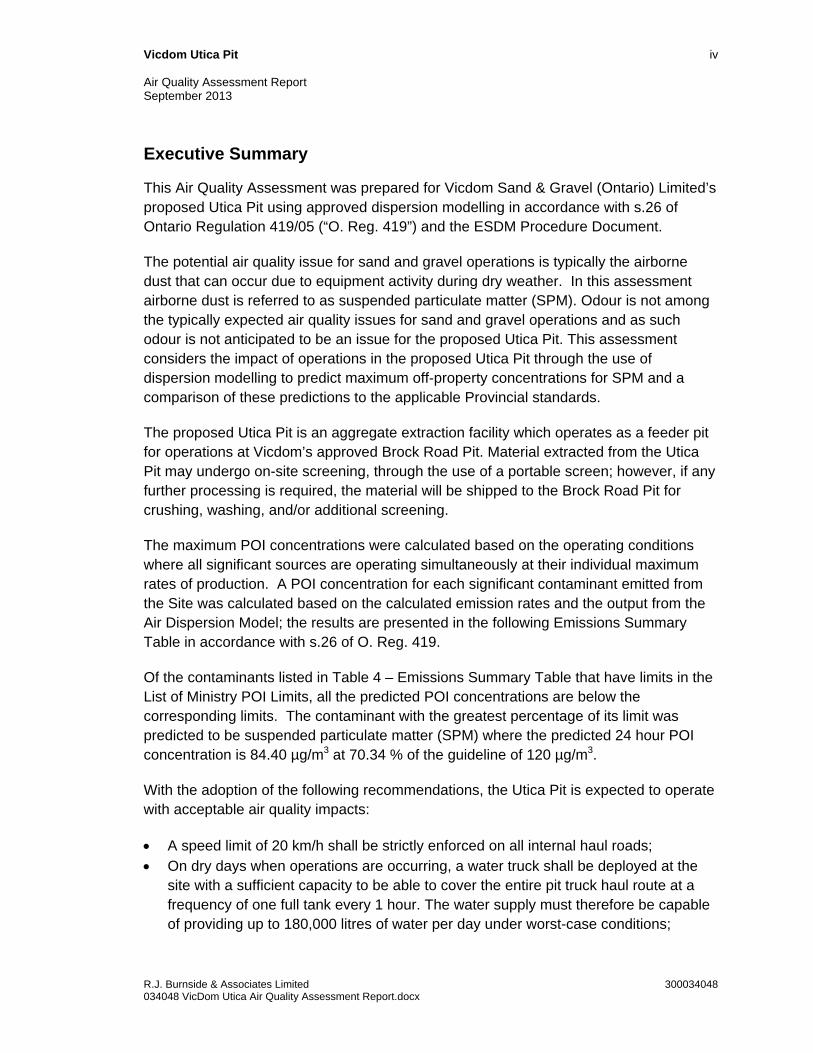
This Air Quality Assessment was prepared for Vicdom Sand & Gravel (Ontario) Limited’s proposed Utica Pit using approved dispersion modelling in accordance with s.26 of Ontario Regulation 419/05 (“O. Reg. 419”) and the ESDM Procedure Document.
The potential air quality issue for sand and gravel operations is typically the airborne dust that can occur due to equipment activity during dry weather. In this assessment airborne dust is referred to as suspended particulate matter (SPM). Odour is not among the typically expected air quality issues for sand and gravel operations and as such odour is not anticipated to be an issue for the proposed Utica Pit. This assessment considers the impact of operations in the proposed Utica Pit through the use of dispersion modelling to predict maximum off-property concentrations for SPM and a comparison of these predictions to the applicable Provincial standards.
The proposed Utica Pit is an aggregate extraction facility which operates as a feeder pit for operations at Vicdom’s approved Brock Road Pit. Material extracted from the Utica Pit may undergo on-site screening, through the use of a portable screen; however, if any further processing is required, the material will be shipped to the Brock Road Pit for crushing, washing, and/or additional screening.
The maximum POI concentrations were calculated based on the operating conditions where all significant sources are operating simultaneously at their individual maximum rates of production. A POI concentration for each significant contaminant emitted from the Site was calculated based on the calculated emission rates and the output from the Air Dispersion Model; the results are presented in the following Emissions Summary Table in accordance with s.26 of O. Reg. 419.
Of the contaminants listed in Table 4 – Emissions Summary Table that have limits in the List of Ministry POI Limits, all the predicted POI concentrations are below the corresponding limits. The contaminant with the greatest percentage of its limit was predicted to be suspended particulate matter (SPM) where the predicted 24 hour POI concentration is 84.40 µg/m3 at 70.34 % of the guideline of 120 µg/m3.
With the adoption of the following recommendations, the Utica Pit is expected to operate with acceptable air quality impacts:
A speed limit of 20 km/h shall be strictly enforced on all internal haul roads; On dry days when operations are occurring, a water truck shall be deployed at the
site with a sufficient capacity to be able to cover the entire pit truck haul route at a frequency of one full tank every 1 hour. The water supply must therefore be capable of providing up to 180,000 litres of water per day under worst-case conditions;

Vicdom Utica Pit v Air Quality Assessment Report September 2013
R.J. Burnside & Associates Limited 300034048 034048 VicDom Utica Air Quality Assessment Report.docx
In situations where winds are blowing from the proposed expansion area towards the nearest sensitive receptors, extraction in that area shall be suspended if the condition of the active face is dry and dusty, and the wind is directed toward the sensitive receptor at a speed sufficient to cause wind-spread visible erosion of the open face. The active face shall then be stabilized with water sprays or chemical binder as quickly as possible;
Water spray cannons must be available to stabilize the exposed pit face or stockpiles when required; and,
An implementation plan shall be put in place that addresses the chain of responsibility for dust control, staff training, inspection and maintenance of dust control equipment, visual inspection of dust sources, record keeping and complaint response.

Vicdom Sand & Gravel
Uxbridge, ON
Table 4:
Emissions Summary Table
Project No.: 03xxxx
X
(m)
Y
(m)
N/A Suspended Particulate Matter 0.4398 AERMOD 44.31 654009 4880542 24 120 Particulate Schedule 3 36.92%
48.65 654039 4880408 24 200 Health Schedule 3 24.33%
207.23 654022 4880423 1 400 Health Schedule 3 51.81%
N/A Suspended Particulate Matter 0.4560 AERMOD 45.02 654389 4880634 24 120 Particulate Schedule 3 37.52%
32.90 654419 4880648 24 200 Health Schedule 3 16.45%
184.40 654419 4880648 1 400 Health Schedule 3 46.10%
N/A Suspended Particulate Matter 0.4560 AERMOD 84.40 654389 4880634 24 120 Particulate Schedule 3 70.34%
42.13 654499 4880248 24 200 Health Schedule 3 21.06%
182.17 654522 4880253 1 400 Health Schedule 3 45.54%
Scenario 3
10102-44-0 Nitrogen oxides 0.3909 AERMOD
10102-44-0
Nitrogen oxides 0.3909 AERMOD
Scenario 2
Dispersion Model
Used
AERMOD
10102-44-0
Max POI
Value (µg/m3)
Location of Maximum POI
Limiting Effect
Nitrogen oxides 0.3909
Percentage of
Criteria or
Likelihood of
adverse effect
(%)
Averaging
Period of
Criterion (h)
Scenario 1
CAS# ContaminantRegulation
Schedule #
Total
Emission
Rate (g/s)
Criteria
(µg/m3)
R.J. Burnside & Associates Limited Table 4: 1 of 1 034048 VicDom Utica Air Quality Assessment Tables.xls

Vicdom Utica Pit 1 Air Quality Assessment Report September 2013
R.J. Burnside & Associates Limited 300034048 034048 VicDom Utica Air Quality Assessment Report.docx
1.0 Introduction and Site Description
1.1 Purpose and Scope of the Air Quality Assessment
This Air Quality Assessment was prepared for Vicdom Sand & Gravel (Ontario) Limited’s proposed Utica Pit using approved dispersion modelling in accordance with s.26 of Ontario Regulation 419/05 (“O. Reg. 419”) and the ESDM Procedure Document. This assessment considers the impact of operations in the proposed extraction area, through the use of dispersion modelling to predict maximum off-property concentrations of suspended particulate matter and a comparison of these predictions to the applicable Provincial standards. Odour is not among the typically expected air quality issues for sand and gravel operations and as such odour is not anticipated to be an issue for the proposed Utica Pit.
1.2 Description of Processes and NAICS Code
The proposed Utica Pit is an aggregate extraction operation, to be operated under a Class A, Category 3 License under the Aggregate Resources Act (ARA) for a pit with extraction restricted to 1.5 metres above the water table.
Activities in the proposed Utica Pit will include above-water extraction using a front-end loader and/or excavator. Depending on the type of material encountered and customer demand, extracted material is moved and processed differently. Screened material (Granular B and Sandfill) will typically be stockpiled, loaded into shipping trucks (tandem or tractor trailer), weighed, and shipped directly to the customer. Raw, unscreened material (“Pit Run”) will typically be loaded into pit trucks for transport to the Brock Road Pit for processing. No processing (crushing and washing) of material will occur at the Utica Pit. All truck traffic will occur through the existing Miller Boynton Pit entrance from Goodwood Road (See Figure 3).
The North American Industry Classification System (NAICS) code that applies to the Site is 212323, Sand and Gravel Mining and Quarrying.
1.3 Description of Products and Raw Materials
The Utica Pit will produce sand and gravel for a variety of end uses. The raw material is naturally occurring aggregate obtained from the working face. In addition, diesel fuel may be required for onsite vehicles and diesel-fired generating equipment associated with the portable screen.

Vicdom Utica Pit 2 Air Quality Assessment Report September 2013
R.J. Burnside & Associates Limited 300034048 034048 VicDom Utica Air Quality Assessment Report.docx
1.4 Process Flow Diagram
Figure 4 shows the typical above-ground extraction process for the Utica Pit. Other processes are not described in detail because the emissions, if any, do not exhaust from the Site. The maximum extraction rate is 200 tonnes per hour.
1.5 Operating Schedule
The Utica Pit operates from 7:00 AM to 4:00 PM on weekdays, and from 7:00 AM to 12:00 PM on Saturdays, and generally operates from late March to late November.

Vicdom Utica Pit 3 Air Quality Assessment Report September 2013
R.J. Burnside & Associates Limited 300034048 034048 VicDom Utica Air Quality Assessment Report.docx
2.0 Initial Identification of Sources and Contaminants
This section provides an initial identification of all of the sources and the contaminants emitted from the Site.
2.1 Operating Configuration
Overburden stripping at the working face; Loading of raw aggregate material at the extraction face by front-end loader into a pit
truck at a maximum rate of approximately 200 tonnes per hour; Hauling of raw aggregate material (“Pit Run”) from the working face to the off-site
processing plant at a maximum rate of approximately 200 tonnes per hour; Loading of raw aggregate material at the extraction face by front-end loader into a
portable screening plant at a maximum rate of approximately 200 tonnes per hour (Note that the total processing rate is 200 tonnes per hour. That amount may either be hauled off-site or screened on Site.);
Loading of screened aggregate (Granular B and Sandfill) by a front-end loader into shipping trucks (tandem or tractor trailer) at a rate of approximately 200 tonnes per hour;
On-site traffic of shipping and pit trucks; Tailpipe emissions from on-site mobile equipment; and, On-site storage tanks and facilities used for fuelling onsite vehicles
2.2 Sources and Contaminants Identification Table
Table 1 – Sources and Contaminants Identification Table tabulates all the emission sources at the Site, for example, the movement of the loader at the working face (LOADER) is identified as a source. The expected contaminants emitted from each source are also identified in Table 1; for example, the expected contaminant emitted from LOADER is Suspended Particulate Matter (SPM).

Vicdom Utica Pit 4 Air Quality Assessment Report September 2013
R.J. Burnside & Associates Limited 300034048 034048 VicDom Utica Air Quality Assessment Report.docx
3.0 Assessment of the Significance of Contaminants and Sources
This section provides an explanation for each source and contaminant identified in Table 1 – Sources and Contaminants Identification Table.
In accordance with s.8 of O. Reg. 419, emission rate calculations, and dispersion modelling does not have to be performed for emissions from negligible sources or for the emission of negligible contaminants from significant sources.
3.1 Identification of Negligible Contaminants and Sources
The principal airborne emission at aggregate extraction operations is dust from handling of materials and dust from equipment traffic. This dust is referred to Suspended Particulate Matter (SPM). The SPM from aggregate operations contains relatively few trace metals or other contaminants of concern. With the exception of the diesel-fired engine associated with the portable screen and emissions from mobile equipment, there are no major sources that would emit contaminants other than SPM.
The only contaminants carried forward for quantitative assessment of the non-negligible sources was suspended particulate matter (airborne dust and combustion particles) and nitrogen oxides (NOx) from the diesel-fired engine. Individual contaminants contained within the SPM were not specifically assessed, as they were considered to be adequately represented by SPM as surrogates. A discussion of the contaminants excluded from the dispersion modelling assessment is provided in the following sections.
3.1.1 Rationale for Assessment
3.1.1.1 PM10 and PM2.5
Schedule 3 of regulation 419/05 includes a standard for SPM, expressed in terms of micrograms of contaminant per cubic meter of air (µg/m3). The standard is 120 µg/m3, averaged over 24 hours. SPM embodies all sizes of particles that can become airborne and remain suspended in the air long enough to impact off-site locations. The terms PM10 and PM2.5 refer to smaller size fractions of dust which can enter the human lungs, i.e. particles less than 10 microns in diameter (inhalable particulate matter, or PM10) and particulate less than 2.5 microns in diameter (respirable particulate matter PM2.5).These components of SPM do not have standards under Regulation 419/05. Instead, PM10 has an interim Ambient Air Quality Criterion available, while PM2.5 has a Canada Wide Standard in place. The MOE has not required specific quantitative assessment of these contaminants for aggregate operations.
Vicdom Utica Pit 5 Air Quality Assessment Report September 2013
R.J. Burnside & Associates Limited 300034048 034048 VicDom Utica Air Quality Assessment Report.docx
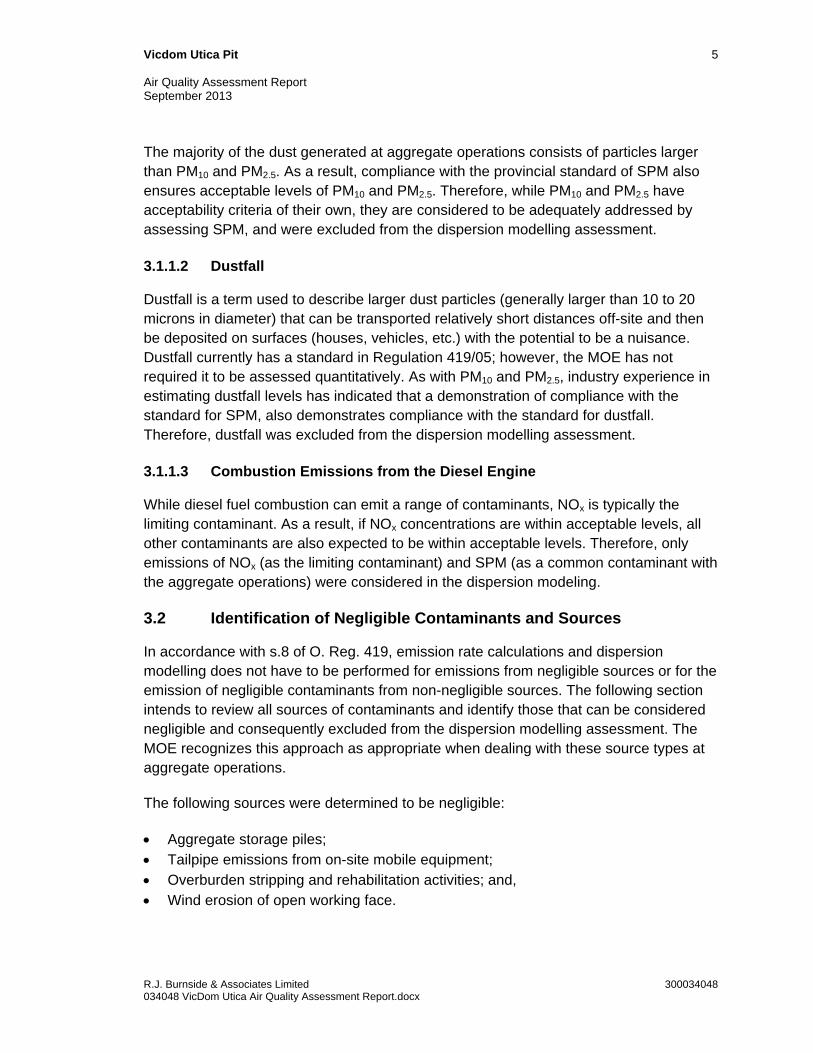
The majority of the dust generated at aggregate operations consists of particles larger than PM10 and PM2.5. As a result, compliance with the provincial standard of SPM also ensures acceptable levels of PM10 and PM2.5. Therefore, while PM10 and PM2.5 have acceptability criteria of their own, they are considered to be adequately addressed by assessing SPM, and were excluded from the dispersion modelling assessment.
3.1.1.2 Dustfall
Dustfall is a term used to describe larger dust particles (generally larger than 10 to 20 microns in diameter) that can be transported relatively short distances off-site and then be deposited on surfaces (houses, vehicles, etc.) with the potential to be a nuisance. Dustfall currently has a standard in Regulation 419/05; however, the MOE has not required it to be assessed quantitatively. As with PM10 and PM2.5, industry experience in estimating dustfall levels has indicated that a demonstration of compliance with the standard for SPM, also demonstrates compliance with the standard for dustfall. Therefore, dustfall was excluded from the dispersion modelling assessment.
3.1.1.3 Combustion Emissions from the Diesel Engine
While diesel fuel combustion can emit a range of contaminants, NOx is typically the limiting contaminant. As a result, if NOx concentrations are within acceptable levels, all other contaminants are also expected to be within acceptable levels. Therefore, only emissions of NOx (as the limiting contaminant) and SPM (as a common contaminant with the aggregate operations) were considered in the dispersion modeling.
3.2 Identification of Negligible Contaminants and Sources
In accordance with s.8 of O. Reg. 419, emission rate calculations and dispersion modelling does not have to be performed for emissions from negligible sources or for the emission of negligible contaminants from non-negligible sources. The following section intends to review all sources of contaminants and identify those that can be considered negligible and consequently excluded from the dispersion modelling assessment. The MOE recognizes this approach as appropriate when dealing with these source types at aggregate operations.
The following sources were determined to be negligible:
Aggregate storage piles; Tailpipe emissions from on-site mobile equipment; Overburden stripping and rehabilitation activities; and, Wind erosion of open working face.
Vicdom Utica Pit 6 Air Quality Assessment Report September 2013
R.J. Burnside & Associates Limited 300034048 034048 VicDom Utica Air Quality Assessment Report.docx
3.2.1 Rationale for Assessment
3.2.1.1 Aggregate Storage Piles
Small aggregate stockpiles may be located within the proposed Utica Pit area, consisting of Granular B, Sandfill, and “Pit Run”. These piles will normally have high moisture contents, and therefore are not expected to be significant contributors to the overall emissions from the proposed area.
3.2.1.2 Tailpipe Emissions from On-Site Mobile Equipment
In accordance with s.5 of O. Reg. 419, the compliance assessment “does not apply to discharges of contaminants from motor vehicles.”
3.2.1.3 Overburden Stripping and Rehabilitation Activities
The MOE has not required overburden, stripping, and rehabilitation activities to be explicitly assessed for aggregate operations. These activities do not typically coincide with the maximum production operations and therefore are not part of the maximum operating scenario.
In addition, stripping of overburden typically involves material that has inherently high moisture content. As per Section 7.2.2 of the ESDM Procedure Document, it may not be necessary to consider a source of contaminant that discharges a negligible amount of the relevant contaminant, having regard to the total amount of the contaminant that is discharged by all the sources of that contaminant to the nature of the contaminant.
Sources that, in combination, represent less than 5 % of total property-wide emissions of a contaminant can, in many cases, be considered insignificant sources. A review of the emission factors provided in US EPA AP-42 Chapter 13.2.4 suggest that with elevated moisture content, the emission factors are insignificant compared to the overall site-wide emissions of particulate. As per Section 7.2.2 of the ESDM Procedure Document the potential emissions from overburden, stripping, and rehabilitation activities are considered to be less than 5 % of total property-wide particulate emissions and have therefore been excluded from the dispersion modeling analysis.
The scenario that results in the highest emission of SPM uses one loader to move material from the face to the screener and the other to move material from the screened piles to trucks. This scenario does not allow another vehicle to simultaneously remove overburden.

Vicdom Utica Pit 7 Air Quality Assessment Report September 2013
R.J. Burnside & Associates Limited 300034048 034048 VicDom Utica Air Quality Assessment Report.docx
3.2.1.4 Wind Erosion of Open Working Face
The incidence of wind erosion from exposed pit faces is relatively infrequent. Wind erosion occurs only when conditions are dry and the wind is high, nevertheless, it is a potentially significant dust source when it takes place. Wind erosion is possible when wind speeds exceed 15 to 20 km/h and becomes significant with wind speeds greater than 30 km/h.
In the proposed Utica area, winds above 30 km/h in the direction of the nearest sensitive receptors, west through south, occur less than 0.5 % of the time over a full year.
If surfaces are wet due to precipitation wind erosion will not occur. In addition, the location of the extraction area relative to the sensitive receptors varies throughout the life of the proposed pit. Overall, wind erosion is expected to occur less than 0.5% of the time over a full year.
In situations where winds erosion is possible or occurring, additional preventative measures may be considered. R.J. Burnside recommends the following control strategies:
Extraction shall be suspended if the condition of an active face is dry and dusty with 30 km/h or greater winds directed toward sensitive receptors;
The active face shall be stabilized with water or chemical wetting agents; and, By monitoring wind forecasts, wind erosion at the working face can be prevented or
reduced by planning and anticipating response to high wind speeds using the two aforementioned strategies. To implement this control strategy, specific actions that may be undertaken by the operator include a daily weather forecast check. 24-hours, 36-hours, and 7 day wind speed and direction forecasts are available from online services such as The Weather Network.
With these recommendations in place, wind erosion effects are not expected to be a concern at the proposed site and have therefore been excluded from the dispersion modeling analysis.

Vicdom Utica Pit 8 Air Quality Assessment Report September 2013
R.J. Burnside & Associates Limited 300034048 034048 VicDom Utica Air Quality Assessment Report.docx
4.0 Operating Conditions, Emissions Estimating and Data Quality Emissions
This section provides a description of the operating conditions used in the calculation of the emission estimates and an assessment of the data quality of the emission estimates for each significant contaminant from the Site. In accordance with s.8 of O. Reg. 419, emission rate calculations and dispersion modelling does not have to be performed for emissions from negligible sources or for the emission of negligible contaminants from negligible sources.
4.1 Description of Operating Conditions
Section 10 of O. Reg. 419 states “A scenario that assumes operating conditions for the Facility that would result, for the relevant contaminant, in the highest concentration of the contaminant at a point of impingement that the Facility is capable of”. The operating condition described in this Air Assessment Report meets this requirement.
The assessment of all operating conditions for the proposed Utica Pit describes the above-ground operation. Raw aggregate extracted from the working face may be transferred off-site or it may undergo screening using the portable screen near the working face. Worst case operations would assume all material is screened before being moved off site. The maximum operating scenario includes movement of the loader at the working face, screening of the material, operation of the screen’s diesel-fired engine, transfer of the material to stockpiles via stacker, loading of the trucks via front-end loader, and movement of the trucks off-site. The activities of the maximum operating scenario were assumed to occur simultaneously at a maximum rate of 200 tonnes per hour over the entire operational day. Continuous operation is expected to provide the largest POI concentration estimate so that method is used as the basis of calculations in this Air Quality Assessment. The operating schedule is described in Section 1.5 above.
4.2 Explanation of the Method Used to Calculate Emission Rates
The maximum emission rates for each significant contaminant emitted from the significant sources were calculated using the methodologies discussed in Appendix A – Supporting Calculations.
The emission rates and the methodology used for each calculation are documented in Table 2 – Source Summary Table. The technical rationale, including sample calculations, is documented in Appendix A – Supporting Calculations.

Vicdom Utica Pit 9 Air Quality Assessment Report September 2013
R.J. Burnside & Associates Limited 300034048 034048 VicDom Utica Air Quality Assessment Report.docx
4.3 Assessment of Data Quality
This section provides a description of the assessment of the data quality of the emission estimates for each significant contaminant from the Site.
The assessment of data quality of the emission rate estimates for each significant contaminant emitted from significant sources was performed in accordance with the requirements of sub paragraph 7iii of s.26 (1) of O. Reg. 419. For example, the EF technique used to calculate the emissions from the portable screener’s diesel engine is based on the USEPA NOx emission factor published in AP-42. The data quality of that emission factor is “D” which is equivalent to the MOE data Quality of “Marginal”.
For each contaminant, the emission rate was estimated and the data quality of the estimate is documented in Table 2 – Source Summary Table. The assessment of data quality for each type of source listed in Table 2 is documented in Appendix A – Supporting Calculations.
All the emission rates listed in Table 2 are documented as having between Above-Average and Marginal Data Quality and correspond to the operating scenario where all significant sources are operating simultaneously at their individual maximum rates averaged over the appropriate averaging time for that contaminant.
A data quality range of Above-Average to Marginal is considered acceptable since this assessment assumes that 100 % of the extracted material is screened out. In reality, the operator expects that between 25 % and 50 % will not be screened. Furthermore, this assessment assumes that operations will occur at the closest point to the property line at all times, while in reality this will only occur during a relatively small part of the time. Similarly, this assessment conservatively assumes that the longest loader path and haul routes will be used at all times.

Vicdom Utica Pit 10 Air Quality Assessment Report September 2013
R.J. Burnside & Associates Limited 300034048 034048 VicDom Utica Air Quality Assessment Report.docx
5.0 Source Summary Table and Site Plan
5.1 Source Summary Table
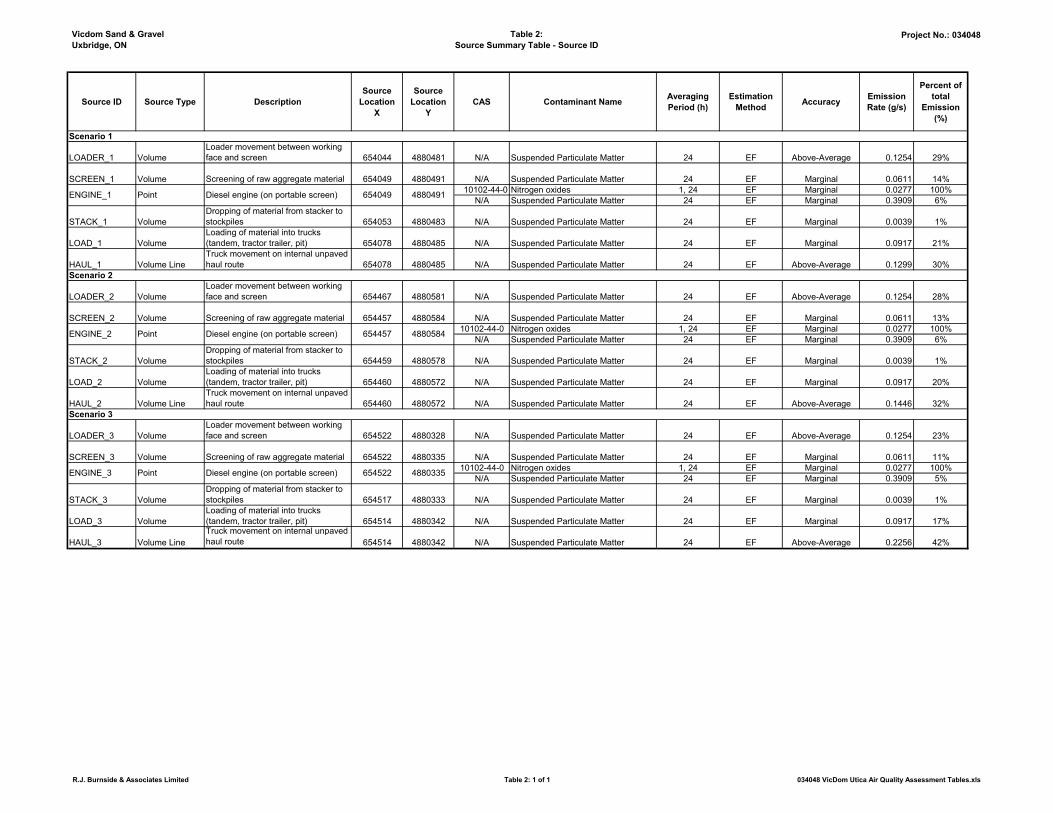
The emission rate estimates for each source of significant contaminants are documented in Table 2 – Source Summary Table.
For each source of significant contaminants the following parameters are referenced:
Contaminant name, Chemical Abstract Society (“CAS”) reference number, Source ID, Source description, Source parameters (flow rate, exhaust temperature, diameter, height above grade,
height above roof), Location referenced to UTM coordinate system presented on Figure 1 – Site
Location Plan Averaging period, Emission estimating technique, Estimation of data quality, and Percentage of overall emission.
5.2 Site Plan
Figure 1 and 3 provide the site plan for the Utica Pit.
Vicdom Utica Pit 11 Air Quality Assessment Report September 2013
R.J. Burnside & Associates Limited 300034048 034048 VicDom Utica Air Quality Assessment Report.docx
6.0 Dispersion Modelling
Dispersion modelling for the proposed Utica Pit was conducted using the estimated emission rates discussed in Section 4.0 and Appendix A in conjunction with the AERMOD dispersion model to predict SPM and NOx concentrations at points of impingement along the property line and beyond.
Sources were modelled as a series of volume sources with parameters based on information obtained from site plans, the approximate dimensions of processing equipment, and vehicles proposed to be used at the facility. Internal haul roads were modelled as volume line sources and the exhaust stack from the diesel-fired engine was modelled as a point source.
6.1 Dispersion Modelling Scenarios
Three separate scenarios were considered in the dispersion modelling assessment, representing worst-case operations for each of the future phases. These operations are represented by Scenario 1, Scenario 2, and Scenario 3 (Figure 3). The processing rate and relative position of equipment is consistent within each phase; the locations were changed to provide the closest approach to each possible property line.
The dispersion modelling scenario includes movement of the loader at the working face, screening of the raw aggregate, the diesel-fired engines powering the screen, stacking of the screened aggregate into stockpiles, loading of the trucks (tandem, tractor trailer and pit), and movement of the trucks to the existing Miller Boynton Pit property entrance.
Note that since Vicdom will be implementing a Best Management Practise Plan (“BMPP”) and so are allowed to ignore road dust emissions in their assessment; however, road dust emissions have been included to ensure that they meet the criteria despite this allowance.
6.2 Dispersion Modelling Input Summary
6.2.1 Deposition
AERMOD has the capability to account for wet and dry deposition of substances that would reduce airborne concentrations.
Operations in the pit occur below grade. Therefore, for the SPM contaminant, the model was run using the dry deposition and depletion algorithms, which account for gravitational settling and deposition of particles. The particle size distribution and density was taken from reference material for typical bulk materials. The model runs for NOx did not consider the dry deposition and depletion algorithms, since NOx is a gaseous pollutant.
Vicdom Utica Pit 12 Air Quality Assessment Report September 2013
R.J. Burnside & Associates Limited 300034048 034048 VicDom Utica Air Quality Assessment Report.docx
6.2.2 Meteorology and Land Use Data
A land use zoning plan is provided on Figure 2 – Land Use Zoning Plan. Figure 2 also illustrates the extent of the Site property boundary and provides the zoning of adjacent land uses. The Site is located in an area currently zoned “Countryside Area”. To the north is an existing aggregate operation (Miller Boynton Pit), to the east an existing aggregate operation, to the south woodlands and rural residential, and to west rural residential.
The MOE has created, and periodically updates, AERMOD-ready regional meteorological datasets for use with dispersion modelling using AERMOD. Depending upon the local land use of the Site, the dataset used can be urban, crops, or forest. As the Site is situated within the geographical coverage of MOE Central Region Office and based on the land-use characteristics around the site, the “Crops” dataset was used. The surface data is from the Toronto Pearson Airport and the Upper Air Data is from Buffalo, New York. The meteorological data covers the dates from January 1, 1996 to December 31, 2000. The hourly data includes many factors which affect the dispersion of air contaminants including wind speed, wind direction, temperature, ceiling height, and atmospheric stability.
Removal of meteorological anomalies was performed in this analysis. The results shown are the maximum value of the second highest 24-hour values and the ninth highest 1-hour values of all five years.
6.3 Terrain
In this assessment, terrain elevation contour data was downloaded from Natural Resources Canada's Canadian Digital Elevation Data (CDED) dataset and processed using the AERMOD terrain processor AERMAP. AERMAP determines base terrain elevation using the DEM data for all sources and receptors, and provides the user with a suitable input file for use with AERMOD.
6.4 Area of Modelling Coverage
For both SPM and NOx, impacts were assessed at ground level, at and beyond the property line. Receptors were chosen based on recommendations provided in Section 7.1 of the ADGMO, which is in accordance with s.14 of O. Reg. 419/05.
Property line receptors were placed every 10 m along the property boundary. No receptors were placed inside the Site's property line.
Beyond the property line, a nested receptor grid, generally centred on proposed operations centre, was placed as follows:

Vicdom Utica Pit 13 Air Quality Assessment Report September 2013
R.J. Burnside & Associates Limited 300034048 034048 VicDom Utica Air Quality Assessment Report.docx
A bounding box was created that encompasses all the sources at the Site. 20 m spacing within 200 m of the edge of the bounding box; 50 m spacing from 200 m to 500 m; 100 m spacing from 500 to 1000 m; 200 m spacing from 1000 to 2000 m; and 500 m spacing from 2000 m to 5000 m.
6.5 Coordinate System
The Universal Transverse Mercator (“UTM”) coordinate system, as per Section 5.2.2 of the ADGMO, was used to specify model sources and receptors. All coordinates were defined in the North American Datum of 1983 (“NAD83”).
6.6 Averaging Time and Conversions
Schedule 3 standards of O. Reg. 419/05 are being applied to this Site. The relevant Schedule 3 averaging time for SPM is 24-hours and for NOx both 1-hour and 24-hours.
6.7 Dispersion Modelling Input and Output Files
The information entered into the approved dispersion model is recorded in Appendix B. AERMOD dispersion model data of all the contaminants is provided in electronic form on the CD in Appendix B. As an illustration, a copy of the contour plot and the model output file for the contaminant NOx is also contained in Appendix B.

Vicdom Utica Pit 14 Air Quality Assessment Report September 2013
R.J. Burnside & Associates Limited 300034048 034048 VicDom Utica Air Quality Assessment Report.docx
7.0 Emissions Summary Table and Conclusions
7.1 Emissions Summary Table
A POI concentration for each significant contaminant emitted from the Site was calculated based on the emission rates listed in Table 2 – Source Summary Table and the output from the approved dispersion model. The results are presented in Table 4 – Emissions Summary Table.
The following parameters are referenced for each source of significant contaminants:
Contaminant name, Chemical Abstract Society (“CAS”) reference number, Total Site emission rate, Approved dispersion model used, Max POI concentration, Averaging period for the dispersion modelling, MOE POI limit, Indication of the limiting effect, Schedule in O. Reg. 419/05, and The percentage of standard or indication of the likelihood of an adverse effect.
The POI concentrations listed in Table 4 – Emission Summary Table are the maximum predicted ground level concentrations (after removing outliers), occurring at or beyond the property line for each of the three future operating phases – Scenario 1, 2, and 3. The POI concentrations listed in the Emissions Summary Table were compared to the Schedule 3 Standards under Ontario Regulation 419/05 – Local Air Quality.
Modelling using meteorological data sets may produce certain rare, extreme, or transient meteorological conditions, which can be considered outliers. When determining the maximum POI concentrations these meteorological anomalies were removed from consideration. Consistent with the “Air Dispersion Modelling Guideline for Ontario”, the top 1 meteorological event can be removed when modelling for a 24-hour averaging period and the top 8 meteorological events per year can be removed from the results when modelling for a 1-hour averaging.
7.2 Assessment of Contaminants with no MOE POI Limits
All of the contaminants identified in the emission inventory have established Point of Impingement (POI) limits.

Vicdom Utica Pit 15 Air Quality Assessment Report September 2013
R.J. Burnside & Associates Limited 300034048 034048 VicDom Utica Air Quality Assessment Report.docx
7.3 Conclusions & Recommendations
The emission rate estimates for each source of significant contaminants are documented in Table 2 – Source Summary Table. All the emission rates listed in Table 2 correspond to the operating scenario where all sources are operating simultaneously at their individual maximum rates of production. Therefore, these emission rate estimates listed in Table 2 – Source Summary Table, are not likely to be an underestimate of the actual emission rates.
A POI concentration for each contaminant emitted from the Site was calculated based on the calculated emission rates and the output from the model; the results are presented in Table 4 – Emissions Summary Table. The POI concentrations listed in Table 4 were compared to the Schedule 3 Standards under Ontario Regulation 419/05 – Local Air Quality.
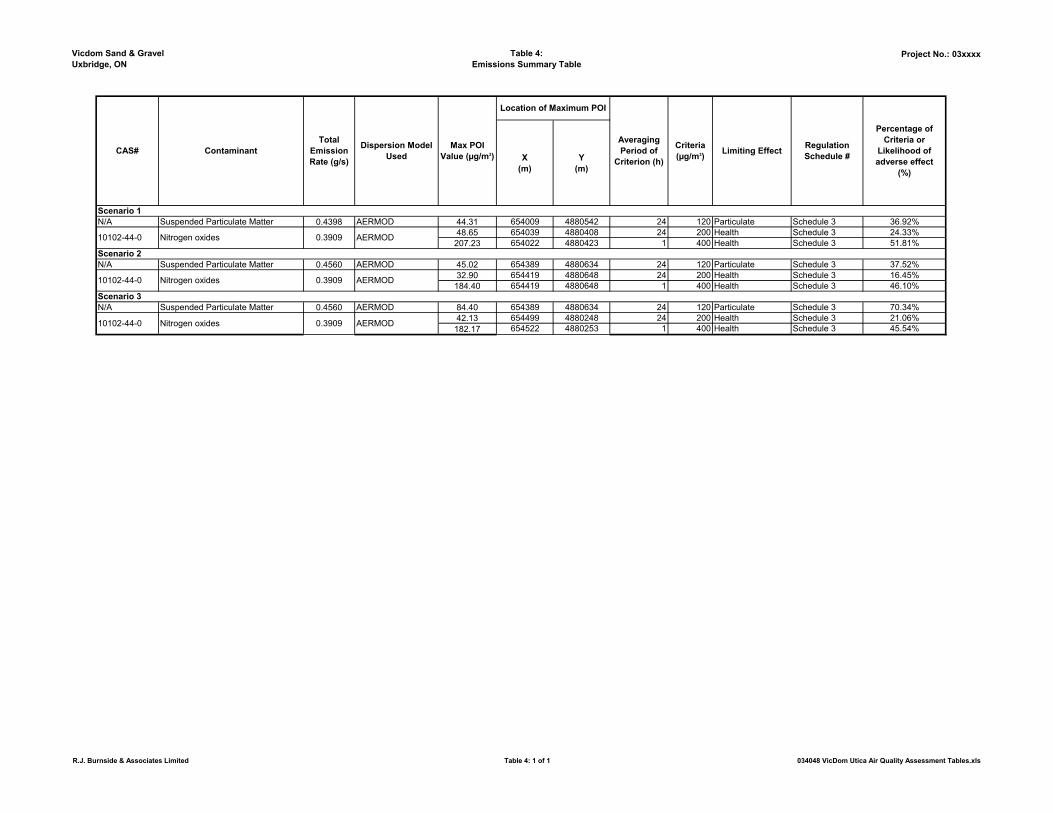
Of the contaminants listed in Table 4 – Emissions Summary Table that have limits in the List of Ministry POI Limits, all the predicted POI concentrations are below the corresponding limits. The contaminant with the greatest percentage of its limit was predicted to be suspended particulate matter (SPM) where the predicted 24 hour POI concentration is 84.40 µg/m3 at 70.34 % of the guideline of 120 µg/m3.
With the adoption of the following recommendations, the Utica Pit is expected to operate with acceptable air quality impacts:
A speed limit of 20 km/h shall be strictly enforced on all internal haul roads; On dry days when operations are occurring, a water truck shall be deployed at the
site, with a sufficient capacity to be able to cover the entire pit truck haul route at a frequency of one full tank every 1 hour. The water supply must therefore be capable of providing up to 180,000 litres of water per day under worst-case conditions;
In situations where winds are blowing from the proposed expansion are towards the nearest sensitive receptors, extraction in that area shall be suspended if the condition of the active face is dry and dusty, and the wind is directed toward the sensitive receptor at a speed sufficient to cause wind-spread visible erosion of the open face. The active face shall then be stabilized with water sprays or chemical binder as quickly as possible;
Water spray cannons must be available to stabilize the exposed pit face or stockpiles when required; and,
An implementation plan shall be put in place that addresses the chain of responsibility for dust control, staff training, inspection and maintenance of dust control equipment, visual inspection of dust sources, record keeping and complaint response.

Vicdom Utica Pit
Air Quality Assessment Report September 2013
16
7.4 Limitations and Use of Report
R. J. Burnside & Associates Limited (Burnside) has completed this report in accordance with generally accepted standards and practices. The conclusions and recommendations in this report are professional opinions based upon our understanding of anticipated Site conditions at the time of this assessment. To the best of our knowledge, the information contained in our report is accurate however Burnside does not guarantee the accuracy and reliability of the information provided by other persons or agencies. Burnside is not responsible for environmental concerns that are not visible or otherwise disclosed to us.
This report was prepared for the exclusive use Vicdom Sand & Gravel. Any use or reliance on or decisions based on this report by a third party, are the responsibility of such third parties. Burnside accepts no responsibility for damages, if any, suffered by any third party as a result of decisions made or actions based on this report.
Prepared by:
R.J. Burnside & Associates Limited
Approved by:
Kathleen Alexander, B.Sc. Environmental Scientist
'Harvey Watson, P.Eng. Environmental Project Manager
R.J. Burnside & Associates Limited 034048 VicDom Utica Air Quality Assessment Report.docx
300034048

Tables

Vicdom Sand & Gravel
Uxbridge, ON
Table 1:
Sources and Contaminants Identification Table
Project No.: 034048
Expected Contaminants
Source ID Description General Location Contaminants Yes or No?
LOADER Loader movement between working face and screen Scenario 1, 2, & 3 SPM Yes
SCREEN Screening of raw aggregate material Scenario 1, 2, & 3 SPM Yes
ENGINE Diesel engine (on portable screen) Scenario 1, 2, & 3 SPM and NOx Yes
STACK Dropping of material from stacker to stockpiles Scenario 1, 2, & 3 SPM Yes
LOAD Loading of material into trucks (tandem, tractor trailer, pit) Scenario 1, 2, & 3 SPM Yes
HAUL Truck movement on internal unpaved haul route Scenario 1, 2, & 3 SPM Yes
Source Information Significant
R.J. Burnside & Associates Limited Table 1: 1 of 1 034048 VicDom Utica Air Quality Assessment Tables.xls
Vicdom Sand & Gravel
Uxbridge, ON
Table 2:
Source Summary Table - Source ID
Project No.: 034048
Source ID Source Type Description
Source
Location
X
Source
Location
Y
CAS Contaminant NameAveraging
Period (h)
Estimation
MethodAccuracy
Emission
Rate (g/s)
Percent of
total
Emission
(%)
LOADER_1 Volume
Loader movement between working
face and screen 654044 4880481 N/A Suspended Particulate Matter 24 EF Above-Average 0.1254 29%
SCREEN_1 Volume Screening of raw aggregate material 654049 4880491 N/A Suspended Particulate Matter 24 EF Marginal 0.0611 14%
10102-44-0 Nitrogen oxides 1, 24 EF Marginal 0.0277 100%
N/A Suspended Particulate Matter 24 EF Marginal 0.3909 6%
STACK_1 Volume
Dropping of material from stacker to
stockpiles 654053 4880483 N/A Suspended Particulate Matter 24 EF Marginal 0.0039 1%
LOAD_1 Volume
Loading of material into trucks
(tandem, tractor trailer, pit) 654078 4880485 N/A Suspended Particulate Matter 24 EF Marginal 0.0917 21%
HAUL_1 Volume Line
Truck movement on internal unpaved
haul route 654078 4880485 N/A Suspended Particulate Matter 24 EF Above-Average 0.1299 30%
LOADER_2 Volume
Loader movement between working
face and screen 654467 4880581 N/A Suspended Particulate Matter 24 EF Above-Average 0.1254 28%
SCREEN_2 Volume Screening of raw aggregate material 654457 4880584 N/A Suspended Particulate Matter 24 EF Marginal 0.0611 13%
10102-44-0 Nitrogen oxides 1, 24 EF Marginal 0.0277 100%
N/A Suspended Particulate Matter 24 EF Marginal 0.3909 6%
STACK_2 Volume
Dropping of material from stacker to
stockpiles 654459 4880578 N/A Suspended Particulate Matter 24 EF Marginal 0.0039 1%
LOAD_2 Volume
Loading of material into trucks
(tandem, tractor trailer, pit) 654460 4880572 N/A Suspended Particulate Matter 24 EF Marginal 0.0917 20%
HAUL_2 Volume Line
Truck movement on internal unpaved
haul route 654460 4880572 N/A Suspended Particulate Matter 24 EF Above-Average 0.1446 32%
LOADER_3 Volume
Loader movement between working
face and screen 654522 4880328 N/A Suspended Particulate Matter 24 EF Above-Average 0.1254 23%
SCREEN_3 Volume Screening of raw aggregate material 654522 4880335 N/A Suspended Particulate Matter 24 EF Marginal 0.0611 11%
10102-44-0 Nitrogen oxides 1, 24 EF Marginal 0.0277 100%
N/A Suspended Particulate Matter 24 EF Marginal 0.3909 5%
STACK_3 Volume
Dropping of material from stacker to
stockpiles 654517 4880333 N/A Suspended Particulate Matter 24 EF Marginal 0.0039 1%
LOAD_3 Volume
Loading of material into trucks
(tandem, tractor trailer, pit) 654514 4880342 N/A Suspended Particulate Matter 24 EF Marginal 0.0917 17%
HAUL_3 Volume Line
Truck movement on internal unpaved
haul route 654514 4880342 N/A Suspended Particulate Matter 24 EF Above-Average 0.2256 42%
654457
Scenario 3
654522 4880335
Point Diesel engine (on portable screen)
PointENGINE_2
ENGINE_3
654049 4880491
Scenario 1
ENGINE_1
4880584
Point
Diesel engine (on portable screen)
Diesel engine (on portable screen)
Scenario 2
R.J. Burnside & Associates Limited Table 2: 1 of 1 034048 VicDom Utica Air Quality Assessment Tables.xls
Vicdom Sand & Gravel
Uxbridge, ON
Table 3:
Dispersion Modeling Input Summary Table
Project No.: 034048
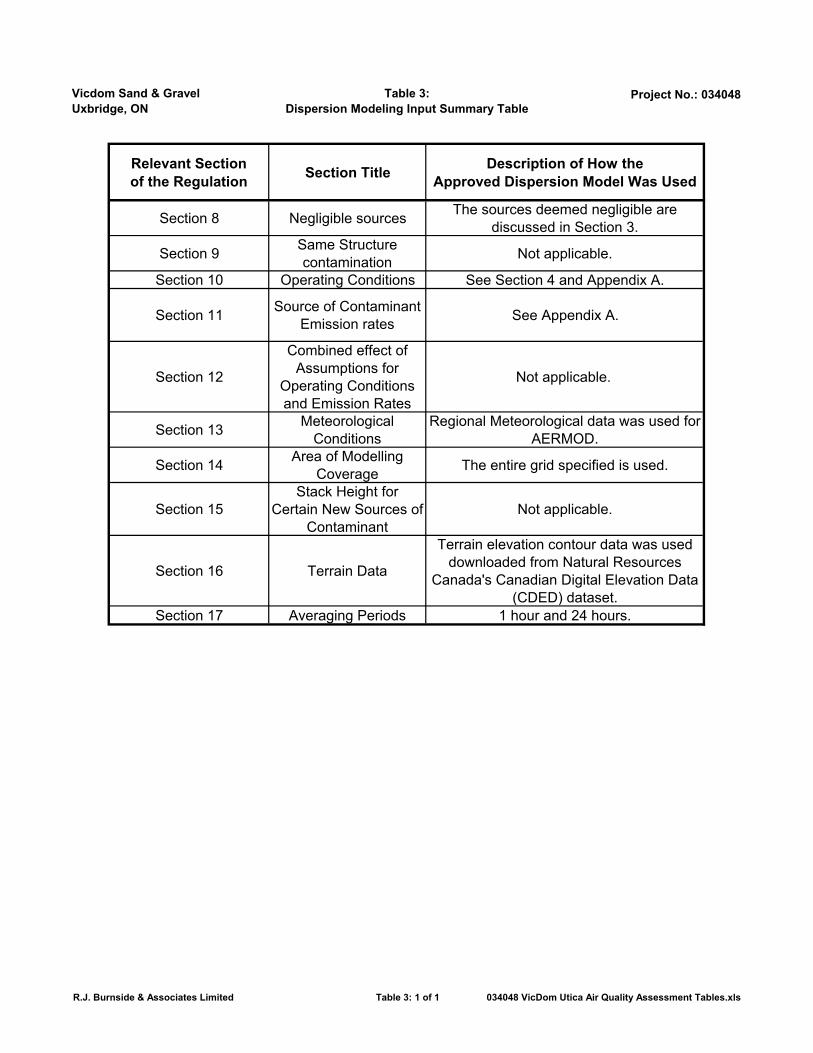
Relevant Section
of the RegulationSection Title
Description of How the
Approved Dispersion Model Was Used
Section 8 Negligible sourcesThe sources deemed negligible are
discussed in Section 3.
Section 9Same Structure
contaminationNot applicable.
Section 10 Operating Conditions See Section 4 and Appendix A.
Section 11Source of Contaminant
Emission ratesSee Appendix A.
Section 12
Combined effect of
Assumptions for
Operating Conditions
and Emission Rates
Not applicable.
Section 13Meteorological
Conditions
Regional Meteorological data was used for
AERMOD.
Section 14Area of Modelling
CoverageThe entire grid specified is used.
Section 15
Stack Height for
Certain New Sources of
Contaminant
Not applicable.
Section 16 Terrain Data
Terrain elevation contour data was used
downloaded from Natural Resources
Canada's Canadian Digital Elevation Data
(CDED) dataset.
Section 17 Averaging Periods 1 hour and 24 hours.
R.J. Burnside & Associates Limited Table 3: 1 of 1 034048 VicDom Utica Air Quality Assessment Tables.xls
Vicdom Sand & Gravel
Uxbridge, ON
Table 4:
Emissions Summary Table
Project No.: 03xxxx
X
(m)
Y
(m)
N/A Suspended Particulate Matter 0.4398 AERMOD 44.31 654009 4880542 24 120 Particulate Schedule 3 36.92%
48.65 654039 4880408 24 200 Health Schedule 3 24.33%
207.23 654022 4880423 1 400 Health Schedule 3 51.81%
N/A Suspended Particulate Matter 0.4560 AERMOD 45.02 654389 4880634 24 120 Particulate Schedule 3 37.52%
32.90 654419 4880648 24 200 Health Schedule 3 16.45%
184.40 654419 4880648 1 400 Health Schedule 3 46.10%
N/A Suspended Particulate Matter 0.4560 AERMOD 84.40 654389 4880634 24 120 Particulate Schedule 3 70.34%
42.13 654499 4880248 24 200 Health Schedule 3 21.06%
182.17 654522 4880253 1 400 Health Schedule 3 45.54%
Scenario 3
10102-44-0 Nitrogen oxides 0.3909 AERMOD
10102-44-0
Nitrogen oxides 0.3909 AERMOD
Scenario 2
Dispersion Model
Used
AERMOD
10102-44-0
Max POI
Value (µg/m3)
Location of Maximum POI
Limiting Effect
Nitrogen oxides 0.3909
Percentage of
Criteria or
Likelihood of
adverse effect
(%)
Averaging
Period of
Criterion (h)
Scenario 1
CAS# ContaminantRegulation
Schedule #
Total
Emission
Rate (g/s)
Criteria
(µg/m3)
R.J. Burnside & Associates Limited Table 4: 1 of 1 034048 VicDom Utica Air Quality Assessment Tables.xls

Figures

B
O
W
L
E
S
R
O
A
D
G
O
O
D
W
O
O
D
R
O
A
D
L
A
K
E
R
I
D
G
E
R
O
A
D
(654522, 4880685)
(654636, 4880278)
(653851, 4880449)
(654285, 4880616)
0 400100
Metres
200 30050
N
File
N
am
e: 0
34
04
8 A
ir Q
ua
lity A
sse
ssm
en
t D
ra
win
g.d
wg
D
ate
P
lo
tte
d: S
ep
te
mb
er 1
7, 2
01
3 - 3
:2
0 P
M
Scale Project No.
Figure No.
Figure Title
Drawn
Client
Checked Date
Vicdom Sand & Gravel
Utica Air Quality Assessment Report
Figure 1: Site Location Plan
KA
1:5000 300034048
1
13/09/12HW
LEGEND
APPROXIMATE SITE BOUNDARY
(653851, 4880449)
BOUNDARY COORDINATE
UTM NAD83

N
File
N
am
e: 0
34
04
8 A
ir Q
ua
lity A
sse
ssm
en
t D
ra
win
g.d
wg
D
ate
P
lo
tte
d: O
cto
be
r 1
5, 2
01
3 - 1
0:1
7 A
M
Scale Project No.
Figure No.
Figure Title
Drawn
Client
Checked Date
Vicdom Sand & Gravel
Utica Air Quality Assessment Report
Figure 2: Land Use Zoning Plan
KA
NTS 300034048
2
13/09/12HW
LEGEND

Scenario_1
Scenario_2
Scenario_3
Exit to Miller Boynton Pit
LOADER_1
SCREEN_1, ENGINE_1
HAUL_1
LOADER_2
HAUL_2
LOADER_3
HAUL_3
LOAD_3
SCREEN_2, ENGINE_2
STACK_1
LOAD_1
STACK_2
LOAD_2
SCREEN_3, ENGINE_3
STACK_3
(654522, 4880685)
(654636, 4880278)
(653851, 4880449)
(654285, 4880616)
0 24060
Metres
120 180
N
File
N
am
e: 0
34
04
8 A
ir Q
ua
lity A
sse
ssm
en
t D
ra
win
g.d
wg
D
ate
P
lo
tte
d: S
ep
te
mb
er 1
8, 2
01
3 - 1
0:5
9 A
M
Scale Project No.
Figure No.
Figure Title
Drawn
Client
Checked Date
Vicdom Sand & Gravel
Utica Air Quality Assessment Report
Figure 3: Site Operational Plan
KA
1:3000 300034048
3
13/09/12HW
LEGEND
APPROXIMATE SITE BOUNDARY
APPROXIMATE EXTRACTION AREA
(653851, 4880449)
BOUNDARY COORDINATE
UTM NAD83

LOADER
TRANSFER TO
TRUCK
SHIPPING OFF
SITE
EXTRACTION
AT WORKING
FACE
LOADER
TRANSFER TO
SCREENER
SCREENING AT
PORTABLE
SCREENER
STOCKPILING
STOCKPILING
File
N
am
e: 0
34
04
8 A
ir Q
ua
lity A
sse
ssm
en
t D
ra
win
g.d
wg
D
ate
P
lo
tte
d: O
cto
be
r 1
5, 2
01
3 - 9
:2
1 A
M
Scale Project No.
Figure No.
Figure Title
Drawn
Client
Checked Date
Vicdom Sand & Gravel
Utica Air Quality Assessment Report
Figure 4: Process Flow Diagram
KA
NTS 300034048
4
13/09/12HW
Appendix A
Supporting Calculations

Vicdom Utica Pit A1 ECA Supporting Calculations September 2013
R.J. Burnside & Associates Limited 300034048 034048 VicDom Utica Air Quality Assessment Report.docx
Appendix A Supporting Calculations
1.0 Combustion Emissions .................................................................................. 1
2.0 Processing Operations .................................................................................. 2
3.0 Bulk Material Handling ................................................................................... 3
4.0 Unpaved Haul Roads ...................................................................................... 4 1.0 Combustion Emissions
Combustion emissions will result from the diesel-fired engine on the portable screener. See Attachment C for the technical specifications for the screen’s diesel-fired engine.
The emission calculations for this source are shown on Table A-1: Combustion Emissions. The process flow diagram is shown in Figure 4.
Methodology: Emission Factor (“EF”)
Chapter 3.3 of the U.S. AP-42 Document provides emission factors that can be used to predict emissions from a diesel-fired engine. The following equation was used to predict emissions from the screen’s diesel engine:
Emission Rate = Engine Horsepower x Emission Factor
Emission Factor = 0.031 lb/hp-hr
Engine Horsepower = 100 hp
Sample Calculation:
Emission Rate = 100 hp/hr * (0.031 lbNOx/hp-hr) * (454 g/1 lb) * (1 hr/3600 s)
= 0.3909 g/s
Particulate emissions from the screener’s diesel-fired engine were calculated analogously.
Data Quality: Marginal
Data quality for this calculation is best characterized by the following paragraph from Section 8.3.4 of the ESDM Procedure Document titled “Marginal Data Quality” Emission Estimating Techniques states:

Vicdom Utica Pit A2 ECA Supporting Calculations September 2013
R.J. Burnside & Associates Limited 300034048 034048 VicDom Utica Air Quality Assessment Report.docx
Emission Factors: Emission rate estimates that are developed from tests on only a small number of facilities where there is evidence of variability within the source category population (e.g., US EPA, AP-42, emission factor quality rating of D or E) and/or the emission factor rating is uncertain are considered to have uncertain data quality.
2.0 Processing Operations
Processing operations include the screening of raw aggregate materials and the dropping of material from stacker to stockpile. No crushing or washing of material will occur at the Utica Pit; rather, material will be shipped to Brock Road Pit for further processing, if necessary.
The emission calculations for this source are shown on Table A-2: Processing Operations. The process flow diagram is shown in Figure 4.
Methodology: Emission Factor (“EF”)
Emission factors from the US EPA’s AP-42 Chapter 11.19.2 Crushed Stone Processing and Pulverized Mineral Processing were used to predict emission rates from the processing operations. The following equation was used to predict emissions from the screen processing operations:
Emission Rate = Material Handling Rate x Emission Factor
The processing operation emission rates are dependent on the amount of material being handled as well as the control efficiency. As noted in Section 3.2.1.1, aggregate stockpiles are considered negligible due to high moisture contents, similarly, controlled emission factors were used for the screen and stackers to account for the high moisture levels of the extracted material.
Screening Emission Factor (controlled) = 0.0011 kgSPM/ Mgaggregate
Handling Rate = 200 Mgaggregate/hr
Sample Calculation:
Emission Rate = 200 Mgaggregate/hr * (0.001 kgSPM/ Mgaggregate) * (1000 g/1 kg) * (1 hr / 3600 s)
= 0.0611 g/s
Particulate emissions from the stacker were calculated analogously, with the appropriate emission factor.

Vicdom Utica Pit A3 ECA Supporting Calculations September 2013
R.J. Burnside & Associates Limited 300034048 034048 VicDom Utica Air Quality Assessment Report.docx
Data Quality: Marginal
Data quality for this calculation is best characterized by the following paragraph from Section 8.3.4 of the ESDM Procedure Document titled “Marginal” or “Uncertain Data Quality” Emission Estimating Techniques states:
Emission Factors: Emission rate estimates that are developed from tests on only a small number of facilities where there is evidence of variability within the source category population (e.g., US EPA, AP-42, emission factor quality rating of D or E) and/or the emission factor rating is uncertain are considered to have uncertain data quality.
Operating Condition, Individual Maximum Rates of Production:
The emission rate calculations for this source are based on the maximum operating scenario with a “maximum worst-case” handling rate of 200 tonnes per hour.
3.0 Bulk Material Handling
Bulk material handling emissions include the loading of material into trucks.
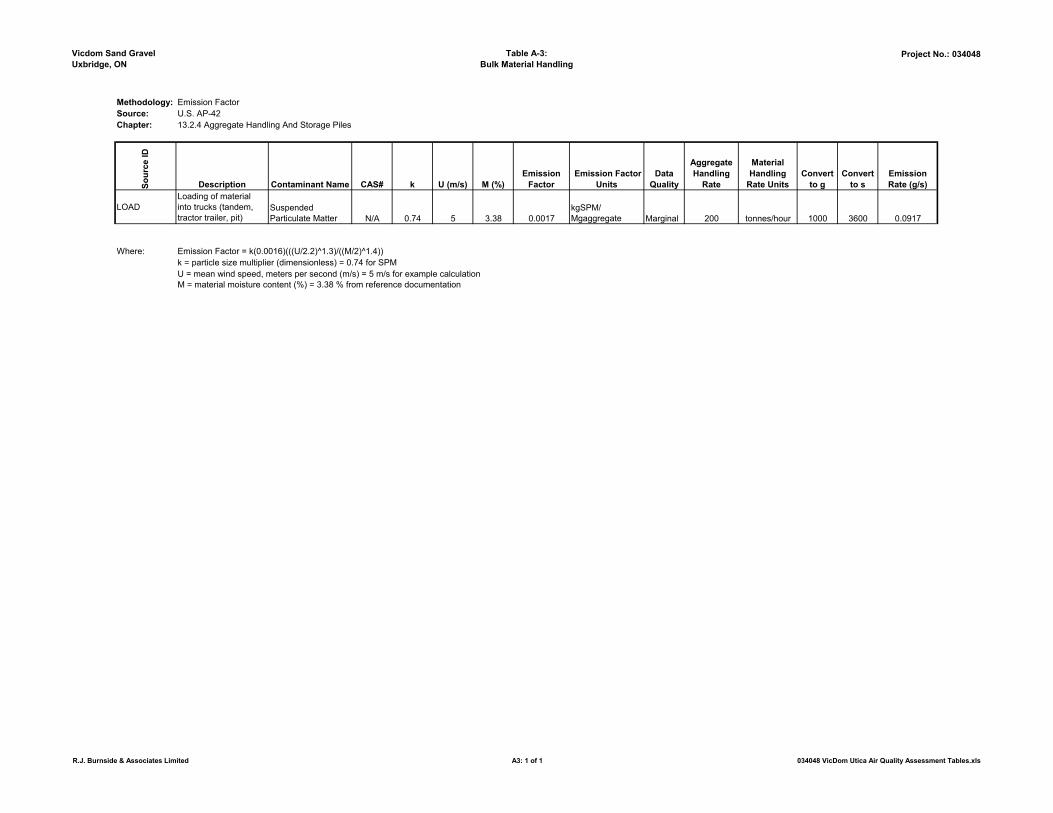
The emission calculations for this source are shown on Table A-3: Bulk Material Handling. The process flow diagram is shown in Figure 4.
Methodology: Emission Factor (“EF”)
Emission Factors from AP-42 Chapter 13.2.4, “Aggregate Handling and Storage Piles,” were used to predict the emission rates from the bulk material handling.
The emission factors from Chapter 13.2.4 are dependent on wind speed. To accurately reflect the change in emissions with changes in wind speed, hourly wind speeds from the meteorological data file were used in conjunction with the emission factor to develop a file of hourly emission rates for use in the dispersion modelling analysis.
Chapter 13.2.4 of the U.S. EPA Compilation of Air Pollutant Emission Factors (AP-42) provides the following equation to predict emissions from bulk material handling operations.
Emission Rate = Material Handling Rate x Emission Factor
Emission Factor (kgSPM/ Mgaggregate) = k(0.0016) * ((U/2.2)1.3/(M/2)1.4))
Where: k = particle size multiplier (dimensionless) U = mean wind speed (m/s) M = material moisture content (%)

Vicdom Utica Pit A4 ECA Supporting Calculations September 2013
R.J. Burnside & Associates Limited 300034048 034048 VicDom Utica Air Quality Assessment Report.docx
Sample Calculation:
The particle size multiplier (k), varies with aerodynamic particle size range, and for particles that are less than 30 µm, k = 0.74. As a worst case scenario, assuming all material is screened, reference documentation from a similar assessment indicates that the moisture content of screened material from this geographic area is approximately 3.38%. For this sample calculation, a sample wind speed of 5 m/s was chosen. The hourly handling rate is proposed to be 200 tonnes per hour.
Emission Factor (kgSPM/ Mgaggregate) = 0.74 (0.0016) * ((5/2.2)1.3 / (3.38/2)1.4))
= 0.0017 kgSPM/ Mgaggregate
Emission Rate = 200 Mgaggregate/hr * 0.001651284 kgSPM/ Mgaggregate *(1000 g/1 kg) * (1 hr /3600 s)
= 0.0917 g/s Data Quality: Marginal
Data quality for this calculation is best characterized by the following paragraph from Section 8.3.4 of the ESDM Procedure Document titled “Marginal” or “Uncertain Data Quality” Emission Estimating Techniques states:
Emission Factors: Emission rate estimates that are developed from tests on only a small number of facilities where there is evidence of variability within the source category population (e.g., US EPA, AP-42, emission factor quality rating of D or E) and/or the emission factor rating is uncertain are considered to have uncertain data quality.
Operating Condition, Individual Maximum Rates of Production:
The emission rate calculations for this source are based on the maximum operating scenario with a “maximum worst-case” handling rate of 200 tonnes per hour.
4.0 Unpaved Haul Roads
Unpaved Haul Road emissions include the loader movement at the working face and truck movement on internal unpaved haul routes.
The emission calculations for this source are shown on Table A-4: Unpaved Haul Roads. The process flow diagram is shown in Figure 4.
Vicdom Utica Pit A5 ECA Supporting Calculations September 2013
R.J. Burnside & Associates Limited 300034048 034048 VicDom Utica Air Quality Assessment Report.docx
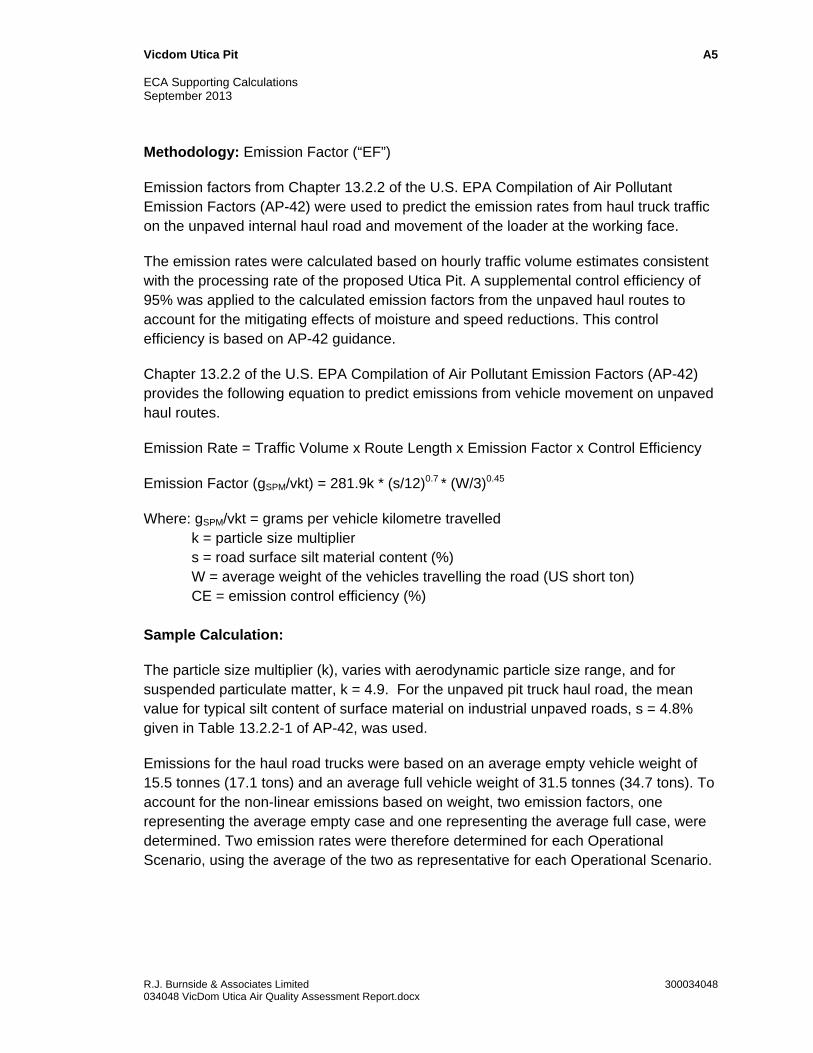
Methodology: Emission Factor (“EF”)
Emission factors from Chapter 13.2.2 of the U.S. EPA Compilation of Air Pollutant Emission Factors (AP-42) were used to predict the emission rates from haul truck traffic on the unpaved internal haul road and movement of the loader at the working face.
The emission rates were calculated based on hourly traffic volume estimates consistent with the processing rate of the proposed Utica Pit. A supplemental control efficiency of 95% was applied to the calculated emission factors from the unpaved haul routes to account for the mitigating effects of moisture and speed reductions. This control efficiency is based on AP-42 guidance.
Chapter 13.2.2 of the U.S. EPA Compilation of Air Pollutant Emission Factors (AP-42) provides the following equation to predict emissions from vehicle movement on unpaved haul routes.
Emission Rate = Traffic Volume x Route Length x Emission Factor x Control Efficiency
Emission Factor (gSPM/vkt) = 281.9k * (s/12)0.7 * (W/3)0.45
Where: gSPM/vkt = grams per vehicle kilometre travelled k = particle size multiplier s = road surface silt material content (%) W = average weight of the vehicles travelling the road (US short ton) CE = emission control efficiency (%) Sample Calculation:
The particle size multiplier (k), varies with aerodynamic particle size range, and for suspended particulate matter, k = 4.9. For the unpaved pit truck haul road, the mean value for typical silt content of surface material on industrial unpaved roads, s = 4.8% given in Table 13.2.2-1 of AP-42, was used.
Emissions for the haul road trucks were based on an average empty vehicle weight of 15.5 tonnes (17.1 tons) and an average full vehicle weight of 31.5 tonnes (34.7 tons). To account for the non-linear emissions based on weight, two emission factors, one representing the average empty case and one representing the average full case, were determined. Two emission rates were therefore determined for each Operational Scenario, using the average of the two as representative for each Operational Scenario.

Vicdom Utica Pit A6 ECA Supporting Calculations September 2013
R.J. Burnside & Associates Limited 300034048 034048 VicDom Utica Air Quality Assessment Report.docx
Average Empty Vehicle Emission Factor (gSPM/vkt)
= 281.9k * (s/12)0.7 * (W/3)0.45
= 281.9* 4.9 * (4.8/12) 0.7 * (17.1/3)0.45
= 1591.76
Average Full Vehicle Emission Factor (gSPM/vkt)
= 281.9k * (s/12)0.7 * (W/3)0.45
= 281.9* 4.9 * (4.8/12) 0.7 * (34.7/3)0.45
= 2188.65
Average Empty Vehicle Emission Rate (g/s)
= 26.6 vehicles/hr * 323 m * (1 km / 1000 m) * 1591.76 gSPM/vkt * (1 hr / 3600 s) * (1-(95% /100%))
= 0.1899 g/s
Average Full Vehicle Emission Rate (g/s)
= 26.6 vehicles/hr * 323 m * (1 km / 1000 m) * 2188.65 gSPM/vkt * (1 hr / 3600 s) * (1-(95% /100%))
= 0.2612 g/s
A control efficiency of 95% was used to account for the mitigating effects of the watering program, improved road grading, and strictly enforced speed limits. This control efficiency was based on AP-42 guidance and Table 13.2.2-2 (AP-42 Chapter 13.2.2) which suggests that 95% control is achievable with the application of water alone. As the proposed operation – in conjunction with a watering program – will restrict vehicle speed and strategically grade internal haul roads so silt stays to a minimum and water distributes evenly, thereby conserving water and reducing airborne silt, the 95 % control efficiency is considered appropriate.
Traffic volume was determined relative to the maximum of 120 trucks per day during the 9 hours of operation. This volume equates to 13.3 trucks per hour and therefore 26.6 one-way trips per hour. The haul route length differs for each Operational Scenario, the worst case haul route, Scenario 3, from the working face to the Miller Boynton Pit entrance to the north is shown below.
Emissions Rate = (0.1899 g/s + 0.2612 g/s) / 2
= 0.2256 g/s
Emissions resulting from the movement of the loader at the working face were calculated analogously.

Vicdom Utica Pit A7 ECA Supporting Calculations September 2013
R.J. Burnside & Associates Limited 300034048 034048 VicDom Utica Air Quality Assessment Report.docx
Data Quality: Above-Average
Data quality for this calculation is best characterized by the following paragraph from Section 8.3.2 of the ESDM Procedure Document titled “Above-Average Data Quality” Emission Estimating Techniques states:
Emission Factors: Emission rate estimates that are developed from tests on a moderate to large number of sources where the source category population is sufficiently specific to minimize variability (e.g., US EPA, AP-42, emission factor quality rating of A or B) are anticipated to provide above-average quality of emission rate estimates.
Operating Condition, Individual Maximum Rates of Production:
The emission rate calculations for this source are based on the maximum operating scenario with a “maximum worst-case” handling rate of 200 tonnes per hour.

Vicdom Sand Gravel
Uxbridge, ON
Table A-1:
Combustion Emissions
Project No.: 034048
Methodology: Emission Factor
Source: U.S. AP-42
Chapter: 3.3 Gasoline And Diesel Industrial EnginesS
ou
rce I
D
Description Contaminant Name CAS#
Emission
Factor
Emission
Factor
Units
Convert to
g
Convert to
s Data Quality
Engine
Horsepower (HP)
Emission Rate
(g/s)
Nitrogen oxides 10102-44-0 0.0310 lb/hp-hr 454 3600 Marginal 100 0.3909
Suspended Particulate Matter N/A 0.0022 lb/hp-hr 454 3600 Marginal 100 0.0277ENGINE Diesel engine (on portable screen)
R.J. Burnside & Associates Limited A1: 1 of 1 034048 VicDom Utica Air Quality Assessment Tables.xls

Vicdom Sand Gravel
Uxbridge, ON
Table A-2:
Processing Operations
Project No.: 034048
Methodology: Emission Factor
Source: U.S. AP-42
Chapter: 11.19.2 Crushed Stone Processing and Pulverized Mineral Processing
So
urc
e I
D
Description Contaminant Name CAS#
Controlled
Emission Factor
Controlled Emission
Factor Units
Data
Quality
Aggregate
Handling
Rate
Material
Handling Rate
Units
Convert
to g
Convert
to s
Emission Rate
(g/s)
SCREENScreening of raw
aggregate materialSuspended Particulate
Matter N/A 0.0011 kgSPM/ Mgaggregate Marginal 200 tonnes/hour 1000 3600 0.0611
STACKDropping of material from
stacker to stockpilesSuspended Particulate
Matter N/A 0.00007 kgSPM/ Mgaggregate Marginal 200 tonnes/hour 1000 3600 0.0039
R.J. Burnside & Associates Limited A2: 1 of 1 034048 VicDom Utica Air Quality Assessment Tables.xls
Vicdom Sand Gravel
Uxbridge, ON
Table A-3:
Bulk Material Handling
Project No.: 034048
Methodology: Emission Factor
Source: U.S. AP-42
Chapter: 13.2.4 Aggregate Handling And Storage Piles
So
urc
e I
D
Description Contaminant Name CAS# k U (m/s) M (%)
Emission
Factor
Emission Factor
Units
Data
Quality
Aggregate
Handling
Rate
Material
Handling
Rate Units
Convert
to g
Convert
to s
Emission
Rate (g/s)
LOAD
Loading of material
into trucks (tandem,
tractor trailer, pit)Suspended
Particulate Matter N/A 0.74 5 3.38 0.0017
kgSPM/
Mgaggregate Marginal 200 tonnes/hour 1000 3600 0.0917
Where: Emission Factor = k(0.0016)(((U/2.2)^1.3)/((M/2)^1.4))
k = particle size multiplier (dimensionless) = 0.74 for SPM
U = mean wind speed, meters per second (m/s) = 5 m/s for example calculation
M = material moisture content (%) = 3.38 % from reference documentation
R.J. Burnside & Associates Limited A3: 1 of 1 034048 VicDom Utica Air Quality Assessment Tables.xls

Vicdom Sand Gravel
Uxbridge, ON
Table A-4:
Unpaved Haul Roads
Project No.: 034048
Methodology: Emission Factor
Source: U.S. AP-42
Chapter: 13.2.2 Unpaved RoadsS
ou
rce I
D
Description
Contaminant
Name CAS# k s (%)
Average
Empty
Vehicle
Weight
(ton)
Average
Full
Vehicle
Weight
(ton)
CE
(%)
Average
Empty
Vehicle
Emission
Factor
Average
Full
Vehicle
Emission
Factor
Data
Quality
Route
Length
(m)
Vehicles
Per Hour
Convert
to g
Convert
to s
Average
Empty
Vehicle
Emission
Rate (g/s)
Average
Full
Vehicle
Emission
Rate (g/s)
Emission
Rate (g/s)
HAUL_1
Truck movement on
internal unpaved haul
route (Scenario 1 to Miller
Boynton Entrance)
Suspended
Particulate
Matter N/A 4.9 4.8 17.1 34.7 95 1592 2189
Above-
Average 198 26.6 1000 3600 0.1164 0.1601 0.1383
HAUL_2
Truck movement on
internal unpaved haul
route (Scenario 2 to Miller
Boynton Entrance)
Suspended
Particulate
Matter N/A 4.9 4.8 17.1 34.7 95 1592 2189
Above-
Average 223 26.6 1000 3600 0.1311 0.1803 0.1557
HAUL_3
Truck movement on
internal unpaved haul
route (Scenario 3 to Miller
Boynton Entrance)
Suspended
Particulate
Matter N/A 4.9 4.8 17.1 34.7 95 1592 2189
Above-
Average 347 26.6 1000 3600 0.2041 0.2806 0.2423
LOADER
Loader movement
between working face and
screen
Suspended
Particulate
Matter N/A 4.9 4.8 34.5 40 95 2183 2333
Above-
Average 50 80 1000 3600 0.1213 0.1296 0.1254
Where: Emission Factor (kgSPM/ Mgaggregate) = 281.9k((s/12)^0.7)((W/3)^0.45)
k = particle size multiplier (dimensionless) = 4.9 for SPM from Table 13.2.2-2
s = road surface silt material content (%) = 4.8 % from Table 13.2.2-1
W = average weight of the vehicles traveling the road (US short tons)
CE = emission control efficiency (%)
R.J. Burnside & Associates Limited A4: 1 of 1 034048 VicDom Utica Air Quality Assessment Tables.xls
Appendix B
Dispersion Modelling Printouts Table B-1 Modelling Input Values Figure B-1 Contour Plot of Maximum Concentrations for NOx

Vicdom Utica Pit B1 ECA Dispersion Modelling Printouts September 2013
R.J. Burnside & Associates Limited 300034048 034048 VicDom Utica Air Quality Assessment Report.docx
Appendix B Dispersion Modelling
1.0 Nitrogen Oxides .............................................................................................. 1
2.0 Suspended Particulate Matter ....................................................................... 1 The property boundary points are listed in Table C-1. The emission rates organized by emission source are found in Table 2. Selected pages from the simulation output file for nitrogen oxides are shown at the end of this Appendix.
1.0 Nitrogen Oxides
The nitrogen oxides simulation is found in the “034048 Vicdom Utica NOx.zip” backup. The NOx emission is predicted from the maximum firing rate of the screen’s diesel engine and simulated as a point source. All three modelling scenarios (1, 2, and 3) are included in the modelling file. The first highest predicted values are reported in Table 4.
A contour plot showing the first highest value for Scenario 1, 2, and 3 is shown in this Appendix labelled “Vicdom Utica Pit – NOx (1-hour averaging period)”.
2.0 Suspended Particulate Matter
The particulate matter simulation is found in the “034048 Vicdom Utica SPM.zip” backup. All sources, with the exception of internal haul roads and the diesel engine, were modelled as volume sources with parameters based on information obtained from site plans, the approximate dimensions of processing equipment, and vehicles proposed to be used at the facility. Internal haul roads were modelled as volume line sources and the exhaust stack from the diesel-fired engine was modelled as a point source.

Vicdom Sand & Gravel
Uxbridge, ON
Table B-1:
Modelling Input ValuesProject No.: 034048
X (m) Y (m)
653851.44 4880448.86
653906.05 4880445.56
653963.59 4880438.24
654022.22 4880422.85
654077.31 4880401.79
654129.72 4880378.35
654182.50 4880349.78
654235.27 4880322.31
654289.15 4880296.67
654318.10 4880284.95
654345.59 4880277.99
654401.43 4880265.82
654461.53 4880258.12
654494.89 4880254.09
654522.01 4880253.36
654580.28 4880258.86
654636.72 4880278.27
654646.61 4880301.71
654603.77 4880434.41
654597.54 4880473.60
654583.97 4880524.35
654541.82 4880644.49
654529.72 4880667.20
654523.86 4880685.14
654520.93 4880686.24
654487.94 4880669.03
654334.38 4880614.82
654291.38 4880598.33
654283.69 4880617.38
654221.38 4880617.74
653852.54 4880485.86
653848.87 4880466.08
UTM Coordinates
Property Boundary
R.J. Burnside & Associates Limited Table B1: 1 of 1 034048 VicDom Utica Air Quality Assessment Tables.xls

** Lakes Environmental AERMOD MPI ** **************************************** ** ** AERMOD Input Produced by: ** AERMOD View Ver. 8.1.0 ** Lakes Environmental Software Inc. ** Date: 9/17/2013 ** File: C:\AERMOD\VicDom\034048\Rev0\NOx\034048 NOx.ADI ** **************************************** ** ** **************************************** ** AERMOD Control Pathway **************************************** ** ** CO STARTING TITLEONE C:\AERMOD\VicDom Utica\VicDom Utica.isc MODELOPT DFAULT CONC AVERTIME 1 24 POLLUTID MULTI RUNORNOT RUN ERRORFIL "034048 NOx.err" CO FINISHED ** **************************************** ** AERMOD Source Pathway **************************************** ** ** SO STARTING ** Source Location ** ** Source ID - Type - X Coord. - Y Coord. ** LOCATION ENGINE1NOX POINT 654049.357 4880490.712 348.040 ** DESCRSRC diesel engine (on portable screen) LOCATION ENGINE2NOX POINT 654457.484 4880583.773 346.000 ** DESCRSRC diesel engine (on portable screen) LOCATION ENGINE3NOX POINT 654521.860 4880335.020 340.720 ** DESCRSRC diesel engine (on portable screen) ** Source Parameters ** SRCPARAM ENGINE1NOX 0.3909444444 3.000 816.000 44.56338 0.100 SRCPARAM ENGINE2NOX 0.3909444444 3.000 816.000 44.56338 0.100 SRCPARAM ENGINE3NOX 0.3909444444 3.000 816.000 44.56338 0.100 ** Variable Emissions Type: "By Hour / Day (HRDOW)" ** Variable Emission Scenario: "Scenario 2" ** WeekDays: EMISFACT ENGINE1NOX HRDOW 0.0 0.0 0.0 0.0 0.0 0.0 EMISFACT ENGINE1NOX HRDOW 1.0 1.0 1.0 1.0 1.0 1.0 EMISFACT ENGINE1NOX HRDOW 1.0 1.0 1.0 0.0 0.0 0.0 EMISFACT ENGINE1NOX HRDOW 0.0 0.0 0.0 0.0 0.0 0.0 ** Saturday: EMISFACT ENGINE1NOX HRDOW 0.0 0.0 0.0 0.0 0.0 0.0 EMISFACT ENGINE1NOX HRDOW 1.0 1.0 1.0 1.0 1.0 0.0 EMISFACT ENGINE1NOX HRDOW 0.0 0.0 0.0 0.0 0.0 0.0 EMISFACT ENGINE1NOX HRDOW 0.0 0.0 0.0 0.0 0.0 0.0 ** Sunday:

*** AERMOD - VERSION 12345 *** *** C:\AERMOD\VicDom Utica\VicDom Utica.isc *** 09/17/13 *** *** 20:27:39 PAGE 400 **MODELOPTs: RegDFAULT CONC ELEV *** THE MAXIMUM 200 1-HR AVERAGE CONCENTRATION VALUES FOR SOURCE GROUP: ALL *** INCLUDING SOURCE(S): ENGINE1NOX , ENGINE2NOX , ENGINE3NOX , ** CONC OF MULTI IN MICROGRAMS/M**3 ** RANK CONC (YYMMDDHH) AT RECEPTOR (XR,YR) OF TYPE RANK CONC (YYMMDDHH) AT RECEPTOR (XR,YR) OF TYPE - - - - - - - - - - - - - - - - - - - - - - - - - - - - - - - - - - - - - - - - - - - - - - - - - - - - - - - - - - - - - - - - - - 1. 239.89003 (99122008) AT ( 654419.00, 4880648.00) DC 41. 208.00333 (98021307) AT ( 654039.00, 4880408.00) DC 2. 238.05449 (00020307) AT ( 654419.00, 4880648.00) DC 42. 207.61864 (99122010) AT ( 654019.00, 4880548.00) DC 3. 237.06266 (96011615) AT ( 654419.00, 4880648.00) DC 43. 207.58937 (99022207) AT ( 654039.00, 4880408.00) DC 4. 235.31593 (98011409) AT ( 654022.22, 4880422.85) DC 44. 207.38551 (96010808) AT ( 654059.00, 4880408.00) DC 5. 234.34142 (96011614) AT ( 654419.00, 4880648.00) DC 45. 206.49921 (98011608) AT ( 654039.00, 4880408.00) DC 6. 234.32436 (98011511) AT ( 654022.22, 4880422.85) DC 46. 206.48796 (96032707) AT ( 654022.22, 4880422.85) DC 7. 232.23713 (99020215) AT ( 654419.00, 4880648.00) DC 47. 206.28665 (00020407) AT ( 653999.00, 4880428.00) DC 8. 227.38842 (96121110) AT ( 654022.22, 4880422.85) DC 48. 206.19196 (00121408) AT ( 654059.00, 4880408.00) DC 9. 226.28480 (99120815) AT ( 654419.00, 4880648.00) DC 49. 206.15747 (99022007) AT ( 654059.00, 4880408.00) DC 10. 225.71665 (00092807) AT ( 654022.22, 4880422.85) DC 50. 205.66123 (99122008) AT ( 654019.00, 4880548.00) DC 11. 224.57553 (97011515) AT ( 654419.00, 4880648.00) DC 51. 205.36725 (98022409) AT ( 654522.01, 4880253.36) DC 12. 222.69560 (99022407) AT ( 654022.22, 4880422.85) DC 52. 205.34826 (00011507) AT ( 654459.00, 4880668.00) DC 13. 221.30905 (97011515) AT ( 654019.00, 4880548.00) DC 53. 205.20632 (97110807) AT ( 654522.01, 4880253.36) DC 14. 220.41955 (96123010) AT ( 654022.22, 4880422.85) DC 54. 205.15951 (97013108) AT ( 654459.00, 4880668.00) DC 15. 219.86492 (99020215) AT ( 654019.00, 4880548.00) DC 55. 204.74206 (99121312) AT ( 654522.01, 4880253.36) DC 16. 219.26971 (96121109) AT ( 654022.22, 4880422.85) DC 56. 204.73780 (98121708) AT ( 654039.00, 4880408.00) DC 17. 217.03577 (98011612) AT ( 654022.22, 4880422.85) DC 57. 203.96934 (99022208) AT ( 654522.01, 4880253.36) DC 18. 216.01038 (99122010) AT ( 654419.00, 4880648.00) DC 58. 203.85135 (00122909) AT ( 654522.01, 4880253.36) DC 19. 215.33924 (96011614) AT ( 654019.00, 4880548.00) DC 59. 203.82888 (96022207) AT ( 654039.00, 4880408.00) DC 20. 215.32724 (00011013) AT ( 654419.00, 4880648.00) DC 60. 203.53705 (98021409) AT ( 654059.00, 4880408.00) DC 21. 214.69474 (96012207) AT ( 654439.00, 4880668.00) DC 61. 203.50645 (99120115) AT ( 654419.00, 4880648.00) DC 22. 214.60489 (00123010) AT ( 653999.00, 4880428.00) DC 62. 203.48900 (00120107) AT ( 654522.01, 4880253.36) DC 23. 214.58302 (96011615) AT ( 654019.00, 4880548.00) DC 63. 203.30107 (97020808) AT ( 654059.00, 4880408.00) DC 24. 214.17307 (96011611) AT ( 654019.00, 4880548.00) DC 64. 203.18787 (00122115) AT ( 654459.00, 4880668.00) DC 25. 213.65015 (00122113) AT ( 654019.00, 4880548.00) DC 65. 203.09623 (00121113) AT ( 654022.22, 4880422.85) DC 26. 213.06780 (96011611) AT ( 654419.00, 4880648.00) DC 66. 202.96816 (97013007) AT ( 653999.00, 4880428.00) DC 27. 212.92441 (98011514) AT ( 654022.22, 4880422.85) DC 67. 202.88770 (96022210) AT ( 654522.01, 4880253.36) DC 28. 212.56805 (00120208) AT ( 654059.00, 4880408.00) DC 68. 202.60109 (99122708) AT ( 654059.00, 4880408.00) DC 29. 211.16591 (98020507) AT ( 654522.01, 4880253.36) DC 69. 202.24139 (96121008) AT ( 654459.00, 4880668.00) DC 30. 210.75975 (00120107) AT ( 654059.00, 4880408.00) DC 70. 202.15616 (98011607) AT ( 654522.01, 4880253.36) DC 31. 210.68033 (98022408) AT ( 654522.01, 4880253.36) DC 71. 202.01164 (00120108) AT ( 654059.00, 4880408.00) DC 32. 209.86502 (96021508) AT ( 654059.00, 4880408.00) DC 72. 201.97433 (98122607) AT ( 654459.00, 4880668.00) DC 33. 209.83265 (98011610) AT ( 654022.22, 4880422.85) DC 73. 201.55760 (98010812) AT ( 654022.22, 4880422.85) DC 34. 209.66079 (97091707) AT ( 654419.00, 4880648.00) DC 74. 201.51769 (00021910) AT ( 654059.00, 4880408.00) DC 35. 209.43679 (00012008) AT ( 654522.01, 4880253.36) DC 75. 201.19534 (99121510) AT ( 654459.00, 4880668.00) DC 36. 209.10275 (98100707) AT ( 654419.00, 4880648.00) DC 76. 201.07101 (00122908) AT ( 654539.00, 4880248.00) DC 37. 208.90276 (96022209) AT ( 654059.00, 4880408.00) DC 77. 200.88191 (98021308) AT ( 654039.00, 4880408.00) DC 38. 208.56183 (00122113) AT ( 654419.00, 4880648.00) DC 78. 200.83475 (97020807) AT ( 654059.00, 4880408.00) DC 39. 208.13907 (00020408) AT ( 654522.01, 4880253.36) DC 79. 200.81738 (98011409) AT ( 654019.00, 4880408.00) DC 40. 208.10636 (97121107) AT ( 654059.00, 4880408.00) DC 80. 200.57238 (00121408) AT ( 654522.01, 4880253.36) DC

AERMOD View - Lakes Environmental Software C:\AERMOD\VicDom\034048\Rev0\NOx\034048 NOx.isc
SCALE:
0 0.2 km
1:6,571
PROJECT TITLE:
Vicdom Utica PitNOx (1-hour averaging period)
COMMENTS:
- Scenario 1 MAX POI at 58.79% of criteria- Scenario 2 MAX POI at 56.13% of criteria- Scenario 3 MAX POI at 48.95 % of criteria
COMPANY NAME:
MODELER:
DATE:
9/18/2013
PROJECT NO.:
034048
SOURCES:
3
RECEPTORS:
3393
OUTPUT TYPE:
Concentration
MAX:
239.89003 ug/m^3

Appendix C
Equipment Data

9/11/13 VOLVO l220e Wheel Loader
www.ritchiespecs.com/specification?category=Wheel Loader&make=VOLVO&model=l220e&modelid=91626 1/2
VOLVO L220E WHEEL LOADER
Bucket
Dimensions
G. DUMP CLEARANCE AT MAX RAISE 10.3 ft in 3150 mm
A. LENGTH WITH BUCKET ON GROUND 30.5 ft in 9300 mm
B. WIDTH OVER TIRES 10.4 ft in 3170 mm
C. HEIGHT TO TOP OF CAB 12.2 ft in 3730 mm
D. WHEELBASE 12.1 ft in 3700 mm
E. GROUND CLEARANCE 1.7 ft in 510 mm
F. HINGE PIN - MAX HEIGHT 15.4 ft in 4680 mm
H. REACH AT MAX LIFT AND DUMP 4.6 ft in 1400 mm

9/11/13 VOLVO l220e Wheel Loader
www.ritchiespecs.com/specification?category=Wheel Loader&make=VOLVO&model=l220e&modelid=91626 2/2
VOLVO L220E WHEEL LOADER
Specification
Engine
MAKE Volvo
MODEL D12CLBE2
NET POWER 351 hp 261.7 kw
GROSS POWER 352 hp 262.5 kw
POWER MEASURED @ 1600 rpm
DISPLACEMENT 732.3 cu in 12 L
TORQUE MEASURED @ 1200 rpm
MAX TORQUE 1301.8 lb ft 1765 Nm
NUMBER OF CYLINDERS 6
Operational
OPERATING WEIGHT 68960.6 lb 31280 kg
FUEL CAPACITY 97.7 gal 370 L
HYDRAUILC SYSTEM FLUID CAPACITY 64.2 gal 243 L
ENGINE OIL FLUID CAPACITY 12.7 gal 48 L
COOLING SYSTEM FLUID CAPACITY 11.4 gal 43 L
TRANSMISSION FLUID CAPACITY 11.9 gal 45 L
FRONT AXLE/DIFF FLUID CAPACITY 20.3 gal 77 L
REAR AXLE/DIFF FLUID CAPACITY 18.8 gal 71 L
STATIC TIPPING WEIGHT 51808.6 lb 23500 kg
TURNING RADIUS 25.6 ft in 7810 mm
OPERATING VOLTAGE 24 V
ALTERNATOR SUPPLIED AMPERAGE 55 amps
REAR AXLE OSCILLATION 30 degrees
TIRE SIZE 29.5R25 L3
Transmission
TYPE Volve HTE 305
NUMBER OF FORWARD GEARS 4
NUMBER OF REVERSE GEARS 4
MAX SPEED - FORWARD 20.4 mph 32.8 km/h
MAX SPEED - REVERSE 20.4 mph 32.8 km/h
Hydraulic System
RELIEF VALVE PRESSURE 3625.9 psi 25000 kPa
PUMP FLOW CAPACITY 61.8 gal/min 234 L/min
RAISE TIME 5.8 sec
DUMP TIME 1.6 sec
LOWER TIME 3.2 sec
Bucket
BREAKOUT FORCE 50177.4 lb 223.2 kN
DUMP CLEARANCE AT MAX RAISE 10.3 ft in 3150 mm
BUCKET WIDTH 11.3 ft in 3430 mm
BUCKET CAPACITY - HEAPED 6.8 yd3 5.2 m3
Dimensions
LENGTH WITH BUCKET ON GROUND 30.5 ft in 9300 mm
WIDTH OVER TIRES 10.4 ft in 3170 mm
HEIGHT TO TOP OF CAB 12.2 ft in 3730 mm
GROUND CLEARANCE 1.7 ft in 510 mm
WHEELBASE 12.1 ft in 3700 mm
HINGE PIN - MAX HEIGHT 15.4 ft in 4680 mm
REACH AT MAX LIFT AND DUMP 4.6 ft in 1400 mm

S130 Nov. 2006, issue 005
1
All specifications are current as of this printing, but are subject to change
SPECIFICATIONS
McCloskey
S130
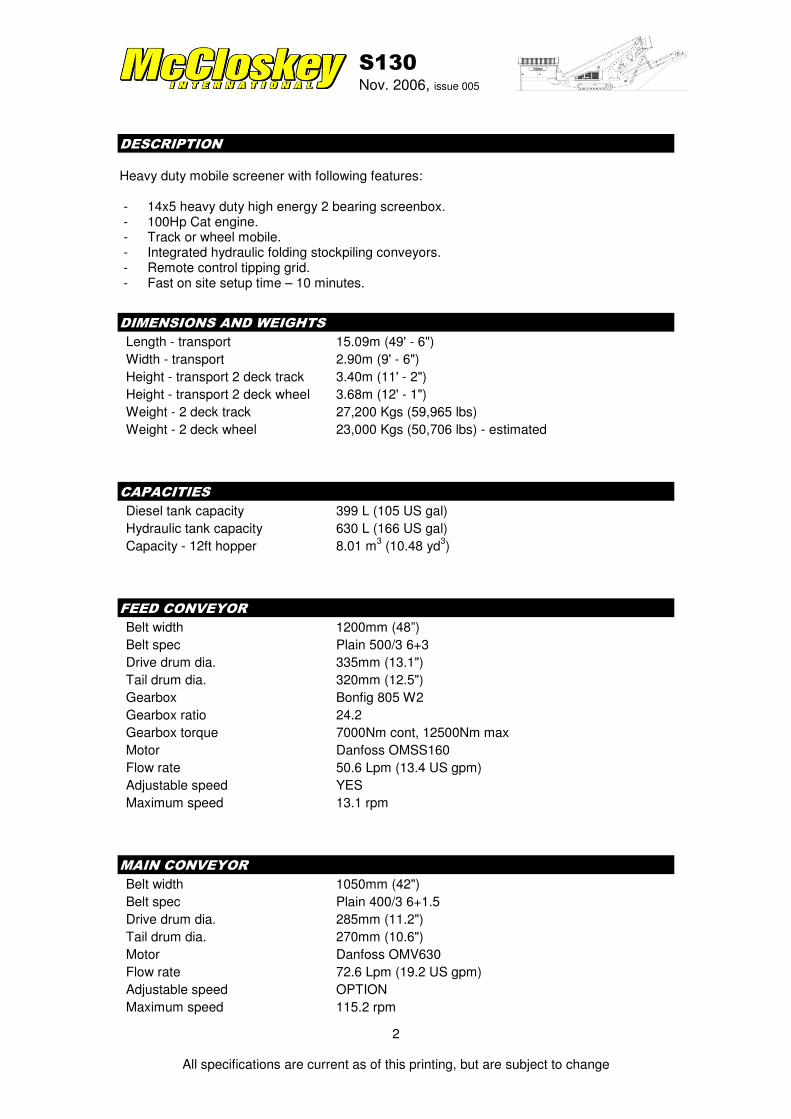
S130 Nov. 2006, issue 005
2
All specifications are current as of this printing, but are subject to change
DESCRIPTION
Heavy duty mobile screener with following features: - 14x5 heavy duty high energy 2 bearing screenbox. - 100Hp Cat engine. - Track or wheel mobile. - Integrated hydraulic folding stockpiling conveyors. - Remote control tipping grid. - Fast on site setup time – 10 minutes.
DIMENSIONS AND WEIGHTS
Length - transport 15.09m (49' - 6")
Width - transport 2.90m (9' - 6")
Height - transport 2 deck track 3.40m (11' - 2")
Height - transport 2 deck wheel 3.68m (12' - 1")
Weight - 2 deck track 27,200 Kgs (59,965 lbs)
Weight - 2 deck wheel 23,000 Kgs (50,706 lbs) - estimated
CAPACITIES
Diesel tank capacity 399 L (105 US gal)
Hydraulic tank capacity 630 L (166 US gal)
Capacity - 12ft hopper 8.01 m3 (10.48 yd
3)
FEED CONVEYOR
Belt width 1200mm (48”)
Belt spec Plain 500/3 6+3
Drive drum dia. 335mm (13.1")
Tail drum dia. 320mm (12.5")
Gearbox Bonfig 805 W2
Gearbox ratio 24.2
Gearbox torque 7000Nm cont, 12500Nm max
Motor Danfoss OMSS160
Flow rate 50.6 Lpm (13.4 US gpm)
Adjustable speed YES
Maximum speed 13.1 rpm
MAIN CONVEYOR
Belt width 1050mm (42")
Belt spec Plain 400/3 6+1.5
Drive drum dia. 285mm (11.2")
Tail drum dia. 270mm (10.6")
Motor Danfoss OMV630
Flow rate 72.6 Lpm (19.2 US gpm)
Adjustable speed OPTION
Maximum speed 115.2 rpm

S130 Nov. 2006, issue 005
3
All specifications are current as of this printing, but are subject to change
TAIL CONVEYOR
Stockpile height - track model 3871mm (12' - 8")
Stockpile height - wheel model 4139mm (13' - 7")
Belt width 1200mm (48")
Belt spec Plain - 400/2 6+1.5
Drive drum dia. 285mm (11.2")
Tail drum dia. 270mm (10.6")
Motor Danfoss OMV630
Flow rate 72.6 Lpm (19.2 US gpm)
Maximum speed 115.2 rpm
SIDE CONVEYOR
Stockpile height - track model 4600mm (15' - 1")
Stockpile height - wheel model 4870mm (15' - 11")
Belt width 650mm (26")
Belt spec Chevron - 400/3 6+1.5
Drive drum dia. 285mm (11.2")
Tail drum dia. 270mm (10.6")
Motor OMT400
Flow rate 50.6 Lpm (13.4 US gpm)
Adjustable speed YES
Maximum speed 126.5 rpm
SCREENBOX
Dimensions - top deck 4270mm x 1524mm (14' x 5')
Dimensions - bottom deck 3660mm x 1524mm (12' x 5')
Bearing type 2 Deck NSK/RHP 22319 - 95mm bore
Screens - top deck 5' x 4' side tension - 3 off & 5’ x 2’ side tension - 1 off
Screens - bottom deck 5' x 6' end tension - 2 off
Tensioning - top deck Quick release pin and wedge
Tensioning - bottom deck Curved tension bar and adjuster
Screen angle 25 to 38 deg
Screen motor DBH MCC2208 (58.9cc/rev)
Drive system Direct drive with HRC180 coupling
Hydraulic flowrate 72.6 Lpm (19.2 US gpm)
Speed adjustable YES - Pressure compensated FCV
Screen stroke adjustable 6 - 10mm maximum
Screen shaft speed 1130 - 950 rpm
Screen 'g' force 4.29 - 5.05

S130 Nov. 2006, issue 005
4
All specifications are current as of this printing, but are subject to change
POWERUNIT AND HYDRAULICS
Engine CAT 3054 C DIT (Tier II)
Engine power 100 HP
Engine speed 2200 rpm
Flywheel Pump 1 DBH 5033,5033
LH PTO Pump 2 DBH 5023,5023
RH PTO Pump 3 DBH 2SPA11
Total system flow 289 L (76.3 US Gpm)
Hydraulic tank capacity 630 L (166 US Gals)
Hydraulic tank ratio 2.18 : 1
Hydraulic Oil cooler YES
ELECTRICS
Emergency stops 6 off, 1 feeder, 2 powerunit RH&LH, 2 chassis front RH&LH, 1 Walkway
Chassis cabling Armored cable
Start Siren YES - 10 sec delay
Engine shutdowns: Low oil pressure
High water temp
Air filter blockage (selectable)
Fuel contamination
Low hydraulic tank level
Engine room light YES
Remote tipping grid YES - 2 function timed
Radio control tracks optional - Hetronic system
Pendant track control YES - plugged in at feeder end
TRACKS
Width 500mm (19.7")
Length 2920mm (9' - 7") crs
Height 739mm (29.4")
Gearbox Bonfiglioli 707
Ratio 122:1
Motor Rexroth 63
Speed max 1.32 Kph (0.82 Mph)
Flow rate 72.6 Lpm (19.2 US gpm)
Dual speed TBC
Attachment to chassis Bolt On for quick change

S130 Nov. 2006, issue 005
5
All specifications are current as of this printing, but are subject to change
WHEELS
Width 2900mm (9' - 6")
Axle centers 1360mm (4' - 6")
Wheels 235/75/R17.5 dual
Axles 2 off
Brakes YES
Spring suspension YES
Mudguards YES
Handbrake OPTION
ABS OPTION
OPTIONS
Single or double deck live head
Roll-in bogie system
Single shaft shredder
2 Deck Rinser
Crusher chute (available with 15ft hopper only)
Radio remote control
SAFETY FEATURES
External belt alignment points
External grease points
Engine safety shutdown systems
Full safety guarding for nip points

S130 Nov. 2006, issue 005
6
All specifications are current as of this printing, but are subject to change
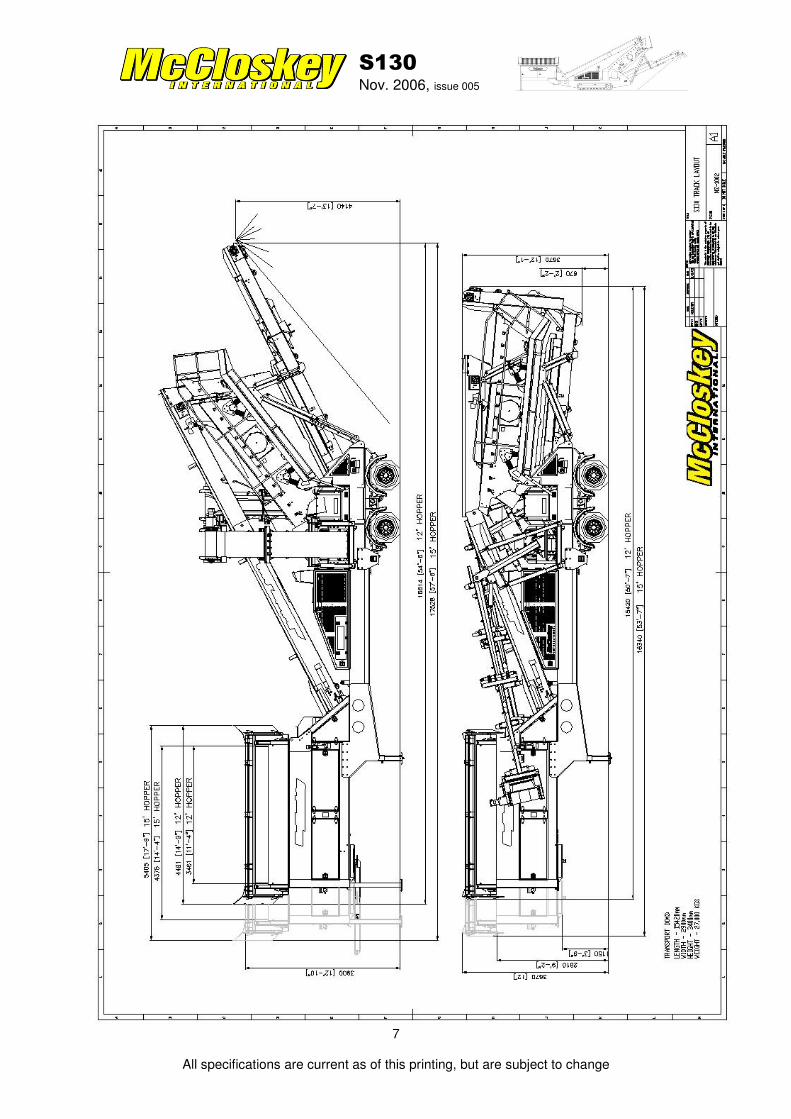
S130 Nov. 2006, issue 005
7
All specifications are current as of this printing, but are subject to change

S130 Nov. 2006, issue 005
8
All specifications are current as of this printing, but are subject to change

S130 Nov. 2006, issue 005
9
All specifications are current as of this printing, but are subject to change