air force institute of technology - defense … · air force institute of technology . air...
TRANSCRIPT
PROCESS FOR REFINING AND VALIDATING A FINITE ELEMENT MODEL
OF AN EXPERIMENTAL HIGH-ALTITUDE, LONG-ENDURANCE (HALE)
AIRCRAFT
THESIS
Nicholas A. Sinnokrak, Lieutenant Commander, USN AFIT/GAE/ENY/11-J04
DEPARTMENT OF THE AIR FORCE AIR UNIVERSITY
AIR FORCE INSTITUTE OF TECHNOLOGY
Wright-Patterson Air Force Base, Ohio APPROVED FOR PUBLIC RELEASE; DISTRIBUTION UNLIMITED

The views expressed in this thesis are those of the author and do not reflect the official
policy or position of the United States Air Force, the United States Navy, the Department
of Defense, or the United States Government. This material is declared a work of the
U.S. Government and is not subject to copyright protection in the United States.
AFIT/GAE/ENY/11-J04
PROCESS FOR REFINING AND VALIDATING A FINITE ELEMENT MODEL
OF AN EXPERIMENTAL HIGH-ALTITUDE, LONG-ENDURANCE (HALE)
AIRCRAFT
THESIS
Presented to the Faculty
Department of Aeronautics and Astronautics
Graduate School of Engineering and Management
Air Force Institute of Technology
Air University
Air Education and Training Command
In Partial Fulfillment of the Requirements for the
Degree of Master of Science in Aeronautical Engineering
Nicholas A. Sinnokrak
Lieutenant Commander, USN
June 2011
APPROVED FOR PUBLIC RELEASE; DISTRIBUTION UNLIMITED.
AFIT/GAE/ENY/11-J04
PROCESS FOR REFINING AND VALIDATING A FINITE ELEMENT MODEL
OF AN EXPERIMENTAL HIGH-ALTITUDE, LONG-ENDURANCE (HALE)
AIRCRAFT
Nicholas A. Sinnokrak
Lieutenant Commander, USN
Approved:
________
Lt Col Christopher M. Shearer, USAF (Chairman) Date
_______________________________________ ________
Dr. Eric D. Swenson (Member) Date
_____________________________________ ________
Dr. Donald L. Kunz (Member) Date
iv
AFIT/GAE/ENY/11-J04 Abstract
The work presented here focuses on finite element (FE) modeling of X-HALE, a
test aircraft designed and built by the University of Michigan, in conjunction with the Air
Force Institute of Technology (AFIT) and Air Force Research Laboratory (AFRL). This
scaled vehicle is representative of high-altitude, long-endurance (HALE) aircraft and was
designed to provide controlled aeroelastic and flight data. FE models of portions of the
X-HALE wing structure were created and analysis results were compared against two
separate laboratory static bending tests conducted on X-HALE wing sections. The
process documented here should improve future efforts to refine FE models of X-HALE.
Improved modeling techniques will help design and test X-HALE to provide data for
future designs of HALE aircraft and will also help to validate coupled nonlinear
aeroelastic and flight dynamic codes. Results of the FE models created indicate the
manufactured wing structure possesses material properties close to those expected of the
composite materials used in its design. However, the results also suggest additional focus
is required to accurately model the wing joint region of the X-HALE structure, with
specific attention paid to the joiner piece which connects the wing sections together.

v
To my wife & son
vi
Table of Contents
Page
Abstract .................................................................................................................. iv
List of Figures ...................................................................................................... viii
List of Tables ....................................................................................................... xiii
Nomenclature ....................................................................................................... xiv
I. Introduction ........................................................................................................ 1
Mission Requirements ........................................................................................ 2 Research Focus and Objectives .......................................................................... 4
II. Background ....................................................................................................... 6
HALE Aircraft .................................................................................................... 6 DARPA Vulture Program ................................................................................. 11 Theory and Previous Research ......................................................................... 11 X-HALE Overview ........................................................................................... 12
X-HALE Wing. ............................................................................................. 14 Wing Joint. .................................................................................................... 16
Setup and Apparatus of Laboratory Tests ......................................................... 19 Three-point Bending Test. ............................................................................ 20 Bending and Torsion Rig Test. ..................................................................... 23
Rig Design. ............................................................................................... 23 Stiffness Tests. .......................................................................................... 28
X-HALE Ground and Flight Testing ................................................................ 28
III. Methodology .................................................................................................. 32
FEMAP Uses and Limitations .......................................................................... 33 Modeling Process .............................................................................................. 34 Three-point Bending Test ................................................................................. 35
Simplifying Assumptions. ............................................................................. 38 Loads and Boundary Conditions. .................................................................. 39
Loads. ........................................................................................................ 40 Boundary conditions. ................................................................................ 40
FE meshes. .................................................................................................... 41 Contact Problem. ........................................................................................... 45 Lessons Learned. ........................................................................................... 55
Bending and Torsion Test Rig .......................................................................... 59 Simplifying Assumptions. ............................................................................. 60
vii
Loads and Boundary Conditions. .................................................................. 61 FE Model Development. ............................................................................... 62 Lessons Learned. ........................................................................................... 92
IV. Results and Discussion .................................................................................. 96
Three-point Bending Test ................................................................................. 96 Deformed Geometry. .................................................................................... 98 Stress Contours. ............................................................................................ 98 Comparison to Laboratory Data .................................................................. 100 Quality of Load and Boundary Condition Definitions. .............................. 105 Additional Comments Regarding FE Model Quality. ................................ 106
Bending and Torsion Rig Test ........................................................................ 107 Deformed Geometry. .................................................................................. 109
V. Conclusions ................................................................................................... 119
Appendix ............................................................................................................. 123
X-HALE Design Components ........................................................................ 123 X-HALE Fabrication ...................................................................................... 125
Foam Core. .................................................................................................. 125 Wing Box. ................................................................................................... 126 Wing Section. .............................................................................................. 128 Wing Joint. .................................................................................................. 130
X-HALE Testing ............................................................................................. 131 Test Plan [31]. ............................................................................................. 131 Previous Tests [31]. .................................................................................... 132
Bibliography ....................................................................................................... 135
Vita ...................................................................................................................... 138
viii
List of Figures
Figure Page
Figure 1. Performance envelope for unmanned systems [3] .............................................. 4
Figure 2. Pathfinder aircraft at rest on Rogers Dry Lake Bed, c. 1992 [11] ...................... 7
Figure 3. Pathfinder aircraft in flight, c. 1992 [11] ............................................................ 7
Figure 4. Helios flying near the Hawaiian islands of Niihau and Lehua [15] ................... 8
Figure 5. Plan view of ERAST Program aircraft plus front view of HP03 [23]................ 9
Figure 6. AeroVironment, Inc. Global Observer's first flight [1] ...................................... 9
Figure 7. Boeing's Phantom Eye UAV [2] ...................................................................... 10
Figure 8. RQ-4 Global Hawk [3] ..................................................................................... 10
Figure 9. Final variant of X-HALE [8] ............................................................................ 13
Figure 10. Plan- and front-views of X-HALE [9] ............................................................ 14
Figure 11. Cross section of X-HALE wing with additional detail of wing box corner area (detail shows individual layers of fiberglass in blue) [28] ............ 15
Figure 12. CAD model of a single wing section .............................................................. 16
Figure 13. a) Joiner block and b) alignment between joiner block and wing box [9] ..... 17
Figure 14. Joiner block for outer dihedral wing joints [27] ............................................. 17
Figure 15. Joiner sleeve joint fitting [29].......................................................................... 18
Figure 16. Transparent CAD view of fairing structure [9] .............................................. 19
Figure 17. Unassembled wing joint [28].......................................................................... 21
Figure 18. Assembled wing joint showing strain gauges [28] ......................................... 21
Figure 19. Joined 2-wing test section (right side up) [28] ............................................... 22
Figure 20. Wing Joint Bending Set-up [28] ..................................................................... 22
Figure 21. Laboratory wing joint 3-point bending test [28] ............................................ 22
Figure 22. 3-point bending test loading cycle [28] .......................................................... 23
Figure 23. Test rig overview [20] .................................................................................... 25
Figure 24. Wing mount assembly (showing 2 wings joined) [20] ................................... 26
Figure 25. Bottom wing mount [20] ................................................................................ 27
Figure 26. Top wing mount [20] ...................................................................................... 27
ix
Figure 27. X-HALE Transport Box ................................................................................. 30
Figure 28. X-HALE Transport Box (Top View) ............................................................. 31
Figure 29. X-HALE Transport Box (Front View) ........................................................... 31
Figure 30. CAD model of 2 wing section and joiner block (separated apart) ................. 37
Figure 31. FE model constraints indicated by red triangles............................................. 41
Figure 32. FE model constraints indicated by red triangles (front view) ........................ 41
Figure 33. Overlapping wing box and airfoil geometry and mesh ................................... 43
Figure 34. End of wing box model (only fiberglass wing box remains) .......................... 43
Figure 35. Model 3 deformed showing wooden joiner block inside wing box ............... 45
Figure 36. Wing box joint without contact surfaces defined showing protruding joiner (with close-up detail of joiner block) ..................................................... 46
Figure 37. Cantilever Test Model, Contact Surfaces NOT Activated .............................. 48
Figure 38. Successful Contact Test ................................................................................... 48
Figure 39. Joined wing box model showing top wing box surfaces highlighted ............. 50
Figure 40. Joined wing box model showing top joiner block surface highlighted .......... 50
Figure 41. Joined wing box model showing bottom joiner block surface highlighted ....................................................................................................... 51
Figure 42. Joined wing box model showing bottom wing box surfaces highlighted ....................................................................................................... 51
Figure 43. Wing box joint with contact surfaces defined showing resulting contact forces (detail of Model 5, color contours show contact force) ............ 52
Figure 44. Deformed geometry (Model 6) with no foam in the airfoil............................. 54
Figure 45. Behavior resulting from trailing edge mesh separation .................................. 55
Figure 46. Overlapping foam elements at leading edge of wing ..................................... 57
Figure 47. Corrected leading edge foam element ............................................................ 58
Figure 48. Deformed model with load applied to nodes on the right wing box section .............................................................................................................. 59
Figure 49. CAD drawing of single wing showing coordinate system ............................. 60
Figure 50. Single wing span representing only fiberglass structure ................................ 61
Figure 51. Original CAD geometry of single wing box .................................................. 65
Figure 52. Undeformed (blue) and deformed (white) coarse mesh of wing box ............. 66
Figure 53. Undeformed (blue) and deformed (white) fine mesh of wing box ................. 67
Figure 54. Wing box mesh showing 3 different mesh sizes along span .......................... 68
x
Figure 55. View showing placement of load at free end of wing box with deformed mesh ................................................................................................. 68
Figure 56. Airfoil-only model of single wing showing applied load and constraint ....... 70
Figure 57. Single wing model with color contours showing total element translation ......................................................................................................... 71
Figure 58. Two single wing meshes with rigid elements (white lines) along free edge .................................................................................................................. 72
Figure 59. Transparent view showing wing box and airfoil geometries merged............. 73
Figure 60. Initial mesh of combined wing box and airfoil model (top); and view showing poor chordwise alignment of airfoil and wing box elements (bottom) ............................................................................................................ 74
Figure 61. Outline of undeformed wing and deformed color contour mesh showing concentration of translated elements along trailing edge half of free edge ........................................................................................................... 76
Figure 62. Outline of undeformed wing and deformed mesh showing elements of lower wing surface deflecting through those of upper wing surface ............... 76
Figure 63. Undeformed wing (dark green) and deformed mesh (gray) with rigid links added between wing surfaces along free edge (white lines) ................... 77
Figure 64. Wing box model with solid foam (bright blue) inside fiberglass walls ......... 79
Figure 65. Undeformed outline and deformed color contour mesh of wing box with solid foam (bright orange)........................................................................ 80
Figure 66. Wing mesh in the progress of adding solid foam elements (white) within fiberglass plate elements (gray) ............................................................ 80
Figure 67. Color contour mesh of foam-filled single wing model .................................. 82
Figure 68. Outline of single wing and deformed mesh resulting from test load applied to trailing edge of wing ....................................................................... 83
Figure 69. Outline of single wing and deformed mesh resulting from test load applied to free edge of wing ............................................................................. 84
Figure 70. Two-wing model with coincident nodes along joint highlighted ................... 85
Figure 71. 2-wing model showing surface where loads were applied (highlighted yellow).............................................................................................................. 86
Figure 72. Original CAD geometry of aluminum joiner ................................................. 87
Figure 73. Single wing model with Al joiner imported from original CAD ................... 88
Figure 74. Single wing model with Al joiner imported from original CAD ................... 88
Figure 75. Single wing box mesh with Al joiner imported from original CAD .............. 89
Figure 76. Single wing box mesh with Al joiner imported from original CAD .............. 89
Figure 77. Single wing model with Al joiner copied to free end of wing ....................... 90
xi
Figure 78. FE mesh of two wing sections with Al joiner (highlighted yellow)............... 91
Figure 79. FE mesh of two wing sections with Al joiner (highlighted yellow)............... 91
Figure 80. View of 2 m wing section subjected to 3-point bending test showing deflection reference line between wing tips ..................................................... 97
Figure 81. Deflection of wing joint vs. time resulting from 3-point bending test ........... 97
Figure 82. Front view of Model 8 showing deformed mesh geometry (color contours indicate total translation) ................................................................... 99
Figure 83. Close up view of Model 8 mesh at the joint showing separation between elements of each wing section as well as joiner protrusion ............... 99
Figure 84. Plate Stress Contour (Model 8, 60lb load) .................................................... 100
Figure 85. Plate Stress at Center of Airfoil (Model 8, 60lb load) ................................... 100
Figure 86. Comparison of load vs. displacement results amongst lab and 8 FE models ............................................................................................................ 102
Figure 87. Comparison of displacement results between lab test, Model 8, and 3 versions of Model 8 with modified material properties ................................. 104
Figure 88. Wing tip deflections for 4 single test wing sections under loading conditions ....................................................................................................... 108
Figure 89. Wing tip deflections for 2 joined test wing sections under loading conditions ....................................................................................................... 108
Figure 90. Free end of wing box model showing total translation under applied load with original position of wing box outlined ........................................... 109
Figure 91. Deflection of combined wing box / airfoil model for 0.67 lb (3N) applied load (0.276 in. maximum deflection indicated) ................................ 113
Figure 92. Exaggerated deflection of wing mesh showing deformation without (left) and with (right) rigid links between airfoil surfaces forward of the wing box ......................................................................................................... 114
Figure 93. Mesh of full wing model showing translation contours ............................... 114
Figure 94. Deformations of the final single wing model under 5 loading conditions (undeformed wing in blue/green) ................................................. 116
Figure 95. Simple 2-wing model under 3 N load showing original position (blue/green) and deformed position (gray mesh) ........................................... 117
Figure 96. Simple 2-wing model under 7 N load showing original position (blue/green) and deformed position (gray mesh) ........................................... 118
Figure 97. Off-angle and front views of fairing [28] ..................................................... 123
Figure 98. Front view of 6-m version of X-HALE showing dihedral wing joint .......... 124
Figure 99. Side view of spine / fairing / tail section showing typical arrangement of internal electronics of each fairing............................................................. 124
xii
Figure 100. Uncut foam blocks with acrylic templates attached prior to sanding ......... 125
Figure 101. Aluminum wing mold used to shape and cure the X-HALE airfoil ........... 126
Figure 102. Carbon fiber end of wing box ..................................................................... 127
Figure 103. Wing box end with carbon fiber dowels added attached to wing box foam................................................................................................................ 127
Figure 104. Layup assembly for wing box .................................................................... 128
Figure 105. End of finished wing box (left) and cross section (right) ........................... 128
Figure 106. Completed wing box attached to leading and trailing edge sections of foam................................................................................................................ 129
Figure 107. Single wing assembly before (left) and after (right) final fiberglass layer ................................................................................................................ 129
Figure 108. Layup arrangement for single wing section ............................................... 129
Figure 109. Three-view diagram of aluminum joiner block with dimensions .............. 130
Figure 110. Three-view diagram of dihedral version of aluminum joiner block ........... 131
Figure 111. Graph of Power vs. Thrust [31] .................................................................. 133
xiii
List of Tables
Table Page
Table 1. Summary of FE models and descriptions .......................................................... 38
Table 2. Summary of FE models and descriptions ........................................................ 101
Table 3. Comparison of laboratory and FE model wing tip deflections for five load cases ....................................................................................................... 110
xiv
Nomenclature
Abbreviation
AFIT Air Force Institute of Technology
AFRL Air Force Research Laboratory
ATV Aeroelastic Test Vehicle
CAD Computer-aided Design
cg Center of Gravity
DARPA Defense Advanced Research Projects Agency
E Modulus of Elasticity / Young's modulus
EI Bending stiffness
FE Finite Element
FEMAP Finite element modeling and post-processing application
FTV Flight Test Vehicle
FQ Flying qualities
GPS Global Positioning System
HALE High-Altitude, Long-Endurance
ISR Intelligence, Surveillance, and Reconnaissance
R/C radio controlled
RPA Remotely Piloted Aircraft
UM/NAST University of Michigan’s Nonlinear Aeroelastic Simulation Toolbox
X-HALE Experimental High-Altitude, Long-Endurance
1
PROCESS FOR REFINING AND VALIDATING A FINITE ELEMENT MODEL
OF AN EXPERIMENTAL HIGH-ALTITUDE, LONG-ENDURANCE (HALE)
AIRCRAFT
I. Introduction
The desire to fly higher and farther has existed as soon as humans took to the
skies over two centuries ago. Aircraft designs have evolved profoundly during this time.
Initial designs attempted to mimic birds and therefore focused on flapping wings of
various sorts. Once Sir George Cayley of England set the study of aeronautics down the
path of fixed wing craft, aviation history was destined towards airmen such as Otto
Lilienthal and the Wright brothers. Ultimately, after overcoming the challenge of aircraft
propulsion, Orville and Wilbur Wright were able to successfully control their Wright
Flyers utilizing wing warping techniques. Upon understanding basic aerodynamics and
effective means of aircraft control, aeronautical engineering experienced exponential
developments throughout the 20th Century [7].
The arena of aeronautical design again finds itself looking to extend the
endurance and application of aircraft far beyond what is most commonly understood to
be normal. With the continued advancement and reliability of automated systems,
aircraft that can remain airborne for years at a time are nearing the realm of reality.
2
Mission Requirements
The past decades have seen a dramatic rise in the use of and reliance on satellites
for various purposes. Scientific research and military operations alike gather vast
amounts of data from these orbiting platforms. Although their value is readily apparent,
there are many drawbacks to using satellites. The sensor payloads within satellites are
expensive and complicated to design, as they are required to operate reliably in extremely
harsh conditions. The mere act of launching satellites is somewhat risky, and by
extension costly. The capital investment required up front to successfully place a satellite
into orbit is enormous and often prohibitive. Once launched, the coverage areas of
satellites are often difficult to adjust, usually requiring large constellations to provide the
desired coverage. In contrast, high-flying aircraft are less costly to launch and much less
expensive to test. The ability to adjust an aircraft's flight path, and thereby coverage area,
is far less complicated both to plan and execute. And with take-off and landing the
riskiest portions of an aircraft's flight, the longer an aircraft stays aloft the more of its
operational life it spends in a relatively benign environment [11]. Along with improved
reliability, maintainability, and modularity, these are just some of the advantages which a
high-altitude, long-endurance [34] (HALE) aircraft posses over satellites. Of course,
long before satellites became commonplace aircraft were operating at great heights.
Military aircraft such as the U-2 and B-52 have exploited altitude extremes in order to
collect information undetected or as a defensive means by remaining out of the reach of
adversaries. Scientific aircraft such as Voyager or Helios used extreme altitudes out of
necessity to break range and endurance records.
3
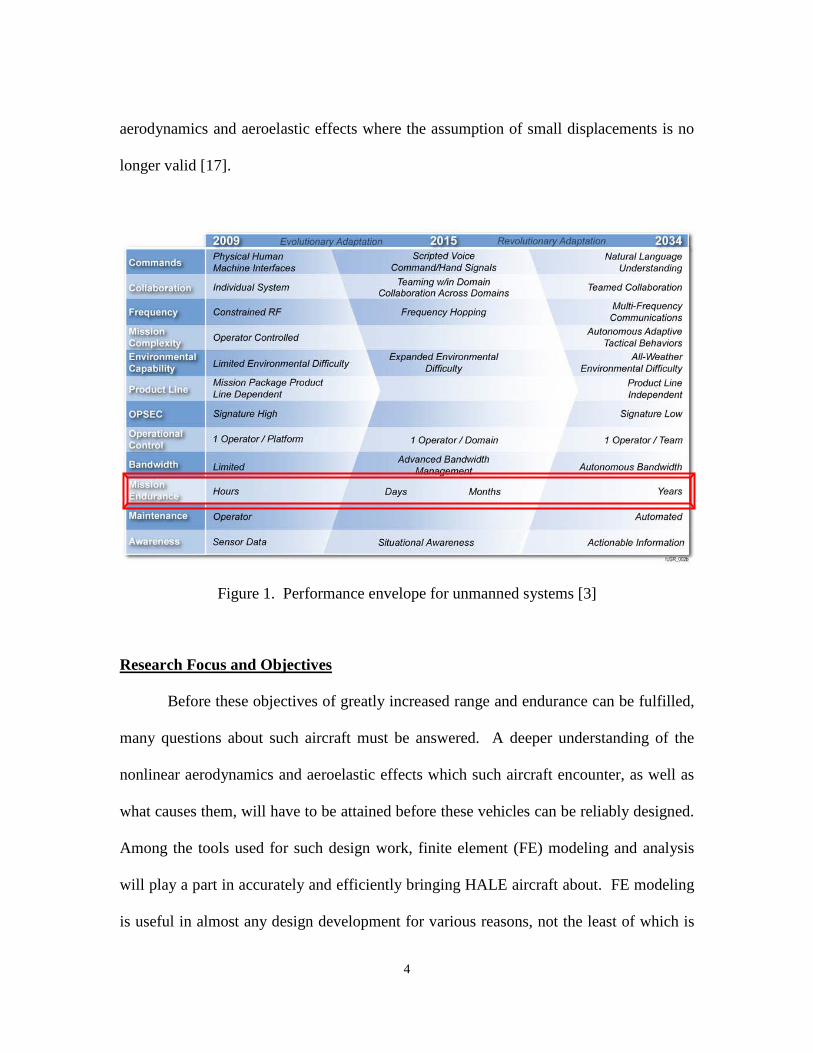
The United States Department of Defense's roadmap for all unmanned systems
highlights the desire for increased endurance and range for unmanned aircraft systems
(UAS); note the highlighted portion of Figure 1 [3]. While mission endurance is
currently most often measured in hours, in the future it will be both beneficial and
necessary for UAS aircraft to be able to "conduct their missions in durations measured in
days, weeks, months, and feasibly years [3]." Especially for high altitude missions, such
as Intelligence, Surveillance, and Reconnaissance (ISR) and data gathering for scientific
purposes, operations are almost always limited by the constraints of the human body –
our need for food and sleep. Zephyr and Global Observer HALE systems are already in
development or being procured. These systems are envisioned to fill the need to have an
asset orbit for weeks at a time providing a communication link over an area of thousands
of square miles, or to develop power systems able to support HALE UAS operations,
respectively. Development is planned within this decade for a persistent HALE UAS
able remain on station for months at a time without refueling, providing continuous ISR
capabilities.
Aircraft such as these which are designed to fly primarily at altitudes far above
those used by current commercial aircraft share some specific characteristics.
Specifically, their long wings have relatively large aspect ratios and thick airfoils as
compared to more conventional aircraft. At high altitudes thicker airfoils have lower
critical Mach numbers due to a lower speed of sound as compared to sea level. For
maximum endurance these aircraft have very lightweight structures with flexible wings
which tend to experience large deformations during normal, trimmed flight. The results
of a wing with higher Mach flows and extreme deformations can be nonlinear
4
aerodynamics and aeroelastic effects where the assumption of small displacements is no
longer valid [17].
Figure 1. Performance envelope for unmanned systems [3]
Research Focus and Objectives
Before these objectives of greatly increased range and endurance can be fulfilled,
many questions about such aircraft must be answered. A deeper understanding of the
nonlinear aerodynamics and aeroelastic effects which such aircraft encounter, as well as
what causes them, will have to be attained before these vehicles can be reliably designed.
Among the tools used for such design work, finite element (FE) modeling and analysis
will play a part in accurately and efficiently bringing HALE aircraft about. FE modeling
is useful in almost any design development for various reasons, not the least of which is
5
the ability to minimize destructive testing on physical system components. In this
particular case an FE model is desired to compare to laboratory bending test results from
portions of an experimental HALE aircraft called X-HALE. FE analysis results in this
thesis will be compared to results of static testing conducted on wing sections of the X-
HALE aircraft. The ultimate goal of this effort will be to create and validate an FE model
of the X-HALE vehicle. Improved modeling processes will help characterize X-HALE
to provide data for future designs of HALE aircraft.
The FE modeling work done here was intended to mirror static laboratory testing
that had been conducted on portions of the X-HALE wing. The Finite Element Modeling
and post-processing Application (FEMAP) by Siemens PLM Software was utilized for all
FE modeling produced for this research. Initial model results were compared against
results from a three-point bending laboratory test on a two-wing section of X-HALE at
the University of Michigan in the early design phase of this program. Although small in
scope, the modeling of this test provided many lessons learned and much needed
experience of both the general FE process as well as FEMAP specifics. The core of this
research effort consisted of more rigorous modeling work which attempted to reproduce
recent laboratory bending tests conducted on multiple portions of the X-HALE vehicle.
6
II. Background
HALE Aircraft
With the realization that satellites are not the always the best option for missions
requiring a perspective high above Earth, the development of HALE aircraft has gathered
much interest. Early in the 1980s it was understood that solar power would be the power
source for a high altitude aircraft that was to remain airborne for days at a time, and it
was during this time that AeroVironment designed and built their HALSOL (High-
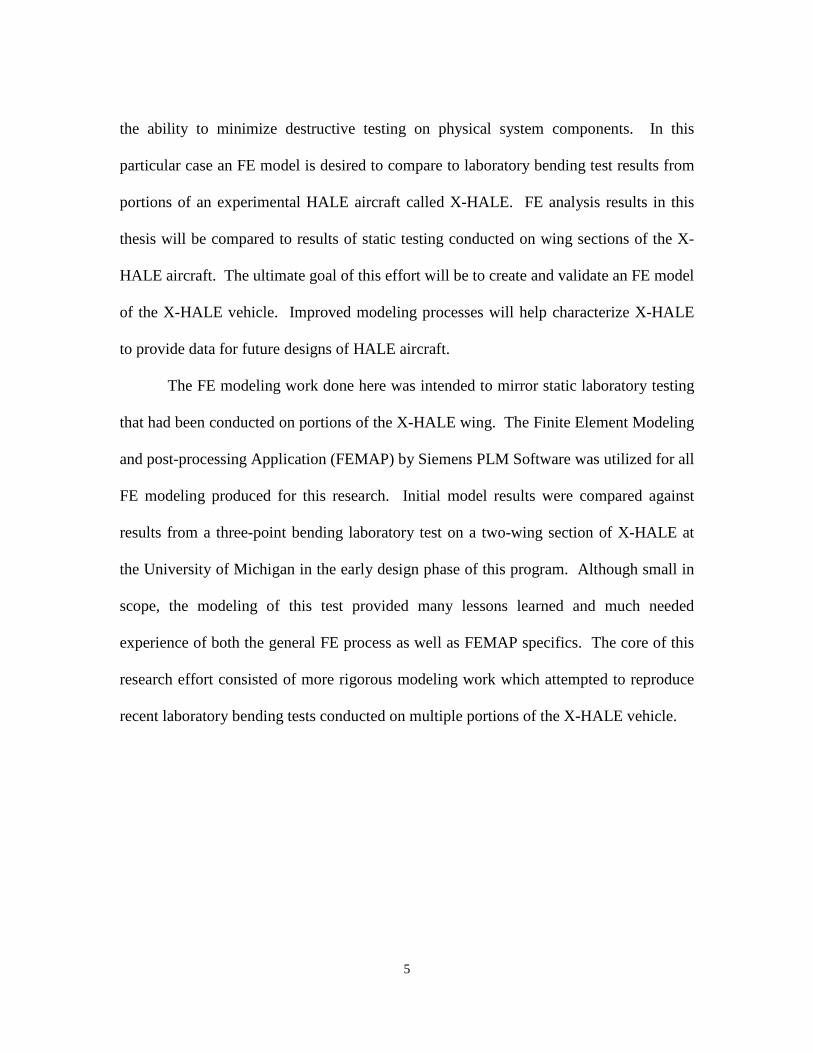
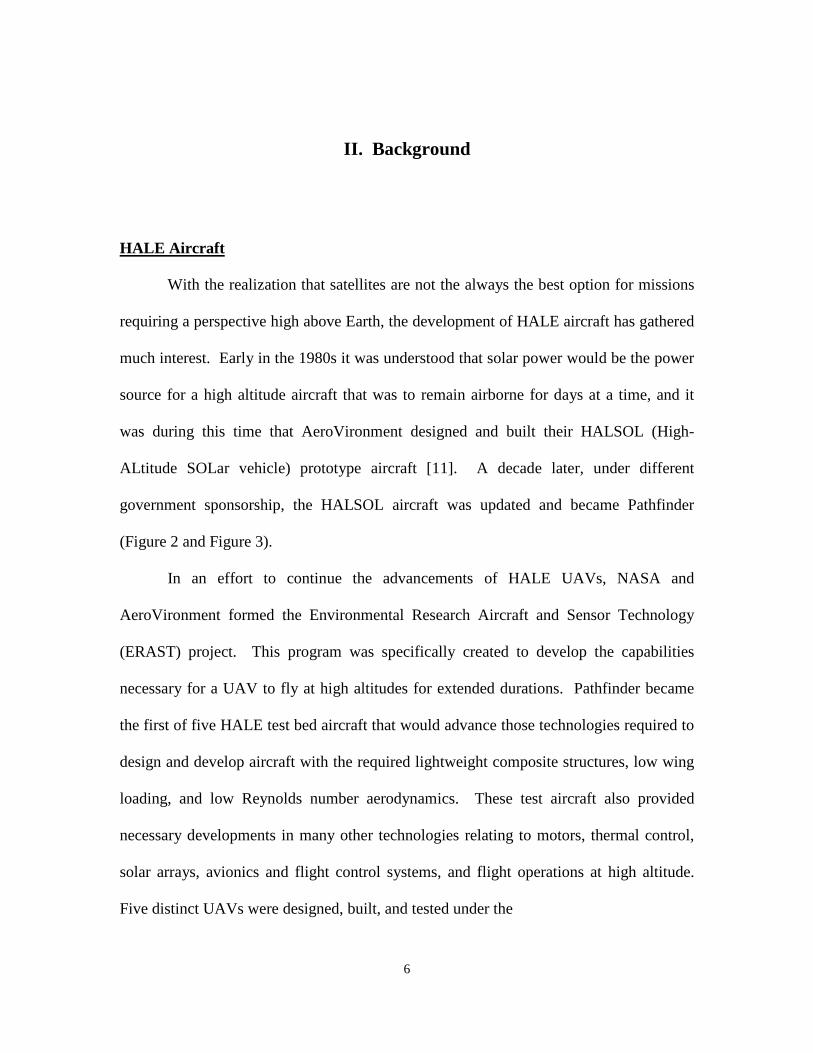
ALtitude SOLar vehicle) prototype aircraft [11]. A decade later, under different
government sponsorship, the HALSOL aircraft was updated and became Pathfinder
(Figure 2 and Figure 3).
In an effort to continue the advancements of HALE UAVs, NASA and
AeroVironment formed the Environmental Research Aircraft and Sensor Technology
(ERAST) project. This program was specifically created to develop the capabilities
necessary for a UAV to fly at high altitudes for extended durations. Pathfinder became
the first of five HALE test bed aircraft that would advance those technologies required to
design and develop aircraft with the required lightweight composite structures, low wing
loading, and low Reynolds number aerodynamics. These test aircraft also provided
necessary developments in many other technologies relating to motors, thermal control,
solar arrays, avionics and flight control systems, and flight operations at high altitude.
Five distinct UAVs were designed, built, and tested under the
7
Figure 2. Pathfinder aircraft at rest on Rogers Dry Lake Bed, c. 1992 [11]
Figure 3. Pathfinder aircraft in flight, c. 1992 [11]
8
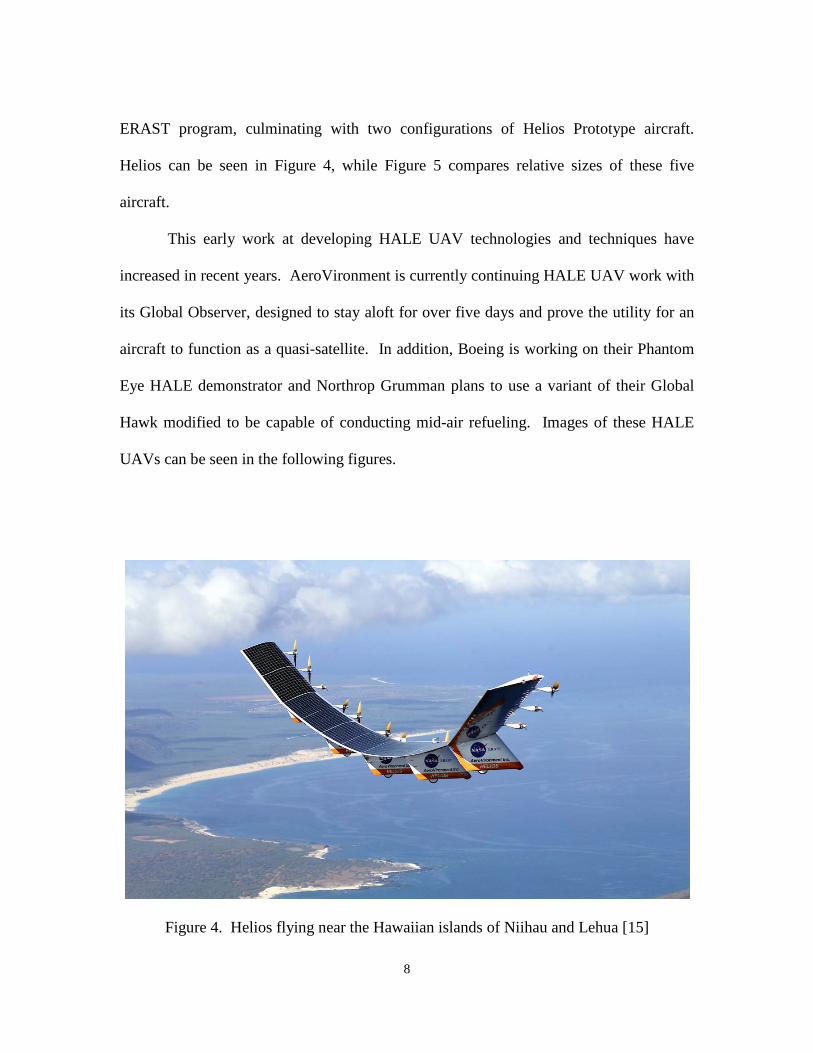
ERAST program, culminating with two configurations of Helios Prototype aircraft.
Helios can be seen in Figure 4, while Figure 5 compares relative sizes of these five
aircraft.
This early work at developing HALE UAV technologies and techniques have
increased in recent years. AeroVironment is currently continuing HALE UAV work with
its Global Observer, designed to stay aloft for over five days and prove the utility for an
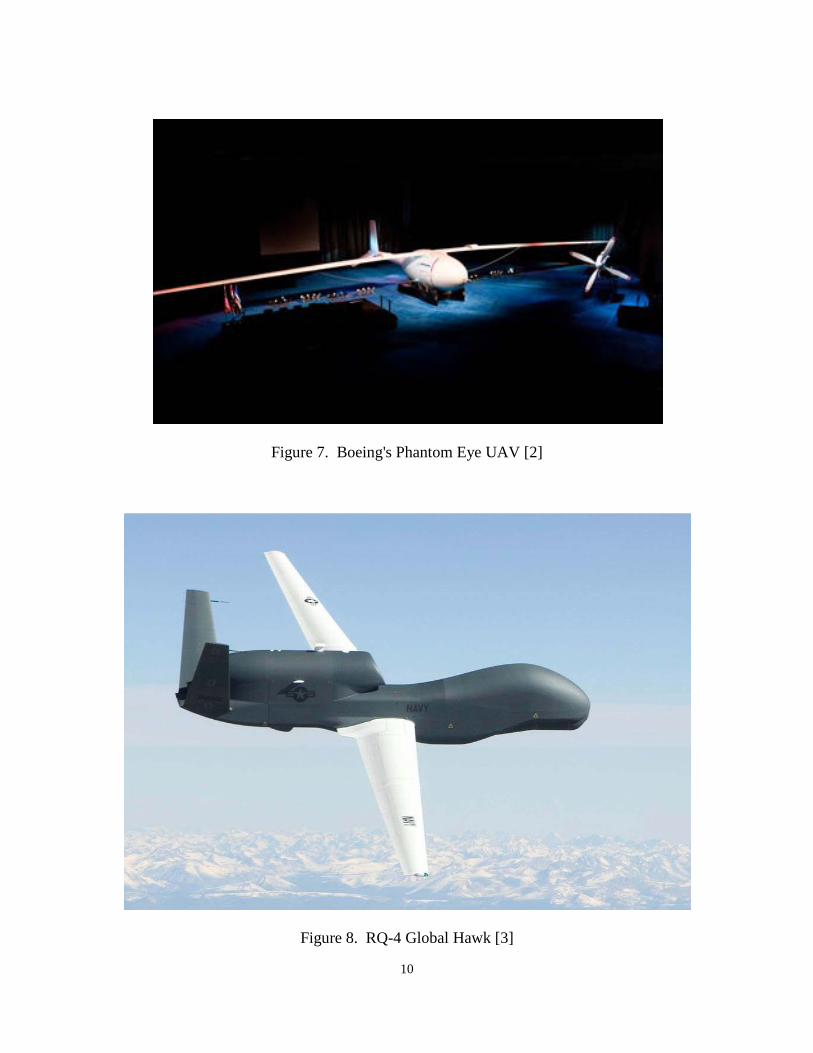
aircraft to function as a quasi-satellite. In addition, Boeing is working on their Phantom
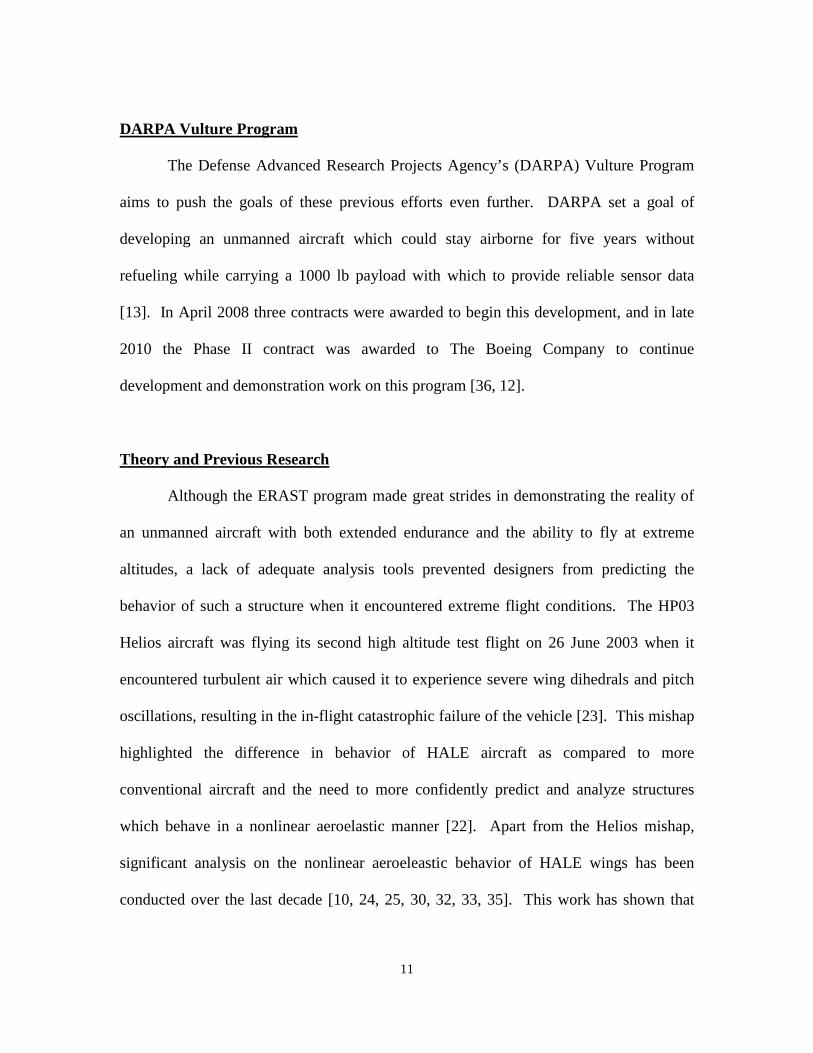
Eye HALE demonstrator and Northrop Grumman plans to use a variant of their Global
Hawk modified to be capable of conducting mid-air refueling. Images of these HALE
UAVs can be seen in the following figures.
Figure 4. Helios flying near the Hawaiian islands of Niihau and Lehua [15]
9
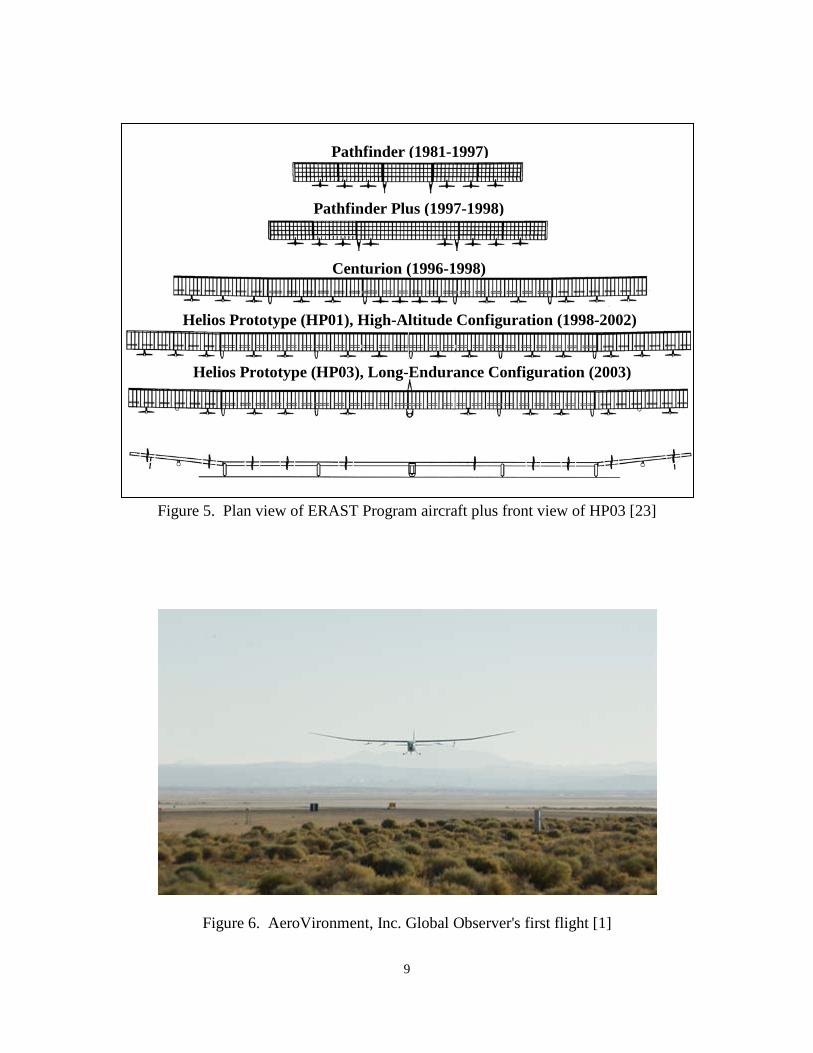
Figure 5. Plan view of ERAST Program aircraft plus front view of HP03 [23]
Figure 6. AeroVironment, Inc. Global Observer's first flight [1]
Pathfinder (1981-1997)
Pathfinder Plus (1997-1998)
Centurion (1996-1998)
Helios Prototype (HP01), High-Altitude Configuration (1998-2002)
Helios Prototype (HP03), Long-Endurance Configuration (2003)
10
Figure 7. Boeing's Phantom Eye UAV [2]
Figure 8. RQ-4 Global Hawk [3]
11
DARPA Vulture Program
The Defense Advanced Research Projects Agency’s (DARPA) Vulture Program
aims to push the goals of these previous efforts even further. DARPA set a goal of
developing an unmanned aircraft which could stay airborne for five years without
refueling while carrying a 1000 lb payload with which to provide reliable sensor data
[13]. In April 2008 three contracts were awarded to begin this development, and in late
2010 the Phase II contract was awarded to The Boeing Company to continue
development and demonstration work on this program [36, 12].
Theory and Previous Research
Although the ERAST program made great strides in demonstrating the reality of
an unmanned aircraft with both extended endurance and the ability to fly at extreme
altitudes, a lack of adequate analysis tools prevented designers from predicting the
behavior of such a structure when it encountered extreme flight conditions. The HP03
Helios aircraft was flying its second high altitude test flight on 26 June 2003 when it
encountered turbulent air which caused it to experience severe wing dihedrals and pitch
oscillations, resulting in the in-flight catastrophic failure of the vehicle [23]. This mishap
highlighted the difference in behavior of HALE aircraft as compared to more
conventional aircraft and the need to more confidently predict and analyze structures
which behave in a nonlinear aeroelastic manner [22]. Apart from the Helios mishap,
significant analysis on the nonlinear aeroeleastic behavior of HALE wings has been
conducted over the last decade [10, 24, 25, 30, 32, 33, 35]. This work has shown that
12
traditional design methods employing linear aerodynamic equations are not appropriate
for such aircraft designs.
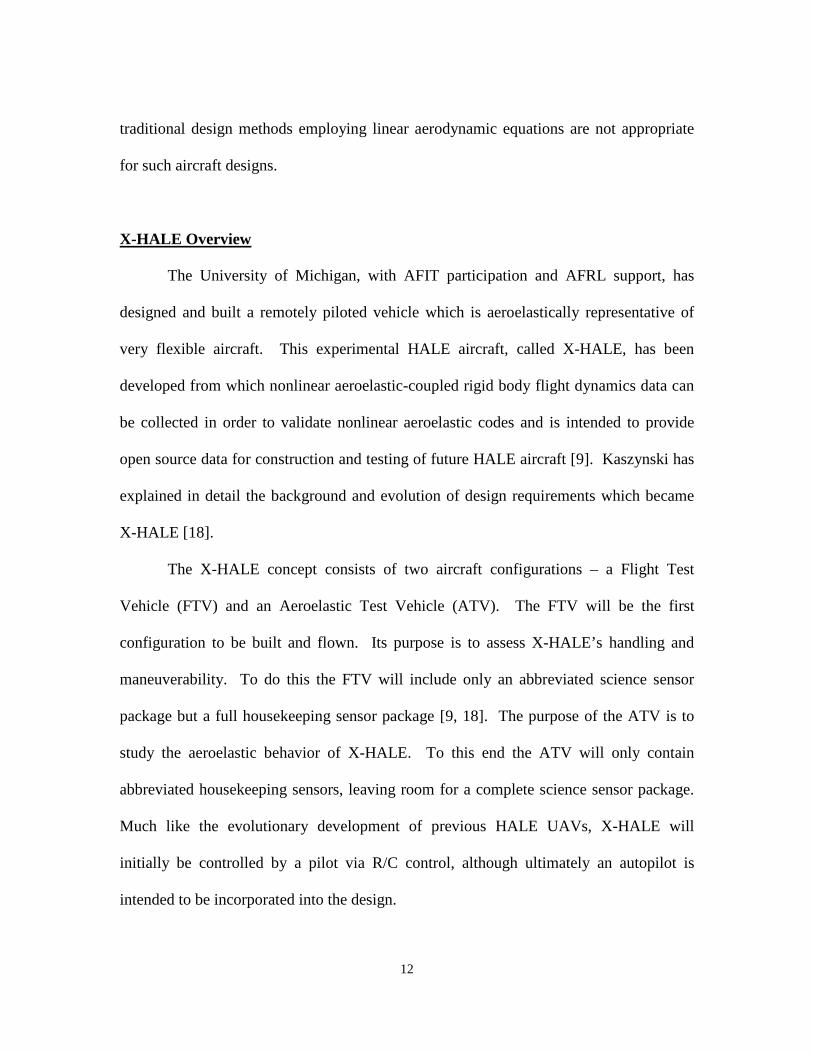
X-HALE Overview
The University of Michigan, with AFIT participation and AFRL support, has
designed and built a remotely piloted vehicle which is aeroelastically representative of
very flexible aircraft. This experimental HALE aircraft, called X-HALE, has been
developed from which nonlinear aeroelastic-coupled rigid body flight dynamics data can
be collected in order to validate nonlinear aeroelastic codes and is intended to provide
open source data for construction and testing of future HALE aircraft [9]. Kaszynski has
explained in detail the background and evolution of design requirements which became
X-HALE [18].
The X-HALE concept consists of two aircraft configurations – a Flight Test
Vehicle (FTV) and an Aeroelastic Test Vehicle (ATV). The FTV will be the first
configuration to be built and flown. Its purpose is to assess X-HALE’s handling and
maneuverability. To do this the FTV will include only an abbreviated science sensor
package but a full housekeeping sensor package [9, 18]. The purpose of the ATV is to
study the aeroelastic behavior of X-HALE. To this end the ATV will only contain
abbreviated housekeeping sensors, leaving room for a complete science sensor package.
Much like the evolutionary development of previous HALE UAVs, X-HALE will
initially be controlled by a pilot via R/C control, although ultimately an autopilot is
intended to be incorporated into the design.
13
In keeping with HALE aircraft designs discussed previously, X-HALE is a high
aspect ratio aircraft with multiple boom-tails connected to the flexible wing structure.
The main component of the aircraft is the EMX07 reflexed airfoil, which forms each 1-m
long section of wing along the span and has a 0.2-m chord. Initial design specifications
called for six wings, five motor pods, and four boom-tails. All five pods were covered in
fairings, made into the shape of NACA 0010-66 airfoils [28], to contain a propeller
motor, battery, and processor boards. Pitch and roll are to be controlled by the four
outboard horizontal tails (attached to the ends of the 0.83-m long booms) and yaw
controlled using differential thrust from the outboard motors. The outer dihedral wings
were designed with ailerons to supplement the planned in-flight disturbances [9].
Adjustments and improvements to this design were made, including two additional wings
and one more boom-tail at the center pod. The current aircraft consists of eight identical
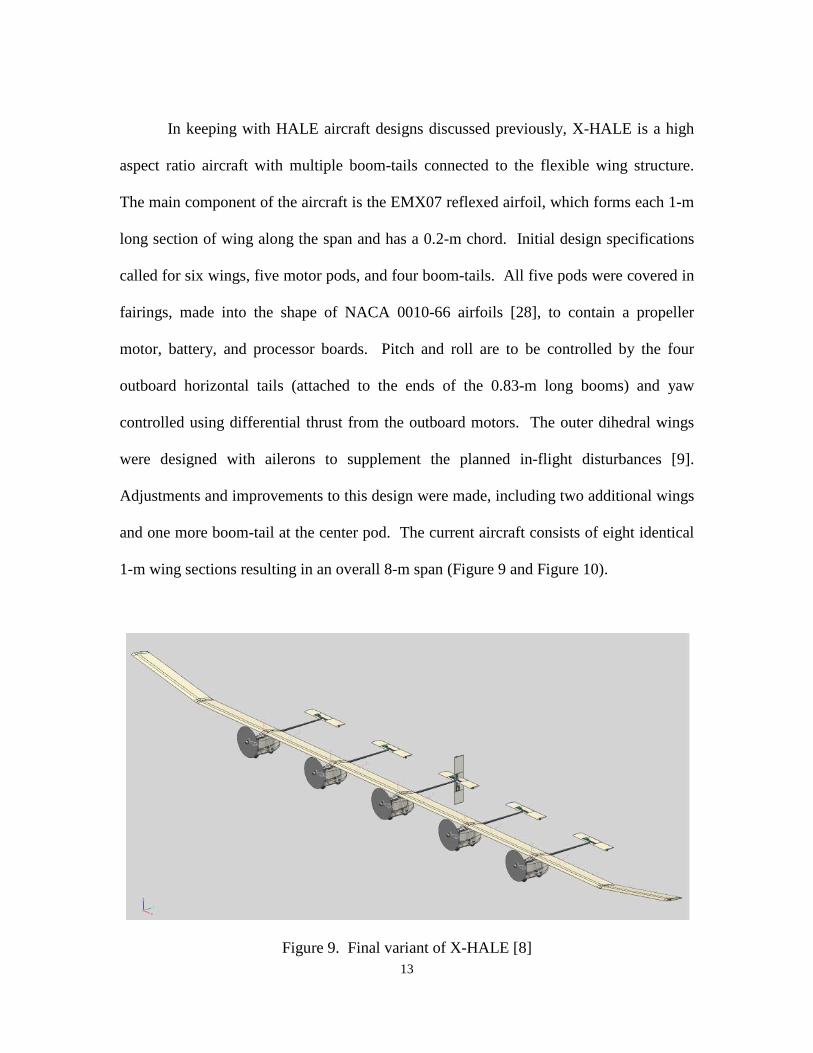
1-m wing sections resulting in an overall 8-m span (Figure 9 and Figure 10).
Figure 9. Final variant of X-HALE [8]
14
Figure 10. Plan- and front-views of X-HALE [9]
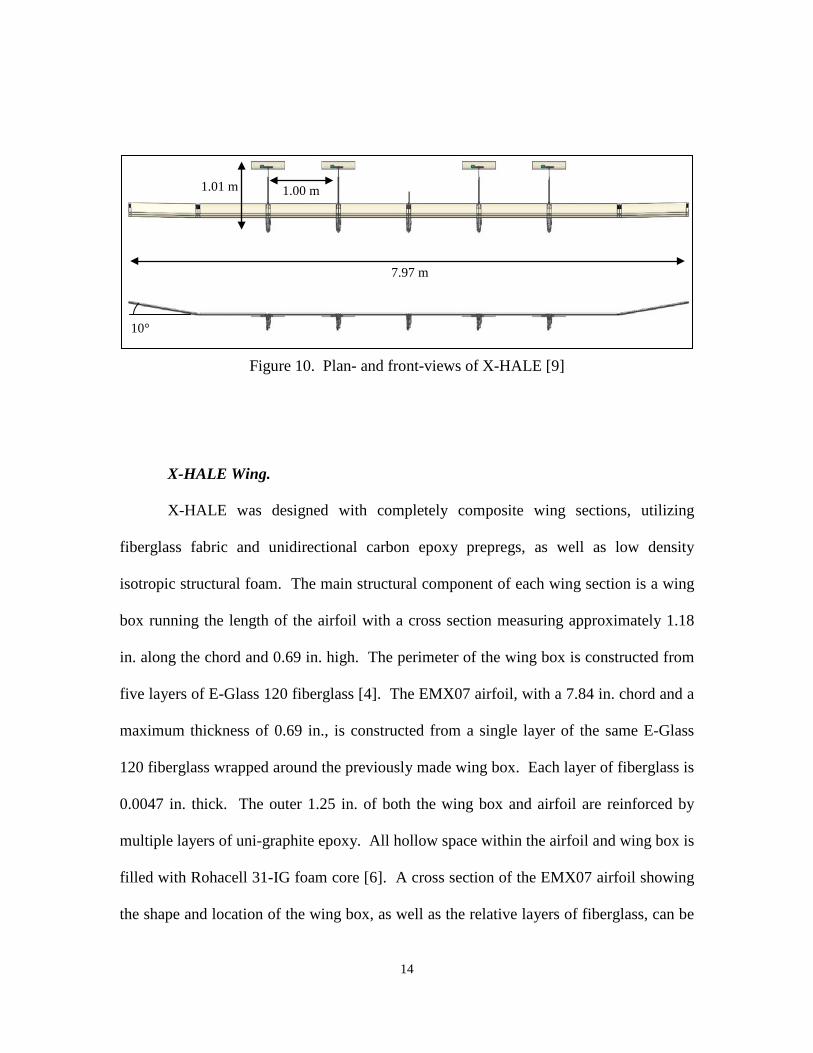
X-HALE Wing.
X-HALE was designed with completely composite wing sections, utilizing
fiberglass fabric and unidirectional carbon epoxy prepregs, as well as low density
isotropic structural foam. The main structural component of each wing section is a wing
box running the length of the airfoil with a cross section measuring approximately 1.18
in. along the chord and 0.69 in. high. The perimeter of the wing box is constructed from
five layers of E-Glass 120 fiberglass [4]. The EMX07 airfoil, with a 7.84 in. chord and a
maximum thickness of 0.69 in., is constructed from a single layer of the same E-Glass
120 fiberglass wrapped around the previously made wing box. Each layer of fiberglass is
0.0047 in. thick. The outer 1.25 in. of both the wing box and airfoil are reinforced by
multiple layers of uni-graphite epoxy. All hollow space within the airfoil and wing box is
filled with Rohacell 31-IG foam core [6]. A cross section of the EMX07 airfoil showing
the shape and location of the wing box, as well as the relative layers of fiberglass, can be
7.97 m
1.00 m 1.01 m
10°
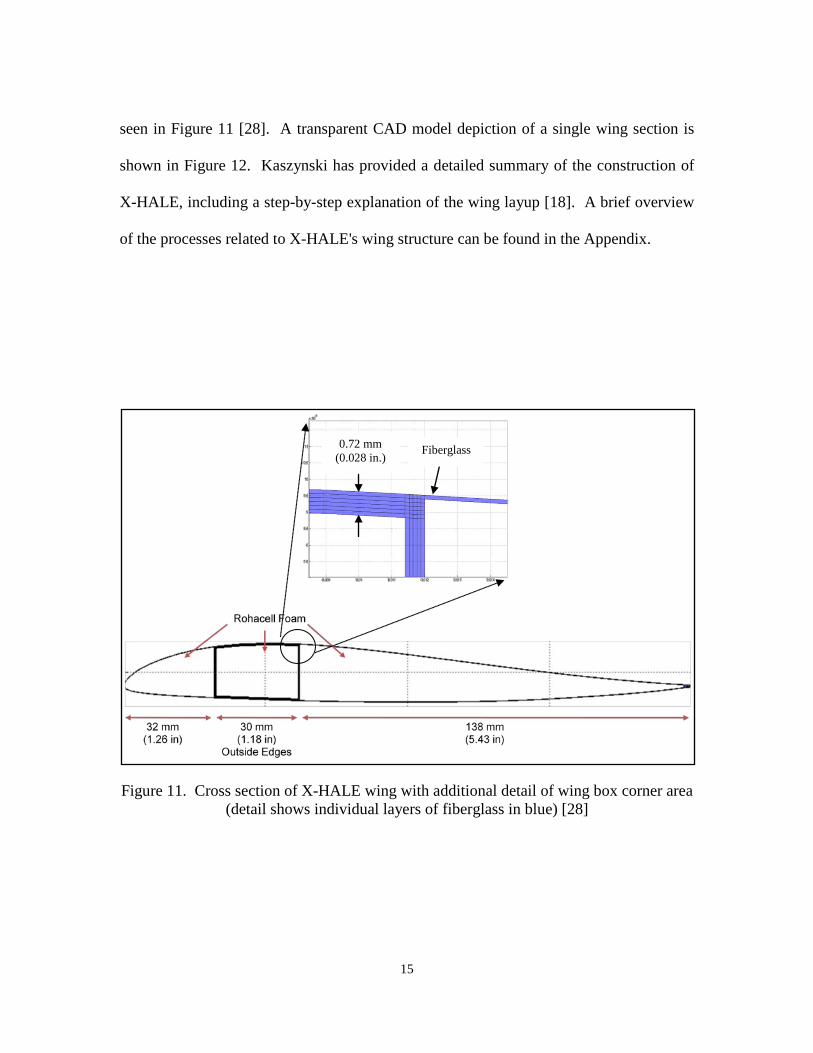
15
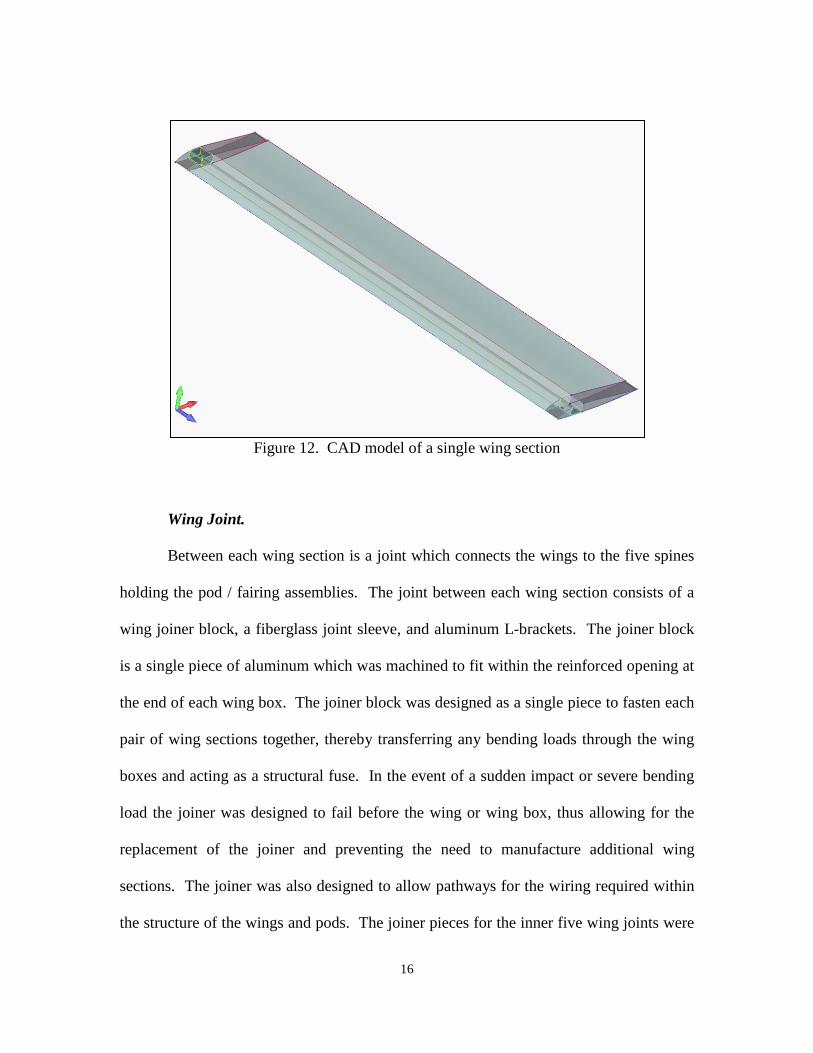
seen in Figure 11 [28]. A transparent CAD model depiction of a single wing section is
shown in Figure 12. Kaszynski has provided a detailed summary of the construction of
X-HALE, including a step-by-step explanation of the wing layup [18]. A brief overview
of the processes related to X-HALE's wing structure can be found in the Appendix.
Figure 11. Cross section of X-HALE wing with additional detail of wing box corner area (detail shows individual layers of fiberglass in blue) [28]
0.72 mm (0.028 in.) Fiberglass
16
Figure 12. CAD model of a single wing section
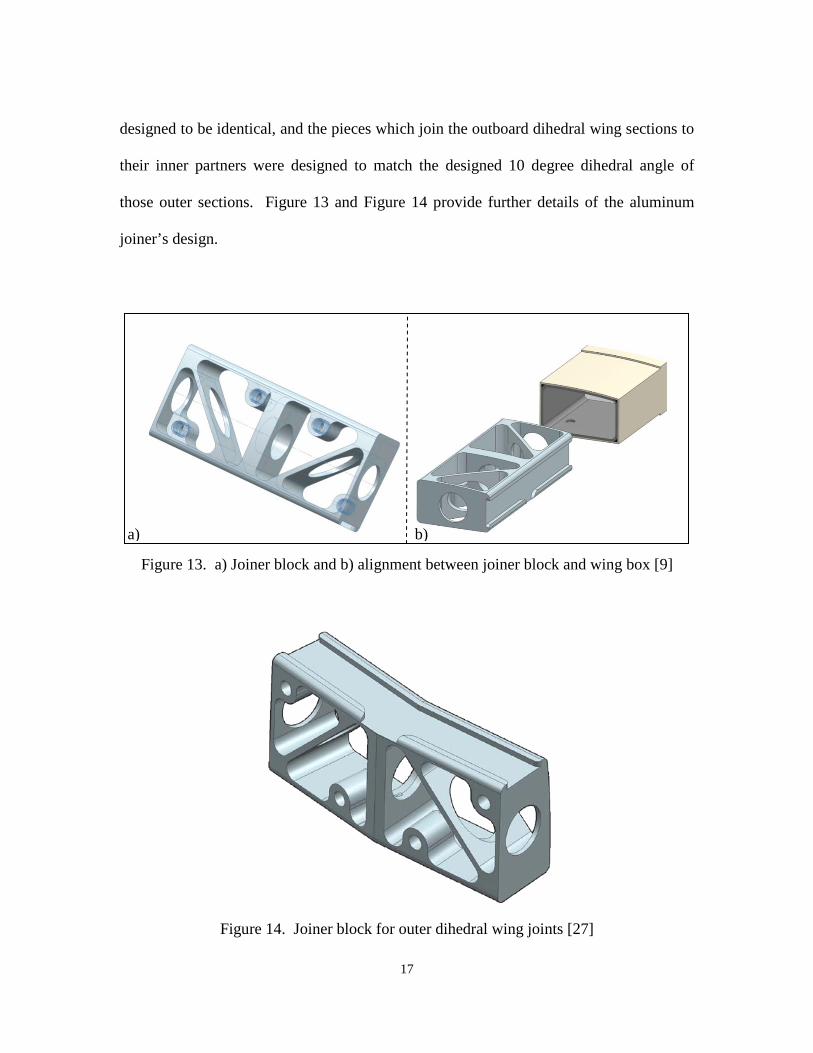
Wing Joint.
Between each wing section is a joint which connects the wings to the five spines
holding the pod / fairing assemblies. The joint between each wing section consists of a
wing joiner block, a fiberglass joint sleeve, and aluminum L-brackets. The joiner block
is a single piece of aluminum which was machined to fit within the reinforced opening at
the end of each wing box. The joiner block was designed as a single piece to fasten each
pair of wing sections together, thereby transferring any bending loads through the wing
boxes and acting as a structural fuse. In the event of a sudden impact or severe bending
load the joiner was designed to fail before the wing or wing box, thus allowing for the
replacement of the joiner and preventing the need to manufacture additional wing
sections. The joiner was also designed to allow pathways for the wiring required within
the structure of the wings and pods. The joiner pieces for the inner five wing joints were
17
designed to be identical, and the pieces which join the outboard dihedral wing sections to
their inner partners were designed to match the designed 10 degree dihedral angle of
those outer sections. Figure 13 and Figure 14 provide further details of the aluminum
joiner’s design.
Figure 13. a) Joiner block and b) alignment between joiner block and wing box [9]
Figure 14. Joiner block for outer dihedral wing joints [27]
a) b)
18
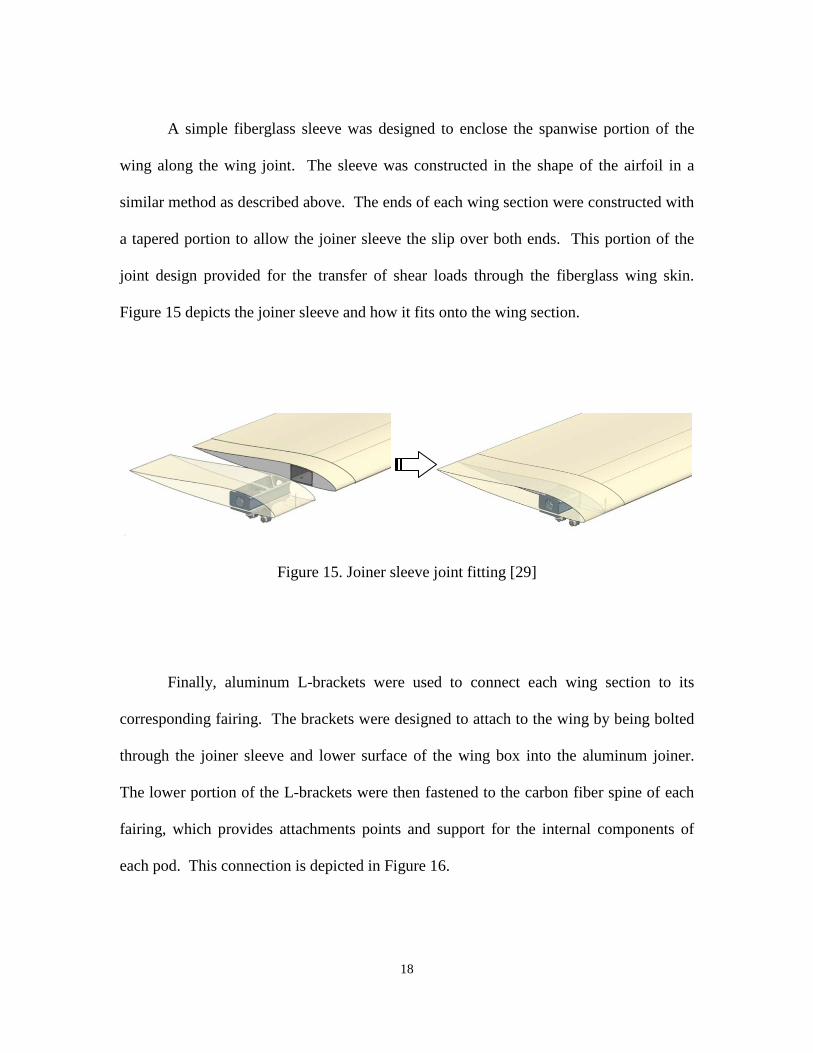
A simple fiberglass sleeve was designed to enclose the spanwise portion of the
wing along the wing joint. The sleeve was constructed in the shape of the airfoil in a
similar method as described above. The ends of each wing section were constructed with
a tapered portion to allow the joiner sleeve the slip over both ends. This portion of the
joint design provided for the transfer of shear loads through the fiberglass wing skin.
Figure 15 depicts the joiner sleeve and how it fits onto the wing section.
Figure 15. Joiner sleeve joint fitting [29]
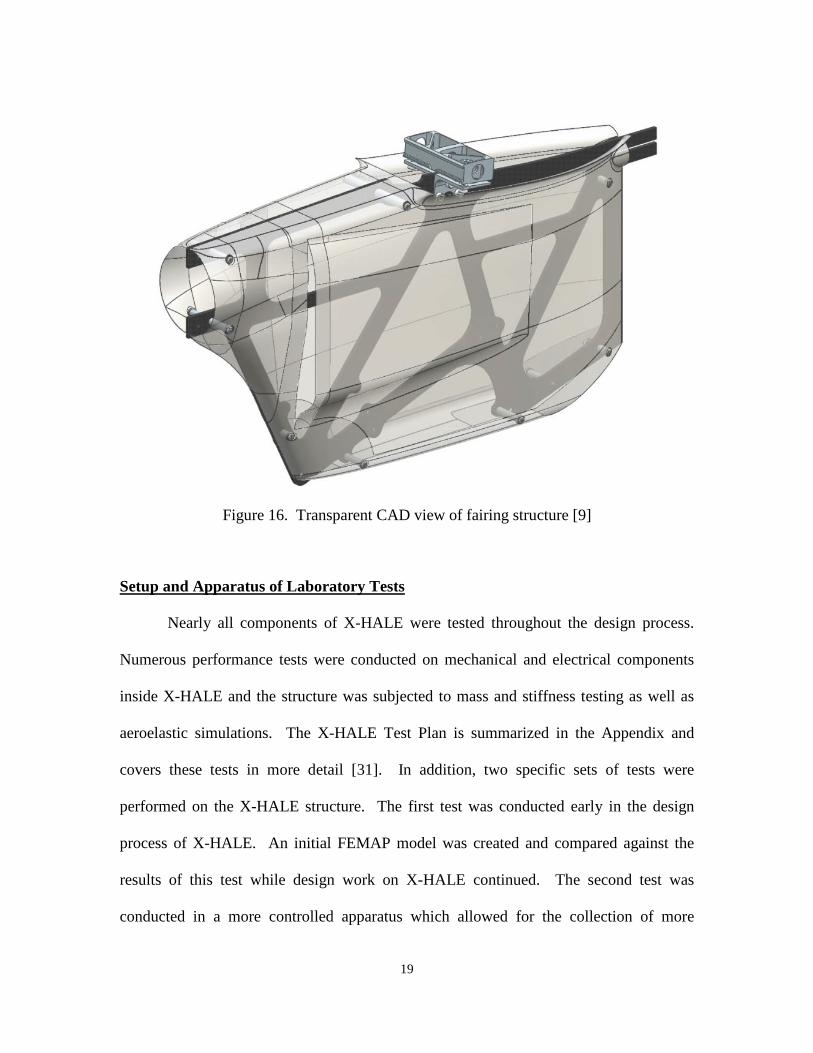
Finally, aluminum L-brackets were used to connect each wing section to its
corresponding fairing. The brackets were designed to attach to the wing by being bolted
through the joiner sleeve and lower surface of the wing box into the aluminum joiner.
The lower portion of the L-brackets were then fastened to the carbon fiber spine of each
fairing, which provides attachments points and support for the internal components of
each pod. This connection is depicted in Figure 16.
19
Figure 16. Transparent CAD view of fairing structure [9]
Setup and Apparatus of Laboratory Tests
Nearly all components of X-HALE were tested throughout the design process.
Numerous performance tests were conducted on mechanical and electrical components
inside X-HALE and the structure was subjected to mass and stiffness testing as well as
aeroelastic simulations. The X-HALE Test Plan is summarized in the Appendix and
covers these tests in more detail [31]. In addition, two specific sets of tests were
performed on the X-HALE structure. The first test was conducted early in the design
process of X-HALE. An initial FEMAP model was created and compared against the
results of this test while design work on X-HALE continued. The second test was
conducted in a more controlled apparatus which allowed for the collection of more
20
refined data and would be better suited to validate the FE model developed for that test.
However, the FE model created to represent the early bending test will also be discussed
here to illustrate lessons learned and steps taken in the development of more refined
models.
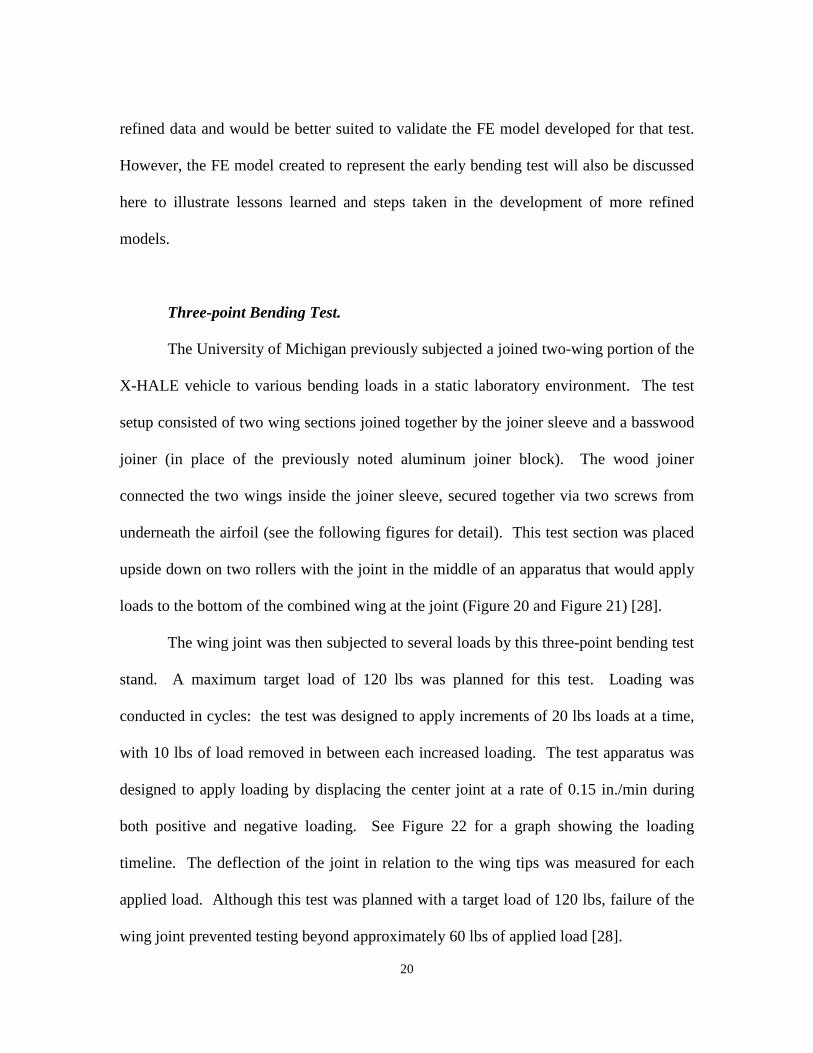
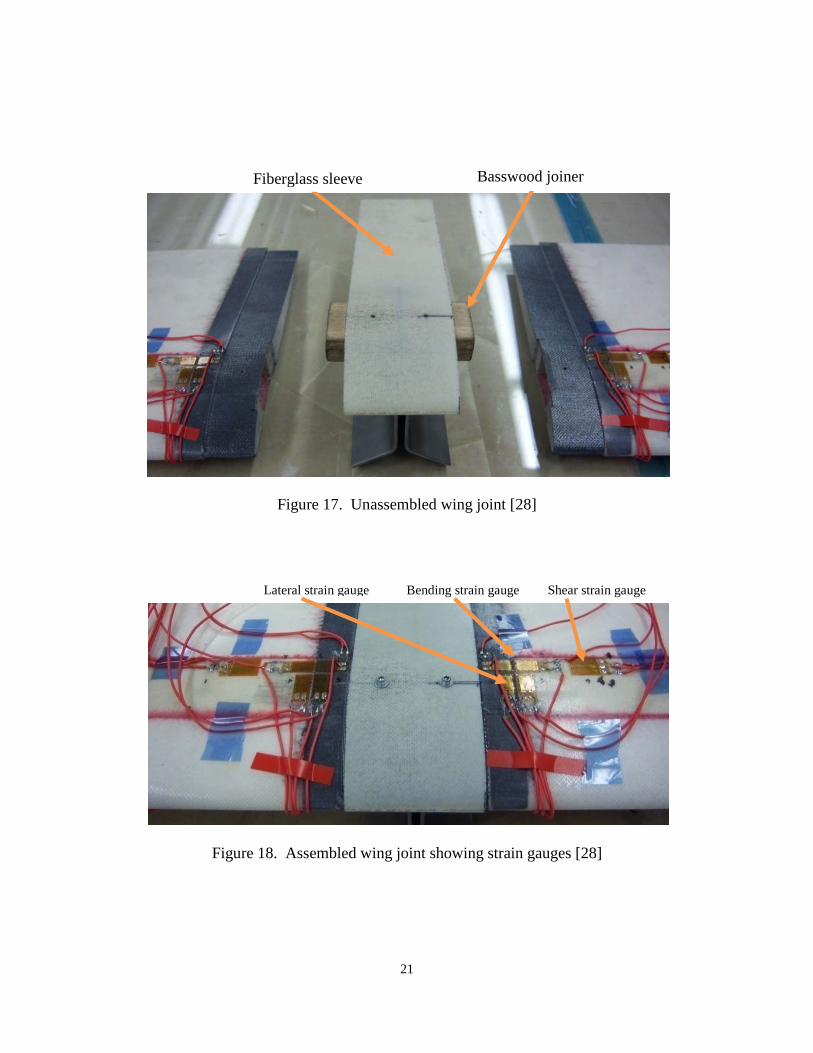
Three-point Bending Test.
The University of Michigan previously subjected a joined two-wing portion of the
X-HALE vehicle to various bending loads in a static laboratory environment. The test
setup consisted of two wing sections joined together by the joiner sleeve and a basswood
joiner (in place of the previously noted aluminum joiner block). The wood joiner
connected the two wings inside the joiner sleeve, secured together via two screws from
underneath the airfoil (see the following figures for detail). This test section was placed
upside down on two rollers with the joint in the middle of an apparatus that would apply
loads to the bottom of the combined wing at the joint (Figure 20 and Figure 21) [28].
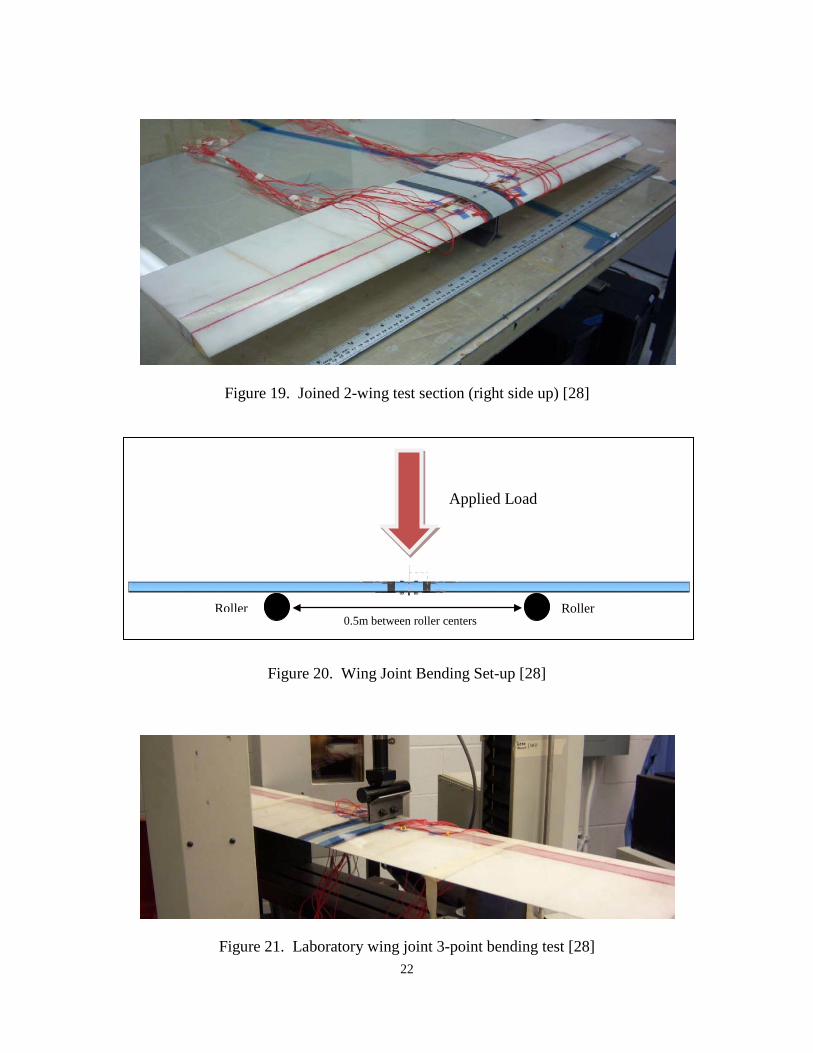
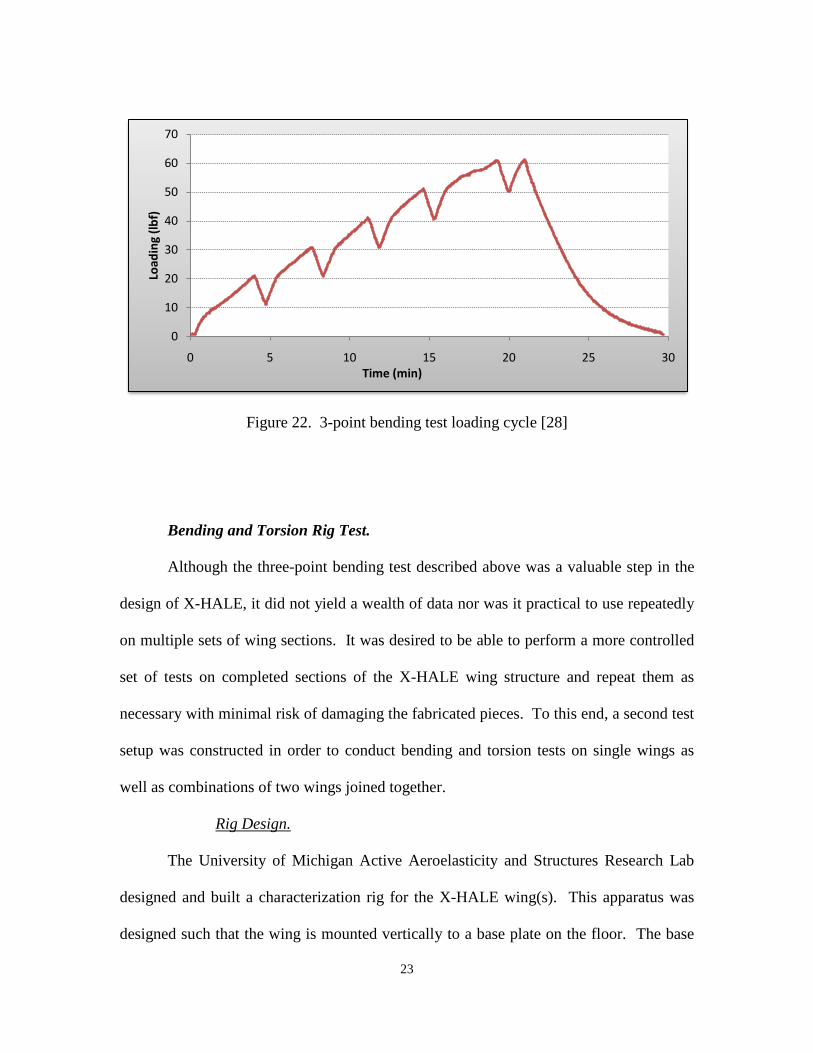
The wing joint was then subjected to several loads by this three-point bending test
stand. A maximum target load of 120 lbs was planned for this test. Loading was
conducted in cycles: the test was designed to apply increments of 20 lbs loads at a time,
with 10 lbs of load removed in between each increased loading. The test apparatus was
designed to apply loading by displacing the center joint at a rate of 0.15 in./min during
both positive and negative loading. See Figure 22 for a graph showing the loading
timeline. The deflection of the joint in relation to the wing tips was measured for each
applied load. Although this test was planned with a target load of 120 lbs, failure of the
wing joint prevented testing beyond approximately 60 lbs of applied load [28].
21
Figure 17. Unassembled wing joint [28]
Figure 18. Assembled wing joint showing strain gauges [28]
Bending strain gauge Lateral strain gauge Shear strain gauge
Fiberglass sleeve Basswood joiner
22
Figure 19. Joined 2-wing test section (right side up) [28]
Figure 20. Wing Joint Bending Set-up [28]
Figure 21. Laboratory wing joint 3-point bending test [28]
Roller
Applied Load
0.5m between roller centers Roller
23
Figure 22. 3-point bending test loading cycle [28]
Bending and Torsion Rig Test.
Although the three-point bending test described above was a valuable step in the
design of X-HALE, it did not yield a wealth of data nor was it practical to use repeatedly
on multiple sets of wing sections. It was desired to be able to perform a more controlled
set of tests on completed sections of the X-HALE wing structure and repeat them as
necessary with minimal risk of damaging the fabricated pieces. To this end, a second test
setup was constructed in order to conduct bending and torsion tests on single wings as
well as combinations of two wings joined together.
Rig Design.
The University of Michigan Active Aeroelasticity and Structures Research Lab
designed and built a characterization rig for the X-HALE wing(s). This apparatus was
designed such that the wing is mounted vertically to a base plate on the floor. The base
0
10
20
30
40
50
60
70
0 5 10 15 20 25 30
Load
ing
(lbf)
Time (min)
24
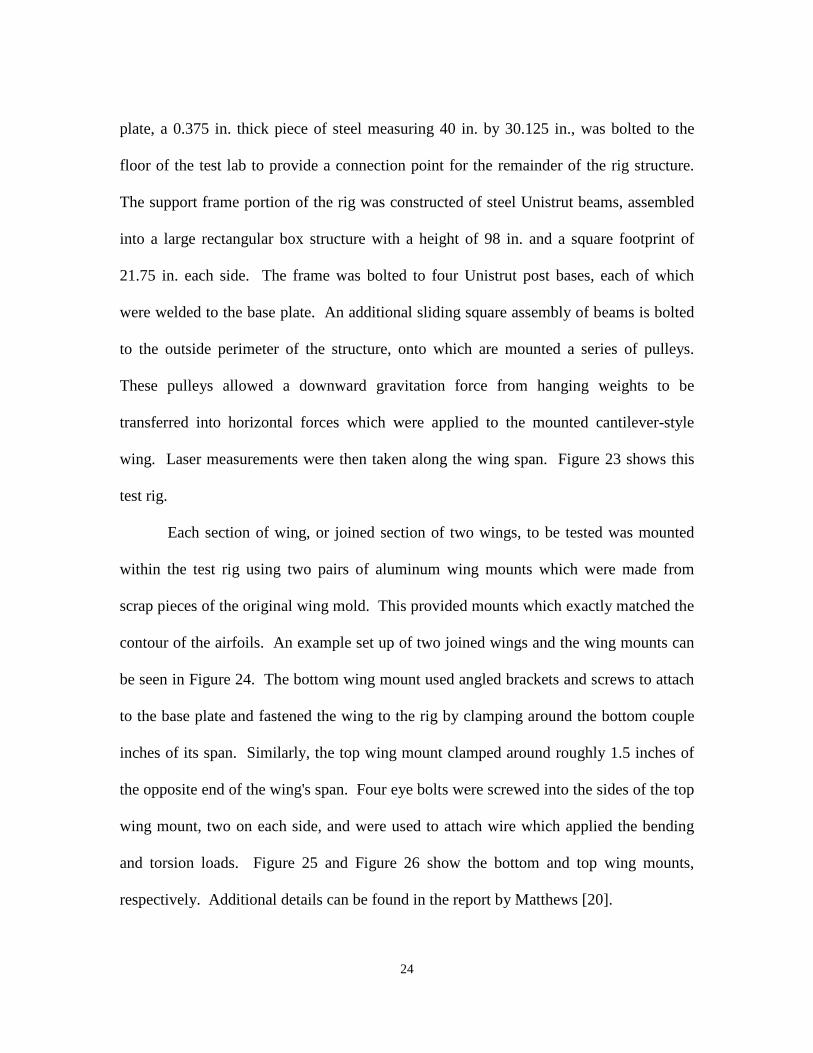
plate, a 0.375 in. thick piece of steel measuring 40 in. by 30.125 in., was bolted to the
floor of the test lab to provide a connection point for the remainder of the rig structure.
The support frame portion of the rig was constructed of steel Unistrut beams, assembled
into a large rectangular box structure with a height of 98 in. and a square footprint of
21.75 in. each side. The frame was bolted to four Unistrut post bases, each of which
were welded to the base plate. An additional sliding square assembly of beams is bolted
to the outside perimeter of the structure, onto which are mounted a series of pulleys.
These pulleys allowed a downward gravitation force from hanging weights to be
transferred into horizontal forces which were applied to the mounted cantilever-style
wing. Laser measurements were then taken along the wing span. Figure 23 shows this
test rig.
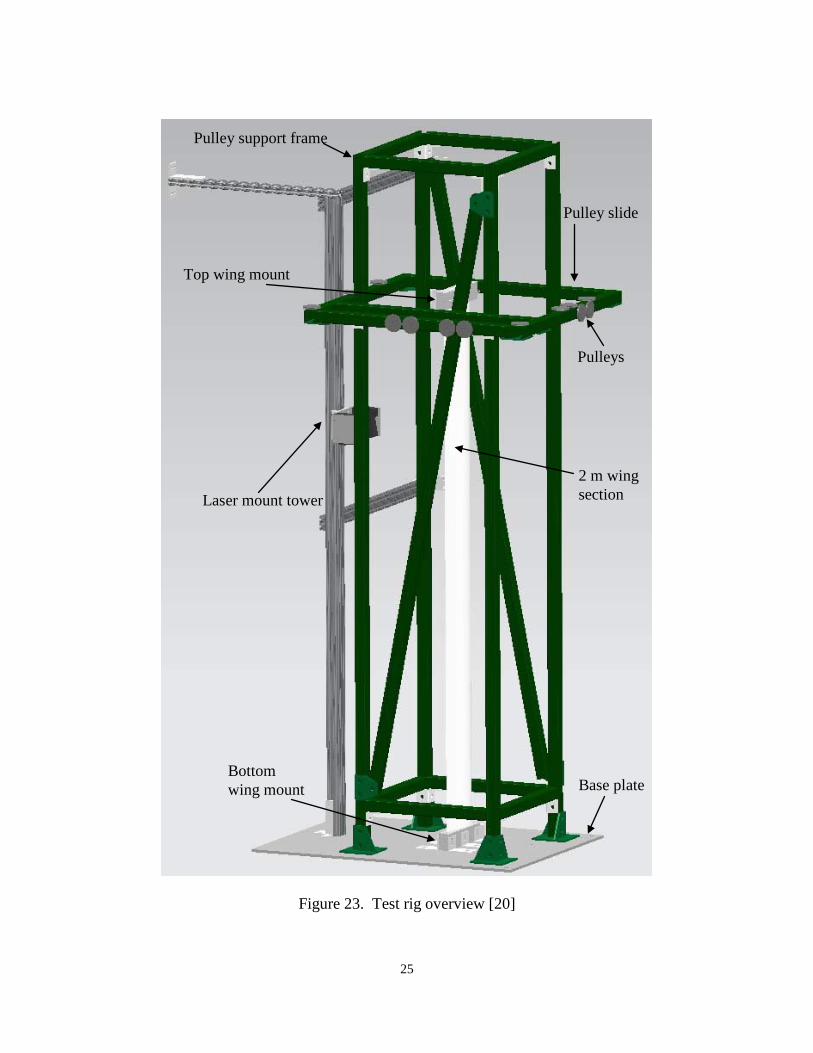
Each section of wing, or joined section of two wings, to be tested was mounted
within the test rig using two pairs of aluminum wing mounts which were made from
scrap pieces of the original wing mold. This provided mounts which exactly matched the
contour of the airfoils. An example set up of two joined wings and the wing mounts can
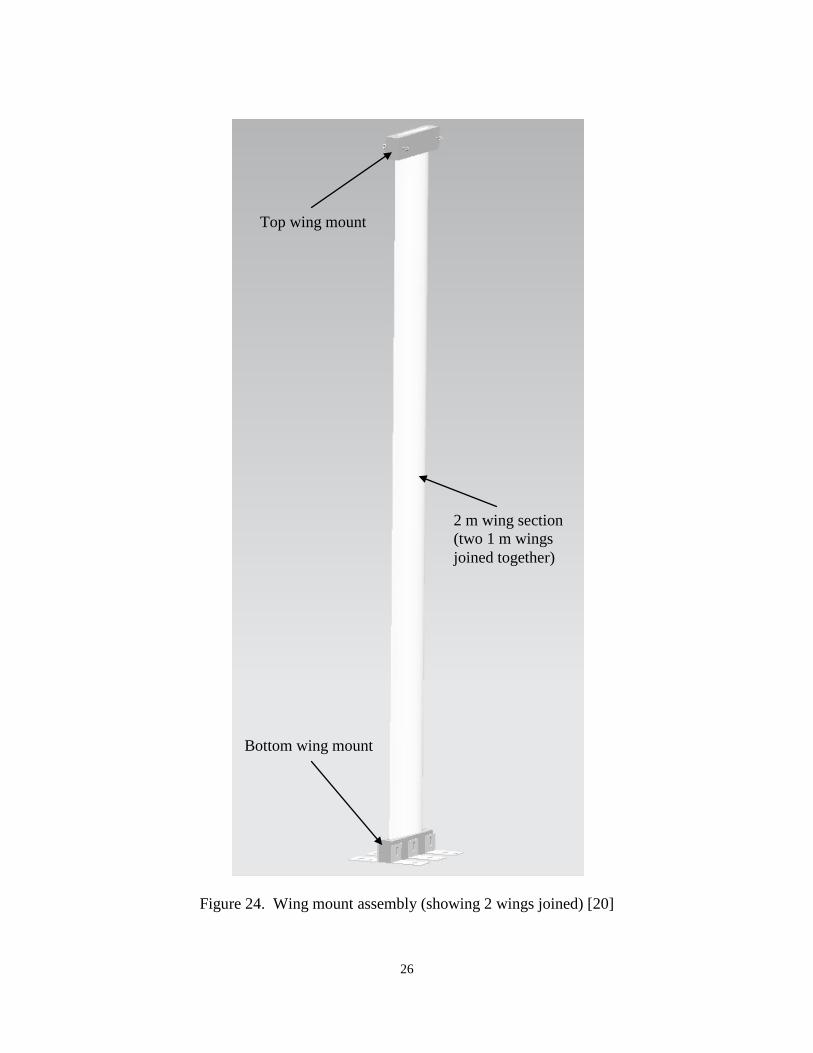
be seen in Figure 24. The bottom wing mount used angled brackets and screws to attach
to the base plate and fastened the wing to the rig by clamping around the bottom couple
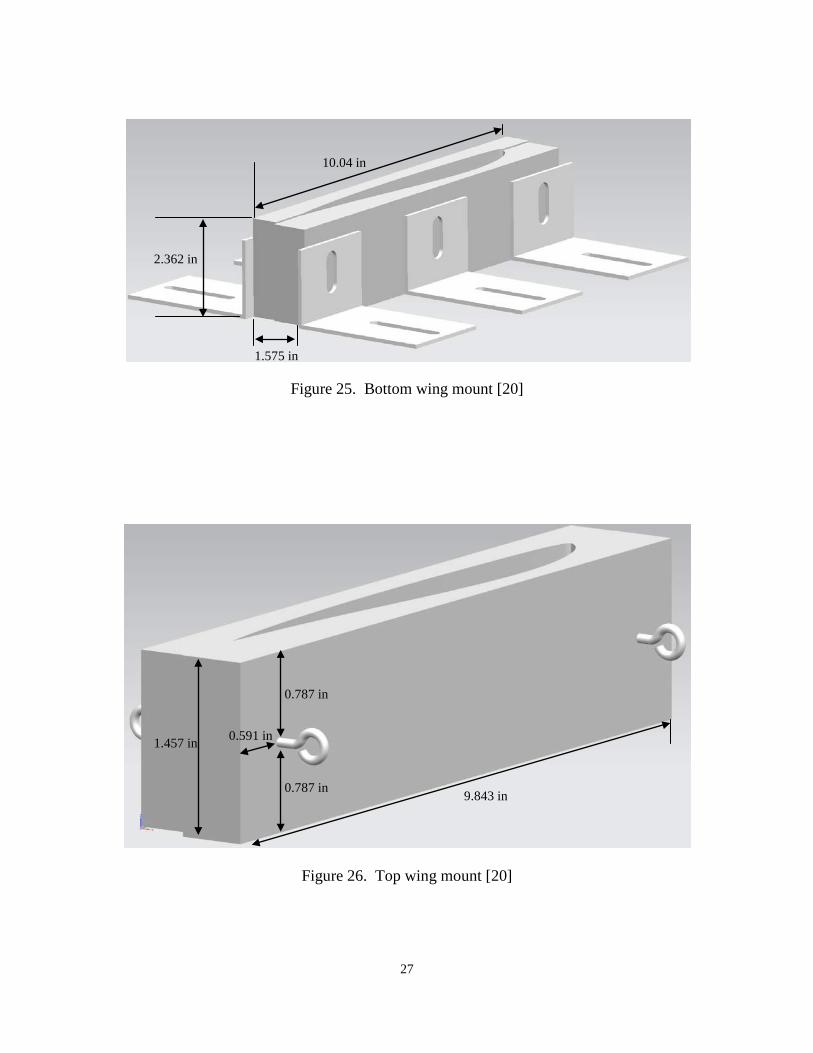
inches of its span. Similarly, the top wing mount clamped around roughly 1.5 inches of
the opposite end of the wing's span. Four eye bolts were screwed into the sides of the top
wing mount, two on each side, and were used to attach wire which applied the bending
and torsion loads. Figure 25 and Figure 26 show the bottom and top wing mounts,
respectively. Additional details can be found in the report by Matthews [20].
25
Figure 23. Test rig overview [20]
Laser mount tower
Base plate
Pulley support frame
2 m wing section
Pulleys
Top wing mount
Bottom wing mount
Pulley slide
26
Figure 24. Wing mount assembly (showing 2 wings joined) [20]
Top wing mount
Bottom wing mount
2 m wing section (two 1 m wings joined together)
27
Figure 25. Bottom wing mount [20]
Figure 26. Top wing mount [20]
10.04 in
2.362 in
1.575 in
9.843 in
1.457 in 0.591 in
0.787 in
0.787 in
28
Stiffness Tests.
Four wing sections from X-HALE were subjected to bending and torsion tests
utilizing the test rig. The wing sections were tested as single wing sections and as
combinations of two wing sections joined together as they would be assembled in the
complete aircraft. For the purposes of this research, only bending tests will be discussed.
And although the wing sections were subjected to bending in both directions, this
research only considered bending loads applied in the direction from the lower surface to
the upper surface, or camber, of the airfoil. All wing sections, both single and joined
sections, were subjected to applied loads of 3, 4, 5, 6, and 7 N. The bending stiffness, EI,
was also calculated for each test section once results were collected. The progress report
by Matthews describes in detail the test procedure and rig calibration, as well as
summarizes the test results [21].
X-HALE Ground and Flight Testing
The main test plan for X-HALE was developed into two phases, with each phase
employing two different aircraft – the FTV and the ATV, as previously mentioned.
These aircraft will be structurally and aerodynamically identical, but will have minor
internal differences. While the FTV will have a full housekeeping sensor package, it will
include only an abbreviated science sensor package. Since its purpose is to study the
aeroelastic behavior of X-HALE, the ATV will have additional electronic components
including more extensive scientific instrumentation and an autopilot. To save weight, as
well as time and funding required for construction, the FTV will not included these
additional components. The FTV will be utilized for all Phase 1 testing and the ATV will
29
be reserved for Phase 2 of testing. The current version of the test plan pays specific
attention only to Phase 1 [31]. Additional detail regarding ground and flight testing can
be found in the Appendix.
Building X-HALE in a modular fashion allowed for flexibility in assembly and
transportation. The aircraft can be transported as a whole or partial structure and
assembled or disassembled as required. Construction and assembly at the University of
Michigan was deemed the primary choice, as this will allow for maximum
troubleshooting of any assembly-related issues. As such, the aircraft will be
preassembled and transported from the University to the field test location as a full
vehicle. Because the test plan requires testing of the 6-meter version before continuing
with tests of the full 8-meter aircraft, X-HALE will be assembled into the 6-meter version
and transported in one piece. The additional sections to make the 8-m FTV will be
assembled in the field once the 6-m flight tests are completed. The X-HALE FTV, along
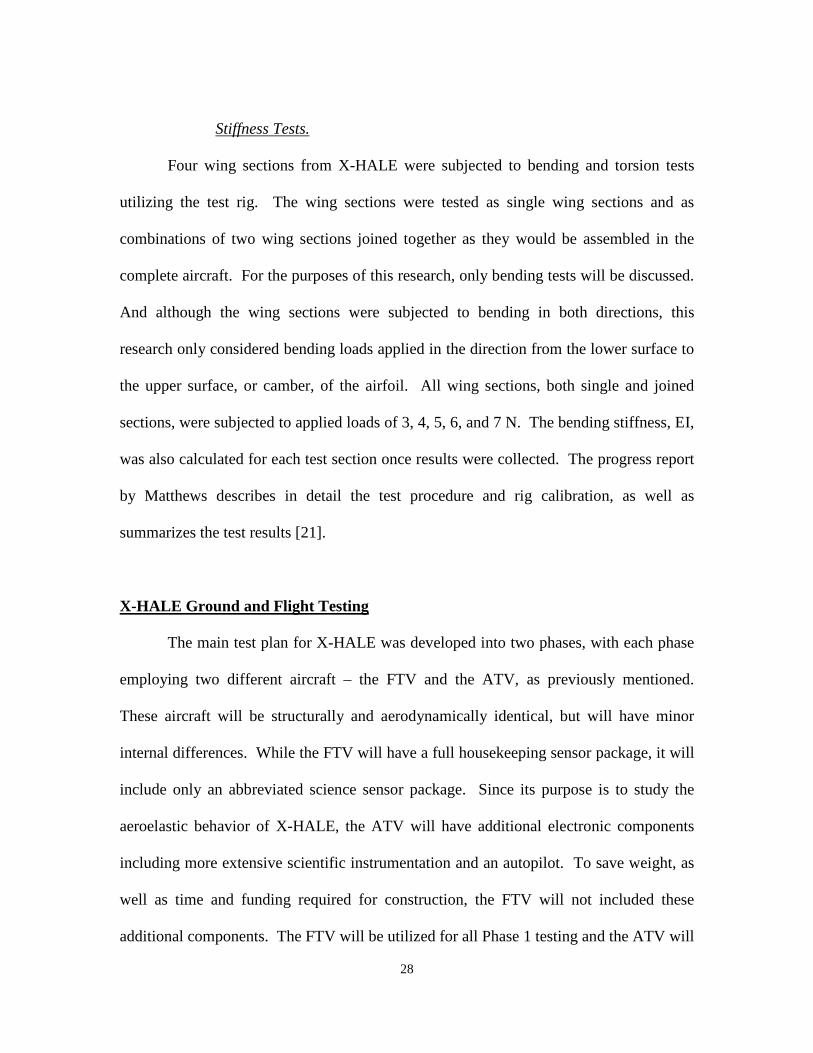
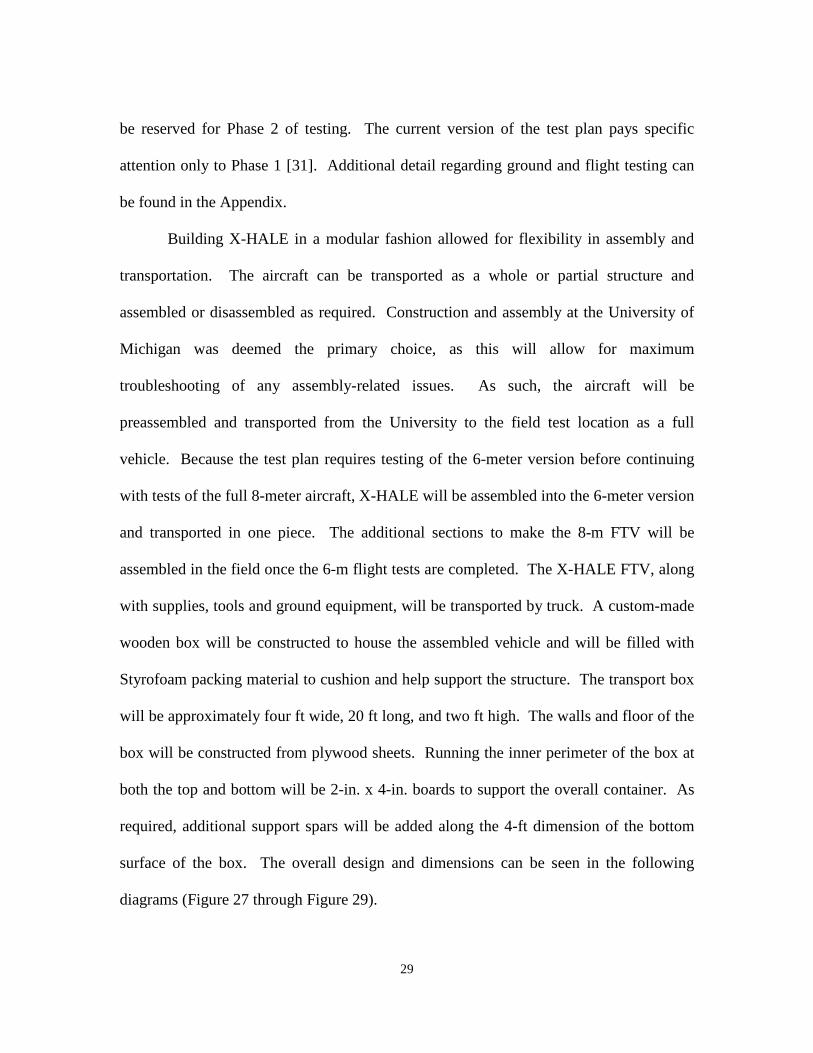
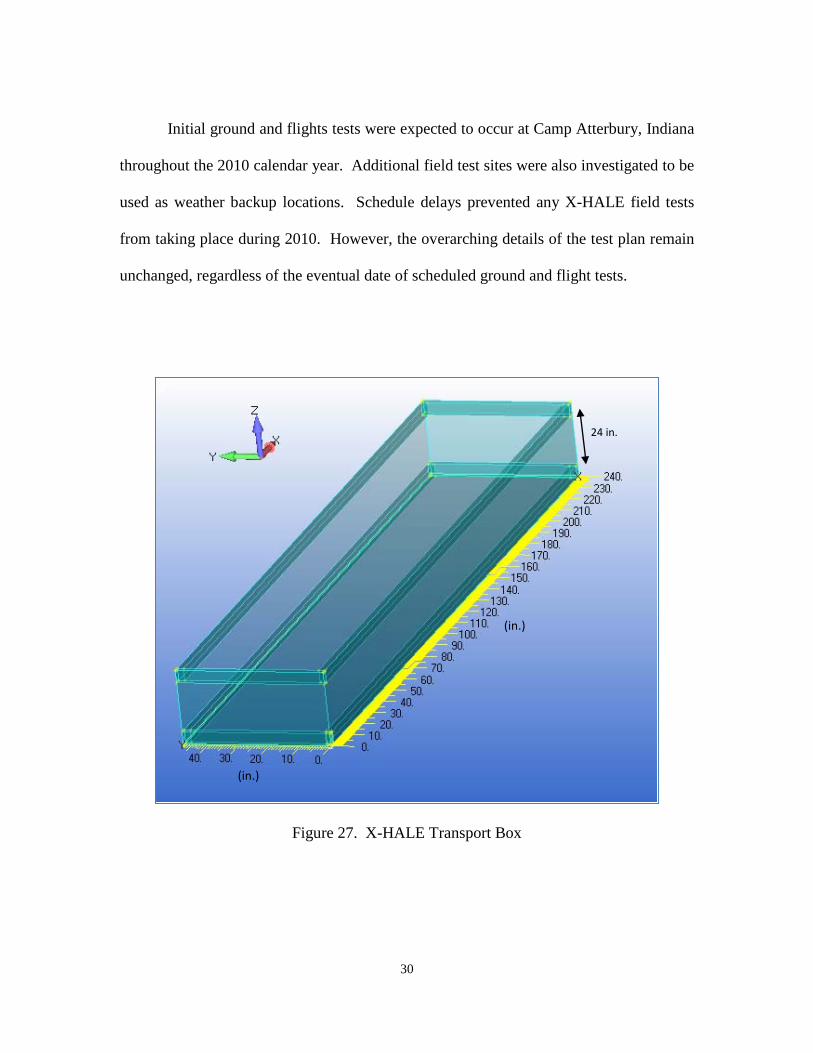
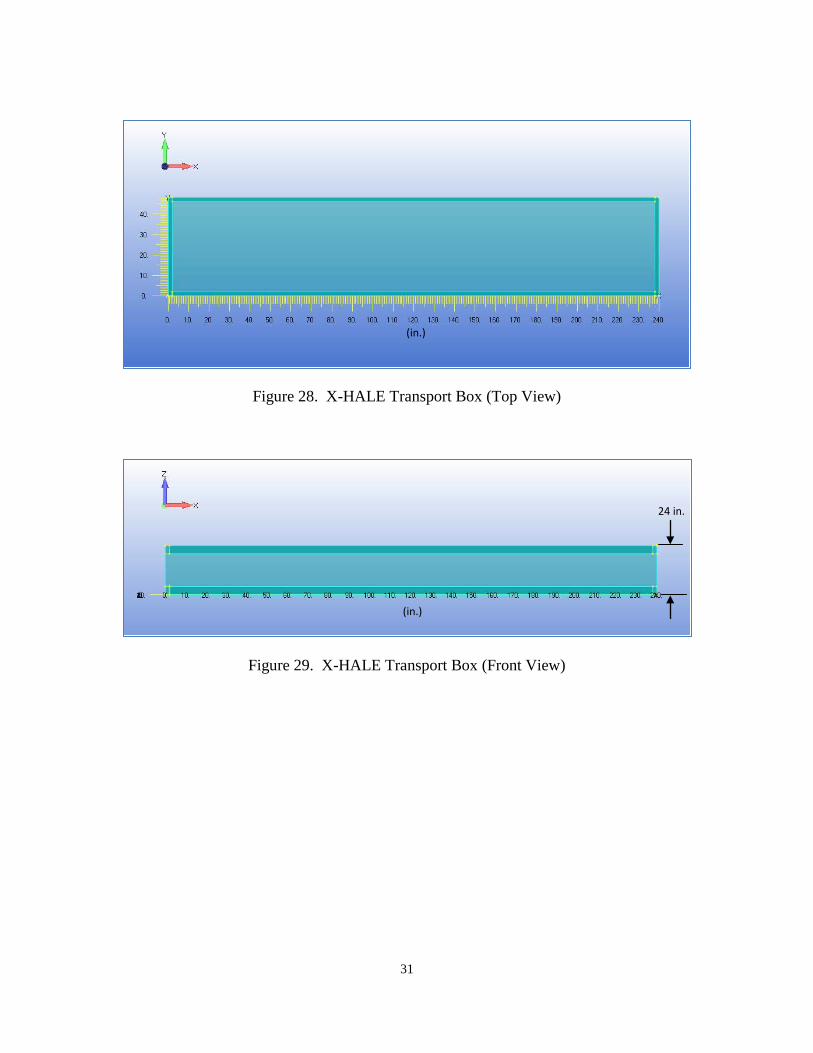
with supplies, tools and ground equipment, will be transported by truck. A custom-made
wooden box will be constructed to house the assembled vehicle and will be filled with
Styrofoam packing material to cushion and help support the structure. The transport box
will be approximately four ft wide, 20 ft long, and two ft high. The walls and floor of the
box will be constructed from plywood sheets. Running the inner perimeter of the box at
both the top and bottom will be 2-in. x 4-in. boards to support the overall container. As
required, additional support spars will be added along the 4-ft dimension of the bottom
surface of the box. The overall design and dimensions can be seen in the following
diagrams (Figure 27 through Figure 29).
30
Initial ground and flights tests were expected to occur at Camp Atterbury, Indiana
throughout the 2010 calendar year. Additional field test sites were also investigated to be
used as weather backup locations. Schedule delays prevented any X-HALE field tests
from taking place during 2010. However, the overarching details of the test plan remain
unchanged, regardless of the eventual date of scheduled ground and flight tests.
Figure 27. X-HALE Transport Box
(in.)
(in.)
24 in.
31
Figure 28. X-HALE Transport Box (Top View)
Figure 29. X-HALE Transport Box (Front View)
(in.)
(in.)
24 in.
32
III. Methodology
As explained by Gosz, the FE method is a mathematical process for
approximating the solutions to differential equations [16]. Conceptually, the method
takes a mathematical problem and breaks it up into individual pieces referred to as nodes
and elements. By discretizing the problem into these smaller parts, they can be treated as
finite components and solutions to many smaller problems can be determined. The
overall FE modeling procedure is most often divided into three phases: pre-processing,
analysis, and post-processing. Gosz feels that the pre-processing phase is often the most
difficult and time consuming of the three phases, and the amount of effort expended on
this research effort would seem to confirm that suggestion.
Kim and Sankar present an overview of the core principles involved in developing
and using FE programs [19]. They highlight that once a system is divided into finite
elements, it is the focus of FE analysis to determine the behavior of each element, as well
as its interaction with other nearby elements. These elemental behaviors are then
translated into an approximation of the global behavior of the entire system. A key
principle here is that errors typically decrease as the problem is discretized further. As
the number of elements are increased and their sizes are reduced, the overall solution for
the system will converge and reach the true solution for the problem. This, of course,
directly relates to computational cost and limits associated with arriving as such a
problem.
This research was likely similar to the experiences of many engineers in industry,
where the use of a finite element software tool can be at odds with the user's low level of
33
confidence in the many key aspects of the problem at hand, such as the overall
assumptions made, how the boundary conditions are defined, and what metrics of failure
are to be used. As more time was spent working with the FE program, assumptions were
refined and boundary conditions were described with greater detail. The importance of
correctly defining material properties was also realized throughout this effort. Many of
these realizations occurred after acquiring results and evaluating whether or not boundary
conditions had been satisfied, whether the FE mesh was refined sufficiently, if the
starting assumptions were made correctly, and whether a more complicated model and
analysis were needed.
FEMAP Uses and Limitations
Finite element models created for this research were built and tested using
FEMAP, a Siemens PLM Software product. An advantage of using a commercial FE
tool such as FEMAP is the ease of utilizing previously created CAD-based geometry of
the desired subject and the ability to conduct FE analysis on the whole or partial aircraft
component as needed. Limitations of the software system included an education license
which excluded some toolkits otherwise available with the program and prevented some
modifications to FEMAP that could have increased productivity during this effort. Also,
throughout this work several different versions of FEMAP were used. Reasons for this
were that training material was initially available only for earlier versions of the software,
while AFIT network functionality prevented all but the most recent version of FEMAP
from successfully integrating post-processing results.
34
An incremental process was followed throughout the modeling effort of this
research. This step-by-step method allowed starting with significantly simplified
versions of the components to be analyzed before moving on to more complex and
detailed representations of the structures. There are several benefits to using such a
process to develop a model, prime among them being the likelihood that mistakes are
often caught earlier than they would have been otherwise. Starting with simplified
models often allows the user to more readily test the validity of assumptions, whether the
boundary conditions were correctly defined, and whether the selected solver will provide
the desired results. Incremental model development usually means less time and effort is
spent overall as compared to a process in which the user attempts to develop a more
complicated model immediately.
Modeling Process
Computational cost of analysis for this effort did not become an issue. For further
FE analysis beyond the modeling effort conducted in this research, the computational
requirement will likely increase significantly. The subject of units was recognized early
as both important and likely to cause errors. Both SI and English units were used during
much of the testing and physical design of X-HALE, so care was taken to remain
consistent during the FE analysis process.
Modeling work within FEMAP began with the original CAD models of the parts
of X-HALE to be analyzed. CAD files of the complete wing section and joiner block
were obtained from the University of Michigan. These models were then imported into
35
FEMAP as solid geometry and would form the reference foundation for the development
of the finite element models.
Two distinct FE modeling efforts will be discussed here. The first is focused on
the University of Michigan's three-point bending test conducted early in X-HALE's
design and construction effort. At the time it was conducted, this bending test was the
only major lab test performed on a significant structural X-HALE component for which
appreciable data had been collected. The point in time at which the test had been
completed and the organization of its data served as an appropriate test subject with
which to work in relation to this research. Subsequent FE modeling and analysis focused
on the later bending tests conducted in the University of Michigan's bending and torsion
test rig.
Three-point Bending Test
As described in detail previously, the entire X-HALE aircraft is comprised of
eight one-meter long wing sections joined together at seven joints (Figure 9 and Figure
10). The inner five joint sections, where airfoils are joined to the five inner motor
fairings, are identical and are representative of the wing joint section that was subjected
to bending loads. The first assumption made was to neglect the motor fairing from the
joint, since this was not included in the test. Because the joiner sleeve is not glued to the
wing, but rather intended to transfer torsional loads between wing sections through the
joint, the sleeve geometry was also neglected and two wing section models were simply
connected together along their edge.
36
First, the original CAD geometry of a complete X-HALE wing created by the
University of Michigan was imported into FEMAP. The geometry included all details of
the wing that were to be constructed of fiberglass, foam, and carbon fiber materials. No
sensors or wires were included in the geometry. A Cartesian coordinate system was
defined about the model such that the positive X direction is along the wing chord out the
trailing edge of the wing, the positive Y direction is out to top of the wing surface normal
to the chord line and parallel to the direction of the applied load of the test rig, and the
positive Z direction is out the aircraft's left wing along the span of the wing section (see
Figure 31). For the purposes of creating an FE model, the original CAD geometry was
overly complex to use directly, especially for the beginning steps of the incremental
process. Some simplification of the model was required to begin the meshing process.
The carbon IM7 layers within the airfoil and wing box sections were neglected to
simplify the model. Although it would later be added back into the FE model, the foam
core of the airfoil and wing box was not included during the initial analysis because it
was assumed the foam provided only minimal additional stiffness. This left the initial
model consisting of two hollow 1-m (39.37-in.) span airfoils, wrapped around hollow
wing boxes, connected together by sliding the inner end of the wing boxes over a 2.5-in.
long wooden joiner block (Figure 30).
To remain consistent with the bending test that was conducted, and to further
simplify the model, it was assumed the joined wing section would only move in the
positive or negative Y (along the direction of the applied load) and Z (span-wise)
directions. And although the bending test was conducted at cycles of +20 lb / -10 lb
loads at a ±0.15 in./min loading rate, the model would be subjected to single, incremental
37
loads corresponding to each of the maximum loads applied for each cycle during the test
– 20, 30, 40, 50, and 60 lbs respectively.
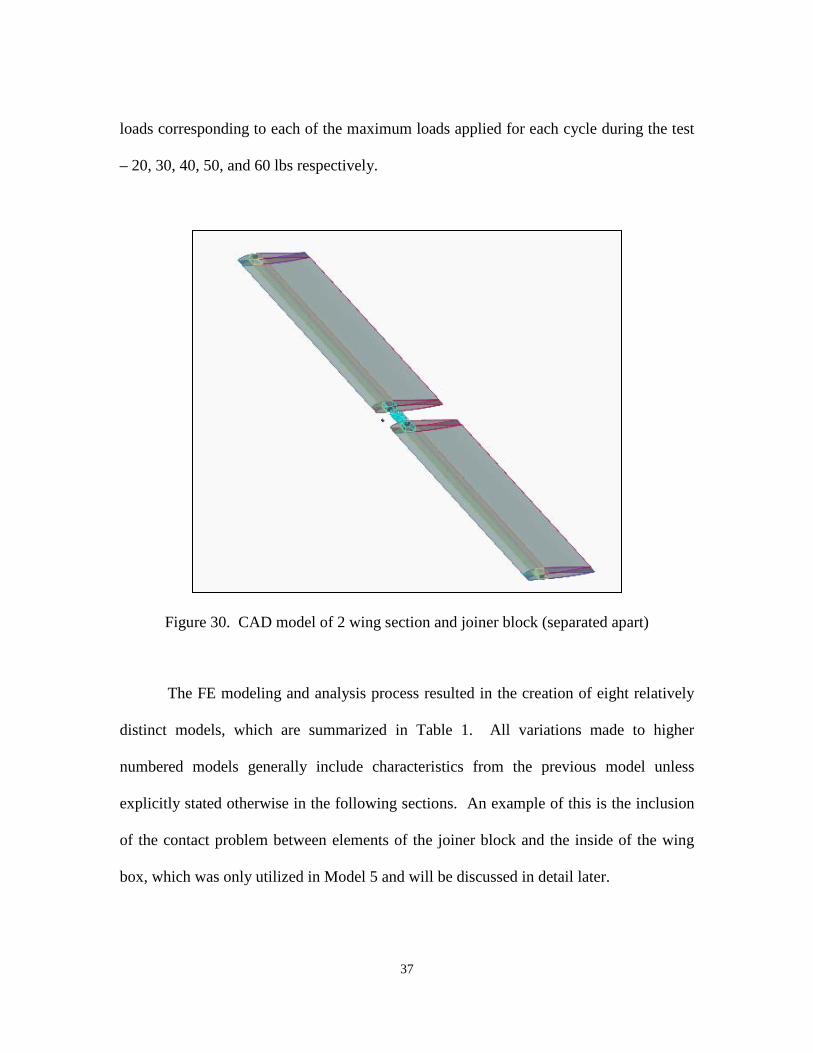
Figure 30. CAD model of 2 wing section and joiner block (separated apart)
The FE modeling and analysis process resulted in the creation of eight relatively
distinct models, which are summarized in Table 1. All variations made to higher
numbered models generally include characteristics from the previous model unless
explicitly stated otherwise in the following sections. An example of this is the inclusion
of the contact problem between elements of the joiner block and the inside of the wing
box, which was only utilized in Model 5 and will be discussed in detail later.
38
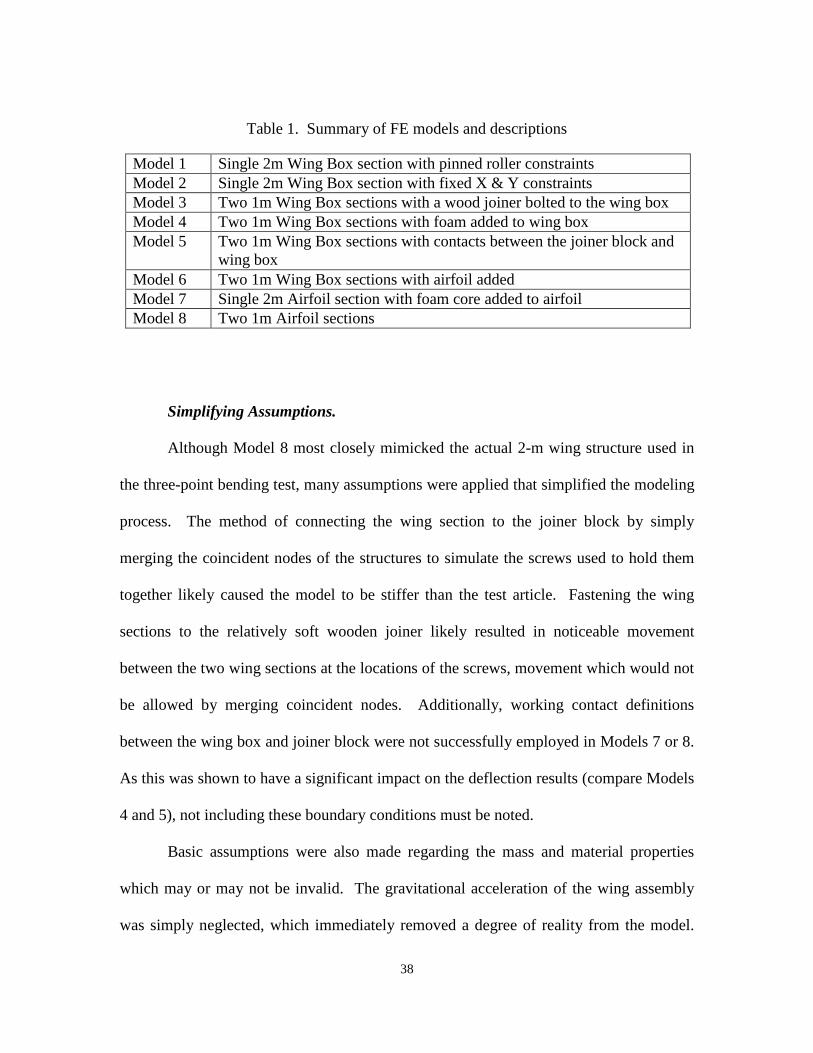
Table 1. Summary of FE models and descriptions
Model 1 Single 2m Wing Box section with pinned roller constraints Model 2 Single 2m Wing Box section with fixed X & Y constraints Model 3 Two 1m Wing Box sections with a wood joiner bolted to the wing box Model 4 Two 1m Wing Box sections with foam added to wing box Model 5 Two 1m Wing Box sections with contacts between the joiner block and
wing box Model 6 Two 1m Wing Box sections with airfoil added Model 7 Single 2m Airfoil section with foam core added to airfoil Model 8 Two 1m Airfoil sections
Simplifying Assumptions.
Although Model 8 most closely mimicked the actual 2-m wing structure used in
the three-point bending test, many assumptions were applied that simplified the modeling
process. The method of connecting the wing section to the joiner block by simply
merging the coincident nodes of the structures to simulate the screws used to hold them
together likely caused the model to be stiffer than the test article. Fastening the wing
sections to the relatively soft wooden joiner likely resulted in noticeable movement
between the two wing sections at the locations of the screws, movement which would not
be allowed by merging coincident nodes. Additionally, working contact definitions
between the wing box and joiner block were not successfully employed in Models 7 or 8.
As this was shown to have a significant impact on the deflection results (compare Models
4 and 5), not including these boundary conditions must be noted.
Basic assumptions were also made regarding the mass and material properties
which may or may not be invalid. The gravitational acceleration of the wing assembly
was simply neglected, which immediately removed a degree of reality from the model.
39
However, the gravitational force on the wing of such a small composite structure was
assumed to be orders of magnitude less than the applied loading. For the static analysis
performed, this assumption likely had negligible affects. On the other hand, the material
properties of the composites (as published by their manufacturer) were used were in the
model definitions [4, 6]. How they compared to the true properties of the assembled
materials is unknown. The layup technique employed during fabrication of the wings
may have resulted in properties varying significantly from their published values.
Finally, while the carbon fiber reinforcements to the joint sections of the wings only
consisted of a small fraction of the wing, neglecting this material also resulted in material
properties of the assembled wing which differed from that of the test section, likely
causing the model to be slightly more flexible than the actual physical structure.
As the FE model of the joined wing sections evolved from Model 1 to Model 8,
the simplifying assumptions applied were systematically removed. The joiner block was
added at the joint inside the wing box (Models 3 – 8) and the wing sections were split
into two separate pieces. The foam core was then added back to the wing box. Finally,
the airfoil was reintroduced and the foam was included within the airfoil sections. Each
change brought the model closer to the test article. However, as will be discussed in the
following sections, as more of the wing section structure was added back to the model the
results diverged from those of the actual bending test.
Loads and Boundary Conditions.
The loading and boundary conditions for the test case were relatively straight-
forward. Loads and constraints were applied to the model only at nodes of the wing box
40
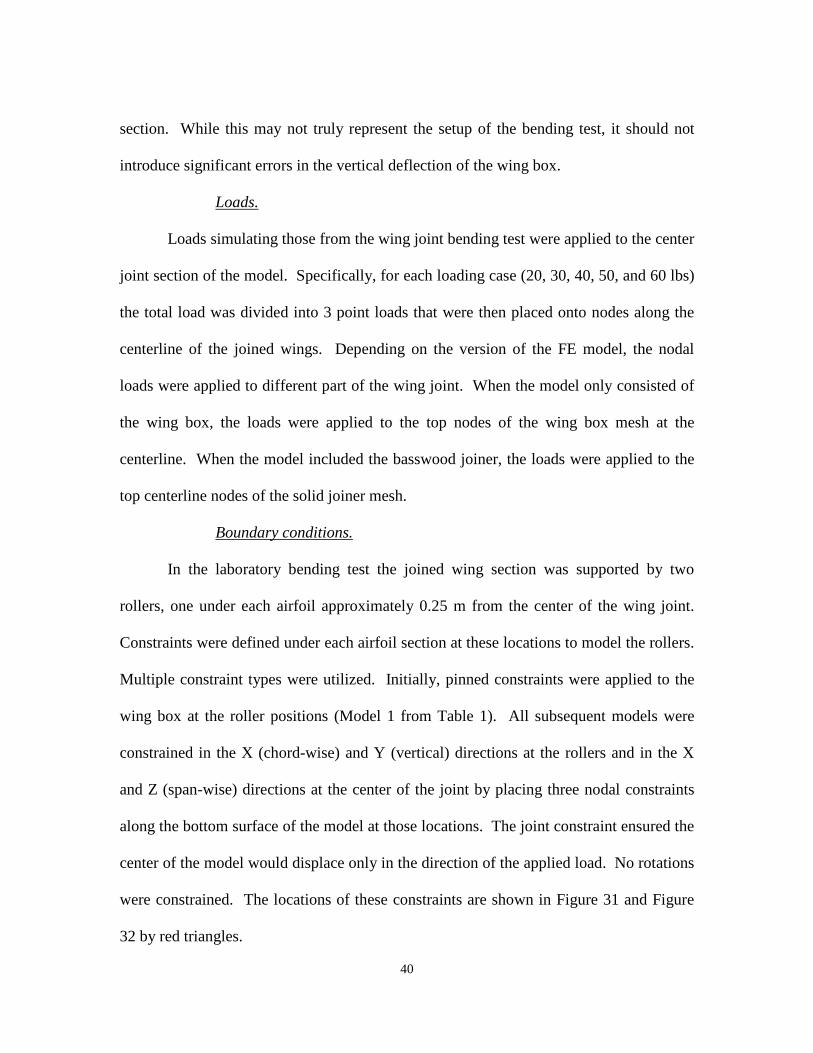
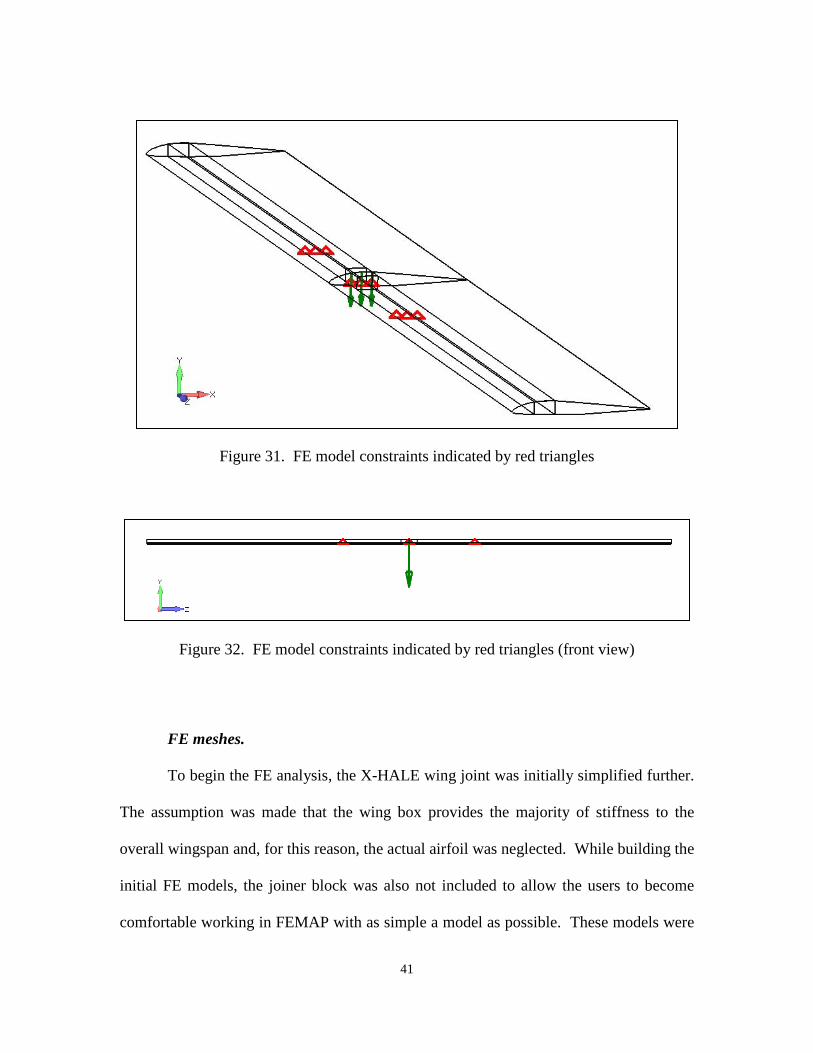
section. While this may not truly represent the setup of the bending test, it should not
introduce significant errors in the vertical deflection of the wing box.
Loads.
Loads simulating those from the wing joint bending test were applied to the center
joint section of the model. Specifically, for each loading case (20, 30, 40, 50, and 60 lbs)
the total load was divided into 3 point loads that were then placed onto nodes along the
centerline of the joined wings. Depending on the version of the FE model, the nodal
loads were applied to different part of the wing joint. When the model only consisted of
the wing box, the loads were applied to the top nodes of the wing box mesh at the
centerline. When the model included the basswood joiner, the loads were applied to the
top centerline nodes of the solid joiner mesh.
Boundary conditions.
In the laboratory bending test the joined wing section was supported by two
rollers, one under each airfoil approximately 0.25 m from the center of the wing joint.
Constraints were defined under each airfoil section at these locations to model the rollers.
Multiple constraint types were utilized. Initially, pinned constraints were applied to the
wing box at the roller positions (Model 1 from Table 1). All subsequent models were
constrained in the X (chord-wise) and Y (vertical) directions at the rollers and in the X
and Z (span-wise) directions at the center of the joint by placing three nodal constraints
along the bottom surface of the model at those locations. The joint constraint ensured the
center of the model would displace only in the direction of the applied load. No rotations
were constrained. The locations of these constraints are shown in Figure 31 and Figure
32 by red triangles.
41
Figure 31. FE model constraints indicated by red triangles
Figure 32. FE model constraints indicated by red triangles (front view)
FE meshes.
To begin the FE analysis, the X-HALE wing joint was initially simplified further.
The assumption was made that the wing box provides the majority of stiffness to the
overall wingspan and, for this reason, the actual airfoil was neglected. While building the
initial FE models, the joiner block was also not included to allow the users to become
comfortable working in FEMAP with as simple a model as possible. These models were
42
created as single 2-m structures without the complication of a connecting piece. The
wing box was initially modeled using simple beam elements. By defining the beam cross
section to be that of the wing box, or close to it, the beam elements would be a simple
and efficient model of the wing span in a bending scenario such as this test. A
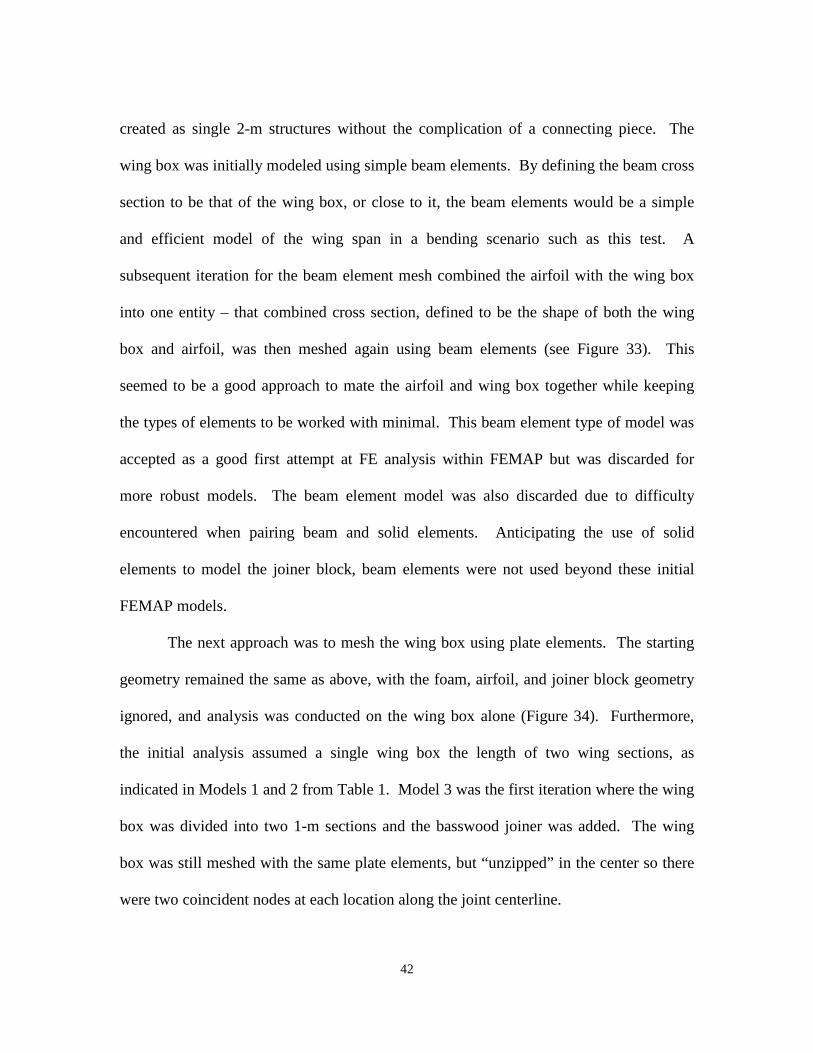
subsequent iteration for the beam element mesh combined the airfoil with the wing box
into one entity – that combined cross section, defined to be the shape of both the wing
box and airfoil, was then meshed again using beam elements (see Figure 33). This
seemed to be a good approach to mate the airfoil and wing box together while keeping
the types of elements to be worked with minimal. This beam element type of model was
accepted as a good first attempt at FE analysis within FEMAP but was discarded for
more robust models. The beam element model was also discarded due to difficulty
encountered when pairing beam and solid elements. Anticipating the use of solid
elements to model the joiner block, beam elements were not used beyond these initial
FEMAP models.
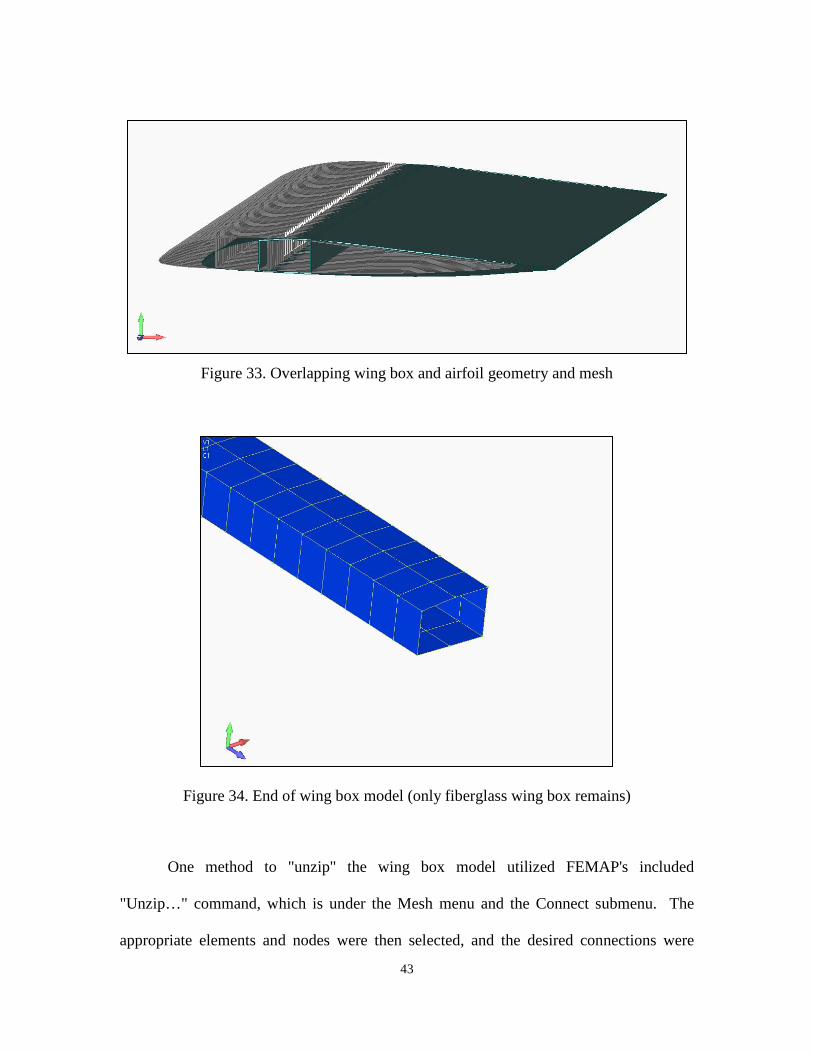
The next approach was to mesh the wing box using plate elements. The starting
geometry remained the same as above, with the foam, airfoil, and joiner block geometry
ignored, and analysis was conducted on the wing box alone (Figure 34). Furthermore,
the initial analysis assumed a single wing box the length of two wing sections, as
indicated in Models 1 and 2 from Table 1. Model 3 was the first iteration where the wing
box was divided into two 1-m sections and the basswood joiner was added. The wing
box was still meshed with the same plate elements, but “unzipped” in the center so there
were two coincident nodes at each location along the joint centerline.
43
Figure 33. Overlapping wing box and airfoil geometry and mesh
Figure 34. End of wing box model (only fiberglass wing box remains)
One method to "unzip" the wing box model utilized FEMAP's included
"Unzip…" command, which is under the Mesh menu and the Connect submenu. The
appropriate elements and nodes were then selected, and the desired connections were
44
selected within the Generate Connection Options dialogue box. To completely free the
two portions of the model, None was selected as the connection type. Additionally, an
effective method to "unzip" the center joint of the 2-m wing box model was to revert
back to an earlier version of the model, before the coincident nodes at the center were
merged, and leave them unmerged. Although the appearance of the model did not
change, the number of nodes increased and the two 1-m sections of wing box were now
separate structures. The basswood joiner was meshed as eight solid Hex elements. The
properties of the basswood were assumed to be equal to those for commonly published
woods [26]. During the laboratory test the joiner was secured to the structure with two
vertical screws through the airfoil, wing box, and wood. In the FE model the wood-screw
connections were simulated by merging the nodes where the screws were located on the
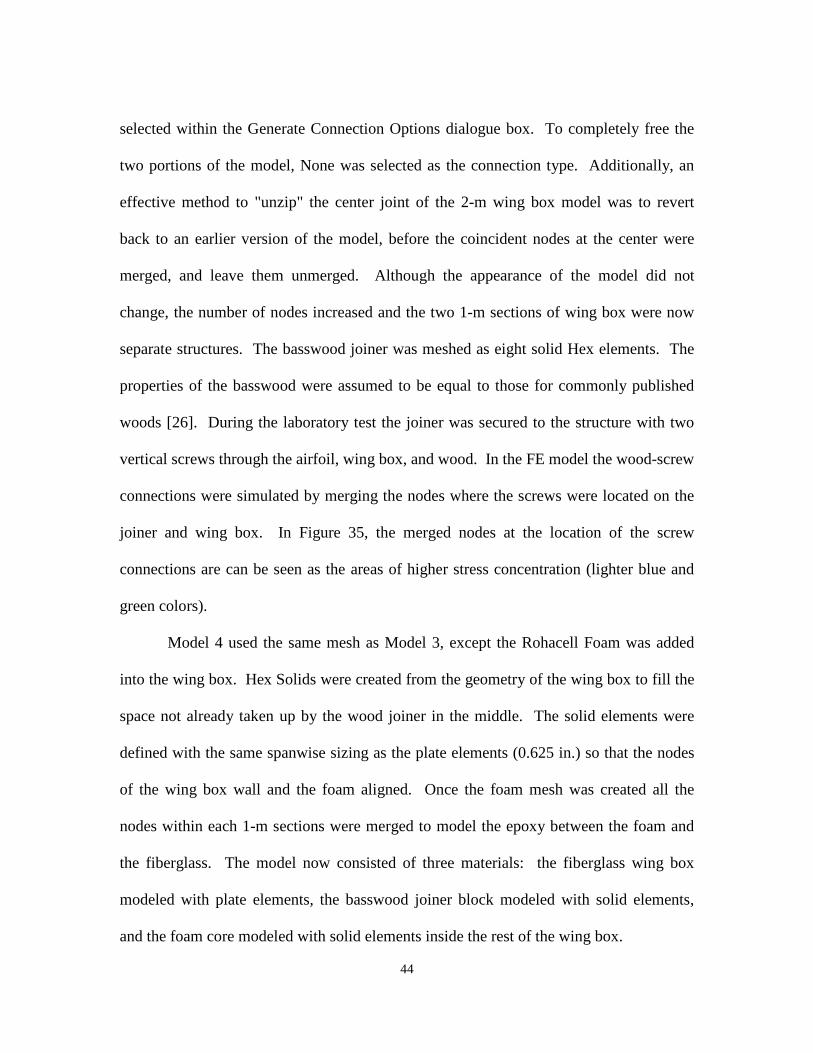
joiner and wing box. In Figure 35, the merged nodes at the location of the screw
connections are can be seen as the areas of higher stress concentration (lighter blue and
green colors).
Model 4 used the same mesh as Model 3, except the Rohacell Foam was added
into the wing box. Hex Solids were created from the geometry of the wing box to fill the
space not already taken up by the wood joiner in the middle. The solid elements were
defined with the same spanwise sizing as the plate elements (0.625 in.) so that the nodes
of the wing box wall and the foam aligned. Once the foam mesh was created all the
nodes within each 1-m sections were merged to model the epoxy between the foam and
the fiberglass. The model now consisted of three materials: the fiberglass wing box
modeled with plate elements, the basswood joiner block modeled with solid elements,
and the foam core modeled with solid elements inside the rest of the wing box.
45
Figure 35. Model 3 deformed showing wooden joiner block inside wing box
Contact Problem.
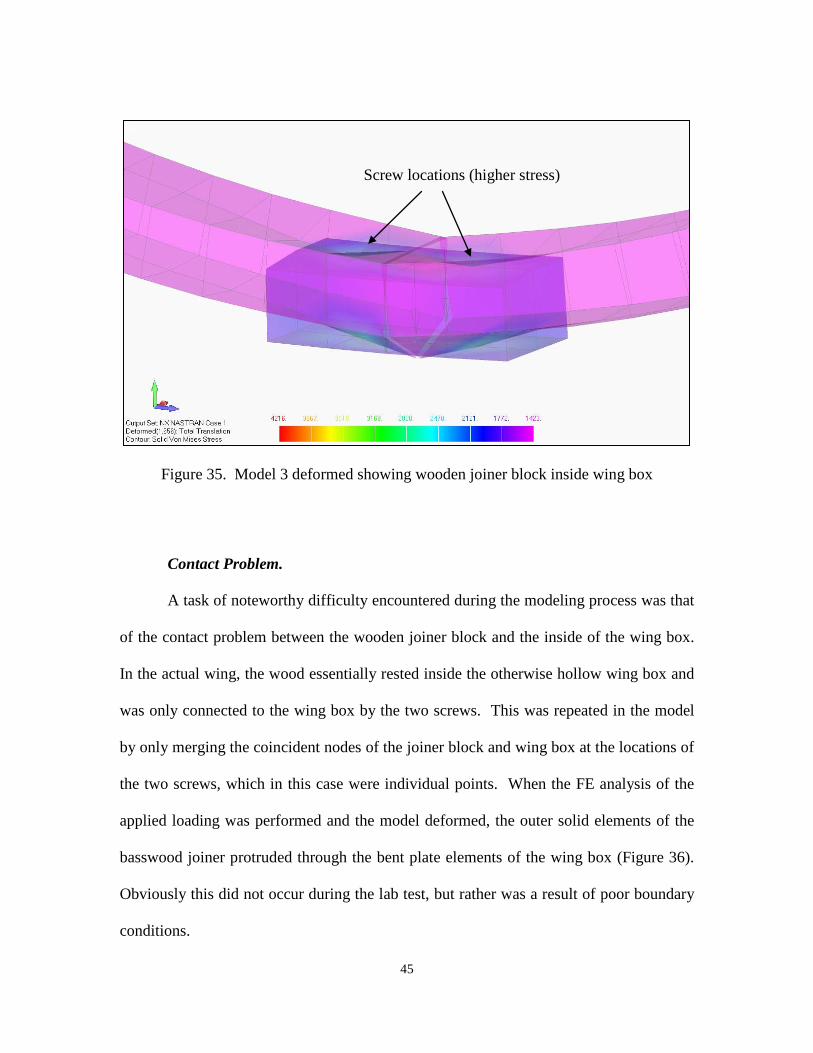
A task of noteworthy difficulty encountered during the modeling process was that
of the contact problem between the wooden joiner block and the inside of the wing box.
In the actual wing, the wood essentially rested inside the otherwise hollow wing box and
was only connected to the wing box by the two screws. This was repeated in the model
by only merging the coincident nodes of the joiner block and wing box at the locations of
the two screws, which in this case were individual points. When the FE analysis of the
applied loading was performed and the model deformed, the outer solid elements of the
basswood joiner protruded through the bent plate elements of the wing box (Figure 36).
Obviously this did not occur during the lab test, but rather was a result of poor boundary
conditions.
Screw locations (higher stress)
46
Figure 36. Wing box joint without contact surfaces defined showing protruding joiner (with close-up detail of joiner block)
To investigate this contact problem, a simple model of two cantilever square
beams was created. Both beams were fixed at opposite ends, with one beam resting on
the other. Finally, a load was applied to the free end of the top beam. However, without
properly defining and/or activating a connector, when analysis of the model was
performed the top beam deformed through the bottom beam (shown in Figure 37 by the
blue transparent geometry of the original position and the deflected gray elements).
While the method to solve this unrealistic behavior was not difficult, several steps were
required to create a working contact problem. The following technique outlines the
process used to model the physical contact of two surfaces for this research.
Deformed wing box joint
Undeformed wing box joint
47
Within the Connections function of FEMAP, the following steps were taken:
1. A Connection Property was defined, with the following settings:
a. Connect Type was set to 0.Contact
b. Friction was set to 1
c. Min Contact Search Dist was set to 0
d. Max Contact Search Dist was set sufficiently high
e. Min Contact Percentage was left at 0
f. Initial Penetration was set to 3.Zero Gap/Penetration
2. Two Connection Regions were selected, with the following settings:
a. Type was set as Deformable
b. Output set to Elements
c. Defined By set to Surfaces
d. One region was defined for each beam – the bottom surface of the top
beam and the top surface of the bottom beam.
3. A Contact Connector was defined. Within the Contact Connector definition the
two previously defined Connection Regions were selected. The Connection
Property defined above was selected as the property. One region was set as the
Master and the other as the Slave.
Finally, the connector was Enabled by right-clicking its title in the Model Info window.
When analysis was again performed, this time the cantilever test model deformed as one
would expect – the surfaces in contact deflected together, causing the bottom beam to
also deflect (Figure 38).
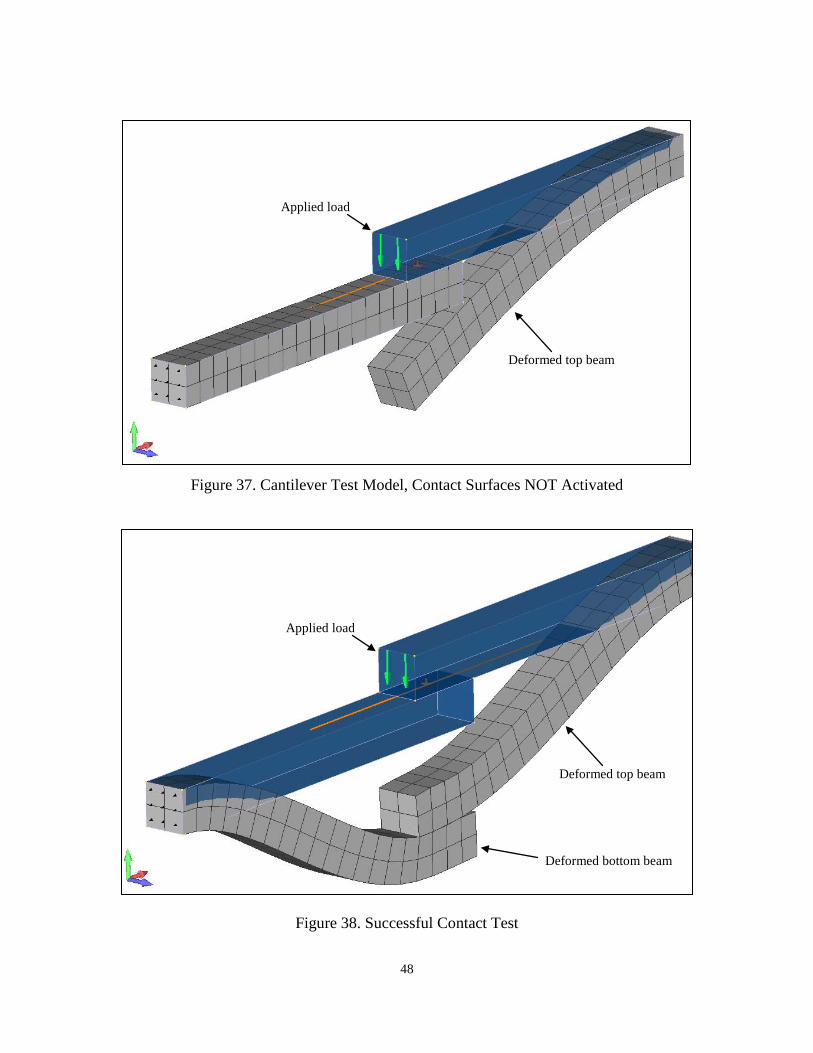
48
Figure 37. Cantilever Test Model, Contact Surfaces NOT Activated
Figure 38. Successful Contact Test
Applied load
Deformed top beam
Applied load
Deformed top beam
Deformed bottom beam
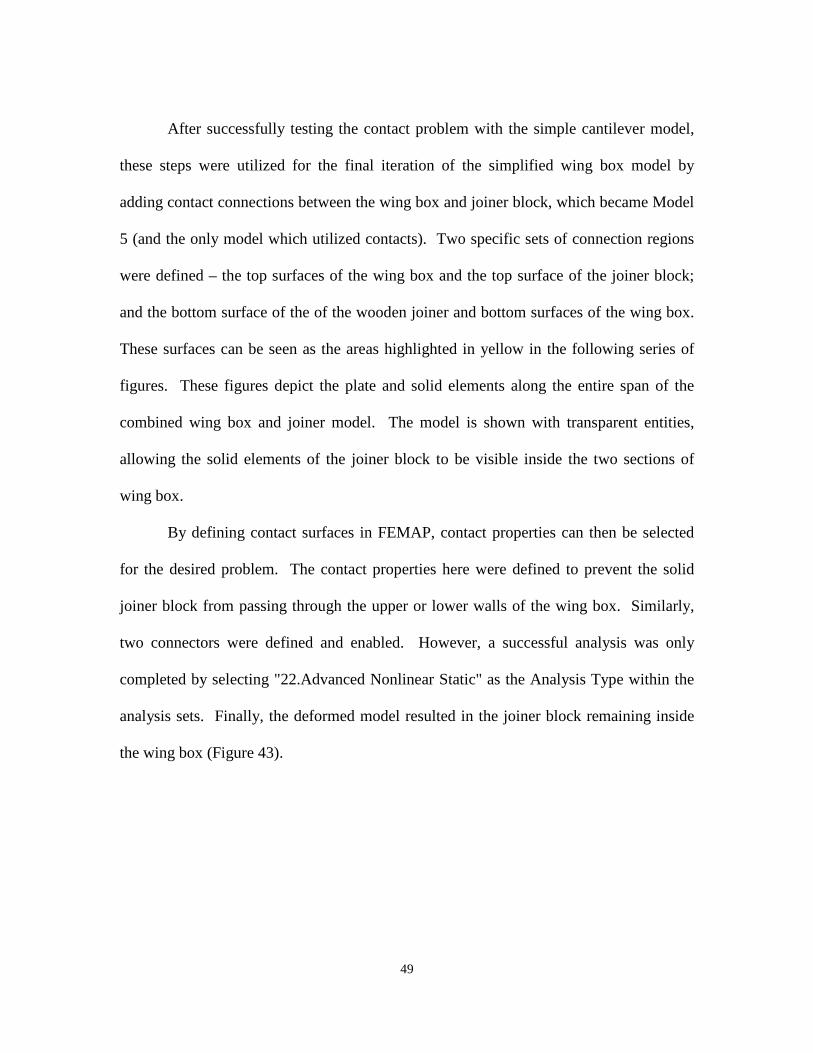
49
After successfully testing the contact problem with the simple cantilever model,
these steps were utilized for the final iteration of the simplified wing box model by
adding contact connections between the wing box and joiner block, which became Model
5 (and the only model which utilized contacts). Two specific sets of connection regions
were defined – the top surfaces of the wing box and the top surface of the joiner block;
and the bottom surface of the of the wooden joiner and bottom surfaces of the wing box.
These surfaces can be seen as the areas highlighted in yellow in the following series of
figures. These figures depict the plate and solid elements along the entire span of the
combined wing box and joiner model. The model is shown with transparent entities,
allowing the solid elements of the joiner block to be visible inside the two sections of
wing box.
By defining contact surfaces in FEMAP, contact properties can then be selected
for the desired problem. The contact properties here were defined to prevent the solid
joiner block from passing through the upper or lower walls of the wing box. Similarly,
two connectors were defined and enabled. However, a successful analysis was only
completed by selecting "22.Advanced Nonlinear Static" as the Analysis Type within the
analysis sets. Finally, the deformed model resulted in the joiner block remaining inside
the wing box (Figure 43).
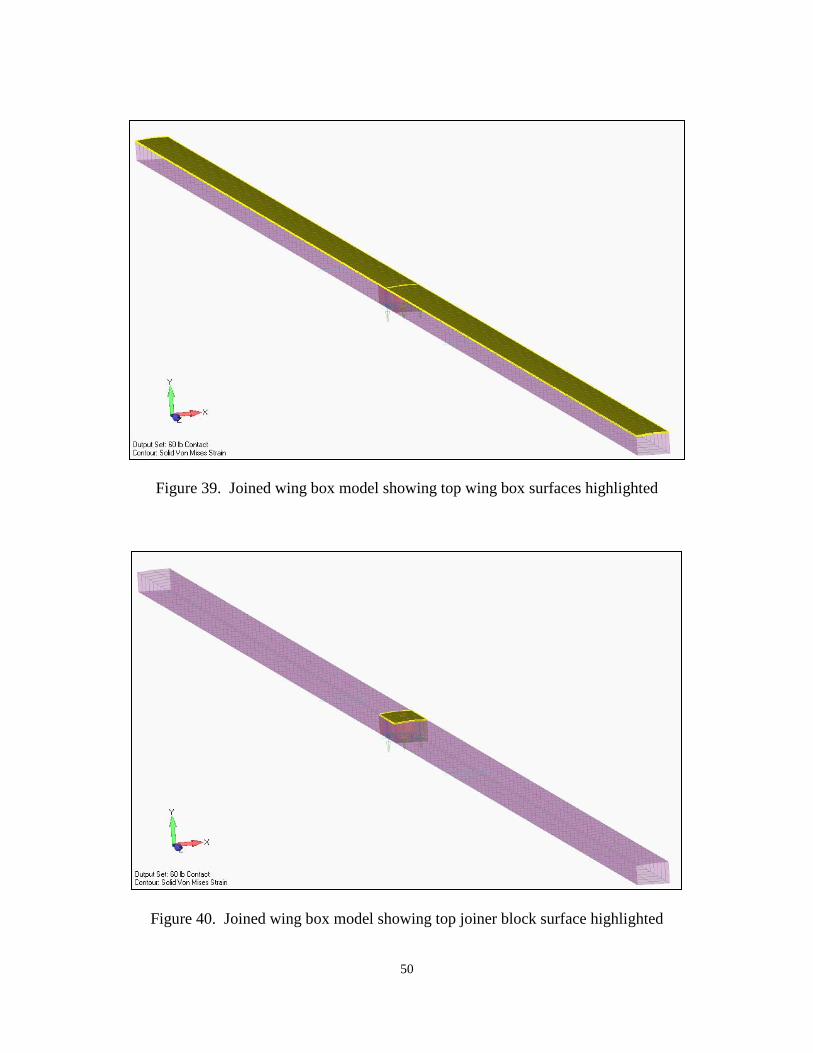
50
Figure 39. Joined wing box model showing top wing box surfaces highlighted
Figure 40. Joined wing box model showing top joiner block surface highlighted
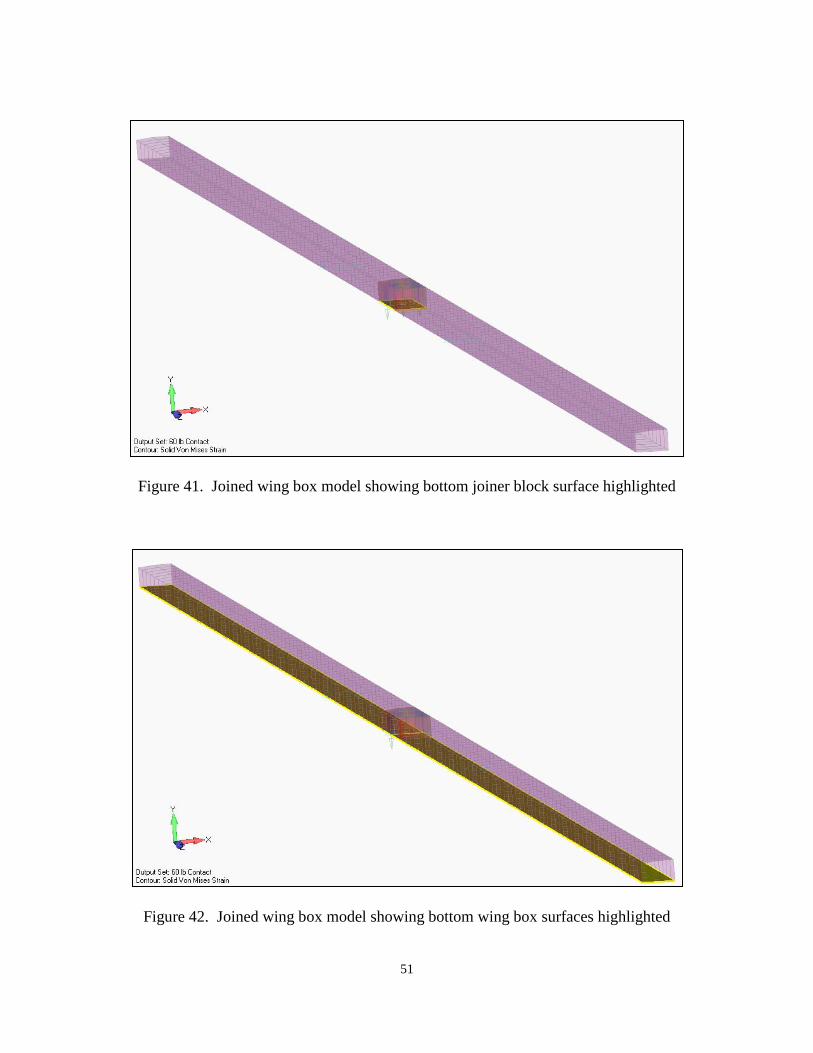
51
Figure 41. Joined wing box model showing bottom joiner block surface highlighted
Figure 42. Joined wing box model showing bottom wing box surfaces highlighted
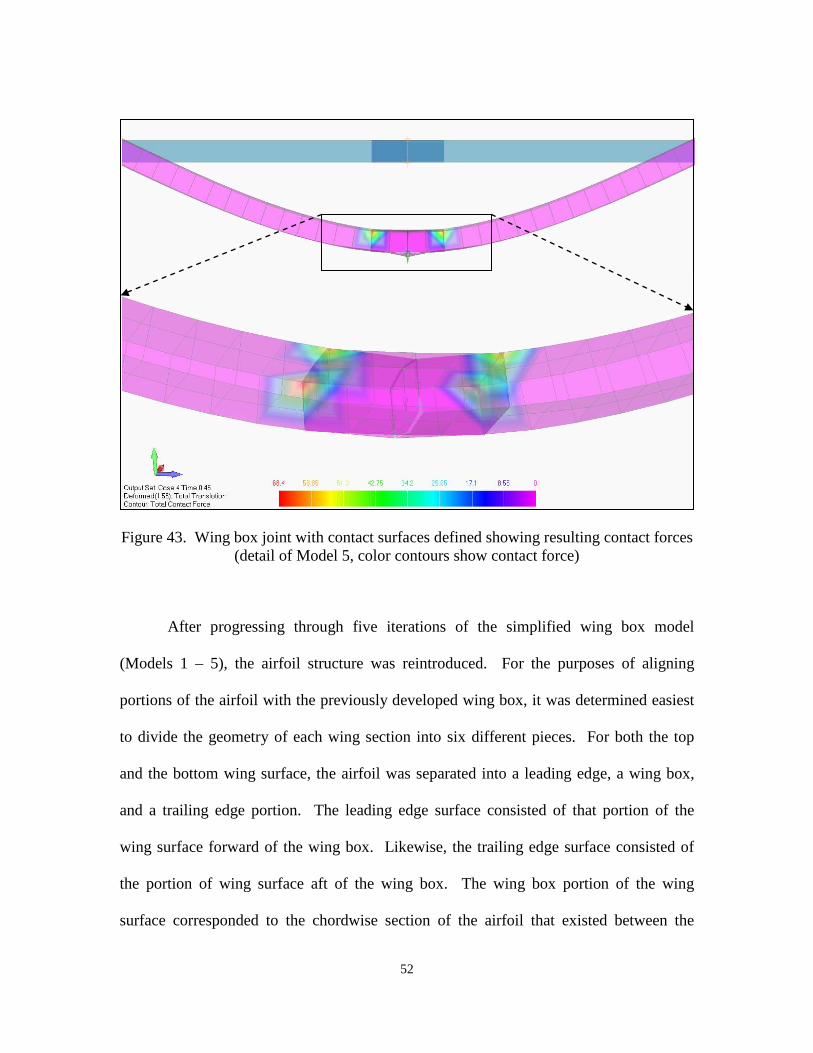
52
Figure 43. Wing box joint with contact surfaces defined showing resulting contact forces (detail of Model 5, color contours show contact force)
After progressing through five iterations of the simplified wing box model
(Models 1 – 5), the airfoil structure was reintroduced. For the purposes of aligning
portions of the airfoil with the previously developed wing box, it was determined easiest
to divide the geometry of each wing section into six different pieces. For both the top
and the bottom wing surface, the airfoil was separated into a leading edge, a wing box,
and a trailing edge portion. The leading edge surface consisted of that portion of the
wing surface forward of the wing box. Likewise, the trailing edge surface consisted of
the portion of wing surface aft of the wing box. The wing box portion of the wing
surface corresponded to the chordwise section of the airfoil that existed between the
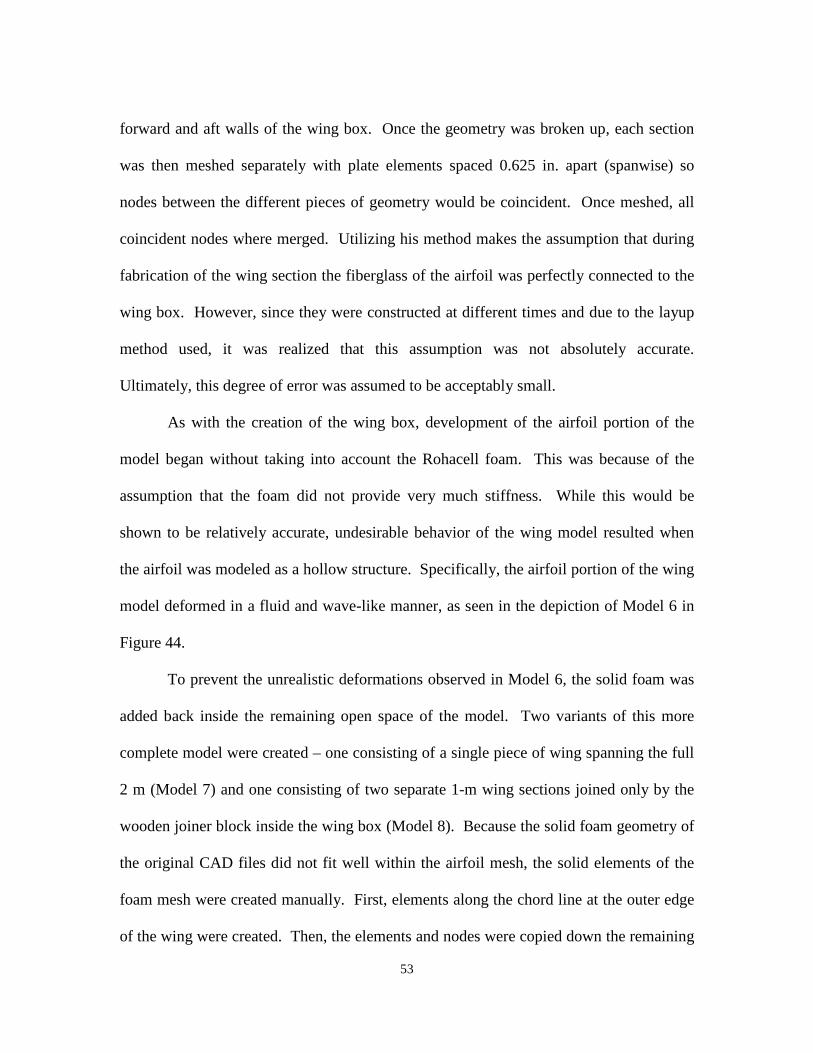
53
forward and aft walls of the wing box. Once the geometry was broken up, each section
was then meshed separately with plate elements spaced 0.625 in. apart (spanwise) so
nodes between the different pieces of geometry would be coincident. Once meshed, all
coincident nodes where merged. Utilizing his method makes the assumption that during
fabrication of the wing section the fiberglass of the airfoil was perfectly connected to the
wing box. However, since they were constructed at different times and due to the layup
method used, it was realized that this assumption was not absolutely accurate.
Ultimately, this degree of error was assumed to be acceptably small.
As with the creation of the wing box, development of the airfoil portion of the
model began without taking into account the Rohacell foam. This was because of the
assumption that the foam did not provide very much stiffness. While this would be
shown to be relatively accurate, undesirable behavior of the wing model resulted when
the airfoil was modeled as a hollow structure. Specifically, the airfoil portion of the wing
model deformed in a fluid and wave-like manner, as seen in the depiction of Model 6 in
Figure 44.
To prevent the unrealistic deformations observed in Model 6, the solid foam was
added back inside the remaining open space of the model. Two variants of this more
complete model were created – one consisting of a single piece of wing spanning the full
2 m (Model 7) and one consisting of two separate 1-m wing sections joined only by the
wooden joiner block inside the wing box (Model 8). Because the solid foam geometry of
the original CAD files did not fit well within the airfoil mesh, the solid elements of the
foam mesh were created manually. First, elements along the chord line at the outer edge
of the wing were created. Then, the elements and nodes were copied down the remaining
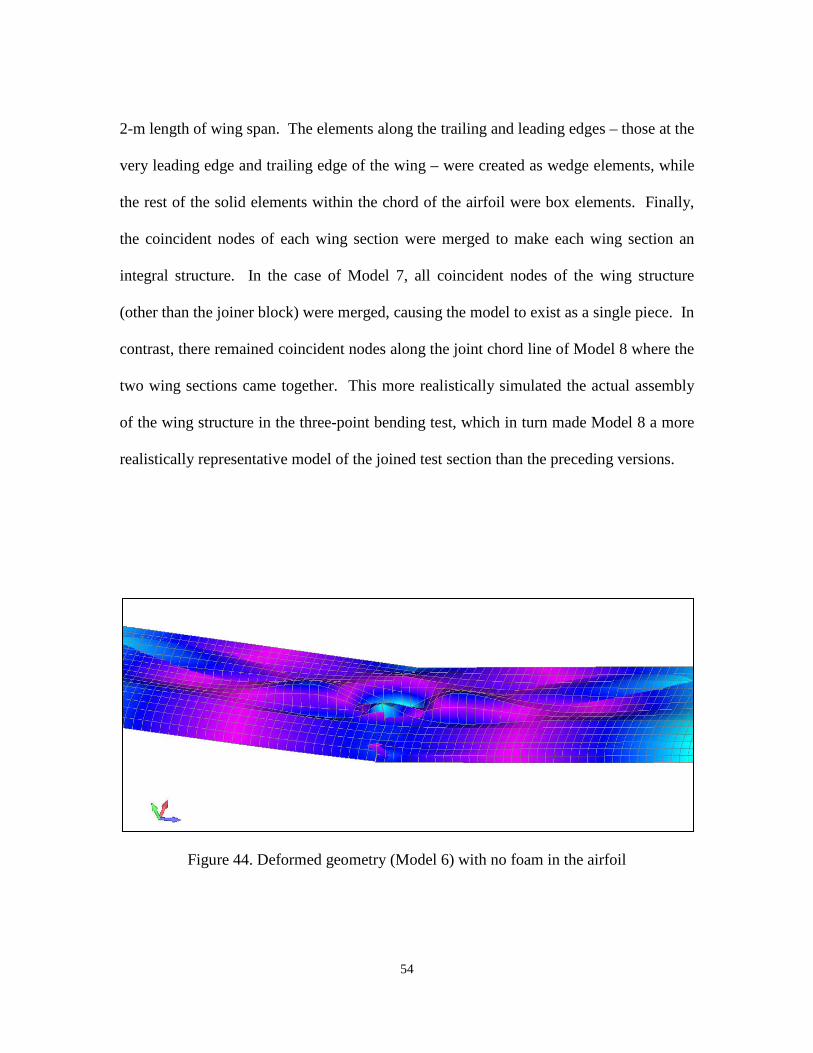
54
2-m length of wing span. The elements along the trailing and leading edges – those at the
very leading edge and trailing edge of the wing – were created as wedge elements, while
the rest of the solid elements within the chord of the airfoil were box elements. Finally,
the coincident nodes of each wing section were merged to make each wing section an
integral structure. In the case of Model 7, all coincident nodes of the wing structure
(other than the joiner block) were merged, causing the model to exist as a single piece. In
contrast, there remained coincident nodes along the joint chord line of Model 8 where the
two wing sections came together. This more realistically simulated the actual assembly
of the wing structure in the three-point bending test, which in turn made Model 8 a more
realistically representative model of the joined test section than the preceding versions.
Figure 44. Deformed geometry (Model 6) with no foam in the airfoil
55
Lessons Learned.
Beyond discovering the procedures for defining contact surfaces between parts of
the model, many lessons were learned for effective methods of performing all levels of
tasks within the FE modeling process. An issue encountered early on in this effort dealt
with coincident nodes. There were many instances when meshing geometry resulted in
end nodes farther apart than the default value of 0.008 in. For example, the bottom and
top section of the trailing edge of the airfoil were approximately 0.023 in. apart. This
produced some unrealistic performance in the airfoil (see Figure 45) where the upper and
lower surfaces separated at the trailing edge and deformed individually. To avoid these
kinds of results, the tolerance for coincident node checks needed to be noted and adjusted
as necessary.
Figure 45. Behavior resulting from trailing edge mesh separation
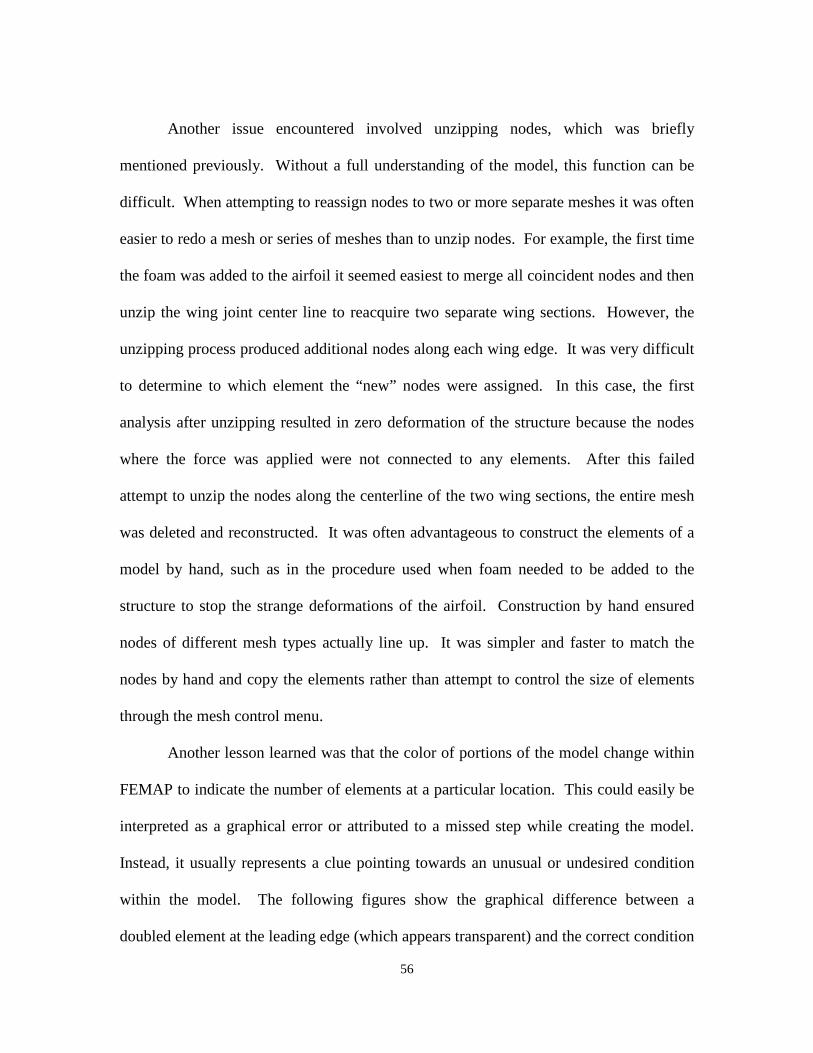
56
Another issue encountered involved unzipping nodes, which was briefly
mentioned previously. Without a full understanding of the model, this function can be
difficult. When attempting to reassign nodes to two or more separate meshes it was often
easier to redo a mesh or series of meshes than to unzip nodes. For example, the first time
the foam was added to the airfoil it seemed easiest to merge all coincident nodes and then
unzip the wing joint center line to reacquire two separate wing sections. However, the
unzipping process produced additional nodes along each wing edge. It was very difficult
to determine to which element the “new” nodes were assigned. In this case, the first
analysis after unzipping resulted in zero deformation of the structure because the nodes
where the force was applied were not connected to any elements. After this failed
attempt to unzip the nodes along the centerline of the two wing sections, the entire mesh
was deleted and reconstructed. It was often advantageous to construct the elements of a
model by hand, such as in the procedure used when foam needed to be added to the
structure to stop the strange deformations of the airfoil. Construction by hand ensured
nodes of different mesh types actually line up. It was simpler and faster to match the
nodes by hand and copy the elements rather than attempt to control the size of elements
through the mesh control menu.
Another lesson learned was that the color of portions of the model change within
FEMAP to indicate the number of elements at a particular location. This could easily be
interpreted as a graphical error or attributed to a missed step while creating the model.
Instead, it usually represents a clue pointing towards an unusual or undesired condition
within the model. The following figures show the graphical difference between a
doubled element at the leading edge (which appears transparent) and the correct condition
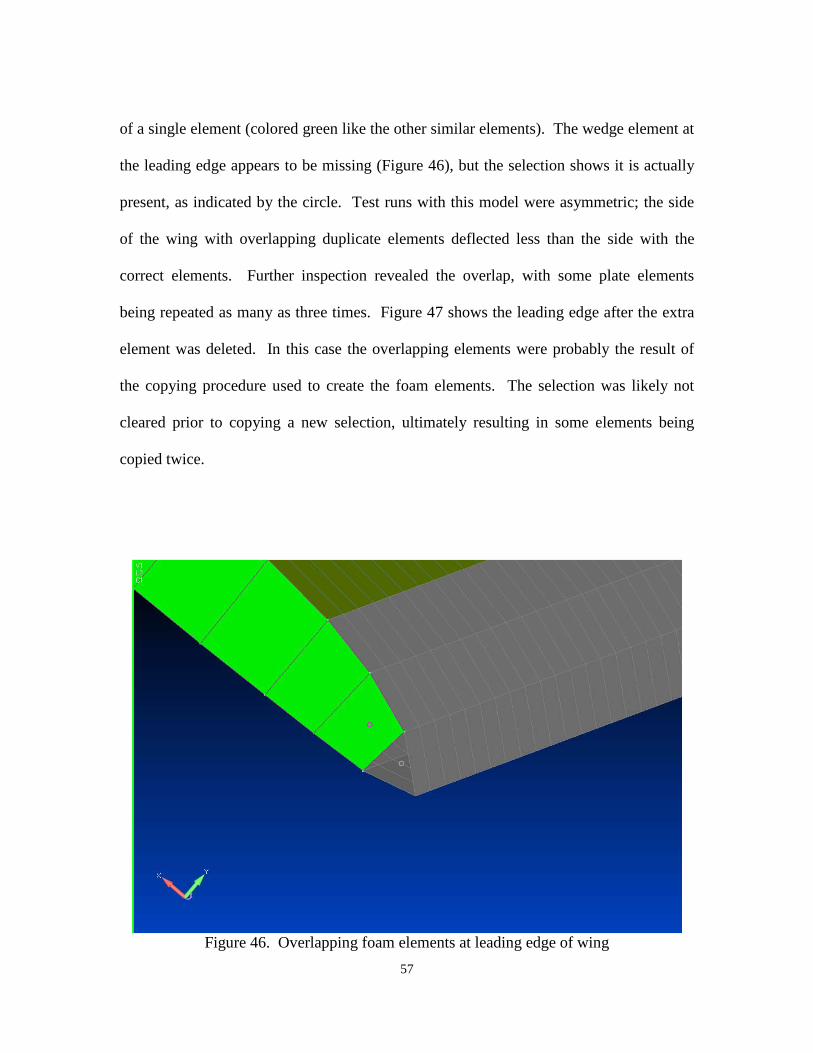
57
of a single element (colored green like the other similar elements). The wedge element at
the leading edge appears to be missing (Figure 46), but the selection shows it is actually
present, as indicated by the circle. Test runs with this model were asymmetric; the side
of the wing with overlapping duplicate elements deflected less than the side with the
correct elements. Further inspection revealed the overlap, with some plate elements
being repeated as many as three times. Figure 47 shows the leading edge after the extra
element was deleted. In this case the overlapping elements were probably the result of
the copying procedure used to create the foam elements. The selection was likely not
cleared prior to copying a new selection, ultimately resulting in some elements being
copied twice.
Figure 46. Overlapping foam elements at leading edge of wing
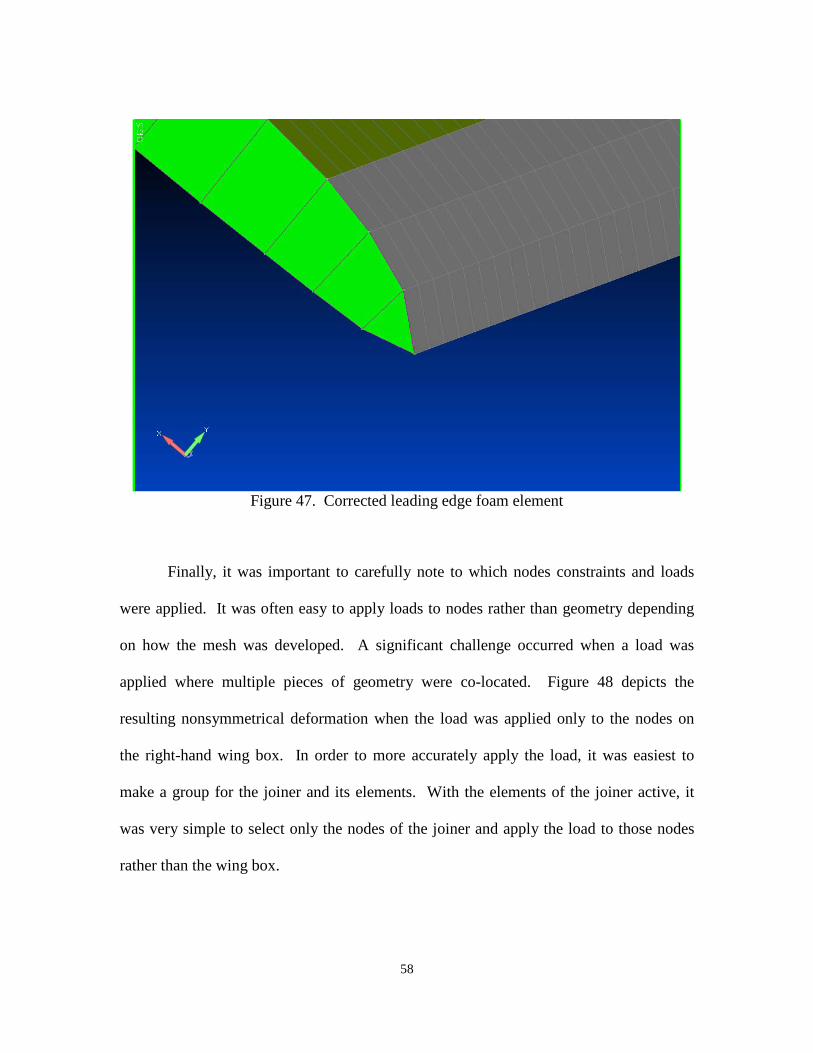
58
Figure 47. Corrected leading edge foam element
Finally, it was important to carefully note to which nodes constraints and loads
were applied. It was often easy to apply loads to nodes rather than geometry depending
on how the mesh was developed. A significant challenge occurred when a load was
applied where multiple pieces of geometry were co-located. Figure 48 depicts the
resulting nonsymmetrical deformation when the load was applied only to the nodes on
the right-hand wing box. In order to more accurately apply the load, it was easiest to
make a group for the joiner and its elements. With the elements of the joiner active, it
was very simple to select only the nodes of the joiner and apply the load to those nodes
rather than the wing box.
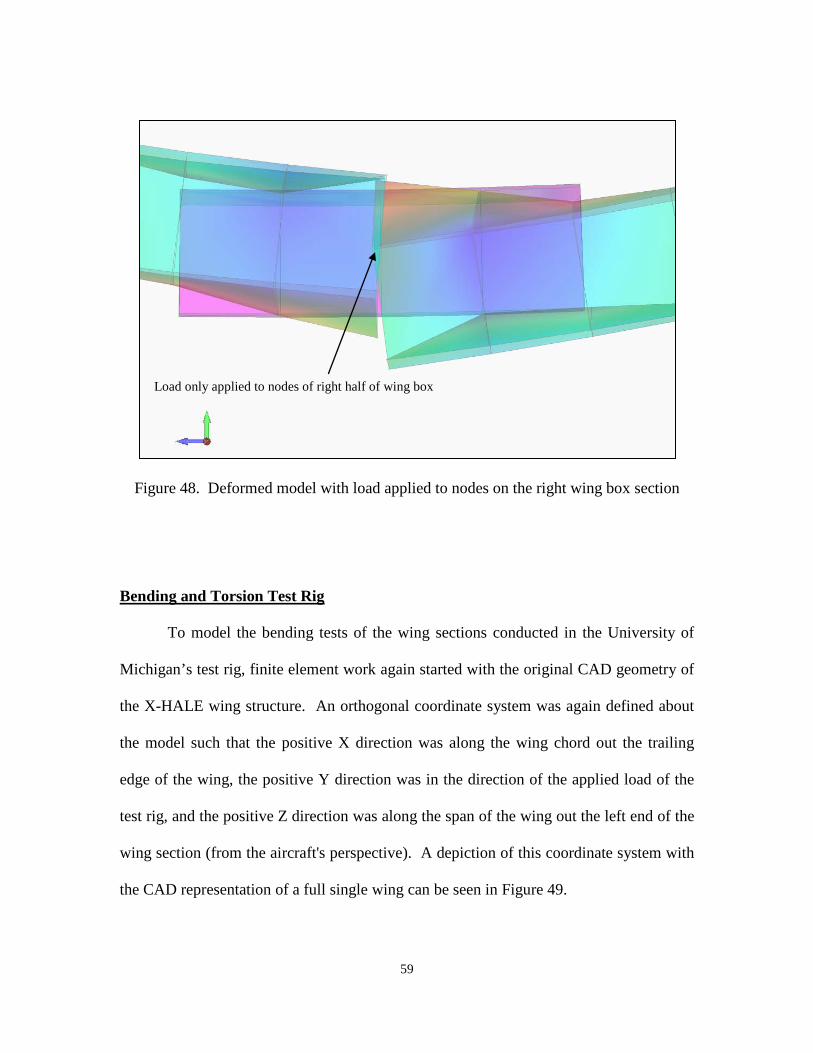
59
Figure 48. Deformed model with load applied to nodes on the right wing box section
Bending and Torsion Test Rig
To model the bending tests of the wing sections conducted in the University of
Michigan’s test rig, finite element work again started with the original CAD geometry of
the X-HALE wing structure. An orthogonal coordinate system was again defined about
the model such that the positive X direction was along the wing chord out the trailing
edge of the wing, the positive Y direction was in the direction of the applied load of the
test rig, and the positive Z direction was along the span of the wing out the left end of the
wing section (from the aircraft's perspective). A depiction of this coordinate system with
the CAD representation of a full single wing can be seen in Figure 49.
Load only applied to nodes of right half of wing box
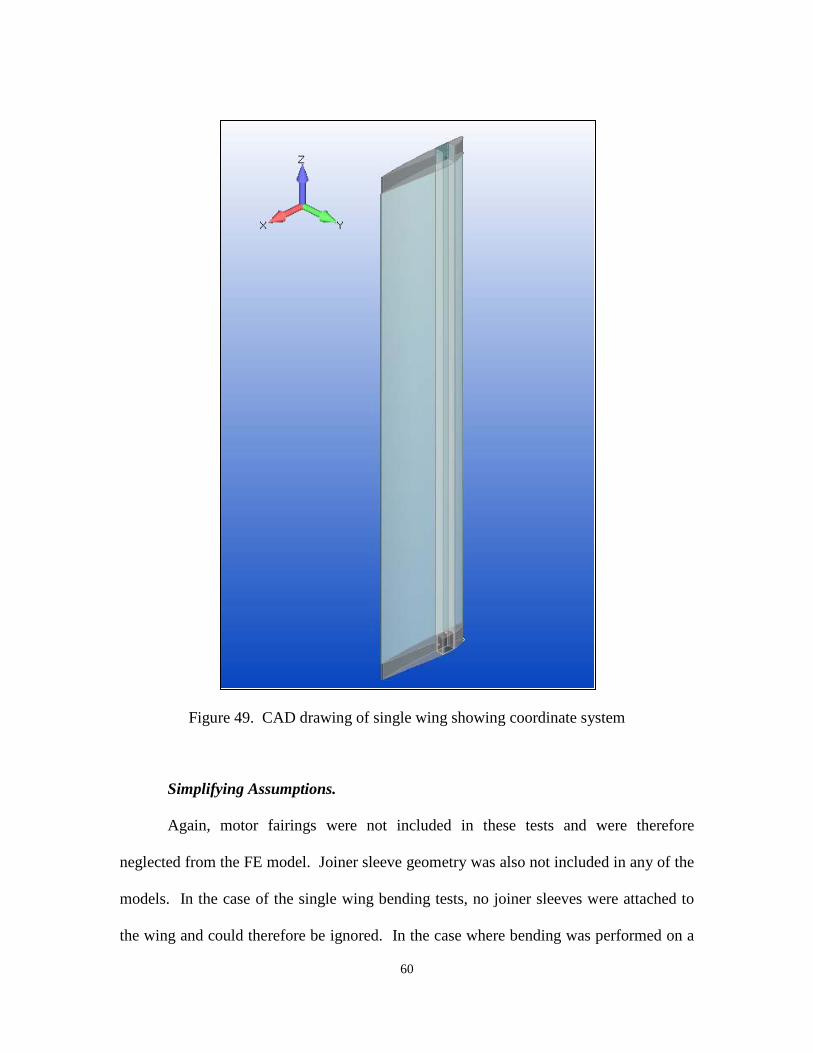
60
Figure 49. CAD drawing of single wing showing coordinate system
Simplifying Assumptions.
Again, motor fairings were not included in these tests and were therefore
neglected from the FE model. Joiner sleeve geometry was also not included in any of the
models. In the case of the single wing bending tests, no joiner sleeves were attached to
the wing and could therefore be ignored. In the case where bending was performed on a
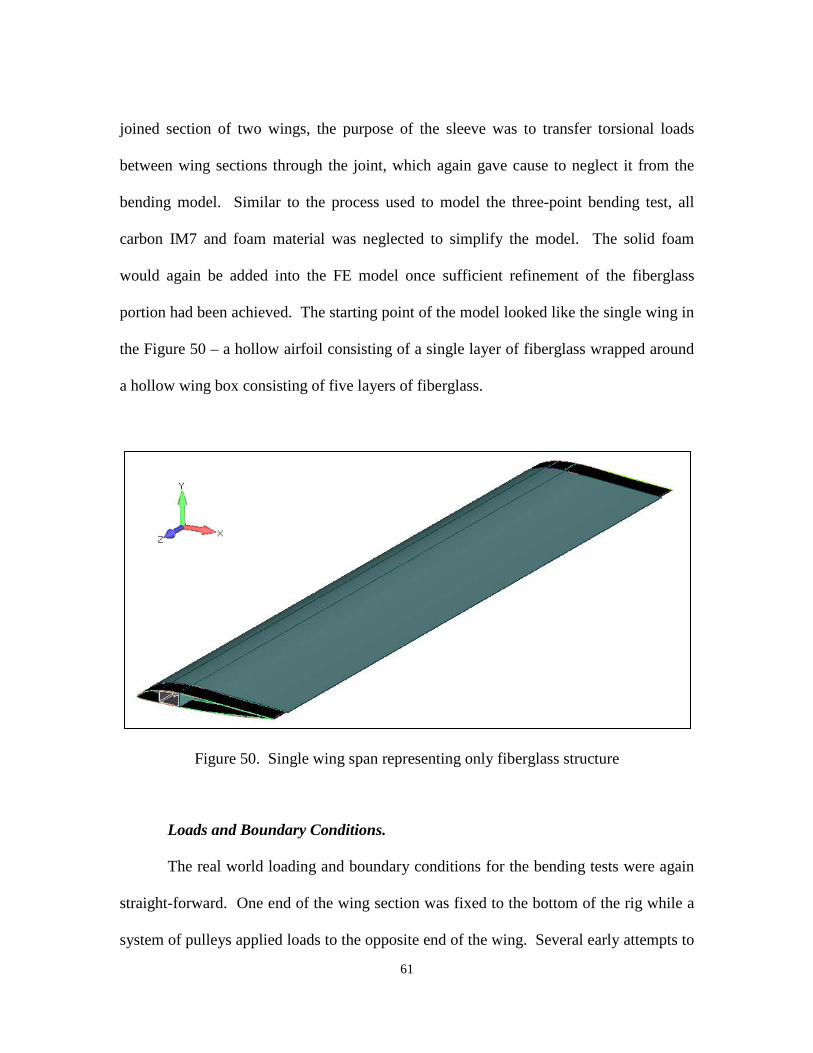
61
joined section of two wings, the purpose of the sleeve was to transfer torsional loads
between wing sections through the joint, which again gave cause to neglect it from the
bending model. Similar to the process used to model the three-point bending test, all
carbon IM7 and foam material was neglected to simplify the model. The solid foam
would again be added into the FE model once sufficient refinement of the fiberglass
portion had been achieved. The starting point of the model looked like the single wing in
the Figure 50 – a hollow airfoil consisting of a single layer of fiberglass wrapped around
a hollow wing box consisting of five layers of fiberglass.
Figure 50. Single wing span representing only fiberglass structure
Loads and Boundary Conditions.
The real world loading and boundary conditions for the bending tests were again
straight-forward. One end of the wing section was fixed to the bottom of the rig while a
system of pulleys applied loads to the opposite end of the wing. Several early attempts to
62
apply these loads and constraints were changed prior to the final variants of the model.
The most complicated part of applying the loads and constraints related to the size of the
wing clamps used to hold the test article in the test rig. As detailed in the previous
chapter, the sizes of the two sets of wing clamps used in the test rig differed slightly,
resulting in different spanwise areas of wing being covered at each end. The approaches
used to address these differences area detailed below.
FE Model Development.
Similar to the process used in the earlier FE modeling effort described previously,
this work began by first modeling only the wing box. When some confidence was gained
with the wing box model, the airfoil portion of the wing was then modeled by itself.
Finally, the elements of the wing box and wing were combined, with varying success.
To begin the wing box model, an extremely simplified version of the wing box
geometry was created. The true geometry of the wing box can be seen in Figure 51.
Even after the foam and carbon portions of the wing box had been removed, some overly
complicated geometry remained. The bolt holes were ignored, and the taper at both ends
was removed. Although the design of the wing box is close to square, the top and bottom
surfaces of the box actually match the curvature of the airfoil. These walls were removed
and replaced with flat surfaces that connected the front and back (or leading edge and
trailing edge) walls of the wing box.
The simplified wing box model was then meshed with plate elements. A very
coarse mesh of only 12 elements per span was used initially (Figure 52) followed by a
much finer mesh (Figure 53). These models were primarily used to investigate methods
63
of applying loads and constraints, and to confirm that static analysis would run correctly.
For both of these models, the test load was initially applied to the nodes on the bottom
surface at the top (i.e., free) end of the wing box. The green arrows in these figures
indicate the applied loads. For the coarsely meshed model, only the nodes of the element
at the end of the wing box were used for loads, while many elements at the end of the
finely meshed model were used for selecting elemental nodes for load locations. These
were both early attempts to simulate the coverage of the applied bending load based on
the size of the wing clamp. A single element of the coarse mesh was longer (spanwise)
than the actual wing clamp, and so only the nodes of one elements were used. In the
finely meshed model an area of elements more closely matching the spanwise length of
the wing clamp (1.457 in.) were used for nodal loading. Similarly, fixed constraints were
applied to all of the nodes of the elements corresponding to the area of the bottom wing
clamp (these are indicated as light blue triangles in Figure 52 and Figure 53).
Regardless of the coarseness of the mesh used, the applied forces and constraints
needed to be more accurately modeled to mimic the wing mounts used in the bending rig.
To help with this, the dimensions of the rig mounts were marked on the model inward
from each end. Specifically, curves in the X-Y plane were placed on the wing box at the
distance along the wing span in from each end that corresponded to the end of each wing
clamp. The original four surfaces of the wing box were then separated at these curves,
creating twelve separate surfaces. Eight surfaces (four at each end) then corresponded to
the wing area held within the wing mounts, with the remaining four surfaces being the
main part of the span not held by mounts. This allowed for applying loads and
constraints to surfaces rather than nodes, as well as defining different mesh sizes for the
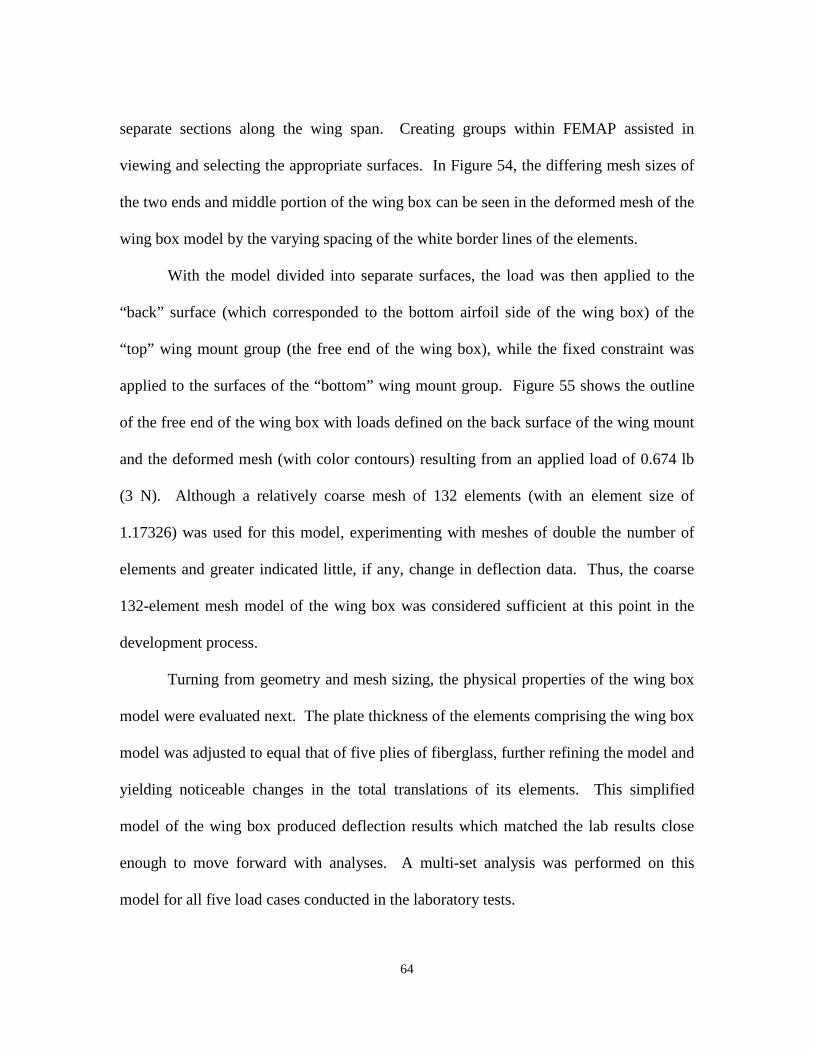
64
separate sections along the wing span. Creating groups within FEMAP assisted in
viewing and selecting the appropriate surfaces. In Figure 54, the differing mesh sizes of
the two ends and middle portion of the wing box can be seen in the deformed mesh of the
wing box model by the varying spacing of the white border lines of the elements.
With the model divided into separate surfaces, the load was then applied to the
“back” surface (which corresponded to the bottom airfoil side of the wing box) of the
“top” wing mount group (the free end of the wing box), while the fixed constraint was
applied to the surfaces of the “bottom” wing mount group. Figure 55 shows the outline
of the free end of the wing box with loads defined on the back surface of the wing mount
and the deformed mesh (with color contours) resulting from an applied load of 0.674 lb
(3 N). Although a relatively coarse mesh of 132 elements (with an element size of
1.17326) was used for this model, experimenting with meshes of double the number of
elements and greater indicated little, if any, change in deflection data. Thus, the coarse
132-element mesh model of the wing box was considered sufficient at this point in the
development process.
Turning from geometry and mesh sizing, the physical properties of the wing box
model were evaluated next. The plate thickness of the elements comprising the wing box
model was adjusted to equal that of five plies of fiberglass, further refining the model and
yielding noticeable changes in the total translations of its elements. This simplified
model of the wing box produced deflection results which matched the lab results close
enough to move forward with analyses. A multi-set analysis was performed on this
model for all five load cases conducted in the laboratory tests.
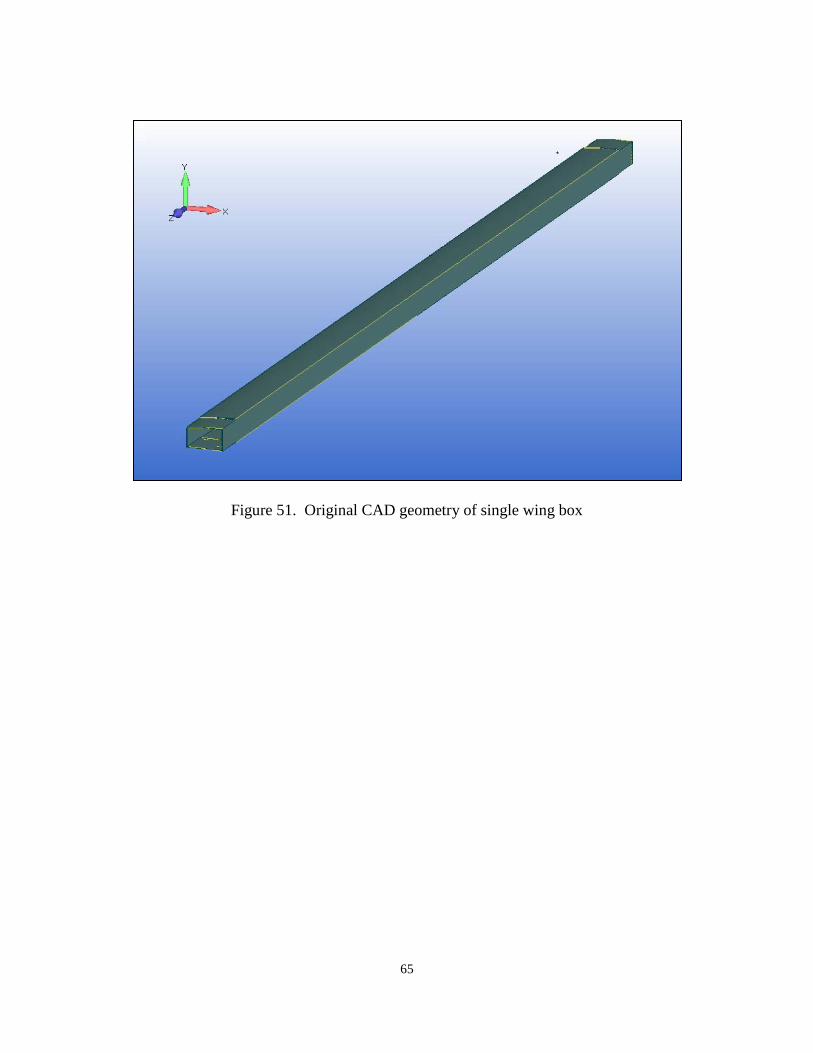
65
Figure 51. Original CAD geometry of single wing box
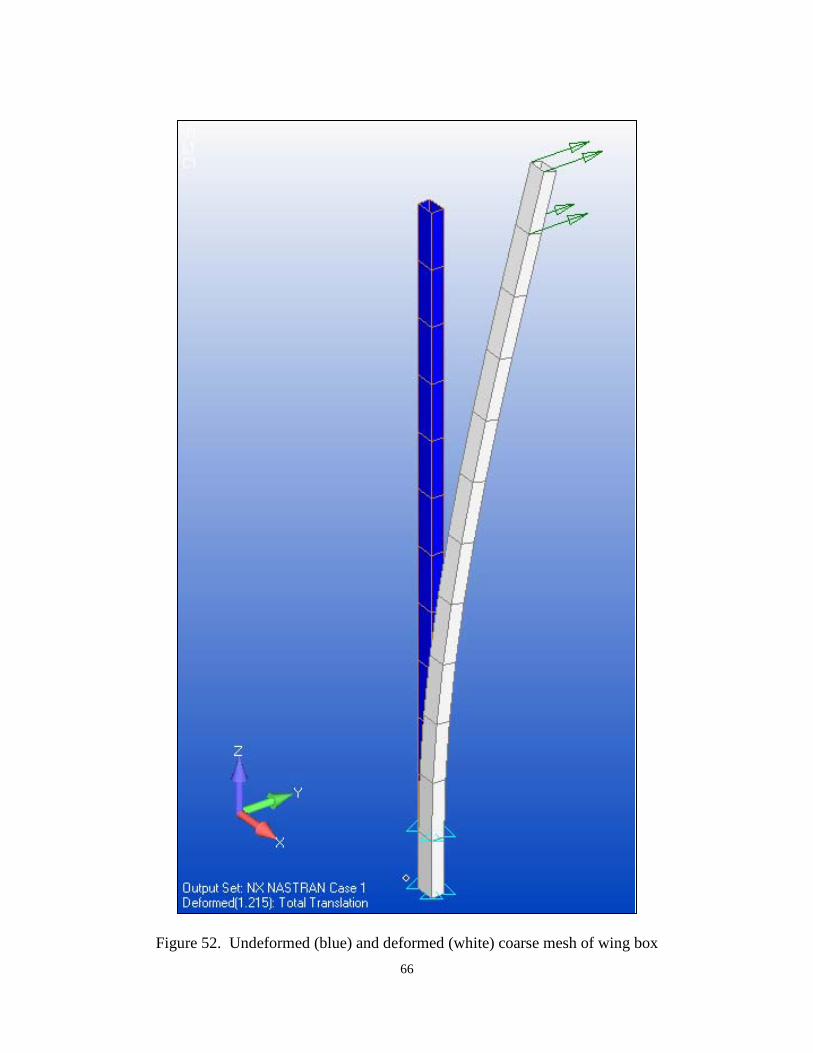
66
Figure 52. Undeformed (blue) and deformed (white) coarse mesh of wing box
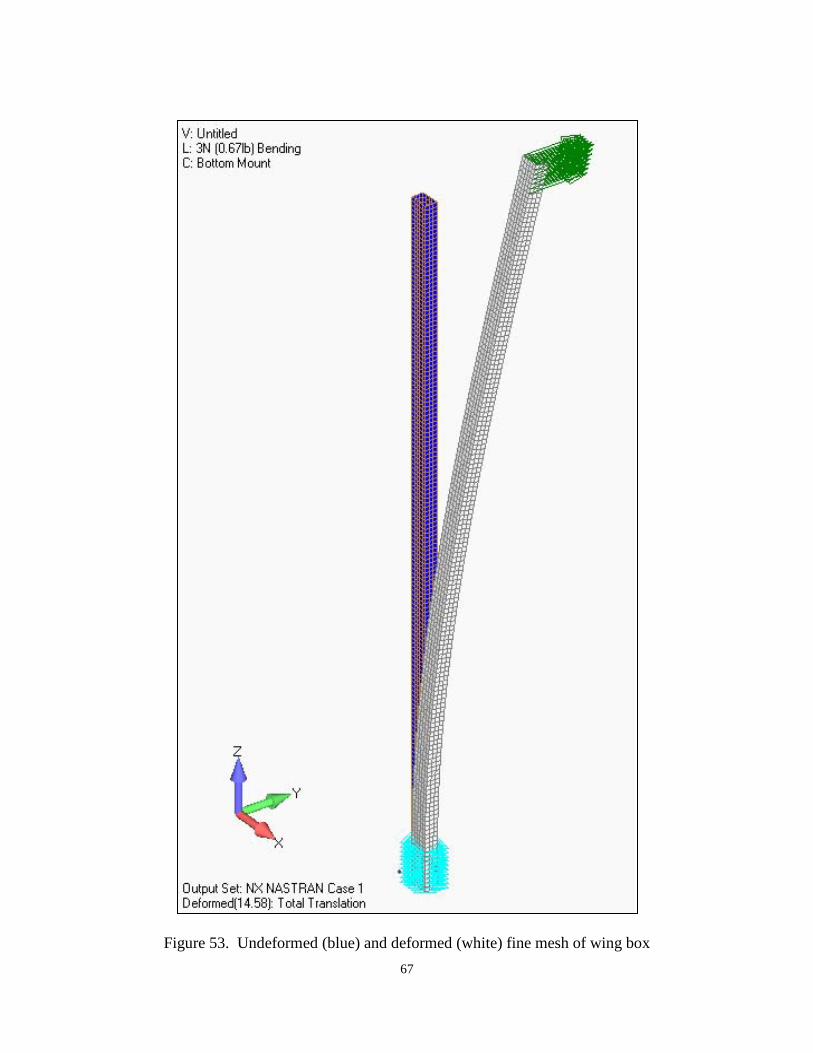
67
Figure 53. Undeformed (blue) and deformed (white) fine mesh of wing box
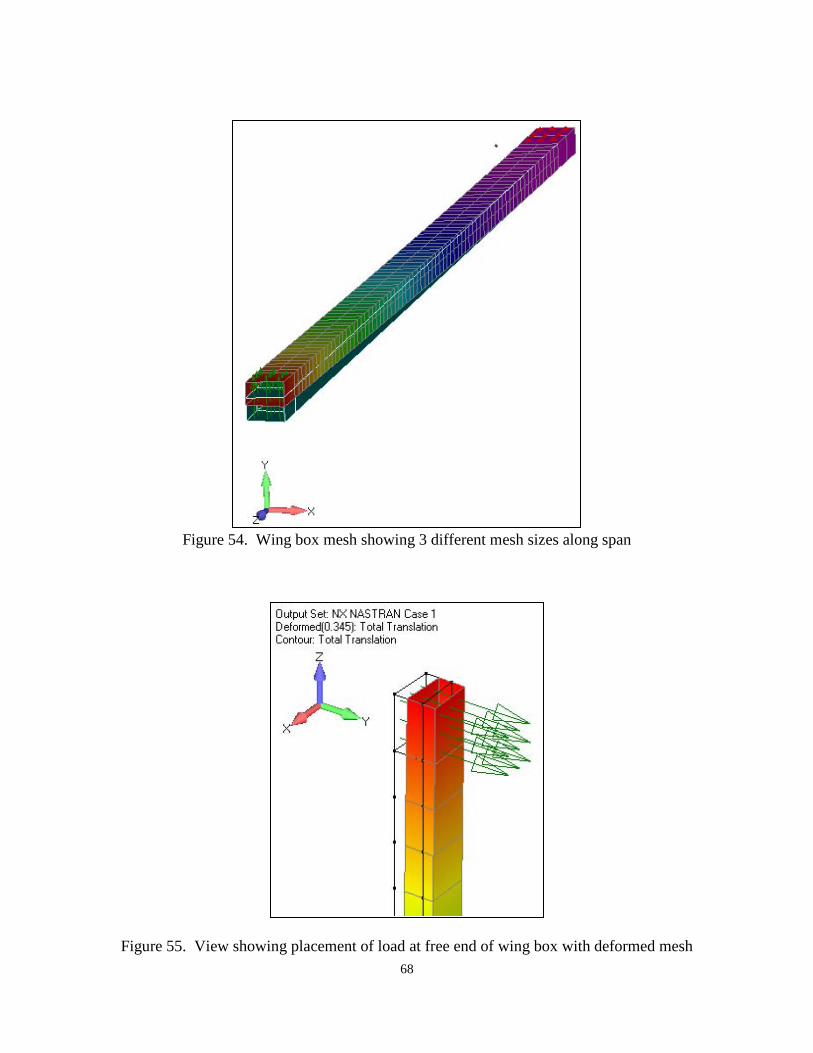
68
Figure 54. Wing box mesh showing 3 different mesh sizes along span
Figure 55. View showing placement of load at free end of wing box with deformed mesh
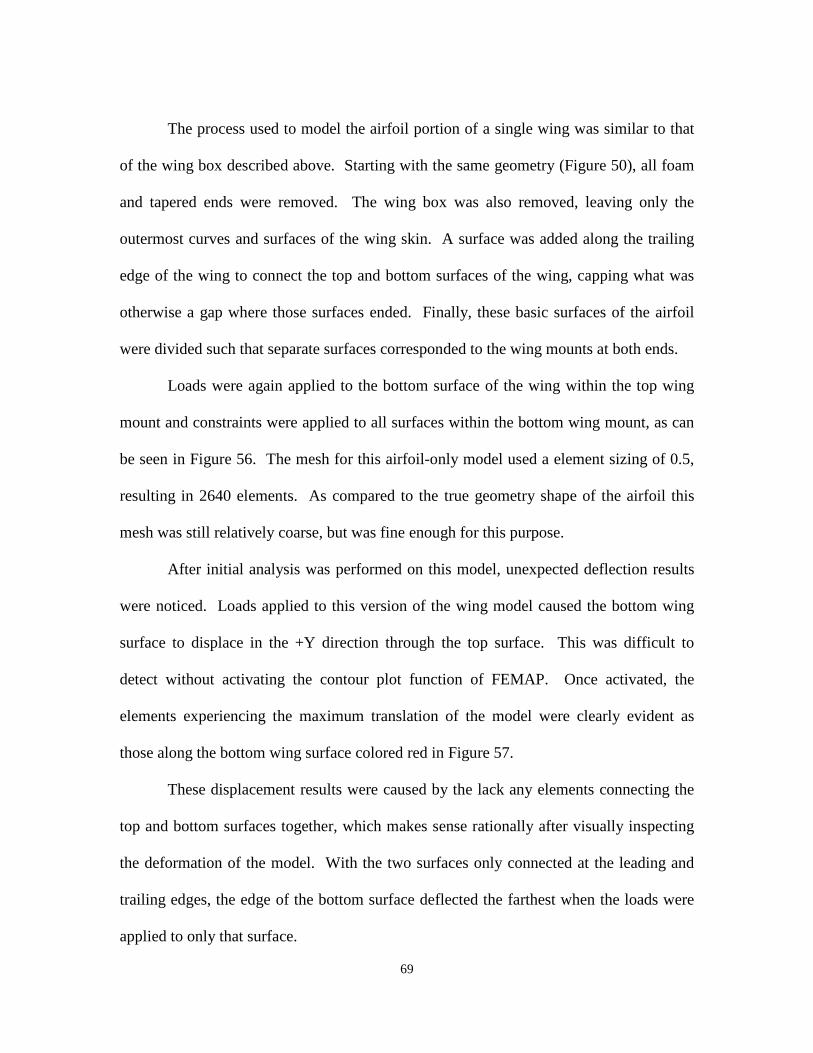
69
The process used to model the airfoil portion of a single wing was similar to that
of the wing box described above. Starting with the same geometry (Figure 50), all foam
and tapered ends were removed. The wing box was also removed, leaving only the
outermost curves and surfaces of the wing skin. A surface was added along the trailing
edge of the wing to connect the top and bottom surfaces of the wing, capping what was
otherwise a gap where those surfaces ended. Finally, these basic surfaces of the airfoil
were divided such that separate surfaces corresponded to the wing mounts at both ends.
Loads were again applied to the bottom surface of the wing within the top wing
mount and constraints were applied to all surfaces within the bottom wing mount, as can
be seen in Figure 56. The mesh for this airfoil-only model used a element sizing of 0.5,
resulting in 2640 elements. As compared to the true geometry shape of the airfoil this
mesh was still relatively coarse, but was fine enough for this purpose.
After initial analysis was performed on this model, unexpected deflection results
were noticed. Loads applied to this version of the wing model caused the bottom wing
surface to displace in the +Y direction through the top surface. This was difficult to
detect without activating the contour plot function of FEMAP. Once activated, the
elements experiencing the maximum translation of the model were clearly evident as
those along the bottom wing surface colored red in Figure 57.
These displacement results were caused by the lack any elements connecting the
top and bottom surfaces together, which makes sense rationally after visually inspecting
the deformation of the model. With the two surfaces only connected at the leading and
trailing edges, the edge of the bottom surface deflected the farthest when the loads were
applied to only that surface.
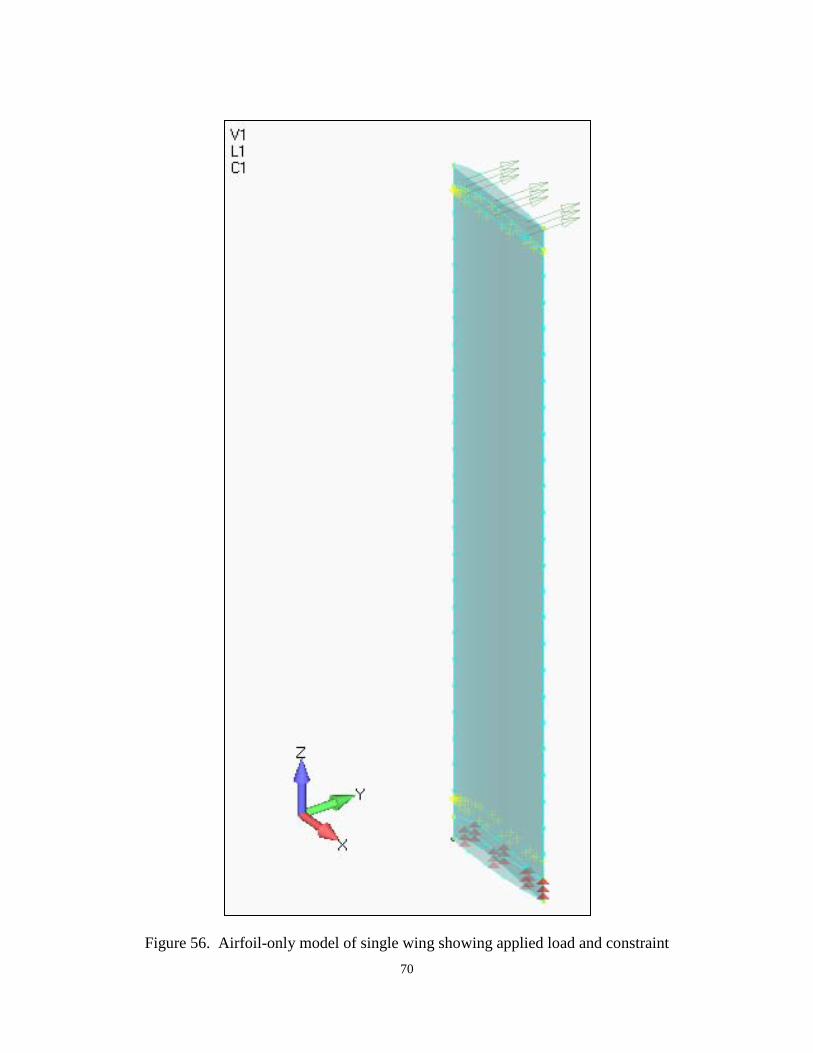
70
Figure 56. Airfoil-only model of single wing showing applied load and constraint
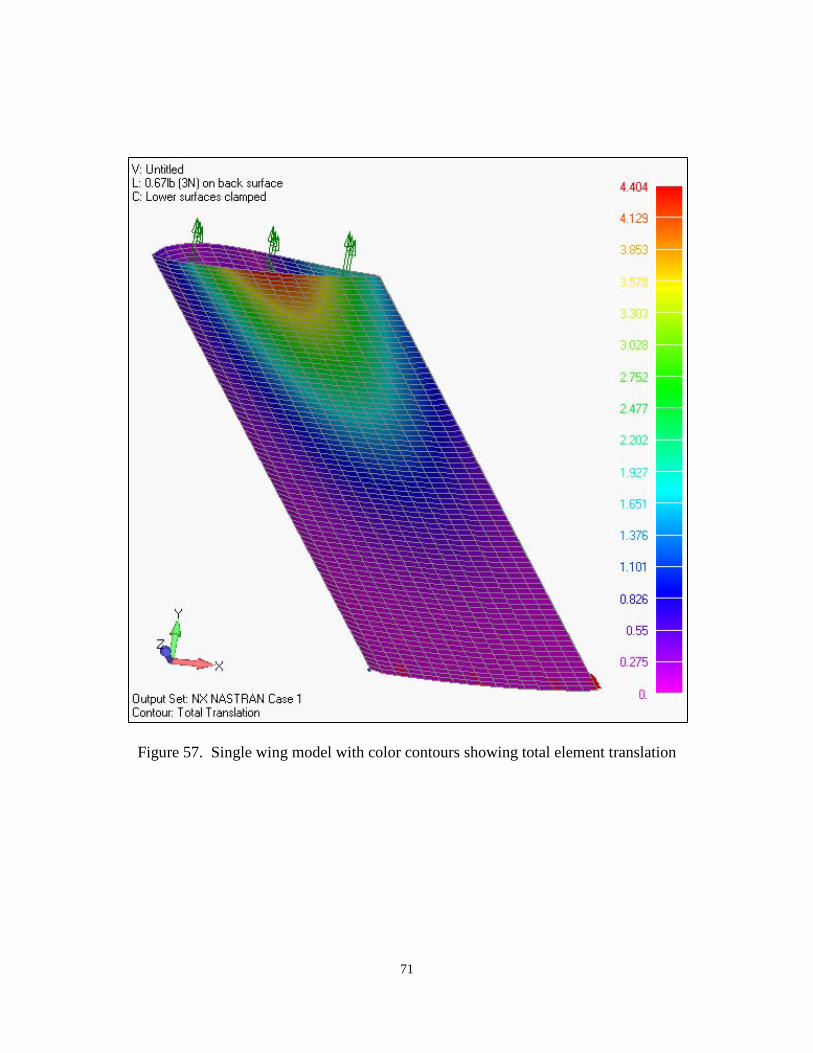
71
Figure 57. Single wing model with color contours showing total element translation
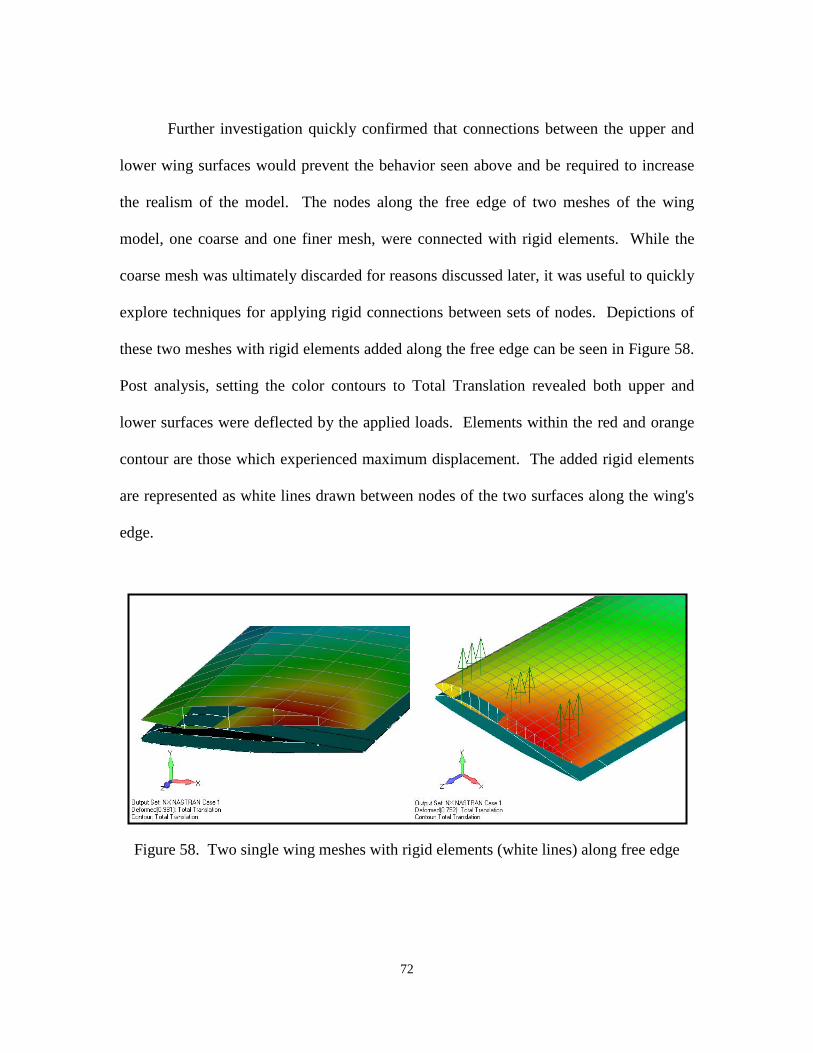
72
Further investigation quickly confirmed that connections between the upper and
lower wing surfaces would prevent the behavior seen above and be required to increase
the realism of the model. The nodes along the free edge of two meshes of the wing
model, one coarse and one finer mesh, were connected with rigid elements. While the
coarse mesh was ultimately discarded for reasons discussed later, it was useful to quickly
explore techniques for applying rigid connections between sets of nodes. Depictions of
these two meshes with rigid elements added along the free edge can be seen in Figure 58.
Post analysis, setting the color contours to Total Translation revealed both upper and
lower surfaces were deflected by the applied loads. Elements within the red and orange
contour are those which experienced maximum displacement. The added rigid elements
are represented as white lines drawn between nodes of the two surfaces along the wing's
edge.
Figure 58. Two single wing meshes with rigid elements (white lines) along free edge
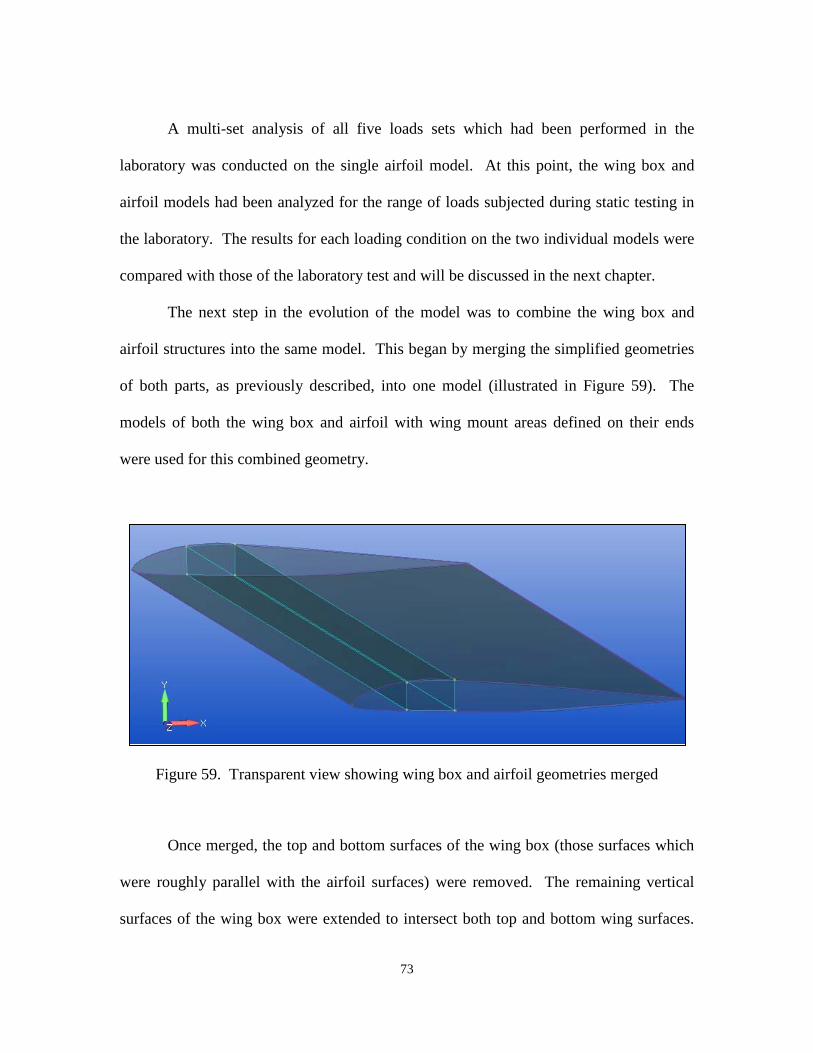
73
A multi-set analysis of all five loads sets which had been performed in the
laboratory was conducted on the single airfoil model. At this point, the wing box and
airfoil models had been analyzed for the range of loads subjected during static testing in
the laboratory. The results for each loading condition on the two individual models were
compared with those of the laboratory test and will be discussed in the next chapter.
The next step in the evolution of the model was to combine the wing box and
airfoil structures into the same model. This began by merging the simplified geometries
of both parts, as previously described, into one model (illustrated in Figure 59). The
models of both the wing box and airfoil with wing mount areas defined on their ends
were used for this combined geometry.
Figure 59. Transparent view showing wing box and airfoil geometries merged
Once merged, the top and bottom surfaces of the wing box (those surfaces which
were roughly parallel with the airfoil surfaces) were removed. The remaining vertical
surfaces of the wing box were extended to intersect both top and bottom wing surfaces.
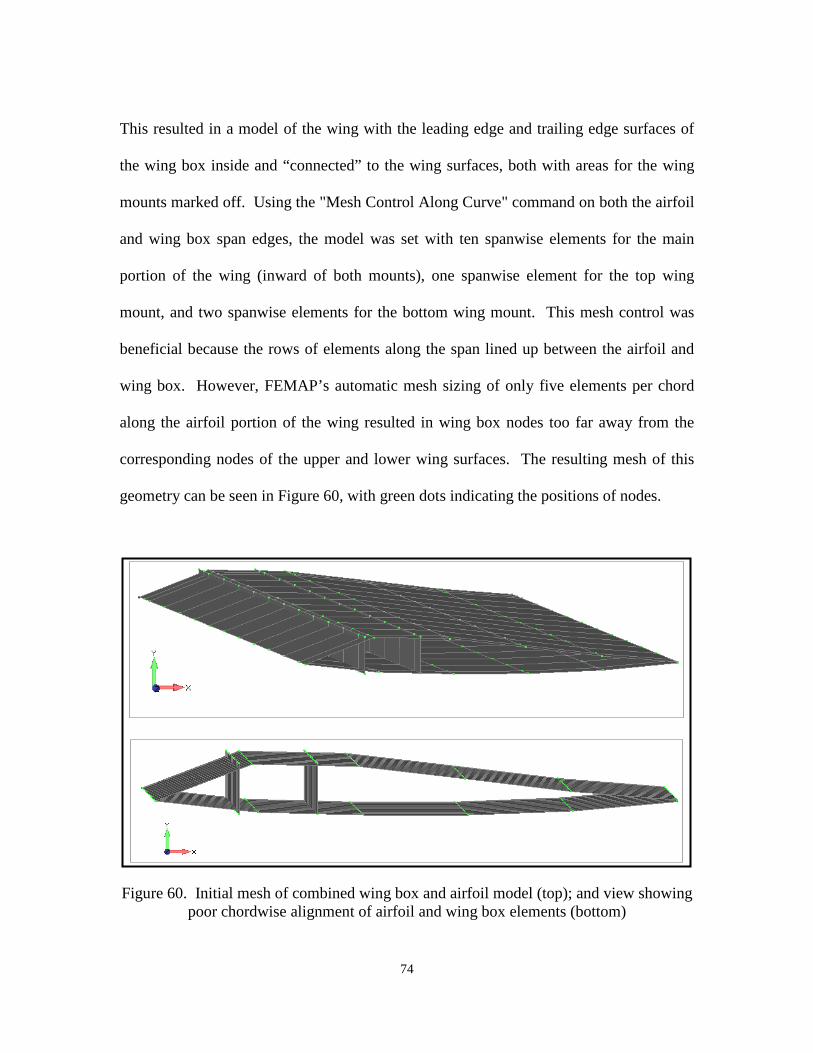
74
This resulted in a model of the wing with the leading edge and trailing edge surfaces of
the wing box inside and “connected” to the wing surfaces, both with areas for the wing
mounts marked off. Using the "Mesh Control Along Curve" command on both the airfoil
and wing box span edges, the model was set with ten spanwise elements for the main
portion of the wing (inward of both mounts), one spanwise element for the top wing
mount, and two spanwise elements for the bottom wing mount. This mesh control was
beneficial because the rows of elements along the span lined up between the airfoil and
wing box. However, FEMAP’s automatic mesh sizing of only five elements per chord
along the airfoil portion of the wing resulted in wing box nodes too far away from the
corresponding nodes of the upper and lower wing surfaces. The resulting mesh of this
geometry can be seen in Figure 60, with green dots indicating the positions of nodes.
Figure 60. Initial mesh of combined wing box and airfoil model (top); and view showing poor chordwise alignment of airfoil and wing box elements (bottom)
75
The alignment between wing box and airfoil nodes improved greatly by adjusting
the chordwise mesh control to 50 elements. This mesh resulted in a maximum distance
of 0.06 in. between any wing box node and wing surface node along the cross section.
While this was sufficiently close along the wing box portion of the wing chord, it was
noted that nodes at the trailing edge of the wing surfaces were less than 0.06 in. apart. If
all nodes within 0.06 in. of each other were merged together this would have changed the
mesh at the trailing edge to a sharp edge, which was deemed undesirable at this stage.
Instead, only those nodes near the wing box area of the model were selected and merged
– 56 nodes in total.
With an approximate wing box now successfully added to the airfoil-only model,
an initial 3N test load was applied to the wing mount surface at the free end of the wing
and the model was analyzed. As anticipated, the resulting deflection was concentrated
along the trailing edge half of the wing (see Figure 61). This behavior seemed
appropriate for a model consisting of only wing skin and wing box elements. Without
rigid links between the upper and lower wing surfaces, the lower surface of the wing
(where the load was applied) again deflected through the upper wing surface (see Figure
62). Adding rigid links between the wing surfaces forward and aft of the wing box, as
shown in Figure 63, once again prevented this unrealistic deformation.
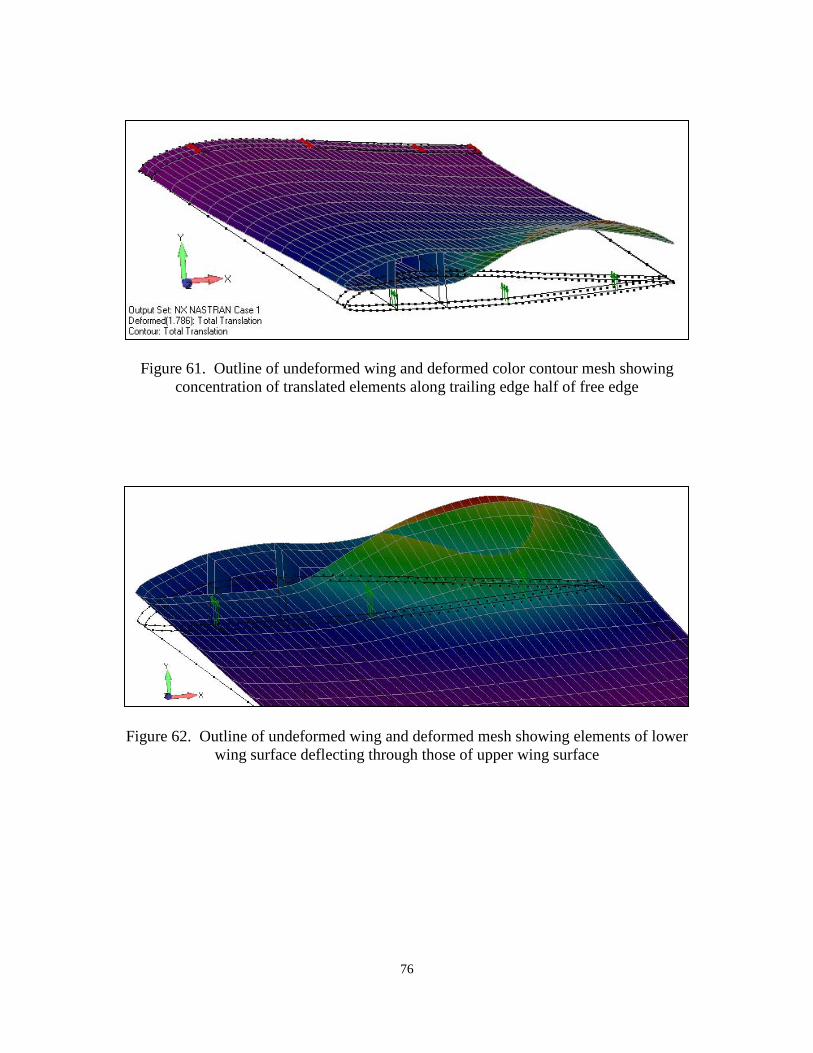
76
Figure 61. Outline of undeformed wing and deformed color contour mesh showing concentration of translated elements along trailing edge half of free edge
Figure 62. Outline of undeformed wing and deformed mesh showing elements of lower wing surface deflecting through those of upper wing surface
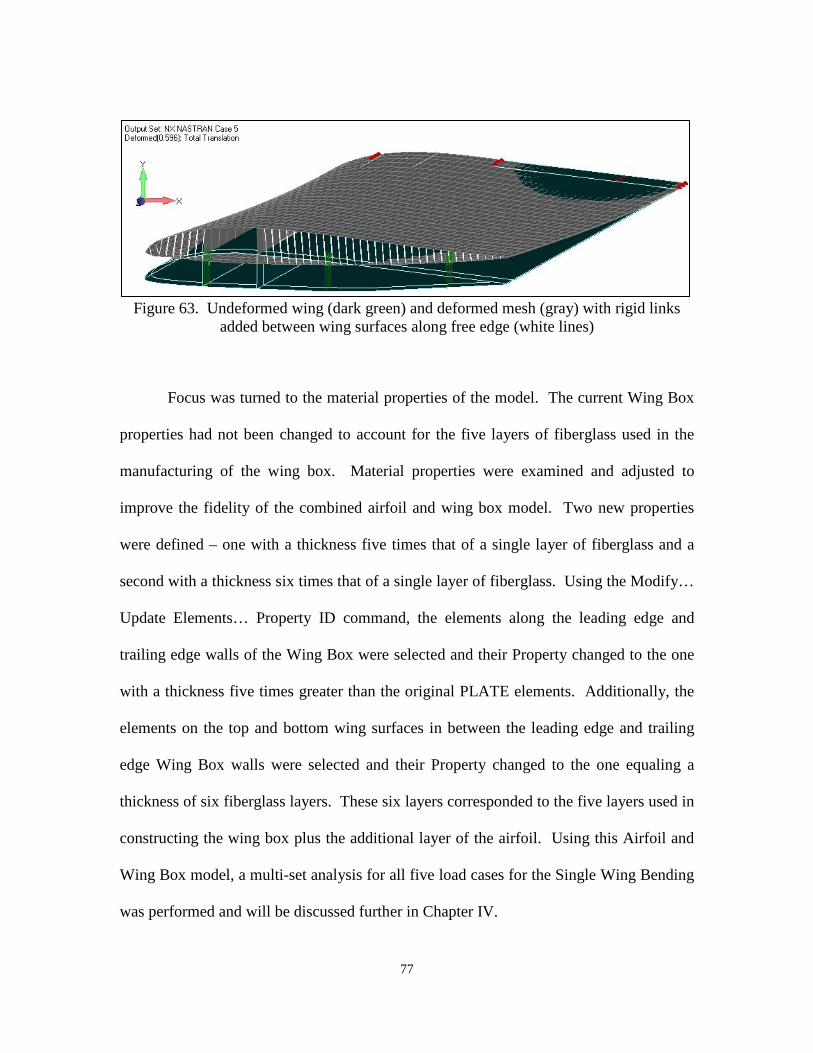
77
Figure 63. Undeformed wing (dark green) and deformed mesh (gray) with rigid links
added between wing surfaces along free edge (white lines)
Focus was turned to the material properties of the model. The current Wing Box
properties had not been changed to account for the five layers of fiberglass used in the
manufacturing of the wing box. Material properties were examined and adjusted to
improve the fidelity of the combined airfoil and wing box model. Two new properties
were defined – one with a thickness five times that of a single layer of fiberglass and a
second with a thickness six times that of a single layer of fiberglass. Using the Modify…
Update Elements… Property ID command, the elements along the leading edge and
trailing edge walls of the Wing Box were selected and their Property changed to the one
with a thickness five times greater than the original PLATE elements. Additionally, the
elements on the top and bottom wing surfaces in between the leading edge and trailing
edge Wing Box walls were selected and their Property changed to the one equaling a
thickness of six fiberglass layers. These six layers corresponded to the five layers used in
constructing the wing box plus the additional layer of the airfoil. Using this Airfoil and
Wing Box model, a multi-set analysis for all five load cases for the Single Wing Bending
was performed and will be discussed further in Chapter IV.
78
This iteration of the model was still a relatively simple approximation. It did not
accurately model the true manufacturing of the wing structure, where a fully constructed
wing box made of five layers of fiberglass and filled with foam was then wrapped inside
the single-layer airfoil with foam forward and aft of the wing box. The method described
here almost certainly created a more perfect connection than actually resulted during
construction of the wing. However, any errors produced by this difference were assumed
to be small and therefore neglected.
The next step to improve the wing model was to add solid foam elements inside
the hollow structure of the wing, including both the wing box and areas inside the airfoil
forward and aft of the wing box. This process was started by going back to the simple
model of only the wing box. Solid geometry was added to fill the inside of the wing box
cross section. The areas at each end of the wing box within the wing mount sections
were left hollow, as was done 1.25 in. inward from each end in the physical construction
of each wing box section to allow room for the wing joiner to fit. This variant of the
model can be seen in Figure 64. The mesh control was kept the same as the previously
meshed walls of the wing box, producing solid elements with the same spacing as the
plate elements of the wing box. The solid foam portion of the model was meshed using
HexMesh Solids. All corresponding nodes along the meshed solid foam were coincident
with those of the wing box wall and were subsequently merged. Finally, once individual
test analyses had been conducted to check its overall behavior, a multi-load analysis was
performed on this most complete version of the foam-filled wing box model. Figure 65
depicts a view of one of the results from this analysis.
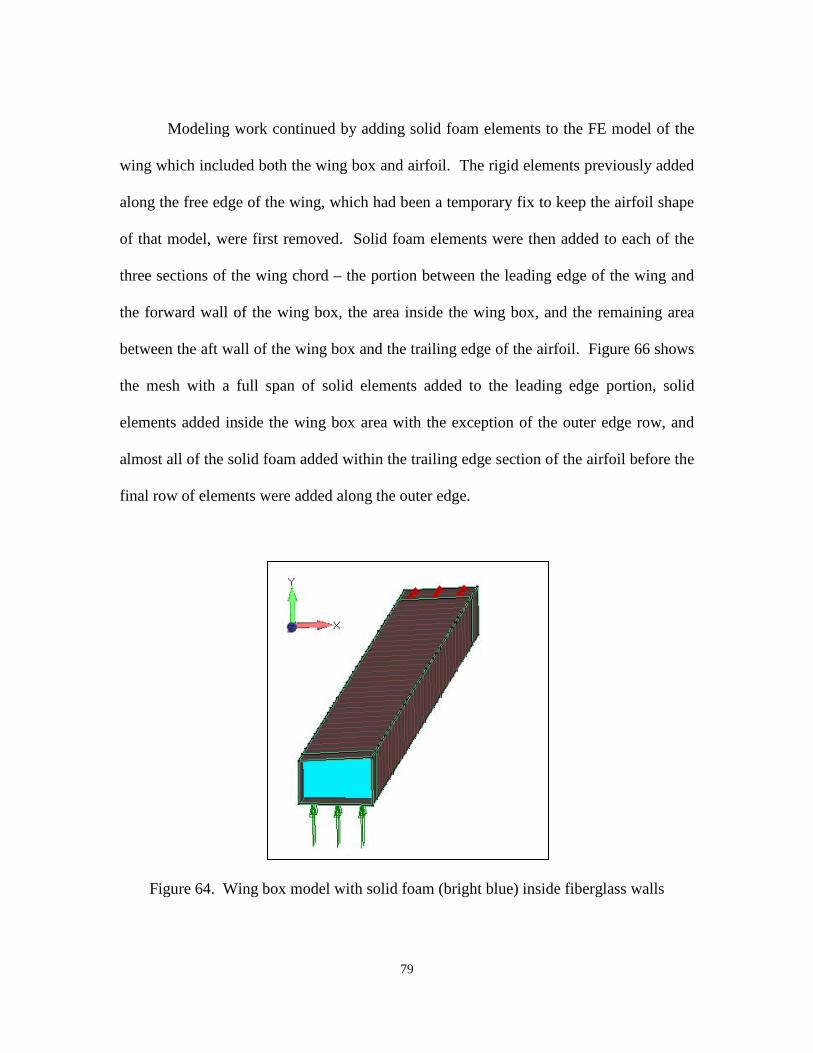
79
Modeling work continued by adding solid foam elements to the FE model of the
wing which included both the wing box and airfoil. The rigid elements previously added
along the free edge of the wing, which had been a temporary fix to keep the airfoil shape
of that model, were first removed. Solid foam elements were then added to each of the
three sections of the wing chord – the portion between the leading edge of the wing and
the forward wall of the wing box, the area inside the wing box, and the remaining area
between the aft wall of the wing box and the trailing edge of the airfoil. Figure 66 shows
the mesh with a full span of solid elements added to the leading edge portion, solid
elements added inside the wing box area with the exception of the outer edge row, and
almost all of the solid foam added within the trailing edge section of the airfoil before the
final row of elements were added along the outer edge.
Figure 64. Wing box model with solid foam (bright blue) inside fiberglass walls
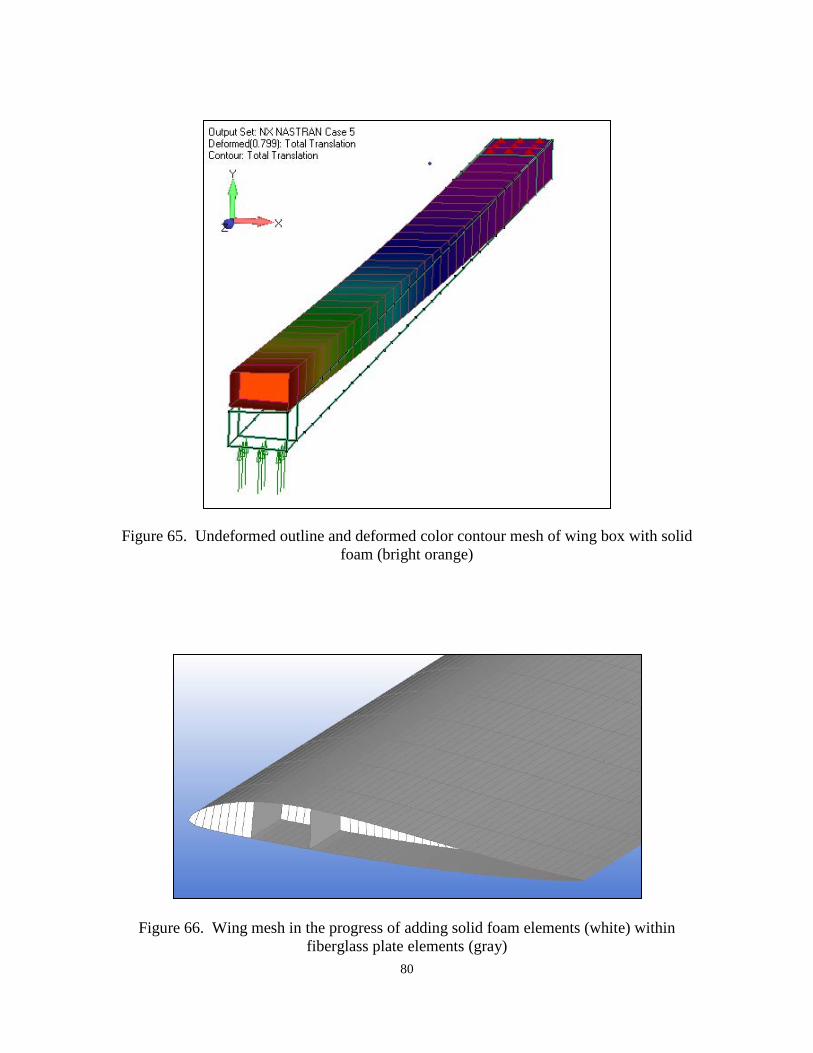
80
Figure 65. Undeformed outline and deformed color contour mesh of wing box with solid foam (bright orange)
Figure 66. Wing mesh in the progress of adding solid foam elements (white) within fiberglass plate elements (gray)
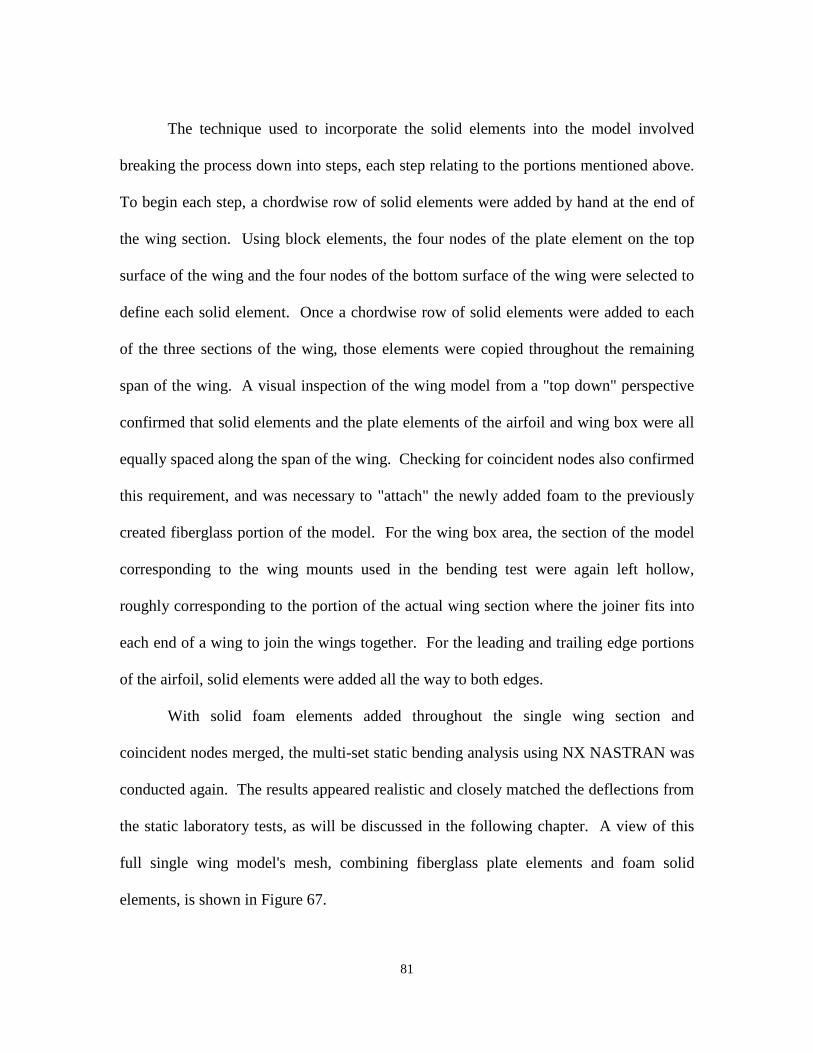
81
The technique used to incorporate the solid elements into the model involved
breaking the process down into steps, each step relating to the portions mentioned above.
To begin each step, a chordwise row of solid elements were added by hand at the end of
the wing section. Using block elements, the four nodes of the plate element on the top
surface of the wing and the four nodes of the bottom surface of the wing were selected to
define each solid element. Once a chordwise row of solid elements were added to each
of the three sections of the wing, those elements were copied throughout the remaining
span of the wing. A visual inspection of the wing model from a "top down" perspective
confirmed that solid elements and the plate elements of the airfoil and wing box were all
equally spaced along the span of the wing. Checking for coincident nodes also confirmed
this requirement, and was necessary to "attach" the newly added foam to the previously
created fiberglass portion of the model. For the wing box area, the section of the model
corresponding to the wing mounts used in the bending test were again left hollow,
roughly corresponding to the portion of the actual wing section where the joiner fits into
each end of a wing to join the wings together. For the leading and trailing edge portions
of the airfoil, solid elements were added all the way to both edges.
With solid foam elements added throughout the single wing section and
coincident nodes merged, the multi-set static bending analysis using NX NASTRAN was
conducted again. The results appeared realistic and closely matched the deflections from
the static laboratory tests, as will be discussed in the following chapter. A view of this
full single wing model's mesh, combining fiberglass plate elements and foam solid
elements, is shown in Figure 67.
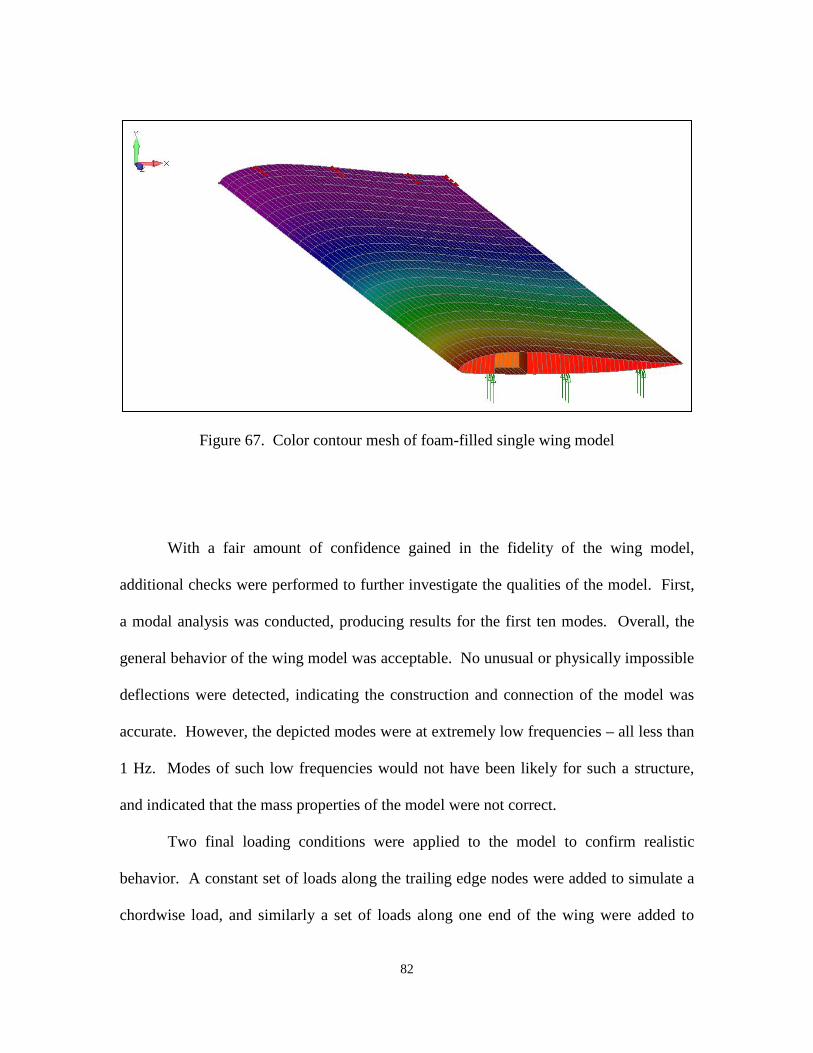
82
Figure 67. Color contour mesh of foam-filled single wing model
With a fair amount of confidence gained in the fidelity of the wing model,
additional checks were performed to further investigate the qualities of the model. First,
a modal analysis was conducted, producing results for the first ten modes. Overall, the
general behavior of the wing model was acceptable. No unusual or physically impossible
deflections were detected, indicating the construction and connection of the model was
accurate. However, the depicted modes were at extremely low frequencies – all less than
1 Hz. Modes of such low frequencies would not have been likely for such a structure,
and indicated that the mass properties of the model were not correct.
Two final loading conditions were applied to the model to confirm realistic
behavior. A constant set of loads along the trailing edge nodes were added to simulate a
chordwise load, and similarly a set of loads along one end of the wing were added to
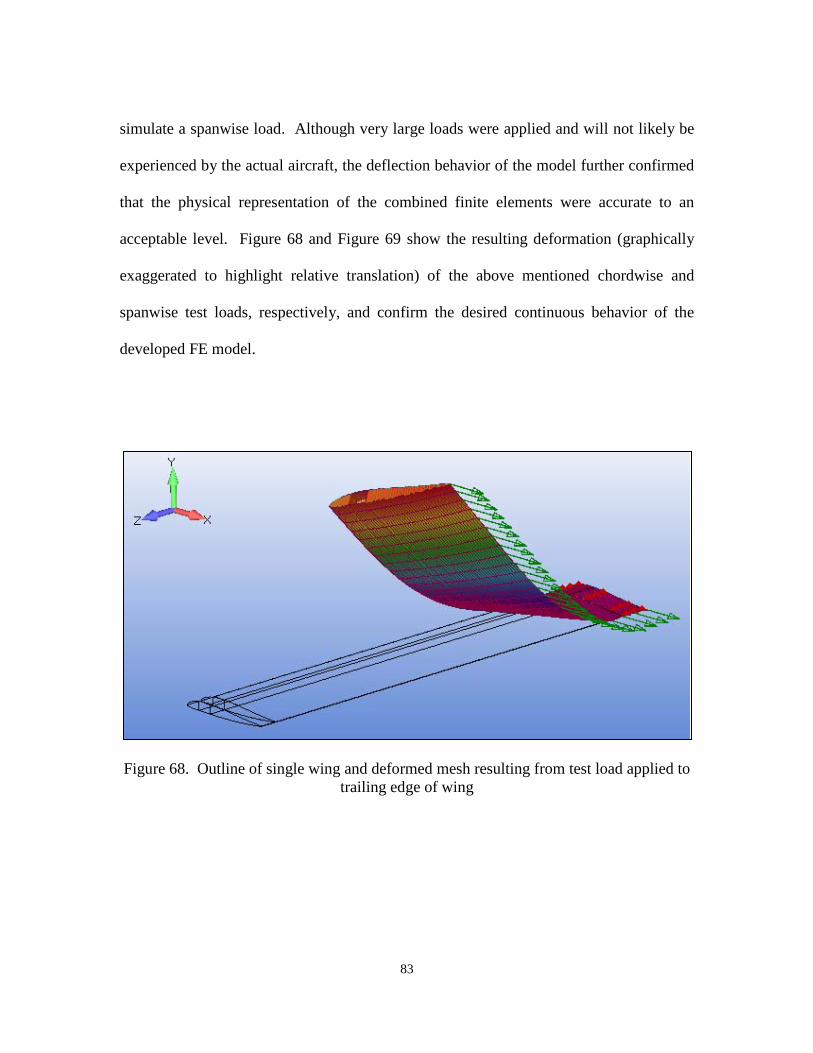
83
simulate a spanwise load. Although very large loads were applied and will not likely be
experienced by the actual aircraft, the deflection behavior of the model further confirmed
that the physical representation of the combined finite elements were accurate to an
acceptable level. Figure 68 and Figure 69 show the resulting deformation (graphically
exaggerated to highlight relative translation) of the above mentioned chordwise and
spanwise test loads, respectively, and confirm the desired continuous behavior of the
developed FE model.
Figure 68. Outline of single wing and deformed mesh resulting from test load applied to trailing edge of wing
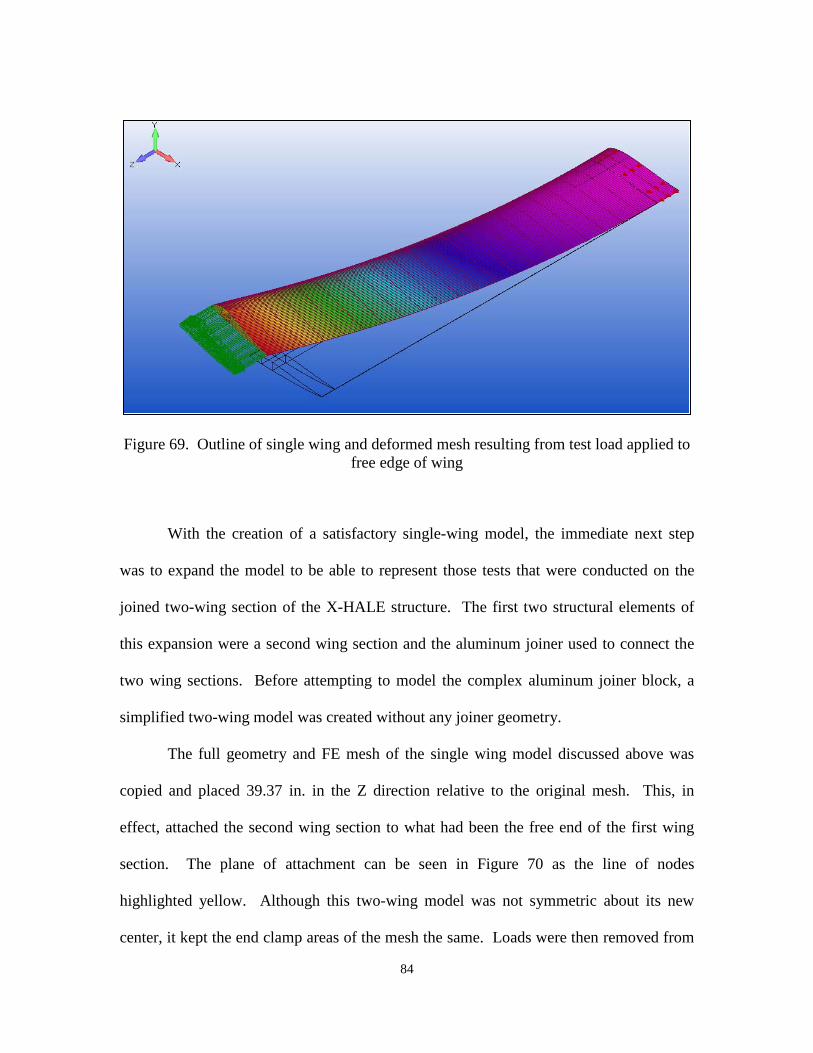
84
Figure 69. Outline of single wing and deformed mesh resulting from test load applied to free edge of wing
With the creation of a satisfactory single-wing model, the immediate next step
was to expand the model to be able to represent those tests that were conducted on the
joined two-wing section of the X-HALE structure. The first two structural elements of
this expansion were a second wing section and the aluminum joiner used to connect the
two wing sections. Before attempting to model the complex aluminum joiner block, a
simplified two-wing model was created without any joiner geometry.
The full geometry and FE mesh of the single wing model discussed above was
copied and placed 39.37 in. in the Z direction relative to the original mesh. This, in
effect, attached the second wing section to what had been the free end of the first wing
section. The plane of attachment can be seen in Figure 70 as the line of nodes
highlighted yellow. Although this two-wing model was not symmetric about its new
center, it kept the end clamp areas of the mesh the same. Loads were then removed from
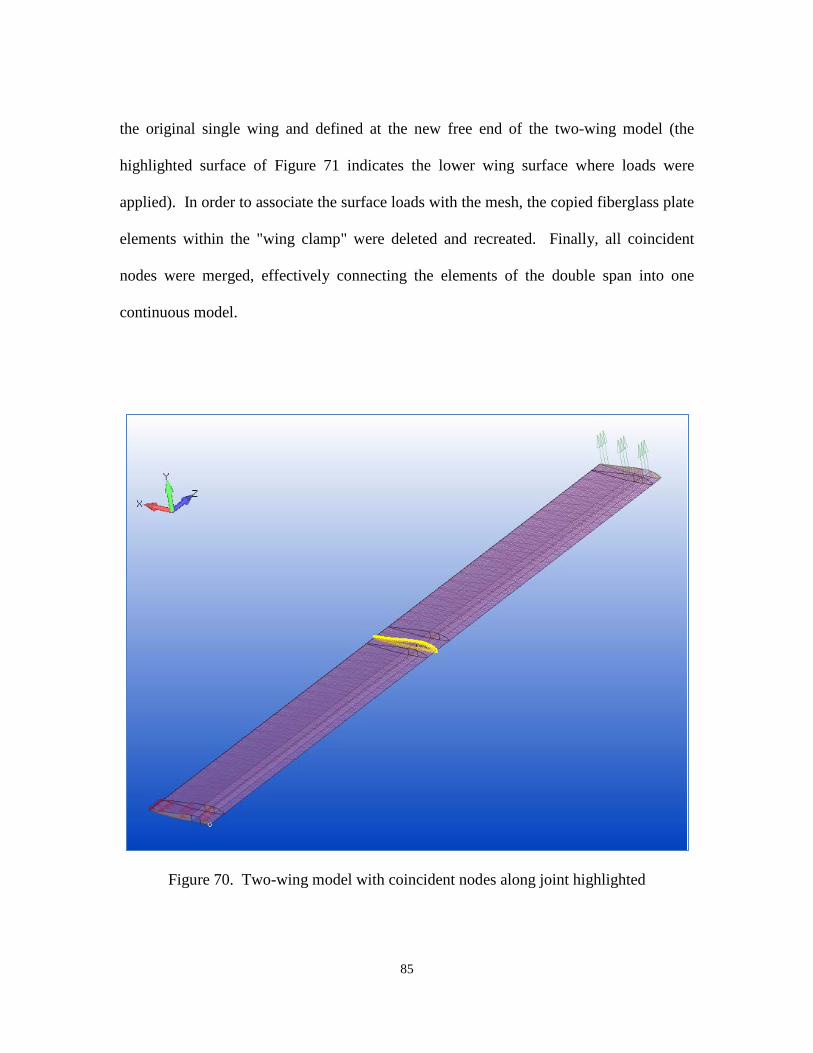
85
the original single wing and defined at the new free end of the two-wing model (the
highlighted surface of Figure 71 indicates the lower wing surface where loads were
applied). In order to associate the surface loads with the mesh, the copied fiberglass plate
elements within the "wing clamp" were deleted and recreated. Finally, all coincident
nodes were merged, effectively connecting the elements of the double span into one
continuous model.
Figure 70. Two-wing model with coincident nodes along joint highlighted
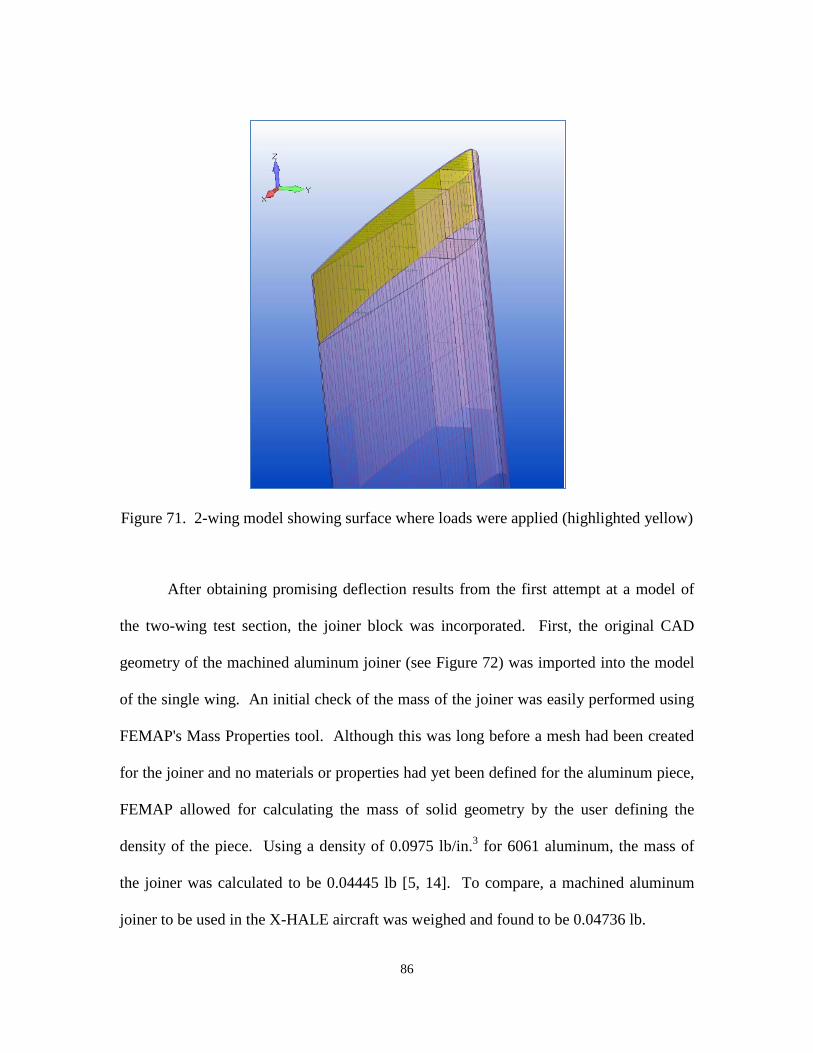
86
Figure 71. 2-wing model showing surface where loads were applied (highlighted yellow)
After obtaining promising deflection results from the first attempt at a model of
the two-wing test section, the joiner block was incorporated. First, the original CAD
geometry of the machined aluminum joiner (see Figure 72) was imported into the model
of the single wing. An initial check of the mass of the joiner was easily performed using
FEMAP's Mass Properties tool. Although this was long before a mesh had been created
for the joiner and no materials or properties had yet been defined for the aluminum piece,
FEMAP allowed for calculating the mass of solid geometry by the user defining the
density of the piece. Using a density of 0.0975 lb/in.3 for 6061 aluminum, the mass of
the joiner was calculated to be 0.04445 lb [5, 14]. To compare, a machined aluminum
joiner to be used in the X-HALE aircraft was weighed and found to be 0.04736 lb.
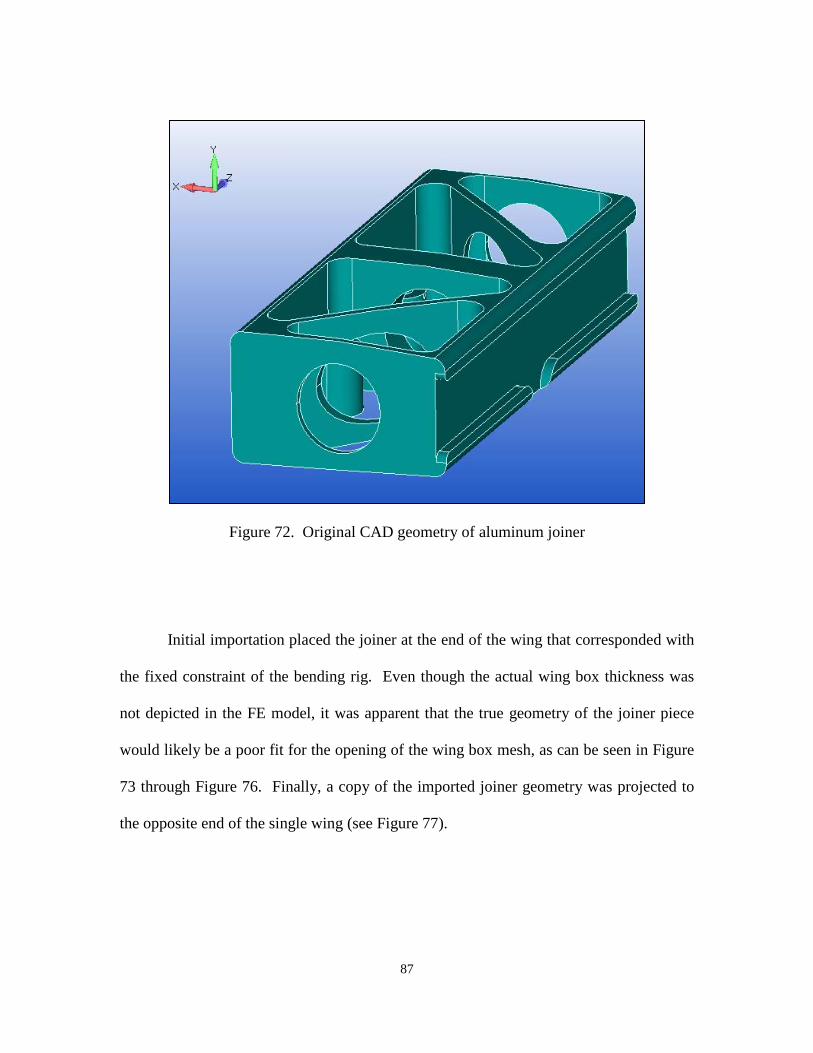
87
Figure 72. Original CAD geometry of aluminum joiner
Initial importation placed the joiner at the end of the wing that corresponded with
the fixed constraint of the bending rig. Even though the actual wing box thickness was
not depicted in the FE model, it was apparent that the true geometry of the joiner piece
would likely be a poor fit for the opening of the wing box mesh, as can be seen in Figure
73 through Figure 76. Finally, a copy of the imported joiner geometry was projected to
the opposite end of the single wing (see Figure 77).
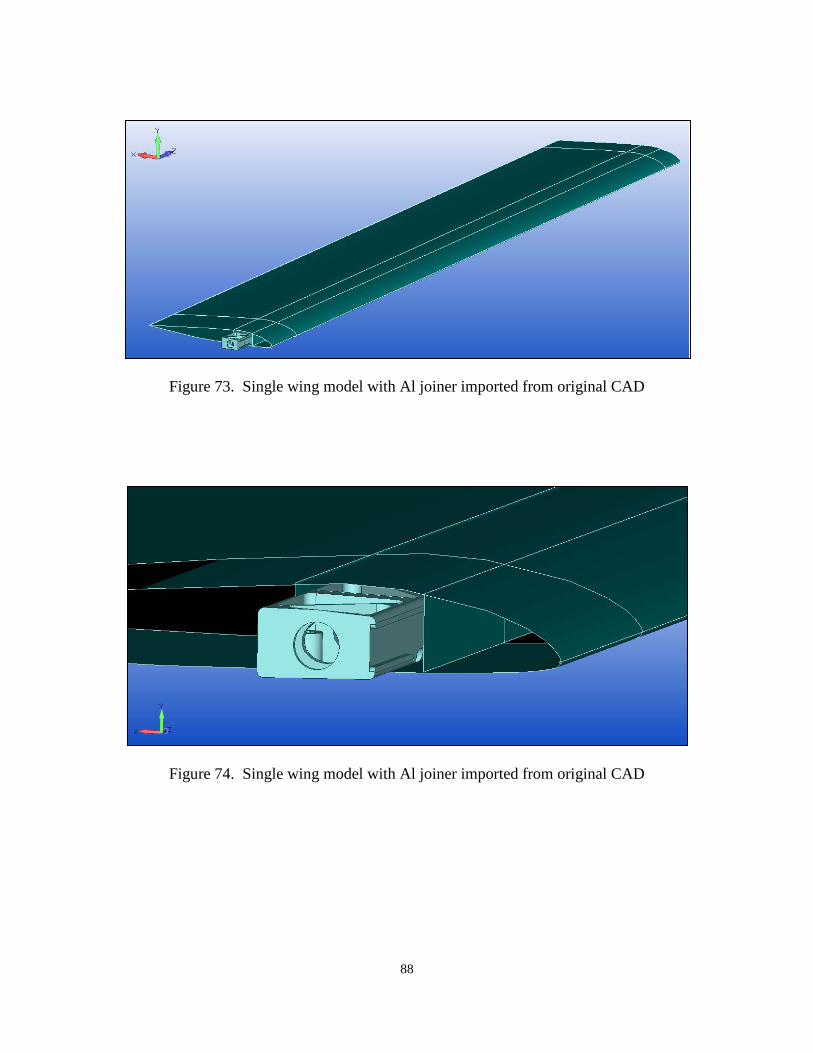
88
Figure 73. Single wing model with Al joiner imported from original CAD
Figure 74. Single wing model with Al joiner imported from original CAD
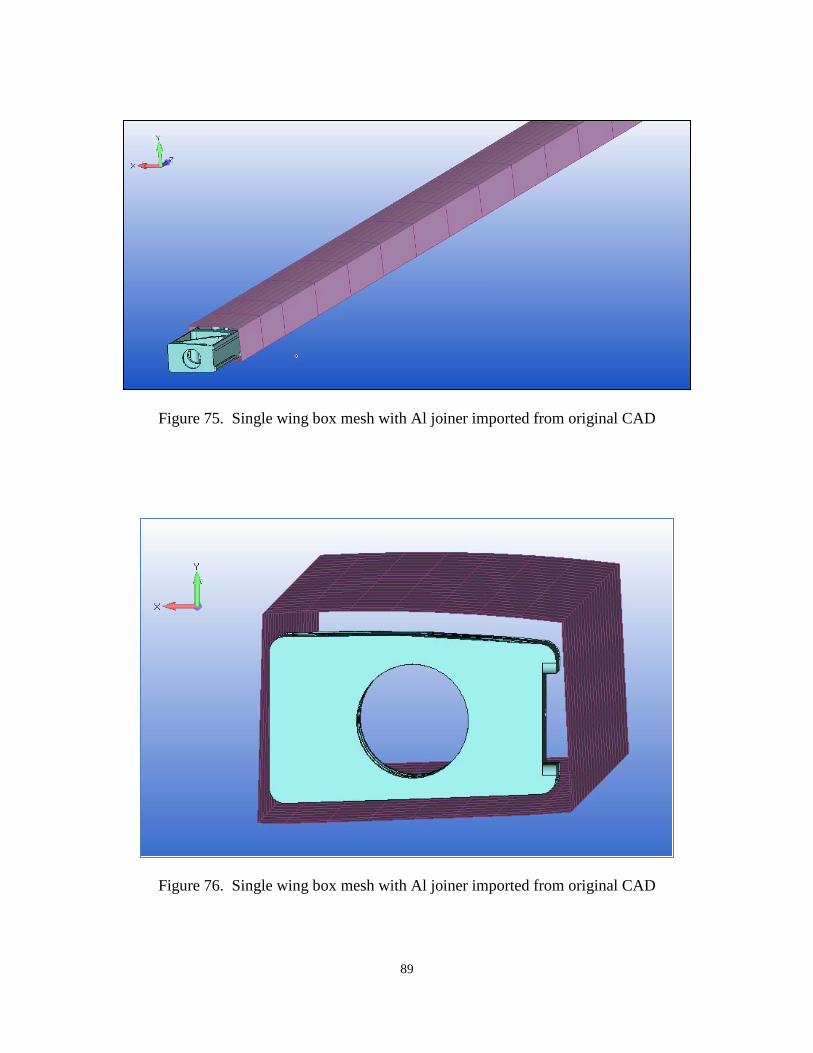
89
Figure 75. Single wing box mesh with Al joiner imported from original CAD
Figure 76. Single wing box mesh with Al joiner imported from original CAD
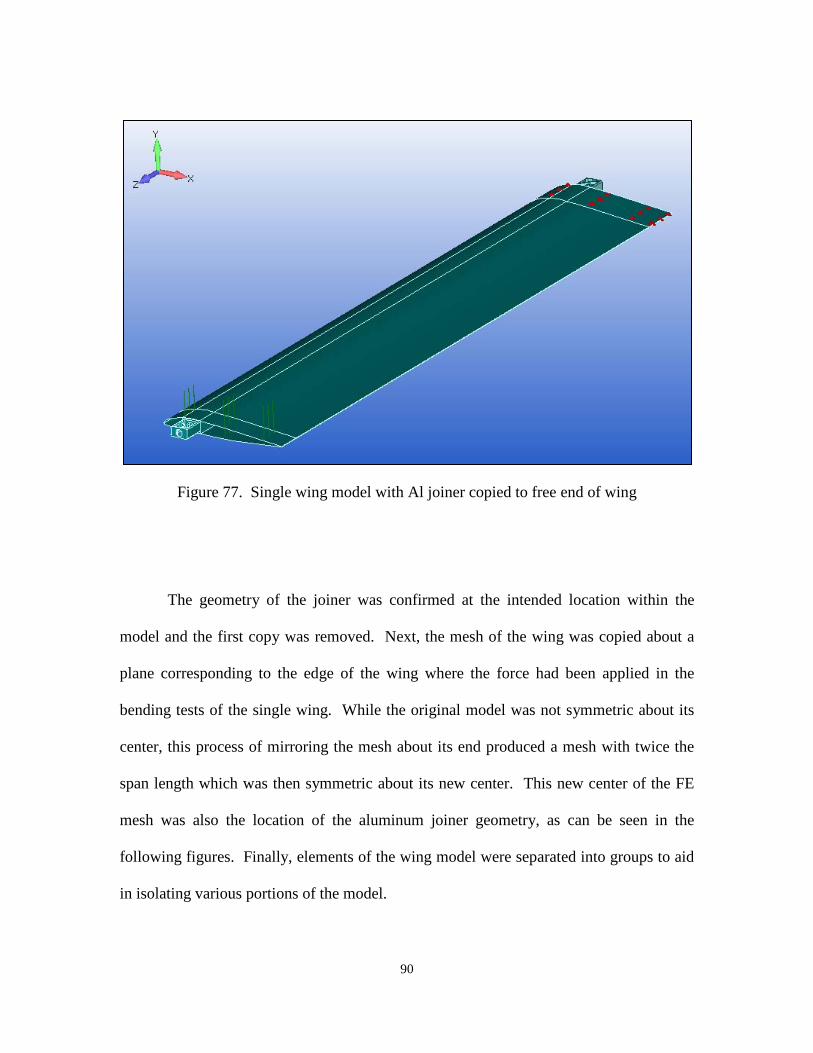
90
Figure 77. Single wing model with Al joiner copied to free end of wing
The geometry of the joiner was confirmed at the intended location within the
model and the first copy was removed. Next, the mesh of the wing was copied about a
plane corresponding to the edge of the wing where the force had been applied in the
bending tests of the single wing. While the original model was not symmetric about its
center, this process of mirroring the mesh about its end produced a mesh with twice the
span length which was then symmetric about its new center. This new center of the FE
mesh was also the location of the aluminum joiner geometry, as can be seen in the
following figures. Finally, elements of the wing model were separated into groups to aid
in isolating various portions of the model.
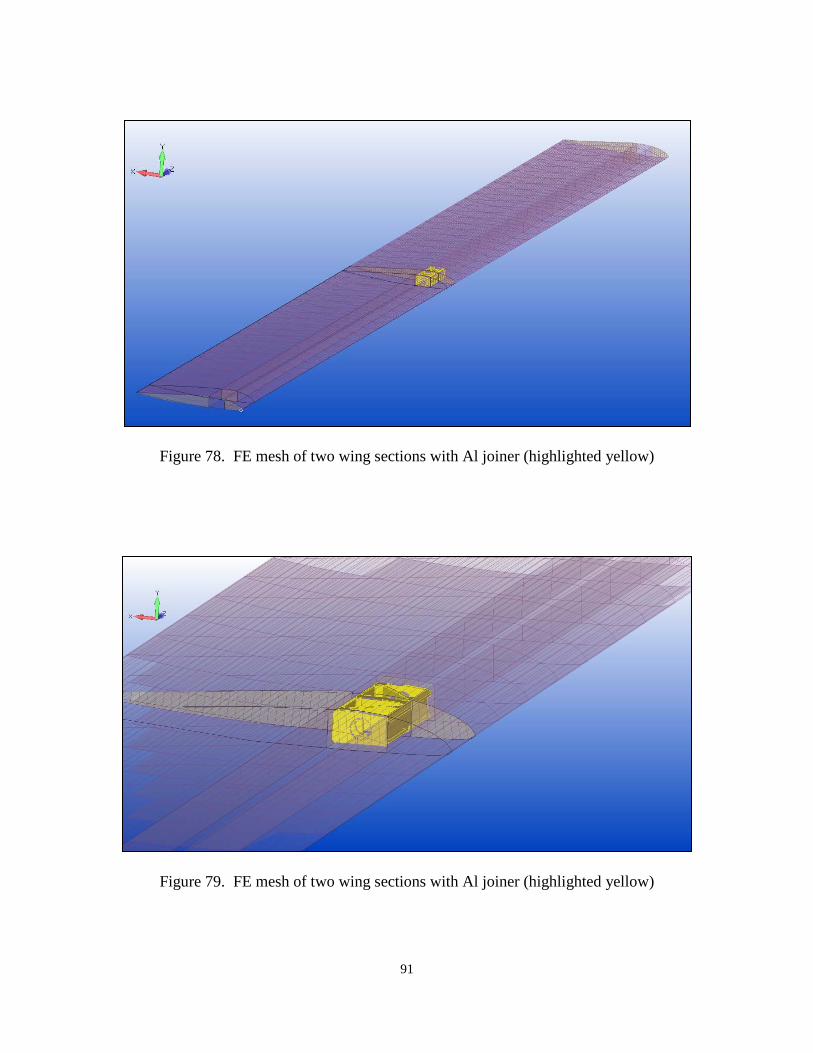
91
Figure 78. FE mesh of two wing sections with Al joiner (highlighted yellow)
Figure 79. FE mesh of two wing sections with Al joiner (highlighted yellow)
92
The finite element mesh for the single wing was refined to the point of
segmenting the end portions of the wing section such that the spanwise area contained
within the respective wing clamps of the bending rig could be defined as separate
surfaces and groups of elements. These areas also became the definition for those
portions of the wing box which had no solid foam elements within the interior cross
section, allowing for the ends of the wing sections into which the wing joiners are to be
inserted. For the purposes of accurately isolating, defining, and locating the forces and
constraints applied to the wing sections in the test rig, these segmented areas at the wing
ends worked quite well. However, the areas did not correctly depict the true openings of
the wing box. Specifically, the area where the bottom wing clamp constraint was defined
was noticeably larger than the true opening. Upon initially adding the wing joiner into
the model, these segmented areas did not provide ideal areas to represent the receptacle
portion of the wing box.
Lessons Learned.
Throughout the modeling work conducted here several specific techniques were
discovered which warrant mentioning. First among these was the choice to ultimately
define loads by applying them to model surfaces instead of nodes. Once the model was
created with areas representing those on the wing onto which the loads and constraints
were applied, this method prevented the user from having to determine which nodes and
elements of a mesh fit within a desired area. This was useful when adjusting the mesh
sizing within a model and prevented having to redistribute loads among newly created
93
nodes or elements after each adjustment. However, this method necessitated caution
when copying portions of the model, as the following discussion highlights.
When the modeling work progressed from the single wing to the two wings joined
together, much of the previously created model was merely copied and pasted alongside
the first half. While this effectively saved time and effort, the order for which items were
copied became quite important. The original geometry and mesh of the single wing
could be copied and placed in the new location. The loads used to bend the model could
also be moved by defining them on the new end of the double wing section. However,
since the copied mesh had not been meshed from the copied geometry, the loads that had
been placed on the end of the copied wing surface weren't actually associated with the
copied mesh underneath them. This portion of the new mesh where the loads were
applied had to be recreated in order to be effectively associated with the copied surface
and for the loads to have any effect on the finite element mesh.
A few limitations of the graphical interface were encountered during this effort.
When attempting to combine the wing box and airfoil models it had been assumed that
many key points or curves of the respective geometries were located at the same points
within the modeling environment. But what often appeared to the user as coincident
points or curves often were actually offset by a very small distance. Many different
techniques, some more successful than others, were attempted to join portions of the
model when necessary. Ultimately, realizing this difficulty early on in the modeling
process may allow the user to prepare and allocate suitable time and energy to address
these illusions.
94
In contrast to the above limitation, many graphical details were extremely helpful
in analyzing various behaviors of the model. Specifically, when the color contour plots
were activated and set to Total Translation they allowed the user to identify exactly what
parts of the model deformed. When the lower wing surface of the single wing model
actually deflected through the upper surface, the maximum translation results were
initially assumed to be those of the upper surface. It was only upon activating the color
contours when it became obvious which portion of the model was experiencing
maximum deflection.
During the meshing process, the "Mesh Control / Size along Curve…" command
proved most useful. Even when meshing solids or surfaces, this technique of defining the
mesh size was preferred. When attempting to align the mesh sizing along the span of the
wing model between two or more pieces of geometry, such as the wing box and airfoil,
this command created meshes of both plate and solid elements with coincident nodes
located as desired.
The methods used for simple acts such as selecting entities within the model were
important. For example, selecting by element TYPE was used often. When removing
rigid elements along the wing edge it was a significantly easier and faster method to use
the toolbar and select Delete… Model… Element, Method… Type, and choose the
intended element (in this case, "29. L Rigid") instead of selecting them individually. As
another example, using a box to select portions of the model instead of individually
selecting elements or nodes was a significant aid. When merging nodes within a certain
distance between the wing box and airfoil, the box selection method prevented the
accidental selection of those nodes along the trailing edge of the wing. This also helped
95
when modifying the properties of the elements of the wing box. On that note, the use of
multiple property definitions, even for the same material definition, was extremely
helpful for modeling the wing box. By using the "Modify / Update Elements / Property
ID" command, the properties of the wing box plate elements were easily changed to
reflect their increased layer thicknesses.
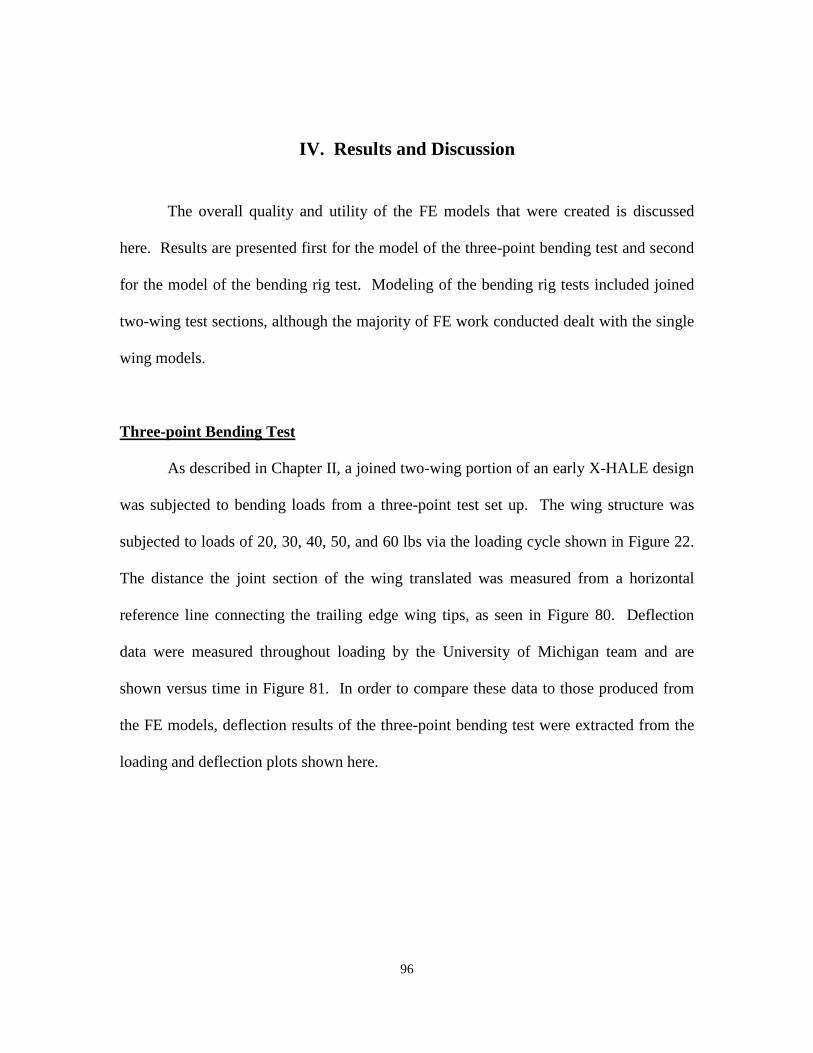
96
IV. Results and Discussion
The overall quality and utility of the FE models that were created is discussed
here. Results are presented first for the model of the three-point bending test and second
for the model of the bending rig test. Modeling of the bending rig tests included joined
two-wing test sections, although the majority of FE work conducted dealt with the single
wing models.
Three-point Bending Test
As described in Chapter II, a joined two-wing portion of an early X-HALE design
was subjected to bending loads from a three-point test set up. The wing structure was
subjected to loads of 20, 30, 40, 50, and 60 lbs via the loading cycle shown in Figure 22.
The distance the joint section of the wing translated was measured from a horizontal
reference line connecting the trailing edge wing tips, as seen in Figure 80. Deflection
data were measured throughout loading by the University of Michigan team and are
shown versus time in Figure 81. In order to compare these data to those produced from
the FE models, deflection results of the three-point bending test were extracted from the
loading and deflection plots shown here.
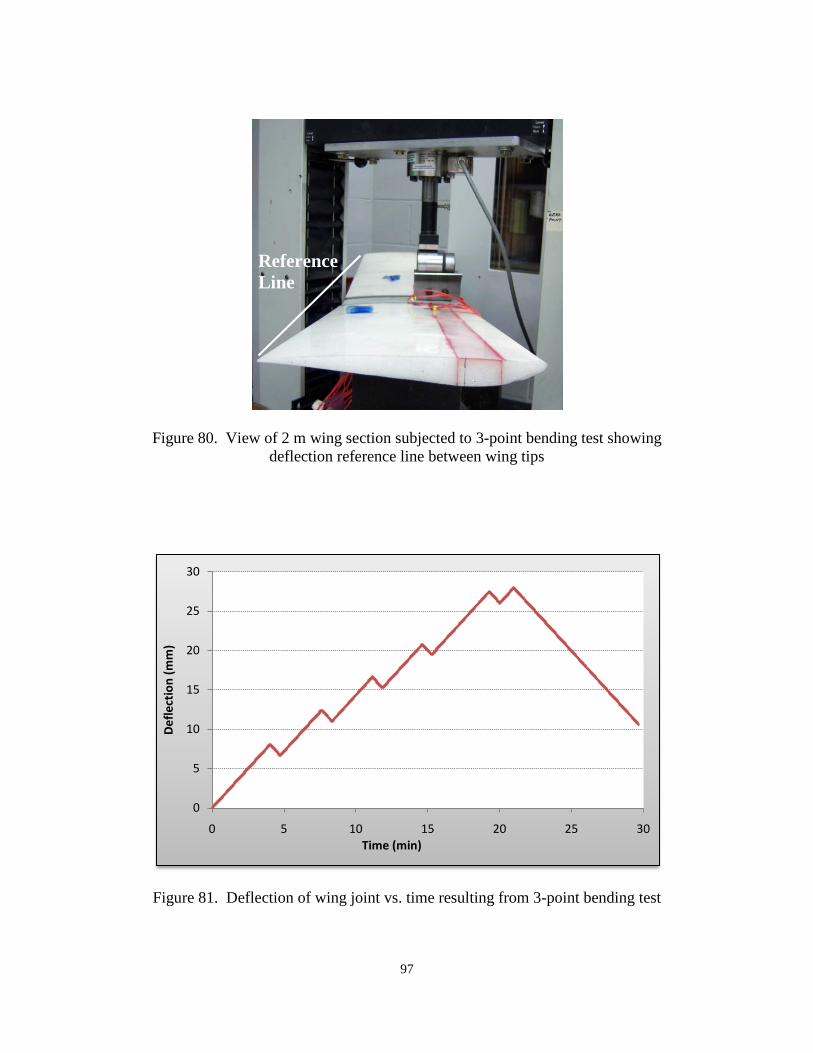
97
Figure 80. View of 2 m wing section subjected to 3-point bending test showing deflection reference line between wing tips
Figure 81. Deflection of wing joint vs. time resulting from 3-point bending test
0
5
10
15
20
25
30
0 5 10 15 20 25 30
Def
lect
ion
(mm
)
Time (min)
Reference Line
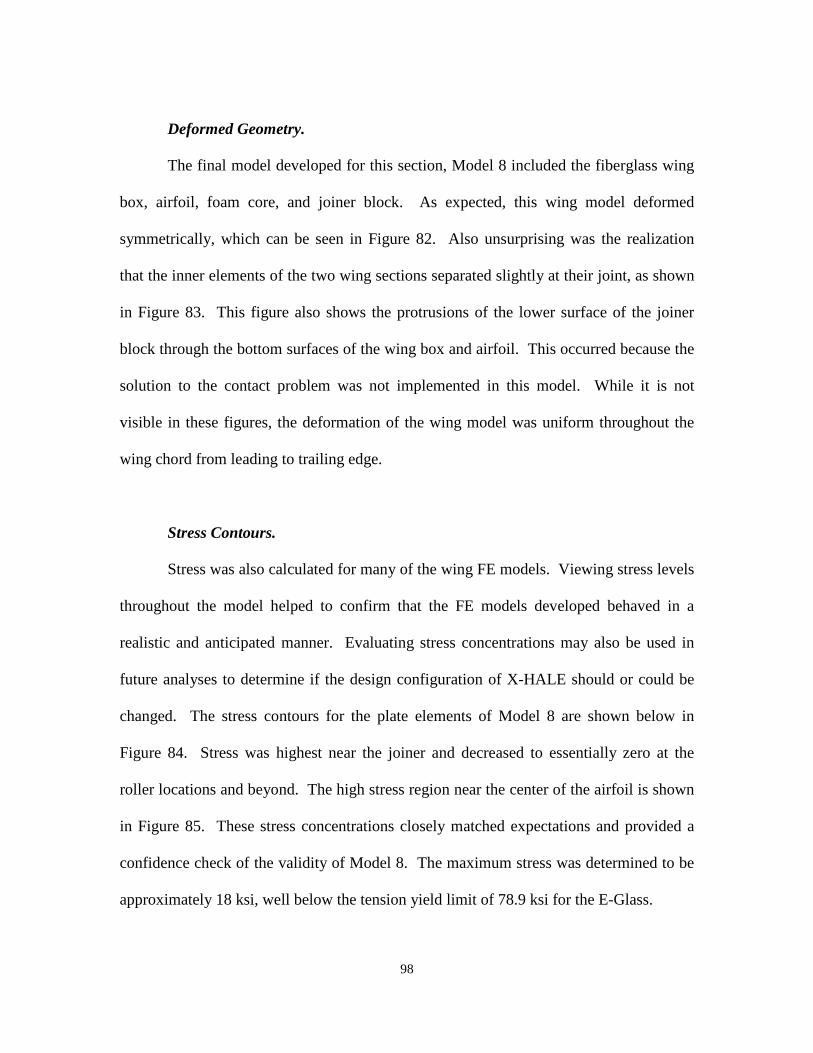
98
Deformed Geometry.
The final model developed for this section, Model 8 included the fiberglass wing
box, airfoil, foam core, and joiner block. As expected, this wing model deformed
symmetrically, which can be seen in Figure 82. Also unsurprising was the realization
that the inner elements of the two wing sections separated slightly at their joint, as shown
in Figure 83. This figure also shows the protrusions of the lower surface of the joiner
block through the bottom surfaces of the wing box and airfoil. This occurred because the
solution to the contact problem was not implemented in this model. While it is not
visible in these figures, the deformation of the wing model was uniform throughout the
wing chord from leading to trailing edge.
Stress Contours.
Stress was also calculated for many of the wing FE models. Viewing stress levels
throughout the model helped to confirm that the FE models developed behaved in a
realistic and anticipated manner. Evaluating stress concentrations may also be used in
future analyses to determine if the design configuration of X-HALE should or could be
changed. The stress contours for the plate elements of Model 8 are shown below in
Figure 84. Stress was highest near the joiner and decreased to essentially zero at the
roller locations and beyond. The high stress region near the center of the airfoil is shown
in Figure 85. These stress concentrations closely matched expectations and provided a
confidence check of the validity of Model 8. The maximum stress was determined to be
approximately 18 ksi, well below the tension yield limit of 78.9 ksi for the E-Glass.
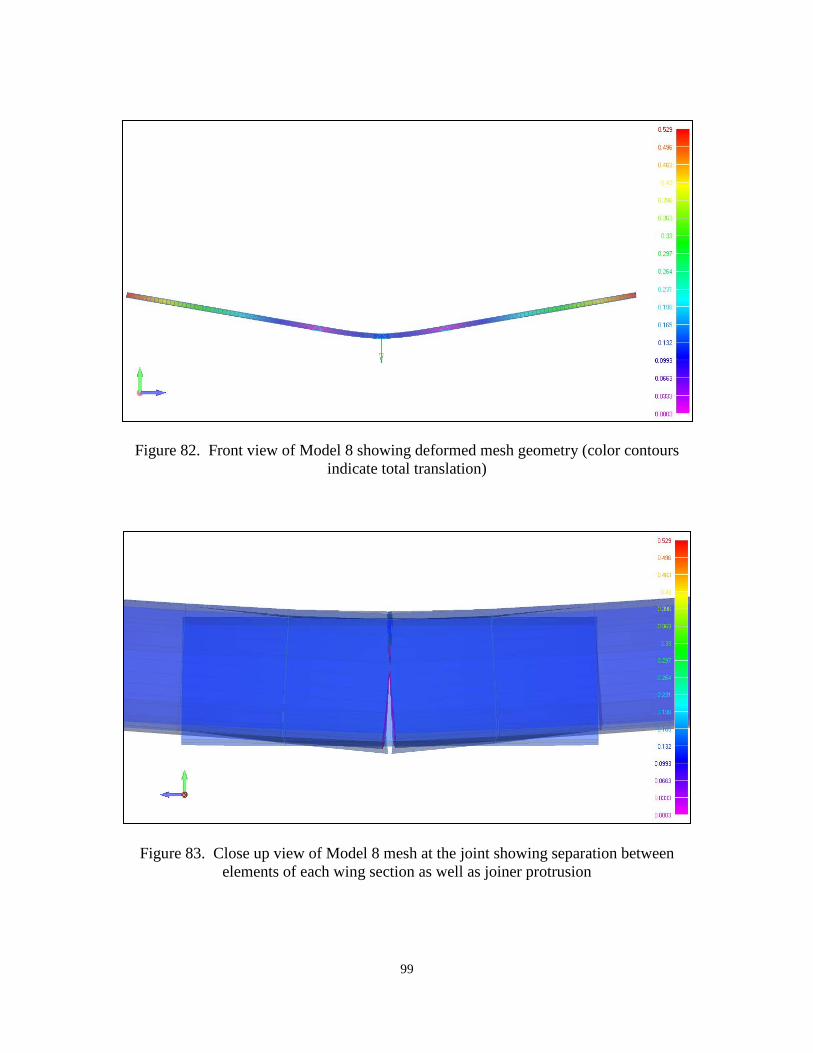
99
Figure 82. Front view of Model 8 showing deformed mesh geometry (color contours indicate total translation)
Figure 83. Close up view of Model 8 mesh at the joint showing separation between elements of each wing section as well as joiner protrusion
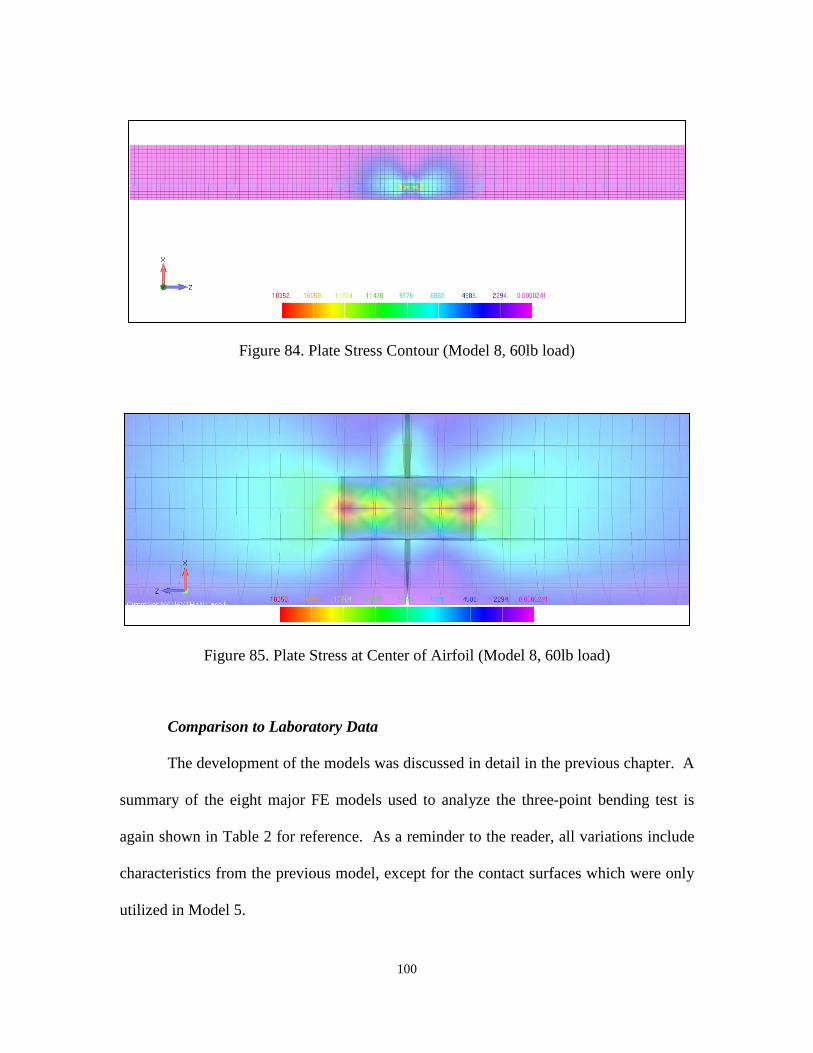
100
Figure 84. Plate Stress Contour (Model 8, 60lb load)
Figure 85. Plate Stress at Center of Airfoil (Model 8, 60lb load)
Comparison to Laboratory Data
The development of the models was discussed in detail in the previous chapter. A
summary of the eight major FE models used to analyze the three-point bending test is
again shown in Table 2 for reference. As a reminder to the reader, all variations include
characteristics from the previous model, except for the contact surfaces which were only
utilized in Model 5.
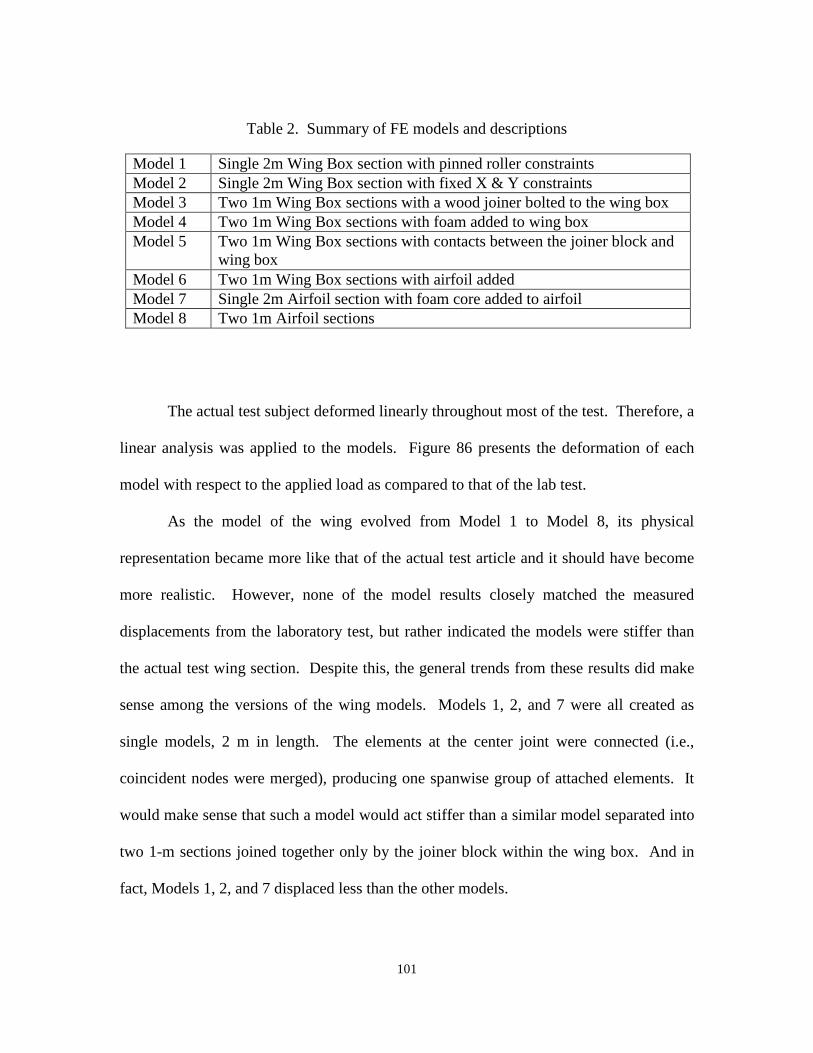
101
Table 2. Summary of FE models and descriptions
Model 1 Single 2m Wing Box section with pinned roller constraints Model 2 Single 2m Wing Box section with fixed X & Y constraints Model 3 Two 1m Wing Box sections with a wood joiner bolted to the wing box Model 4 Two 1m Wing Box sections with foam added to wing box Model 5 Two 1m Wing Box sections with contacts between the joiner block and
wing box Model 6 Two 1m Wing Box sections with airfoil added Model 7 Single 2m Airfoil section with foam core added to airfoil Model 8 Two 1m Airfoil sections
The actual test subject deformed linearly throughout most of the test. Therefore, a
linear analysis was applied to the models. Figure 86 presents the deformation of each
model with respect to the applied load as compared to that of the lab test.
As the model of the wing evolved from Model 1 to Model 8, its physical
representation became more like that of the actual test article and it should have become
more realistic. However, none of the model results closely matched the measured
displacements from the laboratory test, but rather indicated the models were stiffer than
the actual test wing section. Despite this, the general trends from these results did make
sense among the versions of the wing models. Models 1, 2, and 7 were all created as
single models, 2 m in length. The elements at the center joint were connected (i.e.,
coincident nodes were merged), producing one spanwise group of attached elements. It
would make sense that such a model would act stiffer than a similar model separated into
two 1-m sections joined together only by the joiner block within the wing box. And in
fact, Models 1, 2, and 7 displaced less than the other models.
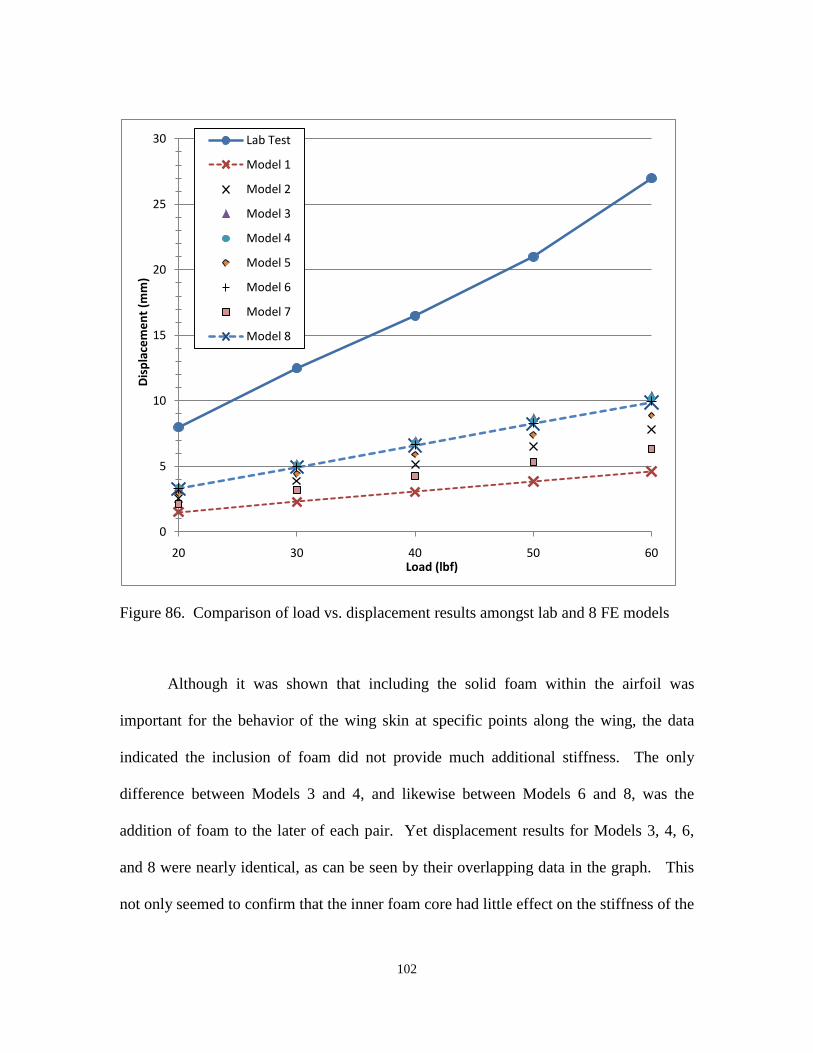
102
Figure 86. Comparison of load vs. displacement results amongst lab and 8 FE models
Although it was shown that including the solid foam within the airfoil was
important for the behavior of the wing skin at specific points along the wing, the data
indicated the inclusion of foam did not provide much additional stiffness. The only
difference between Models 3 and 4, and likewise between Models 6 and 8, was the
addition of foam to the later of each pair. Yet displacement results for Models 3, 4, 6,
and 8 were nearly identical, as can be seen by their overlapping data in the graph. This
not only seemed to confirm that the inner foam core had little effect on the stiffness of the
0
5
10
15
20
25
30
20 30 40 50 60
Dis
plac
emen
t (m
m)
Load (lbf)
Lab Test
Model 1
Model 2
Model 3
Model 4
Model 5
Model 6
Model 7
Model 8
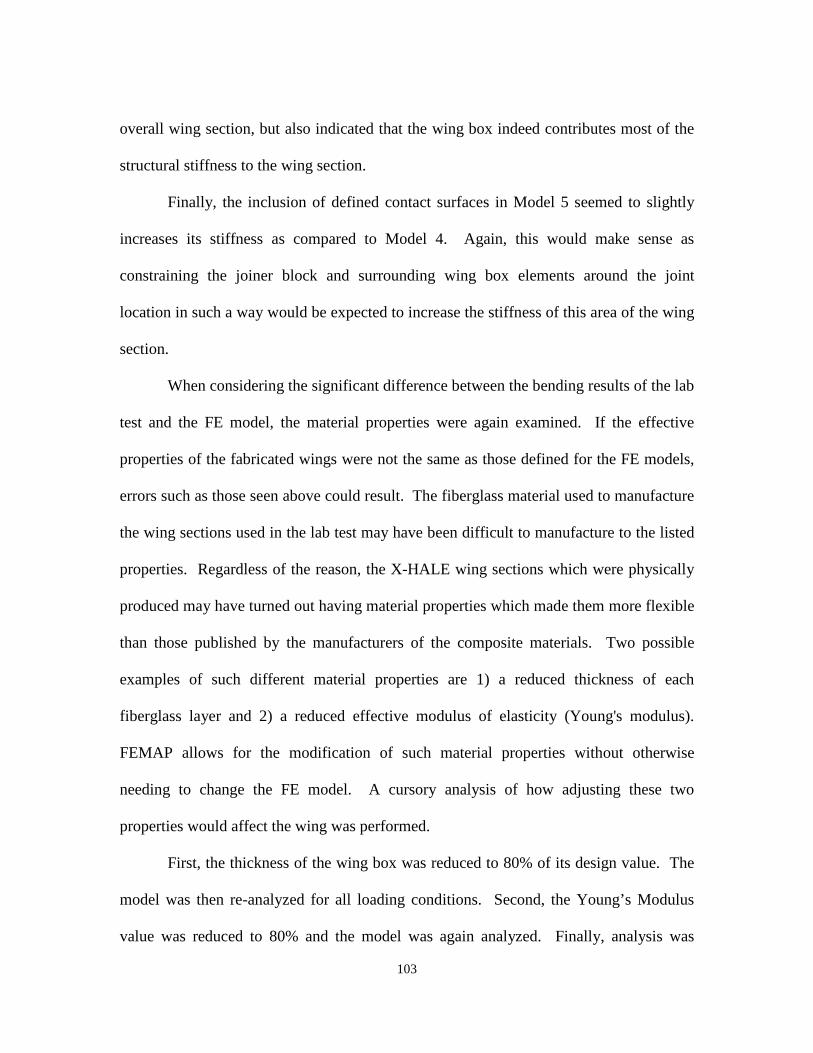
103
overall wing section, but also indicated that the wing box indeed contributes most of the
structural stiffness to the wing section.
Finally, the inclusion of defined contact surfaces in Model 5 seemed to slightly
increases its stiffness as compared to Model 4. Again, this would make sense as
constraining the joiner block and surrounding wing box elements around the joint
location in such a way would be expected to increase the stiffness of this area of the wing
section.
When considering the significant difference between the bending results of the lab
test and the FE model, the material properties were again examined. If the effective
properties of the fabricated wings were not the same as those defined for the FE models,
errors such as those seen above could result. The fiberglass material used to manufacture
the wing sections used in the lab test may have been difficult to manufacture to the listed
properties. Regardless of the reason, the X-HALE wing sections which were physically
produced may have turned out having material properties which made them more flexible
than those published by the manufacturers of the composite materials. Two possible
examples of such different material properties are 1) a reduced thickness of each
fiberglass layer and 2) a reduced effective modulus of elasticity (Young's modulus).
FEMAP allows for the modification of such material properties without otherwise
needing to change the FE model. A cursory analysis of how adjusting these two
properties would affect the wing was performed.
First, the thickness of the wing box was reduced to 80% of its design value. The
model was then re-analyzed for all loading conditions. Second, the Young’s Modulus
value was reduced to 80% and the model was again analyzed. Finally, analysis was
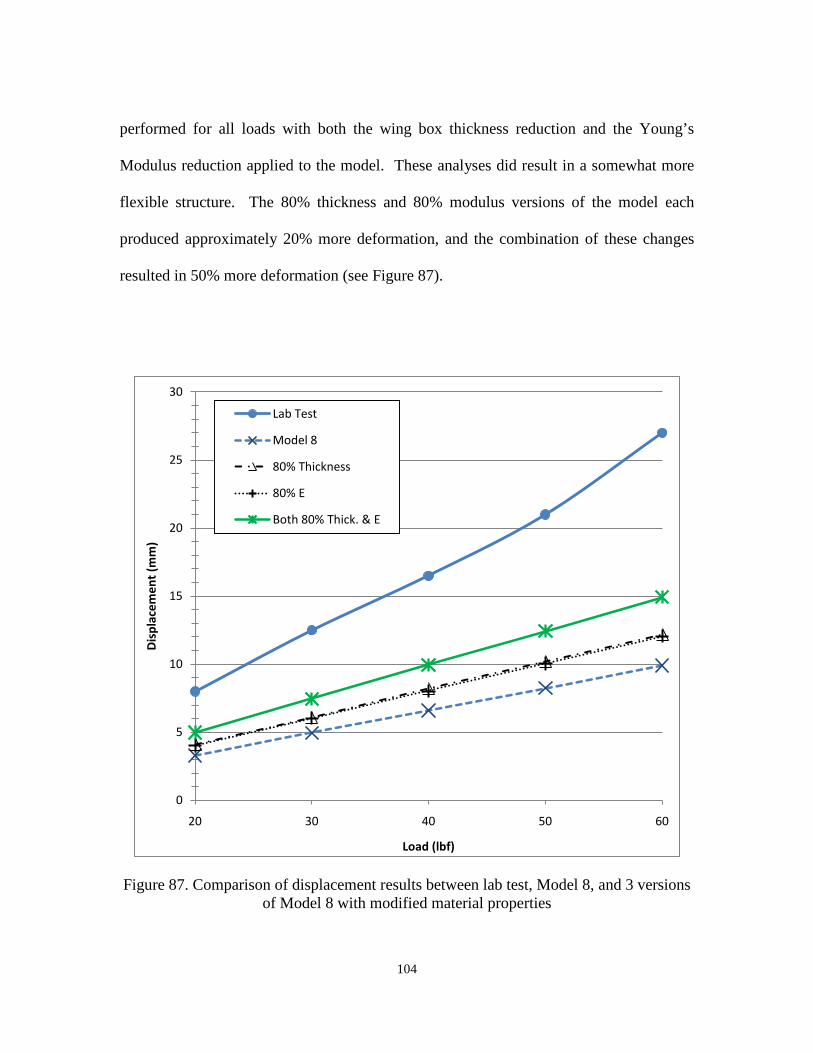
104
performed for all loads with both the wing box thickness reduction and the Young’s
Modulus reduction applied to the model. These analyses did result in a somewhat more
flexible structure. The 80% thickness and 80% modulus versions of the model each
produced approximately 20% more deformation, and the combination of these changes
resulted in 50% more deformation (see Figure 87).
Figure 87. Comparison of displacement results between lab test, Model 8, and 3 versions of Model 8 with modified material properties
0
5
10
15
20
25
30
20 30 40 50 60
Dis
plac
emen
t (m
m)
Load (lbf)
Lab Test
Model 8
80% Thickness
80% E
Both 80% Thick. & E
105
The results above suggested the material properties of the fabricated wings were
not equal to those prescribed by the material manufacturers. These modifications to layer
thickness and Young's modulus were the only property changes made to Model 8.
Additional adjustments are required to determine the degree of difference between these
material properties. There may also be additional explanations for the deflection
differences, such as poorly defined connections and overly simplified assumptions.
Likewise, these possibilities would need to be investigated to determine their affect on
the deflection results.
Quality of Load and Boundary Condition Definitions.
Some improvements could have been made to how the loads and constraints were
defined in the FE models. One such improvement would have been obtaining actual
dimensions of the load and roller devices, specifically in the direction of the wing chord.
The placement of the loads and constraints could then be refined. As it is, the model
assumes that the load and constraints are distributed across the wing box section alone.
This was mainly done to simplify the modeling process. Another area for improvement
would have been changing nodal loads to nodal deflections. Using deflections would
more closely simulate the actual test conditions in which a solid bar loaded the wing box.
Also, increasing the number of wing box nodes in the chord direction would more evenly
distribute the load, further increasing the accuracy of the model.
106
Additional Comments Regarding FE Model Quality.
While numerous simplifying assumptions were made to allow immediate and
rapid modeling of the three-point bending test, many of these could be removed or
modified to further refine the model. For example, including the pieces of the wing
which were constructed from carbon fiber would allow the model to account for
interactions between more materials and, in turn, improve the fidelity of the model. Also,
appropriate contact surface definitions should be included in the model. This could allow
for the discovery of issues within the wing joint where the wing box and joiner block are
fastened and results in a redesign. A more mature model of the screws which fasten the
wing sections should also be added. This could be as simple as adding spring elements to
account for the play at the joint or as complex as actually modeling the physical screws
and defining contact surfaces between the screws and the joiner block material.
Regardless of the approach, testing of the physical connection should also conducted in
order to properly refine the screw model.
Regarding the various materials which comprise the wing section, their properties
should be tested enough times to yield confident values for the actual wing box strength
and stiffness. This is especially true for the composite materials, as many variable exist
which can affect their end state properties. Testing representative parts of the X-HALE
structure is probably the most effective way to address the differences between model
and laboratory test results. Vibration testing could also be conducted. This would
provide additional data which could be compared to modal results from FEMAP.
Finally, the correct mass of the model should be accounted for. While this would likely
107
not significantly affect the results of static testing, it would allow for accurate dynamic
tests to be performed and would further increased the validity of the model.
Bending and Torsion Rig Test
As described in Chapter II and the report by Matthews, four X-HALE wings
sections were subjected to bending and torsion tests in the characterization rig at the
University of Michigan [21]. Once a standardized test procedure was finalized, the
resulting wing tip deflection measurements were recorded for applied loads of 3, 4, 5, 6,
and 7 N. For purposes of comparing to the FE models developed here, only bending test
data will be referenced. Additionally, the data collected by Matthews has been separated
and only the average wing tip deflection measurements for the tests when bending was
conducted towards the top surface of the wing will be discussed in this section. The
graph in Figure 88 displays the average deflection at the free end of the wing section for
each of the four wing sections tested as single wings spans. Similarly, the graph in
Figure 89 displays the average deflection at the free end of the wing section for each of
the two sing sections tested as joined double wing spans.
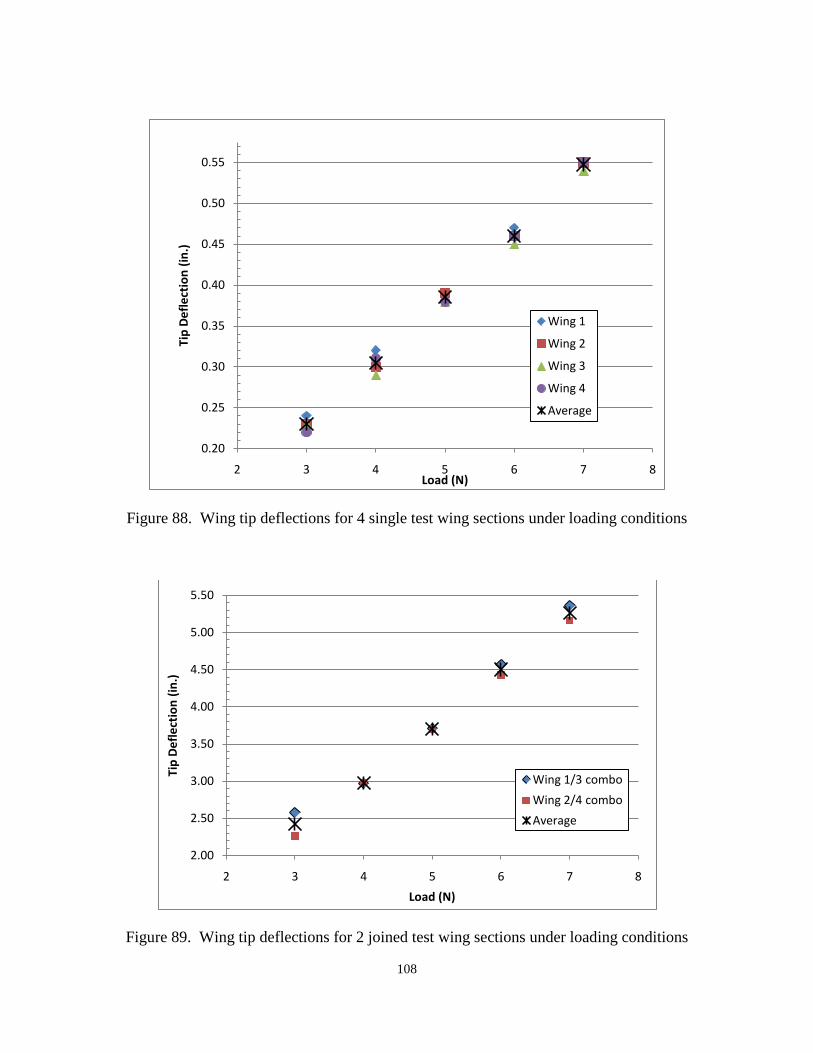
108
Figure 88. Wing tip deflections for 4 single test wing sections under loading conditions
Figure 89. Wing tip deflections for 2 joined test wing sections under loading conditions
0.20
0.25
0.30
0.35
0.40
0.45
0.50
0.55
2 3 4 5 6 7 8
Tip
Def
lect
ion
(in.)
Load (N)
Wing 1
Wing 2
Wing 3
Wing 4
Average
2.00
2.50
3.00
3.50
4.00
4.50
5.00
5.50
2 3 4 5 6 7 8
Tip
Def
lect
ion
(in.)
Load (N)
Wing 1/3 combo
Wing 2/4 combo
Average
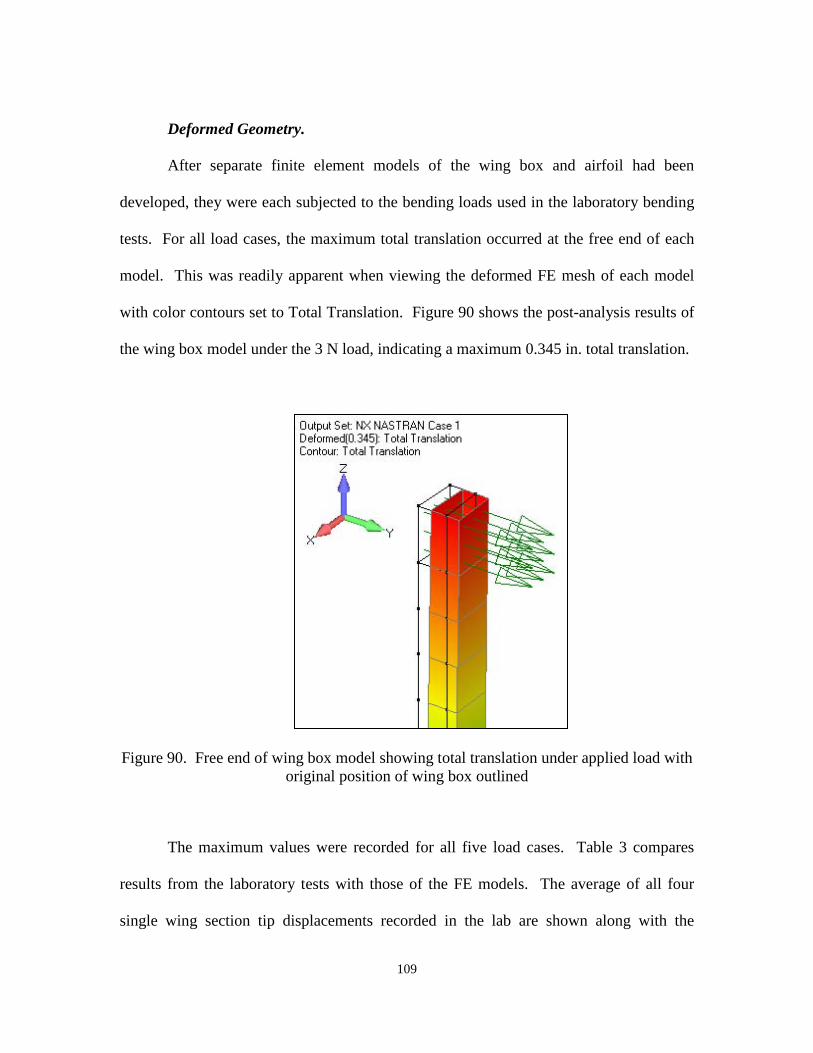
109
Deformed Geometry.
After separate finite element models of the wing box and airfoil had been
developed, they were each subjected to the bending loads used in the laboratory bending
tests. For all load cases, the maximum total translation occurred at the free end of each
model. This was readily apparent when viewing the deformed FE mesh of each model
with color contours set to Total Translation. Figure 90 shows the post-analysis results of
the wing box model under the 3 N load, indicating a maximum 0.345 in. total translation.
Figure 90. Free end of wing box model showing total translation under applied load with original position of wing box outlined
The maximum values were recorded for all five load cases. Table 3 compares
results from the laboratory tests with those of the FE models. The average of all four
single wing section tip displacements recorded in the lab are shown along with the
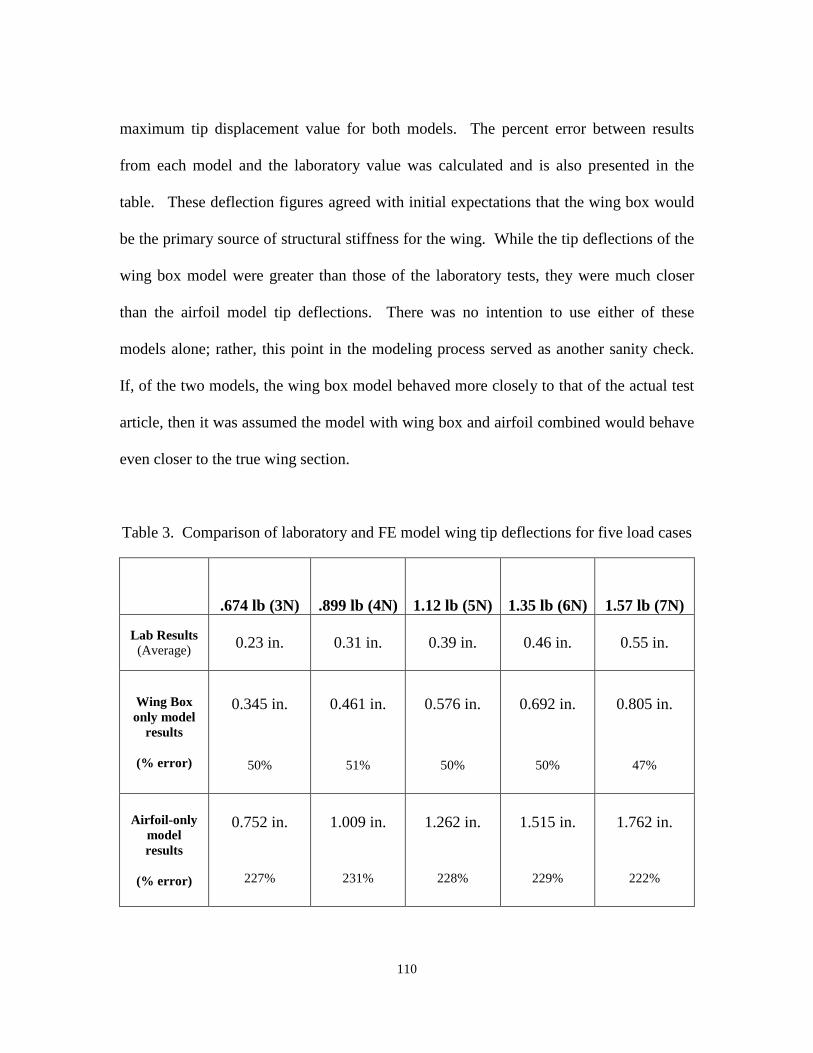
110
maximum tip displacement value for both models. The percent error between results
from each model and the laboratory value was calculated and is also presented in the
table. These deflection figures agreed with initial expectations that the wing box would
be the primary source of structural stiffness for the wing. While the tip deflections of the
wing box model were greater than those of the laboratory tests, they were much closer
than the airfoil model tip deflections. There was no intention to use either of these
models alone; rather, this point in the modeling process served as another sanity check.
If, of the two models, the wing box model behaved more closely to that of the actual test
article, then it was assumed the model with wing box and airfoil combined would behave
even closer to the true wing section.
Table 3. Comparison of laboratory and FE model wing tip deflections for five load cases
.674 lb (3N) .899 lb (4N) 1.12 lb (5N) 1.35 lb (6N) 1.57 lb (7N)
Lab Results (Average) 0.23 in. 0.31 in. 0.39 in. 0.46 in. 0.55 in.
Wing Box only model
results
(% error)
0.345 in. 0.461 in. 0.576 in. 0.692 in. 0.805 in.
50% 51% 50% 50% 47%
Airfoil-only model results
(% error)
0.752 in. 1.009 in. 1.262 in. 1.515 in. 1.762 in.
227% 231% 228% 229% 222%
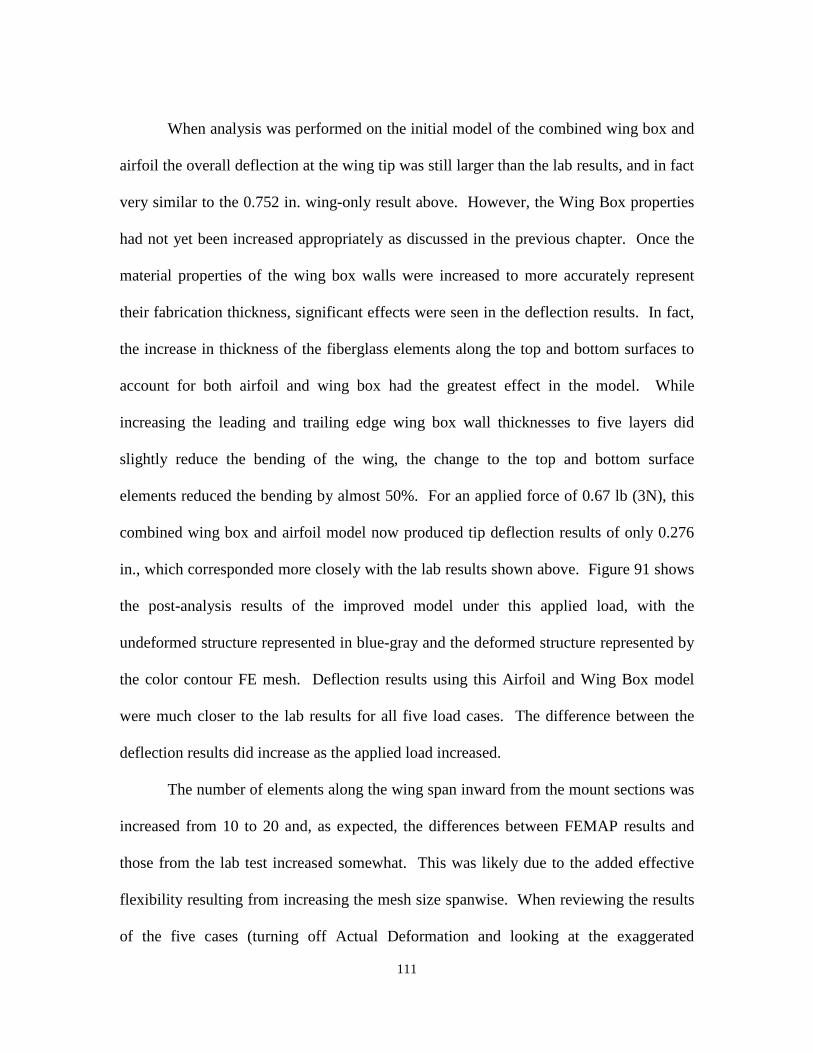
111
When analysis was performed on the initial model of the combined wing box and
airfoil the overall deflection at the wing tip was still larger than the lab results, and in fact
very similar to the 0.752 in. wing-only result above. However, the Wing Box properties
had not yet been increased appropriately as discussed in the previous chapter. Once the
material properties of the wing box walls were increased to more accurately represent
their fabrication thickness, significant effects were seen in the deflection results. In fact,
the increase in thickness of the fiberglass elements along the top and bottom surfaces to
account for both airfoil and wing box had the greatest effect in the model. While
increasing the leading and trailing edge wing box wall thicknesses to five layers did
slightly reduce the bending of the wing, the change to the top and bottom surface
elements reduced the bending by almost 50%. For an applied force of 0.67 lb (3N), this
combined wing box and airfoil model now produced tip deflection results of only 0.276
in., which corresponded more closely with the lab results shown above. Figure 91 shows
the post-analysis results of the improved model under this applied load, with the
undeformed structure represented in blue-gray and the deformed structure represented by
the color contour FE mesh. Deflection results using this Airfoil and Wing Box model
were much closer to the lab results for all five load cases. The difference between the
deflection results did increase as the applied load increased.
The number of elements along the wing span inward from the mount sections was
increased from 10 to 20 and, as expected, the differences between FEMAP results and
those from the lab test increased somewhat. This was likely due to the added effective
flexibility resulting from increasing the mesh size spanwise. When reviewing the results
of the five cases (turning off Actual Deformation and looking at the exaggerated
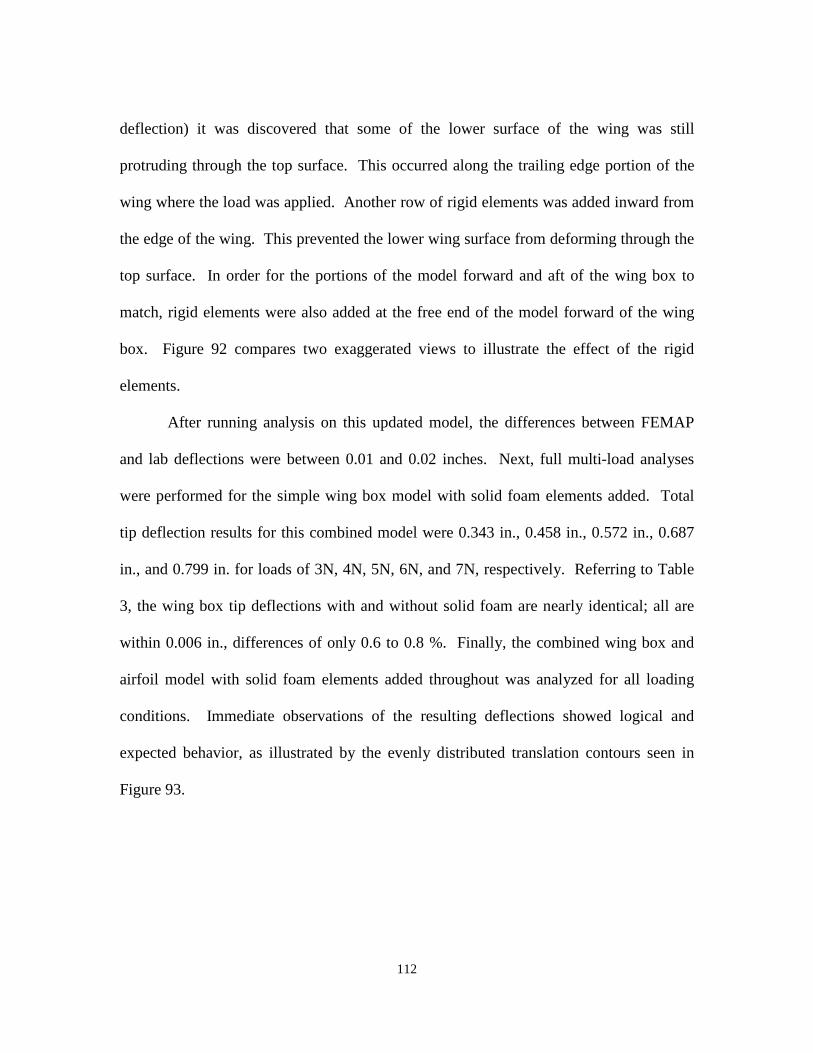
112
deflection) it was discovered that some of the lower surface of the wing was still
protruding through the top surface. This occurred along the trailing edge portion of the
wing where the load was applied. Another row of rigid elements was added inward from
the edge of the wing. This prevented the lower wing surface from deforming through the
top surface. In order for the portions of the model forward and aft of the wing box to
match, rigid elements were also added at the free end of the model forward of the wing
box. Figure 92 compares two exaggerated views to illustrate the effect of the rigid
elements.
After running analysis on this updated model, the differences between FEMAP
and lab deflections were between 0.01 and 0.02 inches. Next, full multi-load analyses
were performed for the simple wing box model with solid foam elements added. Total
tip deflection results for this combined model were 0.343 in., 0.458 in., 0.572 in., 0.687
in., and 0.799 in. for loads of 3N, 4N, 5N, 6N, and 7N, respectively. Referring to Table
3, the wing box tip deflections with and without solid foam are nearly identical; all are
within 0.006 in., differences of only 0.6 to 0.8 %. Finally, the combined wing box and
airfoil model with solid foam elements added throughout was analyzed for all loading
conditions. Immediate observations of the resulting deflections showed logical and
expected behavior, as illustrated by the evenly distributed translation contours seen in
Figure 93.
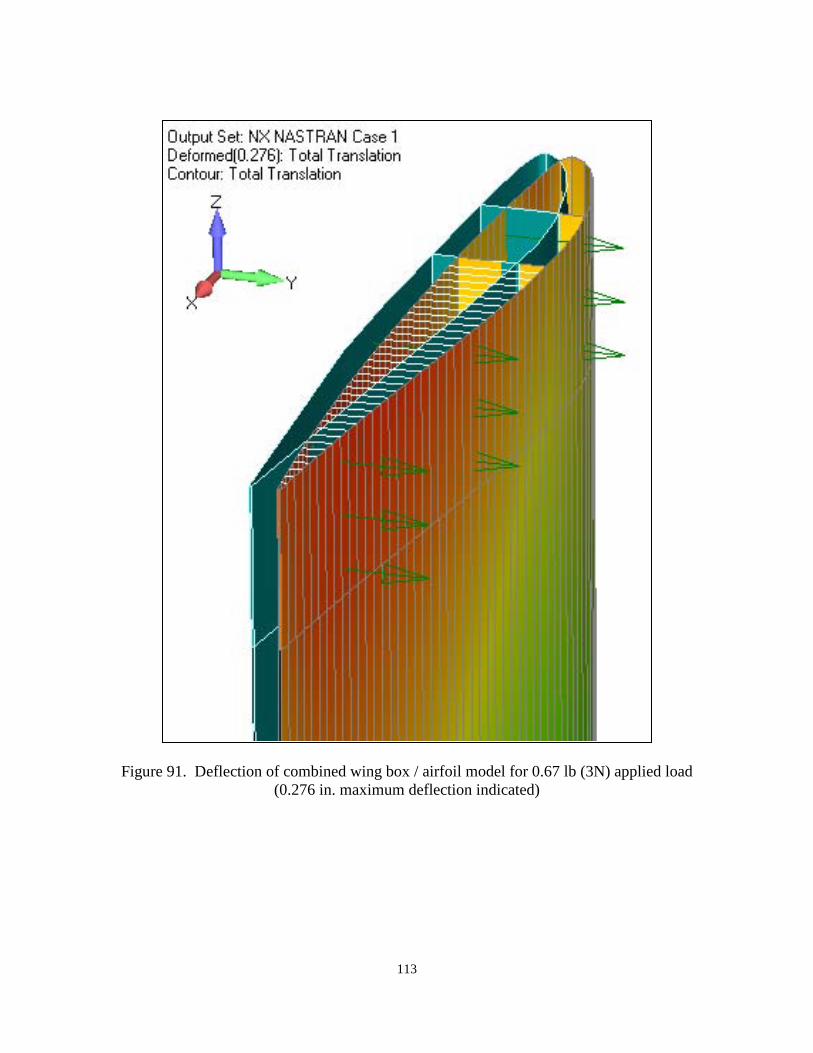
113
Figure 91. Deflection of combined wing box / airfoil model for 0.67 lb (3N) applied load (0.276 in. maximum deflection indicated)
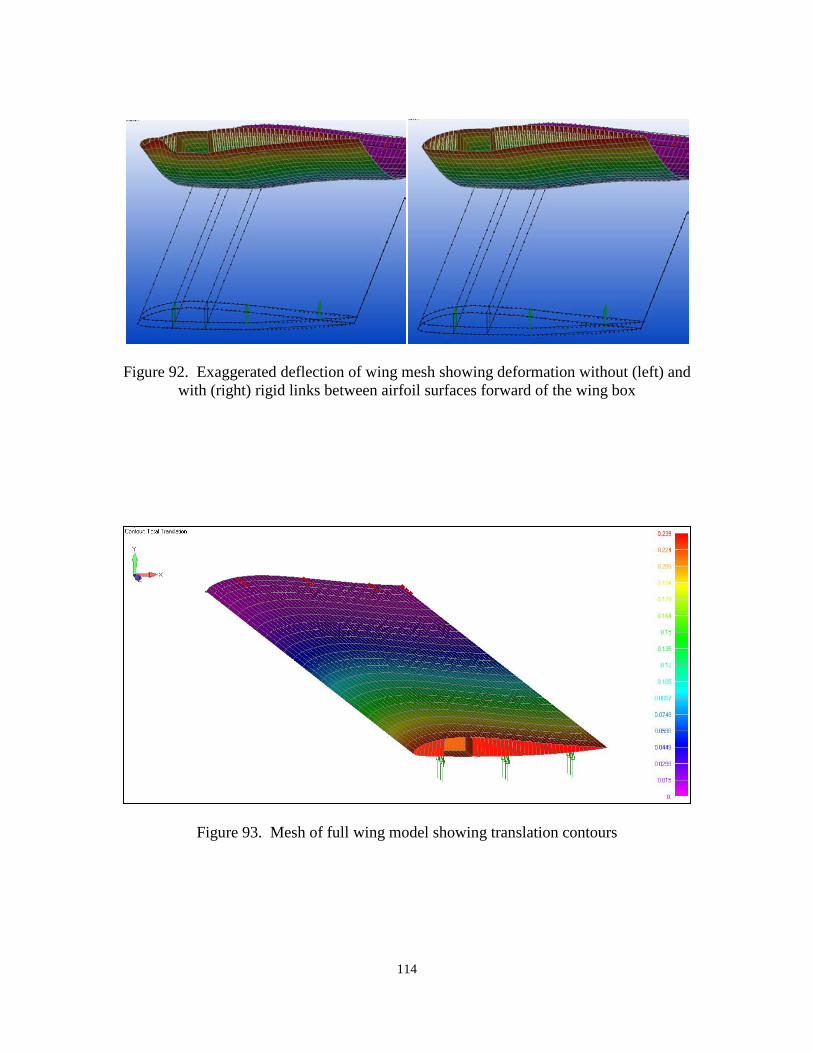
114
Figure 92. Exaggerated deflection of wing mesh showing deformation without (left) and with (right) rigid links between airfoil surfaces forward of the wing box
Figure 93. Mesh of full wing model showing translation contours
115
The deflection calculations of this final wing model closely matched the
deflections from the static laboratory tests. Specifically, the results of the linear analysis
for the wing subjected to 3, 4, 5, 6, and 7 N loads yielded deflections of 0.239, 0.319,
0.399, 0.478, and 0.558 in., respectively, all of which were less than a 5% error from the
lab result averages. Post-analysis depictions of these actual deformations can be seen in
the series of FEMAP screen shots in Figure 94. To further check the reality of the wing
model produced to this point, the additional loads described in Chapter III and depicted in
Figure 68 and Figure 69 were applied to the model. These were not loads representative
of any laboratory test previously conducted. Rather, these were intended to subject the
wing model to relatively extreme loading conditions to test the overall connectedness of
the finite element mesh.
Using the NX NASTRAN linear static solver, the simplified two-wing model was
analyzed for all five loading conditions in the same manner as the single wing model.
Post analysis inspection indicated results closely matching those from the two-wing
laboratory tests. The tip displacement of the model corresponding to a 3 N load was
2.091 in. – a 13.6% error, and the largest of the five cases. Displacements for the 4, 5, 6,
& 7 N loads were 2.806 in., 3.508 in., 4.21 in., and 4.913 in., respectively – all errors of
only 5% to 7%. The extremes of these tip deflections for the simple two-wing model
under a load of 3 N and 7 N are shown in Figure 95 and Figure 96, respectively.
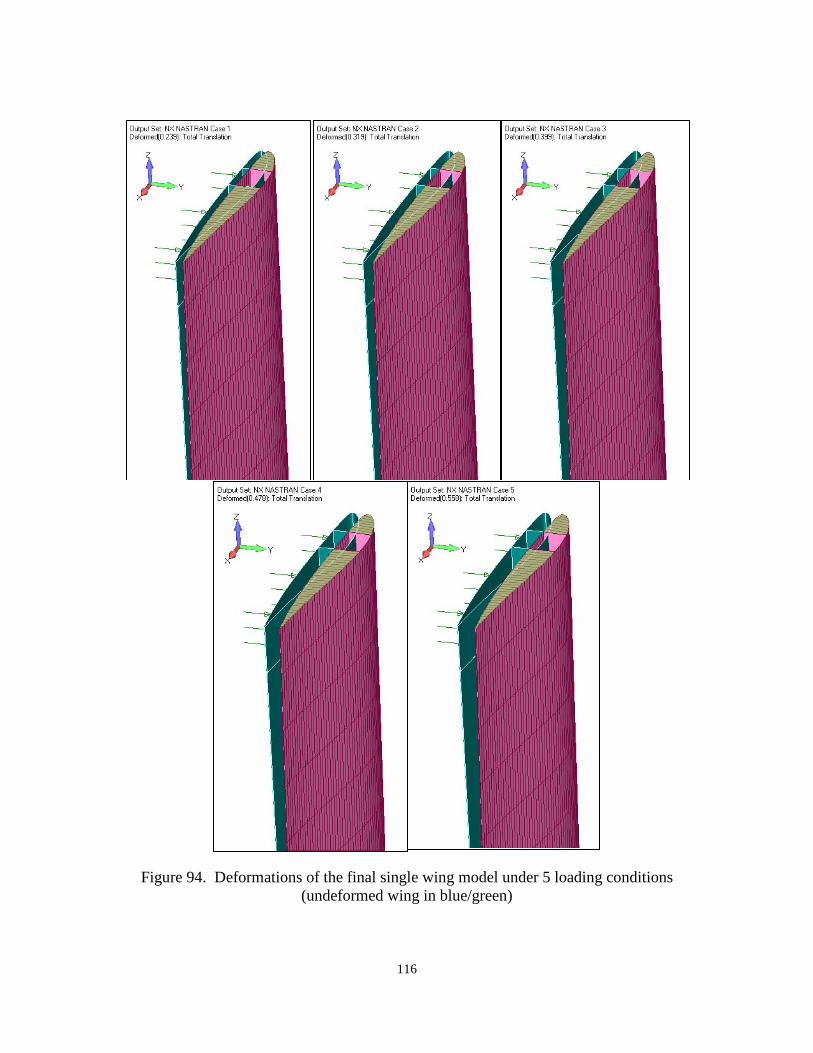
116
Figure 94. Deformations of the final single wing model under 5 loading conditions (undeformed wing in blue/green)
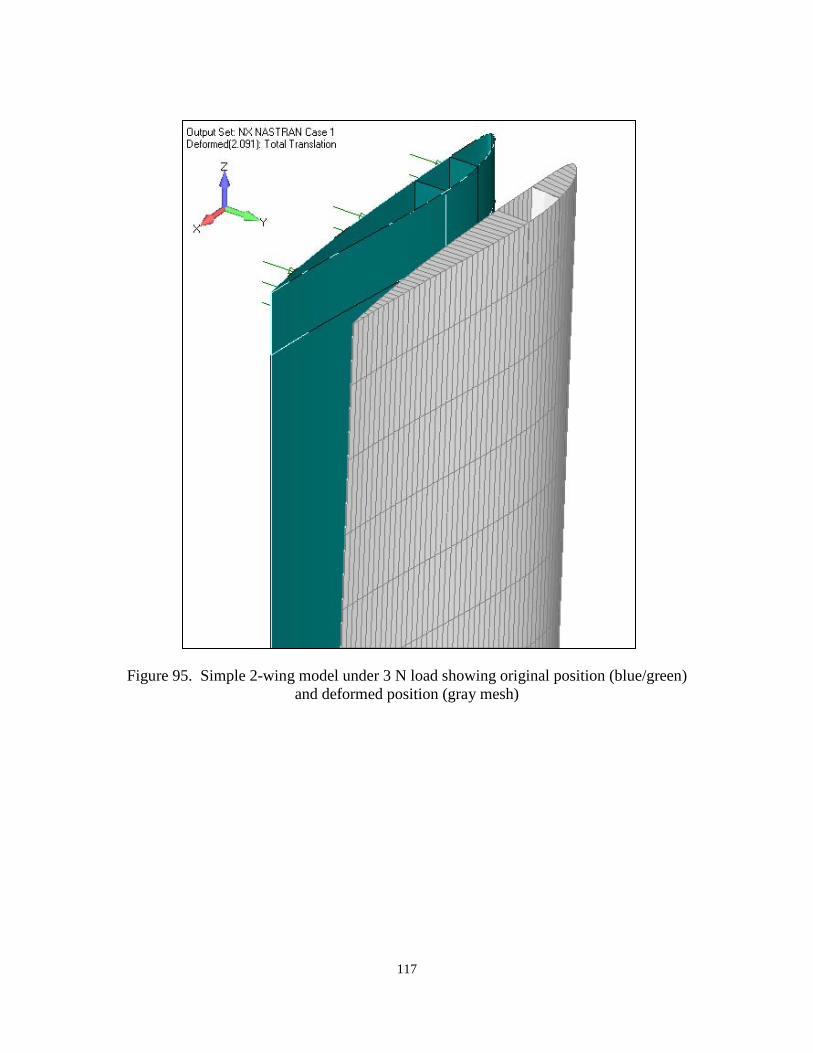
117
Figure 95. Simple 2-wing model under 3 N load showing original position (blue/green) and deformed position (gray mesh)
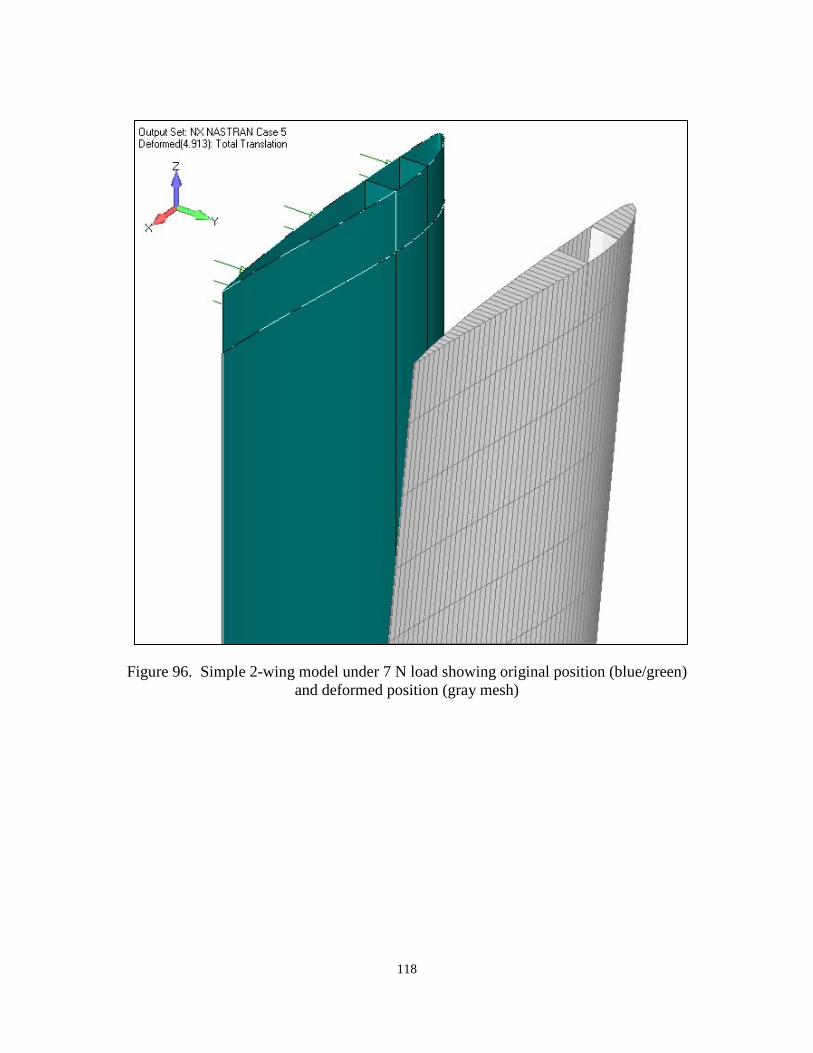
118
Figure 96. Simple 2-wing model under 7 N load showing original position (blue/green) and deformed position (gray mesh)
119
V. Conclusions
This work centered around finite element (FE) modeling and analysis of static
laboratory bending tests conducted on wing sections of the X-HALE aircraft designed by
the University of Michigan's Department of Aerospace Engineering. Results obtained for
the initial set of tests indicated that there were possible errors between the material
properties of the X-HALE wings tested in the lab and the FE models created within
FEMAP. At the same time, the source(s) of the discrepancies between laboratory and FE
displacement results could not completely be isolated to material properties – details such
as connections and contact surfaces will have to be investigated further in order to
determine their role in the behavior or the model. Regarding the analysis of the later tests
performed with the characterization rig, results for wing tip displacements obtained from
the FE models closely matched those from the laboratory. While the similarity in
behavior between the models created and actual wing sections are promising, further
work will be required to be able to truly describe the accuracy and validity of the FE
models created.
The work conducted on the three-point bending test will likely not be extended
beyond level described here. That test was performed on a joint section of the X-HALE
wing which has subsequently undergone significant design changes. From a test
perspective, subjecting the two joined wings to those bending loads revealed weaknesses
in the original joint design, and as such was a successful test. From a FE modeling
perspective, that test provided an initial set of data to which FE modeling data could be
compared. The level of refinement of this initial FE modeling certainly left room for
120
improvement and further work. For example, the loading and boundary conditions could
have been implemented more realistically by obtaining measurements of the actual load
and roller devices, especially of their length in the direction of the wing chord. The
model presented here assumes that the load and constraints are distributed across the
wing box section alone, which may not be accurate. Many other examples of
oversimplification exist. However, the additional effort that might have been put towards
improving the model of the three-point bending test section will not be discussed here.
Instead, additional modeling steps and insight into the modeling process which apply to
the current FE model of X-HALE are offered below.
The assumptions made throughout the modeling process served various purposes.
Why the assumptions were made, as well as the validity of the assumptions themselves,
should be assessed as future work progresses. For example, the mass of the wing
components were neglected. The gravitational forces on such a small composite and
foam structure was assumed to be much less than the applied loading, and therefore
would not impact the results. However, if additional tests are to be modeled the mass of
X-HALE may come into play. Also, the assumptions regarding material properties may
be invalid. Composite layup techniques may result in properties varying significantly
from their published values. Regardless of the results obtained here, such variables could
be a large factor in differences between test and model results. With additional time, and
certainly before further modeling work is conducted, the material properties of the
fabricated X-HALE structure should be determined. Primary focus should be on the
wing sections, especially the composite materials, which should be tested enough times to
yield a statistically significant value for the actual wing strength and stiffness. A
121
drawback to this recommendation is the requirement to manufacture additional wing
sections for the sole purpose of performing material property tests, as these test section
would like be damaged and therefore unusable in the aircraft.
Contact surfaces were discussed for the three-point test, but remain applicable for
the later model and may likely prove to be a challenging detail of any FE model of an
aircraft like X-HALE. For any work that continues on the joined wing version of the
bending rig model, the contact definitions throughout the joint between the two wing
sections will require significant focus. The early lessons learned regarding contact
surface definitions should be applied to the portion of the two-wing model where the
aluminum joiner block is fastened inside the open wing box sections of both wings. And
unlike the original design of the wing joint where wood screws were used to connect the
wooden joiner block to the wings, the current X-HALE joint employs a nut and bolt
design which may present additional levels of complexity throughout its components.
Regardless, appropriate contact surfaces will surely play a role in the fidelity of the
model and adequate time should therefore be allocated towards that work.
Overall, this effort resulted in improved levels of confidence in how to
appropriately apply the crucial steps of creating and working with FE models. Although
important, these are only the early steps of the FE modeling process. Much work remains
before a model can be used to fully analyze X-HALE's behavior in its anticipated
environment. Work on the model of the joined two-wing section should be extended to a
level at least equal to that which was conducted on the sing wing model. Finite element
analysis could also be performed for the torsion tests to which the single and joined wing
sections were subjected. And analysis of the bending and torsion tests should be
122
performed for both directions, as was done in the laboratory. However, the ultimate goal
of creating a FE model of X-HALE was to compare its results to those obtained from
actual flight tests. As with most flight test programs, delays prevented gathering any
flight data at the time of this writing. But this end goal should not be ignored, and work
should be continued to provide a more mature model by the time flight tests commence.
While this limited set of finite element models cannot be considered validated for the
purposes of characterizing X-HALE or its components, it does provide a starting point
from which to continue as well as a set of lessons learned which will hopefully save time
as this effort progresses.
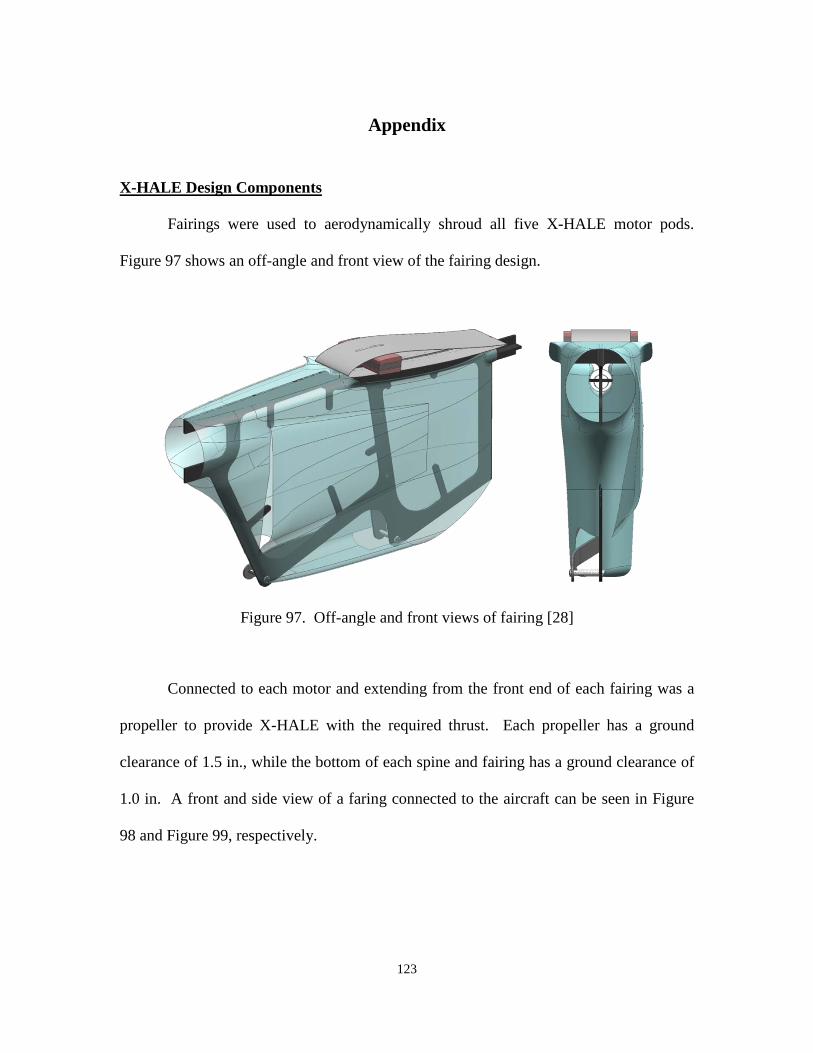
123
Appendix
X-HALE Design Components
Fairings were used to aerodynamically shroud all five X-HALE motor pods.
Figure 97 shows an off-angle and front view of the fairing design.
Figure 97. Off-angle and front views of fairing [28]
Connected to each motor and extending from the front end of each fairing was a
propeller to provide X-HALE with the required thrust. Each propeller has a ground
clearance of 1.5 in., while the bottom of each spine and fairing has a ground clearance of
1.0 in. A front and side view of a faring connected to the aircraft can be seen in Figure
98 and Figure 99, respectively.
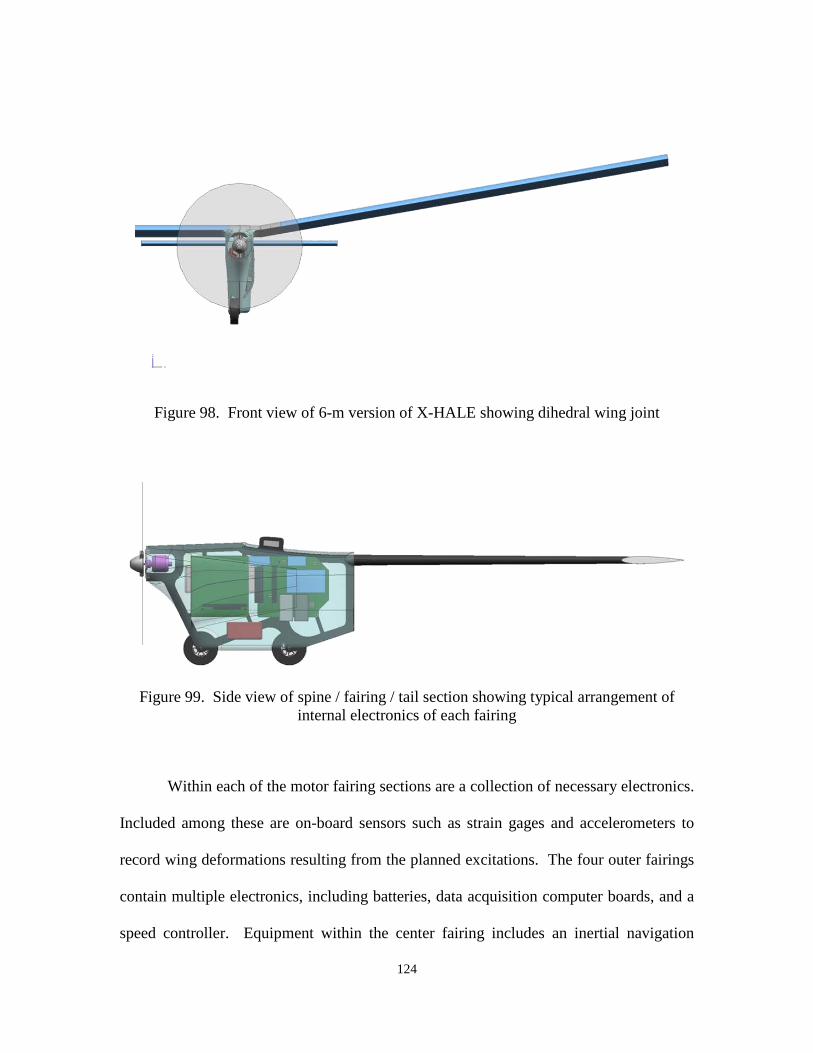
124
Figure 98. Front view of 6-m version of X-HALE showing dihedral wing joint
Figure 99. Side view of spine / fairing / tail section showing typical arrangement of internal electronics of each fairing
Within each of the motor fairing sections are a collection of necessary electronics.
Included among these are on-board sensors such as strain gages and accelerometers to
record wing deformations resulting from the planned excitations. The four outer fairings
contain multiple electronics, including batteries, data acquisition computer boards, and a
speed controller. Equipment within the center fairing includes an inertial navigation
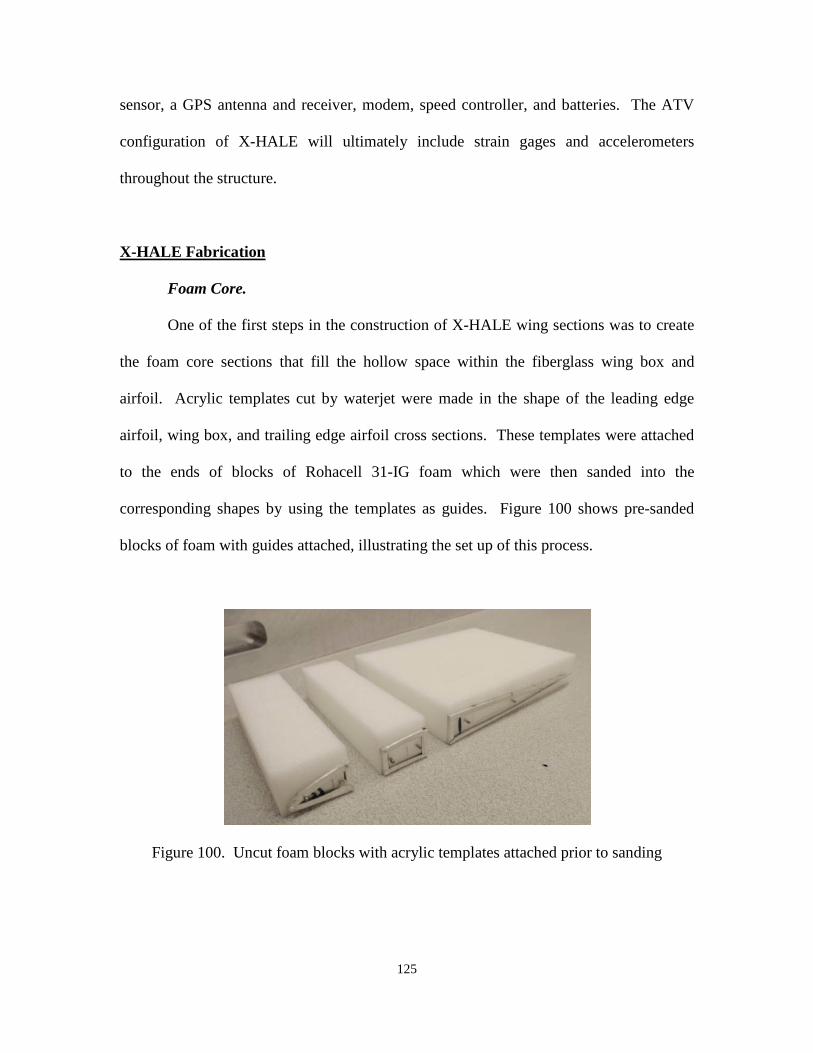
125
sensor, a GPS antenna and receiver, modem, speed controller, and batteries. The ATV
configuration of X-HALE will ultimately include strain gages and accelerometers
throughout the structure.
X-HALE Fabrication
Foam Core.
One of the first steps in the construction of X-HALE wing sections was to create
the foam core sections that fill the hollow space within the fiberglass wing box and
airfoil. Acrylic templates cut by waterjet were made in the shape of the leading edge
airfoil, wing box, and trailing edge airfoil cross sections. These templates were attached
to the ends of blocks of Rohacell 31-IG foam which were then sanded into the
corresponding shapes by using the templates as guides. Figure 100 shows pre-sanded
blocks of foam with guides attached, illustrating the set up of this process.
Figure 100. Uncut foam blocks with acrylic templates attached prior to sanding
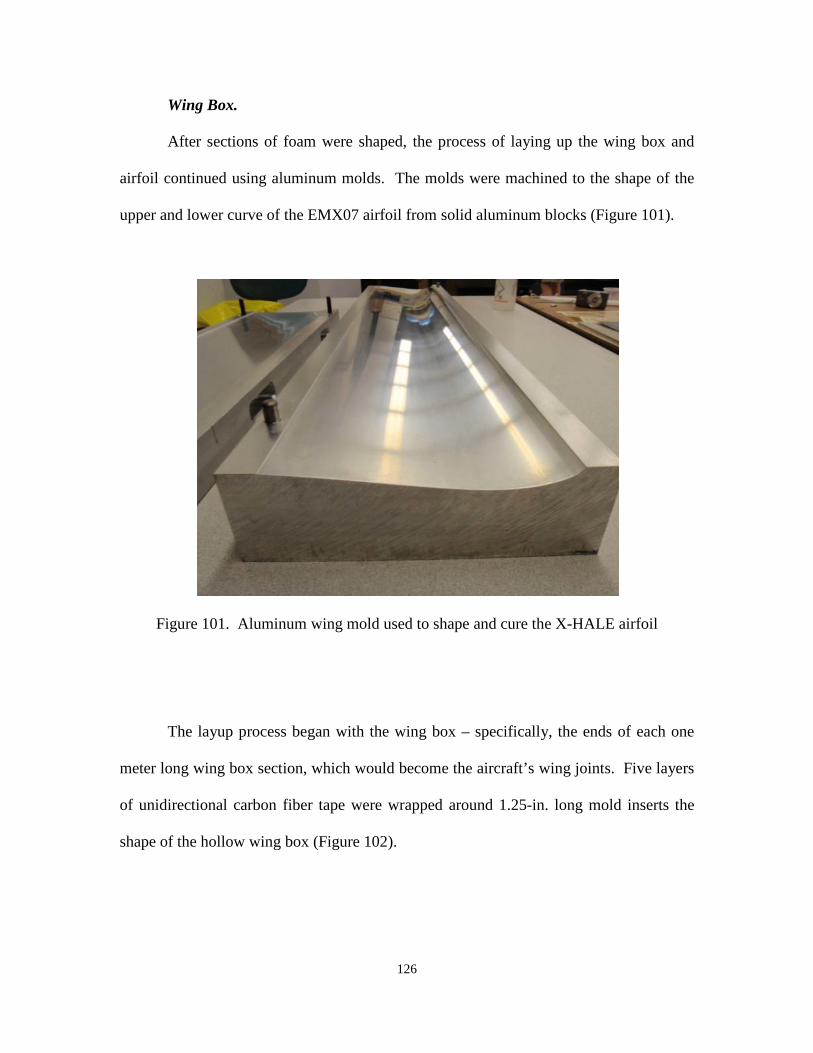
126
Wing Box.
After sections of foam were shaped, the process of laying up the wing box and
airfoil continued using aluminum molds. The molds were machined to the shape of the
upper and lower curve of the EMX07 airfoil from solid aluminum blocks (Figure 101).
Figure 101. Aluminum wing mold used to shape and cure the X-HALE airfoil
The layup process began with the wing box – specifically, the ends of each one
meter long wing box section, which would become the aircraft’s wing joints. Five layers
of unidirectional carbon fiber tape were wrapped around 1.25-in. long mold inserts the
shape of the hollow wing box (Figure 102).
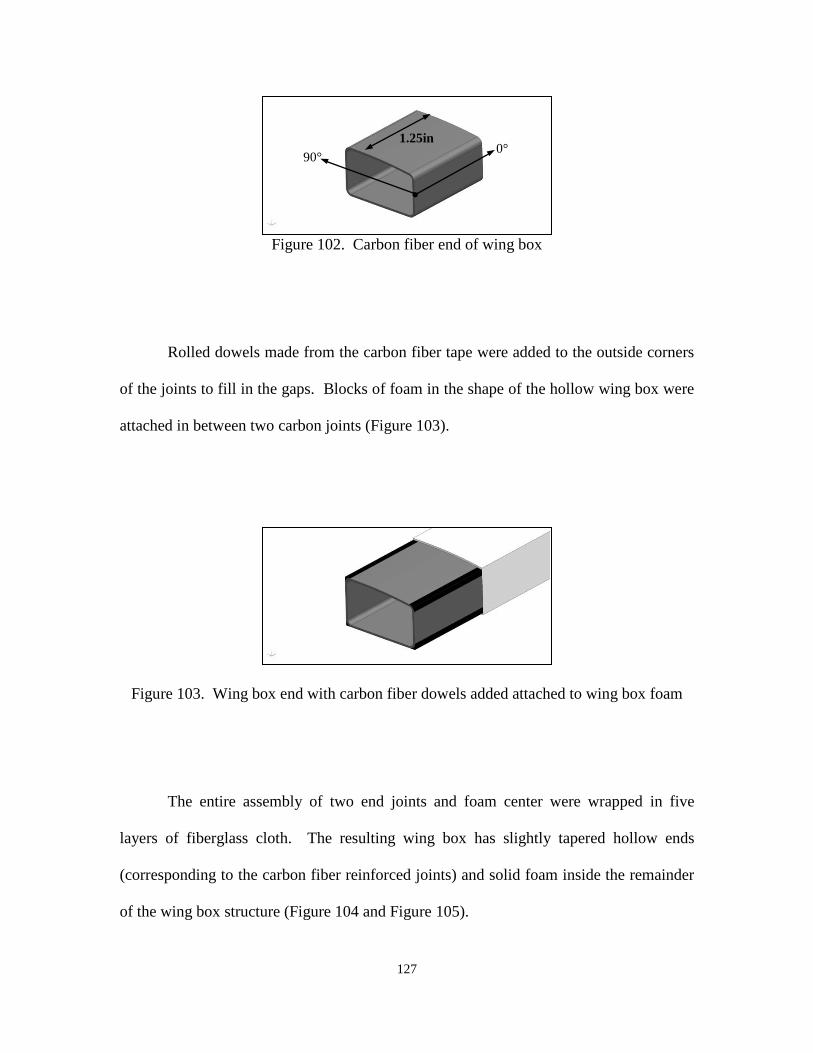
127
Figure 102. Carbon fiber end of wing box
Rolled dowels made from the carbon fiber tape were added to the outside corners
of the joints to fill in the gaps. Blocks of foam in the shape of the hollow wing box were
attached in between two carbon joints (Figure 103).
Figure 103. Wing box end with carbon fiber dowels added attached to wing box foam
The entire assembly of two end joints and foam center were wrapped in five
layers of fiberglass cloth. The resulting wing box has slightly tapered hollow ends
(corresponding to the carbon fiber reinforced joints) and solid foam inside the remainder
of the wing box structure (Figure 104 and Figure 105).
0° 90°
1.25in
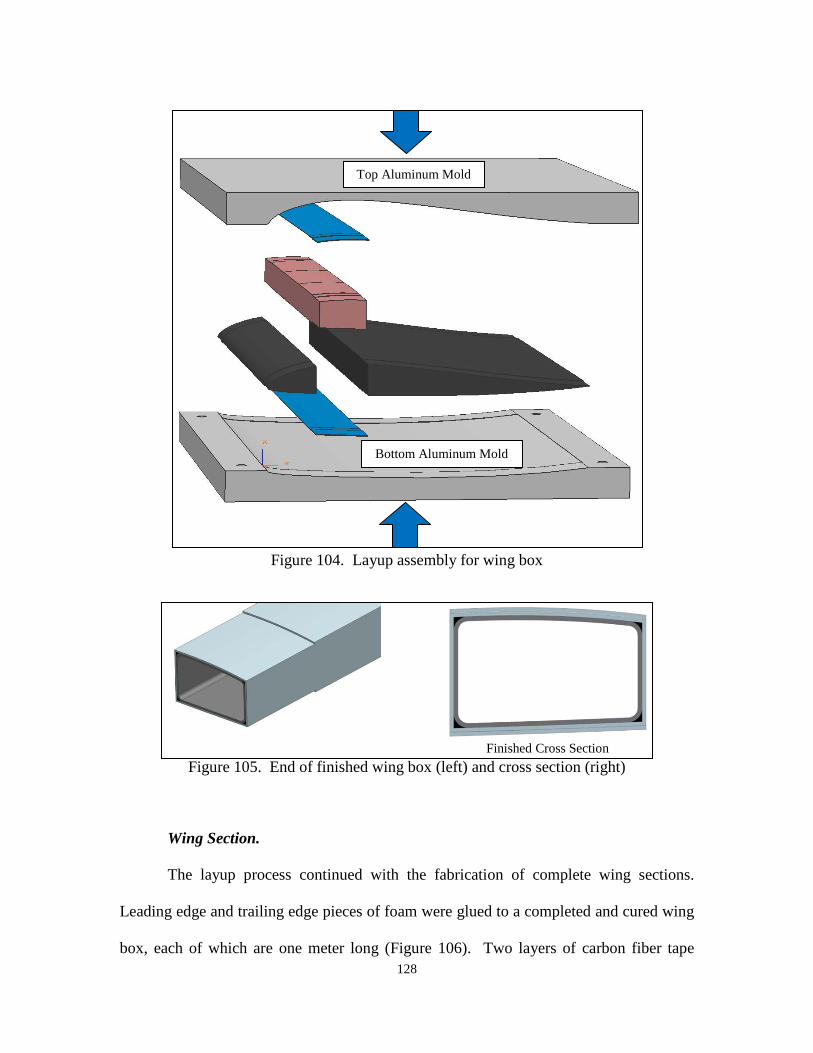
128
Figure 104. Layup assembly for wing box
Figure 105. End of finished wing box (left) and cross section (right)
Wing Section.
The layup process continued with the fabrication of complete wing sections.
Leading edge and trailing edge pieces of foam were glued to a completed and cured wing
box, each of which are one meter long (Figure 106). Two layers of carbon fiber tape
Finished Cross Section
Top Aluminum Mold
Bottom Aluminum Mold
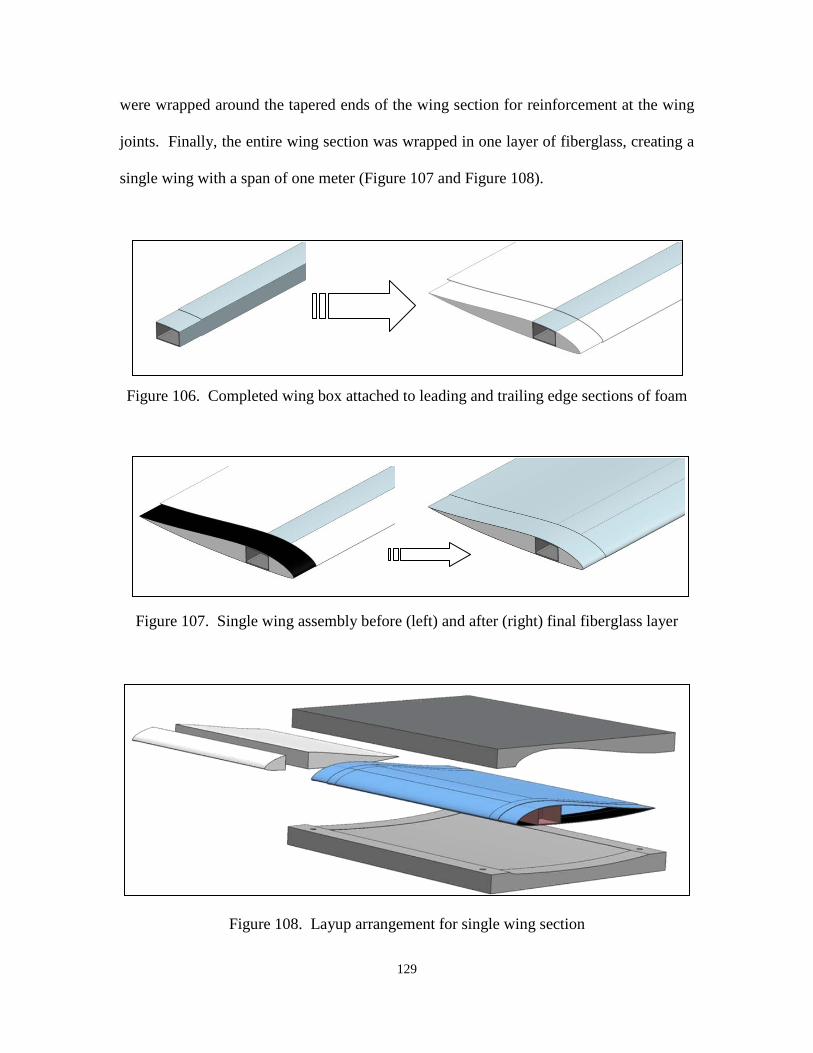
129
were wrapped around the tapered ends of the wing section for reinforcement at the wing
joints. Finally, the entire wing section was wrapped in one layer of fiberglass, creating a
single wing with a span of one meter (Figure 107 and Figure 108).
Figure 106. Completed wing box attached to leading and trailing edge sections of foam
Figure 107. Single wing assembly before (left) and after (right) final fiberglass layer
Figure 108. Layup arrangement for single wing section
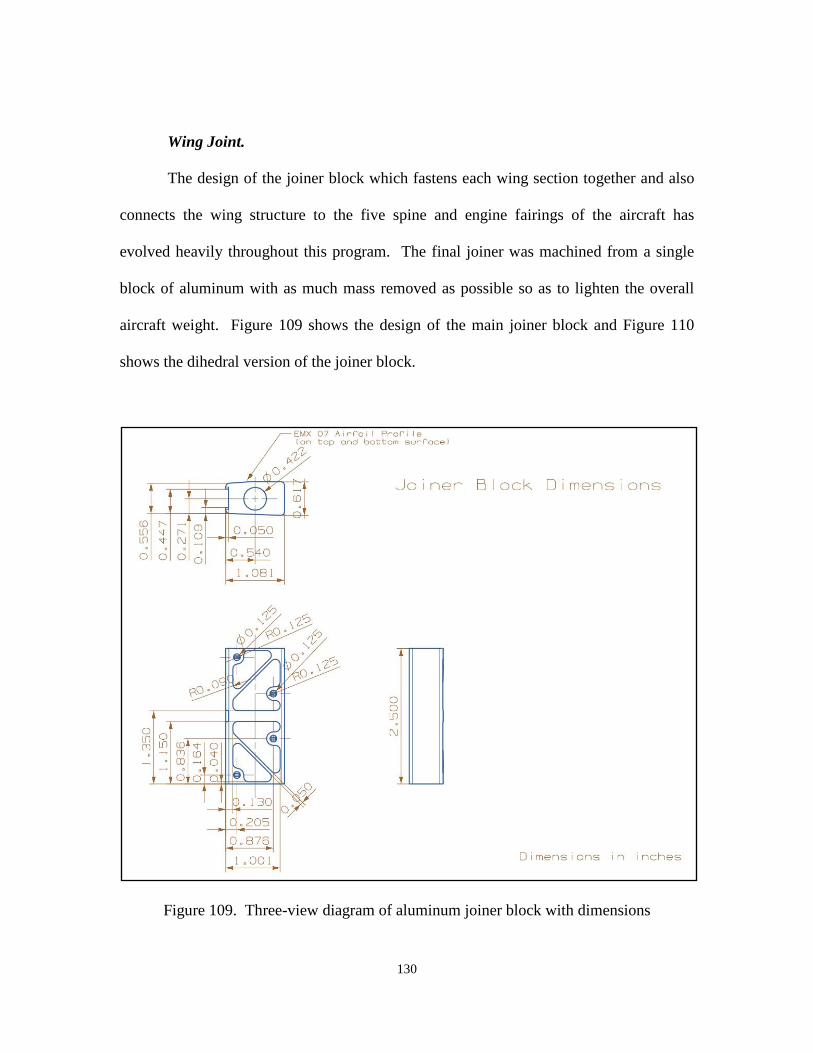
130
Wing Joint.
The design of the joiner block which fastens each wing section together and also
connects the wing structure to the five spine and engine fairings of the aircraft has
evolved heavily throughout this program. The final joiner was machined from a single
block of aluminum with as much mass removed as possible so as to lighten the overall
aircraft weight. Figure 109 shows the design of the main joiner block and Figure 110
shows the dihedral version of the joiner block.
Figure 109. Three-view diagram of aluminum joiner block with dimensions
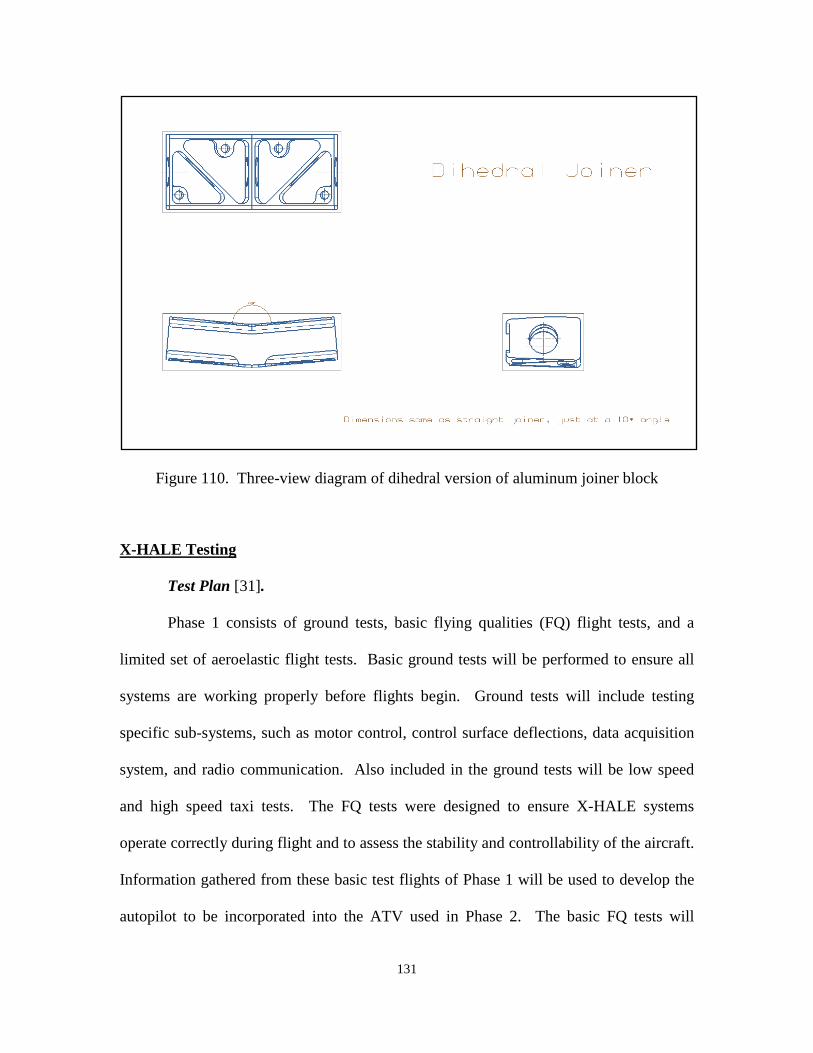
131
Figure 110. Three-view diagram of dihedral version of aluminum joiner block
X-HALE Testing
Test Plan [31].
Phase 1 consists of ground tests, basic flying qualities (FQ) flight tests, and a
limited set of aeroelastic flight tests. Basic ground tests will be performed to ensure all
systems are working properly before flights begin. Ground tests will include testing
specific sub-systems, such as motor control, control surface deflections, data acquisition
system, and radio communication. Also included in the ground tests will be low speed
and high speed taxi tests. The FQ tests were designed to ensure X-HALE systems
operate correctly during flight and to assess the stability and controllability of the aircraft.
Information gathered from these basic test flights of Phase 1 will be used to develop the
autopilot to be incorporated into the ATV used in Phase 2. The basic FQ tests will
132
include maneuvers such as take-off, turning, climb, cruise, descend, and land. Turning
will be tested using various methods, including differential thrust and/or aileron inputs, to
determine optimal methods of aircraft control. The aeroelastic flight tests will consist of
a set of preprogrammed elevon inputs designed to excite predicted nonlinearities in the
structural and rigid body nonlinear flight dynamics.
Phase 2 of X-HALE testing was planned to consist of advanced flight tests
designed to stress the nonlinear coupled rigid body dynamics of the aircraft. These
follow on tests will be conducted for NAST code validation.
The overall objective of the test plan is to ensure X-HALE is controllable and
exhibits predicted Dutch-roll response under large excitations of the aileron. At the same
time, information about the magnitude of airborne control inputs required to produce the
desired nonlinear behavior will be collected. Additionally, the tests were designed to
demonstrate acceptable data acquisition, storage, and transmission characteristic of the
onboard systems. The test plan was designed for all maneuvers and objective to be
completed with X-HALE initially assembled in a 6-m configuration, after which the
sequence of maneuvers will be repeated by an 8-m configuration of X-HALE. There will
be approximately five hours of flight tests during Phase 1 of the test plan.
Previous Tests [31].
Aside from the formal Phase 1 and Phase 2 portions of the test plan, several
preliminary tests were conducted to predict the performance of X-HALE and what
structural deflections the aircraft would experience in-flight. The physical bench tests
included mass and stiffness testing of aircraft components, propeller performance testing
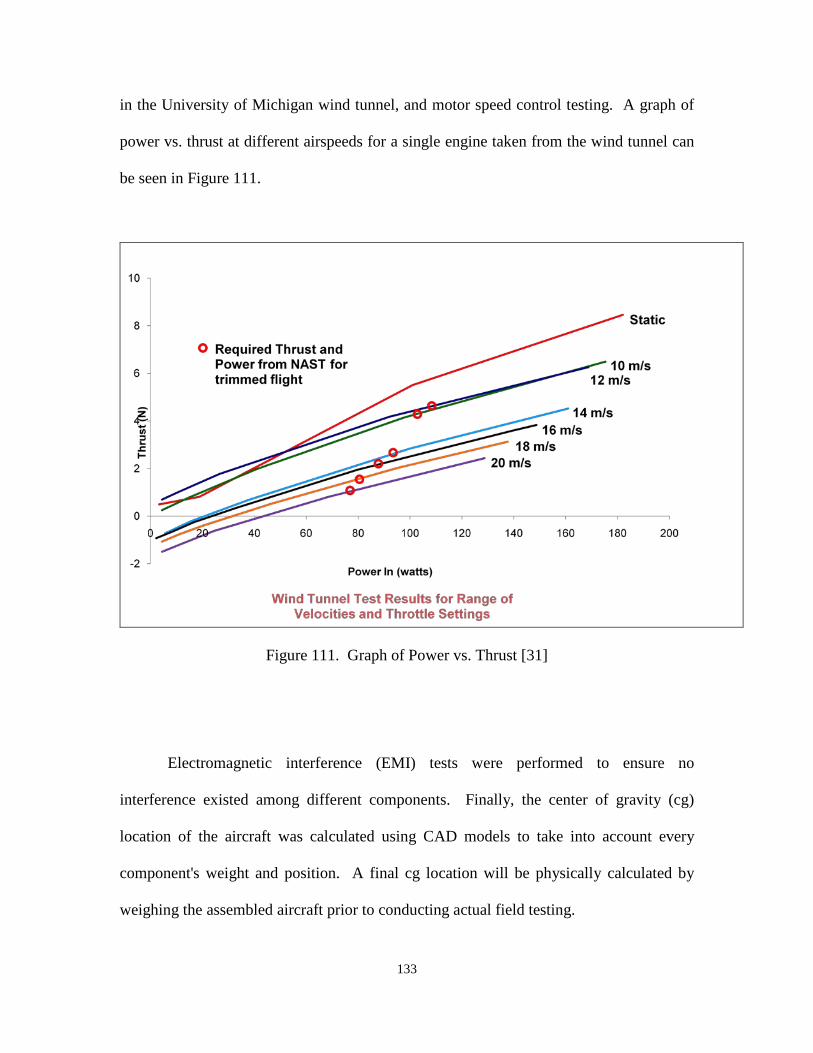
133
in the University of Michigan wind tunnel, and motor speed control testing. A graph of
power vs. thrust at different airspeeds for a single engine taken from the wind tunnel can
be seen in Figure 111.
Figure 111. Graph of Power vs. Thrust [31]
Electromagnetic interference (EMI) tests were performed to ensure no
interference existed among different components. Finally, the center of gravity (cg)
location of the aircraft was calculated using CAD models to take into account every
component's weight and position. A final cg location will be physically calculated by
weighing the assembled aircraft prior to conducting actual field testing.
134
For all phases of testing, the X-HALE FTV will be operated as a remotely piloted
aircraft (RPA). The designated pilot will operate the vehicle using R/C controls, taking
off and landing on a prepared runway surface. To take off, the pilot will smoothly
increase throttles to full power during the take-off roll. When the aircraft reaches a speed
of approximately 15 m/s the pilot will command the aircraft to pitch up and climb away
from the ground. The predicted stall speed for the aircraft is 10 m/s and onboard batteries
will provide sufficient power for approximately 45 minutes of flight time before reaching
roughly 80% discharged. X-HALE was designed to land normally on a runway. With no
braking system incorporated into the design, it will simply roll to a stop after landing. An
estimated 300 feet of runway will be required to land and stop. The pilot will use
differential thrust to maintain directional control during take-off and landing
135
Bibliography
[1] "AeroVironment, Inc.: Global Observer - Stratospheric Persistent UAS (Unmanned Aircraft System)," [http://www.avinc.com/globalobserver/, Accessed 5/7/2011.]
[2] "Boeing Feature Story: Phantom Eye High Altitude Long Endurance aircraft unveiled," [http://www.boeing.com/Features/2010/07/bds_feat_phantom_eye_07_12_10.html, Accessed 4/3/2011.]
[3] "Unmanned Systems Integrated Roadmap, FY2009 - 2034," 2009.
[4] "CYTEC Industries," [https://b2b.cytec.com/engineered-materials/products/Cycom381.htm, Accessed 3/2/2011.]
[5] "ASM Material Data Sheet," [http://asm.matweb.com/search/SpecificMaterial.asp?bassnum=MA6061t6, Accessed 4/3/2011.]
[6] "ROHACELL® IG/ IG-F: Specification," [http://www.rohacell.com/product/rohacell/en/products-services/rohacell-ig-ig-f/pages/default.aspx, Accessed 2/17/2011.]
[7] Anderson, J.D., "Introduction to flight," McGraw-Hill, New York, 2007.
[8] Cesnik, C.E.S., and Su, W., "Nonlinear Aeroelastic Simulation of X-HALE: a Very Flexible UAV," 49th AIAA Aerospace Sciences Meeting including the New Horizons Forum and Aerospace Exposition, Orlando, Florida, American Institute of Aeronautics and Astronautics, Inc., 2011.
[9] Cesnik, C.E.S., Senatore, P.J., Su, W., "X-HALE: A Very Flexible UAV for Nonlinear Aeroelastic Tests," 51st AIAA/ASME/ASCE/AHS/ASC Structures, Structural Dynamics, and Materials Conference, 2010.
[10] Cesnik, C.E.S., and Su, W., "Nonlinear Aeroelastic Modeling and Analysis of Fully Flexible Aircraft," 46 th AIAA/ASME/ASCE/AHS/ASC Structures, Structural Dynamics, and Materials Conference, 2005.
[11] Colella, N.J., and Wenneker, G.S., "Pathfinder and the development of solar rechargeable aircraft," Energy and Technology Review, 1994, pp. 1–9.
[12] DARPA, "NewsReleaseVultureII.pdf (application/pdf Object)," [http://www.darpa.mil/news/2010/NewsReleaseVultureII.pdf, Accessed 2/15/2011.]
136
[13] DARPA, "Vulture Program, Broad Agency Announcement (BAA) Solicitation 07-51," Defense Advanced Research Projects Agency, Arlington, VA, 2007.
[14] Davis, J.R. ed., "Aluminum and Aluminum Alloys," ASM International, Materials Park, OH, 1993.
[15] Galante,N. and Tschida,T., "NASA Dryden Helios Photo Collection," [http://www.dfrc.nasa.gov/gallery/photo/Helios/index.html, Accessed 4/15/2011.]
[16] Gosz, M.R., "Finite Element Method: Applications in Solids, Structures, and Heat Transfer," CRC Press, Boca Raton, FL, 2006.
[17] Hallissy, B.P., and Cesnik, C.E.S., "High-fidelity Aeroelastic Analysis of Very Flexible Aircraft," 52nd AIAA/ASME/ASCE/AHS/ASC Structures, Structural Dynamics and Materials Conference, 2011.
[18] Kaszynski, A.A., "X-HALE: THE DEVELOPMENT OF A RESEARCH PLATFORM FOR THE VALIDATION OF NONLINEAR AEROELASTIC CODES," 2011.
[19] Kim, N., and Sankar, B.V., "Introduction to Finite Element Analysis and Design," Wiley, New York, 2009.
[20] Matthews, J., "X-HALE Wing Characterization Rig Design Report," 2010.
[21] Matthews, J., "X-HALE Wing Testing Progress Report," 2010.
[22] Noll, T.E., Ishmael, S.D., Henwood, B., "Technical Findings, Lessons Learned, and Recommendations Resulting from the Helios Prototype Vehicle Mishap," UAV Design Processes / Design Criteria for Structures, Vol. RTO-MP-AVT-145, 2007.
[23] Noll, T.E., Brown, J.M., Perez-Davis, M.E., "Investigation of the Helios Prototype Aircraft Mishap," 2004, January, [http://www.nasa.gov/pdf/64317main_helios.pdf, Accessed 4/17/2011.]
[24] Palacios, R., Cesnik, C.E.S., and Reichenbach, E.Y., "Re-examined Structural Design Procedures for Very Flexible Aircraft," 2007 International Forum of Aeroelasticity and Structural Dynamics, 2007.
[25] Patil, M.J., Hodges, D.H., and Cesnik, C.E.S., "Nonlinear Aeroelasticity and Flight Dynamics of High-Altitude Long-Endurance Aircraft," Journal of Aircraft, Vol. 38, No. 1, 2001, pp. 88-94.
[26] Seely,O. ," "Physical Properties of Common Woods," [http://www.csudh.edu/oliver/chemdata/woods.htm, Accessed 5/17/2011.]
137
[27] Senatore, P.J., "JoinerBlock.pdf," 2009.
[28] Senatore, P.J., Cesnik, C.E.S., and Su, W., "X-HALE Experimental Aircraft Project Overview and Progress, XHALE Overview.ppt," 2009.
[29] Senatore, P.J., "Wing Layup read me.doc,"
[30] Shearer, C.M., and Cesnik, C.E.S., "Nonlinear flight dynamics of very flexible aircraft," Journal of Aircraft, Vol. 44, No. 5, 2007, pp. 1528-1545.
[31] Shearer, C., Cesnik, C., and Haag, C., "Experimental High Altitude Long Endurance (X-HALE) Flight Test Plan Phase 1," 2010, 11 November.
[32] Su, W., and Cesnik, C.E.S., "Nonlinear Aeroelasticity of a Very Flexible Blended-Wing-Body Aircraft," Journal of Aircraft, Vol. 47, No. 5, 2010, pp. 1539-1553.
[33] Su, W., and Cesnik, C.E.S., "Dynamic Response of Highly Flexible Flying Wings," 47th AIAA/ASME/ASCE/AHS/ASC Structures, Structural Dynamics, and Materials Conference / 14th AIAA/ASME/AHS Adaptive Structures Conference, 2006.
[34] Truss, L., "Eats, shoots, and leaves," Gotham, 2003.
[35] Wang, Z., Chen, P., Liu, D., "Nonlinear Aeroelastic Analysis for A HALE Wing Including Effects of Gust and Flow Separation," 48th AIAA/ASME/ASCE/AHS/ASC Structures, Structural Dynamics, and Materials Conference, 2007.
[36] Wilson, J., "Fly Like a Vulture," Aerospace America, 2008, pp. 28-33.
138
Vita
LCDR Nicholas A. Sinnokrak conducted his undergraduate studies at the
University of Illinois in Urbana-Champaign under the NROTC scholarship program. He
earned a Bachelor of Science degree in Aeronautical and Astronautical Engineering and
was commissioned an Ensign in December 2000. After completing flight training at
NAS Pensacola, he was designated a Naval Flight Officer in August 2002 and assigned to
Sea Control Squadron FOUR ONE (VS-41) at NAS North Island, CA for Fleet
Replacement training in the S-3B Viking.
In July 2003 he was assigned to Sea Control Squadron THREE THREE (VS-33)
where he completed two deployments aboard the aircraft carrier USS CARL VINSON
(CVN-70). Remaining in San Diego, in July 2006 he reported to PEO C4I at SPAWAR
where he served as Deputy Assistant Program Manager for the Air GPS program within
the Navy's Communication and Navigation Program Office (PMW/A-170).
In August 2009 he began his graduate work at the Air Force Institute of
Technology in the Department of Aeronautics and Astronautics. Upon completing his
degree he will report to U.S. Navy Test Pilot School to begin the Airborne Systems Test
program.
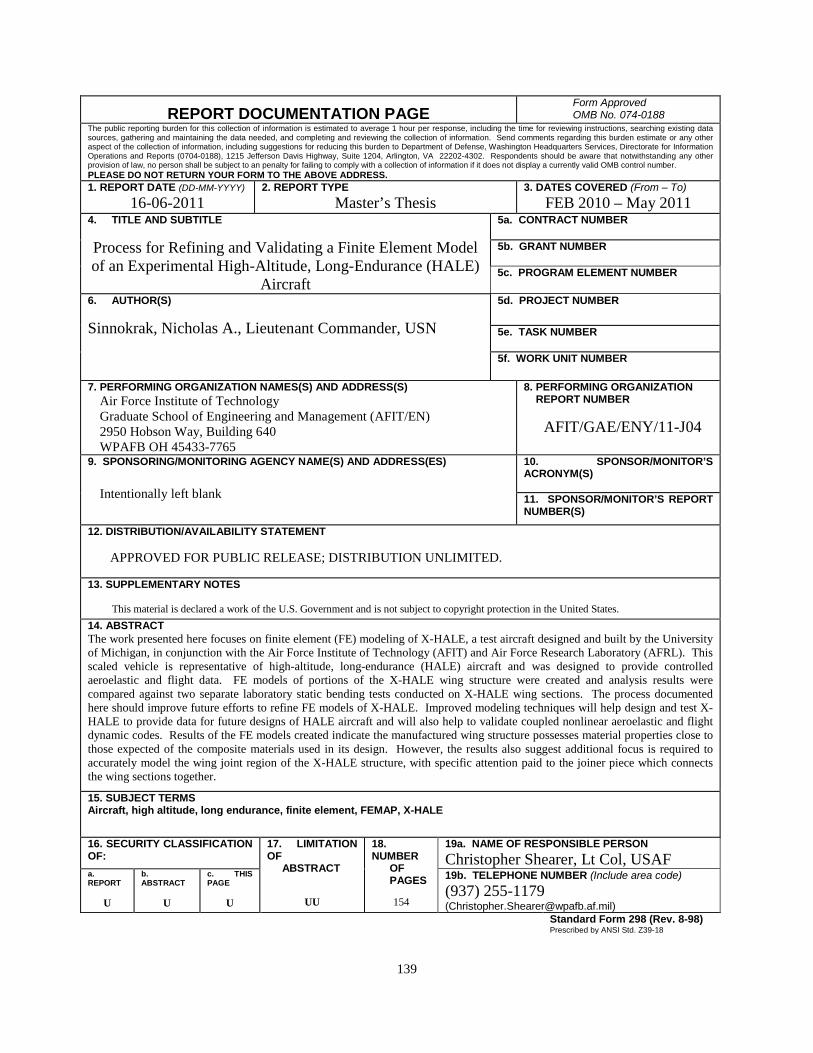
139
REPORT DOCUMENTATION PAGE Form Approved OMB No. 074-0188
The public reporting burden for this collection of information is estimated to average 1 hour per response, including the time for reviewing instructions, searching existing data sources, gathering and maintaining the data needed, and completing and reviewing the collection of information. Send comments regarding this burden estimate or any other aspect of the collection of information, including suggestions for reducing this burden to Department of Defense, Washington Headquarters Services, Directorate for Information Operations and Reports (0704-0188), 1215 Jefferson Davis Highway, Suite 1204, Arlington, VA 22202-4302. Respondents should be aware that notwithstanding any other provision of law, no person shall be subject to an penalty for failing to comply with a collection of information if it does not display a currently valid OMB control number. PLEASE DO NOT RETURN YOUR FORM TO THE ABOVE ADDRESS. 1. REPORT DATE (DD-MM-YYYY)
16-06-2011 2. REPORT TYPE
Master’s Thesis 3. DATES COVERED (From – To)
FEB 2010 – May 2011 4. TITLE AND SUBTITLE Process for Refining and Validating a Finite Element Model of an Experimental High-Altitude, Long-Endurance (HALE)
Aircraft
5a. CONTRACT NUMBER
5b. GRANT NUMBER 5c. PROGRAM ELEMENT NUMBER
6. AUTHOR(S) Sinnokrak, Nicholas A., Lieutenant Commander, USN
5d. PROJECT NUMBER 5e. TASK NUMBER
5f. WORK UNIT NUMBER
7. PERFORMING ORGANIZATION NAMES(S) AND ADDRESS(S) Air Force Institute of Technology Graduate School of Engineering and Management (AFIT/EN) 2950 Hobson Way, Building 640 WPAFB OH 45433-7765
8. PERFORMING ORGANIZATION REPORT NUMBER AFIT/GAE/ENY/11-J04
9. SPONSORING/MONITORING AGENCY NAME(S) AND ADDRESS(ES)
Intentionally left blank
10. SPONSOR/MONITOR’S ACRONYM(S) 11. SPONSOR/MONITOR’S REPORT NUMBER(S)
12. DISTRIBUTION/AVAILABILITY STATEMENT APPROVED FOR PUBLIC RELEASE; DISTRIBUTION UNLIMITED.
13. SUPPLEMENTARY NOTES This material is declared a work of the U.S. Government and is not subject to copyright protection in the United States. 14. ABSTRACT The work presented here focuses on finite element (FE) modeling of X-HALE, a test aircraft designed and built by the University of Michigan, in conjunction with the Air Force Institute of Technology (AFIT) and Air Force Research Laboratory (AFRL). This scaled vehicle is representative of high-altitude, long-endurance (HALE) aircraft and was designed to provide controlled aeroelastic and flight data. FE models of portions of the X-HALE wing structure were created and analysis results were compared against two separate laboratory static bending tests conducted on X-HALE wing sections. The process documented here should improve future efforts to refine FE models of X-HALE. Improved modeling techniques will help design and test X-HALE to provide data for future designs of HALE aircraft and will also help to validate coupled nonlinear aeroelastic and flight dynamic codes. Results of the FE models created indicate the manufactured wing structure possesses material properties close to those expected of the composite materials used in its design. However, the results also suggest additional focus is required to accurately model the wing joint region of the X-HALE structure, with specific attention paid to the joiner piece which connects the wing sections together.
15. SUBJECT TERMS Aircraft, high altitude, long endurance, finite element, FEMAP, X-HALE 16. SECURITY CLASSIFICATION OF:
17. LIMITATION OF ABSTRACT
UU
18. NUMBER OF PAGES
154
19a. NAME OF RESPONSIBLE PERSON Christopher Shearer, Lt Col, USAF
a. REPORT
U
b. ABSTRACT
U
c. THIS PAGE
U
19b. TELEPHONE NUMBER (Include area code) (937) 255-1179 ([email protected])
Standard Form 298 (Rev. 8-98) Prescribed by ANSI Std. Z39-18