agricultural technology economic viability and poverty alleviation
TRANSCRIPT

AGRICULTURAL TECHNOLOGY, ECONOMIC VIABILITY
AND POVERTY ALLEVIATION IN KENYA
By
W. Oluoch-Kosura1, E.S. Ariga1, A.M. Okeyo1, M.M. Waithaka2 and A.M.
Kyalo3
1University of Nairobi, College of Agriculture and Veterinary Sciences, P.O. Box29053, Nairobi, Kenya.2 Kenya Agricultural Research Institute Headquarters, P. O. Box 57811 Nairobi,Kenya3 Ministry of Agriculture Headquarters, P. O. Box 30028 Nairobi, Kenya.
A paper for the Agricultural Transformation Policy in Sub-Saharan AfricaWorkshop held at Serena Hotel, Nairobi, Kenya. on 27-30 June, 1999

2}}
Table of contents
INTRODUCTION ............................................................................................................................................ 4
1.1 BACKGROUND........................................................................................................................................... 41.2 THE PROBLEM ........................................................................................................................................... 51.3 THE OBJECTIVES........................................................................................................................................ 8
2. APPROACHES AND METHODS ADOPTED FOR THE STUDY ........................................................... 9
2.1 FORMATION OF STUDY TEAM...................................................................................................................... 92.2 LITERATURE REVIEW AND ANALYSIS........................................................................................................... 9
3. ANALYSIS OF TECHNOLOGIES ........................................................................................................... 10
3.1 MAIZE PRODUCTION TECHNOLOGY AND TECHNOLOGY PACKAGE. ............................................................. 103.1.1 Maize Seed and Fertilizer Technology ............................................................................................ 103.1.2 Policy implications for increased fertilizer utilization and maize production .................................. 16
3.5 IMPROVED LIVESTOCK SEED-STOCK TECHNOLOGIES. ................................................................................. 193.5.1 Artificial Insemination.................................................................................................................... 193.5.2 Role of AI in elevating poor peasant livestock keepers to commercial small scale dairy farmers level213.5.3 Some policy Implications for Livestock Improvement Research. ..................................................... 26
3.6 IMPROVED SMALL SCALE DAIRY TECHNOLOGY PACKAGE ........................................................................... 273.6.1 The zero grazing system.................................................................................................................. 273.6.1.1 Advantages of zero grazing.......................................................................................................... 273.6.1.2 Problems associated with zero grazing......................................................................................... 283.6.1.3 The zero grazing technology package components ....................................................................... 283.6.2 Gross margin analysis of Zero-grazing as technology package ....................................................... 293.6.3 Policy implications ......................................................................................................................... 52
4. RESEARCH-EXTENSION LINKAGES AND OTHER FACTORS IN TECHNOLOGY ADOPTION 54
4.1 RESEARCH-EXTENSION LINKAGE ............................................................................................................. 544.2 OTHER FACTORS AFFECTING TECHNOLOGY APPLICATION ON FARMS......................................................... 55
5. GENERAL CONCLUSION AND RECOMMENDATIONS .................................................................... 56
6. REFERENCES ........................................................................................................................................... 57
List of Tables
Table 1. Average growth rates in maize area, yield, and adoption of improved seed and fertilizerin Kenya, 1963-91..............................................11
Table 2. Economic analysis for growing maize using farmer's practice and recommendedpackages during short rains 1994/5, long rains 1995 and short rains 1995/6 in Upper-Midland 2 of Central Kenya .......................................12
Table 3. The value cost ratio and profit due to fertilizer application in maize in West Pokot(Kaibos - LH 2) in 1997. .........................................13
Table 4. The value cost ratio and profit due to fertilizer application in maize in Trans Nzoia(Tulwet) in 1997...............................................14
Table 5. Profitability of fertilizer use in maize according to agroecological zones, 1998.....15Table 6 Characteristics of Ruiru 11 compared to that of SL 28 coffee variety. ..........18Table 7 Profitability of SL and Ruiru 11 varieties in Ksh/ha during their fifth year and peak of
production after establishment on new land .............................18Table 8. Number of artificial inseminations carried out by KNAIS, 1984-97............21Table 9 Estimated gross margin analysis of AI service when inseminator uses motorbike and

3}}
moped .....................................................25Table 10. Reference small-scale dairy farming situation .........................30Table 11. Gross margin of milk production under zero grazing conditions.............31Table 12. Research expenditures as percentage of AGDP and contribution of GoK and donors.54
List of FiguresFigure 1. Percentage distribution of absolute poverty by percent number of people in Kenya..7Figure 2. Number of artificial inseminations (‘000) carried out by the Kenya National Artificial
Insemination Services (KNAIS) and private firms in Kenya: 1971-1997 ...........22

4}}
INTRODUCTION
1.1 Background.The major challenges facing Kenya today are poverty and unemployment. About 50% of the
rural population and 30% of the urban population live below the poverty line. With 80% of the
population being rural the poverty problem is overwhelming. The country has been unable to
generate adequate employment and wage employment has been declining over the recent past.
While in the 1970s the growth rate of employment was about 4% per annum, in the current
decade, the growth rate has been about 1.9% per annum, which is below the population growth
rate estimated at about 3%. The country has also witnessed declining growth in income per
capita. While in the 1960s per capita income grew at 2.6% p.a. this declined to 0.4% in 1980s.
Between 1990 and 95 the decline was even more dramatic at negative 0.3% (Kenya, 1997).
The poverty line is defined here as the value of consumption of food and non-food items below
which individuals cannot afford the recommended energy intake plus a minimum allowance for
non-food consumption. The poverty line has been estimated at about US$ 200 and 300 for
rural and urban areas respectively (GoK, 1998). This translates to less than one US$ per day.
Of Kenya’s total land area of 57.6 million hectares, 9.4 million or about 16% is classified as
high and medium potential land for agriculture. The remaining area estimated at 84% makes up
the arid and semi arid lands (ASALs). Out of the ASALs 48 million hectares, about 9 million
hectares can support crop production, 15 million hectares is adequate for livestock production
while the rest is dry and only useful for nomadic pastoralism. The ASAL supports about 20%
of the population, 50% of livestock and 3% of current agricultural output and 7% of
commercial output. ASALs have low natural fertility which are prone to compaction and
vulnerable to erosion.
The agriculture sector dominates the economy and contributes virtually to all the stated national
goals including achievement of national and household food security, industrialization by year
2020 as well as provision of employment opportunities. Currently, agriculture accounts for
about one-third of the gross domestic product, employs more than two-thirds of the labour
force, accounts for almost 70% of the export earnings (excluding refined petroleum), generates
the bulk of the country's food requirements and provides significant proportion of raw materials
for the agricultural based industrial sector. Overall, the smallholder sub-sector contributes about
75% of the total value of agricultural output, 55% of the marketed agricultural output and
provides just over 85% of the total employment in agriculture.

5}}
The sector’s ability to contribute effectively to the national goals hinges on identifying and
implementing measures which promote high and sustainable growth rate. Mellor (1990)
asserted that agricultural productivity growth is normally the major source of sustained
improvements in rural welfare. Three sources of agricultural growth can be identified in Kenya.
One is the expansion of cultivated area. The second is substitution or switching towards higher
valued commodities. The third is intensification. The first source of agricultural growth is
currently extremely limited. The cultivable land available to open up has diminished over the
years with rapidly rising population estimated at about 3% per annum to the extent that the land
holdings are becoming sub-optimal economic units and there is ever increasing temptation to
migrate to the marginal and fragile zone. Moreover, irrigation development which could help in
increasing cultivable land has been very slow due to the seemingly high cost associated with it.
Commodity substitution will contribute significantly to growth only if the input and output
markets function in a way to allow the producers and the private sectors respond appropriately
to the market signals. This is expected to occur if the on-going structural adjustment
programmes succeed in limiting government intervention to its core functions (of public good
nature) and allowing the private sector to take up the production, marketing and distribution
role. Most agricultural growth will therefore come from the third source: increased output per
unit land area. The realization of this growth potential will hinge on shifting rapidly from
resource based to science and knowledge-based agriculture. The objective of this paper is to
analyze the potential for agricultural technology to solve one of Kenya’s biggest challenges,
alleviation of poverty.
1.2 The problemDespite many years of capital investment in agricultural research and technology development in
Kenya, poverty and hunger still threaten human survival and livelihood. About 50% of rural
household live below the poverty line. Information from the Kenya Agricultural Research
Institute (KARI) indicates that many viable technologies that have been developed are currently
not being applied by the the farmers. This has led to farmers achieving as low as 6% of what is
potentially possible (Salasya et. al., 1998). For instance, in Kakamega district, while the
potential yield of maize was 50-60 bags per hectare by research station standards, the average
yield on farms was a meager 3 bags per hectare. This is one of the districts where between 50-
60% of the population live below the poverty line (Kenya, 1998). This particular example
shows the magnitude of the problem facing poor households in accessing available technologies
which can substantially alleviate poverty. The same situation of lack of adoption in livestock
and processing technologies which can alleviate poverty abound in Kenya.

6}}
Kenya has developed a poverty atlas, mapping out the incidence and depth of poverty (Error!
Reference source not found.). The country has subsequently launched a National Poverty
Eradication Plan spanning 1999-2015. The highest incidence of poverty is found in the Arid
and Semi-Arid Land (ASAL) districts of Northern Kenya. Few of the ASAL districts have
more than one percent of the country’s total poor households despite their high percentage
incidence of poverty. The poor in ASAL areas tend to be physically isolated, have inferior
access to basic goods, services and infrastructure and rely on an uncertain resource base.
Failure to identify development options in these areas will increase the pressure for large sums
for relief. The sustainable opportunities for the ASAL areas arise from using domesticated
livestock, wild animals and trees to improve rural livelihoods. Their economies are vulnerable
to major climatic changes. Floods and drought alternate to destroy many of the assets created
by development investments. Relief is needed on a recurrent basis to prevent hunger and
suffering.

7}}
Figure 1. Percentage Distribution of Absolute Poverty by Percent Number of People in Kenya
Source:; Government of Kenya (1998)
8}}
The areas of high and medium potential contain most of the rural population and so many of the
rural poor are concentrated here as well. In Machakos and Kakamega together reside 10% of
the nation’s poor. If a further four district - Makueni, Siaya, Kitui and Bungoma - are added to
these first two, then 25% of all poor households have been identified. Even though the highland
districts, including those in the coffee zone are counted as well-favoured in national terms each
of them also has a large number of poor people and households. Rapidly increasing population
has intensified the pressure on land-based resources and left poorer groups without adequate
access to the basic means of production. There is also some evidence that traditional norms of
reciprocity and community safety-nets have largely broken down in a number of these areas,
leaving the resources and income poor especially vulnerable to weather, disease and economic
variations.
1.3 The objectivesThis paper aims at identifying and analyzing a selected number of crop, livestock and
agricultural processing technologies or technological packages that have been developed in
Kenya in the recent past with respect to the following:
1. Evolution of technology generation
2. Transfer methods and current status, including the level of adoption in targeted areas
3. Identification of technologies
4. Evaluation of their economic viability
5. How the application of the technology can contribute to poverty alleviation in the
targeted areas
6. Policy implications and recommendations for future initiatives
The effectiveness and impact of agricultural technologies therefore depend on:
(a) Policy environment
(b) Capacity of institutions (service providers) to extend the technology to farmers
(c) The complexity of the technological packages, level of education and diversity of the
intended recipient farmer population (farmer characteristics or profiles)
(d) The diversity of the sector or sub sector (cultural homogeneity and market condition)
(e) The Agro-climate condition (ecology)
(f) The status of infrastructure development: roads, telecommunication and energy
(g) The prevailing socio-cultural beliefs
(h) The existing governance style (whether there is commitment to have effective judiciary,
regulatory bodies) to eradicate corruption and poverty

9}}
2. APPROACHES AND METHODS ADOPTED FOR THE STUDY
2.1 Formation of study teamAs specified in the terms of reference and given the nature of agricultural technology generation
and transfer a - person team was formed to analyze the technology generation-viability-poverty
alleviation nexus. The team consisted of a research extension liaison officer from the ministry of
agriculture, an agricultural economist from KARI, a crop scientist and an animal scientist from
the University of Nairobi and the team leader, who is an agricultural economist at the University
of Nairobi. The team reviewed the terms of reference to have a common understanding of the
scope of work and the expected output.
2.2 Literature review and analysisIt was understood that the focused literature review together with the team members
experiences in their respective fields would bring out the issues revolving around the economic
viability of available technologies on farms to increase productivity and consequently alleviate
the persistent poverty in rural areas particularly and the country in general. Attempts at
integrating these viable technologies on research process as well as the barriers to achieve a
coordinated approach to technology generation and transfer were identified.
Based on perceived potential to alleviate poverty in the areas designated to have high incidence
and greater depth of poverty in Kenya (GoK, 1998), the team selected specific crop and
livestock technologies and technology packages as well as processing technology package to
demonstrate the economic viability. The technologies included the following:
(i) Maize production technology package.
(ii) Improved coffee production technology.
(iii) Improved livestock seed-stock technology
(iv) Improved small scale dairy technology package
The recommendations for policy were derived from the analysis of the literature review as well
as on the economic analyses of each of the selected technologies.

10}}
3. ANALYSIS OF TECHNOLOGIES
3.1 Maize Production technology and Technology Package.Maize is the major staple food in Kenya. The consumption pattern has shifted to maize over the
years to the extent that over 90% of the population rely on maize as a food item. This has
caused a situation where famine in Kenya is associated with lack of maize, even if there are
other food items like rice or potatoes. Seventy five per cent of Kenya's maize is produced by
smallholders who cultivate about 85% of total land area under maize.
3.1.1 Maize Seed and Fertilizer TechnologyGiven its importance, the government initiated a maize improvement research program as early
as 1955 at Kitale, the centre of high potential maize production area in Kenya (Lynam and
Hassan, 1998). Research at Kitale focused on developing late maturity hybrids for the highland
areas where typically rainfall is confined to one long season. After 1957, Katumani and Embu
research programs were established to cater for semi-arid mid-altitude and moist mid-altitude
areas while the Mtwapa program concentrated research on lowland, coastal agricultural zones1.
By 1975 ten hybrid maize and three composites had been released and a significant number had
adopted this first generation of improved maize material (Gerhard, 1975). Table 1 shows the
growth rates of adoption of improved seed and fertilizer in Kenya between 1963 and 1991.
Large-scale farmers located in the high-potential areas appeared to be the early adopters of the
package and by 1974 almost half of them used the new maize varieties. Small-scale farmers in
the relatively marginal areas were the slowest to adopt the technology package with only 16%
of the farmers adopting the new varieties by 1984. Although adoption of inorganic fertilizer
followed closely on the adoption of improved seed in the large farm sector, it appears the
smallholder adoption of fertilizer lagged substantially behind their adoption of improved
varieties and remained virtually negligible in marginal areas2.
Small-scale producers seem to prefer a maize variety that is early maturing, high yielding, does
not lodge easily and that yield large quantities of stover for feeding livestock and mulching,
attributes that most of the above hybrids meet.
1Agricultural zones in Kenya are defined mainly by moisture supply but differentiated by altitude,
temperature, rainfall, soil types and fertility and ranges of crops economically grown (Jaetzold, 1982).
2This differs from the green revolution experience in Asia where both technologies were adopted as apackage

11}}
Table 1. Average growth rates in maize area, yield, and adoption of improved seed and fertilizerin Kenya, 1963-91
Growth rate
Parameter 1963-74 1975-84 1985-91 Overall
Area (% yr-1)Yield (% yr-1)Number of new varieties released% of farmers who have adopted Improvedseeds
Large-scale farmers in high-potential zoneSmall-scale farmers in high potential zonesSmall-scale farmers in low-potential zones
% of farmers who have adopted Fertilizera
Large-scale farmers in high-potential zonesSmall-scale farmers in high-potential zonesSmall-scale farmers in low-potential zones
4.610.913
47.516.04.0
42.310.82.3
0.40.62
24.242.212.1
17.324.62.3
(1.1)4.46
22.236.639.7
23.127.86.0
2.37.121
93.994.756.8
82.763.210.6
Source: Lynam and Hassan, 1998.a Represents the percentage of farmers who once bought improved seed or fertilizer, but does
not reflect current adoption rates. Large-scale were defined as farmers having more than 8 ha
of land. High-potential zones consist of the wet highlands and mid-altitude regions. Low-
potential zones are the semiarid and lowland tropical zones.
Maize yields in farmers fields in mid altitude of Eastern and Central Kenya range between 1 and
1.5 tons per ha against research potential of 5 tons per ha (KARI, 1994). Surveys conducted in
these areas have identified low soil fertility, low adoption of recommended varieties and low
plant population to be the main biophysical factors contributing to low maize yields in farmers'
fields. Most of the high and medium potential areas of Kenya have been utilized for maize
production and hence increase of the crop through area expansion is not feasible. Increase in
production will be achieved only by increase in yield per unit area as there is no area for
expansion beyond the current 1.8 million hectares. Therefore wide spread adoption of intensive
production methods using recommended technology packages is required.
Trials conducted for three seasons in the upper midland zone 2 of Central Kenya to quantify
yield gap between research and farmers' fields show that there is considerable room for
improvement in maize yields as shown by the marginal rate of return, which is the percentage
change in net benefits due to a unit increase in the total costs that vary as one moves from one
practice to the other.

12}}
Table 2. Economic analysis for growing maize using farmer's practice and recommendedpackages during short rains 1994/5, long rains 1995 and short rains 1995/6 in Upper-Midland 2of Central Kenya
Season 1Treatments/Technology
Gross benefitKsh/ha
Total variablecost Ksh/ha
Net benefitsKsh/ha
Marginal rate ofreturn forinnovation (%)
Short rains1994/95
Farmer's wayDensityVarietyF X D X V*
16,064.017,132.618,051.021,292.6
6,061.46,683.57,137.28,707.2
10,002.610,449.110,913.212,585.4
71.8102.2106.6
Long rains1995
Farmer's wayF X D
22,271.128,706.4
7,155.412,268.1
15,155.816,438.2 25.9
Short rains1995/6
Farmer's wayDensityF X D X V
18,435.219,869.921,935.0
6,479.37,165.98,820.4
11,955.912,704.013,114.5
109.024.8
Source: Gitari et al, 1996
1F = fertilizer, D = density and V = variety.; farmer's way = growing local seed, plant density of
37,037 plants/ha and fertilizer rate of 20 Kg N plus 20 Kg P2O5/ha.; Recommended technology
package = growing hybrid 512, plant density of 53,333 plants/ha and fertilizer rate of 50 Kg of
N plus 50Kg of P2O5/ha.
A study to establish determinants of fertilizer use and the gap between farmers' maize yields and
potential yields in Kenya, revealed that Kenyan farmers apply lower rates of inorganic fertilizers
in their maize crop than is considered economically optimal (Hassan, et al, 1998). The gap
between farmers' yields under current practices and the yields that could be attained if optimal
levels of nitrogen (N) and phosphorus (P) were applied is on average 30%. About one million
tons of maize could be added to current domestic production (a 33% increase) if farmers
improved their soil fertility management practices.
Fertilizer is a major agricultural input in Kenya. Kenya's annual consumption of mineral fertilizer
nutrient stands at about 100,000 metric tonnes while the potential is estimated to be about four
times as much (Mulagoli, 1999). According to sessional paper of 1994, increased and efficient
use of fertilizer is perceived among ways through which increase crop production can be
achieved. The target agricultural rate is 5.3% per annum with an expected increase in fertilizer
use of 12.2% per annum. However, the current fertilizer use is only 37% of the estimated rate
per year and mainly in plantation and high value crops. This results in continuous declining trend
in food production leading to perennial food shortage, famine and food imports.
On farm verification trials have been conducted through Fertilizer Extension Project of the

13}}
ministry of agriculture. It covered 15 districts countrywide representing medium and high
potential agroecological zones of Kenya. This was a follow up to the Fertilizer Use
Recommendation Project (FURP) earlier implemented by KARI. Results indicated that there
was a good response of maize to fertilizer application in various parts of the country with
variable profit margins. In Kaibos (West Pokot, LH 3) in 1997, Maize was more profitable with
highest return to investment in fertilizer if farmers applied triple super phosphate (TSP) and
calcium ammonium nitrate (CAN) at the rates of 25 Kg per acre each respectively (Table 3).
This gave value cost ratio (VCR3) of 5.6, meaning that for every Ksh 1 invested in fertilizer the
farmer got a return of extra Ksh 4.60. Although it was not risky to double fertilizer rate to
50+50+0 (VCR = 2.6), the profit may be only enough to purchase fertilizers with very little
balance to finance other activities.
Table 3. The value cost ratio and profit due to fertilizer application in maize in West Pokot(Kaibos - LH 2) in 1997.
Nutrient level Agronomic fertilizer effect Economic fertilizer effect
N + P + K Average yieldincreaseKg/ha
Value of yieldincrease Ksh
Fertilizer costKsh
Profit due tofertilizer Ksh
VCR
0+0+0 - - - -
25+25+0 2,226 22,256 4,000 18,256 5.6
50+50+0 2,063 20,634 8,000 12,643 2.6
25+25+0+5t FYM1
1,812 18,124 6,000 12,124 3.0
25+60+0 (FP2) 1,798 17,982 3,375 14,607 5.3
FYM1 is farm yard manure and FP2 is farmer's practice
In zones represented by Tulwet in Trans Nzoia, it would be more profitable if farmers applied
CAN (75+0+0) in two equal splits in maize to obtain a VCR of 21.7 (Table 4). In this region
there was no demand for phosphorus when enough nitrogen was applied. Even doubling the
rate of application to (150+0+0) would still be economical (VCR of 10). Thus farmers would
earn enough money from sale of maize and retain balance to finance other activities. This would
alleviate their poverty and improve the living standards.
3Value cost ratio (VCR)is an indicator that shows the amount of money generated for every shilling invested
in fertilizer use in a maize crop.

14}}
Table 4. The value cost ratio and profit due to fertilizer application in maize in Trans Nzoia(Tulwet) in 1997
Parameter Nutrient level N+P+K
0+0+0 75+0+0 150+0+0 60+60+0
Average yield (Kg/ha) 3,518 11,470 11,085 9,261
Average yield increase (Kg/ha) - 7,952 7,567 5,743
Value of yield (Ksh) 46,907 152,933 147,800 123,480
Value of yield increase (Ksh) - 106,027 100,893 76,573
Fertilizer cost (Ksh) - 4,896 9,792 7,567
Profit due to fertilizer (Ksh) - 101,131 91,101 69,006
Value Cost Ratio (VCR) - 21.7 10.3 10.1
Following similar on-farm verification trials in other regions, economic fertilizer rates and
profitability in maize, as indicated by VCR, are indicated (Table 5). Farmers used certified seeds
of the recommended maize variety in each agroecological zone. Economic rate indicated the
amount of fertilizer that yields maximum profit.
The higher the VCR value the more it is worthwhile to invest in fertilizer rates indicated to
produce maize. A VCR less than 1.0 indicates that farmers in the zone should not apply
fertilizer rates indicated to produce maize. For example in Kakamega Municipality (0.6), Lower
Nyakach in Kisumu (0.4) and Gachoka in Embu (0.9). High returns on fertilizer investment in
maize were realized in Noigam in Transzoia (21), Kabuchai in Bungoma (13), Kimondo in
Trans Nzoia (11) and Kiminini in Bungoma (10).
Farm yard manure application is a national extension recommendation and in some regions
where it was applied at 5 tons per acre, in addition to fertilizer, VCR significantly increased.
Positive response of maize yields to application of farm yard manure was recorded in
Muhoroni/Koru and Maseno, both, in Kisumu, Njukiri in Embu and Kabatini in Nakuru. Farm
yard manure was applied only in farms where it was available at no significant extra cost.

15}}
Table 5. Profitability of fertilizer use in maize according to agroecological zones, 1998.
AEZ Region (District) Cropping pattern Economic rate N+P+K VCR
LM 1 Khuisero (Kakamega)Sang'alo (Bungoma)Bumala (Bungoma)Butere (Kakamega)Nyahera (Kisumu)
Maize/BeansMaize/BeansMaize/BeansMaizeMaize/Beans
25+25+025+25+025+25+025+25+075+0+0
2.83.44.43.66.3
LM 2 Muhoroni/Koru (Kisumu)
Kabras (Kakamega)Municipality (Kakamega)Maseno (Kisumu)
Maize/BeansMaize/BeansMaize/BeansMaizeMaize/BeansMaize/Beans
25+0+025+0+0+5tFYM150+75+0150+25+075+0+075+0+0+5tFYM
3.74.32.4.631.82.8
LM 3 Lower Nyakach (Kisumu)Sirisia (Bungoma)Gachoka (Embu)Rwika (Embu)
Maize/BeansMaize/BeansMaizeMaize
150+75+060+60+025+25+025+25+0
.434.5.931.9
LM 4 Itiira/Siakago (Meru) Maize 25+25+0 2.8
UM 1 Shinyalu (Kakamega)Kimilili (Bungoma)
Maize/BeansMaize/Beans
0+50+075+0+0
4.72.6
UM 2 Igoji (Meru)Gikuuri (Embu)
Njukiri (Embu)
MaizeMaize/BeansMaize/BeansMaize/BeansMaize/Beans
75+0+075+75+075+75+0+5tFYM75+75+075+75+0+5tFYM
5.82.33.32.95.7
UM 3 Murkwijit (West Pokot)Kabuchai (Bungoma)
Maize/BeansMaize/Beans
25+25+00+30+0
2.113
UM 4 Ririmpoi (West Pokot)Tartar (West Pokot)Noigam (Transzoia)Biribiriet (Transzoia)Kaplamai (Transzoia)Lunyu (Transzoia)Kipsaina (Transzoia)Makhele (Transzoia)Kibomet (Transzoia)Kiminini (Bungoma)Likuyani (Kakamega)
Maize/BeansMaize/BeansMaizeMaizeMaizeMaizeMaizeMaizeMaizeMaizeMaize
75+0+075+0+060+60+0150+0+075+0+075+0+0150+0+0150+0+075+0+00+30+075+0+0
2.44.4212.39.31.82.01.76.8103.7
LH 2 Chemundu (Nandi)Talau (West Pokot)Kaibos (West Pokot)
Maize/BeansMaizeMaize
60+90+025+25+025+25+0
2.93.75.6
LH 3 Kabatini (Nakuru)
Ngwataniro (Nakuru)Kimondo (Transzoia)
Maize/BeansMaize/BeansMaize/BeansMaize
75+0+075+0+0+5tFYM75+0+075+0+0
1.42.24.311
LH 4 Mia Moja (Laikipia)Kalalu (Laikipia)
Maize/BeansMaize/Beans
25+25+025+0+0
6.69.1
Source: Mulagoli, 1996 and 1997

16}}
3.1.2 Policy implications for increased fertilizer utilization and maize productionThe central objective of the Kenya government and fertilizer policy is to ensure that adequate
and quality fertilizers are made available to the farmers at affordable prices and that they are
used at the right time and in the correct proportions.
Promotion of high N products such as urea will reduce the relative cost of the N component,
lower the nutrient-grain price ratio, and improve the returns to fertilizer use for maize farmers.
Public investment in rural roads, removal of restrictions on fertilizer imports, and the provision
of credits and tax incentives to private traders to invest in private storage and distribution
facilities would have a significant impact on diffusion of fertilizer. The marketing of fertilizers in
small packages (10 to 25 kg instead of 50 kg), which are easier to transport, would also help
increase in fertilizer use, especially by small scale farmers in rural areas. The demand for this
packaging has led to traders opening the 50 kg bag and weighing fertilizer quantities as desired
by farmers there by cheating them on quantity and at times quality when adulteration occurs.
This calls for self regulating mechanism on fertilizer quality control.
Another means of increasing the profitability of fertilizer use would be to achieve higher yield
gains (biological response) from fertilizer application, both through breeding research (better
adapted hybrids for marginal zones) and crop management research and extension efforts (to
disseminate fertilizer recommendations conditioned by soil type and nutrient analysis). The
development of alternative low-cost sources of N, such as green and animal manures for
efficient nutrient recycling, and methods of soil conservation, will reduce soil nutrient depletion
and enhance maize productivity in the long run (Qureshi, 1987). Hassan et al, 1998 emphasize
that the strategy for ensuring wider diffusion and adoption of improved technologies for maize
production in Kenya is to develop a more efficient extension service (characterized by regular
visits and increased use of contact farmers and farmer groups) and more input supply
mechanisms. More emphasis needs to be placed on marginal environments and female headed
households. Channels of disseminating fertilizer use information such as radio programmes,
short subject specific extension publications should be strengthened.
Focused effort should be made at systematic and comprehensive characterization of farming
systems using participatory approaches, targeting specific types of households with specific
types of technologies to alleviate their poverty.
Research structure should be organized along agro-ecological zones rather than provincial
stations to tackle development of crop technologies to alleviate poverty in specific farming
systems. Crop and location specific fertilizers should be readily available in each region.

17}}
The government, donors and NGOs should target poorer households with relevant development
assistance. These households are characterized by the following features (Sutherland et al,
1997); (a) limited access to cash income including salaried employment, and sales of fruits,
crops and livestock products, (b) few convertible assets such as livestock, timber trees and land,
(c) few labour saving devices such as ox-drawn equipment, draught animals, wheelbarrows,
spray pumps, rainwater harvesting tanks, and larger hand tools, (d) food insecurity which tends
to divert labour and time away from production activities on own land to survival activities such
as food for work programmes, bartering chickens and handicrafts, and working for others, (e) in
some cases insecure access to land.
To increase farmers' demand for fertilizer, high yield gains from fertilizer use and lower
nutrient-grain price ratios have to be achieved. Supply factors that influence the price of
fertilizer are (a) transportation and transaction costs and (b) dominance of low N fertilizers,
such as DAP, and 20 20 0 among the commercial products traded in Kenya.
Transportation and transaction costs lower marketing margins and hence form a major
disincentive to private traders to enter and engage in fertilizer delivery, to small markets in
remote areas. Donovan (1995) showed that in 1992, marketing cost per ton per kilometre of
maize imported from the US to western Kenya were almost five times greater than they were in
the US. This is despite the fact that the distance traveled by maize from farms to the US Gulf
ports was about 1.5 times the distance between Mombasa and western Kenya.
3.2 Coffee production technology
Smallholder coffee producers account for 65% of the total coffee production in Kenya. The
average yields of 345 kg per hectare are, however, low compared with those of estates, 1,013
kg per hectare. Yields of 10-15 kg per tree per year have been reported in Central Kenya under
smallholder production. The difference in production yields is due to variation in technologies
used and the levels of management. While the estates usually apply recommended levels of
fertilizers, pesticides and herbicides, the smallholder producers apply less than the recommended
rates due to financial constraints or due to lack of know-how.
Several varieties of coffee (SL.28, SL 34, K7 etc) have been released during the last 30-40
years of research, but most outstanding is the Ruiru 11, whose characteristics are outlined in
Table 6.

18}}
Table 6 Characteristics of Ruiru 11 compared to that of SL 28 coffee variety.
Parameter Variety
Ruiru 11 SL 28
Plant population (trees/ha)Yield (tons/ha)Quality indexCBD indexLeaf rust index
2,500 2.70 3.60 0.53 0.01
1,329 2.17 3.56 7.11 2.11
Ruiru 11 is resistant to coffee berry disease (CBD) and leaf rust (LR), two major diseases that
affect coffee production worldwide. This results into saving on fungicides as indicated in Table
7. Ruiru 11 comes into production in the second year while traditional varieties do so in the
third year, hence early flow of benefits (net revenue during the second year is Ksh.79,380 per
ha) which is half of the total establishment on one hectare of new land which is Ksh 131,207.53
(Coffee Research Foundation, personal comm.).
Table 7 Profitability of SL and Ruiru 11 varieties in Ksh/ha during their fifth year and peak ofproduction after establishment on new land
Cost Category
Ground fertilizersFoliar fertilizersFungicidesInsecticidesHerbicidesCasual LabourTotal Variable Costs Ksh/haGross Margin Ksh/haYield Achieved ton clean coffee/haYield Achieved Kg of cherry/haYield Achieved Kg of cherry/tree
SL Variety
17,849640
47,5332,9883,345
47,749120,144268,656
2.014,00010.5
Ruiru 11
13,1806350
2,9883,345
78,29698,444329,237
2.215,400.00
6.2
Since the release of this variety supply has never met demand for seedlings. The reduction in
cost of inputs is substantial at 30% according to Coffee Board of Kenya estimates. This is
particularly important for smallholders who have very limited resources. The spacing of 2m by
2m (2,500 trees per hectare) is also ideal for smallholder producers who can now grow extra
trees as compared to the conventional spacing of 2.74m by 2.74m (1,329 trees per hectare) for
most varieties of arabica coffee. Ruiru 11 is also much shorter than the other varieties making it
easy to harvest. The gross margin of Ruiru 11 is 22% higher than that of SL 28 at the peak of
production.
Coffee production under smallholder systems is essentially labour intensive: planting, weeding,

19}}
pruning, and picking. Profit margins are generally small and that explains why farmers abandon
management of coffee trees when world prices experience a significant fall. Estimates by
Coffee Board of Kenya in 1997 under three scenarios of low, medium and high yields indicate
gross margins ranging from Ksh 4,256 to Ksh 62,114 per hectare under smallholder production.
In the same period, the estates had profits ranging from Ksh 17,618 to Ksh 85,256 per hectare
under low, medium and high yield scenarios. Adoption of Ruiru 11 and other appropriate crop
management practices by smallholders will pull those currently below poverty line to a higher
income and standard of living.
3.5 Improved livestock seed-stock technologies.The economic viability and of a livestock enterprise depends on among other factors the genetic
potential of that given germplasm to respond to improved husbandry (good feeding, housing
and health care). The germplasm, and particularly its genetic potential in itself and when
considered as a resources can impede increases in productivity. For example, in cases where
land is limited and labour is constraining, keeping a cow that has low genetic potential for milk
production would be uneconomical. The well being of the keeper of such a cow would not be
guaranteed. In such instances, development and wide adoption of germplasm that have higher
genetic potential for say milk, meat, egg production has been undertaken in Kenya with the aim
of achieving higher productivity and consequently alleviation of poverty among the livestock
farmers. Upgrading of indigenous cattle breeds towards the exotic dairy breeds has been done
through the use of artificial insemination (AI) technology.
3.5.1 Artificial InseminationTemperate dairy cattle perform better than the indigenous Zebu cattle in the tropical highlands.
As the human population increased in the highlands and land size decreases, it becomes prudent
to adopt technologies that would enable efficient utilization of the scarce resources.
AI technology involves the identification of the very top genetic potential bulls. These are kept
in central stations and semen continually collected, assessed, diluted, packed in straws and
preserved in liquid nitrogen at low temperatures. When needed, each straw of semen can be
used to artificially inseminate a cow that is on heat. One superior bull once identified can
potentially sire thousands of offspring in different herds each year. The genetic superiority of
one individual is therefore quickly spread become beneficial to many farmers than would
otherwise be possible with natural mating.

20}}
When a cow is on heat and needs a bull, the farmer through training is able to detect this by
observing the cows behavior as well as physical changes in external reproductive tract. The
farmers then notifies the inseminators who within preferably 18 hours of onset of heat artificially
inseminate the cow using the semen from a superior bull.
Upgrading of local cattle to the temperate dairy breeds and concurrent use of highly selected
animals through AI has been the technological packages of choice in Kenya and has been largely
responsible for the great strides so far made in the country's dairy sub-sector.
AI is without doubt economically advantageous compared to natural service because:
1. The need to keep a bull and the costs associated with it are avoided.
2. It is cheaper, than natural service. Currently one insemination costs between KShs.200
and Ksh 2,500 depending on the genetic superiority of the semen and the type of service
provided.
3. It makes it possible for farmers to have access to high quality germplasm and thus make
permanent improvement of their stock faster and more efficiently.
4. The spread of venereal diseases is easily controlled.
However, the level and quality of AI service in Kenya has of late declined seriously. Previous
AI service was provided by the government run Kenya National Artificial Insemination Service
(KNAIS), provided at a highly subsidized rate to the dairy farmers. Israelsson and Oscarsson
(1994) indicate that the most low cost model of providing AI service to the farmer was daily
run model, as long as such inseminations are made per day by one inseminator, covering
between 100 to 120 km along a prescribed route. An alternative model would be where the
inseminator waits for information from farmers on when to provide the service.
In situations such as those that characterize the Kenya's smallholder dairy farmers, both models
have proved to be unsustainable for different reasons: First, the mobile system is too expensive
on vehicle maintenance and fuel expenses due to the poor state of roads. The static system is
unsustainable and expensive as AI service on its own is not a viable business undertaking, and
has therefore not attracted private investors following the liberalization of provision of
agricultural services structural adjustments beginning in the mid 1980's.
Although AI as a technology is technically beneficial, lack of appropriate delivery system, its
adoption and effectiveness in Kenya is rapidly declining (Table 8 and Figure 1). The
consequences of such decline is disastrous because the genetic potential and productivity of the

21}}
dairy herd is bound to decline very rapidly4. The low productivity arise from both poor genetic
potential as well as longer calving intervals among cow's in production.
Table 8. Number of artificial inseminations carried out by KNAIS, 1984-97
Number of inseminations (‘000) Total ‘000 Percentage change
Grade cows Zebu cows
19841985198619871988198919901991199219931994199519961997
462465388370348398385246192134105103 68 24
23211715111211422
386486405385359410396250194136
-17+26-17-5-7
+14-3-37-22-30
Source: Government of Kenya, Department of Veterinary Services, Ministry of Agriculture.
Secondly, the AI service fees which currently average Ksh. 450 per insemination although,
much higher than what the KNAIS used to charge, are in reality reasonable given the gross
margins realized by zero grazing units as evidenced in the discussions later in this section and
Section 3.6. It is recommended that the cost of one insemination should not exceed 10% of the
value of annual milk production per cow (Israelsson and Oscarsson, 1994). Given the current
AI charges of Ksh. 450 per insemination, milk price of Ksh.20 per litre and average yield of
3,000 litres per lactation, AI charges forms only 0.1% of the total revenue from milk sales alone
which is far much less than 10%. At lactation yields greater than 4,500 litres, this cost
component becomes negligible. The trends of the number of inseminations on Zebu cattle,
Table 8 show continuous decline. This reflects the successful growth of grade cattle population
through AI.
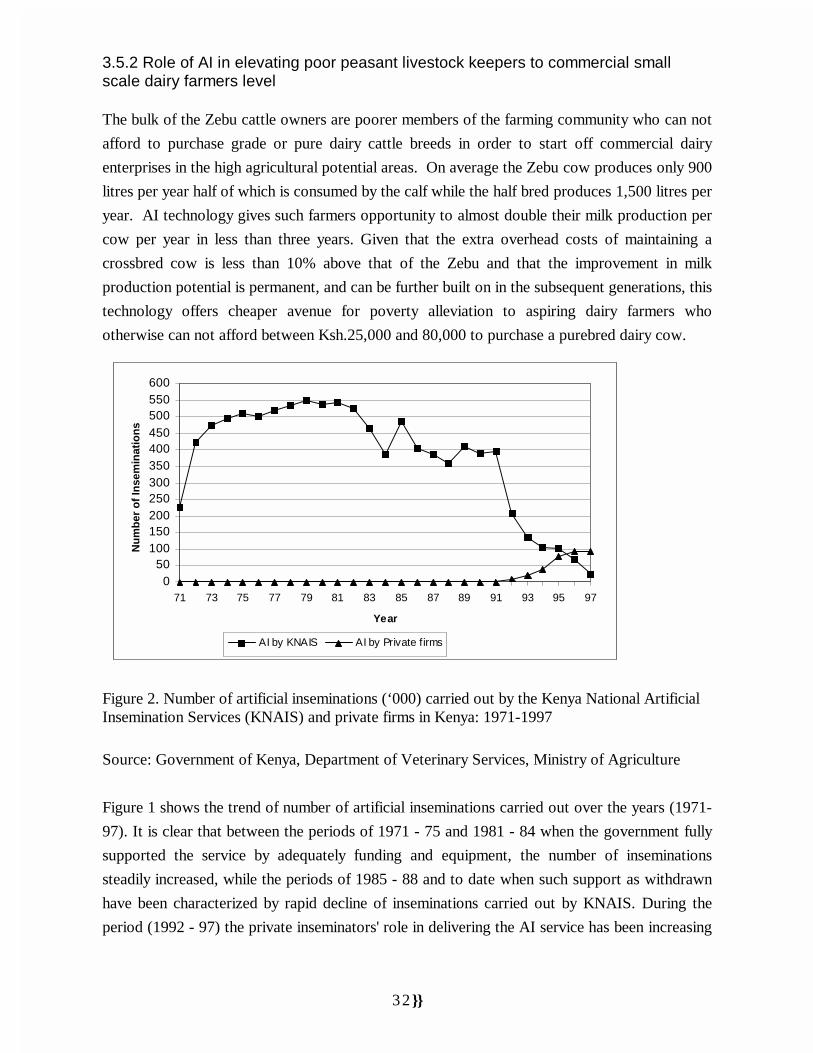
3.5.2 Role of AI in elevating poor peasant livestock keepers to commercial smallscale dairy farmers level
The bulk of the Zebu cattle owners are poorer members of the farming community who can not 4Available reports currently reveal that only 10% of available semen at the Central Artificial InseminationStation is used annually.

22}}
afford to purchase grade or pure dairy cattle breeds in order to start off commercial dairy
enterprises in the high agricultural potential areas. On average the Zebu cow produces only 900
litres per year half of which is consumed by the calf while the half bred produces 1,500 litres per
year. AI technology gives such farmers opportunity to almost double their milk production per
cow per year in less than three years. Given that the extra overhead costs of maintaining a
crossbred cow is less than 10% above that of the Zebu and that the improvement in milk
production potential is permanent, and can be further built on in the subsequent generations, this
technology offers cheaper avenue for poverty alleviation to aspiring dairy farmers who
otherwise can not afford between Ksh.25,000 and 80,000 to purchase a purebred dairy cow.
Figure 1. Number of artificial inseminations (‘000) carried out by the Kenya National ArtificialInsemination Services (KNAIS) and private firms in Kenya: 1971-1997
Source: Government of Kenya, Department of Veterinary Services, Ministry of Agriculture
Figure 1 shows the trend of number of artificial inseminations carried out over the years (1971-
97). It is clear that between the periods of 1971 - 75 and 1981 - 84 when the government fully
supported the service by adequately funding and equipment, the number of inseminations
steadily increased, while the periods of 1985 - 88 and to date when such support as withdrawn
have been characterized by rapid decline of inseminations carried out by KNAIS. During the
period (1992 - 97) the private inseminators' role in delivering the AI service has been increasing
although there still remains a big gap between the potential demand and what private service
providers offer today.
050
100150200250300350400450500550600
71 73 75 77 79 81 83 85 87 89 91 93 95 97
Year
Nu
mb
er o
f In
sem
inat
ion
s
AI by KNAIS AI by Private firms

23}}
The additional 400 litres per cow is potentially available for sale three years later and thereafter
annually for the next five or so years. Without AI technology it would be nearly impossible for
the resource poor small-scale livestock farmers to join the dairy enterprise. The adoption of AI
technology, especially through the upgrading programme, has enabled approximately 80% of
the current suppliers of milk in Kenya to enter into commercial dairying within reasonably short
period than would have been if direct importation of dairy cows had been adopted.
AI enables farmers to achieve between 0.75% and 1% genetic potential improvement in their
herd's milk production annually. Use of bulls (natural mating) can only achieve much less and if
not well executed can most likely lead to retrogression. One bull can only serve up to 50 cows
each year and even if such services are charged at half of Ksh 350 that of the current average AI
charges, this can only realize an annual income of Ksh.15,000 and yet the annual maintenance
cost of such a bull if kept to serve only 80 cows would be equivalent to less than that of one
dairy cow at Ksh.25,000.
According to the gross margin analyses in Section 3.6 of this report the estimated current
commercial cost of semen plus its delivery at Ksh.700 forms 43% of the total annual veterinary
and AI costs per cow and only 1.5% of the total annual cost per cow per year. This turns out to
be only a negligible 1.4% proportion of the total value of milk sales per cow per year.
Currently AI charges are on average Ksh 150 per cow per year higher than those by bull
service. However, whereas the bull service has no guarantee of providing heifers that are
between 0.75 and 1% better than their parents’ production levels annually, with AI such
improvement rates are guaranteed. This means that with an extra Ksh 150 per cow per year the
AI user would tie a total (principal plus interest) of Ksh. 258 over a three-year period when
heifers born would begin milk production. Because such heifers will have 1% higher potential
they would each year for the next five years produce 30 litres more milk than those born of
natural mating. At the milk price of Ksh 20 per litre this turns out to be an extra Ksh.3,000 per
cow’s lifetime. Besides such a cow would on average, have higher salvage value than that born
from natural mating. Therefore, for an extra Ksh 260 cost an extra revenue of Ksh 1,200 would
accrue assuming that only 40% of calves born are females that reach milk production age.
The appropriateness and viability of any technology can be judged by how much demand it
attracts whenever it is offered in a competitive free market situation. From the trends of the
private artificial inseminations one could argue that AI as a tool for genetic improvement is
indeed the main reason behind the improvement and success of dairy sub-sector in Kenya as is
the case world over. If the potential is realized, then incomes of the poor can be raised and this

24}}
will alleviate poverty.
The failure of AI under the government supported programme was largely due to the wrong
choice of mode of delivery of the service. The KNAIS opted for motor vehicle as the mode of
transporting the service delivery which if compared to motorbike or moped costs much more to
buy and maintain. Besides, a motor vehicle requires more developed road network system and
would inadequately serve most of the rural communities today. The success of the private AI
service providers today is due to their choice of motorbikes instead of motor cars.
Table 9 shows that positive gross margins are realizable by private AI service providers under
different levels of operations and two modes of transport. This shows that AI as a technology is
viable at both the user (dairy farmer) and service provider levels. Results obtained from private
veterinarians indicate that when AI is combined with clinical practice and agro-veterinary retail
practice the gross margin from the AI activity is even larger. Similarly, cooperative member
small scale dairy farmers could lower their AI service costs substantially by training one of their
technicians to provide AI service besides other extension or marketing services.
The purchase and maintenance cost of operating the smallest second hand four-wheel drive car
would be twice that of a motorbike and would therefore beyond the reach of a beginning private
inseminator.
Currently the population of dairy cattle in Kenya is 12 million head. Assuming that 60% of these
are cows and heifers of breeding ages and that 10% of these need to be inseminated monthly,
the approximately 720,000 inseminations need to be carried out. Of these, if 70% are through
AI then it is apparent that a huge potential exists for the privates AI service.

25}}
Table 9 Estimated gross margin analysis of AI service when inseminator uses motorbike andmoped
Purchase price KshInsemination charge per dose Ksh 375 375
RevenueServices per day 4 6 10 4 6 10Semen per dose 450 450 450 450 450 450Revenue from semen sales 604,800 907,200 1,512,000 604,800 907,200 1,512,000Service charges 360,000 540,000 900,000 360,000 540,000 900,000TOTAL REVENUE 964,800 1,447,200 2,412,000 964,800 1,447,200 2,412,000
CostsCost of semen 604,800 907,200 1,512,000 604,800 907,200 1,512,000Stationery 20,700 20,700 20,700 20,700 20,700 20,700Liquid Nitrogen 37,800 37,800 37,800 37,800 37,800 37,800Consumable supplies 45,000 45,000 45,000 45,000 45,000 45,000Fuel 60,000 60,000 60,000 18,000 18,000 18,000Maintenance 2,400 2,400 2,400 1,200 1,200 1,200TOTAL COSTS 770,700 1,073,100 1,677,900 727,500 1,029,900 1,634,700
GROSS MARGIN 194,100 374,100 734,100 237,300 417,300 777,300
Motorbike Moped120,000 60,000
Adapted from American Breeders Service Kenya Ltd., 1998.
Table 9 gives the estimates of gross margin analyses of private AI delivery service based on two
modes of transportation (motorbike and moped) on annual basis. Use of mopeds and
motorbikes compare reasonably well and offer very high gross margins when six and ten
inseminations are offered in a day.
Reasons attributed to the very high AI costs incurred by KNAIS relative to milk prices include:
(i) Wrong choice of AI delivery service (cars instead of motorbikes) given the poor states
of rural roads, the vehicle running costs were too high. Secondly the time taken to
reach cows that are reported to be on heat would be much longer, with a good number
of such cows being inseminated well past the optimum periods.
(ii) Poor infrastructure: the cost of telephone services is too high, while the quality of this
service is dually low.
(iii) Poor market policies: milk is not marketed based on quality (protein and butter fat
content), while semen is priced on quality which, includes anticipated milk quality.
(iv) Poor legal frameworks that govern and regulate the various service providing
institutions. Service providing institution, are commonly poorly run with fraud and
corruption being rampant among cooperative leaders and employees. The legal
machinery is inefficient that justice when applied, it is usually comes too late.

26}}
3.5.3 Some policy Implications for Livestock Improvement Research.
Based on the past experiences, the following are some policy implications for livestock
improvement research in Kenya:
i) For sustainable and effective adoption of agricultural technologies, given the much
reduced government’s roles in the delivery of services, the private sector is increasingly
playing a central roles in service delivery. This takes various forms, but the one that is
already in place and need to be rejuvenated and re-oriented is the farmer cooperative
movement (FCM). The FCM need to adopt a more multi-purpose service provision
roles than has been the case. In the past FCM were restricted to provision of marketing
services for farm produce and inputs (seed, fertilizer and animal feeds). FCM have the
untapped potential of providing wider services to the member and non-member farmers
on a need sensitive basis. It is recommended that FCMs personnel be trained in aspects
such as AI and extension to take over or augmenting government roles.
ii) In the process of technology development considerations must be made of the cultural
implications, technical feasibility and appropriateness as well as its sustainability.
Sustainability depends on the above first two factors as well as the ability of and the
extent to which the existing policies and infrastructure can support such technologies.
iii) Improvement in infrastructure particularly roads, provision of good quality water,
electricity and efficient telephone facilities are by and large essential for agricultural
technologies to effectively and positively impact on the rural based livestock farmers,
who are currently the least beneficiaries of modern agricultural technologies in Kenya.
iv) Despite the almost universal interest of farmers in mixed farming (crop-animal systems),
researchers appear to pursue pure commodity based research without consideration to
the associated interactions between the two which lead to increased productivity. There
is need to recognize such interactions by having a good balance between commodity and
farming systems based research.

27}}
3.6 Improved small scale dairy technology package
3.6.1 The zero grazing systemZero grazing is animal management exclusively under confinement. It started to gain relative
importance from the late 70s mainly due to the rising land pressure. It is the most intensive milk
production system and is implemented by more than 20,000 smallholders all over the country. The
system is characterised by keeping high yielding grade cattle like Ayrshire, Friesians and their crosses.
This system differs from semi-grazing by the absence of pastures, heavy dependence on cultivated
Napier grass and high use of purchased inputs. Milk yields per cow per year, in zero grazing farms
average 3,300 kg, 2,340 kg in semi-grazing farms and 1,800 kg in open grazing systems (Egerton
University, 1990).
The cattle are permanently kept in a cow shed, where they are fed, milked and also sleep. Zero
grazing farmers are predominantly market producers with from 1 to 5 cows. Their main interest
being milk production, the male calves are sold at an early age. Heifer calves are kept in calf pens
from where they are bucket fed with whole milk and some concentrates before they are weaned from
3 to 6 months. After weaning, heifers are kept with the cows. On most farms, cattle are sprayed once
a week to control tick-borne diseases and drenching to control internal parasites is done routinely.
The main feed under zero grazing system is Napier grass (Pennisetum purpureum), a perennial
fodder grass. It is the most popular fodder crop since under normal rainfall conditions, it is ready for
harvest 4 weeks after cutting and on it alone, a cow can produce up to 7 litres of milk per day
(Kariuki and Waithaka, 1992). However, Napier grass is prone to frost damage in the high altitude
areas, cannot withstand very long dry periods as experienced in the low altitude areas and cannot
withstand direct grazing. Napier grass has to be cut from the fields and carried to the cows and is
chopped to reduce wastage through spilling and trampling. Other feeds include farm by-products
which are in season, e.g., maize stover and vegetables as well as commercial concentrates and
mineral supplements.
3.6.1.1 Advantages of zero grazingThe most outstanding advantages of zero grazing (Kariuki and Waithaka, 1992) are:
1. Productivity per unit of land is increased since selective grazing is reduced and one acre
planted with Napier grass can support one cow and her followers (heifer and calf).
2. Animal energy expenditure is reduced as the cows do not have to walk while grazing
or searching for water.
3. Better health and management. Due to the confinement, the incidences of infestation by ticks
are reduced and cows which are sick or on heat can be detected in time.

28}}
4. More manure is available for fodders and crops reducing the use of expensive compound
fertilisers while improving soil fertility. This manure has an added advantage in that it
incorporates urine which is rich in nitrogen.
3.6.1.2 Problems associated with zero grazingThe major problems associated with zero grazing (Kariuki and Waithaka, 1992) are:
i) The cost of constructing a zero grazing unit is high. A unit for two cows and followers costs
more than KSh. 40,000.
ii) The system is labour intensive. Sine a cow eats up to 3% of its body weight in dry matter
basis per day, a 500 kg cow requires 15 kg dry matter equivalent to 100 kg of fresh Napier
grass.
iii) Diseases such as mastitis and foot rot can arise with poor management and low hygiene.
iv) Poor nutrient recycling can occur if manure is not returned to the fodder crops, but is instead put
in the food or cash crop fields.
v) Reduction in selective grazing may lead to poor nutrient intakes. Since cows select only the
green higher quality leaves, cutting and chopping of dead herbage and stems reduces the
quality of the feed offered.
vi) Time of harvesting Napier grass is crucial. The optimal time to harvest is from 4 and not later than
8 weeks after cutting.
3.6.1.3 The zero grazing technology package componentsThe zero grazing technology package as recommended by NDDP has six components:
1. The zero grazing unit consists of resting place and walking area, feed and water trough,
milking place, calf pen, fodder chopping area and manure pit.
2. Calf management includes management of in-calf cow, feeding calf with colostrum, whole
milk and concentrates before weaning, housing, disease control and feeding after weaning.
3. Napier grass management includes variety, area to be planted, planting, weed control,
cutting, fertiliser and manure use and intercropping with legumes.
4. Feeding the dairy cow includes feeding of Napier grass, supplementation with concentrates
and mineral salts.
5. Fertility of the dairy cow involves heat signs and detection, feeding in relation to fertility and
disease prevention.
6. Clean milk production includes hygiene and milking technique.
Unit production costs of milk are lower under zero grazing conditions primarily due to higher milk
yields. Other critical factors are shorter calving interval and reduced animal health costs.

29}}
3.6.2 Gross margin analysis of Zero-grazing as technology packageTo calculate gross margins of milk production under smallholder zero grazing conditions a
spreadsheet model adapted from Waithaka and Nijssen, 1992 is used. Data used are derived from the
experiences and standards developed by the National Dairy Development Programme (NDDP)
which worked directly with small scale dairy farmers and KARI, Naivasha.
The spreadsheet model is used in calculations for a reference farming situation (Table 10). The costs
and revenues of the farming system are split into various components. First the revenue is calculated
from revenue from sales of milk and sales of bull calves, heifers and cull cows. The number of cattle
to be sold is calculated by using the number of cows present, birth rate, calf mortality rate, heifer
mortality rate, adult mortality rate, culling rate, calving interval and age at first calving. The total milk
production per lactation and the calving interval are the two components used for calculation of the
annual milk production per cow and the peak production per day. Only those data together with the
maximum daily milk production from roughage are used to specify the amount of concentrates
required for the desired production. In the calculation, the lactation curve of the cow is estimated.
The costs of feeding the animals are split up in a number of items. The fodder expenses are calculated
as a fixed amount per acre. The number of acres per cow including followers is variable in the model.
A standard of 1.6 bag of CAN and 4 bags of 20 - 10 - 10 fertilizer have been included for production
of Napier grass. Animal health costs are calculated per average present animal. Weekly costs for tick
control are included for all age groups. Costs for AI or bull service are accounted for under animal
health costs.
Other cattle costs include milking pails, miscellaneous cattle costs, adult mortality and interest on
cattle. The adult mortality is included as a cost, because in the reference farming situation the number
of adult cattle is constant. The annual costs for adult mortality can therefore be considered as an
insurance premium. Interest costs for animals present in the farming system are included as
opportunity costs. If the farmer would not invest his money in cattle, but save it in a bank, he would
be earning interest on this money. Now that the money is invested in animals, interest costs on the
total value of the herd must be included in the production cost calculation.
The last group of costs is for use of land, labour, animal housing, a tick control sprayer and, if
applicable, for a chaff cutter. The costs of land have been set as an annual amount per acre. This
amount is the opportunity costs of the land. Also for labour costs, the opportunity costs have been
used. Costs for housing, sprayer and chaff cutter include maintenance, depreciation and interest.
To calculate the gross margin, the total variable cost is deducted from the total revenue. The
resulting amount is divided by the quantity of milk to be sold. This is the average annual milk

30}}
production minus the quantity of milk used to feed the calves. There is no subtraction for household
consumption. A summary of these calculations is shown in Table 11.
Table 10. Reference small-scale dairy farming situation
Description Input Result
Fertility and mortalityNumber of cowsCalving intervalAge at first calvingCalf mortality rateHeifer mortality rateCulling rateAdult mortality rateFeedsMilk production per lactationMilk production per yearMax production on roughage onlyNapier useMilk intake per bull calfMilk intake per heifer calfVeterinary costsCurative drugs + AI
Cattle pricesBull calvesHeifer 0-1 yearHeifer 1-2 yearsPregnant heifersCowsInterest rateHousing costsInvestmentMaintenanceChaff cutterInvestmentMaintenanceSprayer costsInvestmentMaintenance
3405 30 8 7 25 4
3,0002,7047.5 150
415
1,200/ cow1,000/ pregnant heifer500/ heifer 1-2yrs
500/ heifer 0-1 yearValue1,500
15,00025,00050,00040,000
20
42,0005%
KShs22,000
5%KShs8,0005%
cows days
months % % % %
kg
kg/dayacre/cow
kgkg
Selling2,000
18,00030,000
45,000%
KShs2,100 KShs
KShs1,100 KShs
400
Adapted from Waithaka and Nijssen, 1992.

31}}
Table 11. Gross margin of milk production under zero grazing conditions
Description Quantity Unit Price Unit Amount %
REVENUE
Milk to be marketedBull calvesHeifers 1-2 yearCull cows
Total Revenue
7,4831.350.410.75
litresanimalanimal
202,000
30,00045,000
litreanimalanimalanimal
149,6502,704
12,19833,750
198,302
751617
100
COSTS
Fodder expensesCAN Fertilizer20-10-10 FertilizerEarly weaner pelletsYoung stock pencilsDairy mealMineralsTotal feed costs
AcaricidesPY GreaseDewormerCurative drugs + AIMastriteMilking salveBactergentTotal vet costs
Milking pailsMiscellaneousAdult mortalityInterest on operatingcapitalTotal other costs
LandLabourHousingChaff cutterSprayerTotal other costs
Total costs
3.004.8012.0091363130685
205964981
6.75345
4
69,388
335442,00022,0008,000
acresbagsbagkgkgkgkg
mlgramml
litrekglitre
%
Kshs
acresdaysKShsKShsKShs
900950/50 kg1,300/50 kg1,150/70 kg1,200/70 kg800/70 kg850/70 kg
218/100 80/250185/120
1,200/5120/0.5520/5
6941,600
20
2,000 120 5 5 5
acresbagbagbagbagbagbag
mlgramml
litrekglitre
cowcow
%
acreday%%%
2,7004,56015,6001,4926,22914,9317,186
52,698
4,489 208 1244,8491,620 7204,68016,690
950 2,082 4,800
13,87820,759
6,00042,507 2,100 1,100 40052,107
142,252
2 311 1 410 5
37
3 0 0 3 1 1 312
1 1 3
1015
430 1 1 037
100
Gross margin 56,049
Adapted from Waithaka and Nijssen, 1992.
32}}
3.5.2 Role of AI in elevating poor peasant livestock keepers to commercial smallscale dairy farmers level
The bulk of the Zebu cattle owners are poorer members of the farming community who can not
afford to purchase grade or pure dairy cattle breeds in order to start off commercial dairy
enterprises in the high agricultural potential areas. On average the Zebu cow produces only 900
litres per year half of which is consumed by the calf while the half bred produces 1,500 litres per
year. AI technology gives such farmers opportunity to almost double their milk production per
cow per year in less than three years. Given that the extra overhead costs of maintaining a
crossbred cow is less than 10% above that of the Zebu and that the improvement in milk
production potential is permanent, and can be further built on in the subsequent generations, this
technology offers cheaper avenue for poverty alleviation to aspiring dairy farmers who
otherwise can not afford between Ksh.25,000 and 80,000 to purchase a purebred dairy cow.
Figure 2. Number of artificial inseminations (‘000) carried out by the Kenya National ArtificialInsemination Services (KNAIS) and private firms in Kenya: 1971-1997
Source: Government of Kenya, Department of Veterinary Services, Ministry of Agriculture
Figure 1 shows the trend of number of artificial inseminations carried out over the years (1971-
97). It is clear that between the periods of 1971 - 75 and 1981 - 84 when the government fully
supported the service by adequately funding and equipment, the number of inseminations
steadily increased, while the periods of 1985 - 88 and to date when such support as withdrawn
have been characterized by rapid decline of inseminations carried out by KNAIS. During the
period (1992 - 97) the private inseminators' role in delivering the AI service has been increasing
050
100150200250300350400450500550600
71 73 75 77 79 81 83 85 87 89 91 93 95 97
Year
Nu
mb
er o
f In
sem
inat
ion
s
AI by KNAIS AI by Private firms

33}}
although there still remains a big gap between the potential demand and what private service
providers offer today.
The additional 400 litres per cow is potentially available for sale three years later and thereafter
annually for the next five or so years. Without AI technology it would be nearly impossible for
the resource poor small-scale livestock farmers to join the dairy enterprise. The adoption of AI
technology, especially through the upgrading programme, has enabled approximately 80% of
the current suppliers of milk in Kenya to enter into commercial dairying within reasonably short
period than would have been if direct importation of dairy cows had been adopted.
AI enables farmers to achieve between 0.75% and 1% genetic potential improvement in their
herd's milk production annually. Use of bulls (natural mating) can only achieve much less and if
not well executed can most likely lead to retrogression. One bull can only serve up to 50 cows
each year and even if such services are charged at half of Ksh 350 that of the current average AI
charges, this can only realize an annual income of Ksh.15,000 and yet the annual maintenance
cost of such a bull if kept to serve only 80 cows would be equivalent to less than that of one
dairy cow at Ksh.25,000.
According to the gross margin analyses in Section 3.6 of this report the estimated current
commercial cost of semen plus its delivery at Ksh.700 forms 43% of the total annual veterinary
and AI costs per cow and only 1.5% of the total annual cost per cow per year. This turns out to
be only a negligible 1.4% proportion of the total value of milk sales per cow per year.
Currently AI charges are on average Ksh 150 per cow per year higher than those by bull
service. However, whereas the bull service has no guarantee of providing heifers that are
between 0.75 and 1% better than their parents’ production levels annually, with AI such
improvement rates are guaranteed. This means that with an extra Ksh 150 per cow per year the
AI user would tie a total (principal plus interest) of Ksh. 258 over a three-year period when
heifers born would begin milk production. Because such heifers will have 1% higher potential
they would each year for the next five years produce 30 litres more milk than those born of
natural mating. At the milk price of Ksh 20 per litre this turns out to be an extra Ksh.3,000 per
cow’s lifetime. Besides such a cow would on average, have higher salvage value than that born
from natural mating. Therefore, for an extra Ksh 260 cost an extra revenue of Ksh 1,200 would
accrue assuming that only 40% of calves born are females that reach milk production age.
The appropriateness and viability of any technology can be judged by how much demand it
attracts whenever it is offered in a competitive free market situation. From the trends of the

34}}
private artificial inseminations one could argue that AI as a tool for genetic improvement is
indeed the main reason behind the improvement and success of dairy sub-sector in Kenya as is
the case world over. If the potential is realized, then incomes of the poor can be raised and this
will alleviate poverty.
The failure of AI under the government supported programme was largely due to the wrong
choice of mode of delivery of the service. The KNAIS opted for motor vehicle as the mode of
transporting the service delivery which if compared to motorbike or moped costs much more to
buy and maintain. Besides, a motor vehicle requires more developed road network system and
would inadequately serve most of the rural communities today. The success of the private AI
service providers today is due to their choice of motorbikes instead of motor cars.
Table 9 shows that positive gross margins are realizable by private AI service providers under
different levels of operations and two modes of transport. This shows that AI as a technology is
viable at both the user (dairy farmer) and service provider levels. Results obtained from private
veterinarians indicate that when AI is combined with clinical practice and agro-veterinary retail
practice the gross margin from the AI activity is even larger. Similarly, cooperative member
small scale dairy farmers could lower their AI service costs substantially by training one of their
technicians to provide AI service besides other extension or marketing services.
The purchase and maintenance cost of operating the smallest second hand four-wheel drive car
would be twice that of a motorbike and would therefore beyond the reach of a beginning private
inseminator.
Currently the population of dairy cattle in Kenya is 12 million head. Assuming that 60% of these
are cows and heifers of breeding ages and that 10% of these need to be inseminated monthly,
the approximately 720,000 inseminations need to be carried out. Of these, if 70% are through
AI then it is apparent that a huge potential exists for the privates AI service.

35}}
Table 12 Estimated gross margin analysis of AI service when inseminator uses motorbike andmoped
Purchase price KshInsemination charge per dose Ksh 375 375
RevenueServices per day 4 6 10 4 6 10Semen per dose 450 450 450 450 450 450Revenue from semen sales 604,800 907,200 1,512,000 604,800 907,200 1,512,000Service charges 360,000 540,000 900,000 360,000 540,000 900,000TOTAL REVENUE 964,800 1,447,200 2,412,000 964,800 1,447,200 2,412,000
CostsCost of semen 604,800 907,200 1,512,000 604,800 907,200 1,512,000Stationery 20,700 20,700 20,700 20,700 20,700 20,700Liquid Nitrogen 37,800 37,800 37,800 37,800 37,800 37,800Consumable supplies 45,000 45,000 45,000 45,000 45,000 45,000Fuel 60,000 60,000 60,000 18,000 18,000 18,000Maintenance 2,400 2,400 2,400 1,200 1,200 1,200TOTAL COSTS 770,700 1,073,100 1,677,900 727,500 1,029,900 1,634,700
GROSS MARGIN 194,100 374,100 734,100 237,300 417,300 777,300
Motorbike Moped120,000 60,000
Adapted from American Breeders Service Kenya Ltd., 1998.
Table 9 gives the estimates of gross margin analyses of private AI delivery service based on two
modes of transportation (motorbike and moped) on annual basis. Use of mopeds and
motorbikes compare reasonably well and offer very high gross margins when six and ten
inseminations are offered in a day.
Reasons attributed to the very high AI costs incurred by KNAIS relative to milk prices include:
(v) Wrong choice of AI delivery service (cars instead of motorbikes) given the poor states
of rural roads, the vehicle running costs were too high. Secondly the time taken to
reach cows that are reported to be on heat would be much longer, with a good number
of such cows being inseminated well past the optimum periods.
(vi) Poor infrastructure: the cost of telephone services is too high, while the quality of this
service is dually low.
(vii) Poor market policies: milk is not marketed based on quality (protein and butter fat
content), while semen is priced on quality which, includes anticipated milk quality.
(viii) Poor legal frameworks that govern and regulate the various service providing
institutions. Service providing institution, are commonly poorly run with fraud and
corruption being rampant among cooperative leaders and employees. The legal
machinery is inefficient that justice when applied, it is usually comes too late.
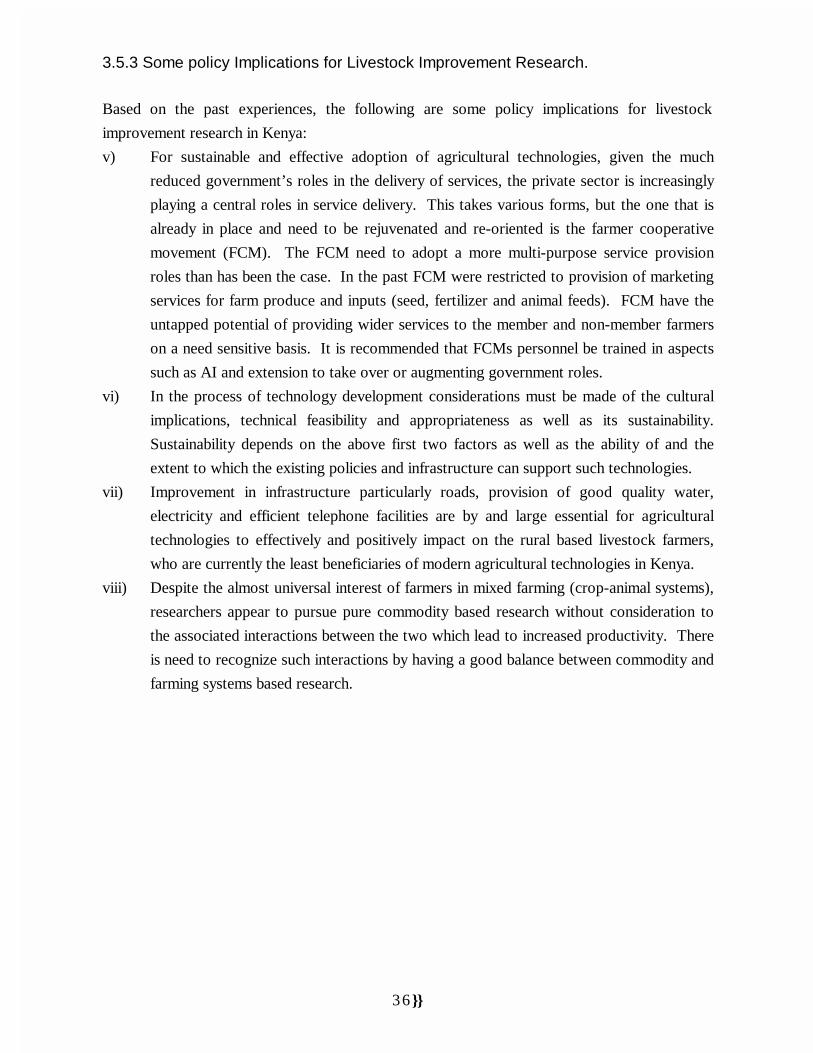
36}}
3.5.3 Some policy Implications for Livestock Improvement Research.
Based on the past experiences, the following are some policy implications for livestock
improvement research in Kenya:
v) For sustainable and effective adoption of agricultural technologies, given the much
reduced government’s roles in the delivery of services, the private sector is increasingly
playing a central roles in service delivery. This takes various forms, but the one that is
already in place and need to be rejuvenated and re-oriented is the farmer cooperative
movement (FCM). The FCM need to adopt a more multi-purpose service provision
roles than has been the case. In the past FCM were restricted to provision of marketing
services for farm produce and inputs (seed, fertilizer and animal feeds). FCM have the
untapped potential of providing wider services to the member and non-member farmers
on a need sensitive basis. It is recommended that FCMs personnel be trained in aspects
such as AI and extension to take over or augmenting government roles.
vi) In the process of technology development considerations must be made of the cultural
implications, technical feasibility and appropriateness as well as its sustainability.
Sustainability depends on the above first two factors as well as the ability of and the
extent to which the existing policies and infrastructure can support such technologies.
vii) Improvement in infrastructure particularly roads, provision of good quality water,
electricity and efficient telephone facilities are by and large essential for agricultural
technologies to effectively and positively impact on the rural based livestock farmers,
who are currently the least beneficiaries of modern agricultural technologies in Kenya.
viii) Despite the almost universal interest of farmers in mixed farming (crop-animal systems),
researchers appear to pursue pure commodity based research without consideration to
the associated interactions between the two which lead to increased productivity. There
is need to recognize such interactions by having a good balance between commodity and
farming systems based research.

37}}
3.6 Improved small scale dairy technology package
3.6.1 The zero grazing systemZero grazing is animal management exclusively under confinement. It started to gain relative
importance from the late 70s mainly due to the rising land pressure. It is the most intensive milk
production system and is implemented by more than 20,000 smallholders all over the country. The
system is characterised by keeping high yielding grade cattle like Ayrshire, Friesians and their crosses.
This system differs from semi-grazing by the absence of pastures, heavy dependence on cultivated
Napier grass and high use of purchased inputs. Milk yields per cow per year, in zero grazing farms
average 3,300 kg, 2,340 kg in semi-grazing farms and 1,800 kg in open grazing systems (Egerton
University, 1990).
The cattle are permanently kept in a cow shed, where they are fed, milked and also sleep. Zero
grazing farmers are predominantly market producers with from 1 to 5 cows. Their main interest
being milk production, the male calves are sold at an early age. Heifer calves are kept in calf pens
from where they are bucket fed with whole milk and some concentrates before they are weaned from
3 to 6 months. After weaning, heifers are kept with the cows. On most farms, cattle are sprayed once
a week to control tick-borne diseases and drenching to control internal parasites is done routinely.
The main feed under zero grazing system is Napier grass (Pennisetum purpureum), a perennial
fodder grass. It is the most popular fodder crop since under normal rainfall conditions, it is ready for
harvest 4 weeks after cutting and on it alone, a cow can produce up to 7 litres of milk per day
(Kariuki and Waithaka, 1992). However, Napier grass is prone to frost damage in the high altitude
areas, cannot withstand very long dry periods as experienced in the low altitude areas and cannot
withstand direct grazing. Napier grass has to be cut from the fields and carried to the cows and is
chopped to reduce wastage through spilling and trampling. Other feeds include farm by-products
which are in season, e.g., maize stover and vegetables as well as commercial concentrates and
mineral supplements.
3.6.1.1 Advantages of zero grazingThe most outstanding advantages of zero grazing (Kariuki and Waithaka, 1992) are:
1. Productivity per unit of land is increased since selective grazing is reduced and one acre
planted with Napier grass can support one cow and her followers (heifer and calf).
2. Animal energy expenditure is reduced as the cows do not have to walk while grazing
or searching for water.
3. Better health and management. Due to the confinement, the incidences of infestation by ticks
are reduced and cows which are sick or on heat can be detected in time.

38}}
4. More manure is available for fodders and crops reducing the use of expensive compound
fertilisers while improving soil fertility. This manure has an added advantage in that it
incorporates urine which is rich in nitrogen.
3.6.1.2 Problems associated with zero grazingThe major problems associated with zero grazing (Kariuki and Waithaka, 1992) are:
vii) The cost of constructing a zero grazing unit is high. A unit for two cows and followers costs
more than KSh. 40,000.
viii) The system is labour intensive. Sine a cow eats up to 3% of its body weight in dry matter
basis per day, a 500 kg cow requires 15 kg dry matter equivalent to 100 kg of fresh Napier
grass.
ix) Diseases such as mastitis and foot rot can arise with poor management and low hygiene.
x) Poor nutrient recycling can occur if manure is not returned to the fodder crops, but is instead put
in the food or cash crop fields.
xi) Reduction in selective grazing may lead to poor nutrient intakes. Since cows select only the
green higher quality leaves, cutting and chopping of dead herbage and stems reduces the
quality of the feed offered.
xii) Time of harvesting Napier grass is crucial. The optimal time to harvest is from 4 and not later
than 8 weeks after cutting.
3.6.1.3 The zero grazing technology package componentsThe zero grazing technology package as recommended by NDDP has six components:
7. The zero grazing unit consists of resting place and walking area, feed and water trough,
milking place, calf pen, fodder chopping area and manure pit.
8. Calf management includes management of in-calf cow, feeding calf with colostrum, whole
milk and concentrates before weaning, housing, disease control and feeding after weaning.
9. Napier grass management includes variety, area to be planted, planting, weed control,
cutting, fertiliser and manure use and intercropping with legumes.
10. Feeding the dairy cow includes feeding of Napier grass, supplementation with concentrates
and mineral salts.
11. Fertility of the dairy cow involves heat signs and detection, feeding in relation to fertility and
disease prevention.
12. Clean milk production includes hygiene and milking technique.
Unit production costs of milk are lower under zero grazing conditions primarily due to higher milk
yields. Other critical factors are shorter calving interval and reduced animal health costs.

39}}
3.6.2 Gross margin analysis of Zero-grazing as technology packageTo calculate gross margins of milk production under smallholder zero grazing conditions a
spreadsheet model adapted from Waithaka and Nijssen, 1992 is used. Data used are derived from the
experiences and standards developed by the National Dairy Development Programme (NDDP)
which worked directly with small scale dairy farmers and KARI, Naivasha.
The spreadsheet model is used in calculations for a reference farming situation (Table 10). The costs
and revenues of the farming system are split into various components. First the revenue is calculated
from revenue from sales of milk and sales of bull calves, heifers and cull cows. The number of cattle
to be sold is calculated by using the number of cows present, birth rate, calf mortality rate, heifer
mortality rate, adult mortality rate, culling rate, calving interval and age at first calving. The total milk
production per lactation and the calving interval are the two components used for calculation of the
annual milk production per cow and the peak production per day. Only those data together with the
maximum daily milk production from roughage are used to specify the amount of concentrates
required for the desired production. In the calculation, the lactation curve of the cow is estimated.
The costs of feeding the animals are split up in a number of items. The fodder expenses are calculated
as a fixed amount per acre. The number of acres per cow including followers is variable in the model.
A standard of 1.6 bag of CAN and 4 bags of 20 - 10 - 10 fertilizer have been included for production
of Napier grass. Animal health costs are calculated per average present animal. Weekly costs for tick
control are included for all age groups. Costs for AI or bull service are accounted for under animal
health costs.
Other cattle costs include milking pails, miscellaneous cattle costs, adult mortality and interest on
cattle. The adult mortality is included as a cost, because in the reference farming situation the number
of adult cattle is constant. The annual costs for adult mortality can therefore be considered as an
insurance premium. Interest costs for animals present in the farming system are included as
opportunity costs. If the farmer would not invest his money in cattle, but save it in a bank, he would
be earning interest on this money. Now that the money is invested in animals, interest costs on the
total value of the herd must be included in the production cost calculation.
The last group of costs is for use of land, labour, animal housing, a tick control sprayer and, if
applicable, for a chaff cutter. The costs of land have been set as an annual amount per acre. This
amount is the opportunity costs of the land. Also for labour costs, the opportunity costs have been
used. Costs for housing, sprayer and chaff cutter include maintenance, depreciation and interest.
To calculate the gross margin, the total variable cost is deducted from the total revenue. The
resulting amount is divided by the quantity of milk to be sold. This is the average annual milk

40}}
production minus the quantity of milk used to feed the calves. There is no subtraction for household
consumption. A summary of these calculations is shown in Table 11.
Table 13. Reference small-scale dairy farming situation
Description Input Result
Fertility and mortalityNumber of cowsCalving intervalAge at first calvingCalf mortality rateHeifer mortality rateCulling rateAdult mortality rateFeedsMilk production per lactationMilk production per yearMax production on roughage onlyNapier useMilk intake per bull calfMilk intake per heifer calfVeterinary costsCurative drugs + AI
Cattle pricesBull calvesHeifer 0-1 yearHeifer 1-2 yearsPregnant heifersCowsInterest rateHousing costsInvestmentMaintenanceChaff cutterInvestmentMaintenanceSprayer costsInvestmentMaintenance
3405 30 8 7 25 4
3,0002,7047.5 150
415
1,200/ cow1,000/ pregnant heifer500/ heifer 1-2yrs
500/ heifer 0-1 yearValue1,500
15,00025,00050,00040,000
20
42,0005%
KShs22,000
5%KShs8,0005%
cows days
months % % % %
kg
kg/dayacre/cow
kgkg
Selling2,000
18,00030,000
45,000%
KShs2,100 KShs
KShs1,100 KShs
400
Adapted from Waithaka and Nijssen, 1992.

41}}
Table 14. Gross margin of milk production under zero grazing conditions
Description Quantity Unit Price Unit Amount %
REVENUE
Milk to be marketedBull calvesHeifers 1-2 yearCull cows
Total Revenue
7,4831.350.410.75
litresanimalanimal
202,000
30,00045,000
litreanimalanimalanimal
149,6502,704
12,19833,750
198,302
751617
100
COSTS
Fodder expensesCAN Fertilizer20-10-10 FertilizerEarly weaner pelletsYoung stock pencilsDairy mealMineralsTotal feed costs
AcaricidesPY GreaseDewormerCurative drugs + AIMastriteMilking salveBactergentTotal vet costs
Milking pailsMiscellaneousAdult mortalityInterest on operatingcapitalTotal other costs
LandLabourHousingChaff cutterSprayerTotal other costs
Total costs
3.004.8012.0091363130685
205964981
6.75345
4
69,388
335442,00022,0008,000
acresbagsbagkgkgkgkg
mlgramml
litrekglitre
%
Kshs
acresdaysKShsKShsKShs
900950/50 kg1,300/50 kg1,150/70 kg1,200/70 kg800/70 kg850/70 kg
218/100 80/250185/120
1,200/5120/0.5520/5
6941,600
20
2,000 120 5 5 5
acresbagbagbagbagbagbag
mlgramml
litrekglitre
cowcow
%
acreday%%%
2,7004,56015,6001,4926,22914,9317,186
52,698
4,489 208 1244,8491,620 7204,68016,690
950 2,082 4,800
13,87820,759
6,00042,507 2,100 1,100 40052,107
142,252
2 311 1 410 5
37
3 0 0 3 1 1 312
1 1 3
1015
430 1 1 037
100
Gross margin 56,049
Adapted from Waithaka and Nijssen, 1992.

42}}
Results
In the reference farming situation with three cows, the gross margin is Ksh 56,049. The main
cost items are labour 30%, other costs, 19%, concentrates 15%, fertilizer 14% animal health at
12% and interest on operating capital at 10%. The major source of revenue is milk at 76%, cull
cows 17%, one to two year old heifers 6% and bull calves 1% (Table 11).
Sensitivity analysis
The reference farming situation is more or less an arbitrary situation. Therefore it is important
to check the gross margin in different situations as well. In every analysis only one factor has
been changed from the reference farming
situation to different levels.
Number of cows
In the reference farming situation the
number of cows is three. The number of
cows is an important factor in the gross
margin calculations. The reason for that is
that a number of costs in the gross margin
calculations are incurred irrespective of the
number of cows although they are not fixed
costs. When the same expenses have to be
divided by a smaller herd size, the gross
margin increases. At two cows the gross
margin is Ksh. 33,759 at six cows it is Ksh.
133,245. For each additional cow, the
gross margin increases by Ksh 23,973.
Milk production per lactation
In the reference farming situation the milk production per lactation is 3,000 litres. Since the
calving interval is 405 days, the annual production per cow is 2,704 litres. At this production
level the gross margin is Ksh.56,049. When milk production is only 2,000 litres per lactation the
gross margin decreases to Ksh. 18,451. At a production level of 4,500 litres the gross margin
increases to Ksh. 103,365. For every 500 liters increase in annual milk production, the gross
margin increases by Ksh 17,000.
Calving interval
The calving interval is 405 days in the
reference farming situation and many
Cows
0
20,000
40,000
60,000
0 2 4 6 8
Number of cows
Gro
ss M
arg
in (
K.S
hs.
)
Lactation yield
0
20,000
40,000
60,000
0 1,000 2,000 3,000 4,000 5,000
Lactation yield (kg)
Gro
ss M
arg
in (
KS
hs)
Calving interval
0
20,000
40,000
60,000
0 200 400 600
Gro
ss M
arg
in (
Ksh
s)

43}}
farmers do not reach this level but border on more than 450 days. The gross margin at the
optimal calving interval of 365 days is Ksh. 70,405. At an interval of 495 days the gross margin
drops to Ksh. 33,395. The main reason for this severe influence of calving interval on the gross
margin is that the annual milk supply
decreases at an unchanged production level
per lactation. For every 30 days increase in
calving interval, the gross margin declines by
Ksh 8,520.
Milk price
Milk price in the reference situation is Ksh
20 per litre. Although milk prices are no
longer controlled, they vary from Ksh 10 in surplus areas such as Nyandarua to Ksh 35 in deficit
areas such as Mombasa. At Ksh 10, the gross margin drops to Ksh -18,777. At Ksh 35, it
shoots to Ksh 168,286. This implies that for every shilling increase in the price of milk, the
gross margin increases by Ksh 7,483.
Maximum production on roughage
only
The quantity of concentrates needed to
achieve a certain milk production is affected
by both the quality and the quantity of roughage available. Under good Napier management,
like in the reference farming situation, it is possible to produce 7.5 litres of milk per day when
feeding only roughage. At 4.5 litres of milk on roughage only the gross margin is Ksh. 35,740,
at 9.5 litres of milk on roughage only it is Ksh. 65,526. For every litre increase in milk
production the gross margin increases by Ksh 5,954.
Milk Price
0
20,000
40,000
60,000
10 15 20 25 30 35
Max. production on roughage only
0
20,000
40,000
60,000
0 2 4 6 8 10
Roughage (kg/day)
Gro
ss M
arg
in

44}}
Labour costs
The costs for labour differ very much
between different districts. In densely
populated areas, generally the labour cost
is lower. In the reference farming situation
labour costs have been set at Ksh. 120 per
day. When the labour costs are only Ksh.
80 per day, the gross margin decreases to
Ksh. 70,218. At a labour costs level of
Ksh. 160 per day it is Ksh. 41,880 per litre. For every Ksh 10 increase in labour costs, the gross
margin declines by Ksh 3,540.
Interest rate
The interest rate used in the reference
farming situation is 20 %. Interest is
charged on operating capital. The interest
rate changes the production cost of milk by
about Ksh 694 for every 1 % change in interest rate.
Other factors
In addition, the sensitivity of cattle sales prices, fertilizer prices, concentrate prices and
veterinary costs were investigated. These factors have only marginal influence (1%) on the
gross margin of milk. The influence of the milk taken by calves on the gross margin is bigger. In
the reference farming situation bull calves get 50 litres of milk and heifer calves get 415 litres. If
this is reduced to 30 litres and 265 litres respectively, the gross margin increases from Ksh.
56.049 to Ksh.60,645. However, this is only recommended if the calves are provided with milk
replacers which do not compromise calf health and growth.
Labour
0
20,000
40,000
60,000
0 50 100 150 200
Labour per man day (KShs)
Gro
ss M
arg
in (
KS
hs)
Interest rate
0
20,000
40,000
60,000
0 10 20 30 40

45}}
3.6 Improved small scale dairy technology package
3.6.1 The zero grazing systemZero grazing is animal management exclusively under confinement. It started to gain relative
importance from the late 70s mainly due to the rising land pressure. It is the most intensive milk
production system and is implemented by more than 20,000 smallholders all over the country. The
system is characterised by keeping high yielding grade cattle like Ayrshire, Friesians and their crosses.
This system differs from semi-grazing by the absence of pastures, heavy dependence on cultivated
Napier grass and high use of purchased inputs. Milk yields per cow per year, in zero grazing farms
average 3,300 kg, 2,340 kg in semi-grazing farms and 1,800 kg in open grazing systems (Egerton
University, 1990).
The cattle are permanently kept in a cow shed, where they are fed, milked and also sleep. Zero
grazing farmers are predominantly market producers with from 1 to 5 cows. Their main interest
being milk production, the male calves are sold at an early age. Heifer calves are kept in calf pens
from where they are bucket fed with whole milk and some concentrates before they are weaned from
3 to 6 months. After weaning, heifers are kept with the cows. On most farms, cattle are sprayed once
a week to control tick-borne diseases and drenching to control internal parasites is done routinely.
The main feed under zero grazing system is Napier grass (Pennisetum purpureum), a perennial
fodder grass. It is the most popular fodder crop since under normal rainfall conditions, it is ready for
harvest 4 weeks after cutting and on it alone, a cow can produce up to 7 litres of milk per day
(Kariuki and Waithaka, 1992). However, Napier grass is prone to frost damage in the high altitude
areas, cannot withstand very long dry periods as experienced in the low altitude areas and cannot
withstand direct grazing. Napier grass has to be cut from the fields and carried to the cows and is
chopped to reduce wastage through spilling and trampling. Other feeds include farm by-products
which are in season, e.g., maize stover and vegetables as well as commercial concentrates and
mineral supplements.
3.6.1.1 Advantages of zero grazingThe most outstanding advantages of zero grazing (Kariuki and Waithaka, 1992) are:
1. Productivity per unit of land is increased since selective grazing is reduced and one acre
planted with Napier grass can support one cow and her followers (heifer and calf).
2. Animal energy expenditure is reduced as the cows do not have to walk while grazing
or searching for water.
3. Better health and management. Due to the confinement, the incidences of infestation by ticks
are reduced and cows which are sick or on heat can be detected in time.

46}}
4. More manure is available for fodders and crops reducing the use of expensive compound
fertilisers while improving soil fertility. This manure has an added advantage in that it
incorporates urine which is rich in nitrogen.
3.6.1.2 Problems associated with zero grazingThe major problems associated with zero grazing (Kariuki and Waithaka, 1992) are:
xiii) The cost of constructing a zero grazing unit is high. A unit for two cows and followers costs
more than KSh. 40,000.
xiv) The system is labour intensive. Sine a cow eats up to 3% of its body weight in dry matter
basis per day, a 500 kg cow requires 15 kg dry matter equivalent to 100 kg of fresh Napier
grass.
xv) Diseases such as mastitis and foot rot can arise with poor management and low hygiene.
xvi) Poor nutrient recycling can occur if manure is not returned to the fodder crops, but is instead
put in the food or cash crop fields.
xvii) Reduction in selective grazing may lead to poor nutrient intakes. Since cows select only the
green higher quality leaves, cutting and chopping of dead herbage and stems reduces the
quality of the feed offered.
xviii) Time of harvesting Napier grass is crucial. The optimal time to harvest is from 4 and not later
than 8 weeks after cutting.
3.6.1.3 The zero grazing technology package componentsThe zero grazing technology package as recommended by NDDP has six components:
13. The zero grazing unit consists of resting place and walking area, feed and water trough,
milking place, calf pen, fodder chopping area and manure pit.
14. Calf management includes management of in-calf cow, feeding calf with colostrum, whole
milk and concentrates before weaning, housing, disease control and feeding after weaning.
15. Napier grass management includes variety, area to be planted, planting, weed control,
cutting, fertiliser and manure use and intercropping with legumes.
16. Feeding the dairy cow includes feeding of Napier grass, supplementation with concentrates
and mineral salts.
17. Fertility of the dairy cow involves heat signs and detection, feeding in relation to fertility and
disease prevention.
18. Clean milk production includes hygiene and milking technique.
Unit production costs of milk are lower under zero grazing conditions primarily due to higher milk
yields. Other critical factors are shorter calving interval and reduced animal health costs.

47}}
3.6.2 Gross margin analysis of Zero-grazing as technology packageTo calculate gross margins of milk production under smallholder zero grazing conditions a
spreadsheet model adapted from Waithaka and Nijssen, 1992 is used. Data used are derived from the
experiences and standards developed by the National Dairy Development Programme (NDDP)
which worked directly with small scale dairy farmers and KARI, Naivasha.
The spreadsheet model is used in calculations for a reference farming situation (Table 10). The costs
and revenues of the farming system are split into various components. First the revenue is calculated
from revenue from sales of milk and sales of bull calves, heifers and cull cows. The number of cattle
to be sold is calculated by using the number of cows present, birth rate, calf mortality rate, heifer
mortality rate, adult mortality rate, culling rate, calving interval and age at first calving. The total milk
production per lactation and the calving interval are the two components used for calculation of the
annual milk production per cow and the peak production per day. Only those data together with the
maximum daily milk production from roughage are used to specify the amount of concentrates
required for the desired production. In the calculation, the lactation curve of the cow is estimated.
The costs of feeding the animals are split up in a number of items. The fodder expenses are calculated
as a fixed amount per acre. The number of acres per cow including followers is variable in the model.
A standard of 1.6 bag of CAN and 4 bags of 20 - 10 - 10 fertilizer have been included for production
of Napier grass. Animal health costs are calculated per average present animal. Weekly costs for tick
control are included for all age groups. Costs for AI or bull service are accounted for under animal
health costs.
Other cattle costs include milking pails, miscellaneous cattle costs, adult mortality and interest on
cattle. The adult mortality is included as a cost, because in the reference farming situation the number
of adult cattle is constant. The annual costs for adult mortality can therefore be considered as an
insurance premium. Interest costs for animals present in the farming system are included as
opportunity costs. If the farmer would not invest his money in cattle, but save it in a bank, he would
be earning interest on this money. Now that the money is invested in animals, interest costs on the
total value of the herd must be included in the production cost calculation.
The last group of costs is for use of land, labour, animal housing, a tick control sprayer and, if
applicable, for a chaff cutter. The costs of land have been set as an annual amount per acre. This
amount is the opportunity costs of the land. Also for labour costs, the opportunity costs have been
used. Costs for housing, sprayer and chaff cutter include maintenance, depreciation and interest.
To calculate the gross margin, the total variable cost is deducted from the total revenue. The
resulting amount is divided by the quantity of milk to be sold. This is the average annual milk

48}}
production minus the quantity of milk used to feed the calves. There is no subtraction for household
consumption. A summary of these calculations is shown in Table 11.
Table 15. Reference small-scale dairy farming situation
Description Input Result
Fertility and mortalityNumber of cowsCalving intervalAge at first calvingCalf mortality rateHeifer mortality rateCulling rateAdult mortality rateFeedsMilk production per lactationMilk production per yearMax production on roughage onlyNapier useMilk intake per bull calfMilk intake per heifer calfVeterinary costsCurative drugs + AI
Cattle pricesBull calvesHeifer 0-1 yearHeifer 1-2 yearsPregnant heifersCowsInterest rateHousing costsInvestmentMaintenanceChaff cutterInvestmentMaintenanceSprayer costsInvestmentMaintenance
3405 30 8 7 25 4
3,0002,7047.5 150
415
1,200/ cow1,000/ pregnant heifer500/ heifer 1-2yrs
500/ heifer 0-1 yearValue1,500
15,00025,00050,00040,000
20
42,0005%
KShs22,000
5%KShs8,0005%
cows days
months % % % %
kg
kg/dayacre/cow
kgkg
Selling2,000
18,00030,000
45,000%
KShs2,100 KShs
KShs1,100 KShs
400
Adapted from Waithaka and Nijssen, 1992.
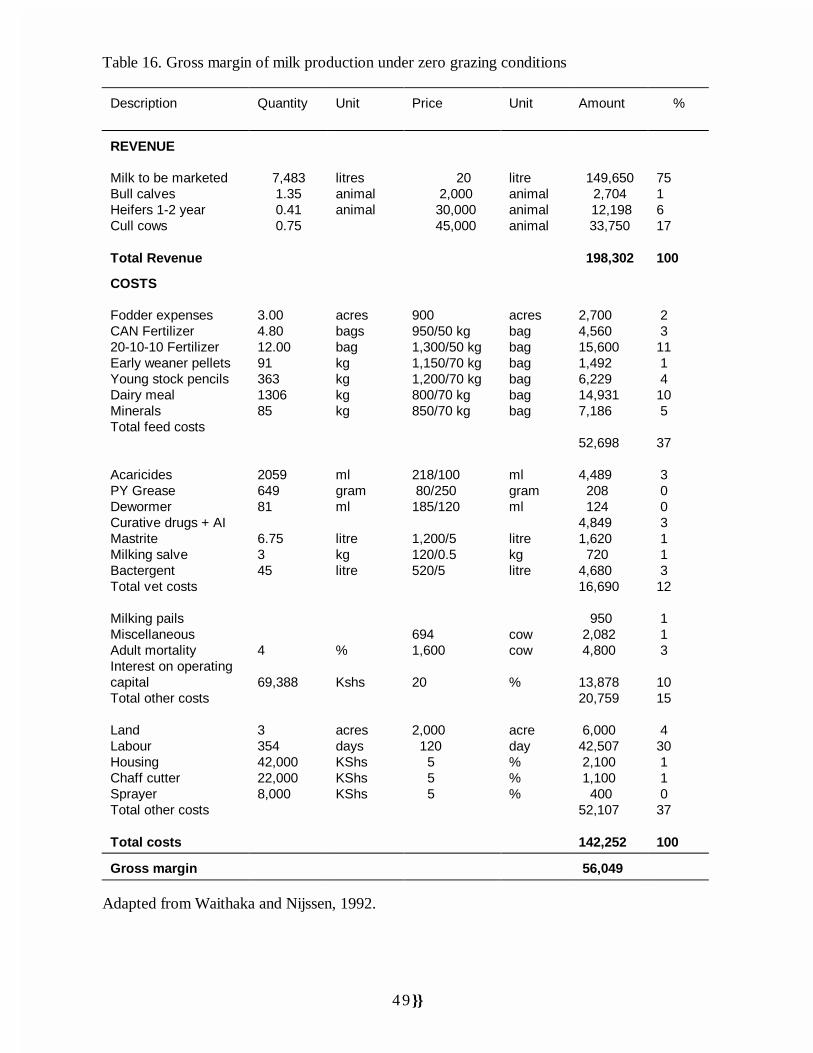
49}}
Table 16. Gross margin of milk production under zero grazing conditions
Description Quantity Unit Price Unit Amount %
REVENUE
Milk to be marketedBull calvesHeifers 1-2 yearCull cows
Total Revenue
7,4831.350.410.75
litresanimalanimal
202,000
30,00045,000
litreanimalanimalanimal
149,6502,704
12,19833,750
198,302
751617
100
COSTS
Fodder expensesCAN Fertilizer20-10-10 FertilizerEarly weaner pelletsYoung stock pencilsDairy mealMineralsTotal feed costs
AcaricidesPY GreaseDewormerCurative drugs + AIMastriteMilking salveBactergentTotal vet costs
Milking pailsMiscellaneousAdult mortalityInterest on operatingcapitalTotal other costs
LandLabourHousingChaff cutterSprayerTotal other costs
Total costs
3.004.8012.0091363130685
205964981
6.75345
4
69,388
335442,00022,0008,000
acresbagsbagkgkgkgkg
mlgramml
litrekglitre
%
Kshs
acresdaysKShsKShsKShs
900950/50 kg1,300/50 kg1,150/70 kg1,200/70 kg800/70 kg850/70 kg
218/100 80/250185/120
1,200/5120/0.5520/5
6941,600
20
2,000 120 5 5 5
acresbagbagbagbagbagbag
mlgramml
litrekglitre
cowcow
%
acreday%%%
2,7004,56015,6001,4926,22914,9317,186
52,698
4,489 208 1244,8491,620 7204,68016,690
950 2,082 4,800
13,87820,759
6,00042,507 2,100 1,100 40052,107
142,252
2 311 1 410 5
37
3 0 0 3 1 1 312
1 1 3
1015
430 1 1 037
100
Gross margin 56,049
Adapted from Waithaka and Nijssen, 1992.

50}}
Results
In the reference farming situation with three cows, the gross margin is Ksh 56,049. The main
cost items are labour 30%, other costs, 19%, concentrates 15%, fertilizer 14% animal health at
12% and interest on operating capital at 10%. The major source of revenue is milk at 76%, cull
cows 17%, one to two year old heifers 6% and bull calves 1% (Table 11).
Sensitivity analysis
The reference farming situation is more or less an arbitrary situation. Therefore it is important
to check the gross margin in different situations as well. In every analysis only one factor has
been changed from the reference farming
situation to different levels.
Number of cows
In the reference farming situation the
number of cows is three. The number of
cows is an important factor in the gross
margin calculations. The reason for that is
that a number of costs in the gross margin
calculations are incurred irrespective of the
number of cows although they are not fixed
costs. When the same expenses have to be
divided by a smaller herd size, the gross
margin increases. At two cows the gross
margin is Ksh. 33,759 at six cows it is Ksh.
133,245. For each additional cow, the
gross margin increases by Ksh 23,973.
Milk production per lactation
In the reference farming situation the milk production per lactation is 3,000 litres. Since the
calving interval is 405 days, the annual production per cow is 2,704 litres. At this production
level the gross margin is Ksh.56,049. When milk production is only 2,000 litres per lactation the
gross margin decreases to Ksh. 18,451. At a production level of 4,500 litres the gross margin
increases to Ksh. 103,365. For every 500 liters increase in annual milk production, the gross
margin increases by Ksh 17,000.
Calving interval
The calving interval is 405 days in the
reference farming situation and many
Cows
0
20,000
40,000
60,000
0 2 4 6 8
Number of cows
Gro
ss M
arg
in (
K.S
hs.
)
Lactation yield
0
20,000
40,000
60,000
0 1,000 2,000 3,000 4,000 5,000
Lactation yield (kg)
Gro
ss M
arg
in (
KS
hs)
Calving interval
0
20,000
40,000
60,000
0 200 400 600
Gro
ss M
arg
in (
Ksh
s)
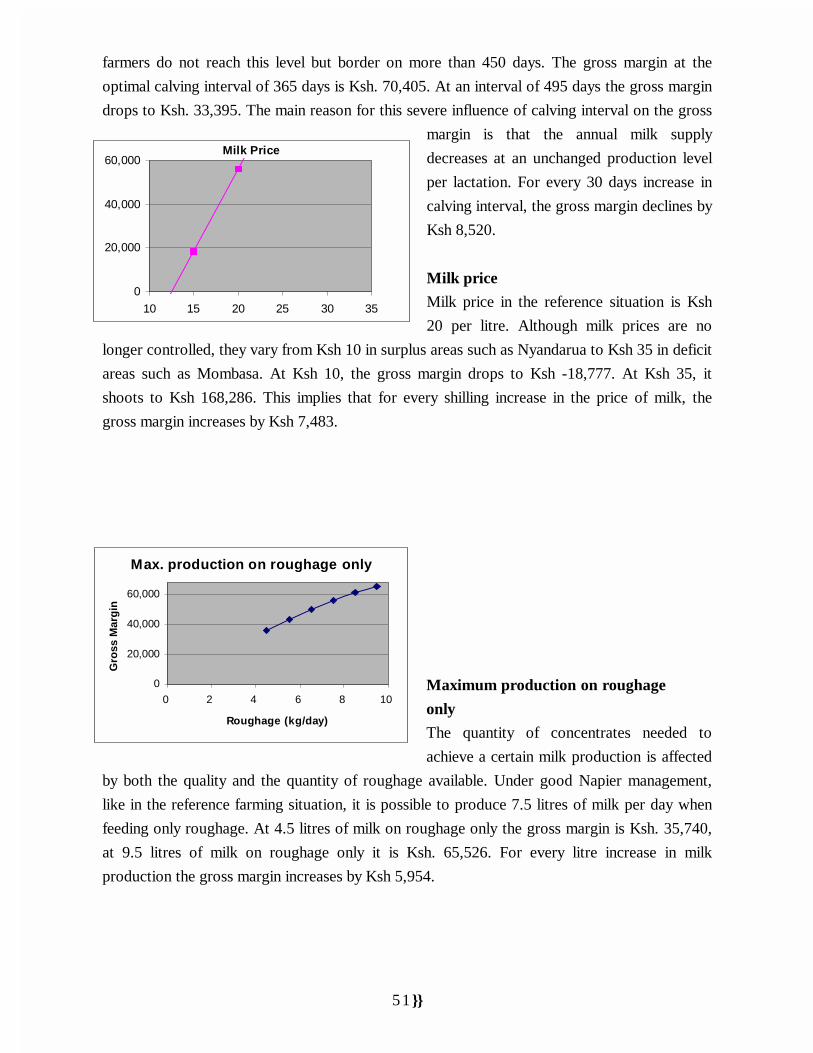
51}}
farmers do not reach this level but border on more than 450 days. The gross margin at the
optimal calving interval of 365 days is Ksh. 70,405. At an interval of 495 days the gross margin
drops to Ksh. 33,395. The main reason for this severe influence of calving interval on the gross
margin is that the annual milk supply
decreases at an unchanged production level
per lactation. For every 30 days increase in
calving interval, the gross margin declines by
Ksh 8,520.
Milk price
Milk price in the reference situation is Ksh
20 per litre. Although milk prices are no
longer controlled, they vary from Ksh 10 in surplus areas such as Nyandarua to Ksh 35 in deficit
areas such as Mombasa. At Ksh 10, the gross margin drops to Ksh -18,777. At Ksh 35, it
shoots to Ksh 168,286. This implies that for every shilling increase in the price of milk, the
gross margin increases by Ksh 7,483.
Maximum production on roughage
only
The quantity of concentrates needed to
achieve a certain milk production is affected
by both the quality and the quantity of roughage available. Under good Napier management,
like in the reference farming situation, it is possible to produce 7.5 litres of milk per day when
feeding only roughage. At 4.5 litres of milk on roughage only the gross margin is Ksh. 35,740,
at 9.5 litres of milk on roughage only it is Ksh. 65,526. For every litre increase in milk
production the gross margin increases by Ksh 5,954.
Milk Price
0
20,000
40,000
60,000
10 15 20 25 30 35
Max. production on roughage only
0
20,000
40,000
60,000
0 2 4 6 8 10
Roughage (kg/day)
Gro
ss M
arg
in

52}}
Labour costs
The costs for labour differ very much
between different districts. In densely
populated areas, generally the labour cost
is lower. In the reference farming situation
labour costs have been set at Ksh. 120 per
day. When the labour costs are only Ksh.
80 per day, the gross margin decreases to
Ksh. 70,218. At a labour costs level of
Ksh. 160 per day it is Ksh. 41,880 per litre. For every Ksh 10 increase in labour costs, the gross
margin declines by Ksh 3,540.
Interest rate
The interest rate used in the reference
farming situation is 20 %. Interest is
charged on operating capital. The interest
rate changes the production cost of milk by
about Ksh 694 for every 1 % change in interest rate.
Other factors
In addition, the sensitivity of cattle sales prices, fertilizer prices, concentrate prices and
veterinary costs were investigated. These factors have only marginal influence (1%) on the
gross margin of milk. The influence of the milk taken by calves on the gross margin is bigger. In
the reference farming situation bull calves get 50 litres of milk and heifer calves get 415 litres. If
this is reduced to 30 litres and 265 litres respectively, the gross margin increases from Ksh.
56.049 to Ksh.60,645. However, this is only recommended if the calves are provided with milk
replacers which do not compromise calf health and growth.
3.6.3 Policy implicationsThe intensive zero grazing system is predominantly a milk production system. However, even
with such an intensive production system, farmers are not willing to specialize in milk
production but engage in subsistence production where they use minimal inputs. In many areas
in Kenya, the potential for dairy farming is high and specialization in milk production in those
Labour
0
20,000
40,000
60,000
0 50 100 150 200
Labour per man day (KShs)
Gro
ss M
arg
in (
KS
hs)
Interest rate
0
20,000
40,000
60,000
0 10 20 30 40

53}}
areas would increase household milk output enormously, reduce dairy production costs,
increase profitability and subsequently raise the standard of living of the farmers and their
families. Under the current production situation and contrary to popular belief, the costs of
concentrates and fertilizers for fodder do not exert a major influence on the potential returns
from the farm. The most limiting factors to increased productivity are the number of animals on
the farm, milk production levels, calving intervals, milk price, quality of fodder crops and labour
outlay.
It is possible for farmers to maximise returns from their zero grazing systems by increasing their
herd sizes subject to their ability to devote one acre of Napier grass per cow and her followers.
The cows should have high production potential. Napier grass fields should be well maintained
and have fertilizer applied regularly. Adequate labour force must be engaged to feed the cows
and maintain the Napier grass. By observing the recommended calving interval of one calf every
year, farmers can get more returns from their cows.
The main factors limiting increased milk production at the household level are poor
performance of the milk market, poor availability and distribution of major production inputs
and services and the possibility that farmers do not quite appreciate the potential gains of
following research and extension production guidelines. Farmers will not endeavour to increase
production when milk prices do not meet production costs or if they are uncertain of whether
the performance of the existing markets will be efficient and effective. Possible improvements
include increased efficiency and reliability of existing outlets/processors. Infrastructure
improvements would open up distant markets. Provision of storage facilities would reduce
wastage and increase sales volumes while local processing facilities would reduce wastage, add
or increase value and hence returns.
Farmers fail to produce optimally where key inputs and services are not available when they are
required. Farmers groups/organizations should be strengthened to provide inputs and services
while existing input and service providers should be encouraged to provide additional inputs and
services as well.
Farmers also fail to produce optimally when they downplay the importance of research and
extension recommendations. It is surprising that even in a farming system like zero grazing,
where research and extension have had great influence, technical factors like the calving
interval, feeding of cows and calves with concentrates and fodder production are still far from
optimal. To achieve a high household milk output the role of research and extension has to be
intensified. This calls for increased facilitation of research and extension agents so as to perform
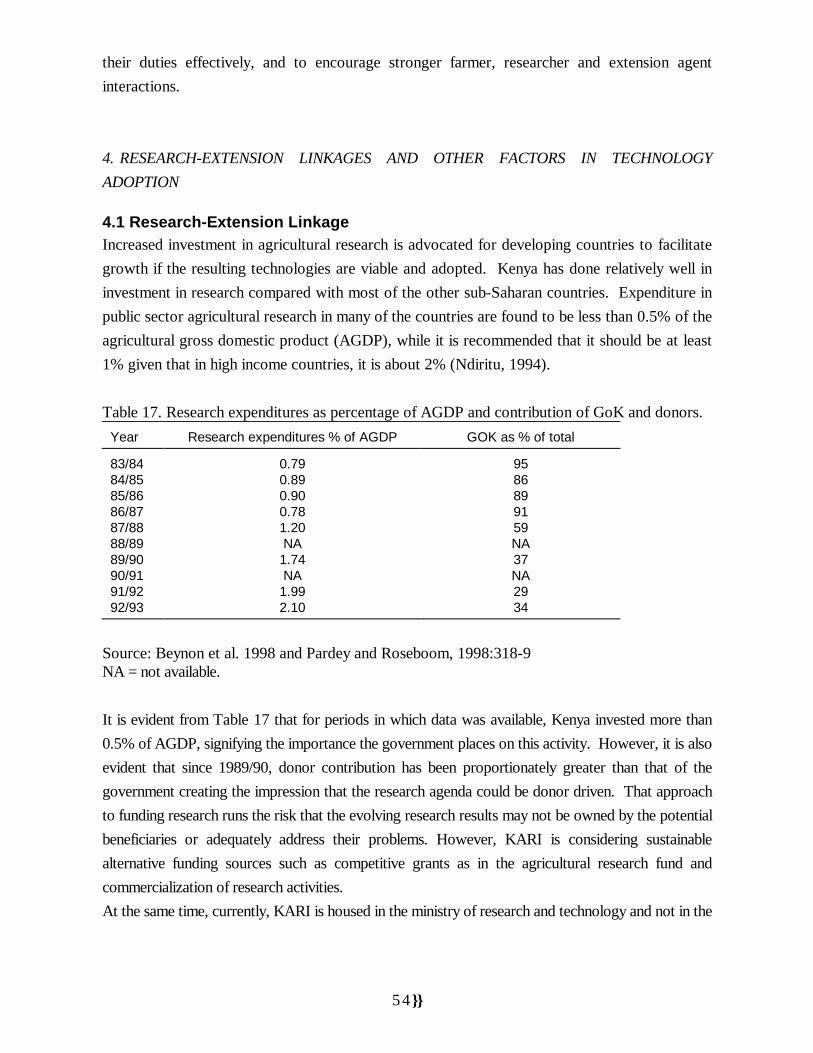
54}}
their duties effectively, and to encourage stronger farmer, researcher and extension agent
interactions.
4. RESEARCH-EXTENSION LINKAGES AND OTHER FACTORS IN TECHNOLOGY
ADOPTION
4.1 Research-Extension LinkageIncreased investment in agricultural research is advocated for developing countries to facilitate
growth if the resulting technologies are viable and adopted. Kenya has done relatively well in
investment in research compared with most of the other sub-Saharan countries. Expenditure in
public sector agricultural research in many of the countries are found to be less than 0.5% of the
agricultural gross domestic product (AGDP), while it is recommended that it should be at least
1% given that in high income countries, it is about 2% (Ndiritu, 1994).
Table 17. Research expenditures as percentage of AGDP and contribution of GoK and donors.
Year Research expenditures % of AGDP GOK as % of total
83/8484/8585/8686/8787/8888/8989/9090/9191/9292/93
0.790.890.900.781.20NA
1.74NA
1.992.10
9586899159NA37NA2934
Source: Beynon et al. 1998 and Pardey and Roseboom, 1998:318-9NA = not available.
It is evident from Table 17 that for periods in which data was available, Kenya invested more than
0.5% of AGDP, signifying the importance the government places on this activity. However, it is also
evident that since 1989/90, donor contribution has been proportionately greater than that of the
government creating the impression that the research agenda could be donor driven. That approach
to funding research runs the risk that the evolving research results may not be owned by the potential
beneficiaries or adequately address their problems. However, KARI is considering sustainable
alternative funding sources such as competitive grants as in the agricultural research fund and
commercialization of research activities.
At the same time, currently, KARI is housed in the ministry of research and technology and not in the

55}}
ministry agriculture. Although a Memorandum of Understanding (MOU) has been signed between
the two ministries emphasising joint research and extension activities, in practice staff complain of
persistent lack of funds and long bureaucratic lines of authority which severely constraint the
implementation of planned joint research and extension activities. Kimenye, (1997) has identified four
linkages which could benefit the farmer either directly or indirectly. These are (i) research-extension
(ii) research-extension-farmer (iii) research-farmer and (iv) research-input supplier-farmer. She
found that the first three were the main linkage systems evident in Embu and Mbere districts in
Kenya while the fourth was non-existent, yet it is now acknowledged that the fourth one is very
effective in dissemination and utilization of new technologies (Alders et al). Hassan (1998) also
found a significant relationship between presence of a technology supplier in proximity to adoption of
technology.
The research-extension-farmer type linkage which was provided by the Regional Research Centres
through open days or field days proved effective, because the adaptive research was designed to
incorporate farmers participation in technology evaluation and dissemination. The activities were
decentralized, with venues of open days being closer to many farmers particularly women (Kimenye,
1997). This design of linking research to farmers is desirable and should be encouraged.
4.2 Other Factors Affecting Technology Application on farmsDue to the slow rate of adoption of seemingly viable agricultural technologies on farms, many studies
have been conducted in Kenya to establish the factors determining adoption of technologies (e.g.
Hassan, et al., 1998; Salasya et al., 1998 and Kimenye, 1997).
These studies use logit regression model with the dependent variable being the probability of
adopting a technology and the independent variables being the factors hypothesized to affect that
probability of adoption. The studies report that favourable climatic environment, better access to
extension services, credit, technology supply (e.g., seed or fertilizer) better infrastructure and farmer
characteristics such as gender and membership to a village social or development group significantly
affected adoption. Formal education appeared not to significantly affect adoption seemingly because
the formally educated were in non-farm occupations. Information access by practising farmers was
significant in improving yield because once embodied technology through seed was adopted to
improve yield, crop management methods, involving more complicated processes needed to be
understood and applied.
The greater the complexity of the technology, the slower is the adoption rate. Susceptibility of the
varieties to pests, ease of processing and the product taste also affect adoption of technology. It is

56}}
also worth noting that intra-household transfer of agricultural knowledge, which is usually assumed
to take place was found not to be the norm. Knowledge acquired by men for instance may not
necessarily be transferred to the women unless they stand to be benefit as in cash crop production
(Kimenye, 1997). This implies that extension messages meant to boost yields need to be targeted to
those who actually apply the technology. The poverty map already prepared by the government can
be used to target the beneficiaries.
5. GENERAL CONCLUSION AND RECOMMENDATIONS
The power of technological solutions to solve poverty problems currently witnessed in Kenya will be
limited unless the myriad of policy, institutional and supply constraints are addressed and resolved.
The policy reform process is underway and if this culminates in an environment of predictable, stable
and consistent policies, the policy induced price distortions which have rendered technological
application on farms unprofitable and risky will be eliminated. Moreover, with a better policy
environment, investment in rural infrastructure and transport network can bring down input costs
considerably by reducing one of the major supply constraints to adoption. This will also facilitate
farm produce to be disposed of easily, creating opportunity to increase farm incomes and thereby
alleviating poverty. Reforms meant to eliminate public sector monopolies for input supply and
loosening foreign exchange and licensing restrictions on imports of farm inputs will similarly be
helpful just as widening the input-output market through regional integration.
Considerable adaptive research and stronger and decentralized research-extension farmer linkage is
required to increase the speed with which farmers apply the viable technologies once the policy
environment is right. The best judges of agricultural technology are the end users-the farmers and
involving them in technology evaluation is critical to the success of research investment programs.
Involving the farmers in the research agenda setting will also facilitate research to be demand driven
and problem solving. This will also facilitate establishing a proper balance between commodity and
farming systems research or between commodity, factor and natural resource management research
for increased sustainable production to alleviate the persistent poverty in Kenya.

57}}
6. REFERENCES
Alders, C., B. Haverkort ad L. Van Veldhuizen. Linking with farmers. Networking for low
external - input and sustainable agriculture. ITP London.
Amitau Rath and Brent Herbert Copley. 1993. Green technologies for development. Transfer,
trade and cooperation. pp 63.
Beynon, J., Akroyd, S., Duncan, A. and Jones, S. 1998. Financing the future. Options for
agricultural research and extension in sub-Saharan Africa. Oxford Policy Management. England.
DAREP, 1994. Farming in Tharaka: Report of an informal diagnostic survey of farming
systems in Tharaka North and Central division of Tharaka-Nithi District, Kenya. Dryland
applied research and extension project, KARI RRC Embu, Kenya.
Donovan, W.G. 1995. The role of inputs and marketing systems in the modernization of
agriculture. Paper presented at the SG-2000 Workshop, "Developing African agriculture:
achieving greater impact from research investments, 26-30 Sept. Addis Ababa, Ethiopia,
Fisher, M. 1995. Summary of ApproTEC'S activities on food processing. A paper presented
during Federation of Kenya Employer's Workshop held on 24th February, 1995.
FAO 1978. Report on the Agro-ecological zones project. Methodology and research for
Africa (World Soil Resources Rep. 48(1), Rome.
Gerhart, J. 1975. "The Diffusion of Hybrid Maize in Western Kenya" Research Report for
CIMMYT (Mexico City).
Gitari J.N.; F.K. Kanampiu and F.M. Murithi 1996. Maize yield gap analysis for mid-altitude
areas of Eastern and Central Kenya region. In focus on Agricultural research for sustainable
development in changing economic environment. Proceedings of the fifth KARI scientific
conference. Eds P.O. Fungoh and G.C.O. Mbadi, Nairobi, Kenya. pp. 216-225.
Government of Kenya (GOK). 1998. First report on poverty in Kenya. Vol. II: Poverty and
Social Indicators. Ministry of planning and national development pp. 1-54.

58}}
Harwood, R. 1979. Small farm development. Understanding and improving farming systems in
the humid tropics 160 pp. Western press.
Hassan, R.J. Corbett and J. Njoroge 1994 "Combining Geo-referenced survey data with
agroclimate attributes to characterise maize production systems in Kenya".
Hassan, R.M. ed. 1998. Maize Technology, Development and Transfer. A GIS application for
research planning in Kenya. CAB International.
Hassan, R.M., F. Murithi, and G. Kamau. "Determination of fertilizer use and the gap between
farmers' maize yields and potential yields in Kenya" In Hassan, R.M. (ed.) pp. 137-162. CAB
International.
Hassan, R.M.; D.D. Karanja and H.H.A. Mulamula. 1998. Availability and effectiveness of
agricultural extension services for maize farmers in Kenya. In Hassan, R.M. (Ed).
Israelsson, R. and G Osacarsson. 1994. The Kenya National Artificial Insemination Services
(KNAIS), Revision of Plan: A Consultancy Report to the Kenya Government, Ministry of
Livestock Development.
Jaetzold, R. and H. Schimidt. 1982. Farm management handbook of Kenya, Vol. II/B Central
Kenya. Ministry of Agriculture pp. 14-15.
Jaetzold, R. and H. Schmitt. 1982. Farm Management Handbook of Kenya: Natural conditions
and Farm Management Information, Vol.IIA West Kenya, Nyanza and Western Provinces.
Nairobi, Kenya GTZ.
KARI 1994. Strategic plan for cereals in Kenya (1993-2013). Kenya Agricultural Research
Institute, Nairobi. pp.8.
Kariuki, J.N. and Waithaka, M.M. 1992. Strengths and limitations of zero grazing. Paper
presented to NDDP Field Staff Course in KARI Naivasha.
Kimenye, L.M. 1997. "The Effectiveness of the dissemination of agricultural technologies from
the Embu Regional Research Centre and their utilization by women farmers in Embu and Mbere
Districts in Kenya". A dissemination Workshop report.

59}}
Lynam, J. and R.M. Hassan 1998. "A new approach to securing sustained growth in Kenya's
Maize Sector" in Hassan R.M. (ed.) pp 3-14 CAB International.
Mulagoli, I.J.W. 1996 and 1997. Fertilizer Extension Project Report for 1996 and 1997.
Ministry of Agriculture, Livestock Development and Marketing (MALDM) in co-operation
with GTZ.
Mulagoli, I.J.W. 1999. Accomplishments of Fertilizer Extension Project and the way forward.
the 5th fertilizer round table meeting. Hilton Hotel, 4-5th March, 1999, 7pp.
Ndiritu, C.G. 1994. Funding of agricultural research in Kenya. In FAO: funding agricultural
research in Sub-Saharan Africa. Proceedings of an FAO/SPAAR/KARI expert consultation,
Nairobi, Kenya
Ndubi, J. 1997. Gender participation in Agriculture and Agricultural Research: Experiences
from Dryland areas of Eastern Kenya. A paper prepared for conference on participatory
dryland agricultural research East of Mount Kenya, 21-24 January, 1997.
Pandya-Lorch, R. 1994. Economic growth and development. 2020 vision brief 1. IFPRI
Washington.
Pardey, P.G. and J. Roseboom. 1998. Trends in financing African agricultural research. In:
Financing agricultural research: a source book. Eds. S.R. Tabor, Janssen, W. Bruneau, H. The
Hague: International Service for National Agricultural Research.
Per Pinstrup-Andersen and Pandya-Lorch, R. 1995. Agricultural growth is the key to poverty
alleviation in low-income developing countries. 2020 vision brief 15. IFPRI, Washington.
Qureshi, J. 1987. The cumulative effects of N-P fertilizers, manure and crop residues on maize
grain yields, leaf nutrient contents and some soil chemical properties at Kabete. Paper presented
at the National maize agronomy workshop, Nairobi, Kenya.
Ramphal, Sir Sridath. 1990. Third world grievances. EPa Journal, 16 (4) 39 - 43.
Republic of Kenya 1998. National poverty eradication plan. Department of development co-
ordination, Office of the President, Nairobi.

60}}
Saito, A.K. 1994. Raising the productivity of women farmers in sub-saharan Africa. World
Bank discussion papers No. 230 World Bank: Washington D.C.Alders, C., B. Haverkort and L.
Van Veldhuizen. Linking With Farmers. Networking
Salasya, B.D., Mwangi, W., Verjurji, H., Odendo, M.A. and Odenya, J.O. 1998. " An
assessment of the adoption of seed and fertilizer packages and the role of credit in smallholder
maize production in Kakamega and Vihiga Districts, Kenya CIMMYT publication.
Sands, D. 1986. The technology application gap: overcoming constraints to small farm
development. 144 pp., FAO.
Sutherland, A., J. Kang'ara; M. Kidundo and J.W. Irungu. 1997. Farming systems
characterisation and targeting: DAREP experiences. In Kang'ara, Sutherland and Gethi (Eds.).
Proceedings of the conference on participatory dryland research agricultural research east of
Mount Kenya. January 21-24, 1997. KARI: Kitale, Kenya. pp 64-80.
Teece, D. 1977. Technology transfer by multinational firms. The resource cost of transferring
technological knowhow. The Economist Journal, 87 (346), 242-261.
Waithaka, M.M. 1995 A research project to explain the adoption of dairy technologies from a
user perspective. In Hitzel, M. and Janssen, W. (Eds.), Linking adoption studies and priority
setting for livestock research. workshop proceedings. The Hague: International Service for
National Agricultural Research.
Waithaka, M.M. and Nijssen, J.M.A. 1992. Production costs of milk under zero grazing
conditions. KARI, Naivasha.
World Bank 1994. Kenya, Poverty Assessment, World Bank Washington.
World Bank 1996. Poverty in sub-Saharan Africa: issues and recommendations. Findings
African Region. Number 73, October.