agilian quick start - image server of visual...
TRANSCRIPT
Agilian
Quick Start
Last update: March 13, 2011
© Copyright 2002-2012 Visual Paradigm International Ltd.
Agilian Quick Start
Page 2 of 32
Table of Contents
Table of Contents .......................................................................................................................... 2
Getting Started .............................................................................................................................. 3
Installing Agilian ....................................................................................................................................................... 3 Starting Agilian ......................................................................................................................................................... 3 Selecting Workspace ................................................................................................................................................. 4 Importing the License Key ........................................................................................................................................ 4 Environment .............................................................................................................................................................. 5 Saving and Loading Projects ..................................................................................................................................... 6
Diagramming ................................................................................................................................. 7
Creating Diagram ...................................................................................................................................................... 7 Creating Shapes ......................................................................................................................................................... 7 Connecting Shapes .................................................................................................................................................... 8 Documenting Model Elements .................................................................................................................................. 8 Setting Color, Line and Font styles for Shapes ......................................................................................................... 9 Nicknaming ............................................................................................................................................................. 10 Layer ....................................................................................................................................................................... 11
Business Process Modeling ......................................................................................................... 12
Drawing Business Process Diagram ........................................................................................................................ 12 Writing Operation Procedures ................................................................................................................................. 13 Drawing Fact Diagram ............................................................................................................................................ 13 Recording Business Rules ....................................................................................................................................... 14
UML Modeling ............................................................................................................................ 15
Drawing Sequence Diagram .................................................................................................................................... 15 Drawing Activity Diagram ...................................................................................................................................... 16 Drawing Class Diagram .......................................................................................................................................... 17
Enterprise Architecture .............................................................................................................. 18
Zachman Framework ............................................................................................................................................... 18 Business Motivation Model (BMM) ....................................................................................................................... 19
General Modeling........................................................................................................................ 20
Drawing ERD .......................................................................................................................................................... 20 Mind Mapping ......................................................................................................................................................... 21 Drawing Process Map ............................................................................................................................................. 22 Drawing Data Flow Diagram .................................................................................................................................. 23 Drawing Organization Chart ................................................................................................................................... 24
Impact Analysis ........................................................................................................................... 25
Matrix ...................................................................................................................................................................... 25 Analysis Diagram .................................................................................................................................................... 26
Report Generation ...................................................................................................................... 27
Generating Report ................................................................................................................................................... 27 Customizing Report Template ................................................................................................................................. 28 Publishing Report to a Website ............................................................................................................................... 29
Teamwork Collaboration ........................................................................................................... 30
Checkout and Open Project ..................................................................................................................................... 30 Commit .................................................................................................................................................................... 31 Update ..................................................................................................................................................................... 31
Agilian Quick Start
Page 3 of 32
Getting Started
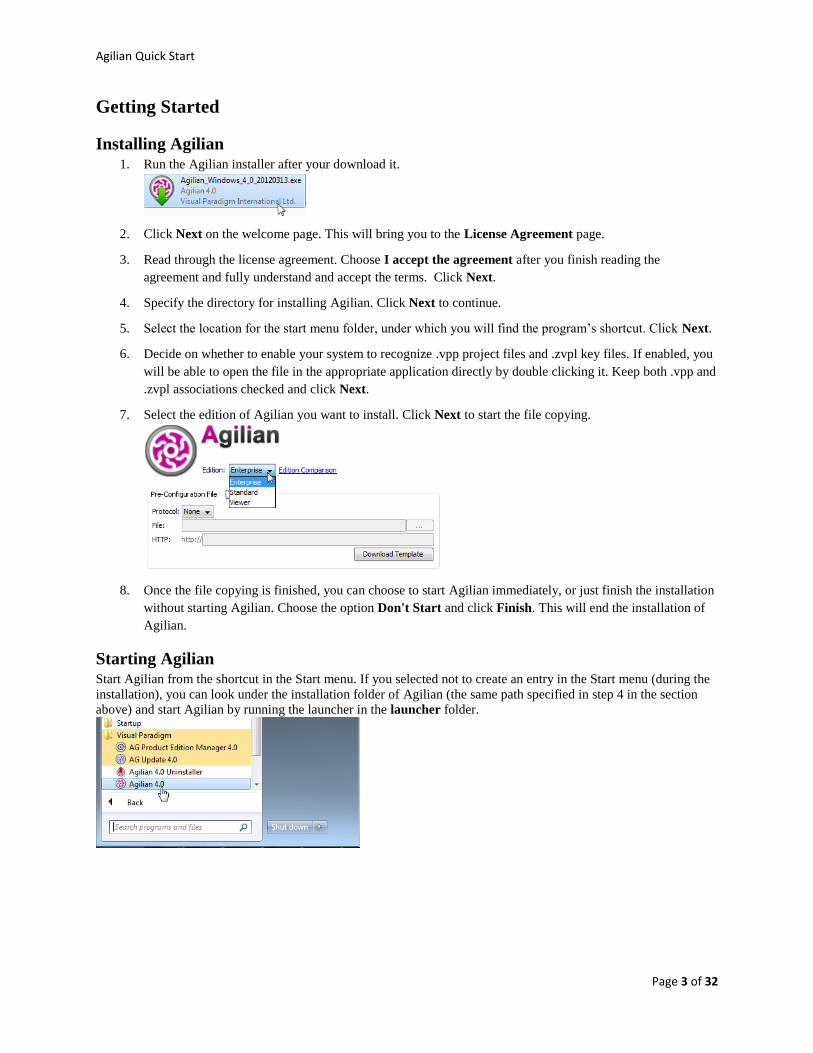
Installing Agilian 1. Run the Agilian installer after your download it.
2. Click Next on the welcome page. This will bring you to the License Agreement page.
3. Read through the license agreement. Choose I accept the agreement after you finish reading the
agreement and fully understand and accept the terms. Click Next.
4. Specify the directory for installing Agilian. Click Next to continue.
5. Select the location for the start menu folder, under which you will find the program’s shortcut. Click Next.
6. Decide on whether to enable your system to recognize .vpp project files and .zvpl key files. If enabled, you
will be able to open the file in the appropriate application directly by double clicking it. Keep both .vpp and
.zvpl associations checked and click Next.
7. Select the edition of Agilian you want to install. Click Next to start the file copying.
8. Once the file copying is finished, you can choose to start Agilian immediately, or just finish the installation
without starting Agilian. Choose the option Don't Start and click Finish. This will end the installation of
Agilian.
Starting Agilian Start Agilian from the shortcut in the Start menu. If you selected not to create an entry in the Start menu (during the
installation), you can look under the installation folder of Agilian (the same path specified in step 4 in the section
above) and start Agilian by running the launcher in the launcher folder.
Agilian Quick Start
Page 4 of 32
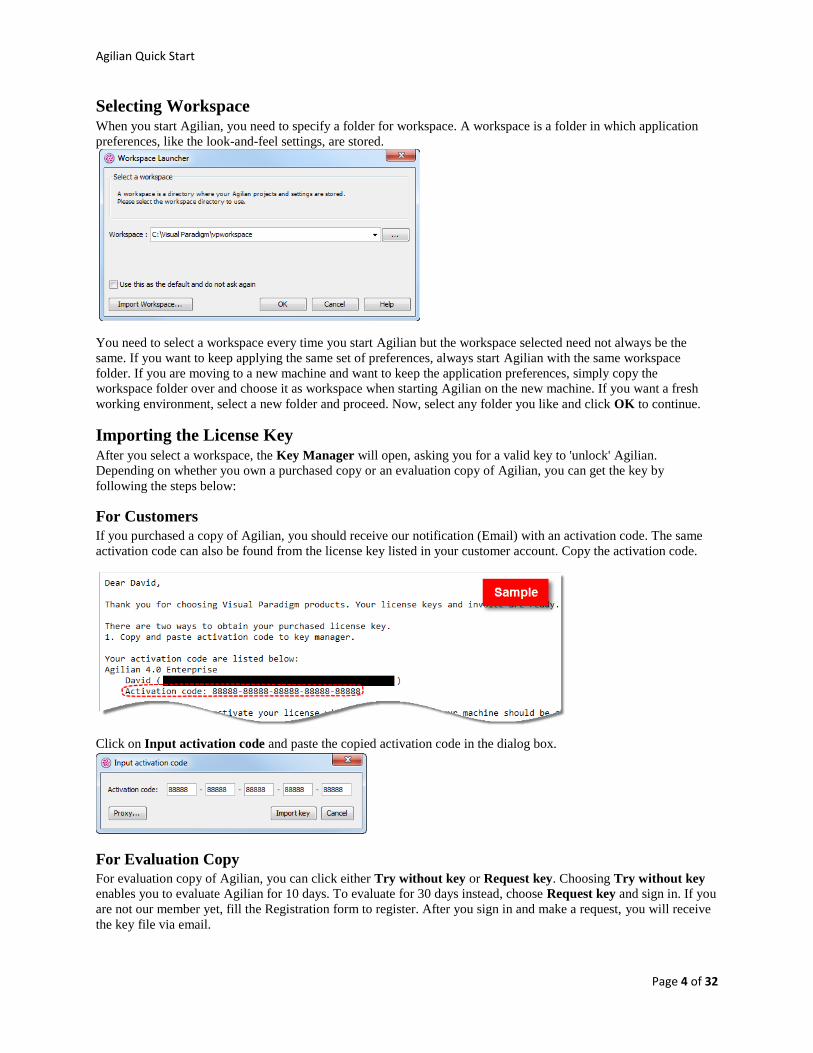
Selecting Workspace When you start Agilian, you need to specify a folder for workspace. A workspace is a folder in which application
preferences, like the look-and-feel settings, are stored.
You need to select a workspace every time you start Agilian but the workspace selected need not always be the
same. If you want to keep applying the same set of preferences, always start Agilian with the same workspace
folder. If you are moving to a new machine and want to keep the application preferences, simply copy the
workspace folder over and choose it as workspace when starting Agilian on the new machine. If you want a fresh
working environment, select a new folder and proceed. Now, select any folder you like and click OK to continue.
Importing the License Key After you select a workspace, the Key Manager will open, asking you for a valid key to 'unlock' Agilian.
Depending on whether you own a purchased copy or an evaluation copy of Agilian, you can get the key by
following the steps below:
For Customers
If you purchased a copy of Agilian, you should receive our notification (Email) with an activation code. The same
activation code can also be found from the license key listed in your customer account. Copy the activation code.
Click on Input activation code and paste the copied activation code in the dialog box.
For Evaluation Copy
For evaluation copy of Agilian, you can click either Try without key or Request key. Choosing Try without key
enables you to evaluate Agilian for 10 days. To evaluate for 30 days instead, choose Request key and sign in. If you
are not our member yet, fill the Registration form to register. After you sign in and make a request, you will receive
the key file via email.
Agilian Quick Start
Page 5 of 32
Environment
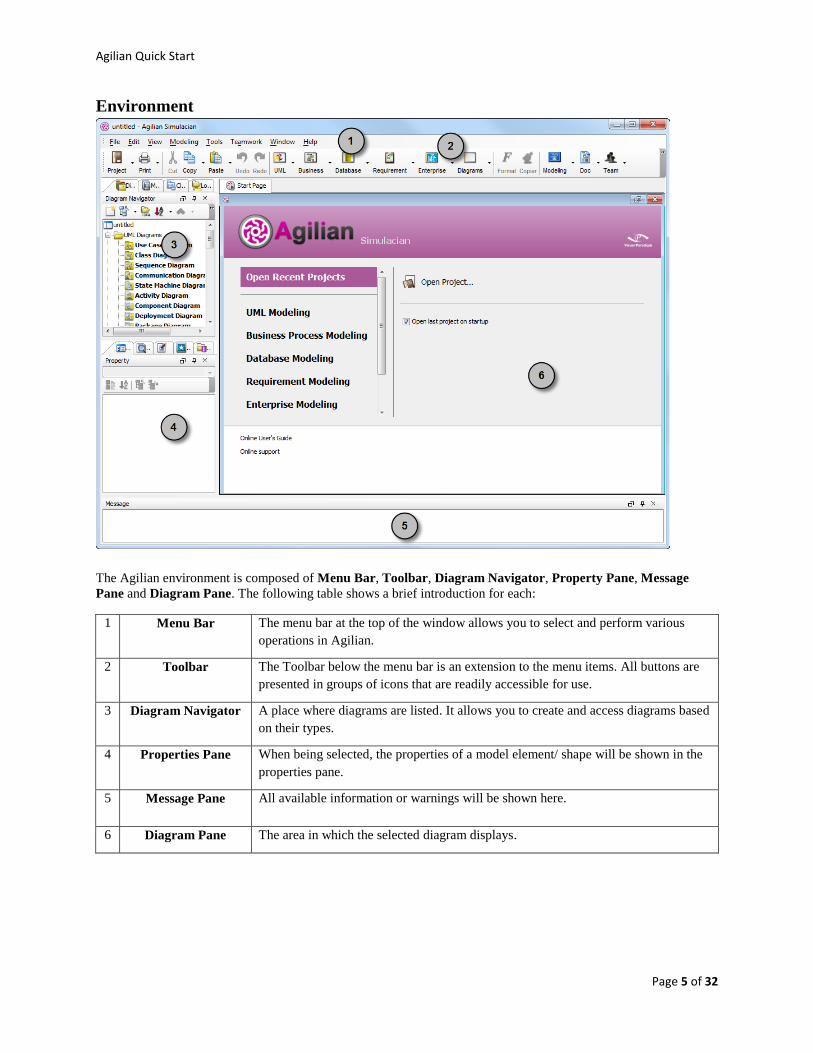
The Agilian environment is composed of Menu Bar, Toolbar, Diagram Navigator, Property Pane, Message
Pane and Diagram Pane. The following table shows a brief introduction for each:
1 Menu Bar The menu bar at the top of the window allows you to select and perform various
operations in Agilian.
2 Toolbar The Toolbar below the menu bar is an extension to the menu items. All buttons are
presented in groups of icons that are readily accessible for use.
3 Diagram Navigator A place where diagrams are listed. It allows you to create and access diagrams based
on their types.
4 Properties Pane When being selected, the properties of a model element/ shape will be shown in the
properties pane.
5 Message Pane All available information or warnings will be shown here.
6 Diagram Pane The area in which the selected diagram displays.
Agilian Quick Start
Page 6 of 32
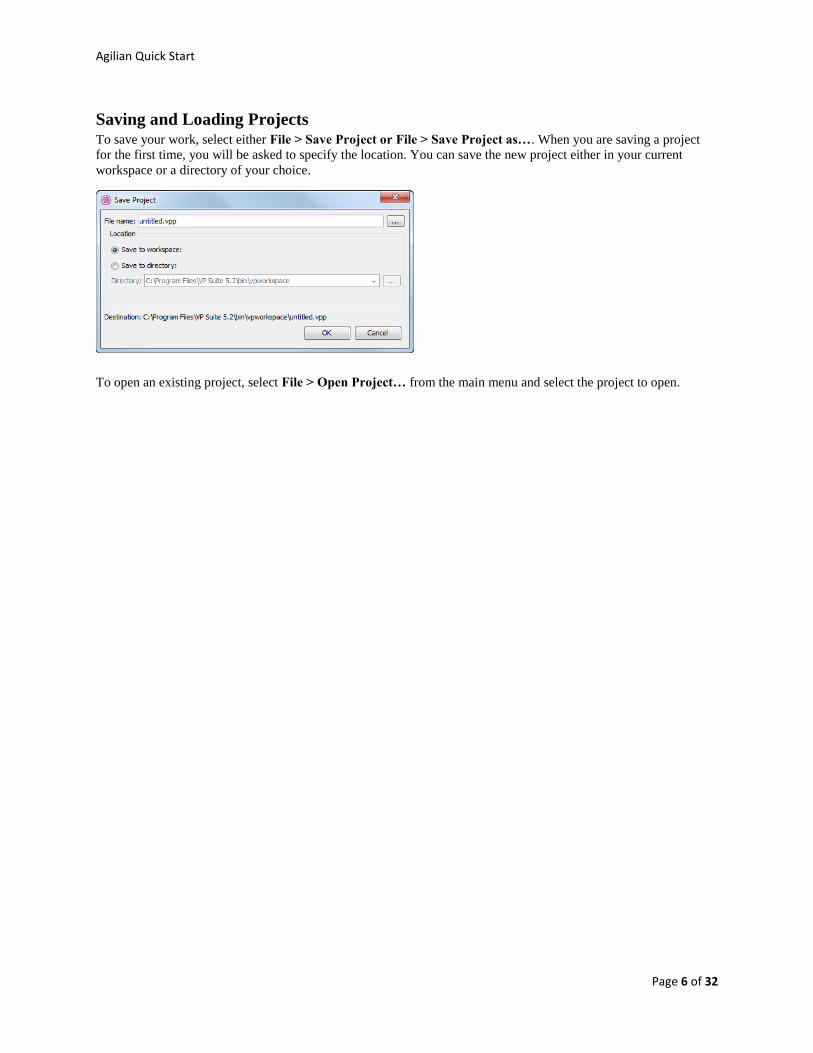
Saving and Loading Projects To save your work, select either File > Save Project or File > Save Project as…. When you are saving a project
for the first time, you will be asked to specify the location. You can save the new project either in your current
workspace or a directory of your choice.
To open an existing project, select File > Open Project… from the main menu and select the project to open.
Agilian Quick Start
Page 7 of 32
Diagramming After you familiarize yourself with the environment of Agilian, you are now ready to create a diagram. This section
will show you not only how to create diagrams, but also how to create and connect diagram elements (shapes),
documents their details and format them. It will end with a general description on the nickname and layers features.
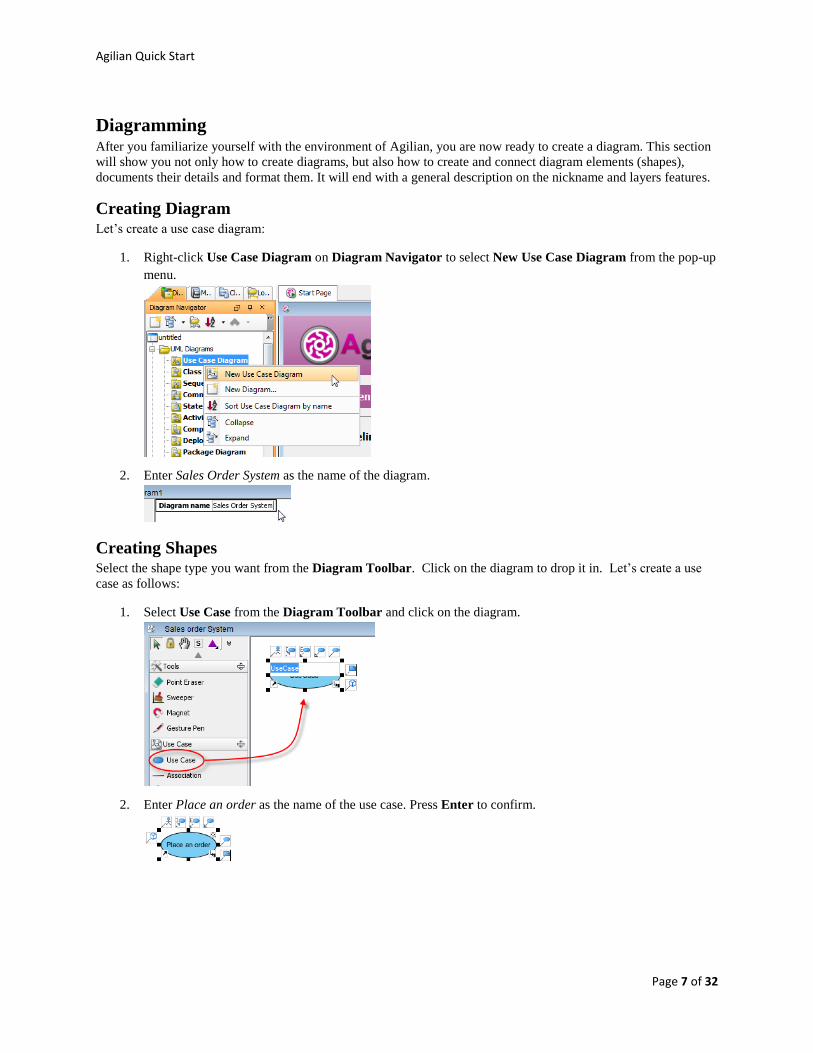
Creating Diagram Let’s create a use case diagram:
1. Right-click Use Case Diagram on Diagram Navigator to select New Use Case Diagram from the pop-up
menu.
2. Enter Sales Order System as the name of the diagram.
Creating Shapes Select the shape type you want from the Diagram Toolbar. Click on the diagram to drop it in. Let’s create a use
case as follows:
1. Select Use Case from the Diagram Toolbar and click on the diagram.
2. Enter Place an order as the name of the use case. Press Enter to confirm.
Agilian Quick Start
Page 8 of 32
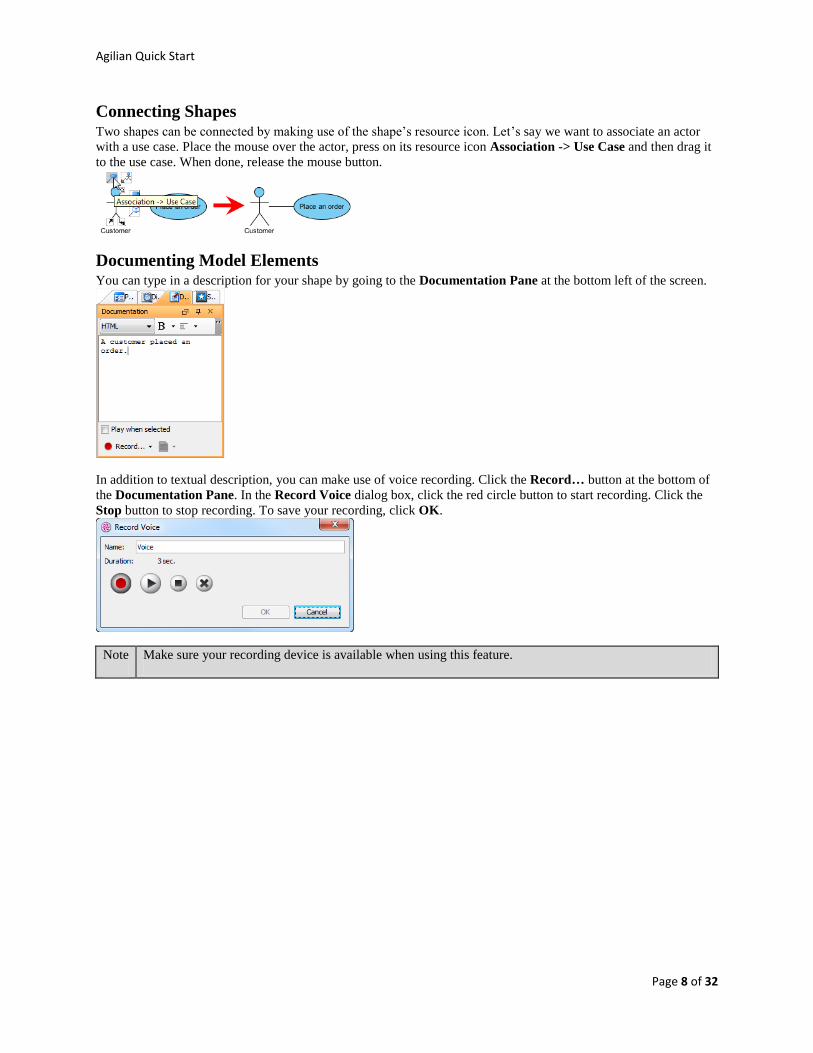
Connecting Shapes Two shapes can be connected by making use of the shape’s resource icon. Let’s say we want to associate an actor
with a use case. Place the mouse over the actor, press on its resource icon Association -> Use Case and then drag it
to the use case. When done, release the mouse button.
Documenting Model Elements You can type in a description for your shape by going to the Documentation Pane at the bottom left of the screen.
In addition to textual description, you can make use of voice recording. Click the Record… button at the bottom of
the Documentation Pane. In the Record Voice dialog box, click the red circle button to start recording. Click the
Stop button to stop recording. To save your recording, click OK.
Note Make sure your recording device is available when using this feature.
Agilian Quick Start
Page 9 of 32
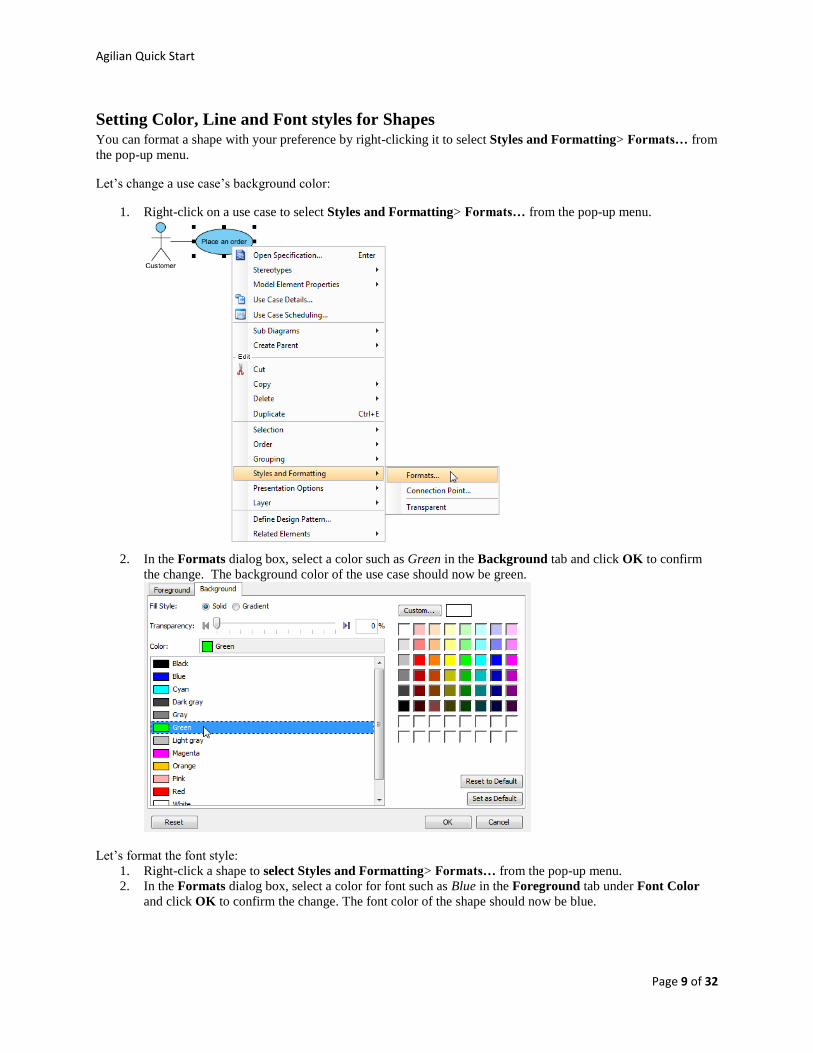
Setting Color, Line and Font styles for Shapes You can format a shape with your preference by right-clicking it to select Styles and Formatting> Formats… from
the pop-up menu.
Let’s change a use case’s background color:
1. Right-click on a use case to select Styles and Formatting> Formats… from the pop-up menu.
2. In the Formats dialog box, select a color such as Green in the Background tab and click OK to confirm
the change. The background color of the use case should now be green.
Let’s format the font style:
1. Right-click a shape to select Styles and Formatting> Formats… from the pop-up menu.
2. In the Formats dialog box, select a color for font such as Blue in the Foreground tab under Font Color
and click OK to confirm the change. The font color of the shape should now be blue.
Agilian Quick Start
Page 10 of 32
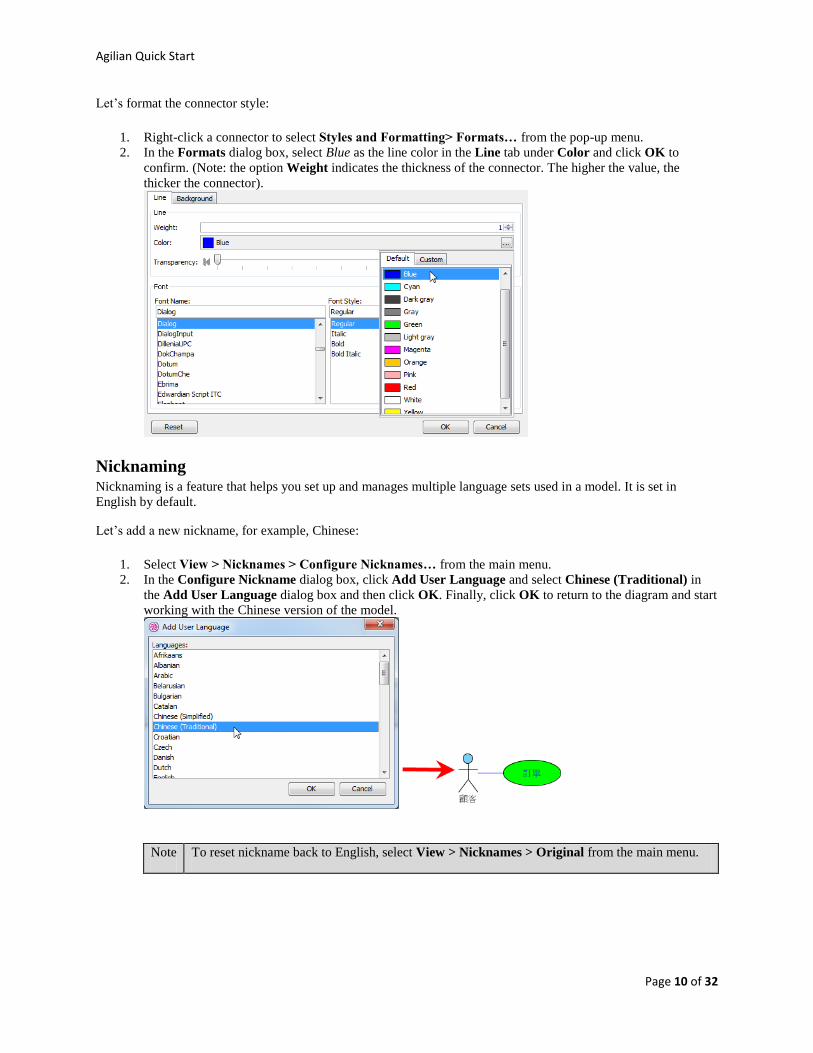
Let’s format the connector style:
1. Right-click a connector to select Styles and Formatting> Formats… from the pop-up menu.
2. In the Formats dialog box, select Blue as the line color in the Line tab under Color and click OK to
confirm. (Note: the option Weight indicates the thickness of the connector. The higher the value, the
thicker the connector).
Nicknaming Nicknaming is a feature that helps you set up and manages multiple language sets used in a model. It is set in
English by default.
Let’s add a new nickname, for example, Chinese:
1. Select View > Nicknames > Configure Nicknames… from the main menu.
2. In the Configure Nickname dialog box, click Add User Language and select Chinese (Traditional) in
the Add User Language dialog box and then click OK. Finally, click OK to return to the diagram and start
working with the Chinese version of the model.
Note To reset nickname back to English, select View > Nicknames > Original from the main menu.
Agilian Quick Start
Page 11 of 32
Layer
Layer is a feature that lets you group shapes on a diagram into logical groups, and perform various actions including
changing their visibility and disabling the editing mode.
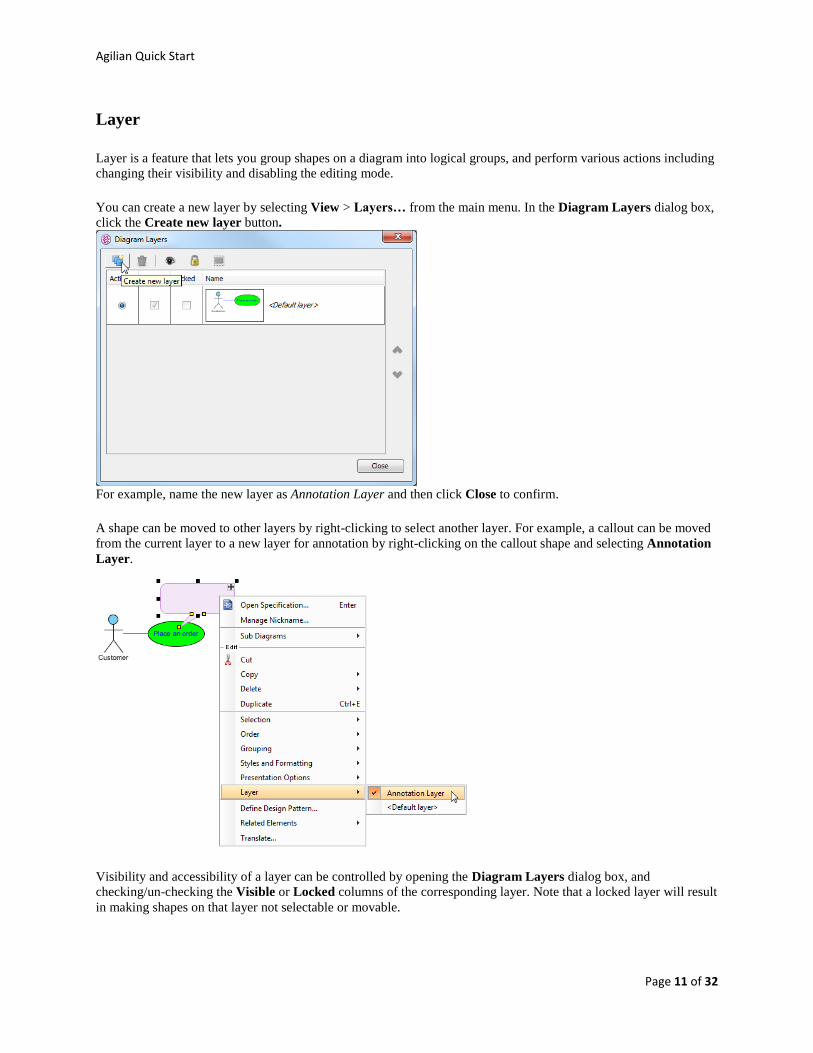
You can create a new layer by selecting View > Layers… from the main menu. In the Diagram Layers dialog box,
click the Create new layer button.
For example, name the new layer as Annotation Layer and then click Close to confirm.
A shape can be moved to other layers by right-clicking to select another layer. For example, a callout can be moved
from the current layer to a new layer for annotation by right-clicking on the callout shape and selecting Annotation
Layer.
Visibility and accessibility of a layer can be controlled by opening the Diagram Layers dialog box, and
checking/un-checking the Visible or Locked columns of the corresponding layer. Note that a locked layer will result
in making shapes on that layer not selectable or movable.
Agilian Quick Start
Page 12 of 32
Business Process Modeling
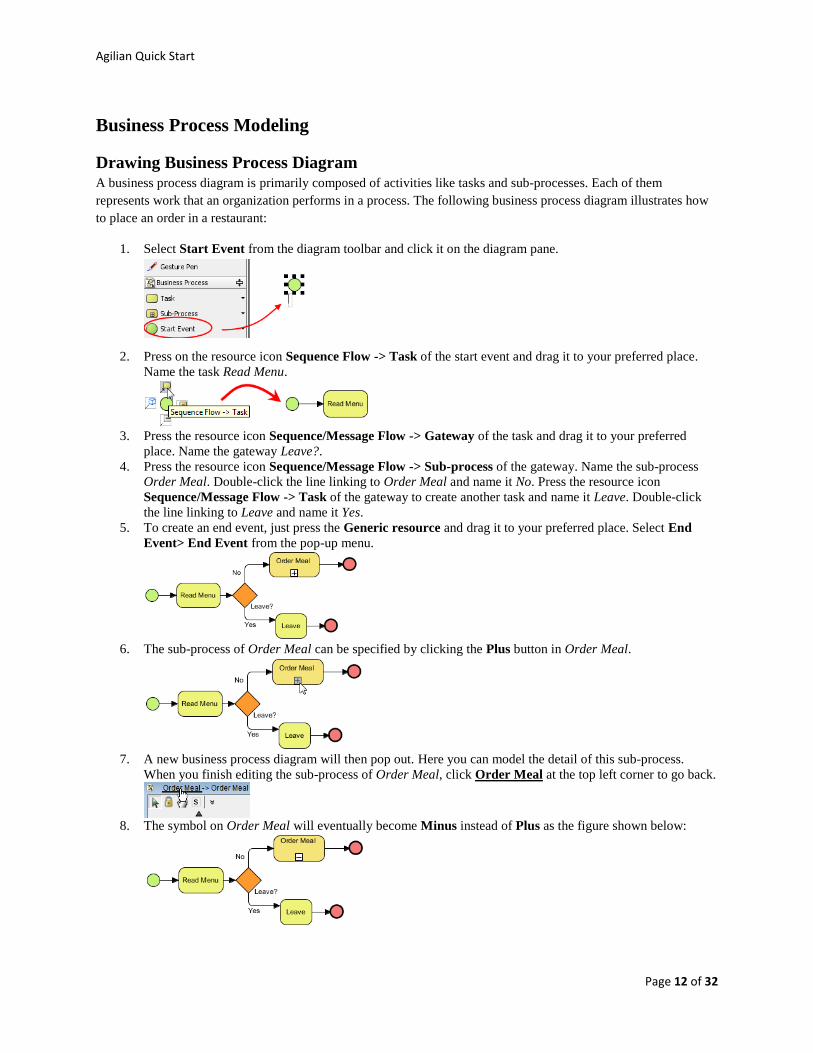
Drawing Business Process Diagram A business process diagram is primarily composed of activities like tasks and sub-processes. Each of them
represents work that an organization performs in a process. The following business process diagram illustrates how
to place an order in a restaurant:
1. Select Start Event from the diagram toolbar and click it on the diagram pane.
2. Press on the resource icon Sequence Flow -> Task of the start event and drag it to your preferred place.
Name the task Read Menu.
3. Press the resource icon Sequence/Message Flow -> Gateway of the task and drag it to your preferred
place. Name the gateway Leave?.
4. Press the resource icon Sequence/Message Flow -> Sub-process of the gateway. Name the sub-process
Order Meal. Double-click the line linking to Order Meal and name it No. Press the resource icon
Sequence/Message Flow -> Task of the gateway to create another task and name it Leave. Double-click
the line linking to Leave and name it Yes.
5. To create an end event, just press the Generic resource and drag it to your preferred place. Select End
Event> End Event from the pop-up menu.
6. The sub-process of Order Meal can be specified by clicking the Plus button in Order Meal.
7. A new business process diagram will then pop out. Here you can model the detail of this sub-process.
When you finish editing the sub-process of Order Meal, click Order Meal at the top left corner to go back.
8. The symbol on Order Meal will eventually become Minus instead of Plus as the figure shown below:
Agilian Quick Start
Page 13 of 32
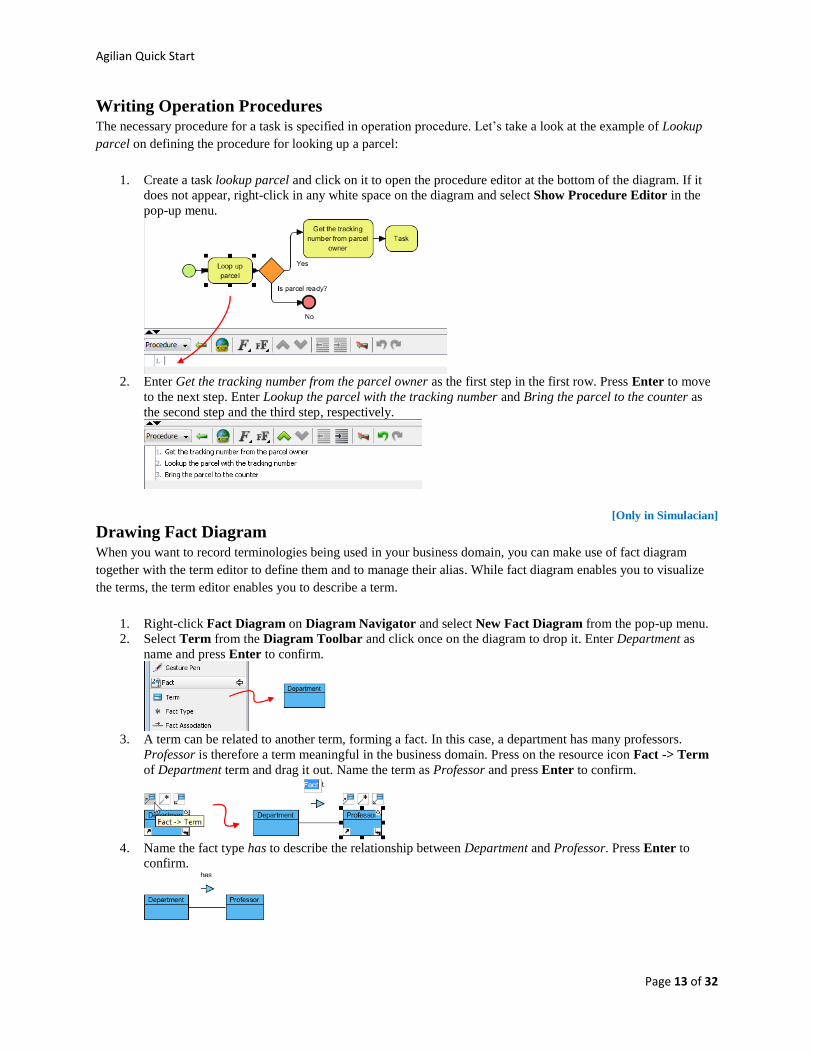
Writing Operation Procedures The necessary procedure for a task is specified in operation procedure. Let’s take a look at the example of Lookup
parcel on defining the procedure for looking up a parcel:
1. Create a task lookup parcel and click on it to open the procedure editor at the bottom of the diagram. If it
does not appear, right-click in any white space on the diagram and select Show Procedure Editor in the
pop-up menu.
2. Enter Get the tracking number from the parcel owner as the first step in the first row. Press Enter to move
to the next step. Enter Lookup the parcel with the tracking number and Bring the parcel to the counter as
the second step and the third step, respectively.
Drawing Fact Diagram [Only in Simulacian]
When you want to record terminologies being used in your business domain, you can make use of fact diagram
together with the term editor to define them and to manage their alias. While fact diagram enables you to visualize
the terms, the term editor enables you to describe a term.
1. Right-click Fact Diagram on Diagram Navigator and select New Fact Diagram from the pop-up menu.
2. Select Term from the Diagram Toolbar and click once on the diagram to drop it. Enter Department as
name and press Enter to confirm.
3. A term can be related to another term, forming a fact. In this case, a department has many professors.
Professor is therefore a term meaningful in the business domain. Press on the resource icon Fact -> Term
of Department term and drag it out. Name the term as Professor and press Enter to confirm.
4. Name the fact type has to describe the relationship between Department and Professor. Press Enter to
confirm.
Agilian Quick Start
Page 14 of 32
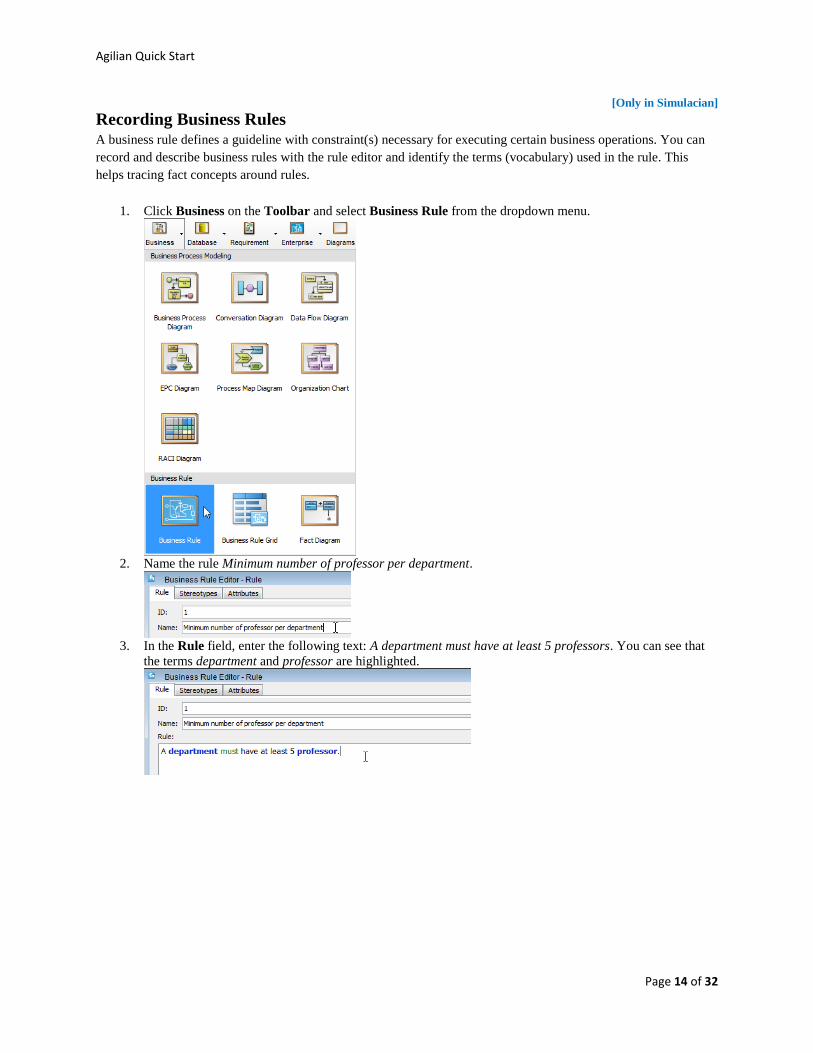
Recording Business Rules [Only in Simulacian]
A business rule defines a guideline with constraint(s) necessary for executing certain business operations. You can
record and describe business rules with the rule editor and identify the terms (vocabulary) used in the rule. This
helps tracing fact concepts around rules.
1. Click Business on the Toolbar and select Business Rule from the dropdown menu.
2. Name the rule Minimum number of professor per department.
3. In the Rule field, enter the following text: A department must have at least 5 professors. You can see that
the terms department and professor are highlighted.
Agilian Quick Start
Page 15 of 32
UML Modeling
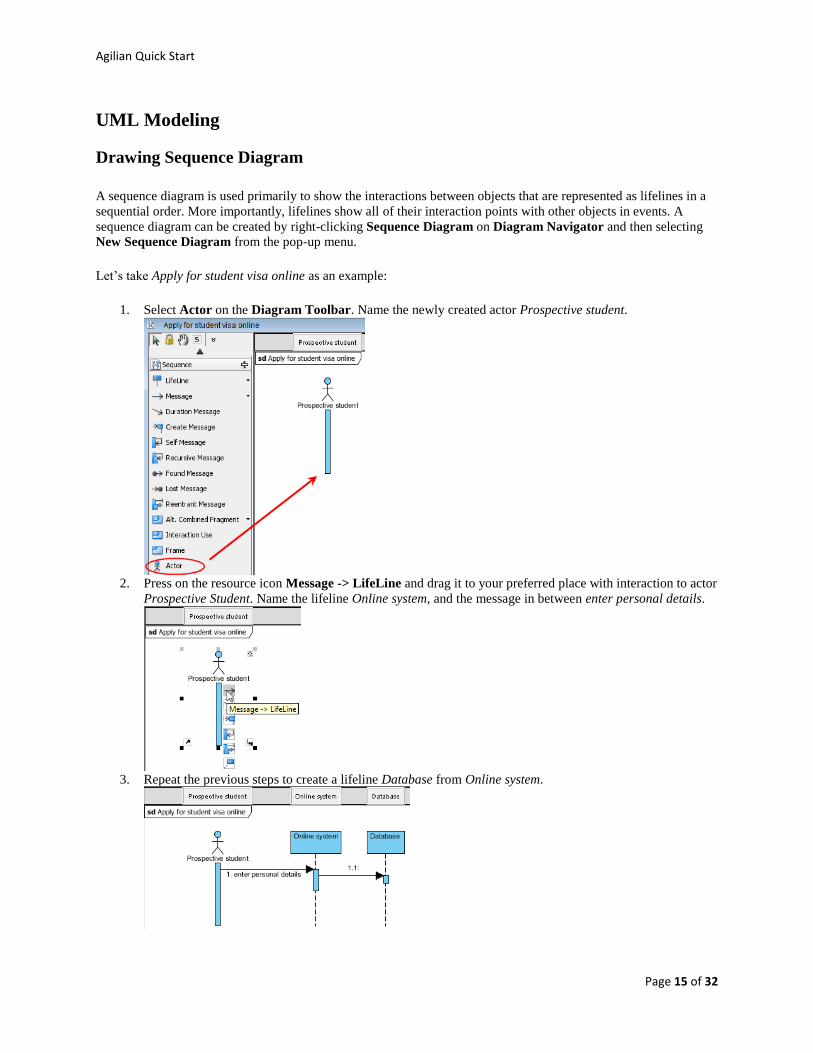
Drawing Sequence Diagram
A sequence diagram is used primarily to show the interactions between objects that are represented as lifelines in a
sequential order. More importantly, lifelines show all of their interaction points with other objects in events. A
sequence diagram can be created by right-clicking Sequence Diagram on Diagram Navigator and then selecting
New Sequence Diagram from the pop-up menu.
Let’s take Apply for student visa online as an example:
1. Select Actor on the Diagram Toolbar. Name the newly created actor Prospective student.
2. Press on the resource icon Message -> LifeLine and drag it to your preferred place with interaction to actor
Prospective Student. Name the lifeline Online system, and the message in between enter personal details.
3. Repeat the previous steps to create a lifeline Database from Online system.
Agilian Quick Start
Page 16 of 32
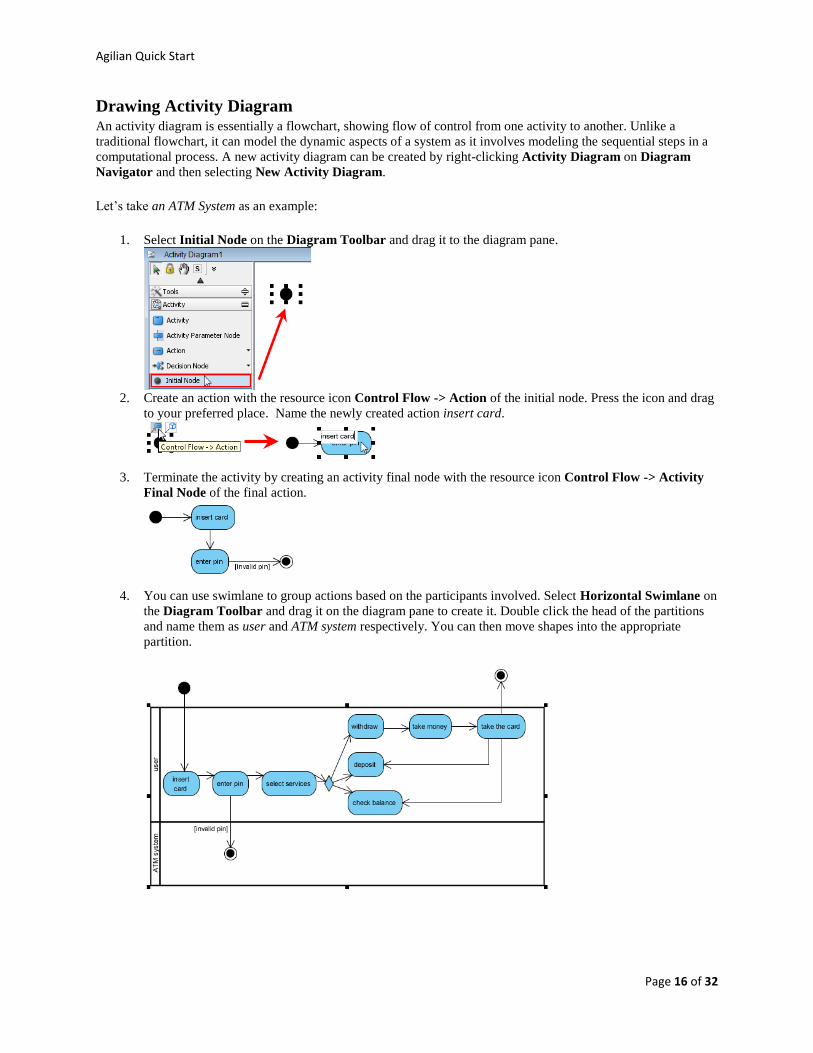
Drawing Activity Diagram An activity diagram is essentially a flowchart, showing flow of control from one activity to another. Unlike a
traditional flowchart, it can model the dynamic aspects of a system as it involves modeling the sequential steps in a
computational process. A new activity diagram can be created by right-clicking Activity Diagram on Diagram
Navigator and then selecting New Activity Diagram.
Let’s take an ATM System as an example:
1. Select Initial Node on the Diagram Toolbar and drag it to the diagram pane.
2. Create an action with the resource icon Control Flow -> Action of the initial node. Press the icon and drag
to your preferred place. Name the newly created action insert card.
3. Terminate the activity by creating an activity final node with the resource icon Control Flow -> Activity
Final Node of the final action.
4. You can use swimlane to group actions based on the participants involved. Select Horizontal Swimlane on
the Diagram Toolbar and drag it on the diagram pane to create it. Double click the head of the partitions
and name them as user and ATM system respectively. You can then move shapes into the appropriate
partition.
Agilian Quick Start
Page 17 of 32
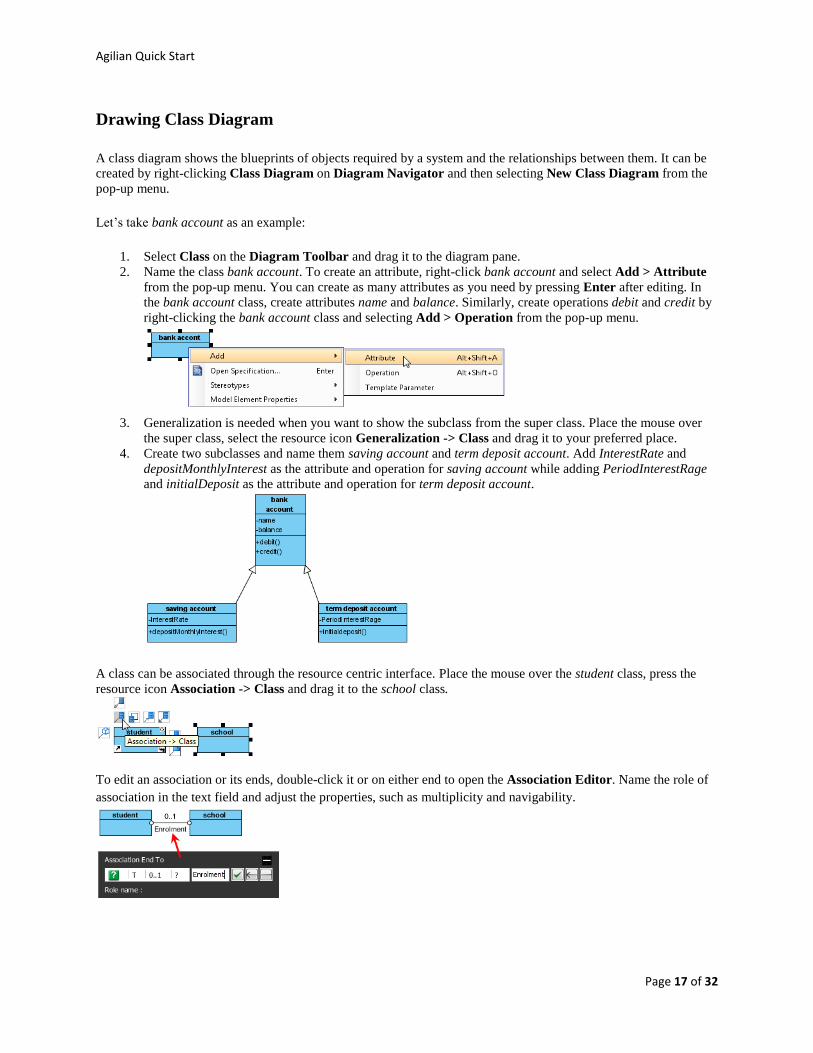
Drawing Class Diagram
A class diagram shows the blueprints of objects required by a system and the relationships between them. It can be
created by right-clicking Class Diagram on Diagram Navigator and then selecting New Class Diagram from the
pop-up menu.
Let’s take bank account as an example:
1. Select Class on the Diagram Toolbar and drag it to the diagram pane.
2. Name the class bank account. To create an attribute, right-click bank account and select Add > Attribute
from the pop-up menu. You can create as many attributes as you need by pressing Enter after editing. In
the bank account class, create attributes name and balance. Similarly, create operations debit and credit by
right-clicking the bank account class and selecting Add > Operation from the pop-up menu.
3. Generalization is needed when you want to show the subclass from the super class. Place the mouse over
the super class, select the resource icon Generalization -> Class and drag it to your preferred place.
4. Create two subclasses and name them saving account and term deposit account. Add InterestRate and
depositMonthlyInterest as the attribute and operation for saving account while adding PeriodInterestRage
and initialDeposit as the attribute and operation for term deposit account.
A class can be associated through the resource centric interface. Place the mouse over the student class, press the
resource icon Association -> Class and drag it to the school class.
To edit an association or its ends, double-click it or on either end to open the Association Editor. Name the role of
association in the text field and adjust the properties, such as multiplicity and navigability.
Agilian Quick Start
Page 18 of 32
Enterprise Architecture There are tools that help you define an enterprise by modeling the vision, goals and missions of business activities.
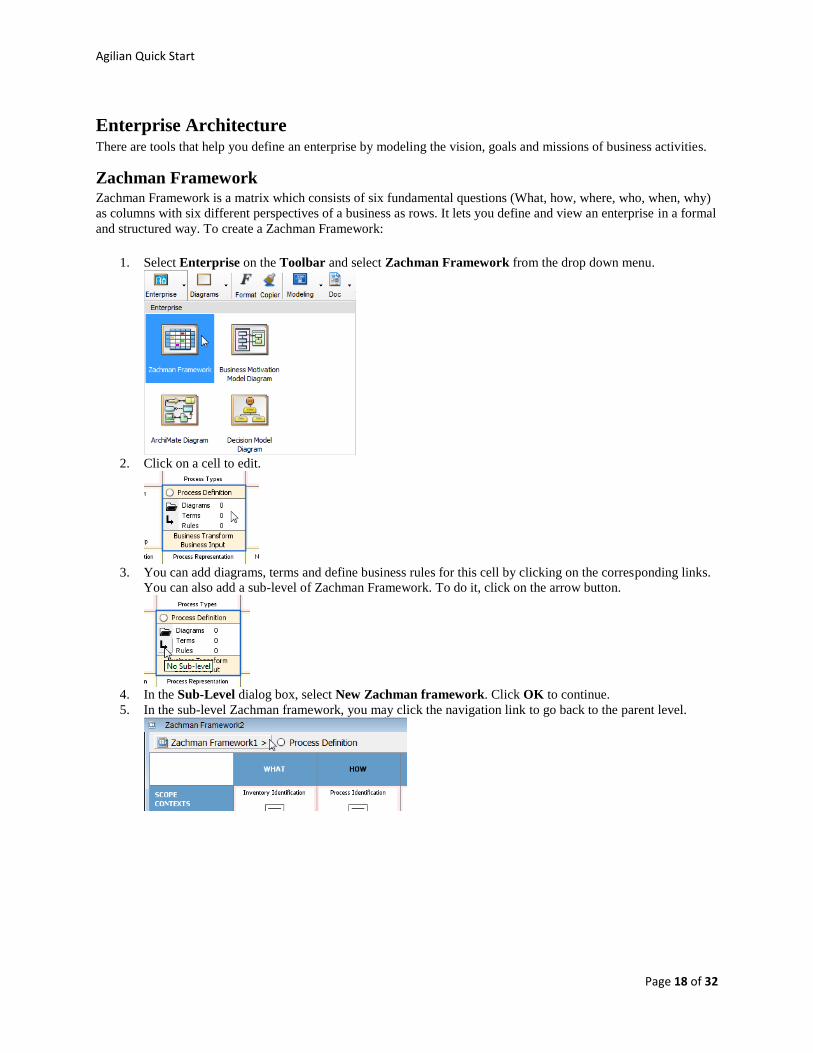
Zachman Framework Zachman Framework is a matrix which consists of six fundamental questions (What, how, where, who, when, why)
as columns with six different perspectives of a business as rows. It lets you define and view an enterprise in a formal
and structured way. To create a Zachman Framework:
1. Select Enterprise on the Toolbar and select Zachman Framework from the drop down menu.
2. Click on a cell to edit.
3. You can add diagrams, terms and define business rules for this cell by clicking on the corresponding links.
You can also add a sub-level of Zachman Framework. To do it, click on the arrow button.
4. In the Sub-Level dialog box, select New Zachman framework. Click OK to continue.
5. In the sub-level Zachman framework, you may click the navigation link to go back to the parent level.
Agilian Quick Start
Page 19 of 32
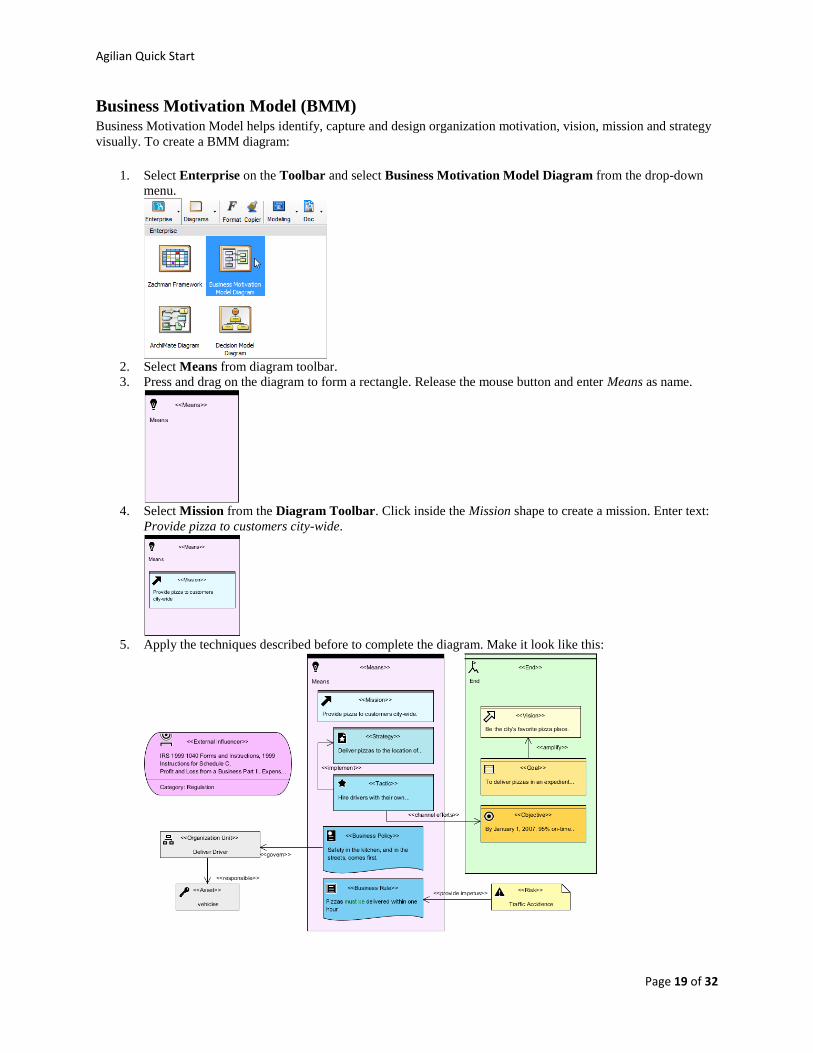
Business Motivation Model (BMM) Business Motivation Model helps identify, capture and design organization motivation, vision, mission and strategy
visually. To create a BMM diagram:
1. Select Enterprise on the Toolbar and select Business Motivation Model Diagram from the drop-down
menu.
2. Select Means from diagram toolbar.
3. Press and drag on the diagram to form a rectangle. Release the mouse button and enter Means as name.
4. Select Mission from the Diagram Toolbar. Click inside the Mission shape to create a mission. Enter text:
Provide pizza to customers city-wide.
5. Apply the techniques described before to complete the diagram. Make it look like this:
Agilian Quick Start
Page 20 of 32
General Modeling
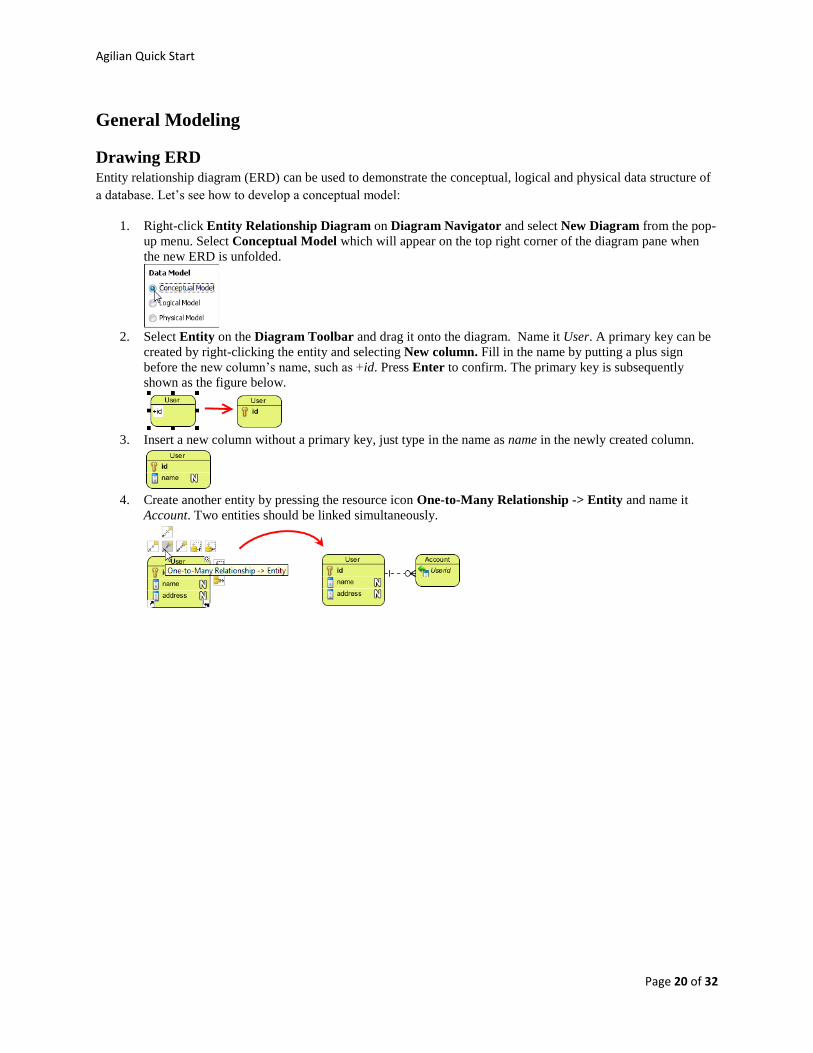
Drawing ERD Entity relationship diagram (ERD) can be used to demonstrate the conceptual, logical and physical data structure of
a database. Let’s see how to develop a conceptual model:
1. Right-click Entity Relationship Diagram on Diagram Navigator and select New Diagram from the pop-
up menu. Select Conceptual Model which will appear on the top right corner of the diagram pane when
the new ERD is unfolded.
2. Select Entity on the Diagram Toolbar and drag it onto the diagram. Name it User. A primary key can be
created by right-clicking the entity and selecting New column. Fill in the name by putting a plus sign
before the new column’s name, such as +id. Press Enter to confirm. The primary key is subsequently
shown as the figure below.
3. Insert a new column without a primary key, just type in the name as name in the newly created column.
4. Create another entity by pressing the resource icon One-to-Many Relationship -> Entity and name it
Account. Two entities should be linked simultaneously.
Agilian Quick Start
Page 21 of 32
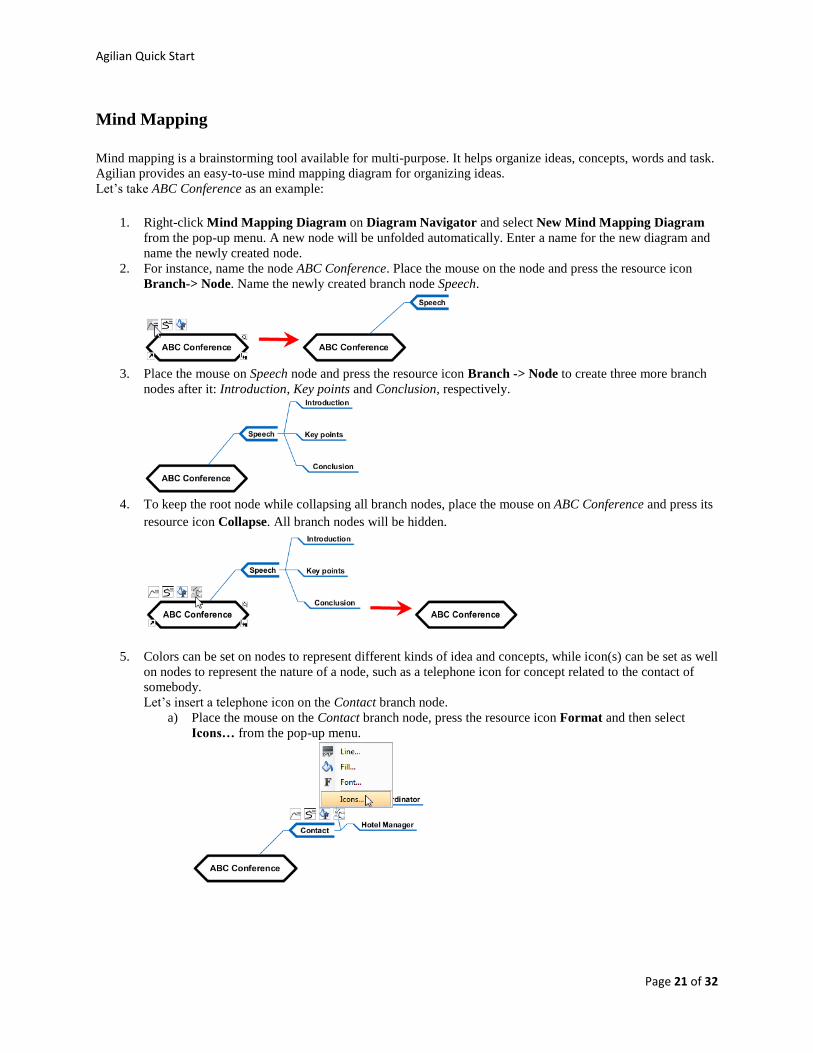
Mind Mapping
Mind mapping is a brainstorming tool available for multi-purpose. It helps organize ideas, concepts, words and task.
Agilian provides an easy-to-use mind mapping diagram for organizing ideas.
Let’s take ABC Conference as an example:
1. Right-click Mind Mapping Diagram on Diagram Navigator and select New Mind Mapping Diagram
from the pop-up menu. A new node will be unfolded automatically. Enter a name for the new diagram and
name the newly created node.
2. For instance, name the node ABC Conference. Place the mouse on the node and press the resource icon
Branch-> Node. Name the newly created branch node Speech.
3. Place the mouse on Speech node and press the resource icon Branch -> Node to create three more branch
nodes after it: Introduction, Key points and Conclusion, respectively.
4. To keep the root node while collapsing all branch nodes, place the mouse on ABC Conference and press its
resource icon Collapse. All branch nodes will be hidden.
5. Colors can be set on nodes to represent different kinds of idea and concepts, while icon(s) can be set as well
on nodes to represent the nature of a node, such as a telephone icon for concept related to the contact of
somebody.
Let’s insert a telephone icon on the Contact branch node.
a) Place the mouse on the Contact branch node, press the resource icon Format and then select
Icons… from the pop-up menu.
Agilian Quick Start
Page 22 of 32
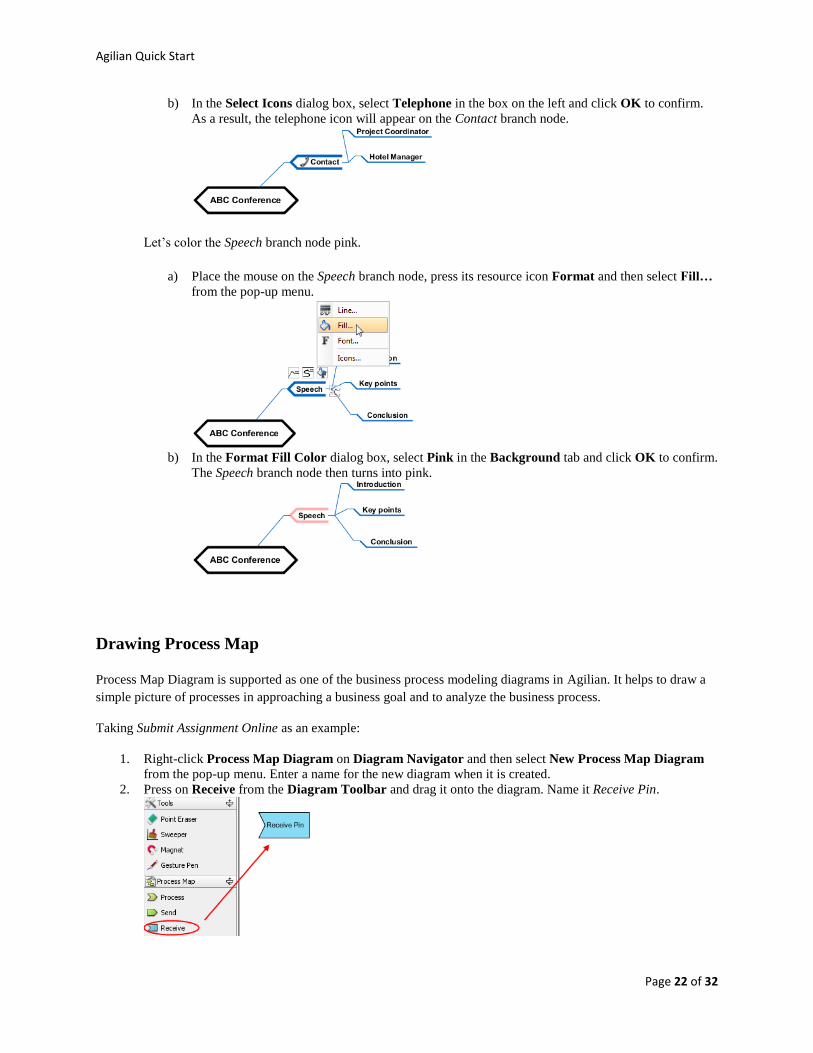
b) In the Select Icons dialog box, select Telephone in the box on the left and click OK to confirm.
As a result, the telephone icon will appear on the Contact branch node.
Let’s color the Speech branch node pink.
a) Place the mouse on the Speech branch node, press its resource icon Format and then select Fill…
from the pop-up menu.
b) In the Format Fill Color dialog box, select Pink in the Background tab and click OK to confirm.
The Speech branch node then turns into pink.
Drawing Process Map
Process Map Diagram is supported as one of the business process modeling diagrams in Agilian. It helps to draw a
simple picture of processes in approaching a business goal and to analyze the business process.
Taking Submit Assignment Online as an example:
1. Right-click Process Map Diagram on Diagram Navigator and then select New Process Map Diagram
from the pop-up menu. Enter a name for the new diagram when it is created.
2. Press on Receive from the Diagram Toolbar and drag it onto the diagram. Name it Receive Pin.
Agilian Quick Start
Page 23 of 32
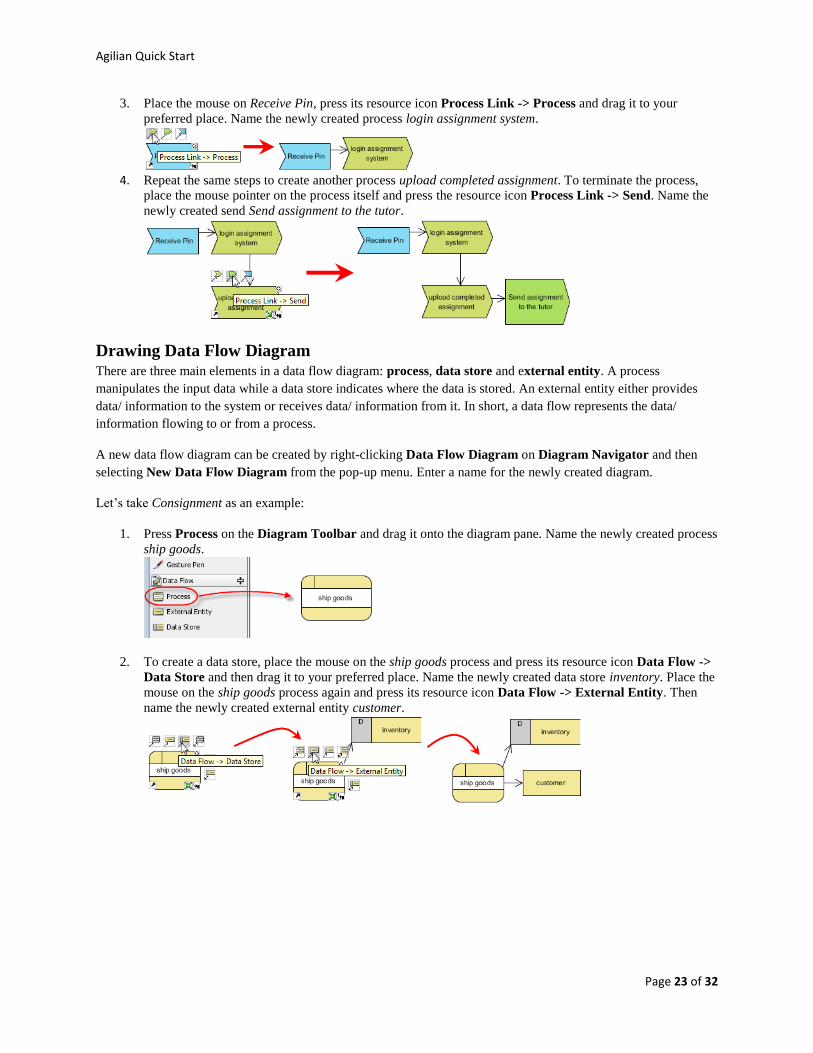
3. Place the mouse on Receive Pin, press its resource icon Process Link -> Process and drag it to your
preferred place. Name the newly created process login assignment system.
4. Repeat the same steps to create another process upload completed assignment. To terminate the process,
place the mouse pointer on the process itself and press the resource icon Process Link -> Send. Name the
newly created send Send assignment to the tutor.
Drawing Data Flow Diagram There are three main elements in a data flow diagram: process, data store and external entity. A process
manipulates the input data while a data store indicates where the data is stored. An external entity either provides
data/ information to the system or receives data/ information from it. In short, a data flow represents the data/
information flowing to or from a process.
A new data flow diagram can be created by right-clicking Data Flow Diagram on Diagram Navigator and then
selecting New Data Flow Diagram from the pop-up menu. Enter a name for the newly created diagram.
Let’s take Consignment as an example:
1. Press Process on the Diagram Toolbar and drag it onto the diagram pane. Name the newly created process
ship goods.
2. To create a data store, place the mouse on the ship goods process and press its resource icon Data Flow ->
Data Store and then drag it to your preferred place. Name the newly created data store inventory. Place the
mouse on the ship goods process again and press its resource icon Data Flow -> External Entity. Then
name the newly created external entity customer.
Agilian Quick Start
Page 24 of 32
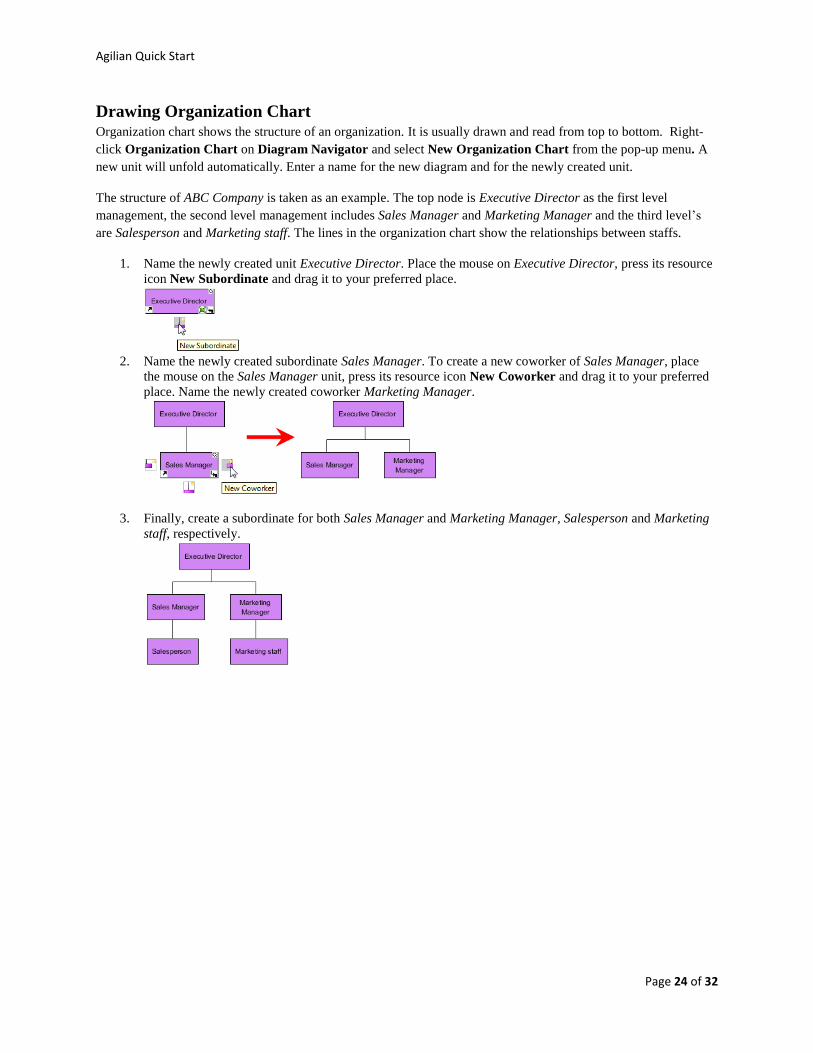
Drawing Organization Chart Organization chart shows the structure of an organization. It is usually drawn and read from top to bottom. Right-
click Organization Chart on Diagram Navigator and select New Organization Chart from the pop-up menu. A
new unit will unfold automatically. Enter a name for the new diagram and for the newly created unit.
The structure of ABC Company is taken as an example. The top node is Executive Director as the first level
management, the second level management includes Sales Manager and Marketing Manager and the third level’s
are Salesperson and Marketing staff. The lines in the organization chart show the relationships between staffs.
1. Name the newly created unit Executive Director. Place the mouse on Executive Director, press its resource
icon New Subordinate and drag it to your preferred place.
2. Name the newly created subordinate Sales Manager. To create a new coworker of Sales Manager, place
the mouse on the Sales Manager unit, press its resource icon New Coworker and drag it to your preferred
place. Name the newly created coworker Marketing Manager.
3. Finally, create a subordinate for both Sales Manager and Marketing Manager, Salesperson and Marketing
staff, respectively.
Agilian Quick Start
Page 25 of 32
Impact Analysis If you were to make a change to some model elements, it would be important to know which other elements will get
affected because of it. The Impact Analysis feature can help you with that. There are two options, Matrix and
Analysis Diagram, to choose from, depending on the scope of the analysis you need. Matrix provides, like a big
picture, an exhaustive list of combinations of model elements in a grid and shows you which pairs are related. In
contrast, Analysis Diagram offers a visual way to look at a particular model element closely in terms of which other
model elements are related to it, like holding a magnifying glass over it.
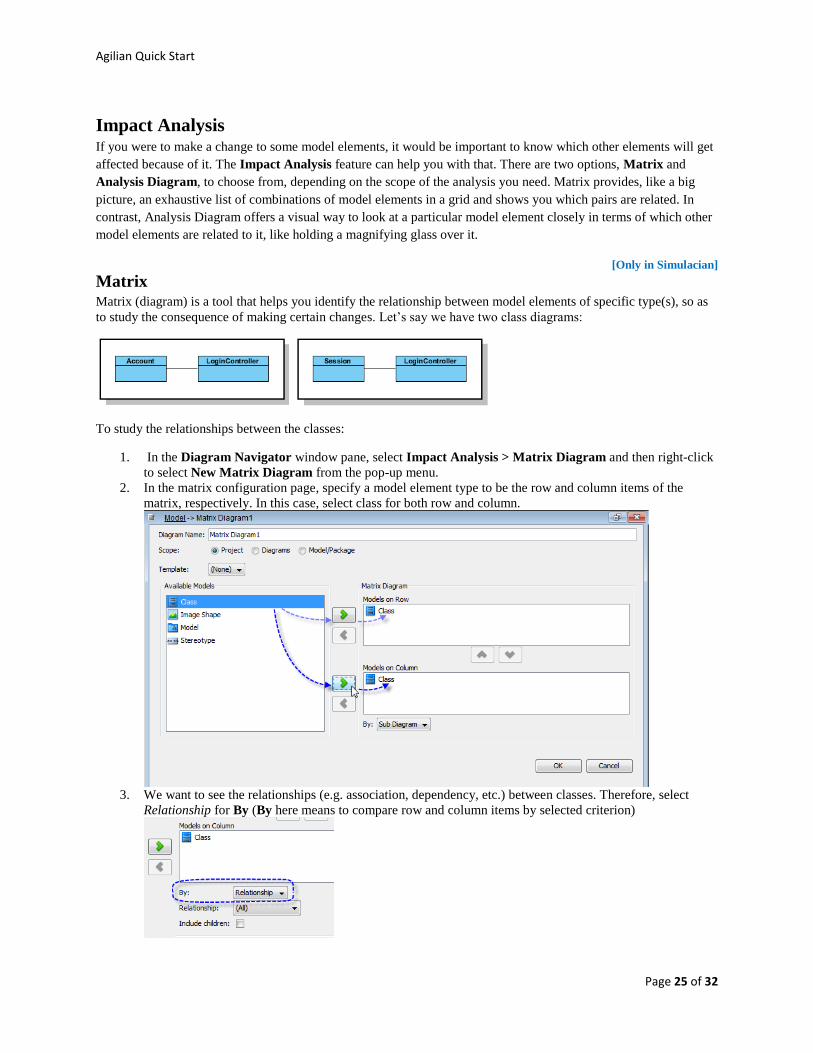
Matrix [Only in Simulacian]
Matrix (diagram) is a tool that helps you identify the relationship between model elements of specific type(s), so as
to study the consequence of making certain changes. Let’s say we have two class diagrams:
To study the relationships between the classes:
1. In the Diagram Navigator window pane, select Impact Analysis > Matrix Diagram and then right-click
to select New Matrix Diagram from the pop-up menu.
2. In the matrix configuration page, specify a model element type to be the row and column items of the
matrix, respectively. In this case, select class for both row and column.
3. We want to see the relationships (e.g. association, dependency, etc.) between classes. Therefore, select
Relationship for By (By here means to compare row and column items by selected criterion)
Agilian Quick Start
Page 26 of 32
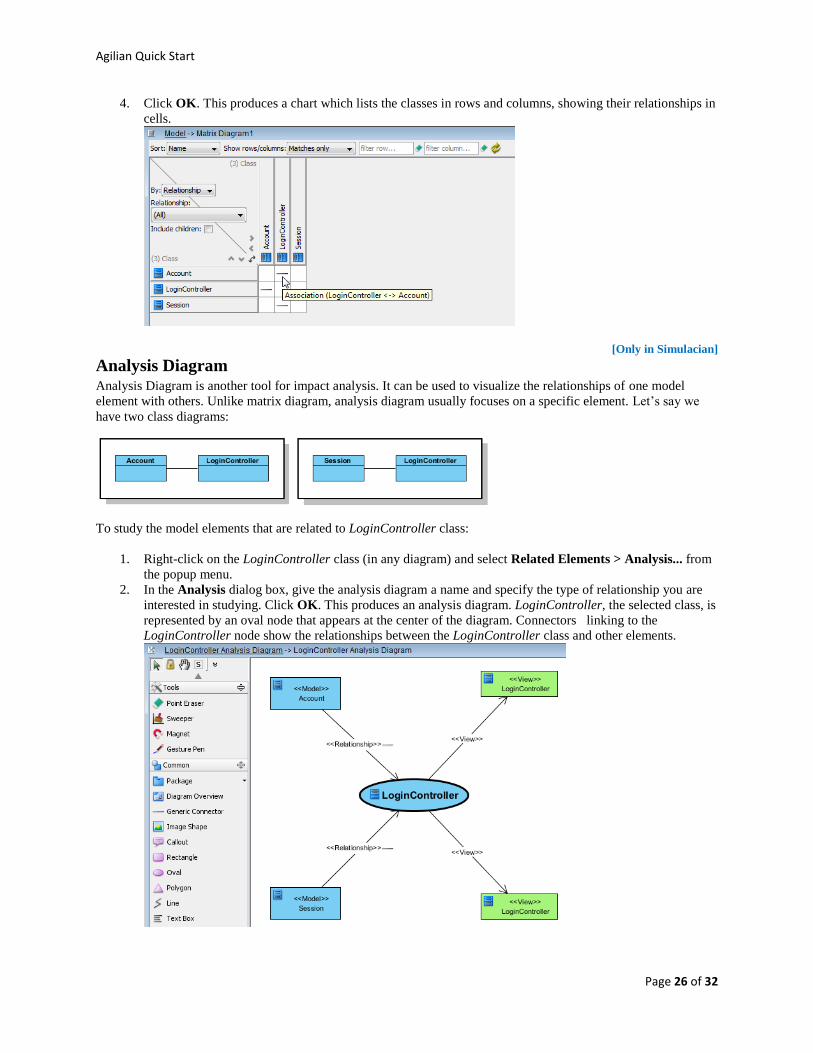
4. Click OK. This produces a chart which lists the classes in rows and columns, showing their relationships in
cells.
Analysis Diagram [Only in Simulacian]
Analysis Diagram is another tool for impact analysis. It can be used to visualize the relationships of one model
element with others. Unlike matrix diagram, analysis diagram usually focuses on a specific element. Let’s say we
have two class diagrams:
To study the model elements that are related to LoginController class:
1. Right-click on the LoginController class (in any diagram) and select Related Elements > Analysis... from
the popup menu.
2. In the Analysis dialog box, give the analysis diagram a name and specify the type of relationship you are
interested in studying. Click OK. This produces an analysis diagram. LoginController, the selected class, is
represented by an oval node that appears at the center of the diagram. Connectors linking to the
LoginController node show the relationships between the LoginController class and other elements.
Agilian Quick Start
Page 27 of 32
Report Generation
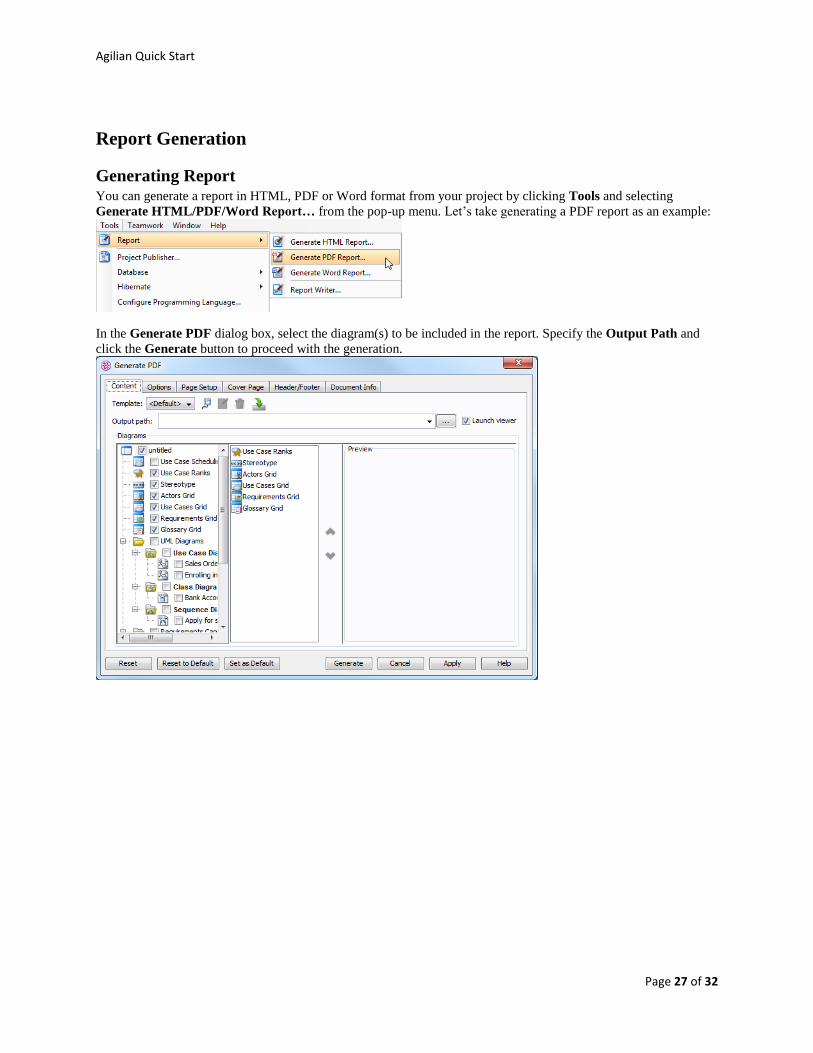
Generating Report You can generate a report in HTML, PDF or Word format from your project by clicking Tools and selecting
Generate HTML/PDF/Word Report… from the pop-up menu. Let’s take generating a PDF report as an example:
In the Generate PDF dialog box, select the diagram(s) to be included in the report. Specify the Output Path and
click the Generate button to proceed with the generation.
Agilian Quick Start
Page 28 of 32
Customizing Report Template
You may customize your report instead of using the built-in template.
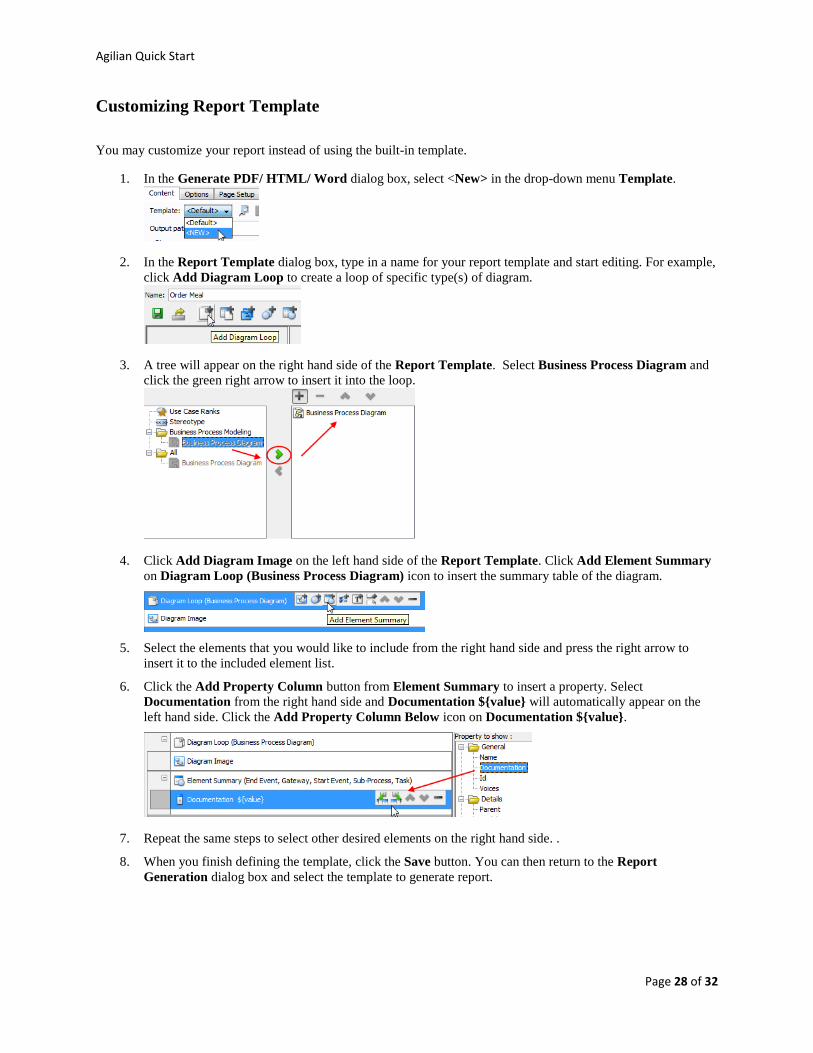
1. In the Generate PDF/ HTML/ Word dialog box, select <New> in the drop-down menu Template.
2. In the Report Template dialog box, type in a name for your report template and start editing. For example,
click Add Diagram Loop to create a loop of specific type(s) of diagram.
3. A tree will appear on the right hand side of the Report Template. Select Business Process Diagram and
click the green right arrow to insert it into the loop.
4. Click Add Diagram Image on the left hand side of the Report Template. Click Add Element Summary
on Diagram Loop (Business Process Diagram) icon to insert the summary table of the diagram.
5. Select the elements that you would like to include from the right hand side and press the right arrow to
insert it to the included element list.
6. Click the Add Property Column button from Element Summary to insert a property. Select
Documentation from the right hand side and Documentation ${value} will automatically appear on the
left hand side. Click the Add Property Column Below icon on Documentation ${value}.
7. Repeat the same steps to select other desired elements on the right hand side. .
8. When you finish defining the template, click the Save button. You can then return to the Report
Generation dialog box and select the template to generate report.
Agilian Quick Start
Page 29 of 32
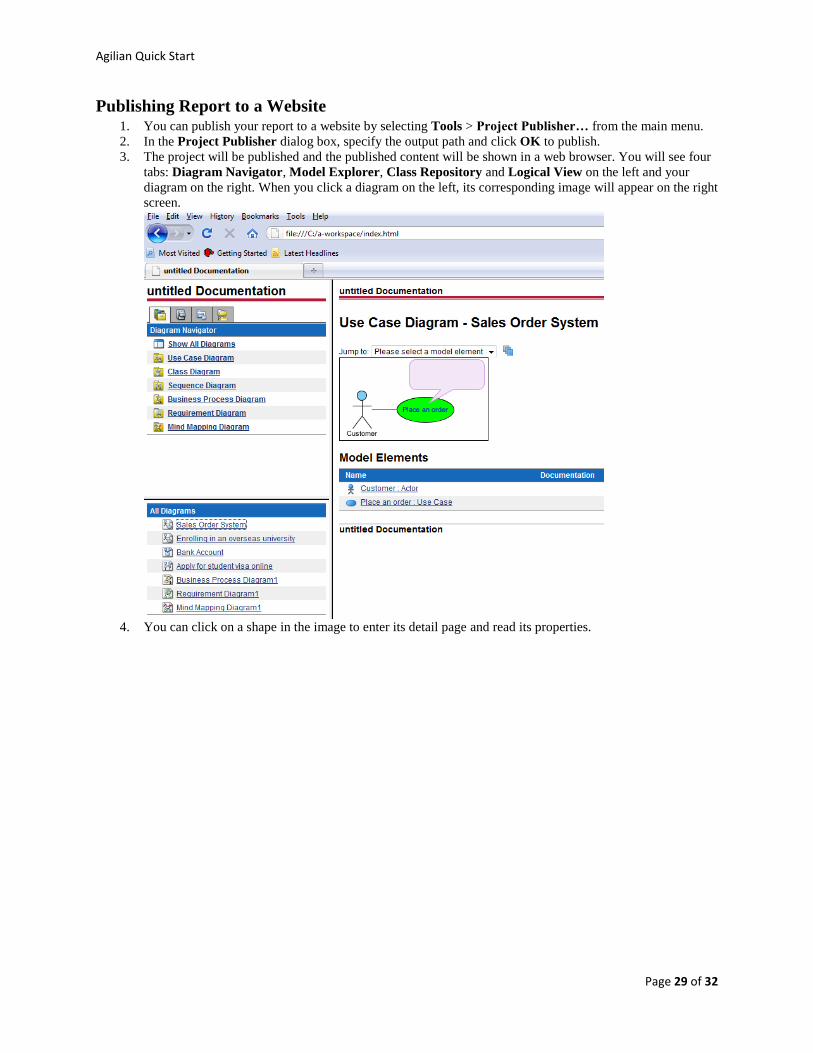
Publishing Report to a Website 1. You can publish your report to a website by selecting Tools > Project Publisher… from the main menu.
2. In the Project Publisher dialog box, specify the output path and click OK to publish.
3. The project will be published and the published content will be shown in a web browser. You will see four
tabs: Diagram Navigator, Model Explorer, Class Repository and Logical View on the left and your
diagram on the right. When you click a diagram on the left, its corresponding image will appear on the right
screen.
4. You can click on a shape in the image to enter its detail page and read its properties.
Agilian Quick Start
Page 30 of 32
Teamwork Collaboration Your team can work together on the same project effectively through the teamwork collaboration feature. Agilian
supports the integration with version control systems such as SVN, CVS, Perforce and Teamwork Server. This
section will cover basic teamwork operations with Teamwork Server. The techniques to be discussed can be applied
to the integration with SVN, CVS, Perforce and ClearCase as well.
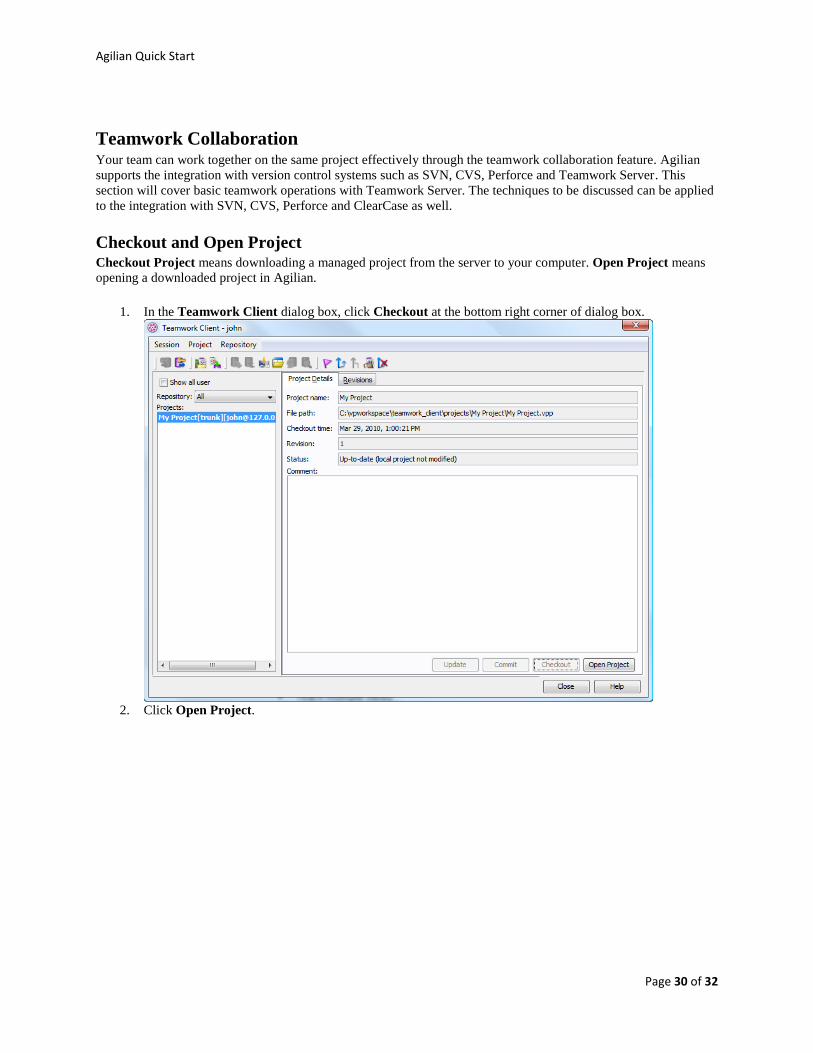
Checkout and Open Project Checkout Project means downloading a managed project from the server to your computer. Open Project means
opening a downloaded project in Agilian.
1. In the Teamwork Client dialog box, click Checkout at the bottom right corner of dialog box.
2. Click Open Project.
Agilian Quick Start
Page 31 of 32
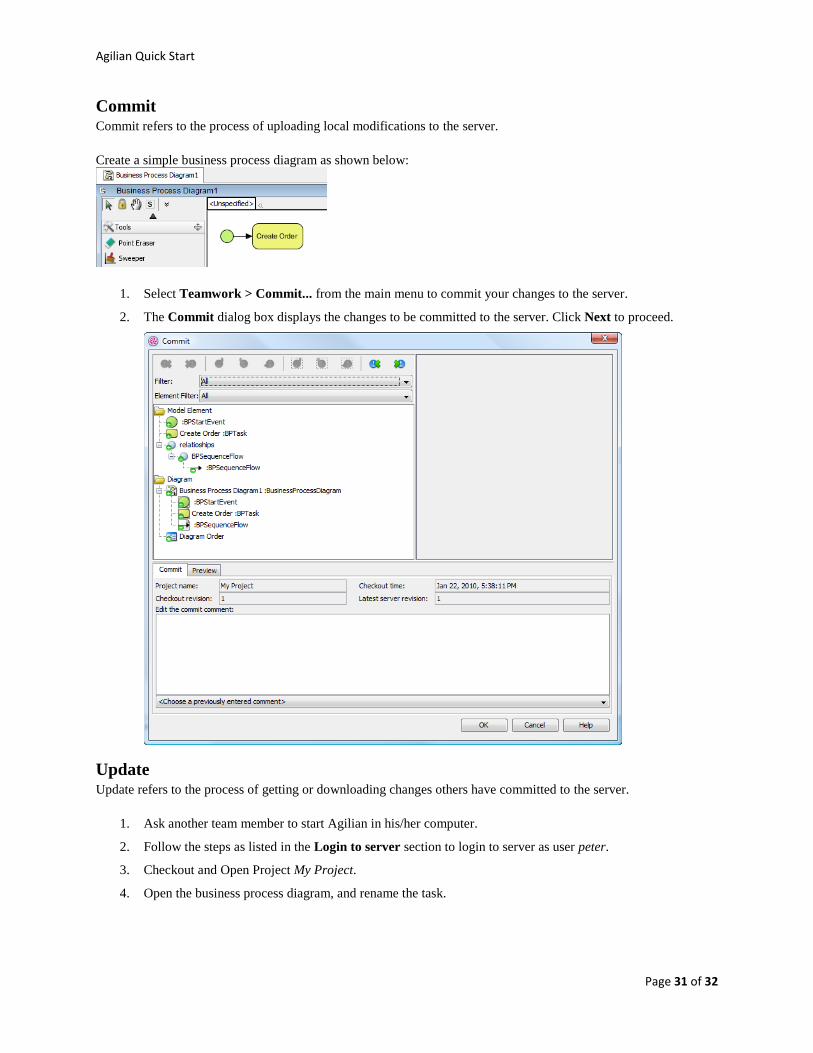
Commit Commit refers to the process of uploading local modifications to the server.
Create a simple business process diagram as shown below:
1. Select Teamwork > Commit... from the main menu to commit your changes to the server.
2. The Commit dialog box displays the changes to be committed to the server. Click Next to proceed.
Update Update refers to the process of getting or downloading changes others have committed to the server.
1. Ask another team member to start Agilian in his/her computer.
2. Follow the steps as listed in the Login to server section to login to server as user peter.
3. Checkout and Open Project My Project.
4. Open the business process diagram, and rename the task.
Agilian Quick Start
Page 32 of 32
5. Follow the steps as described in the Commit section to commit the change to the server.
6. Now, go back to john's environment.
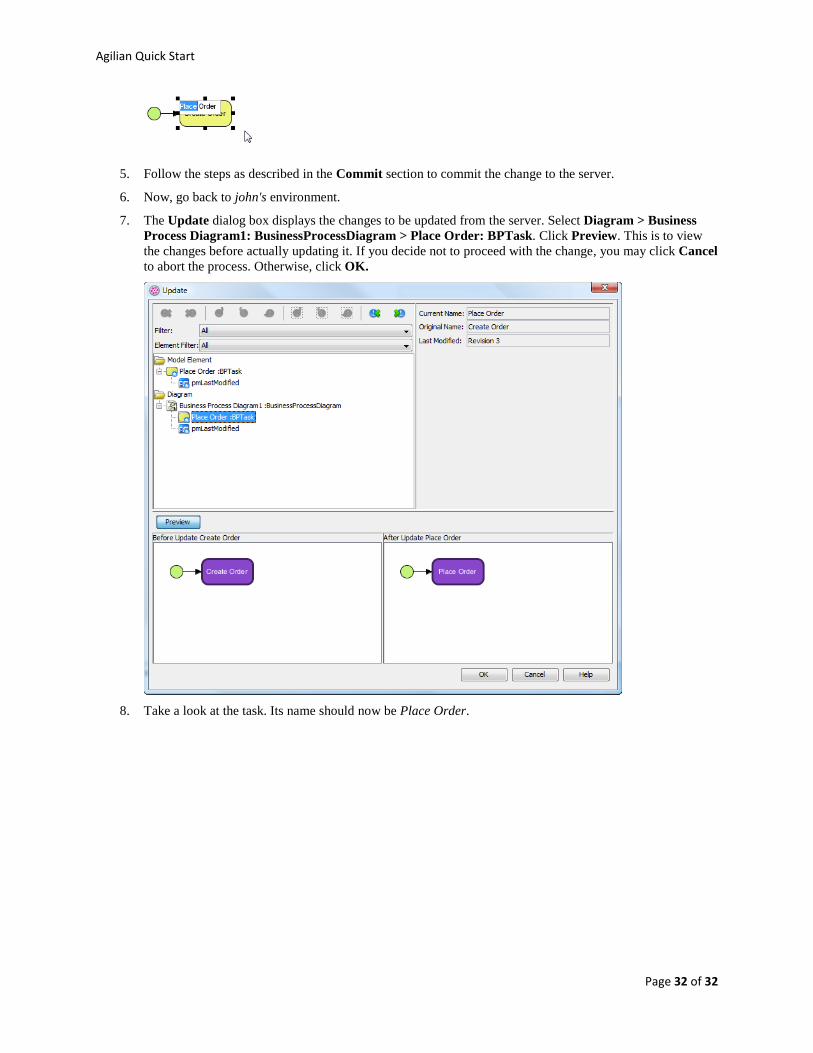
7. The Update dialog box displays the changes to be updated from the server. Select Diagram > Business
Process Diagram1: BusinessProcessDiagram > Place Order: BPTask. Click Preview. This is to view
the changes before actually updating it. If you decide not to proceed with the change, you may click Cancel
to abort the process. Otherwise, click OK.
8. Take a look at the task. Its name should now be Place Order.