aggregate breakdown during tillage in a mediterranean loamy soil
TRANSCRIPT

Soil & Tillage Research 101 (2008) 62–68
Aggregate breakdown during tillage in a Mediterranean loamy soil
J. Alvaro-Fuentes a,*, J.L. Arrue a, C. Cantero-Martınez b, M.V. Lopez a
a Departamento de Suelo y Agua, Estacion Experimental de Aula Dei, Consejo Superior de Investigaciones Cientıficas (CSIC), POB 13034, 50080 Zaragoza, Spainb Departament de Produccio Vegetal i Ciencia Forestal, Universitat de Lleida-IRTA, Rovira Roure 177, 25198 Lleida, Spain
A R T I C L E I N F O
Article history:
Received 21 December 2007
Received in revised form 17 June 2008
Accepted 20 June 2008
Keywords:
Soil aggregation
Moldboard plow
Chisel plow
Mediterranean conditions
A B S T R A C T
Long-term tillage negatively affects soil aggregation, but little is known about the short-term effects of
tillage. We investigated the effects of intensive tillage (moldboard plowing) and conservation tillage
(chisel plowing) on aggregate breakage during tillage in a long-term study located in the semiarid Ebro
river valley (NE Spain). The type of tillage resulted in different soil aggregate distributions. In the 0–5-cm
and 5–10-cm soil layers, chisel plowing decreased dry mean weight diameter (DMWD) 29% and 35%,
respectively, while moldboard plowing decreased DMWD by only 2% and 16%, respectively. The decrease
in DMWD was mainly due to breaking of large aggregates ranging (2–8 mm) into small aggregates
(<0.5 mm). Tillage method had no effect on water stability of 1–2 mm aggregates. The differences in
DMWD demonstrate that the choice of the tillage implement can be a key factor in improving soil
management and productivity. The surprising result that aggregate breakdown was greater with chisel
than moldboard plowing needs further research to determine the mechanisms controlling aggregate
breaking during tillage.
� 2008 Elsevier B.V. All rights reserved.
Contents lists available at ScienceDirect
Soil & Tillage Research
journa l homepage: www.e lsev ier .com/ locate /s t i l l
1. Introduction
Soil aggregation plays an important role in the maintenance ofsoil productivity and quality. Soil aggregates physically protect soilorganic matter and affects root density and elongation, soil erosion,oxygen diffusion, soil water retention and dynamics, nutrientadsorption and microbial community structure (Amezketa, 1999;Six et al., 2004). Karlen et al. (1994) suggested that aggregate sizedistribution and stability are good indicators for evaluating soilquality in tillage experiments.
Soil aggregation is influenced by a large number of factors suchas changes in soil organic matter, moisture content and microbialcommunity, crop type, root development and tillage implementa-tion. It is well established that long-term tillage causes a modifiesthe dry aggregate size distribution (Singh et al., 1994; Yang andWander, 1998; Eynard et al., 2004) and the water-stableaggregation (Angers et al., 1993; Unger et al., 1998; Alvaro-Fuentes et al., 2008b). Tillage mechanically disrupts soil aggregatesleading to a decrease in aggregate size. At the same time, tillagecontinually exposes soils to wetting/drying and freeze/thaw cyclesat the surface, making aggregates more susceptible to break down.
* Corresponding author. Present address: Natural Resource Ecology Laboratory,
Colorado State University, Fort Collins, CO 80523 1499, USA. Tel.: +1 970 491 5724.
E-mail address: [email protected] (J. Alvaro-Fuentes).
0167-1987/$ – see front matter � 2008 Elsevier B.V. All rights reserved.
doi:10.1016/j.still.2008.06.004
Upon aggregate disruption, aggregate-occluded SOM is releasedand becomes more available for decomposition (Paustian et al.,1997).
Tillage effects on soil aggregate size distribution are directlyrelated to the degree of soil disturbance. Alvaro-Fuentes et al.(2008b), in a semiarid Mediterranean agroecosystem, found thatthe dry mean weigh diameter (DMWD) of soil aggregates decreasesin relation with tillage intensity. In semiarid central Spain, Hernanzet al. (2002) observed that water stability of 2–1 mm aggregatesdecreased in the following order: no-tillage (NT) > reduced tillage(RT) > conventional tillage (CT).
The majority of these studies about tillage and soil aggregationhave been focused on the study of the effects of long-term tillageon aggregate size distribution and aggregate stability. However,little information exists about the short-term effects of differenttillage implements on soil aggregation and, particularly, on dryaggregate size distribution.
Historically, one of the main reasons that has been given tojustify soil tillage is the achievement of an adequate seedbedpreparation in order to facilitate a good seed-soil contact and thusa better crop emergence. In the last 20 years, conservation tillagesystems, and specially NT, have spread out and in some areas of theworld have completely displaced to CT systems. Benefits of NThave been widely compiled and reviewed (Lal, 1989; Unger, 1990)but despite those well-recognized benefits, NT has not beenimplemented in large areas. Ignorance of the technique, textural

Table 2Total monthly precipitation (P) and mean monthly maximum and minimum air
temperatures (T) recorded at the experimental site during 2004
2004
P (mm) T (8C)
Max. Min.
January 10.3 12.7 3.1
February 43.4 9.8 0.5
March 56.4 14.3 2.0
April 42.0 17.6 4.8
May 34.9 23.3 8.7
June 5.9 32.3 14.3
July 14.5 32.1 15.9
August 10.5 32.3 16.7
September 25.3 29.0 14.5
October 32.9 23.8 10.2
November 8.5 13.1 2.9
December 32.7 10.9 3.0
J. Alvaro-Fuentes et al. / Soil & Tillage Research 101 (2008) 62–68 63
and soil depth limitations and weed infestations are among thefactors that have reduced widespread use of NT. Therefore, in areaswhere intensive tillage is commonly used it is necessary to shiftfrom this practice to a more conservative system with chisel plowor cultivator plow in order to improve soil quality and to avoidenvironmental risks associated with intensive tillage systems.
Our objective was (i) to quantify the breakdown of soilaggregates during a tillage event and (ii) to evaluate the effectsof a reduction in tillage intensity on the aggregate breakdown. Wehypothesized that: (i) during intensive tillage a large proportion ofaggregates are broken up and consequently a reduction on tillageintensity can reduce this aggregate breaking.
2. Materials and methods
2.1. Site and tillage treatments
Soil samples were collected from a long-term tillage experi-ment established in 1989 at the dryland research farm of theEstacion Experimental de Aula Dei (Consejo Superior de Investi-gaciones Cientıficas) in the Zaragoza province, Spain (4184403000N,084601800W, 270 m). The soil is a loam (fine-loamy, mixed, thermicXerollic Calciorthid) according to the USDA soil classification (SoilSurvey Staff, 1975). Selected soil chemical and physical propertiesare shown in Table 1 and precipitation and maximum andminimum temperatures recorded at the experimental site for the2004 year are presented in Table 2. The climate is semiarid, with anaverage annual precipitation of 340 mm and an average annual airtemperature of 14.7 8C. The cropping system consisted ofcontinuous barley (Hordeum vulgare, L.). In this study soil sampleswere taken from two tillage treatments: conventional tillage withmoldboard plowing (MP) to a depth of 30–35 cm and chiselplowing (CP) to a depth of 20–25 cm. The moldboard plowconsisted of three bottoms of 0.50 m width and reduced tillage andthe chisel plow consisted of 5 rigid shanks spaced 20 cm apart andwith a shank width of 5 cm. Although during the year consideredfor this study no secondary tillage was performed, during theprevious years a secondary tillage was performed by passing asweep cultivator to a depth of 10–15 cm in both MP and CPtreatments. In this long-term experiment, seeding has always beenmade with a direct drill planter. Tillage treatments were arrangedin a randomized complete block design with three replications. Thesize of each subplot was 33.5 m � 10 m.
2.2. Soil sampling and aggregate analyses
Soil samples were collected at five depths (0–5, 5–10, 10–20,20–30, 30–40 cm) in November 2004 just before and after tillageimplementation. Tillage was done on 10 November and soilsamples were collected on 8 November (pre-tillage) and 15November (post-tillage). From each plot and depth, a compositesoil sample for aggregation analyses was prepared from twosamples taken at two points 15 m apart with a flat spade and
Table 1Soil physical and chemical soil properties at the experimental site
Soil depth (cm)
0–20 20–40
Particle size distribution (g kg�1)
Sand (2000 < Ø < 50 mm) 293 279
Silt (50 < Ø < 2 mm) 484 460
Clay (Ø < 2 mm) 223 261
pH (H2O, 1:2.5) 8.3 8.3
Electrical conductivity (1:5) (dS m�1) 0.25 0.28
CaCO3 (g kg�1) 432 425
placed in crush-resistant, air-tight containers in order to avoidaggregate breaking during sample transportation. Samplingposition was carefully selected in order to avoid areas withprevious wheel track. At the same time, once in the laboratory,field-moist soil was passed through a 8-mm sieve. The sieved soilwas air dried and stored at room temperature. Soil aggregation wascharacterized by the dry aggregate size distribution and wateraggregate stability. The dry aggregate size distribution wasattained by placing 200 g of air-dried soil (previously passedthrough a 8 mm sieve) on the top of a vertical electromagneticsieve apparatus (FRITSCH Analysette 3 PRO) equipped with a stackof seven sieves with the following screens: 4, 2, 1, 0.85, 0.5, 0.25and 0.05 mm. In order to determine the optimum combination ofsieving time and amplitude (vertical vibration height), a series ofexperiments testing different sieving times and amplitudes werecarried out using different soils. A sieving time of 5 min and withamplitude of 0.1 mm were finally fixed for our experiment. Dry soilremaining on each sieve was collected and weighed. The dry meanweight diameter (DMWD) was used to express dry aggregate sizedistribution (Youker and McGuiness, 1957).
DMWD ¼X8
i¼1
XiWi (1)
where Xi is the mean diameter of the size fraction, and Wi is theproportion of total sample weight retained on each sieve.
Dry aggregates between 1 and 2 mm diameter range wereseparated to determine the water aggregate stability (WAS) for thisaggregate size class. The WAS was measured using the procedureof Kemper and Rosenau (1986). Briefly, 4 g of 1–2 mm air-driedaggregates were placed on the top of a 0.25 mm sieve and sieved indistilled water during 3 min with a stroke length of 1.3 cm and afrequency of 35 strokes min�1. Soil retained on the sieve wastransferred to an aluminum pan and dried and weighed.
Total soil organic carbon (SOC) from each plot and depth wasmeasured in July 2005, after crop harvest. A composite sample wasprepared from two samples taken from each plot and depth. A 5 gsubsample was used to determine total SOC content by the wetoxidation method of Walkley and Black (Nelson and Sommers,1982).
Daily precipitation and air temperature data were collectedusing an automatic weather station (Campbell Scientific Inc.,datalogger CR10) located within the experimental field.
Statistical analyses of data were performed using the SASstatistical package (SAS Institute, 1990). ANOVA analyses were

J. Alvaro-Fuentes et al. / Soil & Tillage Research 101 (2008) 62–6864
made in order to test the effects of tillage, sampling moment andthe interaction between factors. Interaction between tillage andsampling moment was tested with the slice option of the LSMEANSstatement.
3. Results and discussion
3.1. Tillage effects on dry aggregate distribution
Prior to tillage, the DMWD of aggregates ranged from 2.2 to3.0 mm with similar values between tillage treatments except forthe 30–40 cm depth where greater DMWD was found under MPthan under CP (Fig. 1). The similar DMWD between CP and MP canbe related with the long time elapsed since the last tillage event (1year). At the same time, low differences in C inputs between tillagetreatments could have led to similar DMWD values prior to tillage.It is well accepted that soil aggregation is dependent on C inputs(Bronick and Lal, 2005). Tisdall and Oades (1982), in theiraggregate hierarchy model, proposed that macroaggregates
Fig. 1. Dry mean weight diameter (DMWD) for the 0–5, 5–10, 10–20, 20–30, 30–40 cm lay
and the sampling time regarding to tillage implementation (pre- and post-tillage). Err
differences between tillage treatments for the same moment and soil depth (P < 0.05). *
treatment (P < 0.05).
(>250 mm) are formed by the binding of stable microaggregates(20–250 mm) by temporary (fungal hyphae and roots) andtransient binding agents (microbial- and plant-derived polysac-charides). Nevertheless, Elmholt et al. (2008), observed similarfungal hyphae and hot-water extractable carbohydrate-C onmicro- and macroaggregates. These authors concluded that thelevel of C inputs controls the formation of binding agents andtherefore soil aggregation. Other similar studies have corroboratedthat soil aggregates are formed due to the action of microbialactivity stimulated by the presence of plant residues (Golchin et al.,1994; Six et al., 1998). In our study, no microbial analyses weremade, but crop residue inputs were similar between tillagetreatments during the previous cropping season (2003–2004) with9160 and 9340 kg dry biomass ha�1 (straw + roots) in CP and MP,respectively (Alvaro-Fuentes et al., 2008a).
As stated before, the exception was found in the deepest soillayer sampled (30–40 cm) where a greater DMWD was found inMP compared with CP (Fig. 1). We consider that differences indepth implementation between CP (up to 25-cm depth with no
ers of soil as affected by tillage system (CP, chisel plowing; MP, moldboard plowing)
or bars represent standard errors. Different lowercase letters indicate significant
Indicates significant differences between moments for a same soil depth and tillage

Table 3Percentage reduction in the dry mean weight diameter (DMWD) during tillage
chisel plowing (CP) and moldboard plowing (MP) for different soil depths
Soil depth (cm) % DMWD
CP MP
0–5 29.0az 1.8b
5–10 35.2a 15.8b
10–20 27.4a 21.3a
20–30 13.9a 14.1a
30–40 3.0a 11.2a
z Different lowercase letters indicate significant differences between tillage
treatments within a soil depth (P < 0.05).
J. Alvaro-Fuentes et al. / Soil & Tillage Research 101 (2008) 62–68 65
inversion) and MP (up to 35-cm depth with soil inversion) led tothese observed differences in DMWD. Therefore, a deeperplacement of crop residues in the MP plots compared with theCP plots could have led to a greater DMWD in the 30–40 cm depthdue to greater stimulation of soil microorganisms by a greateramount of crop residues.
In all the depths and tillage treatments, the DMWD was greaterbefore tillage implementation (pre-tillage) than immediately aftertillage (post-tillage) except in the 0–5 cm depth in MP and in the30–40 cm depth in both CP and MP where similar values wereobserved (Fig. 1). The greatest decrease in DMWD was observed inthe 5–10 cm depth in CP where after the pass of a chisel plow thepre-tillage DMWD value decreased by 35% (Table 3). This loss ofDMWD due to CP was significantly greater than the loss observedafter the pass of MP for the same soil depth. Nevertheless, thegreatest difference between CP and MP was observed in the 0–5 cmdepth where the CP treatment decrease by 29% in the pre-tillageDMWD compared with the pre-tillage moment. However, in theMP treatment this loss was only a 2% (Table 3). Therefore, MPcompared with CP did not reduced the DMWD in the soil surface. Ithas been accepted that tillage implementation produces thebreakdown of aggregates (Amezketa, 1999; Bronick and Lal, 2005).However, most of these studies did not deal with dry aggregation.
Table 4Dry aggregate size distribution measured at five soil depths immediately before (pre-t
Soil depth
(cm)
Sampling
time
Tillage
treatment
Aggregate proportion (%)
4–8 mm 2–4 mm 1–2 mm
0–5 Pre-tillage CP 24.3 (2.1)*,z 23.4 (1.0)* 17.6 (2.9)
Post-tillage CP 13.1 (1.8) 18.3 (1.3) 16.8 (0.1)
Pre-tillage MP 21.3 (2.4) 23.2 (0.7) 20.2 (0.4)
Post-tillage MP 21.8 (1.6) 20.7 (1.0) 17.8 (0.2)
5–10 Pre-tillage CP 30.3 (2.0)* 23.9 (0.5)* 17.9 (0.6)
Post-tillage CP 13.8 (2.1) 18.6 (0.7) 18.4 (0.7)
Pre-tillage MP 24.9 (2.0)* 24.6 (0.6)* 19.2 (0.9)
Post-tillage MP 19.3 (0.9) 20.6 (0.4) 18.7 (0.2)
10–20 Pre-tillage CP 30.4 (1.2)* 24.9 (1.0)* 17.1 (0.3)
Post-tillage CP 17.2 (1.9) 21.1 (0.9) 18.8 (1.0)
Pre-tillage MP 29.4 (1.0)* 24.3 (0.3) 18.1 (0.4)
Post-tillage MP 18.9 (0.8) 22.4 (0.7) 19.6 (0.3)
20–30 Pre-tillage CP 26.0 (2.0) 24.1 (1.0) 16.8 (0.3)
Post-tillage CP 19.0 (3.1) 22.3 (0.4) 18.5 (0.6)
Pre-tillage MP 26.3 (2.6) 23.6 (0.8) 18.7 (1.1)
Post-tillage MP 19.9 (1.0) 21.3 (1.0) 19.3 (0.4)
30–40 Pre-tillage CP 17.9 (2.0) 21.5 (0.9) 17.4 (0.5)
Post-tillage CP 15.4 (1.6) 21.4 (0.8) 18.3 (0.8)
Pre-tillage MP 24.5 (2.6)* 23.7 (0.4) 18.0 (0.4)
Post-tillage MP 19.7 (2.2) 21.8 (0.6) 18.9 (0.5)
* Indicates significant differences between pre- and post-tillage measurements withz Values in parenthesis are the standard errors of the mean.
Yang and Wander (1998) suggested that little information existsabout the temporal shifts in the characteristics of naturallyoccurring aggregates obtaining by dry-sieving. These authorsstudied tillage and crop effects (corn and soybean) on temporal dryaggregation changes in Illinois. Conversely to our results, theyfound an increase of DMWD after fall tillage implementation inboth crops. Differences between studies can be related withdifferences in the time elapsed between tillage implementationand soil sampling. In this study, 2 months passed from the pre-tillage to the post-tillage sampling date. Plante and McGill (2002)studying aggregate dynamics under different simulated tillagefound that aggregates were rapidly reformed between tillageevents occurred every 2 weeks. Concurrently, MP causes aninversion of soil profile. The little differences in DMWD betweenpre- and pos-tillage at surface might be related by a distributioneffect where soil from the bottom of the plough layer is brought tothe surface.
In the 30–40 cm depth no differences in DMWD were foundbetween pre- and post-tillage in both tillage treatments (Fig. 1). Asmentioned before, CP was performed up to 25 cm depth.Consequently, in the CP treatment similar DMWD values wereobserved between pre- and post-tillage. However, the differencesin the MP treatment were expected to be greater since MP wasdone up to 35 cm. Despite no significant differences in the DMWDwere found in the MP treatment in the 30–40 cm depth betweenthe pre- and post-tillage moment, the pre-tillage DMWD wasslightly greater than the post-tillage DMWD (Fig. 1).
The dry aggregate size distributions measured prior and afterCP and MP operations are shown in Table 4. In both tillagetreatments the greatest aggregate breakage due to tillage wasobserved in the large macroaggregates fractions (4–8 and 2–4 mmaggregate size classes) (Table 4). In the 0–5 cm depth, the CPtreatment significantly reduced the proportion of aggregates of 4–8 mm size from 24.3% to 13.1%. However, for the same aggregatesize class and soil depth, MP had a similar proportion of 4–8 mmsize aggregates after tillage (Table 4). Furthermore, for the 2–4 mmaggregate size class a similar trend was observed, with a
illage) and after (post-tillage) chisel plowing (CP) and moldboard plowing (MP)
0.84–1 mm 0.5–0.84 mm 0.25–0.5 mm 0.05–0.25 mm <0.05 mm
3.9 (1.4) 12.8 (0.9) 11.2 (1.1)* 5.2 (1.0)* 0.3 (0.02)*
2.6 (0.01) 13.3 (0.4) 22.1 (2.4) 11.9 (1.6) 1.3 (0.3)
2.7 (0.2) 14.0 (0.5)* 12.0 (0.9)* 6.6 (1.0) 0.3 (0.06)
2.4 (0.1) 11.5 (0.4) 14.7 (1.3) 9.7 (1.0) 0.1 (0.1)
2.4 (0.1) 10.4 (0.9) 9.0 (0.7)* 5.6 (0.5)* 0.3 (0.03)*
2.8 (0.08) 13.2 (0.3) 19.5 (1.7) 12.7 (1.5) 1.1 (0.1)
2.8 (0.2) 12.1 (0.7) 10.4 (0.7)* 6.0 (0.8)* 0.3 (0.06)*
2.6 (0.09) 12.3 (0.4) 15.4 (0.4) 10.7 (0.8) 0.9 (0.1)
2.1 (0.09)* 9.8 (0.6)* 8.8 (0.7)* 6.5 (0.5)* 0.4 (0.02)*
2.7 (0.1) 12.4 (0.5) 16.8 (1.6) 10.9 (1.3) 0.9 (0.2)
2.2 (0.03)* 10.8 (0.3)* 9.3 (0.4)* 5.7 (0.5)* 0.3 (0.05)*
2.6 (0.09) 12.4 (0.2) 14.7 (1.0) 9.2 (0.3) 0.7 (0.1)
2.3 (0.1) 9.8 (0.3)* 10.1 (1.1) 10.2(1.2)* 0.9 (0.1)
2.4 (0.1) 11.7 (0.6) 14.6 (1.1) 10.9 (1.2) 1.6 (0.3)
2.3 (0.2) 11.2 (0.8) 10.2 (0.8) 7.5 (0.7)* 0.5 (0.08)*
2.5 (0.1) 12.4 (0.3) 14.7 (0.8) 9.5 (0.8) 0.7 (0.1)
2.3 (0.1) 11.3 (0.2)* 15.2 (2.1) 13.1 (0.8) 1.4 (0.2)
2.3 (0.08) 12.7 (0.9) 18.4 (1.6) 11.7 (0.7) 1.1 (0.1)
2.6 (0.2) 10.5 (0.5) 10.4 (0.7) 9.4 (0.9) 0.8 (0.1)
2.7 (0.06) 11.9 (0.5) 14.9 (1.1) 10.1 (0.7) 0.9 (0.1)
in the same soil depth and tillage treatment (P < 0.05).

J. Alvaro-Fuentes et al. / Soil & Tillage Research 101 (2008) 62–6866
significantly decrease under CP from 23.4% to 18.3% and similarvalues under MP (Table 4). In the 5–10 cm and 10–20 cm depthsand in both CP and MP, tillage implementation significantlyreduced the 4–8 and 2–4 mm aggregate size classes except for the2–4 mm aggregate size class in the MP treatment (Table 4). In the20–30 and 30–40 cm depths, similar proportions of 4–8 and 2–4 mm aggregates were observed between the pre- and post-tillagesamplings except for the 30–40 cm depth in the MP treatmentwhere tillage implementation led to a decrease of the proportion of4–8 mm aggregate size class (Table 4). In all the soil depths and inboth tillage treatments, a similar proportion of 1–2 and 0.84–1 mmaggregates was found before and after tillage. Conversely, theproportion of the 0.5–0.84, 0.25–0.5, 0.05–0.25, <0.05 aggregatesize classes increased after tillage implementation in both tillagetreatments and in all the soil depths. Nevertheless, this tendencydiminished with depth (Table 4). The lowest increase in theseaggregate fractions was observed in the deepest soil layers (20–30and 30–40 cm). Grandy and Robertson (2006), studying the short-term response of tillage on water-stable aggregate size distributionaccording four size classes (2–8, 0.25–2, 0.05–0.25 and
Fig. 2. Water stability of air-dried 1–2 mm size aggregates (WAS) for the 0–5, 5–10, 10–20
moldboard plowing) and the sampling time regarding to tillage implementation (pre-
indicate significant differences between tillage treatments for a same moment and soi
<0.053 mm), observed 60 days after tillage implementationobserved a decrease in the 2–8 mm aggregate size class and anincrease of the 0.05–0.25 and <0.053 size classes. In ourexperiment, in which the dry macroaggregate range was splitinto 6 classes, we detected that only the macroaggregates of the 4–8 and 2–4 mm size classes were responsible for the decrease in theDMWD observed after tillage implementation. According to Tisdalland Oades (1982), roots and hyphae are the main binding agentsfor macroaggregates >2 mm. These binding agents are sensible tomanagement. Several studies have observed a decrease of hyphaeand root networks after tillage (Jansa et al., 2003; Castillo et al.,2006). Consequently, tillage operations could lead to a loss ofmacroaggregate binding agents (hyphae and little roots), resultingin an easily breakdown of soil macroaggregates.
3.2. Tillage effects on water aggregate stability (WAS)
In the pre- and post-tillage samplings, WAS ranged from 12 to20% (Fig. 2). In the 0–5 and 5–10 cm depths, a greater pre-tillageWAS was observed in the CP treatment compared with MP.
, 20–30, 30–40 cm layers of soil as affected by tillage system (CP, chisel plowing; MP,
and post-tillage). Error bars represent standard errors. Different lowercase letters
l depth (P < 0.05).
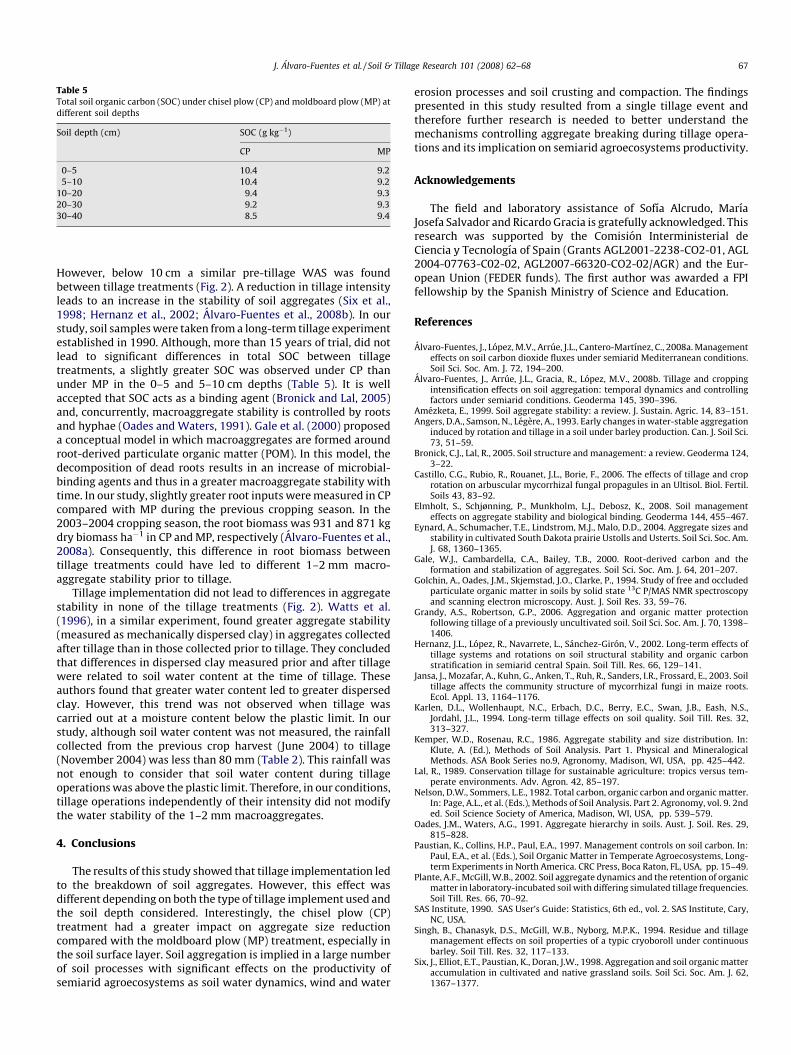
Table 5Total soil organic carbon (SOC) under chisel plow (CP) and moldboard plow (MP) at
different soil depths
Soil depth (cm) SOC (g kg�1)
CP MP
0–5 10.4 9.2
5–10 10.4 9.2
10–20 9.4 9.3
20–30 9.2 9.3
30–40 8.5 9.4
J. Alvaro-Fuentes et al. / Soil & Tillage Research 101 (2008) 62–68 67
However, below 10 cm a similar pre-tillage WAS was foundbetween tillage treatments (Fig. 2). A reduction in tillage intensityleads to an increase in the stability of soil aggregates (Six et al.,1998; Hernanz et al., 2002; Alvaro-Fuentes et al., 2008b). In ourstudy, soil samples were taken from a long-term tillage experimentestablished in 1990. Although, more than 15 years of trial, did notlead to significant differences in total SOC between tillagetreatments, a slightly greater SOC was observed under CP thanunder MP in the 0–5 and 5–10 cm depths (Table 5). It is wellaccepted that SOC acts as a binding agent (Bronick and Lal, 2005)and, concurrently, macroaggregate stability is controlled by rootsand hyphae (Oades and Waters, 1991). Gale et al. (2000) proposeda conceptual model in which macroaggregates are formed aroundroot-derived particulate organic matter (POM). In this model, thedecomposition of dead roots results in an increase of microbial-binding agents and thus in a greater macroaggregate stability withtime. In our study, slightly greater root inputs were measured in CPcompared with MP during the previous cropping season. In the2003–2004 cropping season, the root biomass was 931 and 871 kgdry biomass ha�1 in CP and MP, respectively (Alvaro-Fuentes et al.,2008a). Consequently, this difference in root biomass betweentillage treatments could have led to different 1–2 mm macro-aggregate stability prior to tillage.
Tillage implementation did not lead to differences in aggregatestability in none of the tillage treatments (Fig. 2). Watts et al.(1996), in a similar experiment, found greater aggregate stability(measured as mechanically dispersed clay) in aggregates collectedafter tillage than in those collected prior to tillage. They concludedthat differences in dispersed clay measured prior and after tillagewere related to soil water content at the time of tillage. Theseauthors found that greater water content led to greater dispersedclay. However, this trend was not observed when tillage wascarried out at a moisture content below the plastic limit. In ourstudy, although soil water content was not measured, the rainfallcollected from the previous crop harvest (June 2004) to tillage(November 2004) was less than 80 mm (Table 2). This rainfall wasnot enough to consider that soil water content during tillageoperations was above the plastic limit. Therefore, in our conditions,tillage operations independently of their intensity did not modifythe water stability of the 1–2 mm macroaggregates.
4. Conclusions
The results of this study showed that tillage implementation ledto the breakdown of soil aggregates. However, this effect wasdifferent depending on both the type of tillage implement used andthe soil depth considered. Interestingly, the chisel plow (CP)treatment had a greater impact on aggregate size reductioncompared with the moldboard plow (MP) treatment, especially inthe soil surface layer. Soil aggregation is implied in a large numberof soil processes with significant effects on the productivity ofsemiarid agroecosystems as soil water dynamics, wind and water
erosion processes and soil crusting and compaction. The findingspresented in this study resulted from a single tillage event andtherefore further research is needed to better understand themechanisms controlling aggregate breaking during tillage opera-tions and its implication on semiarid agroecosystems productivity.
Acknowledgements
The field and laboratory assistance of Sofıa Alcrudo, MarıaJosefa Salvador and Ricardo Gracia is gratefully acknowledged. Thisresearch was supported by the Comision Interministerial deCiencia y Tecnologıa of Spain (Grants AGL2001-2238-CO2-01, AGL2004-07763-C02-02, AGL2007-66320-CO2-02/AGR) and the Eur-opean Union (FEDER funds). The first author was awarded a FPIfellowship by the Spanish Ministry of Science and Education.
References
Alvaro-Fuentes, J., Lopez, M.V., Arrue, J.L., Cantero-Martınez, C., 2008a. Managementeffects on soil carbon dioxide fluxes under semiarid Mediterranean conditions.Soil Sci. Soc. Am. J. 72, 194–200.
Alvaro-Fuentes, J., Arrue, J.L., Gracia, R., Lopez, M.V., 2008b. Tillage and croppingintensification effects on soil aggregation: temporal dynamics and controllingfactors under semiarid conditions. Geoderma 145, 390–396.
Amezketa, E., 1999. Soil aggregate stability: a review. J. Sustain. Agric. 14, 83–151.Angers, D.A., Samson, N., Legere, A., 1993. Early changes in water-stable aggregation
induced by rotation and tillage in a soil under barley production. Can. J. Soil Sci.73, 51–59.
Bronick, C.J., Lal, R., 2005. Soil structure and management: a review. Geoderma 124,3–22.
Castillo, C.G., Rubio, R., Rouanet, J.L., Borie, F., 2006. The effects of tillage and croprotation on arbuscular mycorrhizal fungal propagules in an Ultisol. Biol. Fertil.Soils 43, 83–92.
Elmholt, S., Schjønning, P., Munkholm, L.J., Debosz, K., 2008. Soil managementeffects on aggregate stability and biological binding. Geoderma 144, 455–467.
Eynard, A., Schumacher, T.E., Lindstrom, M.J., Malo, D.D., 2004. Aggregate sizes andstability in cultivated South Dakota prairie Ustolls and Usterts. Soil Sci. Soc. Am.J. 68, 1360–1365.
Gale, W.J., Cambardella, C.A., Bailey, T.B., 2000. Root-derived carbon and theformation and stabilization of aggregates. Soil Sci. Soc. Am. J. 64, 201–207.
Golchin, A., Oades, J.M., Skjemstad, J.O., Clarke, P., 1994. Study of free and occludedparticulate organic matter in soils by solid state 13C P/MAS NMR spectroscopyand scanning electron microscopy. Aust. J. Soil Res. 33, 59–76.
Grandy, A.S., Robertson, G.P., 2006. Aggregation and organic matter protectionfollowing tillage of a previously uncultivated soil. Soil Sci. Soc. Am. J. 70, 1398–1406.
Hernanz, J.L., Lopez, R., Navarrete, L., Sanchez-Giron, V., 2002. Long-term effects oftillage systems and rotations on soil structural stability and organic carbonstratification in semiarid central Spain. Soil Till. Res. 66, 129–141.
Jansa, J., Mozafar, A., Kuhn, G., Anken, T., Ruh, R., Sanders, I.R., Frossard, E., 2003. Soiltillage affects the community structure of mycorrhizal fungi in maize roots.Ecol. Appl. 13, 1164–1176.
Karlen, D.L., Wollenhaupt, N.C., Erbach, D.C., Berry, E.C., Swan, J.B., Eash, N.S.,Jordahl, J.L., 1994. Long-term tillage effects on soil quality. Soil Till. Res. 32,313–327.
Kemper, W.D., Rosenau, R.C., 1986. Aggregate stability and size distribution. In:Klute, A. (Ed.), Methods of Soil Analysis. Part 1. Physical and MineralogicalMethods. ASA Book Series no.9, Agronomy, Madison, WI, USA, pp. 425–442.
Lal, R., 1989. Conservation tillage for sustainable agriculture: tropics versus tem-perate environments. Adv. Agron. 42, 85–197.
Nelson, D.W., Sommers, L.E., 1982. Total carbon, organic carbon and organic matter.In: Page, A.L., et al. (Eds.), Methods of Soil Analysis. Part 2. Agronomy, vol. 9. 2nded. Soil Science Society of America, Madison, WI, USA, pp. 539–579.
Oades, J.M., Waters, A.G., 1991. Aggregate hierarchy in soils. Aust. J. Soil. Res. 29,815–828.
Paustian, K., Collins, H.P., Paul, E.A., 1997. Management controls on soil carbon. In:Paul, E.A., et al. (Eds.), Soil Organic Matter in Temperate Agroecosystems, Long-term Experiments in North America. CRC Press, Boca Raton, FL, USA, pp. 15–49.
Plante, A.F., McGill, W.B., 2002. Soil aggregate dynamics and the retention of organicmatter in laboratory-incubated soil with differing simulated tillage frequencies.Soil Till. Res. 66, 70–92.
SAS Institute, 1990. SAS User’s Guide: Statistics, 6th ed., vol. 2. SAS Institute, Cary,NC, USA.
Singh, B., Chanasyk, D.S., McGill, W.B., Nyborg, M.P.K., 1994. Residue and tillagemanagement effects on soil properties of a typic cryoboroll under continuousbarley. Soil Till. Res. 32, 117–133.
Six, J., Elliot, E.T., Paustian, K., Doran, J.W., 1998. Aggregation and soil organic matteraccumulation in cultivated and native grassland soils. Soil Sci. Soc. Am. J. 62,1367–1377.

J. Alvaro-Fuentes et al. / Soil & Tillage Research 101 (2008) 62–6868
Six, J., Bossuyt, H., Degryze, S., Denef, K., 2004. A history of research on the linkbetween (micro) aggregates, soil biota, and soil organic matter dynamics. SoilTill. Res. 79, 7–31.
Soil Survey Staff, 1975. Soil Taxonomy, A Basic System of Soil Classification forMaking and Interpreting Soil Surveys. USDA-SCS Agric. Handbook 436. US Gov.Print. Office, Washington, DC, USA.
Tisdall, J.M., Oades, J.M., 1982. Organic matter and water-stable aggregates in soils.J. Soil Sci. 33, 141–163.
Unger, P.W., 1990. Conservation tillage systems. Adv. Soil Sci. 13, 28–68.
Unger, P.W., Jones, O.R., McClenagan, J.D., Stewart, B.A., 1998. Aggregation of soilcropped to dryland wheat and grain sorghum. Soil Sci. Soc. Am. J. 62, 1659–1666.
Watts, C.W., Dexter, A.R., Longstaff, D.J., 1996. An assessment of the vulnerability ofsoil structure to destabilisation during tillage. Part II. Field trials. Soil Till. Res.37, 175–190.
Yang, X., Wander, M.M., 1998. Temporal changes in dry aggregate size and stability:tillage and crop effects on a silty loam Mollisol in Illinois. Soil Till. Res. 49, 173–183.
Youker, R.E., McGuiness, J.L., 1957. A short method of obtaining mean weight-diameter values of aggregate analyses of soils. Soil Sci. 83, 291–294.