affordable solar housing annual progress report …€annual progress report ... detailed data: mash...
TRANSCRIPT

Multifamily Affordable Solar Housing
Semi‐Annual Progress Report
February 2, 2011
1
Table of Contents
1. Executive Summary .............................................................................................................................. 2
2. Background ........................................................................................................................................... 3
2.1. Incentive Types: Track 1 (A and B) and Track 2 .......................................................................... 4
Table 2.1: MASH Track 1 Incentive Rates in $/Watt ............................................................................ 5
2.2. Virtual Net Metering ................................................................................................................... 6
Figure 2.1: Conventional Solar Systems on Individually‐Metered Multifamily Housing ................................................................................................................................................. 6
2.3. Program Eligibility ....................................................................................................................... 8
2.4. Budget ......................................................................................................................................... 8
Table 2.2: MASH Budget Allocations by Utility Territory ..................................................................... 8
Table 2.3: MASH Program Expenditures by Program Administrator ................................................... 9
3. Regulatory Update ............................................................................................................................. 10
3.1 CPUC Staff Proposal Summary ............................................................................................................. 10
Table 3: MASH Specific Staff Proposal................................................................................................ 11
4. Program Progress ............................................................................................................................... 11
Table 4: Summary Data: MASH Track 1 Applications by Status ......................................................... 12
4.1. MASH Track 1 Waitlist Update ........................................................................................................... 13
Chart 1: Applications by Status........................................................................................................... 14
4.2. MASH Track 2 Incentives .................................................................................................................... 14
Table 5: Summary Data: Total MASH Track 2 Applications by Status ................................................ 15
4.3. MASH Track 1 Activity ........................................................................................................................ 15
Table 6: Detailed Data: MASH Track 1A (Common Area) Applications by Status .............................. 16
Table 7: Detailed Data: MASH Track 1B (Tenant) Applications by Status .......................................... 17
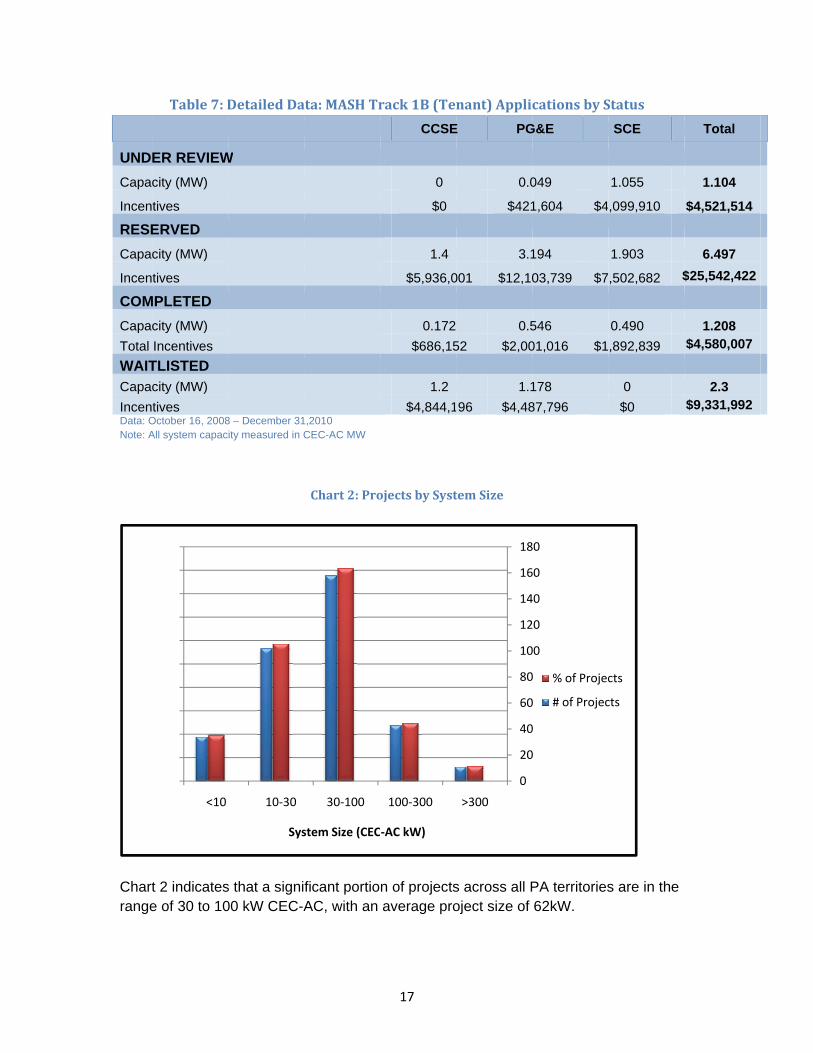
Chart 2: Projects by System Size ......................................................................................................... 17
Chart 3: Average Cost per Watt by Project Size ................................................................................. 18
5. Conclusions ......................................................................................................................................... 19

2
Multifamily Affordable Solar Housing Semi-Annual Progress Report
The California Center for Sustainable Energy (CCSE), on behalf of the California Solar Initiative (CSI) Program Administrators (PAs), submits this 2010 Semi-Annual Progress Report for the Multifamily Affordable Solar Housing (MASH) Program, in compliance with California Public Utilities Commission (CPUC or Commission) Decision (D.) 08-10-036, which requires the PAs to submit joint semi-annual reports to the Director of the Energy Division on the progress of the MASH Program.1
This third MASH semi-annual report captures administrative expenses and program data from program inception on October 16, 2008 through December 31, 2010. It includes requirements identified in Appendix A of D.08-10-036, and other data that the Energy Division (ED) has requested.
1. Executive Summary
The MASH Program is one of CSI’s two low-income programs and is administered by Pacific Gas and Electric (PG&E), Southern California Edison (SCE), and CCSE in San Diego Gas and Electric territory (SDG&E) service territory. The MASH Program provides incentives for the installation of solar photovoltaic (PV) generating systems on low-income multifamily housing, as defined in California Public Utilities Code (PUC) Section 2852. The MASH Program has two incentive tracks both of which are paid in a one-time lump sum payment referred to as the Expected Performance Based Buydown (EPBB).
1. Track 1 provides fixed, capacity-based rebates at $3.30 per watt for solar PV generating systems that offset common area electrical load (Track 1A) or at $4.00 per watt for solar PV generating systems that offset tenant common area electrical load (Track 1B). Track 1 applications are reviewed on a first-come first-served basis.
2. Track 2 is a competitive application process and provides variable rebates up to 100% of system and ongoing maintenance costs. To be awarded Track 2 funds, an applicant must demonstrate direct tenant benefit. Track 2 consists of two application cycles per year.
The PAs began accepting applications for Track 1 in February 2009 and conducted the first round of Track 2 application evaluations between July and December 2009. PG&E, SCE, and SDG&E began to offer a Virtual Net Metering (VNM) utility tariff option in June 1 D.08-10-036, Ordering Paragraph No. 9 and Appendix A. In addition, the PAs will file a more detailed reporting of MASH expenses, including VNM implementation, as part of the CSI semi-annual administrative expense report that is due July 30, 2010. D.08-10-036, Ordering Paragraph No. 7 and Appendix.

3
2009 to simplify the installation of solar PV generating systems in multifamily affordable housing.
Currently, Track 1 funds across all PA territories have been fully allocated. As of January 20, 2011 CCSE and SCE are accepting applications for their respective waitlists. PG&E is not accepting applications for its waitlist due to the significant number of existing applications on its waitlist.
PG&E, SCE & CCSE have completed three application cycles for Track 2. The PAs received and awarded the following number of applications:
• CCSE has received a total of 9 applications and has awarded 2 projects totaling $820,000.
• PGE has received a total of 38 applications and has awarded incentives to 7 applications totaling $2.6M.
• SCE has received a total of 8 applications and has awarded incentives to 4 applications totaling $4.7M.
In July 2010, ED Staff issued a proposal with suggested modifications to the MASH program. The details of the proposal are outlined in section 3 of this report. If approved, the modifications may have significant impact to the program.
2. Background
In D.06-01-024, the Commission adopted the Staff Proposal to set aside a minimum of 10% of CSI Program funds for projects installed by low-income residential customers and affordable housing projects.2 In 2006, the California Legislature codified this requirement in Senate Bill (SB) 13 and Assembly Bill (AB) 2723.4 Subsequently, in D.06-12-033, the Commission directed the PAs to conform the CSI Program to SB 1 and AB 2723 requirements and directed that 10% of the total ten-year CSI budget would be reserved for the low-income residential solar incentive programs that are now referred to as MASH and the Single-Family Affordable Solar Homes (SASH) Programs. On October 16, 2008, in D.08-10-036, the Commission established the $108.34 million MASH Program as a component of the CSI Program. The MASH Program provides
2 D.06-01-024, mimeo., pp. 5 and 27, Conclusion of Law 9 at p. 43 (see also Appendix A, pp. 2-3) 3 SB 1 (Murray & Levine), Chapter 132, Statutes of 2006, sets forth specific CSI program requirements regarding program budget, conditions for solar incentives, and eligibility criteria. 4 AB 2723 (Pavley), Chapter 864, Statutes 2006, required the Commission to ensure that not less than 10% of the CSI funds are used for the installation of solar energy systems on low-income residential housing and authorized the Commission to incorporate a revolving loan or loan guarantee program for this purpose.

4
incentives “for solar installations on existing multifamily affordable housing that meet[s] the definition of low income residential housing established in Pub. Util. Code § 2852.”5 The Commission adopted a two-track incentive structure, “with Track 1 providing up front incentives to systems that offset either common area or tenant load, and Track 2 providing an opportunity to compete for higher incentives through a grant program.”6 PG&E, SCE, and, in SDG&E’s service territory CCSE administer incentives under the MASH Program. The Commission selected the general market CSI PAs because the target customers of the MASH Program, who are affordable housing building owners, are similar to the commercial and non-profit customers of the general market CSI Program. The resulting synergy allowed the PAs to incorporate MASH into their existing CSI administrative structures and to implement MASH in a quick and cost-effective manner.7
The overall goals for the MASH Program are to:
1. Stimulate adoption of solar power in the affordable housing sector; 2. Improve energy utilization and overall quality of affordable housing through
application of solar and energy efficiency technologies; 3. Decrease electricity use and costs without increasing monthly household
expenses for affordable housing building occupants; and 4. Increase awareness and appreciation of the benefits of solar among affordable
housing occupants and developers.
The MASH Program will operate either until January 1, 2016, or when all funds available from the program’s incentive budget have been allocated, whichever event occurs first. PUC Section 2852(c)(3) requires that any program dollars remaining unspent on January 1, 2016, are to be used for Low Income Energy Efficiency programs.
2.1. Incentive Types: Track 1 (A and B) and Track 2
The MASH Program is designed to subsidize solar PV generating systems in low-income multifamily housing. Incentivizing the installation of solar PV generating systems in the MASH Program is not as straightforward as the general market CSI Program. Although affordable housing building owners are the target market, two different categories of customers may receive the benefits from an installed system: the building owners and the tenants. The incentive structure and rebate levels of the MASH Program were designed so that benefits of the solar systems could accrue for both categories of customers.
5 D.08-10-036, Appendix A, mimeo., p. 1 6 D.08-10-036, mimeo., p. 9. 7 D.08-10-036, p. 24-25

5
To accomplish this goal, MASH incentives are divided into two different tracks: Track 1 and Track 2. Track 1 is similar to the general market CSI Program in that the rebate amount is fixed and capacity-based. As shown in Table 2.1, Track 1 offers different incentives for solar PV generating systems that offset the electric load for common areas and tenant units. The rebates are based only on the Expected Performance Based Buy-down (EPBB) method, which is a one-time lump sum payment made after verification of system installation. In the MASH Program, the EPBB incentive rates are fixed and do not automatically decline as they do in the general market CSI program; instead the incentive levels can be revisited and the Administrative Law Judge assigned to the CSI proceeding has the authority to reduce MASH Track 1 incentives by up to 10% each year.8
Table 2.1: MASH Track 1 Incentive Rates in $/Watt
Track 1A: PV System Offsetting Common Area Load
Track 1B: PV System Offsetting Tenant Area Load
$3.30/Watt $4.00/Watt
Track 1A incentives, at $3.30/Watt, are available for solar system installations that offset common area; Track 1B incentives, at $4.00/Watt, are available for systems that offset residential tenant unit electrical load. There is no mandate requiring property owners to install systems that offset tenant unit load in order to qualify for Track 1A incentives; however it is assumed that the Track 1B rate is sufficient to incentivize property owners to provide solar electric benefits to their tenants.
The Track 2 category allows applicants to compete for higher incentive rates if the project provides a quantifiable “direct tenant benefit” (i.e., any operating costs savings from solar that are shared with tenants). Other categories of benefits that are considered when determining an award include energy efficiency improvements in tenant units, on-site green job creation, training, outreach and education for tenants on sustainability topics.
Two Track 2 award cycles are held each year, and the PAs can award up to 20 percent of the total Track 2 budget in any given cycle; however, awards are not guaranteed during any cycle. For each winning application, a PA can award up to 100 percent of the capital costs for the project as well as ongoing operation and maintenance costs.
To ensure that the PAs apply consistent criteria in evaluating Track 2 applications, the PAs developed a standardized statewide Track 2 application and review process with consultation from members of the affordable housing community. The application is available on the PA’s MASH web pages. The CPUC granted a recent request by MASH PAs to postpone the fourth semiannual application cycle for Track 2 incentives until April 29, 2011. Track 2 was scheduled to 8 D.08-10-036, p. 14
6
begin January 1, 2011. For further detail, see section 3 - Regulatory and Legislative Updates.
2.2. Virtual Net Metering
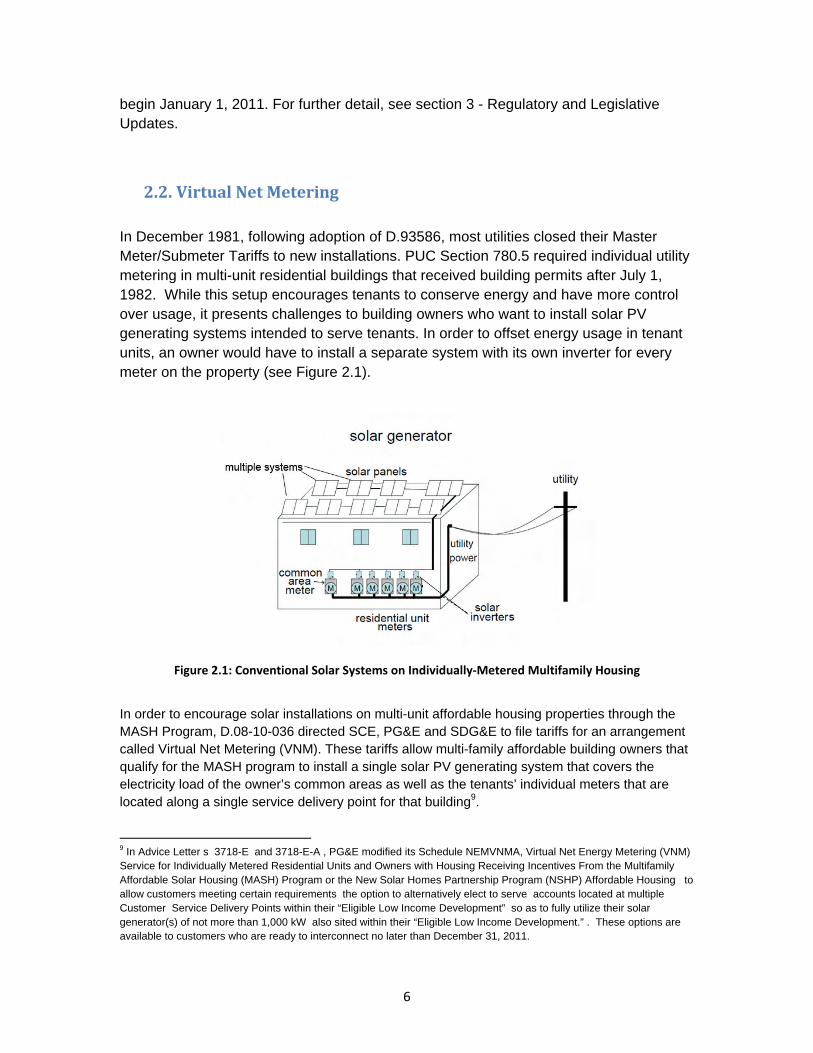
In December 1981, following adoption of D.93586, most utilities closed their Master Meter/Submeter Tariffs to new installations. PUC Section 780.5 required individual utility metering in multi-unit residential buildings that received building permits after July 1, 1982. While this setup encourages tenants to conserve energy and have more control over usage, it presents challenges to building owners who want to install solar PV generating systems intended to serve tenants. In order to offset energy usage in tenant units, an owner would have to install a separate system with its own inverter for every meter on the property (see Figure 2.1).
Figure 2.1: Conventional Solar Systems on Individually‐Metered Multifamily Housing
In order to encourage solar installations on multi-unit affordable housing properties through the MASH Program, D.08-10-036 directed SCE, PG&E and SDG&E to file tariffs for an arrangement called Virtual Net Metering (VNM). These tariffs allow multi-family affordable building owners that qualify for the MASH program to install a single solar PV generating system that covers the electricity load of the owner’s common areas as well as the tenants’ individual meters that are located along a single service delivery point for that building9.
9 In Advice Letter s 3718-E and 3718-E-A , PG&E modified its Schedule NEMVNMA, Virtual Net Energy Metering (VNM) Service for Individually Metered Residential Units and Owners with Housing Receiving Incentives From the Multifamily Affordable Solar Housing (MASH) Program or the New Solar Homes Partnership Program (NSHP) Affordable Housing to allow customers meeting certain requirements the option to alternatively elect to serve accounts located at multiple Customer Service Delivery Points within their “Eligible Low Income Development” so as to fully utilize their solar generator(s) of not more than 1,000 kW also sited within their “Eligible Low Income Development.” . These options are available to customers who are ready to interconnect no later than December 31, 2011.
7
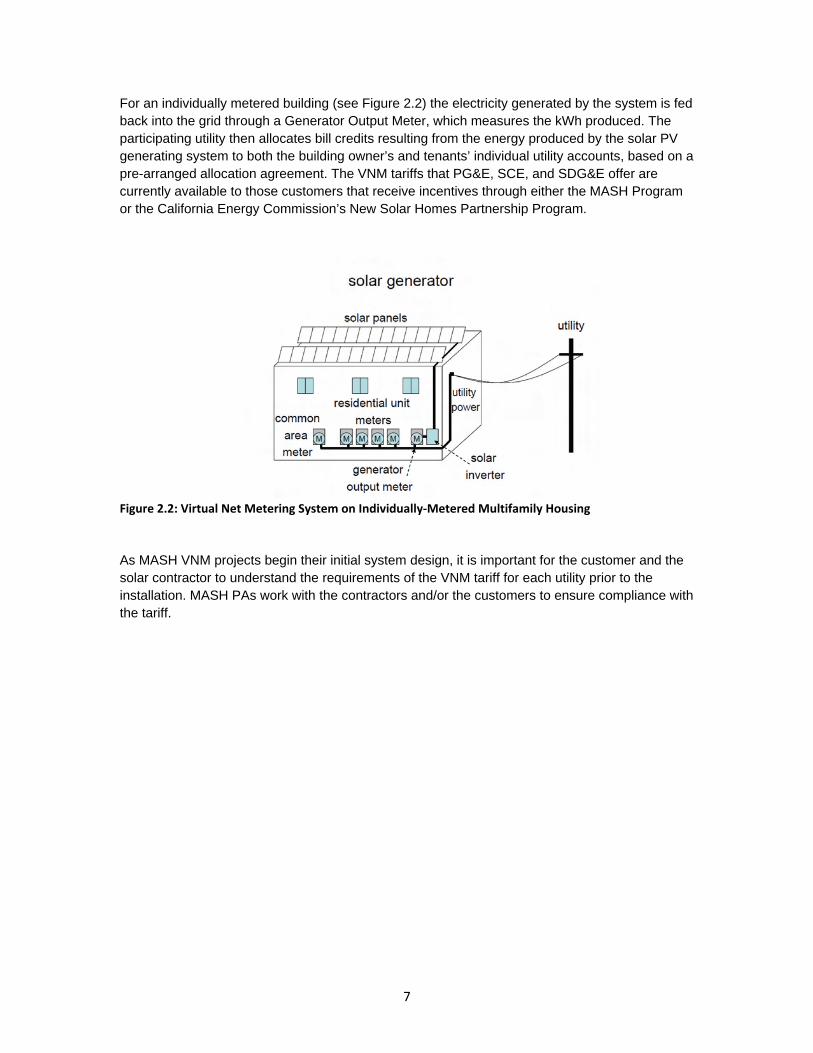
For an individually metered building (see Figure 2.2) the electricity generated by the system is fed back into the grid through a Generator Output Meter, which measures the kWh produced. The participating utility then allocates bill credits resulting from the energy produced by the solar PV generating system to both the building owner’s and tenants’ individual utility accounts, based on a pre-arranged allocation agreement. The VNM tariffs that PG&E, SCE, and SDG&E offer are currently available to those customers that receive incentives through either the MASH Program or the California Energy Commission’s New Solar Homes Partnership Program.
Figure 2.2: Virtual Net Metering System on Individually‐Metered Multifamily Housing
As MASH VNM projects begin their initial system design, it is important for the customer and the solar contractor to understand the requirements of the VNM tariff for each utility prior to the installation. MASH PAs work with the contractors and/or the customers to ensure compliance with the tariff.
8
2.3. Program Eligibility Eligibility for the MASH Program is based on the characteristics of the affordable housing development, which must:
1. Meet the definition of “low income residential housing” as provided in PUC Section 2852;
2. Have an occupancy permit for at least two (2) years; and
3. Be within the service territories of SCE, PG&E, or SDG&E.
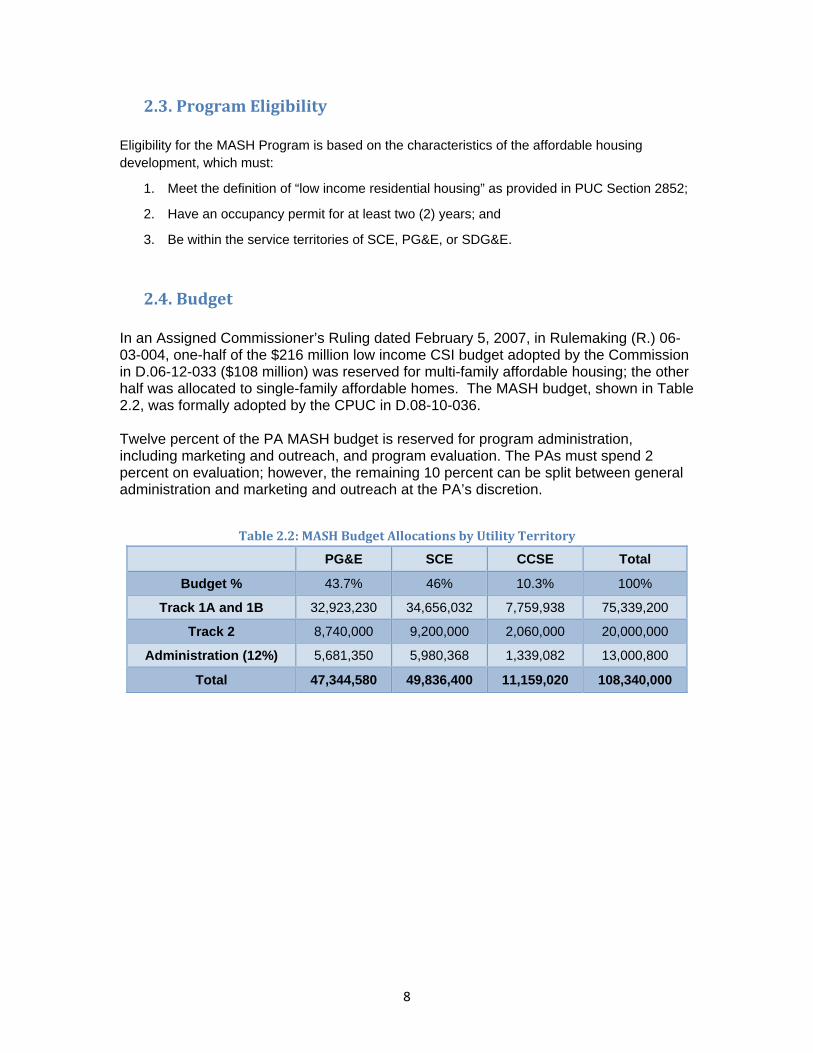
2.4. Budget In an Assigned Commissioner’s Ruling dated February 5, 2007, in Rulemaking (R.) 06-03-004, one-half of the $216 million low income CSI budget adopted by the Commission in D.06-12-033 ($108 million) was reserved for multi-family affordable housing; the other half was allocated to single-family affordable homes. The MASH budget, shown in Table 2.2, was formally adopted by the CPUC in D.08-10-036. Twelve percent of the PA MASH budget is reserved for program administration, including marketing and outreach, and program evaluation. The PAs must spend 2 percent on evaluation; however, the remaining 10 percent can be split between general administration and marketing and outreach at the PA’s discretion.
Table 2.2: MASH Budget Allocations by Utility Territory
PG&E SCE CCSE Total
Budget % 43.7% 46% 10.3% 100%
Track 1A and 1B 32,923,230 34,656,032 7,759,938 75,339,200
Track 2 8,740,000 9,200,000 2,060,000 20,000,000
Administration (12%) 5,681,350 5,980,368 1,339,082 13,000,800
Total 47,344,580 49,836,400 11,159,020 108,340,000

9
From October 16, 2008 through December 31, 2010, total MASH program expenditures are $7,749,743. Table 2.3 details expenditures by Program Administrator.
Table 2.3: MASH Program Expenditures by Program Administrator
MASH Program Expenditure Data Oct 16, 200810 to December 31, 2010 Expenditure Type CCSE PG&E SCE Total Administrative $250,802 $430,916 $347,041 $1,028,759
Marketing $35,407 $33,274 $21,230 $89,911
Measurement & Valuation
$0 $41,445 $0 $41,445
Incentive $524,184 $3,503,560 $2,561,794 $6,589,538
Total $810,393 $4,009,195 $2,930,065 $7,749,743
10 Date of Decision 08-10-036

10
3. Regulatory Update
Since the July 2010 MASH semi-annual report, the program has been affected by the following regulatory activities:
• On September 16, 2010, the CPUC approved PG&E’s Advice Letters 3718-E and 3718-E-A with an effective date of September 15, 2010. The PG&E Advice Letters modify its Schedule NEMVNMA, Virtual Net Energy Metering (VNM) Service for Individually Metered Residential Units and Owners with Housing Receiving Incentives From the Multifamily Affordable Solar Housing (MASH) Program or the New Solar Homes Partnership Program (NSHP) Affordable Housing to allow customers meeting certain requirements the option to alternatively elect to serve accounts located at multiple Customer Service Delivery Points within their “Eligible Low Income Development” so as to fully utilize their solar generator(s) of not more than 1,000 kW also sited within their “Eligible Low Income Development.” . These options are available to customers who are ready to interconnect no later than December 31, 2011.
• On December 6, 2010 SCE filed opening comments to the Scoping Memo issued by the CPUC. Reply comments were filed on December 20, 2010.
• On December 15, 2010, SCE filed its 2011 MASH Program Marketing and
Outreach Plan. As of December 31, 2010, the plan is pending CPUC approval.
• On December 29, 2010, the CPUC granted PG&E and CCSE’s request to postpone the fourth cycle for Track 2 incentives. The request was in response to issues raised in a CPUC Scoping Memo and Ruling that included a recommendation to reallocate all unreserved Track 2 incentive funds to Track 1.11
3.1 CPUC Staff Proposal Summary In a July 26, 2010 CPUC Ruling, parties were asked to review a proposal by the CPUC Energy Division Staff (Staff Proposal) containing suggested modifications to the California Solar Initiative (CSI) Program. On November 9, 2010, the CPUC issued a Scoping Memo to establish priorities and set forth the schedule to address the issues within the Staff Proposal. The Scoping Memo also requested comments on the issues that will be addressed first in this proceeding (Phase I Issues). Among the Commission’s high priority items to be addressed in the first quarter of 2011 are five issues related to
11 SCE filed a request for postponement of MASH Track 2 fourth cycle on January 6, 2011 and was approved on January 12, 2011.

11
the MASH Program. Table 3 lists the MASH-specific issues identified in the Staff Proposal.
Table 3: MASH Specific Staff Proposal
Staff Proposal Section Number MASH-related Issue
Section 2.2 Service Delivery Point as the Boundary of Eligibility for Virtual Net Metering (VNM) Service
Section 2.3 Expansion of VNM to all Customers
Section 2.4 Expansion of VNM to all Affordable Housing Customers
Section 6.6 Increasing Incentives Available for Sold Out MASH Track 1
Section 6.7 Two year Occupancy Requirement for Eligibility for MASH
4. Program Progress
Since the last semi-annual report in July 2010, 27 additional applications have been completed for a total of 36 completed MASH solar projects with a capacity of 2 MW (See Table 4).
As shown in Table 4, the MASH Program has 21 completed Track 1 projects paid in PG&E territory, eight Track 1 projects paid in SCE territory and seven Track 1 projects in SDG&E territory. At this time, $7,049,906 million of incentives have been paid to MASH Track 1 projects statewide. Of the 36 completed projects, 17 are virtually net metered.
Table 4 also shows that there are a total of 264 MASH Track 1 applications with reserved incentives totaling $57,579,676 and an estimated capacity of 16.595 MW as of December 31, 2010. An additional 56 applications are on waitlists for Track 1 funding in the three territories, representing approximately 4.4 MW of capacity.
The third MASH Track 2 application cycle was completed on December 31, 2010. A total of 14 applications were submitted across all PA territories, and one Track 2 incentive project was awarded. As noted in Section 3 of this report, the fourth MASH Track 2 cycle, which was scheduled to start on January 1, 2011, has been postponed until related issues have been resolved by the CPUC.

12
Table 4: Summary Data: MASH Track 1 Applications by Status
Data: October 16, 2008 – December 31, 2010 Note: All system capacity measured in CEC-AC MW.
Summary Data (Track 1) CCSE PG&E SCE Total
UNDER REVIEW APPLICATIONS
Application (Number) 0 5 24 29
Capacity (MW) 0 0.276 2.076 2.352
Incentives $0 $979,087 $8,191,451 $9,170,538
RESERVED APPLICATIONS
Application (Number) 22 139 103 264
Capacity (MW) 1.685 8.017 6.893 16.595
Incentives $6,566,618 $27,110,271 $23,902,787 $57,579,676
COMPLETED APPLICATIONS
Application (Number) 7 21 8 36
Capacity (MW) 0.296 1.035 0.700 2.031
Incentives $984,552 $3,503,560 $2,561,794 $7,049,906
WAITLIST APPLICATIONS
Application (Number) 10 46 0 56
Capacity (MW) 1.2 3.2 0 4.4
Incentives $4,844,196 $12,015,393 $0 $16,859,589
OTHER DETAILS Average Project Costs ($/Watt) Completed, before incentive $6.87 $7.89 $10.11 $7.46
Average Dropout Rate 3.4% 10.9% 14.5% 9.6%

13
4.1. MASH Track 1 Waitlist Update
The MASH program began accepting applications for Track 1 incentives in February 2009. As of the end of June 2010, all three Program Administrator budgets were fully subscribed for Track 1 incentives. PG&E received sufficient applications to exceed its Track 1 budget in October 2009, followed by SCE in January 2010 and CCSE in June 2010. As a result of these incentive subscriptions, the PAs established waitlists for MASH Track 1 incentives in each program territory. In terms of overall volume, the three program territory waitlists received a total of 56 applications with a combined capacity of 4.4 MW and requested incentive dollars of $16,859,589. Current waitlist status is detailed in Table 4.
The majority of these waitlisted projects have been moved into active status as a result of normal dropout and project size decreases (see Table 4 for territory project dropout averages; note, the general market CSI program has experienced a statewide project dropout average of approximately 20 percent). Active status, as defined in this report, refers to those applications that are either under review, reserved or completed.
Since closing its MASH Track 1 waitlist in April 2010, SCE has been able to move all of its MASH Track 1 waitlist applications into active status and as a result, SCE re-opened its MASH Track 1 waitlist on January 5, 2011 for new MASH Track 1 applications and now has a waitlist.
To access the latest MASH program statistics including waitlist status, customers and stakeholders are encouraged to visit each PA website at the links provided below or the GoSolarCalifornia website.
California Center for Sustainable Energy: https://energycenter.org/index.php/incentive-programs/multifamily-affordable-solar-housing
Pacific Gas & Electric: http://www.pge.com/includes/docs/word_xls/shared/solar/csi/mash_stats.xls
Southern California Edison: http://asset.sce.com/Documents/Shared/MASHStats.xls

4
As shprojeJuly 2two a
DurinapplicTracksix pr
In thein onedid noreceiv
Ince
4.2. M
hown in Tabcts across a2009, and toapplications w
ng the seconcations that k 2 incentiverojects and C
e third applice incentive aot award prove Track 2 f
Proof o
entive Claim Reque
Project Comple
MASH Trac
le 5, a total oall PA territoro date the prwere awarde
nd applicatiomet the prog
e budget for CCSE did no
cation cycle,award totalinojects in the funding.
Reservation Requ
Reservation Res
f Milestones Subm
Reservation Conf
ested (Project Inst
Pending Pay
eted and Incentive
Canc
Withd
Chart 1: Ap
ck 2 Incen
of $8,151,39ries. The firsrogram has hed: one in C
on cycle, SCgram’s standthat cycle froot receive an
CCSE receng $408,000third cycle.
0 10
uested
erved
mitted
irmed
talled)
yment
e Paid
celled
drawn
14
pplications by
ntives
99 has beenst MASH Traheld three cy
CCSE and th
CE received adards and wom $1.83M ny applicatio
eived a total 0. SCE receiv PG&E rece
0 20 30
Num
y Status
awarded toack 2 applicaycles. In thee other in P
a large volumwas granted to $4.73M. P
ons.
of seven apved a total o
eived 1 appli
40 50
mber of Applic
o 13 differentation cycle o initial applicG&E territor
me of Track authority to PG&E award
plications wof four appliccation but it
60 70
cations
t Track 2 opened in cation cycle,ry.
2 increase its ded a total o
hich resultedcations but did not
80 90
of
d
CCSE
PG&E
SCE

15
To assist contractors in improving the quality of their Track 2 projects and increase program participation, the MASH PAs offered workshops in subsequent cycles to affordable housing developers and stakeholders. The workshops were intended to familiarize applicants with the program’s expectations and scoring criteria. The workshops and continued outreach efforts resulted in a total of six awards to date in PG&E territory, four in SCE territory and 2 in SDG&E territory(see Table 5).
Table 5: Summary Data: Total MASH Track 2 Applications by Status
Summary Data (Track 2) CCSE PG&E SCE Total
AWARDED APPLICATIONS
Application (Number) 2 7 4 13
Capacity (MW) 0.115 0.513 0.699 1.327
Incentives ($ Million) $820,000 $2,598,023 $4,733,376 $8,151,399
Incentive Budget Remaining $1,240,000 $6,141,977 $4,466,624 $11,848,601 Data: October 16, 2008 – December 31, 2010 Note: All system capacity measured in CEC-AC MW.
4.3. MASH Track 1 Activity
The charts and tables in this section illustrate detailed MASH Track 1 activity based on several data points such as application status, number of active applications, system capacity and incentive dollars. Active status is defined as applications that are either under review, reserved or completed. As shown in Table 6, there are currently 10 MW reserved and 1.28MW of capacity under review for Track 1A incentives, designed to serve common area load. SCE and CCSE have currently no applications on their waitlists, however PG&E is still managing about 2 MW of waitlisted applications worth $7.5 million. So far, 789 kW of solar has been completed under Track 1A.

16
Table 6: Detailed Data: MASH Track 1A (Common Area) Applications by Status
CCSE PG&E SCE Total UNDER REVIEW Capacity (MW) 0 0.227 1.021 1.248 Incentives $0 $557,483 $4,091,541 $4,649,024 RESERVED
Capacity (MW) 0.259 4.823 4.990 10.072
Incentives $856,090 $15,006,532 $16,400,105 $32,262,727
COMPLETED
Capacity (MW) 0.090 0.489 0.210 0.789 Incentives $298,400 $1,502,544 $668,955 $2,469,899 WAITLISTED Capacity (MW) 0 2.022 0 2.022 Incentives $0 $7,527,597 $0 $7,527,597 Data: October 16, 2008 – December 31, 2010 Note: All system capacity measured in CEC-AC MW As shown in Table 7, there are 1.1 MW reserved and nearly 6.5 MW of capacity under review for Track 1B incentives, designed to offset load for tenant units. So far, 1.2 MW of solar projects have been completed under Track 1B. The greater volume of activity in this section indicates that with the right incentive structure, building owners are willing to install solar systems that offset tenants’ electricity. For this track, CCSE has a waitlist of 1.2 MW, worth $4.8 million in incentives, and PG&E has a waitlist of almost 1.2 MW, worth $4.5 million.
UNDCapa
Incen
RESECapa
Incen
COMCapaTotal WAITCapaIncenData: ONote: A
Chartrange
1
1
2
2
3
3
4
4
5
Table 7: D
ER REVIEWcity (MW)
tives
ERVED
city (MW)
tives
MPLETED city (MW) Incentives
TLISTED city (MW) tives
October 16, 2008All system capac
t 2 indicatese of 30 to 10
0%
5%
10%
15%
20%
25%
30%
35%
40%
45%
50%
<10
Detailed Da
W
8 – December 31ity measured in C
s that a signi00 kW CEC-A
10‐30
Sys
ata: MASH Tr
,2010 CEC-AC MW
Chart 2: Pro
ficant portioAC, with an
30‐100
stem Size (CEC
17
rack 1B (Ten
CCSE
0
$0
1.4
$5,936,0
0.172$686,15
1.2 $4,844,1
ojects by Syst
n of projectsaverage pro
100‐300
C‐AC kW)
nant) Appli
E PG
0.0
$421
3.1
001 $12,10
0.552 $2,00
1.196 $4,48
tem Size
s across all Poject size of
0
20
40
60
80
10
12
14
16
18
>300
cations by S
G&E
049
1,604 $4
194
03,739 $7
546 01,016 $1
178 87,796
PA territories62kW.
0
0
0
0
00
20
40
60
80
% of Projec
# of Projec
Status
SCE
1.055
,099,910
1.903
,502,682 $
0.490 ,892,839
0 $0
s are in the
cts
cts
Total
1.104
$4,521,514
6.497 $25,542,422
1.208 $4,580,007
2.3 $9,331,992

Chartcost psystewhereoppobe lesthat happlicthat aproje
$
$
$
$
$
$1
$1
$/Watt B
efore Incentive
Chart 3
t 3 shows soper watt, sys
ems larger the economiessite is true inss expensivhave been ccation statusare < 100kWct >100kW a
$0.00
$2.00
$4.00
$6.00
$8.00
10.00
12.00
3: Average Co
ome cost vastems less thhan 100 kW.s of scale len PG&E ande than largeompleted ors. The chart
W. SCE incluand 33 <100
CCSE
ost per Watt b
riability betwhan 100 kW This is conad to cost ef
d SCE territoer systems. Dr are in pendabove inclu
udes 2 proje0kW.
PG&
18
by Project Siz
ween the PAW CEC-AC co
nsistent with fficiencies in
ories, where Data pulled fding paymendes 1 CCSEcts > 100kW
&E
ze
A territories. Lost more in Cthe general
n larger systesystems les
for Chart 3 cnt. Please reE project >10W and 7 <100
SCE
Looking at thCCSE territo market CSIems. Howess than 100 consists of peference Cha00kW and 6 0kW. PG&E
<100
>100
he average ory than I program, ver, the kW tend to rojects art 1 for projects includes 1

19
5. Conclusions
• A total of $7,049,906 in incentives has been disbursed and 2.031 MW of capacity have been installed through Track 1, with an additional 18.947 MW of capacity expected from active reservations.
• A total of $8,151,339 and 1.327 MW of capacity have been awarded through Track 2.
• The rapid success of Track 1 incentives and the extensive Track 1 application waitlist demonstrates high market demand for Track 1 at current incentive amounts. The PA’s support a proposal to reallocate unreserved funds from the MASH Track 2 incentive program or other funding sources into the Track 1 incentive program to enable waitlisted applications to move forward with their PV installation, thus increase the adoption of PV by the multifamily affordable housing community.