ad-a012 373 - dtic · tamb tamb deg. f ambient temperature at altitude. tamb, tambi deg. f ambient...
TRANSCRIPT
AD-A012 373
COMMERCIAL AIRCRAFT NOISE DEFINITION.- L-1011 TRISTAR.VOLUME III - PROGRAM USER'S MANUAL
Lockheed-California Company
Prepared for:
Federal Aviation Administration
September 1974
DISTRIBUTED BY:
National Technical Information ServiceU. S. DEPARTMENT OF COMMERCE
Report No. FAA-EQ-73-6,111206046
COMMERCIAL AIRCRAFT NOISE DEFINITION-L4011 TRISTAR
q ,Volume Ill-Program User's Manua!
C Natha Shapiro, et al
"Lockheed Calfoiiia Company
A Division of Lockheed Ahkaft CorporationP.O. Box 551
Burbank, California 91520
D D
241975
LO L:5UD1EC
SEPTEMBER 1974 D
FINAL REPORT
C, •'.••"v
"U.S. DEPARTMENT OF TRANSPORTATIONE AVIATION AOMMlSTRATON
Ofte of Evirarmatl Quaity
WashlqtnS, HC. 20591

BestAvai~lable
Copy
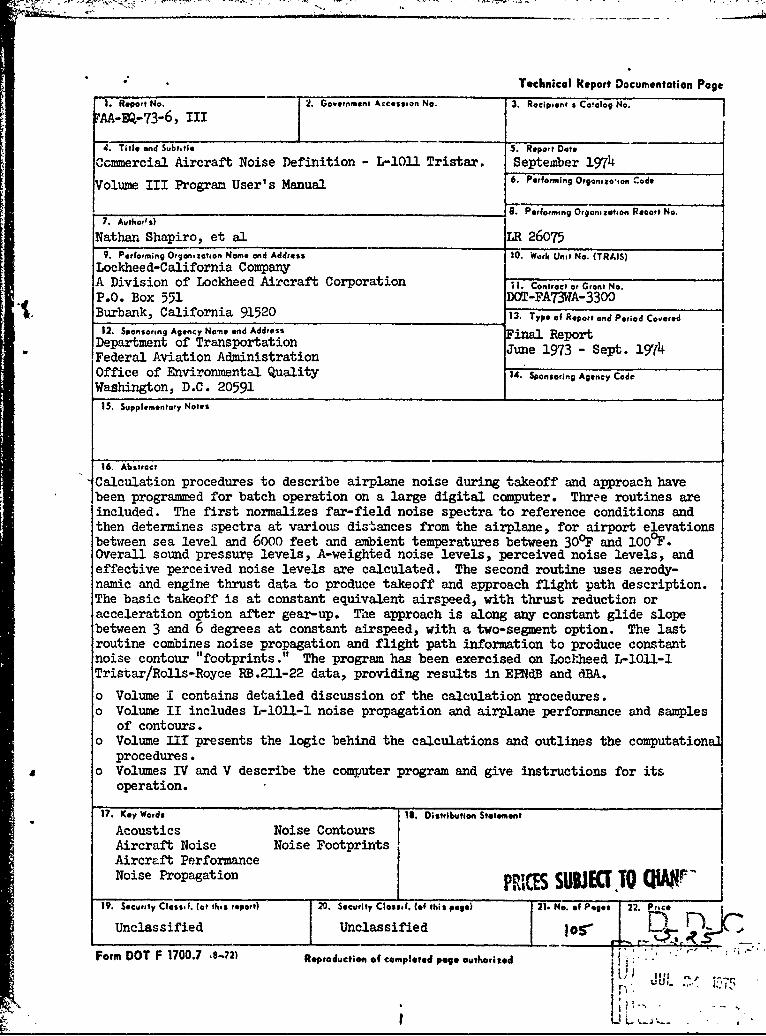
Technical Report Documentation Page
1. Report No. 2. Government Accession No. 3. Recipient s Catalog No.rAA-Eq-73"6, II I I4. Title and Subtitle 5. Report Date
Ccmmercial Aircraft Noise Definition - L-lOl1 Tristar. September 1974
Volume III Program Userts Manual 6. Performing Organso.,on 'ode
7. _ _ _ _ _ _ __ g 11. Performing Organization Revort No.7. Autkor/s)I
Nathan Shapiro, et al LR 260759. Performing Organzaoton Name and Address 10 . Work Unit No. (TRAIS)
Lockheed-California CompanyA Division of Lockheed Aircraft Corporation 11. Contract or Grant No.
P.O. Box 551 DOT-FA73WA-3300"I. Burbank, California 91520 13. Type of Report and Period Covered
12. Sponsoring Agency No-e and Address Final ReportDepartment of Transportation Fina R eptFederal Aviation Administration June 1973 - Sept. 1974Office of Environmental Quality 14. Sponsoring Agency Code
Washington, D.C. 2059115. Supplementay Notes
16. Abstract
Calculation procedures to describe airplane noise during takeoff and approach havebeen programmed for batch operation on a large digital computer. Three routines areincluded. The first normalizes far-field noise spectra to reference conditions andthen determines spectra at various distances from the airplane, for airport elevationsbetween sea level and 6000 feet and ambient temperatures between 30OF and 1000F.Overall sound pressure levels, A-weighted noise levels, perceived noise levels, andeffective perceived noise levels are calculated. The second routine uses aerody-namic and engine thrust data to produce takeoff and approach flight path description.The basic takeoff is at constant equivalent airspeed, with thrust reduction oracceleration option after gear-up. The approach is along any constant glide slopebetween 3 and 6 degrees at constant airspeed, with a two-segment option. The lastroutine combines noise propagation and flight path information to produce constantnoise contour "footprints ." The program has been exercised on Loclheed L-lOll-1Tristar/Rolls-Royce RB.211-22 data, providing results in EPNdB and dBA.
"o Volume I contains detailed discussion of the calculation procedures."o Volume II includes L-lOll-1 noise propagation and airplane performance and samples
of contours."o Volume flr presents the logic behind the calculations and outlines the computational
procedures.o Volumes IV and V describe the computer program and give instructions for its
operation.
17. Key Words I18. D•strlbutlon Stetement
Acoustics Noise ContoursAircraft Noise Noise FootprintsAircraft PerformanceNoise Propagation
19. seuiy2asl a hsrpr)-0. Security Classol. (of this page) 21. No. of Poeges 22. SeuiyCasl (ttu eot P IE U Jr o iAt~Unclassified Unclassified
Form DOT F 1700.7 8-72) Reproductiom of completed poge outhorized itt" '
1K u .... :'5
U.'

TABLE OF CONTENTS
Section Page
FIGURES ii
NOMENCLATURE iii
1 INTRODUCTION 1-1
2 PROGRAM CAPABILITIES 2-1
3 MATHEMATICAL MODEL 3-1
3.1 NOISE PROPAGATION 3-2
3.1.1 Propagation Input Parameters 3-33.1.2 Propagation Calculation 3-3
3.2 TAKEOFF PERFO1MANCE 3-7
3.2.1 Brake Release to Rotation 3-83.2.2 Rotation to Liftoff 3-93.2.3 Liftoff to 35 Feet 3-93.2.4 35 Feet to Gear Up 3-93.2.5 Three Flight Options After Gear Up 3-10
3.3 APPROACH PERFORMANCE 3-18
3.4 NOISE FOOTPRINT 3-20
3.4.1 Footprint Input Parameters 3-203.4.2 Footprint Calculation 3-21
3.5 FLOW DIAGRAM 3-23
4 PROGRAM APPLICATION 4-1
4.1 SUBSTANTIATION WITH FLIGHT TEST DATA 4-2
4.2 TYPICAL PROGRAM USE - SAMPLE CASES 4-8
4.2.1 Noise Data Generation - Noise 4-9Propagation Program
4.2.2 Climb Noise 4-334.2.3 Approach Noise 4-49
5 SUMMARY 5-1
REFERENCES R-1
14/
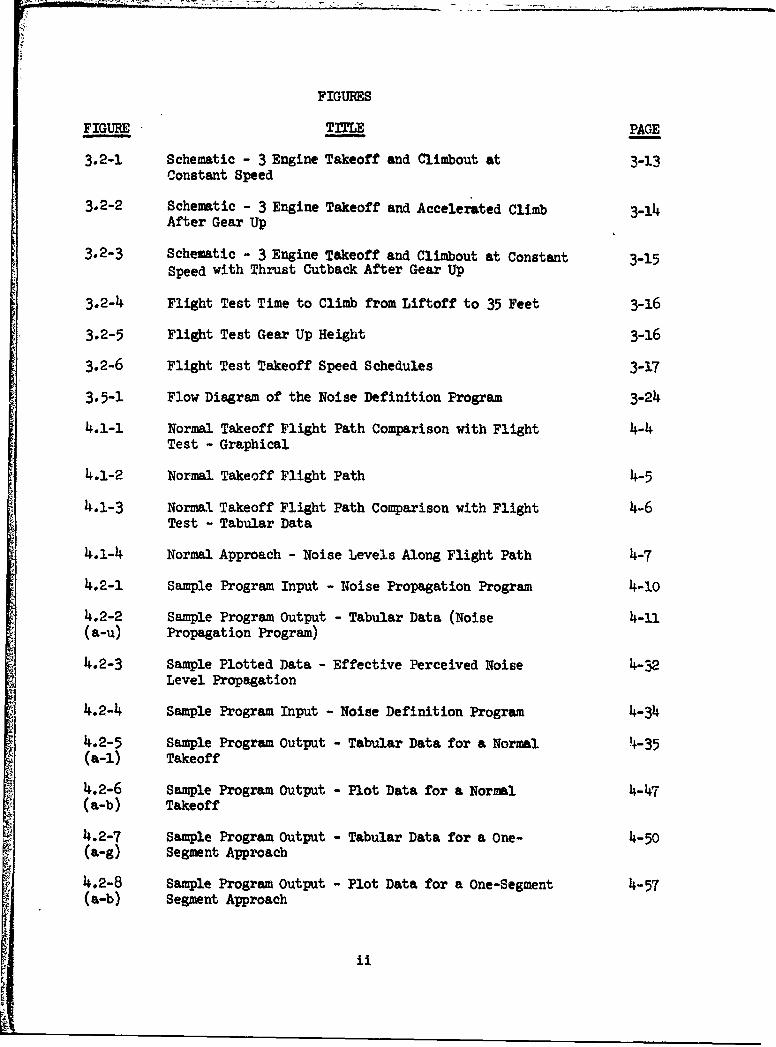
FIGURES
FIGURE TITLE PAGE
3.2-1 Schematic - 3 Engine Takeoff and Climbout at 3-13Constant Speed
3.2-2 Schematic - 3 Engine Takeoff and Accelerated Climb 3-14After Gear Up
3.2-3 Schematic - 3 Engine Takeoff and Climbout at Constant 3-15Speed with Thrust Cutback After Gear Up
3.2-4 Flight Test Time to Climb from Liftoff to 35 Feet 3-16
3.2-5 Flight Test Gear Up Height 3-16
3.2-6 Flight Test Takeoff Speed Schedules 3-17
3.5-1 Flow Diagram of the Noise Definition Program 3-24
4.1-1 Normal Takeoff Flight Path Comparison with Flight 4-4Test - Graphical
4.1-2 Normal Takeoff Flight Path 4-5
4.1-3 Normal Takeoff Flight Path Comparison with Flight 4-6Test - Tabular Data
4.1-4 Normal Approach - Noise Levels Along Flight Path 4-7
4.2-1 Sample Program Input - Noise Propagation Program 4-10
4.2-2 Sample Program Output - Tabular Data (Noise 4-n1(a-u) Propagation Program)
4.2-3 Sample Plotted Data - Effective Perceived Noise 4-32Level Propagation
4.2-4 Sample Program Input - Noise Definition Program 4-34
4.2-5 Sample Program Output - Tabular Data for a Normal 4-35(a-l) Takeoff
4.2-6 Sample Program Output - Plot Data for a Normal 4-47(a-b) Takeoff
4.2-7 Sample Program Output - Tabular Data for a One- 4-50(a-g) Segment Approach
4.2-8 Sample Program Output - Plot Data for a One-Segment 4-57(a-b) Segment Approach
ii
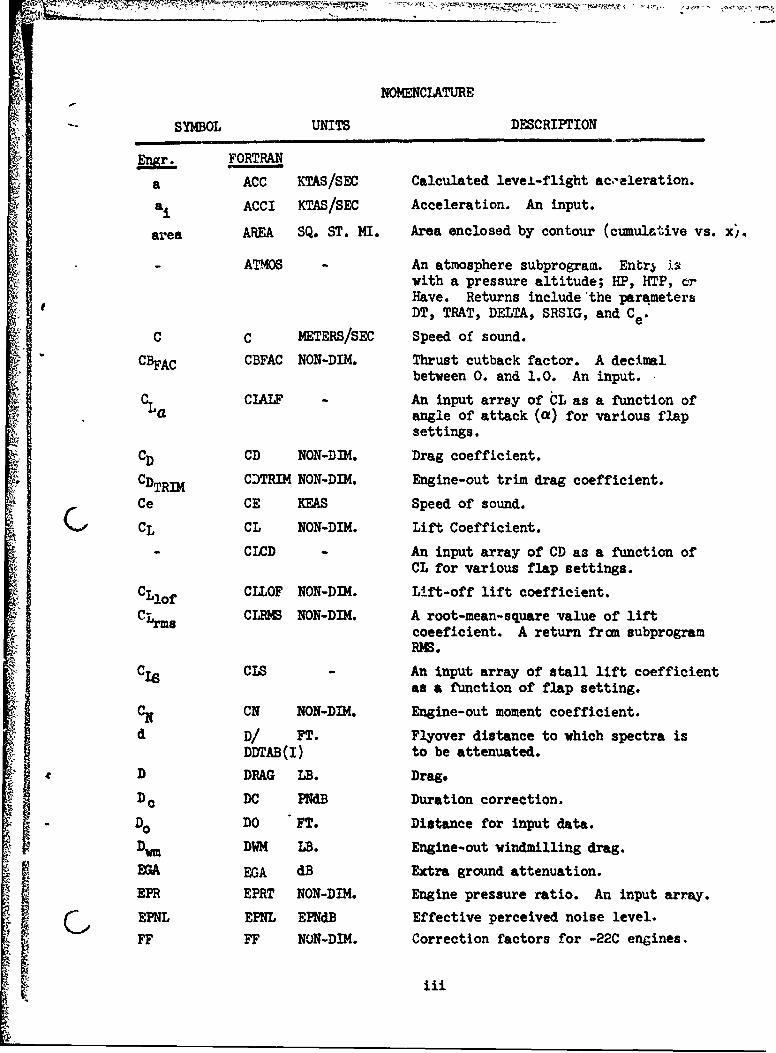
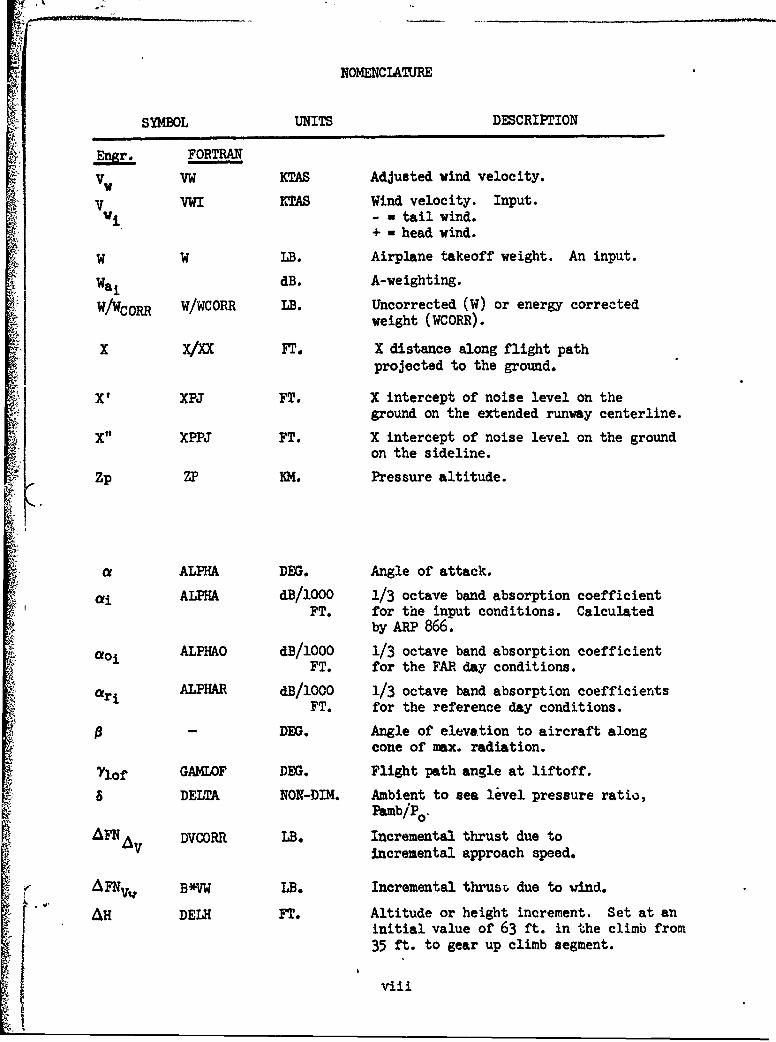
NOMENCLATURE
"SYMBOL UNITS DESCRIPTION
EnII FORTRAN,
a ACC KTAS/SEC Calculated level-flight ac,-eleration.
a, ACCI KTAS/SEC Acceleration. An input.
area AREA SQ. ST. MI. Area enclosed by contour (cumulative vs. x).
ATMOS - An atmosphere subprogram. Entrý i"with a pressure altitude; HP, HTP, orHave. Returns include the parametersDT, TRAT, DELTA, SRSIG, and Ce.
C C METERS/SEC Speed of sound.
CBFAC CBFAC NON-DIM. Thrust cutback factor. A decimalbetween 0. and 1.0. An input.
C CIALF - An input array of CL as a function ofLa angle of attack (a) for various flap
settings.
CD CD NON-DIM. Drag coefficient.
CDTRIM CDTRIM NON-DIM. Engine-out trim drag coefficient.
Ce CE KEAS Speed of sound.
SCL CL NON-DIM. Lift Coefficient.
CLCD - An input array of CD as a function ofCL for various flap settings.
CLlof CLLOF NON-DIM. Lift-off lift coefficient.
C-rms CLRMS NON-DIM. A root-mean-square value of liftcoeeficient. A return fron subprogramRMS.
C CiS - An input array of stall lift coefficientas a function of flap setting.
CN CN NON-DIM. Engine-out moment coefficient.
d D/ FT. Flyover distance to which spectra isDDTAB(I) to be attenuated.
D DRAG LB. Drag*
Do DC PNdB Duration correction.
Do DO FT. Distance for input data.
Dwm DWM LB. Engine-out windmilling drag.EGA EGA dB Extra ground attenuation.
EPR EPRT NON-DIM. Engine pressure ratio. An input array.EPNL EPNL EPNdB Effective perceived noise level.FF FF NON-DIM. Correction factors for -22C engines.
iii
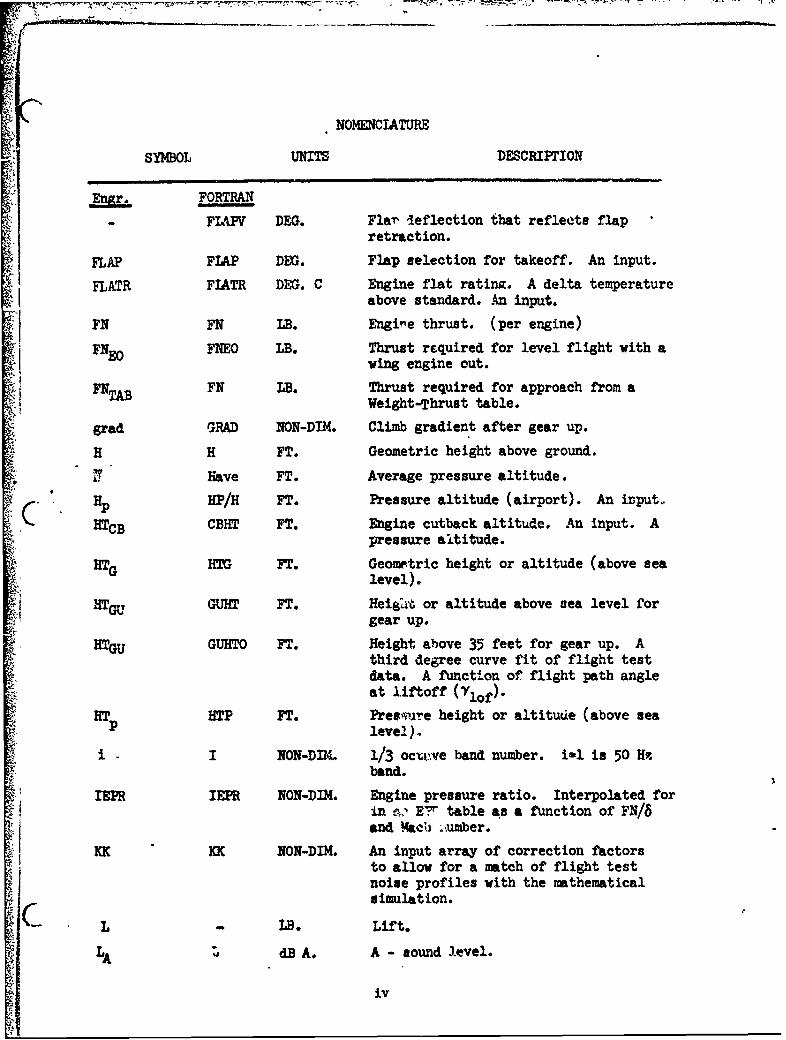
NOMENCLATURE
SYMBOL UNITS DESCRIPTION
Engr. FORTRAN
- FIAPV DEG. Flar leflection that reflects flapretraction.
FLAP FLAP DEG. Flap selection for takeoff. An input.
FLATR FIATR DEG. C Engine flat rating. A delta temperatureabove standard. An input.
FN FN LB. Engire thrust. (per engine)
FNEo FNEO LB. Thrust required for level flight with awing engine out.
FNTAB FN LB. Thrust required for approach from aWeight-Thrust table.
grad GRAD NON-DIM. Climb gradient after gear up.
H H FT. Geometric height above ground.
lip, Have FT. Average pressure altitude.
SHP/H FT. Pressure altitude (airport). An input.
HTcB CBHT FT. Engine cutback altitude. An input. Apressure altitude.
HTG HTG FT. Geometric height or altitude (above sealevel).
HTGu GUHT FT. Heigat or altitude above sea level forgear up.
HTGU GUHTO FT. Height above 35 feet for gear up. Athird degree curve fit of flight testdata. A function of flight path angleat liftoff (1of).
HT p HTP FT. fresure height or altitude (above sealevel).
i I NON-DIM. 1/3 ocvve band number. i-1 is 50 Hrband.
IEPR IEPR NON-DIM. Engine pressure ratio. Interpolated forin e E?r table as a function of FN/6and .kaeh ,umber.
KK KK NON-DIM. An input array of correction factorsto allow for a match of flight testnoise profiles with the mathematicalsimulation.
L - LB. Lift.
LA u dB A. A - sound level.
iv
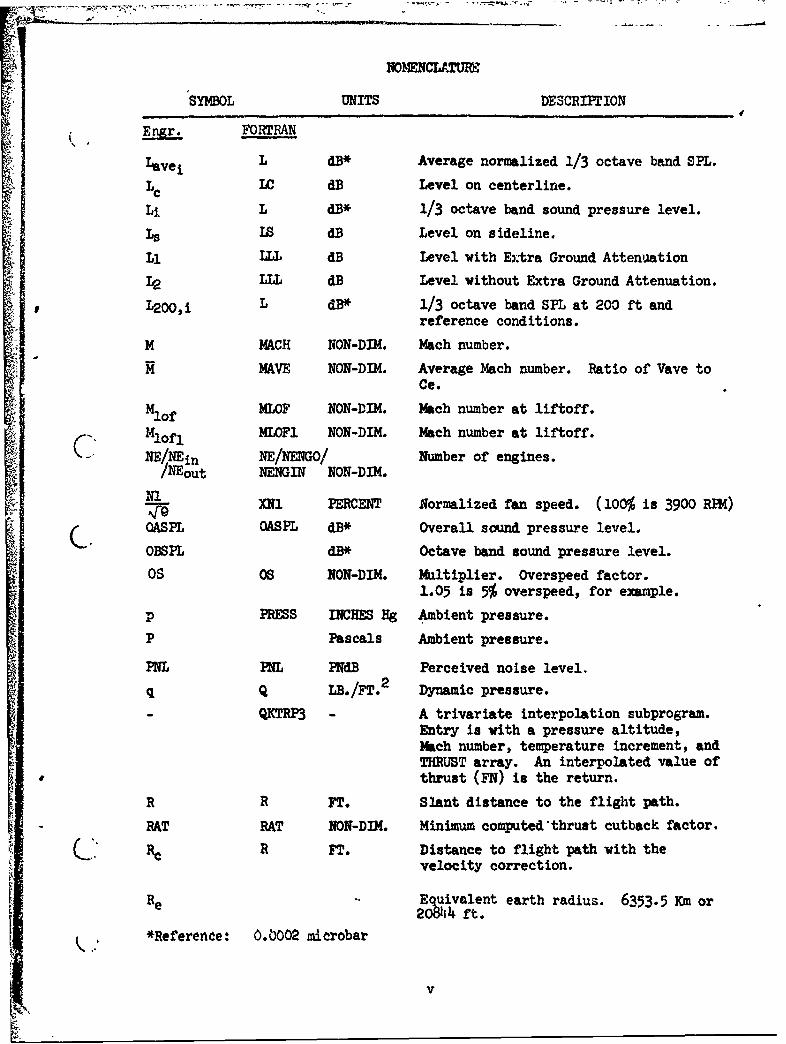
NOMENCLATURE
SYMBOL UNITS DESCRIPTION
Engr. FORTRAN
Lavei L dB* Average normalized 1/3 octave band SPL.
LC IC dB Level on centerline.
Li L dB* 1/3 octave band sound pressure level.
Ls Is dB Level on sideline.
Li ILL dB Level with Extra Ground Attenuation
L2 LLL dB Level without Extra Ground Attenuation.L200,i L dB* 1/3 octave band SPL at 200 ft and
reference conditions.
M MACH NON-DIM. Mach number.
MAVE NON-DIM. Average Mach number. Ratio of Vave toCe.
M1 of MLOF NON-DIM. Mach number at liftoff.
14ofl MLOF1 NON-DIM. Mach number at liftoff.
NE/NEin NE/NENGO/ Number of engines./NEout NENGIN NON-DIM.
NIA- XNl PERCENT Normalized fan speed. (100% is 3900 RPM), OASPL OASPL dB* Overall sound pressure level.
OBSPL dB* Octave band sound pressure level.
0S OS NON-DIM. Multiplier. Overspeed factor.1.05 is 5% overspeed, for example.
p PRESS INCHES Hg Ambient pressure.
P Pascals Ambient pressure.
PNL PNL PNdB Perceived noise level.
q Q LB./FT.2 Dynamic pressure.
-QKTRP3 - A trivariate interpolation subprogram.Entry is with a pressure altitude,Mach number, temperature increment, andTHRUST array. An interpolated value ofthrust (FN) is the return.
R R FT. Slant distance to the flight path.
RAT RAT NON-DIM. Minimum computed*thrust cutback factor.
(j R FT. Distance to flight path with thevelocity correction.
Re Equivalent earth radius. 6353.5 Km orOS ft.
*Reference: 0.0002 microbar
!• v

NOMENCLATURE
SYMBOL UNITS DESCRIPTION
FORTRAN
Relative RLTHUM PERCENT Relative humidity.Humidity
RNS RIM A subprogram which calculates the root-mean-square value of an initial and finalvelocity. The rma velocity is used tocalculate an associated rms value of liftcoefficient, CLrmsr, which is a return fromthe subprogram.
R/C or R/D ROC FT./SEC. Rate-of-climb or rate-of-descent. Tapeline.
R, R1 FT. Distance to flight path for a givenlevel without EGA.
R2 R2 FT. Distance to flight path for a givenlevel with EGA.
S 3 FT2 Wing area. (3456 FT2 ). An input.
SA FT. Downrange distance during groundacceleration from brake release torotation.
Sc SC FT. Downrange distance during climb fromliftoff to 35 feet.
Sclmb SCIMB FT. Incremental downrange distance duringgear up climb.
SGU TSGU FT. Downrange distance for the climbsegment from 35 ft. to gear up.
STOT TDIST FT. Total downrange distance.Sr SR FT. Downrange distance during ground
acceleration from rotation to liftoff.
t TTW DEG. F Ambient temperature.
T TW - DEG. K/LB. Temperature or total thrust.
Tamb TAMB DEG. F Ambient temperature at altitude.
Tamb, TAMBI DEG. F Ambient airport temperature. An input.
Tclm TCLMB SEC. Time to climb from liftoff. A thirddegree curve fit of flight test data.A function of flight path angle atliftoff (-lof).
vi
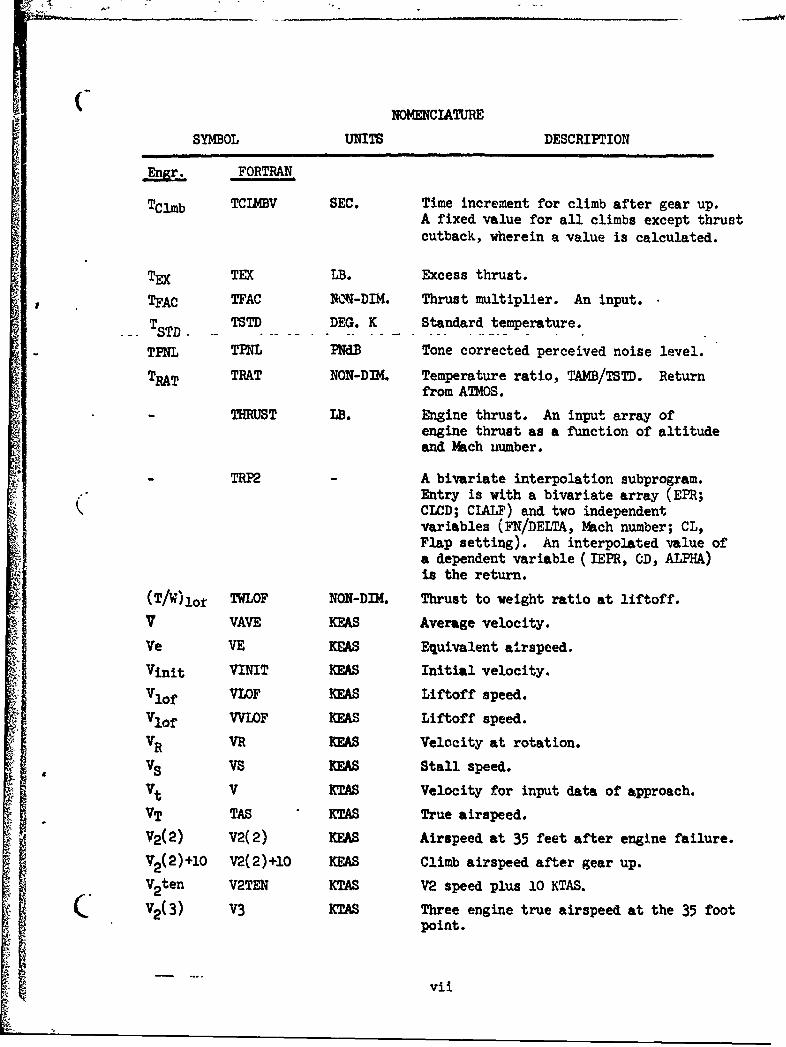
NOMENCLATURE
SYMBOL UNITS DESCRIPTION
gr. FOR N
TClmb TCINBV SEC. Time increment for climb after gear up.A fixed value for all climbs except thrustcutback, wherein a value is calculated.
TEX TEX LB. Excess thrust.
TFAC TFAC NOW-DIM. Thrust multiplier. An input.
TST TSTD DEG. K Standard temperature.
TFNL TPNL PNdB Tone corrected perceived noise level.
TRAT TRAT NON-DIM. Temperature ratio, TAMB/TSTD. Returnfrom ATMOS.
THRUST LB. Engine thrust. An input array ofengine thrust as a function of altitudeand Mach number.
TRP2 A bivariate interpolation subprogram.Entry is with a bivariate array (EPR;CICD; CLALF) and two independentvariables (FN/DELTA, Mach number; CL,Flap setting). An interpolated value ofa dependent variable (IEPR, CD, ALPHA)is the return.
(T/W)lo• TWLOF NON-DIM. Thrust to weight ratio at liftoff.
V VAVE KEAS Average velocity.
Ve VE KEAS Equivalent airspeed.
Vinit VINIT KEAS Initial velocity.
Vlof VLOF KEAS Liftoff speed.Vlof VVLOF KEAS Liftoff speed.
VR VR KEAS Velocity at rotation.
Vs VS KEAS Stall speed.
Vt V KTAS Velocity for input data of approach.
VT TAS KTAS True airspeed.V2 (2) V2(2) KEAS Airspeed at 35 feet after engine failure.
V2 (2)+10 V2(2)+10 KEAS Climb airspeed after gear up.
V2 ten V2TEN KTAS V2 speed plus 10 KTAS.
C V2 (3) V3 KTAS Three engine true airspeed at the 35 footpoint.
vii
NOMENCIATURE
SYMBOL UNITS DESCRIPTION
Engr. FORTRAN
VW VW KTAS Adjusted wind velocity.
V VWI KTAS Wind velocity. Input.Vi - A tail wind.
+ - head wind.
W W LB. Airplane takeoff weight. An input.
Wai dB. A-weighting.
W/WCORR W/WCORR LB. Uncorrected (W) or energy correctedweight (WCORR).
X X/XX FT. X distance along flight pathprojected to the ground.
Xt XPJ FT. X intercept of noise level on theground on the extended runway centerline.
X" XPPJ FT. X intercept of noise level on the groundon the sideline.
Zp ZP KM. Pressure altitude.
ta ALPHA DEG. Angle of attack.
0ai ALPHA dB/iOO0 1/3 octave band absorption coefficientFT. for the input conditions. Calculated
by ARP 866.
aoi ALPHAO dB/iO00 1/3 octave band absorption coefficientFT. for the FAR day conditions.
ari ALPHAR dB/iO00 1/3 octave band absorption coefficientsFT. for the reference day conditions.
- DEG. Angle of elevation to aircraft alongcone of max. radiation.
71of GAMLOF DEG. Flight path angle at liftoff.
8 DELTA NON-DIM. Ambient to sea level pressure ratio,Pamb/Po.
AFN DVCORR LB. Incremental thrust due toincremental approach speed.
SFNVv B*VW LB. Incremental thrusr, due to wind.
AH DELH FT. Altitude or height increment. Set at aninitial value of 63 ft. in the climb from35 ft. to gear up climb segment.
viii
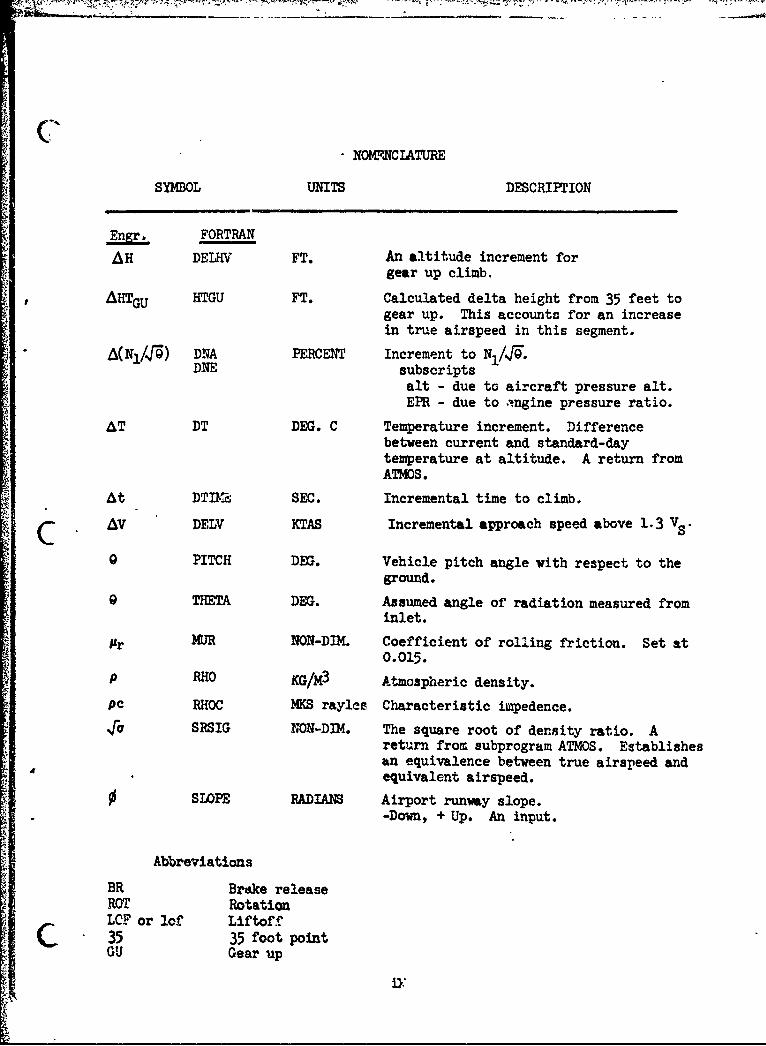
C•NOMRSC IATURE
SYMBOL UNITS DESCRIPTION
Engr. FORTRAN
AH DELII FT. An altitude increment forgear up climb.
AHTGu HTGU FT. Calculated delta height from 35 feet togear up. This accounts for an increasein true airspeed in this segment.
A(Nl/49) DINA PERCENT Increment to NI/T.DNE subscripts
alt - due to aircraft pressure alt.EPR - due to angine pressure ratio.
AT DT DEG. C Temperature increment. Differencebetween current and standard-daytemperature at altitude. A return fromATMOS.
At DTDS SEC. Incremental time to climb.
C AV DELV KTAS Incremental approach speed above 1.3 VS.
0 PITCH DEG. Vehicle pitch angle with respect to theground.
0 THETA DEG. Assumed angle of radiation measured frominlet.
Ar MUR NON-DIM. Coefficient of rolling friction. Set at0.015.
p RHO KG/M 3 Atmospheric density.
pc RHOC MKS raylce Characteristic impedence.SRSIG NON-DIM. The square root of density ratio. A
return from subprogram ATMOS. Establishesan equivalence between true airspeed andequivalent airspeed.
SLOPE RADLAM• Airport runway slope.-Down, + Up. An input.
Abbreviations
BR Brake releaseROT RotationLOF or lof Liftoff
C 35 35 foot pointGU Gear up
ni.
SECTION 1
INTRODUCTION
The detailed discussion of the procedures and calculations for determining the
noise patterns resulting from takeoff and approach operations of a commercial
transport is presented in Volume I of this five-volume report. Performance
anO. noise data for the Lockheed L-101-I Tristar are contained in Volume II.
This Volume III presents a description of the logic and the procedures for the
noise definition calculations which have been developed into a digital-computer
program. Sufficient detail is included to permit judgments to be made regard-
ing the applicability of the program to any particular noise study.
The aircraft noise definition analysis described he:e starts with the airplane/
engine's far field noise signature in the form of one-third octave band sound
pressure level spectra at a reference distance from the airplav,, at a refer-
ence airport elevation, ambient temperature, and relative humidity. Then thenoise versus distance-from-airplane characteristics may be calculated and used
in conjunction with the airplane's distance irom any desired point on the
ground to determine the noise level at that point. The airplane's distance is
provided by the performance subroutine which generat',s either the takeoff or
approach flight path. Ground noise patterns are generally produced as noise
directly under the airplane as a function of distance from an airport refer-
ence point or as constant noise contours (footprints) at preselected noise
levels. The airp]ane performance calculations are based on normal takeoff
and approach operating procedures. However, sufficient flexibility has been
included to permit noise evaluations of variations in operational procedures.
ii-
SECTION 2
PROGRAM CAPABILITIES
A purpose of the Comnercial Aircraft Noise Definition study reported in theseveral volumes of this report is to develop and illustrate a computational
procedure which will produce the noise patterns on the ground produced during
takeoff and landing operations of an airplane in the vicinity of an airport.These noise patterns may then be used for comparing airplanes, for evaluatingoperational procedures, and for integrating into the total noise impact ofthe air traffic at an airport. The computational procedure consists of twoparts, or subroutines, each providing independent output data which may be
used by themselves or used as input to the noise pattern calculations. These
subroutines produce noise propagation data and airplane performance, takeoff
or approach, data for use in the footprint routine which produces the noise
patterns.
The noise propagation calculation subroutine provides a means for determining
far-field noise source characteristics, or signatures, from measured or pre-dicted acoustic spectra and for calculating noise versus distance data fromthese signatures. The acoustic signature generation may be accomplished frommeasured or calculated noise spectra and durations at any far-field distancefrom the airplane and at any atmospheric conditions within the scope of SAEARP 866 (Reference 1 ) and at any engine thrust condition. These spectra and
durations are normalized to a 200 foot flyover distance from the airplane ona FAR Part 36 reference day (sea level, T70 F, 70% relative humidity). Thisportion of the calculation routine thus provides a procedure for normalizirg
flyover noise measurement data to reference conditions. If noise at severalthrust settings is available, then the dependence of noise on thrust atreference conditions is available. The noise is in the form of one-third-octave or octave band spectra, overall level, A-weighted noise level, perceived
noise level, and effective perceived noise level. If other noise weighting
are desired, then they may be introduced into the calculation program. The
remainder of the calculation procedure determines, starting with the 200 foot
spectral signatures, noise versus distance at ary atmospheric conditions
2-1
V,
specified and for all the noise level forms above. A complete description
then exists for the noise characteristics of the airplane/engine and of the
noise propagation characteristics at any atmospheric conditions at airport
elevations from sea level to 6000 feet.
The airplane performance subroutine is comprised of two separate routines.
The takeoff section provides the necessary data in the form of geometric
altitude, distance from brake release, speed, engine data Nl/9rV for input
to the footprint program. The approach section provides the same data,
except that distance to threshold is used. When used as part of a combined
program, these performance sections provide the data to the footprint pro-
gram for the bpecific cases required (see Section 4.2, Figure 4.2-3). These
data can also be output in tabular form alone (see Section 4.2, page 4-38)
without any output from the footprint program.
Three specific types of' takeoff flight profiles can be produced. One is a
takeoff and climbout at constant velocity after gear up; another is a takeoff
and climbout with an accelerated climb after gear up; the third is a takeoff
and climbout with the option of a thrust cutback after gear up. Approach
may be along any glide slope between 3 and 6 degrees or may be a two-seg-
ment maneuver with the two glide slopes intersecting at any predetermined
altitude.
The noise footprint routine combines airplane flight path data with noise
propagation data in the calculation of noise on the ground during takeoff
and approach maneuvers. The flight path and propagation data may be the
output of the program subroutines discussed above or may be available from
other sources. The footprint program calculates noise directly under the
flight path and along a sideline one-quarter nautical mile from the flight
path projection and calculates the coordinates of points on the ground where
any specified maximum noise levels are attained. Constant noise contours for
the specified maximum levels may then be drawn through the calculated points
either by hand or by means of a machine plotting routine. The specified
noise levels may be any physical, weighted, or computed levels for which
propagation information is available, either from the noise propagation
routine or from some other source.
2-2
An integration for area within a contour is performed when the maximum noise
point coordinates are being calculated and the total area enclosed by a given
contour accompanies the contour closing point. lontour-enclosed areas provide
an indication of comunity exposure to various levels of noise during operation
of an airplane. They may also be used for evaluating the impact of airplane
variations, such as weights and flap angles, and for studying the effects of
procedural variations, such as takeoff thrust cutback and two segment approach.
The footprint data, as well as the noise propagation data, may also be used
for inclusion in calculations of cumulative noise exposures resulting from the
total siz traffic at an airport during any period a,:' time.
The aircraft noise definition program discussed above is believed to be a
comprehensive and powerful tool for noise studies of airplane operations in
the vicinity of airports.
2-3
SECTION 3
MATHMMTICAL MODEL
The calculation of the noise patterns for an airplane flyover is done by a
series of routines. The noise propagation routine starts with a far-field
input spectrum or a group of spectra, either measured or predicted, and adds
appropriate attenuation to get noise versus distance from the noise source.
The noise ma; be shown as A-noise level, perceived noise level, effective
perceived noise level (References 2 and. 3 ), or some other weighted level or
subjective noise measure. A noise versus distance propagation characteristic
is determined for various engine thrust settings in the range of interest.
The performance routine is used to calculate the takeoff or the approach
flight paths, including the airplane velocity and the engine power setting.
Included in the takeoff portion of the routine are options for thrust cut-
back or for airplane acceleration during climb after gear up. The approach
portion of the routine incorporates the capability for use of any glide
slope between 30 and 60 and for the use of a two segment approach. The
equations and methods deve3 'ped by the Lockheed-California Company Commercial
Engineering Flight Test organization (Reference 14) were used and adapted for
the performance routine.
Finally, the footprint routine utilizes distances from the airplane flight
path, from the performance subroutine, and noise versus distance, from the
noise propagation subroutine, to calculate the coordinates of constant noise
positions on the ground and generates the plots of the constant noise
contours. In Section 3.5 a general flow diagram cr the complete computation
program is presented as an aid toward understanding the interplay among the
several routines.
3-1
3.1 NOISE PROPAGATION
The noise propagation subroutine calculates noise levels versus distance, for
a given set of conditions of airport elevation, ambient temperature, and
relative humidity using spherical spreading (inverse square) attenuation and
extra air attenuation (EAA) due to atmospheric absorption as defined in the
proposed revision to SAE ARP 866 (Reference 5 ). The calculation is done both
without and with extra ground attenuation, using a mathematical model of SAE
AIR 923 (Reference 6 ), to provide propagation characteristics for the two
extreme cases of essentially vertical noise paths from the airplane and of a
horizontal path close to the ground. A homogeneous atmosphere is assumed;
i.e. temperature and relative humidity are constant over the entire noise
path. For the over-the-ground propagation calculation, shielding of the noise
from far-side engines by turbulent exhaust from near-side engines is assumed,
and only half the number of engines is considered as contributing to the noise.
The levels calculated by the subroutine are one-third octave-band sound
pressure levels (SPL), overall sound pressure level (CkSPL), and octave-band
sound pressure levels (OBSPL), in units of dB re 0.0002 microbar; A-weighted
noise level (LA), in dBA; perceived noise level (PZL) and tone-corrected
perceived noise level (PNLT) in PNdB; and effective perceived noise level
(EPUL) in EPNdB. Noise signatures for the airplane/engine noise source are
first required, at any distance from the source and at any meteorological
conditions included in ARP 866, in the form of one-third octave-band sound
pressure levels. These may be measured or calculated spectra. These signa-
ture spectra are normalized to a 200 foot from noise source sideline distance
for a FAR Part 36 reference day (sea level, 770 F, 70% relative humidity) and
then averaged. The averaged, normalized spectrum may then be modified to
any other set of conditions and to various specified distances, calculating
the noise levels listed above. Normally distances of 200, 370, 800, 1600,
3200, 6o00, and 12,800 feet are specified, but other diLtances may be used.
Distances of less than 200 feet should be avoided, partir:ularly with large
engines, since these may be in the near field where the far-field propagation
0-2
assumption of the program will not be valid. If noise signature data are
available for various engine thrust settings, then a noise versus distance
calculation will be carried out for each specified thrust condition.
3.1.1 Propagation Input Parameters
For each set of conditions for which data are available for normalization
to 200 foot noise signatures, the following inputs are needed: measured or
predicted one-third octave-band spectra, temperature in degrees Fahrenheit,
relative humidity, atmospheric pressure in inches of mercury, number of
engines, distance to source (flyover or radial), angle of noise radiation,
aircraft velocity in KEAS, and duration correction. For each set of output
conditions for the noise propagation calculation it is necessary to specify
a table of distances for which attenuations are to be calculated, number -f
engines, lower and upper frequency band for which tone corrections are to be
allowed, pressure altitude at the airport elevation, temperature deviation
from ISA standard in degrees Centigrade, and relative humidity. As many
input spectra as available may be entered and averaged, and as many sets of
output conditions as desired may be run for each case.
3.1.2 Propagation Calculation
The subroutine takes each input spectrum and eaca spectrum developed in the
course of the calculations and calculates OASPL, LA, PNL, PULT, OBSPL, and
EPNL. The overall sound pressure level is calculated by summing the one-
third octave-band levels logarithmically.
Accordingly,
OASPL = 10 LOG 2410 E. anti" n (TLi/lO) (3.1-1)il
The A-noise level is calculated in a similar manner to OASPL after the A-weighting values from IEC 179-1965 (Reference 2) are added to each one-
third octave-band level.
=LA 10 LOG 24 /+El A 10 E antilog N .L i) (3.1-2)
3-3
Perceived noise level and tone-corrected perceived noise level are calculated
by the method outlined in PAR Part 36, Appexdix B (Reference 3). The octave
band sound pressure levels are calculated logarithmically, summing the one-
third octave-band levels in groups of three.
3k0BsPLk = 10 olo z atilog (Li/lO) dB (3.1-3)
i = 3k-2
for k = i, 2, .. 8,
The subroutine will, for each case, take any number of one-third octave band
spectra at the given conditions and normalize them to 200 feet, FAR Part 36
reference day, for t h e specified number of engines and then take an average
of the normalized spectra, duration corrections, and radiation angles. If the
input distance is a radial distance to the aircraft, it is converted to fly-
over distance by multiplying by sin 0. To normalize the spectra:
L i = Li + 20 LOG 10 (Do/20) + (Do - 200) / (1000 sin 9) Mi
+ (200/(1000 sin e)) ( c -toi)+ LpcO + LOG N dB (3.1-4)
where: D is the input flyover distance ft.0
is the radiation angle deg.i.is the absorption coefficient for the input conditions dB/loOOft.
calculated from the temperature and relative humidity as inARP 866 (Reference 3)
Oroi is the absorption coefficient for the FAR day dB/100ft.
i is the one-third octave-band number(50 Hz band is number 1)
LPco is 10 LOG1 0 (410/Pc) for the test conditions
ALOG N is the adjustment factor for the number of engines, equal
(to 1lOG 10o (•1o0dt/lin)
Pc is calculated from the input temperature (t) and pressure (p)using the following relationships derived from the ideal gas
Slaws Rayles
T - (t + )459.67)/1.8 to convert from OF to OK.
P - 3386.39 p to convert from inches of mercury to Pascals
3-4
p = P/(287.053 T) is the density kilograms/meter 3
c -401.874 T is the speed of sound meters/sec
To i:ormalize the duration correction to 200 feet and 160 knots add 10 LOGo
(1.25 V/Do). If there is more than one spectrum, the average is found by
Lave,i= 0 k = 1 10 (Li,k/lO)] /n (3.1-5)
where i is the band number and k is the spectrum number. The noise radiationangles (e) and the duration corrections are also averaged, but they are
averaged arithmetically. If the input spectra are for a 200 foot FAR day,
then thfý spectra are already normalized and therefore are used as entered.
Once the average normalized spectra are known, they are adjusted to the output
conditions. To do this the ambient temperature in degrees Fahrenheit (t),
the atmospheric density (p), and the speed of sound (c) must be found from
the altitude (H) and temperature deviation (A).
Accordingly, Z = .0003048 H km (3.1-6)P
H p = 63535 pz /(Z + 6353-5) km (3.1-7)
ISA 288.15 -6.5 H OK (3.1-8)
T = TI1A + AT oK (3.1-9)
t = 1.8T -459.67 °F (3.1-10)P = 101325 (288 .15/TISA) Pa (3.1-11)
P = '/(287.053 T) kg/ 3 (3-.1-12)c ý z87ý4T •r/sec (3.1-13)
To adjust the spectrum to these conditions.
L200,i = L +a,200/(l000 sin e)) (aoi - cy) + LPCr)
d (3.1-14)
where 0yri is the absorption coefficient for the
output temperature and relative humidity
Lpcr is 10 LOG 10 (pC/410) for the output !onditions
The 200 foot reference day spectrum is attenuated "co other distances ising
inverse square attenuation and extra air attenuation.
3-5
Li L 200,1 Go (d/200) - ((d-200)/lO00 sin e) Uri dB (3.1-15)
where d is the distance to the flight path in feet
In addition, the duration correction is modified for .distance by adding
10 LOG1 0 (d/200) to the normalized duration correction.
Extra ground attenuation (EGA) is calculated by a mathematical model of
Figure 4 of AIR 923 (Reference 6 ). To account for the effect of distance,
a four segment model is used. With Rgthe radial distance from the source,
For 100 < Rg 1000EGA3 = 3.498078 P100O (3.1-16)
EGAM = .7 + 1.2 (LOG 1 o Rg- 2)3.8707 (3.1-17)
For l000 5 Rf 2500
EGA3 = 3.498078 + 2.875692 ((LOGIO 1 3)/.39794)'8 (3.1-18)
EGA4 = 1.9 + 2.85 ((LOG!0C3) /.39794)"8719 (3.1-19)
For 2500 Ri 4000
EGA3 = 6.37377 + .404659 ((LOGIl 0 3.39794)/.204i2) .024 36 4 3 (3.1-20)
EGA4 = 4.75 + .35 ((Lo•103.3979)/.2ozi)'975 (3.1-21)
Fr g• 4 oo00
EGA3 = 6.-i78 4 3 (3.1-22)
EGA4 = 5.1 (3.1-23)
To account for the frequency effects in the model
EGA i = EGA4 + EGA3 LOGl 0 (fi/53) dB (3.1-24)
If f is greater than 1700 Hz, then 1700 Hz is used.
Then,
"L, =-- "I - EGA, - 5 Io(•Eout) dB (3.1-25)
The results of a propagation calculation, without extra ground attenuation,
are illustrated in a sample plot in Section 4 of this report.
3-6
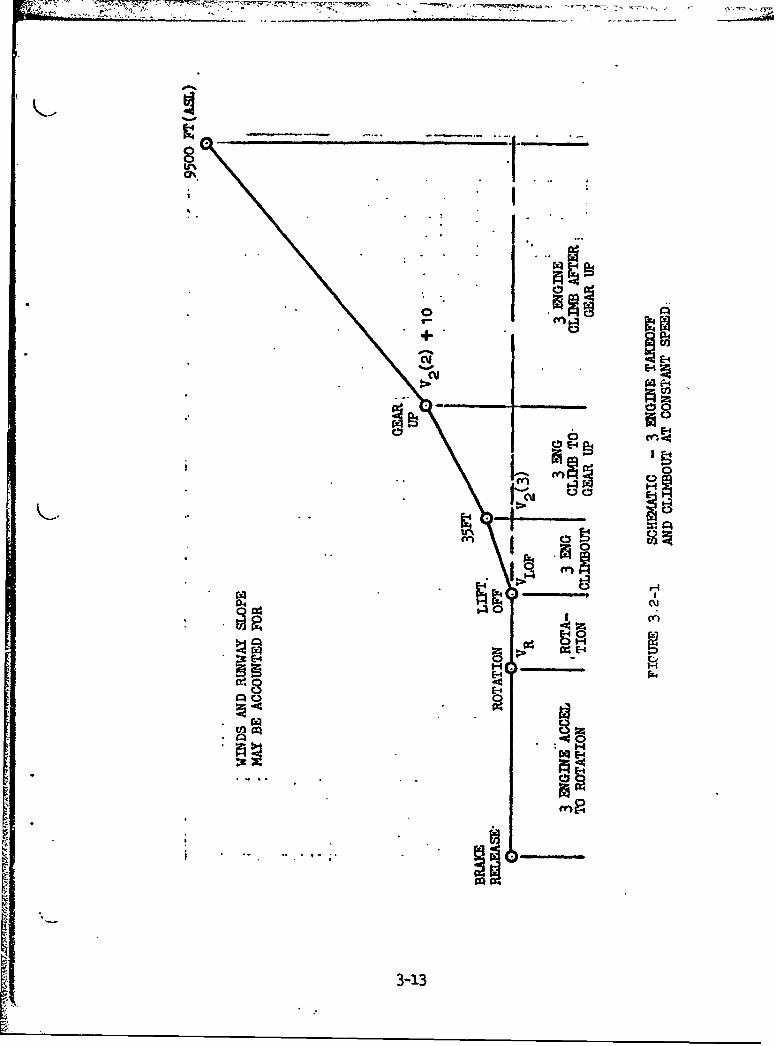
3.2 TAKEOFF PERFORMANCE
This section describes the subroutine which calculates the takeoff flight
path from brake release (BR) to about 9500 feet above sea level (ASL) for
three different prodeduzes. All flight paths reflect all engine operation
and FAA approved aerodynamic data, thrust characteristics, and speed relation-
ships. The all engine distance to 35 feet iiz actual and does not include the
15 percent factor associated with FAR field lengths.
The primary flight path is a 3 engine takeoff and climbout at constant equi-
valent airspeed after gear up. Another path is a 3 engine takeoff and climb-
out to gear up with the option of a thrust reduction at any point after gear
up. During accelerated flight after gear up, the third option, normal cleanup
procedures (flap retraction) are followed. The flight path is broken into a
number of convenient increments, called segments.
The 1962 Standard Atmosphere (Reference 7) is used throughout for all calcu-
lations.
The program uses equations and methods developed by Flight Test (Reference 4)
that describe a takeoff and climbout from brake release to a point where the
aircraft is at about 9500 feet above sea level (Figure 3.2-1). Using FAA
approved thrust, drag, and speed relationships, the aircraft is accelerated
from BR to rotation (ROT), ROT to liftoff (LOF), and LOF to a point where the
aircraft is at 35 feet (AGL). Then the aircraft is accelerated from the velo-
city at the 35 foot point (V2 (3 engine)) to a speed equivalent to the engine
out speed (V2 (2 engine)) plus 10 knots at gear up. After gear up this speed
is maintained to about 9500 feet (ASL) with the flap setting used for takeoff.
At gear up, any flight acceleration between that corresponding to maximum
climb gradient to the maximum acceleration corresponding to level flight may
be selected (Figure 3.2-2). Use of the accelerated flight path requires an
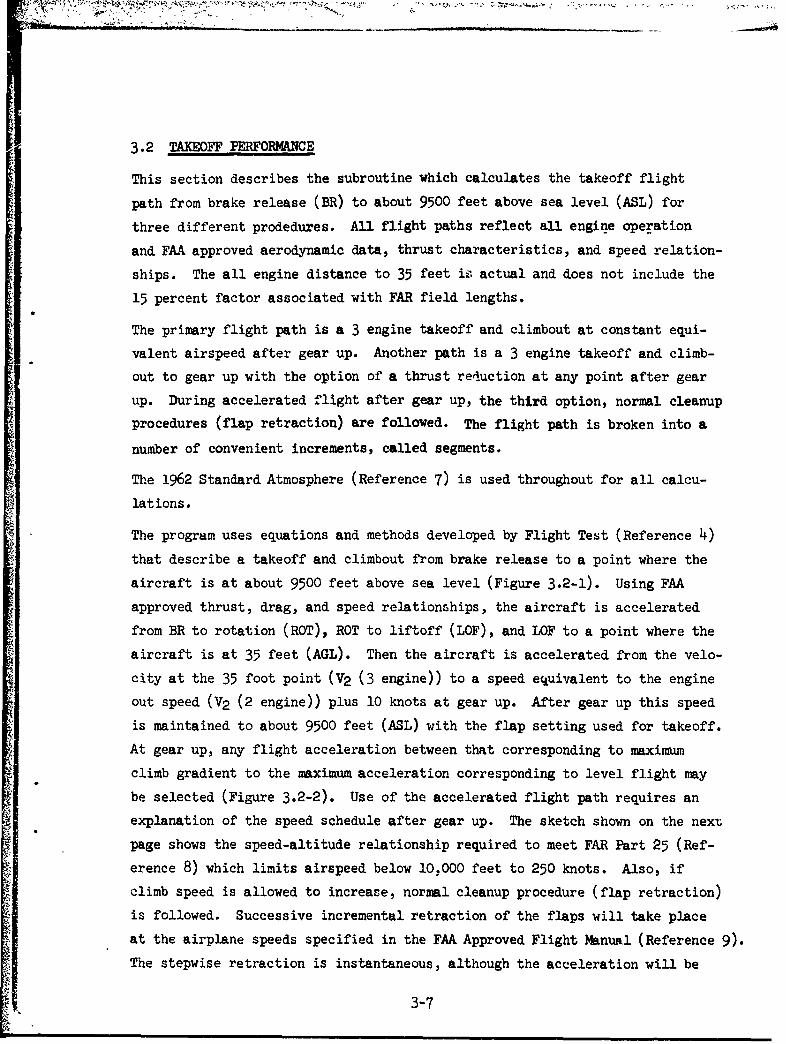
explanation of the speed schedule after gear up. The sketch shown on the next
page shows the speed-altitude relationship required to meet FAR Part 25 (Ref-
erence 8) which limits airspeed below 10,000 feet to 250 knots. Also, if
climb speed is allowed to increase, normal cleanup procedure (flap retraction)
is followed. Successive incremental retraction of the flaps will take place
at the airplane speeds specified in the FAA Approved Flight Manual (Reference 9).
The stepwise retraction is instantaneous, although the acceleration will be
3-7
ACCELERATE10000 • TO CLIMB
WEED
PRESSUREALTITUDE
-FT
GEAR 2 ACCELERATEDUP FLIGHT PATH
V2 +10 250VELOCITY- KEAS
continuous during the cleanup.
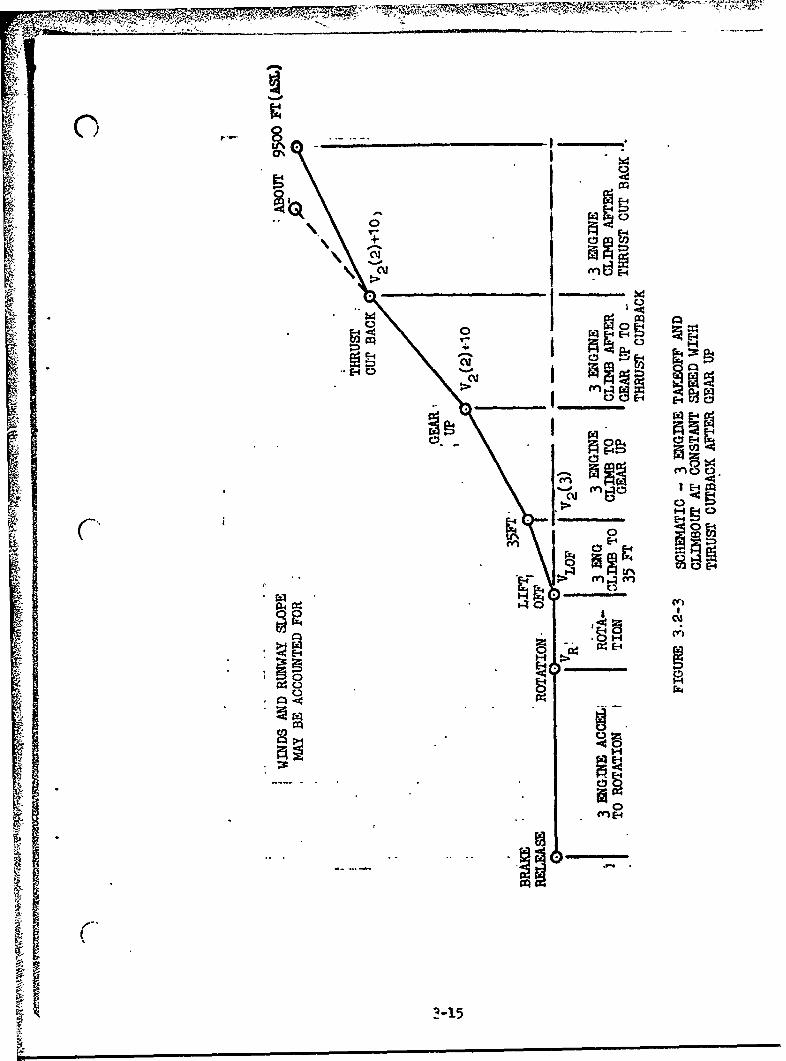
After gear,up any cutback thrust level may be chosen between full thrust and
that corresponding to the thrust required for level flight with a wing engine
inoperative (Figure 3.2-3). After gear up, the aircraft is climbed at constant
equivalent airspeed, corresponding to V2 + 10 KEAS, to the predetermined cut-
back altitude. At this altitude, the throttles are set to an EPR (Engine
Pressure Ratio) corresponding to a percent of maximum takeoff thrust and a
new climb gradient is established. The climb is continued at constant speed
to about 9500 feet (ASL).
At the end of each segment, an interpolation is made for NlNusing appro-
priately calculated values of EPR, Mach number, and pressure attitude. These
parameters, plus downrange distance, are passed to the footprint routine for
use in calculating noise along the flight path. A specific airport altitude
and ambient temperature is assumed.
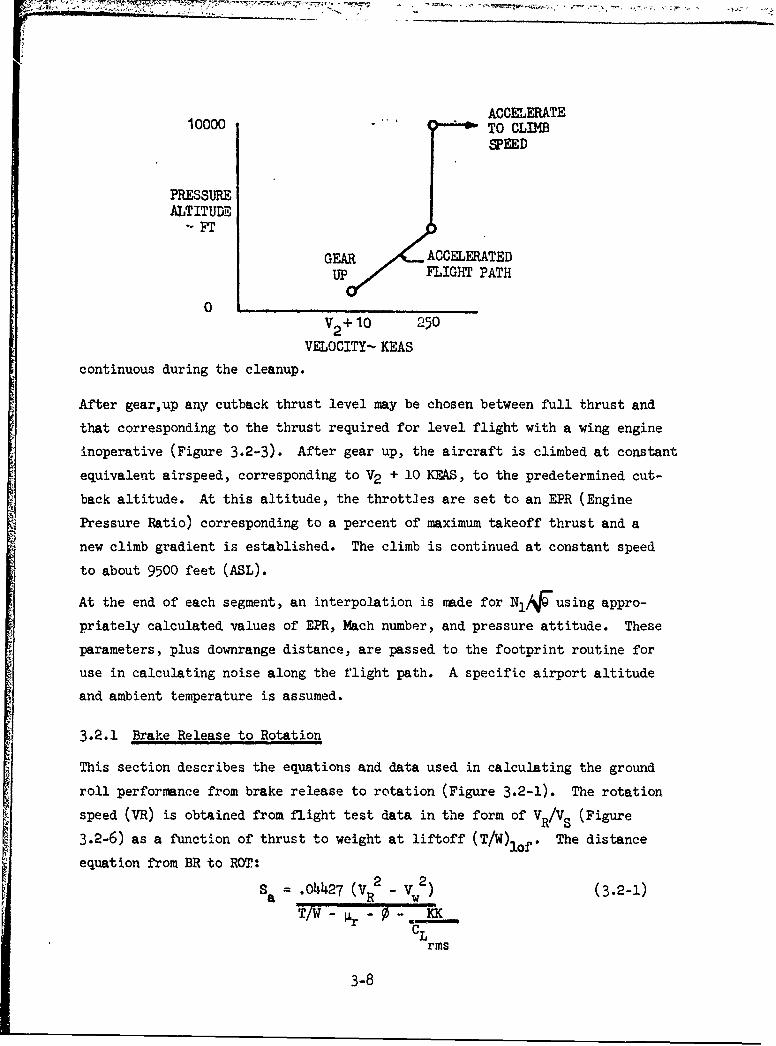
3.2.1 Brake Release to Rotation
This section describes the equations and data used in calculating the ground
roll performance from brake release to rotation (Figure 3.2-1). The rotation
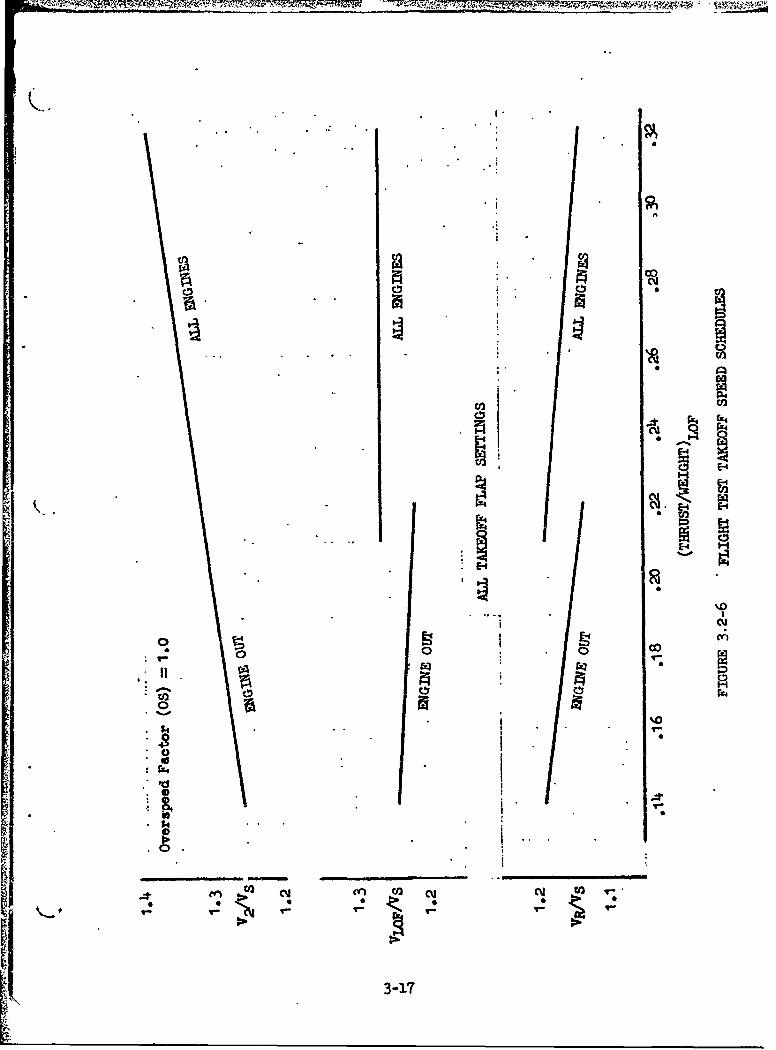
speed (VR) is obtained from flight test data in the form of VR/VS (Figure
3.2-6) as a function of thrust to weight at liftoff (T/W) lf. The distance
equation from BR to ROT:
Sa =0o41427 (V 2 V 2 (3.2-1)
rms
3-8

is derived from the elementary equation of motion, assuming constant accelera-
tion,
2 aS=Vfinal" original (3.2-2)
All velocities used in distance equations are converted from equivalent air-
speed to true airspeed by the following relationship:
VT = V (3.2-3)
3.3.2 Rotation to Liftoff
The performance from rotation to liftoff is described in th'c same manner as
for the previous segment. The liftoff speed is obtained from Figure 3.2-6.
An acceleration from VR to V10f is made. The incremental distance covered is
o.4427 [(Vrif - V - (Vy v)2(T/W (3.2-4)
CLrms
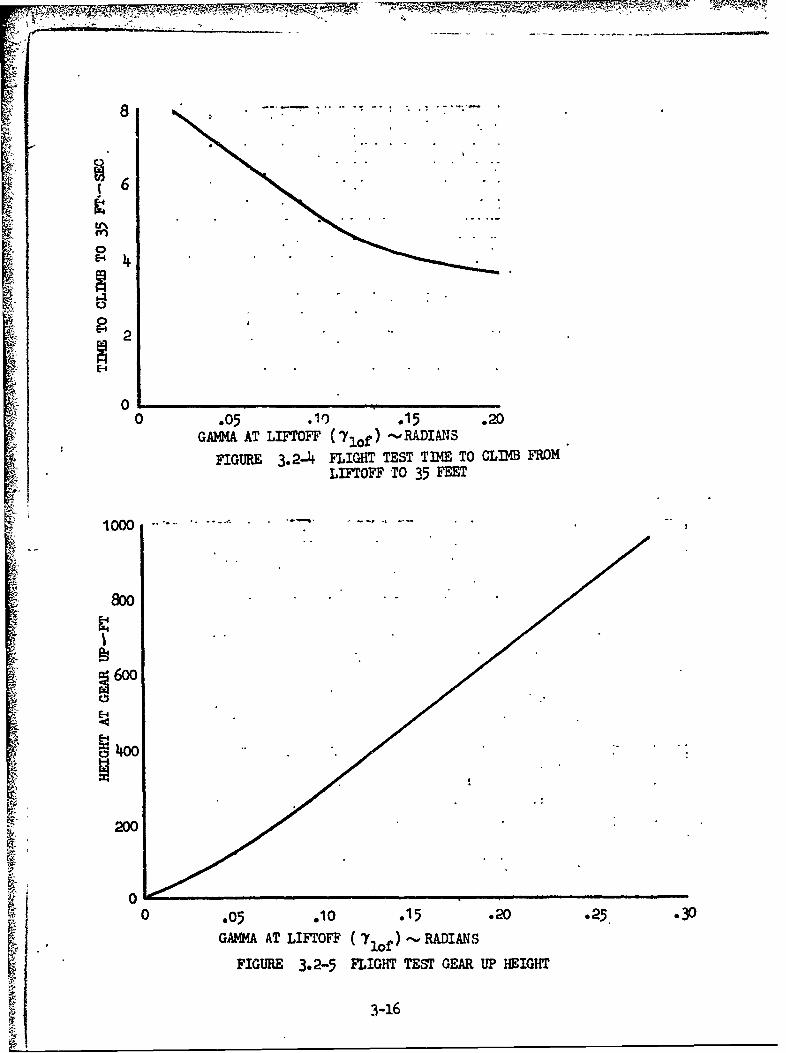
3.2.3 Liftoff to 35 Feet
This segment begins at liftoff and covers the distance travelled during tran-
sition from ground run to a point where the aircraft has climbed to a height
of 35 feet (AGL). The time (T clmb) for this trensition has been described by
Flight Test as a function of the gradient (Ylof) at liftoff (Figure 3.2-4).
Once time has been determined, the climb distance equation
S= [~~a2~of1 -V 1.87 T b (3.2-5)
can be solved. This equation is derived from the following elementary equation:
AS = V AT (3.2-6)
The incremental altitude is -lt at 35 feet.
3.2.4 35 Feet to Gear Up
This segment begins at 35 feet and includes the aircraft performance to the
gear up point. The height at gear up (Figure 3.2-5) has been described by
3-9
Flight Test as a function of the gradient bt liftoff. This height does not
account for the increase in airspeed when accelerating from V2 (3) to V2 (2)
+ 10 KEAS. The program has an iterative routine that will reduce this height
to account for the increase in true airspeed. The total time for gear up is
based on 17.5 sec. (Reference 4) from liftoff to gear up. The segment time
from 35 feet to gear up then becomes
Tclmb+ "tt 3 5 ' to GU = 17.5 (3.2-7)clbFto 35'
orAt GU 175 - Tc mb
(3.2-8)LOF to 35'
3.2.5 Three Flight Options after Gear Up
3.2.5.1 Constant V2 + 10 KEAS Climb After Gear Up
A constant EAS climb is considered the normal option for climb after gear up.
Climb is established at a constant equivalent airspeed (V2 + 10 KEAS) and
continued to about 9500 feet (ASL) with the flap setting selected for takeoff.
To establish the method for calculating incremental distanc-e and height after
gear up, time increment is fixed at 5 seconds and a graphical type integra-
tion is established. The incremental heights over 5 second intervals are
summed until the pressure altitude exceeds 9500 feet (ASL). Basic equations
used for each 5 second integration interval are as follows:
GRAD T -D (3.2-9)
R/C 1. 6 8 78 VT (GRAD 6878 a )(3.2-10)C= 32.2(1+ .567 M2)
A = 5 ROC (3.2-11)
AScib = 1.6878 TCmb VT (3.2-12)
3.2.5.2 Accelerated Climb After Gear Up
The accelerated climb path option starts at gear up, continues until either a
9500 foot pressure altitude is reached or speed reaches 250 KEAS. In the
latter instance, the airplane is climbed at 250 KEAS until about 9500 pressure
3-10
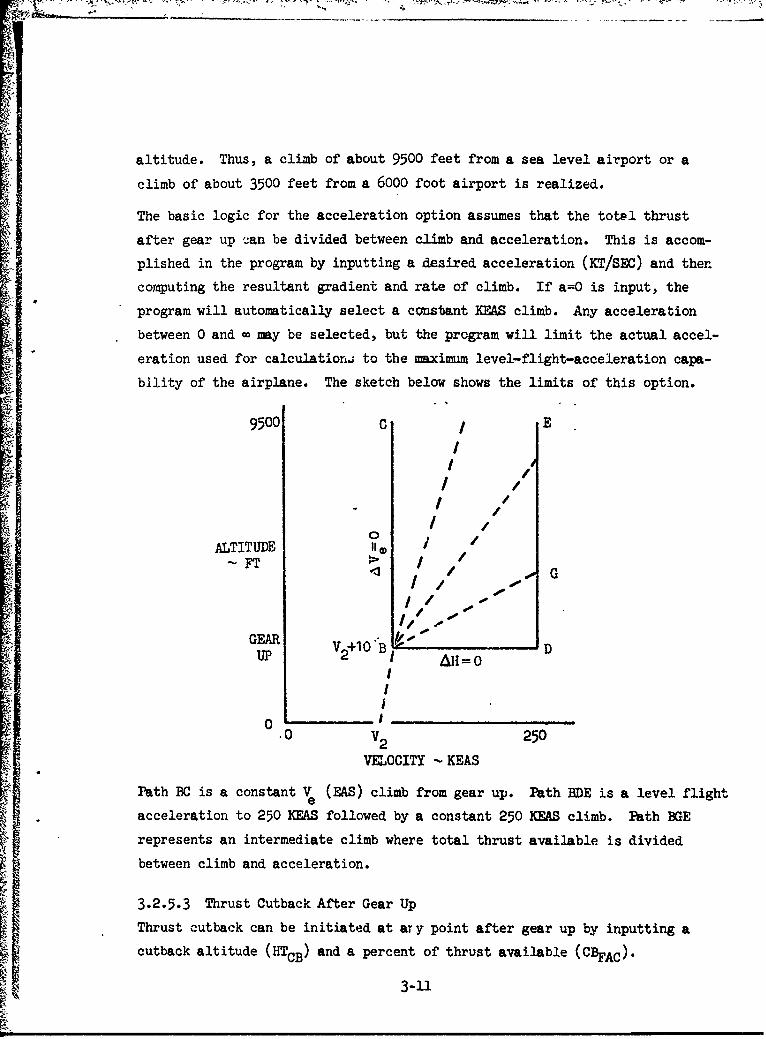
altitude. Thus, a climb of about 9500 feet from a sea level airport or a
climb of about 3500 feet from a 6000 foot airport is realized.
The basic logic for the acceleration option assumes that the total thrust
after gear up ý-an be divided between climb and acceleration. This is accom-
plished in the program by inputting a desired acceleration (KT/SEC) and then
computing the resultant gradient and rate of climb. If a=O is input, the
program will automatically select a emstbant KEAS climb. Any acceleration
between 0 and - may be selected, but the program will limit the actual accel-
eration used for calculation. to the maximum level-flight-acceleration capa-
bility of the airplane. The sketch below shows the limits of this option.
9500 C E
I/I /
- I01
ALTITUDE " / /~FT G/
GEAR-DSv+1 o-B -D
UP 2 1 All= 0
00 V 250
VELOCITY KEAS
Path BC is a constant V (EAS) climb from gear up. Path BDE is a level flight
acceleration to 250 KEAS followed by a constant 250 KEAS climb. Path BGE
represents an intermediate climb where total thrust available is divided
between climb and acceleration.
3.2.5.3 Thrust Cutback After Gear Up
Thrust cutback can be initiated at ar y point after gear up by inputting acutback altitude (HTcB) and a percent of thrust available (CBFAc).
3-11
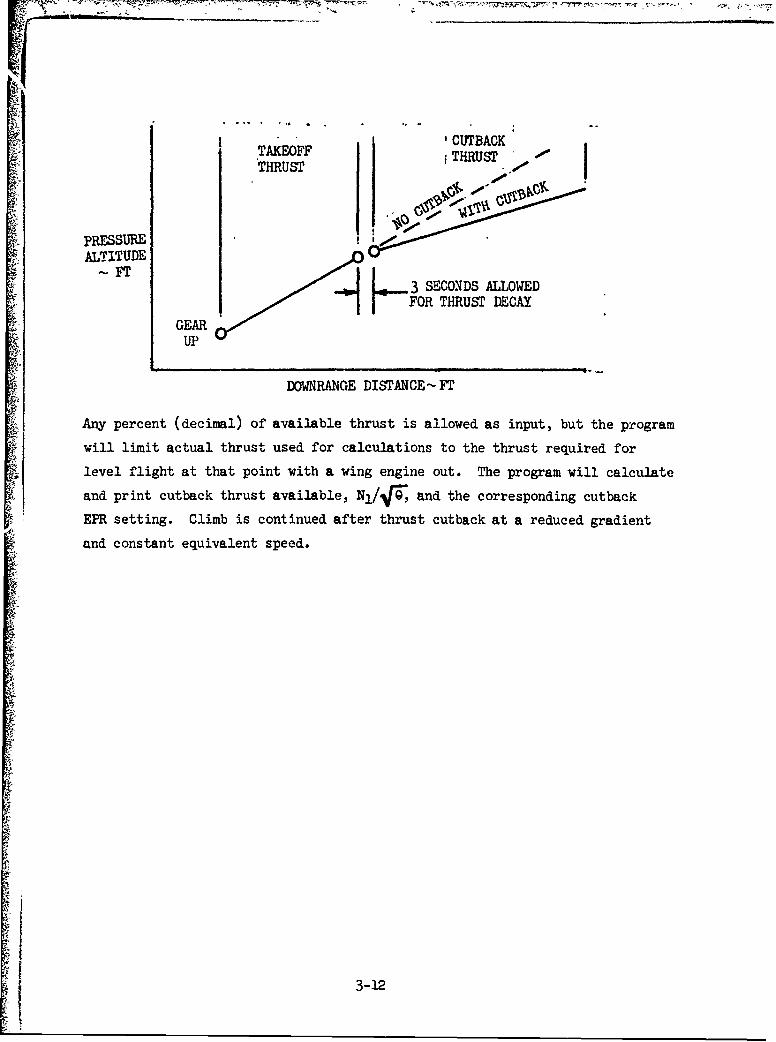
'CUTBACKTAKEOFF :THRUSTTHRUST j HU
PRESSUREALTITUDE
3 SECONDS ALLOWED-iFOR THRUST DECAY
GEARUP
DOWNRANGE DISTANCE- FT
Any percent (decimal) of available thrust is allowed as input, but the program
will limit actual thrust used for calculations to the thrust required for
level flight at that point with a wing engine out. The program will calculate
and print cutback thrust available, N1 /14, and the corresponding cutback
EPR setting. Climb is continued after thrust cutback at a reduced gradient
and constant equivalent speed.
3-12
KE-4
.. 1l
.0
ce..
K-, .* .
3-134

181C%,
IN I
004E-1
p~fz4 E-40
A4 A:
CQ
HO
3-144
..............
0Cj
E-4 0
r00
C-. 0
0 r14
Ii.-410LI* 00E
IrE0- -5,
8
S6
E- 4
OE- 20
C,,
0 .05 .t) .15 .20GAMMA AT LIFOFF ( of RADIANS
FIGURE 3.2-4 FLIGHT TEST TIME TO CLIMB FROMLIFTOFF TO 35 FEET
1000 - ........
8OO
2600
i ,,
E-4
400
0 .05 .10 .15 .2 02 .30
GAMMA AT LIFTOFF 7of-• RADIANS
FIGURE 3.2-5 FLIGHT TEST GEAR UP HEIGHT
3-16
.11
ii C',
500 0 co
3-17
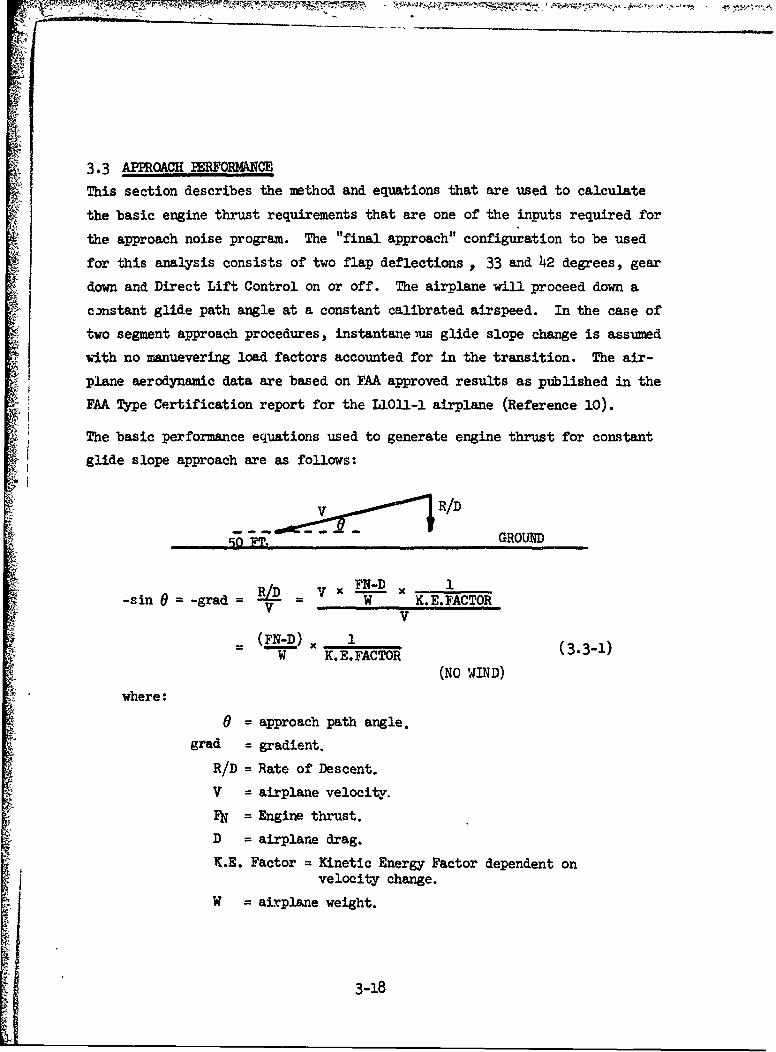
3.3 APPROACH PERFORMANCEThis section describes the method and equations that are used to calculate
the basic engine thrust requirements that are one of the inputs required for
the approach noise program. The "final approach" configuration to be used
for this analysis consists of two flap deflections., 33 and 42 degrees, gear
down and Direct Lift Control on or off. The airplane will proceed down a
constant glide path angle at a constant calibrated airspeed. In the case of
two segment approach procedures, instantane us glide slope change is assumed
with no manuevering load factors accounted for in the transition. The air-
plane aerodynamic data are based on FAA approved results as published in the
FAA Type Certification report for the L1OII-1 airplane (Reference 10).
The basic performance equations used to generate engine thrust for constantglide slope approach are as follows:
V .~ R/D-0 IE- 0e GROUND
SR/D V x FN-D x 1-sin 0= -grad = = W .E.FACTOR
x 1W K.E. FACTOR (3.3-1)
(NO WIND)
where:
0 = approach path angle.grad = gradient.
R/D = Rate of Descent.
V = airplane velocity.
FS = Engine thrust.
D = airplane drag.
K.E. Factor = Kinetic Energy Factor dependent onvelocity change.
W = airplane weight.
3-18
The basic noise program has been written for an approach speed defined as
1.3VS + 10 (VEAS) and zero winds,which corresponds with conditions set up
for FAA noise certification. Since the airplane approaches at a constant
calibrated airspeed, the required engine thrust for maintaining a constant
angle of glide is independent of airplane altitude.
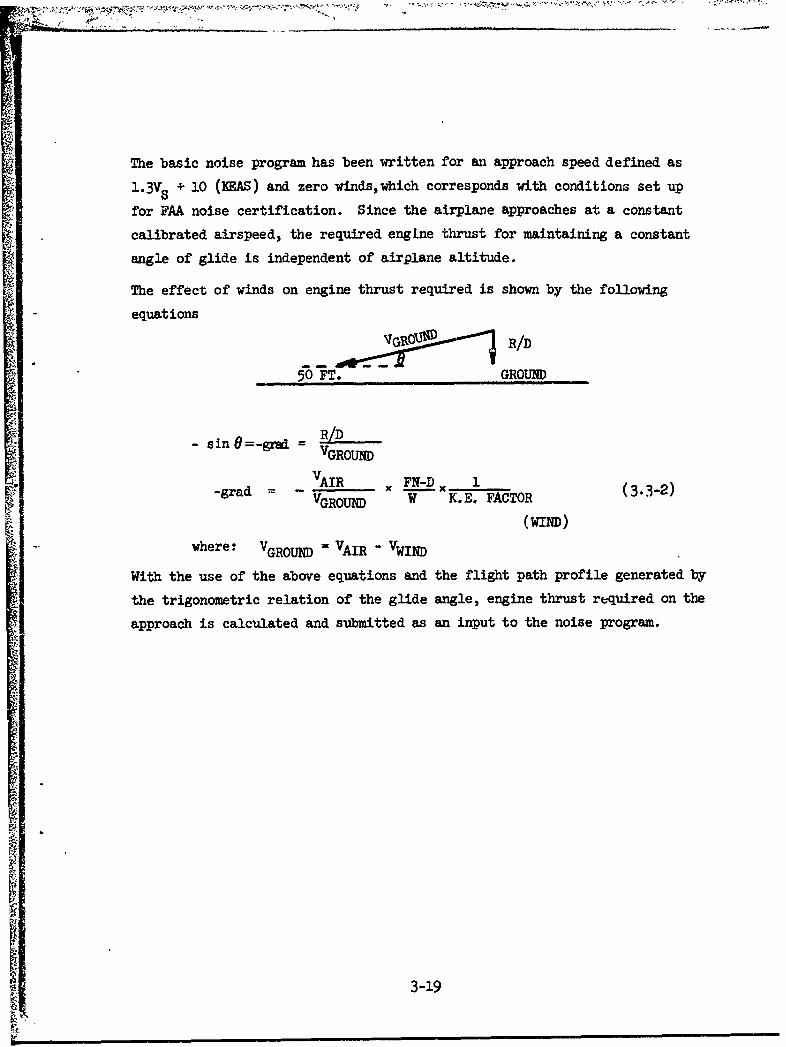
The effect of winds on engine thrust required is shown by the following
equations
' IG~u~oR/D
50 FT. GROUND
- sin O=-grad = R/DVGROUM
-grad VAIR _ ,N-D x 1VGROUND W K.E. FACTOR (3.3-2)
(WIND)where: VGROUM = VAIR - VWIND
With the use of the above equations and the flight path profile generated by
the trigonometric relation of the glide angle, engine thrust required on the
approach is calculated and submitted as an input to the noise program.
3-19
3.4 NOISE FOOTPRINT
The noise footprint subroutine has the capability to calculate the coordinates
(x and w) of equal noise points on a flat terrain, and to plot constant noise
contours through these points. In addition, the noise levels directly under
the airplane flight path and at one-quarter nautical mile to either side
thereof are calculated. As the coordinates are calculated, the area enclosed
by tne contour to that point is also calculated. A plotting routine is used
to provide machine plots of the sontonrs.
The footprint calculation utilizes the output of the performance subroutine
to describe the airplane flight path and tables of noise values extracted
from the noise propagation subroutine. If desired, flight path information
may be entered directly into the footprint routine without using the perform-
ance subroutine. The noise propagation data used are with full extra ground
attenuation and without any extra ground attenuation. The transition from
one extreme to the other in the footprint calculation depends on the angle of
elevation, 0, of the noise path to the ground point utilizing the factor
-Ntan 3e from Reference 11.
3.4.1 Footprint Input Parameters
Footprint input parameters include the following: a table of noise levels
versus distance and versus corrected fan speed (N1/q9) for a specific air-
port altitude and temperature; a maximum-noise radiation angle; the noise
level values for -which contours are desired; flight profile data; and an
initial point and associated distance increment for augmentation of the flight
profile data.
The noise level table includes data both with extra ground attenuation and
without. The flight profile data consist of airplane altitude (H) above flat
ground, true air speed, and corrected fan speed, all as functions of distance
along the flight path projection oa the ground. The initial point and dis-
tance increment input permits augmentation of the flJght profile data while
entering a minimum number of points to define the flight path. If the number
of points defining the path in considered adequate, the initial point may ba
picked beyond the termination of the flight profile and no additional pointswill be calculated.
3-20
3.4.2 Footprint Calculation
To obtain the required resolution for contour plotting, the input flight
profile usually is augmented by adding more points by linear interpolationbetween the profile points from the performance subroutine. The input points
are also included in the generated flight path.
As the augmented flight path is being generated, the noise levels under the
flight path (on the extended runway centerline) and on the quarter mile side-
lines are found. The centerline level, L0 , is found by interpolating withLOG H and N /re in the noise data without EGA. The equation X'= X + H cotan e10 1is used to calculate the intercept on the ground. The quarter nautical milesideline level, LS, is found in a similar manner except the interpolation to
find L and L is with LOG R instead of LOG 1 0H, where1 2 10 1
R =WH2 + 15202 feet (3.4-1)L1 and L2 are the levels at R with and without EGA, respectively. Accordingly,
Ls L 2 -(L 2 - L)e 1 3 dB (3.4-2)
where= arcsin (H sin e/R) degrees (3.4-3)
Note: If 6 >30 then pis set to 300.
Here, the equation X" = X + R cotan a gives the intercept on the ground for
the sideline noise.
In each of the above cases, if the level is an EPNL, a velocity correction tc
the duration must be made. It has the form C = 10 LOG (16o/v), and is added
to the levels found above.
For each noise level for which a contour is required, the distances R1 and R2
must be found using inverse interpolation in the noise data table with entry of
"L 10 Rj (j = 1,2) for each NjVe. The distance R1 and R2 are without EGA andwith EGA, respectively. This will result in tables of R and R2 versus N kle
1 21for each level. Then for each point on the flight path,
"-'tan 3 0 feetrR antilog (LOG 1O R1 - (LO 0 R 1 -LOG 10OR2 e t(3.410h1 10e1(3.4-4)
R and R2 are found by interpolating with a specific value
of Nlle
3-21
If the levels are EPIM, a velocity correction must be made for the duration.
In this instance it is 160/V and multiplies the distance R, and R2 above.
The contour's half width, W, then, is fR2 - H. The distance along the flightpath to the point on the contour is
X' =X + R cotan e ft. (3.4-5)
The area enclosed by a contour is calculated using trapezold}il rulequadrature. This equation is
Area -Area i + 3.587 X 10 8 (X' - X_) (Wi +wi 1 ) sq.mi. (3.4-6)
The constant 3.587 X 10⁻⁸ evolves from
-83.587 X 10- = .5x2
(528o) 2
where 0.5 accounts for the application of the trapezoidal rule and the 2
hccounts for both sides of the centerline. The 1 accounts for the con-
version from square feet to square miles. An example of a contour Dlot is
-included in Section 4, following.
3-22

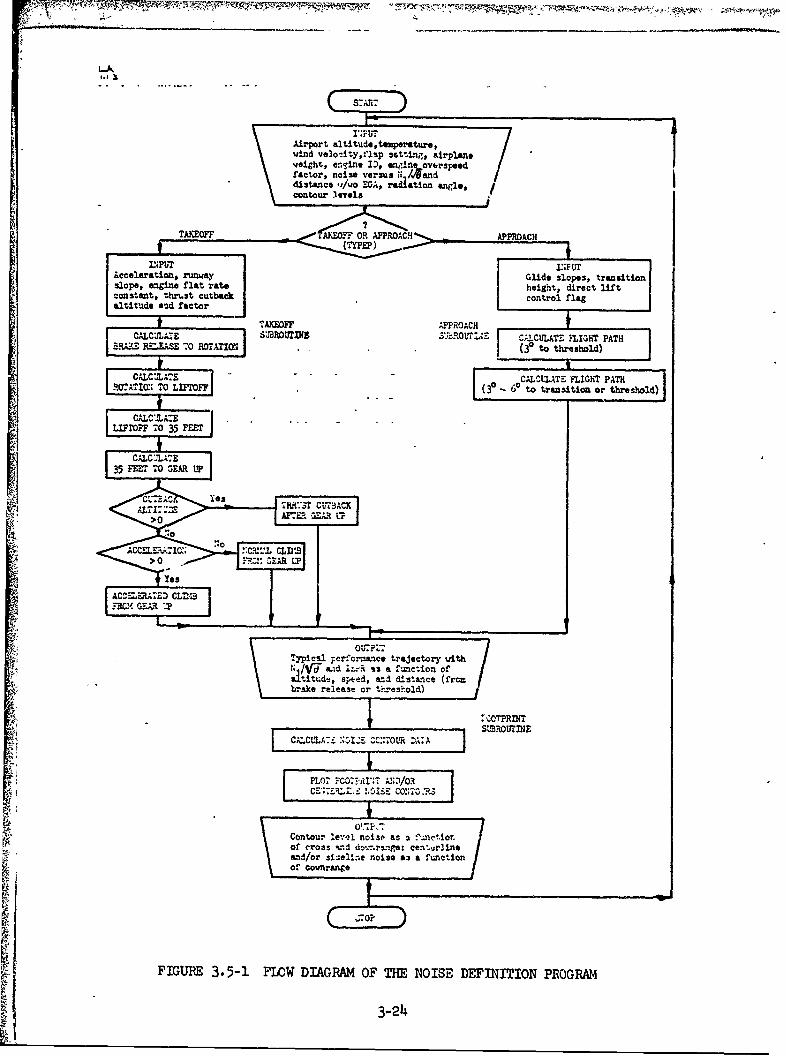
3.5 FLOW DIAGRAM
This section presents a generalized flow diaratm of the logic of the Noise
Definition Program. The onjor options in the program are shown as distinct
routes or paths in the logic.
3-23
distance -"h/o EGA, ra~dation anfle,/contour 34qV*ls
Acceleration,, runway Giesoetastoslope, engine flat rate egt ietlf
ald itude a-ad factor -
CALCAZE.3'--ROWrL~z CALCULATZ FLIGHT PATHBRX L*:AS -0 ROTIATII (30P to threshold)
CALCMATSCALCULATE FLIGHT PATHROTATIN TO IMF(30 - 60 to transition or threshold)
LIFTOFF 70 35 FE
35 FE~r T GGEER LP
Ace= MATE IV;L .4LJ
$E!' :0, ml EA
10es::'I-C-
AC-ZA7: C'cmwr 2;/o
Contour ;er.,1 noice tasetr wit
FIGURE 35-1 FL N DIAGRA OFd T NOS DEFINITION PoORf
;1itde p~d,=3d-24 ne fo
SECTION 4PROGRAM APPLICATION
Representative ways of using the Noise Definition Program and its sister
program, the Noise Propagation Program, are presented in Section 4. Section
4.1 presents data which substantiate the mathematical model of the Noise
Definition Program with respect to comparison with measured flight test data
for both the takeoff climb profile and noise at the 3.5 n. mi. downrange
point. The programs are put to use to exercise their full capabilities.
Typical sample input and output is presented in Section 4.2.
4-1

4.1 SUBSTANTIATION WITH FLIGHT TEST DATA
The noise data used are from the L-1011 noise certification flights made on 4,
5 March 1972. The approach data were measured on 4 March and covered a range
of N1W6 from 55.8% to 70.8% at an approach altitude of arproximately 340 feet
above the microphone. The takeoff data were measured on 5 March and covered a
range of altitude from about 1200 feet to 1800 feet at a takeoff NlJMO of
approximately 90%. It was shown in the certification report (Reference 4)
that there were no tone corrections, only Pseudo tone corrections caused by
the rapid fall off of the spectra at the high frequency end at great dis-tances and by irregularities in the spectra at the low frequency end
due to ground reflections. Those were ignored.
The noise data in the form of one-third octave band spectra were normalized
to 200 feet, FAR 36 day, using the methods of FAR Part 36 (Reference 3). These
spectra were then fitted to a curve versus NhrO to produce spectra atI5% increments of NlAe over the range from 55% to 95%. The spectra were then
modified to tie various ambient conditions and attenuation incorporated to
produce tables of noise versus distance N A/e for the various ambient con-
diticns.
The approach performance routine was based on the flight test methods anddata (Reference l0)page 4.0.1-3-2-2, 4.0.1-3-7-2, 4.0.1-3-7-3. For the
conditions of
Landing Weight 358000 lb.
Flaps 42 degrees
Glide slope 3 degA'ees
Approach speed 149.6 OEASl.3V, + 10
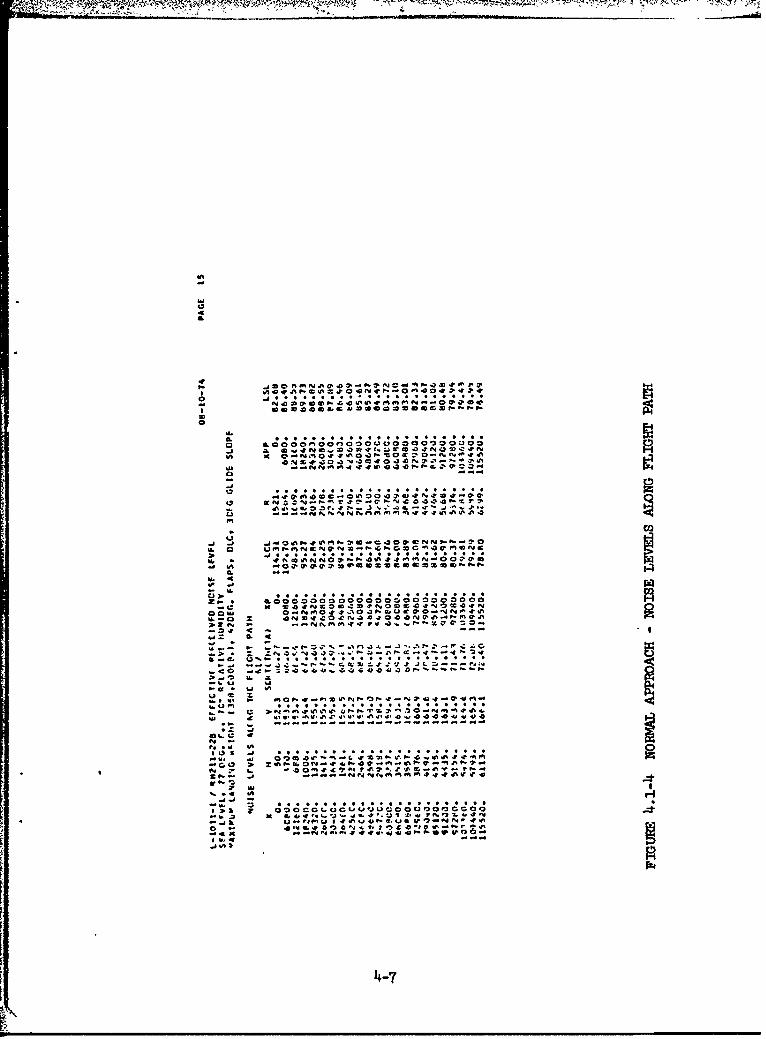
Airport Temperature 770 F
Airport Elevation Sea Level
as seen in Figure 4.1-4, the noise level was found to be 102.70 EPNdB at theone nautical mile point. The certification value for approach was 103
EPNdB for these conditions.
4-2
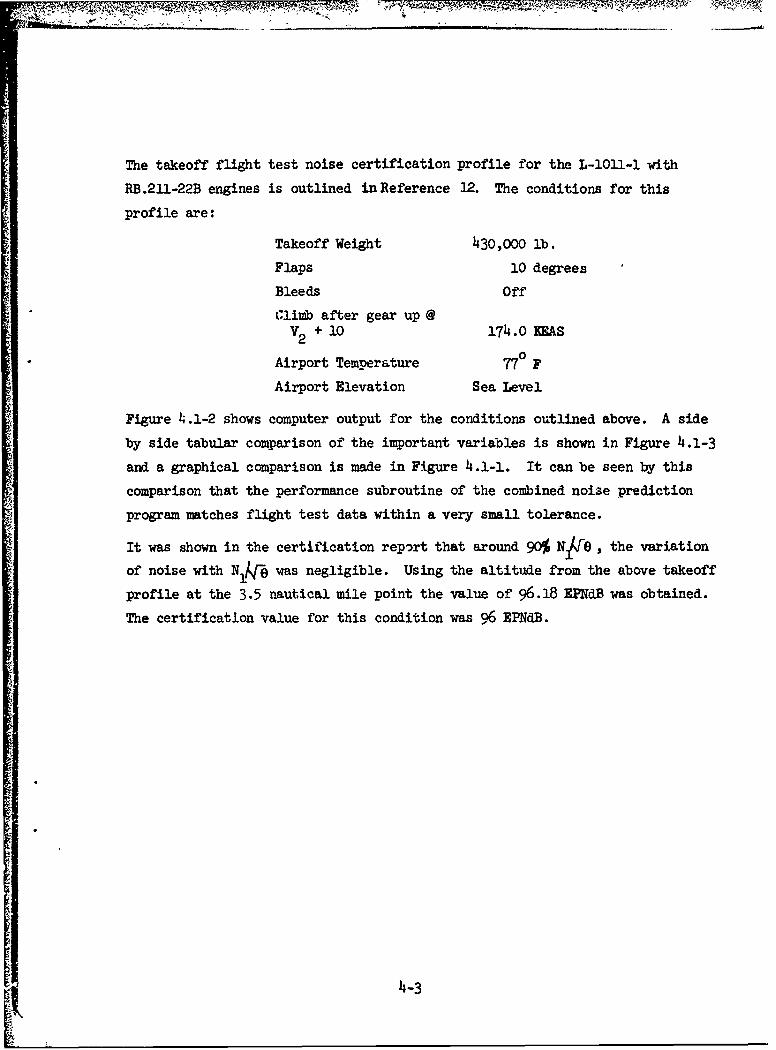
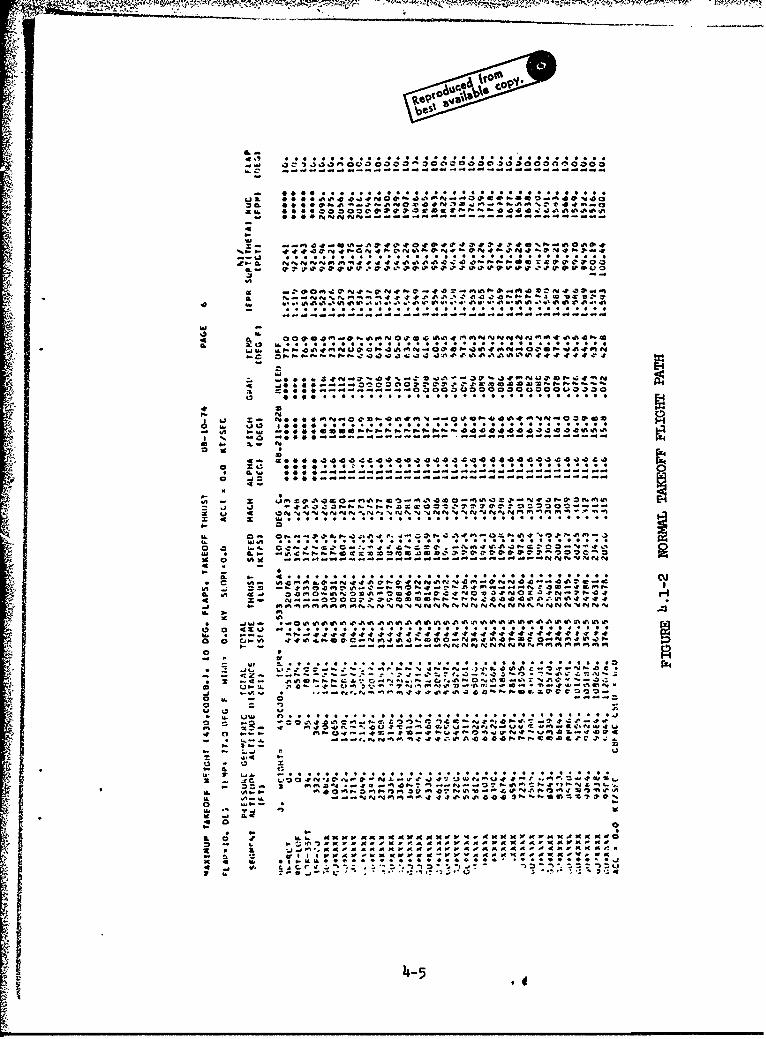
The takeoff flight test noise certification profile for the L-1OIl-1 with
RB.211-22B engines is outlined in Reference 12. The conditions for this
profile are:
Takeoff Weight 430,000 lb.
Flaps 10 degrees
Bleeds OffClimb after gear up @
V2 + 10 174.o KuAS
Airport Temperature 770 F
Airport Elevation Sea Level
Figure 4.1-2 shows computer output for the conditions outlined above. A side
by side tabular comparison of the important variables is shown in Figure 4.1-3
and a graphical comparison is made in Figure 4.1-1. It can be seen by this
comparison that the performance subroutine of the combined noise prediction
program matches flight test data within a very small tolerance.
It was shown in the certification rep'ort that around 90% Nýle, the variation
of noise with N was negligible. Using the altitude from the above takeoff
profile at the 3.5 nautical mile point the value of 96.18 EPNdB was obtained.
The certification value for this condition was 96 EPNdB.
4-3
... ..... ... . - - -- '- t .
E-11
0 E-
040
Q ~E~:tt 4 "M=-j ,f4 ;z
E-2-
1 v 8 ~..... .01 (....h I~~ ...... 140
....... ....-.
a.-o
- -- - - - ---
- **.* .. ~ *.. . . . . **** ** .. . . . .... .
40-1
-6 w 0 - - --
%~ %
w ci 44 ** ** a. *1 , F... -
&A j i-Nr4N 4M O
% 0 No N%.
* 40 .! : 2. 0 *. z ..7 .. 41..0 .* . A. %n 0
Cl .0 .4 .e~O *.J . .
N** -OI
.% ... . . . . .. .. . . .
C £***~04-4 £444 O4.C 44444a- ~ ~
4,~
U. 4-54-
CO4PARISON WITH FLIGHT TEST
430,000 Lb RB. 211-22B
Flaps 10 Deg ISA + 13.9° Rating
Sea Level Bleed Off
77°F Flt Test Computed
EPR @ 6o KTS 1.533 1.533
VR 154 KEAS 154
VLOF 164.3 KEAS 164.3V2 (3 Eng) 171.1 KEAS 171.1
V2 (2 Eng) + 10 KEAS 174.0 KEAS 174.0
Geometric Altitude (Ft) Total Distance (Ft)Segment Flight Test Computer Flight Test Computer
BR -ROT 0 0 5546 5515ROT -LOF 0 0 6619 6575
LOF - 35 Ft. 35 35 7905 787035 Ft - GU 340 344 11775 11739
GU - 414 414 422 12390 12390Hp 200 Ft. 621 628 14109 14109
828 840 15843 15843
1035 1054 17592 17592
1242 1249 19357 193571449 1455 21138 21138
1656 1664 22934 229341863 1868 24747 24747
2070 2078 26576 26576
2278 2285 28422 28422
2485 2493 30286 3o2862692 2700 32166 321662899 2908 34065 340653106 3115 35981 35981
3314 3323 37916 37916
FIGURE 4.1-3 NORMAL TAKEOFF FLIGHT PATH COMPARISONWITH FLIGHT TEST - TABULAR DATA
4-6
4W -
a-a
%- .'mt-oMgN - 4 N- O0
a.
a. **** . . .. ., . ,V: *.
po . . . . . . . . . . . .
"0 z 14 ,Z
-. a 3L 14" w0 1 . .U4 aN 4
-~NNM5SU4*?avv
-~4-7
4.2 TYPICAL PROGRAM USE - SAMPLE CASES
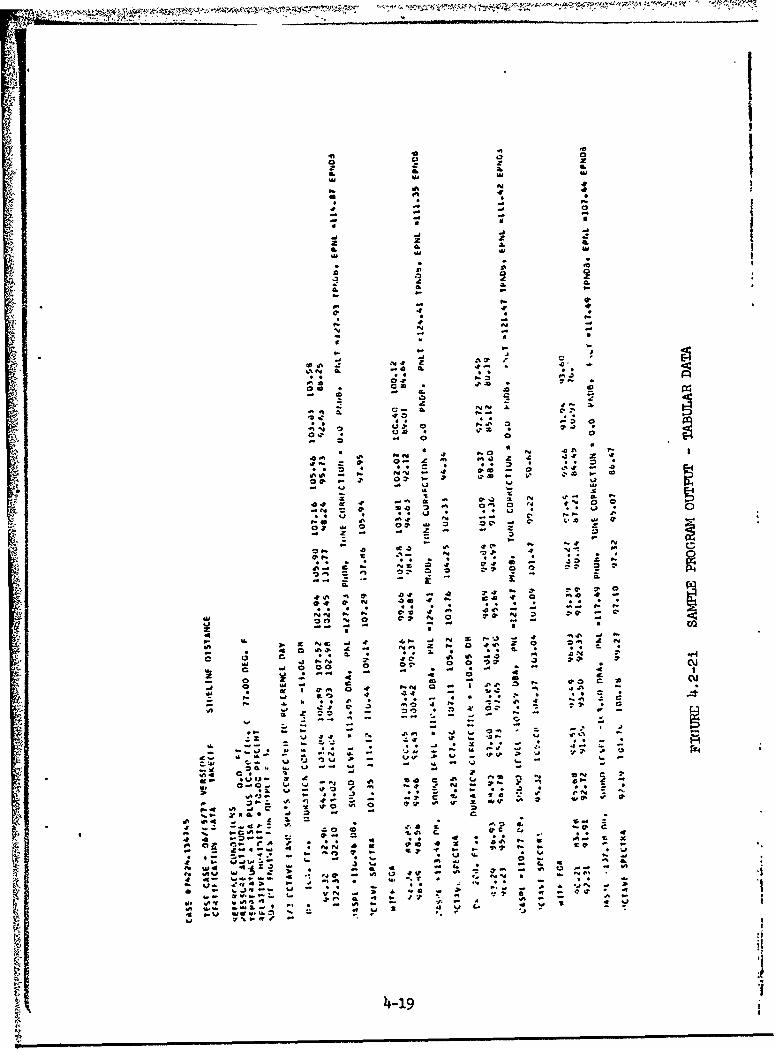
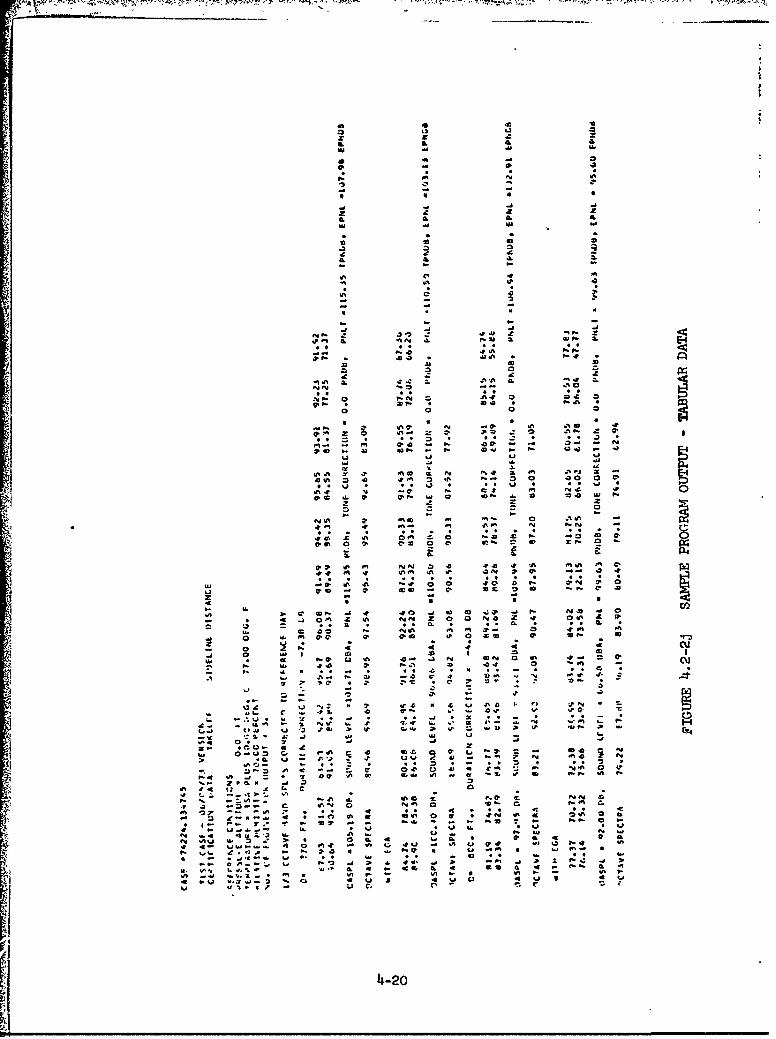
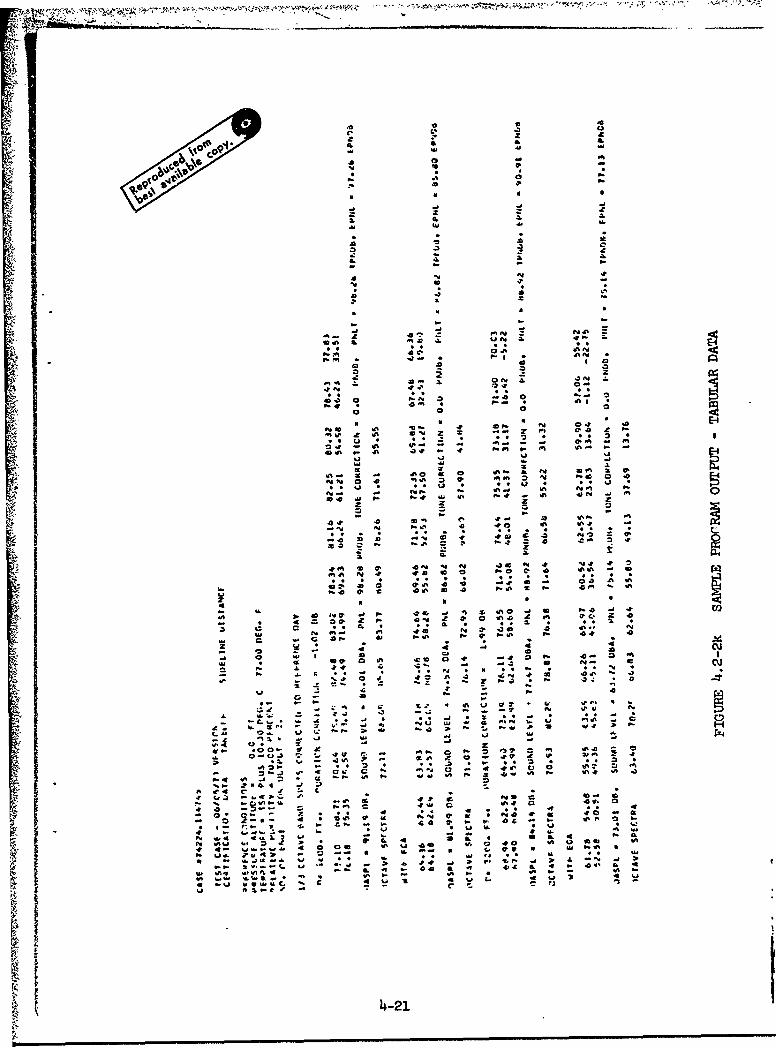
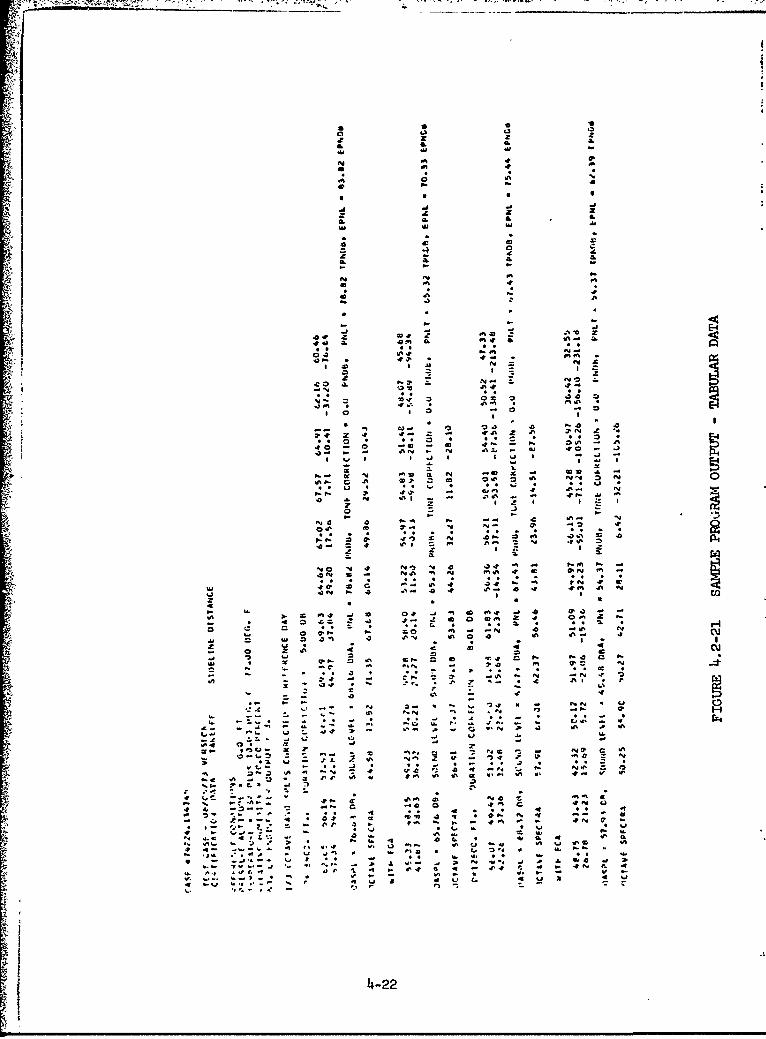
Included here are sample runs of the Noise Propagation Program arnd the
Noise Definition Program including the input and sample plots.
I.4
"NI
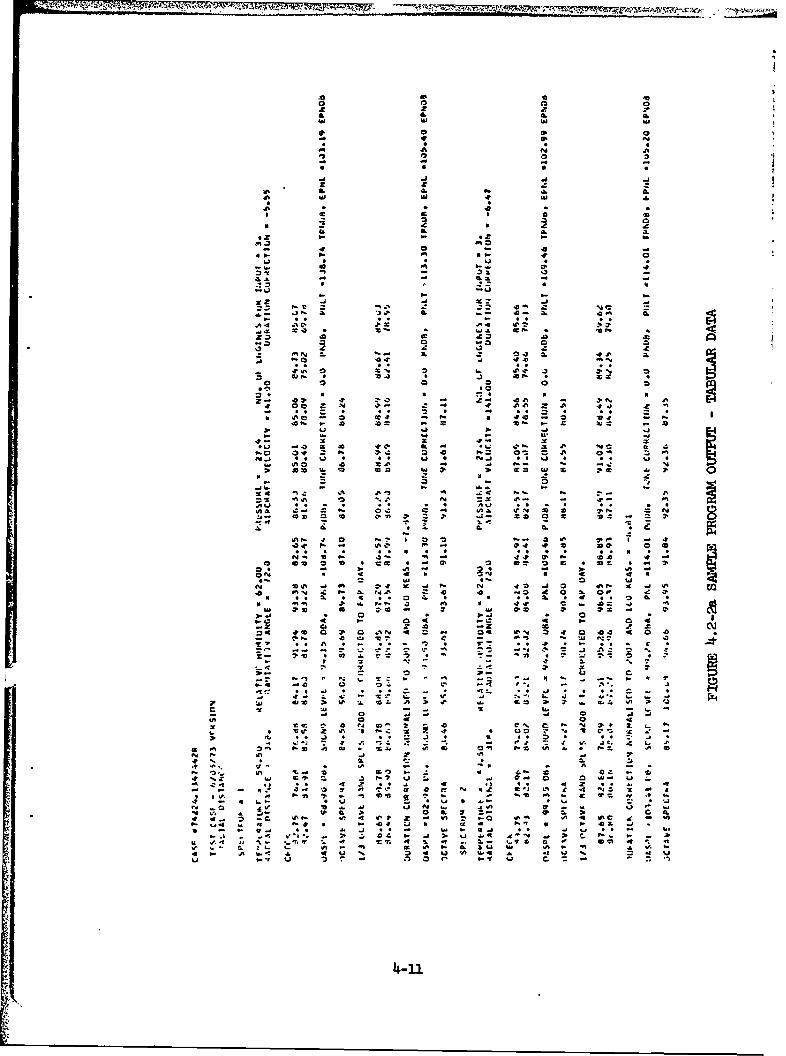
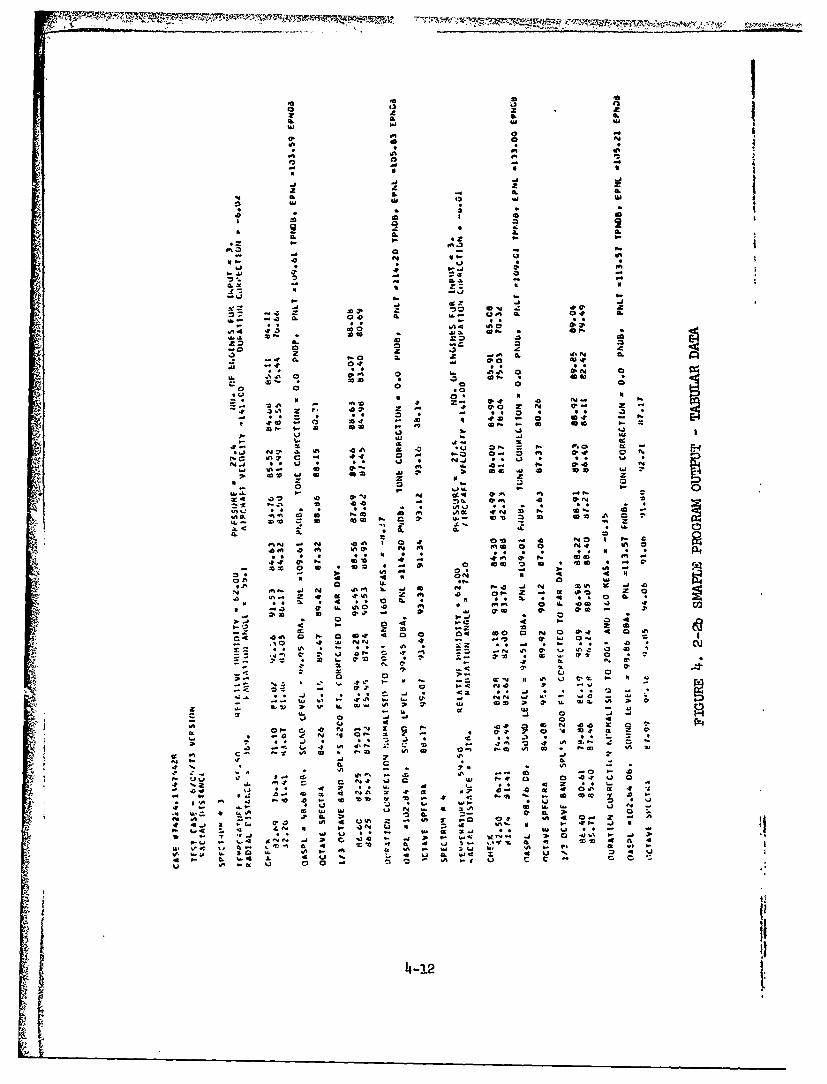
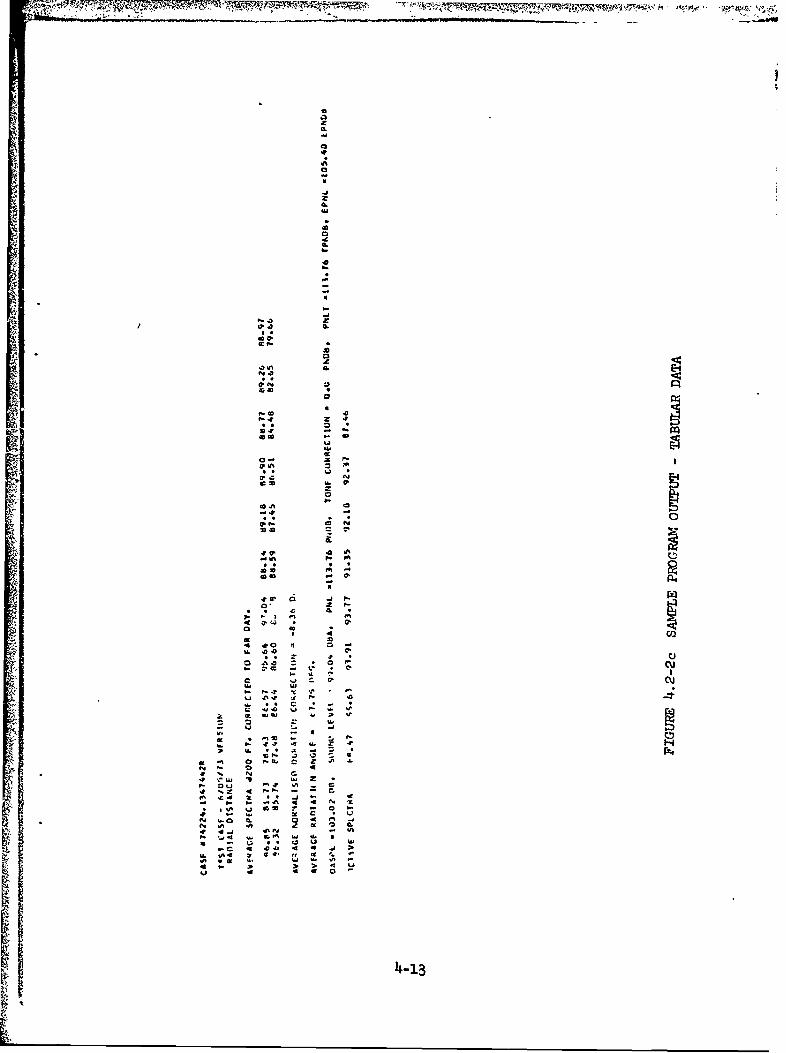
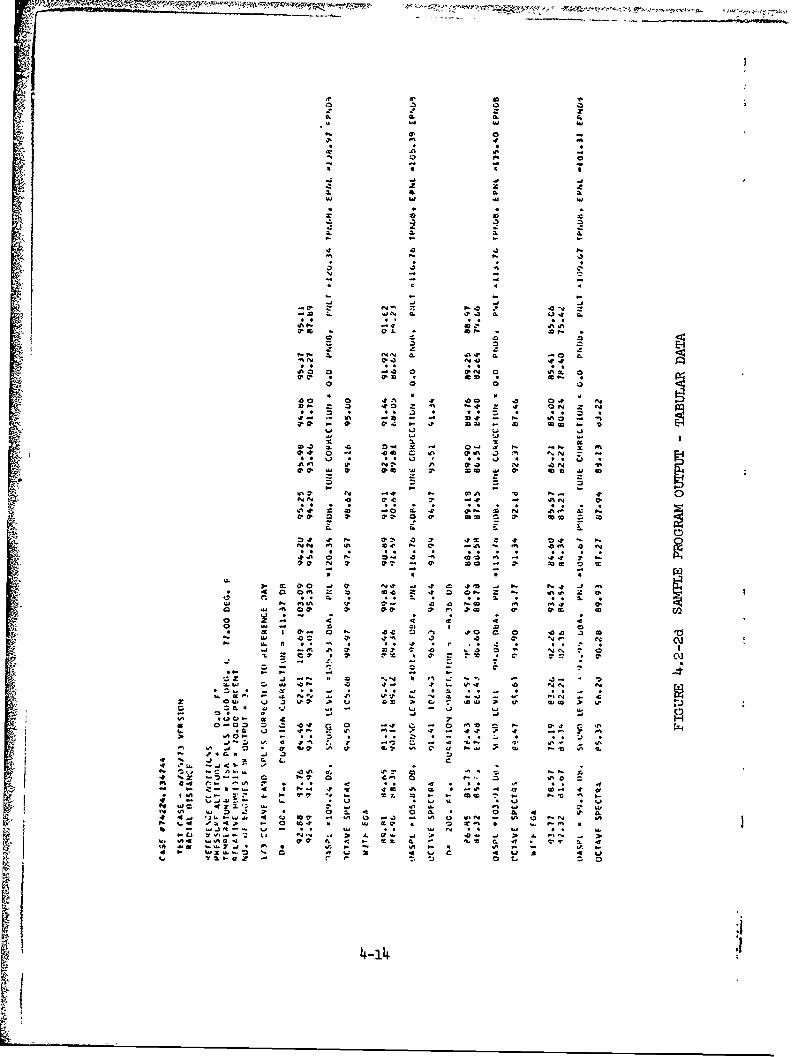
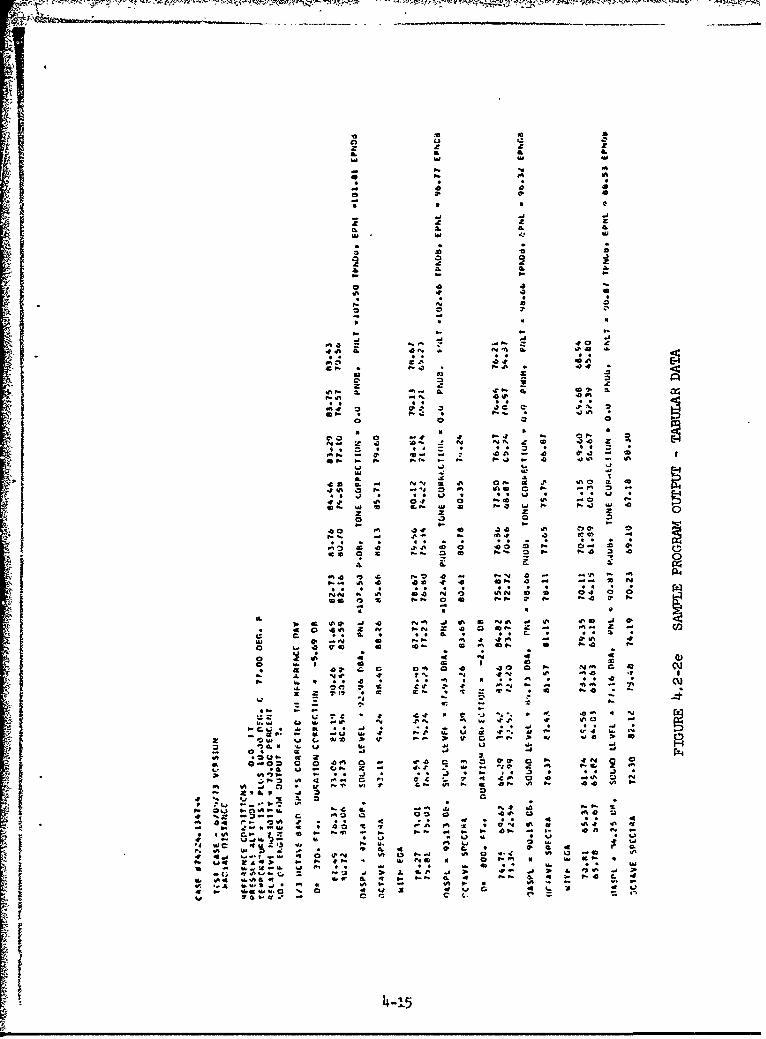
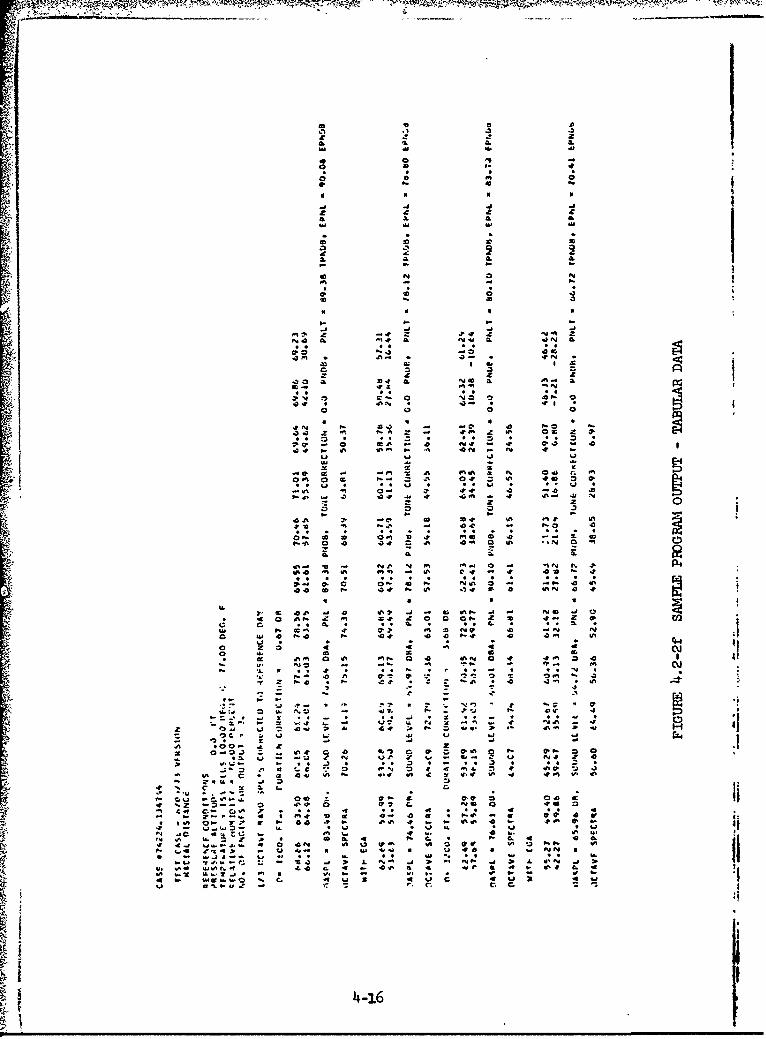
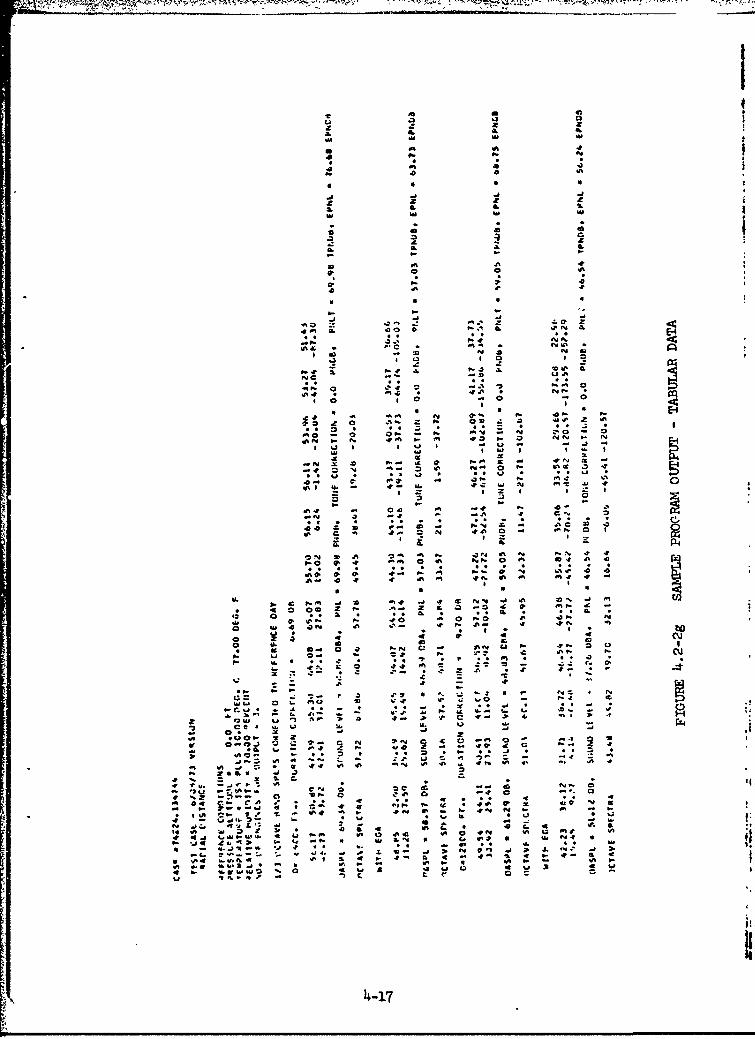
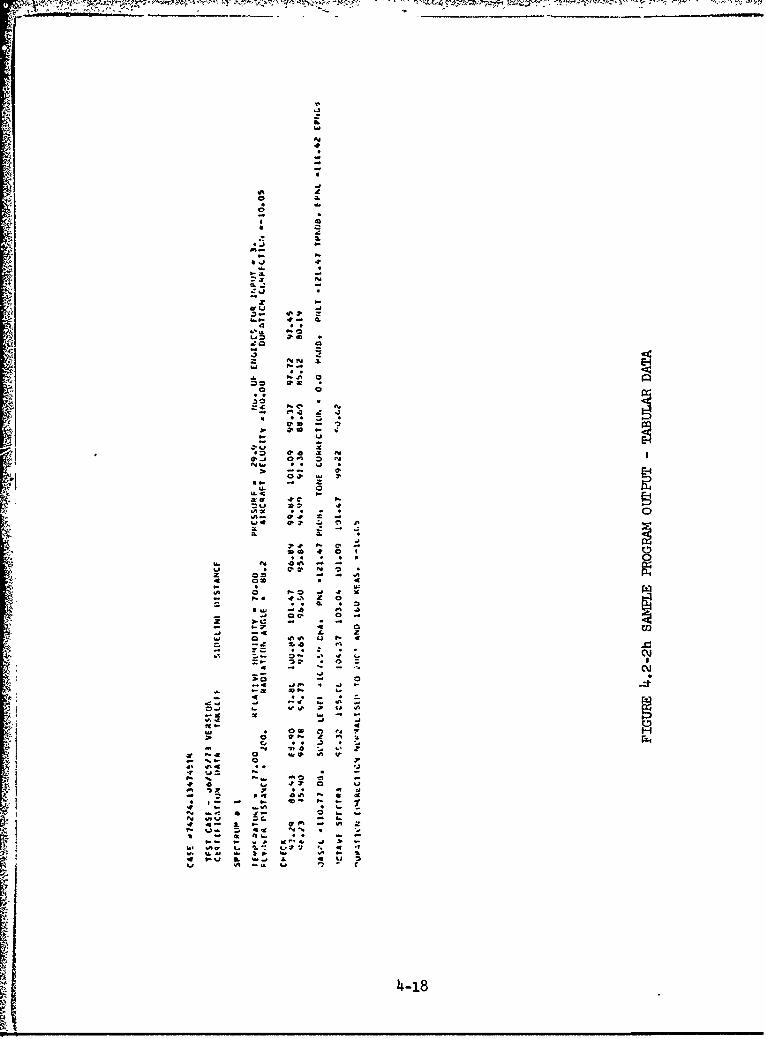
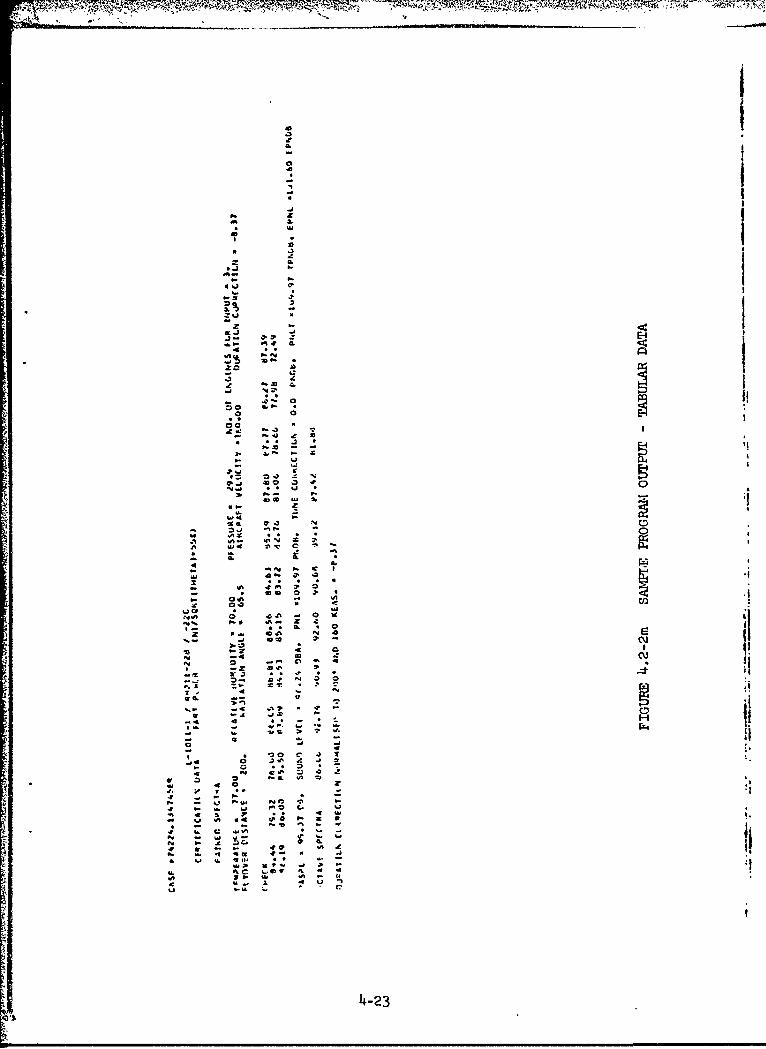
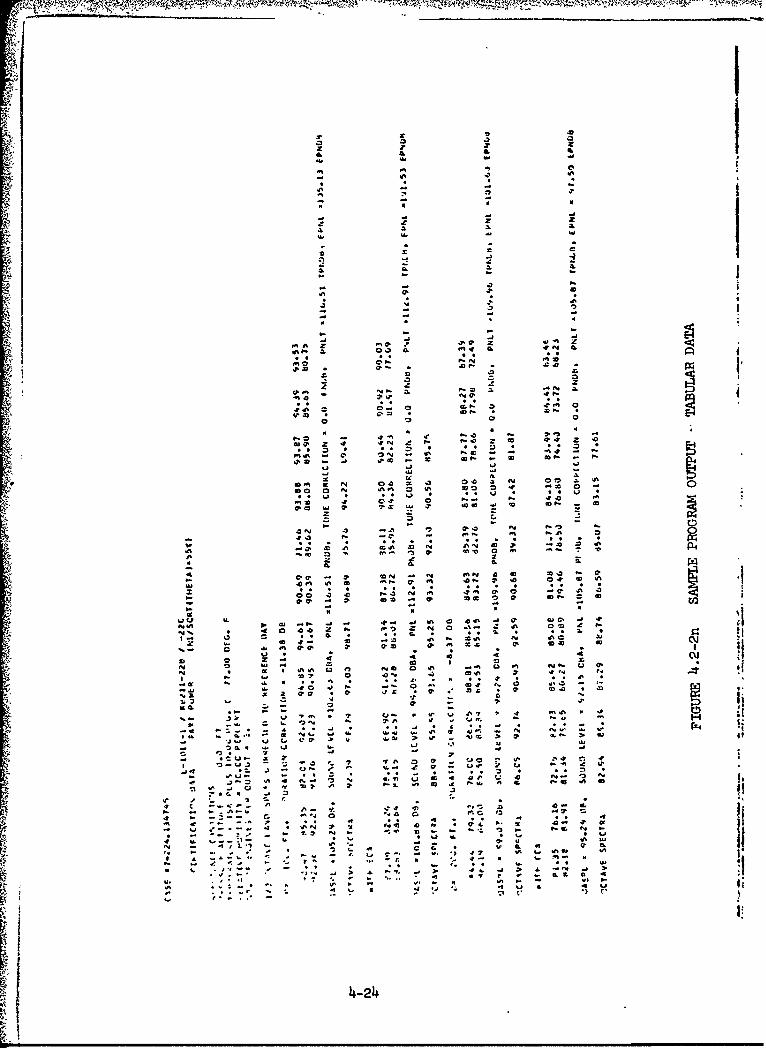
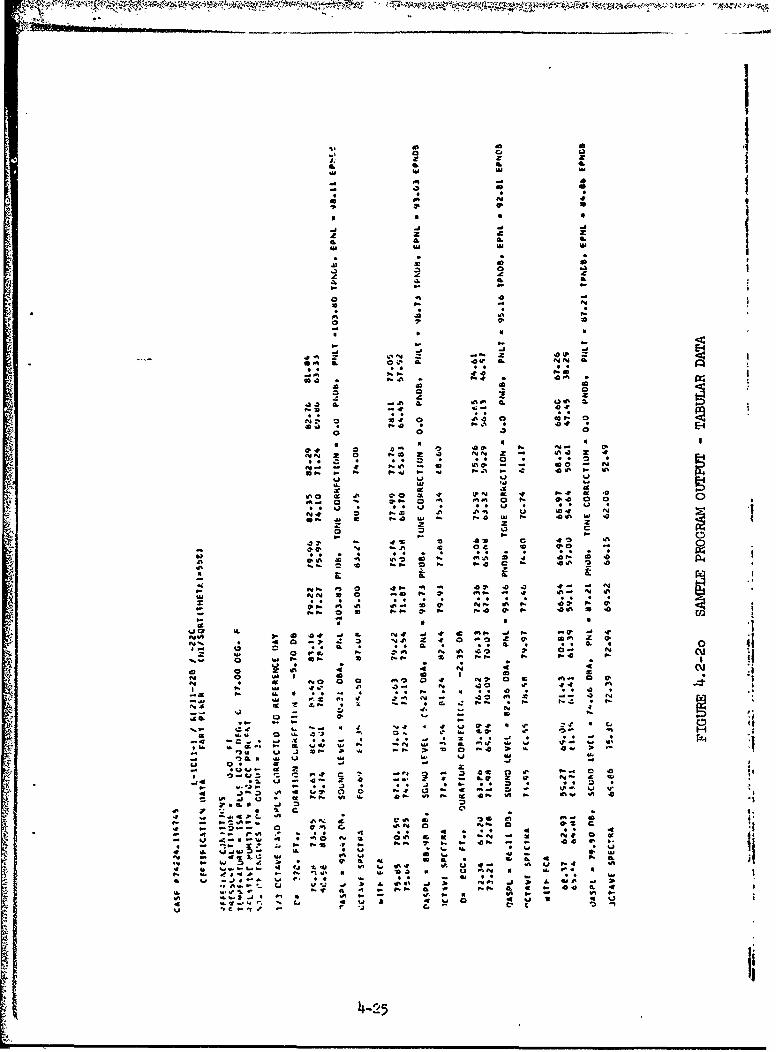
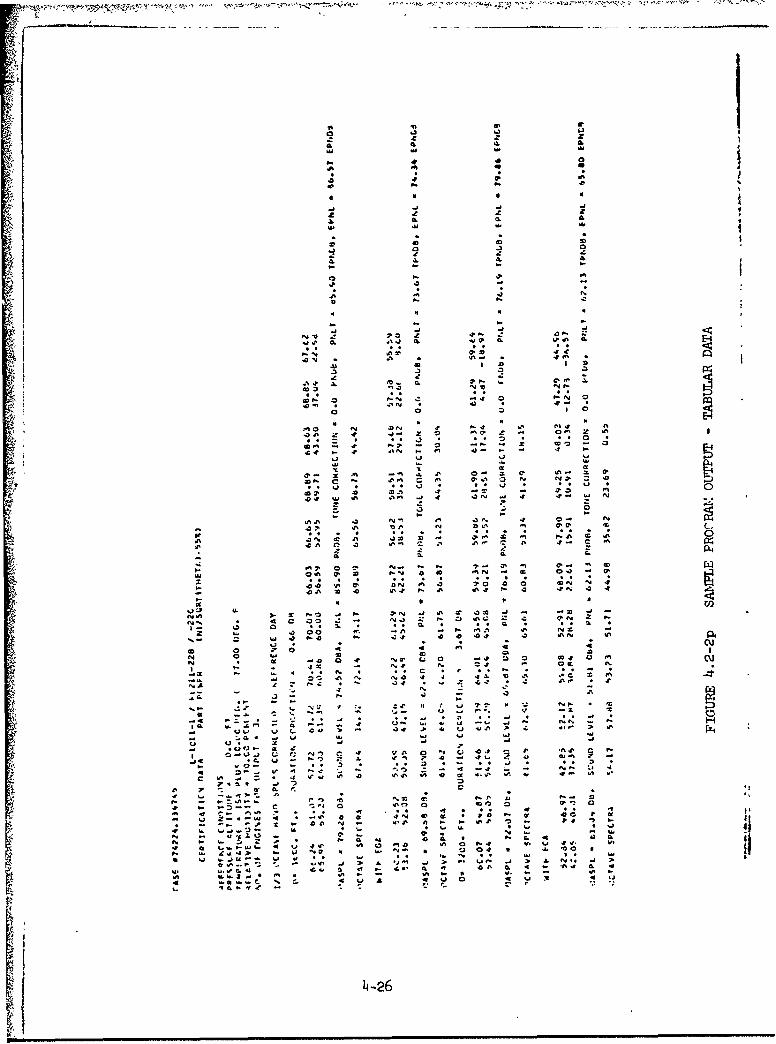
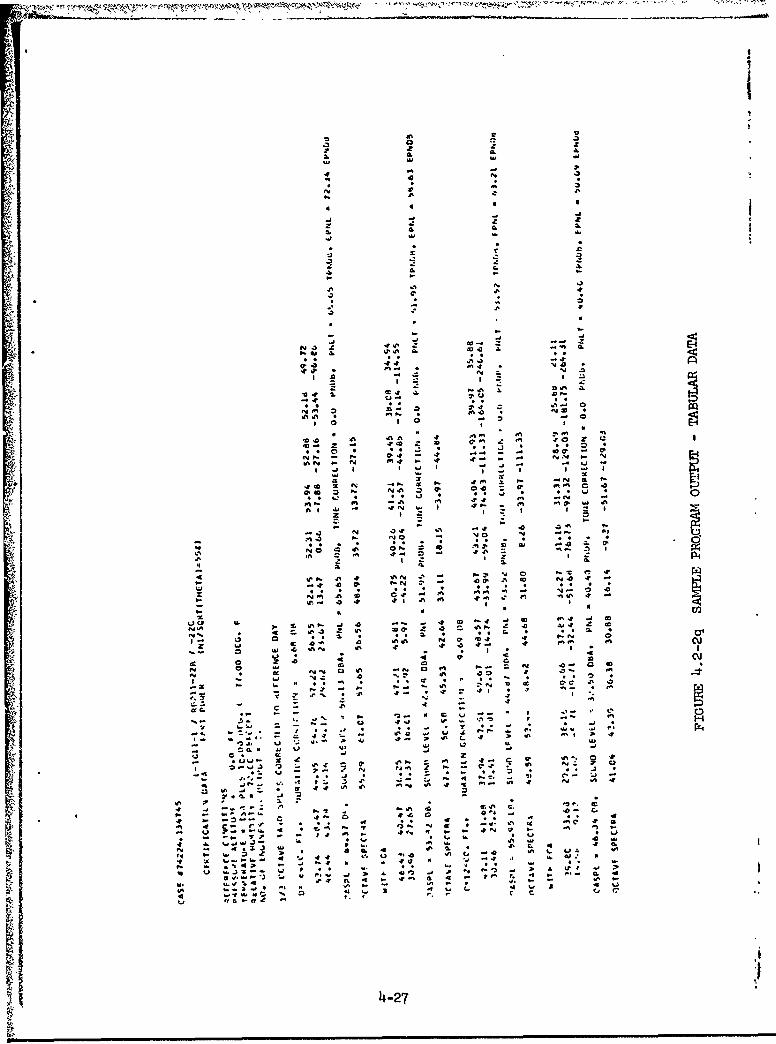
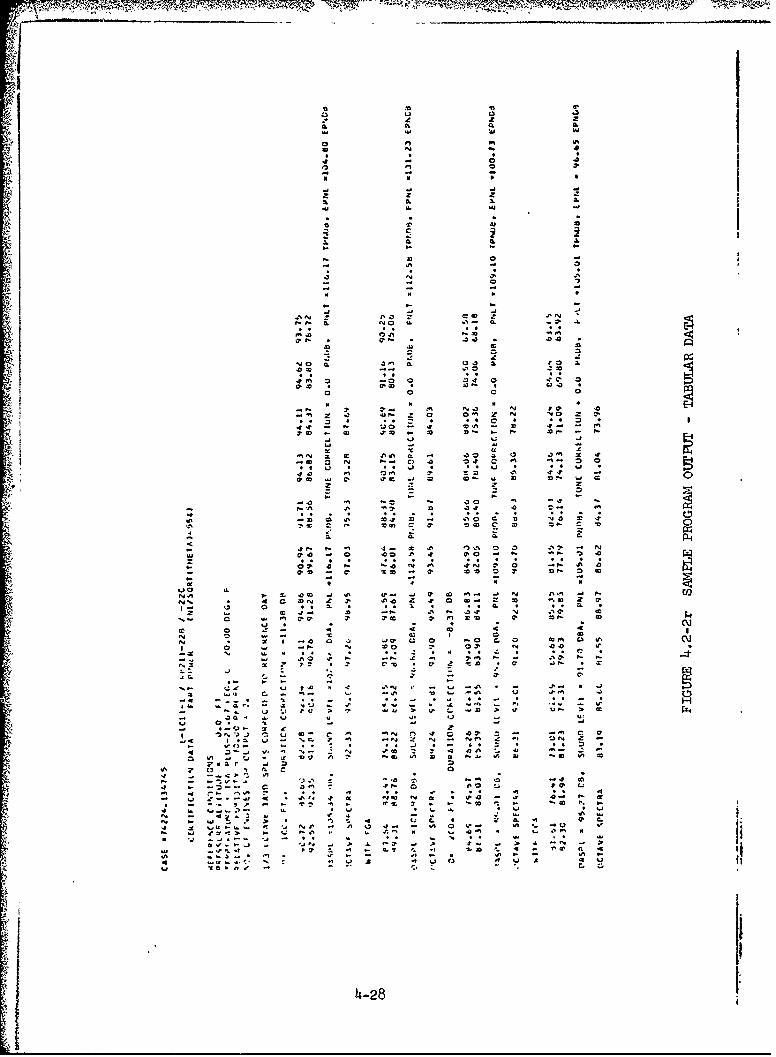
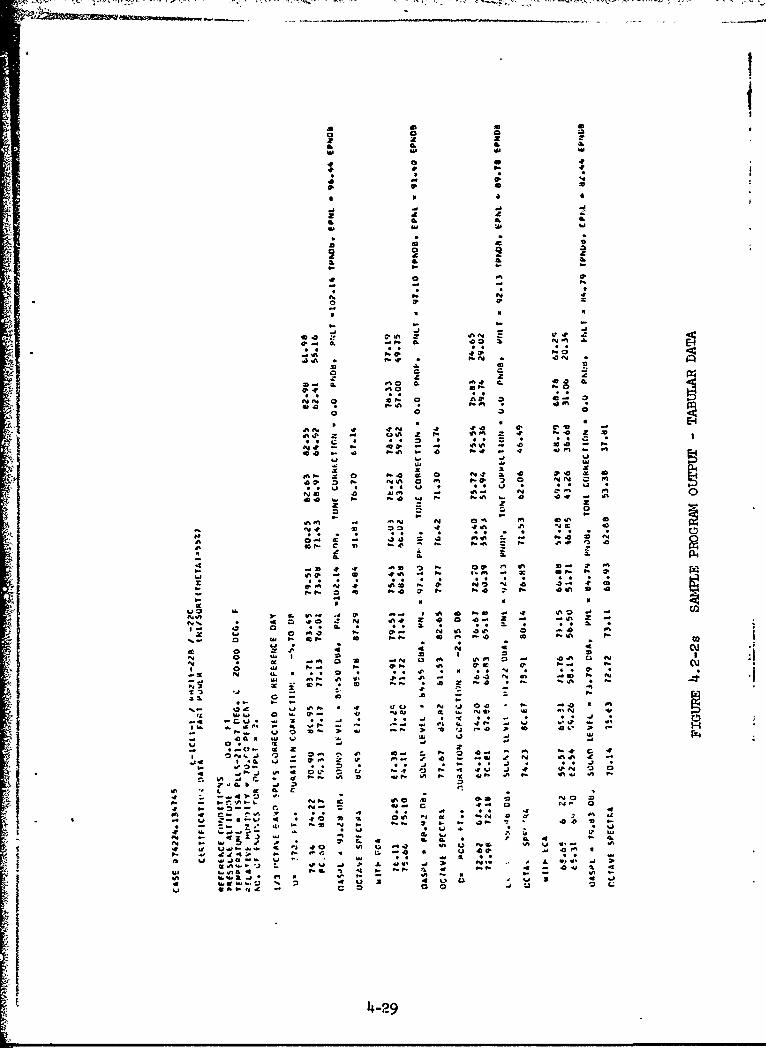
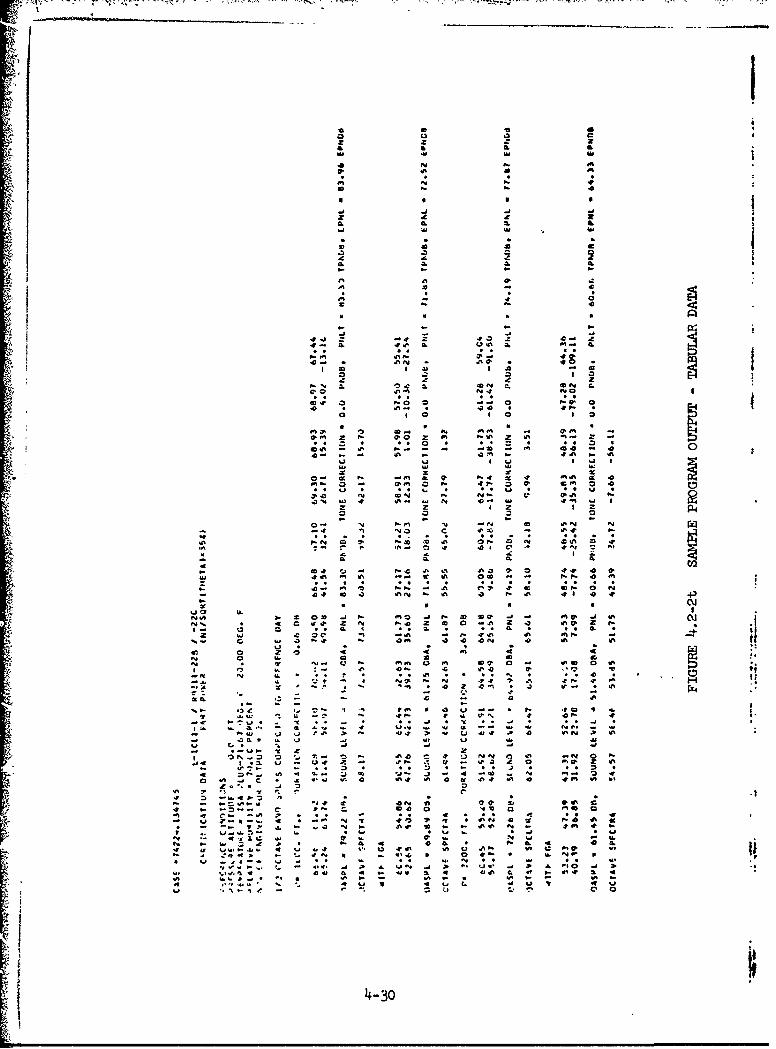
4.2.1 Noise Data Generation - Noise Propagation Program
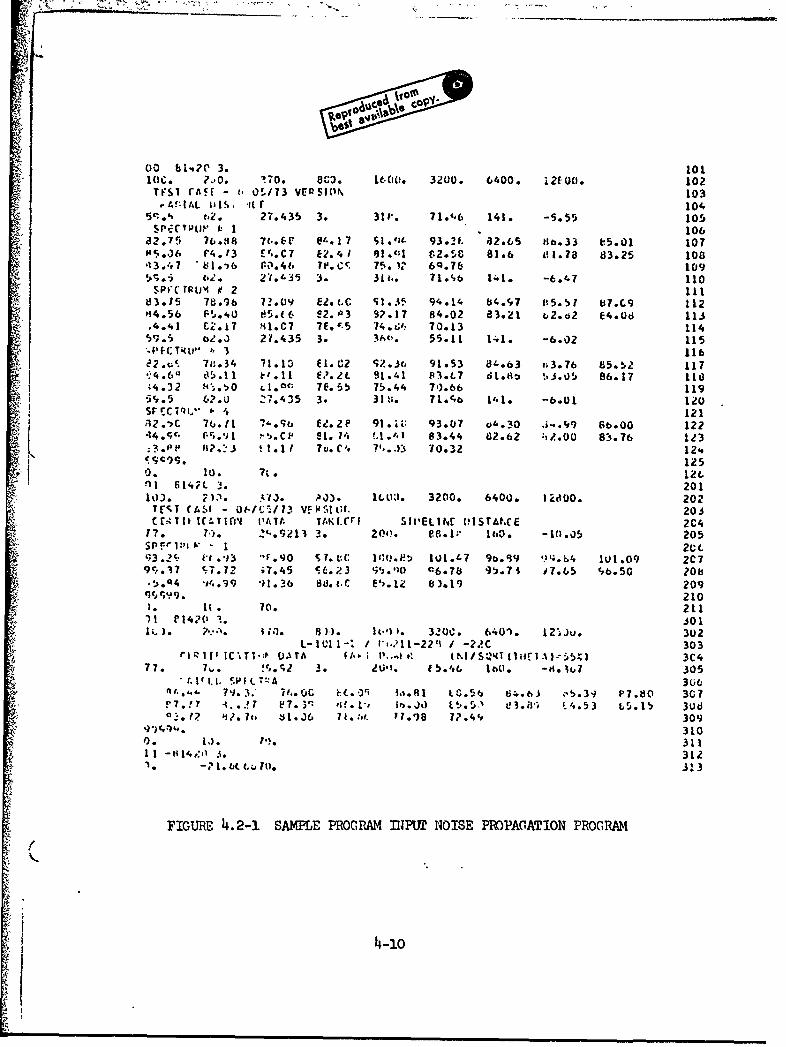
Shown here are three cases run on the Noise Propagation Program: one
showing the averaging of flight test data from Reference 4, the next
showing an input of previously averaged data and the third showing
multiple output conditions. Figure 4.2-1 shows the input listings for
thes- three cases and Figure 4.2-2a through u shows the tabulated
output. An example of plotted noise propagation results - effective
perceived noise leVel versus distance, normalized to 160 knots, on a
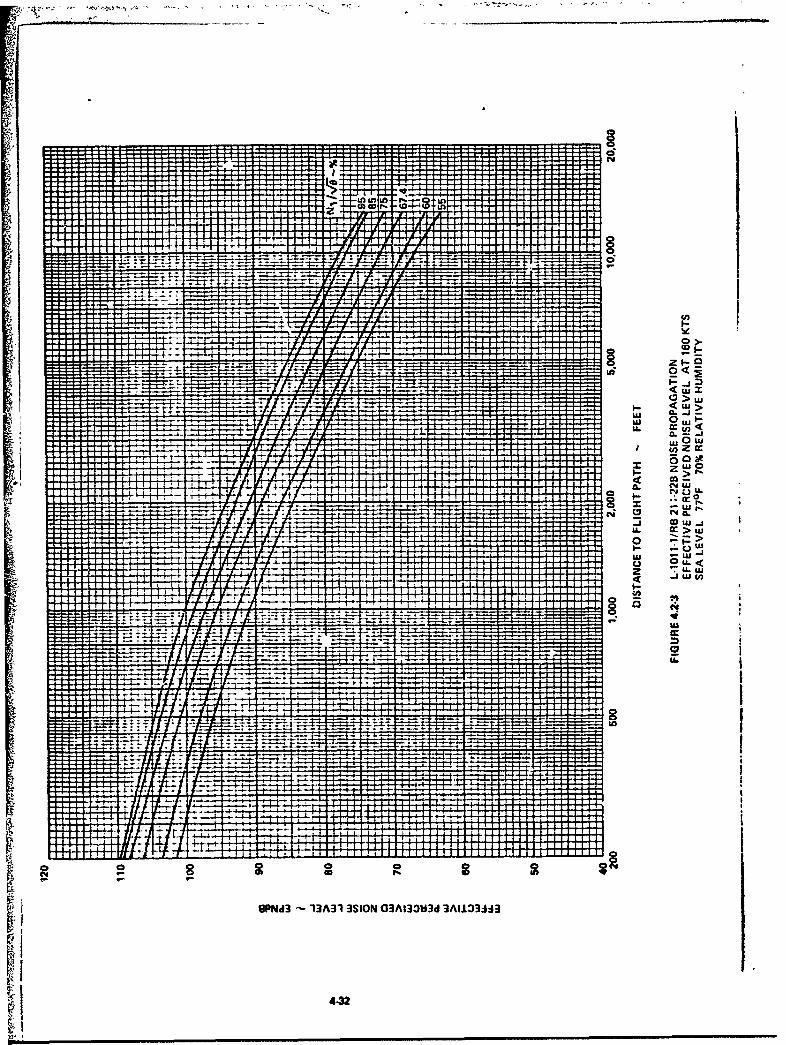
FAR Part 36 reference day - is shown as Figure 4.2-3.
4-9
tel - Jj.% 0-
00 b l.20 3. 10110c. ?.-0. .70. 813. 1600. 3200. 6400. i2f0(. 102T'S1 (A.( - c. OS/73 VCR5101% 103
e&f'1AL IJIS, it r 1045s.*% C-2. 27.435 3. 31V. 71.',6 141. -5.55 105
spl-'C i;Ptlr L 1 . 10682.75 76.88 7e..Lt' el, 1 7 51.1;1 93.21. 82.65 fib.33 :5.01 10705.36 F4.13 0 ',.C7 E2. 4, 1 el ;*l C.2. 5,C 81.6 t,1.78 83.25 108,13.4,7 " 81 .- P6 N1. 4G e 1oc.ý 75. )61 6Q*76• 109
• 6. 2.1.-35 3. Rtt.. 7 1.t, 6 141l. -6.1-7 110s•P UMr~up 9 2 111
83.15 78.9b 7U.09 EU.(C S1.35. 94.14 84.cs7 I15. 5 1 7.C9 112'44.56 P.,.40 05.f(6 U2. 3 92.17 84.02 83.21 bt2.2 E4.Od 113
4I I4.1 CZ.17 '41.C7 7c. 1.5 74. t4 70.13 11459.. bZ .3 27.435 3. 36,. 55.11 141. -6.02 115'-PfCTIu" , 3 116
.e2•c 7tn. 34 1.13 fl. C2 qZ. 3(, 91.53 8-.63 t3.76 85.52 117-.. 63 85.11 e,. I I e.lt. c 91.41 F3.L7 dt.tlo !I J. 05 86.17 113-4.32 14,.t0 .1C", 7E. 55 75.44 7#).66 1195',.5 6.u 7. 435 3. 31,N. 71.4,b P.11. -o.01 120
sr cc .1" Q ,1 12112 .')C 7G.fl ',.Sb fE2. 2 F 91 .;: 93.07 o0.30 . 86.00 12244 lc.- r.i 1 .65. C v1l. M (. .lA. 83.44 02.62 11.0O 83.76 1e3;3 . p F t, 11." , !. I 70. C'. 70. ..13 70.32 124Selig. 125
O. lu. 7t. 126
*) I 614;L -4. 201
10). 2)". ... ULM. 3200o 6400. 1 U00. 202TEST fAS. - U•,r".73 VE1SILt,. 203€C ,ATlf 1C'-*TlfI', I ATt. TA'KI.('ri SWIELItE VISTANCE 2C4
77o 7.). 21,.9213 3. 20I) V,. 1 I"so - 1•.o5 205
'.3 .2' V( .03 -'F. 90 s 7. VC l'm.l : 1I0.1-7 9b.99 9'i. bc4 1010.9 2C79c.37 5.7.72 ;7.45 S.o.23 •';.'10 06.78 95.74 07.45 'b.sc 208,.5" 04.19 91.36 6d. 0., E'). I2 8).19 209i5P9 . 210
l. 1( 70. 211")1 P 14.?0 '.. -O01
1I.I). 1','.'. I ,3. 8 )). I.') l. 320C. 6401. 2"•ju. 302L-10I 1-1 / r2,?11-225 / -. ?C 303
r'l~zl|i IC'%Tl,:IP UATA I1, h 0 L. • ; . II S q I Hr A .b • 3C4,
77. 7.... :"..W 3. 20'N. I 5.',#G l0. -A4. It,7 305"It f 1. 1. SP I LT%:A 306
flL..... 79.3. 71,.o C hto or, 4i.R|I t 6. 64*.63 -5'o.3" P7.80 307!'7. ;7 t. .. ?• L7 . In",. J0; E. . t'... Sl I 3.ij'i E ..5 3 L5. 15 3Otd
-. 12 1?. Its S1.36 7 . :.. 17.98 77.o4( 309
44.4 -,,. 3100O. 1). 1% 3111 i -,H14•,," 3. 312to -? 1.• ti .;, 1). 3! 3
FIGURE 4.2-1 SAMPLE PROGRAM 3lIPUJ NOISE PROPAGATION PROGRAM
¼.
z Z 2.a IL0.4
N.. 8 8-(P
OZ00
-. 0. .8.80
.3' 8 8- 4w .3
4% C= 0 ap4
.A A V
F. 4. 0 .
-'3j-40 A 4 -
UI T
~8~ 68-.'. 0'
-n l. J HI
w. - as .1 w-,
-- C -- Z0* 2N
4 ~ ~ ~ 'P -q7 & J4 4 24 4 A
A4 AC' w,
034 Lo 0 4ý
u 21 V Z~ 0 DV, ata
* 'N 4. -~ 4 .4 0.34-3-% 4
"A t
CL 96 I 4L
'a Q. 04 C
0~~4 t.u 2
L6 cooU
go a 2c
4*0 f44
co v 5 w -i2 I D
N.L 0. z z- 0
-4.6A w
-l ow .5 C -
-11 4 00
.0 A
*m -'4 C. NO 3 *3 IN.5~C t 4-5W
PI0 0 0 0
0- 0,*
~~ CC 037 0O 0 4
-~~r 4. .
.4- a5. .4 j U
o- sfl 14 *4 !L.0 - 4 CN.J~ ~~~~~~ **C*. 3 4 N.) * 3 * 4
7..
3.4~ .30 Li
0..N 44 0
- N C6 0 40 4p NCL
011~~I w 4 4O 4 4 4 4
0 *Z
4-~., ~ 0 4-12- 3
S IL
co.
a
C P-
0 10
0 4
-ra-t V
0 u.
A.
02 1
a- C. w.
1 Q ' P. al CO O
* 4
"# 10 0 r p '
an c
z. C! 0
w0M 0. 40 0
cc 10 a3 .3 c
V- a - y N.
a (a J.-
-. 0' N ' N. 2 'O
- 3
NN ; . N .:' . -. 0 .-J6 CJ 400.1
*0 A. V.
z4 % % 4 T CCO 0 .t~ .t '00 .0 .?A
.3 4-14*4 Z . O
Go 1
P . 10 -.w w
a a I
e to
m . a. 13 4 . 4)21
C4a
U.
a. G. a.a
o9 4 2
-4I
to0 to V.3 0vaIL4 v . u"
1 . *Q '
Nd~ N4 NN
r 4 f-4
A Q IN N 3'W
- I- 4r N
'j . a. - N'I 0 1 ON U ' lA. a.2
do1 _"G a.0 4 a0' P.
4-NN15 N * C C
go V
& a. a. a
W A. di
CL
zc~ .0 L, P. *
C AE -m 3DC
4.3P 4. A
CCA a. i. C C
0' .1 CZ .O .0 ca
z 0
cc 04 A' MD UN m %
0 4) 4. 6-3 4
00 C& CE-.1~0 41 S 4
a.: a. 0. 0
Ow C N 41 'E AN C
4441
z z
C. N
cc a a
wy F. W w
a.Z 0. -a
-r -t
0' 0 in
9 N 3a
A L -j'
2 I S
N NIL
.4.4.4.-~ .. .3* .~ ~ a li
.gm~I a.cu a N a
4- 0 N N
vE a. 0E ~ N 0. 13 0
.4*~ * N -0 -
30 022 W, 7a
*. ~ . . 3 I * 3 ** t,
4-17 N -'4- N -
a
-4-
z ; w
t4 4 4p 0
4.a
C.0
-"
~ 0
4P 10 7
a.c~- .
0,4-18
ILIZ*0
40 4%'%I w IwC4o a a
3 - --
Z P4
-a 8 3 0 4%13a
Z .fl
4 v
- W
9. W.
4-19
*0 'S C *A
.2 U 42
* 44.
a a .. 04%
Z... i . C!
0. P. 3. Q
4; .41 Do,-. 4
Q3 C
a, 0C. wc3
L6w N 0
ki CU4
- -CI 4. a- -3 -ot
a:' Cc, 'a -0
A4 A 4w '
4'N 0 XN * 4 4 l
F4 fm 4:
= A.
*4'4 r c 46 0. Z v4 3 ' ~
4-20
'ai
doU 0
At£
* .S
IV z. 944
.8 0.-
- -4 0 .1 :. =.. .If4 - c" P. .
V_ F.l*A 41 C% ft
04
P . C,
4 8 M4 .0 al C 2M
a
a at
00
:3 3
NW .s 40 : 4 -
U0 I 0 f-
V. 0 0
ft IL - CLO -1 46 N U ~ S'A4 00 ft '4 ' M PC 0
w a 4. . 44 * *4 U * ** '
NC - P t. 4 .04 P
4-21 4' P.? 4' 4
ILIL
40,
46 4L
em
C) .0
ry r4
zly Z.
6 .2 43
JD P4
1-01
w 04 Q. 4
C40 c 0 a- 7.0 ey cm
cm
P4
r7
'7. C,
-44
r- 4 0 4P
41
10 C.tj
!Ljn n
4-22
-. 1:
00
m .3 N
9--Z
m 3m
w
%. 3
. 30 C
IL 0
C.9
3 c
-' 4-23
~T4L
OR t a--
.0 -Y-.Al.. 3..-6
CDC
-- 0 IIf
%0 -0 W% to D.A dA 0 C.
to -r - rm-0%. a- (P ZJI 40*ID 0 z - coJ .I q, C
IA ~ eto 41
IC U
4 4P
0 ~ 1 43 0 m fW, N-U 4
4-24
IL IL
IL 4I
E-1* N 4L
3 0* 3.g
a 'a (p
0 0..0
N NN
w f* 4) 'o n
U-p Z . 431. 0t .. 0 . 0
r4* .
0 0- 30-
a4 t- NE ~ P Eo 0 3j 1034 1 ý
14 1 9K4 a 13
C 0 40 N I
rU m C.
NJ a P..P44 C
j~ 4 NC U * N U, .OU Ni.3 - z
4-253
4 ca. 6-o 0
A Nl
4 .4
a. a
N., 7 0 'D
o -o w% a
ca o 4iN
C 4Q
7- T'-
W, w -% l
4P a a
4-26
AE'
A Iz!
up 0 C.
w V- j 4 o P-4 w
7a . O , C I
F4 -
NL w
I. 4'
ri -nqr r
L e: ca "• 'f -ý.A'
"aI.t •.{1 .• a, . ag I.• • •.
, o . 7 oT
-J~r 2I qlt • q" . . . . 3i.
"4' A"+7, , -
"" 9 ' If a I'
4-27
N3 .a ) .- ~ a
S. . ..3 ; + -,, N .N..= 34' 3.
.3?-Iu~r a. ~ .~ -4' a
* N * *. ...
U 6A
* N 0
fy -~ C a
10 w
z 30 01 z
.4 .4 44 1 . 4 O Dd
4y -4 -
0.0,
-2 6
NOLf .40 .*
-Y 10'4r,9 99
49443 -28 . 04
4L IL
o 0 0& a. S. 3.
0 U4p
14 1: 0* a
0 a - E-
0' .0on Z
in f.4 at
B 04 $A 0m M - r4
P" NN NI
Io P -4
o- N .2
NQ. ft 0.
W% 0
cc 2t L2 M W 2 3
I-~~c c c.VO .4E G
CE &L04NN IxI0r f 0 It
fQ IV E
l . , 4. 414
w It r,'
4-291
04% I.go N 00 N
1A 0
n I. -to
I U I
3 3
A 4'4
-ý 21 0 DF-
NIA ...0- - tc
0 - I % Itzc- -9 In P.
'.4 .00a a 42 ft ~U - cof' 0 (I .0
P-tr In f
T. j% t% N N .cN 0.
4f -r -A V #- 0 N'
4D ID 0 a
aI -4 a 4 IL -4 - .C~ A C .- C. f4 N I
U~~ ~ It.4S 1.
4-301
It 1 0
V.1 - P
a a co e'A A
0% M
.1% 91.
40 -C N
cm .09 0 at
z co . 4.V 0. 0.0 0
em N0 Wý 0 .AN.0 0. 4 . In Nv m AN
-jw %. 1o Q If
0 N o
4-31 ' *
CM
Ln gIn r, 0.U
=...- dr
-- BEFr X..z;
A, --- -4-.. -44--.4-
7j. -4-..I
4- - ~ --- _-
4---- -.- +-
-- ~~ -L- .-4
* -- - 4 ( >W*~~C -, 4 I W
.4- -- . --
I A
- 4 00
-r ,.* a ,~C4JU-,~u -- C
- 1 ~ - I. ~ > Wu
4-
0 ~U. <-:~~u - U)
C-Z
- U.
44A44- ?--- -
2 4-32
4.2.2 Climb 'Noise
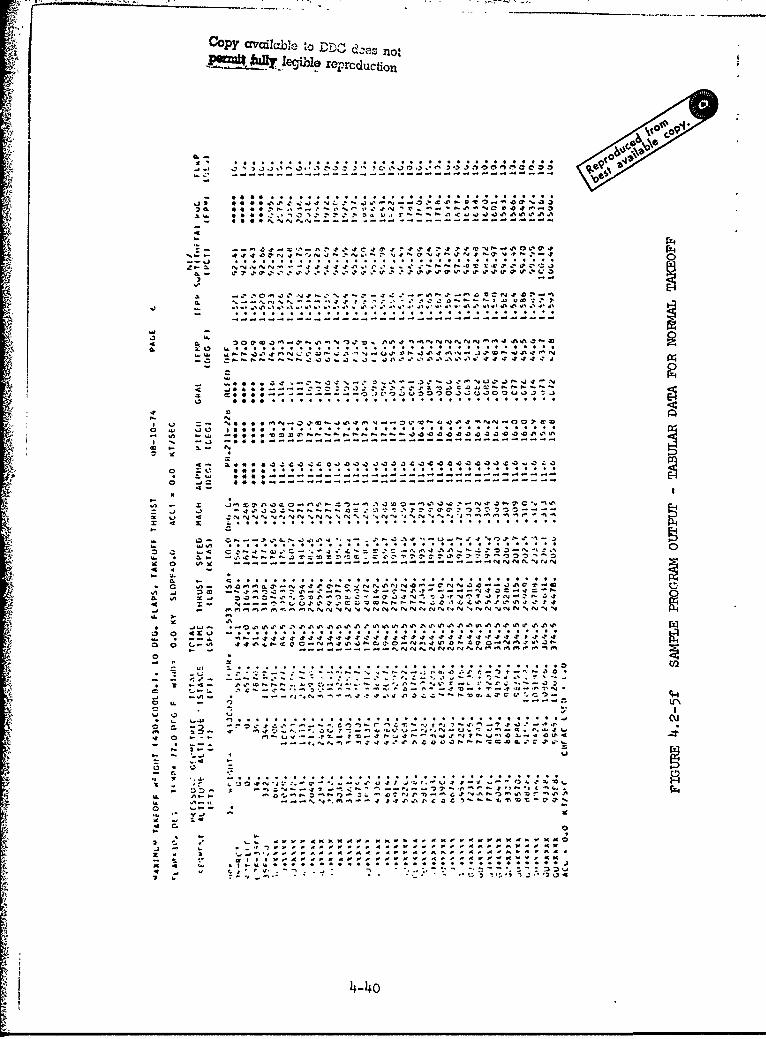
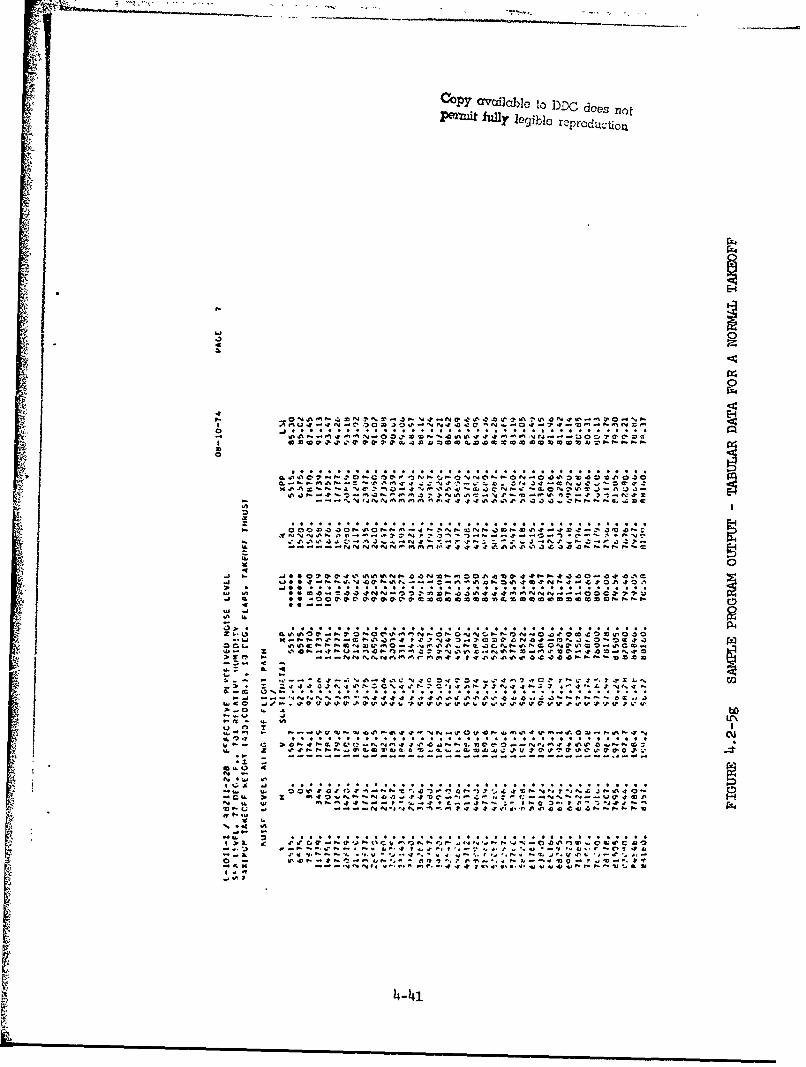
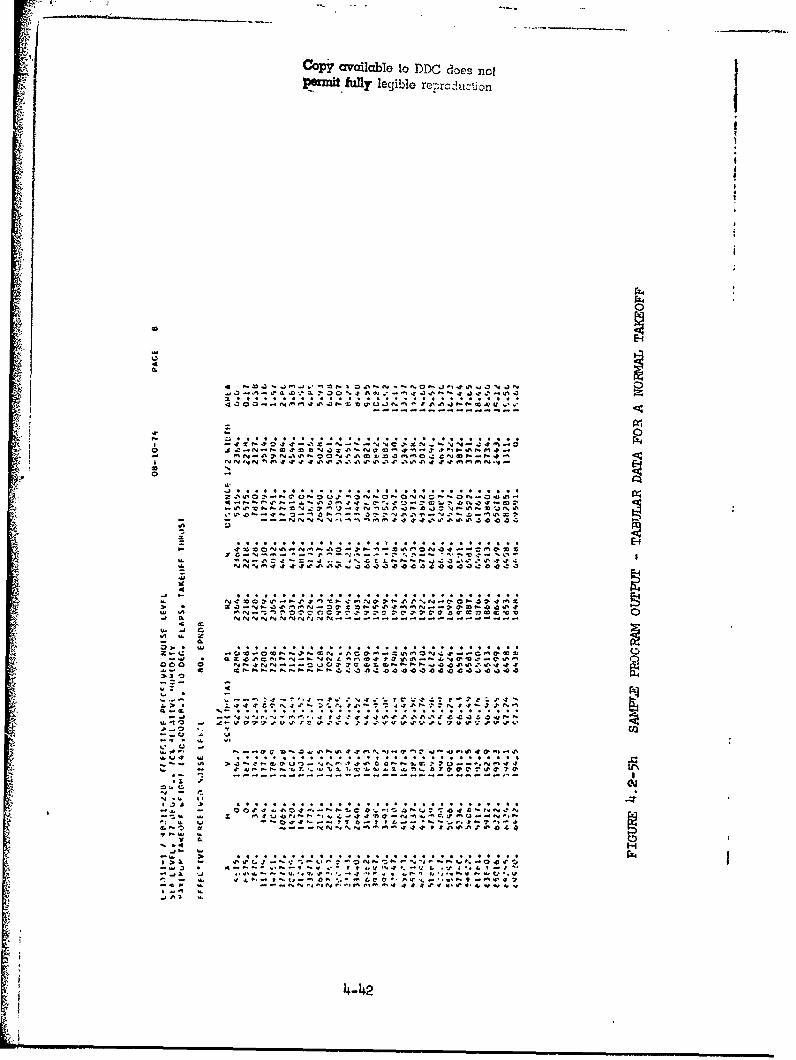
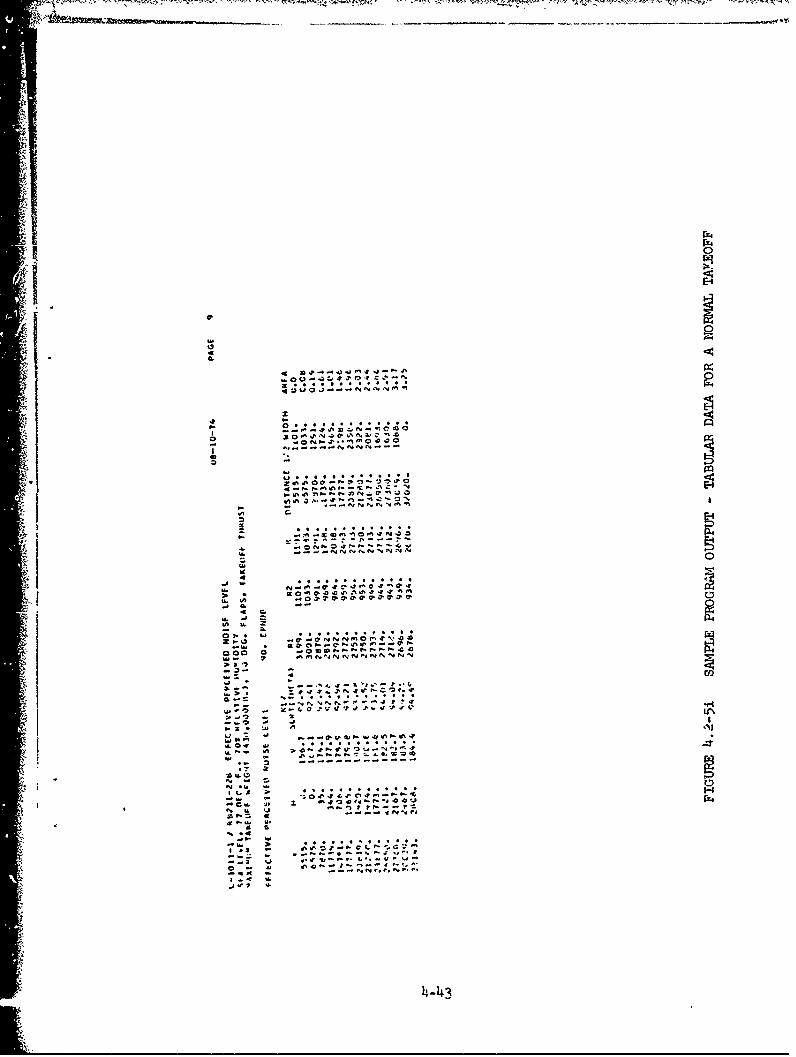
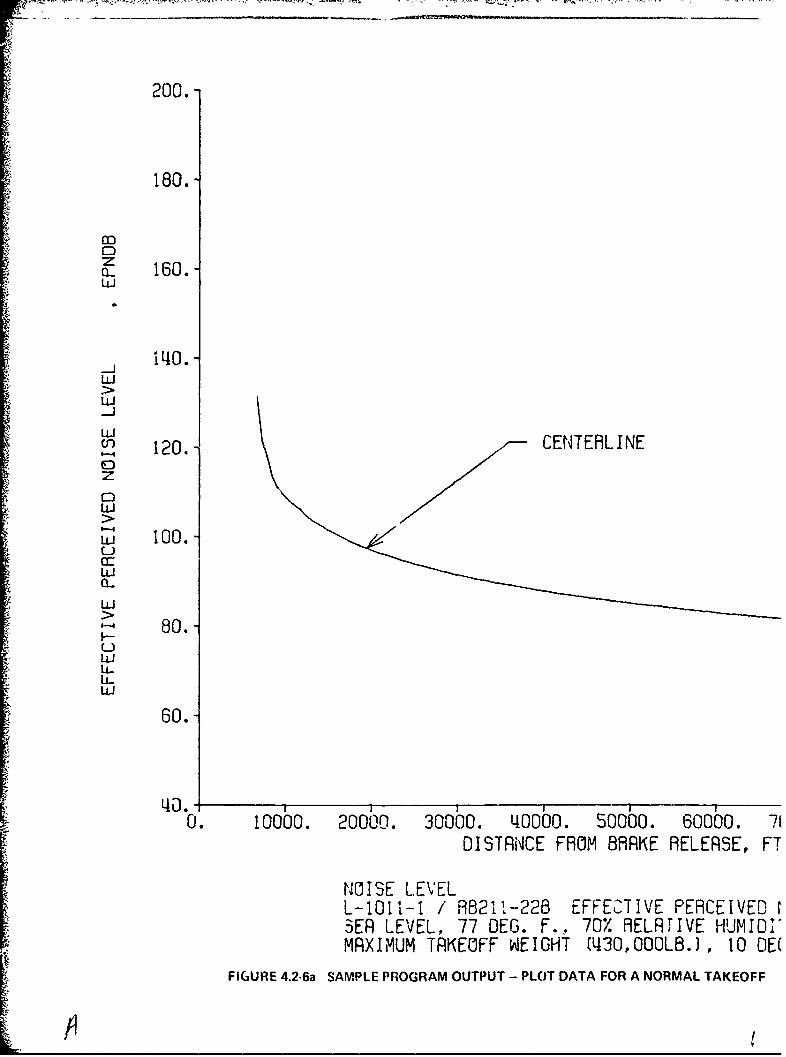
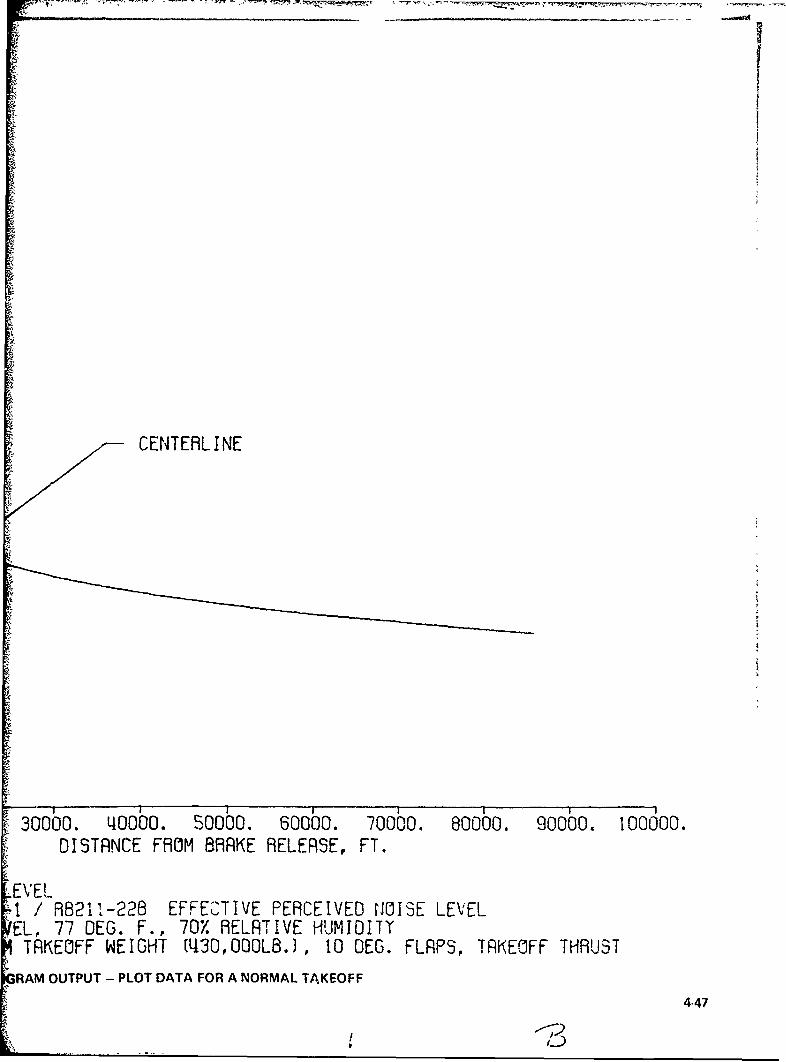
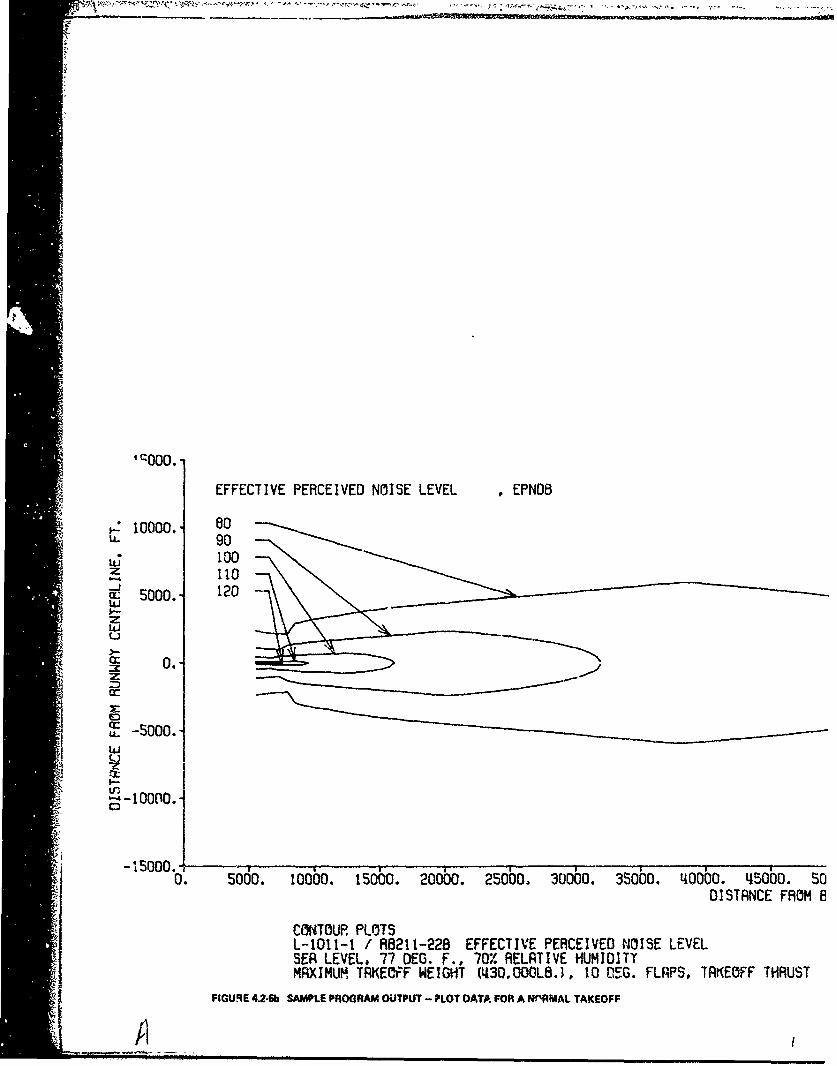
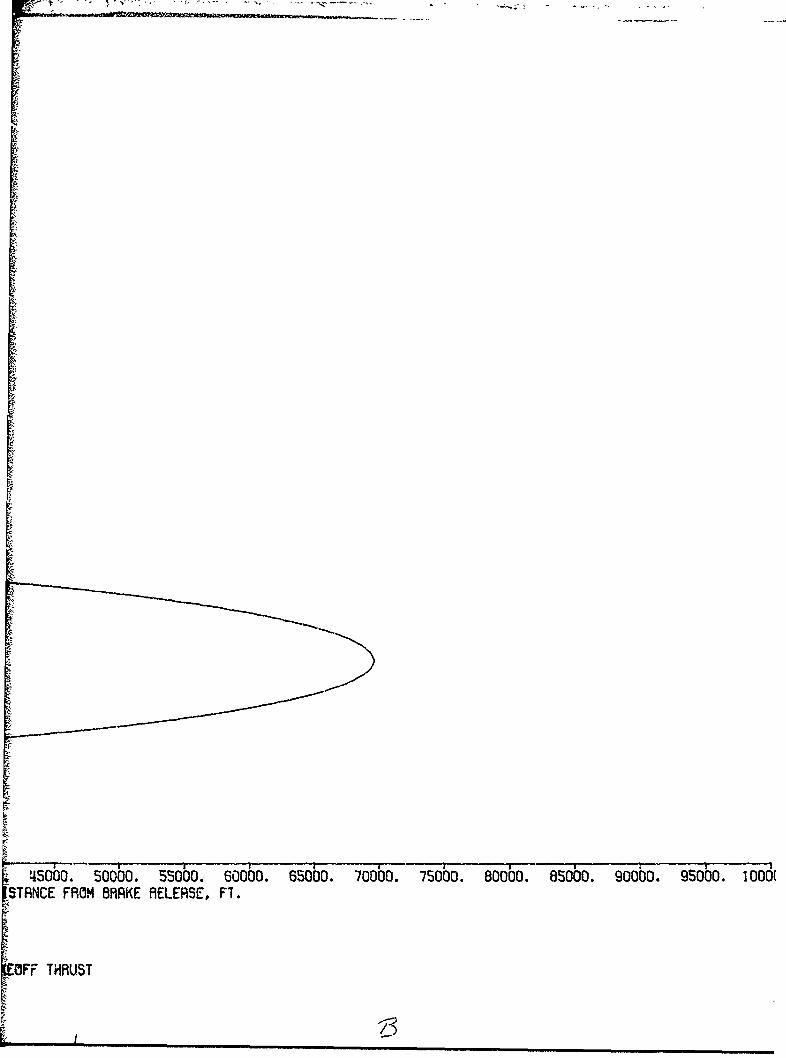
The first sample case for the Noise Definition Prog.am is a normal
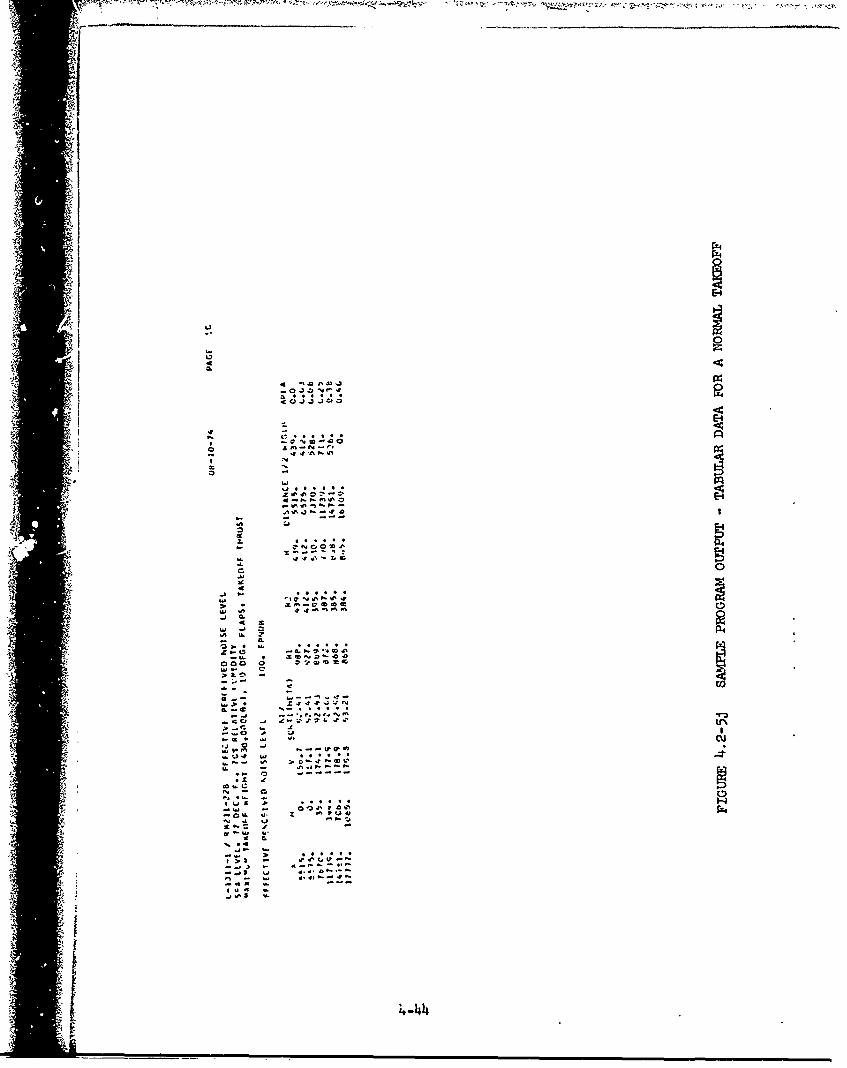
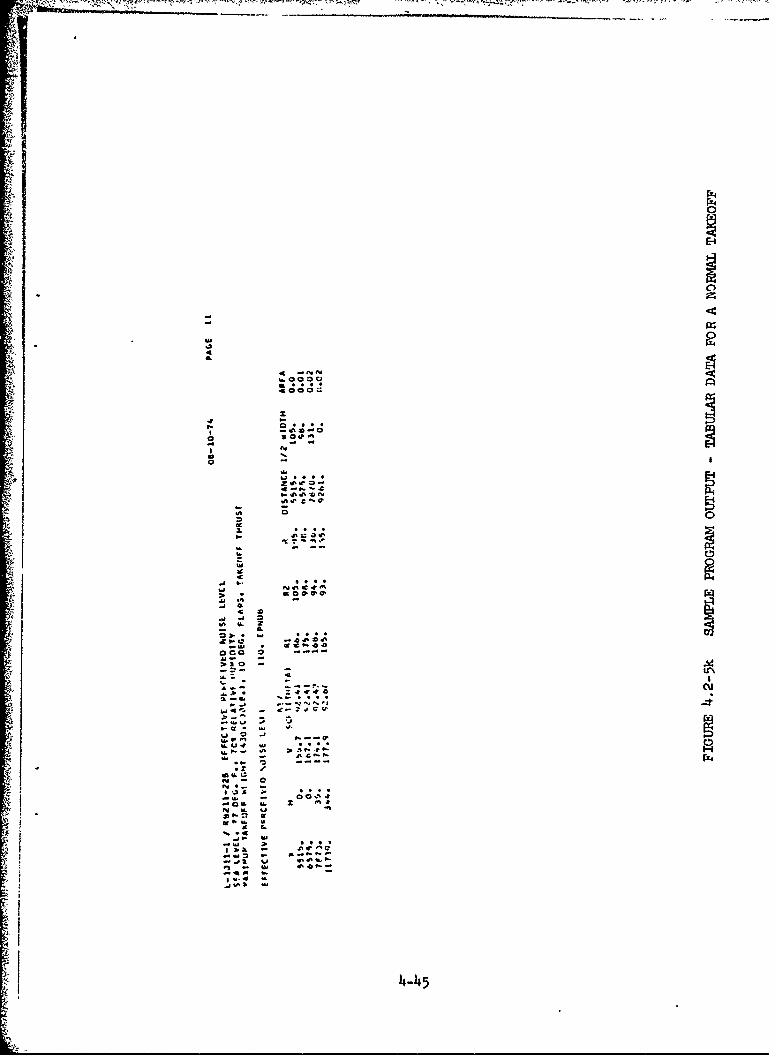
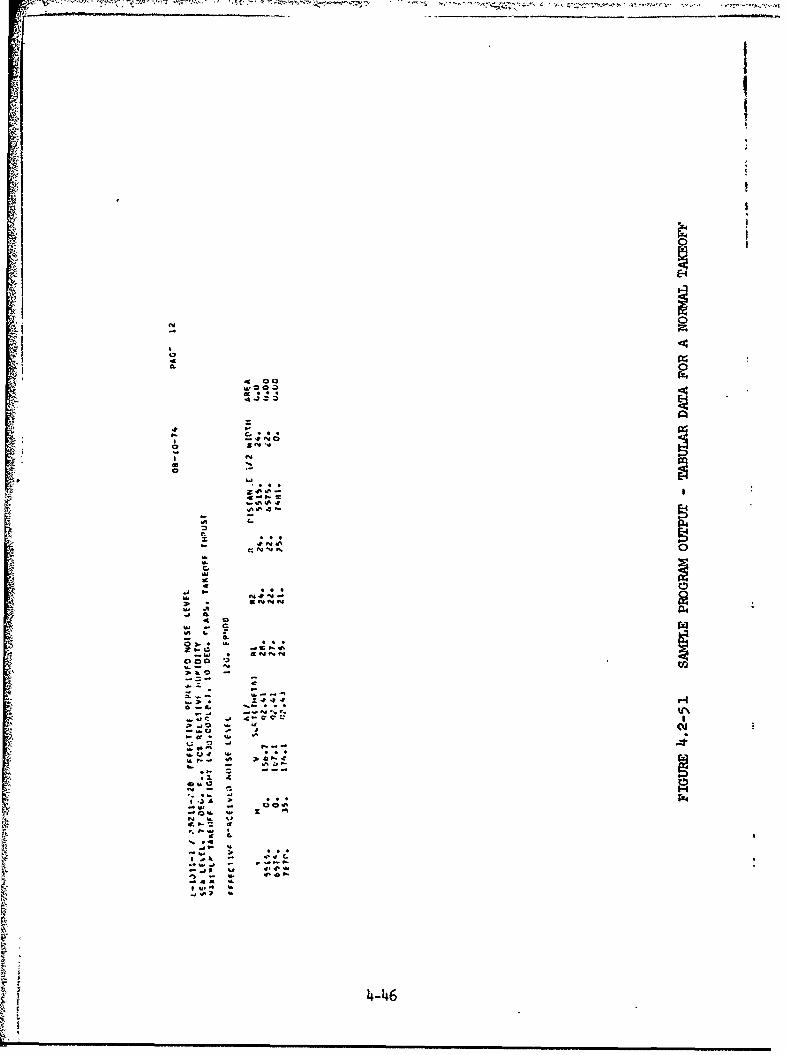
takeoff at the certification conditions. Figure 4.2-4 shows the input
listing for this, as well as for the approach which is treated in
the following Section 4.2.3. The tabulated takeoff output date% areincluded on Figure 4.2-5a through 1. Computer plotted output
showing centerline noise and maximum noise contours are illustrated
by Figure 4.2-6a and b.
4-33
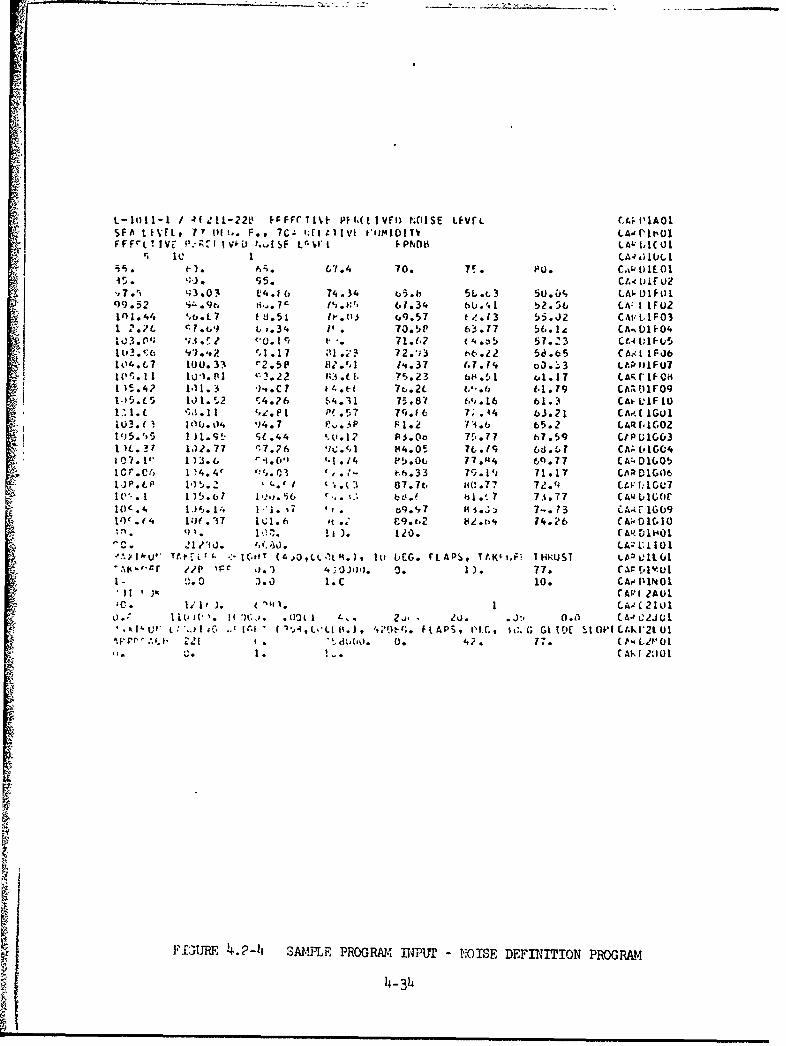
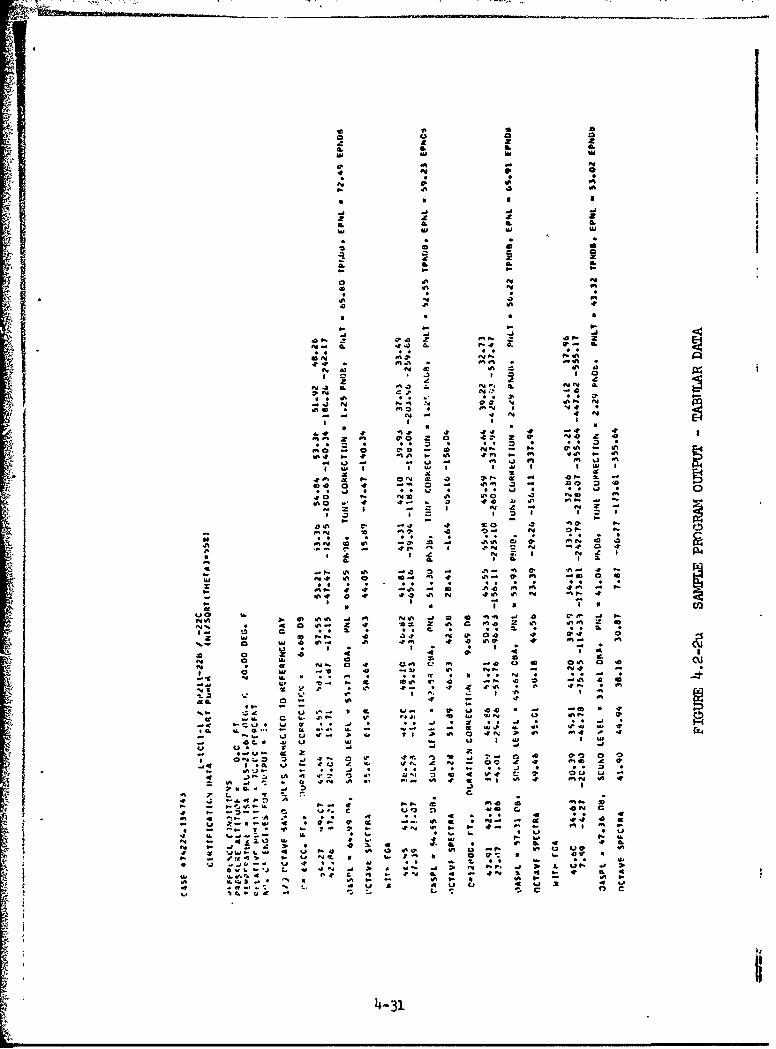
L-101-1 / 1 I L-22V Fr-FFr'.II F PFI,(t IVFI) ;OI SE LfVtL (,4tdIAOISFA L WV L9 77 I11,1. F., 7C;" IJl cllVk t"IIMIDITV L AO I' I 1,0F FF 1 11 I[ V.;,' U N-I •,,SE Lr Vt' F PND6 L AI , IC 01
rC le I (.A;a ULIi . h:. ;. 67.4 70. 7.r cat, C. I EO145. co 55. CtA. UifUZ- 77 . ;3.03 E,4.1 0a 74.34 05.b 5L.t3 5U. O), LAOUI F )199.52 q- .9e. ti..-o7r /%,f,1 61.34 bu.' It. 52. (5At I IFU21l1.44 o,b.L7 I U.51 11'.03 ,0.57 t/..13 55.J2 CAI...1F03I I.?(, Ct.t,9 I.,' s 70.5P 0,6.17 S6.1. CA-.01I-041 % ,. 01; ';34 r * 'AO" . 1 C, 1" . 71.1-2 ( 4 -s!) 57.7-'3 Ct.4 tIF (A•Il• ; W") .,# 2 ',1 .17 Iti 7. 72 .'; 3 bt.,.22 56.65 CA.ýt IF06
104.G7 100.33 c2o5P 11.',1 19.37 (.7.14 oa.-3 LAuIjIFU7I I~, ,. I I W '1. ft 1 4,.22 F13 .( 1. ?5.23 b14 .!. 1 ol . 17 LAr, r If Od
1 15.4? I'l.3 )'*.C? 4 . t- 7t..2L (,',.6 f.1.79 CAA 0 1rF091.5.(5 10 1. c,2 *4.?6 7.21 7. 8" 6'1. 16 61.3 CA- L'IF IUI.- ! I.L c ;, 11ý ',...57 7ocl.o 71- .44 63.21? CA,,.t lGul
lLJ.( '1) U.•0', 94.7 .°3P 141.2 73.6 t5.2 LAR f, L CO21,)5.",5 I S1.(: (.44 .u.1? 1 A.Oo 75.7.7 T7.59 CtPULGO3Il.? 1U)2. 77 7.?h"6 ic.c, 1 84.005 7t., 60. 17 CA;- 01 G04SI07.11'" 1)3.6 ri to'. L.I .4 115. P O. 7 7 "* 41, 6c. 7 7 C• A:- , OG0
S1c-.C! 1 1U4. V 1:.:03c k . .6.•3 3 ,j1. 1 71.17 CAR 0l150I JP. c P 11) t. 2 .. I • .t 87.7t , ( 7.7 7.!. CW' f:lU7IV,-. *1 1 )5.(,7 1 t.. SE f) I t~. * 1 . 7.1. 77 C ALI L)IGOrIOC.4 1.)4. 14 .'1. '7 ' . q.'87 1 .. : 7-. 73 C•.. 1GO9IOC .(4 I: . 37 IC1.6 . C9.C,2 8d.614 74.26 C A |01(,I0:n ;•-(1•', •3 120. (AR. DIF1O
"2"C :1/'1O. ',(, ;it. LA;i." L" 10 1"y. It u' Tt.AO .IG.z (-r O LLItA.), IIt UEG. fLAPS, TfKti,F; THKUST L u I.L G1"4•,-%. Fcr elp IFc J.1 4 * OJO.). O. 1). 77. CA; [, IV Ul
1 1 3k r1A•I 2Aolact. I"'l It j , 1 . 1 LA-,:(2101
O.1 " IlL (' .to j .I I H- 03 2j. - 20. .J:' 0.0 C"02A . U 2JUI* .xi'ut, L:'.. 14c. *,r I, (' ,,4,c,'Ll .), '14. r)•-';. FI.,AP , 'IA.p, PLC G; I DOE StOPfICt.kI'2tL01atv'r ' :. 21- ( 1 '. d (,0,. 0. 4.2. 77. C P Lev (0I
L. .A-, 2'IUi
FIGUE h.-I; SANJI PROGRW, DIwPr -NOISE DEFINITION PROGRAM
14-34
ILI
1-0
3.
NC. Nr: I-
-ý -'L0m
x U,
#4 C%~U. 4N0*J *N - .. -
Inj 1;
w3f I. . tN
4-3
-NgiF
0 ', c- 030aL
7'. N"4 0 14
::i O.,N3N j .1 2 'Z n 'D '3 n80.
o , VC NI N 1 nO- ' -5 z 7
aa
o ~ ~ ~ ~ n 0%-,-%7 -
.C . . - .. 3 . ~:. .
~N~j0 4; 0 - ---- - - - - clO~ C COc 'N O i? N 4.. ~ ~O ~ .O
NNNN %J N NNNN NNN4 N . OOO~O O --- N~ 0%
N ki O O O C C0O.~.s
4-36%!0 c.~C 2 CO.O.
OCpy avicdable to DDC does notPMuuMl*UU legible reproduction
U. I4;
-T" ---- - -"- - " -" 0 0 z C.- ..... . . .. .
e'~- - -~ -P -. - -LJ -0 - -- -~ -~ - -fl .J
o oD
arz C 0";0=C c .
.. .. .. . .... .. . ' ý,• . , . 1, . . . 7., - . ,. . . ,* %
~R
oz- C . C - - 1 t. N a - , 4 0;: M .0 M C I C Z. t I;-
-- I'C~~lfJ~J*'~~ *~o. *00*P. nos4 -3 .. C4.. OC..'.- f, .ýMoo .4
-C-4
* Lr\
o •t •t ••o • *, *C:.p., O) E Oeet ctt4- J .4' • P 0U' t. rP•
----- - .- -- -* -' -U -. -n -
-,I tj f- C 2 4
a..4
43
• ! 4-37

Copy arvcikble to DDC does not
puzul fully legible reproduction
I I)
0,3
I> C 0
•," ,
CU
07 0 -PrT T4
oo
. . .. .. . .. ' .• .-. ......
.- - ------
4--48-,i
0000000 %
0!
4,..... ....... ....... ...... ...- .•.-.• ,.:. .,,... ... .0
a I
• € € € v • • • • € € e • € e € s - . ¢ ¢ t '4
0II
o 1 o .o
-0
*1 000C0O000~0~LM
- - - - - - - - - - - --0 '~
00 CU'J%0 0004-309
Copy avmdwab] to DD' dces not
jegible reprcdluction
A(
• -- * * * * N' NNN *No *e * **
L-
. ... . .. . .. . .. .. . . . .. .. . . ...
-~~ - ;., '; 11,~~J
----. ........... ..- -..-.- -............ . .......
4.. N
--.. ., . . . . . . ...
.. ..
I *- -.. "-• ... 4 .. ....o '...: -_
------ ----- ----- -----
o ,- ,- N-
~~ .a *_
i- .....................................
-N N = N =N== == N % N=N =. N N N :.
---.... --. . . --, - . . .. .- .. .-- -----
- - - ----. 7
-'~~' C 44, '
. .. . *. . .. . . . . N.N. . . . .. . . " .. N ...
O- Z a . . 2. 0
- -
CL
N'N. N*':...............U %CY'I C
.Z . .s~ 4. . . . . . . . . ..
A )-;- -,,4- N - - - - - - - - - - - - - - .4
A 4 4) .4 4ti"'1 C
. . . .* .4 . .. .
4-4o
COPY crvcdlabic 10 DD1) doesnope~m~ bafl1leible reproduction
4 :44
4E-0
o ar
UNWNF 10 4N'eoj 40.J' 23 1 4a.0 It~ 10.
IL I~- ~. -!2 , C Cýý c.)- a- In zoo v4) "4... om o m m N C =0 N J-
In I.. Ap* a :r.
4L
It a
0. T
r 11
1-9
3 .x *-Z 4 c*.
-4 IN. 4rwf 4 -w av
04 4
Copyr available to DDC does notenni fu.flly legible rzrc:,u-ion
i
r74
CI
0.E4
.. . . . .
- ~ ~ ý rl .L0 r- z V tr L; 0J .. r 41 ~ .1 j N a N U
---- -
Z -44Z
4 .0
(E-4
cc.
.2 . N. .NN .w '0'
> Lr
- - - - - - - - - -- - - - - - - - - - - - - - - - - - - --- n
4-142
F44
4N* ol m0" .
l "0).. . . . . .
44-4 g• .- z - N .1 U 0
-
32
U. I
z,,w
44.
.j 41
'4L
44
It f4-cr w.
4-4
rz4r�40
w
4&
4 NN��ooocJa * * *4OCO�
.7
I'p
0 * *
o- - -
* -o -
A- U* * * *zjsg* �-4�p. -
A 4S �54 N.I,.I' �
0
2. ** **
- - --
w
4
a fr * * *J4 � -a a
4 �a -a a �
.n Ii. t
§ 4
c�ja
w4�. -
� - *J*-ff* U�
u�u� w * * *0 a
v�SI. -
.5- S�.z �N - 0
*3.� .-- -
0U� SI. I *�*N U
N�U. U
g% .4
-� U.-w > * * *
-� -
-at U- w
�qA U.
a,'1
-.
445
0
ILI
a -Wac
4r
U-. C. ~4U * *
i j, A
It
-4-46
200.
180.
za- 160.
LUO
140.
120. 00CENTEL I0NE
z
LU 100.1a-)
80.-I-
60.-
0. 10000. 20000. 30000. 410000. 50000. 60000. 7(DISTRNCE FROM BRRKE RELEASE, FT
NOISE LEVELL-1011-1 / R8211-22B EFFECTIVE PERCEIVEDSEA LEVEL, 77 DEG. F., 70X RELArIVE HUMIDOMAXIMUM TAKEOFF WEIGHT (130,OOOLBJ., 10 DE(
FIGURE 4.2-6a SAMPLE PROGRAM OUTPUT - PLOT DATA FOR A NORMAL TAKEOFF
CENTERLINE
30000. 40000. 50000. 60000. 70000. 80000. 90000. 100000.*• DISTANCE FROM BRAKE RELEASE, FT.
EVELt / R8211-228 EFFECTIVE PERCEIVED NOISE LEVELEL, 77 DEG. F., 70X RELATIVE HUMIDITY
TAKEOFF WEIGHT (1130,OOOLB.), tO DEG. FLAPS, TAKEOFF THRUST
RAM OUTPUT - PLOT DATA FOR A NORMAL TAKEOFF
"4-47
4 EFFECTIVE PERCEIVED NOISE LEVEL ,EPNOB
g * o. 60LL- 90
113 100z 110
-- J
C:5000.- 120
libi
zLi
- -•' 0.
cr-
- -51000.-C3
-115000Ai0. 5000. 10000. 15000. 20000. 25000. 30000. 3S000. 40000. 45000o. 5o
DISTANCE FROM E
CONTOUR PLOT$L-1011-1 / R8211-228 EFFECTIVE PERCEIVED NOISE LEVEL
"•-/1___SEA LEEL 77DG . 0 EAIEHMDT
FIUR 4-b AMLEPONT GRA UPI- PLOT OTSM "A AEF
S45000. 50000. 55000. 60000. 65000. 70000. 75000. 800b0. 85000. g0000. 9500,0. 1000i[TNEFROM BRAKE RELEASE, F7{.
;OFF THRUST
-. ' 45r
i.
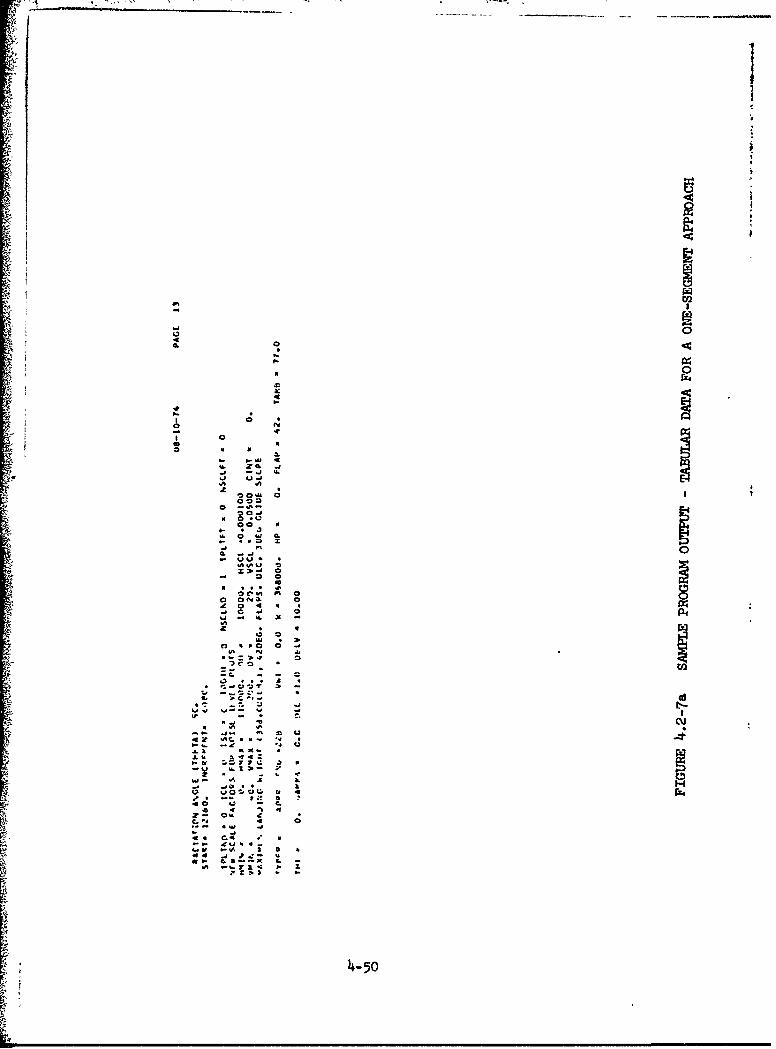
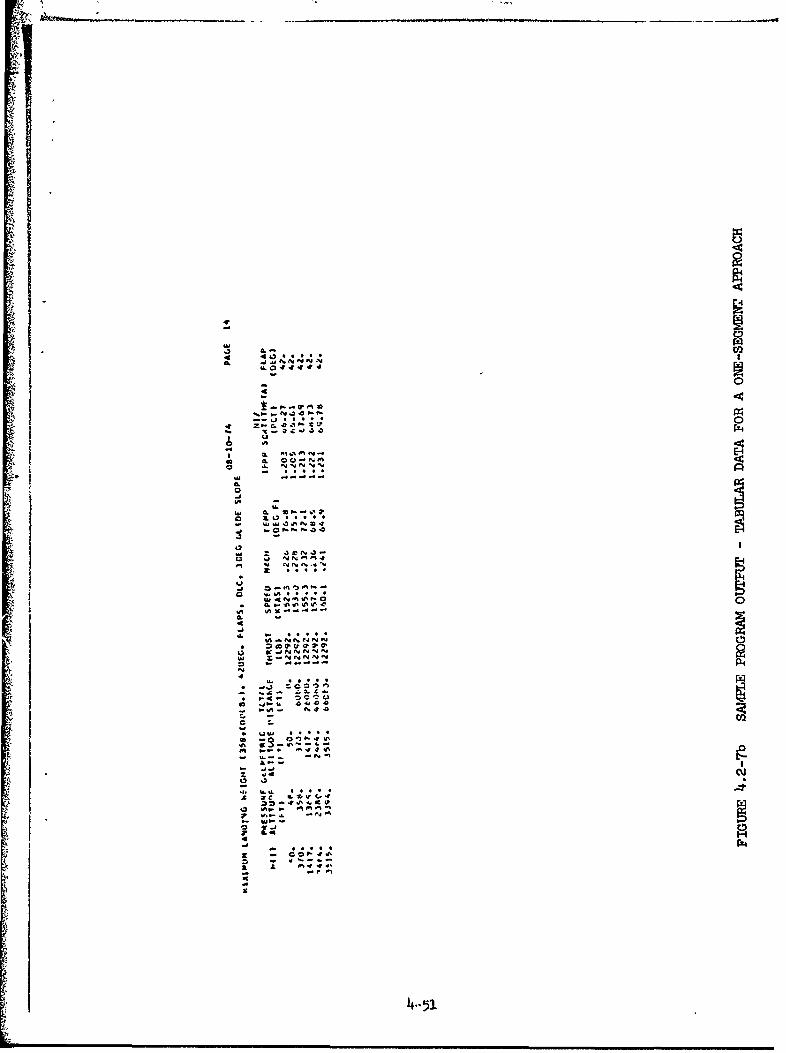
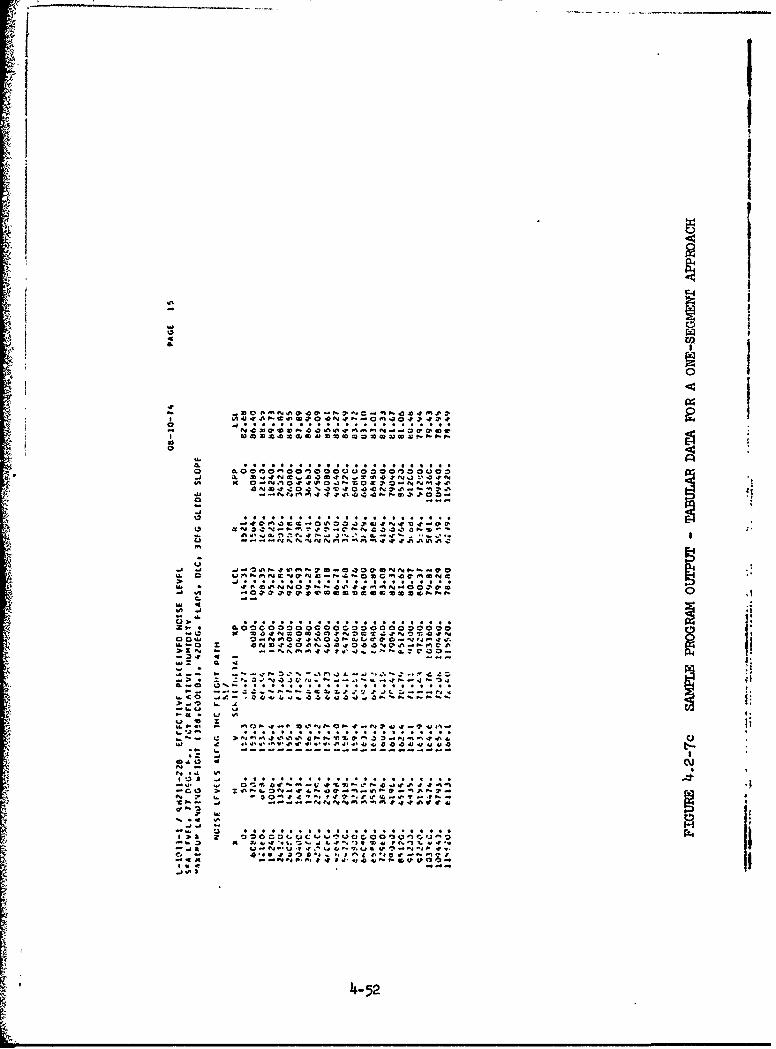
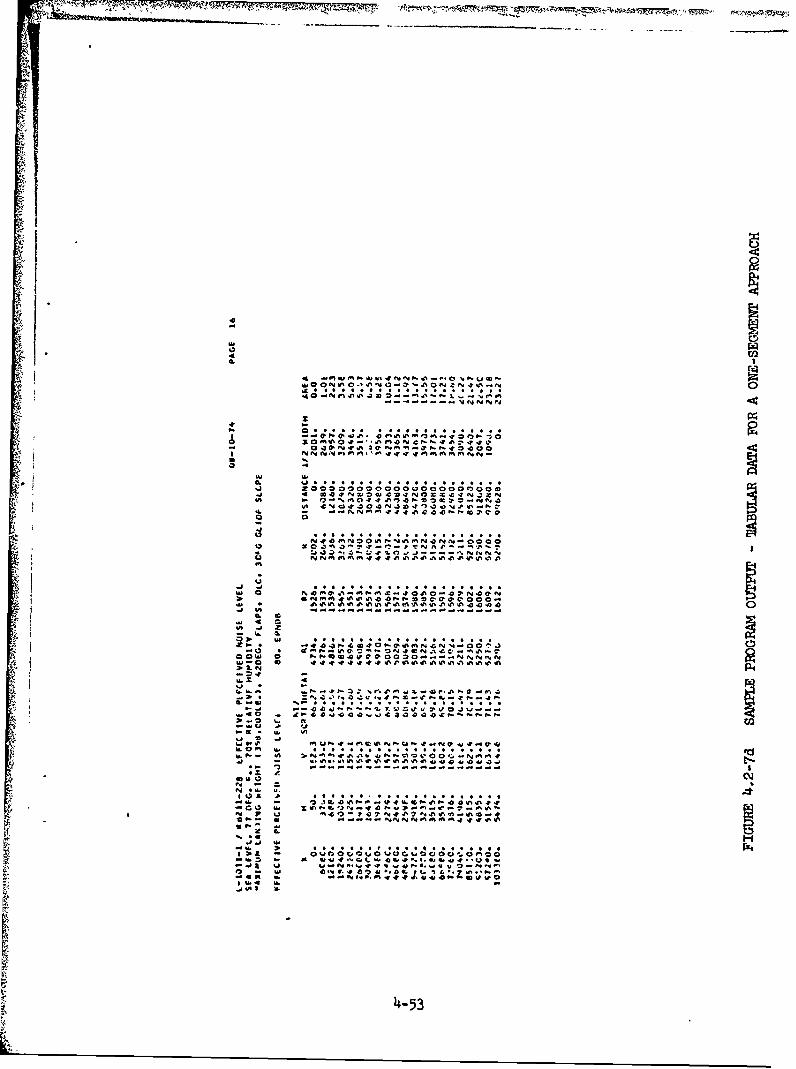
4.2.3 ADoroach Noise
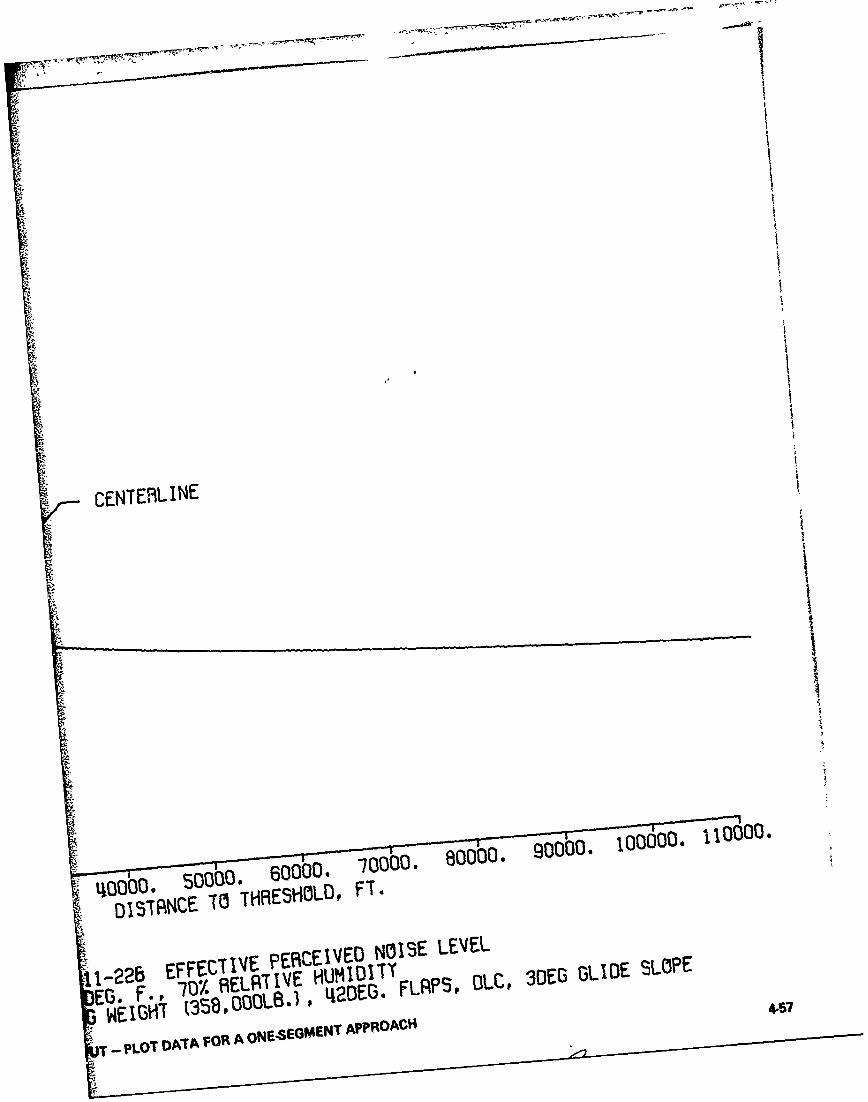
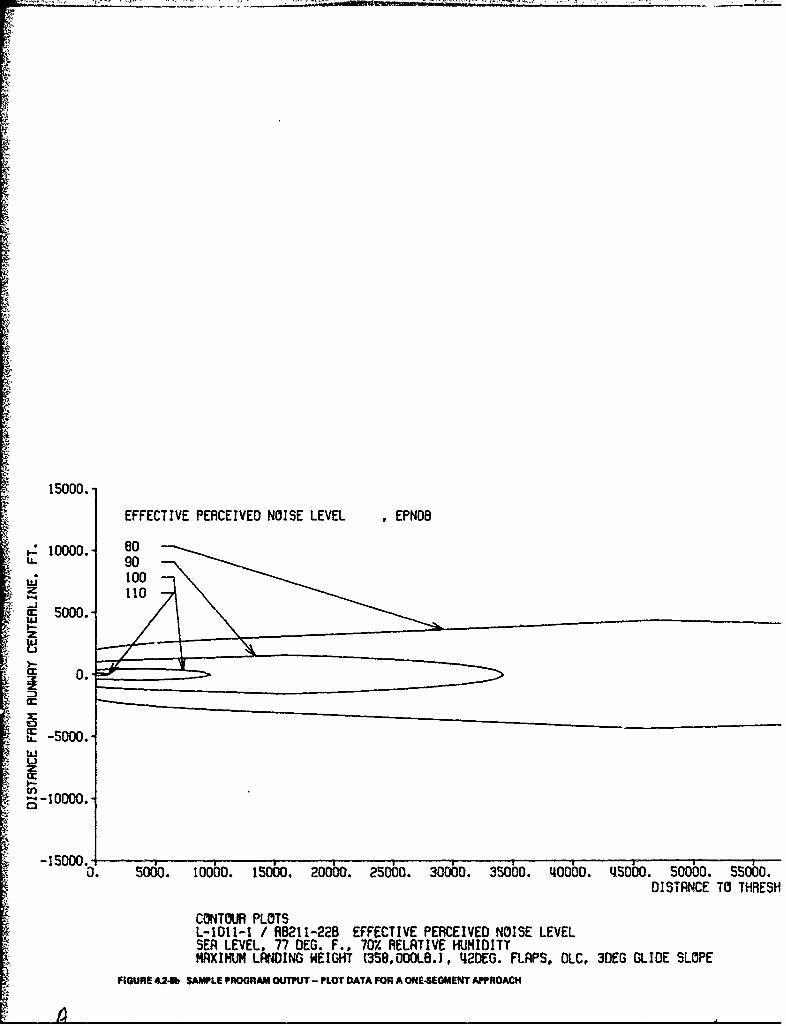
The second sample case for the Noise Definition Program is a
normal approach at the certification condition. The input dataare listed with the input data for the takeoff case (Figure 4.2-4).
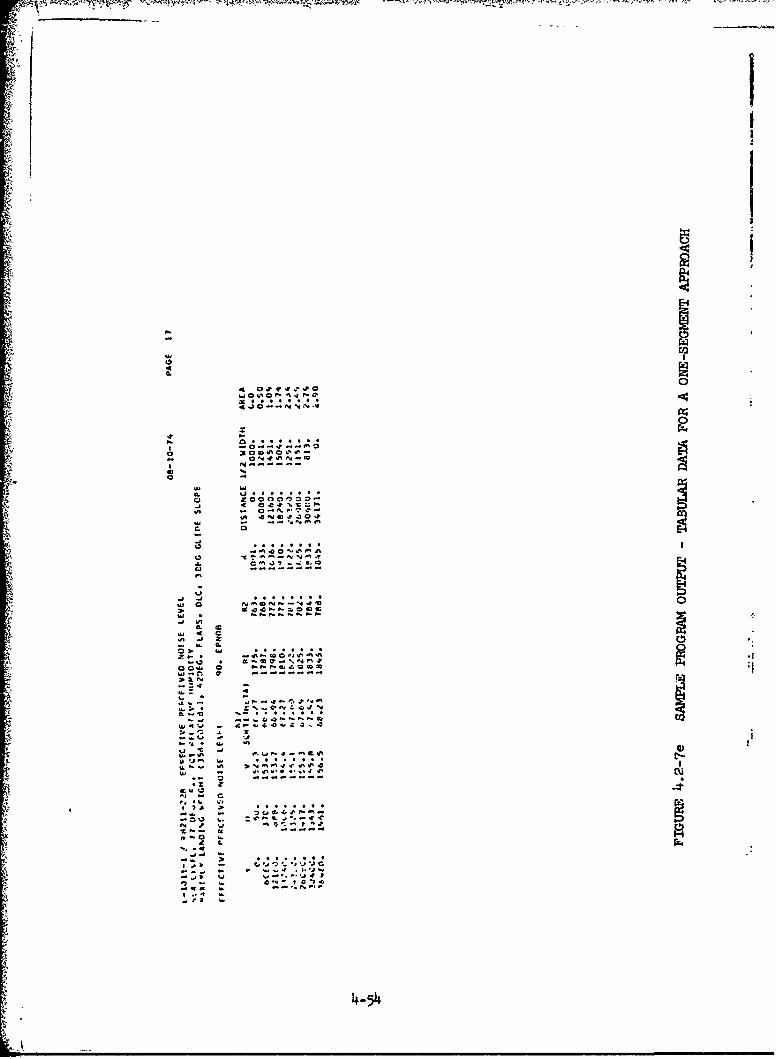
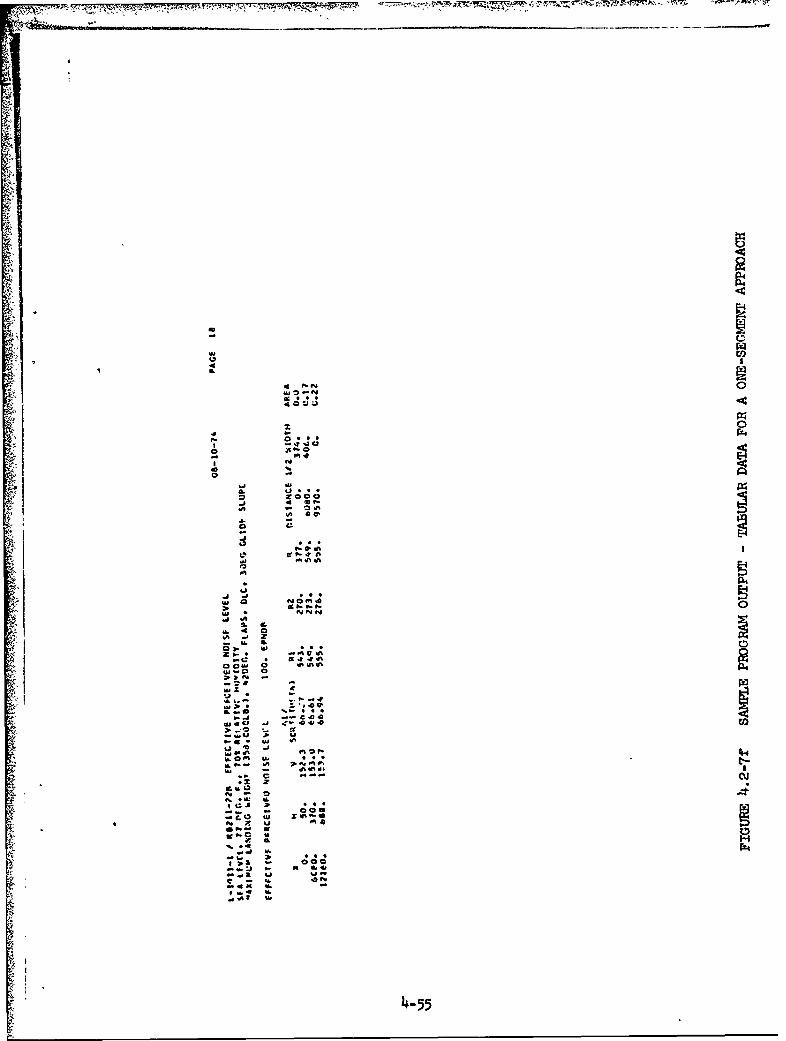
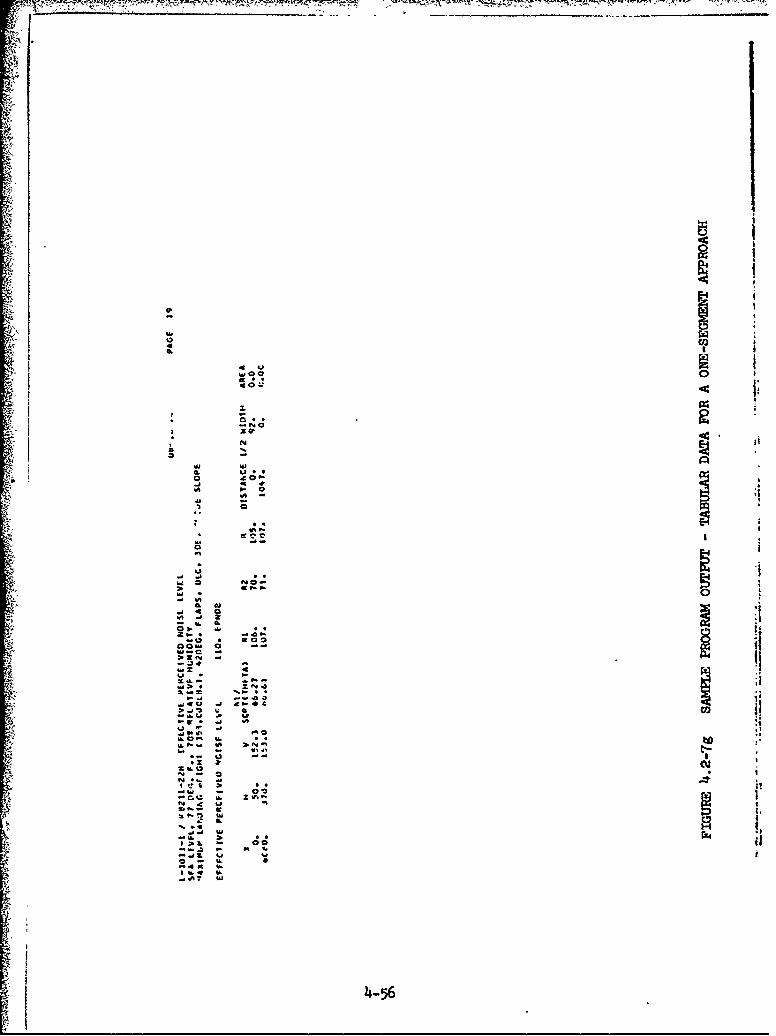
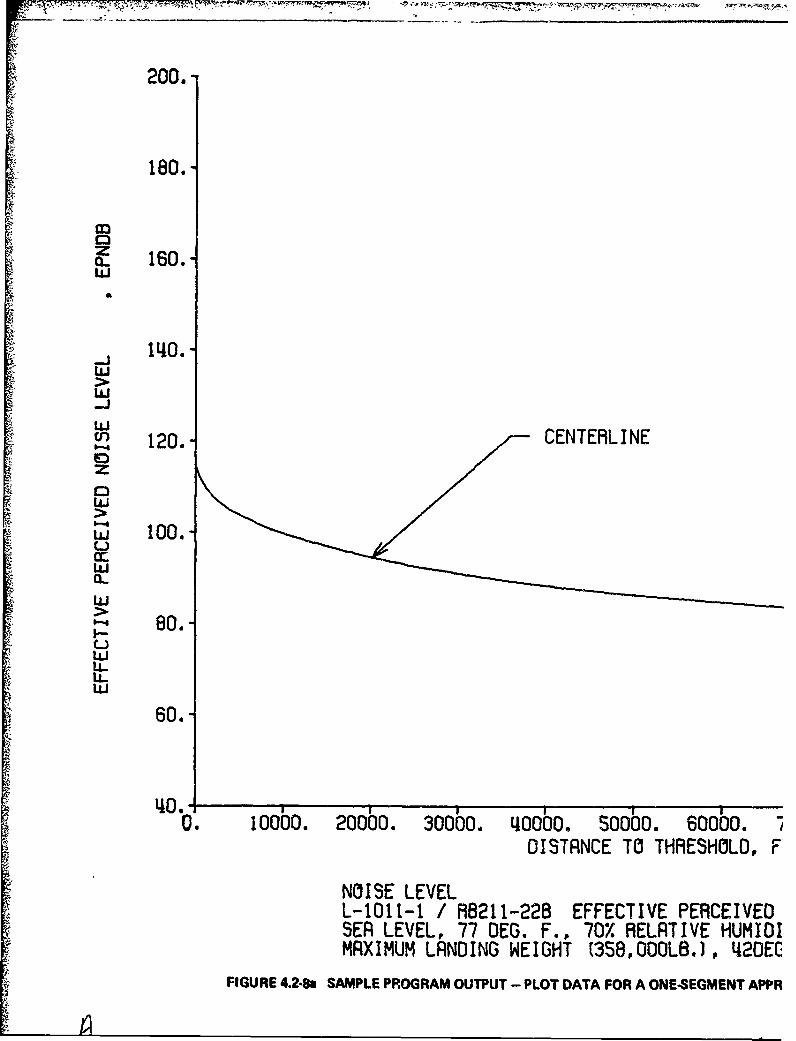
The outpUt tabulation is shown as Figure 4.2-7a through g, and
computer plots of centerline noise and maximum noise contours are
shown on Figure 4.2-8a and b.
4-49
CLi
-3 0
40
a, ca
-0
a a0 a U
- a4W50
44
vi - y N 14 N
43 * c r a-7
O 4 ~NJ
-ll
ff c r 1I ~.JHO
445
x m j"Q-
t4 r W-c f 4
o0.N LlIC3I
.. . .* *.. . . .~ . . . . . . . a .
v z
. . ~. .~ . 0 . . . .~ .0 . C . . .J . . . . .~ .-
-J;
4-5
IQ I*l* 0. NO.%.
z
a Q 0 ON .A0 NS09..N? t .Q0c
CIA 0 -
c t3
.4KA II
4-5
U3 0
uj ri Q.
AD
NO~E.P
0S~ 0N ~ 4-54~
4P
2 0
p. 0
o 4 0j
4 ~P4
U, C ;.0 40
oo
~ .4-55
IOU
40
0 UL
34-5
200.
180.
160.
140.-
LENEIIN
-J Iloo.
-JI- 120. CENTERL INE
60.
40.
60. ,
O. I0000. 20000. 30000. 40000. 50000. 60000. 1DISTANCE TO THRESHOLD, F
NOISE LEVELL-I011-1 / B8211-22B EFFECTIVE PERCEIVEDSEA LEVEL, 77 DEG. F., 70X RELATIVE HUMIDIMAXIMUM LANDING WEIGHT (358,000LB.), 42DEE
FIGURE 4.2-8s SAMPLE PROGRAM OUTPUT - PLOT DATA FOR A ONESEGMENT APPR
I
I
1.
I
Ii
CENTEBLINE4
L~Q0. socco. 60000. 70000. 80000 90000.4 0000 FT.00
DISTPSNCE TO THRESHOLDP FT.
b EFFECTIVE pERCEIVED NOISE LEVEL{1-226 EFF . IV HUMIDITT GLD LOPE
EG. F-p 707% 1ELSTIVE ý1UHIDEG OPS L, TYGLD
W4EIGHIT t3 s vos8,-~8 Pl i2E. FRS Lt 0 L D L P 4-57
- PLOT DATA FOR A ONESEGMENT APPROACH
15000.-
EFFECTIVE PERCEIVED NOISE LEVEL EPNOB
9 10000.- 80U. 90
110
I-.
c -5ooo.-z
z 0.-
U -io~o0.-
z
-15000 .s o ,-
z
b. 5000. lOOOO. 15000. 20000. 25000. 300500. 35000. 4O0600, 5050o. 0000. SSO00.S~DISTANCE TO THRESH
•;CONTOUR PLOTSS~L-1011-1 / R8211-228 EFFECTIVE PERCEIVED NOISE LEVELS~SEA LEVEL, 77 DEG. F., 70% RELATIVE HUMIDITY•; ~MAXIMUM LANDING WEIGHT (358,000LB.1, 4I2DEG. FLAPS, DLC, 3DEG GLIDE SLOPE
• ~FIGURE 4.2-lb SAMPLE PROGRAM OUTPUJT- PLOT DATA FOR A ONE.SEOMENT APPROACH

44W
.11
SECTION 5
SU W RY
Tho Commercial Aircraft Noise Definition stud-y reported in the v,-arior, volumes
of this veport involved the development of a calculation procedure and an
associated computer program for describing an airplane's operations and noise
patterns for takeoffs and approaches. This volume has presented the logic
bel-ind the calculation procedures and has summarized the capabilities of the
program and its subroutines. The program includes a noise propagation section,
an airplane performance section, and a combined routine, footprint section,
which generates datst for plotting constant noise contours for normal airplane
operations and for operational variations, such as takeoff thrust cutback and
two segment approach.
5-1
REFER•NCES
1. SAE Aerospace Recommended Practice ARP 866, "Standard Values of Atmospheric
Absorption as a Function of Temperature and Humidity for Use in Evaluating
* Aircraft Flyover Noise," Society of Automotive Engineers, New York,
August 31, 1964.
2. IEC 379, "Precision Sound Level Meters,," International Electrotechnical
"Commission, 1965.
3. Federal Aviation Regulations "Part 36 Noise Standards: Aircraft Type
Certification," Dept. of Transportation, FAA, Washington, D. C., Nov. 3, 1969.
4. LR 25089, "FAA Type Certification Report, Model L-1011-385-1 with Rolls-
Royce RB.211-22 Engir es," Volume 4, External (Flyover) Noise, Lockheed-
California Company, Burbank, Calif., 14 July 1972.
5. irToposed Reissue of Aerospace Recommended Practice ARP 866, "Standard
Values of Atmospheric Absorption as a Function of Temperature and Humidity,"
Proposed Draft, Society of Automotive Engineers Committee A-21 April 1970,
Revised October 1972 (Private Communication).
6. Aerospace Information Report AIR 923, "Method for Calculating the
Attenuation of Aircraft Ground to Ground Noise Propagation During Takeoff
and Landing," Society of Automotive Engineers, New York, August 15, 1966.
7. "U. S. Standard Atmosphere, 1962," NASA, USAF, and U. S. Weather Bureau,
* December, 1962.
8. Part 25 Federal Aviation Regulations, "Airworthiness Standards: Transport
Category Air)lanes, Change 19," April 23, 1969.
9. LR 25225, "FAA Approved Airplane Flight Manual, Model L-1011-385-1,"
(RB.211-22C), Lockheed-California Company, Burbank, Calif., April 14, 1972.
10. Ia 23039, "FAA Type Certification Report Model L-1011-385-1 with Rolls-
Royce R3.211-22C Engines," Volume I Performance Tests, Lockheed-California
Compakxy Burbank, Calif., 11: July 1972.
11. SAE Reseai'h Project Committee R2.5, "Technique for Developing Noise
Exposure Forecasts," FAA DS-67-14, Federal Aviation Administration,Washington, D. C., August 1967.
R-1
12. LR 25089 "FAA Type Certification Report, Model L-1011-385-1 with: Rolls-
V~ j Royce RB.211-22 Engines, " Volume 4 External (Fayover) Noise, Addendum 3,
Lockheed-California Company, Burbank, Calif., 15 August 1973
R
1
5 R-2
It