abundance and opportunity: u.s. natural gas...historic data source: eia natural gas monthly, april...
TRANSCRIPT
Abundance and Opportunity: U.S. Natural Gas Paul Hartman Regional Director January 22, 2015
Driving Demand for Natural Gas
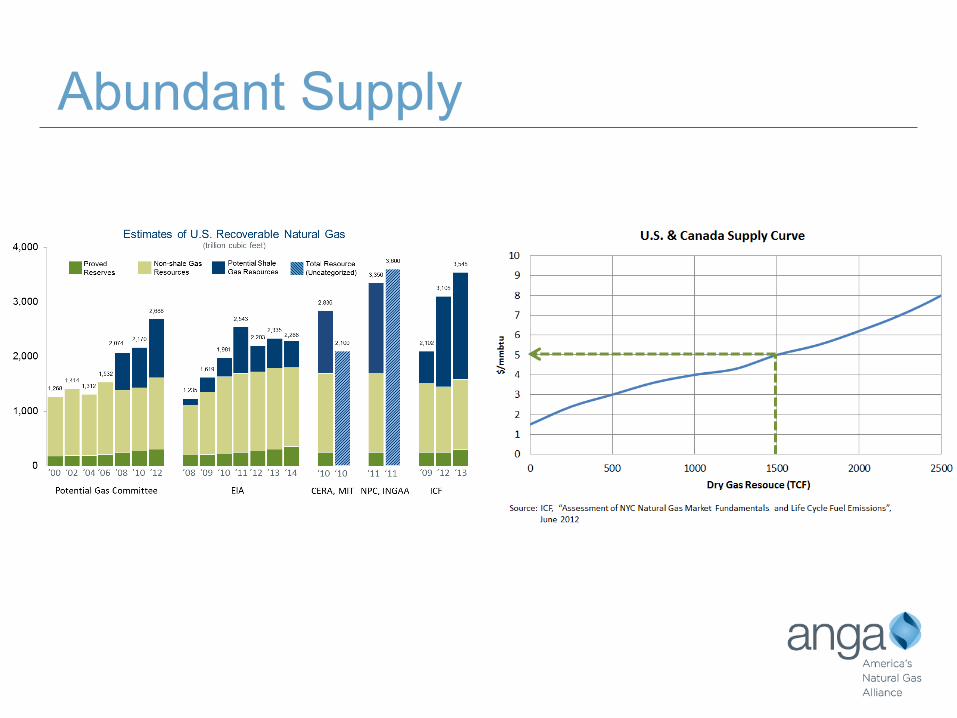
Abundant Supply
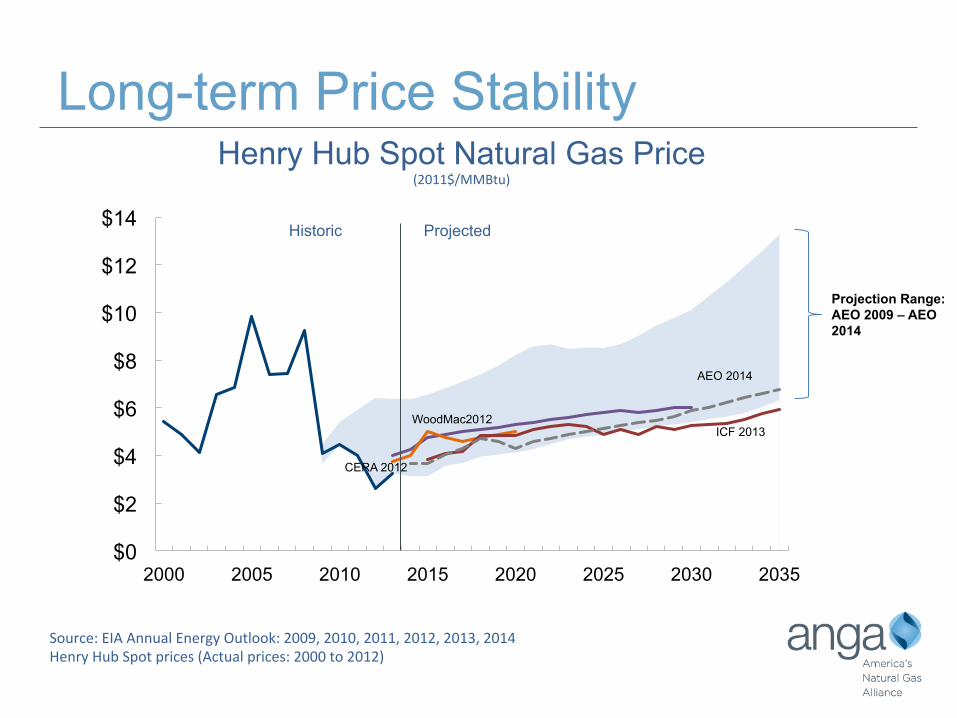
Long-term Price Stability
$0
$2
$4
$6
$8
$10
$12
$14
2000 2005 2010 2015 2020 2025 2030 2035
CERA 2012
WoodMac2012 ICF 2013
AEO 2014
Historic Projected
Henry Hub Spot Natural Gas Price (2011$/MMBtu)
Source: EIA Annual Energy Outlook: 2009, 2010, 2011, 2012, 2013, 2014 Henry Hub Spot prices (Actual prices: 2000 to 2012)
Projection Range: AEO 2009 – AEO 2014
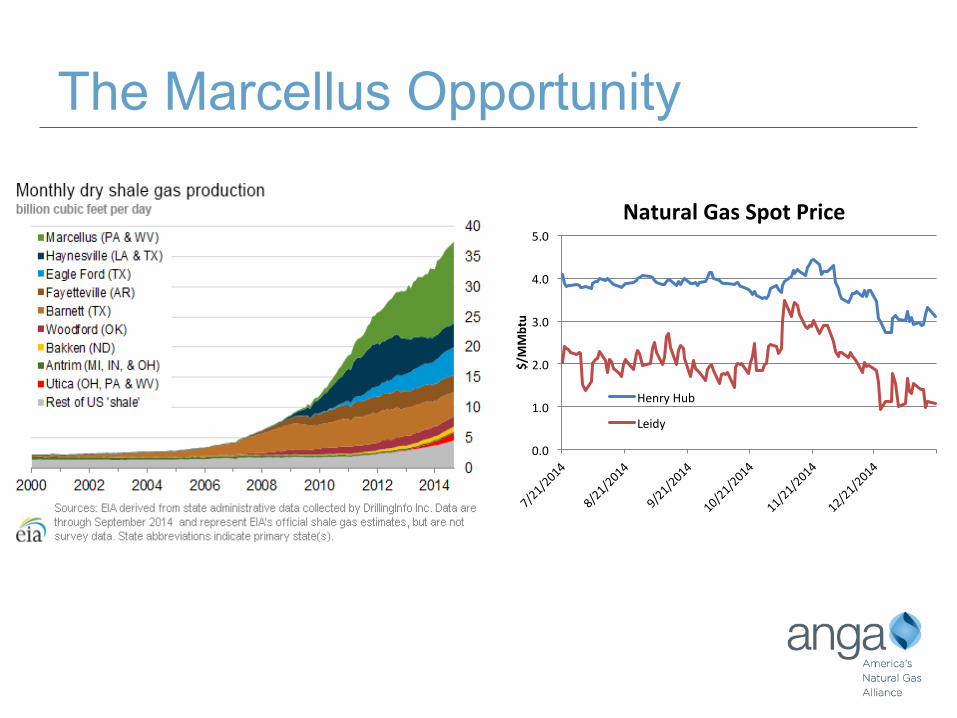
The Marcellus Opportunity
0.0
1.0
2.0
3.0
4.0
5.0
$/MMbtu
Natural Gas Spot Price
Henry Hub
Leidy
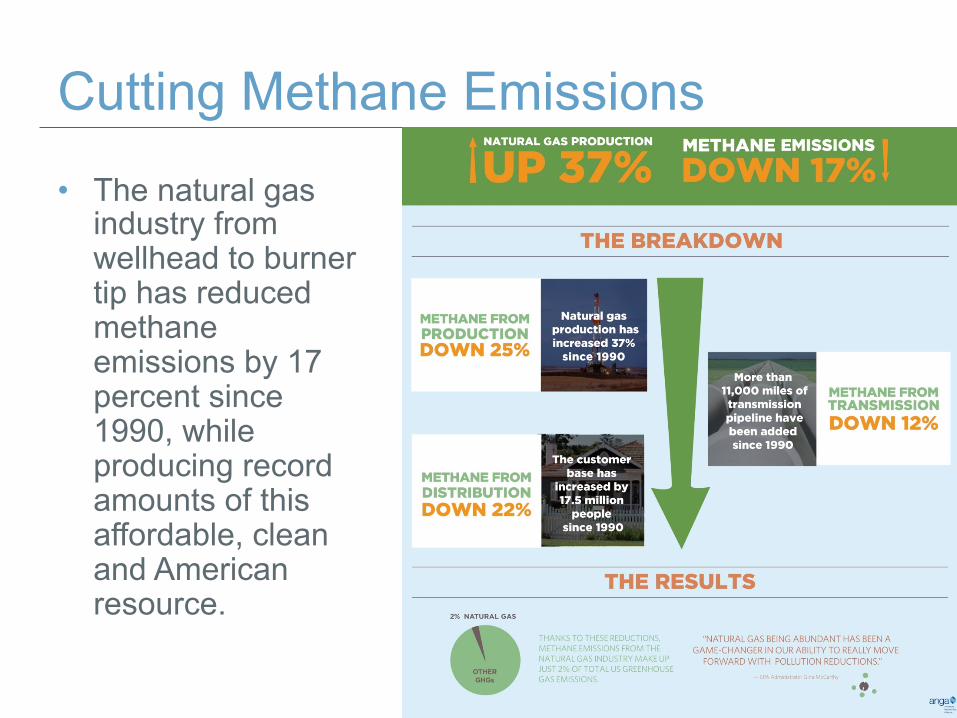
Cutting Methane Emissions
• The natural gas industry from wellhead to burner tip has reduced methane emissions by 17 percent since 1990, while producing record amounts of this affordable, clean and American resource.
6
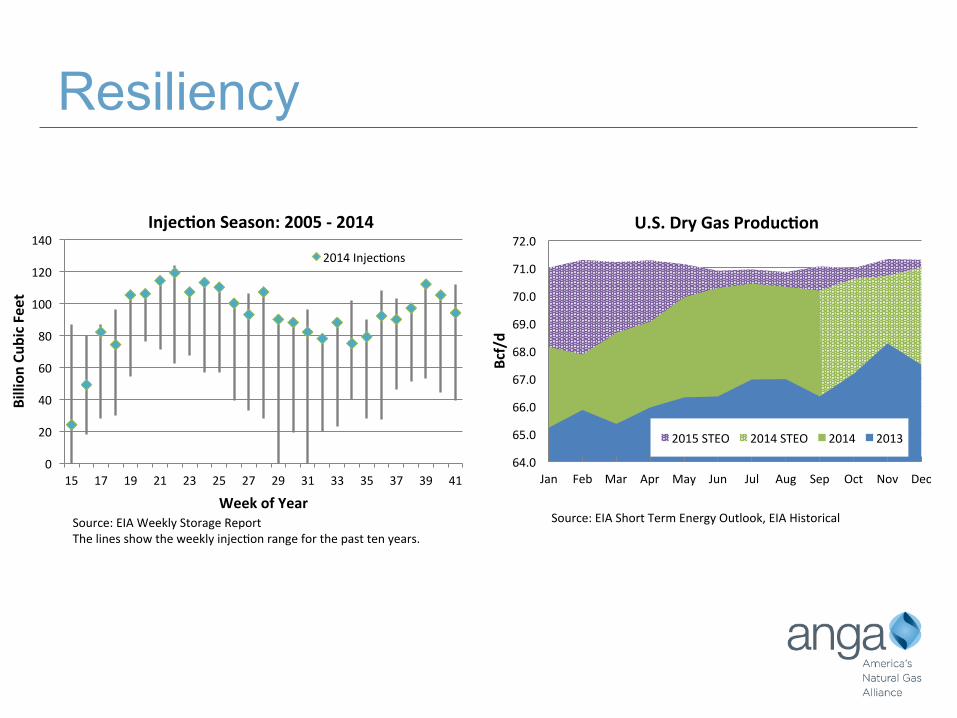
Resiliency
0
20
40
60
80
100
120
140
15 17 19 21 23 25 27 29 31 33 35 37 39 41
Billion
Cub
ic Feet
Week of Year
Injec?on Season: 2005 -‐ 2014
2014 InjecNons
64.0
65.0
66.0
67.0
68.0
69.0
70.0
71.0
72.0
Jan Feb Mar Apr May Jun Jul Aug Sep Oct Nov Dec
Bcf/d
U.S. Dry Gas Produc?on
2015 STEO 2014 STEO 2014 2013
Source: EIA Weekly Storage Report The lines show the weekly injecNon range for the past ten years.
Source: EIA Short Term Energy Outlook, EIA Historical
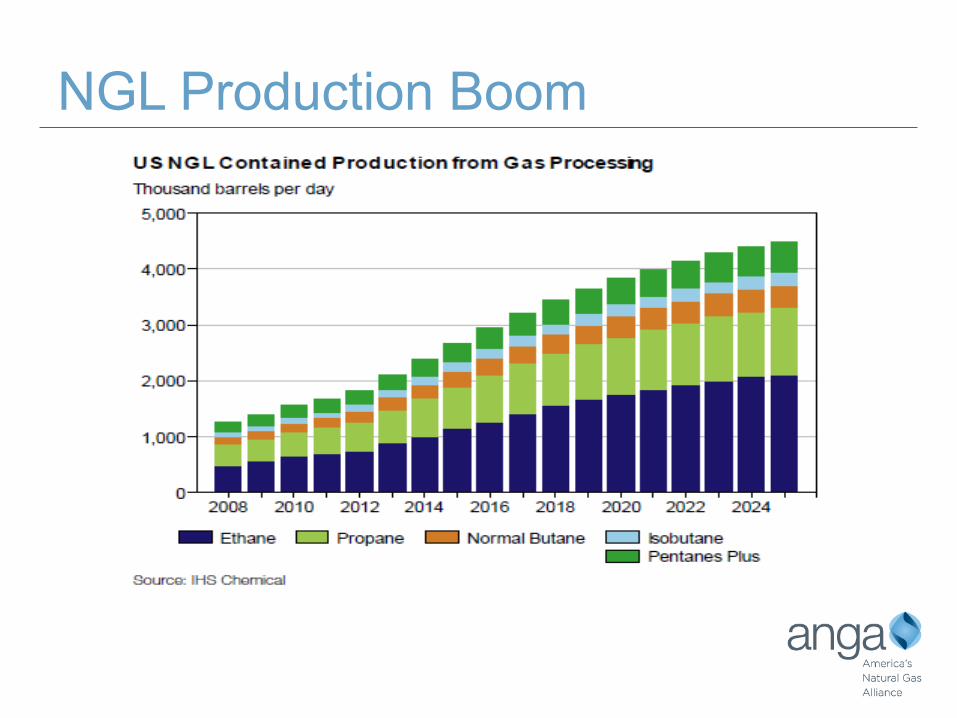
NGL Production Boom
0
10
20
30
40
50
60
70
80
90
100
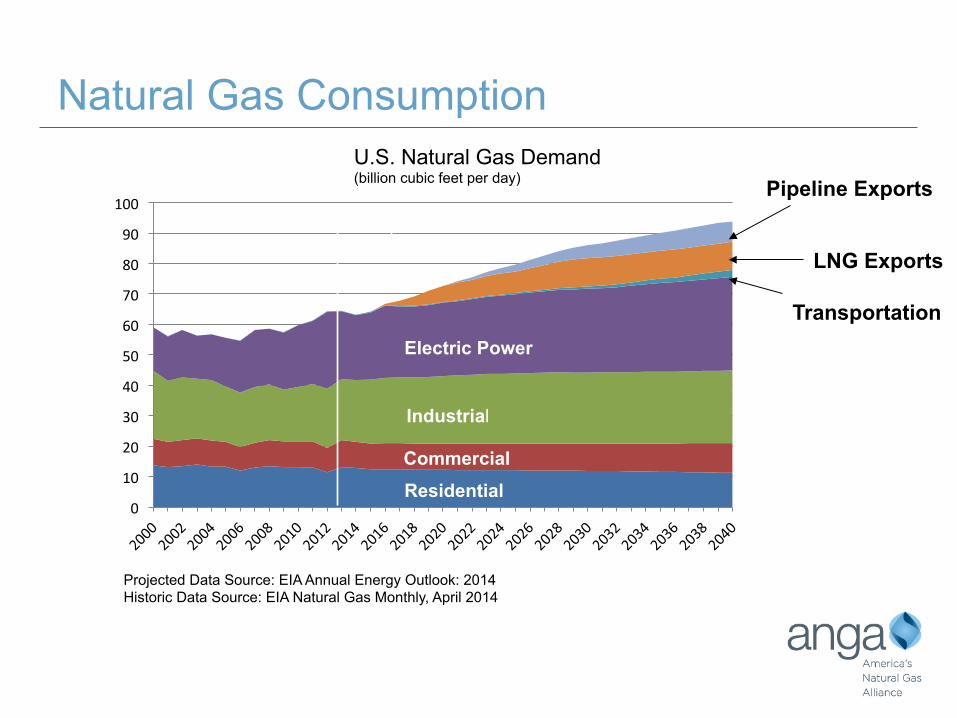
Natural Gas Consumption
Projected Historic
Projected Data Source: EIA Annual Energy Outlook: 2014 Historic Data Source: EIA Natural Gas Monthly, April 2014
U.S. Natural Gas Demand (billion cubic feet per day)
Electric Power
Industrial
Residential Commercial
Transportation
LNG Exports
Pipeline Exports
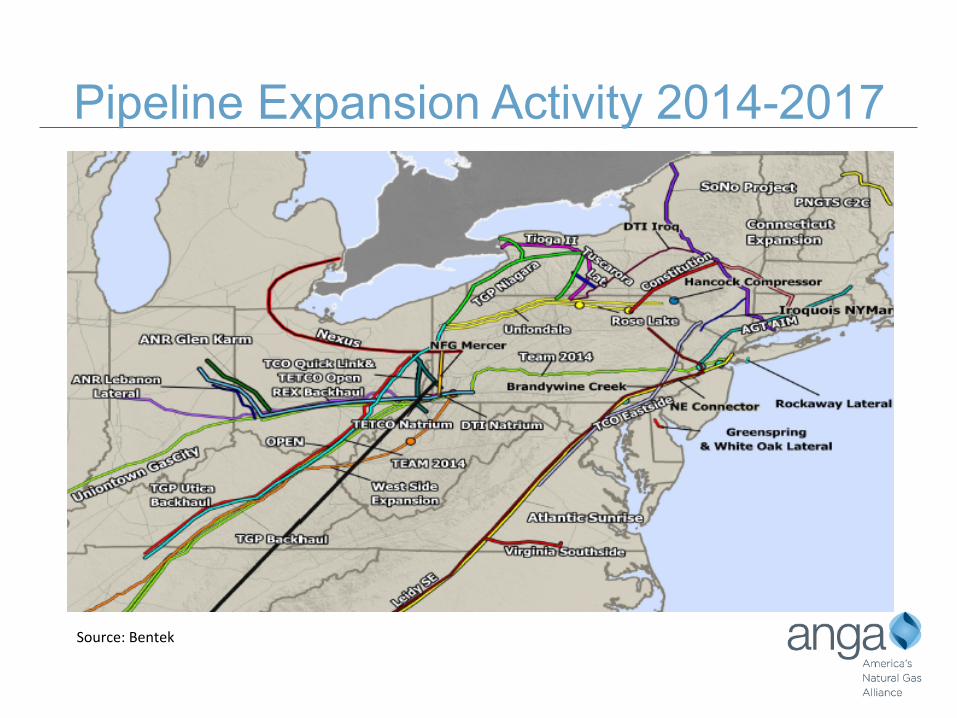
Pipeline Expansion Activity 2014-2017
Source: Bentek Source: Bentek
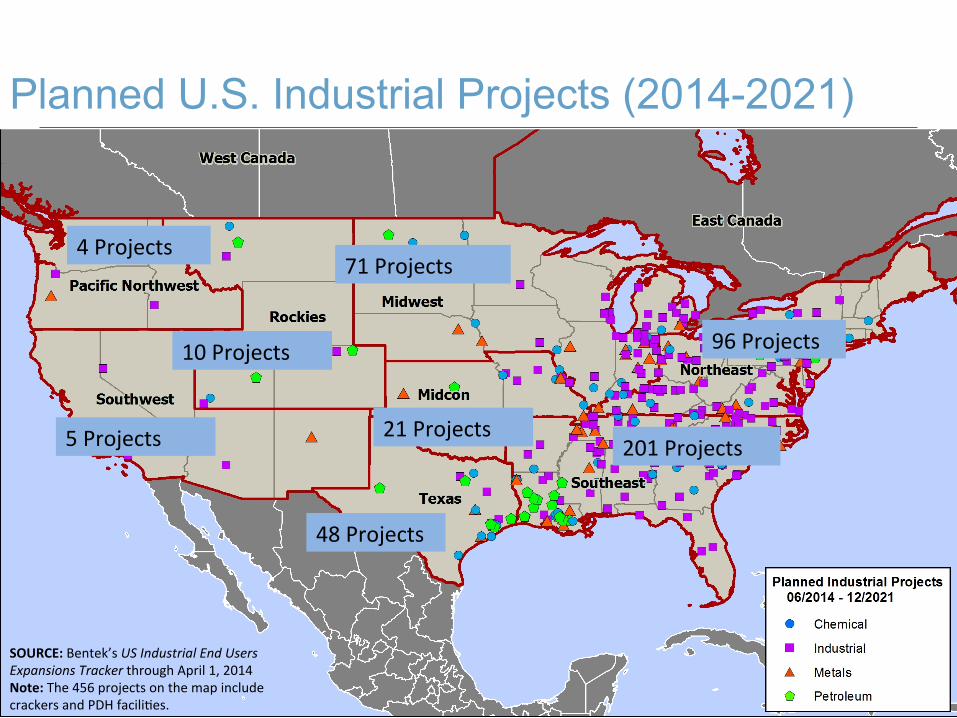
Planned U.S. Industrial Projects (2014-2021)
4 Projects
5 Projects
10 Projects
71 Projects
21 Projects
48 Projects
96 Projects
201 Projects
SOURCE: Bentek’s US Industrial End Users Expansions Tracker through April 1, 2014 Note: The 456 projects on the map include crackers and PDH faciliNes.
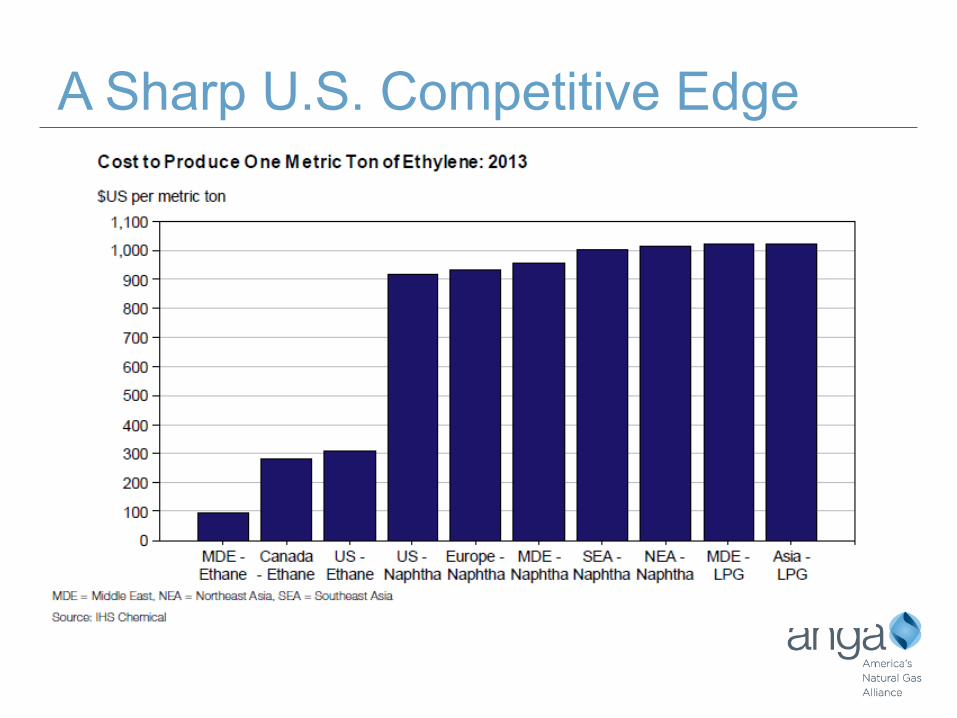
A Sharp U.S. Competitive Edge
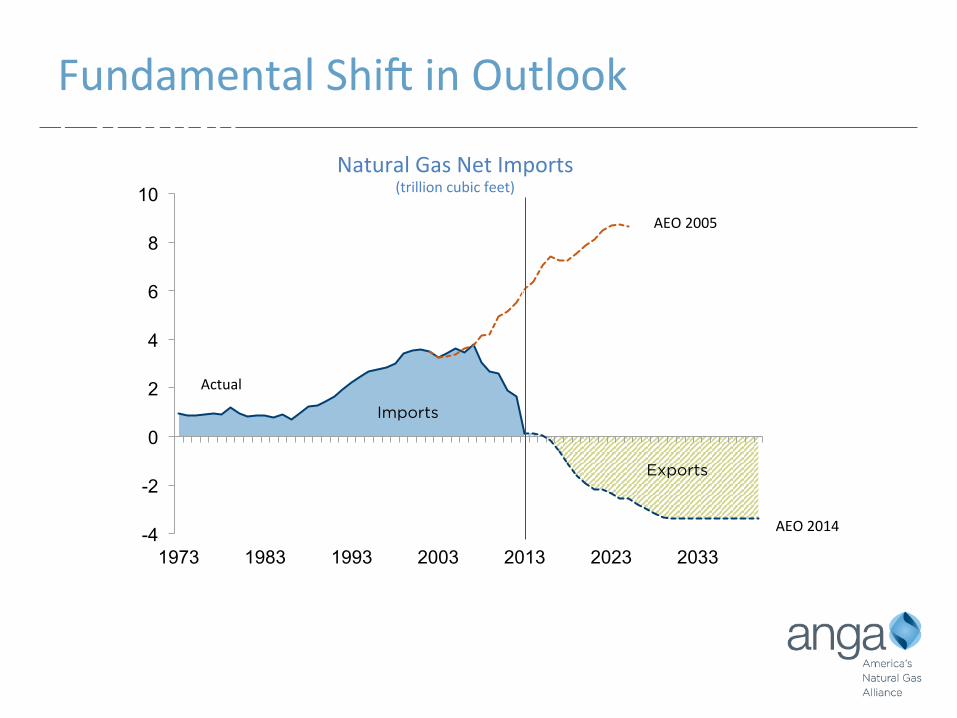
-4
-2
0
2
4
6
8
10
1973 1983 1993 2003 2013 2023 2033
Fundamental Shi] in Outlookame Change
Source: EIA, Annual Energy Outlook 2005 & 2013 Early Release
Natural Gas Net Imports (trillion cubic feet)
Imports
Exports
AEO 2005
Projected Historic
AEO 2013
AEO 2005
AEO 2014
Actual
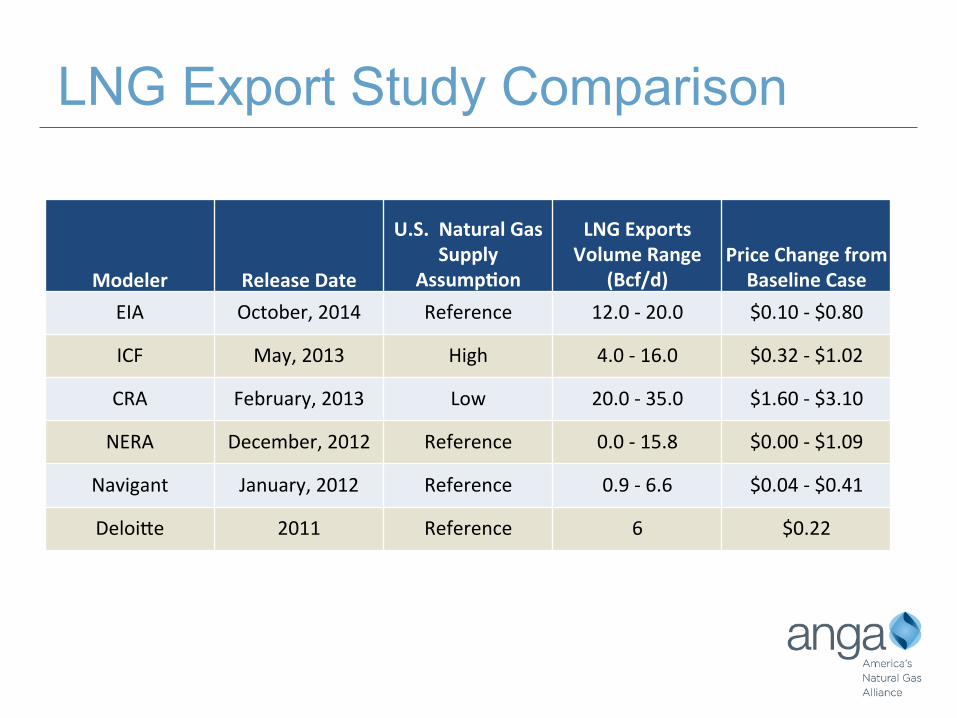
LNG Export Study Comparison
Modeler Release Date
U.S. Natural Gas Supply
Assump?on
LNG Exports Volume Range
(Bcf/d) Price Change from Baseline Case
EIA October, 2014 Reference 12.0 -‐ 20.0 $0.10 -‐ $0.80
ICF May, 2013 High 4.0 -‐ 16.0 $0.32 -‐ $1.02
CRA February, 2013 Low 20.0 -‐ 35.0 $1.60 -‐ $3.10
NERA December, 2012 Reference 0.0 -‐ 15.8 $0.00 -‐ $1.09
Navigant January, 2012 Reference 0.9 -‐ 6.6 $0.04 -‐ $0.41
Deloiae 2011 Reference 6 $0.22
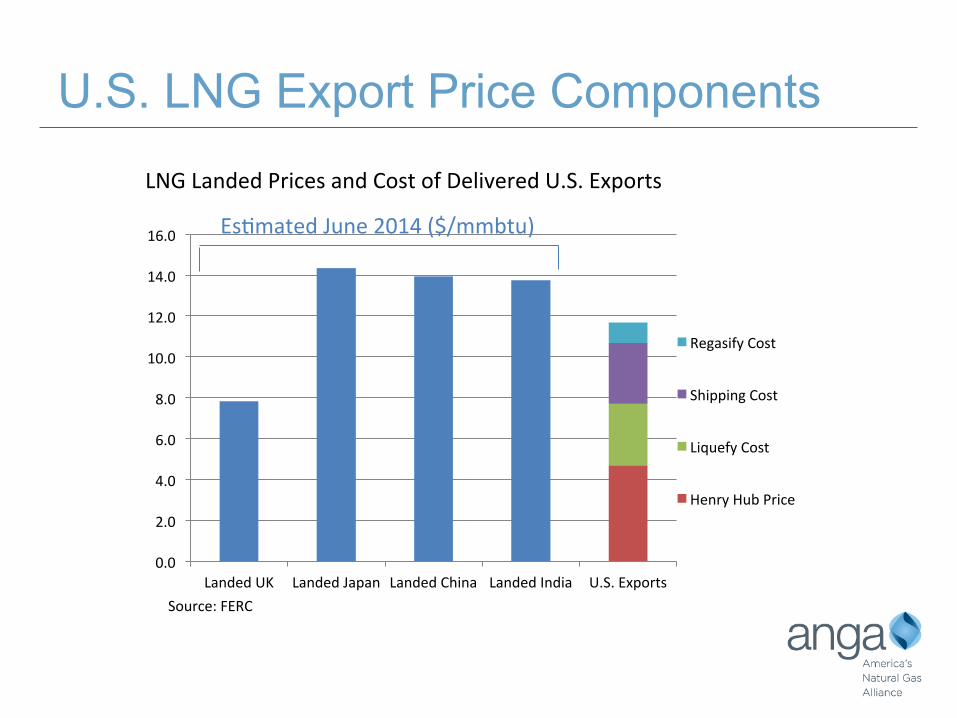
0.0
2.0
4.0
6.0
8.0
10.0
12.0
14.0
16.0
Landed UK Landed Japan Landed China Landed India U.S. Exports
Regasify Cost
Shipping Cost
Liquefy Cost
Henry Hub Price
U.S. LNG Export Price Components
LNG Landed Prices and Cost of Delivered U.S. Exports
Source: FERC
EsNmated June 2014 ($/mmbtu)
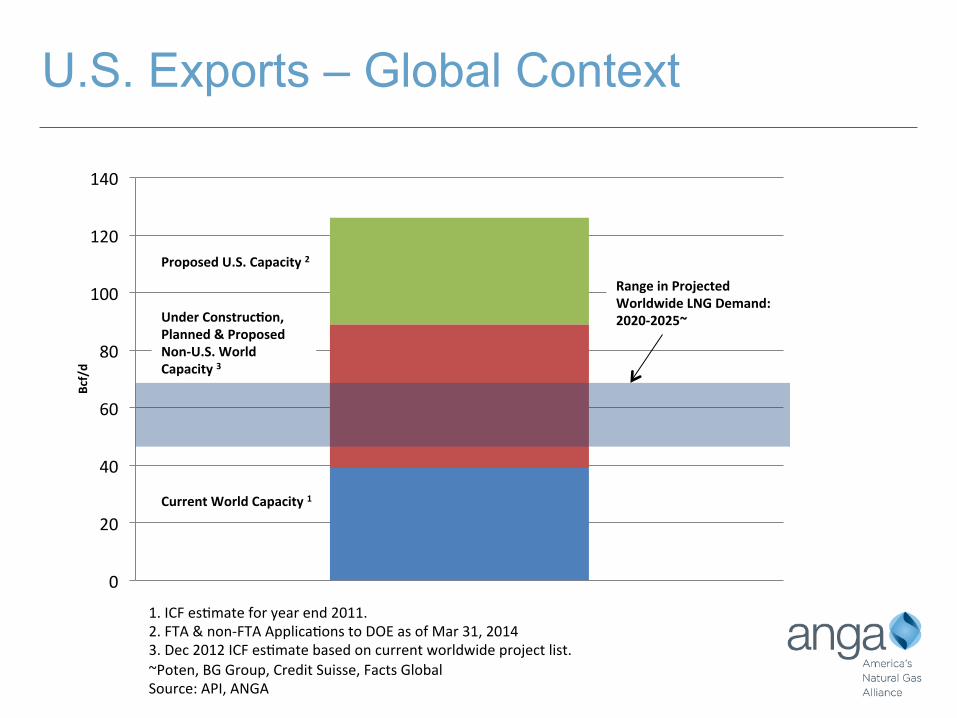
U.S. Exports – Global Context
1. ICF esNmate for year end 2011. 2. FTA & non-‐FTA ApplicaNons to DOE as of Mar 31, 2014 3. Dec 2012 ICF esNmate based on current worldwide project list. ~Poten, BG Group, Credit Suisse, Facts Global Source: API, ANGA
0
20
40
60
80
100
120
140
Bcf/d
Proposed U.S. Capacity 2
Under Construc?on, Planned & Proposed Non-‐U.S. World Capacity 3
Current World Capacity 1
Range in Projected Worldwide LNG Demand: 2020-‐2025~
www.anga.us twitter @ANGAus