increasing u.s. natural gas supplies · liquefied natural gas (lng) infrastructure the u.s. holds...
TRANSCRIPT
INCREASING U.S. NATURAL GAS SUPPLIES
A Discussion Paper and Recommendations from the National Commission on Energy Policy
October 2003
National Commission on Energy Policy 1616 H Street, NW
6th Floor Washington, D.C. 20006
202-637-0400www.energycommission.org

The National Commission on Energy Policy was founded in 2002 by the William and Flora Hewlett Foundation, and its partners – The Pew Charitable Trusts, the John D. and Catherine T. MacArthur Foundation, the David and Lucile Packard Foundation and the Energy Foundation. The 18-member bipartisan Commission includes leading energy experts representing government, industry, academia, labor, and consumer protection and environmental interests. The Commission is currently developing comprehensive recommendations for long-term national energy policy to be released in December 2004. The economic modeling analysis for this report was provided by Energy and Environmental Analysis, Inc. (EEA). Founded in 1974 to perform economic, engineering and policy analysis in the energy and environmental fields, EEA conducts analyses of environmental regulatory policy, emission trading issues and corporate environmental strategy. In the energy field, EEA is nationally known for its analysis of natural gas supply, transportation and market issues and provides strategic planning and regulatory support to all segments of the natural gas industry. Most recently, EEA provided the economic modeling and analysis for the National Petroleum Council's latest report, Balancing Natural Gas Policy – Fueling the Demands of a Growing Economy.
National Commission on Energy Policy Increasing U.S. Natural Gas Supplies
3
INCREASING U.S. NATURAL GAS SUPPLIES
A Discussion Paper and Recommendations from the National Commission on Energy Policy
U.S. consumption of natural gas increased by 18 percent between 1990 and 2002 and is expected to grow for at least the next two decades, in large part because of substantial additions of gas-fired electric generating capacity. However, the conditions that spurred much of this expansion – an apparent abundance of natural gas and relatively low prices – now appear to be changing quickly. In fact, recent trends indicate that future supply and demand dynamics for natural gas may be far different from the experience in the 1990s, leading many analysts to conclude that the North American natural gas market has moved to a permanently higher price level. Underlying these trends is the reality that growth in domestic natural gas production has been unable to keep pace with increased demand. Even with increased imports from Canada – which have historically helped to meet U.S. demand – natural gas prices have continued to rise rapidly. In this context, U.S. policymakers are now considering a variety of long-term supply and demand strategies to address concerns about potentially high prices and increased price volatility in future natural gas markets. Prominent among the supply-side options under discussion are: (a) the construction of a major new pipeline to bring natural gas from developed fields in the North Slope of Alaska to the lower 48 states and (b) the expansion of available infrastructure for importing liquefied natural gas (LNG) from foreign sources. With respect to the Alaska pipeline, in particular, recent discussions have focused on the appropriateness and desirability of providing some form of federal tax incentive or subsidy to support pipeline construction. The primary purpose of this paper is to help inform the current national debate by presenting the results of a cost-benefit analysis of the Alaska pipeline sponsored by the National Commission on Energy Policy and conducted by Energy and Environmental Analysis, Inc., a consulting firm with expertise in the economics of the natural gas industry. The analysis was designed to examine two major questions. First, what is the potential impact of the Alaska pipeline on future U.S. gas supply, demand and prices? Second, what are the likely costs, to the U.S. Treasury, of tax credits at the levels now being proposed in support of the pipeline? The results of this analysis, which are summarized below and explained in more detail in a technical attachment to this discussion paper, suggest that completion of the pipeline could provide substantial consumer benefits in the form of reduced future natural gas prices. Moreover, the net benefits appear likely to far outweigh the costs to the U.S. Treasury of current tax credit proposals aimed at helping pipeline developers manage the financ ial risks associated with the project. Two important points must be emphasized in connection with the above finding and with the recommendations put forward elsewhere in this paper. First, this paper does not attempt to develop a detailed framework or broadly applicable set of criteria for assessing whether or at what level government subsidies – be they in the form of tax credits or direct subsidies – are justified. However, it is the Commission’s strong belief that such interventions generally are justified only where identified market imperfections and regulatory barriers provide a principled public interest rationale for government action. Second, this paper does not attempt to provide a
National Commission on Energy Policy Increasing U.S. Natural Gas Supplies
4
comprehensive discussion of natural gas policy options – which would necessarily address available demand side policies, as well as other important issues related to natural gas transportation, production and supply security. In the last section of this paper we do summarize a number of ongoing Commission activities and research projects in other areas of natural gas policy. However, we have chosen at this time and in this paper to focus more narrowly on the pipeline question – and to a lesser extent on some LNG-related opportunities – to inform the important policy discussions that are now taking place regarding natural gas supply. Background U.S. natural gas production has grown, on average, less than 1 percent per year since 1990 as U.S. basins have matured and premium reservoirs have been depleted. At the same time, U.S. consumption growth has averaged about 1.4 percent per year. Depletion rates for new wells (the rate at which production declines over time from a particular well, reservoir or field) have also been increasing in recent years. In part, faster depletion rates reflect improvements in production technology that allow resources to be extracted more quickly resulting in higher initial production from new wells. However, faster depletion rates also signal a decline in the recoverable volumes in new wells. While better technology has allowed producers to increase initial production from newer wells, it does not appear to have been able to fully offset the impacts of declining well quality. This has resulted in a treadmill effect, where more and more wells must be drilled simply to maintain production levels. Meanwhile, natural gas imports from Canada have increased significantly over the past decade in response to the growing gap between U.S. demand and production. Growth in Canadian production, however, now appears to be slowing as well and prices for Canadian gas have increased substantially. Construction of a pipeline linking the significant natural gas resources of already developed fields in Alaska’s North Slope with North American markets and expansion of the domestic infrastructure needed to support LNG imports currently represent promising opportunities for expanding U.S. supply options in the near to medium-term timeframe. The process of constructing the Alaska pipeline, if begun now, could be completed in 2013-2014. Meaningful expansion of LNG import capacity could be accomplished somewhat more quickly, in the next 5 to 7 years, or even faster through expansion of existing facilities. Both options are described in greater detail below. The market, regulatory and other challenges that apply to each – together with the Commission’s recommendations for addressing those challenges – are discussed in a separate section, following a presentation of the results of our cost benefit analysis for the Alaska pipeline. Alaska Natural Gas Pipeline
Proposals to build a natural gas transmission pipeline from the North Slope of Alaska to the lower 48 states have been discussed for more than 20 years. In the mid-1980s, the Alaska Natural Gas Transportation System project applied for and received various elements of the regulatory approval needed to construct the pipeline. As a result of low natural gas prices through the late 1980s and 1990s however, the pipeline project was put on hold. Significant increases in natural gas prices over the past three years have led to renewed interest in the Alaskan pipeline. The Alaskan North Slope holds significant natural gas resources: approximately 35 trillion cubic feet have been discovered to date, equivalent to roughly 20
National Commission on Energy Policy Increasing U.S. Natural Gas Supplies
5
percent of U.S. proved reserves.1 A substantial volume of this gas is currently being produced and re-injected to support oil production because there is no infrastructure to deliver it to natural gas markets in the United States. Constructing such a pipeline would be an extremely large project even by major world energy project standards and is estimated to require nearly $20 billion in incremental investment and approximately 8 to 10 years to complete. Stretching from the Alaskan North Slope to Alberta, Canada, the first pipeline segment would be roughly 2,100 miles long and would be capable of transporting 4.5 billion cubic feet per day (Bcf/d).2 The pipeline segment from Alberta to Chicago would be 1,470 miles long, bringing the total length of the pipeline to 3,270 miles. The additional natural gas that could be supplied by the pipeline annually is equivalent to nearly 7 percent of current U.S. natural gas consumption. Liquefied Natural Gas (LNG) Infrastructure
The U.S. holds only a small proportion of the world’s proved natural gas reserves.3 Because it allows for marine transport over long distances, LNG provides a means of accessing global natural gas supplies, particularly as recent substantial cost declines in liquefaction and shipping have made it economic to develop LNG projects that target the U.S. market. Currently LNG plays a small role in the U.S., contributing less than 1 percent (200 billion cubic feet annually) to national consumption. However, existing facilities can expand their import capacity and new facilities could be constructed to meaningfully increase LNG’s contribution to domestic gas markets within the next 5 years. Indeed, current forecasts estimate that LNG imports will triple by 2005. If LNG imports become the marginal supplier of natural gas to U.S. markets, the U.S. will in effect be entering a larger regional, if not global, marketplace for gas. Over time, this could assist in reducing volatility in U.S. natural gas markets, because LNG pricing is typically tied to global oil prices, which have been less volatile than U.S. natural gas prices.
Although only four U.S. LNG terminals exist today, plans are underway to develop additional terminals and possibly expand existing facilities. LNG importation facilities require enough land for re-gasification and storage infrastructure along with harbors with sufficient depth, anchorage, and turning space to accommodate LNG tankers, which can measure 900 feet in length, 140 feet in width, and 36 feet in draft below the waterline. The size and draft of LNG tankers clearly limit potential sites for new onshore LNG marine terminals.
1 Estimates of undiscovered natural gas resources in the North Slope reach as high as 150 trillion cubic feet. 2 Based on the proposed “southern route.” 3 The world’s proved reserves alone provide a 61-year supply of gas at present global production levels.
National Commission on Energy Policy Increasing U.S. Natural Gas Supplies
6
Results of a Cost-Benefit Analysis of the Alaska Pipeline and Associated Tax Credit Proposal As indicated in the Introduction, the Commission has analyzed the economic impacts of a pipeline connecting the natural gas resources of Alaska’s North Slope to the Alberta hub in Canada via the “southern route”. 4 The analysis was designed to examine two major questions related to the Alaska pipeline. First, what is the potential impact of the Alaska pipeline on U.S. natural gas supply, demand, and prices? Second, how likely is it that the tax credits currently being proposed in support of the pipeline would be triggered by low natural gas prices, and how much would those credits cost? It should be emphasized that our examination of benefits in this analysis is limited to the impact of using Alaskan gas to replace more expensive domestic sources and the effect of this increased supply on future natural gas prices. Meanwhile our examination of costs is limited to the immediate impacts on the U.S. Treasury of a tax credit designed to provide some insurance against low-probability, low-price contingencies (see further discussion below).5 As such, the analysis does not attempt a comprehensive quantification of costs and benefits, though some of the larger public interest benefits of the project are discussed qualitatively elsewhere in this paper. To conduct the analysis, the Commission worked with Energy and Environmental Analysis, Inc. (EEA) to construct and model several natural gas market scenarios. The first set of scenarios simply forecasts natural gas supply, demand, and prices both with and without the Alaskan pipeline. The second set of scenarios examines five important variables to assess their impact on future natural gas prices. These factors include (1) modified economic activity, as measured by the growth rate in GDP, (2) level of LNG imports, (3) natural gas production levels in the lower 48 states, (4) end-use efficiency and fuel-switching capabilities, and (5) crude oil prices. Importantly, this analysis was designed to quantify and characterize the aggregate, economy-wide impacts of the Alaskan pipeline and therefore does not account for regional differences which could certainly be substantial under the various scenarios analyzed.
Impact of the Pipeline
The first part of the analysis examined two scenarios: one in which pipeline construction is completed with gas flowing into Alberta starting in 2013; the second in which pipeline construction is delayed or abandoned entirely and no Alaskan natural gas is available in the lower 48 states throughout the forecast period (i.e., through 2025). The results indicate that the increase in natural gas supplies is likely to have a significant impact on North American natural gas prices. Model-predicted price impacts are highest in the first two years after the pipeline is completed, with Henry Hub prices falling by approximately $2.00 per million Btu. 6 As producers in Canada and the lower 48 states adjust their production in response
4 While the analysis is based on cost estimates for the “southern route”, construction costs for the “northern route” are likely to be comparable. 5 Some Commission members believe that if a tax credit of this type is adopted some sharing of the associated costs with the State of Alaska should be considered. 6 The analysis assumes the pipeline begins operation in the 3rd quarter 2013. Production is ramped up gradually, with the full 4.0 Bcf/d delivery beginning in 2015. For simplicity, all results are calculated for the 2015 through 2025 period. Note that because of substantial uncertainties about how quickly producers and markets will respond to the new availability of Alaskan gas, we do not include the initial, model-predicted $2.10 per million Btu price drop in our primary calculation of consumer gains and producer gains and losses.
National Commission on Energy Policy Increasing U.S. Natural Gas Supplies
7
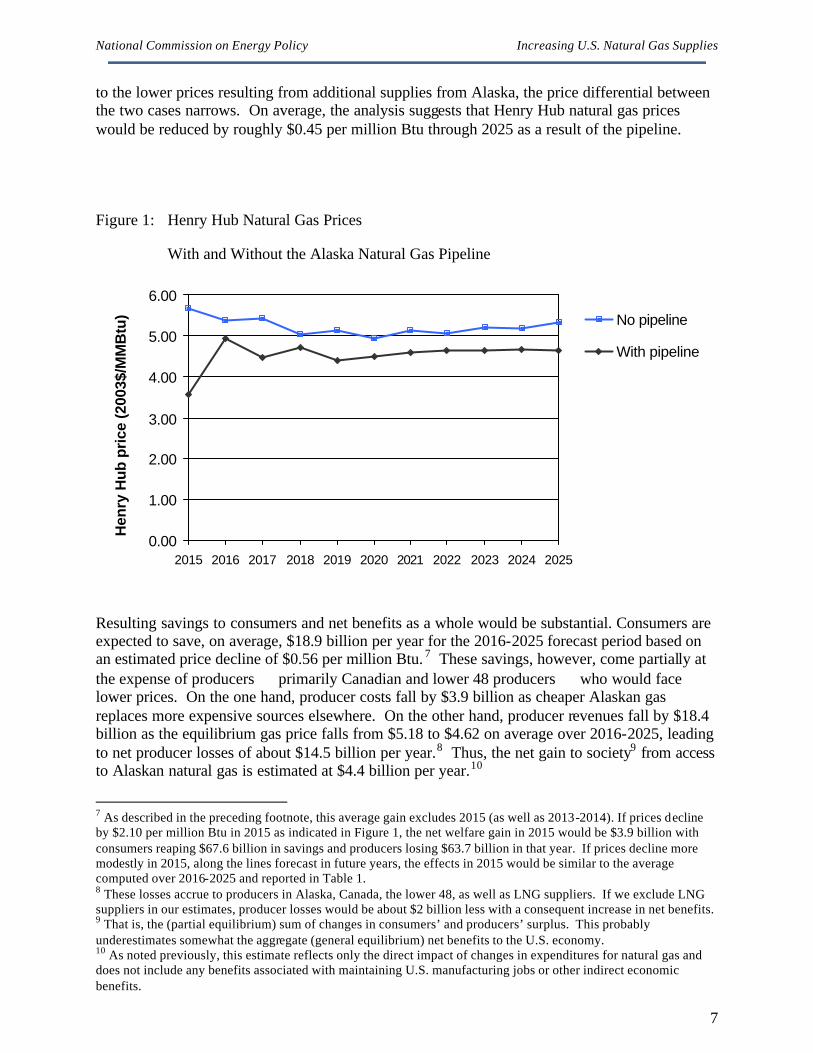
to the lower prices resulting from additional supplies from Alaska, the price differential between the two cases narrows. On average, the analysis suggests that Henry Hub natural gas prices would be reduced by roughly $0.45 per million Btu through 2025 as a result of the pipeline.
Figure 1: Henry Hub Natural Gas Prices
With and Without the Alaska Natural Gas Pipeline
0.00
1.00
2.00
3.00
4.00
5.00
6.00
2015 2016 2017 2018 2019 2020 2021 2022 2023 2024 2025
Hen
ry H
ub p
rice
(200
3$/M
MB
tu) No pipeline
With pipeline
Resulting savings to consumers and net benefits as a whole would be substantial. Consumers are expected to save, on average, $18.9 billion per year for the 2016-2025 forecast period based on an estimated price decline of $0.56 per million Btu. 7 These savings, however, come partially at the expense of producers primarily Canadian and lower 48 producers who would face lower prices. On the one hand, producer costs fall by $3.9 billion as cheaper Alaskan gas replaces more expensive sources elsewhere. On the other hand, producer revenues fall by $18.4 billion as the equilibrium gas price falls from $5.18 to $4.62 on average over 2016-2025, leading to net producer losses of about $14.5 billion per year.8 Thus, the net gain to society9 from access to Alaskan natural gas is estimated at $4.4 billion per year.10
7 As described in the preceding footnote, this average gain excludes 2015 (as well as 2013-2014). If prices decline by $2.10 per million Btu in 2015 as indicated in Figure 1, the net welfare gain in 2015 would be $3.9 billion with consumers reaping $67.6 billion in savings and producers losing $63.7 billion in that year. If prices decline more modestly in 2015, along the lines forecast in future years, the effects in 2015 would be similar to the average computed over 2016-2025 and reported in Table 1. 8 These losses accrue to producers in Alaska, Canada, the lower 48, as well as LNG suppliers. If we exclude LNG suppliers in our estimates, producer losses would be about $2 billion less with a consequent increase in net benefits. 9 That is, the (partial equilibrium) sum of changes in consumers’ and producers’ surplus. This probably underestimates somewhat the aggregate (general equilibrium) net benefits to the U.S. economy. 10 As noted previously, this estimate reflects only the direct impact of changes in expenditures for natural gas and does not include any benefits associated with maintaining U.S. manufacturing jobs or other indirect economic benefits.
National Commission on Energy Policy Increasing U.S. Natural Gas Supplies
8
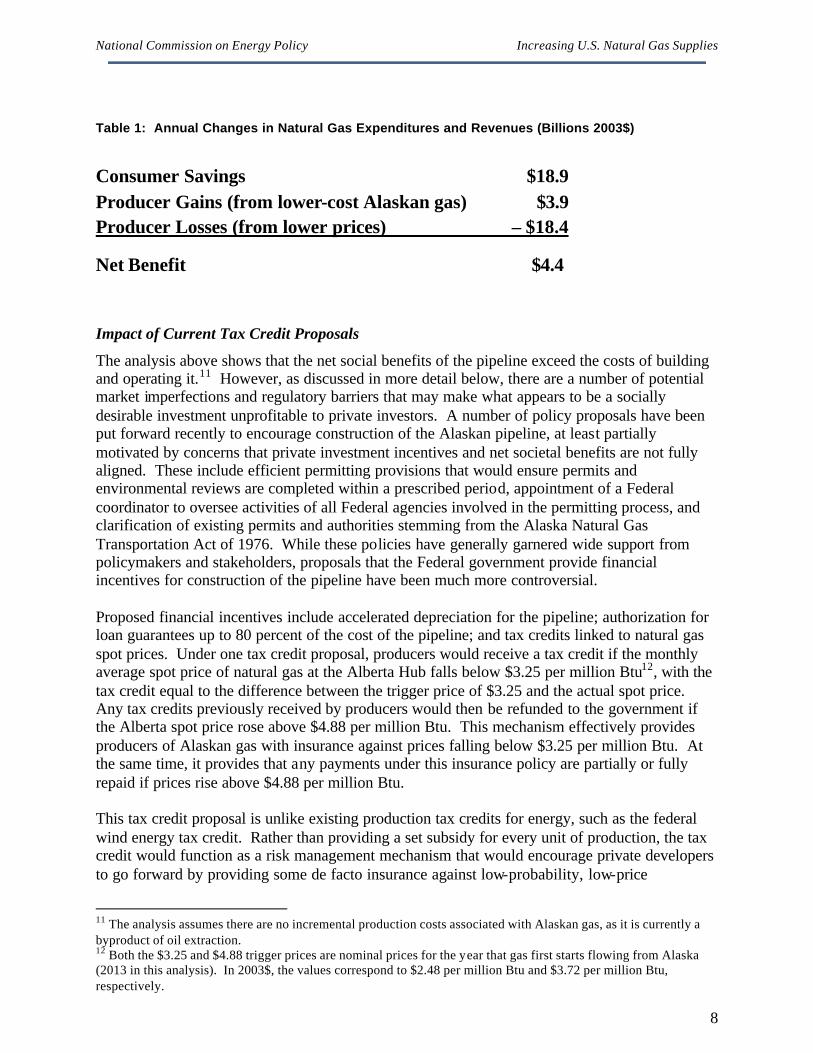
Table 1: Annual Changes in Natural Gas Expenditures and Revenues (Billions 2003$)
Consumer Savings $18.9 Producer Gains (from lower-cost Alaskan gas) $3.9 Producer Losses (from lower prices) – $18.4
Net Benefit $4.4
Impact of Current Tax Credit Proposals
The analysis above shows that the net social benefits of the pipeline exceed the costs of building and operating it.11 However, as discussed in more detail below, there are a number of potential market imperfections and regulatory barriers that may make what appears to be a socially desirable investment unprofitable to private investors. A number of policy proposals have been put forward recently to encourage construction of the Alaskan pipeline, at least partially motivated by concerns that private investment incentives and net societal benefits are not fully aligned. These include efficient permitting provisions that would ensure permits and environmental reviews are completed within a prescribed period, appointment of a Federal coordinator to oversee activities of all Federal agencies involved in the permitting process, and clarification of existing permits and authorities stemming from the Alaska Natural Gas Transportation Act of 1976. While these policies have generally garnered wide support from policymakers and stakeholders, proposals that the Federal government provide financial incentives for construction of the pipeline have been much more controversial. Proposed financial incentives include accelerated depreciation for the pipeline; authorization for loan guarantees up to 80 percent of the cost of the pipeline; and tax credits linked to natural gas spot prices. Under one tax credit proposal, producers would receive a tax credit if the monthly average spot price of natural gas at the Alberta Hub falls below $3.25 per million Btu12, with the tax credit equal to the difference between the trigger price of $3.25 and the actual spot price. Any tax credits previously received by producers would then be refunded to the government if the Alberta spot price rose above $4.88 per million Btu. This mechanism effectively provides producers of Alaskan gas with insurance against prices falling below $3.25 per million Btu. At the same time, it provides that any payments under this insurance policy are partially or fully repaid if prices rise above $4.88 per million Btu. This tax credit proposal is unlike existing production tax credits for energy, such as the federal wind energy tax credit. Rather than providing a set subsidy for every unit of production, the tax credit would function as a risk management mechanism that would encourage private developers to go forward by providing some de facto insurance against low-probability, low-price
11 The analysis assumes there are no incremental production costs associated with Alaskan gas, as it is currently a byproduct of oil extraction. 12 Both the $3.25 and $4.88 trigger prices are nominal prices for the year that gas first starts flowing from Alaska (2013 in this analysis). In 2003$, the values correspond to $2.48 per million Btu and $3.72 per million Btu, respectively.
National Commission on Energy Policy Increasing U.S. Natural Gas Supplies
9
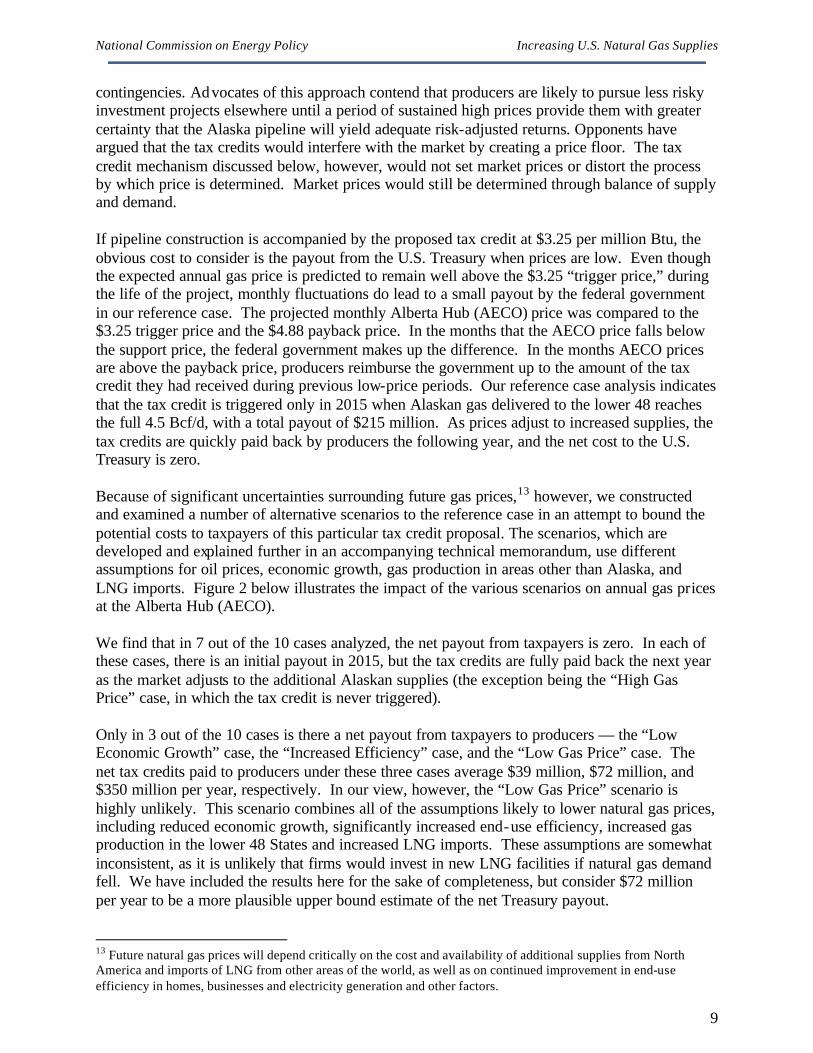
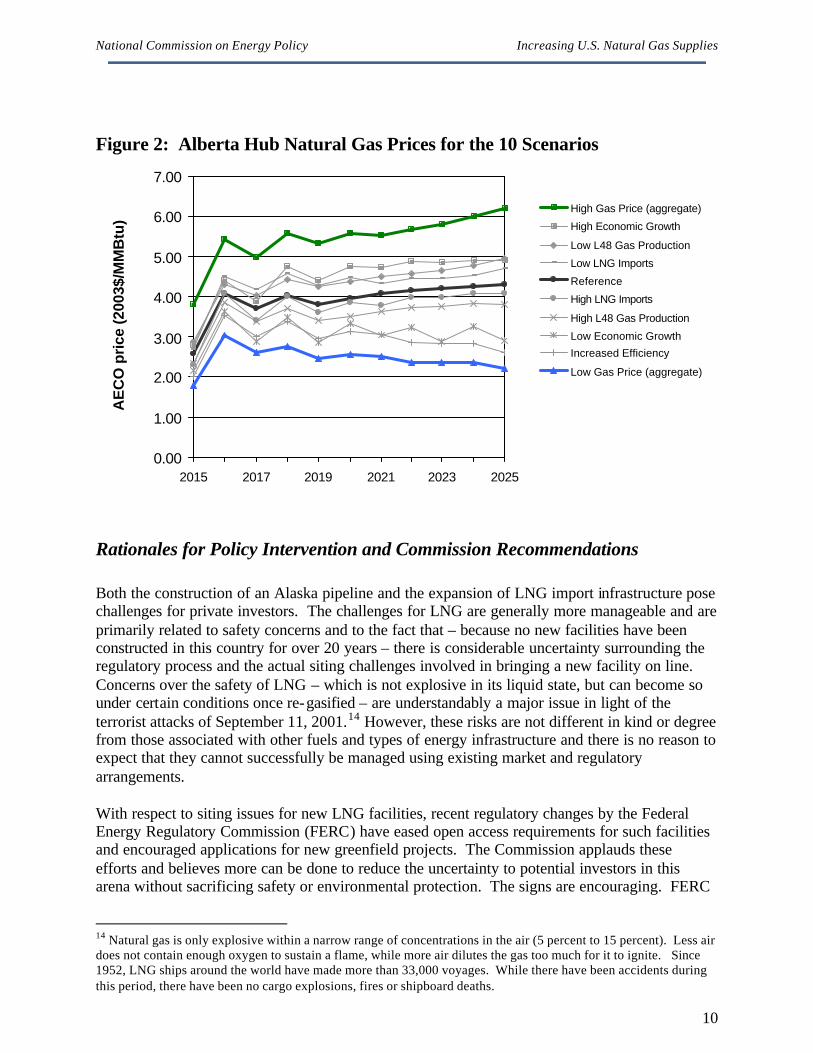
contingencies. Advocates of this approach contend that producers are likely to pursue less risky investment projects elsewhere until a period of sustained high prices provide them with greater certainty that the Alaska pipeline will yield adequate risk-adjusted returns. Opponents have argued that the tax credits would interfere with the market by creating a price floor. The tax credit mechanism discussed below, however, would not set market prices or distort the process by which price is determined. Market prices would still be determined through balance of supply and demand. If pipeline construction is accompanied by the proposed tax credit at $3.25 per million Btu, the obvious cost to consider is the payout from the U.S. Treasury when prices are low. Even though the expected annual gas price is predicted to remain well above the $3.25 “trigger price,” during the life of the project, monthly fluctuations do lead to a small payout by the federal government in our reference case. The projected monthly Alberta Hub (AECO) price was compared to the $3.25 trigger price and the $4.88 payback price. In the months that the AECO price falls below the support price, the federal government makes up the difference. In the months AECO prices are above the payback price, producers reimburse the government up to the amount of the tax credit they had received during previous low-price periods. Our reference case analysis indicates that the tax credit is triggered only in 2015 when Alaskan gas delivered to the lower 48 reaches the full 4.5 Bcf/d, with a total payout of $215 million. As prices adjust to increased supplies, the tax credits are quickly paid back by producers the following year, and the net cost to the U.S. Treasury is zero. Because of significant uncertainties surrounding future gas prices,13 however, we constructed and examined a number of alternative scenarios to the reference case in an attempt to bound the potential costs to taxpayers of this particular tax credit proposal. The scenarios, which are developed and explained further in an accompanying technical memorandum, use different assumptions for oil prices, economic growth, gas production in areas other than Alaska, and LNG imports. Figure 2 below illustrates the impact of the various scenarios on annual gas prices at the Alberta Hub (AECO). We find that in 7 out of the 10 cases analyzed, the net payout from taxpayers is zero. In each of these cases, there is an initial payout in 2015, but the tax credits are fully paid back the next year as the market adjusts to the additional Alaskan supplies (the exception being the “High Gas Price” case, in which the tax credit is never triggered). Only in 3 out of the 10 cases is there a net payout from taxpayers to producers — the “Low Economic Growth” case, the “Increased Efficiency” case, and the “Low Gas Price” case. The net tax credits paid to producers under these three cases average $39 million, $72 million, and $350 million per year, respectively. In our view, however, the “Low Gas Price” scenario is highly unlikely. This scenario combines all of the assumptions likely to lower natural gas prices, including reduced economic growth, significantly increased end-use efficiency, increased gas production in the lower 48 States and increased LNG imports. These assumptions are somewhat inconsistent, as it is unlikely that firms would invest in new LNG facilities if natural gas demand fell. We have included the results here for the sake of completeness, but consider $72 million per year to be a more plausible upper bound estimate of the net Treasury payout.
13 Future natural gas prices will depend critically on the cost and availability of additional supplies from North America and imports of LNG from other areas of the world, as well as on continued improvement in end-use efficiency in homes, businesses and electricity generation and other factors.
National Commission on Energy Policy Increasing U.S. Natural Gas Supplies
10
Figure 2: Alberta Hub Natural Gas Prices for the 10 Scenarios
0.00
1.00
2.00
3.00
4.00
5.00
6.00
7.00
2015 2017 2019 2021 2023 2025
AE
CO
pri
ce (2
003$
/MM
Btu
)
High Gas Price (aggregate)
High Economic Growth
Low L48 Gas Production
Low LNG Imports
Reference
High LNG Imports
High L48 Gas Production
Low Economic Growth
Increased Efficiency
Low Gas Price (aggregate)
Rationales for Policy Intervention and Commission Recommendations Both the construction of an Alaska pipeline and the expansion of LNG import infrastructure pose challenges for private investors. The challenges for LNG are generally more manageable and are primarily related to safety concerns and to the fact that – because no new facilities have been constructed in this country for over 20 years – there is considerable uncertainty surrounding the regulatory process and the actual siting challenges involved in bringing a new facility on line. Concerns over the safety of LNG – which is not explosive in its liquid state, but can become so under certain conditions once re-gasified – are understandably a major issue in light of the terrorist attacks of September 11, 2001.14 However, these risks are not different in kind or degree from those associated with other fuels and types of energy infrastructure and there is no reason to expect that they cannot successfully be managed using existing market and regulatory arrangements. With respect to siting issues for new LNG facilities, recent regulatory changes by the Federal Energy Regulatory Commission (FERC) have eased open access requirements for such facilities and encouraged applications for new greenfield projects. The Commission applauds these efforts and believes more can be done to reduce the uncertainty to potential investors in this arena without sacrificing safety or environmental protection. The signs are encouraging. FERC
14 Natural gas is only explosive within a narrow range of concentrations in the air (5 percent to 15 percent). Less air does not contain enough oxygen to sustain a flame, while more air dilutes the gas too much for it to ignite. Since 1952, LNG ships around the world have made more than 33,000 voyages. While there have been accidents during this period, there have been no cargo explosions, fires or shipboard deaths.
National Commission on Energy Policy Increasing U.S. Natural Gas Supplies
11
recently granted authorization for the construction of the first new LNG terminal in the U.S. in 20 years, which will be located along the Gulf coast in Louisiana. More facilities like this will be needed. The manner in which this project progresses, and the timeliness of its activation, could be important indicators for the future of LNG as a supply option for the U.S. The Commission encourages overseeing authorities to work cooperatively with industry and to handle additional applications with similar efficacy in an effort to develop a set of best practices that accommodates all parties. The challenges confronting potential investors with respect to the Alaska pipeline – by contrast – are considerably more complex and will likely be more difficult to overcome. Some of the most important include: Ø Substantial financial risk as a result of the magnitude of the project and the length
of time needed to complete the pipeline, especially in the face of significant uncertainty over future prices and potential price volatility.
Ø The difficulty of managing these risks given the decline of long-term contracts in recent years as a result of gas market unbundling and competition, together with the unsettled state of electricity restructuring and competition policies.
Ø Regulatory uncertainty regarding siting and permitting of the pipeline and uncertainty regarding royalty payments for Alaskan gas production.
The first two of these challenges are exacerbated by the pipeline’s inherent geographic commitment to the North American market. In the case of LNG, for example, production infrastructure, LNG tankers and liquefaction facilities can be utilized to deliver natural gas to markets other than the intended U.S. delivery location, should U.S. market prices fall. Only the re-gasification facility is tied exclusively to the U.S. market. The Alaska project’s value, on the other hand, is inexorably linked to the value of gas at the Canadian or U.S. terminus of the line. None of the above challenges faced by potential pipeline investors necessarily represent market “failures” that would themselves justify government intervention. However, there are at least two important factors related to the considerations listed above that are more likely than not to create a gap (of uncertain magnitude) between private investor valuations and social benefits. First, dramatic changes in the structure and regulation of gas and electricity markets in the last decade have led to a significant decline in reliance on long-term contracts linking producers and consumers and the associated allocation of market risks between them. One of the goals of these gas and electricity industry reforms was to allow consumers to express their own risk preferences vis-à-vis gas and electricity price uncertainty by choosing the nature and duration of contractual commitments with suppliers, and the associated allocation of market risks, themselves rather than relying on regulators to act on their behalf. A more diverse portfolio of contracts between consumers and producers, with shorter average durations and leading to more market risk being allocated to producers, is a natural outcome of these regulatory and market reforms. Accordingly, it should have been expected that the cost of capital (or hurdle rates) faced by investors in natural gas infrastructure would rise as a consequence of these reforms, while consumers generally benefit from better market incentives for cost control, lower prices overall and from an allocation of market risk that better reflects relative risk-bearing costs. Nevertheless, the transition to well- functioning, competitive gas and – more importantly -- wholesale and retail electricity markets is far from complete and faces significant challenges. These imperfections have likely led to a situation where consumers and their agents presently
National Commission on Energy Policy Increasing U.S. Natural Gas Supplies
12
face distorted incentives that are leading them to avoid longer-term contractual commitments. This situation is compounded by the credit crisis among energy marketers and investors in merchant generating plants. Accordingly, it is more likely than not that an efficient market for risk management tools to properly allocate market risks between consumers and producers has not yet emerged and is acting as a deterrent to investment in large capital- intensive infrastructure projects whose profitability is tied to variations in gas and electricity spot prices. A second relevant consideration that may lead to a gap between private investment incentives and the social value of an investment with the Alaska pipeline’s attributes is that this type of project can be characterized – from an investment standpoint – as extremely “lumpy.” That is, it involves a large, “all or nothing” capital investment in new supply capacity where the average cost of the new capacity being added declines as the capacity increases, other things being equal. Economists have demonstrated that similarly “lumpy” investments – in the case of electricity transmission infrastructure, for example – can lead to a situation where the value of the new capacity being added, from the perspective of potential private investors, understates the social surplus it creates by reducing future prices.15 In these cases, cautious government intervention – subject to several caveats indicated below – may be appropriate. The results of our cost-benefit analysis suggest that the Alaska pipeline very likely does represent such an instance of mismatch between private and societal valuations of a large and risky capital investment. In addition to these two factors related to the project itself, it may be the case more generally that society values the risk associated with low and high gas price outcomes differently than private investors. We briefly discuss possible reasons for this divergence in the “National Interests” section below. Accordingly, the Commission’s recommendation with respect to the Alaska pipeline is that government policymakers give favorable consideration to options that would support pipeline construction by partially shielding investors from the risks of extreme low-price contingencies, while ensuring that taxpayers will be fully compensated for any outlays should natural gas prices subsequently rise to higher levels. Importantly, the Commission does not endorse any particular level of tax credit, nor was our analysis designed to provide a basis for choosing a particular number. More broadly, the above recommendation must be understood in the context of the Commission’s strong belief that government subsidies or tax credits generally are justified only where true market imperfections or regulatory barriers have been identified that stand in the way of the full exploitation of socially beneficial supply and demand side options. Programs designed to mitigate the impacts of market imperfections and regulatory barriers should be used cautiously — after reasonable efforts have been made to reduce the underlying market imperfections and regulatory barriers – and only when remaining market imperfections and regulatory barriers create a clear public interest in enhancing competitive market incentives and market discipline. Moreover, such programs should be structured so as to complement rather than distort market processes and to minimize any financial burdens on taxpayers. For the reasons described above, it appears likely that certain features of the Alaska pipeline — notably current imperfections in markets for natural gas risk management instruments and the project’s “lumpiness” — are creating a gap between private and societal valuations of moving it forward. It is the existence of this gap —
15 For a fuller theoretical treatment, see Paul Joskow and Jean Tirole, Merchant Transmission Investment, May 6, 2003. (http://econ-www.mit.edu/faculty/?prof_id=pjoskow&type=paper)
National Commission on Energy Policy Increasing U.S. Natural Gas Supplies
13
together with the availability of incentive policies that can, at modest cost and without adversely distorting natural gas markets, at least partially close the gap — that provide a principled rationale for the Commission’s recommendation. In the case of LNG infrastructure — which, for the reasons discussed above, presents lesser challenges to private investors — the Commission offers the more modest recommendation that policymakers codify FERC’s recent policy changes regarding open access and reserve capacity for LNG re-gasification facilities. These policy changes will reduce uncertainty and encourage investment in LNG facilities. At the same time, the Commission acknowledges the legitimate concerns of local communities as they evaluate the implications of accommodating a major new industrial facility. Therefore LNG siting decisions should take full account of states' coastal zone management programs, and avoid marine sanctuaries, marine protected areas, sensitive habitats, and fragile resources like deep corals.
The National Interest in Expanding Natural Gas Supply Options The cost-benefit analysis of the Alaska pipeline described above attempts to capture only the “partial equilibrium” benefits directly attributable to reduced prices for consumers and users of natural gas. Major groups in this category include the chemical industry, the millions of Americans who use natural gas in their homes for heating and cooking, and natural-gas fired power plants that directly influence the price of electricity. In fact, lower natural gas prices are expected to result in several additional benefits to the U.S. economy by helping to preserve U.S. manufacturing jobs, enhancing energy security, and displacing pollution from energy sources with higher emissions. While our analysis did not include quantitative estimates of these benefits, the Commission believes they are important and should not be overlooked. Alaskan natural gas is also a relatively secure, stable domestic source of supply that will help to enhance U.S. energy security. LNG imports are expected to rise substantially over the next several years in response to higher U.S. prices. While increasing reliance on natural gas imports does not immediately pose the same energy security issues as oil, it is not entirely clear how global LNG markets will evolve over the next few decades and how this might affect the U.S. In addition, consideration must be given to inherent security risks related to terrorism and sabotage associated with the Alaska pipeline project. These risks appear substantially similar to those presently being managed in the operation and protection of the Trans-Alaska oil pipeline. Ensuring the security of critical energy assets and infrastructure has been identified as a top priority by the Office of Homeland Security and would need to be addressed in planning for the construction and operation of the Alaska pipeline if it moves forward. Finally, lower natural gas prices are likely to reduce environmental compliance costs for a number of industries, in particular the electric power sector. Natural gas is the cleanest burning fossil fuel. Increasing reliance on natural gas in the electric power sector allows firms to avoid additional environmental compliance costs that would be incurred with new coal or oil plants. In addition, natural gas emits fewer carbon dioxide emissions when burned than either coal or oil. If the U.S. begins to reduce greenhouse gas emissions over the next few decades, natural gas use is likely to increase even further. Additional natural gas supplies and lower prices will help to lower future emission reduction costs.
National Commission on Energy Policy Increasing U.S. Natural Gas Supplies
14
Other Areas of Commission Research in Natural Gas Policy The Commission has four additional research projects underway on natural gas related topics. These studies are intended to complement the study recently completed by the National Petroleum Council and provide additional detail on supply and demand issues. They include: (1) Natural Gas Use in the Industrial and Electric Power Sectors; (2) Expanded LNG Imports: Implications for U.S. Energy Markets; (3) Energy Efficiency Opportunities in New Buildings and Equipment; and (4) Retrospective Examination of Energy Demand-Side Policies. The Commission will draw upon these studies and other research in reaching its final recommendations. Natural Gas Use in the Industrial and Electric Power Sectors
This study will provide detailed description of natural gas usage trends in the industrial and power sectors and evaluate the impacts of high gas prices on specific gas-dependent industries such as the chemical and fertilizer industry. In particular, the study will focus on gaining a better understanding of current fuel-switching capabilities in both the industrial and electric power sectors and its impact on natural gas price volatility. The study will also examine the longer-term potential for demand destruction in major U.S. industries as a result of higher natural gas prices. Expanded LNG Imports: Implications for U.S. Energy Markets
If LNG imports become the marginal supplier of natural gas to the U.S. markets, the U.S. will in effect be entering a regional, if not global marketplace for gas. Understanding the implications of this fundamental transition from a North American to a global natural gas market is an important energy policy issue. Key questions to be examined in this study include: § If gas markets globalize will oil and gas prices again become linked as they are in other
parts of the world such as Europe? § Will the U.S. economy become more vulnerable to oil or gas price shocks? § What is the projected long-term natural gas price as LNG imports become an increasingly
important supply source? § What are the potential consequences of competition for LNG among the U.S., Europe,
and Japan? § What are the national security implications of a steadily increasing reliance on imported
natural gas? In addition to these studies on supply-related natural gas topics, the Commission also has two research projects underway that address demand-side issues. Energy Efficiency Opportunities in New Buildings & Equipment
This study will provide estimates of the economic potential for energy and cost savings by fuel and sector, and the environmental impacts from improved energy efficiency in new buildings and equipment in the residential, commercial, and industrial sectors. In particular, the study will estimate the additional costs to retrofit buildings rather than incorporating advanced efficiency into the initial building design. The study will also provide an overview of market barriers and failures related to energy efficiency investments, and policies designed to overcome them. The report will provide recommendations for continuing or improving existing policies and/or implementing new policies.
National Commission on Energy Policy Increasing U.S. Natural Gas Supplies
15
Retrospective Examination of Energy Demand-Side Policies
This study will examine the effectiveness and cost of past demand-side energy programs, including regulatory, voluntary and tax strategies, and identify the lessons they provide for possible new initiatives. Programs to be evaluated include: appliance and equipment standards, demand-side management programs operated by electric utilities, market transformation initiatives, federal energy management program (FEMP), voluntary programs, including EPA and DOE programs, and late 1970s/early 1980s tax breaks for energy efficiency investment. The evaluation will be based on review of published data sources, technical reports, and academic literature.
Conclusion Over the past few years increased demand for natural gas, especially for electricity generation, combined with flat production in the lower 48 states, has resulted in higher natural gas prices. Moreover, natural gas prices are likely to continue to rise in the future as producers are forced to move to more expensive supplies to keep up with demand. Many analysts argue that the North American natural gas market has moved to a permanently higher price level. Substantial supplies of natural gas in Alaska and from other nations are currently inaccessible due to lack of domestic infrastructure. Construction of a major 3,000 mile natural gas pipeline would provide the continental U.S. with access to Alaska natural gas, but three major factors make building such a pipeline a particularly risky investment the large capital costs of the project ($20 billion), the length of time needed to build the pipeline (8 to 10 years), and, by its nature, the pipeline’s geographic commitment to the future U.S. and Canadian market. The Commission examined a tax credit approach in which producers would receive a tax credit if the monthly average spot price of natural gas at the Alberta Hub falls below $3.25 per million Btu, with the production subsidy equal to the difference between the trigger price of $3.25 and the actual spot price. Any production subsidy previously received by producers would then be refunded to the government if the Alberta spot price rose above $4.88 per million Btu. The Commission found that the Alaskan gas pipeline would be expected to provide a range of benefits to the U.S., including 10 to 20 percent reductions in natural gas prices and net benefits averaging $4 billion annually. In addition to savings in natural gas expenditures, lower natural gas prices would also be expected to help preserve U.S. manufacturing jobs, enhance energy security, and reduce environmental compliance costs. Given the substantial benefits likely to accrue from construction of the Alaska natural gas pipeline and the likelihood that certain factors – notably current imperfections in markets for natural gas risk management instruments and the project’s “lumpiness” – may be creating a gap between societal and private assessments of the value of moving it forward, the Commission believes that cautious government intervention may be justified to promote construction of the pipeline sooner than might otherwise occur in the absence of intervention. While the Alaska natural gas pipeline will bring additional natural gas supplies to the market in approximately 10 years, LNG imports are likely to be an important near-term source of

National Commission on Energy Policy Increasing U.S. Natural Gas Supplies
16
additional supply. Recent policy changes by FERC have helped to spur further market interest in building new LNG facilities in the U.S. Codifying these policy changes will provide clarity for market participants and ensure that investments in new facilities continue to move forward.
National Commission on Energy Policy Increasing U.S. Natural Gas Supplies
17
The 18 members of the National Commission on Energy Policy join in support of the recommendations stated herein: Dr. Marilyn Brown Director, Energy Efficiency and Renewable Energy Program, Oak Ridge National Laboratory Ralph Cavanagh Senior Attorney & Co-Director, Energy Program, Natural Resources Defense Council Archie W. Dunham* Chairman, ConocoPhillips Rodney Ellis State Senator, Texas Leo Gerard International President, United Steelworkers of America (USWA) F. Henry Habicht CEO, Global Environment & Technology Foundation; former Deputy Administrator of the Environmental Protection Agency Dr. John P. Holdren Teresa and John Heinz Professor of Environmental Policy, Harvard University Dr. Paul L. Joskow* Professor of Economics and Director of MIT Center for Energy and Environmental Policy Research, Massachusetts Institute of Technology Andrew Lundquist President, The Lundquist Group; former Executive Director, The White House National Energy Policy Development Group Dr. Mario J. Molina Institute Professor, Massachusetts Institute of Technology Sharon Nelson Chief, Consumer Protection Division, Washington Attorney General’s Office; Chair, Board of Directors, Consumers Union William K. Reilly President and CEO, Aqua International Partners; former Administrator of the Environmental Protection Agency John W. Rowe Chairman and CEO, Exelon Corporation Phillip R. Sharp Senior Advisor, Lexecon, Inc.; Senior Policy Advisor, Van Ness Feldman; former U.S. Representative, IN Linda Stuntz Stuntz, Davis & Staffier; former Deputy Secretary of Energy Susan Tierney Managing Principal, The Analysis Group; former Assistant Secretary of Energy R. James Woolsey Vice President, Booz, Allen, Hamilton; former Director of Central Intelligence Dr. Martin B. Zimmerman* Group Vice President, Corporate Affairs, Ford Motor Company
National Commission on Energy Policy Increasing U.S. Natural Gas Supplies
18
Concurrence from Commissioner Paul L. Joskow Professor of Economics and Director of MIT Center for Energy and Environmental Policy Research, Massachusetts Institute of Technology I concur with the analysis and recommendations regarding tax subsidies for an Alaska natural gas pipeline contained in this paper without great enthusiasm. I would have preferred the Commission to wait to release a comprehensive peer reviewed paper on natural gas supply, demand and infrastructure investment issues that reflected a more complete analysis of natural gas markets, market imperfections and regulatory barriers affecting infrastructure investment, and a range of policy options. Nevertheless, I believe that this “interim” paper can provide useful information to inform the current debate about government support for an Alaska natural gas pipeline in particular, and to begin to articulate a public interest framework for properly evaluating proposals for direct and indirect government subsidies more generally. I have voted for releasing the paper primarily for these reasons. There are several aspects of the analysis and recommendations contained in the paper that I want to emphasize. First, the paper makes clear the Commission’s reluctance to rely on direct and indirect government subsidies. The public interest case for subsidies should be based on the presence of significant market imperfections or regulatory barriers that are adversely distorting private investment decisions and that superior policy interventions to mitigate these imperfections and barriers are unavailable. The recommendations in the paper are based on the conclusion that it is more likely than not that certain market imperfections and regulatory barriers associated with the unsettled state of natural gas and electricity markets, whose effects are compounded by the attributes of a project of this size, lead to a gap between private investment incentives and the expected societal value of the Alaska pipeline. Second, while the paper analyzes a particular contingent tax credit proposal, it does not endorse a specific trigger price for the credit. Based on the analysis upon which this paper relies, it appears to me that a lower trigger price may be justified. In addition, I see no reason why the State of Alaska should not share the costs of any subsidies provided to the pipeline since it will benefit from royalty payments produced by sales of Alaskan natural gas. Third, the analysis contained in the paper indicates that the expected costs of the tax credit will be very low, consistent with the net benefit calculations presented and the view that it is basically an insurance policy against a low gas price trajectory that has a low probability. These results, of course, depend on a large number of assumptions about gas supply costs, gas demand, and the cost of the pipeline. If additional analyses indicate that the expected cost of the tax credit is significantly higher than the estimates contained in the paper it would either seriously undermine the case that the pipeline is a wise investment or suggest that the tax credit is providing unreasonably large subsidies to Alaskan gas producers. Finally, despite the fact that the analysis contained in this paper focuses on the “southern” route, I believe that government policies should not favor one pipeline route over another and that any tax breaks should be route-neutral. Martin B. Zimmerman joins in this concurrence. Group Vice President, Corporate Affairs, Ford Motor Company

National Commission on Energy Policy Increasing U.S. Natural Gas Supplies
19
Concurrence from Commissioner Archie W. Dunham Chairman, ConocoPhillips I strongly concur with the recommendation of the Commission. My company, ConocoPhillips, would benefit if a low-price tax credit mechanism were incorporated into law; however, the public will benefit even more generously as they will have access to an important new natural gas supply. Without the low-price tax credit provision, the pipeline will not be built.

Appendix A: Description of EEA Modeling Analysis

National Commission on Energy Policy Increasing U.S. Natural Gas Supplies
ii
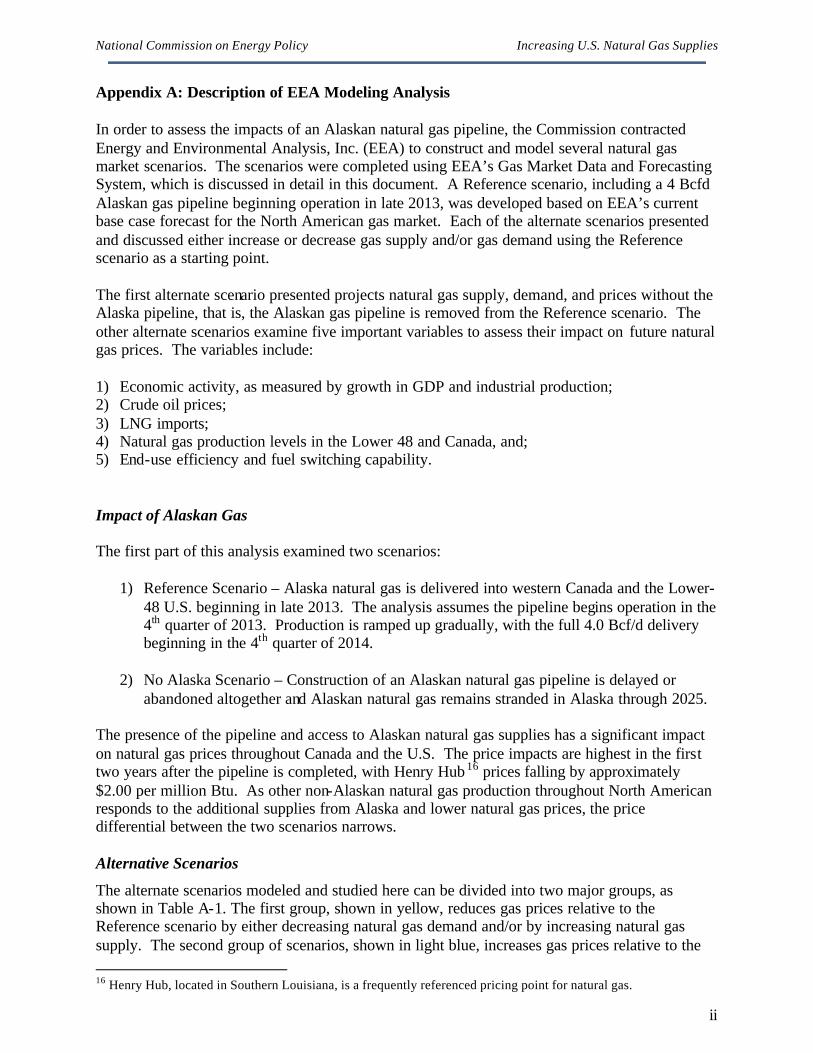
Appendix A: Description of EEA Modeling Analysis In order to assess the impacts of an Alaskan natural gas pipeline, the Commission contracted Energy and Environmental Analysis, Inc. (EEA) to construct and model several natural gas market scenarios. The scenarios were completed using EEA’s Gas Market Data and Forecasting System, which is discussed in detail in this document. A Reference scenario, including a 4 Bcfd Alaskan gas pipeline beginning operation in late 2013, was developed based on EEA’s current base case forecast for the North American gas market. Each of the alternate scenarios presented and discussed either increase or decrease gas supply and/or gas demand using the Reference scenario as a starting point. The first alternate scenario presented projects natural gas supply, demand, and prices without the Alaska pipeline, that is, the Alaskan gas pipeline is removed from the Reference scenario. The other alternate scenarios examine five important variables to assess their impact on future natural gas prices. The variables include: 1) Economic activity, as measured by growth in GDP and industrial production; 2) Crude oil prices; 3) LNG imports; 4) Natural gas production levels in the Lower 48 and Canada, and; 5) End-use efficiency and fuel switching capability. Impact of Alaskan Gas The first part of this analysis examined two scenarios:
1) Reference Scenario – Alaska natural gas is delivered into western Canada and the Lower-48 U.S. beginning in late 2013. The analysis assumes the pipeline begins operation in the 4th quarter of 2013. Production is ramped up gradually, with the full 4.0 Bcf/d delivery beginning in the 4th quarter of 2014.
2) No Alaska Scenario – Construction of an Alaskan natural gas pipeline is delayed or
abandoned altogether and Alaskan natural gas remains stranded in Alaska through 2025. The presence of the pipeline and access to Alaskan natural gas supplies has a significant impact on natural gas prices throughout Canada and the U.S. The price impacts are highest in the first two years after the pipeline is completed, with Henry Hub 16 prices falling by approximately $2.00 per million Btu. As other non-Alaskan natural gas production throughout North American responds to the additional supplies from Alaska and lower natural gas prices, the price differential between the two scenarios narrows. Alternative Scenarios
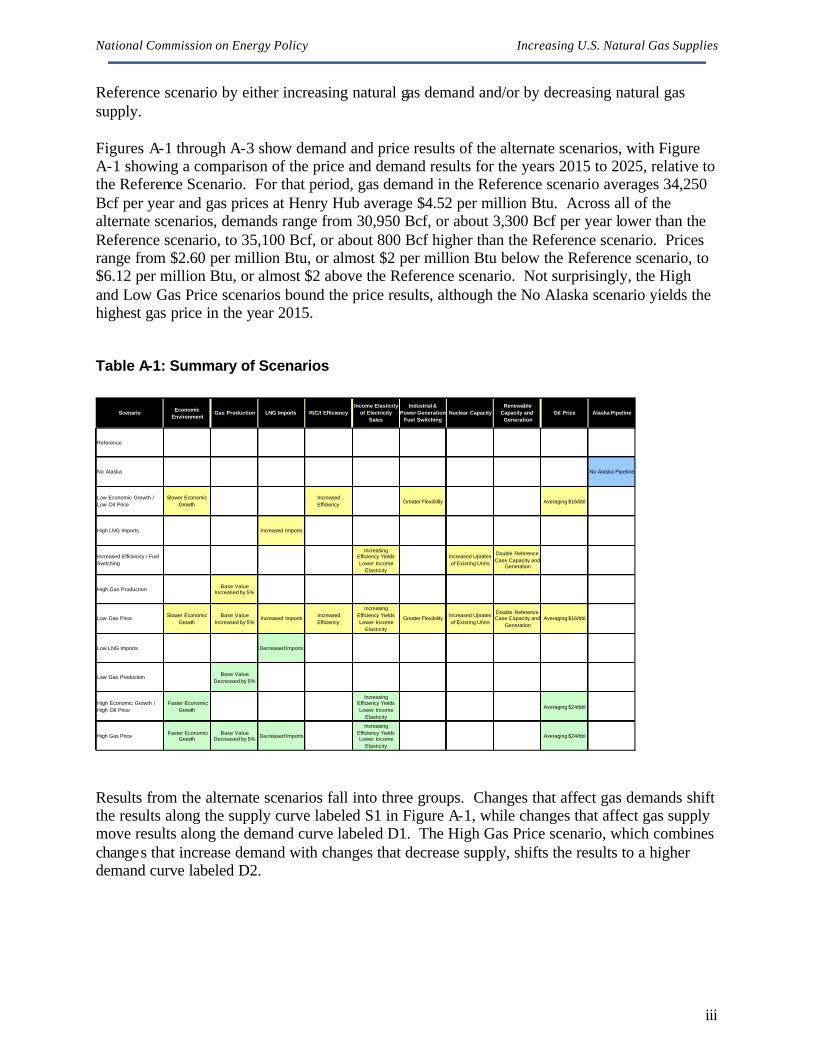
The alternate scenarios modeled and studied here can be divided into two major groups, as shown in Table A-1. The first group, shown in yellow, reduces gas prices relative to the Reference scenario by either decreasing natural gas demand and/or by increasing natural gas supply. The second group of scenarios, shown in light blue, increases gas prices relative to the 16 Henry Hub, located in Southern Louisiana, is a frequently referenced pricing point for natural gas.
National Commission on Energy Policy Increasing U.S. Natural Gas Supplies
iii
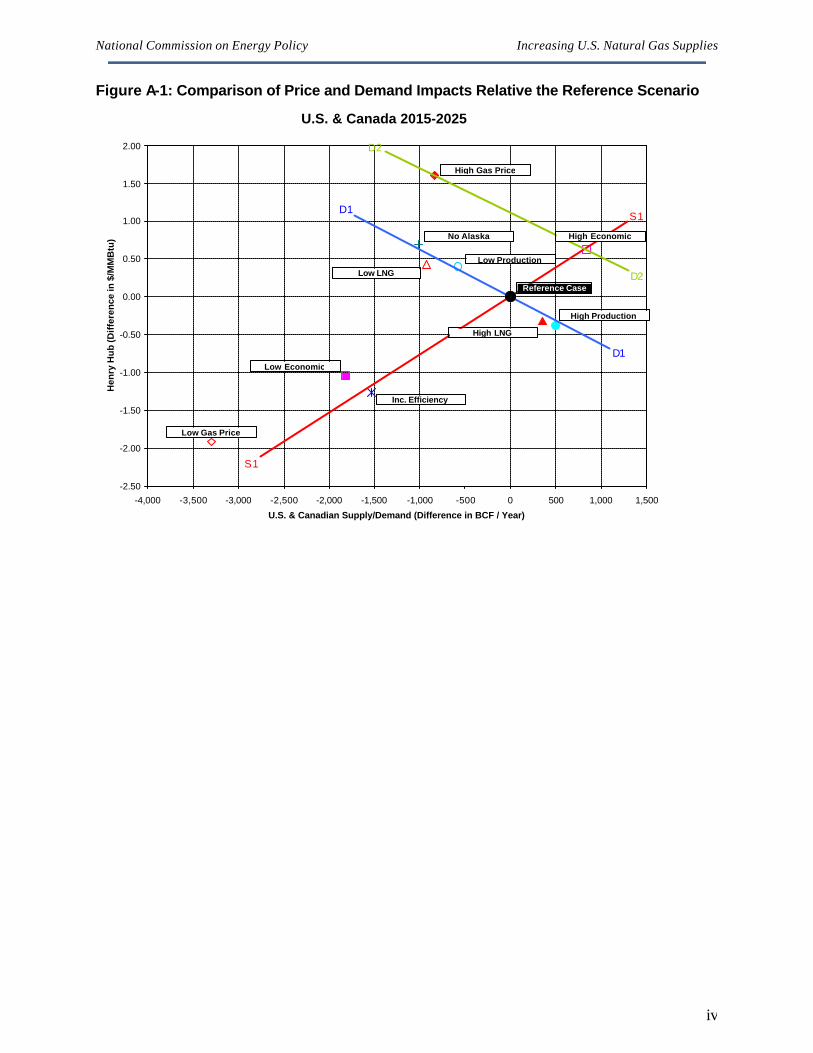
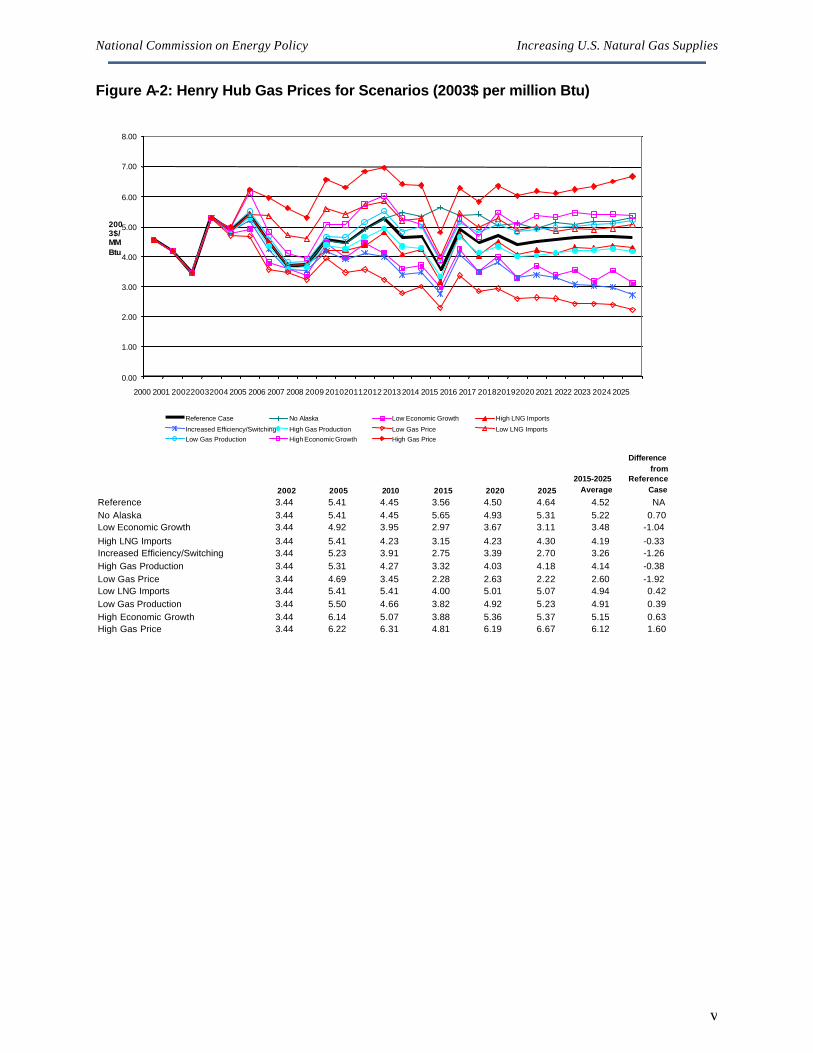
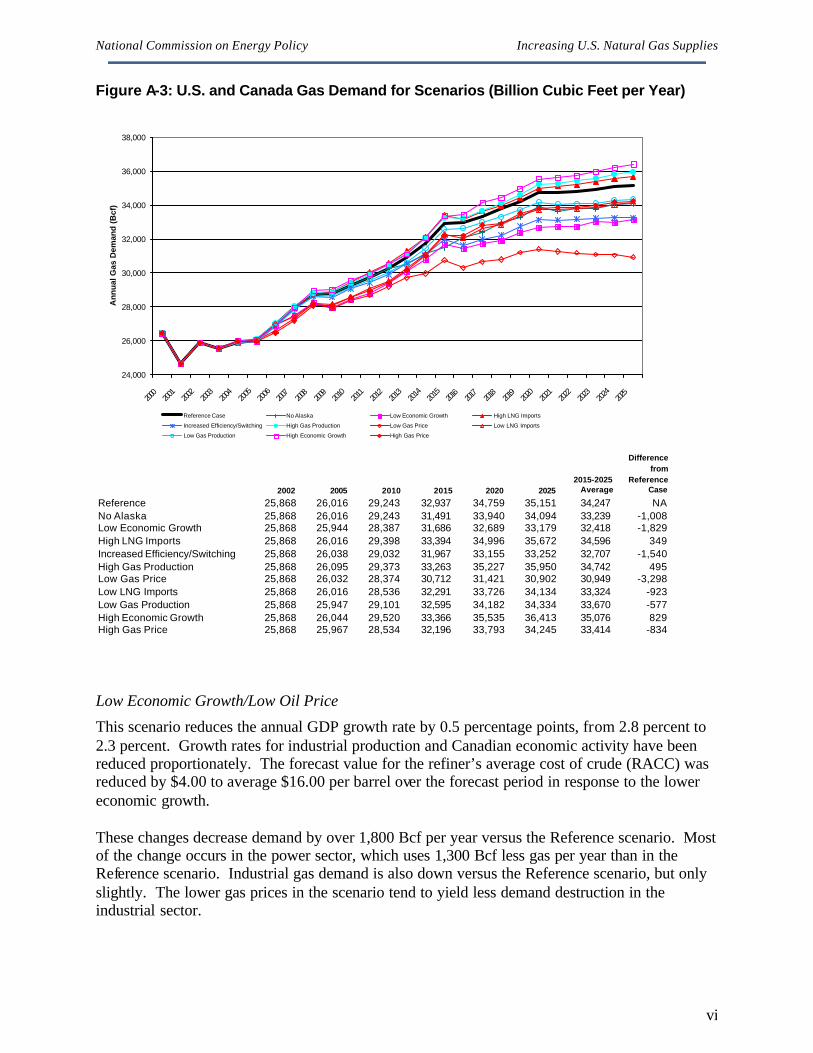
Reference scenario by either increasing natural gas demand and/or by decreasing natural gas supply. Figures A-1 through A-3 show demand and price results of the alternate scenarios, with Figure A-1 showing a comparison of the price and demand results for the years 2015 to 2025, relative to the Reference Scenario. For that period, gas demand in the Reference scenario averages 34,250 Bcf per year and gas prices at Henry Hub average $4.52 per million Btu. Across all of the alternate scenarios, demands range from 30,950 Bcf, or about 3,300 Bcf per year lower than the Reference scenario, to 35,100 Bcf, or about 800 Bcf higher than the Reference scenario. Prices range from $2.60 per million Btu, or almost $2 per million Btu below the Reference scenario, to $6.12 per million Btu, or almost $2 above the Reference scenario. Not surprisingly, the High and Low Gas Price scenarios bound the price results, although the No Alaska scenario yields the highest gas price in the year 2015. Table A-1: Summary of Scenarios
Scenario Economic Environment
Gas Production LNG Imports R/C/I EfficiencyIncome Elasticity
of Electricity Sales
Industrial &Power Generation
Fuel SwitchingNuclear Capacity
Renewable Capacity and
GenerationOil Price Alaska Pipeline
Reference
No Alaska No Alaska Pipeline
Low Economic Growth / Low Oil Price
Slower Economic Growth
Increased Efficiency Greater Flexibility Averaging $16/bbl
High LNG Imports Increased Imports
Increased Efficiency / Fuel Switching
Increasing Efficiency Yields Lower Income
Elasticity
Increased Uprates of Existing Units
Double Reference Case Capacity and
Generation
High Gas Production Base Value Increased by 5%
Low Gas Price Slower Economic Growth
Base Value Increased by 5%
Increased Imports Increased Efficiency
Increasing Efficiency Yields Lower Income
Elasticity
Greater Flexibility Increased Uprates of Existing Units
Double Reference Case Capacity and
GenerationAveraging $16/bbl
Low LNG Imports Decreased Imports
Low Gas Production Base Value Decreased by 5%
High Economic Growth / High Oil Price
Faster Economic Growth
Increasing Efficiency Yields Lower Income
Elasticity
Averaging $24/bbl
High Gas Price Faster Economic Growth
Base Value Decreased by 5% Decreased Imports
Increasing Efficiency Yields Lower Income
Elasticity
Averaging $24/bbl
Results from the alternate scenarios fall into three groups. Changes that affect gas demands shift the results along the supply curve labeled S1 in Figure A-1, while changes that affect gas supply move results along the demand curve labeled D1. The High Gas Price scenario, which combines changes that increase demand with changes that decrease supply, shifts the results to a higher demand curve labeled D2.
National Commission on Energy Policy Increasing U.S. Natural Gas Supplies
iv
Figure A-1: Comparison of Price and Demand Impacts Relative the Reference Scenario
U.S. & Canada 2015-2025
-2.50
-2.00
-1.50
-1.00
-0.50
0.00
0.50
1.00
1.50
2.00
-4,000 -3,500 -3,000 -2,500 -2,000 -1,500 -1,000 -500 0 500 1,000 1,500
U.S. & Canadian Supply/Demand (Difference in BCF / Year)
Hen
ry H
ub
(Dif
fere
nce
in $
/MM
Btu
)
Reference Case
Low Economic
Low Gas Price
High Gas Price
Low LNG
Low Production
No Alaska
Inc. Efficiency
High LNG
High Production
High Economic
D1
D2
S1
S1
D1
D2
National Commission on Energy Policy Increasing U.S. Natural Gas Supplies
v
Figure A-2: Henry Hub Gas Prices for Scenarios (2003$ per million Btu)
2002 2005 2010 2015 2020 20252015-2025
Average
Differencefrom
ReferenceCase
Reference 3.44 5.41 4.45 3.56 4.50 4.64 4.52 NANo Alaska 3.44 5.41 4.45 5.65 4.93 5.31 5.22 0.70Low Economic Growth 3.44 4.92 3.95 2.97 3.67 3.11 3.48 -1.04High LNG Imports 3.44 5.41 4.23 3.15 4.23 4.30 4.19 -0.33Increased Efficiency/Switching 3.44 5.23 3.91 2.75 3.39 2.70 3.26 -1.26High Gas Production 3.44 5.31 4.27 3.32 4.03 4.18 4.14 -0.38Low Gas Price 3.44 4.69 3.45 2.28 2.63 2.22 2.60 -1.92Low LNG Imports 3.44 5.41 5.41 4.00 5.01 5.07 4.94 0.42Low Gas Production 3.44 5.50 4.66 3.82 4.92 5.23 4.91 0.39High Economic Growth 3.44 6.14 5.07 3.88 5.36 5.37 5.15 0.63High Gas Price 3.44 6.22 6.31 4.81 6.19 6.67 6.12 1.60
0.00
1.00
2.00
3.00
4.00
5.00
6.00
7.00
8.00
2000 2001 200220032004 2005 2006 2007 2008 2009 201020112012 20132014 2015 2016 2017 201820192020 2021 2022 2023 2024 2025
2003$/MMBtu
Reference Case No Alaska Low Economic Growth High LNG Imports
Increased Efficiency/Switching High Gas Production Low Gas Price Low LNG ImportsLow Gas Production High Economic Growth High Gas Price
National Commission on Energy Policy Increasing U.S. Natural Gas Supplies
vi
Figure A-3: U.S. and Canada Gas Demand for Scenarios (Billion Cubic Feet per Year)
2002 2005 2010 2015 2020 20252015-2025
Average
Difference from
Reference Case
Reference 25,868 26,016 29,243 32,937 34,759 35,151 34,247 NANo Alaska 25,868 26,016 29,243 31,491 33,940 34,094 33,239 -1,008Low Economic Growth 25,868 25,944 28,387 31,686 32,689 33,179 32,418 -1,829High LNG Imports 25,868 26,016 29,398 33,394 34,996 35,672 34,596 349Increased Efficiency/Switching 25,868 26,038 29,032 31,967 33,155 33,252 32,707 -1,540High Gas Production 25,868 26,095 29,373 33,263 35,227 35,950 34,742 495Low Gas Price 25,868 26,032 28,374 30,712 31,421 30,902 30,949 -3,298Low LNG Imports 25,868 26,016 28,536 32,291 33,726 34,134 33,324 -923Low Gas Production 25,868 25,947 29,101 32,595 34,182 34,334 33,670 -577High Economic Growth 25,868 26,044 29,520 33,366 35,535 36,413 35,076 829High Gas Price 25,868 25,967 28,534 32,196 33,793 34,245 33,414 -834
24,000
26,000
28,000
30,000
32,000
34,000
36,000
38,000
2000
2001
2002
2003
2004
2005
2006
2007
2008
2009
2010
2011
2012
2013
2014
2015
2016
2017
2018
2019
2020
2021
2022
2023
2024
2025
An
nu
al G
as D
eman
d (
Bcf
)
Reference Case No Alaska Low Economic Growth High LNG Imports
Increased Efficiency/Switching High Gas Production Low Gas Price Low LNG Imports
Low Gas Production High Economic Growth High Gas Price
Low Economic Growth/Low Oil Price
This scenario reduces the annual GDP growth rate by 0.5 percentage points, from 2.8 percent to 2.3 percent. Growth rates for industrial production and Canadian economic activity have been reduced proportionately. The forecast value for the refiner’s average cost of crude (RACC) was reduced by $4.00 to average $16.00 per barrel over the forecast period in response to the lower economic growth. These changes decrease demand by over 1,800 Bcf per year versus the Reference scenario. Most of the change occurs in the power sector, which uses 1,300 Bcf less gas per year than in the Reference scenario. Industrial gas demand is also down versus the Reference scenario, but only slightly. The lower gas prices in the scenario tend to yield less demand destruction in the industrial sector.
National Commission on Energy Policy Increasing U.S. Natural Gas Supplies
vii
High LNG Imports
The High LNG Imports scenario adds 2.5 Bcfd of LNG imports to the Reference scenario, mostly on the Gulf Coast. The increase in LNG imports decreases gas prices by an average of $0.40 from 2015 to 2025, versus the Reference scenario. Conversely, demand increases by 400 Bcf per year over the period in response to the lower gas prices. The lower gas prices tend to dampen development of U.S. and Canadian gas supplies slightly, reducing production by about 400 Bcf, or by approximately half of the increase in LNG imports. Most of the increase in gas demand in this scenario versus the Reference scenario occurs in the price-sensitive industrial and power sectors. Increased Efficiency and Increased Fuel Switching
This scenario assumes a number of changes to represent a lower gas demand growth environment due to increasing efficiency in energy use (both gas and electricity) and greater flexibility in fuel choices in the industrial and power sectors. An increased penetration rate for new equipment and appliances combines with conservation measures to reduce the growth rates of gas and electricity sales in the residential and commercial sectors. In power generation, coal-based capacity additions are increased by 35 gigawatts, and gas-based combined cycle additions are reduced by the same amount, based on an assumption that siting coal capacity is more favorable than in the current environment. Nuclear capacity is increased by 10 gigawatts, assuming an aggressive program to upgrade existing units. Renewable capacity and generation penetrate the market at double the rate assumed in the Reference scenario, assuming more aggressive state implementation plans for non-fossil generation. Fuel switching capacity of the fleet of combined cycle and combustion turbines increases by 12 percent, assuming relaxed permitting of oil burning capability. In the industrial sector, fuel switchability in industrial boilers is increased to ¼ of the boiler stock (versus only 5 percent in the Reference scenario). Last, energy intensity has been reduced, assuming a greater penetration of more efficient manufacturing capacity. As a result of these changes, demand in the power sector is down by nearly 2,000 Bcf per year versus the Reference scenario. Despite the increased efficiency assumed in the industrial sector, the lower gas prices lead to a net increase in industrial gas demand over the Reference scenario. The residential and commercial sectors reduce their demand only slightly versus the Reference scenario, as a slight rebound in demand due to lower gas prices offsets some of the reductions due to increased efficiency. Overall, gas demand in this scenario is about 1,500 Bcf per year less than demand in the Reference scenario, and gas prices are lower by about $1.25 per million Btu. High Gas Production
This scenario increases base values for productive capacity of gas wells in the Lower-48 and Canada (excluding frontier areas) by 5 percent. The increase in productive capacity reduces gas prices by $0.40 per million Btu, versus the Reference scenario. The lower gas prices have a negative impact on gas production, so the 5 percent increase in productive capacity yields only a 2.5 percent increase in forecast gas production. Gas demand increases by an average of 500 Bcf per year, versus the Reference scenario.
National Commission on Energy Policy Increasing U.S. Natural Gas Supplies
viii
Low Gas Price
The Low Gas Price scenario combines the features of the Low Economic Growth, High LNG Imports, Increased Efficiency and Increased Fuel Switching, and High Gas Production scenarios. The lower economic growth rate combined with increased efficiency and increased fuel switching has a significant impact on power sector gas use. Electricity sales, which are a function of economic growth and the efficiency assumptions, are more than 12 percent lower than in the Reference scenario. The lower demand for electricity combined with increased availability of nuclear and renewable generation lead to a 3,300 Bcf per year decrease in the forecast gas demand for power generation, roughly equal to the total decrease in gas use versus the Reference scenario. The low gas prices, which are nearly $2 per million Btu below Reference scenario gas prices, push commercial and industrial gas demand slightly higher than levels observed in the Reference scenario. Low LNG Imports
This scenario removes 4 Bcfd of LNG imports by 2025 from the reference scenario, all on the east and west coasts, assuming an unfavorable environment for siting new LNG import facilities. This change increases gas prices by an average of $0.40 per million Btu and reduces gas demand by over 900 Bcf per year versus the Reference scenario. Low Gas Production
This scenario decreases the base values for productive capacity of gas wells in the Lower-48 and Canada (excluding frontier areas) by 5 percent. The decrease in productive capacity increases gas prices by $0.40 per million Btu versus the Reference scenario. However, since production tends to increase as gas prices move higher, the 5 percent decrease in productive capacity yields only about a 2.6 percent decrease in forecast gas production. Figure A-4 contrasts the gas production results in this scenario with the gas production results in the Reference and High Gas Production scenarios. In response to the lower gas production and higher gas prices, gas demand decreases by an average of 500 Bcf per year versus the Reference scenario, primarily in the industrial and power sectors.

National Commission on Energy Policy Increasing U.S. Natural Gas Supplies
ix
Figure A-4: U.S. and Canadian Gas Production for Different Scenarios
25,000
26,000
27,000
28,000
29,000
30,000
31,000
2000
2001
2002
2003
2004
2005
2006
2007
2008
2009
2010
2011
2012
2013
2014
2015
2016
2017
2018
2019
2020
2021
2022
2023
2024
2025
An
nu
al G
as P
rod
uct
ion
(Bcf
)
Reference High Gas Production Low Gas Production
High Economic Growth/High Oil Price
This scenario increases the annual GDP growth rate by 0.5 percentage points, from 2.8 percent to 3.3 percent. Growth rates for industrial production and Canadian economic activity have been increased proportionately. The forecast value for the refiner’s average cost of crude (RACC) has been increased by $4.00 to average $24.00 per barrel over the forecast period in response to the higher economic growth. In addition, the efficiency of electricity consumption has been increased to reduce the impact of higher GDP on electricity sales growth; the increase in 2025 electricity sales versus the Reference scenario has been limited to 200 million kWh. Power generation capacity has been increased to meet the additional electricity demand. The increased economic growth and oil prices increase gas demand by over 800 Bcf per year, versus the Reference scenario. Some of the potential increase in gas demand is offset by greater efficiencies in the power sector, which tend to reduce some of the increase in electricity sales resulting from higher economic growth. Still, the majority of the increase in gas demand is concentrated in the power sector, where gas use exceeds Reference scenario gas use by over 400 Bcf. Gas prices are $0.60 per million Btu higher than in the Reference scenario, which tends to motivate gas to oil switching, offsetting some of the economy-motivated increases in gas demand in this scenario.
National Commission on Energy Policy Increasing U.S. Natural Gas Supplies
x
High Gas Price
The High Gas Price scenario combines the increased demand and decreased supply features of the Low LNG Imports, Low Gas Production, and High Economic Growth scenarios. The combined decrease in supply pushes gas prices up by $1.60 per million Btu while gas demand drops by over 800 Bcf per year versus the Reference scenario. Versus the Reference scenario, reduced gas use is concentrated in the industrial and power sectors, where high gas prices motivate switching to oil. As a result, oil consumption in the power sector increases by nearly 900 trillion Btus by 2025, versus the Reference scenario. There is also a significant increase in coal consumption as generation shifts away from gas at higher gas prices. EEA’s Gas Market Data and Forecasting System EEA’s Gas Market Data and Forecasting System (GMDFS), a nationally recognized modeling and market analysis system for the North American gas market was used to obtain the scenario results presented in this report. EEA’s GMDFS was developed in the mid-1990s to provide forecasts of the North American natural gas market under different assumptions. In its infancy, the model was used to simulate changes in the gas market that occur when major new sources of gas supply are delivered into the marketplace. For example, much of the initial work with the model in 1996-97 focused on measuring the impact of the recently completed Alliance pipeline. The questions answered in the initial studies include:
• What is the price impact of gas deliveries on Alliance at Chicago? • What is the price impact of increased takeaway pipeline capacity in Alberta? • Does the gas market support Alliance? If not, when will demand support Alliance? • Will supply be adequate to fill Alliance? If not, when will supply be adequate? • What is the marginal value of gas transmission on Alliance? • What is the impact of Alliance on other transmission and storage assets? • How does Alliance affect gas supply (both Canadian and U.S. supply)? • What pipe is required downstream of Alliance to take away “excess” gas? Subsequently, EEA’s model has been used to complete strategic planning studies for many private sector companies. The different studies include:
• Analyses of different pipeline expansions • Measuring the impact of power generation growth, and carbon reduction of the gas market • Assessing the impact of low and high gas supply • Assessing the impact of different regulatory environments In addition to its use for strategic planning studies, the EEA model has been widely used by a number of institutional clients, including INGAA, who relied on the model for the 30 Tcf market analysis completed in 1998. INGAA is currently relying on the model for an update to the 30 Tcf market analysis. GRI has relied on EEA mode for the GRI Baseline Projection. The model was the primary tool used to complete the widely referenced study of the North American Gas
National Commission on Energy Policy Increasing U.S. Natural Gas Supplies
xi
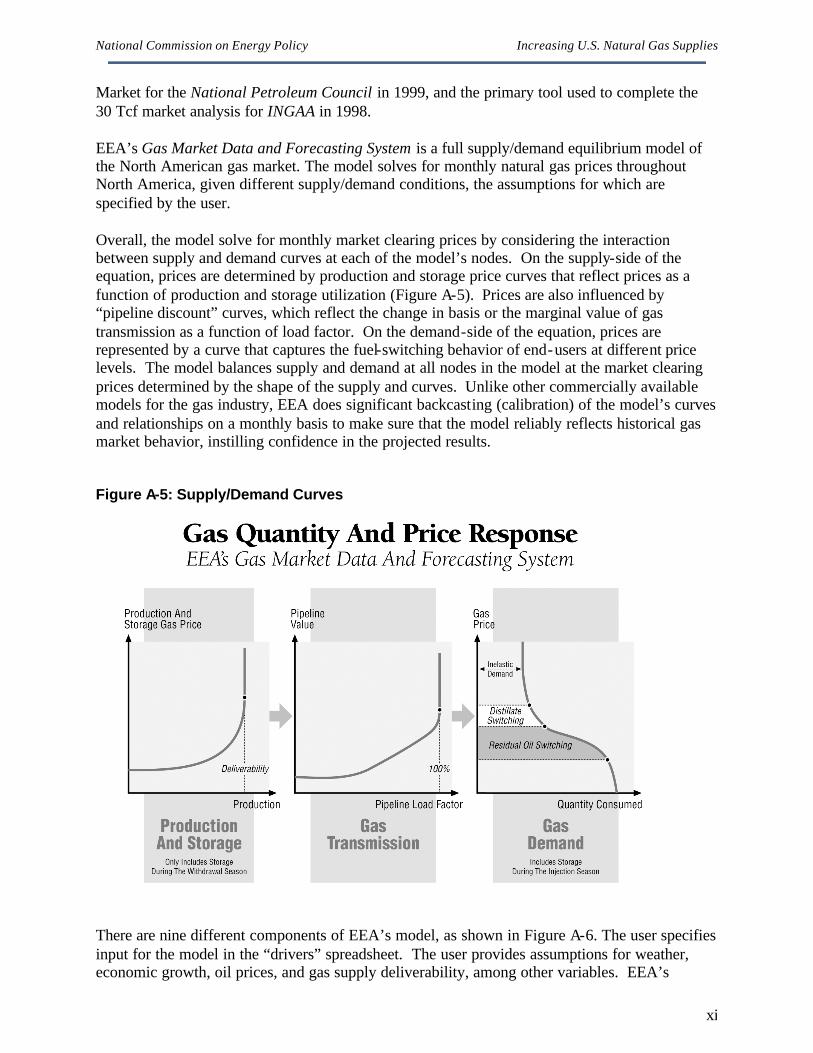
Market for the National Petroleum Council in 1999, and the primary tool used to complete the 30 Tcf market analysis for INGAA in 1998. EEA’s Gas Market Data and Forecasting System is a full supply/demand equilibrium model of the North American gas market. The model solves for monthly natural gas prices throughout North America, given different supply/demand conditions, the assumptions for which are specified by the user. Overall, the model solve for monthly market clearing prices by considering the interaction between supply and demand curves at each of the model’s nodes. On the supply-side of the equation, prices are determined by production and storage price curves that reflect prices as a function of production and storage utilization (Figure A-5). Prices are also influenced by “pipeline discount” curves, which reflect the change in basis or the marginal value of gas transmission as a function of load factor. On the demand-side of the equation, prices are represented by a curve that captures the fuel-switching behavior of end-users at different price levels. The model balances supply and demand at all nodes in the model at the market clearing prices determined by the shape of the supply and curves. Unlike other commercially available models for the gas industry, EEA does significant backcasting (calibration) of the model’s curves and relationships on a monthly basis to make sure that the model reliably reflects historical gas market behavior, instilling confidence in the projected results. Figure A-5: Supply/Demand Curves
There are nine different components of EEA’s model, as shown in Figure A-6. The user specifies input for the model in the “drivers” spreadsheet. The user provides assumptions for weather, economic growth, oil prices, and gas supply deliverability, among other variables. EEA’s
National Commission on Energy Policy Increasing U.S. Natural Gas Supplies
xii
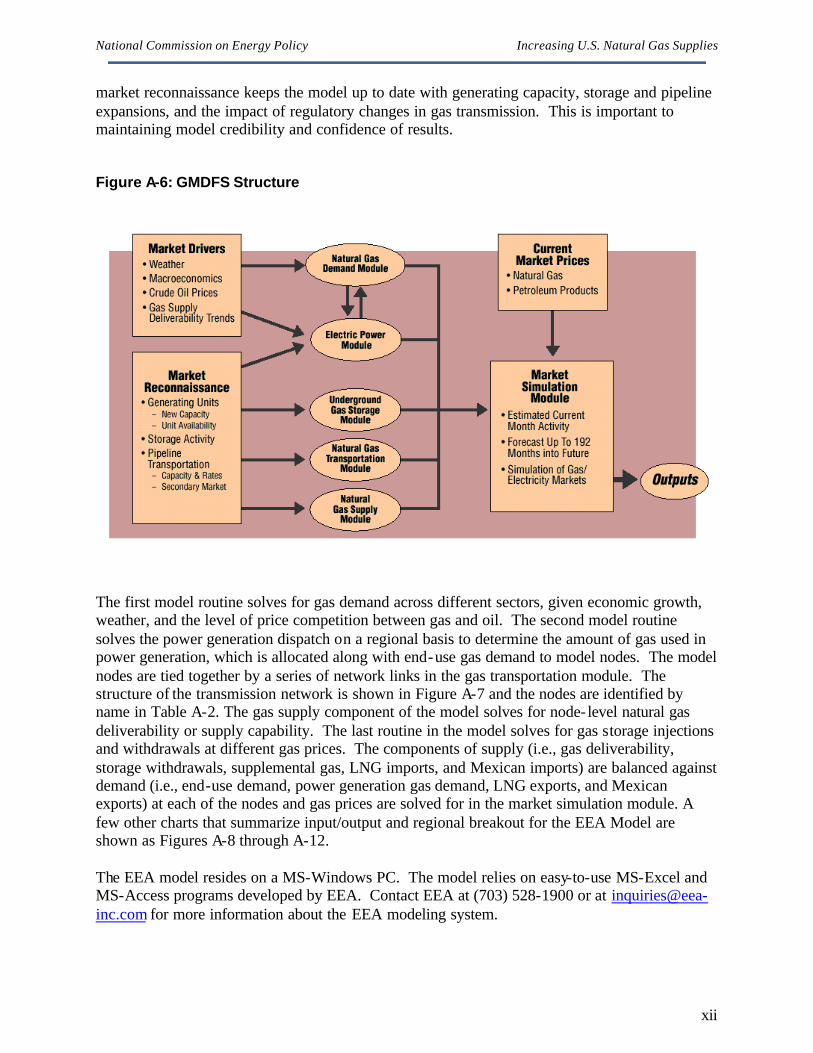
market reconnaissance keeps the model up to date with generating capacity, storage and pipeline expansions, and the impact of regulatory changes in gas transmission. This is important to maintaining model credibility and confidence of results. Figure A-6: GMDFS Structure
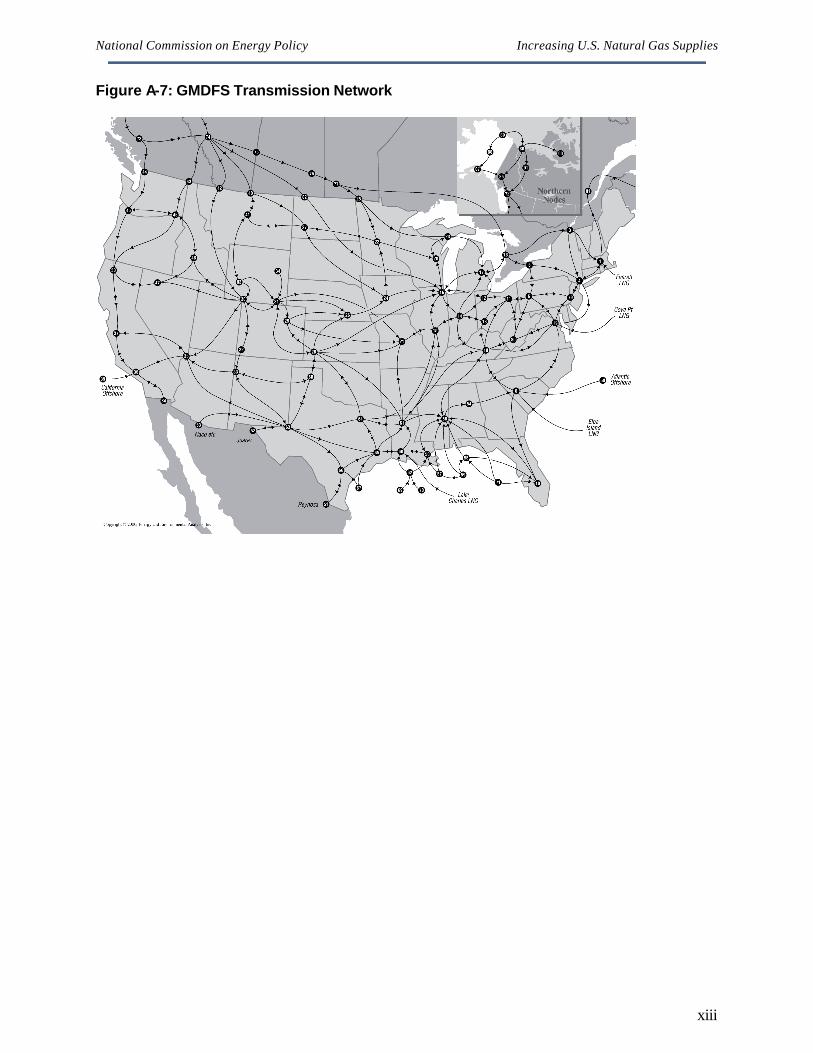
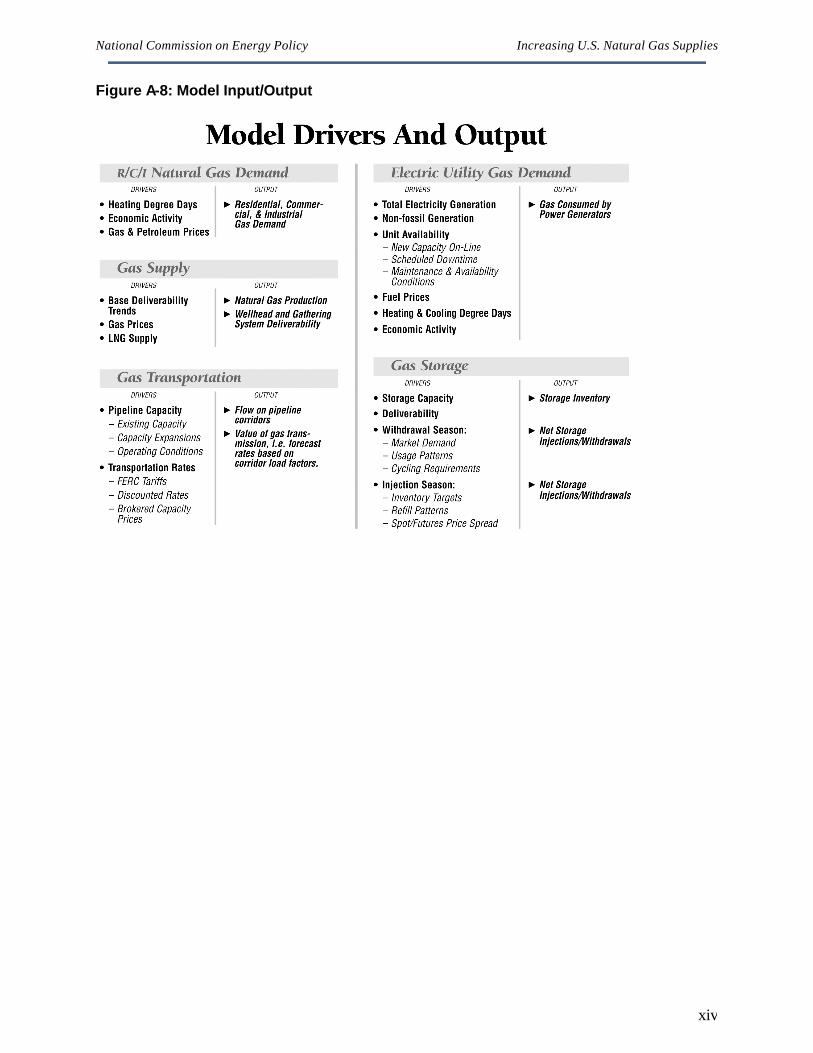
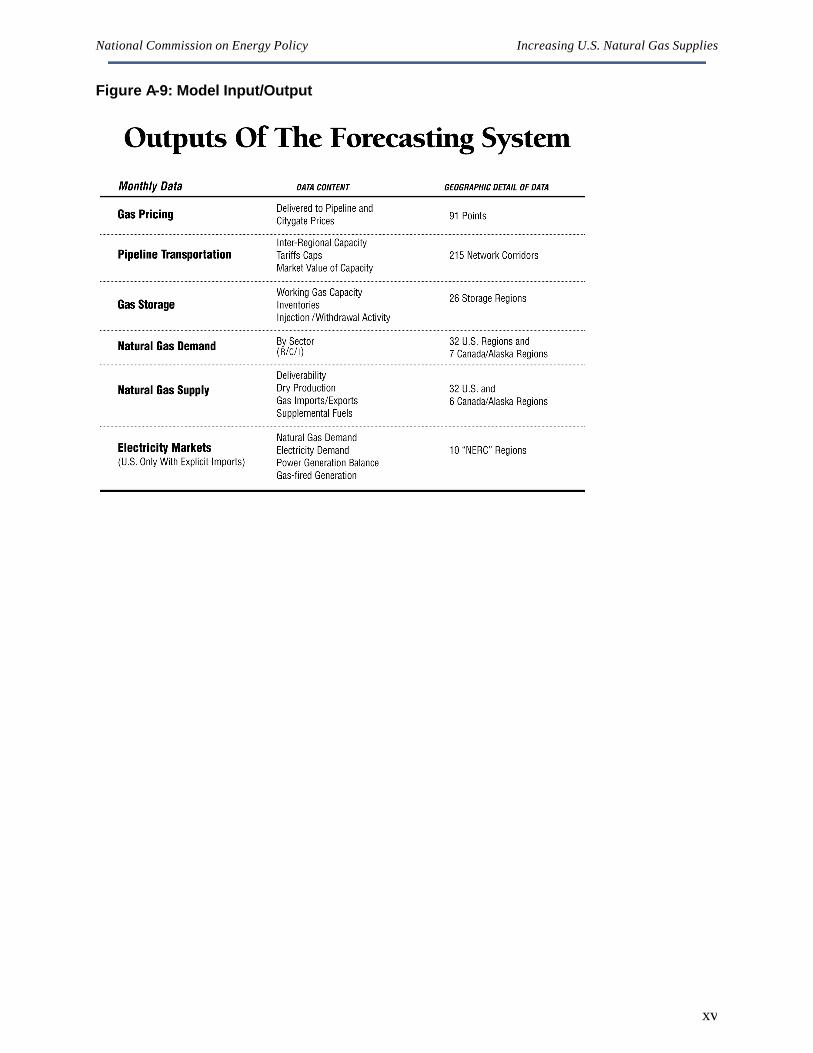
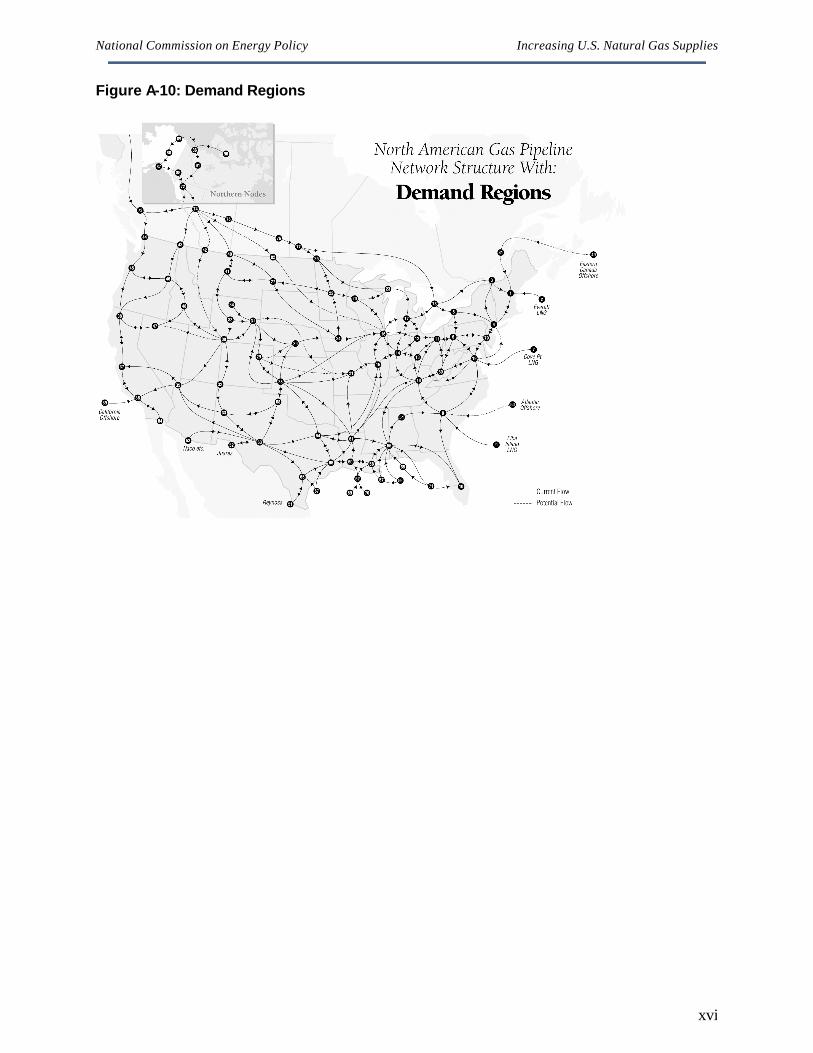
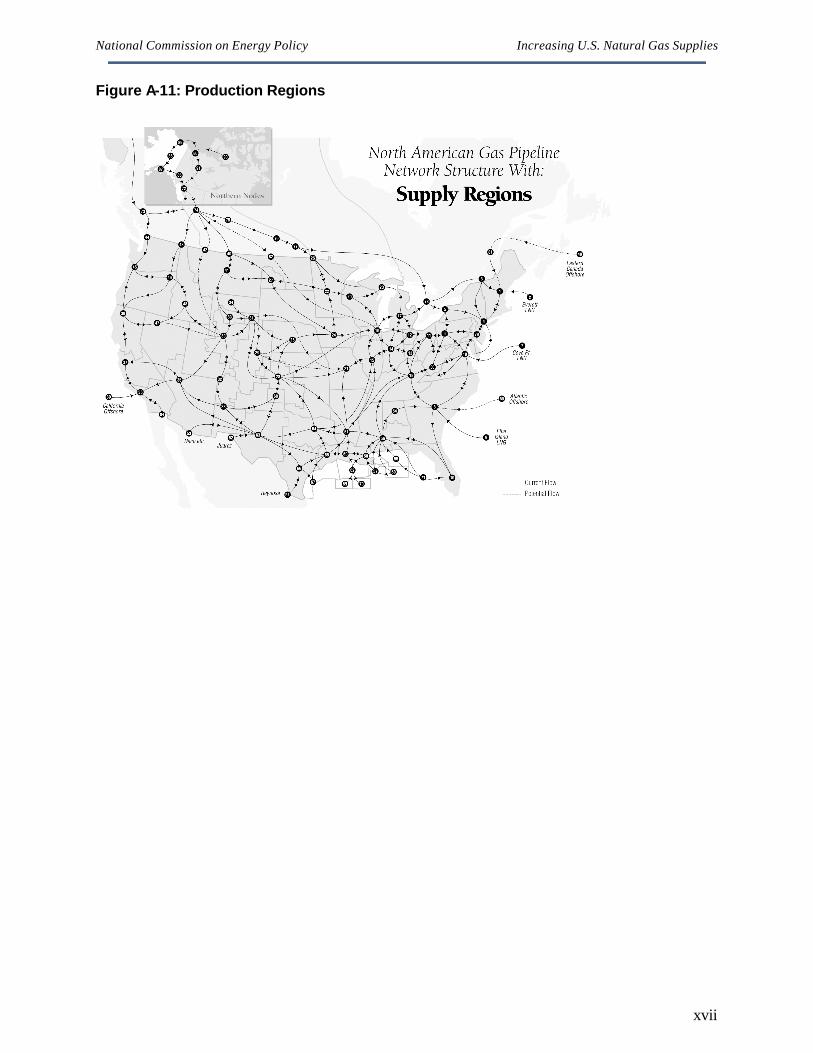
The first model routine solves for gas demand across different sectors, given economic growth, weather, and the level of price competition between gas and oil. The second model routine solves the power generation dispatch on a regional basis to determine the amount of gas used in power generation, which is allocated along with end-use gas demand to model nodes. The model nodes are tied together by a series of network links in the gas transportation module. The structure of the transmission network is shown in Figure A-7 and the nodes are identified by name in Table A-2. The gas supply component of the model solves for node- level natural gas deliverability or supply capability. The last routine in the model solves for gas storage injections and withdrawals at different gas prices. The components of supply (i.e., gas deliverability, storage withdrawals, supplemental gas, LNG imports, and Mexican imports) are balanced against demand (i.e., end-use demand, power generation gas demand, LNG exports, and Mexican exports) at each of the nodes and gas prices are solved for in the market simulation module. A few other charts that summarize input/output and regional breakout for the EEA Model are shown as Figures A-8 through A-12. The EEA model resides on a MS-Windows PC. The model relies on easy-to-use MS-Excel and MS-Access programs developed by EEA. Contact EEA at (703) 528-1900 or at [email protected] for more information about the EEA modeling system.
National Commission on Energy Policy Increasing U.S. Natural Gas Supplies
xiii
Figure A-7: GMDFS Transmission Network
National Commission on Energy Policy Increasing U.S. Natural Gas Supplies
xiv
Figure A-8: Model Input/Output
National Commission on Energy Policy Increasing U.S. Natural Gas Supplies
xv
Figure A-9: Model Input/Output
National Commission on Energy Policy Increasing U.S. Natural Gas Supplies
xvi
Figure A-10: Demand Regions
National Commission on Energy Policy Increasing U.S. Natural Gas Supplies
xvii
Figure A-11: Production Regions
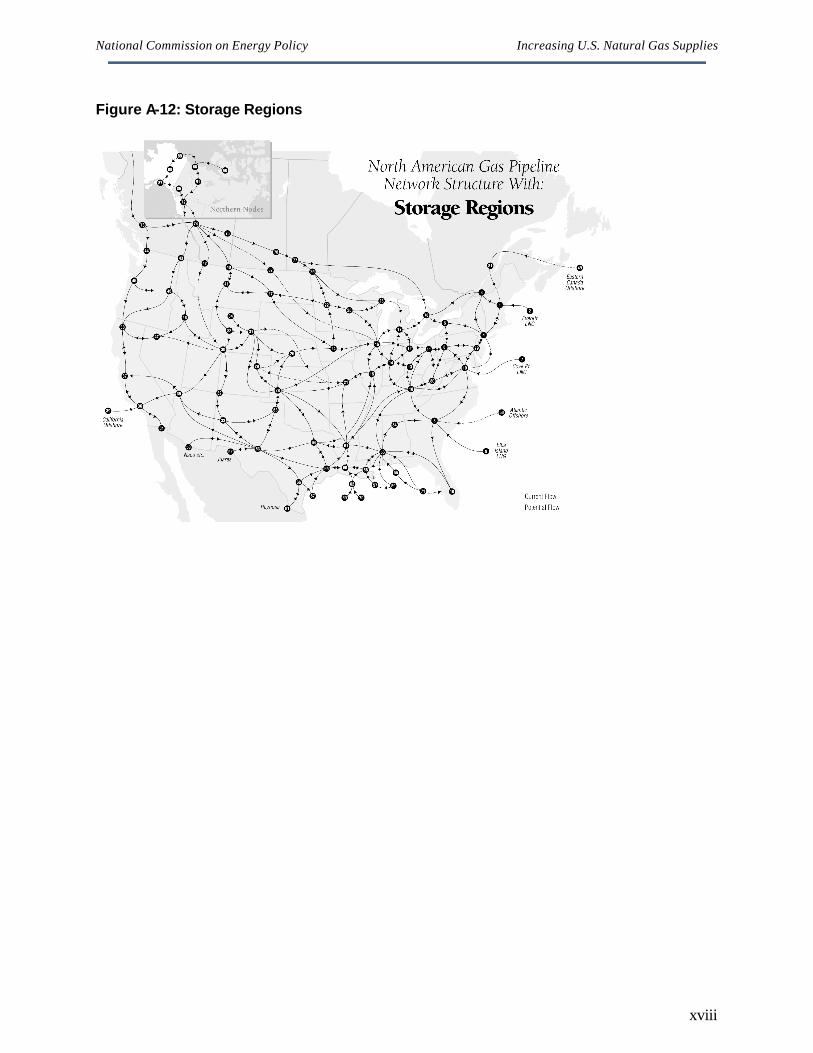
National Commission on Energy Policy Increasing U.S. Natural Gas Supplies
xviii
Figure A-12: Storage Regions
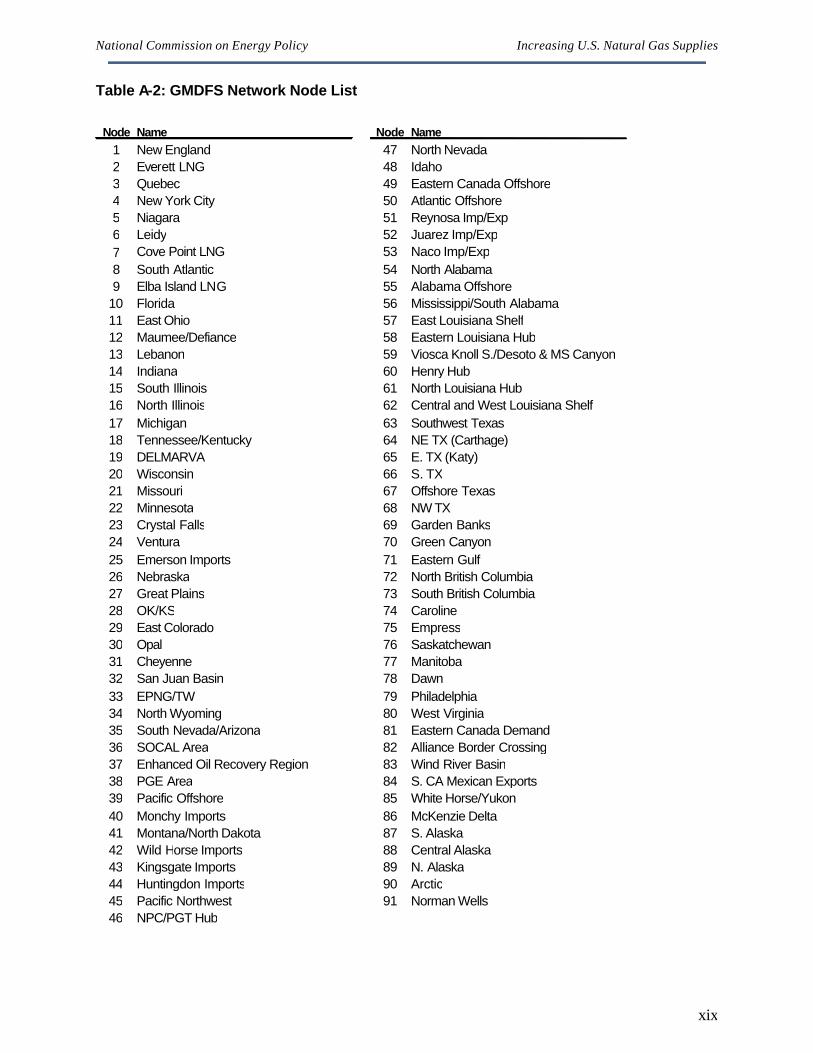
National Commission on Energy Policy Increasing U.S. Natural Gas Supplies
xix
Table A-2: GMDFS Network Node List Node Name Node Name
1 New England 47 North Nevada 2 Everett LNG 48 Idaho 3 Quebec 49 Eastern Canada Offshore 4 New York City 50 Atlantic Offshore 5 Niagara 51 Reynosa Imp/Exp 6 Leidy 52 Juarez Imp/Exp 7 Cove Point LNG 53 Naco Imp/Exp 8 South Atlantic 54 North Alabama 9 Elba Island LNG 55 Alabama Offshore
10 Florida 56 Mississippi/South Alabama 11 East Ohio 57 East Louisiana Shelf 12 Maumee/Defiance 58 Eastern Louisiana Hub 13 Lebanon 59 Viosca Knoll S./Desoto & MS Canyon 14 Indiana 60 Henry Hub 15 South Illinois 61 North Louisiana Hub 16 North Illinois 62 Central and West Louisiana Shelf 17 Michigan 63 Southwest Texas 18 Tennessee/Kentucky 64 NE TX (Carthage) 19 DELMARVA 65 E. TX (Katy) 20 Wisconsin 66 S. TX 21 Missouri 67 Offshore Texas 22 Minnesota 68 NW TX 23 Crystal Falls 69 Garden Banks 24 Ventura 70 Green Canyon 25 Emerson Imports 71 Eastern Gulf 26 Nebraska 72 North British Columbia 27 Great Plains 73 South British Columbia 28 OK/KS 74 Caroline 29 East Colorado 75 Empress 30 Opal 76 Saskatchewan 31 Cheyenne 77 Manitoba 32 San Juan Basin 78 Dawn 33 EPNG/TW 79 Philadelphia 34 North Wyoming 80 West Virginia 35 South Nevada/Arizona 81 Eastern Canada Demand 36 SOCAL Area 82 Alliance Border Crossing 37 Enhanced Oil Recovery Region 83 Wind River Basin 38 PGE Area 84 S. CA Mexican Exports 39 Pacific Offshore 85 White Horse/Yukon 40 Monchy Imports 86 McKenzie Delta 41 Montana/North Dakota 87 S. Alaska 42 Wild Horse Imports 88 Central Alaska 43 Kingsgate Imports 89 N. Alaska 44 Huntingdon Imports 90 Arctic 45 Pacific Northwest 91 Norman Wells 46 NPC/PGT Hub