a user-centered approach to design a mobile application
TRANSCRIPT

HAL Id: hal-03152044https://hal.archives-ouvertes.fr/hal-03152044
Submitted on 8 Apr 2021
HAL is a multi-disciplinary open accessarchive for the deposit and dissemination of sci-entific research documents, whether they are pub-lished or not. The documents may come fromteaching and research institutions in France orabroad, or from public or private research centers.
L’archive ouverte pluridisciplinaire HAL, estdestinée au dépôt et à la diffusion de documentsscientifiques de niveau recherche, publiés ou non,émanant des établissements d’enseignement et derecherche français ou étrangers, des laboratoirespublics ou privés.
A User-Centered Approach to Design a MobileApplication for Chronic Pain Management
Yingdong Liu, Benoît Encelle, Karim Sehaba
To cite this version:Yingdong Liu, Benoît Encelle, Karim Sehaba. A User-Centered Approach to Design a Mobile Appli-cation for Chronic Pain Management. Modelling, measurement and control C, AMSE, 2020, 81 (1-4),pp.24-29. �10.18280/mmc_c.811-405�. �hal-03152044�
A User-Centered Approach to Design a Mobile Application for Chronic Pain Management
Yingdong Liu1, Benoît Encelle2, Karim Sehaba3
1 University of Strasbourg, LISEC, UR 2310, Strasbourg, France 2 University of Lyon, University Lyon 1, CNRS, LIRIS, UMR5205, Lyon, France 3 University of Lyon, University Lyon 2, CNRS, LIRIS, UMR5205, Lyon, France
Corresponding Author Email: [email protected]; [email protected]; [email protected]
https://doi.org/10.18280/mmc_c.811-405 ABSTRACT
Received: 10 August 2020
Accepted: 22 October 2020
This paper presents a user-centered approach for the design/re-design of a mobile
application for chronic pain management, with a focus on chronic low back pain,
sometimes referred to as "invisible disability". Within the framework of a
multidisciplinary project involving physicians, patients and computer scientists, the
work presented here describes firstly an identification and representation process of
the needs/expectations of the users of such an application (patients/physicians), based
on a data-driven persona development method and, secondly, an evaluation process of
the user experience (UX) of the current version of the application, using among others
usability tests. The aim of the approach is to establish (re-)design guidelines in order
to improve this kind of application.
Keywords:
chronic pain/low back pain management, user-
centered design, CHI/UX assessment, mobile
application
1. INTRODUCTION
The work presented in this article was carried out within the
framework of the MIA Healthcare project involving the SATT
Pulsalys (Pulsalys, SATT (Society for Acceleration of
Technology Transfert); Lyon Saint-Etienne), the pain center
of the Saint Jean de Dieu hospital in Lyon, the LIRIS (LIRIS,
Laboratory of informatics in image and systems of
d'information, UMR CNRS 5205, university of Lyon)
computer science laboratory and the company santéNet
specialized in the development of applications dedicated to
pain management. The objective of this project is to develop a
mobile application dedicated to the management of chronic
pain. This application will assist 1/the doctor in understanding
the causes, effects and consequences of pain specific to each
patient and 2/the patient in managing his pain through
personalized advice. In this context, this article presents a user-
centered approach for the design/re-design of such apps,
involving both physicians specialized in pain and patients with
chronic pain. This approach consists of two steps.
The first step consisted in identifying the
needs/expectations, attitudes/behaviors of future users
(physicians and patients) of such a kind of application and, in
order to implement an efficient and cost-effective user-
centered design, to identify typical user profiles. A
quantitative (questionnaire) and qualitative (interviews) study,
followed by a data analysis/clustering process were conducted,
leading to the development of typical user profiles (personas).
The second step of the approach consisted in the evaluation
of the user experience (UX) on the current MIA Healthcare
application. This UX evaluation was conducted using a
questionnaire, a benchmarking of obtained results, and field
experiments (usability tests). The aim was, on the one hand, to
optimize UX by identifying and correcting design issues and,
on the other hand, to establish a taxonomy/classification of
these issues by synthesizing and grouping them.
Our initial focus was on the management of Low Back Pain
(LBP), although the aim of the application is to take into
account all types of chronic pain. This choice was motivated
by the magnitude of this disease, which affects more than 540
million people [1]. In France alone, the prevalence of LBP
(over a lifetime) in the adult population varies according to
studies from 66% to 75% [2]: between two thirds and three
quarters of people will suffer from LBP at least once in their
lifetime. For France, the annual direct medical financial cost is
estimated at more than one billion euros, with indirect costs
estimated to be 5 to 10 times higher according to [3, 4]. Indeed,
LBP is one of the main causes of activity limitation and
absence from work, with heavy economic repercussions on
individuals, their families, industry and governments [5]. LBP,
sometimes described as an "invisible disability", is now the
leading cause of disability worldwide [6].
Section 2 first presents a concise state of the art on existing
applications (similar to the one under consideration) and their
limitations, and then presents the specificities of the MIA
Healthcare project and its objectives. Section 3 details our
contribution: the approach used, and the main results obtained.
We then discuss this approach and results (section 4), and
finally conclude.
2. RELATED WORKS AND SPECIFICITIES OF THE
MIA HEALTHCARE PROJECT, OBJECTIVES
Applications dedicated to pain management are more and
more numerous (Pain Therapy, Pain sense, Mon Coach
Douleur, CatchMyPain, etc.). However, the involvement of
healthcare professionals in the development of this kind of
application is considered insufficient [7, 8] and most of these
applications lack the ability to adapt and customize their
features to end-users.
Modelling, Measurement and Control C Vol. 81, No. 1-4, December, 2020, pp. 24-29
Journal homepage: http://iieta.org/journals/mmc_c
24

As a result, the MIA Healthcare project (see Figure 1)
follows a user-centered design approach, involving physicians
and patients, for the development of a personalized monitoring
application that takes into account the specificities of each
patient (i.e. pain, profile). To this end, the MIA Healthcare
application plans to question patients on a daily basis about the
characteristics/factors related to their chronic pain, such as
pain intensity, feeling of fatigue, quality of sleep,
psychological state, medication compliance, etc. The
application will also be used to monitor and advise patients on
the quality of their sleep. The use of such data should make it
possible to 1/ promulgate to a given patient, using a Chatbot,
personalized advice in order to help him/her manage his/her
pain and thus improve his/her quality of life and 2/ produce a
medical pain logbook for health professionals, to better
understand a patient's condition and its evolution, leading to
better diagnoses and treatments.
Within the framework of a user-centered design, our goal in
this project is to provide tools to guide the design/re-design of
such an application. In this way, end-user needs have to be
identified/prioritized. In order to formulate design/re-design
guidelines, we need to a) identify typical profiles and b)
evaluate the user experience on the current MIA Healthcare
application.
Figure 1. Main screen of the MIA Healthcare application
3. DESIGN PROCESS AND MAIN RESULTS
3.1 Needs/expectations identification and personas
development
3.1.1 Objectives and expected results
Our goal is to better understand the future users of a pain
management application, by studying potential correlations
between the different identified profiles of doctors/patients,
their needs/expectations and their interest in such an
application. These profiles will include classic
sociodemographic data, information on behaviors/attitudes
towards new technologies in general and on such type of
application, the type/frequency of pain (for patients), etc. The
objective here is to study the needs/expectations for a chronic
pain management application in general, by not taking into
account the existing MIA Healthcare app (so as not to bias the
study).
In terms of expected results, functional needs will have to
be identified, weighted and ordered, and typical user profiles
will have to be identified. The identification of a limited set of
typical user profiles allows the design process to be undertaken
at a lower cost (in terms of human, temporal and financial
resources): this design is in fact centered on the main
needs/expectations of the identified profiles. Concretely, the
results of such a study should guide the design/re-design of a
chronic pain management application (whatever it is).
3.1.2 Means and implementation
Quantitative (questionnaires) and qualitative (interviews)
studies were conducted on the target population
(patients/physicians).
Functional needs/expectations were then specified and
personas (typical profiles) were developed on the basis of
these studies. The concept of persona was introduced by
Cooper [9]. The benefits of using personas are as follows:
• To share a specific understanding and a unique
representation of each identified user
group/type of users (persona).
• To guide/validate/prioritize suggested solutions
and related IT developments, with regard to
their adequacy for each persona.
• To provide a human "face" in order to create
empathy.
In the following sub-sections, we detail the means used to
conduct these studies and their implementation.
Means: Questionnaires. In order to create the patient and
doctor questionnaires, whose results integrate the persona
development process, we used:
1/ Five types of variables, recommended by Cooper et al.
[10] to identify the goals and behaviors of users according to
a given product (here the product is the targeted application):
• Activities: what the user does, frequency and
volume for, in our case, the management of
chronic pain.
• Attitudes: what the user thinks, his/her
positioning/feeling/opinion on the product
domain (here the e-health and pain
management applications).
• Aptitudes: what education and training the user
has and his ability to learn.
• Motivations: why the user is engaged in the
product domain.
• Skills: user abilities related to the product
domain and technology (ability to use new
technologies, mobile applications).
For example, for the patient questionnaire, the variable
"activities" should make it possible to understand what
patients actually do to manage/treat pain and how often. As
this variable cannot be measured directly, it can be estimated
by asking patients about their sports practice, the type and
frequency of medical consultations, etc. This variable can also
be used to estimate the frequency of pain management.
2/ classic sociodemographic variables, to understand the
overall context of users: gender, age, level of education, field
of activity.
The questionnaires created include about 30 questions for
the patient and about 20 questions for the doctor. Most of these
questions are closed-ended, with some being conditional
(asked depending on previous answers).
25

Means: Interviews. In addition, in order to better understand
the specific context of future users of such application and thus
complete the results from the questionnaire analysis,
interviews of about ten minutes were conducted with
physicians and patients. The questions asked covered topics
similar to those addressed in the questionnaires. These
interviews will allow us to refine our understanding of, for
example, the daily management of chronic pain and
compliance with treatments, attitudes towards this type of
application, functional expectations/needs, and the ability to
use new technologies.
Implementation. For the sample used to conduct these
studies, the questionnaires had a total of 99 respondents: 67
patients and 32 physicians. Interviews were conducted with
three pain physicians, a psychologist and 12 patients.
Needs/expectations identification
A first list of interesting features has been identified
following a state of the art and an analysis of existing similar
applications. This list of features was then evaluated and
completed by pain specialists, including some features
dedicated to the medical profession.
In order to weight and order these features, and in order to
have a relatively short and easy to fill out questionnaire, two
questions were developed: the first asks for the "top 5" of the
most important features in the previously established list
(check boxes), and the second invites the participant to
complete the proposed list (open question on missing essential
features).
Persona development
A criticism is often made on classical methodology of
persona development, indicating that the personas are often
not or too few based on real user data [11]. To avoid this pitfall,
we propose to use a data-driven method of persona
development [12] and to use a clustering method to determine,
from the collected data (answers to questionnaires), the
optimal number of user groups (i.e. number of personas) for
each category of users (patient personas, physician personas)
and the representative/discriminatory variables for the groups
formed. More precisely, a data clustering method aims at
dividing a data set (here the responses of the patient/physician
subjects to their respective questionnaire) into different
homogeneous groups (clusters), in the sense that the data of
each group share common characteristics. Given that the
variables measured by the questionnaire are derived from
standard variables [10] not directly observed, and that we wish
to obtain an optimal number of user groups/classes for each
user category (patient/physician), we used the statistical
method LCA (Latent Class Analysis) [13-15] to perform the
clustering using R software.
3.1.3 Results
Questionnaire analysis. The main results of the analysis of
the patient questionnaire are presented below. 80.6% are
women, 19.4% are men. 85.1% of the participants are between
30 and 60 years old. 53.8% have at least a “baccalauréat” (i.e.
high school diploma). 49.25% of the participants suffer from
multiple pains. 91% own a smartphone and 77% report using
mobile applications several times a day. Finally, 83.6% of the
respondents say they are interested in the application.
The main results following the analysis of the physician
questionnaire are: 53.1% are men, 46.9% are women. 90.6%
of physicians have been managing chronic pain for more than
5 years. 65.7% often use mobile applications. 46.9% of
physicians have already used a smartphone in a professional
setting and 59.4% declare that they would be willing to use a
mobile application in a professional setting. 81.3% said they
would be interested in the application.
Regarding the main functional expectations/needs, the
results on the patient side are as follows (only the first five
features are presented): 1/Proposal of physical
exercises/massages (80.6%), 2/Assessment of morale, stress,
fatigue, sleep (73.1%), 3/Constitution of a medical pain
logbook (68.7%), 4/Community of patients (specific social
network) (59.7%), 5/Information on chronic pain (50.7%).
Physician's side: 1/Assessment of morale, stress, fatigue,
sleep (84.4%), 2 Constitution of a medical pain logbook
(68.8%), 3/Proposal of physical exercises/massages (53.1%),
4/Information given on the effectiveness of a given treatment
(46.9%), 5/Remote patient monitoring, alarm in case of
anxiety and depression risks. It should be noted that only
feature 5/ is dedicated to the medical profession.
These results show that some pain specialists are unwilling
to use a mobile application in a professional setting. It would
therefore be interesting to study why more precisely.
Physicians and patients share many of the same needs. Indeed,
the three features considered most important are found on both
sides, in a different order. Cumulatively, the assessment of
morale, stress, fatigue, sleep comes first, followed by the
constitution of a medical pain logbook and the proposal of
physical exercises/massages. These results underline the
importance of evaluating the patient's state (morale, stress, etc.)
and its follow-up/evolution (medical pain logbook) for these
two types of users. Special attention must therefore be paid to
the development of these features.
Persona development. The LCA [13-15] method used on the
data from the questionnaires together with the BIC (Bayesian
Information Criterion) and AIC (Akaike Information Criterion)
information criteria enabled us to determine the optimal
number of clusters (called classes below) that corresponds to
the personas that have to be created for each categories of users
(patient/physician). An analysis of these classes guides the
description of these personas. Then, interviews (qualitative
data) were used to refine the development of these personas.
Description of the classes obtained
The results obtained led us to consider two classes for the
patient side and only one for the physician side. We detail here
only the two patient classes. The first class represents 72.7%
of the participants and the second 27.3%.
With regard to the values of discriminating variables among
these classes, the first class tends to have more intense and
pervasive pain (intense and extremely intense pain: 55.4%;
omnipresence: 100%) than the second (intense and extremely
intense pain: 0%; omnipresence: 39.77%).
In addition, and not surprisingly, participants in the first
class consult physicians more often than those in the second
(89.73% consult general practitioners more than four times a
year versus 39.77% for the second; 16.5% for the first class
never see specialists versus 54.53% for the second).
Concerning the common values of variables, almost all
participants have been suffering from pain for more than a year
(97.94% for the first class, 100% for the second). 68.7% of the
participants do sport at least once a week (61.66% for the first,
87.31% for the second). The participants are more interested
in sharing information about their chronic pain (95.84% for the
first and 72.78% for the second). As an example, Figure 2
shows the persona card representing the first class.
26

Figure 2. Person for the first class of patients
3.2 Analysis of the current version of the application:
evaluation of the user experience, usability testing
3.2.1 Objectives and expected results
An analysis to assess some user experience factors on the
current version of the MIA Healthcare application was
conducted. The results obtained will be used to identify the
application's strengths/weaknesses and any usability issues
encountered. Overall, results will be used to improve the user
experience, by improving the ergonomics/user interface of the
application.
3.2.2 Means and implementation
Means. In order to assess and situate user satisfaction, the
UEQ questionnaire was used [16]. This questionnaire
evaluates the user experience using six scales:
• Attractiveness: Overall impression of the
product. Do users like or dislike it?
• Perspicuity: Is it easy to get familiar with the
product and to learn how to use it?
• Efficiency: Can users solve their tasks without
unnecessary effort? Does it react fast?
• Dependability: Does the user feel in control of
the interaction? Is it secure and predictable?
• Stimulation: Is it exciting and motivating to use
the product? Is it fun to use?
• Novelty: Is the design of the product creative?
Does it catch the interest of users?
To situate the evaluation of the user experience, a
benchmarking tool containing the results of UEQ
questionnaires for 246 different products was used [17]. This
tool classifies the product evaluated on each scale using 5
categories: excellent (in the 10% best results), good (10% are
better, 75% worse), above average (25% are better, 50%
worse), below average (50% are better, 25% worse), bad (in
the 25% worst results).
To assess usability, usability tests were conducted [18, 19].
For this purpose, typical use case scenarios of the application
have been established, based on the main features previously
identified (see previous section). For instance, a scenario for
the user category "patient", focusing on the feature
"Constitution of a medical pain logbook", is the following:
"You are experiencing severe pain in your lower back and legs.
You assume that this pain is strongly weather-related (wet
weather). Record this information on the application".
Implementation. 6 scenarios for usability testing were
identified. An evaluation protocol was set up, inspired by
conventional usability testing [18, 19], with a fourth step
aimed at evaluating the user experience (via the UEQ
questionnaire). Protocol steps are the following:
1. Collecting of socio-demographic data: age, new
technology familiarity, professional activity, etc.
2. Getting started with the application: a given short
length of time to discover the application. During his/her app
discovery, the subject is invited to think aloud (verbalizing
thoughts as moving through the user interface)
3. Carrying out usability tests (scenarios) with the
"think aloud" method.
4. Filling out the UEQ questionnaire.
5. Debriefing. Questions on the perceived interest of the
proposed application.
Due to a lack of time and some difficulties in accessing both
categories of users, the evaluation was only conducted with
patient-type users (access to pain specialists being more
difficult). 10 people suffering from chronic low back pain and
owning a smartphone took part in the evaluation. The
participants were aged between 29 and 70 years (M=48.8
years).
3.2.3 Results
Analysis of the usability test results revealed 20 usability
issues, which have been classified using the heuristic
evaluation criteria proposed by Nielsen [18]. We give below
these different criteria, along with the number of issues for
each criterion (in brackets) and with an example of an issue
associated with each criterion: issues with visibility of system
status (5) (e.g. the operations remaining to perform a task are
not indicated (e.g. to inform about a pain, the user can easily
forget to inform about its location after indicating its
intensity)); issues with the match between system and the real
world (4) (e.g. the Chatbot's language level may not be adapted
to the user, its behavior may be strange (e.g. not saying 'hello'
at first)), issues with user control and freedom (3) (e.g. actions
cannot be modified or canceled), issues with consistency and
standards (4) (e.g. the text size is too small); error prevention
issues (1) (lack of user instructions to achieve his or her goal);
recognition issues (3) (e.g. the system does not refer to the
user's goal).
Figure 3. Benchmarking of the application
27
Next, re-design proposals and guidelines based on the
preceding issues were suggested. These results led to user
interface improvements, to minimize user’s cognitive load.
Figure 3 presents the results of the UX evaluation (fourth
step of the protocol).
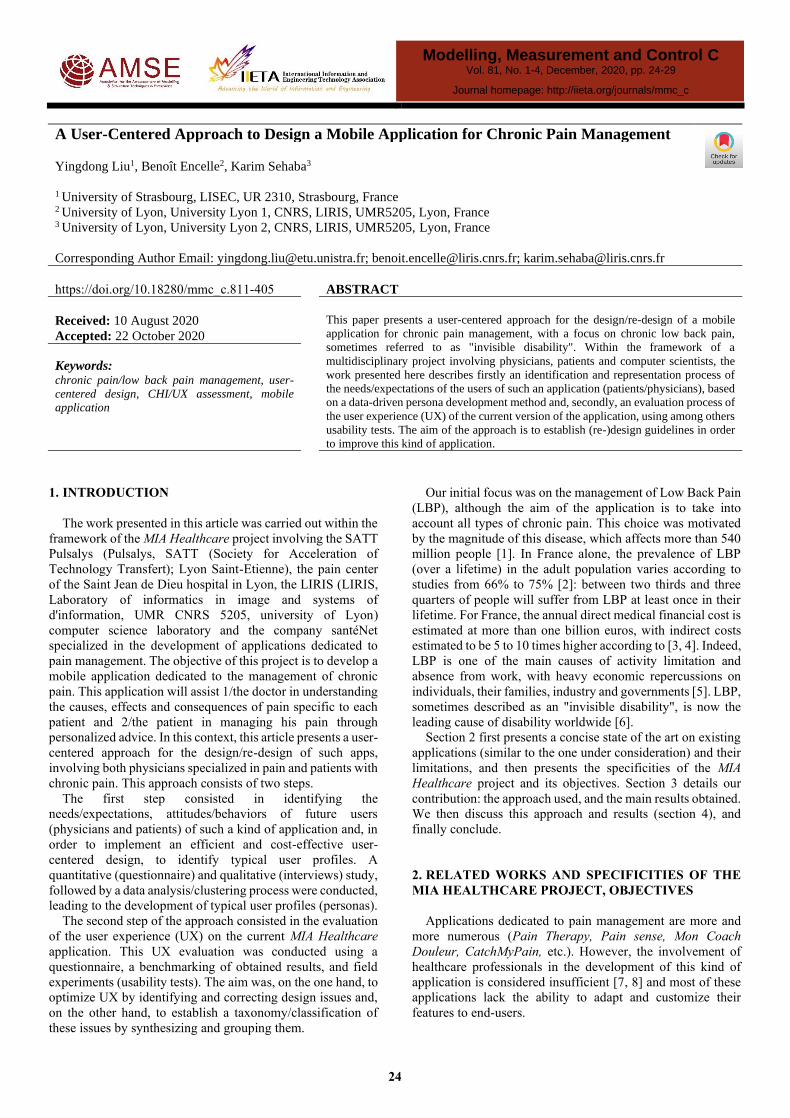
The evaluations of the " Attractiveness", "Dependability"
and "Stimulation" qualities are "excellent", the "Perspicuity",
"Efficiency" and "Novelty" qualities are "good". It appears
that the "Novelty" quality score is the lowest: the application
may suffer from a lack of originality.
4. DISCUSSIONS
The results obtained and presented are drawn from analyses
based on patient/physician samples which may be not
representative of targeted populations. This is mainly due to
the difficulties of accessing the targeted populations (patients
with chronic pain - chronic low back pain, specialist doctors).
As a consequence, these results should not be generalized, but
should be considered in the context of the above studies.
More specifically, although the respondents to the needs
identification questionnaire were relatively numerous and
came from different places (members of chronic pain
associations, chronic pain sufferers who had registered on the
SantéNet website, etc.), interviews (patients/physicians);
usability tests; UEQ questionnaires were conducted with
doctors/patients from the pain center of the Saint Jean de Dieu
hospital. This single source may possibly introduce sampling
bias.
Moreover, more specialized questionnaires could have been
under consideration for the UX evaluation. For instance, the
MARS questionnaire [20] is designed to assess the quality of
healthcare mobile applications. However, we have chosen to
use a fairly general and widely used questionnaire for
evaluating the UX, as the use of a (too) specialized
questionnaire can lead to a lack of reliability. To continue with
the MARS questionnaire, it was clearly designed for the
evaluation of mobile applications related to mental health.
Therefore, the applicability and reliability of MARS in other
health domains remains to be demonstrated [20].
Conclusion and perspectives
This article presents a user-centered approach to the design
of a chronic pain management mobile application for both
chronic pain sufferers and physicians. This approach was
developed as part of a project involving IT researchers,
designers/developers of mobile health applications and
practitioners (pain specialists). The objective of this approach
is to establish design/re-design guidelines for this kind of
application.
A first contribution consists of an identification and
representation process of needs/expectations,
attitudes/behaviors of typical users of a chronic pain
management application. In order not to introduce bias, this
process voluntary doesn’t take into account the MIA
Healthcare mobile application. We first detail the
identification phase and then describe the phase leading to the
development of typical user profiles (personas).
The second contribution consists of an evaluation and
benchmarking process of the user experience (UX) on the
current version of the application. This process is detailed (UX
questionnaire, usability test development, evaluation protocol,
result analysis). If the results presented are specific to the MIA
Healthcare application, the suggested approach for UX
evaluation: questionnaire/benchmarking tool,
construction/analysis of usability tests, evaluation protocol
used, is generic.
The main results are as follows:
• The main needs/expectations of the two categories of
targeted users (patients/physicians) regarding a
chronic pain management application are similar
(assessment of morale, stress, fatigue, sleep;
constitution of a medical pain logbook; proposal of
physical exercises/massages).
• The segmentation of users (typical profiles) by
category is as follows: 2 patient classes (differences
are on pain characterization/frequency,
type/frequency of doctors consulted), 1 physician
class.
Future work includes firstly studies on broader samples,
representative ones, in order to consolidate or not the findings.
It would also be interesting to evaluate the UX of the current
application for the health professional’s category.
Secondly, it would be also interesting to study the real uses
of the application, to complement the suggested redesign
approach. This kind of study could be conducted in a "non-
intrusive" way (subject to user’s agreement), by collecting and
analyzing interaction traces. These interaction traces represent
the history of interactions between users and the application
(feature usages, data inputted, etc.) and provide insights on
real users/uses (most used/less used features, trouble
encountered, etc.).
REFERENCES
[1] Hartvigsen, J., Hancock, M.J., Kongsted, A., Louw, Q.,
Ferreira, M.L., Genevay, S. (2018). What low back pain
is and why we need to pay attention. The Lancet,
391(10137): 2356-2367. https://doi.org/10.1016/S0140-
6736(18)30480-X
[2] Quelques chiffres sur la lombalgie et le mal de dos,
Lombalgie. Disponible sur:
http://www.lombalgie.fr/comprendre/quelques-chiffres.
[3] Fassier, J.B. (2011). Prévalence, coûts et enjeux
sociétaux de la lombalgie. Revue du Rhumatisme, 78:
S38-S41. https://doi.org/10.1016/S1169-
8330(11)70007-2
[4] Maladie, A. (2017). Risques professionnels : une
collection pour mieux comprendre, Risques
professionnels : une collection pour mieux comprendre -
rapport 2017 : la lombalgie liée au travail. Disponible sur:
https://assurance-maladie.ameli.fr/qui-sommes-
nous/publications-reference/assurance-maladie-risques-
professionnels/rapports-sante-travail.
[5] Duthey, B.B. (2013). Background paper 6.24 low back
pain. Priority medicines for Europe and the world. Global
Burden of Disease (2010),(March), pp. 1-29.
[6] Vos, T., Allen, C., Arora, M., Barber, R.M., Bhutta, Z.A.,
Brown, A. (2016). Global, regional, and national
incidence, prevalence, and years lived with disability for
310 diseases and injuries, 1990–2015: a systematic
analysis for the Global Burden of Disease Study 2015.
The lancet, 388(10053): 1545-1602.
https://doi.org/10.1016/S0140-6736(16)31678-6
[7] Alexander, J.C., Joshi, G.P. (2016). Smartphone
applications for chronic pain management: a critical
28

appraisal. Journal of Pain Research, 9: 731-734.
https://doi.org/10.2147/JPR.S119966
[8] Rosser, B.A., Eccleston, C. (2011). Smartphone
applications for pain management. Journal of
Telemedicine and Telecare, 17(6): 308-312.
https://doi.org/10.1258/jtt.2011.101102
[9] Cooper, A. (1999). The Inmates Are Running the
Asylum. USA: Macmillan Publishing Co., Inc.
[10] Cooper, A., Reimann, R., Cronin, D., Noessel, C. (2014).
About Face: The Essentials of Interaction Design. John
Wiley & Sons.
[11] Pruitt, J., Grudin, J. (2003). Personas: practice and theory.
In Proceedings of the 2003 conference on Designing for
User Experiences, pp. 1-15.
https://doi.org/10.1145/997078.997089
[12] McGinn, J., Kotamraju, N. (2008). Data-driven persona
development. In Proceedings of the SIGCHI Conference
on Human Factors in Computing Systems, pp. 1521-
1524. https://doi.org/10.1145/1357054.1357292
[13] Collins, L.M., Lanza, S.T. (2009). Latent class and latent
transition analysis: With applications in the social,
behavioral, and health sciences.
[14] Nylund, K.L., Asparouhov, T., Muthén, B.O. (2007).
Deciding on the number of classes in latent class analysis
and growth mixture modeling: A Monte Carlo simulation
study. Structural Equation Modeling: A
Multidisciplinary Journal, 14(4): 535-569.
https://doi.org/10.1080/10705510701575396
[15] Nylund-Gibson, K., Choi, A.Y. (2018). Ten frequently
asked questions about latent class analysis. Translational
Issues in Psychological Science, 4(4): 440-461.
https://doi.org/10.1037/tps0000176
[16] Laugwitz, B., Held, T., Schrepp, M. (2008). Construction
and evaluation of a user experience questionnaire. In
Symposium of the Austrian HCI and Usability
Engineering Group, pp. 63-76.
https://doi.org/10.1007/978-3-540-89350-9_6
[17] Schrepp, M., Hinderks, A., Thomaschewski, J. (2017).
Construction of a benchmark for the user experience
questionnaire (UEQ). IJIMAI, 4(4): 40-44.
https://doi.org/10.9781/ijimai.2017.445
[18] Nielsen, J. (1994). Usability Engineering. Morgan
Kaufmann.
[19] Rogers, Y., Sharp, H., Preece, J. (2011). Interaction
Design: Beyond Human-Computer Interaction. John
Wiley & Sons.
[20] Stoyanov, S.R., Hides, L., Kavanagh, D.J., Zelenko, O.,
Tjondronegoro, D., Mani, M. (2015). Mobile app rating
scale: a new tool for assessing the quality of health
mobile apps. JMIR mHealth and uHealth, 3(1): e27.
https://doi.org/10.2196/mhealth.3422
29