a time for… time for… coca-cola femsa annual report 2014 transfo throughout our long history as...
TRANSCRIPT

A TIME FOR…
COCA-COLA FEMSAANNUAL REPORT 2014

TRANSFO

Throughout our long history as a bottler, our talented,
skilled, and passionate people have expanded our
geographic footprint to 10 countries, performed
successfully—delivering sustainable revenue growth
and profitability—and enabled us to become the largest
franchised Coca-Cola Bottler in the world.
Today, we are engaged in an intensive transformation
designed to enhance our people’s capabilities and create
a nimbler, more agile, and efficient organization that will
successfully face the unique challenges demanded by the
next wave of growth.
TRANSFO RMATION
2
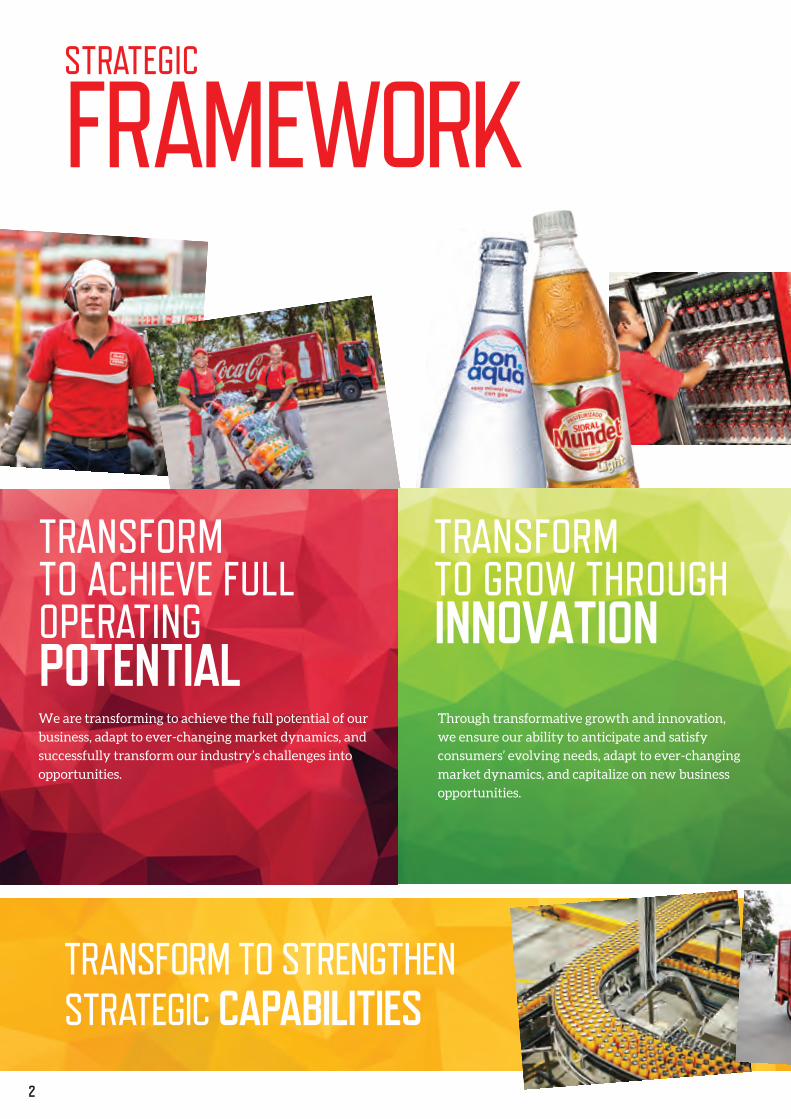
STRATEGIC
FRAMEWORK
TRANSFORM TO ACHIEVE FULL OPERATINGPOTENTIAL
TRANSFORM TO GROW THROUGH INNOVATION
We are transforming to achieve the full potential of our
business, adapt to ever-changing market dynamics, and
successfully transform our industry’s challenges into
opportunities.
Through transformative growth and innovation,
we ensure our ability to anticipate and satisfy
consumers’ evolving needs, adapt to ever-changing
market dynamics, and capitalize on new business
opportunities.
TRANSFORM TO STRENGTHEN STRATEGIC CAPABILITIES
3
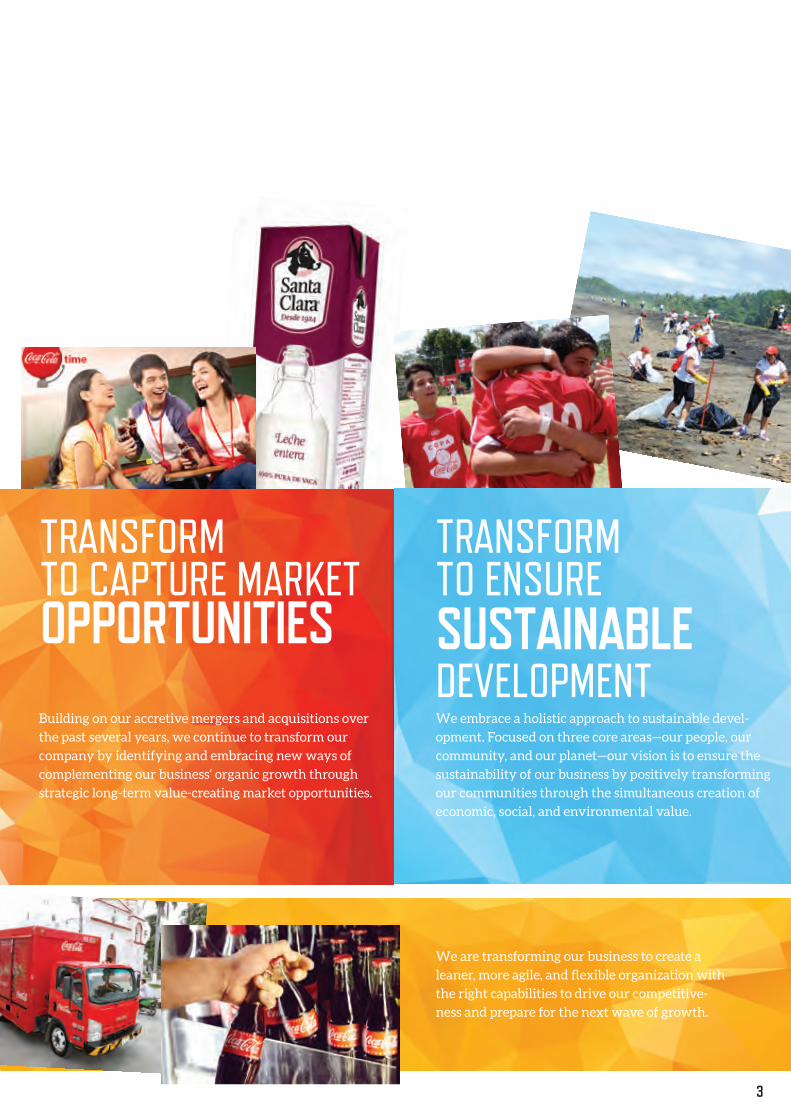
TRANSFORM TO CAPTURE MARKETOPPORTUNITIES
TRANSFORM TO ENSURE SUSTAINABLEDEVELOPMENT
Building on our accretive mergers and acquisitions over
the past several years, we continue to transform our
company by identifying and embracing new ways of
complementing our business’ organic growth through
strategic long-term value-creating market opportunities.
We embrace a holistic approach to sustainable devel-
opment. Focused on three core areas—our people, our
community, and our planet—our vision is to ensure the
sustainability of our business by positively transforming
our communities through the simultaneous creation of
economic, social, and environmental value.
We are transforming our business to create a
leaner, more agile, and flexible organization with
the right capabilities to drive our competitive-
ness and prepare for the next wave of growth.

4
FINANCIAL
HIGHLIGHTS
(US$) 2014 (1) (Ps.) 2014 (Ps.) 2013 % CHANGE
Sales Volume (million unit cases) 3,417.3 3,417.3 3,204.6 6.6%
Total Revenues 9,987 147,298 156,011 -5.6%
Income from Operations 1,406 20,743 21,450 -3.3%
Controlling Interest Net Income 715 10,542 11,543 -8.7%
Total Assets 14,398 212,366 216,665 -2.0%
Long-Term Bank Loans and Notes Payable 4,395 64,821 56,875 14.0%
Controlling Interest 7,167 105,717 113,111 -6.5%
Capital Expenditures 767 11,313 11,703 -3.3%
Book Value per Share (2) 3.46 51.00 55.02 -7.3%
Controlling Interest Earnings per Share (3) 0.34 5.09 5.61 -9.4%
(1) U.S. dollar figures are converted from Mexican pesos using the exchange rate for Mexican pesos published by the U.S. Federal Reserve Board on December 31, 2014, which exchange rate was Ps. 14.75 to U.S.$1.00.(2) Based on 2,072.9 million outstanding ordinary shares in 2014 and 2013.(3) Based on 2,072.9 and 2,056.0 million weighted average outstanding ordinary shares in 2014 and 2013, respectively.(4) Sistema Cambiario Alternativo de Divisas (Supplementary Currency Administration System).
Millions of Mexican pesos and U.S. dollars as of December 31, 2014 (except volume and per share data).
Results under International Financial Reporting Standards. Figures do not include results of Coca-Cola Bottlers Philippines, Inc.
The 2014 results of our Venezuelan operation were translated using the SICAD II(4) alternate exchange rate of 49.99 bolivars per U.S. dollar. The results of 2013 were translated using an exchange rate of 6.30 bolivars per U.S. dollar.
5
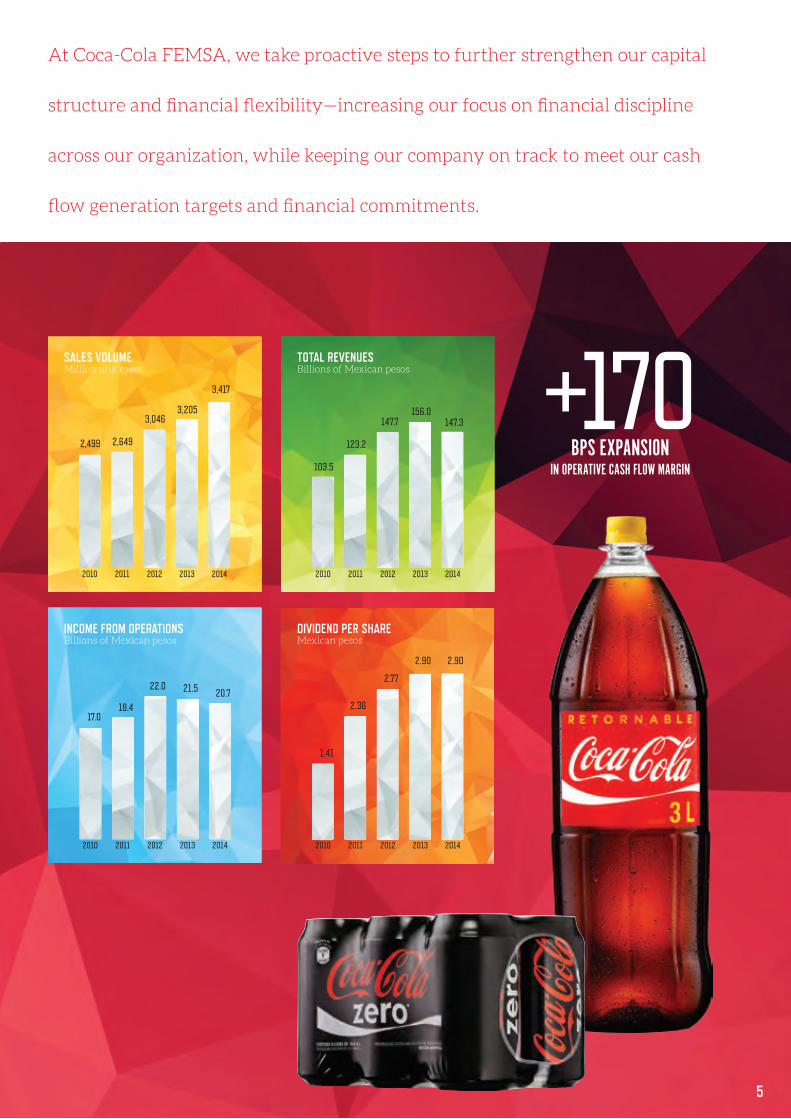
2010 2011 2012 2013 2014
20.721.522.0
18.417.0
2010 2011 2012 2013 2014
147.3156.0
147.7
123.2
103.5
2010 2011 2012 2013 2014
3,417
3,2053,046
2,6492,499
2010 2011 2012 2013 2014
2.902.90
2.77
2.36
1.41
+170BPS EXPANSION
IN OPERATIVE CASH FLOW MARGIN
SALES VOLUMEMillion unit cases
TOTAL REVENUESBillions of Mexican pesos
INCOME FROM OPERATIONSBillions of Mexican pesos
DIVIDEND PER SHAREMexican pesos
At Coca-Cola FEMSA, we take proactive steps to further strengthen our capital
structure and financial flexibility—increasing our focus on financial discipline
across our organization, while keeping our company on track to meet our cash
flow generation targets and financial commitments.

6
DEAR FELLOW
SHAREHOLDERSThis was an exciting, eventful, and
transformational year. Our
company overcame an extremely
challenging macroeconomic, fiscal,
and consumer environment to
deliver top-line growth across our
territories and bottom-line
improvement in Mexico, Brazil,
Venezuela, Argentina, and Central
America.
7
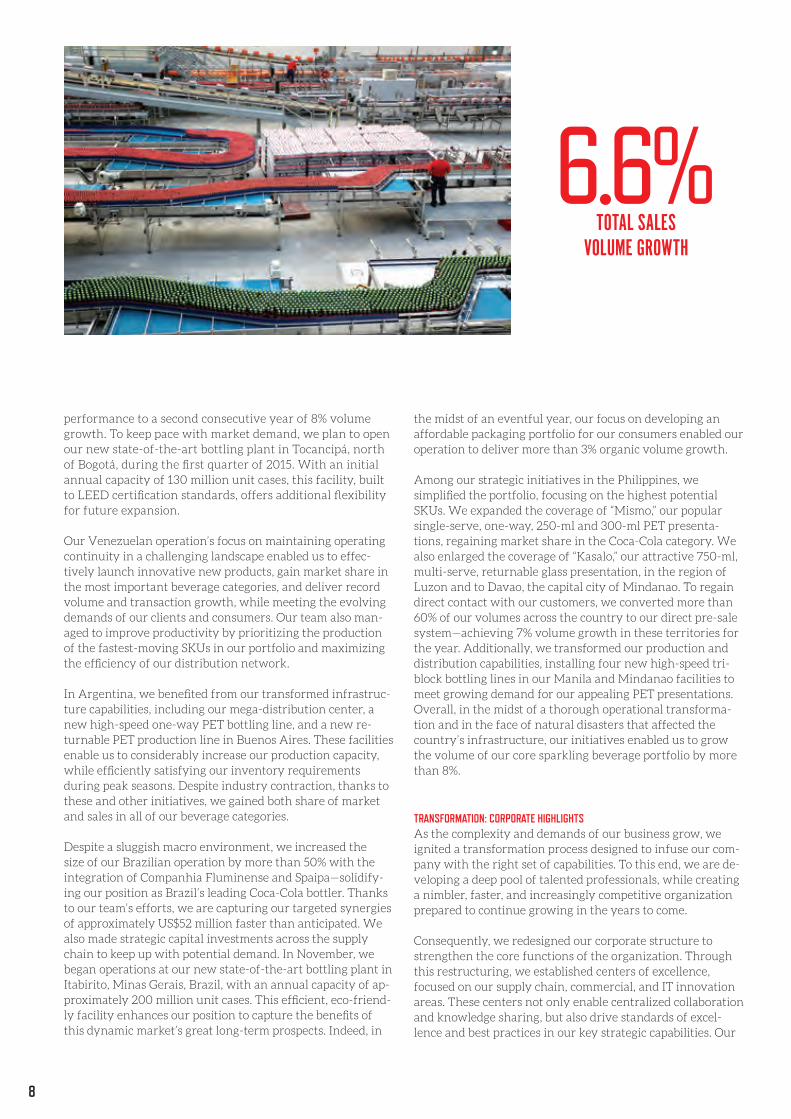
For 2014, our total sales volume grew 6.6% to more than 3.4 billion unit cases, representing close to 21 billion transac-tions in Latin America for the year. Our consolidated total revenues were Ps. 147.3 billion. Our consolidated operat-ing income was Ps. 20.7 billion, and our consolidated net controlling interest income was Ps. 10.5 billion, resulting in earnings per share of Ps. 5.09. On a comparable, currency neutral basis, we achieved double-digit revenue, operating income, and operating cash flow growth, with an operating cash flow margin expansion.
Our key focus for the year was the successful integration of our recently acquired franchises in Brazil and Mexico, coupled with our incremental investments in our manu-facturing and distribution infrastructure to accelerate our volume and transaction growth and to transform the face of our company.
Throughout the year, we faced strong headwinds across our operations. In Mexico, the soft macroeconomic situation, magnified by structural reforms, increased taxation, excise tax-driven price increases on most soft drinks, and higher VAT rates in southern border states, compounded a slug-gish consumer environment for our business. In our major South American markets, we experienced adverse foreign exchange dynamics, combined with decelerating GDP growth in Brazil, a weak economy in Argentina, and a demanding operating landscape in Venezuela. Moreover, in the Philip-pines, we faced natural disasters and a complex operating transformation.
In light of these and other challenges, we embarked on an intensive process to create a leaner, more agile, and flexible organization with the right set of skills to drive our competi-tiveness, enhance our innovative capabilities, accelerate our decision-making, and prepare for the next wave of growth through an efficient and effective management structure. We further strengthened our talent management programs to develop and recruit a deep, multicultural bench of profes-sionals who can address growing market and industry com-plexity in an ever-changing environment, while furthering our company’s strategic vision and results. We also contin-ued to transform our portfolio by launching and reinforcing innovative, affordable packaging alternatives that enabled us to connect more intensively with our consumers and bolster our transactions in each of our markets.
TRANSFORMATION: MARKET HIGHLIGHTS To achieve these results and address the demands ahead, we continued to transform our operations to adapt to ever-changing market dynamics, successfully convert our industry’s challenges into opportunities, and achieve the full potential of our business. This year, our robust and innova-tive portfolio enabled us to connect more closely with our consumers, generating more than 70 million transactions
daily across our franchise territories. This represents a tremendous opportunity to further increase our interaction with our more than 351 million consumers, given that we currently achieve only 0.2 transactions per person per day.
In Mexico, our operations acted swiftly to protect our profit-ability and cash flow generation, proactively implementing portfolio and revenue management initiatives. To success-fully overcome the new tax environment, our operations emphasized returnable presentations, low-calorie, and single-serve sparkling beverages—coupled with packaging and brand innovation—to enable us to connect with our consumers’ needs, generating more than 9 billion transac-tions, while outpacing our volume performance for the year. Additionally, to navigate such tough market dynamics, we restructured our operations, reducing costs and expenses, while aggressively managing our working capital. These initiatives, combined with our relentless focus on point-of-sale execution and overall efficiency, set us on the right path to deliver operating cash flow growth and margin expansion for the year.
Across Central America, our recently initiated acceleration plan, including enhanced point-of-sale execution, expanded cooler coverage, and the introduction of our Magic Price Points strategy, yielded positive results. Building on our expanding manufacturing capability, as well as our invest-ments in packaging and coolers throughout these countries, we are taking this operation from low growth rates to high single-digit volume and transaction growth across Costa Rica, Guatemala, Nicaragua, and Panama during the year.
In Colombia, our transaction growth outpaced our already remarkably strong volume growth thanks to a major two-year acceleration plan, which is transforming the face of our operation across the country. Supported by such commercial initiatives as our Magic Price Points strate-gy, we extended this operation’s positive track record of
8
6.6%
performance to a second consecutive year of 8% volume growth. To keep pace with market demand, we plan to open our new state-of-the-art bottling plant in Tocancipá, north of Bogotá, during the first quarter of 2015. With an initial annual capacity of 130 million unit cases, this facility, built to LEED certification standards, offers additional flexibility for future expansion.
Our Venezuelan operation’s focus on maintaining operating continuity in a challenging landscape enabled us to effec-tively launch innovative new products, gain market share in the most important beverage categories, and deliver record volume and transaction growth, while meeting the evolving demands of our clients and consumers. Our team also man-aged to improve productivity by prioritizing the production of the fastest-moving SKUs in our portfolio and maximizing the efficiency of our distribution network.
In Argentina, we benefited from our transformed infrastruc-ture capabilities, including our mega-distribution center, a new high-speed one-way PET bottling line, and a new re-turnable PET production line in Buenos Aires. These facilities enable us to considerably increase our production capacity, while efficiently satisfying our inventory requirements during peak seasons. Despite industry contraction, thanks to these and other initiatives, we gained both share of market and sales in all of our beverage categories.
Despite a sluggish macro environment, we increased the size of our Brazilian operation by more than 50% with the integration of Companhia Fluminense and Spaipa—solidify-ing our position as Brazil’s leading Coca-Cola bottler. Thanks to our team’s efforts, we are capturing our targeted synergies of approximately US$52 million faster than anticipated. We also made strategic capital investments across the supply chain to keep up with potential demand. In November, we began operations at our new state-of-the-art bottling plant in Itabirito, Minas Gerais, Brazil, with an annual capacity of ap-proximately 200 million unit cases. This efficient, eco-friend-ly facility enhances our position to capture the benefits of this dynamic market’s great long-term prospects. Indeed, in
the midst of an eventful year, our focus on developing an affordable packaging portfolio for our consumers enabled our operation to deliver more than 3% organic volume growth.
Among our strategic initiatives in the Philippines, we simplified the portfolio, focusing on the highest potential SKUs. We expanded the coverage of “Mismo,” our popular single-serve, one-way, 250-ml and 300-ml PET presenta-tions, regaining market share in the Coca-Cola category. We also enlarged the coverage of “Kasalo,” our attractive 750-ml, multi-serve, returnable glass presentation, in the region of Luzon and to Davao, the capital city of Mindanao. To regain direct contact with our customers, we converted more than 60% of our volumes across the country to our direct pre-sale system—achieving 7% volume growth in these territories for the year. Additionally, we transformed our production and distribution capabilities, installing four new high-speed tri-block bottling lines in our Manila and Mindanao facilities to meet growing demand for our appealing PET presentations. Overall, in the midst of a thorough operational transforma-tion and in the face of natural disasters that affected the country’s infrastructure, our initiatives enabled us to grow the volume of our core sparkling beverage portfolio by more than 8%.
TRANSFORMATION: CORPORATE HIGHLIGHTSAs the complexity and demands of our business grow, we ignited a transformation process designed to infuse our com-pany with the right set of capabilities. To this end, we are de-veloping a deep pool of talented professionals, while creating a nimbler, faster, and increasingly competitive organization prepared to continue growing in the years to come.
Consequently, we redesigned our corporate structure to strengthen the core functions of the organization. Through this restructuring, we established centers of excellence, focused on our supply chain, commercial, and IT innovation areas. These centers not only enable centralized collaboration and knowledge sharing, but also drive standards of excel-lence and best practices in our key strategic capabilities. Our
TOTAL SALES VOLUME GROWTH

9
2013 2014
9
priorities include enhanced manufacturing efficiency, im-proved distribution and logistics, and cutting-edge IT-enabled commercial innovation—leaping into the 21st century with both feet technologically.
We also commenced streamlining and de-layering our orga-nization to create a tighter, leaner, more agile management that will enable greater efficiency and bring us closer to the market. For example, in Mexico, over the past two years, we moved from four regions to a single commercial zone, en-compassing the 11 states where we do business. This broader, more simplified structure not only positions every manager closer to our customers, but also enables us to respond more rapidly to market challenges and opportunities.
We are further reinforcing our talent management to de-velop a deep bench of professionals who can address grow-ing market and industry complexity, while furthering our company’s strategic vision. Specifically, we are strength-ening the performance management process; developing future leaders by defining and communicating clear career paths and processes to encourage their development; and, ultimately, fostering a talent culture throughout our company.
With this in mind, our renewed vision is to become one of the fastest growing, most profitable commercial beverage companies in the world along with our partners at The Coca-Cola Company. To realize this vision, we are creating a single, unified, and strong corporate culture that thrives on our diversity and our ability to develop and retain the best talent in the industry.
Our culture is founded on the key attributes of our compa-ny. Based on our keystones of trust and collaboration, every member of our organization must act together and take pride in themselves and our corporation. Whatever the challenges we may face in the future, it’s up to each one of us to contin-ue growing, profoundly transforming our company, while simultaneously delivering economic, social, and environmen-tal value for all of our stakeholders.
On behalf of every employee who proudly and passionately works for our company daily, we would like to thank you for your continued confidence and support.
JOSÉ ANTONIO FERNÁNDEZ CARBAJALChairman of the Board
JOHN SANTA MARIA OTAZUAChief Executive Officer
NUMBER OF TRANSACTIONS
+11.6% GROWTH

10
IN MEMORIAM:
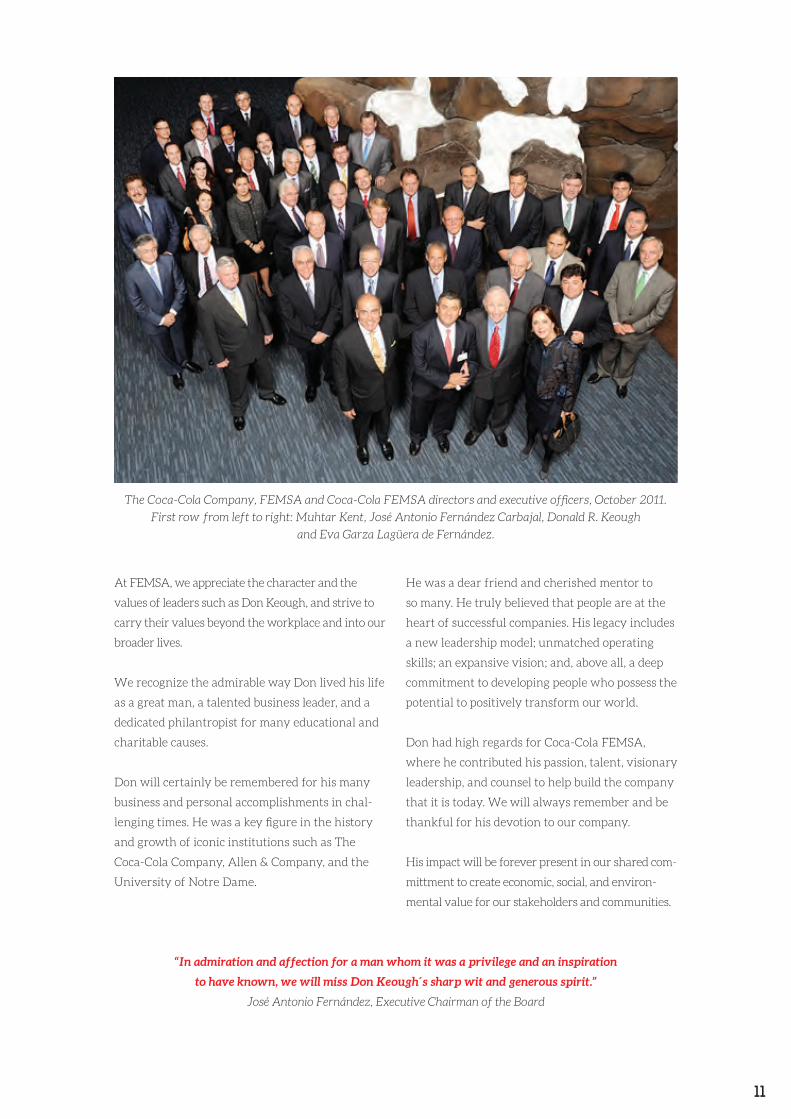
DONALD R. KEOUGH(1926-2015)
If we are fortunate in our lives, we
are privileged to know a very few
great and fascinating leaders.
Donald R. Keough was one of them.
11
At FEMSA, we appreciate the character and the
values of leaders such as Don Keough, and strive to
carry their values beyond the workplace and into our
broader lives.
We recognize the admirable way Don lived his life
as a great man, a talented business leader, and a
dedicated philantropist for many educational and
charitable causes.
Don will certainly be remembered for his many
business and personal accomplishments in chal-
lenging times. He was a key figure in the history
and growth of iconic institutions such as The
Coca-Cola Company, Allen & Company, and the
University of Notre Dame.
He was a dear friend and cherished mentor to
so many. He truly believed that people are at the
heart of successful companies. His legacy includes
a new leadership model; unmatched operating
skills; an expansive vision; and, above all, a deep
commitment to developing people who possess the
potential to positively transform our world.
Don had high regards for Coca-Cola FEMSA,
where he contributed his passion, talent, visionary
leadership, and counsel to help build the company
that it is today. We will always remember and be
thankful for his devotion to our company.
His impact will be forever present in our shared com-
mittment to create economic, social, and environ-
mental value for our stakeholders and communities.
“In admiration and affection for a man whom it was a privilege and an inspiration
to have known, we will miss Don Keough´s sharp wit and generous spirit.”
José Antonio Fernández, Executive Chairman of the Board
The Coca-Cola Company, FEMSA and Coca-Cola FEMSA directors and executive officers, October 2011.
First row from left to right: Muhtar Kent, José Antonio Fernández Carbajal, Donald R. Keough
and Eva Garza Lagüera de Fernández.

TRANSFORM
DIRECTORS AND MANAGERS ROTATED ACROSS OUR DIFFERENT OPERATIONS TO ENHANCE THEIR
SKILLS OVER THE LAST THREE YEARS
617
13
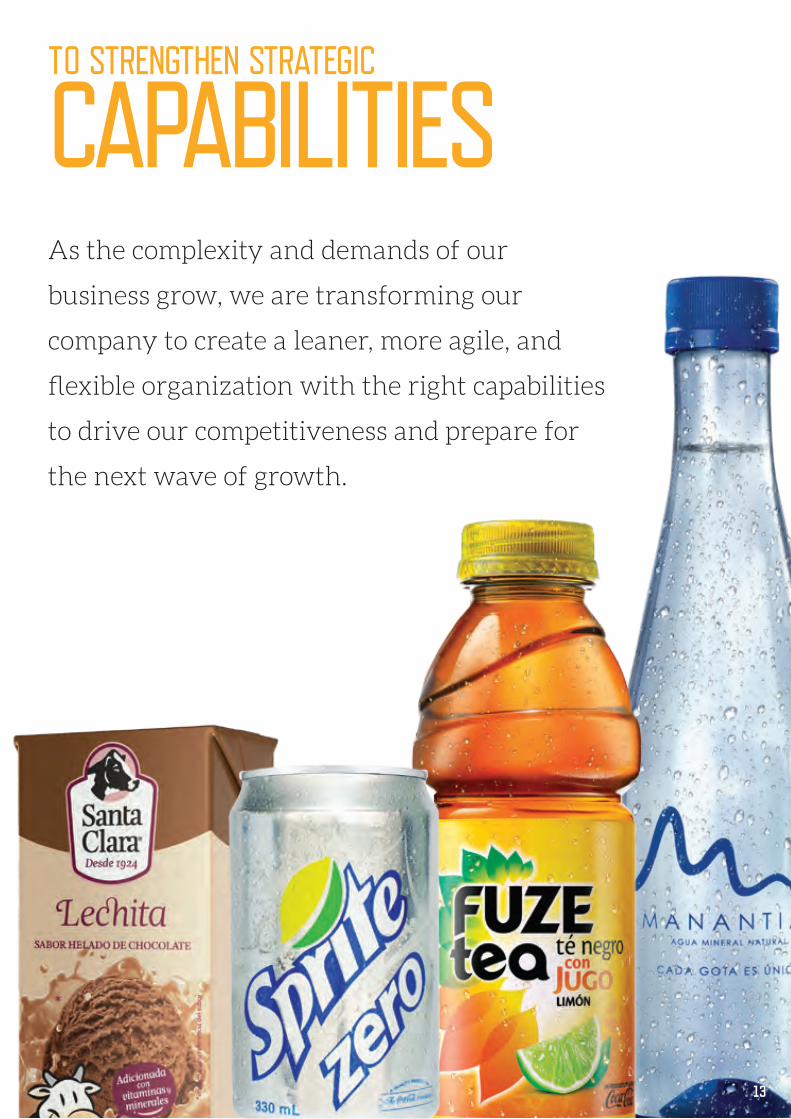
TO STRENGTHEN STRATEGIC
CAPABILITIESAs the complexity and demands of our
business grow, we are transforming our
company to create a leaner, more agile, and
flexible organization with the right capabilities
to drive our competitiveness and prepare for
the next wave of growth.
14
To this end, we redesigned our corporate structure
to strengthen the core functions of the organiza-
tion. In conjunction with this restructuring, we
established centers of excellence, focused on our
supply chain, commercial, and IT innovation ar-
eas. These centers not only enable centralized col-
laboration and knowledge sharing, but also drive
standards of excellence and best practices in these
key strategic capabilities. Our priorities include
enhanced manufacturing efficiency, ensuring
best-in-class practices across all of our operations;
improved distribution and logistics, including
integrated supply chain management—from the
supplier to manufacturing and distribution to the
client; optimal point-of-sale execution; and cut-
ting-edge IT-enabled commercial innovation.
Among our initiatives, we are rolling out our new
proprietary manufacturing model to eight bot-
tling plants across Mexico, Colombia, and Brazil.
This operating model captures all of our shared
knowledge and experience in this core capability.
Through this process, we are matching our experts’
technical skills with each of the different areas of
the plant such as fillers, packers, palletizers, and
auxiliary services. As a result of this new model,
we have cut costs, improved motivation, better
aligned compensation with individual responsibili-
ties, gained efficiency, and raised productivity.
We further enhanced and optimized our organi-
zational spans and de-layered our corporation to
create a tighter, leaner, more agile management
that will enable greater efficiency and bring us
closer to the market. For example, in Brazil, we
took advantage of the integration of Compan-
hia Fluminense and Spaipa to restructure our
organization in order to position us closer to the
marketplace. Specifically, we moved from two
large territories to four equally balanced zones:
1) metropolitan São Paulo; 2) the states of Minas
Gerias, with the city of Belo Horizonte serving
as the focal point, and Matto Grosso do Sul; 3)
the coastal region, connecting our footprint in
the state of Rio de Janeiro with São Paulo; and
4) the former Spaipa territory, incorporating the
state of Paraná and part of the state of São Paulo.
Thanks to this reorganization, we significantly
improved our logistics and, more importantly,
brought corporate management closer to our
customers and consumers.
ON AVERAGE, WE REDUCED 2 ORGANIZATIONAL LAYERS AND INCREASED CONTROL SPANS BY 30%, CAPTURING EFFICIENCIES ACROSS THE COMPANY.
REDUCED LAYERS INCREASED SPANS

15
Over the past three years, we have trained 1,876
managers and 145 directors in effective leadership to
maximize their management skills.
Additionally, we are reinforcing our talent man-
agement to develop a deep bench of professionals
who can address growing market and industry
complexity, while furthering our company’s stra-
tegic vision. Utilizing such tools as Critical Success
Factors, 360-Degree Reviews, and the 9 Box
Performance-Potential Matrix, we are strength-
ening the performance management process to
systematically recognize and reward positive per-
formance, while appropriately differentiating and
dealing with varying levels of accomplishment
across our organization. We are growing future
leaders by defining and communicating clear
career paths, policies, and processes to encourage
development; providing systematic coaching and
feedback; and deploying current and future lead-
ers into stretch roles to accelerate their growth.
For example, over the past three years, we moved
617 directors and managers across our countries,
assuming new responsibilities as part of the
management development program.
Ultimately, we are fostering a
talent culture—where every
employee is a coach or mentor
to their peers and supervisors—
throughout our company.
WE ESTABLISHED CENTERS OF EXCELLENCE, FOCUSED ON OUR SUPPLY CHAIN, COMMERCIAL, AND IT INNOVATION AREAS.

TRANSFORM
MILLION U.S. DOLLARS INVESTED IN INFRASTRUCTURE
IN 2014
$630

17
TO ACHIEVE FULL OPERATING
POTENTIALAs we face an evolving, more demanding
environment, we are transforming our
operations to adapt to ever-changing market
dynamics, successfully convert our industry’s
challenges into opportunities, and achieve
the full potential of our business.
18
OUR JUNDIAÍ MEGA-PLANT, SERVING SÃO PAULO, BRAZIL, SURPASSED 300 MILLION UNIT CASES THIS YEAR—REAFFIRMING ITS POSITION AS THE WORLD’S LARGEST COCA-COLA BOTTLING FACILITY.
With that in mind, we continue to transform our
infrastructural capacity along the supply chain to
achieve untapped operating potential. In Novem-
ber, we opened our state-of-the-art bottling plant
in Itabirito, Brazil. Built to LEED certification
standards, this facility employs a tetra-cogenera-
tion system, which uses up to 30% less energy to
simultaneously generate electricity and heat to
produce hot water, cold water, and carbon dioxide
(CO2). With an annual capacity of approximately
200 million unit cases, this new plant will gener-
ate considerable cost savings, improved produc-
tivity and logistics, and the ability to expand the
coverage of our 2-liter returnable presentation to
serve the growing demand of our consumers in
the state of Minas Gerais, Brazil.
Following our success at our Toluca mega-plant
in Mexico, we installed four new high-speed tri-
block bottling lines in our Manila and Mindanao
facilities in the Philippines. Unlike conventional
bottling lines—where the blower, labeler, and filler
processes are connected by conveyors, requiring
extra time and effort to feed material from one
operation to the other—this new tri-block technol-
ogy combines all three processes in one intercon-
nected high-speed line or block. Indeed, two of our
tri-block lines in the Philippines enjoy a maximum
capacity of up to 81,000 bottles per hour, making
them the fastest bottling lines in the world. How-
ever, technology by itself cannot yield high effi-
ciency rates. It is only through our experienced,
knowledgeable manufacturing teams that we are
able to run these lines at very high benchmark
efficiency levels. This powerful combination of
technology and know-how enables us to reinforce
our company’s position as one of the most efficient
and productive manufacturers across the entire
Coca-Cola bottling system.
We also continued to benefit from the warehouse
automation system concept, already installed in
our Jundiaí, Brazil, and Toluca, Mexico facilities.
Instead of traditional forklifts, which stack pallets
up to three levels, the warehouse automation sys-
tem uses laser-guided vehicles that stack pallets
significantly higher. Consequently, we gain great-
er inventory capacity, while deferring the need to
construct new distribution facilities as our plants’
productivity ratios and markets grow.
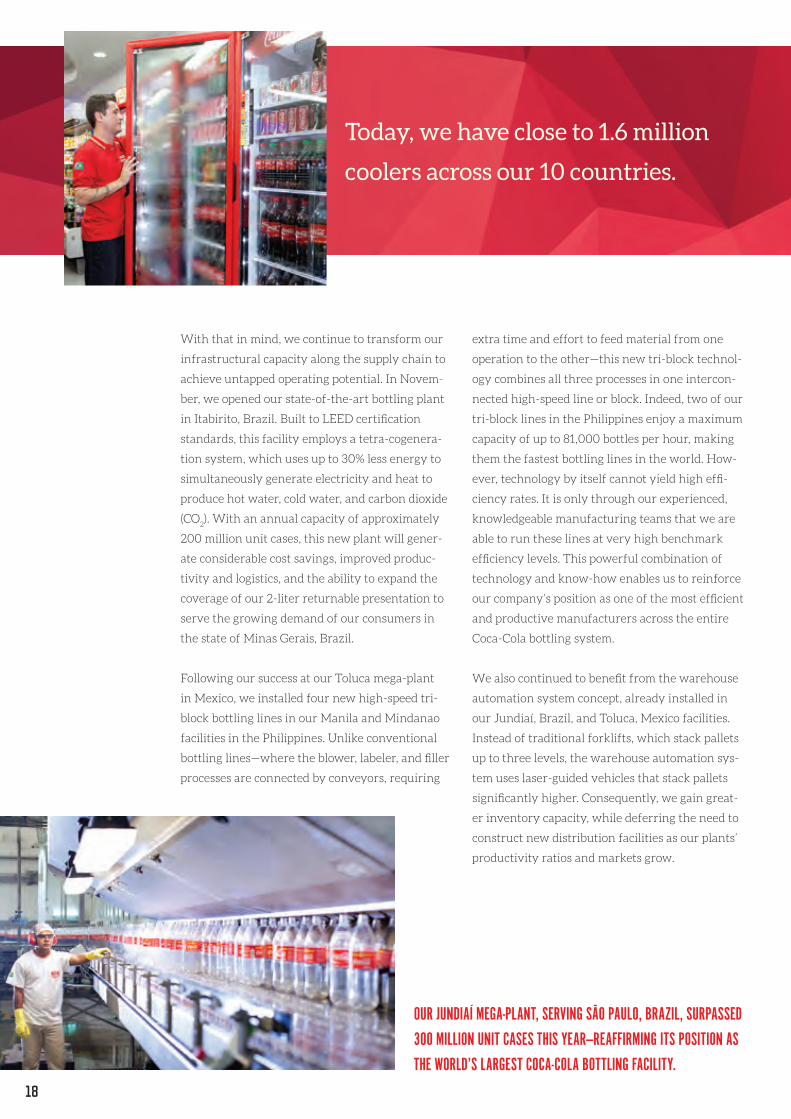
Today, we have close to 1.6 million
coolers across our 10 countries.
19
1
2
3
4
5
67
1
2
4
5
6
3
7
19
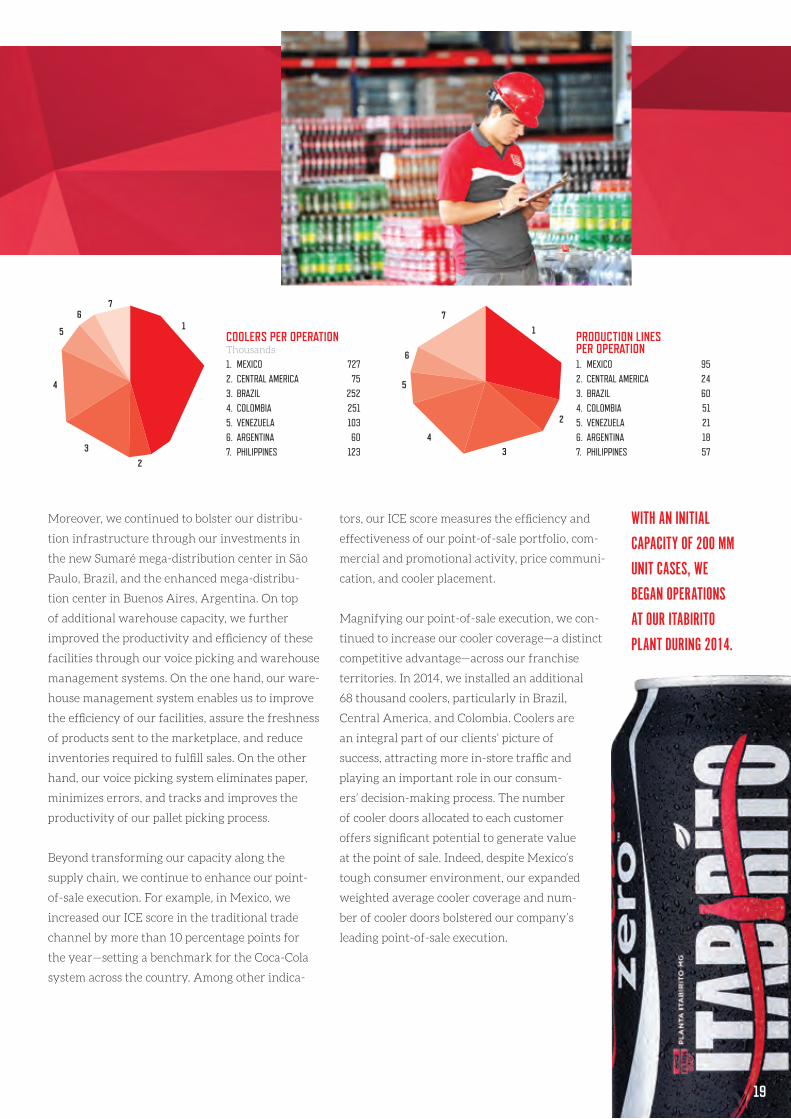
Moreover, we continued to bolster our distribu-
tion infrastructure through our investments in
the new Sumaré mega-distribution center in São
Paulo, Brazil, and the enhanced mega-distribu-
tion center in Buenos Aires, Argentina. On top
of additional warehouse capacity, we further
improved the productivity and efficiency of these
facilities through our voice picking and warehouse
management systems. On the one hand, our ware-
house management system enables us to improve
the efficiency of our facilities, assure the freshness
of products sent to the marketplace, and reduce
inventories required to fulfill sales. On the other
hand, our voice picking system eliminates paper,
minimizes errors, and tracks and improves the
productivity of our pallet picking process.
Beyond transforming our capacity along the
supply chain, we continue to enhance our point-
of-sale execution. For example, in Mexico, we
increased our ICE score in the traditional trade
channel by more than 10 percentage points for
the year—setting a benchmark for the Coca-Cola
system across the country. Among other indica-
tors, our ICE score measures the efficiency and
effectiveness of our point-of-sale portfolio, com-
mercial and promotional activity, price communi-
cation, and cooler placement.
Magnifying our point-of-sale execution, we con-
tinued to increase our cooler coverage—a distinct
competitive advantage—across our franchise
territories. In 2014, we installed an additional
68 thousand coolers, particularly in Brazil,
Central America, and Colombia. Coolers are
an integral part of our clients’ picture of
success, attracting more in-store traffic and
playing an important role in our consum-
ers’ decision-making process. The number
of cooler doors allocated to each customer
offers significant potential to generate value
at the point of sale. Indeed, despite Mexico’s
tough consumer environment, our expanded
weighted average cooler coverage and num-
ber of cooler doors bolstered our company’s
leading point-of-sale execution.
WITH AN INITIAL CAPACITY OF 200 MM UNIT CASES, WE BEGAN OPERATIONS AT OUR ITABIRITO PLANT DURING 2014.
COOLERS PER OPERATIONThousands
1. MEXICO 7272. CENTRAL AMERICA 753. BRAZIL 2524. COLOMBIA 2515. VENEZUELA 1036. ARGENTINA 607. PHILIPPINES 123
PRODUCTION LINES PER OPERATION1. MEXICO 952. CENTRAL AMERICA 243. BRAZIL 604. COLOMBIA 515. VENEZUELA 216. ARGENTINA 187. PHILIPPINES 57

TRANSFORM
GROWTH OF LOW-CALORIE SPARKLING BEVERAGES IN 2014
7%

21
TO GROW THROUGH
INNOVATIONThrough transformative growth and
innovation, we ensure our ability to anticipate
and satisfy consumers’ evolving needs, adapt
to ever-changing market dynamics, and
capitalize on new business opportunities.

22
We significantly increased our
installed vending machine base
in Mexico, reaching more than
20,000 units.
We successfully launched Coca-Cola Life across
our Mexican operations this year. Sweetened with
natural ingredients, Coca-Cola Life offers consum-
ers a reduced calorie alternative for one of the
world’s most beloved brands. Launched in multi-
ple presentations, we not only achieved more than
70% point-of-sale coverage, but also gained share,
while revitalizing the Coca-Cola category among
consumers. In Mexico, we additionally launched
our successful “Share a Coke” campaign from
July through October. This innovative promo-
tion connected with consumers mainly through
personalized 12-ounce cans and 600-ml presen-
tations, sporting more than 300 different names.
Through this campaign, we generated a significant
amount of incremental transactions throughout
our Mexican territories. Subsequently, we rolled
out this campaign in our franchise territories in
Brazil, Argentina, Colombia, Costa Rica, Nicara-
gua, Guatemala, Panama, and the Philippines.
We continue to satisfy health-conscious consum-
ers’ growing demand for isotonic sports drinks
with the innovative growth of Powerade. In
Mexico, Powerade achieved the leading position
in this category across three of our four territories
during the year, reaching close to 48% market
share in our overall Mexican franchise by the end
of 2014. Building on the brand’s popularity, our
volume of Powerade more than doubled in Argen-
tina, increasing share among consumers attracted
to this drink’s refreshing qualities.
In Argentina, we reaped the benefit of our trans-
formed infrastructure capabilities, including our
mega-distribution center and a new returnable
PET bottling line in Buenos Aires. These facilities
enable us to considerably increase our production
capacity, while efficiently satisfying our invento-
ry requirements during peak seasons. Thanks to
these and other initiatives, we gained both share
of market and sales in all of our beverage catego-
ries and across most of our distribution channels
despite a relatively weak consumer environment.
We also continue to satisfy our cost-conscious
consumers through our strong portfolio of afford-
able, returnable packaging alternatives. In Mexico,
we broadened the coverage of our convenient,
affordable 500-ml returnable glass presentation
for brand Coca-Cola, fostering point-of-sale or at
home consumption. In the Valley of Mexico, we
significantly expanded the volume of our 3-liter
multi-serve returnable PET presentation for brand
Coca-Cola, enhancing an attractive value prop-
osition for our consumers to enjoy. In the rest of
our Mexican territories, we also reinforced the
coverage of our 2.5-liter multi-serve returnable
PET presentation for Coca-Cola, expanding the
opportunity to share this popular brand in a seg-
mented way. In Mexico, we further expanded the
coverage of our 1.25-liter multi-serve returnable
glass presentation for brand Coca-Cola, catering to
families across the country. In Brazil, we expanded
the coverage of our 2-liter multi-serve returnable
PET presentation for brand Coca-Cola, enabling
more consumers to share the magic of Coke at
home. Through our broad array of returnable pre-
sentations, we look to provide the right package at
the right price for every consumer.
To intensify our connection with consumers, we
continued our Magic Price Points strategy across
our franchise territories. Specifically for brand
DURING 2014, POWERADE GAINED LEADERSHIP IN MOST OF OUR TERRITORIES IN MEXICO.

1
2
3
4
5
6
2013
188
2014
202
2012
167
2011
134
2010
119
2009
109
23
Coca-Cola in Colombia, we launched a convenient,
entry-level 6.5-ounce returnable glass presentation
at COP500 for on-the-go consumption. We also
reinforced the coverage of our 1.4-liter one-way
presentation, capturing transactions at the magic
price point of COP2,000. Moreover, in Brazil, we
continued to reinforce the availability of Coca-Cola,
Coca-Cola Zero, and Fanta in our 200-ml one-way
presentation at R$1, while increasing the cover-
age of our 300-ml one-way PET presentation for
brand Coca-Cola at R$2. Thanks to this strategy,
we expanded the growth of our sparkling beverage
brands across these countries with the right portfo-
lio at the magic price for our consumers.
We additionally continued to satisfy and stimulate
demand among our consumers for our growing
portfolio of low-calorie, affordable sparkling bev-
erages. Complementing the appeal of our popular
400-ml single-serve presentations of Coca-Cola
Zero and Sprite Zero, we launched 400-ml presen-
tations at attractive price points for Fanta Zero,
Fresca Zero, and Sidral Mundet Light throughout
Mexico. Consequently, we increased the cover-
age and volume of these zero-calorie beverages
throughout the country.
Furthermore, we are expanding our profitable
vending machine business, installing close to
6,000 additional machines in Mexico. We are
increasing our presence at a growing number of
high-traffic locations, while capturing irregular
spaces with our new smaller, slimmer machines.
We are also improving our prospecting process
to maintain momentum in the market, while in-
creasing the productivity of our machines and the
efficiency of the company’s operating model.
FOR THOSE CONSUMERS WHO COULD NOT FIND THEIR NAME, WE INSTALLED MORE THAN 180 PERSONALIZATION CENTERS IN MEXICO, ENABLING US TO ENGAGE MORE THAN 520,000 ADDITIONAL CONSUMERS THROUGH “SHARE A COKE.”
LOW-CALORIE SPARKLING BEVERAGESAs % of consolidated volume of this category
1. MEXICO 32.92. CENTRAL AMERICA 3.83. BRAZIL 30.84. COLOMBIA 7.25. VENEZUELA 1.96. ARGENTINA 23.5
STILL BEVERAGESMillion unit cases

TRANSFORM
SUCCESFULLY INTEGRATED COCA-COLA FRANCHISES AND
DAIRY BUSINESSES SINCE 2011
9

25
TO CAPTURE MARKET
OPPORTUNITIESBuilding on our accretive mergers and
acquisitions over the past several years,
we continue to transform our company by
identifying and embracing new ways of
complementing our business’ organic growth
through strategic long-term value-creating
market opportunities.

26
Despite a difficult environment, we integrated
the operations of Companhia Fluminense and
Spaipa, solidifying our position as Brazil’s leading
Coca-Cola bottler. Through our team’s efforts, we
captured our targeted synergies of approximately
US$52 million faster than anticipated. These syn-
ergies primarily come from back-office consolida-
tion, portfolio optimization, reconfiguration of the
supply chain network, and IT implementation.
Beyond the synergies, the cross-fertilization of
talent and best practices remain key ingredients
to success. The integration of these franchises was
no different. Many of their talented executives
now occupy important positions in Coca-Cola
FEMSA’s operations. Moreover, in terms of best
practices, we are in the process of implementing
Spaipa’s exemplary commercial approach across
our Brazilian operations. Instead of opening a
new distribution center, we will distribute our
products from our bottling plants to distant client
locations through an innovative system of cross
docks and cross trucks—serving a wider area with
less infrastructure investment, while reaching
customers and consumers more efficiently with
our multi-category portfolio of products.
We also completed the integration of Grupo Yoli,
our fourth recent merger in Mexico. Through our
operations’ endeavors, we generated total syner-
gies from these transactions of approximately
Ps. 1.1 billion. The efficiencies achieved through
the smooth integration of these franchises signifi-
cantly improved the profitability of our merged
franchise territories.
Additionally, under our Jugos del Valle joint ven-
ture with The Coca-Cola Company, we capitalized
on our position in Mexico’s milk and value-added
dairy category. During the year, we rolled out
wholesome Santa Clara brand white UHT milk
in regular, lactose-free, light, and lactose-free
light 1-liter presentations, along with chocolate,
cappuccino, vanilla, and strawberry flavored UHT
milk in 250-ml presentations for children. We
distributed these new presentations through 38
distribution centers in 32 cities using regular and
more than 800 specialized home delivery routes—
reaching over 65,000 households. These prod-
ucts further transform our broad still beverage
portfolio, complementing our consumers’ healthy
lifestyles.
WE DELIVER SANTA CLARA PRODUCTS TO MORE THAN 65,000 HOUSEHOLDS EVERY DAY THROUGHOUT OUR TERRITORIES IN MEXICO.

27
+32%
2012 2014
173
131
+25%
2012 2014
2,440
1,957
In the Philippines, we continue to develop the
pillars of an ambitious strategic framework: port-
folio, route to market, and supply chain. Among
our initiatives, we keep simplifying the portfolio,
concentrating on the highest potential SKUs. We
are refocusing on a limited assortment of single-
serve returnable glass presentations below the
PHP10 price point, including our 8-ounce bottle
and “Sakto” 200-ml presentation. We expanded
the coverage of “Mismo,” our exceptionally pop-
ular single-serve, one-way PET presentation for
on-the-go consumption of brand Coca-Cola and
Sprite, beyond the greater Manila metropolitan
area (GMA) to the rest of Luzon and the most im-
portant cities of Mindanao and Visayas. Through
250-ml and 300-ml offerings at PHP10 and
PHP12, respectively, we broadened our mix of PET
presentations and regained market share—pro-
ducing almost 145 thousand unit cases of “Mismo”
daily in Luzon. We also enlarged the coverage
of “Kasalo,” our appealing 750-ml, multi-serve,
returnable glass presentation at PHP18 for shared
consumption of brand Coca-Cola, Sprite, and Roy-
al, from the GMA to Luzon and Davao, the capital
city of Mindanao. We further plan to broaden the
coverage of our refreshing Minute Maid Fresh
orangeade in an affordable 250-milliliter, sin-
gle-serve presentation at PHP12 that appeals to
Filipino consumers’ palates and pocketbooks.
To regain direct contact with our customers, we
converted more than 60% of our volumes across
the country to our new route to market. Imple-
mentation of this pre-sale platform with our
exclusive partners positions us to execute the best
commercial initiatives, enhance our point-of-sale
execution, and guide market evolution through
the right business model. Additionally, we
established a team to optimize the supply chain,
ensuring more efficient logistics from our suppli-
ers through our manufacturing and distribution
centers to our customers. This strategy sets us
firmly on the path to long-term profitability.
In the Philippines, we have 330 delivery
partners, close to 300 KOF dealers, and
more than 2,400 pre-sellers.
ONE-WAY PET VOLUME SOLD IN THE PHILIPPINESMillion unit cases
PRE-SELLERS IN THE PHILIPPINES

TRANSFORM
MEXICAN COMPANY TO GAIN MEMBERSHIP IN ROBECOSAM’S
“THE SUSTAINABILITY YEARBOOK”.
1ST

29
TO ENSURE SUSTAINABLE
DEVELOPMENTWe embrace a holistic approach to sustainable
development, strategically addressing the
material issues that most impact our business.
Focused on three core areas—our people, our
community, and our planet—our vision is to
ensure the sustainability of our business by
positively transforming our communities
through the creation of economic, social,
and environmental value.

30
2013
1.75
2014
1.79
2012
1.76
2011
1.83
2010
1.96
2013
4.03
2014
4.07
2012
3.89
2011
3.86
2010
3.69
Underscoring our commitment to sustainability,
Coca-Cola FEMSA was once again selected as one
of only 8 beverage companies to be included in the
Dow Jones Sustainability Emerging Markets In-
dex. Moreover, the Mexican Stock Exchange chose
our company to participate in its Sustainability
Index for the fourth consecutive year. Important-
ly, we became the first Mexican company to not
only gain membership in RobecoSAM’s 2015 “The
Sustainability Yearbook,” but also receive this
prestigious institution’s Industry Mover Sustain-
ability Award.
Sustainable development begins with us. Hence,
we are committed to offering our more than
120,000 employees the best place to work, found-
ed on respect for human rights. As part of our
transformation process, we are reinforcing our
talent management system to develop executives
and employees with the capabilities to meet new
challenges, drive competitiveness, and prepare for
the next wave of growth.
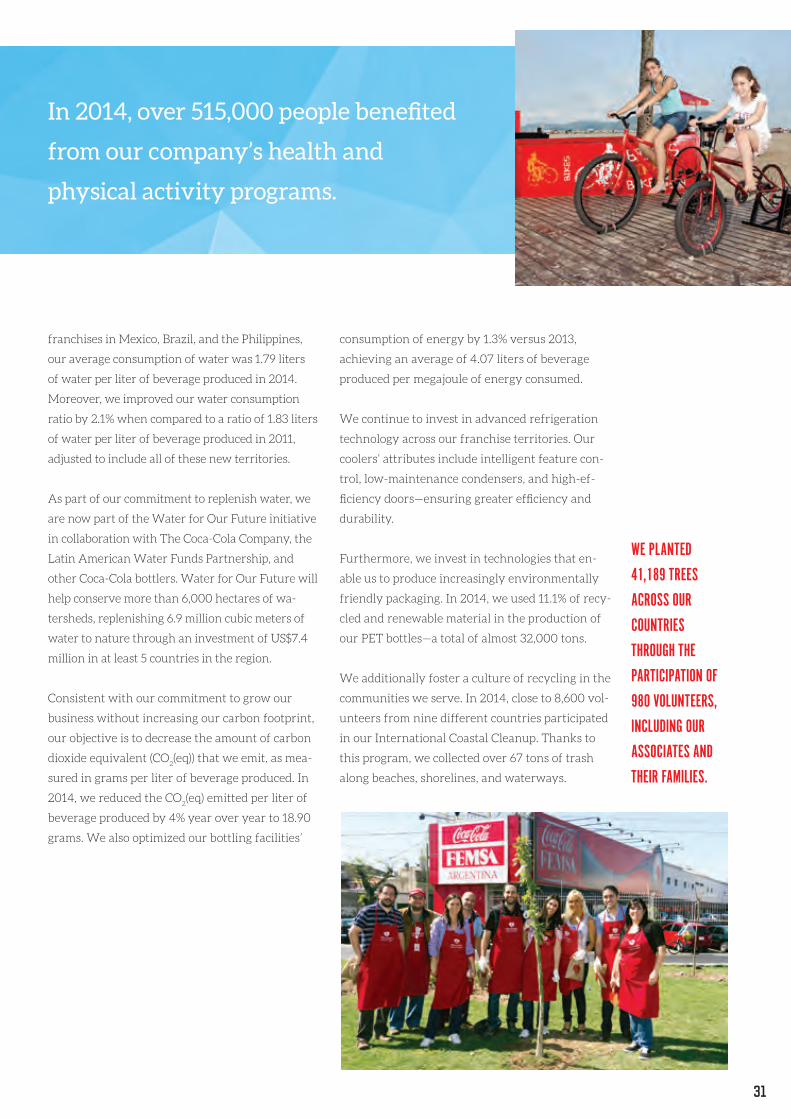
Beyond the workplace, we are devoted to the pos-
itive transformation of the communities we serve.
To this end, we are committed to helping people
achieve healthy and active lifestyles, including
good nutrition habits, hydration, and regular
physical activity. Accordingly, we conduct and
promote a variety of health and physical activity
programs among children and young people. On
top of the 26,000 people who reaped the advan-
tages of our nutritional initiatives, in 2014, more
than 515,000 people benefited from our compa-
ny’s health and physical activity programs.
At Coca-Cola FEMSA, we are dedicated to improv-
ing the environmental impact of our operations.
Specifically, we are focused on three areas: water,
energy, and waste and recycling.
We join our partner, The Coca-Cola Company, in
the global goal to return to nature the same amount
of water we use to produce our beverages, and
guarantee a more efficient use of water across our
entire value chain. Despite our integration of new
AT ONLY 18 GRAMS, OUR 600-ML COCA-COLA PET BOTTLE IS 12% LIGHTER, EMITTING LESS CO
2 AND
UNDERSCORING ITS POSITION AS THE LIGHTEST COKE BOTTLE IN THE SYSTEM.
WATER EFFICIENCYLiters of water /liters of beverage
ENERGY EFFICIENCYLiters of beverage produced / megajoule
31
In 2014, over 515,000 people benefited
from our company’s health and
physical activity programs.
franchises in Mexico, Brazil, and the Philippines,
our average consumption of water was 1.79 liters
of water per liter of beverage produced in 2014.
Moreover, we improved our water consumption
ratio by 2.1% when compared to a ratio of 1.83 liters
of water per liter of beverage produced in 2011,
adjusted to include all of these new territories.
As part of our commitment to replenish water, we
are now part of the Water for Our Future initiative
in collaboration with The Coca-Cola Company, the
Latin American Water Funds Partnership, and
other Coca-Cola bottlers. Water for Our Future will
help conserve more than 6,000 hectares of wa-
tersheds, replenishing 6.9 million cubic meters of
water to nature through an investment of US$7.4
million in at least 5 countries in the region.
Consistent with our commitment to grow our
business without increasing our carbon footprint,
our objective is to decrease the amount of carbon
dioxide equivalent (CO2(eq)) that we emit, as mea-
sured in grams per liter of beverage produced. In
2014, we reduced the CO2(eq) emitted per liter of
beverage produced by 4% year over year to 18.90
grams. We also optimized our bottling facilities’
consumption of energy by 1.3% versus 2013,
achieving an average of 4.07 liters of beverage
produced per megajoule of energy consumed.
We continue to invest in advanced refrigeration
technology across our franchise territories. Our
coolers’ attributes include intelligent feature con-
trol, low-maintenance condensers, and high-ef-
ficiency doors—ensuring greater efficiency and
durability.
Furthermore, we invest in technologies that en-
able us to produce increasingly environmentally
friendly packaging. In 2014, we used 11.1% of recy-
cled and renewable material in the production of
our PET bottles—a total of almost 32,000 tons.
We additionally foster a culture of recycling in the
communities we serve. In 2014, close to 8,600 vol-
unteers from nine different countries participated
in our International Coastal Cleanup. Thanks to
this program, we collected over 67 tons of trash
along beaches, shorelines, and waterways.
WE PLANTED 41,189 TREES ACROSS OUR COUNTRIES THROUGH THE PARTICIPATION OF 980 VOLUNTEERS, INCLUDING OUR ASSOCIATES AND THEIR FAMILIES.
32
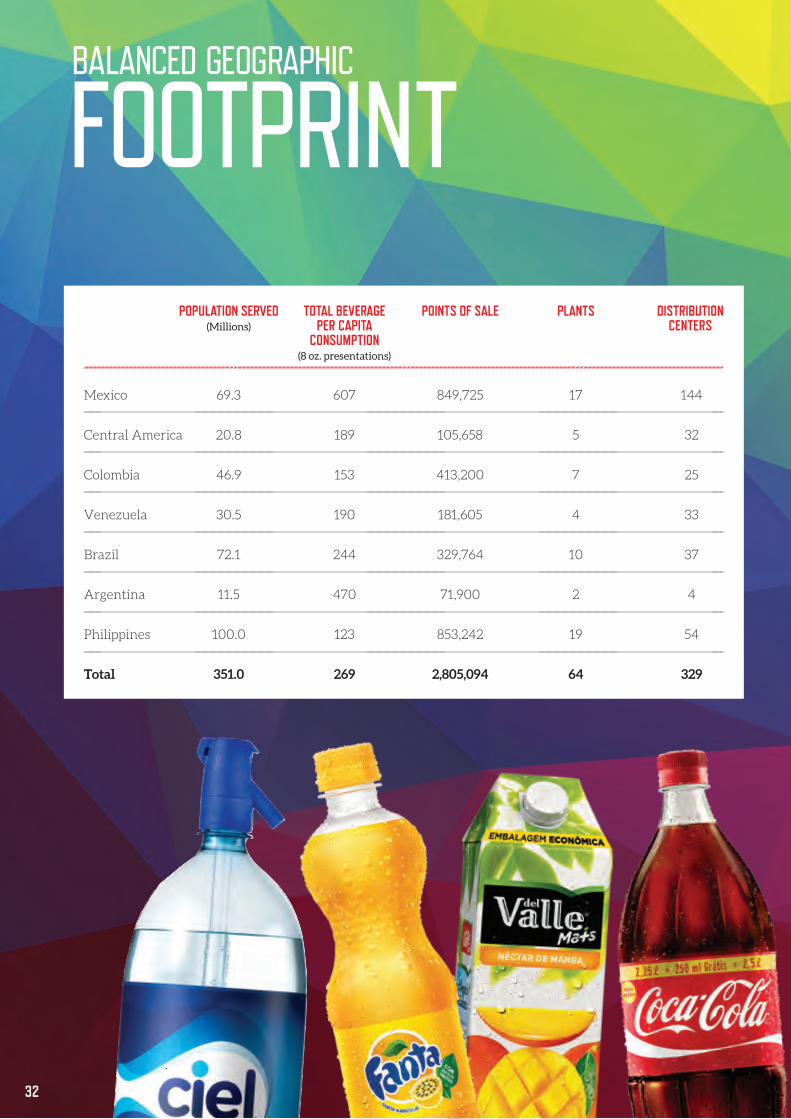
BALANCED GEOGRAPHIC
FOOTPRINT POPULATION SERVED TOTAL BEVERAGE POINTS OF SALE PLANTS DISTRIBUTION (Millions) PER CAPITA CENTERS CONSUMPTION (8 oz. presentations)
Mexico 69.3 607 849,725 17 144
Central America 20.8 189 105,658 5 32
Colombia 46.9 153 413,200 7 25
Venezuela 30.5 190 181,605 4 33
Brazil 72.1 244 329,764 10 37
Argentina 11.5 470 71,900 2 4
Philippines 100.0 123 853,242 19 54
Total 351.0 269 2,805,094 64 329

33
MEXICO &CENTRAL AMERICA
SOUTH AMERICA
SOUTHEAST ASIA
34
5
2
3
4
1
6
OPERATING
HIGHLIGHTS SPARKLING WATER(1) BULK WATER(2) STILL
Mexico 72.2% 5.8% 17.0% 5.1%
Central America 83.9% 5.7% 0.2% 10.2%
Colombia 72.2% 8.0% 9.7% 10.0%
Venezuela 85.7% 5.7% 0.8% 7.8%
Brazil 88.1% 6.0% 0.7% 5.2%
Argentina 86.7% 8.3% 0.3% 4.7%
TOTAL VOLUMEMillion unit cases
1. MEXICO 1,754.9 2. BRAZIL 733.5 3. COLOMBIA 298.4 4. VENEZUELA 241.15. ARGENTINA 225.7 6. CENTRAL AMERICA 163.6
(1) Excludes still bottled water in presentations of 5.0 Lt. or larger. Includes flavored water.(2) Bulk water - still water in presentations of 5.0 Lt. or larger. Includes flavored water.

35
MEX CA COL VEN BRA ARG
62.1%
37.9%
65.2%
34.8%
68.0%
32.0%
93.1%
6.9%
84.5%
15.5%
80.3%
19.7%
MEX CA COL VEN BRA ARG
64.5% 54.7% 69.8% 81.9% 75.0% 85.3%
7.5% 2.4% 8.0%
35.5%45.3%
30.2%
18.1%25.0%
14.7%
PRODUCT MIX BY PACKAGESparkling Beverages
PRODUCT MIX BY SIZESparkling Beverages
SPARKLING BEVERAGES
2,668.4Million unit cases
WATER & BULK WATER
546.5Million unit cases
STILL BEVERAGES
202.5Million unit cases
GROWTH VS. 2013 GROWTH VS. 2013 GROWTH VS. 2013
■ Non-Returnable ■ Returnable ■ Multi-serve ■ Single-serve

36
DEAR
SHAREHOLDERSWe have demonstrated our ability to return capital to our shareholders, while deleveraging our balance sheet, capitalizing on our financial flexibility, and continuing to invest in the future of our company.
37
This year, our company successfully navigated a soft and chal-
lenging macroeconomic and consumer environment, char-
acterized by fiscal reforms and increased taxation in Mexico,
adverse foreign exchange dynamics across our operations, an
economic slowdown in Brazil, Argentina and Central Ameri-
ca, on top of a demanding operating landscape in Venezuela,
along with natural disasters and a complex operating transfor-
mation in the Philippines.
We delivered local currency top-line growth in every market
but Mexico—where volumes were affected by excise tax driv-
en price increases—and margin expansion in Mexico, Brazil,
Venezuela, Argentina, and Central America.
In addition to the results from our recently integrated territo-
ries in Mexico and Brazil, the main drivers of our performance
for the year were our strong and committed team of profes-
sionals, our organizational flexibility, our proactive revenue
management initiatives in every operation, our reinforced
marketplace execution, and our ability to adapt our broad port-
folio of beverages to connect with cost-conscious consumers,
increasing transactions across our franchise territories—always
mindful of protecting the profitability and the cash flow gener-
ation of every operation through our strict financial discipline.
Given current operating and macroeconomic conditions in
Venezuela, we decided to use the previously denominated
SICAD II exchange rate of 50 bolivars per U.S. dollar to trans-
late this operation’s 2014 results into our reporting currency,
the Mexican peso. Consequently, Venezuela’s contribution to
our consolidated results reduced significantly, and now rep-
resents 7% of our volumes and 6% of both our revenues and
operating cash flow. Including this adjustment, we produced
the following results in 2014:
• Consolidated revenues were Ps. 147.3 billion.
• Consolidated operating income was Ps. 20.7 billion.
• Consolidated net controlling interest income was Ps. 10.5
billion, resulting in earnings per share of Ps. 5.09 or
Ps. 50.86 per ADS.
• Total net debt at year-end was approximately Ps. 53.1
billion.
Our strong balance sheet, along with our reaffirmed invest-
ment-grade credit ratings, continues to underscore the finan-
cial strength and flexibility of our company. As of December
31, 2014, we had a cash balance of Ps. 13.0 billion, and our total
debt was Ps. 66.0 billion. For the year, our operating cash flow
was Ps. 28.4 billion. In 2014, our operating cash flow-to-net
interest coverage ratio was 5.49 times, and our net-debt-to-op-
erating cash flow ratio was 1.87 times. During the second and
fourth quarters of 2014, we made dividend payments in the
total amount of Ps. 6.0 billion, demonstrating our company’s
ability to return capital to shareholders, while deleveraging
our balance sheet, capitalizing on our financial flexibility, and
continuing to invest in the future of our company.
The strategic capital investments we make in every one of
our markets create a solid foundation to take advantage of the
opportunities that we envision in the beverage business across
our operations. Among our most recent investments, we con-
tinue to reinforce our cooler coverage—a distinct competitive
advantage—across our franchise territories. We remain at the
forefront of technology through our installation of high-speed
tri-block bottling lines and our light-weighting initiatives. We
carry on our construction of sustainable, state-of-the-art bot-
tling and distribution facilities, including our recently opened
Itabirito plant in the state of Minas Gerais, Brazil, our new
Tocancipá plant to the northeast of Bogotá, Colombia, and our
new Sumaré mega-distribution center in the northern part
of the state São Paulo, Brazil. Through these investments, we
maximize our operations’ capacity to achieve the full potential
of our business more efficiently, productively, and profitably,
while always ensuring that we take care of the environment.
We also continued to complement our business’ organic
growth through strategic long-term value-creating market
opportunities. Despite a difficult environment, we increased
the size of our Brazilian operation by more than 50% with the
integration of Companhia Fluminense and Spaipa—solidifying
our position as Brazil’s leading Coca-Cola bottler. Through our
team’s efforts, we are capturing our targeted synergies of ap-
proximately US$52 million faster than anticipated. These syn-
ergies primarily come from back-office consolidation, portfolio
optimization, reconfiguration of the supply chain network,
and IT implementation. We further completed the integration
of Grupo Yoli, our fourth merger in Mexico since 2011. As a re-
sult of our operation’s endeavors, we generated total synergies
from these four transactions of approximately Ps. 1.1 billion.
The efficiencies achieved through the smooth integration of
these franchises significantly improved the profitability of our
acquired and merged franchise territories.
As always, we took proactive steps to further strengthen our
capital structure and financial flexibility. Our increased focus
on financial discipline across our organization—from more
efficient, prudent, and stricter working capital and capital
investment management, to the development of the talent
and capability to carry out in-depth financial and profitabil-
ity analysis on many fronts, to the implementation of an
organizational transformation, yielding increased efficiency
in every process across our territories to make more, better
informed decisions—enables us to continue reducing our net
debt position, while maintaining our company’s strong cash
flow generation.
$320
Thanks to our team’s ability to effectively manage a tough
macroeconomic, operating, and consumer environment,
our consolidated sales volume grew 6.6% to 3,417 million
unit cases for the year. Organically, excluding the integrated
territories in Brazil and Mexico, our sales volume remained
almost flat. On the same basis, our bottled water portfolio
grew 5.0%, and our still beverage category grew 1.6%. These
increases partially compensated for a volume decline in our
sparkling beverage category and our bulk water business.
Our reported consolidated revenues decreased 5.6%, driven
by the negative translation effect resulting from our use of
the SICAD II exchange rate to translate the results of our
Venezuelan operation.
In the face of structural changes and an exceptionally diffi-
cult consumer landscape—triggered mainly by increased tax-
es on most of our beverages in Mexico—our Mexico & Central
America division’s volume declined 1.8% for the year, totaling
1,919 million unit cases of beverages. Organically, excluding
the integration of Grupo Yoli in Mexico, our volumes in the
division decreased only 3.8%, underscoring the resilience of
our packaging portfolio amid a 16% price increase designed to
pass along the excise tax to our consumers in Mexico.
Our Mexico & Central America division’s total revenues
grew 1.8% to Ps. 72.0 billion. Organically, the division’s total
revenues decreased 0.5%, driven by the volume contraction
resulting from excise tax-related price increases in Mexico.
Our Mexico & Central America division’s operating income im-
proved 0.6% to Ps. 11.6 billion. Organically, the exemplary tight
control of expenses by our division’s management yielded flat
year-over-year operating expenses. On the same basis, our
operating income remained flat for the year, resulting in an
organic operating margin of 16.1% for 2014.
Our Mexico & Central America division’s operating cash flow
rose 7.1% to Ps. 16.3 billion. Organically, our operating cash
flow grew 5.9% to Ps. 16.1 billion. Consequently, our organic
operating cash flow margin expanded 140 basis points to
22.9% in 2014—a truly remarkable achievement, given the
circumstances faced during the year.
In Venezuela, despite the complex operating and consumer
environment, our volumes grew by an exceptional 8% reach-
ing 241 million unit cases in 2014. Our Venezuela revenues
declined 71.6% to Ps. 9.0 billion, driven by the negative trans-
lation effect resulting from our use of the SICAD II exchange
rate to translate the results of this operation. In local currency,
our revenue management initiatives enabled us to compen-
sate for inflation during the year. Due to the application of the
country’s official exchange rate to certain key imported raw
materials and to increased productivity levels, our operating
cash flow margin expanded significantly to 19.8%.
In a very challenging consumer and economic environment,
our South America division, excluding Venezuela, generated
22.3% volume growth for the year, reaching 1,258 million unit
cases of beverages, supported by the integration of our re-
cently acquired territories in Brazil. Organically, excluding the
integrated franchises of Companhia Fluminense and Spaipa,
our volumes increased 3.4%.
Our South America division’s total revenues, excluding Vene-
zuela, increased 23.4% to Ps. 66.4 billion, mainly supported by
revenue management initiatives in Brazil and Argentina, and
volume growth in Colombia and Brazil. Our beer revenues in
Brazil contributed Ps. 7.1 billion during the year.
Our South America division’s reported operating income,
excluding Venezuela, increased 31.7% to Ps. 7.9 billion. In local
currency, including the integration of Companhia Fluminense
and Spaipa in Brazil, we generated operating income growth
in both Brazil and Argentina. Our reported operating margin
expanded 70 basis points to 11.8%, and our organic operating
margin expanded 120 basis points to 12.3% for the year.
Our South America division’s reported operating cash flow,
excluding Venezuela, increased 27.0% to Ps. 10.3 billion. Our
reported operating cash flow margin expanded 40 basis points
to 15.5%, and our organic operating cash flow margin expand-
ed 110 basis points to 16.2% for the year.
In the Philippines, in the face of natural disasters that affected
the country’s infrastructure and, in part, our operations, we
MILLION U.S. DOLLARS INVESTED IN OUR BRAZILIAN INFRASTRUC-
TURE DURING THE YEAR.

39
2011 2012 2013 2014
19.3
18.3
18.918.8
continued to advance successfully on the thorough transfor-
mation of this franchise. We kept simplifying the portfolio,
while expanding the coverage of “Mismo,” our exceptionally
popular one-way PET presentations, and “Kasalo,” our at-
tractive returnable glass presentation. During the year, we
advanced the rollout of our new route to market, regaining di-
rect contact with our clients and achieving 7% volume growth
in these territories. Additionally, we continued investing in
our operation’s infrastructure, installing state-of-the-art,
high-speed bottling lines in our facilities, including two of the
fastest bottling lines in the world. Thanks to our initiatives,
our core sparkling beverage volume in the Philippines grew by
more than 8% over the course of the year.
Despite structural changes in recent years, such as the more
complex tax environment in Mexico and changes to the tax
and distribution landscape in Brazil, we continue to transform
our company’s talent and management capabilities and our
product portfolio and operations, while investing in our supply
chain infrastructure, our packaging innovation, and our route-
to-market and commercial models to meet our consumers’
ever-changing needs in the face of an evolving, challenging
market environment.
Going forward, our financial discipline, our team’s operating
strength and ability to adapt to the changing market dynam-
ics of our geographically diversified portfolio of territories,
and our company’s capacity to create a leaner, more agile,
and flexible organization will enable us to capture the long-
term growth opportunities that we envision in the beverage
industry.
We are proud to enjoy the opportunity to continue creating
sustainable value for you now and into the future. Thank you
for your continued trust and support in Coca-Cola FEMSA.
HÉCTOR TREVIÑO GUTIÉRREZChief Financial Officer
OPERATIVE CASH FLOW MARGIN%

40
FINANCIALSECTION
Financial Summary
Management’s Discussion and Analysis
Audit Committee Annual Report
Corporate Governance
Environmental Statement
Management’s Responsibility for Internal Control
Independent Auditors’ Report
Consolidated Statements of Financial Position
Consolidated Income Statements
Consolidated Statements of Comprehensive Income
Consolidated Statements of Changes in Equity
Consolidated Statements of Cash Flows
Notes to the Consolidated Financial Statements
Board Practices
Glossary
Directors and Officers
Shareholder Information
41
COCA-COLA FEMSA, S.A.B. DE C.V. AND SUBSIDIARIES
U.S. (*) 2014 2013 (3) 2012 (2) 2011 (1)
INCOME STATEMENTTotal revenues 9,987 147,298 156,011 147,739 123,224 Cost of goods sold 5,350 78,916 83,076 79,109 66,693 Gross profit 4,637 68,382 72,935 68,630 56,531 Operative expenses 3,176 46,850 51,315 46,440 37,233 Other expenses, net 11 158 623 952 1,375 Comprehensive financing result 436 6,422 3,773 1,246 1,129 Income before income taxes and share of the profit of associates and joint ventures accounted for using the equity method 1,014 14,952 17,224 19,992 16,794 Income taxes 262 3,861 5,731 6,274 5,667 Share of the profit of associates and joint ventures accounted for using the equity method, net of taxes (8) (125) 289 180 86 Consolidated net income 744 10,966 11,782 13,898 11,213 Equity holders of the parent 715 10,542 11,543 13,333 10,662 Non-controlling interest 29 424 239 565 551 RATIOS TO REVENUES (%) Gross margin 46.4 46.4 46.7 46.5 45.9 Net income margin 7.4 7.4 7.6 9.4 9.1 CASH FLOWSCash flow from operating activities 1,655 24,406 22,097 23,650 13,893 Capital expenditures (4) 767 11,313 11,703 10,259 7,862 Cash and cash equivalents 879 12,958 15,306 23,222 11,843 Marketable securities - - - 12 330 Total cash, cash equivalents and marketable securities 879 12,958 15,306 23,234 12,173 BALANCE SHEET Current assets 2,585 38,128 43,231 45,897 32,724 Investment in associates and joint ventures 1,175 17,326 16,767 5,352 3,656 Property, plant and equipment, net 3,426 50,527 51,785 42,517 38,102 Intangible assets, net 6,578 97,024 98,974 67,013 62,163 Deferred charges and other assets, net 634 9,361 5,908 5,324 5,093 Total Assets 14,398 212,366 216,665 166,103 141,738 Liabilities Short-term bank loans and notes payable 81 1,206 3,586 5,139 5,540 Interest payable 25 371 324 194 206 Other current liabilities 1,820 26,826 28,488 24,217 20,029 Long-term bank loans and notes payable 4,395 64,821 56,875 24,775 16,821 Other non-current liabilities 612 9,024 10,239 6,950 6,061 Total Liabilities 6,933 102,248 99,512 61,275 48,657 Equity 7,465 110,118 117,153 104,828 93,081 Non-controlling interest in consolidated subsidiaries 298 4,401 4,042 3,179 3,053 Equity attributable to equity holders of the parent 7,167 105,717 113,111 101,649 90,028 FINANCIAL RATIOS (%) Current 1.34 1.34 1.33 1.55 1.27 Leverage 0.93 0.93 0.85 0.58 0.52 Capitalization 0.38 0.38 0.35 0.23 0.20 Coverage 4.72 4.72 8.22 15.45 12.48 DATA PER SHARE Book Value (5) 3.457 50.999 54.566 50.060 45.344 Income tributable to the holders of the parent (6) 0.345 5.086 5.614 6.616 5.715 Dividends paid (7) 0.197 2.900 2.870 2.824 2.365 Headcount (8) 83,371 83,371 84,922 73,395 78,979
(1) Information considers full-year of KOF’s territories, three months of Administradora de Acciones del Noreste, S.A. de C.V. (“Grupo Tampico”) and one month of Corporación de los Angeles, S.A. de C.V (“Grupo CIMSA”).
(2) Information considers full-year of KOF’s territories and eight months of Grupo Fomento Queretano, S.A.P.I. (“Grupo Fomento Queretano”) (3) Information considers full-year of KOF’s territories and seven months of Grupo Yoli S.A de C.V. (Grupo YOLI), four months of Companhia Fluminense de Refriger-
antes (Compañía Fluminense) and two months of SPAIPA S.A. Industria Brasileira de Bebidas (SPAIPA)(4) Includes investments in property, plant and equipment, refrigeration equipment and returnable bottles and cases, net of disposals of property, plant and
equipment.(5) Based on 2,072.92 million ordinary shares as of December 31 2014 and 2013, 2,030.54 and 1,985.45 million ordinary shares as of December 31, 2012 and 2011,
respectively.(6) Computed based on the weighted average number of shares outstanding during the periods presented: 2,072.92, 2,056.20, 2,015.14 and 1,865.55 million on 2014,
2013, 2012 and 2011, respectively.(7) Dividends paid during the year based on the prior year’s net income, using 2,072.92 million oustanding ordinary shares on 2014 and 2013 and 2,030.54 and
1,846.53 million oustanding ordinary shares on 2012 and 2011, respectively.(8) Includes third-parties.(*) Exchange; rate as of the December 31st, 2014, Ps 14.75 per U.S. dollar, solely for the convenience of the reader.
FINANCIAL
SUMMARYAmounts expresed in millions of U.S. dollars and Mexican pesos, except data per share and headcount.
42
COCA-COLA FEMSA, S.A.B. DE C.V. AND SUBSIDIARIES
MANAGEMENT’S DISCUSSION AND
ANALYSISResults from Operations for the Year Ended December 31, 2014 Compared to the Year Ended December 31, 2013
CONSOLIDATED RESULTS
Total RevenuesOur reported consolidated total revenues decreased 5.6% to Ps. 147,298 million in 2014 driven by the negative translation
effect resulting from using the SICAD II exchange rate to translate the results of our Venezuelan operation. Excluding the
recently integrated territories of Companhia Fluminense de Refrigerantes (“Fluminense”) and Spaipa S.A. Industria Brasileira de
Bebidas (“Spaipa”) in Brazil and the integration of Grupo Yoli (“Yoli”) in Mexico, total revenues were Ps. 134,088. On a currency
neutral basis and excluding the non-comparable effect of Fluminense and Spaipa in Brazil, and Yoli in Mexico, total revenues
grew 24.7%, driven by average price per unit case growth in most operations and volume growth in Brazil, Colombia, Venezuela
and Central America.
Total sales volume increased 6.6% to 3,417.3 million unit cases in 2014, as compared to 2013. Excluding the integration of Yoli
in Mexico and Fluminense and Spaipa in Brazil, volumes declined 0.7% to 3,182.8 million unit cases, mainly due to the volume
contraction originated by the price increases implemented due to the excise tax in Mexico. On the same basis, the bottled water
portfolio grew 5.0%, driven by Crystal in Brazil, Aquarius and Bonaqua in Argentina, Nevada in Venezuela and Manantial in
Colombia. The still beverage category grew 1.9%, mainly driven by the performance of the Jugos del Valle line of business in
Colombia, Venezuela and Brazil, and Powerade across most of our territories. These increases partially compensated the
performance of our sparkling beverage category which declined 0.9% driven by the volume contraction in Mexico and a 3.5%
volume decline in our bulk water business.
Consolidated average price per unit case decreased 13.2% reaching Ps. 40.92 in 2014, as compared to Ps. 47.15 in 2013. This decline
was driven by the previously mentioned negative translation effect in Venezuela. In local currency, average price per unit case
increased in all of our territories, with the exception of Colombia.
Gross ProfitOur reported gross profit decreased 6.2% to Ps. 68,382 million in 2014. This decline was driven by the previously mentioned
negative translation effect in Venezuela. In local currency, lower sweetener and PET prices in most of our operations were offset
by the depreciation of the average exchange rate of the Argentine peso, the Brazilian real, the Colombian peso and the Mexican
peso as applied to our U.S. dollar-denominated raw material costs. Reported gross margin reached 46.4% in 2014.
The component of cost of goods sold include raw materials (principally soft drink concentrate sweeteners and packaging
materials), depreciation costs attributable to our production facilities, wages and other employment costs associated with labor
force employed at our production facilities and certain overhead costs. Concentrate prices are determined as a percentage
of the retail price of our products in the local currency, net of applicable taxes. Packaging materials, mainly polyethylene
terephthalate (“PET”) and aluminum, and High Fructose Corn Syrup (“HFCS”), used as a sweetener in some countries, are
denominated in U.S. dollars.
Administrative and Selling ExpensesAdministrative and selling expenses as a percentage of total revenues decreased 110 basis points to 31.8% in 2014 as compared
to 2013. Administrative and selling expenses in absolute terms decreased 8.7% mainly as a result of the lower contribution of
Venezuela, which was driven by the previously mentioned negative translation effect. In local currency, operating expenses
decreased as a percentage of revenues in most of our operations, despite of continued marketing investments across our
territories to support our marketplace execution and bolster our returnable presentation base, higher labor costs in Venezuela
and Argentina, and higher freight cost in Brazil and Venezuela.
43
COCA-COLA FEMSA, S.A.B. DE C.V. AND SUBSIDIARIES
During 2014, the other operative expenses line recorded an expense of Ps. 548 million, mainly due to (i) an operative currency
fluctuation effect in Venezuela recorded during the second quarter of 2014, (ii) operative currency fluctuation effects across the
operations in the fourth quarter of 2014, (iii) restructuring charges mainly in our Mexican operation and (iv) the loss on sale of
certain fixed assets.
The share of the profits of associates and joint ventures line recorded an expense of Ps. 125 million in 2014, mainly due to an
equity method loss from our participation in Coca-Cola FEMSA Philippines, Inc., which was partially compensated by equity
method gains from the non-carbonated joint-ventures in Brazil and Mexico.
Comprehensive Financing ResultThe term “comprehensive financing result” refers to the combined financial effects of net interest expenses, net financial foreign
exchange gains or losses, and net gains or losses on monetary position from the hyperinflationary countries in which we
operate. Net financial foreign exchange gains or losses represent the impact of changes in foreign-exchange rates on financial
assets or liabilities denominated in currencies other than local currencies and gains or losses resulting from derivative financial
instruments. A financial foreign exchange loss arises if a liability is denominated in a foreign currency that appreciates relative to
the local currency between the date the liability is incurred or the beginning of the period, whichever comes first, and the date it
is repaid or the end of the period, whichever comes first, as the appreciation of the foreign currency results in an increase in the
amount of local currency, which must be exchanged to repay the specified amount of the foreign currency liability.
Our comprehensive financing result in 2014 recorded an expense of Ps. 6,422 million as compared to an expense of Ps. 3,773
million in 2013. This increase was mainly driven by (i) a higher interest expenses due to a larger debt position and (ii) a foreign
exchange loss mainly as a result of the depreciation of the end-of-period exchange rate of the Mexican peso during the year, as
applied to a higher US dollar-denominated net debt position.
Income TaxesDuring 2014, income tax, as a percentage of income before taxes, was 25.8% as compared to 33.3% in 2013. The lower effective
tax rate registered during 2014 is mainly related to a one-time benefit resulting from the settlement of certain contingent tax
liabilities under the tax amnesty program offered by the Brazilian tax authorities, which was registered during the third quarter
of 2014.
Net Controlling Interest IncomeOur consolidated net controlling interest income reached Ps. 10,542 million in 2014 as compared to Ps. 11,543 million in 2013.
Earnings per share (“EPS”) in the full year of 2014 were 5.09 (Ps. 50.86 per ADS) computed on the basis of 2,072.9 million shares
outstanding (each ADS represents 10 local shares).
CONSOLIDATED RESULTS FROM OPERATIONS BY REPORTING SEGMENT
Mexico and Central AmericaTotal Revenues. Reported total revenues from our Mexico & Central America division increased 1.8% to Ps. 71,965 million in 2014,
as compared to 2013, driven by the integration of Yoli in our Mexican operation. Excluding the integration of Yoli, total revenues
decreased 0.5%, as a result of the volume contraction driven by the excise tax related price increase in Mexico.
Reported total sales volume decreased 1.8% to 1,918.5 million unit cases in 2014, as compared to 2013. Excluding the integration
of Yoli, total volume decreased 3.8%. On the same basis, the volume contraction in Mexico was partially compensated by a 5.1%
volume increase in Central America, mainly driven by growth in Nicaragua and Guatemala. Our water portfolio, including bulk
water, decreased 2.7%. Our sparkling beverage category decreased 3.9% and our still beverage category decreased 6.9%.
Total sales volume in Mexico decreased 2.4% to 1,754.9 million unit cases, as compared to 1,798.0 million unit cases in 2013.
Excluding the integration of Yoli, total volume decreased 4.6%. The volume contraction in our Mexican operation was driven
by the price increase implemented in the country as a result of the excise tax on sugary beverages. Organic sales volume of
our sparkling beverage portfolio decreased 4.8%. Our bottled water portfolio and bulk water business decreased 2.3% and 3.2%
respectively. The still beverage portfolio decreased 8.8%.
Total sales volume in Central America increased 5.1% to 163.6 million unit cases, as compared to 155.6 million unit cases in 2013.
The sales volume of our sparkling beverage portfolio grew 5.0% supported by the strong performance of the Coca-Cola brand
in Guatemala and Nicaragua. Sales volume in the still beverage category increased 3.9%, due to the performance of Powerade in
Guatemala and Panamá, and Hi-C in Nicaragua. The bottled water business, including bulk water, grew 11.4%.

44
COCA-COLA FEMSA, S.A.B. DE C.V. AND SUBSIDIARIES
Gross Profit. Our reported gross profit increased 4.3% to Ps. 36,453 million in 2014 as compared to 2013. Lower sweetener and PET
prices in the division were partially offset by the depreciation of the average exchange rate of most of our division’s currencies
as applied to our U.S. dollar-denominated raw material costs. Reported gross margin reached 50.7% in 2014, an expansion of 122
basis points as compared to the previous year.
Administrative and Selling Expenses. Administrative and selling expenses as a percentage of total revenues increased 30 basis
points to 33.4% in 2014, as compared with the same period in 2013. Administrative and selling expenses in absolute terms
increased 2.9%, as compared to 2013. Excluding the non-comparable effect of the integration of Yoli, administrative and selling
expenses were flat as compared to the previous year due to a tight control of expenses.
South America (excluding Venezuela)Total Revenues. Reported total revenues were Ps. 66,367 million in 2014, an increase of 23.4%, as compared to 2013, mainly
driven by the integration of the new territories in Brazil; average price per unit case increases in local currency in Argentina and
Brazil, and volume growth in Colombia and Brazil (excluding the acquired territories). Excluding beer, which accounted for Ps.
7,117.7 million, total revenues increased 17.8% as compared to 2013. Excluding the integration of Fluminense and Spaipa, total
revenues grew 1.8%.
Total sales volume in our South America division, excluding Venezuela, increased 22.3% to 1,257.7 million unit cases in 2014, as
compared to 2013, as a result of growth in Brazil and Colombia, which compensated for a volume decline in Argentina. Excluding
the non-comparable effect of Fluminense and Spaipa, volumes grew 3.5%, as compared to 2013. On the same basis, the still
beverage portfolio grew 15.5%, mainly driven by the Jugos del Valle line of business in Colombia and Brazil, and the performance
of Powerade in Argentina and Colombia. Our bottled water portfolio, including bulk water increased 7.7%, mainly driven by
Crystal in Brazil and Aquarius and Bonaqua in Argentina. The sparkling beverage portfolio increased 2.1, as compared to 2013.
Total sales volume in Colombia increased 8.2% to 298.4 million unit cases in 2014, as compared to 275.7 million unit cases in 2013.
The sales volume in the sparkling beverage category grew 8.1%, mainly driven by a 7.2% increase of the Coca-Cola brand. Sales
volume in the still beverage category increased 34.8%, mainly driven by del Valle Fresh and Fuze tea. The bottled water business,
including bulk water, decreased 2.2% driven by Brisa bulk water.
Total sales volume in Argentina decreased 0.6% to 225.7 million unit cases in 2014, as compared to 227.1 million unit cases in
2013. The sales volume in the sparkling beverage category decreased 2.5%. Sales volume in the still beverage category increased
7.5%, mainly driven by Powerade. The bottled water business increased 18.3% driven by Aquarius and Bonaqua.
Reported total sales volume in Brazil increased 39.7% to 733.5 million unit cases in 2014, as compared to 525.2 million unit
cases in 2013. Excluding the integration of Fluminense and Spaipa, volume grew 2.7% to 539.5 million unit cases in 2014. On
the same basis sales volume in the bottled water business, including bulk water, increased 18.7%. The sales volume in the still
beverages category increased 2.7% due to the performance of the Jugos del Valle line of business and the sparkling beverage
category increased 1.6%.
Gross Profit. Gross profit reached Ps. 27,372 million, an increase of 22.3% in 2014, as compared to 2013. In local currency, cost of
goods sold increased as a result of the depreciation of the average exchange rate of the Argentine peso, the Brazilian real and
the Colombian peso as applied to our U.S. dollar-denominated raw material costs, which were partially compensated by lower
PET prices in Colombia and Argentina, and lower sweetener prices in Argentina and Brazil. Reported gross margin reached
41.2% in 2014.
Administrative and Selling Expenses. Administrative and selling expenses as a percentage of total revenues decreased 110 basis
points to 29.3% in 2014, as compared to 2013. Administrative and selling expenses in absolute terms increased 18.9%, as compared
to 2013. Excluding the non-comparable effect of Spaipa and Fluminense in Brazil, administrative and selling expenses remained
flat as compared to the previous year, despite of higher freight cost in Brazil, higher labor cost in Argentina, and increased
marketing investments in the division to support our marketplace execution and bolster our returnable packaging base in Brazil.
45
COCA-COLA FEMSA, S.A.B. DE C.V. AND SUBSIDIARIES
VenezuelaTotal Revenues. Total revenues in Venezuela reached Ps. 8,966 million in 2014, a decrease of 71.6% as compared to 2013. This
result was driven by the negative translation effect resulting from using the SICAD II exchange rate to convert the results of the
operation into Mexican pesos. Average price per unit case was Ps. 37.18 in 2014, a decrease of 73.7% as compared to 2013. On a
currency neutral basis, our revenues in Venezuela increased by 100.3%.
Total sales volume increased 8.2% to 241.1 million unit cases in 2014, as compared to 222.9 million unit cases in 2013. The sales
volume in the sparkling beverage category grew 8.4%, driven by the strong performance of the Coca-Cola brand, which grew
15.9%. The still beverage category increased 12.0%, due to the performance of the del Valle Fresh orangeade, Powerade and Kapo.
The bottled water business, including bulk water, grew 1.5%.
Gross Profit. Gross profit was Ps. 4,557 million in 2014, a decrease of 70.8% as compared to 2013, driven by the negative
translation effect resulting from using the SICAD II exchange rate to convert the results of the operation into Mexican pesos.
In local currency, cost of goods sold increased mainly driven by higher sugar prices. Gross margin expanded 132 basis points
reaching 50.8% in 2014.
Administrative and Selling Expenses. Administrative and selling expenses as a percentage of total revenues decreased 150
basis points to 35.1% in 2014, as compared to 2013. Administrative and selling expenses in absolute terms decreased 72.7%, as
compared to 2013, due to the previously mentioned negative currency translation effect. In local currency, administrative and
selling expenses grew ahead of inflation as a consequence of higher labor and freight cost in the country.
46
COCA-COLA FEMSA, S.A.B. DE C.V. AND SUBSIDIARIES
CORPORATE GOVERNANCE
Coca-Cola FEMSA prides itself on its standards of corporate governance and the accuracy of its disclosures. Our corporate governance practices
are governed by our bylaws, the Mexican Securities Market Law and the regulations issued by the CNBV. We also disclose the extent to which we
comply with the Código de Mejores Prácticas Corporativas (Mexican Code of Best Corporate Practices), which was created by a group of Mexican
business leaders and was endorsed by the BMV. We apply the same strict standards accross our operations, including our new operations, and
will continue to do so. We believe that the independence of our directors provides an invaluable contribution to the decision-making process in
our corporation and to shareholder value protection.
ENVIRONMENTAL STATEMENT
Coca-Cola FEMSA is dedicated to the principles of sustainable development. While the Company’s environmental impact is small, Coca-Cola
FEMSA is committed to managing that impact in a positive manner. Compliance, waste minimization, pollution prevention and continuous
improvement are hallmarks of the Company’s environmental management system. The Company has achieved significant progress in
areas such as recovery and recycling, water and energy conservation and wastewater quality. These efforts simultaneously help Coca-Cola
FEMSA to protect the environment and to develop its business. For more information on our commitment to sustainable development, visit
www.coca-colafemsa.com.
MANAGEMENT’S RESPONSIBILITY FOR INTERNAL CONTROL
The management of Coca-Cola FEMSA is responsible for the preparation and integrity of the accompanying consolidated financial statements
and for maintaining a system of internal control. These checks and balances serve to provide reasonable assurance to shareholders, to the
financial community, and to other interested parties that transactions are executed in accordance with management authorization, that
accounting records are reliable as a basis for the preparation of the consolidated financial statements, and that assets are safeguarded against
loss from unauthorized use or disposition.
In fulfilling its responsibilities for the integrity of financial information, management maintains and relies on the Company’s system of internal
control. This system is based on an organizational structure that efficiently delegates responsibilities and ensures the selection and training
of qualified personnel. In addition, it includes policies, which are communicated to all personnel through appropriate channels. This system of
internal control is supported by an ongoing internal audit function that reports its findings to management throughout the year. Management
believes that to date, the internal control system of the Company has provided reasonable assurance that material errors or irregularities have
been prevented or detected and corrected promptly.
47
COCA-COLA FEMSA, S.A.B. DE C.V. AND SUBSIDIARIES
TO THE BOARD OF DIRECTORS COCA COLA FEMSA, S.A.B. DE C.V. (THE ¨COMPANY¨):
Pursuant to Articles 42 and 43 of the Mexican Securities Law (Ley del Mercado de Valores) and the Charter of the Audit Committee, we
submit to the Board of Directors our report on the activities performed during, 2014. We considered the recommendations established in
the Code of Corporate Best Practices and, since the Company is a publicly-listed company in the New York Stock Exchange (¨NYSE¨), we also
complied with the applicable provisions set forth in Sarbanes-Oxley Act. We met at least on a quarterly basis and, based on a work program,
we carried out the activities described below:
RISK ASSESSMENTWe periodically evaluated the effectiveness of the Enterprise Risk Management Process, which is established to identify, measure, record,
assess, and manage the Company´s risks, as well as for the implementation of follow-up measures to ensure its effective operation.
We reviewed with the Management and both External and Internal Auditors of the Company, the key risk factors that could adversely affect
the Company´s operations and assets, and we determined that they have been appropriately identified, managed, and considered in both audit
programs.
INTERNAL CONTROLWe verified the compliance by management of its responsibilities regarding internal control, and the establishment of general guidelines and
the procedures necessary for their application and compliance. Additionally, we followed the comments and remarks made in this regard by
External Auditors as a result of their findings.
We verified the actions taken by the Company in order to comply with section 404 of Sarbanes-Oxley Act regarding the self-assessment
of internal controls performed by the Company to be reported for the year 2014. Throughout this process, we verified the preventive and
corrective measures implemented.
EXTERNAL AUDITWe recommended to the Board of Directors the appointment of the external auditors (who have been the same for the past seven years) for the
Company and its subsidiaries for fiscal year 2014. For this purpose, we verified their independence and their compliance with the requirements
established by applicable laws and regulations. We analyzed their approach, work program as well as their coordination with Internal Audit.
We were in permanent and direct communication with them to be timely informed of their progress and their observations, and also to consider
any comments that resulted from their review of the quarterly financial statements. We were timely informed of their conclusions and reports,
regarding the annual financial statements and followed up on the actions implemented resulting from the findings and recommendations
provided during the year.
We authorized the fees of the external auditors for their annual audit and other permitted services, and verify that such services would not
compromise their Independence.
With the appropriate input from Management, we carried out an evaluation of their services for the previous year and initiated the evaluation
process for fiscal year 2014.
INTERNAL AUDITINGIn order to maintain its independence and objectivity, the Internal Audit area reports to the Audit Committee therefore:
We reviewed and approved the annual work program and budget, in order to comply with the requirements of Sarbanes-Oxley Act. For its
preparation, the Internal Audit area participated in the risk assessment process and the validation of the internal control system.
We received periodic reports regarding the progress of the approved work program, any deviations and the causes thereof.
We followed up the implementation of the observations developed by Internal Audit.
We confirmed the existence of an Annual Training program.
We reviewed and discuss with the responsible of the IA function the evaluations of the Internal Audit service performed by the responsible of
each business unit and the Audit Committee.
ANNUAL REPORT
OF THE AUDIT COMMITTEE
48
FINANCIAL INFORMATION, ACCOUNTING POLICIES AND REPORTS TO THE THIRD PARTIESWe reviewed the quarterly and annual financial statements of the Company with the individuals responsible for its preparation and
recommended to the Board of Directors, its approval and authorize its publication. As part of this process, we consider account the comments of
the external auditors and confirm the criteria, accounting policies and information used by Management to prepare financial information were
adequate, sufficient, and consistently applied with the prior year. As a consequence, the information submitted by Management reasonably
reflects the financial position of the Company, its operating results and cash flows for the fiscal year ending on December 31, 2014.
We also reviewed the quarterly reports prepared by Management and submitted to shareholders and the financial community, verifying that
such information was prepared under International Financial Reporting Standards (IFRS) and the same accounting criteria for preparing the
annual information. We also reviewed the existence of an integral process that provides a reasonable assurance of fairness in the information
content. To conclude, we recommended to the Board to authorize the release of such information.
Our reviews also included reports and any other financial information required by Mexican and United States regulatory authorities.
We reviewed and approved the changes to the accounting standards used by the Company that became effective in 2014, recommending their
approval to the Board of Directors.
COMPLIANCE WITH APPLICABLE LAWS AND REGULATIONS, LEGAL ISSUES AND CONTINGENCIESWe verified the existence and reliability of the Company-established controls to ensure compliance with the various legal provisions applicable
to the Company. When required, we verified its appropriate disclosure in the financial reports.
We made periodic reviews of the various tax, legal and labor contingencies of the Company. We supervised the efficiency of the procedures
established for their identification and follow-up, as well as their adequate disclosure and recording.
CODE OF CONDUCTWe reviewed the new version of the Business Code of Ethics of the Company which incorporates among other changes an update of its values,
validating that it includes a compliance provision with the Anti-Money Laundering laws in the countries where we operate, as well as compliance
with anti corruption laws (FCPA) recommending its approval to the Board of Directors.
With the support of Internal Audit and other departments of the company, we verified the compliance of the Business Code of Ethics, the
existence of adequate processes to update it and its communication to employees, as well as the application of sanctions in those cases where
violations were detected.
We reviewed the complaints received in the Company´s Whistle-Blowing System and followed up on their correct and timely handling.
ADMINISTRATIVE ACTIVITIES We held regular meetings with Management to be informed of any relevant or unusual activities and events. We also met individually with
external and internal auditors to review their work, and observations.
In those cases where we deemed advisable, we requested the support and opinion from independent experts. We are not aware of any significant
non-compliance with the operating policies, the internal control system or the accounting records of the Company.
We held executive meetings and when applicable reviewed with management our resolutions.
We submitted quarterly reports to the Board of Directors, on the activities performed by the Committee.
We reviewed the Audit Committee Charter and made the amendments that we deemed appropriate, submitting such changes for its approval
by the Board of Directors.
We verified that the financial expert of the Committee meets the technical background and experience requirements to be considered as such,
and that each Committee Member meets the independence requirements set forth in by the applicable laws and regulations.
Our activities were duly documented in the minutes prepared for each meeting. Such minutes were properly reviewed and approved by
Committee members.
We made our annual performance self-assessment, and submitted the results to the Chairman of the Board of Directors.
Sincerely
José Manuel Canal HernandoFebruary 24, 2015
COCA-COLA FEMSA, S.A.B. DE C.V. AND SUBSIDIARIES
49
COCA-COLA FEMSA, S.A.B. DE C.V. AND SUBSIDIARIES
INDEPENDENT
AUDITOR’S REPORT
THE BOARD OF DIRECTORS AND SHAREHOLDERS OF COCA-COLA FEMSA, S.A.B. DE C.V.Report on the Consolidated Financial StatementsWe have audited the accompanying consolidated financial statements of Coca-Cola FEMSA, S.A.B. de C.V. and its subsidiaries, which comprise
the consolidated statements of financial position as at December 31, 2014 and 2013, and the consolidated income statements, consolidated
statements of comprehensive income, consolidated statements of changes in equity and consolidated statements of cash flows for each of the
three years in the period ended December 31, 2014, and a summary of significant accounting policies and other explanatory information.
Management’s Responsibility for the Consolidated Financial StatementsManagement is responsible for the preparation and fair presentation of these consolidated financial statements in accordance with International
Financial Reporting Standards, and for such internal control as management determines is necessary to enable the preparation of consolidated
financial statements that are free from material misstatement, whether due to fraud or error.
Auditor’s ResponsibilityOur responsibility is to express an opinion on these consolidated financial statements based on our audits. We conducted our audits in accordance
with International Standards on Auditing. Those standards require that we comply with ethical requirements and plan and perform the audit to
obtain reasonable assurance about whether the consolidated financial statements are free from material misstatement.
An audit involves performing procedures to obtain audit evidence about the amounts and disclosures in the consolidated financial statements.
The procedures selected depend on the auditor’s judgment, including the assessment of the risks of material misstatement of the consolidated
financial statements, whether due to fraud or error. In making those risk assessments, the auditor considers internal control relevant to the
entity’s preparation and fair presentation of the consolidated financial statements in order to design audit procedures that are appropriate in
the circumstances, but not for the purpose of expressing an opinion on the effectiveness of the entity’s internal control. An audit also includes
evaluating the appropriateness of accounting policies used and the reasonableness of accounting estimates made by management, as well as
evaluating the overall presentation of the consolidated financial statements.
We believe that the audit evidence we have obtained is sufficient and appropriate to provide a basis for our audit opinion.
OpinionIn our opinion, the consolidated financial statements present fairly, in all material respects, the financial position of Coca-Cola FEMSA, S.A.B. de
C.V. and its subsidiaries as at December 31, 2014 and 2013, and the consolidated income statements, consolidated statements of comprehensive
income, consolidated statements of changes in equity and consolidated statements of cash flows for each of the three years in the period ended
December 31, 2014, in accordance with International Financial Reporting Standards as issued by the International Accounting Standards Board.
Mancera, S.C. A member practice of Ernst & Young Global
Adan Aranda Suarez
February 24, 2015
Mexico City, MEXICO

50
COCA-COLA FEMSA, S.A.B. DE C.V. AND SUBSIDIARIES
CONSOLIDATED STATEMENTS OF
FINANCIAL POSITION
DECEMBER DECEMBER DECEMBER NOTE 2014 (*) 2014 2013
ASSETS
Current assets:
Cash and cash equivalents 5 $ 879 Ps. 12,958 Ps. 15,306
Accounts receivable, net 6 701 10,339 9,958
Inventories 7 530 7,819 9,130
Recoverable taxes 277 4,082 4,120
Other current financial assets 8 105 1,544 3,134
Other current assets 8 93 1,386 1,583
Total current assets 2,585 38,128 43,231
Non-current assets:
Investments in associates and joint ventures 9 1,175 17,326 16,767
Property, plant and equipment, net 10 3,426 50,527 51,785
Intangible assets, net 11 6,578 97,024 98,974
Deferred tax assets 23 200 2,956 1,326
Other non-current financial assets 12 214 3,160 1,319
Other non-current assets, net 12 220 3,245 3,263
Total non-current assets 11,813 174,238 173,434
TOTAL ASSETS $ 14,398 Ps. 212,366 Ps. 216,665
At December 31, 2014 and 2013Amounts expressed in millions of U.S. dollars ( $ ) and in millions of Mexican pesos ( Ps.)

51
COCA-COLA FEMSA, S.A.B. DE C.V. AND SUBSIDIARIES
DECEMBER DECEMBER DECEMBER NOTE 2014 (*) 2014 2013
LIABILITIES AND EQUITY
Current liabilities:
Bank loans and notes payable 17 $ 20 Ps. 301 Ps. 495
Current portion of non-current debt 17 61 905 3,091
Interest payable 25 371 324
Suppliers 959 14,151 16,220
Accounts payable 363 5,336 4,950
Taxes payable 370 5,457 5,575
Other current financial liabilities 24 128 1,882 1,743
Total current liabilities 1,926 28,403 32,398
Non-current liabilities:
Bank loans and notes payable 17 4,395 64,821 56,875
Post-employment and other non-current employee benefits 15 158 2,324 2,555
Deferred tax liabilities 23 74 1,085 887
Other non-current financial liabilities 24 20 288 1,263
Provisions and other non-current liabilities 24 360 5,327 5,534
Total non-current liabilities 5,007 73,845 67,114
Total liabilities 6,933 102,248 99,512
Equity:
Capital stock 21 139 2,048 2,048
Additional paid-in capital 2,813 41,490 41,490
Retained earnings 5,059 74,624 70,094
Cumulative other comprehensive (loss) income (844) (12,445) (521)
Equity attributable to equity holders of the parent 7,167 105,717 113,111
Non-controlling interest in consolidated subsidiaries 20 298 4,401 4,042
Total equity 7,465 110,118 117,153
TOTAL LIABILITIES AND EQUITY $ 14,398 Ps. 212,366 Ps. 216,665
(*) Convenience translation to U.S. dollars ($) – See Note 2.2.3The accompanying notes are an integral part of these consolidated statements of financial position.
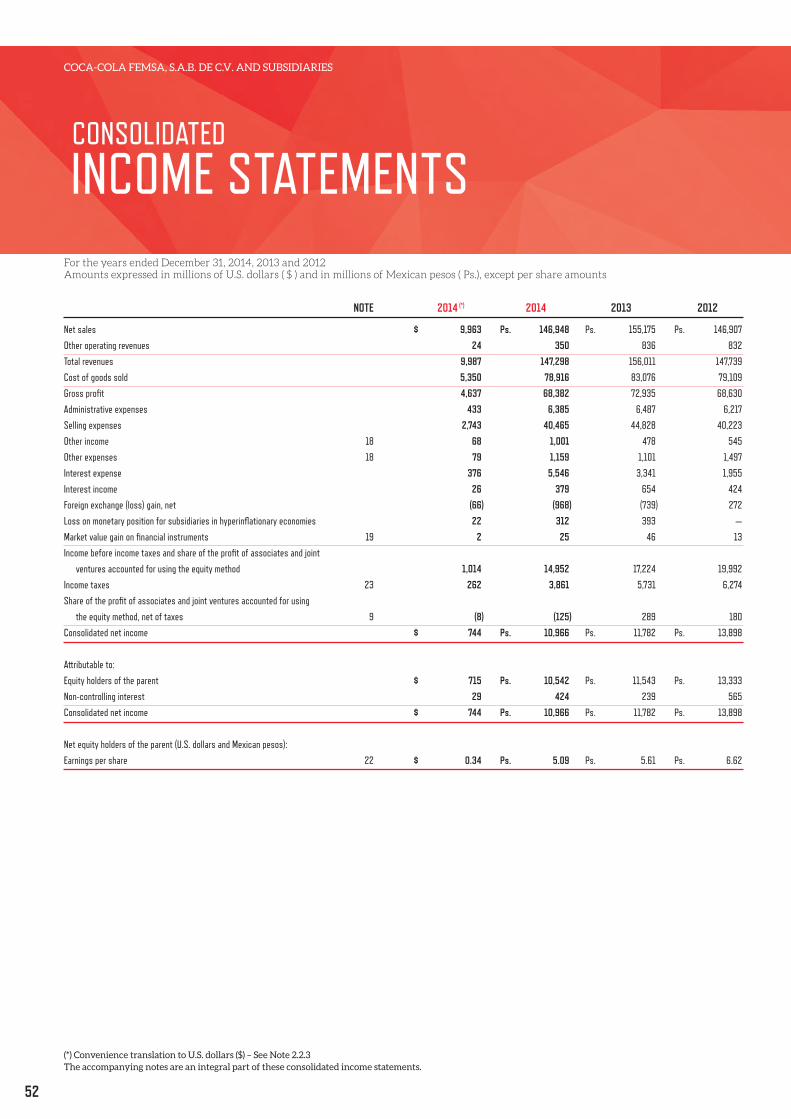
52
COCA-COLA FEMSA, S.A.B. DE C.V. AND SUBSIDIARIES
For the years ended December 31, 2014, 2013 and 2012Amounts expressed in millions of U.S. dollars ( $ ) and in millions of Mexican pesos ( Ps.), except per share amounts
CONSOLIDATED
INCOME STATEMENTS
NOTE 2014 (*) 2014 2013 2012
Net sales $ 9,963 Ps. 146,948 Ps. 155,175 Ps. 146,907
Other operating revenues 24 350 836 832
Total revenues 9,987 147,298 156,011 147,739
Cost of goods sold 5,350 78,916 83,076 79,109
Gross profit 4,637 68,382 72,935 68,630
Administrative expenses 433 6,385 6,487 6,217
Selling expenses 2,743 40,465 44,828 40,223
Other income 18 68 1,001 478 545
Other expenses 18 79 1,159 1,101 1,497
Interest expense 376 5,546 3,341 1,955
Interest income 26 379 654 424
Foreign exchange (loss) gain, net (66) (968) (739) 272
Loss on monetary position for subsidiaries in hyperinflationary economies 22 312 393 —
Market value gain on financial instruments 19 2 25 46 13
Income before income taxes and share of the profit of associates and joint
ventures accounted for using the equity method 1,014 14,952 17,224 19,992
Income taxes 23 262 3,861 5,731 6,274
Share of the profit of associates and joint ventures accounted for using
the equity method, net of taxes 9 (8) (125) 289 180
Consolidated net income $ 744 Ps. 10,966 Ps. 11,782 Ps. 13,898
Attributable to:
Equity holders of the parent $ 715 Ps. 10,542 Ps. 11,543 Ps. 13,333
Non-controlling interest 29 424 239 565
Consolidated net income $ 744 Ps. 10,966 Ps. 11,782 Ps. 13,898
Net equity holders of the parent (U.S. dollars and Mexican pesos):
Earnings per share 22 $ 0.34 Ps. 5.09 Ps. 5.61 Ps. 6.62
(*) Convenience translation to U.S. dollars ($) – See Note 2.2.3The accompanying notes are an integral part of these consolidated income statements.
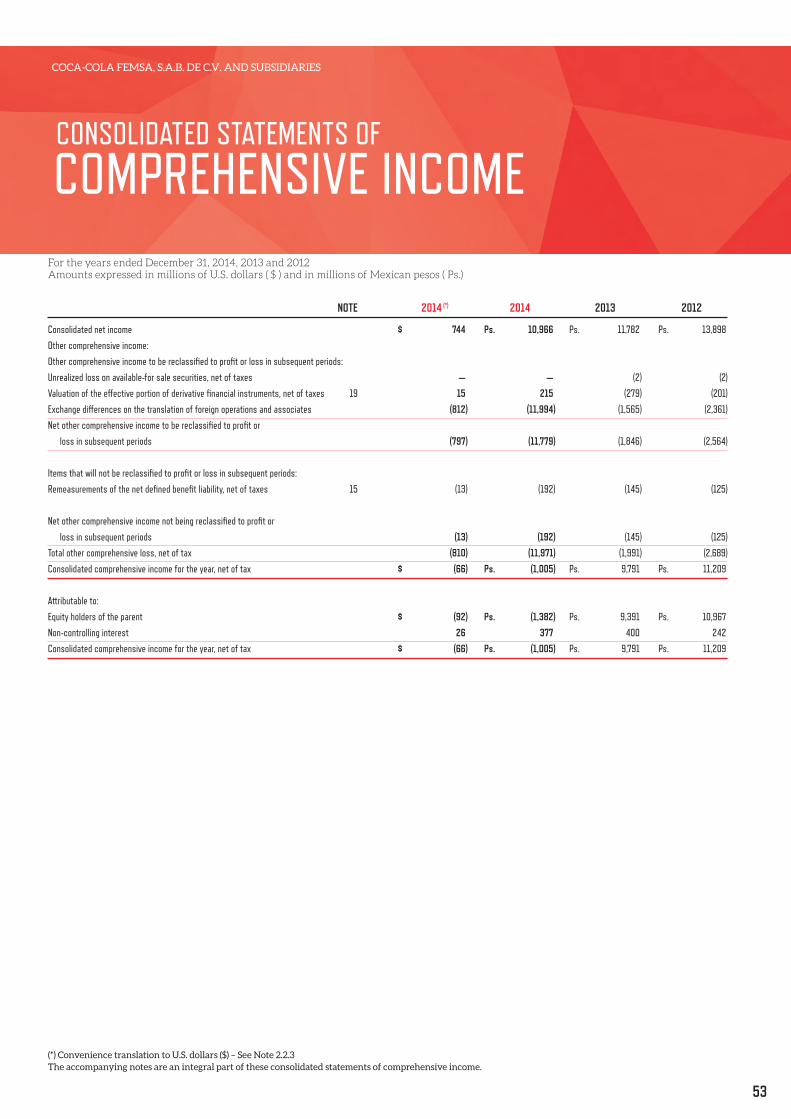
53
COCA-COLA FEMSA, S.A.B. DE C.V. AND SUBSIDIARIES
NOTE 2014 (*) 2014 2013 2012
Consolidated net income $ 744 Ps. 10,966 Ps. 11,782 Ps. 13,898
Other comprehensive income:
Other comprehensive income to be reclassified to profit or loss in subsequent periods:
Unrealized loss on available-for sale securities, net of taxes — — (2) (2)
Valuation of the effective portion of derivative financial instruments, net of taxes 19 15 215 (279) (201)
Exchange differences on the translation of foreign operations and associates (812) (11,994) (1,565) (2,361)
Net other comprehensive income to be reclassified to profit or
loss in subsequent periods (797) (11,779) (1,846) (2,564)
Items that will not be reclassified to profit or loss in subsequent periods:
Remeasurements of the net defined benefit liability, net of taxes 15 (13) (192) (145) (125)
Net other comprehensive income not being reclassified to profit or
loss in subsequent periods (13) (192) (145) (125)
Total other comprehensive loss, net of tax (810) (11,971) (1,991) (2,689)
Consolidated comprehensive income for the year, net of tax $ (66) Ps. (1,005) Ps. 9,791 Ps. 11,209
Attributable to:
Equity holders of the parent $ (92) Ps. (1,382) Ps. 9,391 Ps. 10,967
Non-controlling interest 26 377 400 242
Consolidated comprehensive income for the year, net of tax $ (66) Ps. (1,005) Ps. 9,791 Ps. 11,209
(*) Convenience translation to U.S. dollars ($) – See Note 2.2.3The accompanying notes are an integral part of these consolidated statements of comprehensive income.
CONSOLIDATED STATEMENTS OF
COMPREHENSIVE INCOMEFor the years ended December 31, 2014, 2013 and 2012Amounts expressed in millions of U.S. dollars ( $ ) and in millions of Mexican pesos ( Ps.)

54
COCA-COLA FEMSA, S.A.B. DE C.V. AND SUBSIDIARIES
For the years ended December 31, 2014, 2013 and 2012Amounts expressed in millions of U.S. dollars ( $ ) and in millions of Mexican pesos ( Ps.)
CONSOLIDATED STATEMENTS OF
CHANGES IN EQUITY
VALUATION OF THE EFFECTIVE EXCHANGE EQUITY UNREALIZED PORTION OF DIFFERENCES ON REMEASUREMENTS ATTRIBUTABLE ADDITIONAL GAIN ON DERIVATIVE TRANSLATION OF OF THE NET TO EQUITY NON- PAID-IN RETAINED AVAILABLE-FOR- FINANCIAL FOREIGN OPERATIONS DEFINED BENEFIT HOLDERS OF CONTROLLING ATTRIBUTABLE TO: CAPITAL STOCK CAPITAL EARNINGS SALE SECURITIES INSTRUMENTS AND ASSOCIATES LIABILITY THE PARENT INTEREST TOTAL EQUITY
Balances at January 1, 2012 Ps. 2,009 Ps. 27,230 Ps. 56,792 Ps. 4 Ps. 44 Ps. 4,073 Ps. (124) Ps. 90,028 Ps. 3,053 Ps. 93,081
Net income — — 13,333 — — — — 13,333 565 13,898
Other comprehensive income, net of tax — — — (2) (179) (2,054) (131) (2,366) (323) (2,689)
Total comprehensive income — — 13,333 (2) (179) (2,054) (131) 10,967 242 11,209
Dividends declared — — (5,624) — — — — (5,624) (109) (5,733)
Acquisition of Grupo Fomento Queretano 20 6,258 — — — — — 6,278 — 6,278
Acquisition of non-controlling interest — — — — — — — — (7) (7)
Balances at December 31, 2012 2,029 33,488 64,501 2 (135) 2,019 (255) 101,649 3,179 104,828
Net income — — 11,543 — — — — 11,543 239 11,782
Other comprehensive income, net of tax — — — (2) (233) (1,777) (140) (2,152) 161 (1,991)
Total comprehensive income — — 11,543 (2) (233) (1,777) (140) 9,391 400 9,791
Increase in share of non-controlling interest — — — — — — — — 515 515
Dividends declared — — (5,950) — — — — (5,950) (52) (6,002)
Acquisition of Grupo Yoli 19 8,002 — — — — — 8,021 — 8,021
Balances at December 31, 2013 2,048 41,490 70,094 — (368) 242 (395) 113,111 4,042 117,153
Net income — — 10,542 — — — — 10,542 424 10,966
Other comprehensive income, net of tax — — — — 220 (11,973) (171) (11,924) (47) (11,971)
Total comprehensive income — — 10,542 — 220 (11,973) (171) (1,382) 377 (1,005)
Dividends declared — — (6,012) — — — — (6,012) (18) (6,030)
Balances at December 31, 2014 Ps. 2,048 Ps. 41,490 Ps. 74,624 Ps. — Ps. (148) Ps. (11,731) Ps. (566) Ps. 105,717 Ps. 4,401 Ps. 110,118
(*) Convenience translation to U.S. dollars ($) – See Note 2.2.3The accompanying notes are an integral part of these consolidated statements of changes in equity.

55
COCA-COLA FEMSA, S.A.B. DE C.V. AND SUBSIDIARIES
VALUATION OF THE EFFECTIVE EXCHANGE EQUITY UNREALIZED PORTION OF DIFFERENCES ON REMEASUREMENTS ATTRIBUTABLE ADDITIONAL GAIN ON DERIVATIVE TRANSLATION OF OF THE NET TO EQUITY NON- PAID-IN RETAINED AVAILABLE-FOR- FINANCIAL FOREIGN OPERATIONS DEFINED BENEFIT HOLDERS OF CONTROLLING ATTRIBUTABLE TO: CAPITAL STOCK CAPITAL EARNINGS SALE SECURITIES INSTRUMENTS AND ASSOCIATES LIABILITY THE PARENT INTEREST TOTAL EQUITY
Balances at January 1, 2012 Ps. 2,009 Ps. 27,230 Ps. 56,792 Ps. 4 Ps. 44 Ps. 4,073 Ps. (124) Ps. 90,028 Ps. 3,053 Ps. 93,081
Net income — — 13,333 — — — — 13,333 565 13,898
Other comprehensive income, net of tax — — — (2) (179) (2,054) (131) (2,366) (323) (2,689)
Total comprehensive income — — 13,333 (2) (179) (2,054) (131) 10,967 242 11,209
Dividends declared — — (5,624) — — — — (5,624) (109) (5,733)
Acquisition of Grupo Fomento Queretano 20 6,258 — — — — — 6,278 — 6,278
Acquisition of non-controlling interest — — — — — — — — (7) (7)
Balances at December 31, 2012 2,029 33,488 64,501 2 (135) 2,019 (255) 101,649 3,179 104,828
Net income — — 11,543 — — — — 11,543 239 11,782
Other comprehensive income, net of tax — — — (2) (233) (1,777) (140) (2,152) 161 (1,991)
Total comprehensive income — — 11,543 (2) (233) (1,777) (140) 9,391 400 9,791
Increase in share of non-controlling interest — — — — — — — — 515 515
Dividends declared — — (5,950) — — — — (5,950) (52) (6,002)
Acquisition of Grupo Yoli 19 8,002 — — — — — 8,021 — 8,021
Balances at December 31, 2013 2,048 41,490 70,094 — (368) 242 (395) 113,111 4,042 117,153
Net income — — 10,542 — — — — 10,542 424 10,966
Other comprehensive income, net of tax — — — — 220 (11,973) (171) (11,924) (47) (11,971)
Total comprehensive income — — 10,542 — 220 (11,973) (171) (1,382) 377 (1,005)
Dividends declared — — (6,012) — — — — (6,012) (18) (6,030)
Balances at December 31, 2014 Ps. 2,048 Ps. 41,490 Ps. 74,624 Ps. — Ps. (148) Ps. (11,731) Ps. (566) Ps. 105,717 Ps. 4,401 Ps. 110,118
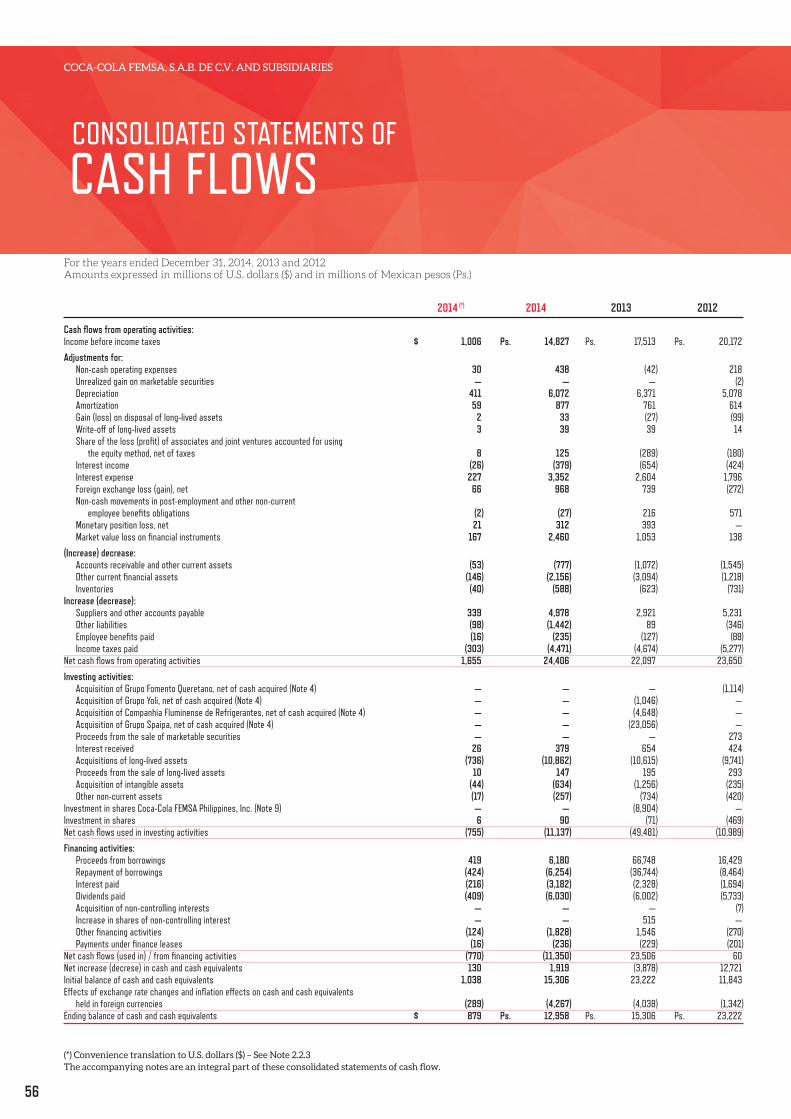
56
COCA-COLA FEMSA, S.A.B. DE C.V. AND SUBSIDIARIES
For the years ended December 31, 2014, 2013 and 2012Amounts expressed in millions of U.S. dollars ($) and in millions of Mexican pesos (Ps.)
CONSOLIDATED STATEMENTS OF
CASH FLOWS
2014 (*) 2014 2013 2012
Cash flows from operating activities:Income before income taxes $ 1,006 Ps. 14,827 Ps. 17,513 Ps. 20,172
Adjustments for: Non-cash operating expenses 30 438 (42) 218 Unrealized gain on marketable securities — — — (2) Depreciation 411 6,072 6,371 5,078 Amortization 59 877 761 614 Gain (loss) on disposal of long-lived assets 2 33 (27) (99) Write-off of long-lived assets 3 39 39 14 Share of the loss (profit) of associates and joint ventures accounted for using the equity method, net of taxes 8 125 (289) (180) Interest income (26) (379) (654) (424) Interest expense 227 3,352 2,604 1,796 Foreign exchange loss (gain), net 66 968 739 (272) Non-cash movements in post-employment and other non-current employee benefits obligations (2) (27) 216 571 Monetary position loss, net 21 312 393 — Market value loss on financial instruments 167 2,460 1,053 138
(Increase) decrease: Accounts receivable and other current assets (53) (777) (1,072) (1,545) Other current financial assets (146) (2,156) (3,094) (1,218) Inventories (40) (588) (623) (731)Increase (decrease): Suppliers and other accounts payable 339 4,978 2,921 5,231 Other liabilities (98) (1,442) 89 (346) Employee benefits paid (16) (235) (127) (88) Income taxes paid (303) (4,471) (4,674) (5,277)Net cash flows from operating activities 1,655 24,406 22,097 23,650
Investing activities: Acquisition of Grupo Fomento Queretano, net of cash acquired (Note 4) — — — (1,114) Acquisition of Grupo Yoli, net of cash acquired (Note 4) — — (1,046) — Acquisition of Companhia Fluminense de Refrigerantes, net of cash acquired (Note 4) — — (4,648) — Acquisition of Grupo Spaipa, net of cash acquired (Note 4) — — (23,056) — Proceeds from the sale of marketable securities — — — 273 Interest received 26 379 654 424 Acquisitions of long-lived assets (736) (10,862) (10,615) (9,741) Proceeds from the sale of long-lived assets 10 147 195 293 Acquisition of intangible assets (44) (634) (1,256) (235) Other non-current assets (17) (257) (734) (420)Investment in shares Coca-Cola FEMSA Philippines, Inc. (Note 9) — — (8,904) —Investment in shares 6 90 (71) (469)Net cash flows used in investing activities (755) (11,137) (49,481) (10,989)
Financing activities: Proceeds from borrowings 419 6,180 66,748 16,429 Repayment of borrowings (424) (6,254) (36,744) (8,464) Interest paid (216) (3,182) (2,328) (1,694) Dividends paid (409) (6,030) (6,002) (5,733) Acquisition of non-controlling interests — — — (7) Increase in shares of non-controlling interest — — 515 — Other financing activities (124) (1,828) 1,546 (270) Payments under finance leases (16) (236) (229) (201)Net cash flows (used in) / from financing activities (770) (11,350) 23,506 60Net increase (decrese) in cash and cash equivalents 130 1,919 (3,878) 12,721Initial balance of cash and cash equivalents 1,038 15,306 23,222 11,843Effects of exchange rate changes and inflation effects on cash and cash equivalents held in foreign currencies (289) (4,267) (4,038) (1,342)Ending balance of cash and cash equivalents $ 879 Ps. 12,958 Ps. 15,306 Ps. 23,222
(*) Convenience translation to U.S. dollars ($) – See Note 2.2.3The accompanying notes are an integral part of these consolidated statements of cash flow.
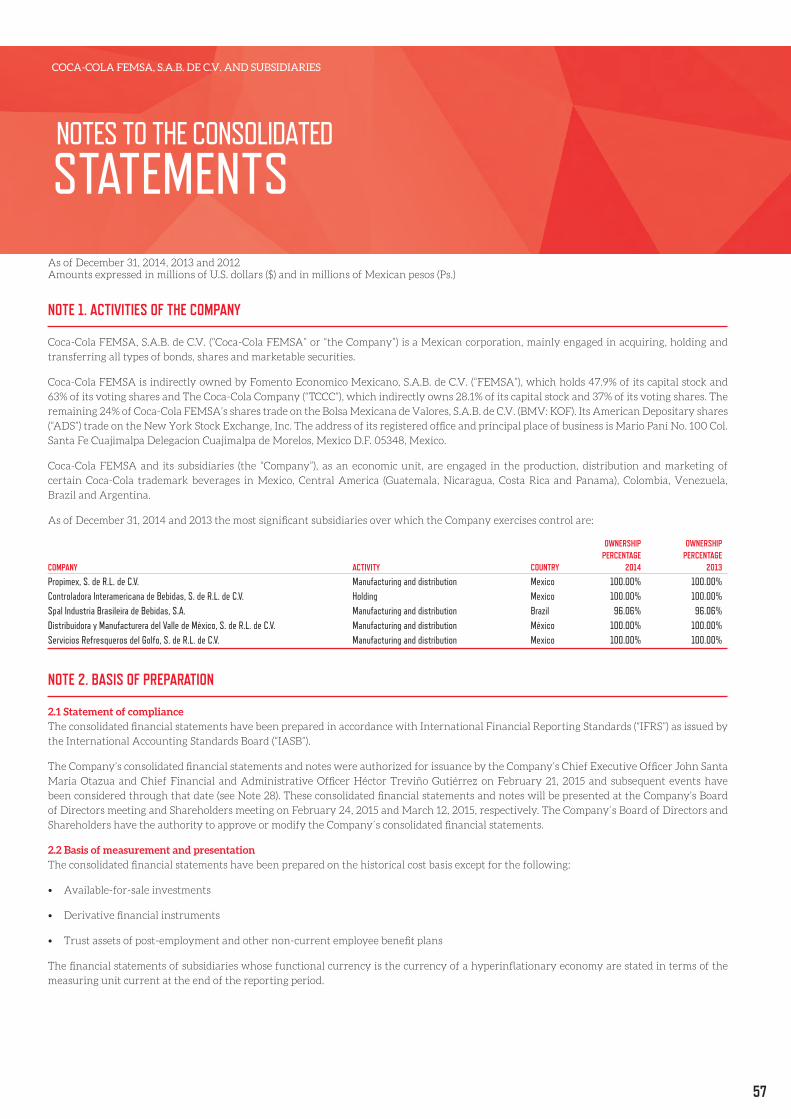
57
COCA-COLA FEMSA, S.A.B. DE C.V. AND SUBSIDIARIES
NOTES TO THE CONSOLIDATED
STATEMENTS
NOTE 1. ACTIVITIES OF THE COMPANY
Coca-Cola FEMSA, S.A.B. de C.V. (“Coca-Cola FEMSA” or “the Company”) is a Mexican corporation, mainly engaged in acquiring, holding and
transferring all types of bonds, shares and marketable securities.
Coca-Cola FEMSA is indirectly owned by Fomento Economico Mexicano, S.A.B. de C.V. (“FEMSA”), which holds 47.9% of its capital stock and
63% of its voting shares and The Coca-Cola Company (“TCCC”), which indirectly owns 28.1% of its capital stock and 37% of its voting shares. The
remaining 24% of Coca-Cola FEMSA’s shares trade on the Bolsa Mexicana de Valores, S.A.B. de C.V. (BMV: KOF). Its American Depositary shares
(“ADS”) trade on the New York Stock Exchange, Inc. The address of its registered office and principal place of business is Mario Pani No. 100 Col.
Santa Fe Cuajimalpa Delegacion Cuajimalpa de Morelos, Mexico D.F. 05348, Mexico.
Coca-Cola FEMSA and its subsidiaries (the “Company”), as an economic unit, are engaged in the production, distribution and marketing of
certain Coca-Cola trademark beverages in Mexico, Central America (Guatemala, Nicaragua, Costa Rica and Panama), Colombia, Venezuela,
Brazil and Argentina.
As of December 31, 2014 and 2013 the most significant subsidiaries over which the Company exercises control are:
OWNERSHIP OWNERSHIP PERCENTAGE PERCENTAGE COMPANY ACTIVITY COUNTRY 2014 2013
Propimex, S. de R.L. de C.V. Manufacturing and distribution Mexico 100.00% 100.00%Controladora Interamericana de Bebidas, S. de R.L. de C.V. Holding Mexico 100.00% 100.00%Spal Industria Brasileira de Bebidas, S.A. Manufacturing and distribution Brazil 96.06% 96.06%Distribuidora y Manufacturera del Valle de México, S. de R.L. de C.V. Manufacturing and distribution México 100.00% 100.00%Servicios Refresqueros del Golfo, S. de R.L. de C.V. Manufacturing and distribution Mexico 100.00% 100.00%
NOTE 2. BASIS OF PREPARATION
2.1 Statement of complianceThe consolidated financial statements have been prepared in accordance with International Financial Reporting Standards (“IFRS”) as issued by
the International Accounting Standards Board (“IASB”).
The Company’s consolidated financial statements and notes were authorized for issuance by the Company’s Chief Executive Officer John Santa
Maria Otazua and Chief Financial and Administrative Officer Héctor Treviño Gutiérrez on February 21, 2015 and subsequent events have
been considered through that date (see Note 28). These consolidated financial statements and notes will be presented at the Company’s Board
of Directors meeting and Shareholders meeting on February 24, 2015 and March 12, 2015, respectively. The Company´s Board of Directors and
Shareholders have the authority to approve or modify the Company´s consolidated financial statements.
2.2 Basis of measurement and presentationThe consolidated financial statements have been prepared on the historical cost basis except for the following:
• Available-for-sale investments
• Derivative financial instruments
• Trust assets of post-employment and other non-current employee benefit plans
The financial statements of subsidiaries whose functional currency is the currency of a hyperinflationary economy are stated in terms of the
measuring unit current at the end of the reporting period.
As of December 31, 2014, 2013 and 2012Amounts expressed in millions of U.S. dollars ($) and in millions of Mexican pesos (Ps.)
58
COCA-COLA FEMSA, S.A.B. DE C.V. AND SUBSIDIARIES
2.2.1 Presentation of consolidated income statementThe Company classifies its costs and expenses by function in the consolidated income statement, in order to conform to the industry practices
where the Company operates.
2.2.2 Presentation of consolidated statements of cash flows.The Company´s consolidated statement of cash flows is presented using the indirect method.
2.2.3 Convenience translation to U.S. dollars ($)The consolidated financial statements are stated in millions of Mexican pesos (“Ps.”) and rounded to the nearest million unless stated otherwise.
However, solely for the convenience of the readers, the consolidated statement of financial position as of December 31, 2014, the consolidated
income statement, the consolidated statement of comprehensive income and consolidated statement of cash flows for the year ended December
31, 2014 were converted into U.S. dollars at the exchange rate of Ps. 14.75 per U.S. dollar as published by the Federal Reserve Bank of New York
as of that date. This arithmetic conversion should not be construed as representations that the amounts expressed in Mexican pesos may be
converted into U.S. dollars at that or any other exchange rate.
2.3 Critical accounting judgments and estimatesIn the application of the Company’s accounting policies, which are described in Note 3, management is required to make judgments, estimates
and assumptions about the carrying amounts of assets and liabilities that are not readily apparent from other sources. The estimates and
associated assumptions are based on historical experience and other factors that are considered to be relevant. Actual results may differ from
these estimates.
The estimates and underlying assumptions are reviewed on an ongoing basis. Revisions to accounting estimates are recognized in the period
in which the estimate is revised if the revision affects only that period or in the period of the revision and future periods if the revision affects
both current and future periods.
2.3.1 Key sources of estimation uncertaintyThe following are the key assumptions concerning the future, and other key sources of estimation uncertainty at the end of the reporting period,
that have a significant risk of causing a material adjustment to the carrying amounts of assets and liabilities within the next financial year.
Existing circumstances and assumptions about future developments, however, may change due to market changes or circumstances arising
beyond the control of the Company. Such changes are reflected in the assumptions when they occur.
2.3.1.1 Impairment of indefinite lived intangible assets, goodwill and other depreciable long-lived assetsIntangible assets with indefinite lives as well as goodwill are subject to annual impairment tests. An impairment exists when the carrying value
of an asset or cash generating unit exceeds its recoverable amount, which is the higher of its fair value less costs to sell and its value in use. The
fair value less costs to sell calculation is based on available data from binding sales transactions in arm’s length transactions of similar assets or
observable market prices less incremental costs for disposing of the asset. In order to determine whether such assets are impaired, the Company
initially calculates an estimation of the value in use of the cash-generating units to which such assets have been allocated. The value in use
calculation requires management to estimate the future cash flows expected to arise from the cash-generating unit and a suitable discount rate
in order to calculate present value. The Company reviews annually the carrying value of its intangible assets with indefinite lives and goodwill
for impairment based on recognized valuation techniques. While the Company believes that its estimates are reasonable, different assumptions
regarding such estimates could materially affect its evaluations. Impairment losses are recognized in current earnings in the period the related
impairment is determined.
The Company assesses at each reporting date whether there is an indication that an asset may be impaired. If any indication exists, or when
annual impairment testing for an asset is required, the Company estimates the asset’s recoverable amount. When the carrying amount of
an asset or CGU exceeds its recoverable amount, the asset is considered impaired and is written down to its recoverable amount. In assessing
value in use, the estimated future cash flows are discounted to their present value using a pre-tax discount rate that reflects current market
assessments of the time value of money and the risks specific to the asset. In determining fair value less costs to sell, recent market transactions
are taken into account, if available. If no such transactions can be identified, an appropriate valuation model is used. These calculations are
corroborated by valuation multiples or other available fair value indicators. The key assumptions used to determine the recoverable amount for
the Company’s CGUs, including a sensitivity analysis, are further explained in Notes 3.16 and 11.
2.3.1.2 Useful lives of property, plant and equipment and intangible assets with defined useful livesProperty, plant and equipment, including returnable bottles are expected to provide benefits over a period of more than one year, as well as
intangible assets with defined useful lives are depreciated/amortized over their estimated useful lives. The Company bases it estimates on the
experience of its technical personnel as well as based on its experience in the industry for similar assets, see Notes 3.12, 10 and 11.
2.3.1.3 Post-employment and other non-current employee benefitsThe Company regularly evaluates the reasonableness of the assumptions used in its post-employment and other non-current employee benefit
computations. Information about such assumptions is described in Note 15.

59
COCA-COLA FEMSA, S.A.B. DE C.V. AND SUBSIDIARIES
2.3.1.4 Income taxesDeferred income tax assets and liabilities are determined based on the differences between the financial statement carrying amounts and the
tax basis of assets and liabilities. The Company regularly reviews its deferred tax assets for recoverability, and records a deferred tax asset based
on its judgment regarding the probability of historical taxable income, projected future taxable income and the expected timing of the reversals
of existing temporary differences, see Note 23.
2.3.1.5 Tax, labor and legal contingencies and provisionsThe Company is subject to various claims and contingencies related to tax, labor and legal proceedings as described in Note 24. Due to their
nature, such legal proceedings involve inherent uncertainties including, but not limited to, court rulings, negotiations between affected parties
and governmental actions. Management periodically assesses the probability of loss for such contingencies and accrues a provision and/ or
discloses the relevant circumstances, as appropriate. If the potential loss of any claim or legal proceeding is considered probable and the amount
can be reasonably estimated, the Company accrues a provision for the estimated loss.
2.3.1.6 Valuation of financial instrumentsThe Company is required to measure all derivative financial instruments at fair value.
The fair values of derivative financial instruments are determined considering quoted prices in recognized markets. If such instruments are
not traded, fair value is determined by applying techniques based upon technical models supported by sufficient, reliable and verifiable data,
recognized in the financial sector. The Company bases its forward price curves upon market price quotations. Management believes that the
chosen valuation techniques and assumptions used are appropriate in determining the fair value of financial instruments, see Note 19.
2.3.1.7 Business combinationsAcquisitions of businesses are accounted for using the acquisition method. The consideration transferred in a business combination is measured
at fair value, which is calculated as the sum of the acquisition-date fair values of the assets transferred by the Company, liabilities assumed by
the Company to the former owners of the acquiree and the equity interests issued by the Company in exchange for control of the acquiree.
At the acquisition date, the identifiable assets acquired and the liabilities assumed are recognized at their fair value, except that:
• deferred tax assets or liabilities, and assets or liabilities related to employee benefit arrangements are recognized and measured in accordance
with IAS 12, Income Taxes and IAS 19, Employee Benefits, respectively;
• liabilities or equity instruments related to share-based payment arrangements of the acquiree or share-based payment arrangements of the
Company entered into to replace share-based payment arrangements of the acquiree are measured in accordance with IFRS 2, Share- based
Payment at the acquisition date, see Note 3.24; and
• assets (or disposal groups) that are classified as held for sale in accordance with IFRS 5, Non-current Assets Held for Sale and Discontinued
Operations are measured in accordance with that standard.
Goodwill is measured as the excess of the sum of the consideration transferred, the amount of any non-controlling interests in the acquiree,
and the fair value of the Company previously held equity interest in the acquiree (if any) over the net of the acquisition-date amounts of the
identifiable assets acquired and the liabilities assumed. If, after reassessment, the net of the acquisition-date amounts of the identifiable assets
acquired and liabilities assumed exceeds the sum of the consideration transferred, the amount of any non-controlling interests in the acquiree
and the fair value of the Company previously held interest in the acquiree (if any), the excess is recognized immediately in profit or loss as a
bargain purchase gain.
For each business combination, the Company elects whether it measures the non-controlling interest in the acquiree either at fair value or at
the proportionate share of the acquiree’s identifiable net assets.
2.3.1.8 Investments in associatesIf the Company holds, directly or indirectly, 20 per cent or more of the voting power of the investee, it is presumed that it has significant
influence, unless it can be clearly demonstrated that this is not the case. If the Company holds, directly or indirectly, less than 20 per cent of
the voting power of the investee, it is presumed that the Company does not have significant influence, unless such influence can be clearly
demonstrated. Decisions regarding the propriety of utilizing the equity method of accounting for a less than 20 per cent-owned corporate
investee requires a careful evaluation of voting rights and their impact on the Company’s ability to exercise significant influence. Management
considers the existence of the following circumstances, which may indicate that the Company is in a position to exercise significant influence
over a less than 20 per cent-owned corporate investee:
• representation on the board of directors or equivalent governing body of the investee;
• participation in policy-making processes, including participation in decisions about dividends or other distributions;
• material transactions between the Company and the investee;
• interchange of managerial personnel; or
• provision of essential technical information.
Management also considers the existence and effect of potential voting rights that are currently exercisable or currently convertible should also
be considered when assessing whether the Company has significant influence.
60
COCA-COLA FEMSA, S.A.B. DE C.V. AND SUBSIDIARIES
In addition, the Company evaluates the indicators that provide evidence of significant influence:
• the Company’s extent of ownership is significant relative to other shareholdings (i.e. a lack of concentration of other shareholders);
• the Company’s significant shareholders, its parent, fellow subsidiaries, or officers of the Company, hold additional investment in the investee;
and
• the Company is a part of significant investee committees, such as the executive committee or the finance committee.
2.3.1.9 Joint ArrangementsAn arrangement can be a joint arrangement even though not all of its parties have joint control of the arrangement. When the Company is
a party to an arrangement it shall assess whether the contractual arrangement gives all the parties, or a group of the parties, control of the
arrangement collectively; joint control exists only when decisions about the relevant activities require the unanimous consent of the parties that
control the arrangement collectively. Management needs to apply judgment when assessing whether all the parties, or a group of the parties,
have joint control of an arrangement. When assessing joint control, management considers the following facts and circumstances:
a) If all the parties, or a group of the parties, control the arrangement, considering definition of joint control, as described in Note 3.1; and
b) If decisions about the relevant activities require the unanimous consent of all the parties, or of a group of the parties
As mentioned in Note 9, on January 25, 2013, the Company finalized the acquisition of 51% of Coca-Cola FEMSA Philippines, Inc. (CCFPI)
(formerly known as Coca-Cola Bottlers Philippines, Inc.). The Company currently jointly controls CCFPI with TCCC. This is based on the
following factors: (i) during the initial four-year period some relevant activities require joint approval between the Company and TCCC; and (ii)
potential voting rights to acquire the remaining 49% of CCFPI are not probable to be executed in the foreseeable future due to the fact the call
option is “out of the money” as of December 31, 2014 and 2013.
2.3.1.10 Venezuela Exchange RatesAs is further explained in Note 3.3 below, the exchange rate used to account for foreign currency denominated monetary items arising in
Venezuela, and also the exchange rate used to translate the financial statements of the Company’s Venezuelan subsidiary for group reporting
purposes are both key sources of estimation uncertainty in preparing the accompanying consolidated financial statements.
2.4 Changes in accounting policiesThe Company has adopted the following new IFRS and amendments to IFRS during 2014:
• Amendments to IFRS 10, IFRS 12 and IAS 27 (revised 2011), Consolidated Financial Statements, Disclosures of Interest in Other Entities and
Separate Financial Statements
• Amendments to IAS 32, Offsetting Financial Assets and Financial Liabilities
• Amendments to IAS 36, Impairment of assets
• Amendments to IAS 39, Financial instruments: recognition and measurement
• IFRIC 21, Levies
• Annual Improvements 2010-2012 Cycle
The nature and the effect of the changes are further explained below.
Amendments to IFRS 10, IFRS 12 and IAS 27 (revised 2011), Consolidated Financial Statements, Disclosures of Interest in Other Entities and Separate
Financial Statements
Amendments to IFRS 10, IFRS 12 and IAS 27, provide ‘investment entities’ an exemption from the consolidation of particular subsidiaries and
instead require that an investment entity measure the investment in each eligible subsidiary at fair value through profit or loss in accordance
with IFRS 9 or IAS 39. In addition, the amendments also require disclosures about why the entity is considered an investment entity, details of the
entity’s unconsolidated subsidiaries, and the nature of relationship and certain transactions between the investment entity and its subsidiaries.
These amendments are effective for annual periods beginning on or after January 1, 2014. The Company does not have participation in an
investment entity therefore the adoption of these admendments had no impact on the Company’s consolidated financial statements.
Amendments to IAS 32, Offsetting Financial Assets and Financial Liabilities
Amendments to IAS 32, “Offsetting Financial Assets and Financial Liabilities”, clarify existing application issues relating to the offsetting
requirements. Specifically, the amendments clarify the meaning of ‘currently has a legally enforceable right of set-off’ and ‘simultaneous
realization and settlement’. The amendments to IAS 32 are effective for annual periods beginning on or after January 1, 2014, with retrospective
application required. The adoption these amedments had no impact on the Company´s consolidated financial statements because the Company’s
policy for offsettings financial instruments is already in accordance with the amedments of IAS 32.
61
COCA-COLA FEMSA, S.A.B. DE C.V. AND SUBSIDIARIES
Amendments to IAS 36, Impairment of assets
Amendments to IAS 36 “Impairment of Assets”, reduce the circumstances in which the recoverable amount of assets or cash-generating units is
required to be disclosed, clarify the disclosures required, and introduce an explicit requirement to disclose the discount rate used in determining
impairment (or reversals) where recoverable amount (based on fair value less costs of disposal) is determined using a present value technique.
The amendments to IAS 36 are effective for annual periods beginning on or after January 1, 2014. The adoption of these amedments had no
impact on the Company´s consolidated financial statements because the Company had no impairment charges in the current and previous years
and in consequence there is no amount that could be reversed.
Amendments to IAS 39, Financial Instruments: Recognition and Measurement
Amendments to IAS 39 “Financial Instruments: Recognition and Measurement” clarify that there is no need to discontinue hedge accounting if
a hedging derivative is novated, provided certain criteria are met. A novation indicates an event where the original parties to a derivative agree
that one or more clearing counterparties replace their original counterparty to become the new counterparty to each of the parties. In order
to apply the amendments and continue hedge accounting, novation to a central counterparty (CCP) must happen as a consequence of laws or
regulations or the introduction of laws or regulations. The amendments to IAS 39 are effective for annual periods beginning on or after January
1, 2014. The Company did not have novated derivates designated as hedging during 2014.
Annual Improvements 2010-2012 CycleIn the 2010-2012 annual improvements cycle, the IASB issued seven amendments to six standards, which included an amendment to IFRS 13
Fair Value Measurement. The amendment to IFRS 13 is effective immediately and, thus, for periods beginning on January 1, 2014, and it clarifies
in the Basis for Conclusions that short-term receivables and payables with no stated interest rates can be measured at invoice amounts when the
effect of discounting is immaterial. This amendment to IFRS 13 had no impact on the Company´s consolidated financial statements.
The amendment to IFRS 8 is effective for annual periods beginning on or after July 1, 2014 however the amendements were early adopted for
the current year. The amendments require disclosing a) the judgments made by management in applying the aggregation criteria of reportable
segments, and b) provide reconciliations of all of the total of the reportable segments’ assets to the entity’s assets if the segment assets are
reported to the CODM. These amendments were incorporated in Note 25.
IFRIC 21, Levies
IFRIC 21 Levies, provides guidance on when to recognize a liability for a levy imposed by a government, both for levies that are accounted
for in accordance with IAS 37 Provisions, Contingent Liabilities and Contingent Assets and those where the timing and amount of the levy
is certain. The Interpretation identifies the obligating event for the recognition of a liability as the activity that triggers the payment of the
levy in accordance with the relevant legislation. It provides guidance on recognition of a liability to pay levies, where the liability is recognized
progressively if the obligating event occurs over a period of time; and if an obligation is triggered on reaching a minimum threshold, the liability
is recognized when that minimum threshold is reached. This interpretation is effective for accounting periods beginning on or after January 1,
2014, with early adoption permitted. The Company adopted this interpretation and had no material impact on the financial statements because
the rates to which is subject are recorded at the time the event giving rise to the payment obligation arises.
NOTE 3. SIGNIFICANT ACCOUNTING POLICIES
3.1 Basis of consolidationThe consolidated financial statements comprise the financial statements of the Company and its subsidiaries as at December 31, 2014. Control
is achieved when the Company is exposed, or has rights, to variable returns from its involvement with the investee and has the ability to affect
those returns through its power over the investee.
Specifically, the Company controls an investee if and only if the Company has:
• Power over the investee (i.e. existing rights that give it the current ability to direct the relevant activities of the investee)
• Exposure, or rights, to variable returns from its involvement with the investee, and
• The ability to use its power over the investee to affect its returns
When the Company has less than a majority of the voting or similar rights of an investee, the Company considers all relevant facts and
circumstances in assessing whether it has power over an investee, including:
• The contractual arrangement with the other vote holders of the investee
• Rights arising from other contractual arrangements
• The Company’s voting rights and potential voting rights
The Company re-assesses whether or not it controls an investee if facts and circumstances indicate that there are changes to one or more of
the three elements of control. Consolidation of a subsidiary begins when the Company obtains control over the subsidiary and ceases when
the Company loses control of the subsidiary. Assets, liabilities, income and expenses of a subsidiary acquired or disposed of during the year are
included in the consolidated financial statement of comprehensive income from the date the Company gains control until the date the Company
ceases to control the subsidiary.

62
COCA-COLA FEMSA, S.A.B. DE C.V. AND SUBSIDIARIES
Profit or loss and each component of other comprehensive income (OCI) are attributed to the equity holders of the parent of the Company and
to the non-controlling interests, even if this results in the non-controlling interests having a deficit balance. When necessary adjustments are
made to the financial statements of subsidiaries to bring their accounting policies into line with the Company’s accounting policies. All intra-
group assets and liabilities, equity, income, expenses and cash flows relating to transactions between members of the Company are eliminated
in full on consolidation.
A change in the ownership interest of a subsidiary, without a loss of control, is accounted for as an equity transaction. If the Company loses
control over a subsidiary, it:
• Derecognizes the assets (including goodwill) and liabilities of the subsidiary
• Derecognizes the carrying amount of any non-controlling interests
• Derecognizes the cumulative translation differences recorded in equity
• Recognizes the fair value of the consideration received
• Recognizes the fair value of any investment retained
• Recognizes any surplus or deficit in profit or loss
• Reclassifies the parent’s share of components previously recognized in OCI to profit or loss or retained earnings, as appropriate, as would be
required if the Company had directly disposed of the related assets or liabilities
3.1.1 Acquisitions of non-controlling interestsAcquisitions of non-controlling interests are accounted for as transactions with owners in their capacity as owners and therefore no goodwill
is recognized as a result. Adjustments to non-controlling interests arising from transactions that do not involve the loss of control are measured
at carrying amount and reflected in equity, as part of additional paid in capital.
3.1.2 Loss of controlUpon the loss of control, the Company derecognizes the assets and liabilities of the subsidiary, any non-controlling interests and the other
components of equity related to the subsidiary. Any surplus or deficit arising on the loss of control is recognized in consolidated net income.
If the Company retains any interest in the previous subsidiary, then such interest is measured at fair value at the date that control is lost.
Subsequently it is accounted for as an equity method or as a financial asset depending on the level of influence retained.
3.2 Business combinationsBusiness combinations are accounted for using the acquisition method at the acquisition date, which is the date on which control is transferred
to the Company. In assessing control, the Company takes into consideration substantive potential voting rights.
The Company measures goodwill at the acquisition date as the fair value of the consideration transferred plus the fair value of any previously-
held equity interest in the acquiree and the recognized amount of any non-controlling interests in the acquiree (if any), less the net recognized
amount of the identifiable assets acquired and liabilities assumed. If after reassessment, the excess is negative, a bargain purchase gain is
recognized in consolidated net income at the time of the acquisition.
Costs related to the acquisition, other than those associated with the issue of debt or equity securities, that the Company incurs in connection
with a business combination are expensed as incurred.
Any contingent consideration payable is recognized at fair value at the acquisition date. If the contingent consideration is classified as equity, it
is not remeasured and settlement is accounted for within equity. Otherwise, if after reassessment subsequent changes to the fair value of the
contingent considerations are recognized in consolidated net income.
If the initial accounting for a business combination is incomplete by the end of the reporting period in which the combination occurs, the
Company reports provisional amounts for the items for which the accounting is incomplete, and discloses that its allocation is preliminary in
nature. Those provisional amounts are adjusted during the measurement period (not greater than 12 months), or additional assets or liabilities
are recognized, to reflect new information obtained about facts and circumstances that existed at the acquisition date that, if known, would have
affected the amounts recognized at that date.
3.3 Foreign currencies and consolidation of foreign subsidiaries, investments in associates and joint venturesIn preparing the financial statements of each individual subsidiary, associate and joint venture, transactions in currencies other than the
individual entity’s functional currency (foreign currencies) are recognized at the rates of exchange prevailing at the dates of the transactions. At
the end of each reporting period, monetary items denominated in foreign currencies are retranslated at the rates prevailing at that date. Non-
monetary items that are measured in terms of historical cost in a foreign currency are not remeasured.
Exchange differences on monetary items are recognized in profit or loss in the period in which they arise except for:
• The variations in the net investment in foreign subsidiaries generated by exchange rate fluctuation are included in the cumulative translation
adjustment, which is recorded in equity as part of the cumulative translation adjustment within the cumulative other comprehensive income.
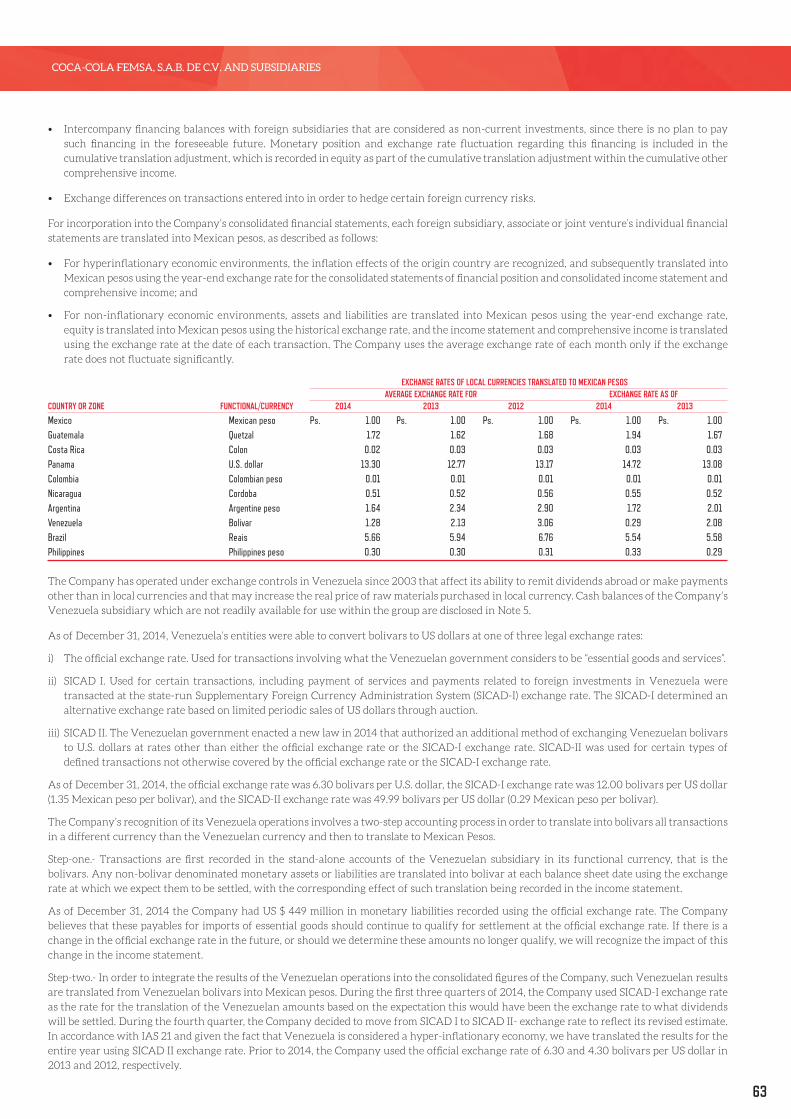
63
COCA-COLA FEMSA, S.A.B. DE C.V. AND SUBSIDIARIES
• Intercompany financing balances with foreign subsidiaries that are considered as non-current investments, since there is no plan to pay
such financing in the foreseeable future. Monetary position and exchange rate fluctuation regarding this financing is included in the
cumulative translation adjustment, which is recorded in equity as part of the cumulative translation adjustment within the cumulative other
comprehensive income.
• Exchange differences on transactions entered into in order to hedge certain foreign currency risks.
For incorporation into the Company’s consolidated financial statements, each foreign subsidiary, associate or joint venture’s individual financial
statements are translated into Mexican pesos, as described as follows:
• For hyperinflationary economic environments, the inflation effects of the origin country are recognized, and subsequently translated into
Mexican pesos using the year-end exchange rate for the consolidated statements of financial position and consolidated income statement and
comprehensive income; and
• For non-inflationary economic environments, assets and liabilities are translated into Mexican pesos using the year-end exchange rate,
equity is translated into Mexican pesos using the historical exchange rate, and the income statement and comprehensive income is translated
using the exchange rate at the date of each transaction. The Company uses the average exchange rate of each month only if the exchange
rate does not fluctuate significantly.
EXCHANGE RATES OF LOCAL CURRENCIES TRANSLATED TO MEXICAN PESOS AVERAGE EXCHANGE RATE FOR EXCHANGE RATE AS OFCOUNTRY OR ZONE FUNCTIONAL/CURRENCY 2014 2013 2012 2014 2013
Mexico Mexican peso Ps. 1.00 Ps. 1.00 Ps. 1.00 Ps. 1.00 Ps. 1.00Guatemala Quetzal 1.72 1.62 1.68 1.94 1.67Costa Rica Colon 0.02 0.03 0.03 0.03 0.03Panama U.S. dollar 13.30 12.77 13.17 14.72 13.08Colombia Colombian peso 0.01 0.01 0.01 0.01 0.01Nicaragua Cordoba 0.51 0.52 0.56 0.55 0.52Argentina Argentine peso 1.64 2.34 2.90 1.72 2.01Venezuela Bolivar 1.28 2.13 3.06 0.29 2.08Brazil Reais 5.66 5.94 6.76 5.54 5.58Philippines Philippines peso 0.30 0.30 0.31 0.33 0.29
The Company has operated under exchange controls in Venezuela since 2003 that affect its ability to remit dividends abroad or make payments
other than in local currencies and that may increase the real price of raw materials purchased in local currency. Cash balances of the Company’s
Venezuela subsidiary which are not readily available for use within the group are disclosed in Note 5.
As of December 31, 2014, Venezuela’s entities were able to convert bolivars to US dollars at one of three legal exchange rates:
i) The official exchange rate. Used for transactions involving what the Venezuelan government considers to be “essential goods and services”.
ii) SICAD I. Used for certain transactions, including payment of services and payments related to foreign investments in Venezuela were
transacted at the state-run Supplementary Foreign Currency Administration System (SICAD-I) exchange rate. The SICAD-I determined an
alternative exchange rate based on limited periodic sales of US dollars through auction.
iii) SICAD II. The Venezuelan government enacted a new law in 2014 that authorized an additional method of exchanging Venezuelan bolivars
to U.S. dollars at rates other than either the official exchange rate or the SICAD-I exchange rate. SICAD-II was used for certain types of
defined transactions not otherwise covered by the official exchange rate or the SICAD-I exchange rate.
As of December 31, 2014, the official exchange rate was 6.30 bolivars per U.S. dollar, the SICAD-I exchange rate was 12.00 bolivars per US dollar
(1.35 Mexican peso per bolivar), and the SICAD-II exchange rate was 49.99 bolivars per US dollar (0.29 Mexican peso per bolivar).
The Company’s recognition of its Venezuela operations involves a two-step accounting process in order to translate into bolivars all transactions
in a different currency than the Venezuelan currency and then to translate to Mexican Pesos.
Step-one.- Transactions are first recorded in the stand-alone accounts of the Venezuelan subsidiary in its functional currency, that is the
bolivars. Any non-bolivar denominated monetary assets or liabilities are translated into bolivar at each balance sheet date using the exchange
rate at which we expect them to be settled, with the corresponding effect of such translation being recorded in the income statement.
As of December 31, 2014 the Company had US $ 449 million in monetary liabilities recorded using the official exchange rate. The Company
believes that these payables for imports of essential goods should continue to qualify for settlement at the official exchange rate. If there is a
change in the official exchange rate in the future, or should we determine these amounts no longer qualify, we will recognize the impact of this
change in the income statement.
Step-two.- In order to integrate the results of the Venezuelan operations into the consolidated figures of the Company, such Venezuelan results
are translated from Venezuelan bolivars into Mexican pesos. During the first three quarters of 2014, the Company used SICAD-I exchange rate
as the rate for the translation of the Venezuelan amounts based on the expectation this would have been the exchange rate to what dividends
will be settled. During the fourth quarter, the Company decided to move from SICAD I to SICAD II- exchange rate to reflect its revised estimate.
In accordance with IAS 21 and given the fact that Venezuela is considered a hyper-inflationary economy, we have translated the results for the
entire year using SICAD II exchange rate. Prior to 2014, the Company used the official exchange rate of 6.30 and 4.30 bolivars per US dollar in
2013 and 2012, respectively.
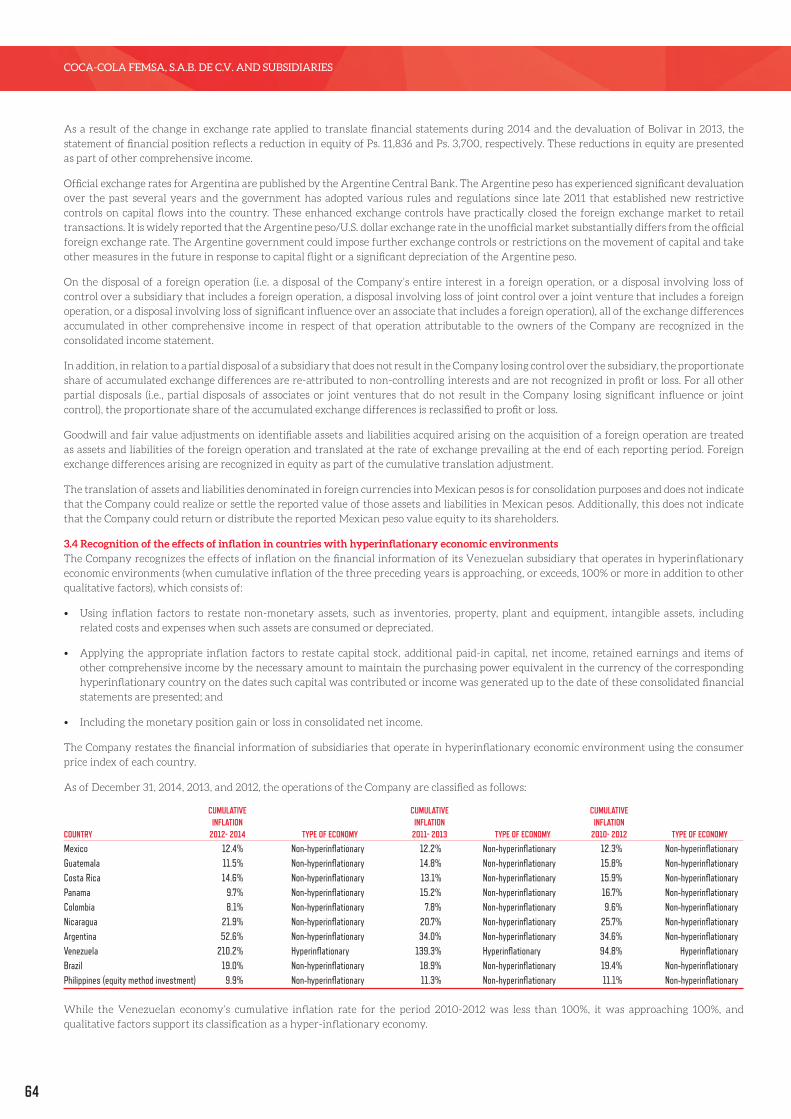
64
COCA-COLA FEMSA, S.A.B. DE C.V. AND SUBSIDIARIES
As a result of the change in exchange rate applied to translate financial statements during 2014 and the devaluation of Bolivar in 2013, the
statement of financial position reflects a reduction in equity of Ps. 11,836 and Ps. 3,700, respectively. These reductions in equity are presented
as part of other comprehensive income.
Official exchange rates for Argentina are published by the Argentine Central Bank. The Argentine peso has experienced significant devaluation
over the past several years and the government has adopted various rules and regulations since late 2011 that established new restrictive
controls on capital flows into the country. These enhanced exchange controls have practically closed the foreign exchange market to retail
transactions. It is widely reported that the Argentine peso/U.S. dollar exchange rate in the unofficial market substantially differs from the official
foreign exchange rate. The Argentine government could impose further exchange controls or restrictions on the movement of capital and take
other measures in the future in response to capital flight or a significant depreciation of the Argentine peso.
On the disposal of a foreign operation (i.e. a disposal of the Company’s entire interest in a foreign operation, or a disposal involving loss of
control over a subsidiary that includes a foreign operation, a disposal involving loss of joint control over a joint venture that includes a foreign
operation, or a disposal involving loss of significant influence over an associate that includes a foreign operation), all of the exchange differences
accumulated in other comprehensive income in respect of that operation attributable to the owners of the Company are recognized in the
consolidated income statement.
In addition, in relation to a partial disposal of a subsidiary that does not result in the Company losing control over the subsidiary, the proportionate
share of accumulated exchange differences are re-attributed to non-controlling interests and are not recognized in profit or loss. For all other
partial disposals (i.e., partial disposals of associates or joint ventures that do not result in the Company losing significant influence or joint
control), the proportionate share of the accumulated exchange differences is reclassified to profit or loss.
Goodwill and fair value adjustments on identifiable assets and liabilities acquired arising on the acquisition of a foreign operation are treated
as assets and liabilities of the foreign operation and translated at the rate of exchange prevailing at the end of each reporting period. Foreign
exchange differences arising are recognized in equity as part of the cumulative translation adjustment.
The translation of assets and liabilities denominated in foreign currencies into Mexican pesos is for consolidation purposes and does not indicate
that the Company could realize or settle the reported value of those assets and liabilities in Mexican pesos. Additionally, this does not indicate
that the Company could return or distribute the reported Mexican peso value equity to its shareholders.
3.4 Recognition of the effects of inflation in countries with hyperinflationary economic environmentsThe Company recognizes the effects of inflation on the financial information of its Venezuelan subsidiary that operates in hyperinflationary
economic environments (when cumulative inflation of the three preceding years is approaching, or exceeds, 100% or more in addition to other
qualitative factors), which consists of:
• Using inflation factors to restate non-monetary assets, such as inventories, property, plant and equipment, intangible assets, including
related costs and expenses when such assets are consumed or depreciated.
• Applying the appropriate inflation factors to restate capital stock, additional paid-in capital, net income, retained earnings and items of
other comprehensive income by the necessary amount to maintain the purchasing power equivalent in the currency of the corresponding
hyperinflationary country on the dates such capital was contributed or income was generated up to the date of these consolidated financial
statements are presented; and
• Including the monetary position gain or loss in consolidated net income.
The Company restates the financial information of subsidiaries that operate in hyperinflationary economic environment using the consumer
price index of each country.
As of December 31, 2014, 2013, and 2012, the operations of the Company are classified as follows:
CUMULATIVE CUMULATIVE CUMULATIVE INFLATION INFLATION INFLATION COUNTRY 2012- 2014 TYPE OF ECONOMY 2011- 2013 TYPE OF ECONOMY 2010- 2012 TYPE OF ECONOMY
Mexico 12.4% Non-hyperinflationary 12.2% Non-hyperinflationary 12.3% Non-hyperinflationaryGuatemala 11.5% Non-hyperinflationary 14.8% Non-hyperinflationary 15.8% Non-hyperinflationaryCosta Rica 14.6% Non-hyperinflationary 13.1% Non-hyperinflationary 15.9% Non-hyperinflationaryPanama 9.7% Non-hyperinflationary 15.2% Non-hyperinflationary 16.7% Non-hyperinflationaryColombia 8.1% Non-hyperinflationary 7.8% Non-hyperinflationary 9.6% Non-hyperinflationaryNicaragua 21.9% Non-hyperinflationary 20.7% Non-hyperinflationary 25.7% Non-hyperinflationaryArgentina 52.6% Non-hyperinflationary 34.0% Non-hyperinflationary 34.6% Non-hyperinflationaryVenezuela 210.2% Hyperinflationary 139.3% Hyperinflationary 94.8% HyperinflationaryBrazil 19.0% Non-hyperinflationary 18.9% Non-hyperinflationary 19.4% Non-hyperinflationaryPhilippines (equity method investment) 9.9% Non-hyperinflationary 11.3% Non-hyperinflationary 11.1% Non-hyperinflationary
While the Venezuelan economy’s cumulative inflation rate for the period 2010-2012 was less than 100%, it was approaching 100%, and
qualitative factors support its classification as a hyper-inflationary economy.
65
COCA-COLA FEMSA, S.A.B. DE C.V. AND SUBSIDIARIES
During 2014, the International Monetary Fund (IMF) issued a declaration of censure and called on Argentina to adopt remedial measures to
address the quality of its official inflation data. The IMF noted that alternative data sources have shown considerably higher inflation rates
than the official data since 2008. Consumer price data reported by Argentina from January 2014 onwards reflect the new national CPI (IPCNu),
which differs substantively from the preceding CPI. Because of the differences in geographical coverage, weights, sampling, and methodology,
the IPCNu data cannot be directly compared to the earlier CPI-GBA data.
3.5 Cash and cash equivalentsCash is measured at nominal value and consists of non-interest bearing bank deposits. Cash equivalents consist principally of short-term bank
deposits and fixed rate investments, both with maturities of three months or less at the acquisition date and are recorded at acquisition cost plus
interest income not yet received, which is similar to market prices.
The Company also maintains restricted cash held as collateral to meet certain contractual obligations (see Note 8). Restricted cash is presented
within other current financial assets given that the restrictions are short-term in nature.
3.6 Financial assetsFinancial assets are classified into the following specified categories: “fair value through profit or loss (FVTPL)”, “held-to-maturity investments”,
“available-for-sale” and “loans and receivables”. The classification depends on the nature and purpose of holding the financial assets and is
determined at the time of initial recognition.
When a financial asset is recognized initially, the Company measures it at its fair value plus, in the case of a financial asset not at fair value
through profit or loss, transaction costs that are directly attributable to the acquisition of the financial asset.
The fair value of an asset is measured using the assumptions that market participants would use when pricing the asset, assuming that market
participants act in their economic best interest.
The Company’s financial assets include cash and cash equivalents, marketable securities, loans and receivables, derivative financial instruments
and other financial assets.
3.6.1 Effective interest rate method (EIR)The effective interest rate method is a method of calculating the amortized cost of loans and receivables and other financial assets (designated as
held to maturity) and of allocating interest income/expense over the relevant period. The effective interest rate is the rate that exactly discounts
estimated future cash receipts (including all fees on points paid or received that form an integral part of the effective interest rate, transaction
costs and other premiums or discounts) through the expected life of the financial asset, or (where appropriate) a shorter period, to the net
carrying amount on initial recognition.
3.6.2 Marketable securitiesMarketable securities consist of debt securities and bank deposits with maturities of more than three months at the acquisition date. Management
determines the appropriate classification of investments at the time of purchase and assesses such designation as of each reporting date. As of
December 31, 2014, and 2013 there were no marketable securities.
3.6.2.1 Available-for-sale marketable securities are carried at fair value, with the unrealized gains and losses, net of tax, reported in other
comprehensive income. Interest and dividends on investments classified as available-for-sale are included in interest income. The fair values of
the investments are readily available based on quoted market prices. The exchange effects of securities available for sale are recognized in the
consolidated income statement in the period in which they arise.
3.6.2.2 Held-to maturity marketable securities are those that the Company has the positive intent and ability to hold to maturity, and are carried
at acquisition cost which includes any cost of purchase and premium or discount related to the investment which is amortized over the life of the
investment based on its outstanding balance utilizing the effective interest method less any impairment. Interest and dividends on investments
classified as held-to maturity are included in interest income. As of December, 31 2014 and 2013 there was no held-to maturity marketable
securities balances.
3.6.2.3 Financial assets at fair value through profit or loss (FVTPL)Financial assets at fair value through profit or loss include financial assets held for trading and financial assets designated upon initial recognition
at fair value through profit or loss. Financial assets are classified as held for trading if they are acquired for the purpose of selling or repurchasing
in the near term. Derivatives, including separated embedded derivatives are also classified as held for trading unless they are designated as
effective hedging instruments as defined by IAS 39. Financial assets at fair value through profit or loss are carried in the statement of financial
position at fair value with net changes in fair value presented as finance costs (negative net changes in fair value) or finance income (positive net
changes in fair value) in the statement of profit or loss.
3.6.3 Loans and receivablesLoans and receivables are non-derivative financial instruments with fixed or determinable payments that are not quoted in an active market.
Loans and receivables with a relevant period (including trade and other receivables) are measured at amortized cost using the effective interest
method, less any impairment.
Interest income is recognized by applying the effective interest rate, except for short-term receivables when the recognition of interest would
be immaterial. For the years ended December 31, 2014, 2013 and 2012 the interest income on loans and receivables recognized in the interest
income line item within the consolidated income statements is Ps. -, Ps. 61 and Ps. 58, respectively.
66
COCA-COLA FEMSA, S.A.B. DE C.V. AND SUBSIDIARIES
3.6.4 Other financial assetsOther financial assets are non-current accounts receivable and derivative financial instruments. Other financial assets with a relevant period
are measured at amortized cost using the effective interest method, less any impairment.
3.6.5 Impairment of financial assetsFinancial assets, other than those at FVTPL, are assessed for indicators of impairment at the end of each reporting period. Financial assets are
considered to be impaired when there is objective evidence that, as a result of one or more events that occurred after the initial recognition of
the financial asset, (an incurred “loss event”) and that loss event has an impact on the estimated future cash flows of the financial assets that can
be reliably estimated.
Evidence of impairment may include indicators as follows:
• Significant financial difficulty of the issuer or counterparty; or
• Default or delinquent in interest or principal payments; or
• It becoming probable that the borrower will enter bankruptcy or financial re-organization; or
• The disappearance of an active market for that financial asset because of financial difficulties.
For financial assets carried at amortized cost, the amount of the impairment loss recognized is the difference between the asset’s carrying
amount and the present value of estimated future cash flows, discounted at the financial asset’s original effective interest rate.
The carrying amount of the financial asset is reduced by the impairment loss directly for all financial assets with the exception of trade
receivables, where the carrying amount is reduced through the use of an allowance for doubtful accounts. When a trade receivable is considered
uncollectible, it is written off against the allowance account. Subsequent recoveries of amounts previously written off are credited against the
allowance account. Changes in the carrying amount of the allowance account are recognized in consolidated net income.
3.6.6 DerecognitionA financial asset (or, where applicable, a part of a financial asset or part of a group of similar financial assets) is derecognized when:
• The rights to receive cash flows from the financial asset have expired, or
• The Company has transferred its rights to receive cash flows from the asset or has assumed an obligation to pay the received cash flows in
full without material delay to a third party under a ‘pass-through’ arrangement; and either (a) the Company has transferred substantially
all the risks and rewards of the asset, or (b) the Company has neither transferred nor retained substantially all the risks and rewards of the
asset, but has transferred control of the asset.
3.6.7 Offsetting of financial instrumentsFinancial assets are required to be offset against financial liabilities and the net amount reported in the consolidated statement of financial
position if, and only when the Company:
• Currently has an enforceable legal right to offset the recognized amounts, and
• Intends to settle on a net basis, or to realize the assets and settle the liabilities simultaneously.
3.7 Derivative financial instrumentsThe Company is exposed to different risks related to cash flows, liquidity, market and third party credit. As a result, the Company contracts
different derivative financial instruments in order to reduce its exposure to the risk of exchange rate fluctuations between the Mexican peso and
other currencies, and interest rate fluctuations associated with its borrowings denominated in foreign currencies and the exposure to the risk of
fluctuation in the costs of certain raw materials.
The Company values and records all derivative financial instruments and hedging activities, in the consolidated statement of financial position
as either an asset or liability measured at fair value, considering quoted prices in recognized markets. If such instruments are not traded in a
formal market, fair value is determined by applying techniques based upon technical models supported by sufficient, reliable and verifiable
market data, recognized in the financial sector. Changes in the fair value of derivative financial instruments are recorded each year in current
earnings or as a component of cumulative other comprehensive income based on the item being hedged and the effectiveness of the hedge.
3.7.1 Hedge accountingThe Company designates certain hedging instruments, which include derivatives in respect of foreign currency risk, as either fair value hedges
or cash flow hedges. Hedges of foreign exchange risk on firm commitments are accounted for as cash flow hedges.
At the inception of the hedge relationship, the Company documents the relationship between the hedging instrument and the hedged item,
along with its risk management objectives and its strategy for undertaking various hedge transactions. Furthermore, at the inception of the
hedge and on an ongoing basis, the Company documents whether the hedging instrument is highly effective in offsetting changes in fair values
or cash flows of the hedged item attributable to the hedged risk.
67
COCA-COLA FEMSA, S.A.B. DE C.V. AND SUBSIDIARIES
3.7.2 Cash flow hedgesThe effective portion of changes in the fair value of derivatives that are designated and qualify as cash flow hedges is recognized in other
comprehensive income and accumulated under the heading valuation of the effective portion of derivative financial instruments. The gain or
loss relating to the ineffective portion is recognized immediately in consolidated net income, and is included in the market value (gain) loss on
financial instruments line item within the consolidated statements of income.
Amounts previously recognized in other comprehensive income and accumulated in equity are reclassified to consolidated net income in
the periods when the hedged item is recognized in consolidated net income, in the same line of the consolidated statement of income as the
recognized hedged item. However, when the hedged forecast transaction results in the recognition of a non-financial asset or a non-financial
liability, the gains and losses previously recognized in other comprehensive income and accumulated in equity are transferred from equity and
included in the initial measurement of the cost of the non-financial asset or non-financial liability.
Hedge accounting is discontinued when the Company revokes the hedging relationship, when the hedging instrument expires or is sold,
terminated, or exercised, or when it no longer qualifies for hedge accounting. Any gain or loss recognized in cumulative other comprehensive
income in equity at that time remains in equity and is recognized when the forecast transaction is ultimately recognized in consolidated
net income. When a forecast transaction is no longer expected to occur, the gain or loss accumulated in equity is recognized immediately in
consolidated net income.
3.7.3 Fair value hedgesThe change in the fair value of a hedging derivative is recognized in the statement of profit or loss as foreign exchange gain or loss. The change
in the fair value of the hedged item attributable to the risk hedged is recorded as part of the carrying value of the hedged item and is also
recognized in the statement of profit or loss as foreign exchange gain or loss.
For fair value hedges relating to items carried at amortized cost, any adjustment to carrying value is amortized through profit or loss over the
remaining term of the hedge using the EIR method. EIR amortization may begin as soon as an adjustment exists and no later than when the
hedged item ceases to be adjusted for changes in its fair value attributable to the risk being hedged. If the hedged item is derecognized, the
unamortized fair value is recognized immediately in profit or loss.
When an unrecognized firm commitment is designated as a hedged item, the subsequent cumulative change in the fair value of the firm
commitment attributable to the hedged risk is recognized as an asset or liability with a corresponding gain or loss recognized in profit and loss.
3.8 Fair value measurementThe Company measures financial instruments, such as, derivatives, and non-financial assets such, at fair value at each balance sheet date. Also,
fair values of bank loans and notes payable carried at amortized cost are disclosed in Note 17.
Fair value is the price that would be received to sell an asset or paid to transfer a liability in an orderly transaction between market participants
at the measurement date. The fair value measurement is based on the presumption that the transaction to sell the asset or transfer the liability
takes place either:
• In the principal market for the asset or liability, or
• In the absence of a principal market, in the most advantageous market for the asset or liability
A fair value measurement of a non-financial asset takes into account a market participant’s ability to generate economic benefits by using the
asset in its highest and best use or by selling it to another market participant that would use the asset in its highest and best use.
The Company uses valuation techniques that are appropriate in the circumstances and for which sufficient data are available to measure fair
value, maximizing the use of relevant observable inputs and minimizing the use of unobservable inputs.
All assets and liabilities for which fair value is measured or disclosed in the financial statements are categorized within the fair value hierarchy,
described as follows, based on the lowest level input that is significant to the fair value measurement as a whole:
• Level 1: quoted prices (unadjusted) in active markets for identical assets or liabilities that the reporting entity has the ability to access at the
measurement date.
• Level 2: inputs other than quoted prices included within level 1 that are observable for the asset or liability, either directly or indirectly.
• Level 3: are unobservable inputs for the asset or liability. Unobservable inputs shall be used to measure fair value to the extent that
observable inputs are not available, thereby allowing for situations in which there is little, if any, market activity for the asset or liability at
the measurement date.
For assets and liabilities that are recognized in the financial statements on a recurring basis, the Company determines whether transfers have
occurred between Levels in the hierarchy by re-assessing categorization (based on the lowest level input that is significant to the fair value
measurement as a whole) at the end of each reporting period
The Company determines the policies and procedures for both recurring fair value measurement, such as those described in Note 19 and
unquoted liabilities such as debt described in Note 17.
For the purpose of fair value disclosures, the Company has determined classes of assets and liabilities on the basis of the nature, characteristics
and risks of the asset or liability and the level of the fair value hierarchy as explained above.
68
COCA-COLA FEMSA, S.A.B. DE C.V. AND SUBSIDIARIES
3.9 Inventories and cost of goods soldInventories are measured at the lower of cost and net realizable value. Net realizable value represents the estimated selling price for inventories
less all estimated costs of completion and costs necessary to make the sale.
Inventories represent the acquisition or production cost which is incurred when purchasing or producing a product, and are based on the
weighted average cost formula.
Cost of goods sold is based on average cost of the inventories at the time of sale. Cost of goods sold includes expenses related to the purchase of
raw materials used in the production process, as well as labor costs (wages and other benefits), depreciation of production facilities, equipment
and other costs, including fuel, electricity, equipment maintenance, inspection and plant transfer costs.
3.10 Other current assetsOther current assets, which will be realized within a period of less than one year from the reporting date, are comprised of prepaid assets and
agreements with customers.
Prepaid assets principally consist of advances to suppliers of raw materials, advertising, promotional, leasing and insurance costs, and are
recognized as other current assets at the time of the cash disbursement, and are unrecognized in the consolidated statement of financial position
or consolidated income statement caption when the risks and rewards of the related goods have been transferred to the Company or services
have been received, respectively.
The Company has prepaid advertising costs which consist of television and radio advertising airtime paid in advance. These expenses are
generally amortized over the period based on the transmission of the television and radio spots. The related production costs are recognized in
consolidated net income as incurred.
The Company has agreements with customers for the right to sell and promote the Company’s products over a certain period. The majority of
these agreements have terms of more than one year, and the related costs are amortized using the straight-line method over the term of the
contract, with amortization presented as a reduction of net sales. During the years ended December 31, 2014, 2013 and 2012, such amortization
aggregated to Ps. 338, Ps. 696 and Ps. 970, respectively.
3.11 Investments in associates and joint arrangements3.11.1 Investments in associatesAssociates are those entities over which the Company has significant influence. Significant influence is the power to participate in the financial
and operating policy decisions of the investee, but is not control over those policies.
Investments in associates are accounted for using the equity method and initial recognition comprises the investment’s purchase price and any
directly attributable expenditure necessary to acquire it.
When the Company’s share of losses exceeds the carrying amount of the associate, including any non-current investments, the carrying amount
is reduced to nil and recognition of further losses is discontinued except to the extent that the Company has a legal or constructive obligation or
has made payments on behalf of the associate.
Goodwill identified at the acquisition date is presented as part of the investment in shares of the associate in the consolidated statement of
financial position. Any goodwill arising on the acquisition of the Company’s interest in associate is accounted for in accordance with the
Company’s accounting policy for goodwill arising in a business combination, see Note 3.2.
After application of the equity method, the Company determines whether it is necessary to recognize an additional impairment loss on its
investment in its associate. The Company determines at each reporting date whether there is any objective evidence that the investment in the
associates is impaired. If this is the case, the Company calculates the amount of impairment as the difference between the recoverable amount
of the associate and its carrying value and recognizes the amount in the share of the profit or loss of associates accounted for using the equity
method in the consolidated statements of income.
3.11.2 Joint arrangementsA joint arrangement is an arrangement of which two or more parties have joint control. Joint control is the contractually agreed sharing of
control of an arrangement, which exists only when decisions about the relevant activities require the unanimous consent of the parties sharing
control. The Company classifies its interests in joint arrangements as either joint operations or joint ventures depending on the Company’s rights
to the assets and obligations for the liabilities of the arrangements
Joint venture is a joint arrangement whereby the parties that have joint control of the arrangement have rights to the net assets of the
arrangement. The Company recognizes its interest in the joint ventures as an investment and accounts for that investment using the equity
method. Joint control is the contractually agreed sharing of control of an arrangement, which exists only when decisions about the relevant
activities require unanimous consent of the parties sharing control. As of December 31, 2014 and 2013 the Company does not have an interest
in joint operations.
69
COCA-COLA FEMSA, S.A.B. DE C.V. AND SUBSIDIARIES
After application of the equity method, the Company determines whether it is necessary to recognize an additional impairment loss on its
investment in its joint venture. The Company determines at each reporting date whether there is any objective evidence that the investment in
the joint ventures is impaired. If this is the case, the Company calculates the amount of impairment as the difference between the recoverable
amount of the joint venture and its carrying value and recognizes the amount in the share of the profit or loss of joint ventures accounted for
using the equity method in the consolidated statements of income.
3.12 Property, plant and equipmentProperty, plant and equipment are initially recorded at their cost of acquisition and/or construction and are presented net of accumulated
depreciation and/or accumulated impairment losses, if any. The borrowing costs related to the acquisition or construction of qualifying asset is
capitalized as part of the cost of that asset.
Major maintenance costs are capitalized as part of total acquisition cost. Routine maintenance and repair costs are expensed as incurred.
Investments in progress consist of long-lived assets not yet in service, in other words, that are not yet used for the purpose that they were
bought, built or developed. The Company expects to complete those investments during the following 12 months.
Depreciation is computed using the straight-line method over acquisition cost. Where an item of property, plant and equipment comprises major
components having different useful lives, they are accounted and depreciated for as separate items (major components) of property, plant and
equipment. The Company estimates depreciation rates, considering the estimated useful lives of the assets.
The estimated useful lives of the Company’s principal assets are as follows:
YEARS
Buildings 40 – 50Machinery and equipment 10 – 20Distribution equipment 7 – 15Refrigeration equipment 5 – 7Returnable bottles 1.5 – 4Other equipment 3 – 10
The estimated useful lives, residual values and depreciation method are reviewed at the end of each reporting period, with the effect of any
changes in estimate accounted for on a prospective basis.
An item of property, plant and equipment is derecognized upon disposal or when no future economic benefits are expected to arise from the
continued use of the asset. Any gain or loss arising on the disposal or retirement of an item of property, plant and equipment is determined as
the difference between the sales proceeds (if any) and the carrying amount of the asset and is recognized in consolidated net income.
Returnable and non-returnable bottles:
The Company has two types of bottles: returnable and non-returnable.
• Non-returnable: Are recorded in consolidated net income at the time of product sale.
• Returnable: Are classified as long-lived assets as a component of property, plant and equipment. Returnable bottles are recorded at acquisition
cost; for countries with hyperinflationary economies, restated according to IAS 29. Depreciation of returnable bottles is computed using the
straight-line method considering their estimated useful lives.
There are two types of returnable bottles:
• Those that are in the Company’s control within its facilities, plants and distribution centers; and
• Those that have been placed in the hands of customers, but still belong to the Company.
Returnable bottles that have been placed in the hands of customers are subject to an agreement with a retailer pursuant to which the Company
retains ownership. These bottles are monitored by sales personnel during periodic visits to retailers and the Company has the right to charge
any breakage identified to the retailer. Bottles that are not subject to such agreements are expensed when placed in the hands of retailers.
The Company’s returnable bottles are depreciated according to their estimated useful lives (3 years for glass bottles and 1.5 years for PET bottles).
Deposits received from customers are amortized over the same useful estimated lives of the bottles.
3.13 Borrowing costsBorrowing costs directly attributable to the acquisition, construction or production of qualifying assets, which are assets that necessarily take
a substantial period of time to get ready for their intended use or sale, are added to the cost of those assets, until such time as the assets are
substantially ready for their intended use or sale. Borrowing costs may include:
• interest expense; and
• exchange differences arising from foreign currency borrowings to the extent that they are regarded as an adjustment to interest costs.
70
COCA-COLA FEMSA, S.A.B. DE C.V. AND SUBSIDIARIES
Interest income earned on the temporary investment of specific borrowings pending their expenditure on qualifying assets is deducted from the
borrowing costs eligible for capitalization.
All other borrowing costs are recognized in consolidated net income in the period in which they are incurred.
3.14 Intangible assetsIntangible assets are identifiable non-monetary assets without physical substance and represent payments whose benefits will be received in
future years. Intangible assets acquired separately are measured on initial recognition at cost. The cost of intangible assets acquired in a business
combination is their fair value as at the date of acquisition (see Note 3.2). Following initial recognition, intangible assets are carried at cost less
any accumulated amortization and accumulated impairment losses. The useful lives of intangible assets are assessed as either finite or indefinite,
in accordance with the period over which the Company expects to receive the benefits.
Intangible assets with finite useful lives are amortized and mainly consist of information technology and management system costs incurred
during the development stage which are currently in use. Such amounts are capitalized and then amortized using the straight-line method over
their expected useful lives. Expenses that do not fulfill the requirements for capitalization are expensed as incurred.
Amortized intangible assets, such as finite lived intangible assets are reviewed for impairment whenever events or changes in circumstances
indicate that the carrying amount of an asset or group of assets may not be recoverable through its expected future cash flows.
Intangible assets with an indefinite life are not amortized and are subject to impairment tests on an annual basis as well as whenever certain
circumstances indicate that the carrying amount of those intangible assets exceeds their recoverable value.
The Company’s intangible assets with an indefinite life mainly consist of rights to produce and distribute Coca-Cola trademark products in the
Company’s territories. These rights are contained in agreements that are standard contracts that The Coca-Cola Company has with its bottlers.
As of December 31, 2014, the Company had nine bottler agreements in Mexico: (i) the agreements for Mexico’s Valley territory, which expire
in April 2016 and June 2023, (ii) the agreements for the Central territory, which expire in March 2015 (two agreements), May 2015 and July
2016, (iii) the agreement for the Northeast territory, which expires in March 2015 (iv) the agreement for the Bajio territory, which expires in
May 2015, and (v) the agreement for the Southeast territory, which expires in June 2023. As of December 31, 2014, the Company had four
bottler agreements in Brazil, two expiring in October 2017 and the other two expiring in April 2024. The bottler agreements with The Coca-Cola
Company will expire for territories in other countries as follows: Argentina in September 2024; Colombia in June 2024; Venezuela in August
2016; Guatemala in March 2025; Costa Rica in September 2017; Nicaragua in May 2016 and Panama in November 2024. All of these bottler
agreements are automatically renewable for ten-year terms, subject to the right of either party to give prior notice that it does not wish to
renew the applicable agreement. In addition, these agreements generally may be terminated in the case of material breach. Termination would
prevent the Company from selling Coca-Cola trademark beverages in the affected territory and would have an adverse effect on the Company´s
business, financial conditions, results from operations and prospects.
3.15 Non-current assets held for saleNon-current assets and disposal groups are classified as held for sale if their carrying amount will be recovered principally through a sale
transaction rather than through continuing use. This condition is regarded as met only when the sale is highly probable and the non-current
asset (or disposal group) is available for immediate sale in its present condition. Management must be committed to the sale, which should be
expected to qualify for recognition as a completed sale within one year from the date of classification.
When the Company is committed to a sale plan involving loss of control of a subsidiary, all of the assets and liabilities of that subsidiary are
classified as held for sale when the criteria described above are met, regardless of whether the Company will retain a non-controlling interest
in its former subsidiary after the sale.
Non-current assets (and disposal groups) classified as held for sale are measured at the lower of their previous carrying amount and fair value
less costs to sell.
3.16 Impairment of non-financial assetsAt the end of each reporting period, the Company reviews the carrying amounts of its tangible and intangible assets to determine whether
there is any indication that those assets have suffered an impairment loss. If any such indication exists, the recoverable amount of the asset
is estimated in order to determine the extent of the impairment loss (if any). Where it is not possible to estimate the recoverable amount of an
individual asset, the Company estimates the recoverable amount of the cash-generating unit to which the asset belongs. Where a reasonable
and consistent basis of allocation can be identified, corporate assets are also allocated to individual CGUs, or otherwise they are allocated to the
smallest CGUs for which a reasonable and consistent allocation basis can be identified.
Intangible assets with indefinite useful lives are tested for impairment at least annually, and whenever there is an indication that the asset may
be impaired.
For goodwill and other indefinite lived intangible assets, the Company tests for impairment on an annual basis and whenever certain
circumstances indicate that the carrying amount of the cash generating unit might exceed its recoverable amount.
Recoverable amount is the higher of fair value less costs to sell and value in use. In assessing value in use, the estimated future cash flows are
discounted to their present value using a pre-tax discount rate that reflects current market assessments of the time value of money and the risks
specific to the asset for which the estimates of future cash flows have not been adjusted.
71
COCA-COLA FEMSA, S.A.B. DE C.V. AND SUBSIDIARIES
If the recoverable amount of an asset (or CGU) is estimated to be less than its carrying amount, the carrying amount of the asset (or CGU) is
reduced to its recoverable amount. An impairment loss is recognized immediately in consolidated net income.
Where an impairment loss subsequently reverses, the carrying amount of the asset (or CGU) is increased to the revised estimate of its recoverable
amount, but so that the increased carrying amount does not exceed the carrying amount that would have been determined had no impairment
loss been recognized for the asset (or CGU) in prior years. A reversal of an impairment loss is recognized immediately in consolidated net income.
Impairment losses related to goodwill are not reversible.
As of December, 31 2014 and 2013 there was no impairment recognized in non-financial assets.
3.17 LeasesThe determination of whether an arrangement is, or contains, a lease is based on the substance of the arrangement at inception date, whether
fulfillment of the arrangement is dependent on the use of a specific asset or assets or the arrangement conveys a right to use the asset, even if
that right is not explicitly specified in an arrangement.
Leases are classified as finance leases whenever the terms of the lease transfer substantially all the risks and rewards of ownership to the lessee.
All other leases are classified as operating leases.
Assets held under finance leases are initially recognized as assets of the Company at their fair value at the inception of the lease or, if lower, at
the present value of the minimum lease payments. The corresponding liability to the lessor is included in the consolidated statement of financial
position as a finance lease obligation. Lease payments are apportioned between finance expenses and reduction of the lease obligation so as to
achieve a constant rate of interest on the remaining balance of the liability. Finance expenses are recognized immediately in consolidated net
income, unless they are directly attributable to qualifying assets, in which case they are capitalized in accordance with the Company’s general
policy on borrowing costs. Contingent rentals are recognized as expenses in the periods in which they are incurred. Assets held under finance
leases are depreciated over their expected useful lives on the same basis as owned assets or, where shorter, the term of the relevant lease.
Operating lease payments are recognized as an expense on a straight-line basis over the lease term, except where another systematic basis
is more representative of the time pattern in which economic benefits from the leased asset are consumed. Contingent rentals arising under
operating leases are recognized as an expense in the period in which they are incurred. In the event that lease incentives are received to enter
into operating leases, such incentives are recognized as a liability. The aggregate benefit of incentives is recognized as a reduction of rental
expense on a straight-line basis, except where another systematic basis is more representative of the time pattern in which economic benefits
from the leased asset are consumed. Leasehold improvements, on operating leases are amortized using the straight-line method over the shorter
of either the useful life of the assets or the related lease term.
3.18 Financial liabilities and equity instruments3.18.1 Classification as debt or equityDebt and equity instruments issued by a group entity are classified as either financial liabilities or as equity in accordance with the substance of
the contractual arrangements and the definitions of a financial liability and an equity instrument.
3.18.2 Equity instrumentsAn equity instrument is any contract that evidences a residual interest in the assets of an entity after deducting all of its liabilities. Equity
instruments issued by the Company are recognized at the proceeds received, net of direct issue costs.
Repurchase of the Company’s own equity instruments is recognized and deducted directly in equity. No gain or loss is recognized in profit or loss
on the purchase, sale, issue or cancellation of the Company’s own equity instruments.
3.18.3 Financial liabilitiesInitial recognition and measurementFinancial liabilities within the scope of IAS 39 are classified as financial liabilities at FVTPL, loans and borrowings, or as derivatives designated
as hedging instruments in an effective hedge, as appropriate. The Company determines the classification of its financial liabilities at initial
recognition.
All financial liabilities are recognized initially at fair value plus, in the case of loans and borrowings, directly attributable transaction costs.
The Company financial liabilities include trade and other payables, loans and borrowings, and derivative financial instruments, see Note 3.7.
Subsequent measurementThe measurement of financial liabilities depends on their classification as described below:
3.18.4 Loans and borrowingsAfter initial recognition, interest bearing loans and borrowings are subsequently measured at amortized cost using the effective interest method.
Gains and losses are recognized in the consolidated statements of income when the liabilities are derecognized as well as through the effective
interest method amortization process.
Amortized cost is calculated by taking into account any discount or premium on acquisition and fees or costs that are an integral part of the
effective interest method. The effective interest method amortization is included in interest expense in the consolidated statements of income.
72
COCA-COLA FEMSA, S.A.B. DE C.V. AND SUBSIDIARIES
DerecognitionA financial liability is derecognized when the obligation under the liability is discharged or cancelled or expires.
When an existing financial liability is replaced by another from the same lender on substantially different terms, or the terms of an existing
liability are substantially modified, such an exchange or modification is treated as the derecognition of the original liability and the recognition
of a new liability. The difference in the respective carrying amounts is recognized in the consolidated statements of income.
3.19 ProvisionsProvisions are recognized when the Company has a present obligation (legal or constructive) as a result of a past event, it is probable that the
Company will be required to settle the obligation, and a reliable estimate can be made of the amount of the obligation.
The amount recognized as a provision is the best estimate of the consideration required to settle the present obligation at the end of the reporting
period, taking into account the risks and uncertainties surrounding the obligation. When a provision is measured using the cash flows estimated
to settle the present obligation, its carrying amount is the present value of those cash flows (where the effect of the time value of money is
material).
When some or all of the economic benefits required to settle a provision are expected to be recovered from a third party, a receivable is recognized
as an asset if it is virtually certain that reimbursement will be received and the amount of the receivable can be measured reliably.
The Company recognizes a provision for a loss contingency when it is probable (i.e. the probability that the event will occur is greater than the
probability that it will not) that certain effects related to past events, would materialize and can be reasonably quantified. These events and their
financial impact are also disclosed as loss contingencies in the consolidated financial statements when the risk of loss is deemed to be other than
remote. The Company does not recognize an asset for a gain contingency until the gain is realized, see Note 24.
Restructuring provisions are recognized only when the recognition criteria for provisions are fulfilled. The Company has a constructive
obligation when a detailed formal plan identifies the business or part of the business concerned, the location and number of employees affected,
a detailed estimate of the associated costs, and an appropriate timeline. Furthermore, the employees affected must have been notified of the
plans main features.
3.20 Post-employment and other non-current employee benefitsPost-employment and other non-current employee benefits, which are considered to be monetary items, include obligations for pension and
post-employment plans and seniority premiums, all based on actuarial calculations, using the projected unit credit method.
In Mexico, the economic benefits and retirement pensions are granted to employees with 10 years of service and minimum age of 60. In
accordance with Mexican Labor Law, the Company provides seniority premium benefits to its employees under certain circumstances. These
benefits consist of a one-time payment equivalent to 12 days wages for each year of service (at the employee’s most recent salary, but not to
exceed twice the legal minimum wage), payable to all employees with 15 or more years of service, as well as to certain employees terminated
involuntarily prior to the vesting of their seniority premium benefit.
For defined benefit retirement plans and other non-current employee benefits, such as the Company’s sponsored pension and retirement plans
and seniority premiums, the cost of providing benefits is determined using the projected unit credit method, with actuarial valuations being
carried out at the end of each reporting period. All remeasurements of the Company’s defined benefit obligation such as actuarial gains and
losses and return on plan assets are recognized directly in other comprehensive income (“OCI”). The Company presents service costs within cost
of goods sold, administrative and selling expenses in the consolidated statements of income. The Company presents net interest cost within
interest expense in the consolidated statements of income. The projected benefit obligation recognized in the consolidated statement of financial
position represents the present value of the defined benefit obligation as of the end of each reporting period. Certain subsidiaries of the Company
have established plan assets for the payment of pension benefits and seniority premiums through irrevocable trusts of which the employees are
named as beneficiaries, which serve to increase the funded status of such plans’ related obligations.
Costs related to compensated absences, such as vacations and vacation premiums, are recognized on an accrual basis. Cost for mandatory
severance benefits are recorded as incurred.
The Company recognizes a liability and expense for termination benefits at the earlier of the following dates:
a. When it can no longer withdraw the offer of those benefits; and
b. When it recognizes costs for a restructuring that is within the scope of IAS 37, Provisions, Contingent Liabilities and Contingent Assets, and
involves the payment of termination benefits.
The Company is demonstrably committed to a termination when, and only when, the entity has a detailed formal plan for the termination and
is without realistic possibility of withdrawal.
A settlement occurs when an employer enters into a transaction that eliminates all further legal of constructive obligations for part or all of
the benefits provided under a defined benefit plan. A curtailment arises from an isolated event such as closing of a plant, discontinuance of an
operation or termination or suspension of a plan. Gains or losses on the settlement or curtailment of a defined benefit plan are recognized when
the settlement or curtailment occurs.
During 2014, the Company settled its pension plan in Brazil and consequently recognized the corresponding effects of the settlement on the
results of the current period, refer to note 15.

73
COCA-COLA FEMSA, S.A.B. DE C.V. AND SUBSIDIARIES
3.21 Revenue recognitionSales of products are recognized as revenue upon delivery to the customer, and once all the following conditions are satisfied:
• The Company has transferred to the buyer the significant risks and rewards of ownership of the goods;
• The Company retains neither continuing managerial involvement to the degree usually associated with ownership nor effective control over
the goods sold;
• The amount of revenue can be measured reliably;
• It is probable that the economic benefits associated with the transaction will flow to the Company; and
• The costs incurred or to be incurred in respect of the transaction can be measured reliably.
All of the above conditions are typically met at the point in time that goods are delivered to the customer at the customers’ facilities. Net sales
reflect units delivered at list prices reduced by promotional allowances, discounts and the amortization of the agreements with customers to
obtain the rights to sell and promote the Company’s products.
Rendering of services and otherRevenue arising from services of sales of waste material and packing of raw materials are recognized in the other operating income caption in
the consolidated income statement.
The Company recognized these transactions as revenues in accordance with the requirements established in the IAS 18, delivery of goods and
rendering of services, which are:
a) The amount of revenue can be measured reliably;
b) It is probable that the economic benefits associated with the transaction will flow to the entity;
c) The stage of completion of the transaction at the end of the reporting period can be measured reliably; and
d) The costs incurred for the transaction and the costs to complete the transaction can be measured reliably.
Interest income revenue arising from the use by others of entity assets yielding interest is recognized once all the following conditions are
satisfied:
• It is probable that the economic benefits associated with the transaction will flow to the entity; and
• The amount of the revenue can be measured reliably.
For all financial instruments measured at amortized cost and interest bearing financial assets classified as available-for- sale, interest income
or expense is recorded using the effective interest rate (“EIR”), which is the rate that exactly discounts the estimated future cash payments or
receipts through the expected life of the financial instrument or a shorter period, where appropriate, to the net carrying amount of the financial
asset or liability. The related interest income is included in the consolidated statements of income.
3.22 Administrative and selling expensesAdministrative expenses include labor costs (salaries and other benefits, including employee profit sharing “PTU” of employees not directly
involved in the sale of the Company’s products, as well as professional service fees, the depreciation of office facilities, amortization of capitalized
information technology system implementation costs and any other similar costs.
Selling expenses include:
• Distribution: labor costs (salaries and other related benefits), outbound freight costs, warehousing costs of finished products, write off of
returnable bottles in the distribution process, depreciation and maintenance of trucks and other distribution facilities and equipment. For
the years ended December 31, 2014, 2013 and 2012, these distribution costs amounted to Ps. 19,236, Ps. 17,971 and Ps. 16,839, respectively;
• Sales: labor costs (salaries and other benefits including PTU) and sales commissions paid to sales personnel;
• Marketing: labor costs (salaries and other benefits), promotional expenses and advertising costs.
PTU is paid by the Company’s Mexican and Venezuelan subsidiaries to its eligible employees. In Mexico, employee profit sharing is computed at
the rate of 10% of the individual company taxable income, except for considering cumulative dividends received from resident legal persons in
Mexico, depreciation of historical rather tax restated values, foreign exchange gains and losses, which are not included until the asset is disposed
of or the liability is due and other effects of inflation are also excluded. PTU in Mexico is calculated from the same taxable income for income
tax, except for the following: a) neither tax losses from prior years nor the PTU paid during the year are being decrease; and b) payments exempt
from taxes for the employees are fully deductible in the PTU computation.
In Venezuela, employee profit sharing is computed at a rate equivalent to 15% of after tax income, and it is no more than four months of salary.

74
COCA-COLA FEMSA, S.A.B. DE C.V. AND SUBSIDIARIES
3.23 Income taxesIncome tax expense represents the sum of the tax currently payable and deferred tax. Income taxes are charged to consolidated net income as
they are incurred, except when they relate to items that are recognized in other comprehensive income or directly in equity, in which case, the
current and deferred tax are also recognized in other comprehensive income or directly in equity, respectively.
3.23.1 Current income taxesIncome taxes are recorded in the results of the year they are incurred.
3.23.2 Deferred income taxesDeferred tax is recognized on temporary differences between the carrying amounts of assets and liabilities in the consolidated financial
statements and the corresponding tax bases used in the computation of taxable profit. Deferred tax liabilities are generally recognized for all
taxable temporary differences. Deferred tax assets are generally recognized for all deductible temporary differences to the extent that it is
probable that taxable profits will be available against which those deductible temporary differences can be utilized and if any, future benefits
from tax loss carry forwards and certain tax credits. Such deferred tax assets and liabilities are not recognized if the temporary difference
arises from initial recognition of goodwill or from the initial recognition (other than in a business combination) of other assets and liabilities in
a transaction that affects neither the taxable profit nor the accounting profit, except in the case of Brazil, where certain goodwill amounts are
at times deductible for tax purposes.
Deferred tax liabilities are recognized for taxable temporary differences associated with investments in subsidiaries, associates, and interests
in joint ventures, except where the Company is able to control the reversal of the temporary difference and it is probable that the temporary
difference will not reverse in the foreseeable future. Deferred tax assets arising from deductible temporary differences associated with such
investments and interests are only recognized to the extent that it is probable that there will be sufficient taxable profits against which to utilize
the benefits of the temporary differences and they are expected to reverse in the foreseeable future.
Deferred income taxes are classified as a non-current asset or liability, regardless of when the temporary differences are expected to reverse. The
carrying amount of deferred tax assets is reviewed at the end of each reporting period and reduced to the extent that it is no longer probable that
sufficient taxable profits will be available to allow all or part of the asset to be recovered.
Deferred tax assets and liabilities are measured at the tax rates that are expected to apply in the period in which the liability is settled or the asset
realized, based on tax rates (and tax laws) that have been enacted or substantively enacted by the end of the reporting period. The measurement
of deferred tax liabilities and assets reflects the tax consequences that would follow from the manner in which the Company expects, at the end
of the reporting period, to recover or settle the carrying amount of its assets and liabilities.
In Mexico, the income tax rate is 30% for 2012, 2013 and 2014. As a result of the Mexican Tax Reform discussed below, it will also be 30% for
2015.
3.24 Share-based payments transactionsSenior executives of the Company receive remuneration in the form of share-based payment transactions, whereby employees render services
as consideration for equity instruments. The equity instruments are granted and then held by a trust controlled by FEMSA. They are accounted
for as equity settled transactions. The award of equity instruments is granted to a fixed value.
Share-based payments to employees are measured at the fair value of the equity instruments at the grant date. The fair value determined at the
grant date of the share-based payments is expensed and recognized based on the graded vesting method over the vesting period.
3.25 Earnings per shareThe Company presents basic earnings per share (EPS) data for its shares. The Company does not have potentially dilutive shares and therefore
its basic earnings per share is equivalent to its diluted earnings per share. Basic EPS is calculated by dividing the net income attributable to
controlling interest by the weighted average number of shares outstanding during the period adjusted for the weighted average of own shares
purchased in the year.
3.26 Issuance of stockThe Company recognizes the issuance of own stock as an equity transaction. The difference between the book value of the shares issued and the
amount contributed by the non-controlling interest holder or third party is recorded as additional paid-in capital.
75
COCA-COLA FEMSA, S.A.B. DE C.V. AND SUBSIDIARIES
NOTE 4. MERGERS AND ACQUISITIONS
4.1 Mergers and AcquisitionsThe Company have had certain business mergers and acquisitions that were recorded using the acquisition method of accounting. The results
of the acquired operations have been included in the consolidated financial statements since the date on which the Company obtained control
of the business, as disclosed below. Therefore, the consolidated statements of income and the consolidated statements of financial position in the
years of such acquisitions are not comparable with previous periods. The consolidated statements of cash flows for the years ended December
31, 2013 and 2012 show the merged and acquired operations net of the cash related to those mergers and acquisitions. For the year ended
December 31, 2014, the Company did not have any acquisitions or mergers.
While all of the acquired companies disclosed below represent bottlers of Coca-Cola trademarked beverages, such acquired entities were not
under common ownership control prior to their acquisition.
4.1.1 Acquisition of Grupo SpaipaOn October 29, 2013, the Company through its Brazilian subsidiary Spal Industria Brasileira de Bebidas, S.A. completed the acquisition of 100%
of Grupo Spaipa. Grupo Spaipa is comprised of the bottler entity Spaipa S.A. Industria Brasileira de Bebidas and three Holding Companies
(collectively “Spaipa”) for Ps. 26,856 in an all cash transaction. Spaipa was a bottler of Coca-Cola trademark products which operated mainly in
Sao Paulo and Paraná, Brazil. This acquisition was made to reinforce the Company’s leadership position in Brazil. Transaction related costs of
Ps. 8 were expensed by the Company as incurred, and recorded as a component of administrative expenses in the accompanying consolidated
income statements. Spaipa was included in the operating results from November 2013.
The fair value of Grupo Spaipa net assets acquired is as follows:
ADDITIONAL FAIR FINAL PRELIMINARY ESTIMATE VALUE PURCHASE PRICE DISCLOSED IN 2013 ADJUSTMENTS ALLOCATION
Total current assets, including cash acquired of Ps. 3,800 Ps. 5,918 Ps. - Ps. 5,918Total non-current assets 5,390 (300) (1) 5,090Distribution rights 13,731 (1,859) 11,872Total assets 25,039 (2,159) 22,880Total liabilities (5,734) (1,073)( 2) (6,807)Net assets acquired 19,305 (3,232) 16,073Goodwill 7,551 3,232 10,783Total consideration transferred Ps. 26,856 Ps. - Ps. 26,856
(1) Originated by changes in fair value of property, plant and equipment and investment in associates.
(2) Originated by identification of new contingencies existed before adquisition date as well as changes in valuation of contingencies identified at adquisition date.
The Company expects to recover the amount recorded as goodwill through synergies related to the available production capacity. Goodwill has
been allocated to the Company´s cash generating unit in Brazil. The goodwill recognized and expected to be deductible for income tax purposes
according to Brazil tax law, is Ps. 22,202.
Selected income statement information of Spaipa for the period from the acquisition date through to December 31, 2013 is as follows:
INCOME STATEMENT 2013
Total revenues Ps. 2,466Income before taxes 354Net income 311
4.1.2 Acquisition of Companhia Fluminense de RefrigerantesOn August 22, 2013, the Company through its Brazilian subsidiary Spal Industria Brasileira de Bebidas S.A., completed the acquisition of 100%
of Companhia Fluminense de Refrigerantes (“Companhia Fluminense”) for Ps. 4,657 in an all cash transaction. Companhia Fluminense was a
bottler of Coca-Cola trademark products which operated in the states of Minas Gerais, Rio de Janeiro, and Sao Paulo, Brazil. This acquisition was
made to reinforce the Company’s leadership position in Brazil. Transaction related costs of Ps. 11 were expensed by the Company as incurred,
and recorded as a component of administrative expenses in the accompanying consolidated income statements. Companhia Fluminense was
included in operating results from September 2013.

76
COCA-COLA FEMSA, S.A.B. DE C.V. AND SUBSIDIARIES
The fair value of Companhia Fluminense net assets acquired is as follows:
ADDITIONAL FAIR FINAL PRELIMINARY ESTIMATE VALUE PURCHASE PRICE DISCLOSED IN 2013 ADJUSTMENTS ALLOCATION
Total current assets, including cash acquired of Ps. 9 Ps. 515 Ps. - Ps. 515Total non-current assets 1,467 254 (1) 1,721Distribution rights 2,634 (557) 2,077Total assets 4,616 (303) 4,313Total liabilities (1,581) (382) (2) (1,963)Net assets acquired 3,035 (685) 2,350Goodwill 1,622 685 2,307Total consideration transferred Ps. 4,657 Ps. - Ps. 4,657
(1) Originated by changes in fair value of property, plant and equipment and investment in associates.
(2) Originated by identification of new contingencies existed before adquisition date as well as changes in valuation of contingencies identified at adquisition date.
The Company expects to recover the amount recorded as goodwill through synergies related to the available production capacity. Goodwill has
been allocated to the Company cash generating unit in Brazil. The goodwill recognized is expected to be deductible for income tax purposes
according to Brazil tax law is Ps. 4,581.
Selected income statement information of Companhia Fluminense for the period from the acquisition date through to December 31, 2013 is as
follows:
INCOME STATEMENT 2013
Total revenues Ps. 981Loss before taxes (39)Net loss (34)
4.1.3 Merger with Grupo YoliOn May 24, 2013, the Company completed the merger of 100% of Grupo Yoli. Grupo Yoli comprised the bottler entity Yoli de Acapulco, S.A. de
C.V. and nine other entities. Grupo Yoli was a bottler of Coca-Cola trademark products which operates mainly in the state of Guerrero, as well
as in parts of the state of Oaxaca in Mexico. This merger was made to reinforce the Company’s leadership position in Mexico. The transaction
involved the issuance of 42,377,925 new L shares of Coca-Cola FEMSA, along with a cash payment immediately prior to closing of Ps. 1,109, in
exchange for 100% share ownership of Grupo Yoli, which was accomplished through a merger. The total purchase price was Ps. 9,130 based on a
share price of Ps. 189.27 per share on May 24, 2013. Transaction related costs of Ps. 82 were expensed by the Company as incurred, and recorded
as a component of administrative expenses in the accompanying consolidated income statements. Grupo Yoli was included in operating results
from June 2013.
The fair value of Grupo Yoli net assets acquired is as follows:
2013
Total current assets, including cash acquired of Ps. 63 Ps. 837Total non-current assets 2,144Distribution rights 3,503Total assets 6,484Total liabilities (1,487)Net assets acquired 4,997Goodwill 4,133Total consideration transferred Ps. 9,130
The Company expects to recover the amount recorded as goodwill through synergies related to the available production capacity. Goodwill has
been allocated to the Company’s cash generating unit in Mexico. The entire amount of goodwill will not be tax deductible.
Selected income statement information of Grupo Yoli for the period from to the acquisition date through December 31, 2013 is as follows:
INCOME STATEMENT 2013
Total revenues Ps. 2,240Income before taxes 70Net income 44

77
COCA-COLA FEMSA, S.A.B. DE C.V. AND SUBSIDIARIES
4.1.4 Merger with Grupo Fomento QueretanoOn May 4, 2012, Coca-Cola FEMSA completed the merger of 100% of Grupo Fomento Queretano. Grupo Fomento Queretano comprised the
bottler entity Refrescos Victoria del Centro, S. de R.L. de C.V. and three other entities. Grupo Fomento Queretano was a bottler of Coca-Cola
trademark products in the state of Queretaro in Mexico. This merger was made to reinforce the Company’s leadership position in Mexico. The
transaction involved the issuance of 45,090,375 new L shares of Coca-Cola FEMSA, along with a cash payment prior to closing of Ps. 1,221, in
exchange for 100% share ownership of Grupo Fomento Queretano, which was accomplished through a merger. The total purchase price was
Ps. 7,496 based on a share price of Ps. 139.22 per share on May 4, 2012. Transaction related costs of Ps. 12 were expensed by the Company as
incurred, and recorded as a component of administrative expenses in the accompanying consolidated statements of income. Grupo Fomento
Queretano was included in operating results from May 2012.
The fair value of the Grupo Fomento Queretano’s net assets acquired is as follows:
2012
Total current assets, including cash acquired of Ps. 107 Ps. 445Total non-current assets 2,123Distribution rights 2,921Total assets 5,489Total liabilities (598)Net assets acquired 4,891Goodwill 2,605Total consideration transferred Ps. 7,496
The Company expects to recover the amount recorded as goodwill through synergies related to the available production capacity. Goodwill has
been allocated to Coca-Cola FEMSA’s cash generating unit in Mexico. The entire amount of goodwill will not be tax deductible.
Selected income statement information of Grupo Fomento Queretano from the acquisition date through to December 31, 2012 is as follows:
STATEMENT OF INCOME 2012
Total revenues Ps. 2,293Income before taxes 245Net income 186
Unaudited Pro Forma Financial Data.The following unaudited 2013 consolidated pro forma financial data represent the Company’s historical financial statements, adjusted to give
effect to (i) the acquisition of Spaipa, Companhia Fluminense and merger of Grupo Yoli, mentioned in the preceding paragraphs as if they
occurred on January 1, 2013; and (ii) certain accounting adjustments mainly related to the pro forma depreciation of fixed assets of the acquired
companies.
UNAUDITED PRO FORMA FINANCIAL INFORMATION FOR THE YEAR ENDED DECEMBER 31, 2013
Total revenues Ps. 168,618Income before taxes 15,958Net income 10,357Earnings per share 4.88
Below are pro-forma 2012 results as if Grupo Fomento Queretano was acquired on January 1, 2012.
UNAUDITED PRO FORMA FINANCIAL INFORMATION FOR THE YEAR ENDED DECEMBER 31, 2012
Total revenues Ps. 148,727Income before taxes 20,080Net income 13,951Earnings per share 6.64

78
COCA-COLA FEMSA, S.A.B. DE C.V. AND SUBSIDIARIES
NOTE 5. CASH AND CASH EQUIVALENTS
For the purposes of the statement of cash flows, cash includes cash on hand and in banks and cash equivalents, which are short-term, highly
liquid investments that are readily convertible to known amounts of cash and which are subject to an insignificant risk of changes in value, with
a maturity date of three months or less at their acquisition date. Cash at the end of the reporting period consists of the following:
2014 2013
Cash and bank balances Ps. 7,212 Ps. 10,542Cash equivalents (see Note 3.5) 5,746 4,764 Ps. 12,958 Ps. 15,306
As explained in Note 3.3 above, the Company operates in Venezuela, which has a certain level of exchange control restricitons, which might
prevent cash and cash equivalent balances from be available for use elsewhere in the group. At December 31, 2014 and 2013, cash and cash
equivalent balances of the Company’s Venezuela subsidiary were Ps. 1,950 and Ps. 5,548, respectively.
NOTE 6. ACCOUNTS RECEIVABLE
2014 2013
Trade receivables Ps. 7,428 Ps. 7,406Current trade customer notes receivable 227 184The Coca-Cola Company (related party) (Note 13) 1,584 1,700Loans to employees 154 211Travel advances to employees 18 47FEMSA and subsidiaries (related parties) (Note 13) 480 27Other related parties (Note 13) 246 199Other 569 583Allowance for doubtful accounts on trade receivables (367) (399) Ps. 10,339 Ps. 9,958
6.1 Trade receivablesAccounts receivable representing rights arising from sales and loans to employees or any other similar concept, are presented net of discounts
and the allowance for doubtful accounts.
Coca-Cola FEMSA has accounts receivable from The Coca-Cola Company arising from the latter’s participation in advertising and promotional
programs and investment in refrigeration equipment and returnable bottles made by Coca-Cola FEMSA.
The carrying value of accounts receivable approximates its fair value as of December 31, 2014 and 2013.
AGING OF TRADE RECEIVABLES PAST DUE BUT NOT IMPAIRED 2014 2013
60-90 days Ps. 33 Ps. 2090-120 days 7 8120 + days 27 34Total Ps. 67 Ps. 62
6.2 Changes in the allowance for doubtful accounts 2014 2013 2012
Balance at beginning of the year Ps. 399 Ps. 329 Ps. 298Allowance for the year 82 138 280Charges and write-offs of uncollectible accounts (78) (24) (221)Restatement of beginning balance in hyperinflationary economies and effects of changes in foreign exchange rates (36) (44) (28)Balance at end of the year Ps. 367 Ps. 399 Ps. 329
In determining the recoverability of trade receivables, the Company considers any change in the credit quality of the trade receivable from the
date credit was initially granted up to the end of the reporting period. The concentration of credit risk is limited due to the customer base being
large and unrelated.
79
COCA-COLA FEMSA, S.A.B. DE C.V. AND SUBSIDIARIES
AGING OF IMPAIRED TRADE RECEIVABLES 2014 2013
60-90 days Ps. 13 Ps. 6790-120 days 10 11120+ days 344 321Total Ps. 367 Ps. 399
6.3 Payments from The Coca-Cola Company:The Coca-Cola Company participates in certain advertising and promotional programs as well as in the Company’s refrigeration equipment
and returnable bottles investment program. Contributions received by the Company for advertising and promotional incentives are recognized
as a reduction in selling expenses and contributions received for the refrigeration equipment and returnable bottles investment program are
recorded as a reduction in the investment in refrigeration equipment and returnable bottles items. For the years ended December 31, 2014, 2013
and 2012 contributions received were Ps. 4,118, Ps. 4,206 and Ps. 3,018, respectively.
NOTE 7. INVENTORIES
2014 2013
Finished products Ps. 2,724 Ps. 2,402Raw materials 2,995 4,295Non strategic spare parts 1,111 1,232Inventories in transit 819 946Packing materials 61 92Other 109 163 Ps. 7,819 Ps. 9,130
As of December 31, 2014, 2013 and 2012, the Company recognized write-downs of its inventories for Ps. 248, Ps. 457 and Ps. 95, respectively to
net realizable value for any periods presented in these consolidated financial statements.
For the years ended at 2014, 2013 and 2012, changes in inventories are comprised as follows and included in the consolidated income statement
under the cost of goods sold caption:
2014 2013 2012
Changes in inventories of finished goods and work in progress Ps. 13,409 Ps. 9,247 Ps. 9,606Raw materials and consumables used 53,535 49,075 50,363Total Ps. 66,944 Ps. 58,322 Ps. 59,969
NOTE 8. OTHER CURRENT ASSETS AND OTHER CURRENT FINANCIAL ASSETS
8.1 Other Current Assets: 2014 2013
Prepaid expenses Ps. 1,051 Ps. 1,334Agreements with customers 161 148Other 174 101 Ps. 1,386 Ps. 1,583
Prepaid expenses as of December 31, 2014 and 2013 are as follows:
2014 2013
Advances for inventories Ps. 364 Ps. 469Advertising and promotional expenses paid in advance 142 141Advances to service suppliers 363 212Prepaid insurance 24 28Others 158 484 Ps. 1,051 Ps. 1,334
Amortization of advertising and promotional expenses paid in advance recorded in the consolidated income statements for the years ended
December 31, 2014, 2013 and 2012 amounted to Ps. 3,488, Ps. 5,391 and Ps. 3,681, respectively.
8.2 Other Current Financial Assets: 2014 2013
Restricted cash Ps. 1,213 Ps. 3,106Derivative financial instruments (See note 19) 331 28 Ps. 1,544 Ps. 3,134

80
COCA-COLA FEMSA, S.A.B. DE C.V. AND SUBSIDIARIES
The Company has pledged part of its short-term deposits in order to fulfill the collateral requirements for the accounts payable in different
currencies. As of December 31, 2014 and 2013, the fair value of the short-term deposit pledged were:
2014 2013
Venezuelan bolivars Ps. 550 Ps. 2,658Brazilian reais 640 340Colombian pesos 23 108Total restricted cash Ps. 1,213 Ps. 3,106
NOTE 9. INVESTMENTS IN ASSOCIATES AND JOINT VENTURES
Details of the investments accounted for under the equity method at the end of the reporting period are as follows:
OWNERSHIP PERCENTAGE CARRYING AMOUNT PRINCIPAL PLACE OF INVESTEE ACTIVITY INCORPORATION 2014 2013 2014 2013
Joint ventures: Compañía Panameña de Bebidas, S.A.P.I. de C.V. Beverages Mexico 50.0% 50.0% Ps. 1,740 Ps. 892 Dispensadoras de Café, S.A.P.I. de C.V. Services Mexico 50.0% 50.0% 190 187 Estancia Hidromineral Itabirito, LTDA Bottling and distribution Brazil 50.0% 50.0% 164 142 Coca-Cola FEMSA Philippines, Inc. Bottling Philippines 51.0% 51.0% 9,021 9,398
Associates: Jugos del Valle, S.A.P.I. de C.V. (1) Beverages Mexico 26.3% 26.2% 1,470 1,470 Leao Alimentos e Bebidas, LTDA (1) (2) Beverages Brazil 24.4% 26.1% 1,670 2,176 Industria Envasadora de Querétaro, S.A. de C.V. (“IEQSA”) (1) Caned bottling Mexico 32.8% 32.8% 194 181 Industria Mexicana de Reciclaje, S.A. de C.V. (“IMER”) (1) Recycling Mexico 35.0% 35.0% 98 90 Promotora Industrial Azucarera, S.A. de C.V. (1) Sugar production Mexico 36.3% 36.3% 2,082 2,034 KSP Participacoes LTDA (1) Beverages Brazil 38.7% 38.7% 91 85 Other Various Various Various Various 606 112 Ps. 17,326 Ps. 16,767
Accounting method:
(1) The Company has significant influence due to the fact that it has power to participate in the financial and operating policy decisions of the investee.
(2) During March 2013, Holdfab2 Partiçipações Societárias, LTDA and SABB- Sistema de Alimentos e Bebidas Do Brasil, LTDA. were merged into Leao Alimentos e Bebidas, Ltda.
As mentioned in Note 4, on May 24, 2013 and May 4, 2012, the Company completed the acquisition of 100% of Grupo Yoli and Grupo Fomento
Queretano, respectively. As part of these acquisitions, the Company increased its equity interest to 36.3% and 26.1% in Promotora Industrial
Azucarera, S.A de C.V., respectively. The Company has recorded the incremental interest acquired at its estimated fair value.
During 2014 the Company converted its account receivable from Compañía Panameña de Bebidas, S.A.P.I. de C.V. in the amount of Ps. 814 into
an additional capital contribution in the investee.
During 2014 and 2013 the Company made capital contributions to Jugos del Valle, S.A.P.I. de C.V. in the amount of Ps, 25 and Ps 27, respectively.
During 2014 the Company received dividends from Jugos del Valle, S.A.P.I. de C.V. in the amount of Ps. 48.
On January 25, 2013, the Company finalized the acquisition of 51% of CCFPI for an amount of $688.5 U.S. dollars (Ps. 8,904) in an all-cash
transaction. As part of the agreement, the Company obtained a call option to acquire the remaining 49% of CCFPI at any time during the seven
years following the closing. The Company also has a put option to sell its 51% ownership to The Coca-Cola Company at any time from the fifth
anniversary of the date of acquisition until the sixth anniversary, at a price which is based in part on the fair value of CCFPI at the date of
acquisition (See Note 19.7).
From the date of the investment acquisition through December 31, 2014, the results of CCFPI have been recognized by the Company using
the equity method, this is based on the following factors: (i) during the initial four-year period some relevant activities require joint approval
between the Company and TCCC; and (ii) potential voting rights to acquire the remaining 49% of CCFPI are not probable to be executed in the
foreseeable future due to the fact the call option is “out of the money” as of December 31, 2014 and 2013.

81
COCA-COLA FEMSA, S.A.B. DE C.V. AND SUBSIDIARIES
The following table shows the combined summarized financial information for individually immaterial Company’s associates accounted for
under the equity method.
2014 2013 2012
Total current assets Ps. 8,622 Ps. 8,232 Ps. 6,958Total non-current assets 17,854 18,957 12,023Total current liabilities 5,612 4,080 3,363Total non-current liabilities 2,684 3,575 2,352Total revenue 20,796 20,889 16,609Total cost and expenses 20,173 20,581 15,514Net income 534 497 858
The following table shows the combined summarized financial information for individually immaterial Company’s joint ventures accounted for
under the equity method.
2014 2013 2012
Total current assets Ps. 8,735 Ps. 8,622 Ps. 1,612Total non-current assets 22,689 18,483 2,616Total current liabilities 5,901 6,547 1,977Total non-current liabilities 2,699 1,939 106Total revenue 18,557 16,844 2,187Total cost and expenses 19,019 16,622 2,262Net (loss) income (321) 125 (77)
NOTE 10. PROPERTY, PLANT AND EQUIPMENT, NET
INVESTMENTS MACHINERY IN FIXED AND REFRIGERATION RETURNABLE ASSETS IN LEASEHOLD COST LAND BUILDINGS EQUIPMENT EQUIPMENT BOTTLES PROGRESS IMPROVEMENTS OTHER TOTAL
Cost as of January 1, 2012 Ps. 3,404 Ps. 10,887 Ps. 28,644 Ps. 11,296 Ps. 4,115 Ps. 3,028 Ps. 425 Ps. 581 Ps. 62,380Additions 97 214 2,262 1,544 1,434 3,838 166 186 9,741Additions from business combinations 206 390 486 84 18 - - - 1,184Adjustments of fair value of past business combinations 57 312 (462) (39) (77) - (1) - (210)Transfer of completed projects in progress 137 210 1,106 901 765 (3,125) 6 - -Transfer (to)/from assets classified as held for sale - - (27) - - - - - (27)Disposals (16) (99) (847) (591) (324) (14) (1) (69) (1,961)Effects of changes in foreign exchange rates (107) (485) (1,475) (451) (134) (28) (58) (41) (2,779)Changes in value on the recognition of inflation effects 85 471 1,138 275 17 (31) - 83 2,038Capitalization of borrowing costs - - 16 - - - - - 16Cost as of December 31, 2012 Ps. 3,863 Ps. 11,900 Ps. 30,841 Ps. 13,019 Ps. 5,814 Ps. 3,668 Ps. 537 Ps. 740 Ps. 70,382
82
COCA-COLA FEMSA, S.A.B. DE C.V. AND SUBSIDIARIES
INVESTMENTS MACHINERY IN FIXED AND REFRIGERATION RETURNABLE ASSETS IN LEASEHOLD COST LAND BUILDINGS EQUIPMENT EQUIPMENT BOTTLES PROGRESS IMPROVEMENTS OTHER TOTAL
Cost as of January 1, 2013 Ps. 3,863 Ps. 11,900 Ps. 30,841 Ps. 13,019 Ps. 5,814 Ps. 3,668 Ps. 537 Ps. 740 Ps. 70,382Additions 77 120 1,512 1,445 1,435 5,685 - 341 10,615Additions from business combinations 534 2,268 2,414 428 96 614 - 264 6,618Transfer of completed projects in progress 389 750 875 1,144 785 (3,991) 48 - -Transfer (to)/from assets classified as held for sale - - (189) - - - - - (189)Disposals (1) (168) (968) (749) (324) (332) (12) (14) (2,568)Effects of changes in foreign exchange rates (250) (1,331) (3,588) (1,135) (466) (208) (99) (55) (7,132)Changes in value on the recognition of inflation effects 228 1,191 2,252 603 46 165 - 277 4,762Capitalization of borrowing costs - - 32 - - - - - 32Cost as of December 31, 2013 Ps. 4,840 Ps. 14,730 Ps. 33,181 Ps. 14,755 Ps. 7,386 Ps. 5,601 Ps. 474 Ps. 1,553 Ps. 82,520
INVESTMENTS MACHINERY IN FIXED AND REFRIGERATION RETURNABLE ASSETS IN LEASEHOLD COST LAND BUILDINGS EQUIPMENT EQUIPMENT BOTTLES PROGRESS IMPROVEMENTS OTHER TOTAL
Cost as of January 1, 2014 Ps. 4,840 Ps. 14,730 Ps. 33,181 Ps. 14,755 Ps. 7,386 Ps. 5,601 Ps. 474 Ps. 1,553 Ps. 82,520Additions 532 42 542 327 398 8,787 - 234 10,862Adjustments of fair value of past business combinations (115) (610) 891 (57) - (68) 99 (253) (113)Transfer of completed projects in progress - 1,263 2,708 1,523 1,994 (7,581) 90 3 -Transfer (to)/from assets classified as held for sale - - (134) - - - - - (134)Disposals (10) (113) (1,516) (632) (60) (1) (14) (79) (2,425)Effects of changes in foreign exchange rates (663) (3,117) (5,959) (1,975) (323) - (42) (506) (12,585)Changes in value on the recognition of inflation effects 110 355 536 186 7 29 - 110 1,333Capitalization of borrowing costs - - 33 - - 263 - - 296Cost as of December 31, 2014 Ps. 4,694 Ps. 12,550 Ps. 30,282 Ps. 14,127 Ps. 9,402 Ps. 7,030 Ps. 607 Ps. 1,062 Ps. 79,754
INVESTMENTS MACHINERY IN FIXED AND REFRIGERATION RETURNABLE ASSETS IN LEASEHOLD ACCUMULATED DEPRECIATION LAND BUILDINGS EQUIPMENT EQUIPMENT BOTTLES PROGRESS IMPROVEMENTS OTHER TOTAL
Accumulated depreciation as of January 1, 2012 Ps. - Ps. (3,485) Ps. (13,020) Ps. (6,419) Ps. (1,031) Ps. - Ps. (115) Ps. (208) Ps. (24,278)Depreciation for the year - (252) (2,279) (1,301) (1,149) - (25) (72) (5,078)Transfer (to)/from assets classified as held for sale - - 12 - - - - (26) (14)Disposals - 138 520 492 200 - 7 1 1,358Effects of changes in foreign exchange rates - 200 754 303 (5) - 68 (5) 1,315Changes in value on the recognition of inflation effects - (288) (672) (200) (3) - - (5) (1,168)Accumulated depreciation as of December 31, 2012 Ps. - Ps. (3,687) Ps. (14,685) Ps. (7,125) Ps. (1,988) Ps. - Ps. (65) Ps. (315) Ps. (27,865)

83
COCA-COLA FEMSA, S.A.B. DE C.V. AND SUBSIDIARIES
INVESTMENTS MACHINERY IN FIXED AND REFRIGERATION RETURNABLE ASSETS IN LEASEHOLD ACCUMULATED DEPRECIATION LAND BUILDINGS EQUIPMENT EQUIPMENT BOTTLES PROGRESS IMPROVEMENTS OTHER TOTAL
Accumulated depreciation as of January 1, 2013 Ps. - Ps. (3,687) Ps. (14,685) Ps. (7,125) Ps. (1,988) Ps. - Ps. (65) Ps. (315) Ps. (27,865)Depreciation for the year - (297) (2,639) (1,631) (1,662) - (46) (96) (6,371)Transfer (to)/from assets classified as held for sale - - 88 - - - - - 88Disposals - 160 953 785 33 - 12 6 1,949Effects of changes in foreign exchange rates - 587 2,044 755 143 - 8 73 3,610Changes in value on the recognition of inflation effects - (583) (993) (442) (6) - - (122) (2,146)Accumulated depreciation as of December 31, 2013 Ps. - Ps. (3,820) Ps. (15,232) Ps. (7,658) Ps. (3,480) Ps. - Ps. (91) Ps. (454) Ps. (30,735)
INVESTMENTS MACHINERY IN FIXED AND REFRIGERATION RETURNABLE ASSETS IN LEASEHOLD ACCUMULATED DEPRECIATION LAND BUILDINGS EQUIPMENT EQUIPMENT BOTTLES PROGRESS IMPROVEMENTS OTHER TOTAL
Accumulated depreciation as of January 1, 2014 Ps. - Ps. (3,820) Ps. (15,232) Ps. (7,658) Ps. (3,480) Ps. - Ps. (91) Ps. (454) Ps. (30,735)Depreciation for the year - (317) (2,320) (1,396) (1,879) - (45) (115) (6,072)Transfer (to)/from assets classified as held for sale - - 62 - - - - - 62Disposals - 56 1,474 602 57 - 13 1 2,203Effects of changes in foreign exchange rates - 1,512 3,479 1,046 105 - 1 236 6,379Changes in value on the recognition of inflation effects - (175) (692) (135) (8) - - (54) (1,064)Accumulated depreciation as of December 31, 2014 Ps. - Ps. (2,744) Ps. (13,229) Ps. (7,541) Ps. (5,205) Ps. - Ps. (122) Ps. (386) Ps. (29,227)
INVESTMENTS MACHINERY IN FIXED AND REFRIGERATION RETURNABLE ASSETS IN LEASEHOLD CARRYING AMOUNT LAND BUILDINGS EQUIPMENT EQUIPMENT BOTTLES PROGRESS IMPROVEMENTS OTHER TOTAL
As of December 31, 2012 Ps. 3,863 Ps. 8,213 Ps. 16,156 Ps. 5,894 Ps. 3,826 Ps. 3,668 Ps. 472 Ps. 425 Ps. 42,517As of December 31, 2013 Ps. 4,840 Ps. 10,910 Ps. 17,949 Ps. 7,097 Ps. 3,906 Ps. 5,601 Ps. 383 Ps. 1,099 Ps. 51,785As of December 31, 2014 Ps. 4,694 Ps. 9,806 Ps. 17,053 Ps. 6,586 Ps. 4,197 Ps. 7,030 Ps. 485 Ps. 676 Ps. 50,527
During the years ended December 31, 2014, 2013 and 2012 the Company capitalized Ps. 296, Ps. 32 and Ps. 16, respectively of borrowing costs in
relation to Ps. 1,915, Ps. 790 and Ps. 196 in qualifying assets. The effective interest rates used to determine the amount of borrowing costs eligible
for capitalization were 4.8%, 4.1% and 4.3% respectively.
For the years ended December 31, 2014, 2013 and 2012 interest expenses and net foreign exchange losses (gains) are analyzed as follows:
2014 2013 2012
Interest expense and foreign exchange, net Ps. 6,760 Ps. 3,830 Ps. 1,284Amount capitalized (1) 338 57 38Net amount in consolidated statements of income Ps. 6,422 Ps. 3,773 Ps. 1,246
(1) Amount capitalized in property, plant and equipment and amortized intangible assets. Commitments related to acquisitions of property, plant and equipment are disclosed in Note 24.
84
COCA-COLA FEMSA, S.A.B. DE C.V. AND SUBSIDIARIES
NOTE 11. INTANGIBLE ASSETS
RIGHTS TO PRODUCE AND OTHER DISTRIBUTE INDEFINITE TECHNOLOGY COCA-COLA LIVED COSTS AND TRADEMARK INTANGIBLE MANAGEMENT DEVELOPMENT OTHER COST PRODUCTS GOODWILLL ASSETS SYSTEMS SYSTEMS AMORTIZABLES TOTAL
Balance as of January 1, 2012 Ps. 54,938 Ps. 4,515 Ps. 96 Ps. 1,873 Ps. 1,431 Ps. 142 Ps. 62,995Purchases — — 6 34 90 105 235Acquisition from business combinations 2,973 2,605 — — — — 5,578Changes in fair value of past acquisitions (42) (148) — — — — (190)Capitalization of internally developed systems — — — — 38 — 38Transfer of completed development systems — — — 559 (559) — —Effect of movements in exchange rates (478) — — (97) (3) (3) (581)Changes in value on the recognition of inflation effects (121) — — — — — (121)Capitalization of borrowing cost — — — — 22 — 22Cost as of December 31, 2012 Ps. 57,270 Ps. 6,972 Ps. 102 Ps. 2,369 Ps. 1,019 Ps. 244 Ps. 67,976
Balance as of January 1, 2013 Ps. 57,270 Ps. 6,972 Ps. 102 Ps. 2,369 Ps. 1,019 Ps. 244 Ps. 67,976Purchases — — — 107 565 82 754Acquisition from business combinations 19,868 13,306 55 43 — 17 33,289Transfer of completed development systems — — — 172 (172) — —Effect of movements in exchange rates (1,828) (356) (10) (75) — (14) (2,283)Changes in value on the recognition of inflation effects 417 — — — — — 417Capitalization of borrowing cost — — — 25 — — 25Cost as of December 31, 2013 Ps. 75,727 Ps. 19,922 Ps. 147 Ps. 2,641 Ps. 1,412 Ps. 329 Ps. 100,178
Balance as of January 1, 2014 Ps. 75,727 Ps. 19,922 Ps. 147 Ps. 2,641 Ps. 1,412 Ps. 329 Ps. 100,178Purchases - - - 73 179 29 281Changes in fair value of past acquisitions (2,416) 3,917 — — — — 1,501Transfer of completed development systems - — — 278 (278) — —Effect of movements in exchange rates (5,343) (246) (8) (152) (1) (13) (5,763)Changes in value on the recognition of inflation effects 2,295 — — — — — 2,295Capitalization of borrowing cost — — — 42 — — 42Cost as of December 31, 2014 Ps. 70,263 Ps. 23,593 Ps. 139 Ps. 2,882 Ps. 1,312 Ps. 345 Ps. 98,534
Amortization expenseBalances as of January 1, 2012 Ps. — Ps. — Ps. — Ps. (788) Ps. — Ps. (44) Ps. (832)Amortization expense — — — (158) — (60) (218)Disposals — — — 25 — — 25Effect of movements in exchange rate — — — 65 — (3) 62Balances as of December 31, 2012 — — — (856) — (107) (963)Amortization expense — — — (223) — (64) (287)Disposals — — — 2 — — 2Effect of movements in exchange rate — — — 35 — 9 44Balances as of December 31, 2013 — — — (1,042) — (162) (1,204)Amortization expense — — — (231) — (84) (315)Effect of movements in exchange rate — — — — — 9 9Balances as of December 31, 2014 Ps. — Ps. — Ps. — Ps. (1,273) Ps. — Ps. (237) Ps. (1,510)
Balance as of December 31, 2012 Ps. 57,270 Ps. 6,972 Ps. 102 Ps. 1,513 Ps. 1,019 Ps. 137 Ps. 67,013Balance as of December 31, 2013 Ps. 75,727 Ps. 19,922 Ps. 147 Ps. 1,599 Ps. 1,412 Ps. 167 Ps. 98,974Balance as of December 31, 2014 Ps. 70,263 Ps. 23,593 Ps. 139 Ps. 1,609 Ps. 1,312 Ps. 108 Ps. 97,024
During the years ended December 31, 2014, 2013 and 2012 the Company capitalized Ps. 42, Ps. 25 and Ps. 22, respectively of borrowing costs in
relation to Ps. 600, Ps. 630 and Ps. 674 in qualifying assets. The effective interest rates used to determine the amount of borrowing costs eligible
for capitalization were 4.2%, 4.1% and 4.3%.
For the year ended in December 31, 2014, the amortization of intangible assets is recognized in cost of goods sold, selling expenses and
administrative expenses and amounted to Ps. 3, Ps. 188 and Ps. 255, respectively.
For the year ended in December 31, 2013, the amortization of intangible assets is recognized in cost of goods sold, selling expenses and
administrative expenses and amounted to Ps. 1, Ps. 80 and Ps. 206, respectively.
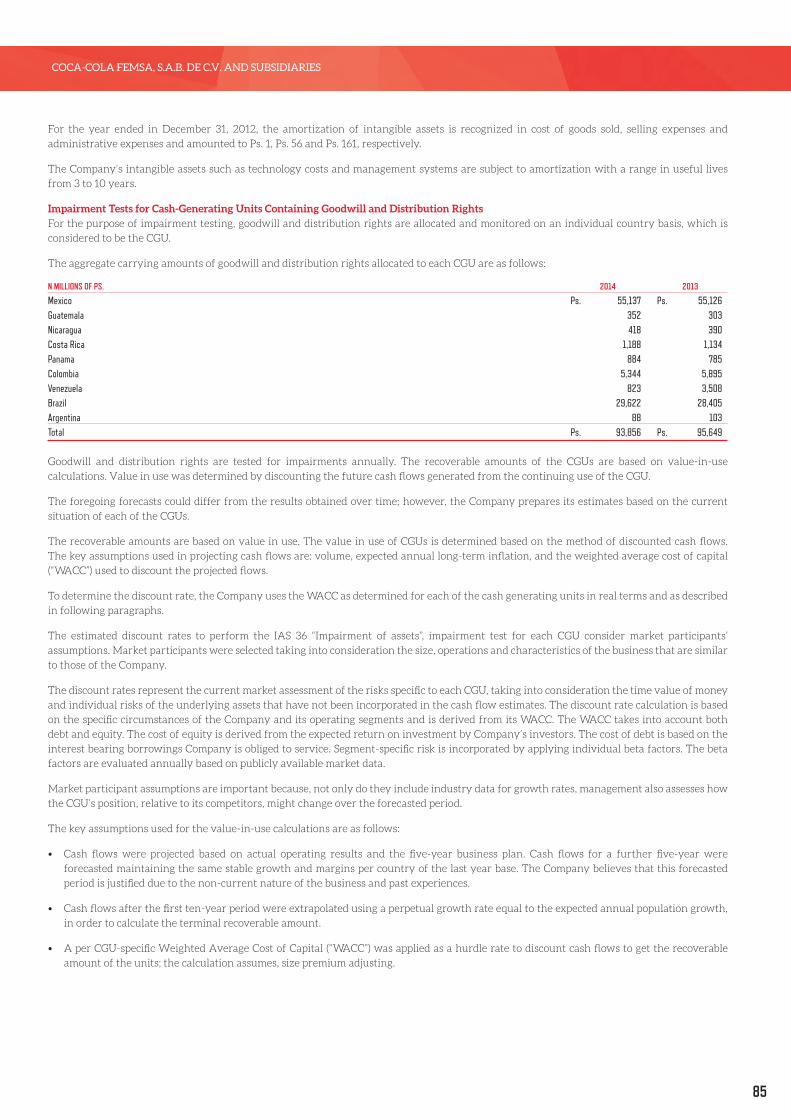
85
COCA-COLA FEMSA, S.A.B. DE C.V. AND SUBSIDIARIES
For the year ended in December 31, 2012, the amortization of intangible assets is recognized in cost of goods sold, selling expenses and
administrative expenses and amounted to Ps. 1, Ps. 56 and Ps. 161, respectively.
The Company’s intangible assets such as technology costs and management systems are subject to amortization with a range in useful lives
from 3 to 10 years.
Impairment Tests for Cash-Generating Units Containing Goodwill and Distribution RightsFor the purpose of impairment testing, goodwill and distribution rights are allocated and monitored on an individual country basis, which is
considered to be the CGU.
The aggregate carrying amounts of goodwill and distribution rights allocated to each CGU are as follows:
N MILLIONS OF PS. 2014 2013
Mexico Ps. 55,137 Ps. 55,126Guatemala 352 303Nicaragua 418 390Costa Rica 1,188 1,134Panama 884 785Colombia 5,344 5,895Venezuela 823 3,508Brazil 29,622 28,405Argentina 88 103Total Ps. 93,856 Ps. 95,649
Goodwill and distribution rights are tested for impairments annually. The recoverable amounts of the CGUs are based on value-in-use
calculations. Value in use was determined by discounting the future cash flows generated from the continuing use of the CGU.
The foregoing forecasts could differ from the results obtained over time; however, the Company prepares its estimates based on the current
situation of each of the CGUs.
The recoverable amounts are based on value in use. The value in use of CGUs is determined based on the method of discounted cash flows.
The key assumptions used in projecting cash flows are: volume, expected annual long-term inflation, and the weighted average cost of capital
(“WACC”) used to discount the projected flows.
To determine the discount rate, the Company uses the WACC as determined for each of the cash generating units in real terms and as described
in following paragraphs.
The estimated discount rates to perform the IAS 36 “Impairment of assets”, impairment test for each CGU consider market participants’
assumptions. Market participants were selected taking into consideration the size, operations and characteristics of the business that are similar
to those of the Company.
The discount rates represent the current market assessment of the risks specific to each CGU, taking into consideration the time value of money
and individual risks of the underlying assets that have not been incorporated in the cash flow estimates. The discount rate calculation is based
on the specific circumstances of the Company and its operating segments and is derived from its WACC. The WACC takes into account both
debt and equity. The cost of equity is derived from the expected return on investment by Company’s investors. The cost of debt is based on the
interest bearing borrowings Company is obliged to service. Segment-specific risk is incorporated by applying individual beta factors. The beta
factors are evaluated annually based on publicly available market data.
Market participant assumptions are important because, not only do they include industry data for growth rates, management also assesses how
the CGU’s position, relative to its competitors, might change over the forecasted period.
The key assumptions used for the value-in-use calculations are as follows:
• Cash flows were projected based on actual operating results and the five-year business plan. Cash flows for a further five-year were
forecasted maintaining the same stable growth and margins per country of the last year base. The Company believes that this forecasted
period is justified due to the non-current nature of the business and past experiences.
• Cash flows after the first ten-year period were extrapolated using a perpetual growth rate equal to the expected annual population growth,
in order to calculate the terminal recoverable amount.
• A per CGU-specific Weighted Average Cost of Capital (“WACC”) was applied as a hurdle rate to discount cash flows to get the recoverable
amount of the units; the calculation assumes, size premium adjusting.
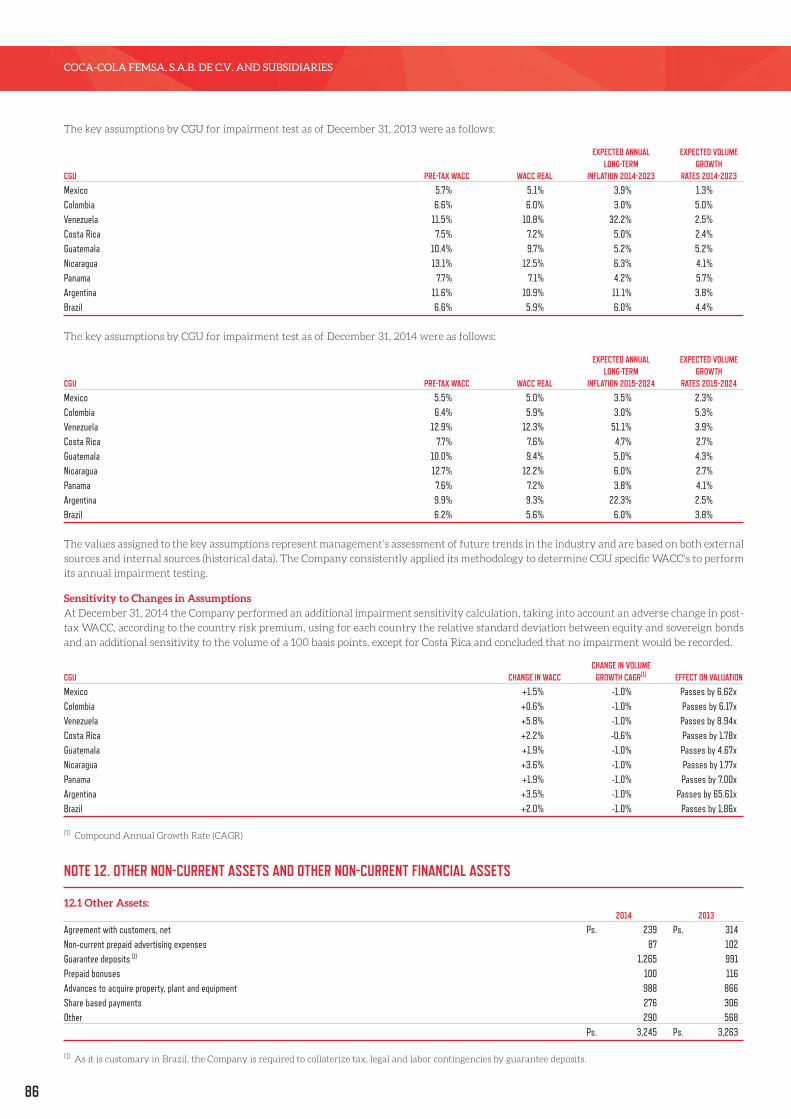
86
COCA-COLA FEMSA, S.A.B. DE C.V. AND SUBSIDIARIES
The key assumptions by CGU for impairment test as of December 31, 2013 were as follows:
EXPECTED ANNUAL EXPECTED VOLUME LONG-TERM GROWTH CGU PRE-TAX WACC WACC REAL INFLATION 2014-2023 RATES 2014-2023
Mexico 5.7% 5.1% 3.9% 1.3%Colombia 6.6% 6.0% 3.0% 5.0%Venezuela 11.5% 10.8% 32.2% 2.5%Costa Rica 7.5% 7.2% 5.0% 2.4%Guatemala 10.4% 9.7% 5.2% 5.2%Nicaragua 13.1% 12.5% 6.3% 4.1%Panama 7.7% 7.1% 4.2% 5.7%Argentina 11.6% 10.9% 11.1% 3.8%Brazil 6.6% 5.9% 6.0% 4.4%
The key assumptions by CGU for impairment test as of December 31, 2014 were as follows:
EXPECTED ANNUAL EXPECTED VOLUME LONG-TERM GROWTH CGU PRE-TAX WACC WACC REAL INFLATION 2015-2024 RATES 2015-2024
Mexico 5.5% 5.0% 3.5% 2.3%Colombia 6.4% 5.9% 3.0% 5.3%Venezuela 12.9% 12.3% 51.1% 3.9%Costa Rica 7.7% 7.6% 4.7% 2.7%Guatemala 10.0% 9.4% 5.0% 4.3%Nicaragua 12.7% 12.2% 6.0% 2.7%Panama 7.6% 7.2% 3.8% 4.1%Argentina 9.9% 9.3% 22.3% 2.5%Brazil 6.2% 5.6% 6.0% 3.8%
The values assigned to the key assumptions represent management’s assessment of future trends in the industry and are based on both external
sources and internal sources (historical data). The Company consistently applied its methodology to determine CGU specific WACC’s to perform
its annual impairment testing.
Sensitivity to Changes in AssumptionsAt December 31, 2014 the Company performed an additional impairment sensitivity calculation, taking into account an adverse change in post-
tax WACC, according to the country risk premium, using for each country the relative standard deviation between equity and sovereign bonds
and an additional sensitivity to the volume of a 100 basis points, except for Costa Rica and concluded that no impairment would be recorded.
CHANGE IN VOLUME CGU CHANGE IN WACC GROWTH CAGR(1) EFFECT ON VALUATION
Mexico +1.5% -1.0% Passes by 6.62xColombia +0.6% -1.0% Passes by 6.17xVenezuela +5.8% -1.0% Passes by 8.94xCosta Rica +2.2% -0.6% Passes by 1.78xGuatemala +1.9% -1.0% Passes by 4.67xNicaragua +3.6% -1.0% Passes by 1.77xPanama +1.9% -1.0% Passes by 7.00xArgentina +3.5% -1.0% Passes by 65.61xBrazil +2.0% -1.0% Passes by 1.86x
(1) Compound Annual Growth Rate (CAGR)
NOTE 12. OTHER NON-CURRENT ASSETS AND OTHER NON-CURRENT FINANCIAL ASSETS
12.1 Other Assets: 2014 2013
Agreement with customers, net Ps. 239 Ps. 314Non-current prepaid advertising expenses 87 102Guarantee deposits (1) 1,265 991Prepaid bonuses 100 116Advances to acquire property, plant and equipment 988 866Share based payments 276 306Other 290 568 Ps. 3,245 Ps. 3,263
(1) As it is customary in Brazil, the Company is required to collaterize tax, legal and labor contingencies by guarantee deposits.

87
COCA-COLA FEMSA, S.A.B. DE C.V. AND SUBSIDIARIES
12.2 Other Financial Assets: 2014 2013
Non-current accounts receivable to Compañía Panameña de Bebidas, S.A.P.I. de C.V., due 2021 Ps. - Ps. 893Non-current accounts receivable to Grupo Estrella Azul, due 2016 59 -Other non-current financial assets 98 176Derivative financial instruments 3,003 250 Ps. 3,160 Ps. 1,319
As of December 31, 2014 there are no significant variances between the fair value and the carrying value of long term receivables. As of
December 31, 2013, the fair value of long term accounts receivable amounted to Ps. 957. The fair value is calculated based on the discounted
value of contractual cash flows whereby the discount rate is estimated using rates currently offered for receivable of similar amounts and
maturities, which is considered to be level 2 in the fair value hierarchy.
NOTE 13. BALANCES AND TRANSACTIONS WITH RELATED PARTIES AND AFFILIATED COMPANIES
Balances and transactions between the Company and its subsidiaries, which are related parties of the Company, have been eliminated on
consolidation and are not disclosed in this Note.
The consolidated statements of financial position and consolidated statements of income include the following balances and transactions with
related parties and affiliated companies:
2014 2013
Balances:Assets (current included in accounts receivable) Due from FEMSA and Subsidiaries (see Note 6) (1) (4) Ps. 480 Ps. 27 Due from The Coca-Cola Company (see Note 6) (1) (4) 1,584 1,700 Due from Heineken Group (1) 171 163 Other receivables (1) 75 36Assets (non-current included in other non-current financial assets) Grupo Estrella Azul 59 - Compañía Panameña de Bebidas, S.A.P.I. de C.V. (5) - 893 Ps. 2,369 Ps. 2,819
2014 2013
Liabilities (current included in suppliers and other liabilities and loans) Due to FEMSA and Subsidiaries (3) (4) Ps. 1,083 Ps. 877 Due to The Coca-Cola Company (3) (4) 4,343 5,562 Due to Heineken Group (3) 389 291 Banco Nacional de México, S.A. (2) (6) - 1,962 Compañía Panameña de Bebidas, S.A.P.I. de C.V. (5) - 2 Other payables (3) 885 395Liabilities (non-current liabilities) BBVA Bancomer, S.A. (2) (6) - 979 Ps. 6,700 Ps. 10,068
(1) Presented within accounts receivable.
(2) Recorded within bank loans.
(3) Recorded within accounts payable.
(4) Holding
(5) Joint venture
(6) Board member

88
COCA-COLA FEMSA, S.A.B. DE C.V. AND SUBSIDIARIES
Balances due from related parties are considered to be recoverable. Accordingly, for the years ended December 31, 2014 and 2013, there was no
expense resulting from the uncollectibility of balances due from related parties.
Details of transactions between the Company and other related parties are disclosed as follows:
TRANSACTIONS 2014 2013 2012Income: Sales to affiliated parties Ps. 3,502 Ps. 3,271 Ps. 5,111 Interest income received from Compañía Panameña de Bebidas, S.A.P.I. de C.V. — 61 58 Interest income received from Grupo Financiero Banamex, S.A. de C.V. 1 34 — Interest income received from BBVA Bancomer, S.A. de C.V. 17 36 —
Expenses: Purchases and other expenses of FEMSA 7,368 5,200 4,484 Purchases of concentrate from The Coca-Cola Company 28,084 22,988 23,886 Purchases of raw material, beer and operating expenses from Heineken 6,288 3,734 2,598 Advertisement expense paid to The Coca-Cola Company 1,167 1,291 1,052 Interest expense and fees paid to BBVA Bancomer, S.A. de C.V. (1) 4 46 51 Purchases from Jugos del Valle 1,803 1,814 1,577 Purchase of sugar from Promotora Industrial Azucarera, S.A. de C.V. 1,020 956 423 Purchase of sugar from Beta San Miguel 1,389 1,557 1,439 Purchase of sugar, cans and aluminum lids from Promotora Mexicana de Embotelladores, S.A. de C.V. 567 670 711 Purchase of canned products from IEQSA 591 615 483 Interest expense paid to Grupo Financiero Banamex, S.A. de C.V. (1) 2 19 — Purchase of plastic bottles from Embotelladora del Atlantico, S.A. (formerly Complejo Industrial Pet, S.A.) 174 124 99 Purchase of resin from Industria Mexicana de reciclaje, S.A. de C.V. 266 — — Donations to Instituto Tecnologico y de Estudios Superiores de Monterrey, A.C. (1) 11 69 68 Interest expense paid to The Coca-Cola Company 4 60 24 Insurance premiums for policies with Grupo Nacional Provincial, S.A.B. (1) 41 16 17 Other expenses with related parties 19 44 191
(1) One or more members of the Board of Directors or senior management of the Company are also members of the Board of Directors or senior management of the counterparties to these transactions.
Also as disclosed in Note 9, during January 2013, the Company purchased its 51% interest in CCFPI from The Coca-Cola Company. The remainder
of CCFPI is owned by The Coca Cola Company and the Company has currently outstanding certain call and put options related to CCFPI’s equity
interests.
The benefits and aggregate compensation paid to executive officers and senior management of the Company were as follows:
2014 2013 2012
Current employee benefits Ps. 584 Ps. 770 Ps. 635Termination benefits 106 5 13Shared based payments 59 273 253
NOTE 14. BALANCES AND TRANSACTIONS IN FOREIGN CURRENCIES
Assets, liabilities and transactions denominated in foreign currencies are those realized in a currency different from the functional currency
of the Company. As of December 31, 2014, 2013 and 2012, assets, liabilities and transactions denominated in foreign currencies, expressed in
Mexican pesos (contractual amounts) are as follows: ASSETS LIABILITIESBALANCES CURRENT NON-CURRENT CURRENT NON-CURRENTAs of December 31, 2014 U.S. dollars 4,270 727 6,566 51,412 Euros — — 23 —As of December 31, 2013 U.S. dollars 3,163 793 5,479 40,852 Euros — — 36 —
PURCHASES OF INTEREST TRANSACTIONS REVENUES RAW MATERIALS EXPENSE OTHERYear ended December 31, 2014 U.S. dollars 606 13,161 1,652 1,741Year ended December 31, 2013 U.S. dollars 409 13,068 432 731Year ended December 31, 2012 U.S. dollars 307 10,715 254 870
Mexican peso exchange rates in effect at the dates of the consolidated statements of financial position and at the issuance date of the Company’s
consolidated financial statements were as follows: DECEMBER 31, FEBRUARY 24, 2014 2013 2012 2015
U.S. dollar 14.7180 13.0765 13.0101 14.9712
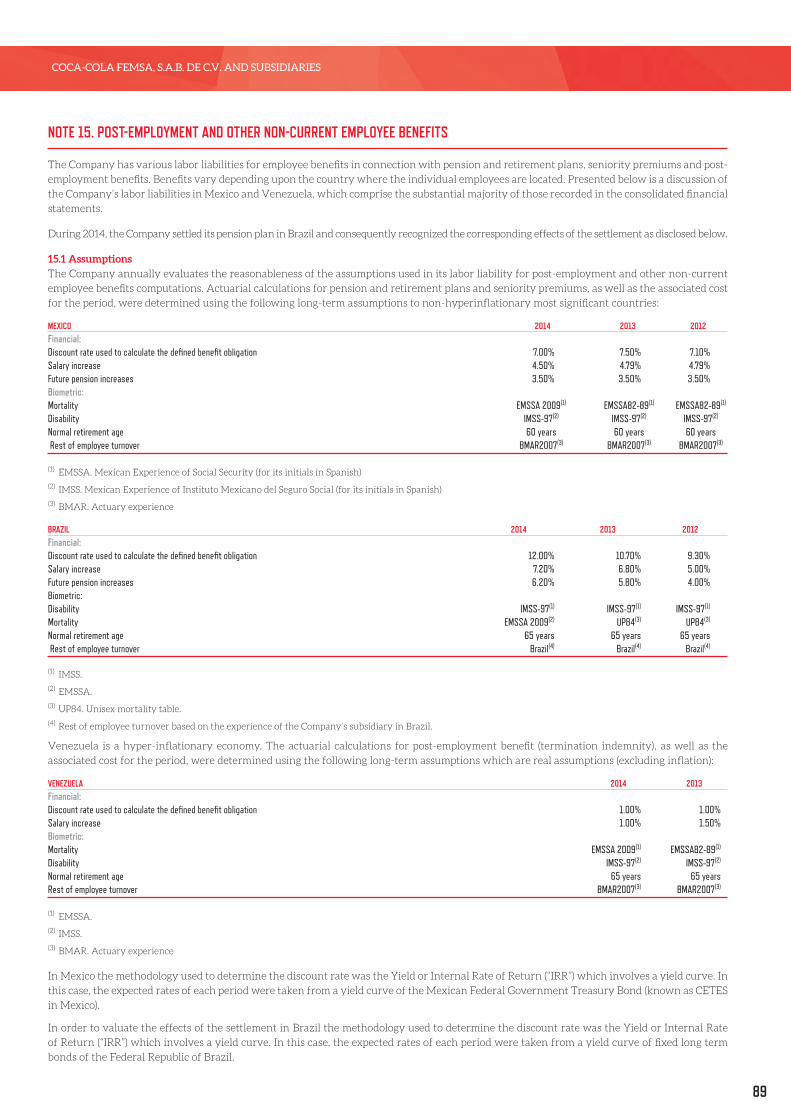
89
COCA-COLA FEMSA, S.A.B. DE C.V. AND SUBSIDIARIES
NOTE 15. POST-EMPLOYMENT AND OTHER NON-CURRENT EMPLOYEE BENEFITS
The Company has various labor liabilities for employee benefits in connection with pension and retirement plans, seniority premiums and post-
employment benefits. Benefits vary depending upon the country where the individual employees are located. Presented below is a discussion of
the Company’s labor liabilities in Mexico and Venezuela, which comprise the substantial majority of those recorded in the consolidated financial
statements.
During 2014, the Company settled its pension plan in Brazil and consequently recognized the corresponding effects of the settlement as disclosed below.
15.1 AssumptionsThe Company annually evaluates the reasonableness of the assumptions used in its labor liability for post-employment and other non-current
employee benefits computations. Actuarial calculations for pension and retirement plans and seniority premiums, as well as the associated cost
for the period, were determined using the following long-term assumptions to non-hyperinflationary most significant countries:
MEXICO 2014 2013 2012Financial:Discount rate used to calculate the defined benefit obligation 7.00% 7.50% 7.10%Salary increase 4.50% 4.79% 4.79%Future pension increases 3.50% 3.50% 3.50%Biometric:Mortality EMSSA 2009(1) EMSSA82-89(1) EMSSA82-89(1)
Disability IMSS-97(2) IMSS-97(2) IMSS-97(2)
Normal retirement age 60 years 60 years 60 years Rest of employee turnover BMAR2007(3) BMAR2007(3) BMAR2007(3)
(1) EMSSA. Mexican Experience of Social Security (for its initials in Spanish)
(2) IMSS. Mexican Experience of Instituto Mexicano del Seguro Social (for its initials in Spanish)
(3) BMAR. Actuary experience
BRAZIL 2014 2013 2012Financial:Discount rate used to calculate the defined benefit obligation 12.00% 10.70% 9.30%Salary increase 7.20% 6.80% 5.00%Future pension increases 6.20% 5.80% 4.00%Biometric:Disability IMSS-97(1) IMSS-97(1) IMSS-97(1)
Mortality EMSSA 2009(2) UP84(3) UP84(3)
Normal retirement age 65 years 65 years 65 years Rest of employee turnover Brazil(4) Brazil(4) Brazil(4)
(1) IMSS.
(2) EMSSA.
(3) UP84. Unisex mortality table.
(4) Rest of employee turnover based on the experience of the Company’s subsidiary in Brazil.
Venezuela is a hyper-inflationary economy. The actuarial calculations for post-employment benefit (termination indemnity), as well as the
associated cost for the period, were determined using the following long-term assumptions which are real assumptions (excluding inflation):
VENEZUELA 2014 2013Financial:Discount rate used to calculate the defined benefit obligation 1.00% 1.00%Salary increase 1.00% 1.50%Biometric:Mortality EMSSA 2009(1) EMSSA82-89(1)
Disability IMSS-97(2) IMSS-97(2)
Normal retirement age 65 years 65 yearsRest of employee turnover BMAR2007(3) BMAR2007(3)
(1) EMSSA.
(2) IMSS.
(3) BMAR. Actuary experience
In Mexico the methodology used to determine the discount rate was the Yield or Internal Rate of Return (“IRR”) which involves a yield curve. In
this case, the expected rates of each period were taken from a yield curve of the Mexican Federal Government Treasury Bond (known as CETES
in Mexico).
In order to valuate the effects of the settlement in Brazil the methodology used to determine the discount rate was the Yield or Internal Rate
of Return (“IRR”) which involves a yield curve. In this case, the expected rates of each period were taken from a yield curve of fixed long term
bonds of the Federal Republic of Brazil.
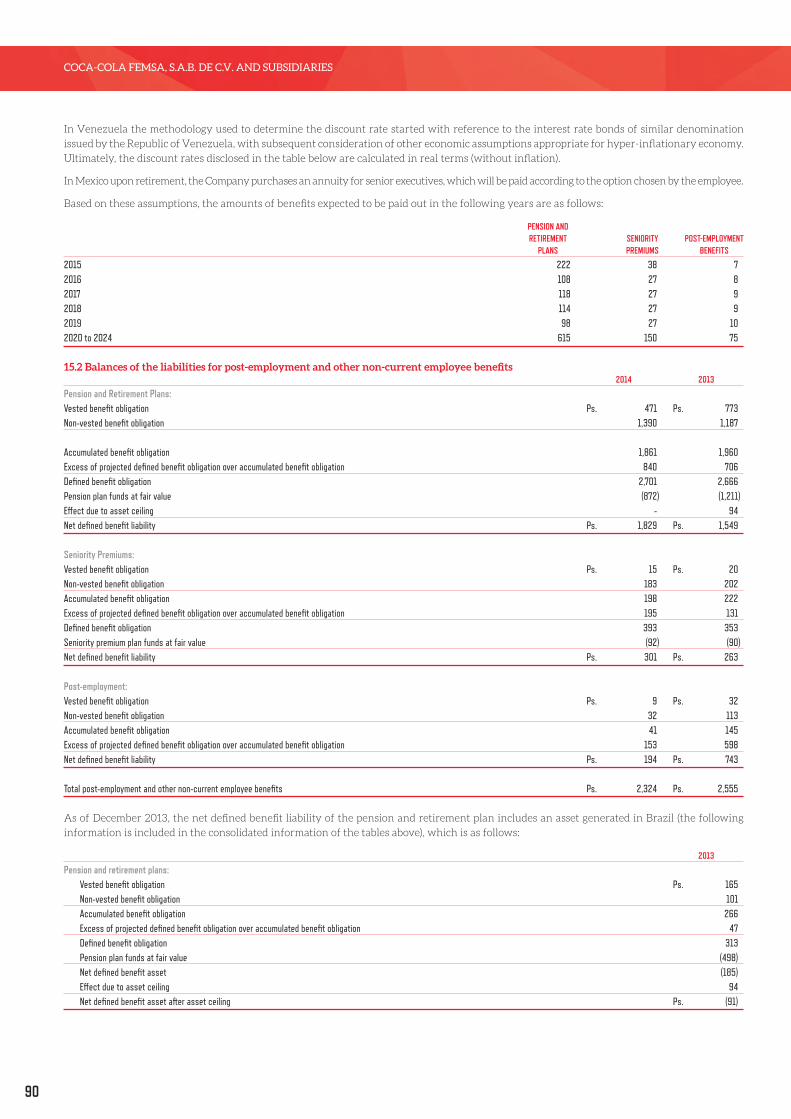
90
COCA-COLA FEMSA, S.A.B. DE C.V. AND SUBSIDIARIES
In Venezuela the methodology used to determine the discount rate started with reference to the interest rate bonds of similar denomination
issued by the Republic of Venezuela, with subsequent consideration of other economic assumptions appropriate for hyper-inflationary economy.
Ultimately, the discount rates disclosed in the table below are calculated in real terms (without inflation).
In Mexico upon retirement, the Company purchases an annuity for senior executives, which will be paid according to the option chosen by the employee.
Based on these assumptions, the amounts of benefits expected to be paid out in the following years are as follows:
PENSION AND RETIREMENT SENIORITY POST-EMPLOYMENT PLANS PREMIUMS BENEFITS
2015 222 38 72016 108 27 82017 118 27 92018 114 27 92019 98 27 102020 to 2024 615 150 75
15.2 Balances of the liabilities for post-employment and other non-current employee benefits 2014 2013
Pension and Retirement Plans:Vested benefit obligation Ps. 471 Ps. 773Non-vested benefit obligation 1,390 1,187
Accumulated benefit obligation 1,861 1,960Excess of projected defined benefit obligation over accumulated benefit obligation 840 706Defined benefit obligation 2,701 2,666Pension plan funds at fair value (872) (1,211)Effect due to asset ceiling - 94Net defined benefit liability Ps. 1,829 Ps. 1,549
Seniority Premiums:Vested benefit obligation Ps. 15 Ps. 20Non-vested benefit obligation 183 202Accumulated benefit obligation 198 222Excess of projected defined benefit obligation over accumulated benefit obligation 195 131Defined benefit obligation 393 353Seniority premium plan funds at fair value (92) (90)Net defined benefit liability Ps. 301 Ps. 263
Post-employment:Vested benefit obligation Ps. 9 Ps. 32Non-vested benefit obligation 32 113Accumulated benefit obligation 41 145Excess of projected defined benefit obligation over accumulated benefit obligation 153 598Net defined benefit liability Ps. 194 Ps. 743
Total post-employment and other non-current employee benefits Ps. 2,324 Ps. 2,555
As of December 2013, the net defined benefit liability of the pension and retirement plan includes an asset generated in Brazil (the following
information is included in the consolidated information of the tables above), which is as follows:
2013
Pension and retirement plans: Vested benefit obligation Ps. 165 Non-vested benefit obligation 101 Accumulated benefit obligation 266 Excess of projected defined benefit obligation over accumulated benefit obligation 47 Defined benefit obligation 313 Pension plan funds at fair value (498) Net defined benefit asset (185) Effect due to asset ceiling 94 Net defined benefit asset after asset ceiling Ps. (91)

91
COCA-COLA FEMSA, S.A.B. DE C.V. AND SUBSIDIARIES
15.3 Trust assetsTrust assets consist of fixed and variable return financial instruments recorded at market value, which are invested as follows:
TYPE OF INSTRUMENT 2014 2013Fixed return:Traded securities 35% 20%Life annuities 20% 5%Bank instruments 3% 2%Federal government instruments 27% 48%Variable return:Publicly traded shares 15% 25%Total 100% 100%
In Mexico, the regulatory framework for pension plans is established in the Income Tax Law and its Regulations, the Federal Labor Law and
the Mexican Social Security Institute Law. None of these laws establish minimum funding levels or a minimum required level of contributions.
At December 2013, in Brazil, the regulatory framework for pension plans is established by the Brazilian Social Security Institute (INSS), which
indicates that the contributions must be made by the company and the workers. There are not minimum funding requirements of contributions
in Brazil neither contractual nor given.
In Venezuela, the regulatory framework for post-employment benefits is established by the Organic Labor Law for Workers (LOTTT). The
organic nature of this law means that its purpose is to defend constitutional rights, and therefore has precedence over other laws.
In Mexico, the Income Tax Law requires that, in the case of private plans, certain notifications must be submitted to the authorities and a certain
level of instruments must be invested in the Federal Government, among others.
The Company’s various pension plans have a technical committee that is responsible for verifying the correct operation of the plan with regard
to the payment of benefits, actuarial valuations of the plan, and the monitoring and supervision of the trust beneficiary. The committee is
responsible for determining the investment portfolio and the types of instruments the fund will be invested in. This technical committee is also
responsible for reviewing the correct operation of the plan in all of the countries in which the Company has these benefits.
The risks related to the Company’s employee benefit plans are primarily attributable to the plan assets. The Company’s plan assets are invested in a
diversified portfolio, which considers the term of the plan so as to invest in assets whose expected return coincides with the estimated future payments.
Since the Mexican Tax Law limits the plan asset investment to 10% for related parties, this risk is not considered to be significant for purposes
of the Company’s Mexican subsidiaries.
In Mexico, the Company’s policy is to invest at least 30% of the fund assets in Mexican Federal Government instruments. Guidelines for the
target portfolio have been established for the remaining percentage and investment decisions are made to comply with these guidelines insofar
as the market conditions and available funds allow.
At December 2013, in Brazil, the investment target was to obtain the consumer price index (inflation), plus six percent. Investment decisions are
made to comply with this guideline insofar as the market conditions and available funds allow.
On May 7, 2012, the President of Venezuela amended the Organic Law for Workers (LOTTT), which establishes a minimum level of social
welfare benefits to which workers have a right when their labor relationship terminates with or without cause. This benefit is computed based
on the last salary received by the worker and retroactive to June 19, 1997 for any employee who joined the Company prior to that date. For
employees who joined the Company after June 19, 1997, the benefit is computed based on the date on which the employee joined the Company.
An actuarial computation must be performed using the projected unit credit method to determine the amount of the labor obligations that arise.
As a result of the initial calculation, there was an amount of Ps. 381 to other expenses caption in the consolidated statement of income reflecting
past service costs during the year ended December 31, 2012 (See Note 18).
In Mexico, the amounts and types of securities of the Company in related parties included in portfolio fund are as follows:
2014 2013MexicoPortfolio:Debt:Grupo Televisa, S.A.B. de C.V. Ps. 17 Ps. 3Grupo Financiero Banorte, S.A.B. de C.V. 7 —Grupo Industrial Bimbo, S.A.B. de C. V. 3 3Grupo Financiero Banamex, S.A.B. de C.V. — 22El Puerto de Liverpool, S.A.B. de C.V. 5 5Teléfonos de México, S.A.B. de C.V. — 4Capital:Fomento Económico Mexicano, S.A.B de C.V. 10 11Coca-Cola FEMSA, S.A.B. de C. V. 12 19Grupo Televisa, S.A.B. de C.V. — 3Grupo Aeroportuario del Sureste, S.A.B. de C.V. — 1Alfa, S.A.B. de C.V. 8 4Grupo Industrial Bimbo, S.A.B. de C.V. — 1Gentera, S.A.B. de C.V. 7 —The Coca-Cola Company 11 —
92
COCA-COLA FEMSA, S.A.B. DE C.V. AND SUBSIDIARIES
At December 2013, in Brazil, the amounts and types of securities of the Company included in plan assets are as follows:
2013BrazilPortfolio:Debt:HSBC - Sociedad de inversión Atuarial INPC (Brazil) Ps. 383Capital:HSBC - Sociedad de inversión Atuarial INPC (Brazil) 114
During the years ended December 31, 2014 and 2013, the Company did not make significant contributions to the plan assets and does not expect
to make material contributions to the plan assets during the following fiscal year.
15.4 Amounts recognized in the consolidated income statements and the consolidated statements of comprehensive income INCOME STATEMENT OCI REMEASUREMENTS NET INTEREST ON OF THE NET DEFINED THE NET DEFINED BENEFIT CURRENT SERVICE PAST SERVICE GAIN OR LOSS BENEFIT LIABILITY
2014 COST COST ON SETTLEMENT LIABILITY NET OF TAXES
Pension and retirement plans Ps. 137 Ps. 52 Ps. (230) Ps. 201 Ps. 481Seniority premiums 39 — (27) 19 47Post-employment 24 — — 17 72Total Ps. 200 Ps. 52 Ps. (257) Ps. 237 Ps. 600
INCOME STATEMENT OCI REMEASUREMENTS NET INTEREST ON OF THE NET DEFINED THE NET DEFINED BENEFIT CURRENT SERVICE PAST SERVICE GAIN OR LOSS BENEFIT LIABILITY
2013 COST COST ON SETTLEMENT LIABILITY NET OF TAXES
Pension and retirement plans Ps. 139 Ps. 8 Ps. (7) Ps. 90 Ps. 178Seniority premiums 28 — — 15 25Post-employment 48 — — 67 205Total Ps. 215 Ps. 8 Ps. (7) Ps. 172 Ps. 408
INCOME STATEMENT OCI REMEASUREMENTS NET INTEREST ON OF THE NET DEFINED THE NET DEFINED BENEFIT CURRENT SERVICE PAST SERVICE GAIN OR LOSS BENEFIT LIABILITY
2012 COST COST ON SETTLEMENT LIABILITY NET OF TAXES
Pension and retirement plans Ps. 119 Ps. — Ps. — Ps. 71 Ps. 174Seniority premiums 22 — — 11 18Post-employment 49 381 — 63 71Total Ps. 190 Ps. 381 Ps. — Ps. 145 Ps. 263
For the years ended December 31, 2014, 2013 and 2012, service costs of Ps. 200, Ps. 215 and Ps. 190 have been included in the consolidated
statements of income as cost of goods sold, administration and selling expenses.
Remeasurements of the net defined benefit liability recognized in other comprehensive income are as follows (amounts are net of tax):
2014 2013 2012
Amount accumulated in other comprehensive income as of the beginning of the periods Ps. 408 Ps. 263 Ps 138Recognized during the year (obligation liability and plan assets) 280 180 99Actuarial gains and losses arising from changes in financial assumptions 87 (19) 48Changes in the effect of limiting a net defined benefit asset to the asset ceiling — — (9)Foreign exchange rate valuation (gain) (175) (16) (13)Amount accumulated in other comprehensive income as of the end of the period, net of tax Ps. 600 Ps. 408 Ps 263
Remeasurements of the net defined benefit liability include the following:
• The return on plan assets, excluding amounts included in interest expense.
• Actuarial gains and losses arising from changes in demographic assumptions.
• Actuarial gains and losses arising from changes in financial assumptions.
• Changes in the effect of limiting a net defined benefit asset to the asset ceiling, excluding amounts included in interest expense.

93
COCA-COLA FEMSA, S.A.B. DE C.V. AND SUBSIDIARIES
15.5 Changes in the balance of the defined benefit obligation for post-employment and other non-current employee benefits
2014 2013 2012Pension and Retirement Plans:Initial balance Ps. 2,666 Ps. 2,394 Ps. 2,160Current service cost 137 139 119Effect on settlement (521) (7) —Interest expense 198 171 159Actuarial gains or losses 220 (73) 81Foreign exchange (gain) loss 41 (55) (69)Benefits paid (92) (85) (87)Amendments — 8 —Acquisitions — 174 31Past service cost 52 — — Ps. 2,701 Ps. 2,666 Ps. 2,394
Seniority Premiums:Initial balance Ps. 353 Ps. 226 Ps. 167Current service cost 39 28 22Gain or loss on settlement (27) - -Interest expense 26 19 11Actuarial losses 28 7 24Benefits paid (26) (26) (12)Acquisitions — 99 14 Ps. 393 Ps. 353 Ps. 226
Post-employment:Initial balance Ps. 743 Ps. 594 Ps. —Current service cost 24 48 49Interest expense 17 67 63Actuarial losses 54 237 108Foreign exchange gain (638) (187) (1)Benefits paid (6) (16) (6)Past service cost — — 381 Ps. 194 Ps. 743 Ps. 594
15.6 Changes in the balance of trust assets 2014 2013 2012Pension and retirement plans:Balance at beginning of year Ps. 1,211 Ps. 1,113 Ps. 1,068Actual return on trust assets 70 8 100Foreign exchange gain (2) (73) (91)Life annuities 128 18 —Benefits paid — — (12)Amendments — 16 —Acquisitions — 129 48Effect of settlement (535) — —Balance at end of year Ps. 872 Ps. 1,211 Ps. 1,113
Seniority premiumsBalance at beginning of year Ps. 90 Ps. 18 Ps. 19Actual return on trust assets 2 — (1)Acquisitions — 72 —Balance at end of year Ps. 92 Ps. 90 Ps. 18
As a result of the Company’s investments in life annuities plan, management does not expect the Company will need to make material
contributions to the trust assets in order to meet its future obligations.
15.7 Variation in assumptions
The Company decided that the relevant actuarial assumptions that are subject to sensitivity and valuated through the projected unit credit
method, are the discount rate and the salary increase rate. The reasons for choosing these assumptions are as follows:
• Discount rate: The rate that determines the value of the obligations over time.
• Salary increase rate: The rate that considers the salary increase which implies an increase in the benefit payable.
94
COCA-COLA FEMSA, S.A.B. DE C.V. AND SUBSIDIARIES
The following table presents the impact in absolute terms of a variation of 0.5% in the assumptions on the net defined benefit liability associated
with the Company’s defined benefit plans. The sensibility of this 0.5% on the significant actuarial assumptions is based on a projected long-term
discount rates to Mexico and a yield curve projections of long-term sovereign bonds:
+0.5%: INCOME STATEMENT OCIDISCOUNT RATE USED TO CALCULATE THE REMEASUREMENTS DEFINED BENEFIT OBLIGATION AND THE NET GAIN OR NET INTEREST ON OF THE NET INTEREST ON THE NET DEFINED BENEFIT CURRENT PAST SERVICE LOSS ON THE NET DEFINED DEFINED BENEFIT LIABILITY SERVICE COST COST SETTLEMENT BENEFIT LIABILITY LIABILITY
Pension and retirement plans Ps. 128 Ps. 51 Ps. (95) Ps. 113 Ps. 237Seniority premiums 38 — (25) 20 38Post-employment 22 — — 17 85Total Ps. 188 Ps. 51 Ps. (120) Ps. 150 Ps. 360
REMEASUREMENTS GAIN OR NET INTEREST ON OF THE NET CURRENT PAST SERVICE LOSS ON THE NET DEFINED DEFINED BENEFIT EXPECTED SALARY INCREASE SERVICE COST COST SETTLEMENT BENEFIT LIABILITY LIABILITY
Pension and retirement plans Ps. 142 Ps. 54 Ps. (111) Ps. 123 Ps. 559Seniority premiums 41 — (29) 21 83Post-employment 27 — — 19 124Total Ps. 210 Ps. 54 Ps. (140) Ps. 163 Ps. 766
-0.5%:DISCOUNT RATE USED TO CALCULATE THE REMEASUREMENTS DEFINED BENEFIT OBLIGATION AND THE NET GAIN OR NET INTEREST ON OF THE NET INTEREST ON THE NET DEFINED BENEFIT CURRENT PAST SERVICE LOSS ON THE NET DEFINED DEFINED BENEFIT LIABILITY SERVICE COST COST SETTLEMENT BENEFIT LIABILITY LIABILITY
Pension and retirement plans Ps. 145 Ps. 55 Ps. (108) Ps. 118 Ps. 564Seniority premiums 42 — (29) 19 91Post-employment 26 — — 19 117Total Ps. 213 Ps. 55 Ps. (137) Ps. 156 Ps. 772
REMEASUREMENTS GAIN OR NET INTEREST ON OF THE NET CURRENT PAST SERVICE LOSS ON THE NET DEFINED DEFINED BENEFIT EXPECTED SALARY INCREASE SERVICE COST COST SETTLEMENT BENEFIT LIABILITY LIABILITY
Pension and retirement plans Ps. 128 Ps. 51 Ps. (99) Ps. 107 Ps. 243Seniority premiums 38 — (27) 18 62Post-employment 21 — — 15 79Total Ps. 187 Ps. 51 Ps. (126) Ps. 140 Ps. 384
15.8 Employee benefits expenseFor the years ended December 31, 2014, 2013 and 2012, employee benefits expenses recognized in the consolidated income statements are as
follows: 2014 2013 2012Included in cost of goods sold:Wages and salaries Ps. 3,823 Ps. 5,978 Ps. 4,590Social security costs 742 837 603Employee profit sharing 141 399 323Pension and seniority premium costs (Note 15.4) 53 51 43Share-based payment expense (Note 16.2) 3 3 7Included in selling and distribution expenses:Wages and salaries 11,999 12,878 8,417Social security costs 2,860 2,416 1,210Employee profit sharing 449 1,181 1,015Pension and seniority premium costs (Note 15.4) 60 56 47Share-based payment expense (Note 16.2) 3 6 9Included in administrative expenses:Wages and salaries 2,937 3,939 5,877Social security costs 420 504 462Employee profit sharing 50 81 76Pension and seniority premium costs (Note 15.4) 63 60 51Post-employment benefits other (Note 15.4) 24 48 49Share-based payment expense (Note 16.2) 173 184 165Included in other expenses:Post-employment (Note 15) — — 381Total employee benefits expense Ps. 23,800 Ps. 28,621 Ps. 23,325
95
COCA-COLA FEMSA, S.A.B. DE C.V. AND SUBSIDIARIES
NOTE 16. BONUS PROGRAMS
16.1 Quantitative and qualitative objectivesThe bonus program for executives is based on achieving certain goals established annually by management, which include quantitative and
qualitative objectives and special projects.
The quantitative objectives represent approximately 50% of the bonus, and are based on the Economic Value Added (“EVA”) methodology. The
objective established for the executives at each entity is based on a combination of the EVA generated per entity and by our Company and the
EVA generated by our parent Company (FEMSA). The qualitative objectives and special projects represent the remaining 50% of the annual
bonus and are based on the critical success factors established at the beginning of the year for each executive.
The bonus amount is determined based on each eligible participant’s level of responsibility and based on the EVA generated by the applicable
business unit the employee works for. This formula is established by considering the level of responsibility within the organization, the
employees’ evaluation and competitive compensation in the market.
The incentive plan target is expressed in months of salary, and the final amount payable is computed based on a percentage of achievement of
the goals established every year. The bonuses are recorded as a part of the income statement and are paid in cash the following year. During the
years ended December 31, 2014, 2013 and 2012 the bonus expense recorded amounted to Ps. 523, Ps. 533 and Ps. 375, respectively.
16.2 Share-based payment bonus planThe Company has a stock incentive plan for the benefit of its senior executives. This plan uses as its main evaluation metric the Economic Value
Added, or EVA. Under the EVA stock incentive plan, eligible employees are entitled to receive a special annual bonus (fixed amount), to purchase
FEMSA and Coca-Cola FEMSA shares or options, based on the executive’s responsibility in the organization, their business’ EVA result achieved,
and their individual performance. The acquired shares or options are deposited in a trust, and the executives may access them one year after
they are vested at 20% per year. The 50% of Coca-Cola FEMSA’s annual executive bonus is to be used to purchase FEMSA shares or options
and the remaining 50% to purchase Coca-Cola FEMSA shares or options. As of December 31, 2014, 2013 and 2012, no stock options have been
granted to employees.
The special bonus is granted to the eligible employee on an annual basis and after withholding applicable taxes. The Company contributes the
individual employee’s special bonus (after taxes) in cash to the Administrative Trust (which is controlled and consolidated by FEMSA), which
then uses the funds to purchase FEMSA and Coca-Cola FEMSA shares (as instructed by the Corporate Practices Committee), which are then
allocated to such employee.
Coca-Cola FEMSA accounts for its share-based payment bonus plan as an equity-settled share based payment transaction, since it is its parent
company, FEMSA, who ultimately grants and settles with shares these obligations due to executives.
At December 31, 2014, 2013 and 2012, the shares granted under the Company’s executive incentive plans are as follows:
NUMBER OF SHARES FEMSA KOF VESTING PERIOD
2009 1,888,680 1,340,790 2010-20142010 1,456,065 1,037,610 2011-20152011 968,440 656,400 2012-20162012 956,685 741,245 2013-20172013 539,020 370,200 2014-20182014 489,345 331,165 2015-2019Total 6,298,235 4,477,410
For the years ended December 31, 2014, 2013 and 2012, the total expense recognized for the period arising from share-based payment
transactions, using the grant date model, was of Ps. 179, Ps. 193 and Ps. 181, respectively.
As of December 31, 2014 and 2013, the asset recorded by Coca-Cola FEMSA in its consolidated statements of financial position amounted to Ps.
276 and Ps. 306, respectively, see Note 12.
96
COCA-COLA FEMSA, S.A.B. DE C.V. AND SUBSIDIARIES
NOTE 17. BANK LOANS AND NOTES PAYABLES
CARRYING FAIR VALUE CARRYING VALUE AT VALUE 2020 AND DECEMBER 31, DECEMBER 31, DECEMBER 31,(IN MILLIONS OF MEXICAN PESOS) 2015 2016 2017 2018 2019 THEREAFTER 2014 2014 2013
Short-term debt:Fixed rate debt:Argentine pesosBank loans Ps. 301 Ps. — Ps. — Ps. — Ps. — Ps. — Ps. 301 Ps. 304 Ps. 495Interest rate 30.9% — — — — — 30.9% — 25.4%
Total short-term debt Ps. 301 Ps. — Ps. — Ps. — Ps. — Ps. — Ps. 301 Ps. 304 Ps. 495
Long-term debt:Fixed rate debt:Argentine pesosBank loans 124 131 54 — — — 309 302 358Interest rate 24.9% 27.5% 30.2% — — — 26.9% — 20.3%Brazilian reaisBank loans 17 24 31 31 31 99 233 183 111Interest rate 3.8% 4.1% 4.6% 4.6% 4.6% 4.9% 4.6% — 3.4%Capital leases 221 192 168 88 41 50 760 640 959Interest rate 4.6% 4.6% 4.6% 4.6% 4.6% 4.6% 4.6% — 4.6%U.S. dollarsSenior notes — — — 14,668 — 29,225 43,893 46,924 34,272Interest rate — — — 2.4% — 4.5% 3.8% — 3.7%Bank loans 30 — — — — — 30 30 123Interest rate 3.9% — — — — — 3.9% — 3.8%Mexican pesosDomestic bonds — — — — — 9,988 9,988 9,677 9,987Interest rate — — — — — 6.2% 6.2% — 6.2%
Subtotal 392 347 253 14,787 72 39,362 55,213 57,756 45,810
Variable rate debt:U.S. dollarsBank loans — 2,108 — 4,848 — — 6,956 7,001 5,843Interest rate — 0.9% — 0.9% — — 0.9% — 0.9%Mexican pesosDomestic bonds — 2,473 — — — — 2,473 2,502 2,517Interest rate — 3.4% — — — — 3.4% — 3.9%Bank loans — — — — — — — — 4,132Interest rate — — — — — — — — 4%Argentine pesosBank loans 17 215 — — — — 232 227 180Interest rate 24.9% 21.3% — — — — 21.5% — 25.7%Brazilian reaisBank loans 4 17 17 17 17 11 83 75 28Interest rate 7.7% 7.6% 7.6% 7.6% 7.6% 7.6% 7.6% — 9.8%Colombian pesosBank loans 492 277 — — — — 769 766 1,456Interest rate 5.9% 5.9% — — — — 5.9% — 5.6%
Subtotal 513 5,090 17 4,865 17 11 10,513 10,571 14,156
Long-term debt 905 5,437 270 19,652 89 39,373 65,726 68,327 59,966Current portion of long term debt 905 — — — — — 905 — 3,091
Long-term debt Ps. — Ps. 5,437 Ps. 270 Ps. 19,652 Ps. 89 Ps. 39,373 Ps. 64,821 Ps. 68,327 Ps. 56,875
(1) All interest rates shown in this table are weighted average contractual annual rates.
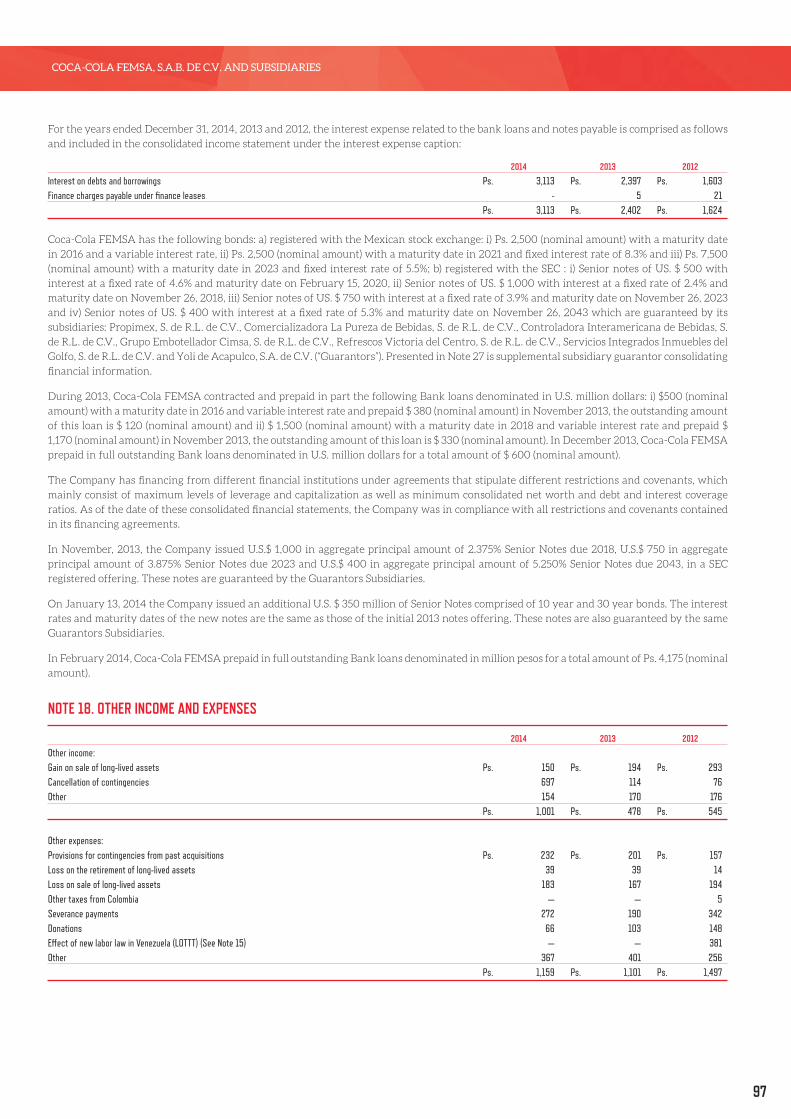
97
COCA-COLA FEMSA, S.A.B. DE C.V. AND SUBSIDIARIES
For the years ended December 31, 2014, 2013 and 2012, the interest expense related to the bank loans and notes payable is comprised as follows
and included in the consolidated income statement under the interest expense caption:
2014 2013 2012
Interest on debts and borrowings Ps. 3,113 Ps. 2,397 Ps. 1,603Finance charges payable under finance leases - 5 21 Ps. 3,113 Ps. 2,402 Ps. 1,624
Coca-Cola FEMSA has the following bonds: a) registered with the Mexican stock exchange: i) Ps. 2,500 (nominal amount) with a maturity date
in 2016 and a variable interest rate, ii) Ps. 2,500 (nominal amount) with a maturity date in 2021 and fixed interest rate of 8.3% and iii) Ps. 7,500
(nominal amount) with a maturity date in 2023 and fixed interest rate of 5.5%; b) registered with the SEC : i) Senior notes of US. $ 500 with
interest at a fixed rate of 4.6% and maturity date on February 15, 2020, ii) Senior notes of US. $ 1,000 with interest at a fixed rate of 2.4% and
maturity date on November 26, 2018, iii) Senior notes of US. $ 750 with interest at a fixed rate of 3.9% and maturity date on November 26, 2023
and iv) Senior notes of US. $ 400 with interest at a fixed rate of 5.3% and maturity date on November 26, 2043 which are guaranteed by its
subsidiaries: Propimex, S. de R.L. de C.V., Comercializadora La Pureza de Bebidas, S. de R.L. de C.V., Controladora Interamericana de Bebidas, S.
de R.L. de C.V., Grupo Embotellador Cimsa, S. de R.L. de C.V., Refrescos Victoria del Centro, S. de R.L. de C.V., Servicios Integrados Inmuebles del
Golfo, S. de R.L. de C.V. and Yoli de Acapulco, S.A. de C.V. (“Guarantors”). Presented in Note 27 is supplemental subsidiary guarantor consolidating
financial information.
During 2013, Coca-Cola FEMSA contracted and prepaid in part the following Bank loans denominated in U.S. million dollars: i) $500 (nominal
amount) with a maturity date in 2016 and variable interest rate and prepaid $ 380 (nominal amount) in November 2013, the outstanding amount
of this loan is $ 120 (nominal amount) and ii) $ 1,500 (nominal amount) with a maturity date in 2018 and variable interest rate and prepaid $
1,170 (nominal amount) in November 2013, the outstanding amount of this loan is $ 330 (nominal amount). In December 2013, Coca-Cola FEMSA
prepaid in full outstanding Bank loans denominated in U.S. million dollars for a total amount of $ 600 (nominal amount).
The Company has financing from different financial institutions under agreements that stipulate different restrictions and covenants, which
mainly consist of maximum levels of leverage and capitalization as well as minimum consolidated net worth and debt and interest coverage
ratios. As of the date of these consolidated financial statements, the Company was in compliance with all restrictions and covenants contained
in its financing agreements.
In November, 2013, the Company issued U.S.$ 1,000 in aggregate principal amount of 2.375% Senior Notes due 2018, U.S.$ 750 in aggregate
principal amount of 3.875% Senior Notes due 2023 and U.S.$ 400 in aggregate principal amount of 5.250% Senior Notes due 2043, in a SEC
registered offering. These notes are guaranteed by the Guarantors Subsidiaries.
On January 13, 2014 the Company issued an additional U.S. $ 350 million of Senior Notes comprised of 10 year and 30 year bonds. The interest
rates and maturity dates of the new notes are the same as those of the initial 2013 notes offering. These notes are also guaranteed by the same
Guarantors Subsidiaries.
In February 2014, Coca-Cola FEMSA prepaid in full outstanding Bank loans denominated in million pesos for a total amount of Ps. 4,175 (nominal
amount).
NOTE 18. OTHER INCOME AND EXPENSES
2014 2013 2012
Other income:Gain on sale of long-lived assets Ps. 150 Ps. 194 Ps. 293Cancellation of contingencies 697 114 76Other 154 170 176 Ps. 1,001 Ps. 478 Ps. 545
Other expenses:Provisions for contingencies from past acquisitions Ps. 232 Ps. 201 Ps. 157Loss on the retirement of long-lived assets 39 39 14Loss on sale of long-lived assets 183 167 194Other taxes from Colombia — — 5Severance payments 272 190 342Donations 66 103 148Effect of new labor law in Venezuela (LOTTT) (See Note 15) — — 381Other 367 401 256 Ps. 1,159 Ps. 1,101 Ps. 1,497
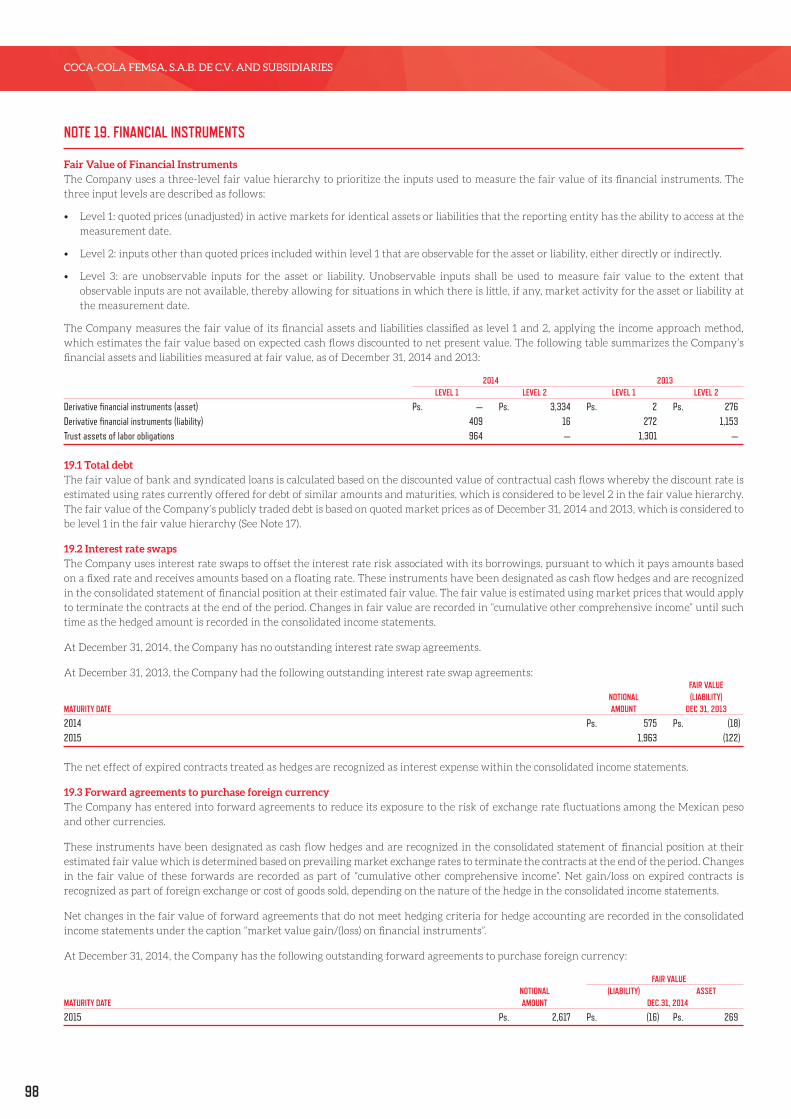
98
COCA-COLA FEMSA, S.A.B. DE C.V. AND SUBSIDIARIES
NOTE 19. FINANCIAL INSTRUMENTS
Fair Value of Financial InstrumentsThe Company uses a three-level fair value hierarchy to prioritize the inputs used to measure the fair value of its financial instruments. The
three input levels are described as follows:
• Level 1: quoted prices (unadjusted) in active markets for identical assets or liabilities that the reporting entity has the ability to access at the
measurement date.
• Level 2: inputs other than quoted prices included within level 1 that are observable for the asset or liability, either directly or indirectly.
• Level 3: are unobservable inputs for the asset or liability. Unobservable inputs shall be used to measure fair value to the extent that
observable inputs are not available, thereby allowing for situations in which there is little, if any, market activity for the asset or liability at
the measurement date.
The Company measures the fair value of its financial assets and liabilities classified as level 1 and 2, applying the income approach method,
which estimates the fair value based on expected cash flows discounted to net present value. The following table summarizes the Company’s
financial assets and liabilities measured at fair value, as of December 31, 2014 and 2013:
2014 2013 LEVEL 1 LEVEL 2 LEVEL 1 LEVEL 2
Derivative financial instruments (asset) Ps. — Ps. 3,334 Ps. 2 Ps. 276Derivative financial instruments (liability) 409 16 272 1,153Trust assets of labor obligations 964 — 1,301 —
19.1 Total debtThe fair value of bank and syndicated loans is calculated based on the discounted value of contractual cash flows whereby the discount rate is
estimated using rates currently offered for debt of similar amounts and maturities, which is considered to be level 2 in the fair value hierarchy.
The fair value of the Company’s publicly traded debt is based on quoted market prices as of December 31, 2014 and 2013, which is considered to
be level 1 in the fair value hierarchy (See Note 17).
19.2 Interest rate swapsThe Company uses interest rate swaps to offset the interest rate risk associated with its borrowings, pursuant to which it pays amounts based
on a fixed rate and receives amounts based on a floating rate. These instruments have been designated as cash flow hedges and are recognized
in the consolidated statement of financial position at their estimated fair value. The fair value is estimated using market prices that would apply
to terminate the contracts at the end of the period. Changes in fair value are recorded in “cumulative other comprehensive income” until such
time as the hedged amount is recorded in the consolidated income statements.
At December 31, 2014, the Company has no outstanding interest rate swap agreements.
At December 31, 2013, the Company had the following outstanding interest rate swap agreements: FAIR VALUE NOTIONAL (LIABILITY) MATURITY DATE AMOUNT DEC 31, 2013
2014 Ps. 575 Ps. (18)2015 1,963 (122)
The net effect of expired contracts treated as hedges are recognized as interest expense within the consolidated income statements.
19.3 Forward agreements to purchase foreign currencyThe Company has entered into forward agreements to reduce its exposure to the risk of exchange rate fluctuations among the Mexican peso
and other currencies.
These instruments have been designated as cash flow hedges and are recognized in the consolidated statement of financial position at their
estimated fair value which is determined based on prevailing market exchange rates to terminate the contracts at the end of the period. Changes
in the fair value of these forwards are recorded as part of “cumulative other comprehensive income”. Net gain/loss on expired contracts is
recognized as part of foreign exchange or cost of goods sold, depending on the nature of the hedge in the consolidated income statements.
Net changes in the fair value of forward agreements that do not meet hedging criteria for hedge accounting are recorded in the consolidated
income statements under the caption “market value gain/(loss) on financial instruments”.
At December 31, 2014, the Company has the following outstanding forward agreements to purchase foreign currency:
FAIR VALUE NOTIONAL (LIABILITY) ASSETMATURITY DATE AMOUNT DEC.31, 2014
2015 Ps. 2,617 Ps. (16) Ps. 269

99
COCA-COLA FEMSA, S.A.B. DE C.V. AND SUBSIDIARIES
At December 31, 2013, the Company had the following outstanding forward agreements to purchase foreign currency:
FAIR VALUE NOTIONAL ASSET MATURITY DATE AMOUNT DEC 31, 2013
2014 Ps. 1,518 Ps. 28
19.4 Options to purchase foreign currencyThe Company has executed collar strategies to reduce its exposure to the risk of exchange rate fluctuations. A collar is a strategy that limits the
exposure to the risk of exchange rate fluctuations in a similar way as a forward agreement.
These instruments have been designated as cash flow hedges and are recognized in the consolidated statement of financial position at their
estimated fair value which is determined based on prevailing market exchange rates to terminate the contracts at the end of the period. Changes
in the fair value of these options, corresponding to the intrinsic value, are initially recorded as part of “cumulative other comprehensive income”.
Changes in the fair value, corresponding to the extrinsic value, are recorded in the consolidated income statements under the caption “market
value gain/ (loss) on financial instruments,” as part of the consolidated net income. Net gain/(loss) on expired contracts including the net premium
paid, is recognized as part of cost of goods sold when the hedged item is recorded in the consolidated income statements.
At December 31, 2014, the Company has the following outstanding collars agreements to purchase foreign currency:
FAIR VALUE NOTIONAL ASSET MATURITY DATE AMOUNT DEC 31, 2014
2015 Ps. 402 Ps. 56
At December 31, 2013, the Company had no outstanding collars to purchase foreign currency.
19.5 Cross-currency swapsThe Company has contracted a number of cross-currency swaps to reduce its exposure to risks of exchange rate and interest rate fluctuations
associated with its borrowings denominated in U.S. dollars. The estimated fair value is estimated using market prices that would apply to
terminate the contracts at the end of the period. The fair value changes related to exchange rate fluctuations of the notional of those cross
currency swaps and the accrued interest are recorded in the consolidated income statements. The remaining portion of the fair value changes,
when designated as Cash Flow Hedges, are recorded in the consolidated balance sheet in “cumulative other comprehensive income”. If they are
designated as Fair Value Hedges the changes in this remaining portion are recorded in the income statements as “market value (gain) loss on
financial instruments”.
At December 31, 2014, the Company had the following outstanding cross currency swap agreements designated as Cash Flow Hedges:
FAIR VALUE NOTIONAL (LIABILITY) ASSETMATURITY DATE AMOUNT DEC.31, 2014
2018 Ps. 20,311 Ps. — Ps. 1,381
At December 31, 2013, the Company had the following outstanding cross currency swap agreements designated as Cash Flow Hedges:
FAIR VALUE NOTIONAL (LIABILITY) ASSET
MATURITY DATE AMOUNT DEC.31, 2013
2014 Ps. 1,308 Ps. — Ps. 132018 18,046 (981) —
At December 31, 2014, the Company had the following outstanding cross currency swap agreements designated as Fair Value Hedges:
FAIR VALUE NOTIONAL ASSET MATURITY DATE AMOUNT DEC 31, 2014
2015 Ps. 30 Ps. 62018 13,099 1,622
At December 31, 2013, the Company had the following outstanding cross currency swap agreements designated as Fair Value Hedges:
FAIR VALUE NOTIONAL ASSET MATURITY DATE AMOUNT DEC 31, 2013
2014 Ps. 50 Ps. 52015 83 112018 5,884 156
The Company had certain cross-currency swaps that do not meet the criteria for hedge accounting purposes. Consequently, changes in the
estimated fair value were recorded in the income statements as “market value (gain) loss on financial instruments”.
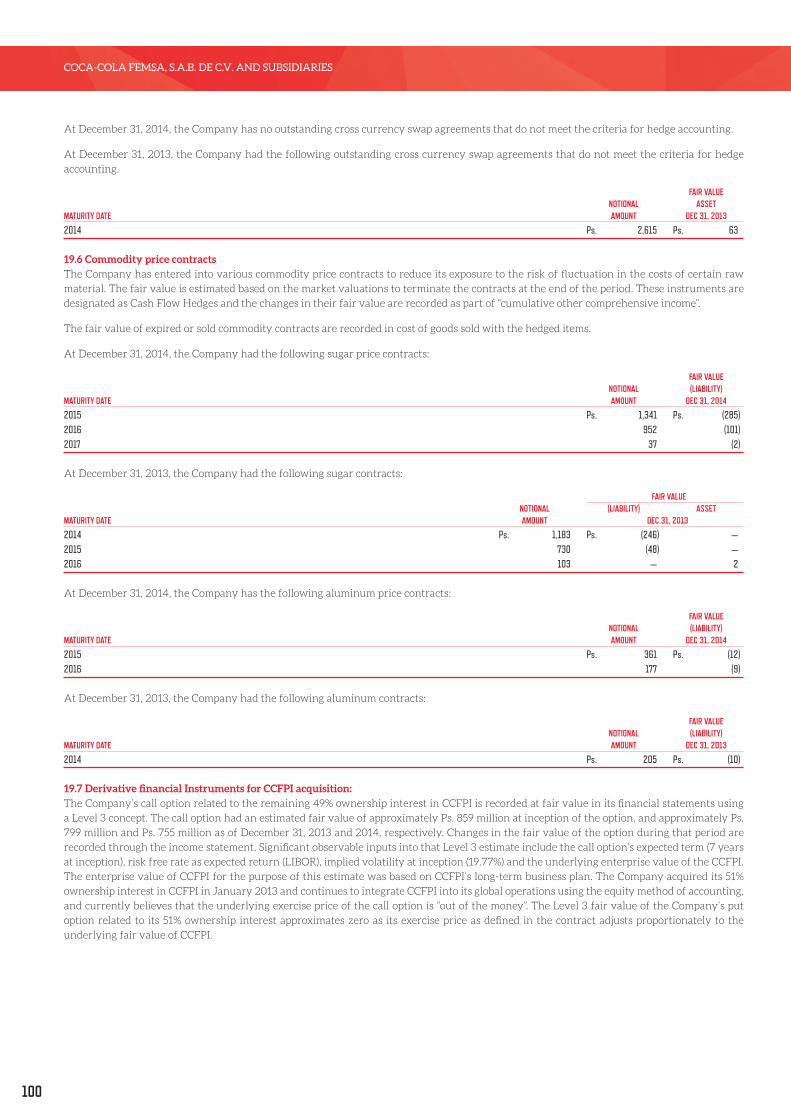
100
COCA-COLA FEMSA, S.A.B. DE C.V. AND SUBSIDIARIES
At December 31, 2014, the Company has no outstanding cross currency swap agreements that do not meet the criteria for hedge accounting.
At December 31, 2013, the Company had the following outstanding cross currency swap agreements that do not meet the criteria for hedge
accounting.
FAIR VALUE NOTIONAL ASSET MATURITY DATE AMOUNT DEC 31, 2013
2014 Ps. 2,615 Ps. 63
19.6 Commodity price contractsThe Company has entered into various commodity price contracts to reduce its exposure to the risk of fluctuation in the costs of certain raw
material. The fair value is estimated based on the market valuations to terminate the contracts at the end of the period. These instruments are
designated as Cash Flow Hedges and the changes in their fair value are recorded as part of “cumulative other comprehensive income”.
The fair value of expired or sold commodity contracts are recorded in cost of goods sold with the hedged items.
At December 31, 2014, the Company had the following sugar price contracts:
FAIR VALUE NOTIONAL (LIABILITY) MATURITY DATE AMOUNT DEC 31, 2014
2015 Ps. 1,341 Ps. (285)2016 952 (101) 2017 37 (2)
At December 31, 2013, the Company had the following sugar contracts:
FAIR VALUE NOTIONAL (LIABILITY) ASSETMATURITY DATE AMOUNT DEC.31, 2013
2014 Ps. 1,183 Ps. (246) —2015 730 (48) —2016 103 — 2
At December 31, 2014, the Company has the following aluminum price contracts:
FAIR VALUE NOTIONAL (LIABILITY) MATURITY DATE AMOUNT DEC 31, 2014
2015 Ps. 361 Ps. (12)2016 177 (9)
At December 31, 2013, the Company had the following aluminum contracts:
FAIR VALUE NOTIONAL (LIABILITY) MATURITY DATE AMOUNT DEC 31, 2013
2014 Ps. 205 Ps. (10)
19.7 Derivative financial Instruments for CCFPI acquisition:The Company’s call option related to the remaining 49% ownership interest in CCFPI is recorded at fair value in its financial statements using
a Level 3 concept. The call option had an estimated fair value of approximately Ps. 859 million at inception of the option, and approximately Ps.
799 million and Ps. 755 million as of December 31, 2013 and 2014, respectively. Changes in the fair value of the option during that period are
recorded through the income statement. Significant observable inputs into that Level 3 estimate include the call option’s expected term (7 years
at inception), risk free rate as expected return (LIBOR), implied volatility at inception (19.77%) and the underlying enterprise value of the CCFPI.
The enterprise value of CCFPI for the purpose of this estimate was based on CCFPI’s long-term business plan. The Company acquired its 51%
ownership interest in CCFPI in January 2013 and continues to integrate CCFPI into its global operations using the equity method of accounting,
and currently believes that the underlying exercise price of the call option is “out of the money”. The Level 3 fair value of the Company’s put
option related to its 51% ownership interest approximates zero as its exercise price as defined in the contract adjusts proportionately to the
underlying fair value of CCFPI.

101
COCA-COLA FEMSA, S.A.B. DE C.V. AND SUBSIDIARIES
19.8 Net effects of expired contracts that met hedging criteria IMPACT IN CONSOLIDATED TYPE OF DERIVATIVES INCOME STATEMENT 2014 2013 2012
Interest rate swaps Interest expense Ps. 137 Ps. 105 Ps. 147Forward agreements to purchase foreign currency Foreign exchange — (1,591) —Option to purchase foreign currency Cost of goods sold — (9) —Forward agreements to purchase foreign currency Cost of goods sold (22) (22) —Commodity price contracts Cost of goods sold 291 362 (6)
19.9 Net effect of changes in fair value of derivative financial instruments that did not meet the hedging criteria for accounting purposes
IMPACT IN CONSOLIDATED TYPE OF DERIVATIVES INCOME STATEMENT 2014 2013 2012
Forward agreements to purchase foreign currency Market value (loss) gain on financial instruments Ps. (1) Ps. (20) Ps. 30Cross-currency swaps Market value gain on financial instruments 26 66 —
19.10 Net effect of expired contracts that did not meet the hedging criteria for accounting purposes
IMPACT IN CONSOLIDATED TYPE OF DERIVATIVES INCOME STATEMENT 2014 2013 2012
Options to purchase foreign currency Cost of goods sold Ps. — Ps. — Ps. (1)Cross-currency swaps Market value loss on financial instruments — — (43)
19.11 Market riskThe Company’s activities expose it primarily to the financial risks of changes in foreign currency exchange rates, interest rates and commodity
prices. The Company enters into a variety of derivative financial instruments to manage its exposure to foreign currency risk, interest rates risk
and commodity prices risk including:
• Forward Agreements to Purchase Foreign Currency in order to reduce its exposure to the risk of exchange rate fluctuations.
• Interest Rate Swaps in order to reduce its exposure to the risk of interest rate fluctuations.
• Cross-Currency Swaps in order to reduce its exposure to the risk of exchange rate fluctuations.
• Commodity price contracts in order to reduce its exposure to the risk of fluctuation in the costs of certain raw materials.
The Company tracks the fair value (mark to market) of its derivative financial instruments and its possible changes using scenario analyses. The
following disclosures provide a sensitivity analysis of the market risks, which the Company is exposed to as it relates to foreign exchange rates,
interests rates and commodity prices, which it considers in its existing hedging strategy:
EFFECT ON CHANGE IN EFFECT ON PROFIT FORWARD AGREEMENTS TO PURCHASE USD (MXN/USD) U.S.$ RATE EQUITY OR LOSS
2014 (7%) Ps. (99) Ps. —2013 (11%) (67) —2012 (11%) (122) —
EFFECT ON CHANGE IN EFFECT ON PROFIT FORWARD AGREEMENTS TO PURCHASE USD (BRL/USD) U.S.$ RATE EQUITY OR LOSS
2014 (14%) Ps. (96) Ps. —2013 (13%) (86) —
EFFECT ON CHANGE IN EFFECT ON PROFIT FORWARD AGREEMENTS TO PURCHASE USD (COP/USD) U.S.$ RATE EQUITY OR LOSS
2014 (9%) Ps. (33) Ps. —2013 (6%) (19) —
EFFECT ON CHANGE IN EFFECT ON PROFIT FORWARD AGREEMENTS TO PURCHASE USD (ARS/USD) U.S.$ RATE EQUITY OR LOSS
2014 (11%) Ps. (22) Ps. —
EFFECT ON CHANGE IN EFFECT ON PROFIT OPTIONS TO PURCHASE FOREIGN CURRENCY (MXN/USD) U.S.$ RATE EQUITY OR LOSS
2014 (7%) Ps. (20) Ps. —2012 (11%) (82) —
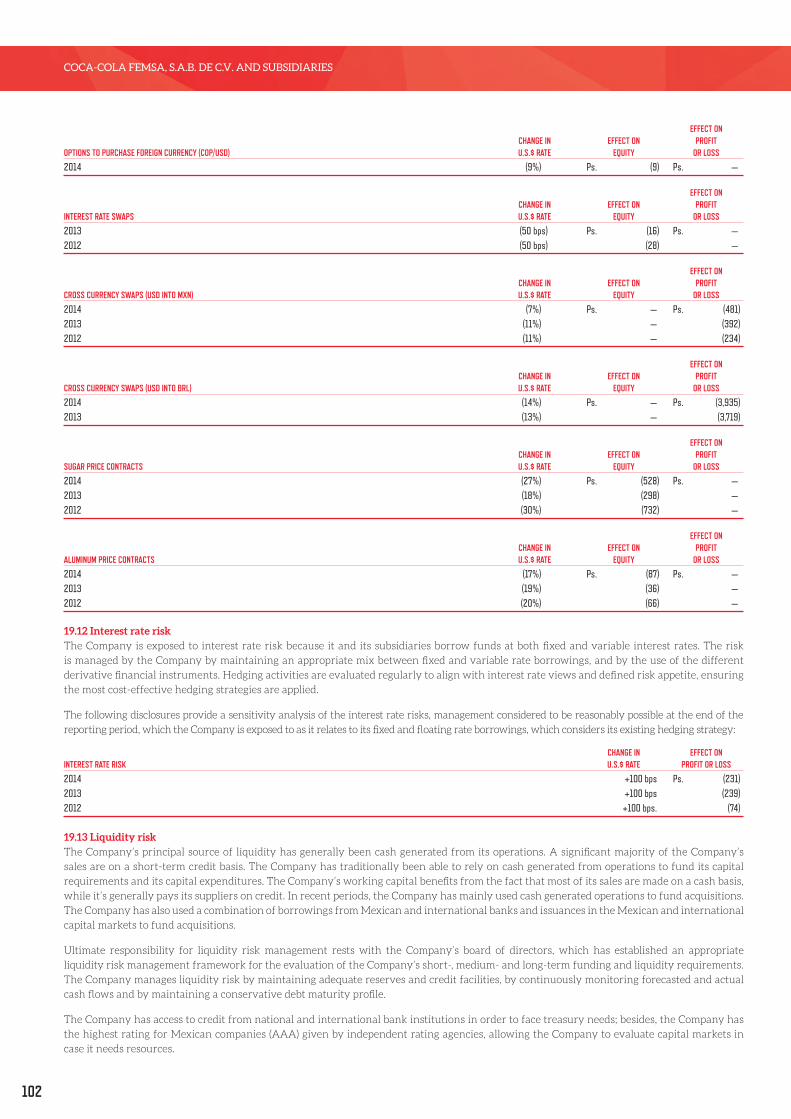
102
COCA-COLA FEMSA, S.A.B. DE C.V. AND SUBSIDIARIES
EFFECT ON CHANGE IN EFFECT ON PROFIT OPTIONS TO PURCHASE FOREIGN CURRENCY (COP/USD) U.S.$ RATE EQUITY OR LOSS
2014 (9%) Ps. (9) Ps. —
EFFECT ON CHANGE IN EFFECT ON PROFIT INTEREST RATE SWAPS U.S.$ RATE EQUITY OR LOSS
2013 (50 bps) Ps. (16) Ps. —2012 (50 bps) (28) —
EFFECT ON CHANGE IN EFFECT ON PROFIT CROSS CURRENCY SWAPS (USD INTO MXN) U.S.$ RATE EQUITY OR LOSS
2014 (7%) Ps. — Ps. (481)2013 (11%) — (392)2012 (11%) — (234)
EFFECT ON CHANGE IN EFFECT ON PROFIT CROSS CURRENCY SWAPS (USD INTO BRL) U.S.$ RATE EQUITY OR LOSS
2014 (14%) Ps. — Ps. (3,935)2013 (13%) — (3,719)
EFFECT ON CHANGE IN EFFECT ON PROFIT SUGAR PRICE CONTRACTS U.S.$ RATE EQUITY OR LOSS
2014 (27%) Ps. (528) Ps. —2013 (18%) (298) —2012 (30%) (732) —
EFFECT ON CHANGE IN EFFECT ON PROFIT ALUMINUM PRICE CONTRACTS U.S.$ RATE EQUITY OR LOSS
2014 (17%) Ps. (87) Ps. —2013 (19%) (36) —2012 (20%) (66) —
19.12 Interest rate riskThe Company is exposed to interest rate risk because it and its subsidiaries borrow funds at both fixed and variable interest rates. The risk
is managed by the Company by maintaining an appropriate mix between fixed and variable rate borrowings, and by the use of the different
derivative financial instruments. Hedging activities are evaluated regularly to align with interest rate views and defined risk appetite, ensuring
the most cost-effective hedging strategies are applied.
The following disclosures provide a sensitivity analysis of the interest rate risks, management considered to be reasonably possible at the end of the
reporting period, which the Company is exposed to as it relates to its fixed and floating rate borrowings, which considers its existing hedging strategy:
CHANGE IN EFFECT ON INTEREST RATE RISK U.S.$ RATE PROFIT OR LOSS
2014 +100 bps Ps. (231)2013 +100 bps (239)2012 +100 bps. (74)
19.13 Liquidity riskThe Company’s principal source of liquidity has generally been cash generated from its operations. A significant majority of the Company’s
sales are on a short-term credit basis. The Company has traditionally been able to rely on cash generated from operations to fund its capital
requirements and its capital expenditures. The Company’s working capital benefits from the fact that most of its sales are made on a cash basis,
while it’s generally pays its suppliers on credit. In recent periods, the Company has mainly used cash generated operations to fund acquisitions.
The Company has also used a combination of borrowings from Mexican and international banks and issuances in the Mexican and international
capital markets to fund acquisitions.
Ultimate responsibility for liquidity risk management rests with the Company’s board of directors, which has established an appropriate
liquidity risk management framework for the evaluation of the Company’s short-, medium- and long-term funding and liquidity requirements.
The Company manages liquidity risk by maintaining adequate reserves and credit facilities, by continuously monitoring forecasted and actual
cash flows and by maintaining a conservative debt maturity profile.
The Company has access to credit from national and international bank institutions in order to face treasury needs; besides, the Company has
the highest rating for Mexican companies (AAA) given by independent rating agencies, allowing the Company to evaluate capital markets in
case it needs resources.

103
COCA-COLA FEMSA, S.A.B. DE C.V. AND SUBSIDIARIES
As part of the Company’s financing policy, management expects to continue financing its liquidity needs with cash from operations. Nonetheless,
as a result of regulations in certain countries in which the Company operates, it may not be beneficial or, as in the case of exchange controls in
Venezuela, practicable to remit cash generated in local operations to fund cash requirements in other countries. Exchange controls like those in
Venezuela may also increase the real price of remitting cash from operations to fund debt requirements in other countries. In the event that cash
from operations in these countries is not sufficient to fund future working capital requirements and capital expenditures, management may decide,
or be required, to fund cash requirements in these countries through local borrowings rather than remitting funds another country. In addition,
the Company’s liquidity in Venezuela could be affected by changes in the rules applicable to exchange rates as well as other regulations, such as
exchange controls. In the future management may finance our working capital and capital expenditure needs with short-term or other borrowings.
The Company’s management continuously evaluates opportunities to pursue acquisitions or engage in strategic transactions. The Company
would expect to finance any significant future transactions with a combination of cash from operations, long-term indebtedness and capital
stock.
See Note 17 for a disclosure of the Company’s maturity dates associated with its non-current financial liabilities as of December 31, 2014.
The following table reflects all contractually fixed and variable pay-offs for settlement, repayments and interest resulting from recognized
financial liabilities. It includes expected gross cash outflows from derivative financial liabilities that are in place as per December 31, 2014.
Such expected net cash outflows are determined based on each particular settlement date of an instrument. The amounts disclosed are
undiscounted net cash outflows for the respective upcoming fiscal years, based on the earliest date on which the Company could be required
to pay. Cash outflows for financial liabilities (including interest) without fixed amount or timing are based on economic conditions (like interest
rates and foreign exchange rates) existing at December 31, 2014.
2020 AND (IN MILLIONS OF PS) 2015 2016 2017 2018 2019 THEREAFTER
Non-derivative financial liabilities: Notes and bonds Ps. 2,375 Ps. 4,821 Ps. 2,283 Ps. 16,972 Ps. 1,934 Ps. 54,283 Loans from banks 1,280 2,908 175 4,953 55 122Obligations under finance leases 249 212 180 94 45 54Derivatives financial liabilities 2,361 2,367 2,367 (1,906) - -
The Company generally makes payments associated with its non-current financial liabilities with cash generated from its operations.
19.14 Credit riskCredit risk refers to the risk that counterparty will default on its contractual obligations resulting in financial loss to the Company. The Company
has adopted a policy of only dealing with creditworthy counterparties, where appropriate, as a means of mitigating the risk of financial loss from
defaults. The Company only transacts with entities that are rated the equivalent of investment grade and above. This information is supplied by
independent rating agencies where available and, if not available, the Company uses other publicly available financial information and its own
trading records to rate its major customers. The Company’s exposure and the credit ratings of its counterparties are continuously monitored and
the aggregate value of transactions is spread amongst approved counterparties.
The Company has a high receivable turnover; hence management believes credit risk is minimal due to the nature of its businesses, which have
a large portion of their sales settled in cash.
The credit risk on liquid funds and derivative financial instruments is limited because the counterparties are banks with high credit-ratings
assigned by international credit-rating agencies.
The Company manages the credit risk related to its derivative portfolio by only entering into transactions with reputable and credit-worthy
counterparties as well as by maintaining a Credit Support Annex (CSA) that establishes margin requirements. As of December 31, 2014 the
Company concluded that the maximum exposure to credit risk related with derivative financial instruments is not significant given the high
credit rating of its counterparties.
NOTE 20. NON-CONTROLLING INTEREST IN CONSOLIDATED SUBSIDIARIES
An analysis of Coca-Cola FEMSA’s non-controlling interest in its consolidated subsidiaries for the years ended December 31, 2014, 2013 and
2012 is as follows:
2014 2013 2012
Mexico Ps. 3,614 Ps. 3,309 Ps. 2,782Colombia 15 16 24Brazil 772 717 373 Ps. 4,401 Ps. 4,042 Ps. 3,179

104
COCA-COLA FEMSA, S.A.B. DE C.V. AND SUBSIDIARIES
The changes in the Coca-Cola FEMSA’s non-controlling interest were as follows:
2014 2013 2012
Balance at beginning of the year Ps. 4,042 Ps. 3,179 Ps. 3,053Net income of non controlling interest (1) 424 239 565Exchange differences on translation of foreign operations (21) 212 (307)Remeasurements of the net defined employee benefit liability (21) (7) 6Valuation of the effective portion of derivative financial instruments, net of taxes (5) (44) (22)Acquisitions effects — — (7)Increase in shares of non-controlling interest — 515 —Dividends paid (18) (52) (109)Balance at end of the year Ps. 4,401 Ps. 4,042 Ps. 3,179
(1) For the years ended at 2014, 2013 and 2012, the Company’s net income allocated to non-controlling interest was Ps. 424, Ps. 239, and Ps. 565, respectively.
NOTE 21. EQUITY
21.1 Equity accountsAs of December 31, 2014, the capital stock of Coca-Cola FEMSA is represented by 2,072,922,229 common shares, with no par value. Fixed capital
stock is Ps. 922 (nominal value) and variable capital is unlimited.
The characteristics of the common shares are as follows:
• Series “A” and series “D” shares are ordinary, have unlimited voting rights, are subject to transfer restrictions, and at all times must represent
a minimum of 75% of subscribed capital stock;
• Series “A” shares may only be acquired by Mexican individuals and may not represent less than 51% of the ordinary shares.
• Series “D” shares have no foreign ownership restrictions and may not represent more than 49% of the ordinary shares.
• Series “L” shares have no foreign ownership restrictions and have limited voting rights and other corporate rights.
As of December 31, 2014, 2013 and 2012, the number of each share series representing Coca-Cola FEMSA’s capital stock is comprised as follows:
THOUSANDS OF SHARESSERIES OF SHARES 2014 2013 2012
“A” 992,078 992,078 992,078“D” 583,546 583,546 583,546“L” 497,298 497,298 454,920 2,072,922 2,072,922 2,030,544
The changes in the share are as follows:
THOUSANDS OF SHARESSERIES OF SHARES 2014 2013 2012
Initial shares 2,072,922 2,030,544 1,985,454Shares issuance — 42,378 45,090Final shares 2,072,922 2,072,922 2,030,544
The net income of the Company is subject to the legal requirement that 5% thereof be transferred to a legal reserve until such reserve equals 20%
of capital stock at nominal value. This reserve may not be distributed to shareholders during the existence of the Company. As of December 31,
2014, 2013 and 2012, this reserve is Ps. 164 for the three years.
Retained earnings and other reserves distributed as dividends, as well as the effects derived from capital reductions, are subject to income tax at
the rate in effect at the date of distribution, except for restated shareholder contributions and distributions made from net consolidated taxable
income, denominated “Cuenta de Utilidad Fiscal Neta” (“CUFIN”).
Dividends paid in excess of CUFIN are subject to income tax at a grossed-up rate based on the current statutory rate. Since 2003, this tax may be
credited against the income tax of the year in which the dividends are paid, and in the following two years against the income tax and estimated
tax payments. As of December 31, 2014, the Company’s balances of CUFIN amounted to Ps. 17,044.

105
COCA-COLA FEMSA, S.A.B. DE C.V. AND SUBSIDIARIES
For the years ended December 31, 2014, 2013 and 2012 the dividends declared and paid per share by the Company are as follows:
THOUSANDS OF SHARESSERIES OF SHARES 2014 2013 2012
“A” Ps. 2,877 Ps. 2,877 Ps. 2,747“D” 1,692 1,692 1,617“L” 1,443 1,381 1,260 Ps. 6,012 Ps. 5,950 Ps. 5,624
(1) At an ordinary shareholders’ meeting of Coca-Cola FEMSA held on March 6, 2014, the shareholders declared a dividend of Ps. 6,012 that was paid in May 4, 2014 and November 5, 2014. Represents a dividend of Ps. 2.90 per each ordinary share.
21.2 Capital managementThe Company manages its capital to ensure that its subsidiaries will be able to continue as going concerns while maximizing the return to
shareholders through the optimization of its debt and equity balance in order to obtain the lowest cost of capital available. The Company
manages its capital structure and makes adjustments to it in light of changes in economic conditions. To maintain or adjust the capital structure,
the Company may adjust the dividend payment to shareholders, return capital to shareholders or issue new shares. No changes were made in
the objectives, policies or processes for managing capital during the years ended December 31, 2014 and 2013.
The Company is not subject to any externally imposed capital requirements, other than the legal reserve and debt covenants (see Note 17 and
Note 21.1).
The Company’s finance committee reviews the capital structure of the Company on a quarterly basis. As part of this review, the committee
considers the cost of capital and the risks associated with each class of capital. In conjunction with this objective, the Company seeks to maintain
the highest achievable credit rating both nationally and internationally and is currently rated AAA in a national scale and A- in a global scale.
To maintain the current ratings, the Company has to at least stay at a debt to earnings before interest, taxes, depreciation and amortization
(“EBITDA”) ratio of 2. A sustained increase above this level could result in a one notch downgrade. As a result, prior to entering into new business
ventures, acquisitions or divestures, management evaluates the optimal ratio of debt to EBITDA in order to maintain its credit rating.
NOTE 22. EARNINGS PER SHARE
Basic earnings per share amounts are calculated by dividing consolidated net income for the year attributable to controlling interest by the
weighted average number of shares outstanding during the period adjusted for the weighted average of own shares purchased in the period.
Basic earnings per share amounts are as follows:
2014 PER SERIES PER SERIES PER SERIES “A” SHARES “D” SHARES “L” SHARES
Consolidated net income Ps. 5,248 Ps. 3,087 Ps. 2,631
Consolidated net income attributable to equity holders of the parent 5,045 2,968 2,529Weighted average number of shares for basic earnings per share (millions of shares) 992 584 497
2013 PER SERIES PER SERIES PER SERIES “A” SHARES “D” SHARES “L” SHARES
Consolidated net income Ps. 5,685 Ps. 3,343 Ps. 2,754
Consolidated net income attributable to equity holders of the parent 5,569 3,276 2,698Weighted average number of shares for basic earnings per share (millions of shares) 992 584 481
2012 PER SERIES PER SERIES PER SERIES “A” SHARES “D” SHARES “L” SHARES
Consolidated net income Ps. 6,842 Ps. 4,025 Ps. 3,031
Consolidated net income attributable to equity holders of the parent 6,564 3,861 2,908Weighted average number of shares for basic earnings per share (millions of shares) 992 584 439

106
COCA-COLA FEMSA, S.A.B. DE C.V. AND SUBSIDIARIES
NOTE 23. INCOME TAXES
23.1 Income TaxThe major components of income tax expense for the years ended December 31, 2014, 2013 and 2012 are:
2014 2013 2012Current tax expense:Current year Ps. 5,002 Ps. 5,889 Ps. 5,371
Deferred tax expense:Origination and reversal of temporary differences 1,808 (4) 606(Benefit) utilization of tax losses recognized (2,949) (154) 297Total deferred tax expense (1,141) (158) 903Total income tax expense in consolidated net income Ps. 3,861 Ps. 5,731 Ps. 6,274
2014 MEXICO FOREIGN TOTALCurrent tax expense:Current year Ps. 2,974 Ps. 2,028 Ps. 5,002
Deferred tax expense:Origination and reversal of temporary differences (249) 2,057 1,808Benefit of tax losses recognized (490) (2,459) (2,949)Total deferred tax expense (benefit) (739) (402) (1,141)Total income tax expense in consolidated net income Ps. 2,235 Ps. 1,626 Ps. 3,861
2013 MEXICO FOREIGN TOTALCurrent tax expense:Current year Ps. 2,949 Ps. 2,940 Ps. 5,889
Deferred tax expense:Origination and reversal of temporary differences (311) 307 (4)Utilization of tax losses recognized (24) (130) (154)Total deferred tax expense (benefit) (335) 177 (158)Total income tax expense in consolidated net income Ps. 2,614 Ps. 3,117 Ps. 5,731
2012 MEXICO FOREIGN TOTALCurrent tax expense:Current year Ps. 3,030 Ps. 2,341 Ps. 5,371
Deferred tax expense:Origination and reversal of temporary differences (318) 924 606Benefit of tax losses recognized 214 83 297Total deferred tax expense (benefit) (104) 1,007 903Total income tax expense in consolidated net income Ps. 2,926 Ps. 3,348 Ps. 6,274
Recognized in Consolidated Statement of Other Comprehensive Income (OCI)
INCOME TAX RELATED TO ITEMS CHARGED OR RECOGNIZED DIRECTLY IN OCI DURING THE YEAR: 2014 2013 2012
Unrealized gain on cash flow hedges Ps. 99 Ps. (147) Ps. (95)Unrealized gain on available for sale securities - (1) (2)Remeasurements of the net defined benefit liability (51) (75) (62)Total income tax recognized in OCI Ps. 48 Ps. (223) Ps. (159)
Balance of income tax of Other Comprehensive Income (OCI) as of:
INCOME TAX RELATED TO ITEMS CHARGED OR RECOGNIZED DIRECTLY IN OCI AS OF YEAR END: 2014 2013 2012
Unrealized gain on derivative financial instruments Ps. (107) Ps. (208) Ps. (67)Unrealized gain on available for sale securities — — 1Comprehensive income to be reclassified to profit or loss in subsequent periods (107) (208) (66)Re-measurements of the net defined benefit liability (167) (196) (120)Balance of income tax in OCI Ps. (274) Ps. (404) Ps. (186)
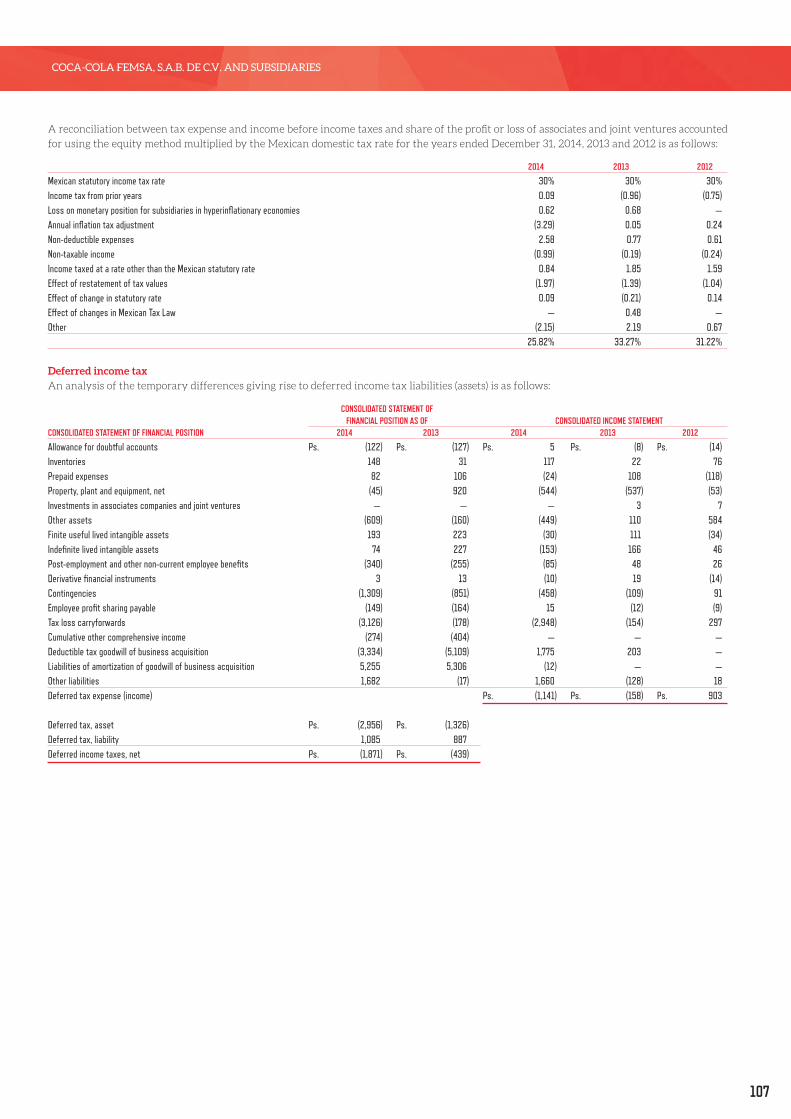
107
COCA-COLA FEMSA, S.A.B. DE C.V. AND SUBSIDIARIES
A reconciliation between tax expense and income before income taxes and share of the profit or loss of associates and joint ventures accounted
for using the equity method multiplied by the Mexican domestic tax rate for the years ended December 31, 2014, 2013 and 2012 is as follows:
2014 2013 2012
Mexican statutory income tax rate 30% 30% 30%Income tax from prior years 0.09 (0.96) (0.75)Loss on monetary position for subsidiaries in hyperinflationary economies 0.62 0.68 —Annual inflation tax adjustment (3.29) 0.05 0.24Non-deductible expenses 2.58 0.77 0.61Non-taxable income (0.99) (0.19) (0.24)Income taxed at a rate other than the Mexican statutory rate 0.84 1.85 1.59Effect of restatement of tax values (1.97) (1.39) (1.04)Effect of change in statutory rate 0.09 (0.21) 0.14Effect of changes in Mexican Tax Law — 0.48 —Other (2.15) 2.19 0.67 25.82% 33.27% 31.22%
Deferred income taxAn analysis of the temporary differences giving rise to deferred income tax liabilities (assets) is as follows:
CONSOLIDATED STATEMENT OF FINANCIAL POSITION AS OF CONSOLIDATED INCOME STATEMENTCONSOLIDATED STATEMENT OF FINANCIAL POSITION 2014 2013 2014 2013 2012
Allowance for doubtful accounts Ps. (122) Ps. (127) Ps. 5 Ps. (8) Ps. (14)Inventories 148 31 117 22 76Prepaid expenses 82 106 (24) 108 (118)Property, plant and equipment, net (45) 920 (544) (537) (53)Investments in associates companies and joint ventures — — — 3 7Other assets (609) (160) (449) 110 584Finite useful lived intangible assets 193 223 (30) 111 (34)Indefinite lived intangible assets 74 227 (153) 166 46Post-employment and other non-current employee benefits (340) (255) (85) 48 26Derivative financial instruments 3 13 (10) 19 (14)Contingencies (1,309) (851) (458) (109) 91Employee profit sharing payable (149) (164) 15 (12) (9)Tax loss carryforwards (3,126) (178) (2,948) (154) 297Cumulative other comprehensive income (274) (404) — — —Deductible tax goodwill of business acquisition (3,334) (5,109) 1,775 203 —Liabilities of amortization of goodwill of business acquisition 5,255 5,306 (12) — —Other liabilities 1,682 (17) 1,660 (128) 18Deferred tax expense (income) Ps. (1,141) Ps. (158) Ps. 903
Deferred tax, asset Ps. (2,956) Ps. (1,326)Deferred tax, liability 1,085 887Deferred income taxes, net Ps. (1,871) Ps. (439)
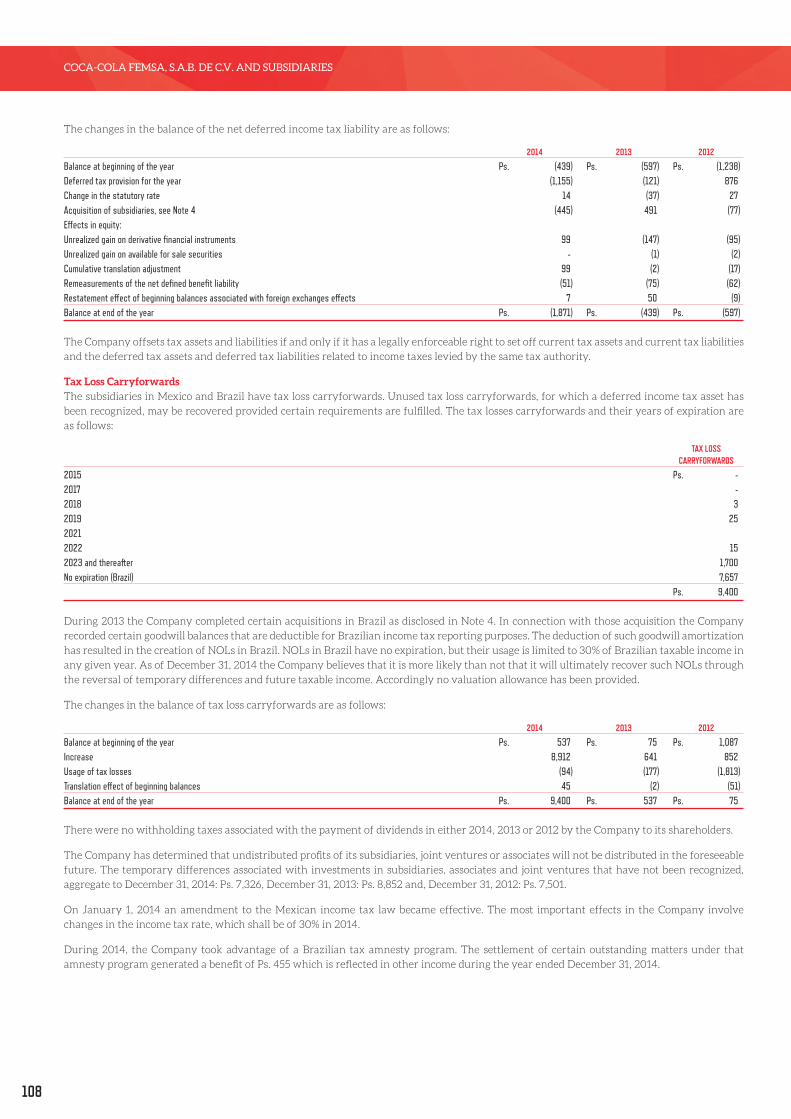
108
COCA-COLA FEMSA, S.A.B. DE C.V. AND SUBSIDIARIES
The changes in the balance of the net deferred income tax liability are as follows:
2014 2013 2012
Balance at beginning of the year Ps. (439) Ps. (597) Ps. (1,238)Deferred tax provision for the year (1,155) (121) 876Change in the statutory rate 14 (37) 27Acquisition of subsidiaries, see Note 4 (445) 491 (77)Effects in equity:Unrealized gain on derivative financial instruments 99 (147) (95)Unrealized gain on available for sale securities - (1) (2)Cumulative translation adjustment 99 (2) (17)Remeasurements of the net defined benefit liability (51) (75) (62)Restatement effect of beginning balances associated with foreign exchanges effects 7 50 (9)Balance at end of the year Ps. (1,871) Ps. (439) Ps. (597)
The Company offsets tax assets and liabilities if and only if it has a legally enforceable right to set off current tax assets and current tax liabilities
and the deferred tax assets and deferred tax liabilities related to income taxes levied by the same tax authority.
Tax Loss CarryforwardsThe subsidiaries in Mexico and Brazil have tax loss carryforwards. Unused tax loss carryforwards, for which a deferred income tax asset has
been recognized, may be recovered provided certain requirements are fulfilled. The tax losses carryforwards and their years of expiration are
as follows:
TAX LOSS CARRYFORWARDS
2015 Ps. -2017 -2018 32019 2520212022 152023 and thereafter 1,700No expiration (Brazil) 7,657 Ps. 9,400
During 2013 the Company completed certain acquisitions in Brazil as disclosed in Note 4. In connection with those acquisition the Company
recorded certain goodwill balances that are deductible for Brazilian income tax reporting purposes. The deduction of such goodwill amortization
has resulted in the creation of NOLs in Brazil. NOLs in Brazil have no expiration, but their usage is limited to 30% of Brazilian taxable income in
any given year. As of December 31, 2014 the Company believes that it is more likely than not that it will ultimately recover such NOLs through
the reversal of temporary differences and future taxable income. Accordingly no valuation allowance has been provided.
The changes in the balance of tax loss carryforwards are as follows:
2014 2013 2012
Balance at beginning of the year Ps. 537 Ps. 75 Ps. 1,087Increase 8,912 641 852Usage of tax losses (94) (177) (1,813)Translation effect of beginning balances 45 (2) (51)Balance at end of the year Ps. 9,400 Ps. 537 Ps. 75
There were no withholding taxes associated with the payment of dividends in either 2014, 2013 or 2012 by the Company to its shareholders.
The Company has determined that undistributed profits of its subsidiaries, joint ventures or associates will not be distributed in the foreseeable
future. The temporary differences associated with investments in subsidiaries, associates and joint ventures that have not been recognized,
aggregate to December 31, 2014: Ps. 7,326, December 31, 2013: Ps. 8,852 and, December 31, 2012: Ps. 7,501.
On January 1, 2014 an amendment to the Mexican income tax law became effective. The most important effects in the Company involve
changes in the income tax rate, which shall be of 30% in 2014.
During 2014, the Company took advantage of a Brazilian tax amnesty program. The settlement of certain outstanding matters under that
amnesty program generated a benefit of Ps. 455 which is reflected in other income during the year ended December 31, 2014.

109
COCA-COLA FEMSA, S.A.B. DE C.V. AND SUBSIDIARIES
23.2 Other taxesThe operations in Guatemala, Nicaragua, Colombia and Argentina are subject to a minimum tax, which is based primary on a percentage of
assets. Any payments are recoverable in future years, under certain conditions.
23.3 Tax ReformOn January 1, 2014, annual changes to Mexican legislation became effective. The most significant changes are described as follows:
• A new withholding tax of 10 % on dividends and / or earnings generated in 2014 and beyond;
• New taxes of 1 Mexican peso per liter on the sale of flavored beverages with added sugar;
• the tax on cash deposits (IDE ) and the Business Flat Tax (IETU) are eliminated;
• the income tax deduction of exempt payroll items for workers is limited to 53%, or 47% in case the percentile of exempt items changes in
comparison with prior year;
• the credit of income tax paid abroad is limited to 30% of the taxable income and it is calculated considering the inflows by country and by
year, proportionally to the net income distributed by the affiliates; and
• the income tax rate remains at 30 % for 2014 and subsequent years.
The effects of these changes have been incorporated into the Company’s consolidated financial statements as of December 31, 2014.
On November 18, 2014, the Venezuelan government published two decrees enacting several significant changes which are effective as of the
date of publication.
This reform establishes that segregated loss carryforward (i.e. foreign operating or domestic operating) may be used only against future
income of the same type. Additionally the three year carryforward for net operating losses is maintained, but the amount of losses available
for carryforwards may not exceed twenty five percent of the tax period’s taxable income, the carryforward of losses relating to inflationary
adjustments has been eliminated.
NOTE 24. OTHER LIABILITIES, PROVISIONS AND COMMITMENTS
24.1 Other current financial liabilities
2014 2013
Sundry creditors Ps. 1,569 Ps. 1,439Derivative financial instruments 313 304Total Ps. 1,882 Ps. 1,743
24.2 Provisions and other liabilities
2014 2013
Provisions Ps. 4,168 Ps. 4,479Taxes payable 270 253Other 889 802Total Ps. 5,327 Ps. 5,534
24.3 Other non-current financial liabilities
2014 2013
Derivative financial instruments Ps. 112 Ps. 1,121Security deposits 176 142Total Ps. 288 Ps. 1,263
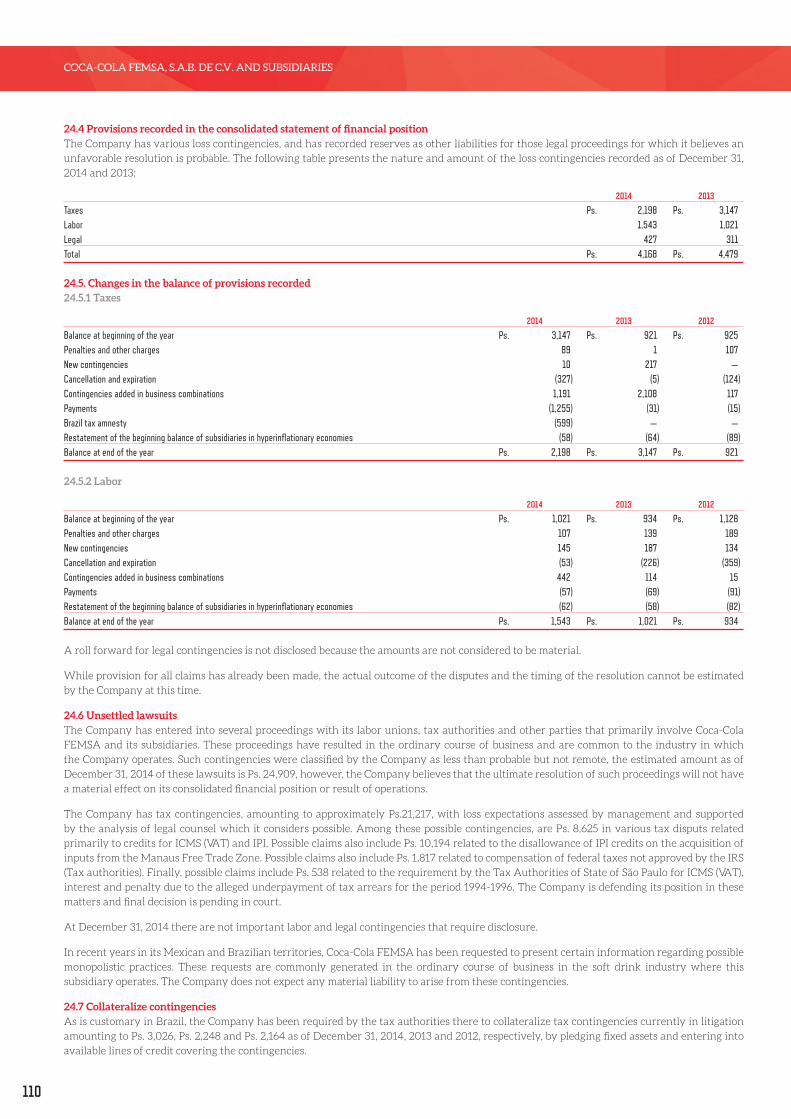
110
COCA-COLA FEMSA, S.A.B. DE C.V. AND SUBSIDIARIES
24.4 Provisions recorded in the consolidated statement of financial positionThe Company has various loss contingencies, and has recorded reserves as other liabilities for those legal proceedings for which it believes an
unfavorable resolution is probable. The following table presents the nature and amount of the loss contingencies recorded as of December 31,
2014 and 2013:
2014 2013
Taxes Ps. 2,198 Ps. 3,147Labor 1,543 1,021Legal 427 311Total Ps. 4,168 Ps. 4,479
24.5. Changes in the balance of provisions recorded24.5.1 Taxes
2014 2013 2012
Balance at beginning of the year Ps. 3,147 Ps. 921 Ps. 925Penalties and other charges 89 1 107New contingencies 10 217 —Cancellation and expiration (327) (5) (124)Contingencies added in business combinations 1,191 2,108 117Payments (1,255) (31) (15)Brazil tax amnesty (599) — —Restatement of the beginning balance of subsidiaries in hyperinflationary economies (58) (64) (89)Balance at end of the year Ps. 2,198 Ps. 3,147 Ps. 921
24.5.2 Labor
2014 2013 2012
Balance at beginning of the year Ps. 1,021 Ps. 934 Ps. 1,128Penalties and other charges 107 139 189New contingencies 145 187 134Cancellation and expiration (53) (226) (359)Contingencies added in business combinations 442 114 15Payments (57) (69) (91)Restatement of the beginning balance of subsidiaries in hyperinflationary economies (62) (58) (82)Balance at end of the year Ps. 1,543 Ps. 1,021 Ps. 934
A roll forward for legal contingencies is not disclosed because the amounts are not considered to be material.
While provision for all claims has already been made, the actual outcome of the disputes and the timing of the resolution cannot be estimated
by the Company at this time.
24.6 Unsettled lawsuitsThe Company has entered into several proceedings with its labor unions, tax authorities and other parties that primarily involve Coca-Cola
FEMSA and its subsidiaries. These proceedings have resulted in the ordinary course of business and are common to the industry in which
the Company operates. Such contingencies were classified by the Company as less than probable but not remote, the estimated amount as of
December 31, 2014 of these lawsuits is Ps. 24,909, however, the Company believes that the ultimate resolution of such proceedings will not have
a material effect on its consolidated financial position or result of operations.
The Company has tax contingencies, amounting to approximately Ps.21,217, with loss expectations assessed by management and supported
by the analysis of legal counsel which it considers possible. Among these possible contingencies, are Ps. 8,625 in various tax disputs related
primarily to credits for ICMS (VAT) and IPI. Possible claims also include Ps. 10,194 related to the disallowance of IPI credits on the acquisition of
inputs from the Manaus Free Trade Zone. Possible claims also include Ps. 1,817 related to compensation of federal taxes not approved by the IRS
(Tax authorities). Finally, possible claims include Ps. 538 related to the requirement by the Tax Authorities of State of São Paulo for ICMS (VAT),
interest and penalty due to the alleged underpayment of tax arrears for the period 1994-1996. The Company is defending its position in these
matters and final decision is pending in court.
At December 31, 2014 there are not important labor and legal contingencies that require disclosure.
In recent years in its Mexican and Brazilian territories, Coca-Cola FEMSA has been requested to present certain information regarding possible
monopolistic practices. These requests are commonly generated in the ordinary course of business in the soft drink industry where this
subsidiary operates. The Company does not expect any material liability to arise from these contingencies.
24.7 Collateralize contingenciesAs is customary in Brazil, the Company has been required by the tax authorities there to collateralize tax contingencies currently in litigation
amounting to Ps. 3,026, Ps. 2,248 and Ps. 2,164 as of December 31, 2014, 2013 and 2012, respectively, by pledging fixed assets and entering into
available lines of credit covering the contingencies.

111
COCA-COLA FEMSA, S.A.B. DE C.V. AND SUBSIDIARIES
24.8 CommitmentsAs of December 31, 2014, the Company has contractual commitments for financing leases for machinery and transport equipment and operating
leases for the rental of production machinery and equipment, distribution and computer equipment.
The contractual maturities of the operating leases commitments by currency, expressed in Mexican pesos as of December 31, 2014, are as follows:
MEXICAN PESOS U.S. DOLLARS OTHER
Not later than 1 year Ps. 167 Ps. 77 Ps. 5Later than 1 year and not later than 5 years 744 302 15Later than 5 years 421 147 3Total Ps. 1,332 Ps. 526 Ps. 23
Rental expense charged to consolidated net income was Ps. 940, Ps. 949 and Ps. 1,019 for the years ended December 31, 2014, 2013 and 2012,
respectively.
Future minimum lease payments under finance leases with the present value of the net minimum lease payments are as follows:
2014 PRESENT 2013 PRESENT MINIMUM VALUE OF MINIMUM VALUE OF PAYMENTS PAYMENTS PAYMENTS PAYMENTS
Not later than 1 year Ps. 255 Ps. 222 Ps. 278 Ps. 237Later than 1 year and not later than 5 years 501 474 775 717Later than 5 years 62 64 4 5Total minimum lease payments 818 760 1,057 959Less amount representing finance charges 58 — 98 —Present value of minimum lease payments Ps. 760 Ps. 959
The Company has firm commitments for the purchase of property, plant and equipment of Ps. 2,077 as December 31, 2014.
24.9 Restructuring provisionCoca-Cola FEMSA recorded a restructuring provision. This provision relates principally to reorganization in the structure of the Company.
The restructuring plan was drawn up and announced to the employees of the Company in 2014 when the provision was recognized in its
consolidated financial statements. The restructuring of the Company is expected to complete by 2015 and it is presented in current liabilities
within accounts payable caption in the consolidated statement of financial position.
2014 2013 2012
Balance at beginning of the year Ps. - Ps. 90 Ps. 153New 199 179 191Payments (142) (234) (254)Cancellation (25) (35) —Balance at end of the year Ps. 32 Ps. — Ps. 90
NOTE 25. INFORMATION BY SEGMENT
The Company’s Chief Operating Decision Maker (“CODM”) is the Chief Executive Officer, who reviews periodically reviews financial information
at the country level. Thus, each of the seperate countries in wich the Company operates are considered operating segments, with the exception
of Central America which representes a single operating segment.
The Company has aggregated operating segments into the following reporting segments for the purposes of its consolidated financial statements:
(i) Mexico and Central America division (comprising the following countries: Mexico (including corporate operations), Guatemala, Nicaragua,
Costa Rica and Panama) and (ii) the South America division (comprising the following countries: Brazil, Argentina, Colombia and Venezuela).
Venezuela operates in an economy with exchange control and hyper-inflation; and as a result, IAS 29, “Financial Reporting in Hyperinflationary
Economies” does not allow its aggregation into the South America segment and (iii) the Asian division comprised of the Company’s equity
method investment in CCFPI (Philippines) which was acquired in January 2013 (see Note 9).
The Company is of the view that the quantitative and qualitative aspects of the aggregated operating segments are similar in nature for all periods
presented. In evaluating the appropriatness of aggregating operating segments, the key indicators considered included but were not limited to:
(i) similarities of customer base, products, production processes and distribution processes, (ii) similarities of governments, (iii) inflation trends,
(iv) currency trends, (v) acquisition opportunities, including efficiencies to be achieved through the continued integration of acquisitions, and (vi)
historical and projected financial and operating statistics.
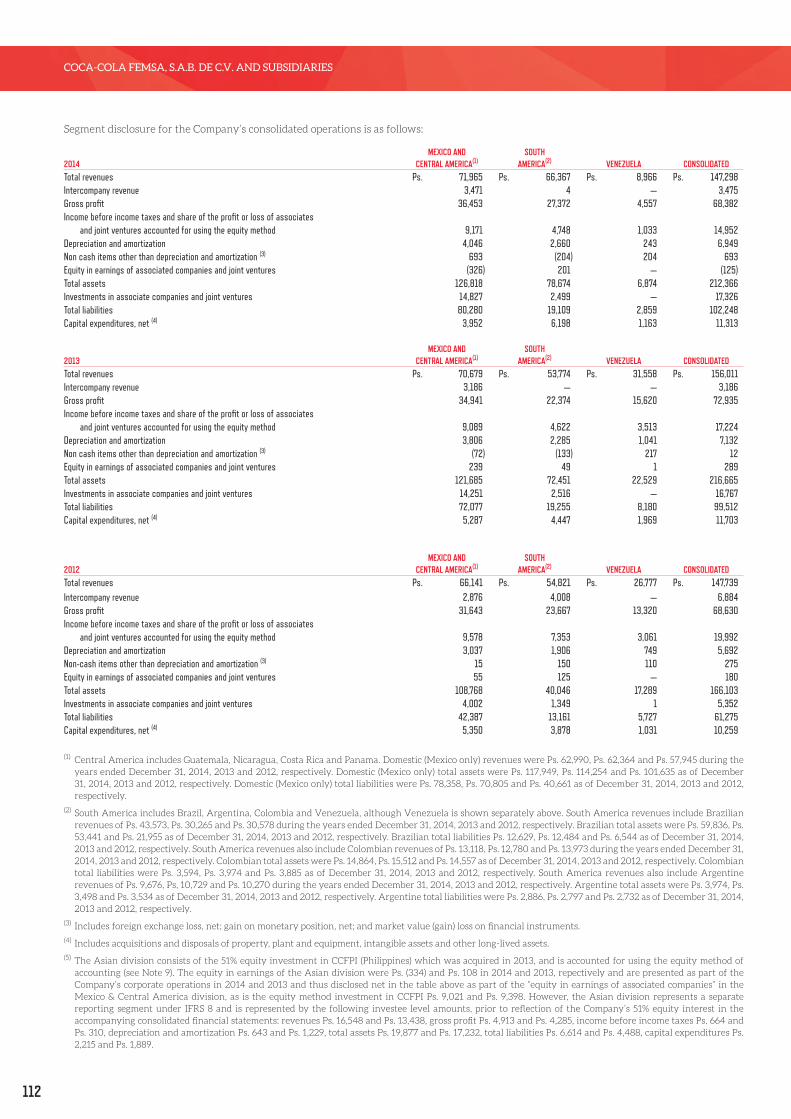
112
COCA-COLA FEMSA, S.A.B. DE C.V. AND SUBSIDIARIES
Segment disclosure for the Company’s consolidated operations is as follows:
MEXICO AND SOUTH 2014 CENTRAL AMERICA(1) AMERICA(2) VENEZUELA CONSOLIDATEDTotal revenues Ps. 71,965 Ps. 66,367 Ps. 8,966 Ps. 147,298Intercompany revenue 3,471 4 — 3,475Gross profit 36,453 27,372 4,557 68,382Income before income taxes and share of the profit or loss of associates and joint ventures accounted for using the equity method 9,171 4,748 1,033 14,952Depreciation and amortization 4,046 2,660 243 6,949Non cash items other than depreciation and amortization (3) 693 (204) 204 693Equity in earnings of associated companies and joint ventures (326) 201 — (125)Total assets 126,818 78,674 6,874 212,366Investments in associate companies and joint ventures 14,827 2,499 — 17,326Total liabilities 80,280 19,109 2,859 102,248Capital expenditures, net (4) 3,952 6,198 1,163 11,313
MEXICO AND SOUTH 2013 CENTRAL AMERICA(1) AMERICA(2) VENEZUELA CONSOLIDATEDTotal revenues Ps. 70,679 Ps. 53,774 Ps. 31,558 Ps. 156,011Intercompany revenue 3,186 — — 3,186Gross profit 34,941 22,374 15,620 72,935Income before income taxes and share of the profit or loss of associates and joint ventures accounted for using the equity method 9,089 4,622 3,513 17,224Depreciation and amortization 3,806 2,285 1,041 7,132Non cash items other than depreciation and amortization (3) (72) (133) 217 12Equity in earnings of associated companies and joint ventures 239 49 1 289Total assets 121,685 72,451 22,529 216,665Investments in associate companies and joint ventures 14,251 2,516 — 16,767Total liabilities 72,077 19,255 8,180 99,512Capital expenditures, net (4) 5,287 4,447 1,969 11,703
MEXICO AND SOUTH 2012 CENTRAL AMERICA(1) AMERICA(2) VENEZUELA CONSOLIDATEDTotal revenues Ps. 66,141 Ps. 54,821 Ps. 26,777 Ps. 147,739Intercompany revenue 2,876 4,008 — 6,884Gross profit 31,643 23,667 13,320 68,630Income before income taxes and share of the profit or loss of associates and joint ventures accounted for using the equity method 9,578 7,353 3,061 19,992Depreciation and amortization 3,037 1,906 749 5,692Non-cash items other than depreciation and amortization (3) 15 150 110 275Equity in earnings of associated companies and joint ventures 55 125 — 180Total assets 108,768 40,046 17,289 166,103Investments in associate companies and joint ventures 4,002 1,349 1 5,352Total liabilities 42,387 13,161 5,727 61,275Capital expenditures, net (4) 5,350 3,878 1,031 10,259
(1) Central America includes Guatemala, Nicaragua, Costa Rica and Panama. Domestic (Mexico only) revenues were Ps. 62,990, Ps. 62,364 and Ps. 57,945 during the years ended December 31, 2014, 2013 and 2012, respectively. Domestic (Mexico only) total assets were Ps. 117,949, Ps. 114,254 and Ps. 101,635 as of December 31, 2014, 2013 and 2012, respectively. Domestic (Mexico only) total liabilities were Ps. 78,358, Ps. 70,805 and Ps. 40,661 as of December 31, 2014, 2013 and 2012, respectively.
(2) South America includes Brazil, Argentina, Colombia and Venezuela, although Venezuela is shown separately above. South America revenues include Brazilian revenues of Ps. 43,573, Ps. 30,265 and Ps. 30,578 during the years ended December 31, 2014, 2013 and 2012, respectively. Brazilian total assets were Ps. 59,836, Ps. 53,441 and Ps. 21,955 as of December 31, 2014, 2013 and 2012, respectively. Brazilian total liabilities Ps. 12,629, Ps. 12,484 and Ps. 6,544 as of December 31, 2014, 2013 and 2012, respectively. South America revenues also include Colombian revenues of Ps. 13,118, Ps. 12,780 and Ps. 13,973 during the years ended December 31, 2014, 2013 and 2012, respectively. Colombian total assets were Ps. 14,864, Ps. 15,512 and Ps. 14,557 as of December 31, 2014, 2013 and 2012, respectively. Colombian total liabilities were Ps. 3,594, Ps. 3,974 and Ps. 3,885 as of December 31, 2014, 2013 and 2012, respectively. South America revenues also include Argentine revenues of Ps. 9,676, Ps, 10,729 and Ps. 10,270 during the years ended December 31, 2014, 2013 and 2012, respectively. Argentine total assets were Ps. 3,974, Ps. 3,498 and Ps. 3,534 as of December 31, 2014, 2013 and 2012, respectively. Argentine total liabilities were Ps. 2,886, Ps. 2,797 and Ps. 2,732 as of December 31, 2014, 2013 and 2012, respectively.
(3) Includes foreign exchange loss, net; gain on monetary position, net; and market value (gain) loss on financial instruments.
(4) Includes acquisitions and disposals of property, plant and equipment, intangible assets and other long-lived assets.
(5) The Asian division consists of the 51% equity investment in CCFPI (Philippines) which was acquired in 2013, and is accounted for using the equity method of accounting (see Note 9). The equity in earnings of the Asian division were Ps. (334) and Ps. 108 in 2014 and 2013, repectively and are presented as part of the Company’s corporate operations in 2014 and 2013 and thus disclosed net in the table above as part of the “equity in earnings of associated companies” in the Mexico & Central America division, as is the equity method investment in CCFPI Ps. 9,021 and Ps. 9,398. However, the Asian division represents a separate reporting segment under IFRS 8 and is represented by the following investee level amounts, prior to reflection of the Company’s 51% equity interest in the accompanying consolidated financial statements: revenues Ps. 16,548 and Ps. 13,438, gross profit Ps. 4,913 and Ps. 4,285, income before income taxes Ps. 664 and Ps. 310, depreciation and amortization Ps. 643 and Ps. 1,229, total assets Ps. 19,877 and Ps. 17,232, total liabilities Ps. 6,614 and Ps. 4,488, capital expenditures Ps. 2,215 and Ps. 1,889.
113
COCA-COLA FEMSA, S.A.B. DE C.V. AND SUBSIDIARIES
NOTE 26. FUTURE IMPACT OF RECENTLY ISSUED ACCOUNTING STANDARDS NOT YET IN EFFECT:The Company has not applied the following the standards and interpretations that are issued, but not yet effective, up to the date of issuance
of the Company’s financial statements are disclosed below. The Company intends to adopt these standards, if applicable, when they become
effective.
Amendments to IAS 19, Employee benefitsIAS 19 requires an entity to consider contributions from employees or third parties when accounting for defined benefit plans. Where the
contributions are linked to service, they should be attributed to periods of service as a negative benefit. These amendments clarify that, if
the amount of the contributions is independent of the number of years of service, an entity is permitted to recognise such contributions as a
reduction in the service cost in the period in which the service is rendered, instead of allocating the contributions to the periods of service. This
amendment is effective for annual periods beginning on or after July 1, 2014. The Company has not early adopted this IFRS, and the Company
has yet to complete its evaluation of whether it will have a material impact on its consolidated financial statements.
Annual Improvements 2010-2012 CycleThese improvements are effective from July 1, 2014 and are not expected to have a material impact on the Company. Annual Improvements
2010-2012 Cycle makes amendments to: IFRS 2 “Share-based payment”, by amending the definitions of vesting condition and market condition,
and adding definitions for performance condition and service condition; IFRS 3 “Business combinations”, which require contingent consideration
that is classified as an asset or a liability to be measured at fair value at each reporting date; IAS 16 “Property, plant and equipment” and IAS 38
“Intangible assets” clarifying that the gross amount of property, plant and equipment is adjusted in a manner consistent with a revaluation of the
carrying amount; and IAS 24 “Related party Disclosures”, clarifying how payments to entities providing management services are to be disclosed.
These improvements are applicable to annual periods beginning on or after July 1, 2014. The Company has not early adopted this IFRS, and the
Company has yet to complete its evaluation of whether it will have a material impact on its consolidated financial statements.
IFRS 9, Financial InstrumentsIn July 2014, the IASB issued the final version of IFRS 9 Financial Instruments which reflects all phases of the financial instruments project
and replaces IAS 39 Financial Instruments: Recognition and Measurement and all previous versions of IFRS 9. The standard introduces new
requirements for classification and measurement, impairment, and hedge accounting. IFRS 9 is effective for annual periods beginning on or
after January 1, 2018, with early application permitted. Retrospective application is required, but comparative information is not compulsory.
Early application of previous versions of IFRS 9 (2009, 2010 and 2013) is permitted if the date of initial application is before February 1, 2015.
The adoption of IFRS 9 will have an effect on the classification and measurement of the Company´s financial assets, but no impact on the
classification and measurement of the Company’s financial liabilities. The Company has not early adopted this IFRS, and the Company has yet
to complete its evaluation of whether it will have a material impact on its consolidated financial statements.
IFRS 15, Revenue from Contracts with CustomersIFRS 15, “Revenue from Contracts with Customers”, was issued in May 2014 and applies to annual reporting periods beginning on or after 1
January 2017, earlier application is permitted. Revenue is recognized as control is passed, either over time or at a point in time.
The standard outlines a single comprehensive model for entities to use in accounting for revenue arising from contracts with customers and
supersedes most current revenue recognition guidance, including industry-specific guidance. In applying the revenue model to contracts within
its scope, an entity will: 1) Identify the contract(s) with a customer ; 2) Identify the performance obligations in the contract; 3) Determine the
transaction price; 4) Allocate the transaction price to the performance obligations in the contract; 5) Recognize revenue when (or as) the entity
satisfies a performance obligation. Also, an entity needs to disclose sufficient information to enable users of financial statements to understand
the nature, amount, timing and uncertainty of revenue and cash flows arising from contracts with customers. The Company has yet to complete
its evaluation of whether these changes will have a significant impact on its consolidated financial statements.

114
COCA-COLA FEMSA, S.A.B. DE C.V. AND SUBSIDIARIES
NOTE 27. SUPPLEMENTAL GUARANTOR INFORMATION
Consolidating Condensed Financial InformationThe following consolidating information presents consolidating condensed statements of financial position as of December 31, 2014 and 2013
and condensed consolidating statements of income, other comprehensive income and cash flows for each of the three years in the period ended
December 31, 2014, 2013 and 2012 of the Company and Propimex, S. de R.L. de C.V., Comercializadora la Pureza de Bebidas, S. de R.L. de C.V.,
Controladora Interamericana de Bebidas, S. de R.L. de C.V., Grupo Embotellador CIMSA, S. de R.L. de C.V., Refrescos Victoria del Centro, S. de R.L.
de C.V., Servicios Integrados Inmuebles del Golfo, S. de R.L. de C.V. and Yoli de Acapulco, S.A. de C.V. (the Guarantors).
These statements are prepared in accordance with IFRS, as issued by the IASB, with the exception that the subsidiaries are accounted for as
investments under the equity method rather than being consolidated. The guarantees of the Guarantors are full and unconditional.
The Company’s consolidating condensed financial information for the (i) Company; (ii) its 100% owned guarantors subsidiaries (on standalone
basis), which are wholly and unconditional guarantors under both prior years debt and current year debt referred to as “Senior Notes” in Note
17; (iii) the combined non-guarantor subsidiaries; iv) eliminations and v) the Company’s consolidated financial statements are as follows:
WHOLLY-OWNED COMBINED GUARANTORS NON-GUARANTOR CONSOLIDATED PARENT SUBSIDIARIES SUBSIDIARIES ELIMINATIONS TOTAL CONSOLIDATED STATEMENT OF FINANCIAL POSITION AS OF DECEMBER 31, 2014Assets:Current assets: Cash and cash equivalents Ps. 7,282 Ps. 755 Ps. 4,921 Ps. - Ps. 12,958 Accounts receivable, net 42,614 4,733 43,794 (80,802) 10,339 Inventories - 3,509 4,310 - 7,819 Recoverable taxes 72 1,675 2,335 - 4,082 Other current assets and financial assets 36 1,015 1,879 - 2,930Total current assets 50,004 11,687 57,239 (80,802) 38,128
Non-current assets: Investments in associates and joint ventures 94,347 57,839 13,676 (148,536) 17,326 Property, plant and equipment, net - 17,049 33,478 - 50,527 Intangible assets, net 29,348 34,920 32,756 - 97,024 Other non-current assets and financial assets 1,281 7,672 6,931 (6,523) 9,361Total non-current assets 124,976 117,480 86,841 (155,059) 174,238
Total assets Ps. 174,980 Ps. 129,167 Ps. 144,080 Ps. (235,861) Ps. 212,366
Liabilities:Current liabilities: Short-term bank loans and notes payable and current portion of non-current debt Ps. 352 Ps. - Ps. 1,225 Ps. - Ps. 1,577 Suppliers 15 2,832 11,304 - 14,151 Other current liabilities 5,890 63,412 24,175 (80,802) 12,675Total current liabilities 6,257 66,244 36,704 (80,802) 28,403
Non-current liabilities: Bank loans and notes payable 62,968 - 1,853 - 64,821 Other non-current liabilities 38 1,382 14,127 (6,523) 9,024Total non-current liabilities 63,006 1,382 15,980 (6,523) 73,845Total liabilities 69,263 67,626 52,684 (87,325) 102,248
Equity:Equity attributable to equity holders of the parent 105,717 61,541 86,995 (148,536) 105,717Non-controlling interest in consolidated subsidiaries - - 4,401 - 4,401Total equity 105,717 61,541 91,396 (148,536) 110,118Total liabilities and equity Ps. 174,980 Ps. 129,167 Ps. 144,080 Ps. (235,861) Ps. 212,366
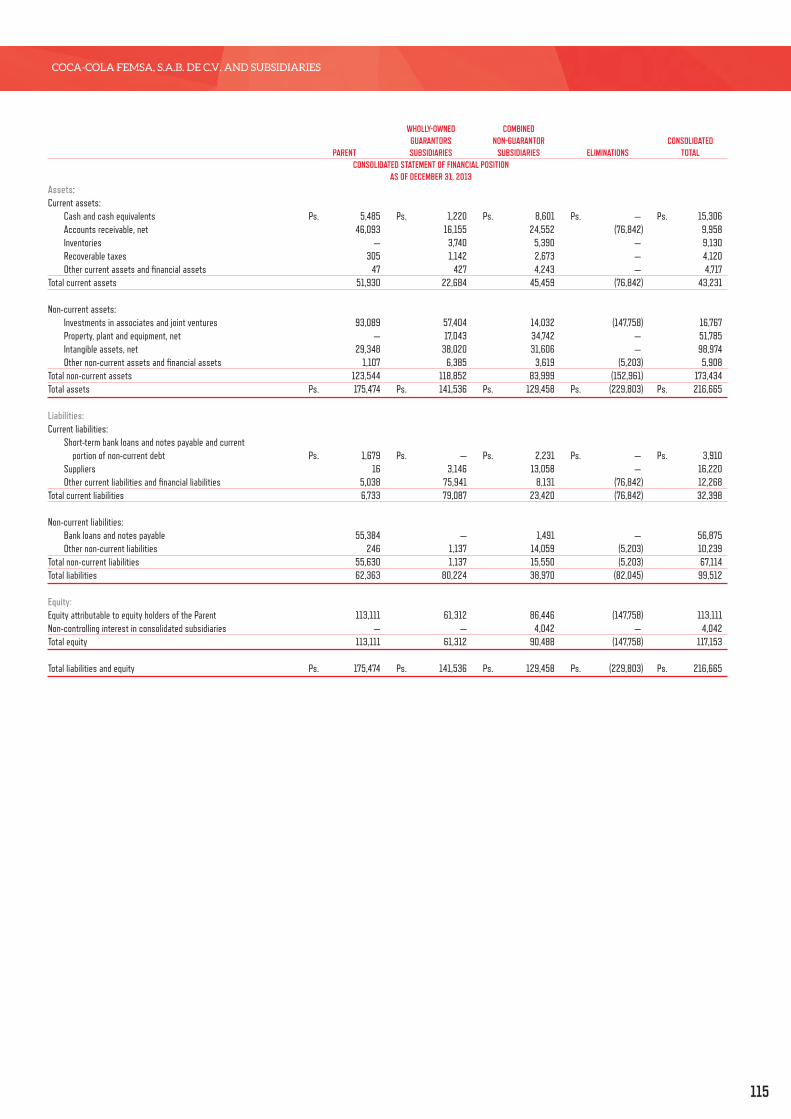
115
COCA-COLA FEMSA, S.A.B. DE C.V. AND SUBSIDIARIES
WHOLLY-OWNED COMBINED GUARANTORS NON-GUARANTOR CONSOLIDATED PARENT SUBSIDIARIES SUBSIDIARIES ELIMINATIONS TOTAL CONSOLIDATED STATEMENT OF FINANCIAL POSITION AS OF DECEMBER 31, 2013Assets:Current assets: Cash and cash equivalents Ps. 5,485 Ps. 1,220 Ps. 8,601 Ps. — Ps. 15,306 Accounts receivable, net 46,093 16,155 24,552 (76,842) 9,958 Inventories — 3,740 5,390 — 9,130 Recoverable taxes 305 1,142 2,673 — 4,120 Other current assets and financial assets 47 427 4,243 — 4,717Total current assets 51,930 22,684 45,459 (76,842) 43,231
Non-current assets: Investments in associates and joint ventures 93,089 57,404 14,032 (147,758) 16,767 Property, plant and equipment, net — 17,043 34,742 — 51,785 Intangible assets, net 29,348 38,020 31,606 — 98,974 Other non-current assets and financial assets 1,107 6,385 3,619 (5,203) 5,908Total non-current assets 123,544 118,852 83,999 (152,961) 173,434Total assets Ps. 175,474 Ps. 141,536 Ps. 129,458 Ps. (229,803) Ps. 216,665
Liabilities:Current liabilities: Short-term bank loans and notes payable and current portion of non-current debt Ps. 1,679 Ps. — Ps. 2,231 Ps. — Ps. 3,910 Suppliers 16 3,146 13,058 — 16,220 Other current liabilities and financial liabilities 5,038 75,941 8,131 (76,842) 12,268Total current liabilities 6,733 79,087 23,420 (76,842) 32,398
Non-current liabilities: Bank loans and notes payable 55,384 — 1,491 — 56,875 Other non-current liabilities 246 1,137 14,059 (5,203) 10,239Total non-current liabilities 55,630 1,137 15,550 (5,203) 67,114Total liabilities 62,363 80,224 38,970 (82,045) 99,512
Equity:Equity attributable to equity holders of the Parent 113,111 61,312 86,446 (147,758) 113,111Non-controlling interest in consolidated subsidiaries — — 4,042 — 4,042Total equity 113,111 61,312 90,488 (147,758) 117,153
Total liabilities and equity Ps. 175,474 Ps. 141,536 Ps. 129,458 Ps. (229,803) Ps. 216,665
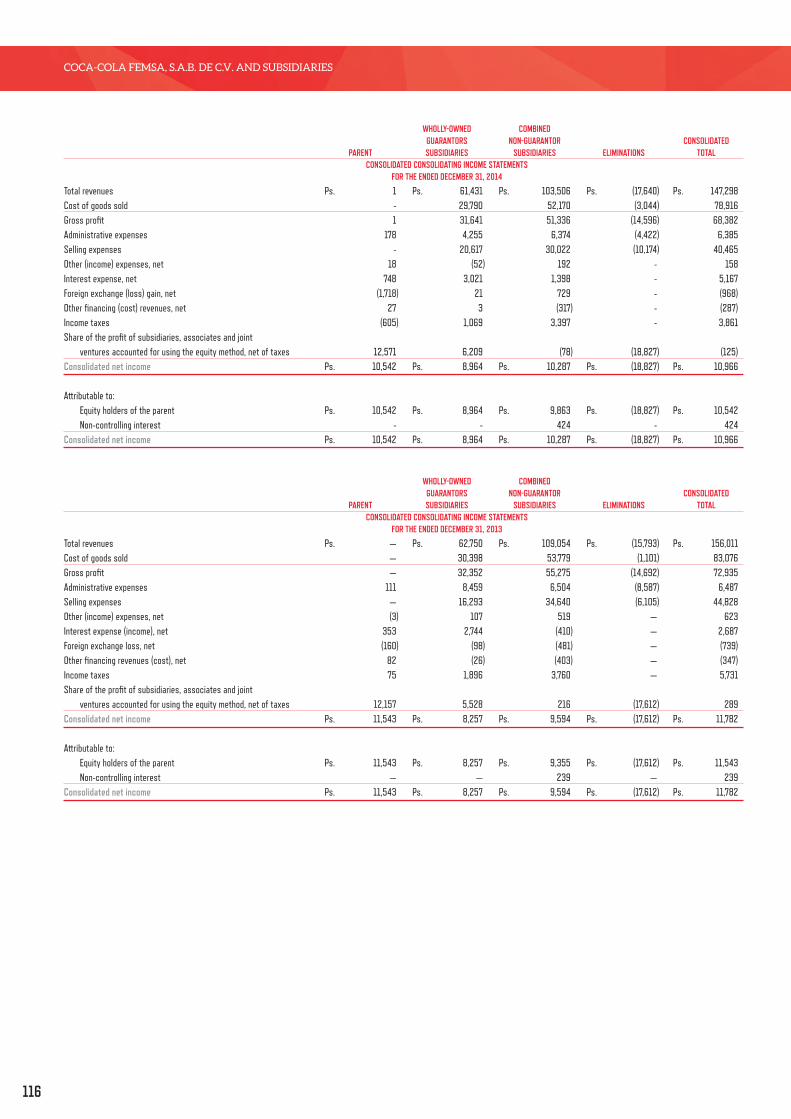
116
COCA-COLA FEMSA, S.A.B. DE C.V. AND SUBSIDIARIES
WHOLLY-OWNED COMBINED GUARANTORS NON-GUARANTOR CONSOLIDATED PARENT SUBSIDIARIES SUBSIDIARIES ELIMINATIONS TOTAL CONSOLIDATED CONSOLIDATING INCOME STATEMENTS FOR THE ENDED DECEMBER 31, 2014
Total revenues Ps. 1 Ps. 61,431 Ps. 103,506 Ps. (17,640) Ps. 147,298Cost of goods sold - 29,790 52,170 (3,044) 78,916Gross profit 1 31,641 51,336 (14,596) 68,382Administrative expenses 178 4,255 6,374 (4,422) 6,385Selling expenses - 20,617 30,022 (10,174) 40,465Other (income) expenses, net 18 (52) 192 - 158Interest expense, net 748 3,021 1,398 - 5,167Foreign exchange (loss) gain, net (1,718) 21 729 - (968)Other financing (cost) revenues, net 27 3 (317) - (287)Income taxes (605) 1,069 3,397 - 3,861Share of the profit of subsidiaries, associates and joint ventures accounted for using the equity method, net of taxes 12,571 6,209 (78) (18,827) (125)Consolidated net income Ps. 10,542 Ps. 8,964 Ps. 10,287 Ps. (18,827) Ps. 10,966
Attributable to: Equity holders of the parent Ps. 10,542 Ps. 8,964 Ps. 9,863 Ps. (18,827) Ps. 10,542 Non-controlling interest - - 424 - 424Consolidated net income Ps. 10,542 Ps. 8,964 Ps. 10,287 Ps. (18,827) Ps. 10,966
WHOLLY-OWNED COMBINED GUARANTORS NON-GUARANTOR CONSOLIDATED PARENT SUBSIDIARIES SUBSIDIARIES ELIMINATIONS TOTAL CONSOLIDATED CONSOLIDATING INCOME STATEMENTS FOR THE ENDED DECEMBER 31, 2013
Total revenues Ps. — Ps. 62,750 Ps. 109,054 Ps. (15,793) Ps. 156,011Cost of goods sold — 30,398 53,779 (1,101) 83,076Gross profit — 32,352 55,275 (14,692) 72,935Administrative expenses 111 8,459 6,504 (8,587) 6,487Selling expenses — 16,293 34,640 (6,105) 44,828Other (income) expenses, net (3) 107 519 — 623Interest expense (income), net 353 2,744 (410) — 2,687Foreign exchange loss, net (160) (98) (481) — (739)Other financing revenues (cost), net 82 (26) (403) — (347)Income taxes 75 1,896 3,760 — 5,731Share of the profit of subsidiaries, associates and joint ventures accounted for using the equity method, net of taxes 12,157 5,528 216 (17,612) 289Consolidated net income Ps. 11,543 Ps. 8,257 Ps. 9,594 Ps. (17,612) Ps. 11,782
Attributable to: Equity holders of the parent Ps. 11,543 Ps. 8,257 Ps. 9,355 Ps. (17,612) Ps. 11,543 Non-controlling interest — — 239 — 239Consolidated net income Ps. 11,543 Ps. 8,257 Ps. 9,594 Ps. (17,612) Ps. 11,782
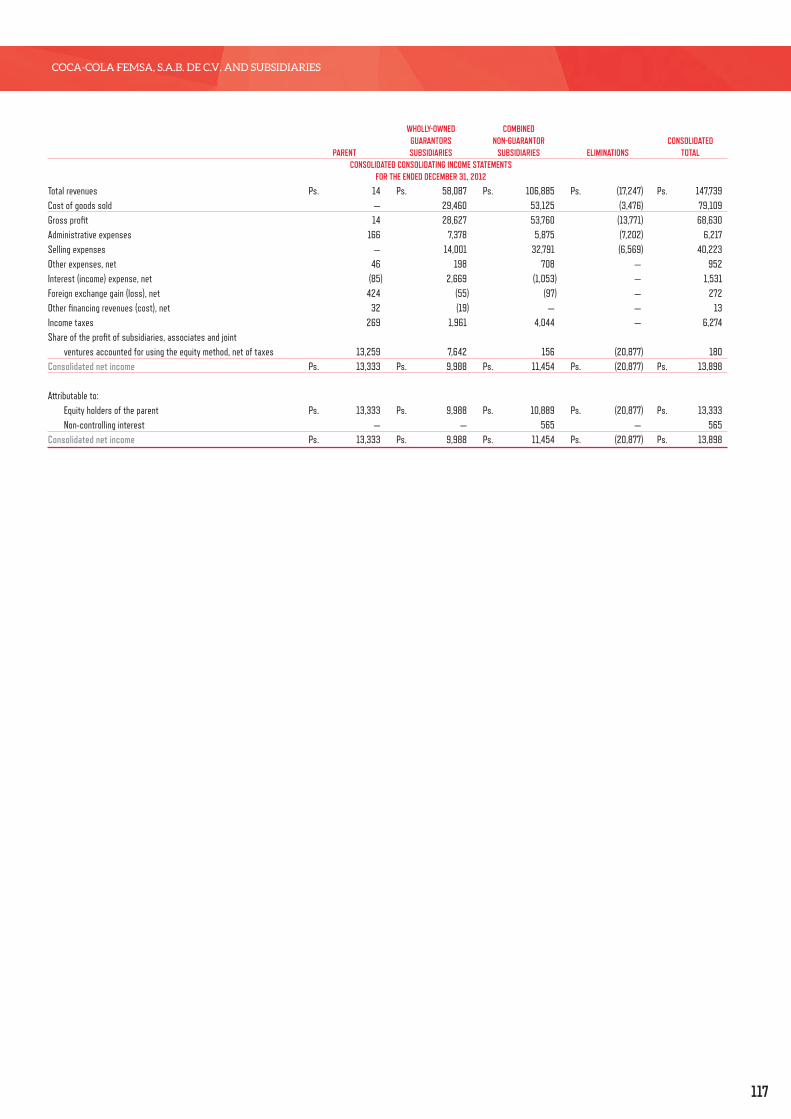
117
COCA-COLA FEMSA, S.A.B. DE C.V. AND SUBSIDIARIES
WHOLLY-OWNED COMBINED GUARANTORS NON-GUARANTOR CONSOLIDATED PARENT SUBSIDIARIES SUBSIDIARIES ELIMINATIONS TOTAL CONSOLIDATED CONSOLIDATING INCOME STATEMENTS FOR THE ENDED DECEMBER 31, 2012
Total revenues Ps. 14 Ps. 58,087 Ps. 106,885 Ps. (17,247) Ps. 147,739Cost of goods sold — 29,460 53,125 (3,476) 79,109Gross profit 14 28,627 53,760 (13,771) 68,630Administrative expenses 166 7,378 5,875 (7,202) 6,217Selling expenses — 14,001 32,791 (6,569) 40,223Other expenses, net 46 198 708 — 952Interest (income) expense, net (85) 2,669 (1,053) — 1,531Foreign exchange gain (loss), net 424 (55) (97) — 272Other financing revenues (cost), net 32 (19) — — 13Income taxes 269 1,961 4,044 — 6,274Share of the profit of subsidiaries, associates and joint ventures accounted for using the equity method, net of taxes 13,259 7,642 156 (20,877) 180Consolidated net income Ps. 13,333 Ps. 9,988 Ps. 11,454 Ps. (20,877) Ps. 13,898
Attributable to: Equity holders of the parent Ps. 13,333 Ps. 9,988 Ps. 10,889 Ps. (20,877) Ps. 13,333 Non-controlling interest — — 565 — 565Consolidated net income Ps. 13,333 Ps. 9,988 Ps. 11,454 Ps. (20,877) Ps. 13,898
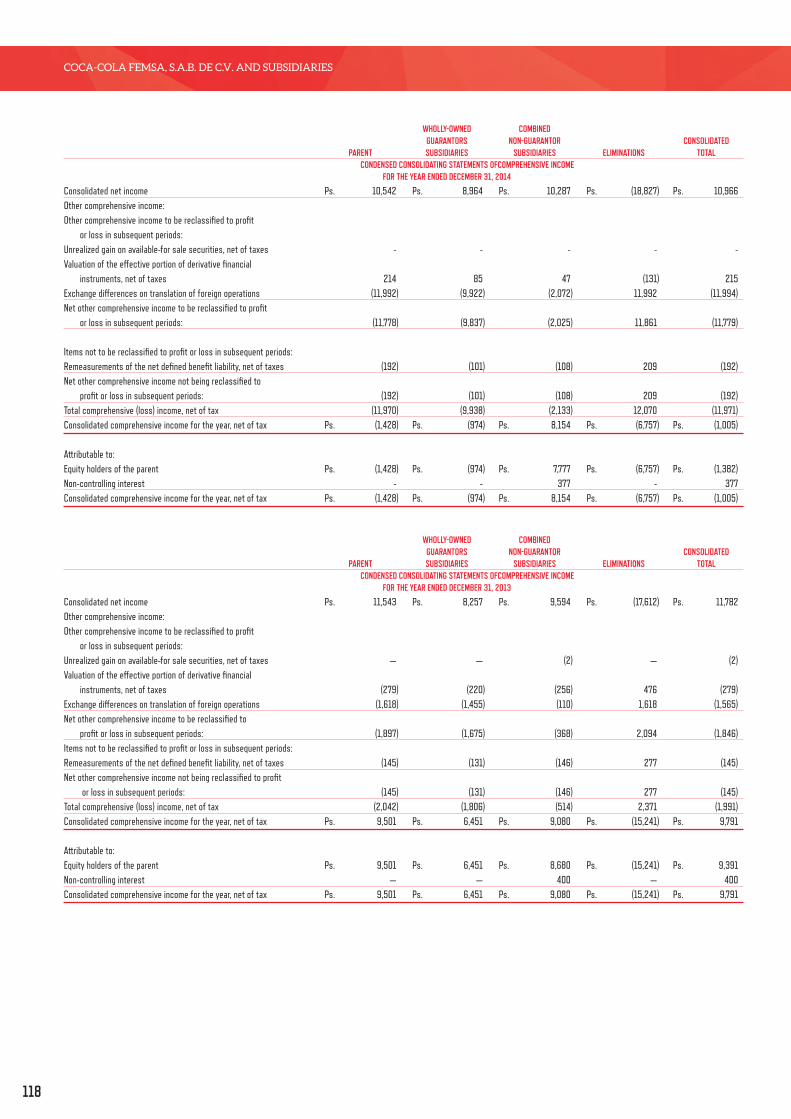
118
COCA-COLA FEMSA, S.A.B. DE C.V. AND SUBSIDIARIES
WHOLLY-OWNED COMBINED GUARANTORS NON-GUARANTOR CONSOLIDATED PARENT SUBSIDIARIES SUBSIDIARIES ELIMINATIONS TOTAL CONDENSED CONSOLIDATING STATEMENTS OFCOMPREHENSIVE INCOME FOR THE YEAR ENDED DECEMBER 31, 2014
Consolidated net income Ps. 10,542 Ps. 8,964 Ps. 10,287 Ps. (18,827) Ps. 10,966Other comprehensive income:Other comprehensive income to be reclassified to profit or loss in subsequent periods:Unrealized gain on available-for sale securities, net of taxes - - - - -Valuation of the effective portion of derivative financial instruments, net of taxes 214 85 47 (131) 215Exchange differences on translation of foreign operations (11,992) (9,922) (2,072) 11,992 (11,994)Net other comprehensive income to be reclassified to profit or loss in subsequent periods: (11,778) (9,837) (2,025) 11,861 (11,779)
Items not to be reclassified to profit or loss in subsequent periods:Remeasurements of the net defined benefit liability, net of taxes (192) (101) (108) 209 (192)Net other comprehensive income not being reclassified to profit or loss in subsequent periods: (192) (101) (108) 209 (192)Total comprehensive (loss) income, net of tax (11,970) (9,938) (2,133) 12,070 (11,971)Consolidated comprehensive income for the year, net of tax Ps. (1,428) Ps. (974) Ps. 8,154 Ps. (6,757) Ps. (1,005)
Attributable to:Equity holders of the parent Ps. (1,428) Ps. (974) Ps. 7,777 Ps. (6,757) Ps. (1,382)Non-controlling interest - - 377 - 377Consolidated comprehensive income for the year, net of tax Ps. (1,428) Ps. (974) Ps. 8,154 Ps. (6,757) Ps. (1,005)
WHOLLY-OWNED COMBINED GUARANTORS NON-GUARANTOR CONSOLIDATED PARENT SUBSIDIARIES SUBSIDIARIES ELIMINATIONS TOTAL CONDENSED CONSOLIDATING STATEMENTS OFCOMPREHENSIVE INCOME FOR THE YEAR ENDED DECEMBER 31, 2013
Consolidated net income Ps. 11,543 Ps. 8,257 Ps. 9,594 Ps. (17,612) Ps. 11,782Other comprehensive income:Other comprehensive income to be reclassified to profit or loss in subsequent periods:Unrealized gain on available-for sale securities, net of taxes — — (2) — (2)Valuation of the effective portion of derivative financial instruments, net of taxes (279) (220) (256) 476 (279)Exchange differences on translation of foreign operations (1,618) (1,455) (110) 1,618 (1,565)Net other comprehensive income to be reclassified to profit or loss in subsequent periods: (1,897) (1,675) (368) 2,094 (1,846)Items not to be reclassified to profit or loss in subsequent periods:Remeasurements of the net defined benefit liability, net of taxes (145) (131) (146) 277 (145)Net other comprehensive income not being reclassified to profit or loss in subsequent periods: (145) (131) (146) 277 (145)Total comprehensive (loss) income, net of tax (2,042) (1,806) (514) 2,371 (1,991)Consolidated comprehensive income for the year, net of tax Ps. 9,501 Ps. 6,451 Ps. 9,080 Ps. (15,241) Ps. 9,791
Attributable to:Equity holders of the parent Ps. 9,501 Ps. 6,451 Ps. 8,680 Ps. (15,241) Ps. 9,391Non-controlling interest — — 400 — 400Consolidated comprehensive income for the year, net of tax Ps. 9,501 Ps. 6,451 Ps. 9,080 Ps. (15,241) Ps. 9,791
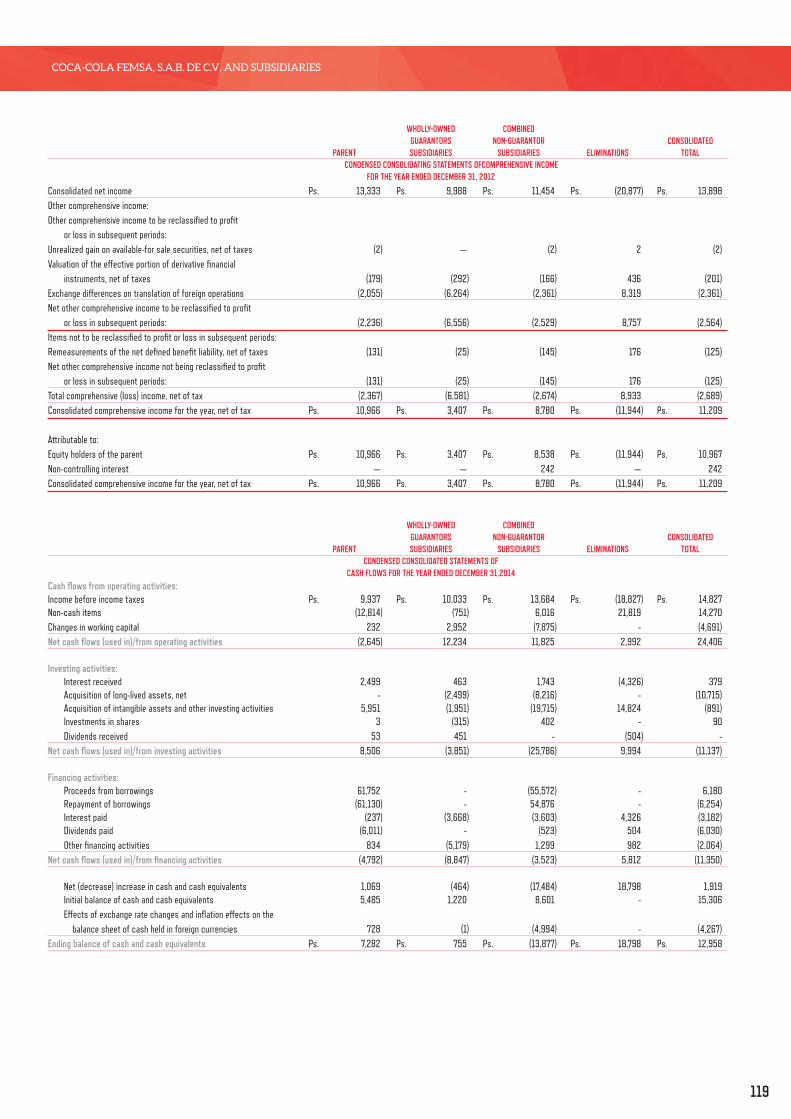
119
COCA-COLA FEMSA, S.A.B. DE C.V. AND SUBSIDIARIES
WHOLLY-OWNED COMBINED GUARANTORS NON-GUARANTOR CONSOLIDATED PARENT SUBSIDIARIES SUBSIDIARIES ELIMINATIONS TOTAL CONDENSED CONSOLIDATING STATEMENTS OFCOMPREHENSIVE INCOME FOR THE YEAR ENDED DECEMBER 31, 2012
Consolidated net income Ps. 13,333 Ps. 9,988 Ps. 11,454 Ps. (20,877) Ps. 13,898Other comprehensive income:Other comprehensive income to be reclassified to profit or loss in subsequent periods:Unrealized gain on available-for sale securities, net of taxes (2) — (2) 2 (2)Valuation of the effective portion of derivative financial instruments, net of taxes (179) (292) (166) 436 (201)Exchange differences on translation of foreign operations (2,055) (6,264) (2,361) 8,319 (2,361)Net other comprehensive income to be reclassified to profit or loss in subsequent periods: (2,236) (6,556) (2,529) 8,757 (2,564)Items not to be reclassified to profit or loss in subsequent periods:Remeasurements of the net defined benefit liability, net of taxes (131) (25) (145) 176 (125)Net other comprehensive income not being reclassified to profit or loss in subsequent periods: (131) (25) (145) 176 (125)Total comprehensive (loss) income, net of tax (2,367) (6,581) (2,674) 8,933 (2,689)Consolidated comprehensive income for the year, net of tax Ps. 10,966 Ps. 3,407 Ps. 8,780 Ps. (11,944) Ps. 11,209
Attributable to:Equity holders of the parent Ps. 10,966 Ps. 3,407 Ps. 8,538 Ps. (11,944) Ps. 10,967Non-controlling interest — — 242 — 242Consolidated comprehensive income for the year, net of tax Ps. 10,966 Ps. 3,407 Ps. 8,780 Ps. (11,944) Ps. 11,209
WHOLLY-OWNED COMBINED GUARANTORS NON-GUARANTOR CONSOLIDATED PARENT SUBSIDIARIES SUBSIDIARIES ELIMINATIONS TOTAL CONDENSED CONSOLIDATED STATEMENTS OF CASH FLOWS FOR THE YEAR ENDED DECEMBER 31,2014Cash flows from operating activities:Income before income taxes Ps. 9,937 Ps. 10,033 Ps. 13,684 Ps. (18,827) Ps. 14,827Non-cash items (12,814) (751) 6,016 21,819 14,270Changes in working capital 232 2,952 (7,875) - (4,691)Net cash flows (used in)/from operating activities (2,645) 12,234 11,825 2,992 24,406
Investing activities: Interest received 2,499 463 1,743 (4,326) 379 Acquisition of long-lived assets, net - (2,499) (8,216) - (10,715) Acquisition of intangible assets and other investing activities 5,951 (1,951) (19,715) 14,824 (891) Investments in shares 3 (315) 402 - 90 Dividends received 53 451 - (504) -Net cash flows (used in)/from investing activities 8,506 (3,851) (25,786) 9,994 (11,137)
Financing activities: Proceeds from borrowings 61,752 - (55,572) - 6,180 Repayment of borrowings (61,130) - 54,876 - (6,254) Interest paid (237) (3,668) (3,603) 4,326 (3,182) Dividends paid (6,011) - (523) 504 (6,030) Other financing activities 834 (5,179) 1,299 982 (2,064)Net cash flows (used in)/from financing activities (4,792) (8,847) (3,523) 5,812 (11,350)
Net (decrease) increase in cash and cash equivalents 1,069 (464) (17,484) 18,798 1,919 Initial balance of cash and cash equivalents 5,485 1,220 8,601 - 15,306 Effects of exchange rate changes and inflation effects on the balance sheet of cash held in foreign currencies 728 (1) (4,994) - (4,267)Ending balance of cash and cash equivalents Ps. 7,282 Ps. 755 Ps. (13,877) Ps. 18,798 Ps. 12,958

120
COCA-COLA FEMSA, S.A.B. DE C.V. AND SUBSIDIARIES
WHOLLY-OWNED COMBINED GUARANTORS NON-GUARANTOR CONSOLIDATED PARENT SUBSIDIARIES SUBSIDIARIES ELIMINATIONS TOTAL CONDENSED CONSOLIDATED STATEMENTS OF CASH FLOWS FOR THE YEAR ENDED DECEMBER 31,2013Cash flows from operating activities:Income before income taxes Ps. 11,618 Ps. 10,153 Ps. 13,354 Ps. (17,612) Ps. 17,513 Non-cash items (13,719) (1,420) 5,699 20,604 11,164Changes in working capital (358) 2,211 (8,433) — (6,580)Net cash flows from operating activities (2,459) 10,944 10,620 2,992 22,097
Investing activities: Acquisitions (1,078) 46 (36,621) — (37,653) Interest received 3,524 1,940 (827) (3,983) 654 Acquisition of long-lived assets, net — (3,302) (7,118) — (10,420) Acquisition of intangible assets and other investing activities (53,740) (214) 60,168 (8,205) (1,991) Investments in shares 684 (12,581) 11,826 — (71) Dividends received 23,372 1,115 — (24,487) —Net cash flows (used in)/from investing activities (27,238) (12,996) 27,428 (36,675) (49,481)
Financing activities: Proceeds from borrowings 61,752 — 4,996 — 66,748 Repayment of borrowings (32,567) — (4,177) — (36,744) Interest paid (1,538) (3,358) (1,414) 3,982 (2,328) Dividends paid (5,950) (20,986) (3,553) 24,487 (6,002) Acquisition of non-controlling interests — — 515 — 515 Other financing activities (268) 26,672 (30,301) 5,214 1,317Net cash flows from / (used in) financing activities 21,429 2,328 (33,934) 33,683 23,506 Net increase (decrease) in cash and cash equivalents (8,268) 276 4,114 — (3,878) Initial balance of cash and cash equivalents 14,394 981 7,847 — 23,222 Effects of exchange rate changes and inflation effects on the balance sheet of cash held in foreign currencies (641) (37) (3,360) — (4,038)Ending balance of cash and cash equivalents Ps. 5,485 Ps. 1,220 Ps. 8,601 Ps. — Ps. 15,306
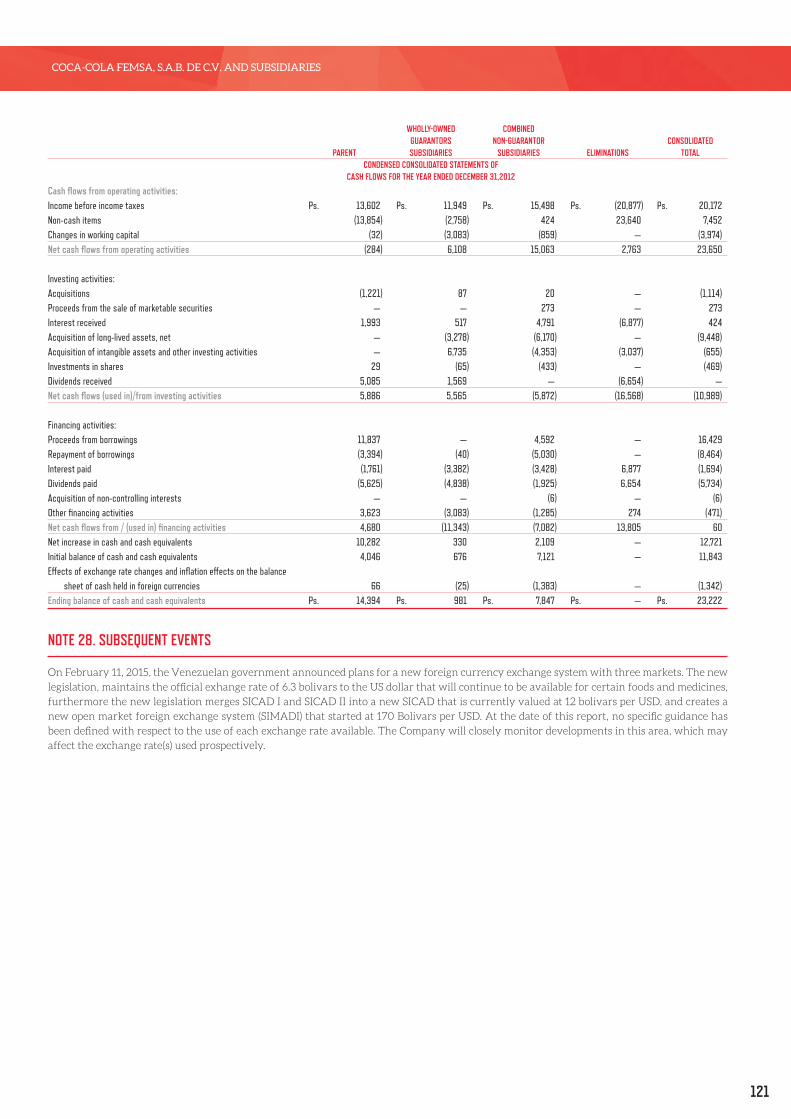
121
COCA-COLA FEMSA, S.A.B. DE C.V. AND SUBSIDIARIES
WHOLLY-OWNED COMBINED GUARANTORS NON-GUARANTOR CONSOLIDATED PARENT SUBSIDIARIES SUBSIDIARIES ELIMINATIONS TOTAL CONDENSED CONSOLIDATED STATEMENTS OF CASH FLOWS FOR THE YEAR ENDED DECEMBER 31,2012
Cash flows from operating activities:Income before income taxes Ps. 13,602 Ps. 11,949 Ps. 15,498 Ps. (20,877) Ps. 20,172Non-cash items (13,854) (2,758) 424 23,640 7,452Changes in working capital (32) (3,083) (859) — (3,974)Net cash flows from operating activities (284) 6,108 15,063 2,763 23,650
Investing activities:Acquisitions (1,221) 87 20 — (1,114)Proceeds from the sale of marketable securities — — 273 — 273Interest received 1,993 517 4,791 (6,877) 424Acquisition of long-lived assets, net — (3,278) (6,170) — (9,448)Acquisition of intangible assets and other investing activities — 6,735 (4,353) (3,037) (655)Investments in shares 29 (65) (433) — (469)Dividends received 5,085 1,569 — (6,654) —Net cash flows (used in)/from investing activities 5,886 5,565 (5,872) (16,568) (10,989)
Financing activities:Proceeds from borrowings 11,837 — 4,592 — 16,429Repayment of borrowings (3,394) (40) (5,030) — (8,464)Interest paid (1,761) (3,382) (3,428) 6,877 (1,694)Dividends paid (5,625) (4,838) (1,925) 6,654 (5,734)Acquisition of non-controlling interests — — (6) — (6)Other financing activities 3,623 (3,083) (1,285) 274 (471)Net cash flows from / (used in) financing activities 4,680 (11,343) (7,082) 13,805 60Net increase in cash and cash equivalents 10,282 330 2,109 — 12,721Initial balance of cash and cash equivalents 4,046 676 7,121 — 11,843Effects of exchange rate changes and inflation effects on the balance sheet of cash held in foreign currencies 66 (25) (1,383) — (1,342)Ending balance of cash and cash equivalents Ps. 14,394 Ps. 981 Ps. 7,847 Ps. — Ps. 23,222
NOTE 28. SUBSEQUENT EVENTS
On February 11, 2015, the Venezuelan government announced plans for a new foreign currency exchange system with three markets. The new
legislation, maintains the official exhange rate of 6.3 bolivars to the US dollar that will continue to be available for certain foods and medicines,
furthermore the new legislation merges SICAD I and SICAD II into a new SICAD that is currently valued at 12 bolivars per USD, and creates a
new open market foreign exchange system (SIMADI) that started at 170 Bolivars per USD. At the date of this report, no specific guidance has
been defined with respect to the use of each exchange rate available. The Company will closely monitor developments in this area, which may
affect the exchange rate(s) used prospectively.

122
COCA-COLA FEMSA, S.A.B. DE C.V. AND SUBSIDIARIES
GLOSSARY
The Coca-Cola Company: Founded in 1886, The Coca-Cola Company is the world’s largest beverage company, refreshing consumers with more
than 500 sparkling and still brands. The Coca-Cola Company’s corporate headquarters are in Atlanta with local operations in more than 200
countries around the world.
Fomento Económico Mexicano, S.A.B. de C.V. (FEMSA): FEMSA is a leading company that participates in the beverage industry through Coca-
Cola FEMSA, the largest franchise bottler of Coca-Cola products in the world; and in the beer industry, through its ownership of the second
largest equity stake in Heineken, one of the world’s leading brewers with operations in over 70 countries. In the retail industry it participates
with FEMSA Comercio, operating various small-format chain stores, including OXXO, the largest and fastest-growing chain of stores in Latin
America. All of which is supported by a Strategic Business unit.
Consumer: Person who consumes Coca-Cola FEMSA products.
Customer: Retail outlet, restaurant or other operation that sells or serves the company’s products directly to consumers.
Per Capita Consumption: The average number of eight-ounce servings consumed per person, per year in a specific market. To calculate per
capita consumption, the company multiplies its unit case volume by 24 and divides by the population.
Serving: Equals eight fluid ounces of a beverage.
Unit Case: Unit of measurement that equals 24 eight fluid ounce servings.
Sparkling beverage: A non-alcoholic carbonated beverage containing flavorings and sweeteners. It excludes flavored waters and carbonated or
non-carbonated tea, coffee and sports drinks.
Still beverage: Non-carbonated beverages.
BOARD PRACTICES
1. Finance and Planning Committee. The Finance and Planning Committee works with management to set our annual and long-term strategic
and financial plans and monitors adherence to these plans. It is responsible for setting our optimal capital structure and recommends the
appropriate level of borrowing as well as the issuance of securities. Financial risk management is another responsibility of the Finance and
Planning Committee. Irial Finan is the chairman of the Finance and Planning Committee. The additional members include: Federico Reyes
García, Ricardo Guajardo Touché and Enrique Senior Hernández. The secretary of the Finance and Planning Committee is Héctor Treviño
Gutiérrez, our Chief Financial Officer.
2. Audit Committee. The Audit Committee is responsible for reviewing the accuracy and integrity of quarterly and annual financial statements
in accordance with accounting, internal control and auditing requirements. The Audit Committee is directly responsible for the appointment,
compensation, retention and oversight of the independent auditor, who reports directly to the Audit Committee; the internal auditing function
also reports to the Audit Committee. The Audit Committee has implemented procedures for receiving, retaining and addressing complaints
regarding accounting, internal control and auditing matters, including the submission of confidential, anonymous complaints from employees
regarding questionable accounting or auditing matters. To carry out its duties, the Audit Committee may hire independent counsel and other
advisors. As necessary, we compensate the independent auditor and any outside advisor hired by the Audit Committee and provide funding for
ordinary administrative expenses incurred by the Audit Committee in the course of its duties. José Manuel Canal Hernando is the chairman
of the Audit Committee and the “audit committee financial expert”. The additional members are: Alfonso González Migoya, Charles H. McTier,
Francisco Zambrano Rodríguez and Ernesto Cruz Velázquez de León. Each member of the Audit Committee is an independent director,
as required by the Mexican Securities Market Law and applicable New York Stock Exchange listing standards. The secretary of the Audit
Committee, who is not a member, is José González Ornelas, head of FEMSA’s auditing and operating control area.
3. Corporate Practices Committee. The Corporate Practices Committee, which consists of exclusively of independent directors, is responsible
for preventing or reducing the risk of performing operations that could damage the value of our company or that benefit a particular group of
shareholders. The committee may call a shareholders meeting and include matters on the agenda for that meeting that it deems appropriate,
approve policies on related party transactions, approve the compensation plan of the chief executive officer and relevant officers, and support
our board of directors in the elaboration of related reports. The chairman of the Corporate Practices Committee is Daniel Servitje Montul. The
additional members include: Alfredo Livas Cantú and Karl Frei Buechi. The secretaries of the Corporate Practices Committee are Gary Fayard
and Javier Astaburuaga Sanjines.
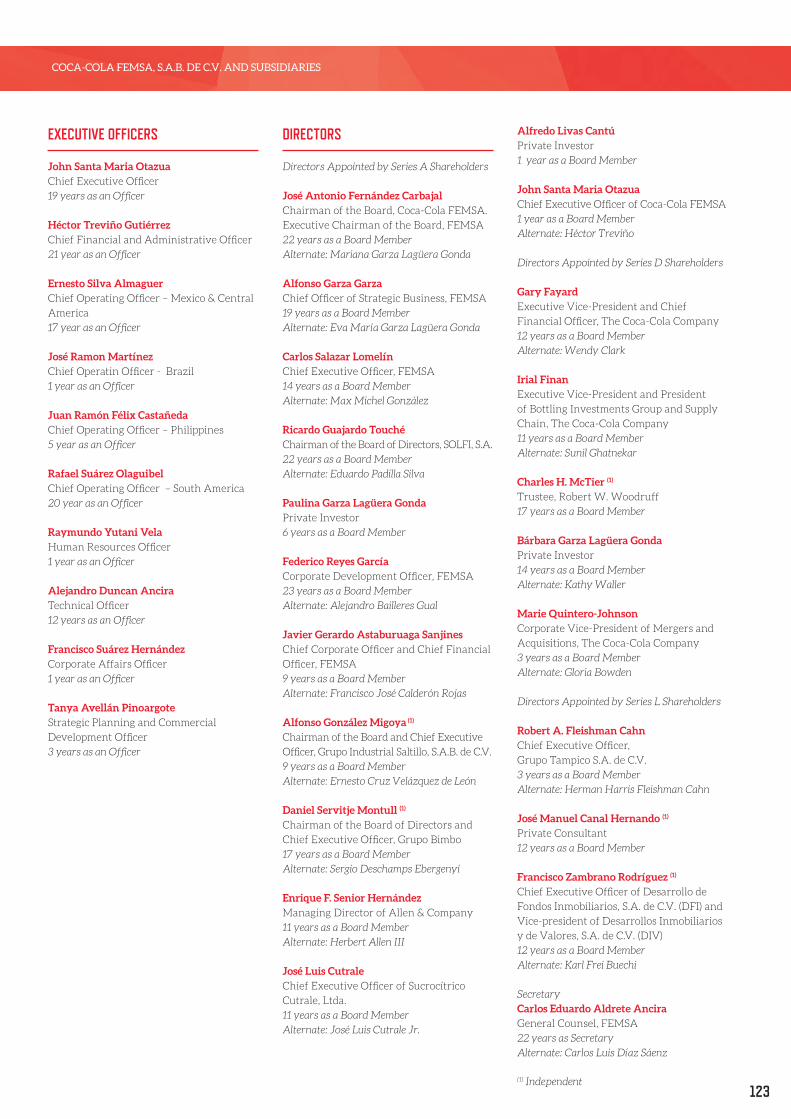
123
COCA-COLA FEMSA, S.A.B. DE C.V. AND SUBSIDIARIES
EXECUTIVE OFFICERS
John Santa Maria Otazua Chief Executive Officer
19 years as an Officer
Héctor Treviño Gutiérrez Chief Financial and Administrative Officer
21 year as an Officer
Ernesto Silva Almaguer Chief Operating Officer – Mexico & Central
America
17 year as an Officer
José Ramon Martínez Chief Operatin Officer - Brazil
1 year as an Officer
Juan Ramón Félix Castañeda Chief Operating Officer – Philippines
5 year as an Officer
Rafael Suárez Olaguibel Chief Operating Officer – South America
20 year as an Officer
Raymundo Yutani Vela Human Resources Officer
1 year as an Officer
Alejandro Duncan Ancira Technical Officer
12 years as an Officer
Francisco Suárez HernándezCorporate Affairs Officer
1 year as an Officer
Tanya Avellán Pinoargote Strategic Planning and Commercial
Development Officer
3 years as an Officer
DIRECTORS
Directors Appointed by Series A Shareholders
José Antonio Fernández Carbajal Chairman of the Board, Coca-Cola FEMSA.
Executive Chairman of the Board, FEMSA
22 years as a Board Member
Alternate: Mariana Garza Lagüera Gonda
Alfonso Garza Garza Chief Officer of Strategic Business, FEMSA
19 years as a Board Member
Alternate: Eva María Garza Lagüera Gonda
Carlos Salazar Lomelín Chief Executive Officer, FEMSA
14 years as a Board Member
Alternate: Max Michel González
Ricardo Guajardo Touché Chairman of the Board of Directors, SOLFI, S.A.
22 years as a Board Member
Alternate: Eduardo Padilla Silva
Paulina Garza Lagüera Gonda Private Investor
6 years as a Board Member
Federico Reyes García Corporate Development Officer, FEMSA
23 years as a Board Member
Alternate: Alejandro Bailleres Gual
Javier Gerardo Astaburuaga Sanjines Chief Corporate Officer and Chief Financial
Officer, FEMSA
9 years as a Board Member
Alternate: Francisco José Calderón Rojas
Alfonso González Migoya (1) Chairman of the Board and Chief Executive
Officer, Grupo Industrial Saltillo, S.A.B. de C.V.
9 years as a Board Member
Alternate: Ernesto Cruz Velázquez de León
Daniel Servitje Montull (1) Chairman of the Board of Directors and
Chief Executive Officer, Grupo Bimbo
17 years as a Board Member
Alternate: Sergio Deschamps Ebergenyi
Enrique F. Senior Hernández Managing Director of Allen & Company
11 years as a Board Member
Alternate: Herbert Allen III
José Luis Cutrale Chief Executive Officer of Sucrocítrico
Cutrale, Ltda.
11 years as a Board Member
Alternate: José Luis Cutrale Jr.
Alfredo Livas CantúPrivate Investor
1 year as a Board Member
John Santa Maria Otazua Chief Executive Officer of Coca-Cola FEMSA
1 year as a Board Member
Alternate: Héctor Treviño
Directors Appointed by Series D Shareholders
Gary Fayard Executive Vice-President and Chief
Financial Officer, The Coca-Cola Company
12 years as a Board Member
Alternate: Wendy Clark
Irial Finan Executive Vice-President and President
of Bottling Investments Group and Supply
Chain, The Coca-Cola Company
11 years as a Board Member
Alternate: Sunil Ghatnekar
Charles H. McTier (1) Trustee, Robert W. Woodruff
17 years as a Board Member
Bárbara Garza Lagüera Gonda Private Investor
14 years as a Board Member
Alternate: Kathy Waller
Marie Quintero-Johnson Corporate Vice-President of Mergers and
Acquisitions, The Coca-Cola Company
3 years as a Board Member
Alternate: Gloria Bowden
Directors Appointed by Series L Shareholders
Robert A. Fleishman Cahn Chief Executive Officer,
Grupo Tampico S.A. de C.V.
3 years as a Board Member
Alternate: Herman Harris Fleishman Cahn
José Manuel Canal Hernando (1) Private Consultant
12 years as a Board Member
Francisco Zambrano Rodríguez (1) Chief Executive Officer of Desarrollo de
Fondos Inmobiliarios, S.A. de C.V. (DFI) and
Vice-president of Desarrollos Inmobiliarios
y de Valores, S.A. de C.V. (DIV)
12 years as a Board Member
Alternate: Karl Frei Buechi
Secretary
Carlos Eduardo Aldrete Ancira General Counsel, FEMSA
22 years as Secretary
Alternate: Carlos Luis Díaz Sáenz
(1) Independent
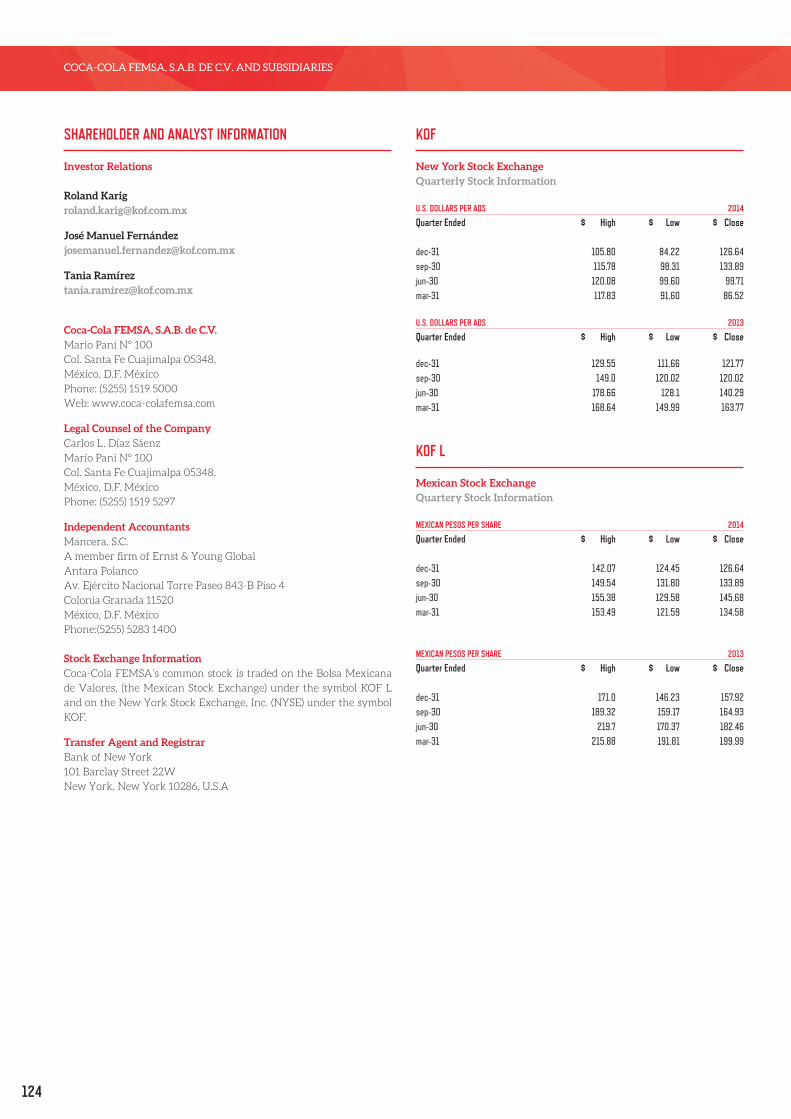
124
COCA-COLA FEMSA, S.A.B. DE C.V. AND SUBSIDIARIES
SHAREHOLDER AND ANALYST INFORMATION
Investor Relations
Roland [email protected]
José Manuel Ferná[email protected]
Tania Ramí[email protected]
Coca-Cola FEMSA, S.A.B. de C.V. Mario Pani N° 100
Col. Santa Fe Cuajimalpa 05348,
México, D.F. México
Phone: (5255) 1519 5000
Web: www.coca-colafemsa.com
Legal Counsel of the Company Carlos L. Díaz Sáenz
Marío Pani N° 100
Col. Santa Fe Cuajimalpa 05348,
México, D.F. México
Phone: (5255) 1519 5297
Independent Accountants Mancera, S.C.
A member firm of Ernst & Young Global
Antara Polanco
Av. Ejército Nacional Torre Paseo 843-B Piso 4
Colonia Granada 11520
México, D.F. México
Phone:(5255) 5283 1400
Stock Exchange Information Coca-Cola FEMSA’s common stock is traded on the Bolsa Mexicana
de Valores, (the Mexican Stock Exchange) under the symbol KOF L
and on the New York Stock Exchange, Inc. (NYSE) under the symbol
KOF.
Transfer Agent and Registrar Bank of New York
101 Barclay Street 22W
New York, New York 10286, U.S.A
KOF
New York Stock Exchange Quarterly Stock Information U.S. DOLLARS PER ADS 2014
Quarter Ended $ High $ Low $ Close
dec-31 105.80 84.22 126.64sep-30 115.78 98.31 133.89jun-30 120.08 99.60 99.71mar-31 117.83 91.60 86.52
U.S. DOLLARS PER ADS 2013
Quarter Ended $ High $ Low $ Close
dec-31 129.55 111.66 121.77sep-30 149.0 120.02 120.02jun-30 178.66 128.1 140.29mar-31 168.64 149.99 163.77
KOF L
Mexican Stock Exchange Quartery Stock Information
MEXICAN PESOS PER SHARE 2014
Quarter Ended $ High $ Low $ Close
dec-31 142.07 124.45 126.64sep-30 149.54 131.80 133.89jun-30 155.38 129.58 145.68mar-31 153.49 121.59 134.58
MEXICAN PESOS PER SHARE 2013
Quarter Ended $ High $ Low $ Close
dec-31 171.0 146.23 157.92sep-30 189.32 159.17 164.93jun-30 219.7 170.37 182.46mar-31 215.88 191.81 199.99
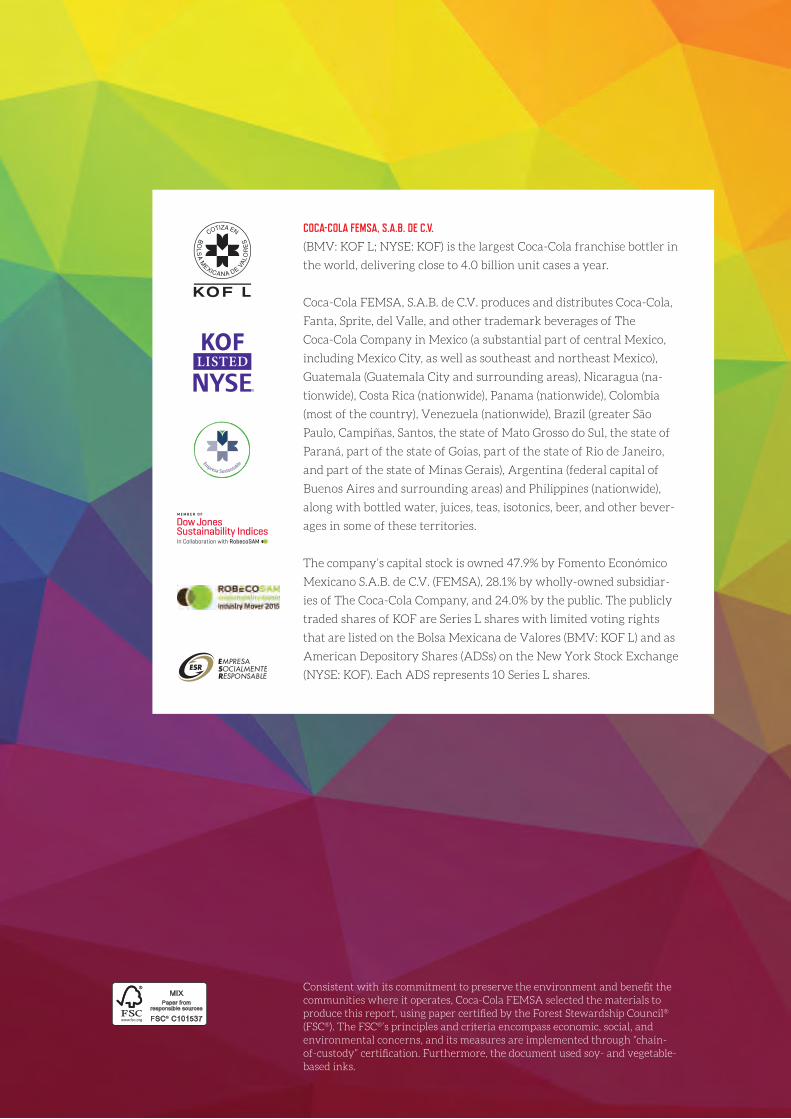
TRANSFO
COCA-COLA FEMSA, S.A.B. DE C.V.
(BMV: KOF L; NYSE: KOF) is the largest Coca-Cola franchise bottler in
the world, delivering close to 4.0 billion unit cases a year.
Coca-Cola FEMSA, S.A.B. de C.V. produces and distributes Coca-Cola,
Fanta, Sprite, del Valle, and other trademark beverages of The
Coca-Cola Company in Mexico (a substantial part of central Mexico,
including Mexico City, as well as southeast and northeast Mexico),
Guatemala (Guatemala City and surrounding areas), Nicaragua (na-
tionwide), Costa Rica (nationwide), Panama (nationwide), Colombia
(most of the country), Venezuela (nationwide), Brazil (greater São
Paulo, Campiñas, Santos, the state of Mato Grosso do Sul, the state of
Paraná, part of the state of Goias, part of the state of Rio de Janeiro,
and part of the state of Minas Gerais), Argentina (federal capital of
Buenos Aires and surrounding areas) and Philippines (nationwide),
along with bottled water, juices, teas, isotonics, beer, and other bever-
ages in some of these territories.
The company’s capital stock is owned 47.9% by Fomento Económico
Mexicano S.A.B. de C.V. (FEMSA), 28.1% by wholly-owned subsidiar-
ies of The Coca-Cola Company, and 24.0% by the public. The publicly
traded shares of KOF are Series L shares with limited voting rights
that are listed on the Bolsa Mexicana de Valores (BMV: KOF L) and as
American Depository Shares (ADSs) on the New York Stock Exchange
(NYSE: KOF). Each ADS represents 10 Series L shares.
Consistent with its commitment to preserve the environment and benefit the communities where it operates, Coca-Cola FEMSA selected the materials to produce this report, using paper certified by the Forest Stewardship Council® (FSC®). The FSC®’s principles and criteria encompass economic, social, and environmental concerns, and its measures are implemented through “chain-of-custody” certification. Furthermore, the document used soy- and vegetable-based inks.
www.coca-colafemsa.com
Mario Pani #100Col. Santa Fé CuajimalpaDelegación Cuajimalpa
México D.F. 05348Phone: +52.55.15195000
Mario Pani #100Col. Santa Fé CuajimalpaDelegación Cuajimalpa
México D.F. 05348Phone: +52.55.15195000