a study of the turning of austempered ductile iron …
TRANSCRIPT
The Pennsylvania State University
The Graduate School
College of Engineering
A STUDY OF THE TURNING OF AUSTEMPERED DUCTILE IRON (ADI)
GRADES WITH COATED CARBIDE TOOLS
A Thesis in
Industrial Engineering
by
Pei-Long,Ting
© 2016 Pei-Long,Ting
Submitted in Partial Fulfillment of the Requirements
for the Degree of
Master of Science
December 2016
ii
The thesis of Pei-Long, Ting was reviewed and approved* by the following:
Robert Voigt
Professor of Industrial Engineering Thesis Advisor
Edward De Meter Professor of Industrial and mechanical Engineering
Janis Terpenny Professor of Industrial Engineering Head of the Department of Department or Graduate Program
*Signatures are on file in the Graduate School

iii
ABSTRACT
Austempered Ductile Iron (ADI) is a relatively new material with the highest hardness and
strength of any material in the cast iron family. Through the unique heat treatment -
austempering, the “ausferrite” microstructure of ferrite and carbon-stabilized austenite along with
graphite nodules is formed. Multiple strength levels can be produced by varying the austempering
temperature or time. In general, ADI has a high strength-weight ratio, good toughness, and very
high wear resistance compared to other ductile iron grades. In addition, the density of ADI is
lower than steel but with approximately the same strength. These unique properties make ADI as
an ideal material for manufacturing products requiring light weight but with high strength and
toughness. On the other hand, ADI is difficult to machine because of its high hardness. This has
impeded the application and the growth of market applications of ADI.
The primary objective of this study was to evaluate the machinability of different grades of ADI
(GR900, GR1050, GR1200) during high speed turning with coolant. Comprehensive turning
experiments were conducted under a range of different machining conditions. The influence of
cutting speed on tool life, surface roughness, and chip formation were analyzed during turning
with coated carbide tools. The turning experiments were conducted on large diameter
commercially produced, pre-machined cylinder castings at a constant feed rate of 0.012 ipr and
depth of cut of 0.06 inches. The cutting speed was varied for the different grades of ADI, from
250-1000 fpm and tool wear was measured at various time intervals. A Taylor tool life model was
developed by measuring the tool life for a range of cutting speeds. This model was then used to
generate general turning guidelines for the various grades of ADI based on tool life. Lastly, in
order to benchmark the turning of ADI with other materials, turning studies with conventional
Ductile Iron grade 100-70-03 were also investigated under similar cutting conditions.

iv
The chip formation for all grades of ADI and DI 100-70-03 were discovered in the form of
discontinuous c-shaped chips. As expected increasing cutting speeds accelerated the rate of tool
wear. The surface roughness trend when machining GR900 and GR1050 are similar – decreased
cutting speed improved surface finish but a very low cutting speeds the surface finish of grade
1200 ADI also decreased.

v
TABLE OF CONTENTS
LIST OF FIGURES ............................................................................................................... vii
LIST OF TABLES ................................................................................................................. x
ACKNOWLEDGEMENTS .................................................................................................. xiii
Chapter 1 INTRODUCTION ................................................................................................... 1
Background ...................................................................................................................... 1 Problem statement ............................................................................................................ 1 Objectives......................................................................................................................... 2
Chapter 2 BACKGOUND ....................................................................................................... 3
Machining ........................................................................................................................ 3 Cutting force ............................................................................................................. 7 Chip formation ......................................................................................................... 11
Turning ............................................................................................................................. 14 Machinability ................................................................................................................... 19 Development of ADI ........................................................................................................ 27
Production of ADI .................................................................................................... 29
Chapter 3 PREVIOUS RESEARCH ....................................................................................... 36
Machining of ADI ............................................................................................................ 36 Cutting speed ............................................................................................................ 37 Cutting tool ............................................................................................................... 38 Depth of cut .............................................................................................................. 39 Chips formation and feed rate .................................................................................. 39
Chapter 4 RESEARCH PLAN ................................................................................................. 41
Workpiece material characteristics .......................................................................... 41 Experimental platform .............................................................................................. 44 Machinability metrics ............................................................................................... 49
Chapter 5 RESULTS................................................................................................................ 54
Chip formation ......................................................................................................... 54 Tool life .................................................................................................................... 56 Surface roughness .................................................................................................... 66
Chapter 6 DISCUSSION ......................................................................................................... 73
Chapter 7 CONCLUSION AND FUTURE WORK ................................................................ 76
References ................................................................................................................................ 78

vi
Appendix A - Tool wear measurements .................................................................................. 82
Appendix B - Surface roughness measurements ...................................................................... 91
Appendix C - Insert identification charts ................................................................................. 109
Appendix D – Tool Wear Measurement Method ..................................................................... 111
vii
LIST OF FIGURES
Figure 1: Illustration of a two-dimensional cutting process (orthogonal cutting) (a) with a
well-defined shear plane (b) without a well-defined shear plane. [1] .............................. 4
Figure 2: Oblique cutting. [2] .................................................................................................. 5
Figure 3: The relationship of velocity 𝑉𝑠, V and 𝑉𝑐 for orthogonal cutting. [4] ..................... 7
Figure 4: Free body diagram of orthogonal cutting. [4] .......................................................... 8
Figure 5: Merchant’s circular force diagram. [4] ..................................................................... 9
Figure 6: Basic types of chips produced in metal cutting: (a) continuous chip with
narrow, straight primary shear zone; (b) secondary shear zone at the tool-chip
interface; (c) continuous chip with built-up edge; (d) segmented or nonhomogeneous
chip; and (e) discontinuous chip. [1] ................................................................................ 13
Figure 7: Basic operations performed on a lathe. (a)facing (b)straight turning (c)taper
turning (d)grooving and cutting off (e)threading (f)tracer turning (g)drilling
(h)reaming (i) boring [3] .................................................................................................. 15
Figure 8: Typical cutting conditions for common external turning operations. [6] ................. 16
Figure 9: Proper selection of inserts geometry for turning operations. [6] ............................ 16
Figure 10: Crater wear of a turning tool. [1] ............................................................................ 22
Figure 11: Taylor tool life model (ln-ln coordinates) [3] ......................................................... 23
Figure 12: Typical tool wear curves for different cutting velocities (𝑉5 > 𝑉4 > 𝑉3 >𝑉2 > 𝑉1) [3] .................................................................................................................... 24
Figure 13: Flank wear features for single-point-tool wear in turning operations [8] ............... 24
Figure 14: Surface finish representation: Arithmetical roughness [3] ..................................... 25
Figure 15: Austempered ductile iron heat treatment cycle ...................................................... 30
Figure 16: The austempering reaction ADI processing window (a) High austempering
temperature (b) Low austempering temperature .............................................................. 31
Figure 17: The microstructure of each ADI grade ................................................................... 43
Figure 18: SECO CNMG 120408-M5 TK2001 insert used in turning studies ........................ 45
Figure 19: the SECO DCLNR2525M12-M tool holder fixed on the HAAS lathe turret ........ 46
Figure 20: The experimental ADI test cylinders prior to pre – turning ................................... 47

viii
Figure 21: An ADI workpiece after initial surface removal prior to turning tests ................... 47
Figure 22: The Westover Portable Refractometer model RHB-32 used for cutting fluid
characterization ................................................................................................................ 48
Figure 23: The procedure for measuring coolant concentration shown schematically ............ 48
Figure 24: Test cylinder placement for turning studies ........................................................... 49
Figure 25: Nikon SMZ800 stereoscope and fixtures used for tool wear measurement. .......... 52
Figure 26: Mahr Pocket Surf III profilometer and the calibration piece EPL-1691 Riser
Plate used for surface roughness measurements. ............................................................. 53
Figure 29: Tool wear progressions for GR1200 at different cutting speeds, (Depth of cut
= 0.06 in, feed rate = 0.012 ipr) ....................................................................................... 59
Figure 30: Tool wear progressions for GR1050 at different cutting speeds, (Depth of cut
= 0.06 in, feed rate = 0.012 ipr) ....................................................................................... 59
Figure 31: Tool wear progressions for GR900 at different cutting speeds, (Depth of cut =
0.06 in, feed rate = 0.012 ipr) ........................................................................................... 60
Figure 32: Tool wear progressions for DI 100-70-03 at different cutting speeds, (Depth of
cut = 0.06 in, feed rate = 0.012 ipr) .................................................................................. 60
Figure 33: Tool wear progressions for GR900, GR1050 and GR1200 at V = 375 fpm,
(Depth of cut = 0.06 in, feed rate = 0.012 ipr) ................................................................. 62
Figure 34: Tool wear progressions for GR900, GR1050 and GR1200 at V = 500 fpm,
(Depth of cut = 0.06 in, feed rate = 0.012 ipr) ................................................................. 63
Figure 35: Effect of cutting speed on tool life for each grade of ADI and DI 100-70-03.
(in terms of cutting time) (Depth of cut = 0.06 in, feed rate = 0.012 ipr) ........................ 64
Figure 36: Effect of cutting speed on tool life for each grade of ADI and DI 100-70-03.
(in terms of cutting length) (Depth of cut = 0.06 in, feed rate = 0.012 ipr) ..................... 64
Figure 37: Ln-Ln tool life plot for developing the Taylor tool life equation ........................... 66
Figure 38: Effect of cutting length on surface roughness (Ra) for ADI GR900 at different
cutting speeds (Depth of cut = 0.06 in, feed rate = 0.012 ipr).......................................... 68
Figure 39: Effect of cutting length on surface roughness (Ra) for ADI GR1050 at
different cutting speeds (Depth of cut = 0.06 in, feed rate = 0.012 ipr). .......................... 68
Figure 40: Effect of cutting length on surface roughness (Ra) for ADI GR1200 at
different cutting speeds (Depth of cut = 0.06 in, feed rate = 0.012 ipr). .......................... 69

ix
Figure 41: Effect of cutting length on surface roughness (Ra) for DI 100-70-03 at
different cutting speeds (Depth of cut = 0.06 in, feed rate = 0.012 ipr). .......................... 70
Figure 42: Effect of cutting speed on surface roughness (Ra) for all grades of ADI and DI
100-70-03 (Depth of cut = 0.06 in, feed rate = 0.012 ipr). ............................................... 70
x
LIST OF TABLES
Table 1: Comparison of Brinell hardness ranges for the various ADI grades ......................... 28
Table 2: Comparison of ISO, ASTM, SAE, and GB standard grades for ADI tensile
strength (MPa) – yield strength (MPa) – elongation (%) ................................................. 29
Table 3: Chemical composition of ductile irons used in this study ......................................... 42
Table 4: Ferrite and austenite volume fraction of each ADI grade after heat treated as
measured by X – ray diffraction ....................................................................................... 42
Table 5: Brinell hardness of each t material tested .................................................................. 44
Table 6: Cutting parameters used in this study for each grade of ADI and for ....................... 51
Table 7: Effect of cutting speed on chip form for ADI grades and DI 100-70-03 (Depth
of cut = 0.06 in, feed rate = 0.012 ipr) ............................................................................. 55
Table 8: Tool wear progression polynomial fit equations and R2 values for different the
grades of ADI and DI 100-70-03 ..................................................................................... 58
Table 9: Effect of cutting speed on tool life for each grade of ADI and DI 100-70-03 in
terms of cutting time and cutting length (Depth of cut = 0.06 in, feed rate = 0.012
ipr) .................................................................................................................................... 71
Table 10: Average surface roughness (Ra) for grades of ADI and DI 100-70-03 (Depth
of cut = 0.06 in, feed rate = 0.012 ipr) ............................................................................. 72
Table 11: Flank wear for ADI GR900 at 375 fpm (Depth of cut = 0.06 in, feed rate =
0.012 ipr) .......................................................................................................................... 82
Table 12: Flank wear for ADI GR900 at 500 fpm (Depth of cut = 0.06 in, feed rate =
0.012 ipr) .......................................................................................................................... 82
Table 13: Flank wear for ADI GR900 at 750 fpm (Depth of cut = 0.06 in, feed rate =
0.012 ipr) .......................................................................................................................... 83
Table 14: Flank wear for ADI GR900 at 1000 fpm (Depth of cut = 0.06 in, feed rate =
0.012 ipr) .......................................................................................................................... 83
Table 15: Flank wear for ADI GR1050 at 375 fpm (Depth of cut = 0.06 in, feed rate =
0.012 ipr) .......................................................................................................................... 83
Table 16: Flank wear for ADI GR1050 at 500 fpm (Depth of cut = 0.06 in, feed rate =
0.012 ipr) .......................................................................................................................... 84
xi
Table 17: Flank wear for ADI GR1050 at 750 fpm (Depth of cut = 0.06 in, feed rate =
0.012 ipr) .......................................................................................................................... 84
Table 18: Flank wear for ADI GR1050 at 1000 fpm (Depth of cut = 0.06 in, feed rate =
0.012 ipr) .......................................................................................................................... 84
Table 19: Flank wear for ADI GR1200 at 250 fpm (Depth of cut = 0.06 in, feed rate =
0.012 ipr) .......................................................................................................................... 85
Table 20: Flank wear for ADI GR1200 at 300 fpm (Depth of cut = 0.06 in, feed rate =
0.012 ipr) .......................................................................................................................... 86
Table 21: Flank wear for ADI GR1200 at 375 fpm (Depth of cut = 0.06 in, feed rate =
0.012 ipr) .......................................................................................................................... 86
Table 22: Flank wear for ADI GR1200 at 400 fpm (Depth of cut = 0.06 in, feed rate =
0.012 ipr) .......................................................................................................................... 87
Table 23: Flank wear for ADI GR1200 at 500 fpm (Depth of cut = 0.06 in, feed rate =
0.012 ipr) .......................................................................................................................... 87
Table 24: Flank wear for DI 100-70-03 at 500 fpm (Depth of cut = 0.06 in, feed rate =
0.012 ipr) .......................................................................................................................... 88
Table 25: Flank wear for DI 100-70-03 at 750 fpm (Depth of cut = 0.06 in, feed rate =
0.012 ipr) .......................................................................................................................... 89
Table 26: Flank wear for DI 100-70-03 at 1000 fpm (Depth of cut = 0.06 in, feed rate =
0.012 ipr) .......................................................................................................................... 90
Table 27: Effect of cutting speed on tool life for ADI grades in terms of cutting time for
all trials (Depth of cut = 0.06 in, feed rate = 0.012 ipr) ................................................... 90
Table 28: Average surface roughness for ADI GR900 (Depth of cut = 0.06 in, feed rate =
0.012 ipr) .......................................................................................................................... 91
Table 29: Average surface roughness for ADI GR1050 (Depth of cut = 0.06 in, feed rate
= 0.012 ipr) ....................................................................................................................... 91
Table 30: Average surface roughness for ADI GR1200 (Depth of cut = 0.06 in, feed rate
= 0.012 ipr) ....................................................................................................................... 92
Table 31: Average surface roughness for DI 100-70-03 (Depth of cut = 0.06 in, feed rate
= 0.012 ipr) ....................................................................................................................... 92
Table 32: Surface roughness measurements for ADI GR900 at 375 fpm (Depth of cut =
0.06 in, feed rate = 0.012 ipr) ........................................................................................... 93
Table 33: Surface roughness measurements for ADI GR900 at 500 fpm (Depth of cut =
0.06 in, feed rate = 0.012 ipr) ........................................................................................... 94

xii
Table 34: Surface roughness measurements for ADI GR900 at 750 fpm (Depth of cut =
0.06 in, feed rate = 0.012 ipr) ........................................................................................... 95
Table 35: Surface roughness measurements for ADI GR900 at 1000 fpm (Depth of cut =
0.06 in, feed rate = 0.012 ipr) ........................................................................................... 96
Table 36: Surface roughness measurements for ADI GR1050 at 375 fpm (Depth of cut =
0.06 in, feed rate = 0.012 ipr) ........................................................................................... 96
Table 37: Surface roughness measurements for ADI GR1050 at 500 fpm (Depth of cut =
0.06 in, feed rate = 0.012 ipr) ........................................................................................... 97
Table 38: Surface roughness measurements for ADI GR1050 at 750 fpm (Depth of cut =
0.06 in, feed rate = 0.012 ipr) ........................................................................................... 98
Table 39: Surface roughness measurements for ADI GR1050 at 1000 fpm (Depth of cut =
0.06 in, feed rate = 0.012 ipr) ........................................................................................... 98
Table 40: Surface roughness measurements for ADI GR1200 at 250 fpm (Depth of cut =
0.06 in, feed rate = 0.012 ipr) ........................................................................................... 99
Table 41: Surface roughness measurements for ADI GR1200 at 300 fpm (Depth of cut =
0.06 in, feed rate = 0.012 ipr) ........................................................................................... 101
Table 42: Surface roughness measurements for ADI GR1200 at 375 fpm (Depth of cut =
0.06 in, feed rate = 0.012 ipr) ........................................................................................... 102
Table 43: Surface roughness measurements for ADI GR1200 at 400 fpm (Depth of cut =
0.06 in, feed rate = 0.012 ipr) ........................................................................................... 103
Table 44: Surface roughness measurements for ADI GR1200 at 500 fpm (Depth of cut =
0.06 in, feed rate = 0.012 ipr) ........................................................................................... 103
Table 45: Surface roughness measurements for DI 100-70-03 at 500 fpm (Depth of cut =
0.06 in, feed rate = 0.012 ipr) ........................................................................................... 104
Table 46: Surface roughness measurements for ADI GR1200 at 750 fpm (Depth of cut =
0.06 in, feed rate = 0.012 ipr) ........................................................................................... 107
Table 47: Surface roughness measurements for ADI GR1200 at 1000 fpm (Depth of cut =
0.06 in, feed rate = 0.012 ipr) ........................................................................................... 108
Table 48: Identification chart for inserts used to machine ADI GR900 .................................. 109
Table 49: Identification chart for inserts used to machine ADI GR1050 ................................ 109
Table 50: Identification chart for inserts used to machine ADI GR1200 ................................ 110
Table 51: Identification chart for inserts used to machine DI 100-70-03 ................................ 110

xiii
ACKNOWLEDGEMENTS
I would like to first acknowledge my appreciation for my adviser, Professor Voigt. His helpful
comments on this paper and his patience over the past two years became the most crucial factor to
complete this thesis.
Also, I would like to thank and recognize the contributions of my senior Dika Handayani, support
specialists Dan Supko and Travis Richner for their help in platform setup, experiment design,
knowledge of manipulating the machine, and guidance in the analyzing methods used in this study
In addition, I would like to express my thanks to Professor Edward De Meter for his assistance to
review this study. This project was supported by Applied Process, Quaker Chemical Corp., and
SECO Tools. My thanks also goes out to Kathy Hayryen, the advisor from Applied Process, for her
suggestion, profession and guidance.
Last but not least, I want to thank my parents, Sea-Chang, Ting and Wu Hsiang-Chun, Ting, who
have supported me all the time and made this happen.

1
Chapter 1
INTRODUCTION
Background
Austempered ductile iron (ADI) is a relatively new material in cast iron family. In recent
years, ADI has been much more widely used in industry. ADI use is driven by its special
mechanical properties. Compared to ductile iron, ADI has improved strength, toughness and wear
resistance that are developed during on austempering heat treatment. In addition, ADI has other
advantages comparing to other competing materials. ADI components can often be produced at
costs that are less than forged steel, with similar strength levels and lower density. Also, the
strength, fatigue resistance, and wear resistance of ADI are higher than for aluminum alloys. With
these advantages, ADI has quickly developing into an important automotive material as well as
an important material in the railroad and defense industries for applications such as gears and
ordinance. ADI casting can be processed by variety of machining process such as turning,
milling, and drilling; however, its high hardness makes it difficult to machine. Even when rough
machining is performed prior to heat treatment, final machining after heat treatment can be
difficult.
Problem statement
In many cases, current and future applications of ADI are limited by difficulties in
machining the material. There is incomplete information in the proper cutting speeds and feed
rates when machining the various grades of ADI to achieve the desirable tool life and surface

2
finish to reduce machining cost. Therefore, manufacturers are often hesitant to completely
machine castings after austempering treatment. In order to decrease the overall cost and increase
the machining efficiency of the different grades of ADI, machinability studies must be conducted
to develop effective machining guidelines.
Objectives
The primary object of this study is to characterize the turning behavior of common grades
of ADI (GR900, GR1050, GR1200) under production turning conditions. Turning studies with
contemporary coated carbide tools, coolant, and fixed feed rates and depths of cut were
performed to develop the relationship between tool life and cutting speed. In addition, the effect
of the different cutting speeds on surface finish and chip formation will also be evaluated.
3
Chapter 2
BACKGOUND
Machining
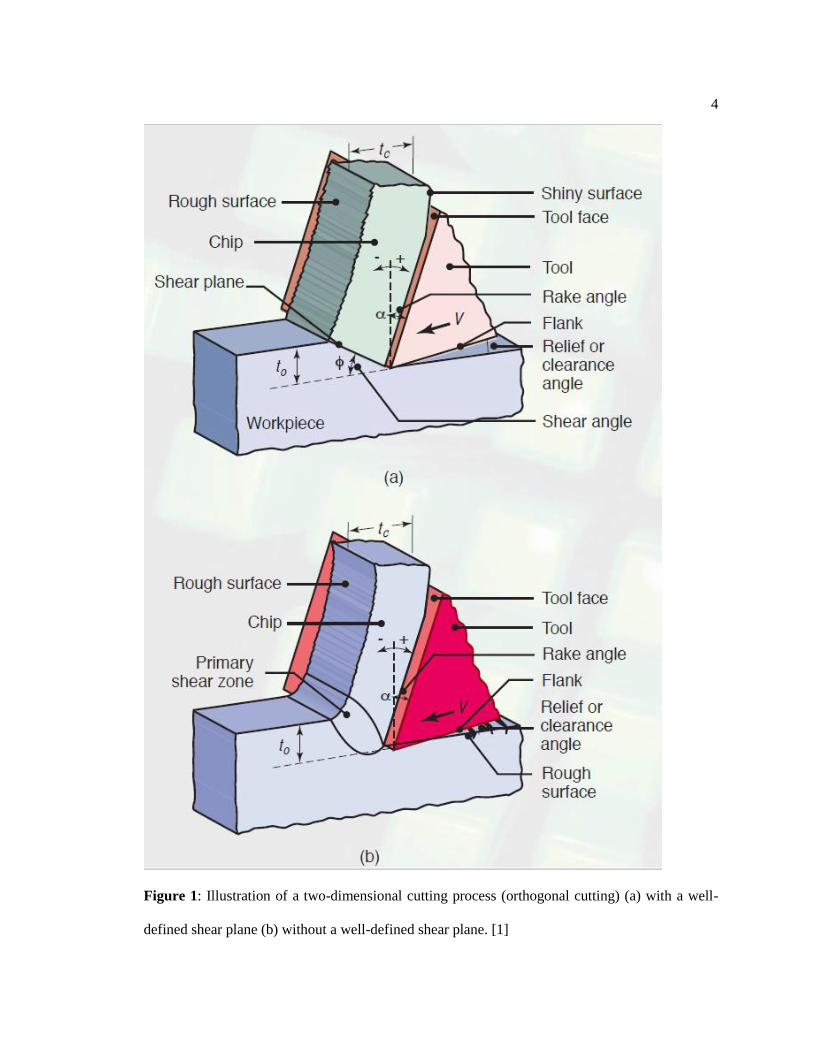
Machining is a cutting process where in the surface layer of a work piece will be removed by the
cutting tool in chip form. [1] Figure 1 [1] shows this schematically. The unnecessary material is
removed and slides along the rake face of the cutting tool with a new face being formed by the
flank face. [1] Based on the geometric relationship of the tool to the workpiece, the cutting process
can classify into two different type of process - orthogonal cutting and oblique cutting. [1] The
orthogonal cutting is a fundamental two-force cutting geometry with the cutting edge oriented
perpendicular to the cutting direction. The analysis of orthogonal cutting is relatively simple
comparing to oblique cutting, because the cutting force can be modeled in only two dimensional.
Because it is easier to build and evaluate cutting models, the orthogonal cutting is widely using in
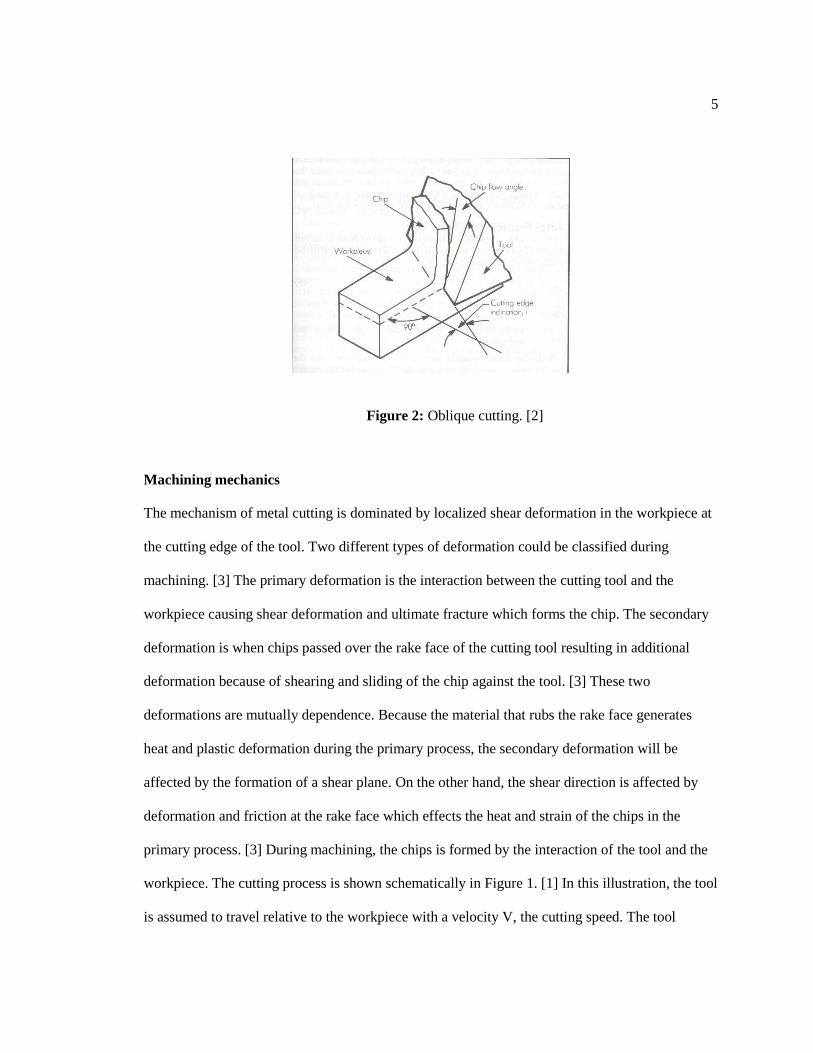
theoretical and experimental work. However, the majority of machining process are three-
dimensional oblique cutting. [1] [2] Unlike orthogonal cutting, in oblique cutting there is an
inclination angle to the cutting edge. In other words, the cutting edge is not perpendicular to the
cutting direction as showing in the Figure 2. [2]
4
Figure 1: Illustration of a two-dimensional cutting process (orthogonal cutting) (a) with a well-
defined shear plane (b) without a well-defined shear plane. [1]
5
Figure 2: Oblique cutting. [2]
Machining mechanics
The mechanism of metal cutting is dominated by localized shear deformation in the workpiece at
the cutting edge of the tool. Two different types of deformation could be classified during
machining. [3] The primary deformation is the interaction between the cutting tool and the
workpiece causing shear deformation and ultimate fracture which forms the chip. The secondary
deformation is when chips passed over the rake face of the cutting tool resulting in additional
deformation because of shearing and sliding of the chip against the tool. [3] These two
deformations are mutually dependence. Because the material that rubs the rake face generates
heat and plastic deformation during the primary process, the secondary deformation will be
affected by the formation of a shear plane. On the other hand, the shear direction is affected by
deformation and friction at the rake face which effects the heat and strain of the chips in the
primary process. [3] During machining, the chips is formed by the interaction of the tool and the
workpiece. The cutting process is shown schematically in Figure 1. [1] In this illustration, the tool
is assumed to travel relative to the workpiece with a velocity V, the cutting speed. The tool
6
geometry is defined by the tool rake angle α and tool clearance angle γ. The shear process occurs
in the shear plane with a shear angle ϕ and a shear velocity𝐹𝑠. Also, the uncut chip thickness,
𝑡0and the chip thickness which is assumed without deformation, 𝑡𝑐 both are shown in the figure.
The chips have a velocity 𝑉𝑐. Figure 2 shows that the 𝑉𝑠 is the vector velocity of V and 𝑉𝑐. [4]
The cutting ratio, or chip-thickness ratio r is important and useful for evaluating the cutting
condition as a parameter, and is always greater than unity. [1] The cutting ratio is defined by
relationships between the rake angle and the shear angle. Therefore the cutting ratio can also be
presented in the form of velocity and chip thickness as well, equation 1 and 2:
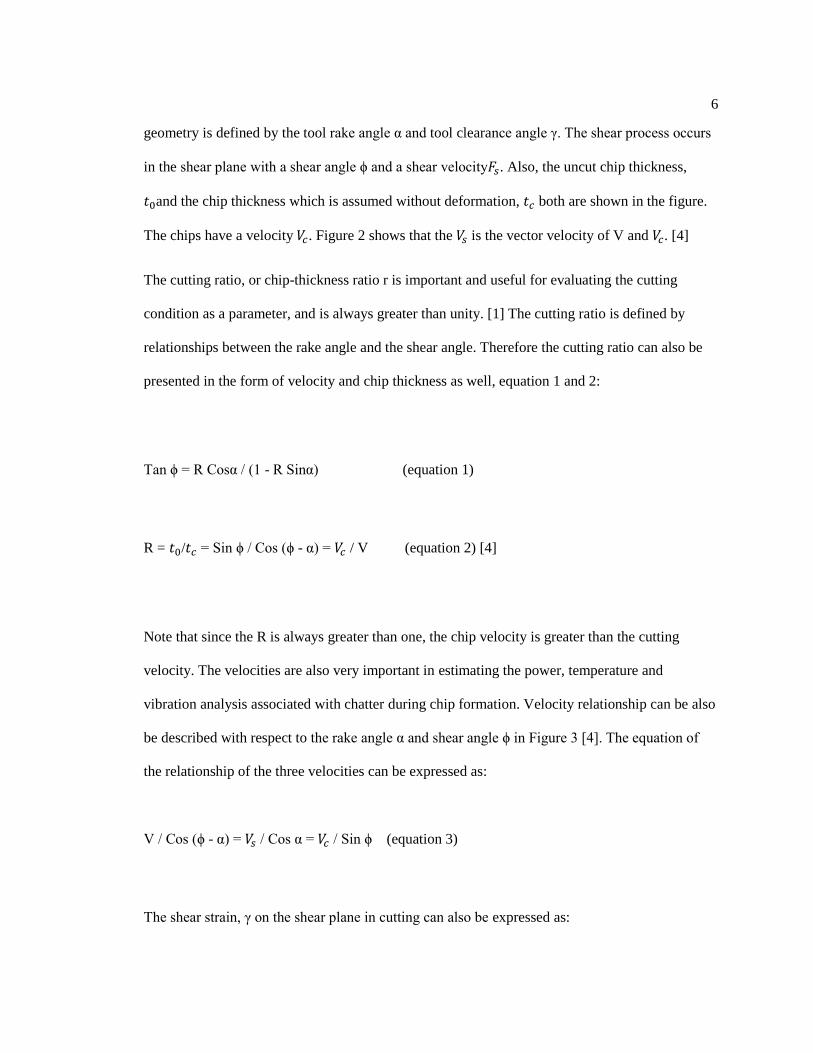
Tan ϕ = R Cosα / (1 - R Sinα) (equation 1)
R = 𝑡0/𝑡𝑐 = Sin ϕ / Cos (ϕ - α) = 𝑉𝑐 / V (equation 2) [4]
Note that since the R is always greater than one, the chip velocity is greater than the cutting
velocity. The velocities are also very important in estimating the power, temperature and
vibration analysis associated with chatter during chip formation. Velocity relationship can be also
be described with respect to the rake angle α and shear angle ϕ in Figure 3 [4]. The equation of
the relationship of the three velocities can be expressed as:
V / Cos (ϕ - α) = 𝑉𝑠 / Cos α = 𝑉𝑐 / Sin ϕ (equation 3)
The shear strain, γ on the shear plane in cutting can also be expressed as:

7
γ = Cot ϕ + Tan (ϕ - α) (equation 4)
The resultant strain rate γ𝑟 can be expressed as:
γ𝑟 = 𝑉𝑠 / ∆Y = [Cos α / Cos (ϕ - α)]* (V/∆Y) (equation 5)
Figure 3: The relationship of velocity 𝑽𝒔, V and 𝑽𝒄 for orthogonal cutting. [4]
Cutting force
The cutting force is a critical factor because it starts the process of chip formation and controls
both the flow of the chips and the thermal gradients involved in machining. [32] The interaction
of chip formation and other machining variables has a significant influence on cutting force.
Generally, the cutting forces are less for discontinuous chips than continuous chips. Also when
cutting force decreases, the relative chip thickness also decreases because of an increase in

8
cutting ratio or shear angle. [2]
For orthogonal cutting, the entire force system lies in a single plane as depicted in Figure 4.[4]
Overall the cutting force could be separated into two basic forces - the friction force F and the
normal force N acting on the tool-chip interface contact area. The resultant force R can also be
resolved into two forces - shear force 𝐹𝑠 and normal force 𝐹𝑛 acting on the shear plane area As.[4]
Figure 4: Free body diagram of orthogonal cutting. [4]
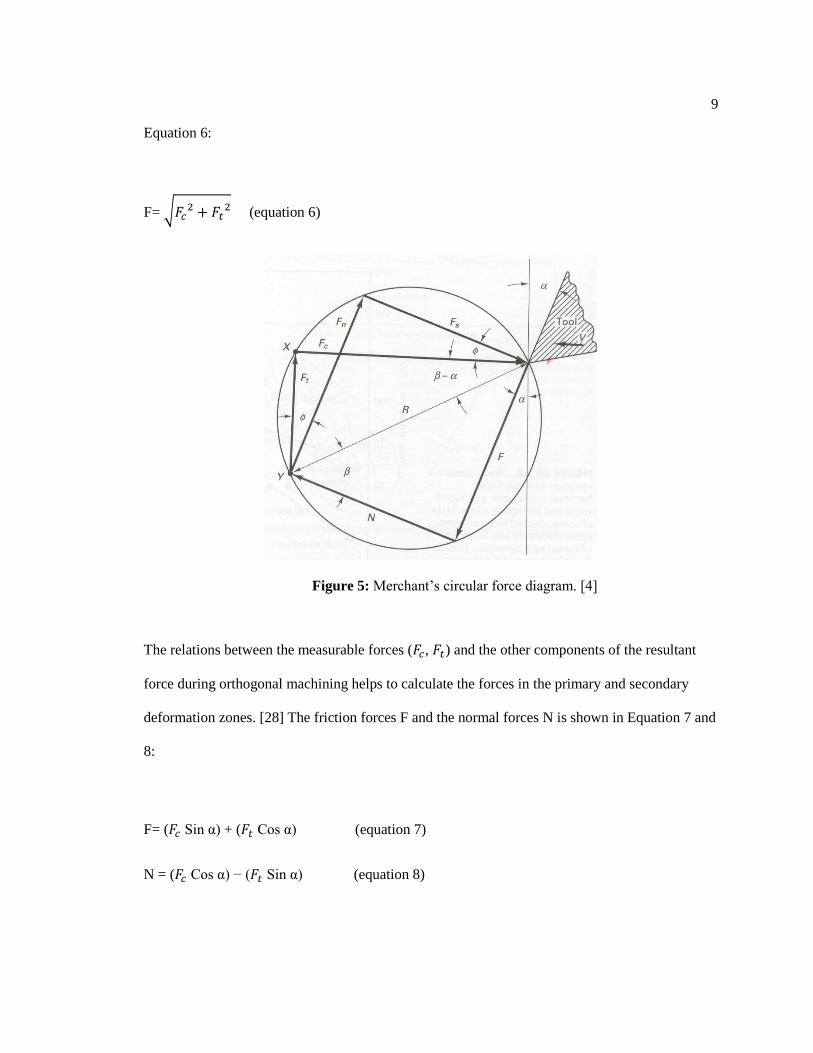
However, neither of these two sets of forces can be measured directly. Merchant’s circular force
diagram (Figure 5) can be used to analyze the resultant force R. As shown in the Figure 5, the
cutting force, R could be separated by cutting force 𝐹𝑐 and the tangential force𝐹𝑡, which are
measurable. The two forces 𝐹𝑐 and 𝐹𝑡 can then be used to calculate the resultant cutting force by
9
Equation 6:
F= √𝐹𝑐2 + 𝐹𝑡
2 (equation 6)
Figure 5: Merchant’s circular force diagram. [4]
The relations between the measurable forces (𝐹𝑐, 𝐹𝑡) and the other components of the resultant
force during orthogonal machining helps to calculate the forces in the primary and secondary
deformation zones. [28] The friction forces F and the normal forces N is shown in Equation 7 and
8:
F= (𝐹𝑐 Sin α) + (𝐹𝑡 Cos α) (equation 7)
N = (𝐹𝑐 Cos α) − (𝐹𝑡 Sin α) (equation 8)

10
The forces parallel and perpendicular to the shear plane can be described as:
𝐹𝑠= (𝐹𝑐 cos ϕ) - (𝐹𝑡 sin ϕ) (equation 9)
𝐹𝑛= (𝐹𝑐 sin ϕ) + (𝐹𝑡 cos ϕ) (equation 10)
Where ϕ is the shear angle and α is the rake angle.
The shear stress 𝜏𝑠 can be defined by equation 11 and 12:
𝜏𝑠 = 𝐹𝑠/𝐴𝑠 (equation 11)
Where 𝐴𝑠 is the shear plane area, could be expressed as equation 12:
𝐴𝑠 = 𝑡0w / sin ϕ (equation 12)
Note that 𝑡0 was the uncut chip thickness and w was the width of the workpiece. The shear stress
can also be expressed as:
𝜏𝑠 = (𝐹𝑐 Cos ϕ Sin ϕ -𝐹𝑡 Sin ϕ2) / 𝑡0w (equation 13)

11
Chip formation
The surfaces of chip formed by machining are different in the constrained and unconstrained
surfaces. The chip surface contacting with rake surface has a shiny appearance and is smooth.
The unconstrained surface is rough. The basic nature of the chips forming during machining can
be classified into four different types - continuous, build up edge (BUE), discontinuous, and
serrated (segment). [1]
Continuous chips usually form when machining a ductile material at high cutting speeds with
high rake angle tools. [1] The deformation of the workpiece occurs in a narrow shear zone, which
is called the primary deformation zone (Figure 6a) [1]. Continuous chips can potentially cause a
second deformation zone due to the high friction at the rake surface. The continuous chip usually
result in good surface finish of the workpiece. [1] However, continuous chip are typically not
desirable. Continuous chip may tangle around the tool holder, workpiece and the disposal system.
Tangling can result in stoppage time to clean the chip tangle. Tangling can be surmised by
changing the cutting parameter such as cutting speed, feed, depth of cut or using cutting fluid. [1]
The BUE chip is named because it has a layer of the material from the workpiece which is
progressively deposited on the tip of the cutting tool as shown in Figure 6c. [1] When the BUE
chip becomes larger, it will be unstable and break off the tool. Part of the BUE is carried away
from the tool side of the chip and randomly deposited on the workpiece surface. This cycle of
BUE formation and destruction will repeat continuously during machining. [1] The BUE
effectively changes the geometry of the cutting edge and makes it “dull”. Therefore, it has a
negative effect on the surface finish. However, if the BUE is stable, the tool wear will actually
decrease by protecting the rake face of the tool from wear. The tendency of BUE formation is
generally decreased by increasing cutting speed, rake angle and decreasing the depth of cut.

12
Using the sharp cutting tool and proper cutting fluid also decreases the tendency of BUE
formation. [1]
A discontinuous chip, shown in Figure 6e, is defined as chip segments connected firmly or
loosely to each other. [1] Discontinuous chip formation during the machining is because of a
series of discrete chip segments that fracture as stress concentrates in the workpiece. [2]
Discontinuous chip formation usually takes place when machining a material with inclusions, or
points of stress concentration such as cast iron due to the brittle graphite phase that doesn’t have
the capacity to undergo the high shear strain involved in cutting. [1] [2] Certain cutting conditions
increase the tendency of forming discontinuous chips. The conditions of very low or very high
cutting speed, large depth of cut, low rake angles and lack of proper cutting fluid will all increase
the tendency of discontinuous chip formation. [1]
Sometimes a discontinuous chip has a semi-continuous appearance such as in Figure 6d which is
called a serrated (segmented, nonhomogeneous) chip. The serrated chip has large zones of low
shear strain and small zones of high shear strain. (Shear localization). The serrated chip usually
occurs when machining low thermal conductivity and low strength materials decreasing
significantly with temperature (thermal softening) such as titanium, resulting in a sawtooth like
chip during machining. [1]
13
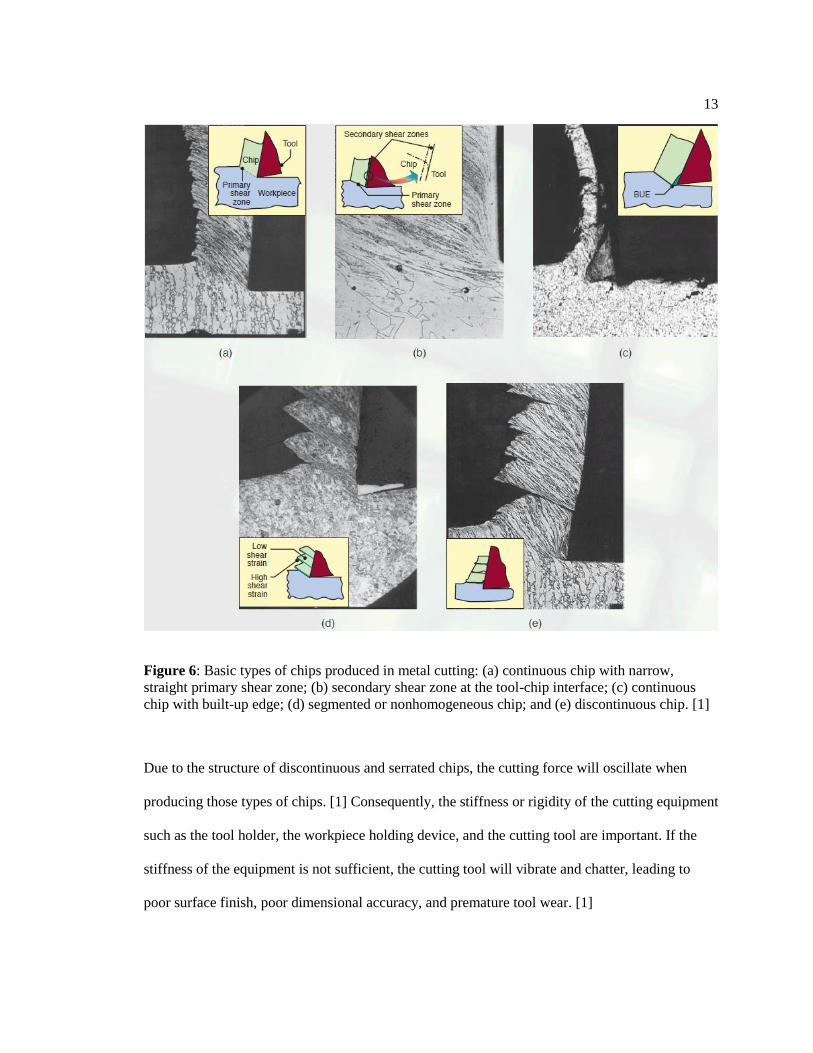
Figure 6: Basic types of chips produced in metal cutting: (a) continuous chip with narrow,
straight primary shear zone; (b) secondary shear zone at the tool-chip interface; (c) continuous
chip with built-up edge; (d) segmented or nonhomogeneous chip; and (e) discontinuous chip. [1]
Due to the structure of discontinuous and serrated chips, the cutting force will oscillate when
producing those types of chips. [1] Consequently, the stiffness or rigidity of the cutting equipment
such as the tool holder, the workpiece holding device, and the cutting tool are important. If the
stiffness of the equipment is not sufficient, the cutting tool will vibrate and chatter, leading to
poor surface finish, poor dimensional accuracy, and premature tool wear. [1]
14
Turning
Turning is a widely used material removal process generally rotating the workpiece on a lathe and
feeding the cutting tool mounted on the lathe into the workpiece to remove the unnecessary part
of workpiece to the required shape. [2] All turning operations can be divided into two categories -
the workpiece is situated in the center between chucks or fixed at the one end without support at
the other end. [3] The workpiece is held and rotated as the cutting tool moves with a certain depth
of cut travel in one direction under the certain velocity. Other than the depth of cut and cutting
speed (velocity), feed rate is also an important cutting parameter of turning. The feed rate is the
distance of tool travels horizontally or vertically per unit revolution of the workpiece. [2] Figure 7
showing the common operations performing that could be achieved by turning on lathe with
different kinds of cutting equipment. [3] The common machining process could be done by lathe
are:
1. Turning: to produce straight, conical, curved or grooved of workpiece such as shafts,
spindle, and pins.
2. Facing: to produce a flat surface which is parallel to the rotating direction at the end of
the workpiece for the parts needed to be assembled with other components.
3. Boring: to enlarge a hole or cylindrical cavity made by previous process or to produce
circular internal grooves.
4. Drilling: to produce a hole or improve the dimensional accuracy and surface finish of
boring hole.
5. Parting: (as cut off); the process is to cut a piece from the end of the workpiece.

15
Figure 7: Basic operations performed on a lathe. (a)facing (b)straight turning (c)taper turning
(d)grooving and cutting off (e)threading (f)tracer turning (g)drilling (h)reaming (i) boring [3]
Cutting tool geometry
Most turning is done as single-point turning. [1] [4] Single point of turning could be further
classified into rough and finish turning based on the different feed rate and depth of cut. [1] [6]
Finish turning is after initial roughing cuts improve dimensional accuracy and improves surface
finish. [1] [4] The tool geometry is important to effectively control chip formation. [6]
Rake angle controls the chip flow direction and the tool tip strength. In general, positive rake
angles reduce cutting force and temperature. However, positive rake angles have the risk of

16
premature tool chipping and failure. For brittle, high strength materials, the rake angle should be
negative. Increasing the wedge angle (the angle between the top face and the clearance angle) will
create a stronger cutting edge but require greater power to machine. [6] The clearance angle is
also important. If the clearance angle is too large, chipping is more likely. However, if it is too
small, the flank wear would increase and the finish surface will be adversely affected.
Another important factor of tool geometry is nose radius. Nose radius can significantly affect the
surface finish and tool tip strength. Smaller nose radius will reduce surface finish at high feed
rates. [1] When roughing the workpiece, the nose radi should be larger to increase the strength of
the tool point, Figure 9. [6] In addition, the machining with bigger nose radi is more desirable at
higher feed rates. [6] In general, it is recommended that the feed rate for roughing should be 50%
of the size of the nose radius in order to have expected surface finish. [6]
Figure 8: Typical cutting conditions for common external turning operations. [6]
Figure 9: Proper selection of inserts geometry for turning operations. [6]

17
Cutting parameters and material removal rates
The key cutting parameter in turning are cutting speed, feed rate and depth of cut. [4] The surface
cutting speed is built on the RPM of the rotating workpiece and diameter of the workpiece
𝑉𝑚𝑎𝑥 = π 𝐷0𝑁𝑠 (equation 14)
Where 𝐷0 is the original cutting diameter (mm/in) during turning process, 𝑁𝑠 is the rotation speed
of the workpiece. (rpm)
Or 𝑉𝑎𝑣𝑔 = π 𝐷𝑎𝑣𝑔𝑁𝑠 (equation 15)
Where 𝐷𝑎𝑣𝑔is the average cutting diameter (mm/in) during turning process, the 𝐷𝑎𝑣𝑔 could be
calculated by equation 16:
𝐷𝑎𝑣𝑔 = (𝐷0 +𝐷𝑓 ) / 2 (equation 16)
Where 𝐷𝑓 (mm/in) is the final diameter.
The feed rate, the distance of tool travels per unit revolution (𝐹𝑟) is given by equation 17:

18
d = DOC = (𝑑1 +𝑑2 ) / 2 (mm/in) (equation 17)
Note that 𝑑1 is the original diameter before cutting and 𝑑2 is the new diameter after machining.
The length of cut is not only the distance traveled parallel to the perpendicular axis of machining
the workpiece but also the sum of allowance or overrun distance before or after machining. [4]
The cutting time (T), can be calculate by equation 18:
T = (L+A) / 𝐹𝑟𝑁𝑠 (equation 18)
Where Ns is the rotation speed of workpiece (RPM), A is the distance before or after machining.
[4]
The material removal rate (MRR) is the volume of material removed per unit time (𝑚𝑚3 or
𝑖𝑛𝑐ℎ3 / min), as follows:
MMR = volume removed / time = π [(𝑑1/2)2 - (𝑑2/2)2] 𝐹𝑟𝑁𝑠 (equation 19)
If the average MRR is required, the average diameter is used instead of the single diameter of a
particular cut. The average MRR can be described as:
MRR = π 𝐷𝑎𝑣𝑔 d 𝐹𝑟𝑁𝑠 or d 𝐹𝑟V (equation 20)
19
Cutting fluid
The cutting fluid is also a very important during turning. The basic two functions of cutting fluid
are cooling and lubrication which decreasing the friction force and temperature of the interface
between tool and workpiece. [3] At moderate cutting the lubrication and cooling are both
important, and for low speed cutting, the function of cutting fluid is mainly for lubrication. [3]
Compared to dry cutting, use of a cutting fluid can increase the productivity and reduce the cost
by making possible of using higher the depth of cut, cutting speed, and feed rate. The effective
application of cutting fluid can increase the tool life, dimensional accuracy, as well as decrease
the surface roughness and power consumption. The choice and effectiveness of cutting fluid can
be determined by the condition of the machine tool, cutting parameters (speed, feed rate, depth of
cut), composition, finish, geometry of the cutting tool, mode of fluid application, geometry of
material is machined, surface coatings, and the composition microstructure, and residual stress
distribution of the workpiece. [3]
Machinability
The machinability of a material is not only based on the metallurgical properties such as hardness,
microstructure, and chemical composition but also on compatibility with the machining process
including the shape of cut, the cutting tool and the cutting fluid. Different machining
environments can have a significant effect on machinability rankings. [2] Furthermore, no single
dependent variable in machining is universally accepted as a measure of machinability. As a
result, machinability ratings for a material will vary depending on the different methods used to
evaluate machinability such as surface finish, tool life, cutting force, and chip formation.

20
Chip formation
The shape of chip formation, can be an important indicator of machinability. The formation of
short chips are considered as a better result than long, unbroken or small, powder like chips. [28]
A ductile material that forms long, unbroken, or continuous chip has more tendency to burrs,
especially as tools wear. [5] The burr formation are often used to evaluate the machinability of
soft, ductile materials such as aluminum. In addition, comparing chip type (the continuous chip or
discontinuous chip) indicates ease of chip recycling and tendency to clog the machine. [26]
Cutting force
The cutting force is another method used to evaluate machinability. Various cutting parameters
have a significant influence on cutting force. Typically the feed rate, depth of cut has more of an
effect on cutting forces than cutting speed. [5] The cutting forces increase significantly with flank
wear. In general, low cutting force result in the longer tool life and improved dimensional
accuracy. [5] The tool geometry also affect the cutting force. The cutting force is reduced when
the rake angle increases. [5] In general, the use of force as an indicator of relative machinability is
based on the assumption that more difficult to machine metals require more cutting force. [2]
However, the tool force is not typically used as the sole measurement of machining quality. [2]
[7]
Tool life
Tool life studies are the most direct method to evaluate the machinability of materials. When tool
life increases, the effective machinability also increases. [28] However, tool wear can occur by
various mechanism: abrasion, adhesion, diffusion, chemical wear, and oxidation wear. [2]
Abrasion wear takes place when hard material and hard particles on the surface of the chip slide
on the tool faces and remove tool material. The hard particles could be fragments of the BUE or
21
abrasive inclusions within the workpiece material. [2] Adhesion wear occurs when the frictional
environment at the interface between the tool and chip, caused by pressure and high temperature,
causes welding at the interface of chips and tool face. When the welds fracture, a small part of
tool material is carried away with the chips. [2] Diffusion wear occurs when the atoms of a
metallic crystal lattice diffuse from an area of high atomic concentration in the workpiece to an
area of low concentration in the tool, due to the high temperature at the interface between the tool
and the chip on the workpiece. Chemical wear is a chemical reaction that wears the tool by
corrosion. The oxidation wear occurs at very high temperature at the point at which the structure
of the cutting tool is weakened through oxidation reactions. The high temperature softens the
microstructure of cutting tool and weakens the edge of the cutting tool. [2]
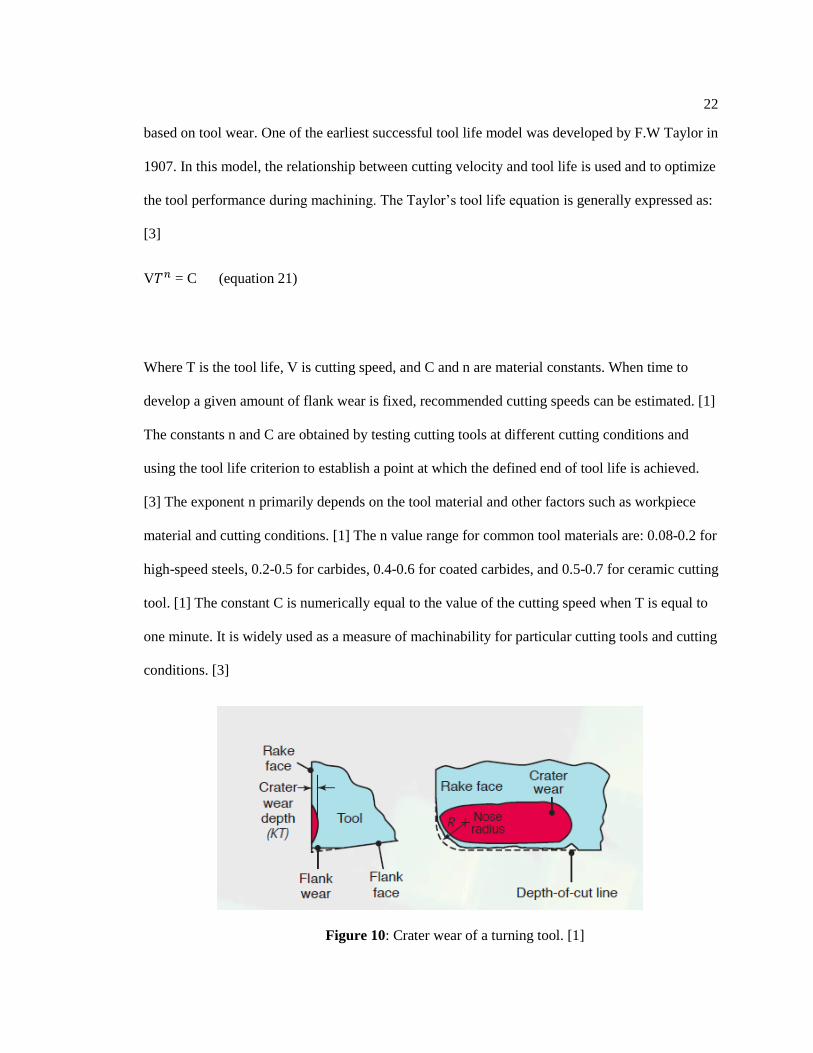
The tool wear can be classified into many different types, such as flank wear, crater wear, nose
wear, notching, plastic deformation of the tool tip, chipping and gross fracture. [1] Among the
various type of wear, flank wear and crater wear are commonly used to characterize tool wear in
most studies, Figure 10 [1] shows characteristic of crater wear and the flank wear on a turning
tool. [1] [3] Crater wear is observed on the rake face of the cutting tool and flank wear is occurred
on relief face of the cutting tool. Crater wear is a result of both of abrasion and diffusion [6] and
is believed to be a thermochemical reaction. [2] The evaluation of crater wear can be done by
measuring the location of the maximum depth of the crater, KT, Figure 10. KT is also coincides
with the location of the maximum temperature at the tool-chip interface. [1] Crater wear is
normally generated by diffusion mechanisms. With the increased tool temperature, the crater
wear increases as well. [1] Crater wear is normally used for evaluating tool wear in extreme
conditions. [28] However, flank wear is more typically used to evaluate tool wear. [40]
Flank wear generation is caused by the rubbing of the tool along the machined surface causing
adhesive and/or abrasive wear. [1] Various tool life models have been used to predict the tool life
22
based on tool wear. One of the earliest successful tool life model was developed by F.W Taylor in
1907. In this model, the relationship between cutting velocity and tool life is used and to optimize
the tool performance during machining. The Taylor’s tool life equation is generally expressed as:
[3]
V𝑇𝑛 = C (equation 21)
Where T is the tool life, V is cutting speed, and C and n are material constants. When time to
develop a given amount of flank wear is fixed, recommended cutting speeds can be estimated. [1]
The constants n and C are obtained by testing cutting tools at different cutting conditions and
using the tool life criterion to establish a point at which the defined end of tool life is achieved.
[3] The exponent n primarily depends on the tool material and other factors such as workpiece
material and cutting conditions. [1] The n value range for common tool materials are: 0.08-0.2 for
high-speed steels, 0.2-0.5 for carbides, 0.4-0.6 for coated carbides, and 0.5-0.7 for ceramic cutting
tool. [1] The constant C is numerically equal to the value of the cutting speed when T is equal to
one minute. It is widely used as a measure of machinability for particular cutting tools and cutting
conditions. [3]
Figure 10: Crater wear of a turning tool. [1]

23
Figure 12 [3] shows typical tool wear curves at different cutting velocities. The shape of the curve
can be broken into three sections - initial wear, where the sharp edge wears quickly, the steady-
state wear in the middle, where wear progresses at a constant rate, and accelerated wear, where
the tool wear rapidly increases just before total failure. Flank wear (W1, Figure 12) is typically
the criteria for limiting tool wear. The width of flank wear land is an appropriate wear criteria for
single point cutting. The wear land can be classified into three zones. The first zone, C, is located
at the tool corner. The second and third, zones B and A, are on the cutting faces, which stop at the
zone N. In the zone B, the wear land is relatively uniform. Two different wear land width can be
identified, the maximum width of flank wear 𝑉𝐵𝐵max and the average wear land width VB.
Either criteria can be considered identified as critical indicators of tool wear. [8] When the wear
land is uniform, the VB criteria is used for measuring the tool life. If the uniform wear land width
reaches the value of 0.3mm, it is considered as tool failure. When the wear land is not uniform,
𝑉𝐵𝐵max is considered. When the 𝑉𝐵𝐵max reaches 0.6mm, the tool is considered as reaching the
end of its life. [8]
Figure 11: Taylor tool life model (ln-ln coordinates) [3]

24
Figure 12: Typical tool wear curves for different cutting velocities (𝑽𝟓 > 𝑽𝟒 > 𝑽𝟑 >𝑽𝟐 > 𝑽𝟏) [3]
Figure 13: Flank wear features for single-point-tool wear in turning operations [8]
25
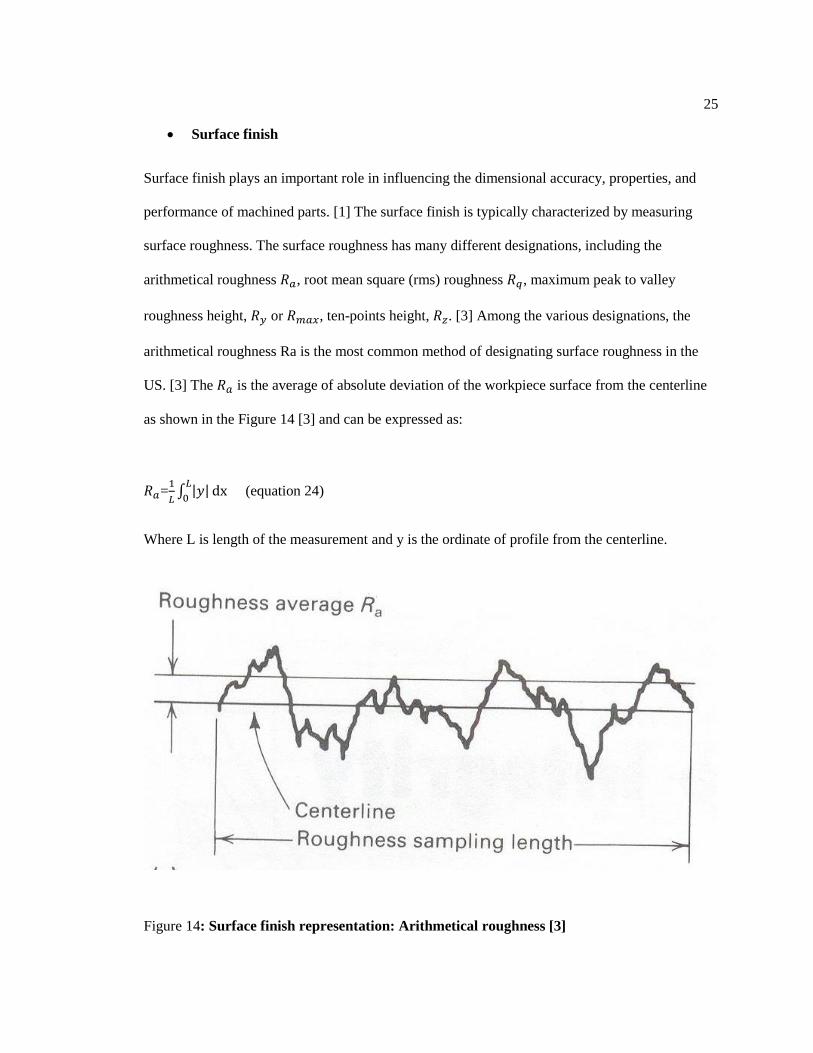
Surface finish
Surface finish plays an important role in influencing the dimensional accuracy, properties, and
performance of machined parts. [1] The surface finish is typically characterized by measuring
surface roughness. The surface roughness has many different designations, including the
arithmetical roughness 𝑅𝑎, root mean square (rms) roughness 𝑅𝑞, maximum peak to valley
roughness height, 𝑅𝑦 or 𝑅𝑚𝑎𝑥, ten-points height, 𝑅𝑧. [3] Among the various designations, the
arithmetical roughness Ra is the most common method of designating surface roughness in the
US. [3] The 𝑅𝑎 is the average of absolute deviation of the workpiece surface from the centerline
as shown in the Figure 14 [3] and can be expressed as:
𝑅𝑎=1
𝐿∫ |𝑦|
𝐿
0dx (equation 24)
Where L is length of the measurement and y is the ordinate of profile from the centerline.
Figure 14: Surface finish representation: Arithmetical roughness [3]
26
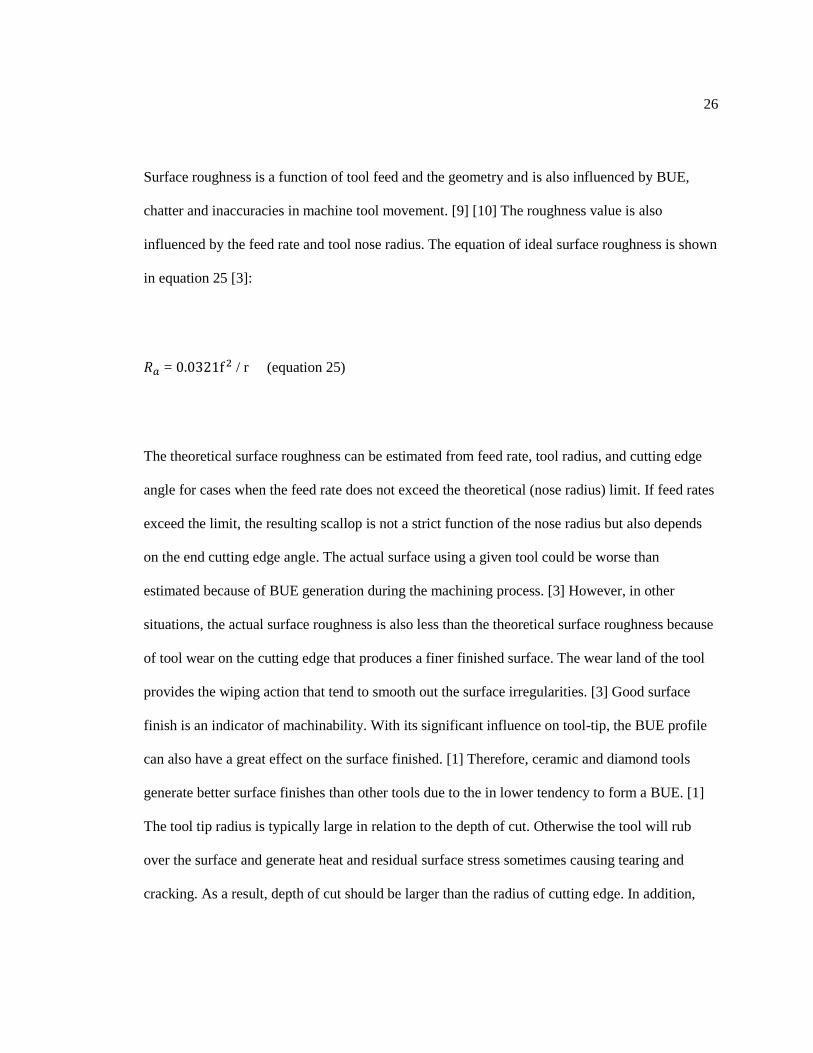
Surface roughness is a function of tool feed and the geometry and is also influenced by BUE,
chatter and inaccuracies in machine tool movement. [9] [10] The roughness value is also
influenced by the feed rate and tool nose radius. The equation of ideal surface roughness is shown
in equation 25 [3]:
𝑅𝑎 = 0.0321f 2 / r (equation 25)
The theoretical surface roughness can be estimated from feed rate, tool radius, and cutting edge
angle for cases when the feed rate does not exceed the theoretical (nose radius) limit. If feed rates
exceed the limit, the resulting scallop is not a strict function of the nose radius but also depends
on the end cutting edge angle. The actual surface using a given tool could be worse than
estimated because of BUE generation during the machining process. [3] However, in other
situations, the actual surface roughness is also less than the theoretical surface roughness because
of tool wear on the cutting edge that produces a finer finished surface. The wear land of the tool
provides the wiping action that tend to smooth out the surface irregularities. [3] Good surface
finish is an indicator of machinability. With its significant influence on tool-tip, the BUE profile
can also have a great effect on the surface finished. [1] Therefore, ceramic and diamond tools
generate better surface finishes than other tools due to the in lower tendency to form a BUE. [1]
The tool tip radius is typically large in relation to the depth of cut. Otherwise the tool will rub
over the surface and generate heat and residual surface stress sometimes causing tearing and
cracking. As a result, depth of cut should be larger than the radius of cutting edge. In addition,
27
vibration and chatter during machining can also adversely affect surface finish because vibration
and chatter of the tool will periodically change the dimension of the cut. [1]
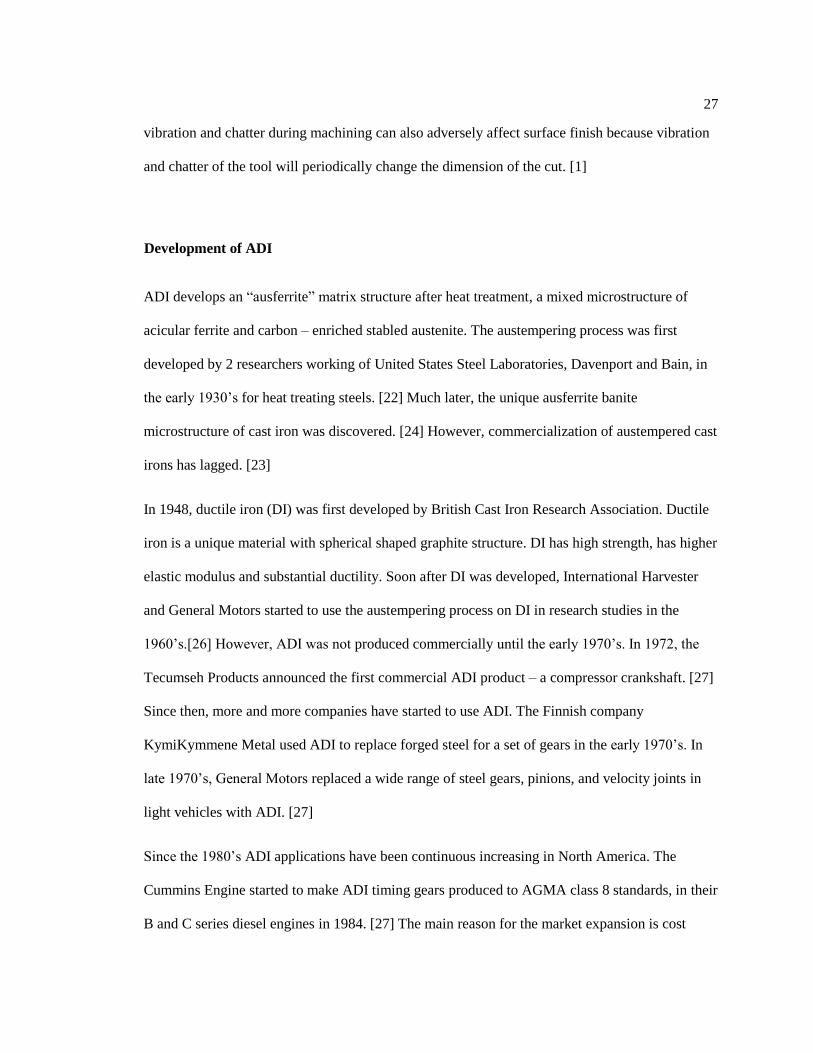
Development of ADI
ADI develops an “ausferrite” matrix structure after heat treatment, a mixed microstructure of
acicular ferrite and carbon – enriched stabled austenite. The austempering process was first
developed by 2 researchers working of United States Steel Laboratories, Davenport and Bain, in
the early 1930’s for heat treating steels. [22] Much later, the unique ausferrite banite
microstructure of cast iron was discovered. [24] However, commercialization of austempered cast
irons has lagged. [23]
In 1948, ductile iron (DI) was first developed by British Cast Iron Research Association. Ductile
iron is a unique material with spherical shaped graphite structure. DI has high strength, has higher
elastic modulus and substantial ductility. Soon after DI was developed, International Harvester
and General Motors started to use the austempering process on DI in research studies in the
1960’s.[26] However, ADI was not produced commercially until the early 1970’s. In 1972, the
Tecumseh Products announced the first commercial ADI product – a compressor crankshaft. [27]
Since then, more and more companies have started to use ADI. The Finnish company
KymiKymmene Metal used ADI to replace forged steel for a set of gears in the early 1970’s. In
late 1970’s, General Motors replaced a wide range of steel gears, pinions, and velocity joints in
light vehicles with ADI. [27]
Since the 1980’s ADI applications have been continuous increasing in North America. The
Cummins Engine started to make ADI timing gears produced to AGMA class 8 standards, in their
B and C series diesel engines in 1984. [27] The main reason for the market expansion is cost

28
reduction. The price per unit of mass for ductile iron was typically half that of steel. When the
extra cost of austempering process was added, the ADI products are still much more economical
than steel. [26] Because of the increasing application of ADI in 1980’s, ADI material
specifications were developed. In 1990, the first US standards - ASTM 897/897M for ADI were
released. [26] In this standard various grades of ADI are specified for many applications. Updated
ADI standards were released in 2000’s. Currently, there are four common standards - ASTM
(A897/A879M) first issued in 2002, SAE (J2477) issued in 2003, ISO (17804) issued in 2005,
and China standard GB/T24733 issued in 2009. The Table 1 shows the comparison of the
hardness of the different standard grades. Table 2 shows the yield strength (MPa) - elongation
(%) for the various grades.
Table 1: Comparison of Brinell hardness ranges for the various ADI grades
Hardness Range (HB)
Grades ISO 17804 SAE J2477 ASTM
A897/A897M
800 250-310
850 269-321
900 280-340 269-341
1050 320-380 302-375 302-363
1200 340-420 341-444 341-444
1400 380-480 388-477 388-477
1600 402-512 444-512
*Based on tensile strength (MPA)
29
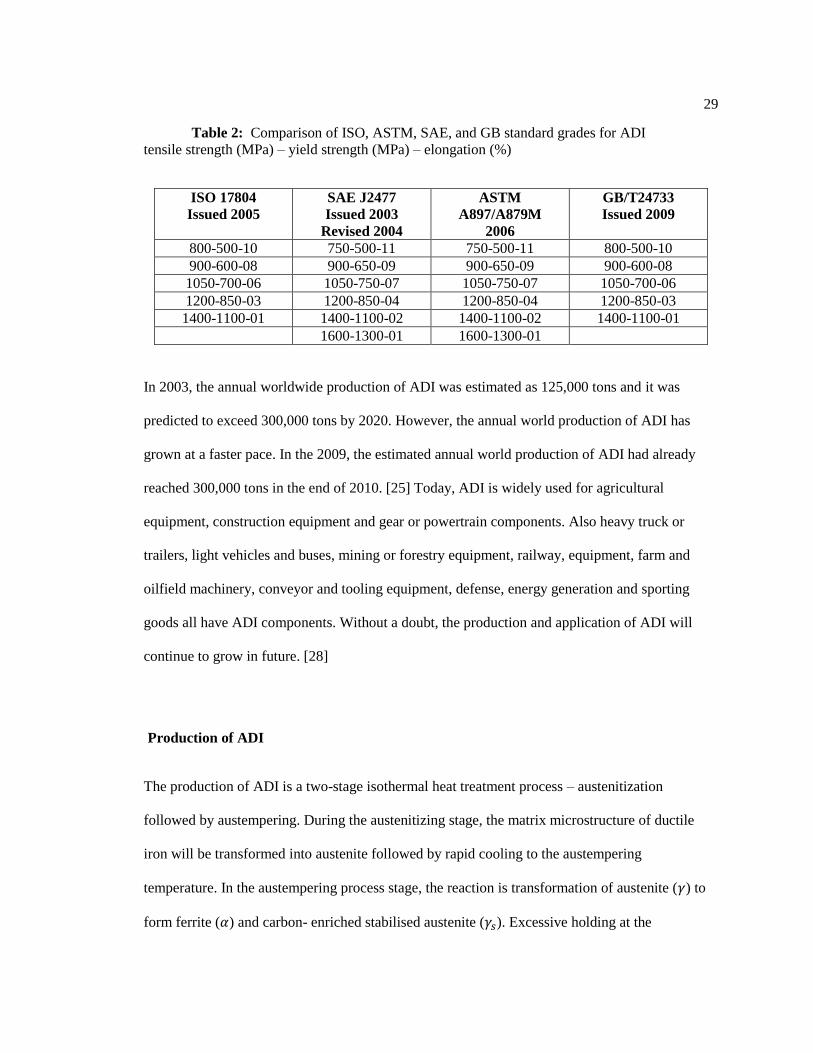
Table 2: Comparison of ISO, ASTM, SAE, and GB standard grades for ADI
tensile strength (MPa) – yield strength (MPa) – elongation (%)
ISO 17804
Issued 2005
SAE J2477
Issued 2003
Revised 2004
ASTM
A897/A879M
2006
GB/T24733
Issued 2009
800-500-10 750-500-11 750-500-11 800-500-10
900-600-08 900-650-09 900-650-09 900-600-08
1050-700-06 1050-750-07 1050-750-07 1050-700-06
1200-850-03 1200-850-04 1200-850-04 1200-850-03
1400-1100-01 1400-1100-02 1400-1100-02 1400-1100-01
1600-1300-01 1600-1300-01
In 2003, the annual worldwide production of ADI was estimated as 125,000 tons and it was
predicted to exceed 300,000 tons by 2020. However, the annual world production of ADI has
grown at a faster pace. In the 2009, the estimated annual world production of ADI had already
reached 300,000 tons in the end of 2010. [25] Today, ADI is widely used for agricultural
equipment, construction equipment and gear or powertrain components. Also heavy truck or
trailers, light vehicles and buses, mining or forestry equipment, railway, equipment, farm and
oilfield machinery, conveyor and tooling equipment, defense, energy generation and sporting
goods all have ADI components. Without a doubt, the production and application of ADI will
continue to grow in future. [28]
Production of ADI
The production of ADI is a two-stage isothermal heat treatment process – austenitization
followed by austempering. During the austenitizing stage, the matrix microstructure of ductile
iron will be transformed into austenite followed by rapid cooling to the austempering
temperature. In the austempering process stage, the reaction is transformation of austenite (𝛾) to
form ferrite (𝛼) and carbon- enriched stabilised austenite (𝛾𝑠). Excessive holding at the
30
austempering temperature will result in the carbon- enriched stabilised austenite decomposing to
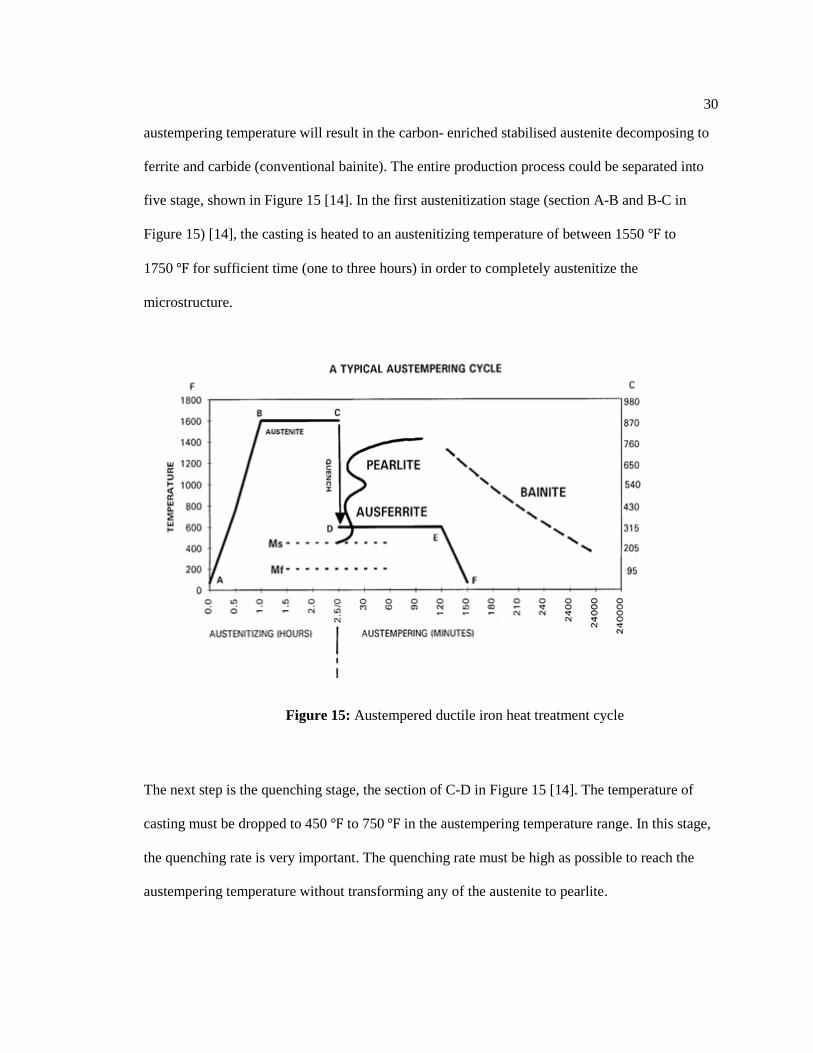
ferrite and carbide (conventional bainite). The entire production process could be separated into
five stage, shown in Figure 15 [14]. In the first austenitization stage (section A-B and B-C in
Figure 15) [14], the casting is heated to an austenitizing temperature of between 1550 ℉ to
1750 ℉ for sufficient time (one to three hours) in order to completely austenitize the
microstructure.
Figure 15: Austempered ductile iron heat treatment cycle
The next step is the quenching stage, the section of C-D in Figure 15 [14]. The temperature of
casting must be dropped to 450 ℉ to 750 ℉ in the austempering temperature range. In this stage,
the quenching rate is very important. The quenching rate must be high as possible to reach the
austempering temperature without transforming any of the austenite to pearlite.
31
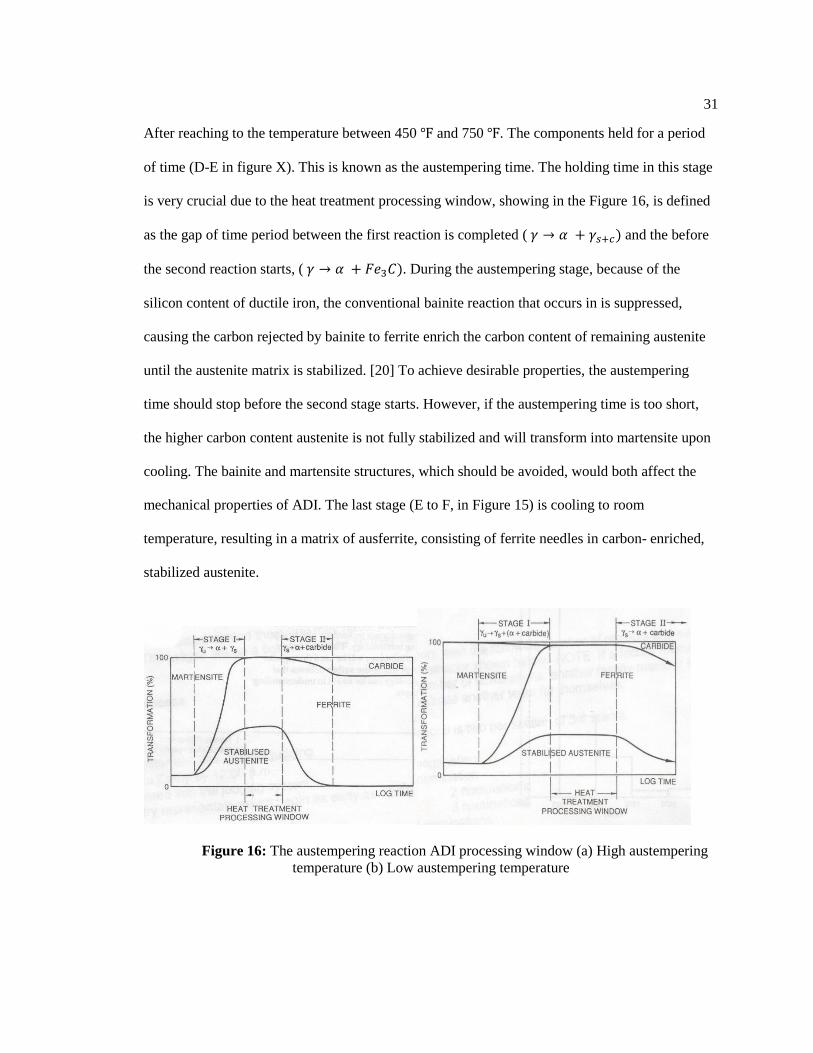
After reaching to the temperature between 450 ℉ and 750 ℉. The components held for a period
of time (D-E in figure X). This is known as the austempering time. The holding time in this stage
is very crucial due to the heat treatment processing window, showing in the Figure 16, is defined
as the gap of time period between the first reaction is completed ( 𝛾 → 𝛼 + 𝛾𝑠+𝑐) and the before
the second reaction starts, ( 𝛾 → 𝛼 + 𝐹𝑒3𝐶). During the austempering stage, because of the
silicon content of ductile iron, the conventional bainite reaction that occurs in is suppressed,
causing the carbon rejected by bainite to ferrite enrich the carbon content of remaining austenite
until the austenite matrix is stabilized. [20] To achieve desirable properties, the austempering
time should stop before the second stage starts. However, if the austempering time is too short,
the higher carbon content austenite is not fully stabilized and will transform into martensite upon
cooling. The bainite and martensite structures, which should be avoided, would both affect the
mechanical properties of ADI. The last stage (E to F, in Figure 15) is cooling to room
temperature, resulting in a matrix of ausferrite, consisting of ferrite needles in carbon- enriched,
stabilized austenite.
Figure 16: The austempering reaction ADI processing window (a) High austempering
temperature (b) Low austempering temperature

32
The three main factors that affect success are austempering time and temperature, austenitizing
time and temperature and a cooling rate sufficient for the casting/alloy combination. [27] The
Austenitizing time and temperature are factors that cannot be ignored when producing ADI. The
austenitizing temperature is related to dissolved carbon, and the reduction in the rate of
austempering. [28] The purpose of the austenitizing is to saturate the austenite matrix with
carbon. Austenitizing temperature affects the final carbon content of the austenite. Increasing the
austenitizing temperature causes an increase in the carbon content of austenite, leading to higher
hardness and strength after austempering, [27] but slowing the transformation during
austempering and sometimes reducing the mechanical properties after austempering. High carbon
content austenite needs more time to transform to ausferrite [27]. During the austempering
process, decreasing the austempering temperature will delay the austempering transformation
start and completion times. At lower temperature the austenite structure may not complete
stabilize. [28] On the other hand, lower temperature also create lower austenite contents with fine
ferrite needles with some bainitic ausferrite formation. The higher austempering temperature
leads to a coarser ausferrite microstructure, which consist of coarse and distinct bainitic ferrite
needles, with more ductility but less strength and hardness than ADI’s transformed at lower
austempering temperatures [29].
The proper austenitizing temperature is dependent on the chemical composition of DI. Elements
such as manganese, silicon and molybdenum play an important role in selecting the proper
austenitizing temperature. [18] The upper critical austenitizing temperature (UCT) is the lowest
temperature for forming austenite + graphite (γ + G) as described on the Fe – C phase diagram.
The manganese will decrease the UTC while the silicon and molybdenum will raise it. [18].
However, if the austenitizing is performed below the UTC, proeutectoid ferrite will be present in

33
the final microstructure, resulting in a lower strength and hardness material after austempering.
[20]
The time of austenitization is also very important. Insufficient holding time would result in an
austenite matrix that is not fully saturated with carbon. The time is affected by composition;
heavily alloyed irons will take more time to austenitize. [18] Han claims that an austenitization
temperature at 900 ℃ for 1.5 hours will increase the size of austempering process window and
will shorten the time for decomposition of austenite. [30]
The austempering temperature and time also have a significant effect on ADI performance. These
two factors will influence the mechanical properties, because they affect the composition of the
micro – constituents. Figure 16 [29] shows the influence of temperature on microstructure. At low
austempering temperatures, the carbon diffusion rate is low, resulting in a limited amount of
austenite carbon enrichment in stage 1 and accompanied by the co-precipitation of carbides in the
ferrite. On the other hand, high austempering temperatures will increase the diffusion rate of
carbon. Therefore, these microstructure would have more carbon - enriched stabilised austenite.
The matrix of ADI can have up to 50% of carbon - enriched stabilised austenite. [29]
The austempering temperature is normally controlled between 450 ℉ and 750 ℉. If the
temperature dropping too low during the quenching stage, it will generate martensite. Martensite
will adversely affect the mechanical properties of ADI. Therefore the austempering temperature
must be controlled above the martensite start temperature. On the other hand, if austempering
temperature is too high or the quenching process is slow, pearlite will form instead of ausferrite.
[16]
Due to the different proportion of austenite and ferrite in microstructure at different austempering
temperatures, the mechanical properties vary as austempering temperature changes. At high

34
austempering temperature larger proportions of stabilized austenite are produced and the hardness
and strength are lower but the ductility is improved. [11] [12] [13] [29] [31]
The austempering time is another critical factor to affect the production of ADI. Insufficient
austempering holding time causes insufficient carbon stabilisation of austenite and transforms the
microstructure to martensite during subsequent cooling to room temperature. The formation of
martensite will increase the strength and hardness, but will significantly decrease the ductility
resulting in brittle performance. [14] [28] [29] [32] Also, long austempering time should be
avoided. Excessive austempering times will lead to decomposition of stabilised austenite to form
ferrite and carbide [29] [33] and decrease the ductility and toughness [29], but not significantly
affect the hardness and strength. [11] [15] [33] The desired ADI matrix should be thought of as a
metastable or intermediate microstructure of ferrite and stabilized austenite with a temperature –
time austempering processing window defining successful heat treatment. [29]
The austempering stage 1 (within the processing window) and undesirable Stage 2 reactions (over
- austempering) are shown in Figure 16.
Stage 1: 𝛾 (𝐴𝑢𝑠𝑡𝑒𝑛𝑖𝑡𝑒) → 𝛼 (𝐹𝑒𝑟𝑟𝑖𝑡𝑒) + 𝛾𝑠 (𝑐𝑎𝑟𝑏𝑜𝑛 − 𝑒𝑛𝑟𝑖𝑐ℎ𝑒𝑑 𝑠𝑡𝑎𝑏𝑖𝑙𝑖𝑠𝑒𝑑 𝑎𝑢𝑠𝑡𝑒𝑛𝑖𝑡𝑒)
Stage 2: 𝛾𝑠(𝑐𝑎𝑟𝑏𝑜𝑛 − 𝑒𝑛𝑟𝑖𝑐ℎ𝑒𝑑 𝑠𝑡𝑎𝑏𝑖𝑙𝑖𝑠𝑒𝑑 𝑎𝑢𝑠𝑡𝑒𝑛𝑖𝑡𝑒) → 𝛼 (𝐹𝑒𝑟𝑟𝑖𝑡𝑒) + 𝜀 (𝐶𝑎𝑟𝑏𝑖𝑑𝑒)
Alloy elements influence the size of the heat treatment processing window for ADI and thus can
have a significant influence on the microstructure and mechanical properties. [31] Alloying
element in ADI help to prevent pearlite and ferrite formation upon cooling from the austenitizing
temperature and make the ADI production easier to control in the processing widow by shifting it

35
to the right and delaying carbide precipitation during the bainitic transformation. [21] However,
an improper alloy composition would cause significant alloy segregation, which will affect the
microstructure and mechanical properties adversely. Ni, Si, Mn, Cu, Mo are the common alloying
elements that have significant effect on ADI. [30] Nickel (Ni) tends to prolong the decomposition
of the carbon with austenite during the austempering process. The use Ni is limited because of its
high cost.
The roles of Manganese (Mn) and Molybdenum (Mo) are similar. They are used for preventing
pearlite during the austempering process and stabilised the austenite, making the carbon difficult
to decompose. However, Mn and Mo can also cause the serious segregation and formation of
martensite, which will limit mechanical properties. Since Mo segregates more than Mn, the
amount of Mo should be controlled carefully. The amount of Mo is normally limited to between
0.01 - 0.3wt%. Copper (Cu) can also be used for slowing the second stage of austempering
process, creating a wider process window with only a small influence the mechanical properties.
Silicon (Si) is an important element for production of DI as well as for controlling the
austempering reaction. The main function of Si during austempering process is to stabilize the
austenite and decrease the carbide formation at the second stage. The amount of Si normally
limited between 2.0% and 2.5% for effective DI production. [30]
36
Chapter 3
PREVIOUS RESEARCH
Machining of ADI
The machinability of a metal is very important in industry. During the past thirty years, many ADI
machining studies have published. Most of these studies have focused on the lower strength grades
of ADI. However, the growth of ADI markets are still impeded due to insufficient information on
the machining of ADI.
There are three different strategies for machining ADI. [14] [35] [36] The three strategies are:
1. Machining before heat treatment
2. Rough machining prior to heat treatment followed by final machining after heat treatment.
3. Machining after heat treatment.
The first method is primary to circumvent the difficulty of machining ADI. The process can be
widely used depending on the proper design and predictable part growth during the austempering
process of the component. Normally, this method is using for wide dimensional tolerance parts.
The second method is using when tight tolerance and surface finishes can’t held during heat
treatment. One of the advantage for using this method is improvement of final part fatigue
strength. However, the process is costly and can cause logistical problems. [14] Machining after
heat treatment avoids the logistical problems and cost of machining twice while maintain tight
tolerances and good surface finish. [14]
The two main difficulties when machining ADI are the high hardness of ADI and the strain-
induced transformation from the austenite structure to the harder and more brittle martensite on

37
the surface of the ADI component. [14] [36] Strain-induced transformation of ADI is because the
austenite structure will transform to martensite structure under plastic strain directly beneath and
ahead of the cutting tool. The strain induced transformation of ADI severely resists further fine
machining, leading to overall poor tool life and tool failure. [41]
From the view of material removal rates, ADI is not as easily machined as pearlitic or ferritic
ductile irons, but does machine comparably to 30Rc hardened steel [14]. The recommended
material removal rates of ADI are reported to be 75% of that of pearlitic ductile irons [36]. Also,
the recommended setting machining parameters for machining ADI are 50% less speed and 50%
deeper depth of cut when compared to other materials with similar hardnesses. [14] [36]
The effect of different cutting parameters on the machinability is one of the main targets of this
ADI turning research. Turning tool life depends on speed, feed rate, cutting tool material and depth
of cut. The choice of cutting tool is also a critical factor affecting machinability. [37] [38]
Cutting speed
The cutting speed has a significant influence on turning tool life. The evaluation of
turning tool life is typically based the tool wear. [39] Flank wear is typically used to evaluate tool
wear instead of crater wear because the flank wear during turning directly affects the accuracy of
the product. [40] As cutting speed increases, the tool life will decrease significantly. [31] [32]
[33] [34] [35] The cutting speed will also influence chip formation. Austenite on ADI surface
transforms to martensite due to the associated high surface strains. The brittle, hard martensite
that forms accelerates tool wear and forms discontinuous chips. [44]. The surface roughness will
also be influenced by cutting speed because high cutting speeds result in higher temperatures on
the surface of tool and at tool-chip interface. [41] [42] [45] Ucun and Gök used CBN cutting tools
at various cutting speeds (200, 300,400 m/min) to machine ADI austempered at different

38
austempering temperatures (250, 350℃). The result shows that the higher cutting speed and
associated high strain rates, lead to the formation of martensite and discontinuous, smaller chips
and shorten tool life. [44] In research by Aslantas and Ucun [45], two type of cutting tools (nose
radius 0.4 mm) - ceramic (Al2O3 based) and cermet (TiCN+TiN coated), were compared under
various cutting speeds, constant depth of cut and feed rate when machining two different grades
of ADI. The results show that from the view of tool life, ceramic tools performed better than
cermet tools. Ceramic cutting tools were not suitable for machining ADI at low cutting speeds
based on the criteria of tool life and surface roughness. However both ceramic and cermet tools
were suitable at high cutting speeds. [45]
Cutting tool
Choice of the proper cutting tool is an important factor for cost effective machining. The
high strength and ductility of ADI adversely affects tool wear during machining. The cutting tools
for machining ADI must have high wear resistance. Tool geometry is also important. The tool life
has also been observed to increase 70 % and by 100% when dry turning ADI and when wet
turning with prefered tool geometries. [46] Tool nose radius also impacts on surface roughness.
The research shows that increasing the nose radius impacts surface roughness. [47] Carbide
cutting tools is typically recommended for machining the various ADI grades, with K-grade
carbide tools used for turning with cutting fluid and P-grade cutting tools used for dry cutting.
[14] Carbide tools with various coatings have good tool life when machining all grades of ADI
under a wide range of cutting conditions. [28] Other material such as ceramic and CBN have also
been used for cutting ADI. Al2O3 ceramics can be used for continuous cutting processes such as
turning. However, Si3N4 ceramics and PCBN cutting tools are not suggested for discontinuous
cut machining of ADI. [14]
39
Depth of cut
Depth of cut is a very important variable for setting cutting parameters. Decreasing the depth of cut
tends to reduce tool life for ADI grades at constant material removal rates [35]. Avishan, Yazdani,
and Vahid studied relationship between depth of cut and machinability. Decreasing depth of cut in
general reduced tool life. They recommend depths of cut between 0.5 and 1 mm for machining ADI.
[35] Akdemir,Yazman, Saglam and Uyaner also reported the influence of depth of cut when
machining ADI. When the depth of cut increased, the surface roughness also increased. However,
they found that reduced depths of cut did not significantly affect tool wear. [42]
Chips formation and feed rate
The chips formed during the machining ADI are discontinuous. [14] [44] [47] Compared to the
continuous coil - like chips that typically result when machining other materials such as steel, the
discontinuous chips formed when machining ADI are considered beneficial. Discontinuous chips
are easier to handle and recycle and, in highly automated machining centers, the smaller chips
tend to not to clog the equipment. [14] Chip shape is influenced by feed rate and cutting speed,
but is typically not affected by depth of cut. When feed rate increases, the thickness of chips also
increases. [47] This can change the chip shape from a coiled chip to C - shaped chip as feed rate
increases. When the cutting speed is increased, the chip shape turned from crack-like and C -
shaped to coiled chips. [48] The feed rate would also affect the tool life and surface finish of ADI.
In research by Polishetty, tool wear increases when the feed rate increases, especially when
cutting with PCBN tools. It was observed that feed rate also demonstrated a dominant effect on
the surface roughness. [41]
40
Polishetty machined ASTM grade 3 ADI using PCBN and ceramic cutting tools for both rough
turning and fine turning. [41] Katuku, Koursaris, and Sigalas researched the machinability of
ASTM grade 2 ADI, using PCBN cutting tools with the constant depth of cut and feed rate at
different cutting speeds. These investigation showed that the optimized cutting speed was
between 150 and 500 m/min for dry turning. C. Wang, Guo, W. Wang and Dong studied tool life
during turning with CC650 ceramic tools at various cutting speeds, feed rates and depths of cut.
[48] Carvalho, Montenegro, Gomes investigated the machinability of ASTM grade 2 and 3 using
carbide tools at a constant cutting speed with various depths of cut, feed rates and tool nose radi.
[47] Akdemir, Yazman, Saglam and Uyaner investigated the effect of machinability by using
carbide inserts at a constant feed rate. [42] In all of these studies, optimal turning conditions were
reported at various cutting speeds and depths of cut. Parhad, Likhite, Bhatt, Peshwe evaluated the
tool life of TiAlN-coated tungsten carbide inserts, at a constant feed rate at two levels of depth of
cut (1, 2 mm) and three levels of speed when turning ADI-250. In the term of surface quality, the
combination of a depth of cut of 2 mm and feed rate of 0.1 mm/rev resulted in the best surface
quality when the cutting speeds is in the range 150–200 m/min. [49]
However, in total, past studies have not resulted in a comprehensive understanding of the
machinability of ADI grades. Although some studies have focused on were conducted in
particular grade of ADI, together these studies were comprehensive enough to establish robust
turning guideline for ADI grades. In addition, past ADI studies have not used contemporary
cutting tools. Only a few studies have evaluated common coated tungsten carbide inserts. Also,
even studies using coated tungsten carbide inserts were conducted without cutting fluids (dry
turning). Clearly information is lacking on the turning ADI grades using contemporary coated
carbide inserts and contemporary cutting fluids.
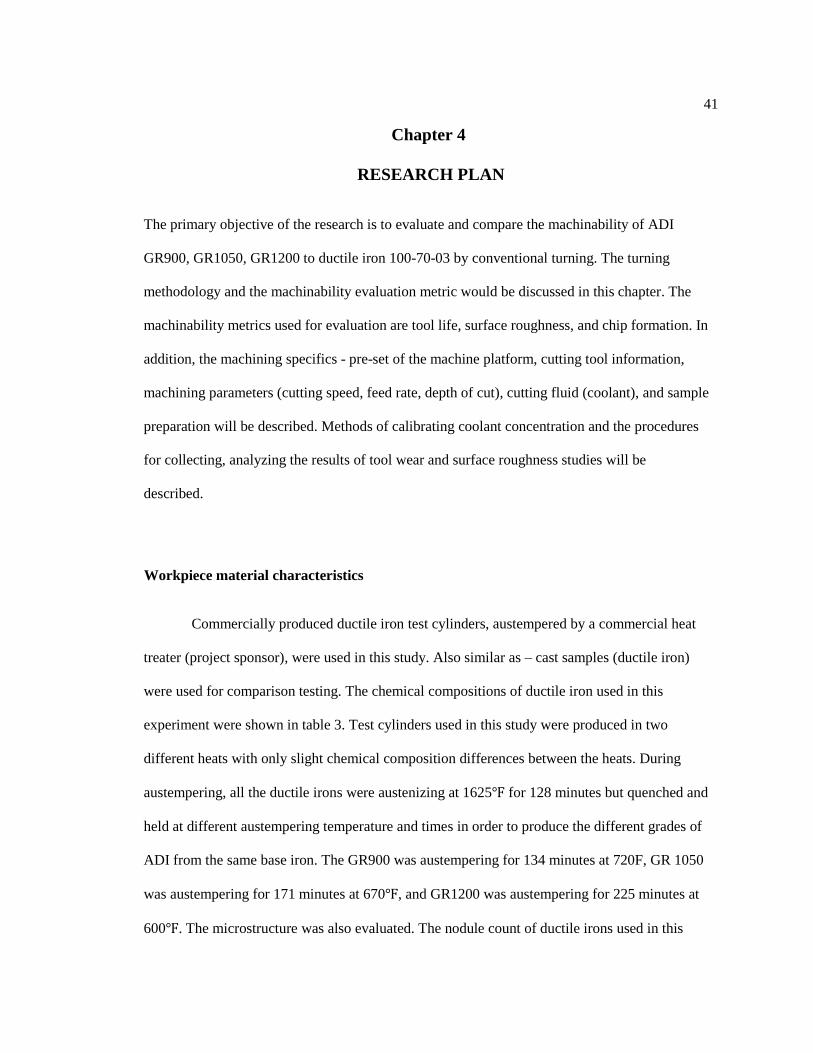
41
Chapter 4
RESEARCH PLAN
The primary objective of the research is to evaluate and compare the machinability of ADI
GR900, GR1050, GR1200 to ductile iron 100-70-03 by conventional turning. The turning
methodology and the machinability evaluation metric would be discussed in this chapter. The
machinability metrics used for evaluation are tool life, surface roughness, and chip formation. In
addition, the machining specifics - pre-set of the machine platform, cutting tool information,
machining parameters (cutting speed, feed rate, depth of cut), cutting fluid (coolant), and sample
preparation will be described. Methods of calibrating coolant concentration and the procedures
for collecting, analyzing the results of tool wear and surface roughness studies will be
described.
Workpiece material characteristics
Commercially produced ductile iron test cylinders, austempered by a commercial heat
treater (project sponsor), were used in this study. Also similar as – cast samples (ductile iron)
were used for comparison testing. The chemical compositions of ductile iron used in this
experiment were shown in table 3. Test cylinders used in this study were produced in two
different heats with only slight chemical composition differences between the heats. During
austempering, all the ductile irons were austenizing at 1625℉ for 128 minutes but quenched and
held at different austempering temperature and times in order to produce the different grades of
ADI from the same base iron. The GR900 was austempering for 134 minutes at 720F, GR 1050
was austempering for 171 minutes at 670℉, and GR1200 was austempering for 225 minutes at
600℉. The microstructure was also evaluated. The nodule count of ductile irons used in this

42
studies was 300 – 350 nodules mm−2 with a nodularity of 93%. The austenite content remaining
in the ADI microstructure after heat treatment was measured by X-ray diffraction (XRD). The
XRD was collected with a Scintag XRD-2000 θ/θ diffractometer with a copper target x-ray tube
from 70° to 105° 2θ, with a step size of 0.05°, and 30 second count time. The microstructure of
different grades of ADI is shown on Figure 17. The results of XRD analysis is shown in Table 4.
It demonstrates that the GR900 matrix is 40% austenite and 60% ferrite, the GR1050 matrix is
37% austenite and 63% ferrite, and the GR1200 matrix is 30% austenite and 70% ferrite – all
typical values.
Table 3: Chemical composition of ductile irons used in this study
Element Heat 1(%) Heat 2(%)
C 3.51 3.60
S 0.007 0.006
P 0.018 0.018
Si 2.34 2.32
Mn 0.46 0.44
Cr 0.06 0.06
Ni 0.03 0.03
Mo <0.01 <0.01
V <0.005 0.006
Al 0.011 0.011
Cu 0.76 0.72
Mg 0.033 0.036
Ti 0.011 0.011
Sb <0.005 <0.005
Ce 0.012 0.012
Sn <0.005 <0.005
Table 4: Ferrite and austenite volume fraction of each ADI grade after heat treated as
measured by X – ray diffraction

43
Sample *Ferrite
volume fraction 95% Confidence
*Austenite
volume fraction 95% Confidence
GR900 0.605 0.03 0.395 0.03
GR1050 0.630 0.03 0.370 0.03
GR1200 0.700 0.02 0.300 0.02
* Matrix volume fraction
Figure 17: The microstructure of each ADI grade
Hardness testing of different types of material was performed using the Brinell hardness
test with a 3000 kg load scale and a 10 mm steel ball indenter. The hardness measurement results
are shown in table 5. The result shows that the hardness increased from GR900 to GR1200 with
the 100 – 70 – 03 being the ductile iron being the softest material. By comparing the result of the
hardness measurement to the ASTM standard datas for ADI, the hardness of all grades of ADI
was within specification.

44
Table 5: Brinell hardness of each t material tested
GR900 GR1050 GR1200 DI
100-70-03
test 1 323 358 429 241
test 2 322 361 432 240
test 3 322 354 427 240
test 4 320 357 429 238
test 5 326 357 426 239
Average 322.6 357.4 428.6 239.6
ASTM
A897/A879M 269-341 302-375 341-444 220-320
Experimental platform
All experiments were conducted on the HAAS ST-20 CNC lathe with the maximum spindle
speed of 4000 rpm. Single point straight turning was conducted under the different cutting
parameters and configurations. The cutting tools used in the experiments - SECO CNMG
120408-M5 TK2001 (ISO – type K), tungsten carbide general cutting inserts coated with CVD Ti
(C, N) + Al2O3 coatings, with 0.3 mm land width, 5° land angle, and 0.8 mm nose radius, Figure
18. A new cutting tool edge was used for each single turning experiment. The tool holder holding
the cutting inserts (SECO DCLNR2525M12-M), Figure 19 resulted in a rake angle of -6°
orthogonal, 95° of cutting angle, inclination angle of -6°, side cutting angle of 5°, and end cutting
angle of 5°. [52]. The ADI workpiece was machined in the center of the workpiece. Before each
experiment started, the ADI workpieces were prior machined by facing and light turning in order
to remove the heat treated outer layer. The cutting parameters used to pre-turn the workpiece
were at a constant feed rate of 0.012 ipr, and a depth of cut of 0.06 inches (greater than the total
nose radius - 0.8mm). However different cutting speeds, based on the different grades of material
were used for pre-turning - 500 fpm for ADI GR900, GR1050, and ductile iron 100-70-03; and
250 fpm for ADI GR1200. In addition, actual surface finish is compared to the theoretical surface
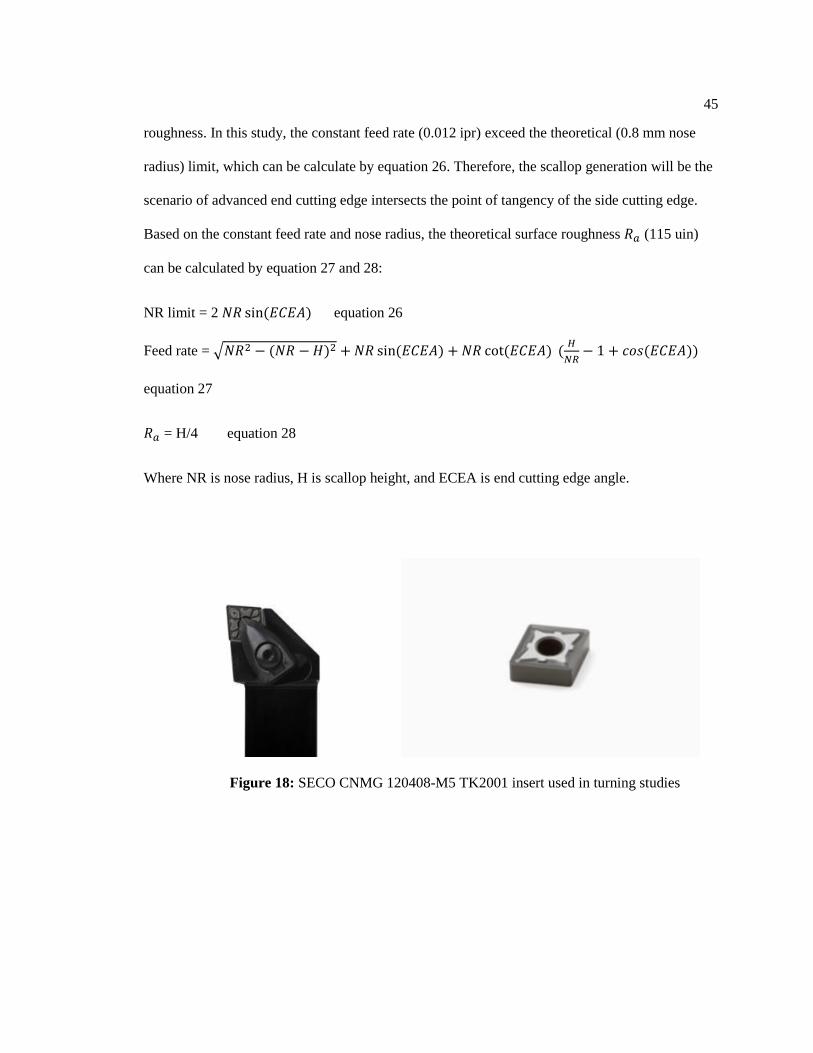
45
roughness. In this study, the constant feed rate (0.012 ipr) exceed the theoretical (0.8 mm nose
radius) limit, which can be calculate by equation 26. Therefore, the scallop generation will be the
scenario of advanced end cutting edge intersects the point of tangency of the side cutting edge.
Based on the constant feed rate and nose radius, the theoretical surface roughness 𝑅𝑎 (115 uin)
can be calculated by equation 27 and 28:
NR limit = 2 𝑁𝑅 sin(𝐸𝐶𝐸𝐴) equation 26
Feed rate = √𝑁𝑅2 − (𝑁𝑅 − 𝐻)2 + 𝑁𝑅 sin(𝐸𝐶𝐸𝐴) + 𝑁𝑅 cot(𝐸𝐶𝐸𝐴) (𝐻
𝑁𝑅− 1 + 𝑐𝑜𝑠(𝐸𝐶𝐸𝐴))
equation 27
𝑅𝑎 = H/4 equation 28
Where NR is nose radius, H is scallop height, and ECEA is end cutting edge angle.
Figure 18: SECO CNMG 120408-M5 TK2001 insert used in turning studies
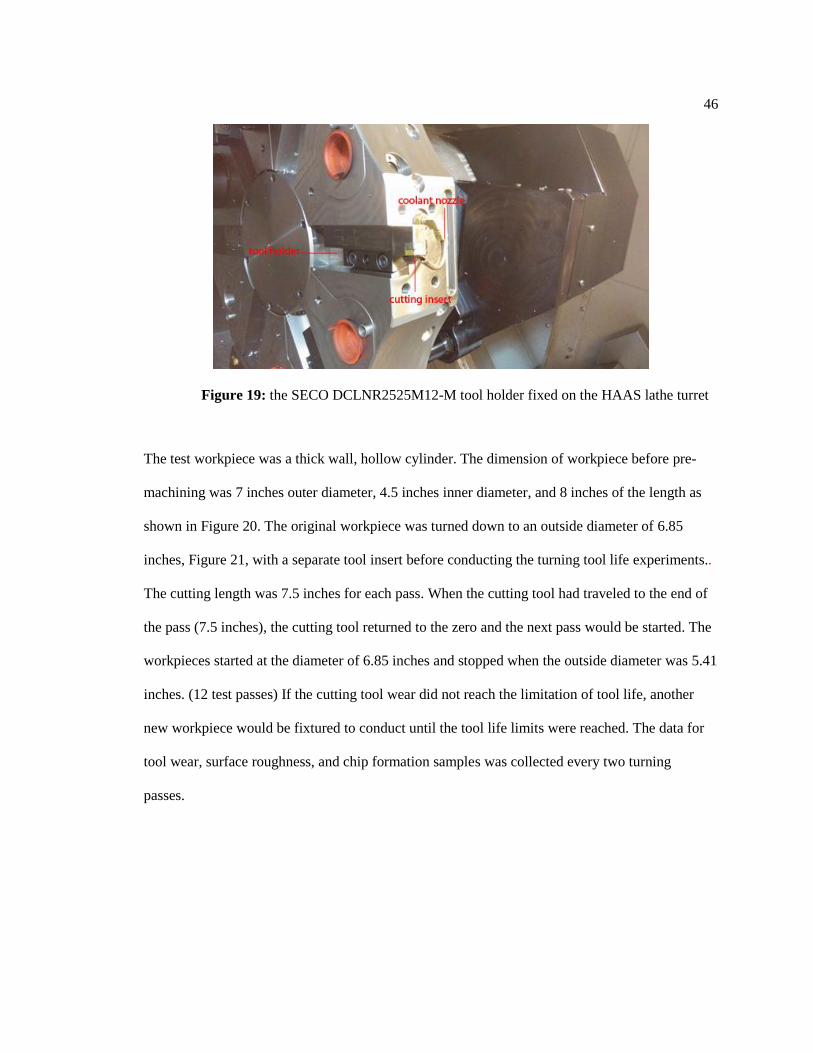
46
Figure 19: the SECO DCLNR2525M12-M tool holder fixed on the HAAS lathe turret
The test workpiece was a thick wall, hollow cylinder. The dimension of workpiece before pre-
machining was 7 inches outer diameter, 4.5 inches inner diameter, and 8 inches of the length as
shown in Figure 20. The original workpiece was turned down to an outside diameter of 6.85
inches, Figure 21, with a separate tool insert before conducting the turning tool life experiments..
The cutting length was 7.5 inches for each pass. When the cutting tool had traveled to the end of
the pass (7.5 inches), the cutting tool returned to the zero and the next pass would be started. The
workpieces started at the diameter of 6.85 inches and stopped when the outside diameter was 5.41
inches. (12 test passes) If the cutting tool wear did not reach the limitation of tool life, another
new workpiece would be fixtured to conduct until the tool life limits were reached. The data for
tool wear, surface roughness, and chip formation samples was collected every two turning
passes.
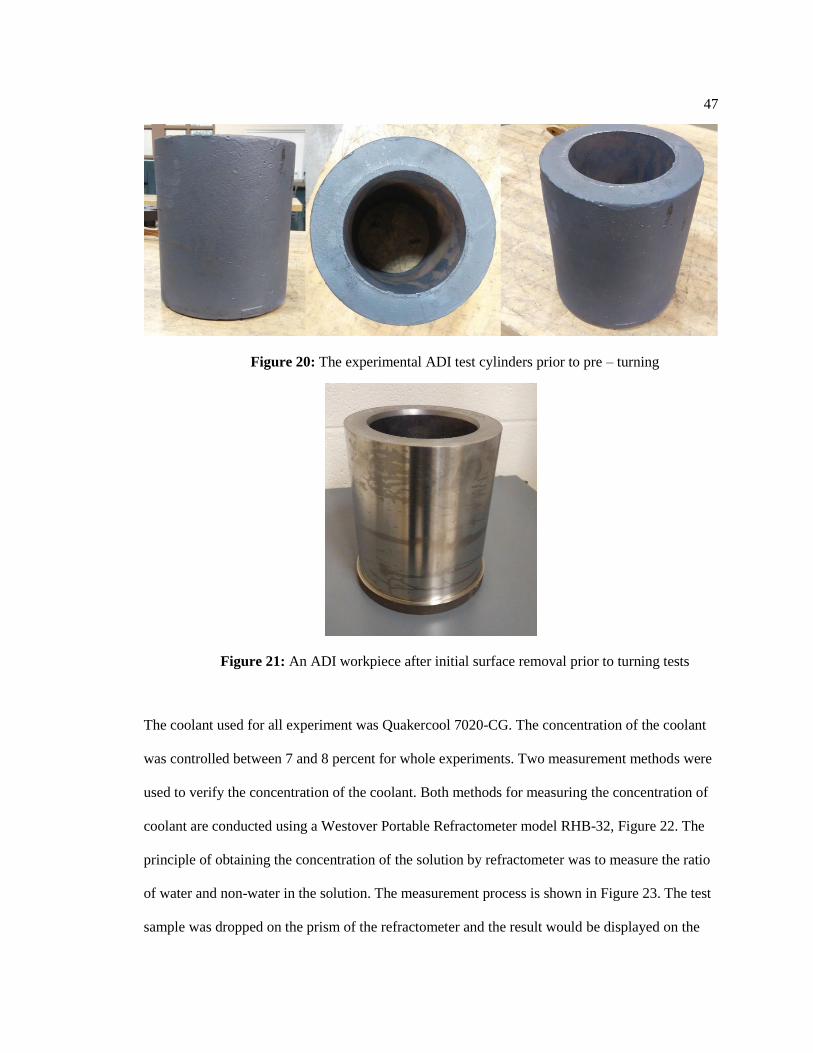
47
Figure 20: The experimental ADI test cylinders prior to pre – turning
Figure 21: An ADI workpiece after initial surface removal prior to turning tests
The coolant used for all experiment was Quakercool 7020-CG. The concentration of the coolant
was controlled between 7 and 8 percent for whole experiments. Two measurement methods were
used to verify the concentration of the coolant. Both methods for measuring the concentration of
coolant are conducted using a Westover Portable Refractometer model RHB-32, Figure 22. The
principle of obtaining the concentration of the solution by refractometer was to measure the ratio
of water and non-water in the solution. The measurement process is shown in Figure 23. The test
sample was dropped on the prism of the refractometer and the result would be displayed on the
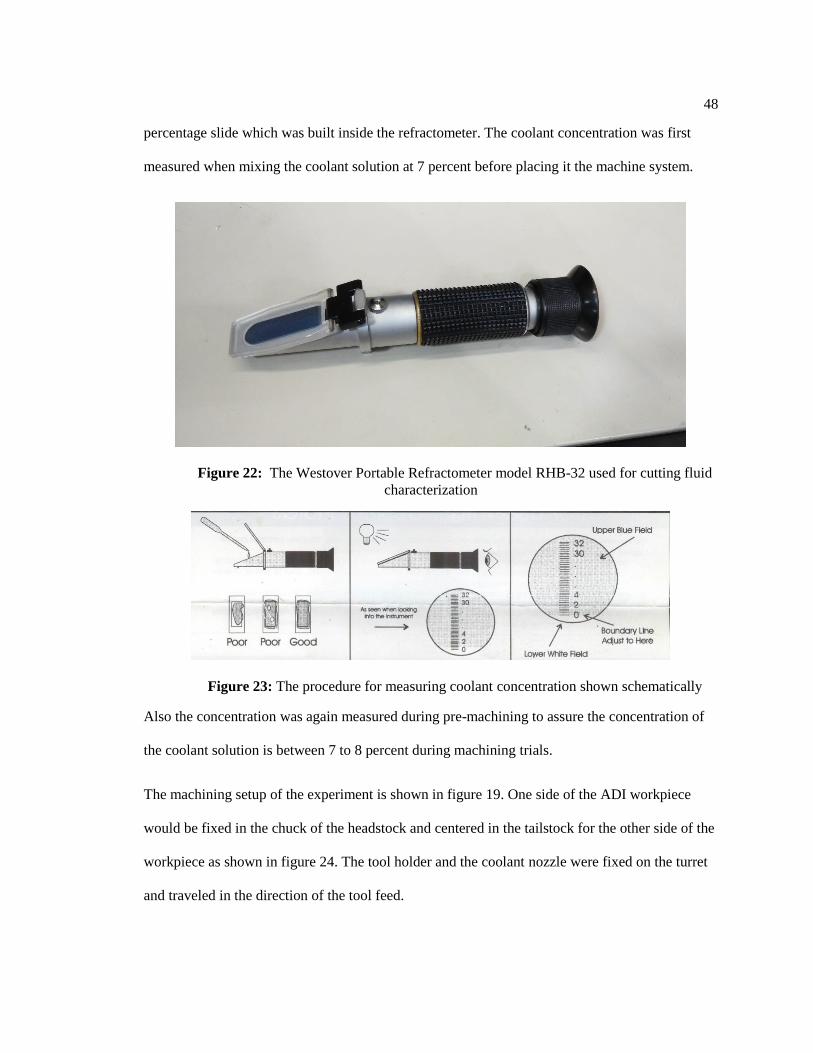
48
percentage slide which was built inside the refractometer. The coolant concentration was first
measured when mixing the coolant solution at 7 percent before placing it the machine system.
Figure 22: The Westover Portable Refractometer model RHB-32 used for cutting fluid
characterization
Figure 23: The procedure for measuring coolant concentration shown schematically
Also the concentration was again measured during pre-machining to assure the concentration of
the coolant solution is between 7 to 8 percent during machining trials.
The machining setup of the experiment is shown in figure 19. One side of the ADI workpiece
would be fixed in the chuck of the headstock and centered in the tailstock for the other side of the
workpiece as shown in figure 24. The tool holder and the coolant nozzle were fixed on the turret
and traveled in the direction of the tool feed.

49
Figure 24: Test cylinder placement for turning studies
Machinability metrics
The machinability of GR900, GR1050, GR1200, and ductile iron 100-70-03 was evaluated by
measuring tool life, surface roughness, and chip formation during straight turning experiments.
Three speeds were investigated of each grade of the ADI and ductile iron with three replications
of every condition. In addition, one extra cutting speed experiment for GR900 and GR1050, and
two for GR1200 were conducted after preliminary data analysis in order to build more reliable
turning models.
The end of tool life using was defined as when the maximum width of flank wear land (𝑉𝐵𝐵max)
was reached 0.6mm or when the uniform width of flank wear land VB reached 0.3mm. [8] The
tool wear measurements were taken after each tool pass was completed (7.5 inches) or when the
tool reaching a limitation condition as indicated by sound change or spark generation during
machining. The cutting tool would be taken off the tool holder after the end of the pass and
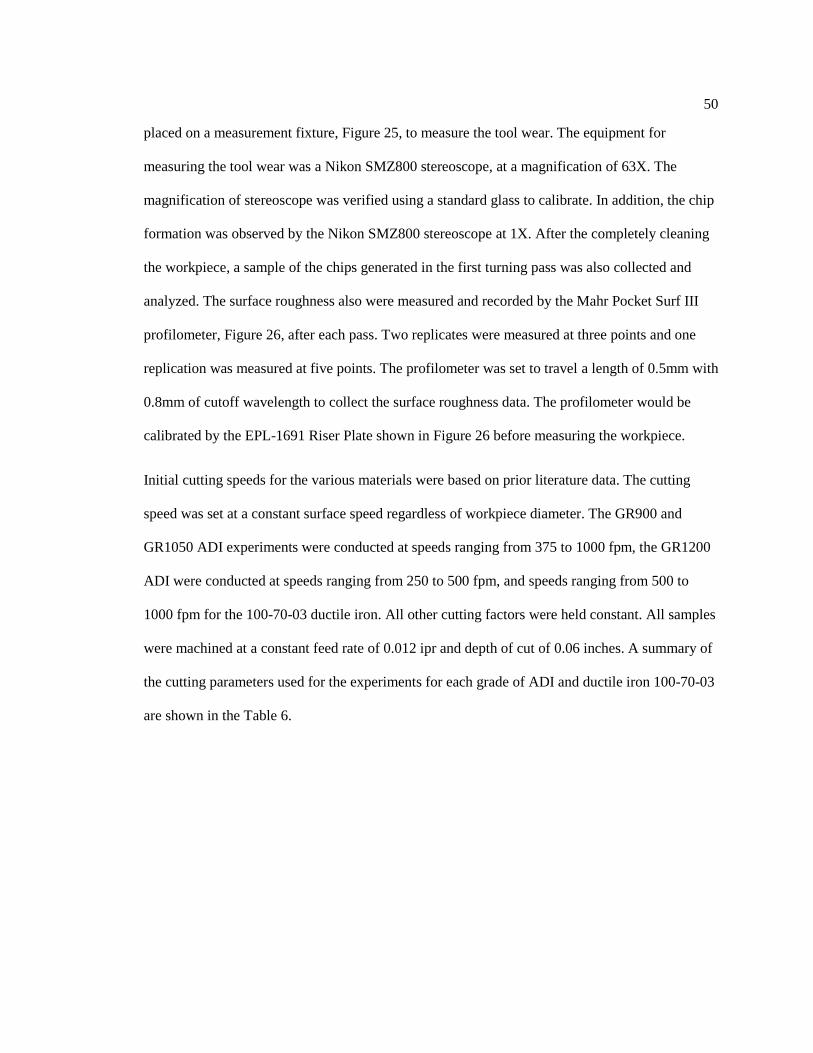
50
placed on a measurement fixture, Figure 25, to measure the tool wear. The equipment for
measuring the tool wear was a Nikon SMZ800 stereoscope, at a magnification of 63X. The
magnification of stereoscope was verified using a standard glass to calibrate. In addition, the chip
formation was observed by the Nikon SMZ800 stereoscope at 1X. After the completely cleaning
the workpiece, a sample of the chips generated in the first turning pass was also collected and
analyzed. The surface roughness also were measured and recorded by the Mahr Pocket Surf III
profilometer, Figure 26, after each pass. Two replicates were measured at three points and one
replication was measured at five points. The profilometer was set to travel a length of 0.5mm with
0.8mm of cutoff wavelength to collect the surface roughness data. The profilometer would be
calibrated by the EPL-1691 Riser Plate shown in Figure 26 before measuring the workpiece.
Initial cutting speeds for the various materials were based on prior literature data. The cutting
speed was set at a constant surface speed regardless of workpiece diameter. The GR900 and
GR1050 ADI experiments were conducted at speeds ranging from 375 to 1000 fpm, the GR1200
ADI were conducted at speeds ranging from 250 to 500 fpm, and speeds ranging from 500 to
1000 fpm for the 100-70-03 ductile iron. All other cutting factors were held constant. All samples
were machined at a constant feed rate of 0.012 ipr and depth of cut of 0.06 inches. A summary of
the cutting parameters used for the experiments for each grade of ADI and ductile iron 100-70-03
are shown in the Table 6.
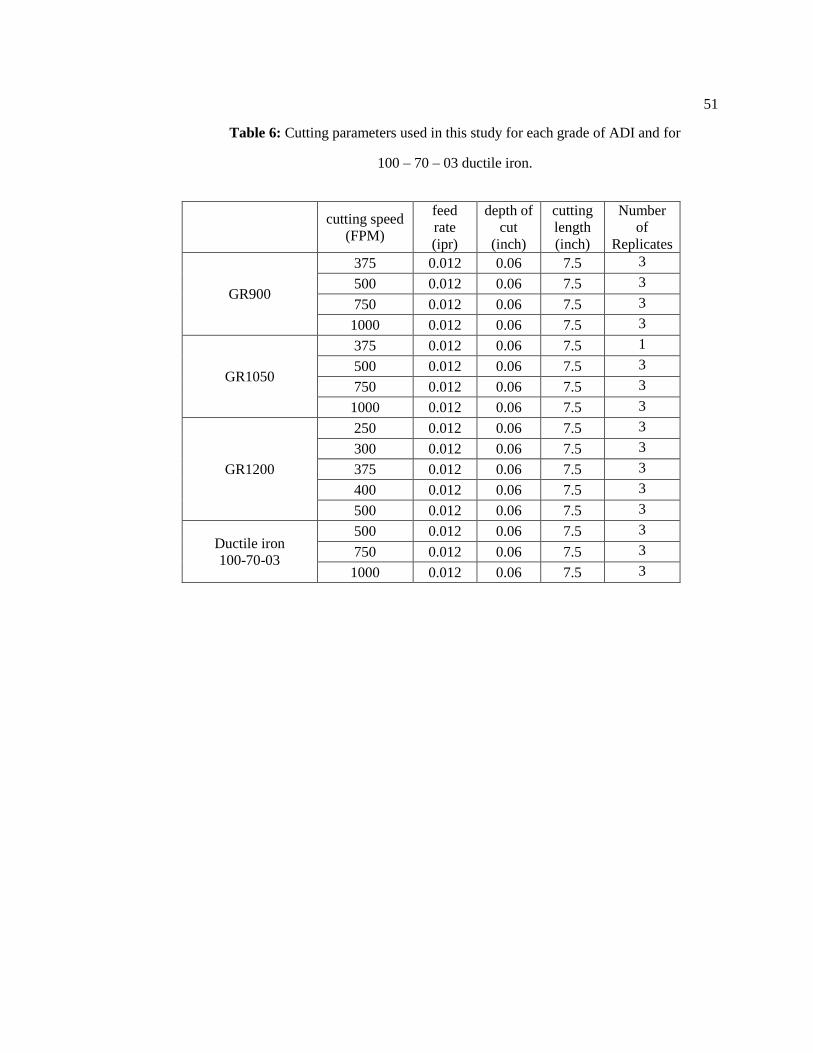
51
Table 6: Cutting parameters used in this study for each grade of ADI and for
100 – 70 – 03 ductile iron.
cutting speed
(FPM)
feed
rate
(ipr)
depth of
cut
(inch)
cutting
length
(inch)
Number
of
Replicates
GR900
375 0.012 0.06 7.5 3
500 0.012 0.06 7.5 3
750 0.012 0.06 7.5 3
1000 0.012 0.06 7.5 3
GR1050
375 0.012 0.06 7.5 1
500 0.012 0.06 7.5 3
750 0.012 0.06 7.5 3
1000 0.012 0.06 7.5 3
GR1200
250 0.012 0.06 7.5 3
300 0.012 0.06 7.5 3
375 0.012 0.06 7.5 3
400 0.012 0.06 7.5 3
500 0.012 0.06 7.5 3
Ductile iron
100-70-03
500 0.012 0.06 7.5 3
750 0.012 0.06 7.5 3
1000 0.012 0.06 7.5 3
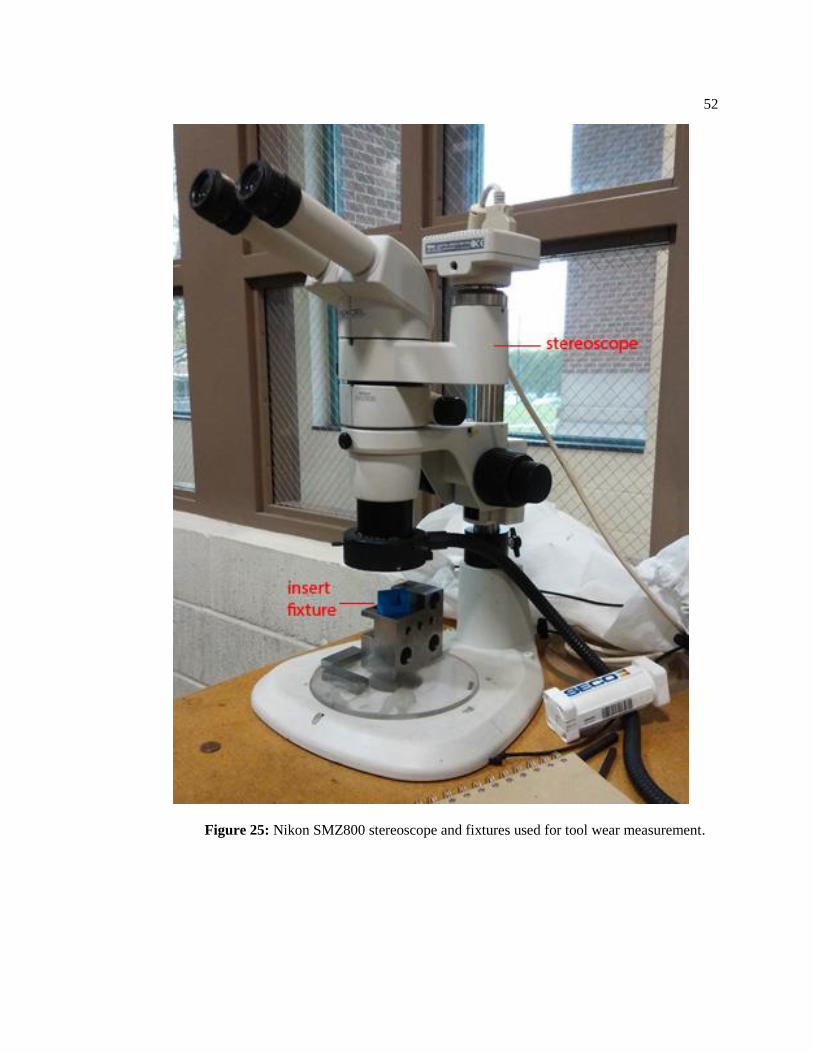
52
Figure 25: Nikon SMZ800 stereoscope and fixtures used for tool wear measurement.
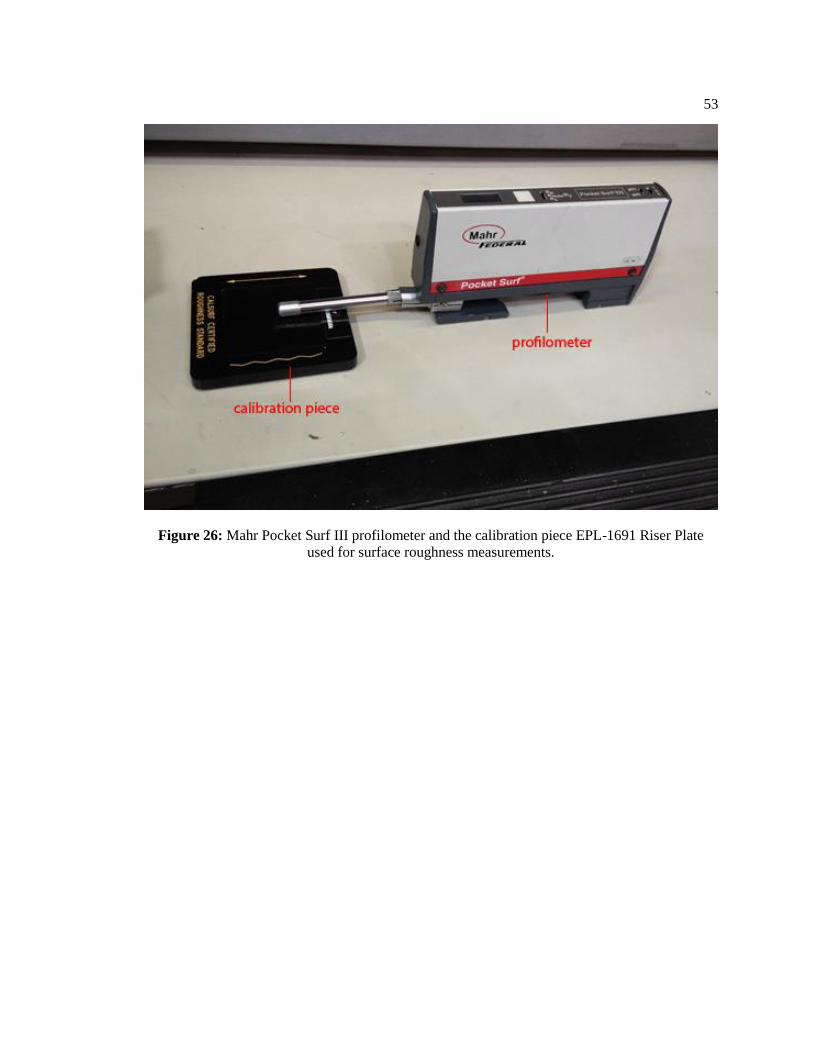
53
Figure 26: Mahr Pocket Surf III profilometer and the calibration piece EPL-1691 Riser Plate
used for surface roughness measurements.

54
Chapter 5
RESULTS
The results of the experiment, machinability evaluations of ADI and ductile iron, are presented in
three parts. The first part evaluates chip formation from all grades of ADI and the 100 – 70 – 03
ductile iron during turning. The second part discusses the surface roughness analysis for each
experiment for all material types. Lastly, the tool life under the different cutting conditions for all
materials is presented.
Chip formation
Representative chips produced from turning experiments are shown in the Table 7. The results
show the effect of different turning speeds from 250 fpm to 1000 fpm on the chip formation for
all materials studied. In general, the chips generated from all grades of ADI work and the 100 –
70 – 03 ductile iron at all speeds are short segmented. Cutting speed had little or no influence on
chip morphology. The length and shape of chips of all grades of ADI and ductile iron 100-70-03
at all cutting speeds was similar with classic c-shaped or connected c-shaped chips.
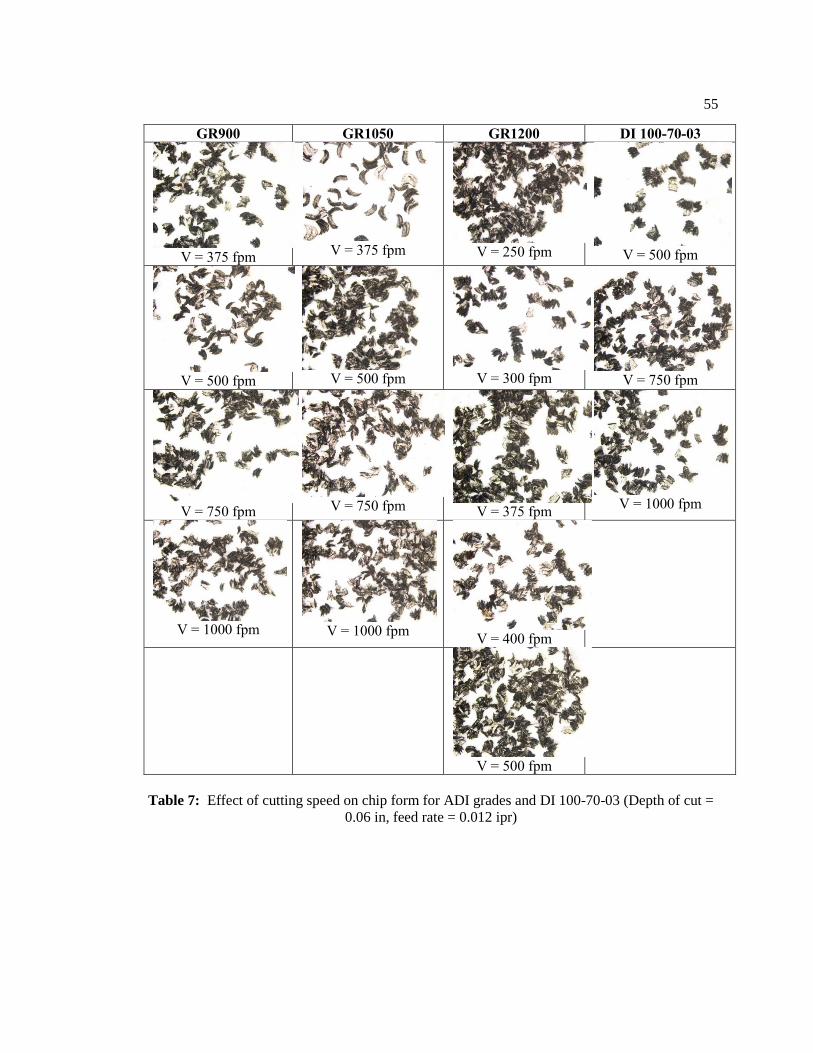
55
GR900 GR1050 GR1200 DI 100-70-03
V = 375 fpm
V = 375 fpm
V = 250 fpm
V = 500 fpm
V = 500 fpm
V = 500 fpm
V = 300 fpm
V = 750 fpm
V = 750 fpm
V = 750 fpm
V = 375 fpm
V = 1000 fpm
V = 1000 fpm
V = 1000 fpm
V = 400 fpm
V = 500 fpm
Table 7: Effect of cutting speed on chip form for ADI grades and DI 100-70-03 (Depth of cut =
0.06 in, feed rate = 0.012 ipr)
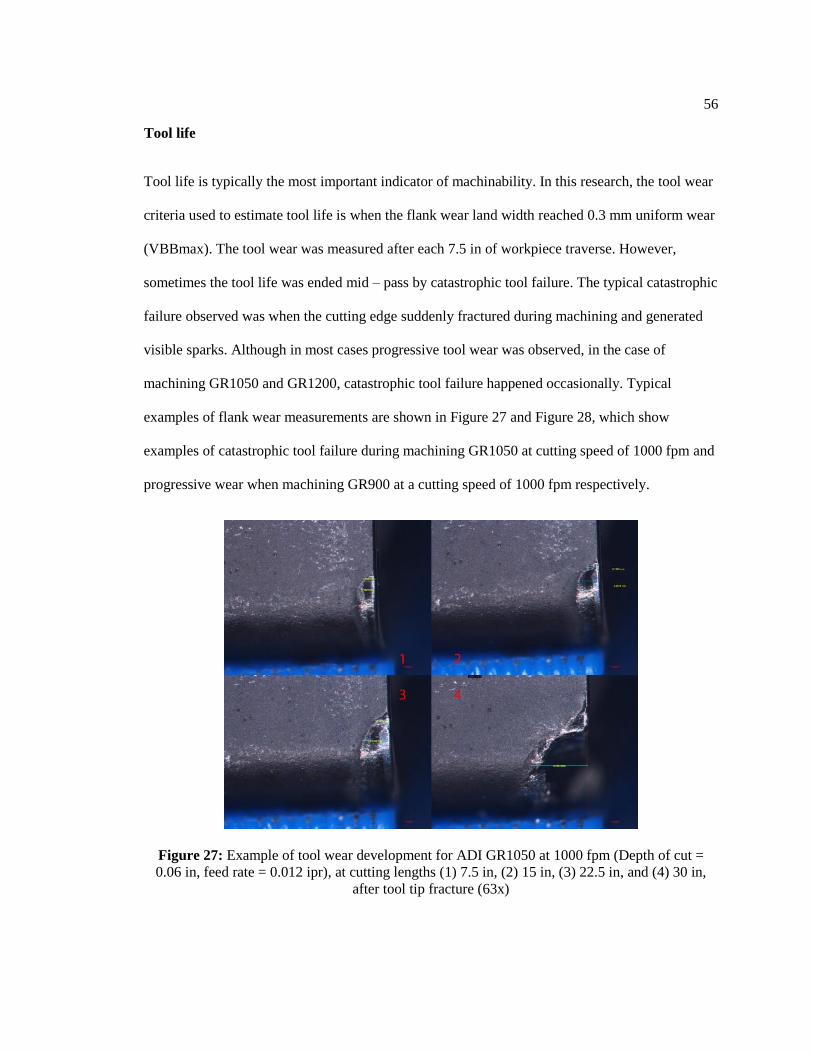
56
Tool life
Tool life is typically the most important indicator of machinability. In this research, the tool wear
criteria used to estimate tool life is when the flank wear land width reached 0.3 mm uniform wear
(VBBmax). The tool wear was measured after each 7.5 in of workpiece traverse. However,
sometimes the tool life was ended mid – pass by catastrophic tool failure. The typical catastrophic
failure observed was when the cutting edge suddenly fractured during machining and generated
visible sparks. Although in most cases progressive tool wear was observed, in the case of
machining GR1050 and GR1200, catastrophic tool failure happened occasionally. Typical
examples of flank wear measurements are shown in Figure 27 and Figure 28, which show
examples of catastrophic tool failure during machining GR1050 at cutting speed of 1000 fpm and
progressive wear when machining GR900 at a cutting speed of 1000 fpm respectively.
Figure 27: Example of tool wear development for ADI GR1050 at 1000 fpm (Depth of cut =
0.06 in, feed rate = 0.012 ipr), at cutting lengths (1) 7.5 in, (2) 15 in, (3) 22.5 in, and (4) 30 in,
after tool tip fracture (63x)

57
Figure 28: Example of tool wear development for ADI GR1050 at 500 fpm (Depth of cut = 0.06
in, feed rate = 0.012 ipr), at cutting lengths (1) 7.5 in, (2) 15 in, (3) 22.5 in, (4) 30 in, (5) 37.5 in,
(6) 45 in, (7) 52.5 in, (8) 60 in, (9) 67.5 in, and (10) 75 in, (63X)
As expected, the result of experiments show that the cutting speed has a very significant influence
on tool wear rates for every grade of ADI and for DI 100-70-03. The higher the cutting speed, the
faster the tool wear rate. From the tool wear data at each cutting condition, tool wear progression
for each grade of ADI and DI 100-70-03 can be evaluated by fitted cubic polynomial as shown in

58
Figures 29 - 32. In these figures, VBBmax is shown as the function of cutting time. The fitted
trend line polynomial equation and the R2 values for each grade of ADI and DI 100-70-03 are
presented in Table 8. Since the R2 values for each fitted curve are high, the fitted wear trend lines
of different cutting speed (375-1000 fpm for GR900 and GR1050, 250-500 for GR1200, and 500-
1000 for DI 100-70-03) accurately describe tool wear progression.
Table 8: Tool wear progression polynomial fit equations and R2 values for different the grades of
ADI and DI 100-70-03
Cutting
speed
[fpm]
Cubic polynomial fit equations R2
900 375 ln V = 8E-05(ln T)3 - 0.0035(ln T)2 + 0.048(ln T) 0.9939
900 500 ln V = 5E-05(ln T)3 - 0.0026(ln T)2 + 0.0452(ln T) 0.9387
900 750 ln V = 0.0016(ln T)3 - 0.0221 ln T)2 + 0.1109(ln T) 0.9876
900 1000 ln V = 0.0085(ln T)3 - 0.0596 ln T)2 + 0.1807(ln T) 0.9945
1050 375 ln V = 9E-05(ln T)3 - 0.0037 ln T)2 + 0.05(ln T) 0.9691
1050 500 ln V = 0.0001(ln T)3 - 0.0043 ln T)2 + 0.0509(ln T) 0.9262
1050 750 ln V = 0.0084(ln T)3 - 0.0691 ln T)2 + 0.201(ln T) 0.9428
1050 1000 ln V = -0.0031(ln T)2 + 0.1314(ln T) 0.9852
1200 250 ln V = 3E-06(ln T)3 - 0.0004(ln T)2 + 0.0161(ln T) 0.8399
1200 300 ln V = 4E-05(ln T)3 - 0.0023(ln T)2 + 0.041(ln T) 0.8110
1200 375 ln V = 0.0003(ln T)3 - 0.0082(ln T)2 + 0.0703(ln T) 0.9553
1200 400 ln V = -8E-05(ln T)3 + 0.0004(ln T)2 + 0.0347(ln T) 0.6828
1200 500 ln V = 0.0019(ln T)3 - 0.0245(ln T)2 + 0.1141(ln T) 0.9786
DI 100-
70-03 500 ln V = 2E-06(ln T)3 - 0.0003(ln T)2 + 0.0137(ln T) 0.7268
DI 100-
70-03 750 ln V = 0.0003(ln T)3 - 0.0072(ln T)2 + 0.0652(ln T) 0.8379
DI 100-
70-03 1000 ln V = 0.0036(ln T)3 - 0.0368(ln T)2 + 0.1364(ln T) 0.9815
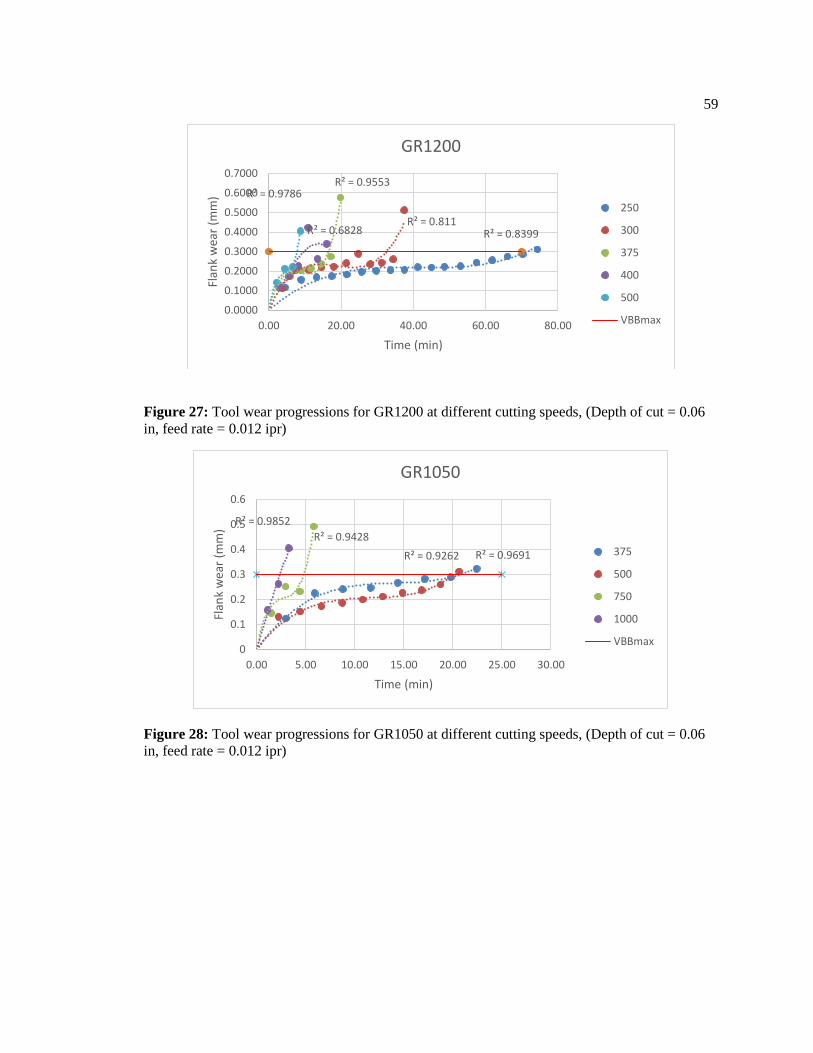
59
Figure 27: Tool wear progressions for GR1200 at different cutting speeds, (Depth of cut = 0.06
in, feed rate = 0.012 ipr)
Figure 28: Tool wear progressions for GR1050 at different cutting speeds, (Depth of cut = 0.06
in, feed rate = 0.012 ipr)
R² = 0.8399R² = 0.811
R² = 0.9553
R² = 0.6828
R² = 0.9786
0.0000
0.1000
0.2000
0.3000
0.4000
0.5000
0.6000
0.7000
0.00 20.00 40.00 60.00 80.00
Flan
k w
ear
(mm
)
Time (min)
GR1200
250
300
375
400
500
VBBmax
R² = 0.9691R² = 0.9262
R² = 0.9428
R² = 0.9852
0
0.1
0.2
0.3
0.4
0.5
0.6
0.00 5.00 10.00 15.00 20.00 25.00 30.00
Flan
k w
ear
(mm
)
Time (min)
GR1050
375
500
750
1000
VBBmax

60
Figure 29: Tool wear progressions for GR900 at different cutting speeds, (Depth of cut = 0.06 in,
feed rate = 0.012 ipr)
Figure 30: Tool wear progressions for DI 100-70-03 at different cutting speeds, (Depth of cut =
0.06 in, feed rate = 0.012 ipr)
R² = 0.9387
R² = 0.9939
R² = 0.9876R² = 0.9945
0.0000
0.0500
0.1000
0.1500
0.2000
0.2500
0.3000
0.3500
0.4000
0.00 5.00 10.00 15.00 20.00 25.00 30.00
Flan
k w
ear
(mm
)
Time (min)
GR900
500
375
750
1000
VBBmax
R² = 0.7268
R² = 0.8379
R² = 0.9815
0.0000
0.0500
0.1000
0.1500
0.2000
0.2500
0.3000
0.3500
0.00 20.00 40.00 60.00 80.00 100.00
Flan
k w
ear
(mm
)
Time (min)
DI
500
750
1000
VBBmax

61
Figure 29 displays tool wear progression for GR1200 at cutting speeds ranging from 250 to 500
fpm. In Table 8, the high R2 values when machining GR1200 at each cutting speed indicate that
the wear progression curve and cubic polynomial equations are accurate. Figure 29 shows that
increasing cutting speeds progressively shorten the tool life. In terms of tool wear progressions,
except for 400 fpm, all the wear curves show initial rapid tool wear followed by a gradual linear
wear profile until tool wear reaches the final limit of tool life. At a cutting speed at 400 fpm, the
tool wear did not steadily reach the limitation of the tool life before catastrophic tool failure
occurred in one of the testing trials. Therefore, the lowest cutting speed (250 fpm) is considered
as the most cost-effective speed of machining GR1200 ADI. The tool wear progression curve for
GR1050 ADI at cutting speeds ranging from 375 to 1000 fpm is shown in Figure 30. Similar
results were observed for ADI GR1200. The high R2 values for machining GR1050 in Table 8
indicate that the fitted tool wear progression curves are accurate. Figure 30 shows that tool life is
shorter when turning at high cutting speed (750, 1000 fpm) than at low cutting speeds (375, 500
fpm). The wear progression curves at each cutting speed all show rapid increases in tool wear
initially followed by a linear wear rate until the limits of tool life are reached. Catastrophic tool
failure often took place when the cutting speed was high (750 fpm) during the turning of GR1050
ADI. However, the measured tool wear for ADI GR1050 was significantly less than for GR1200.
The tool life at a cutting speed at 375 and 500 fpm was approximate the same in terms of cutting
time, but the tool life at a cutting speed at 500 fpm was higher than at 375 fpm if measured by
material removal rates.
Figure 31 shows VBBmax as the function of effective cutting time when turning GR900 ADI at
cutting speeds ranging from 375 to 1000 fpm. The results are very similar to the results for
GR1050 in general. The correlation coefficient for each experiment were also high for GR900
ADI. Also to GR1050, the wear progression curves increased rapidly initially and then exhibited
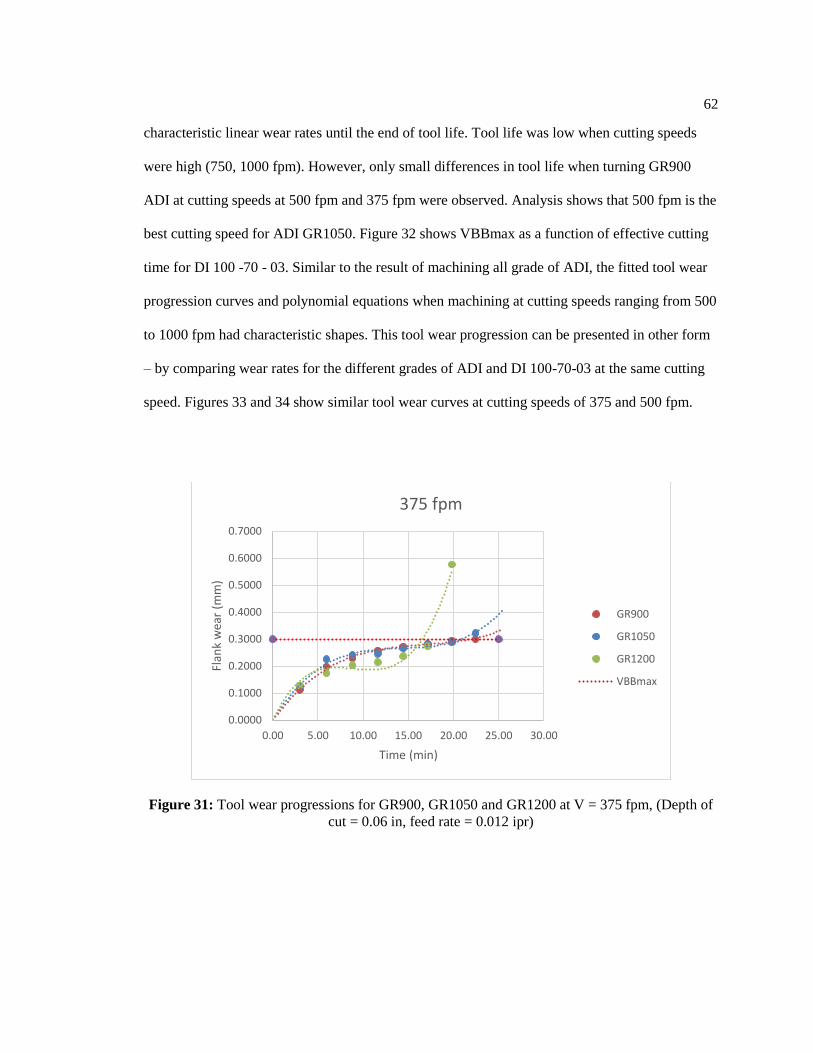
62
characteristic linear wear rates until the end of tool life. Tool life was low when cutting speeds
were high (750, 1000 fpm). However, only small differences in tool life when turning GR900
ADI at cutting speeds at 500 fpm and 375 fpm were observed. Analysis shows that 500 fpm is the
best cutting speed for ADI GR1050. Figure 32 shows VBBmax as a function of effective cutting
time for DI 100 -70 - 03. Similar to the result of machining all grade of ADI, the fitted tool wear
progression curves and polynomial equations when machining at cutting speeds ranging from 500
to 1000 fpm had characteristic shapes. This tool wear progression can be presented in other form
– by comparing wear rates for the different grades of ADI and DI 100-70-03 at the same cutting
speed. Figures 33 and 34 show similar tool wear curves at cutting speeds of 375 and 500 fpm.
Figure 31: Tool wear progressions for GR900, GR1050 and GR1200 at V = 375 fpm, (Depth of
cut = 0.06 in, feed rate = 0.012 ipr)
0.0000
0.1000
0.2000
0.3000
0.4000
0.5000
0.6000
0.7000
0.00 5.00 10.00 15.00 20.00 25.00 30.00
Flan
k w
ear
(mm
)
Time (min)
375 fpm
GR900
GR1050
GR1200
VBBmax

63
Figure 32: Tool wear progressions for GR900, GR1050 and GR1200 at V = 500 fpm, (Depth of
cut = 0.06 in, feed rate = 0.012 ipr)
Tool life predictions can be established based on wear progressions to compute the time or length
of machining until the limiting tool life criteria (0.3 mm uniform flank wear) has been reached,
Table 8. Based on Table 8, the tool life in terms of cutting time and cutting length are shown in
Figure 35 and Figure 36 respectively. Tool life for GR1200 ADI ranged from 64.6 to 6.6 minutes
with tool life decreasing dramatically as cutting speed increased from 250 to 375 fpm, followed
by linear decrease in tool life of higher cutting speeds (375-500 fpm). The tool life of GR1050
ADI gradually decreased from 22.4 to 5.33 minutes when the cutting speed was increased. For
GR900, the tool life increased slightly as the cutting speed increased from 375 to 500 fpm and
then gradually decreased to 5.1 minutes as cutting speed increased.
0.0000
0.0500
0.1000
0.1500
0.2000
0.2500
0.3000
0.3500
0.4000
0.4500
0.5000
0.00 5.00 10.00 15.00 20.00 25.00 30.00
Flan
k w
ear
(mm
)
Time (min)
500 fpm
GR900
GR1050
GR1200
VBBmax
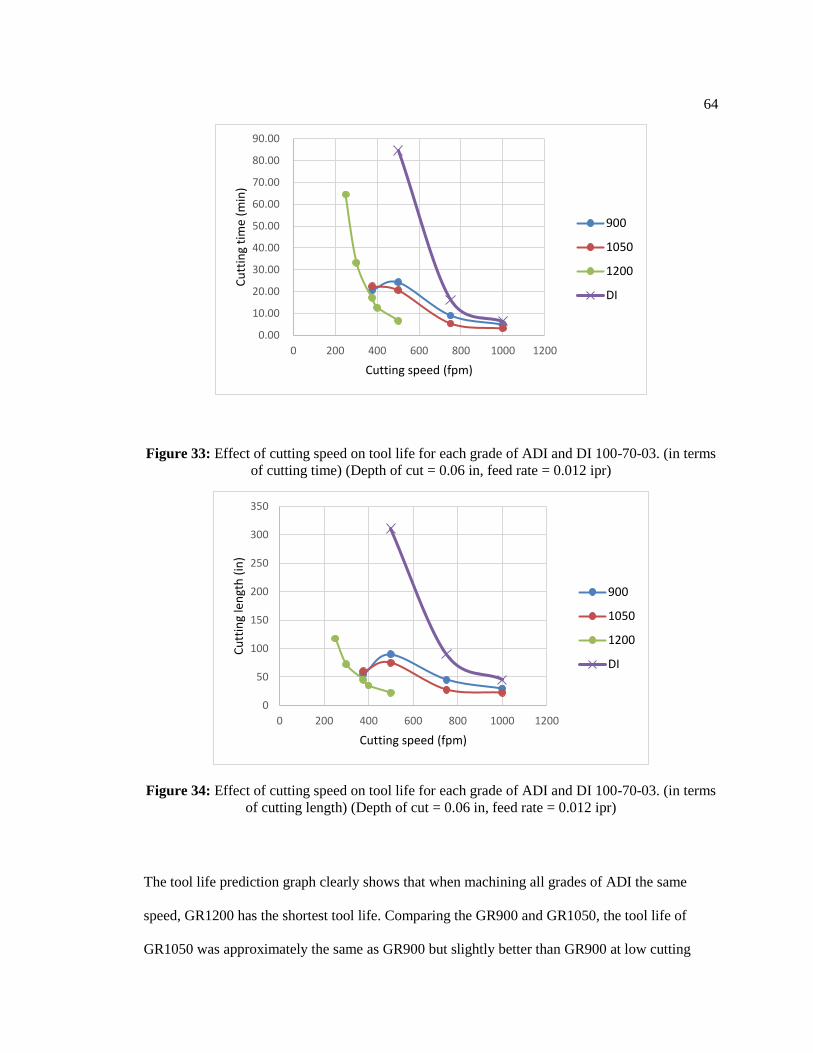
64
Figure 33: Effect of cutting speed on tool life for each grade of ADI and DI 100-70-03. (in terms
of cutting time) (Depth of cut = 0.06 in, feed rate = 0.012 ipr)
Figure 34: Effect of cutting speed on tool life for each grade of ADI and DI 100-70-03. (in terms
of cutting length) (Depth of cut = 0.06 in, feed rate = 0.012 ipr)
The tool life prediction graph clearly shows that when machining all grades of ADI the same
speed, GR1200 has the shortest tool life. Comparing the GR900 and GR1050, the tool life of
GR1050 was approximately the same as GR900 but slightly better than GR900 at low cutting
0.00
10.00
20.00
30.00
40.00
50.00
60.00
70.00
80.00
90.00
0 200 400 600 800 1000 1200
Cu
ttin
g ti
me
(min
)
Cutting speed (fpm)
900
1050
1200
DI
0
50
100
150
200
250
300
350
0 200 400 600 800 1000 1200
Cu
ttin
g le
ngt
h (
in)
Cutting speed (fpm)
900
1050
1200
DI

65
speeds. But when the cutting speed was increased, the GR900 exhibited better tool life than
GR1050.
Other method for estimating tool life is to calculate the total cutting length. (at constant depth of
cut) The tool life of GR1200 ranged from 22.5 to 117.5 in, as cutting speed decreased. However,
for GR900 and GR1050, cutting length increased in the beginning and followed by linear life.
Comparable turning data is shown for as – cast DI 100-70-03 in Table 8 and Figure 32. In terms
of cutting length, the tool life ranged from 311.3 to 45 in when the cutting speed was increased.
As expected, the tool life when machining DI 100-70-03 is much greater than for any grade of
ADI at any cutting speed.
The tool life prediction equations for each grade of ADI were developed using the Taylor
tool life equation. The relationship between cutting speed and tool life, in terms of time, was
used to build the equations. The constant n and C in the Taylor equation for each grade of
ADI were determined from the tool life data. The relationship between tool life and cutting
speed was plotted on a ln – ln graph, as shown in Figure 37. The n value was estimated from
the slope and the C value was determined from Y-intercept of the linear fitted line of Figure
38. The developed tool life equations for GR 900, GR1050, and GR1200 are presented
below.
T𝐺𝑅900 = 1.4 ∗ 106 ∗ V−1/0.55 , R² = 0.871 (equation 26)
T𝐺𝑅1050 = 2.5 ∗ 107 ∗ V−1/0.434 , R² = 0.937 (equation 27)
T𝐺𝑅1200 = 5.2 ∗ 109 ∗ V−1/0.303 , R² = 0.997 (equation 28)
Where V is measured in rpm and T is measured in minutes.

66
Figure 35: Ln-Ln tool life plot for developing the Taylor tool life equation
Surface roughness
The results of surface roughness of each grade for ADI and DI 100-70-03 based on cutting length
at different cutting speeds is shown in Figures 38 - 41. The effect of cutting speed on surface
roughness for each grade of ADI and DI 100-70-03 are shown in Table 9 and Figure 42.
The average surface roughness of GR1200 was slightly different than GR1050 and GR900. The
average surface roughness of GR1200 ranged from 113 to 62 uin as cutting speed increased. The
surface finish dropped from 113 to 110 uin, for the speed range of 250-300 fpms, and then
significantly decreased to 62 uin at low cutting speeds. (300-375 fpm) And as cutting speed
increased, the surface roughness of GR1050 and GR900 materials decreased at low speeds (375-
500 fpm) followed by only slightly linear decrease in surface roughness at high cutting speeds
(500-1000 fpm). The surface roughness of GR 1050, GR900, and DI 100-70-03 ranged from 106
ln V = -0.550 (ln T) + 7.798GR900
ln V = -0.434 (ln T) + 7.395GR1050
ln V = -0.303 (ln T) + 6.777GR1200
5.00
5.50
6.00
6.50
7.00
7.50
0.00 1.00 2.00 3.00 4.00 5.00
Cu
ttin
g sp
eed
(rp
m)
(ln
V)
Tool life (min) (ln T)
GR900
GR1050
GR1200

67
to 61 uin, 105 to 50 uin, and 93 to 59 uin respectively as cutting speed increased. The surface
finish of DI 100 – 70 – 03 also decreased as cutting speed increased.
In Figures 38 - 41, the surface roughness is displayed in terms of cutting length. The surface
finish for all grades of ADI gradually decreased at high cutting speeds but gradually increased at
low cutting speeds except for GR1200 at a cutting speed of 300 fpm. The surface roughness of
the GR1200 increased at the beginning and then decreased until the tool broke.
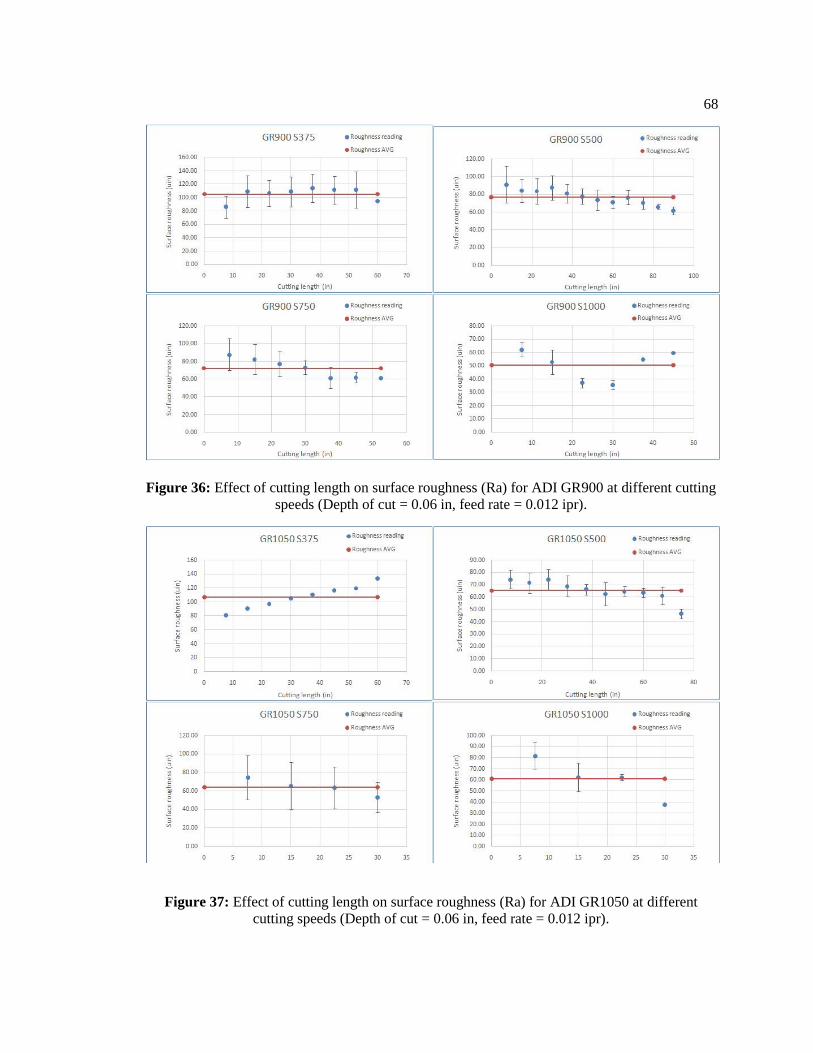
68
Figure 36: Effect of cutting length on surface roughness (Ra) for ADI GR900 at different cutting
speeds (Depth of cut = 0.06 in, feed rate = 0.012 ipr).
Figure 37: Effect of cutting length on surface roughness (Ra) for ADI GR1050 at different
cutting speeds (Depth of cut = 0.06 in, feed rate = 0.012 ipr).
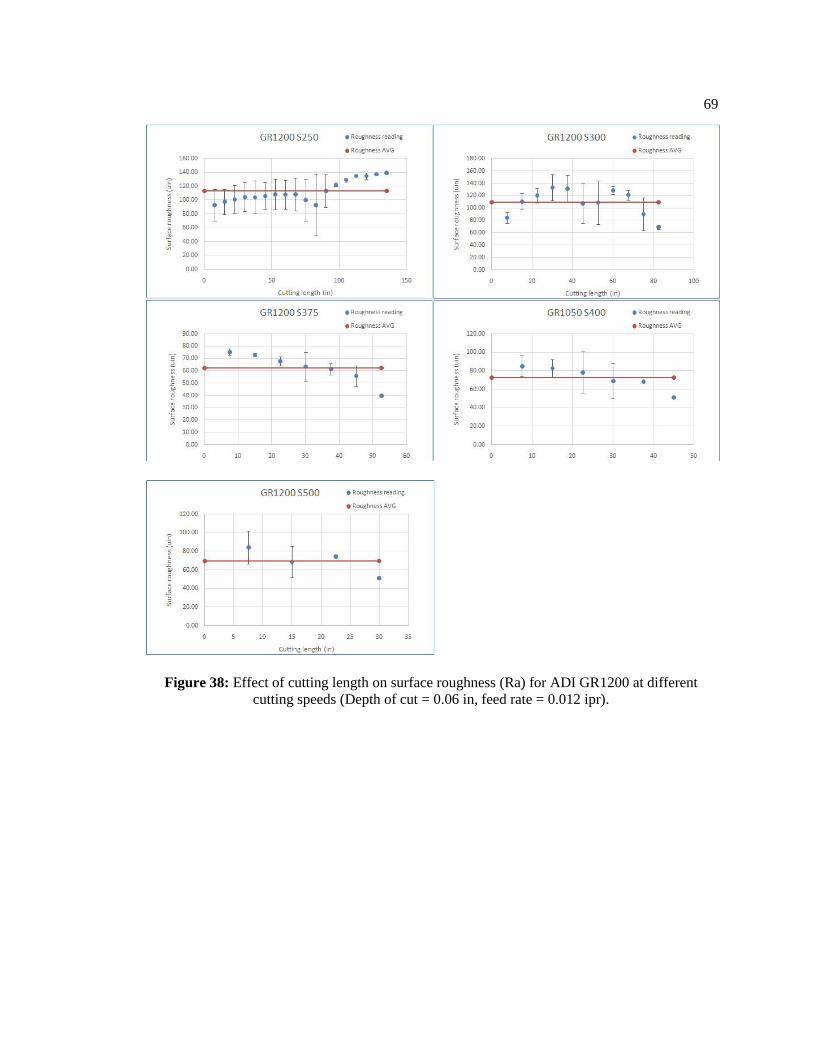
69
Figure 38: Effect of cutting length on surface roughness (Ra) for ADI GR1200 at different
cutting speeds (Depth of cut = 0.06 in, feed rate = 0.012 ipr).

70
Figure 39: Effect of cutting length on surface roughness (Ra) for DI 100-70-03 at different
cutting speeds (Depth of cut = 0.06 in, feed rate = 0.012 ipr).
Figure 40: Effect of cutting speed on surface roughness (Ra) for all grades of ADI and DI 100-
70-03 (Depth of cut = 0.06 in, feed rate = 0.012 ipr).
0
20
40
60
80
100
120
250 300 375 400 500 750 1000
Surf
ace
rou
ghn
ess
(uin
)
Cutting speed (fpm)
900 1050 1200 DI

71
Table 9: Effect of cutting speed on tool life for each grade of ADI and DI 100-70-03 in terms of
cutting time and cutting length (Depth of cut = 0.06 in, feed rate = 0.012 ipr)
Grade
Cutting
speed
[fpm]
Average
Tool life,
cutting time
[min]
Standard
Deviation
[min]
Average
Tool life,
cutting
length [in]
Standard
Deviation
[in]
900 375 20.69 1.51 55 4.33
900 500 24.31 0 90 0.00
900 750 9.02 0.77 45 0.00
900 1000 5.06 1.19 30 0.00
1050 375 22.44 * 22.44 *
1050 500 20.65 0 75 0.00
1050 750 5.33 2.17 27.5 11.46
1050 1000 3.3 1.08 22.5 7.50
1200 250 64.56 16.94 117.5 30.31
1200 300 33.26 7.34 72.5 17.32
1200 375 17.09 4.72 45 12.99
1200 400 12.63 2.98 35 8.66
1200 500 6.59 2.15 22.5 7.50
DI 100-
70-03 500 84.53 10.12 311 37.12
DI 100-
70-03 750 16.21 0 90 0
DI 100-
70-03 1000 6.43 0 45 0
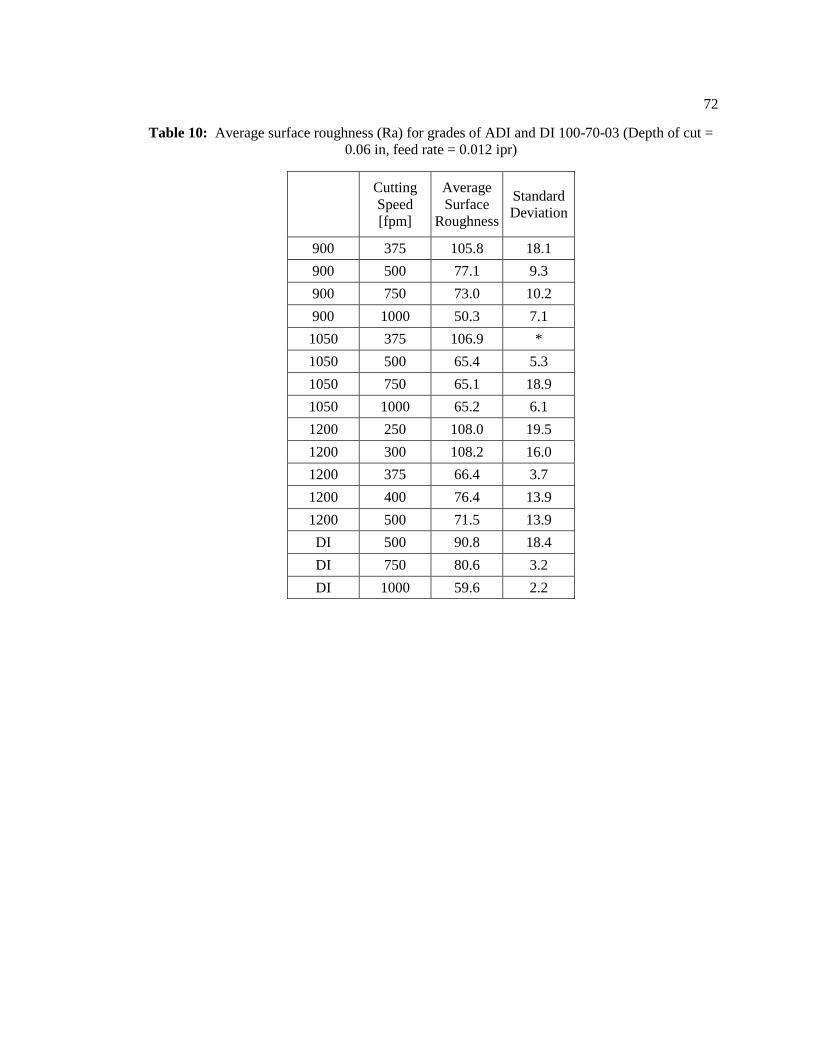
72
Table 10: Average surface roughness (Ra) for grades of ADI and DI 100-70-03 (Depth of cut =
0.06 in, feed rate = 0.012 ipr)
Cutting
Speed
[fpm]
Average
Surface
Roughness
Standard
Deviation
900 375 105.8 18.1
900 500 77.1 9.3
900 750 73.0 10.2
900 1000 50.3 7.1
1050 375 106.9 *
1050 500 65.4 5.3
1050 750 65.1 18.9
1050 1000 65.2 6.1
1200 250 108.0 19.5
1200 300 108.2 16.0
1200 375 66.4 3.7
1200 400 76.4 13.9
1200 500 71.5 13.9
DI 500 90.8 18.4
DI 750 80.6 3.2
DI 1000 59.6 2.2

73
Chapter 6
DISCUSSION
This research thoroughly evaluated of machinability during turning for different grades of ADI
(GR900, GR1050, GR1200) and compared them to DI 100-70-03. In this section, the results of
machining trials with ADI will be discussed and analyzed.
Tool wear measurements are an important indicator for evaluating the machinability of ADI
during turning. Flank wear measurement is commonly observed on both end flank and side flank
of a turning tools. In this study the measurement value of end flank wear had a strong correlation
to the side flank wear, with the side flank wear being much more consistent from tool to tool.
Therefore, side flank wear was used as the critical flank wear criteria for evaluating tool wear in
this study. The flank wear patterns for insert when machining GR1050 ADI at low cutting speeds
and high cutting speeds until the tool failure are shown in Figure 27 and Figure 28, respectively.
These wear patterns were typical for all grade of ADI at different cutting conditions. When
machining ADI at lower cutting speeds, the cutting edge stayed in a stable wear condition -
gradually increasing the wear land at a wide range of cutting times, as shown in Figures 38-1 to 8.
This stable increasing abrasive wear continued until a sufficient number of mechanical impact
loading cycle occurred, resulting in the coating being worn away. [18] As shown in Figure 38-9
and 10, the abrasive wear then increased significantly causing rapid tool failure.
The Taylor tool life equation was used to realize and evaluate the relationship between tool life
and cutting speed. [50] In this trial, the n values were quite different for the three different grades
of ADI. These results suggest that the tool material is most sensitive to cutting speed. Tool wear
for the GR900 material was the most sensitive to cutting speed (n = 0.55), followed by GR1050
(n = 0.434), and GR1200 (n = 0.303). The cutting tool SECO CNMG 120408-M5 TK2001

74
showed the larger n value compared to uncoated tungsten carbide (0.2) and TiC or TiN coated
tungsten carbide (0.3) used in previous studies. [51] Therefore, it can be assumed that the SECO
cutting tool is less sensitive to cutting speed than uncoated tungsten carbide and TiC or TiN
coated tungsten carbide cutting tools. Katuku, Koursaris, and Sigalas [33] reported a Taylor
equation with the n value of 0.51 and C value of 3*10^7 for machining GR900 with a PCBN
cutting tool. (finishing cut, dry turning) The n value for the PCBN cutting tool (0.51) and SECO
CNMG 120408-M5 TK2001 in this study (0.55) is very close, suggesting that level of sensitivity
for machining GR900 ADI is similar. The value for the SECO tool is much smaller than the
PCBN cutting tool when machining GR900 ADI. [43] The significant difference in C values
could come from differences in depth of cut, feed rate, and material removal rates between two
research studies as well as differences in tool material.
The Taylor tool equation can be used to estimate expected tool life under various cutting
conditions. Predicted tool life for 10, 30, and 60 minute tool life criteria for fixed cutting
conditions (depth of cut = 0.06 in, feed rate = 0.012 ipr) are based on the developed equations for
different grades of ADI. The GR900 would result in 10 minutes of the tool life at a cutting speed
of 677 fpm, 30 minutes tool life at a cutting speed of 370 fpm, and 60 minutes tool life at a
cutting speed of 253 fpm. When machining GR1050, a cutting speed of 598 fpm would result in
10 minutes of tool life, the cutting speed of 371 fpm would result in 30 minutes of tool life, and
the cutting speed of 275 fpm would result in 60 minutes of tool life. For machining GR1200,
when the desired tool lives are 10, 30, and 60 minutes, the cutting speed should be 437, 313, and
254 fpm respectively. DI 100-70-03 is the preferred as – cast grade used as the starting material
before ADI heat treatment, had a lower hardness than any grade of ADI. As expected, the
expected tool life of DI 100-70-03 is longer than ADI both in terms of cutting length and cutting
time for all ADI grades.
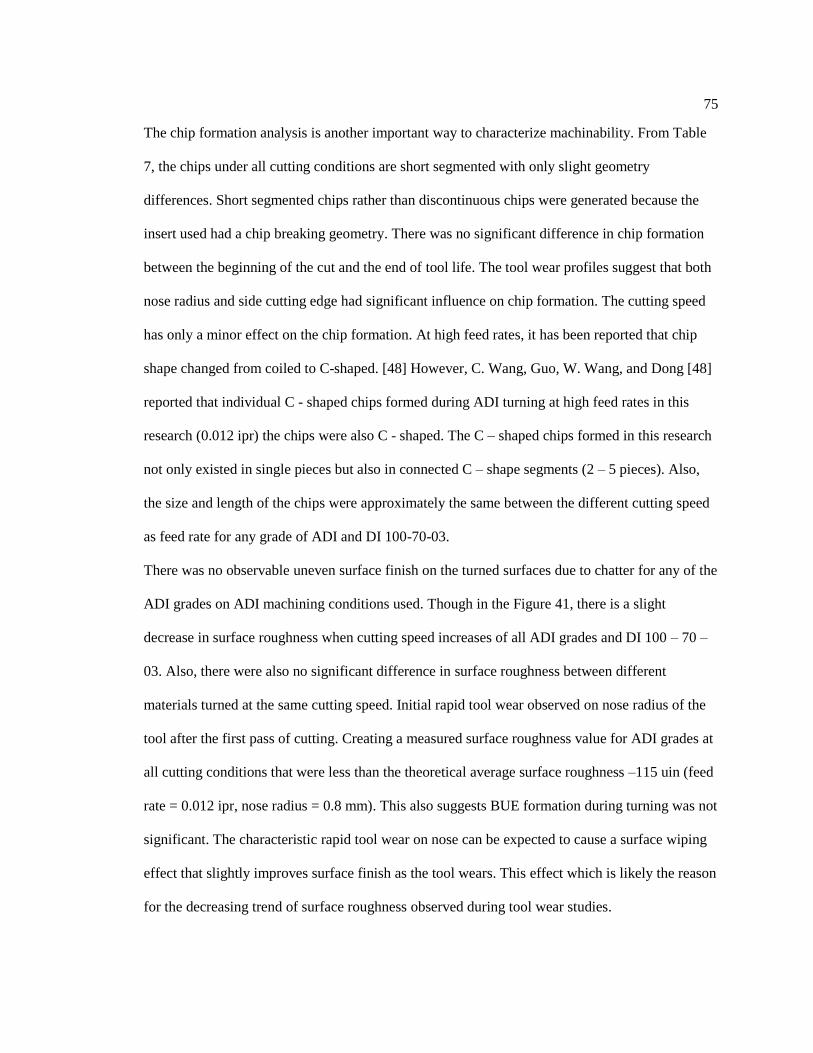
75
The chip formation analysis is another important way to characterize machinability. From Table
7, the chips under all cutting conditions are short segmented with only slight geometry
differences. Short segmented chips rather than discontinuous chips were generated because the
insert used had a chip breaking geometry. There was no significant difference in chip formation
between the beginning of the cut and the end of tool life. The tool wear profiles suggest that both
nose radius and side cutting edge had significant influence on chip formation. The cutting speed
has only a minor effect on the chip formation. At high feed rates, it has been reported that chip
shape changed from coiled to C-shaped. [48] However, C. Wang, Guo, W. Wang, and Dong [48]
reported that individual C - shaped chips formed during ADI turning at high feed rates in this
research (0.012 ipr) the chips were also C - shaped. The C – shaped chips formed in this research
not only existed in single pieces but also in connected C – shape segments (2 – 5 pieces). Also,
the size and length of the chips were approximately the same between the different cutting speed
as feed rate for any grade of ADI and DI 100-70-03.
There was no observable uneven surface finish on the turned surfaces due to chatter for any of the
ADI grades on ADI machining conditions used. Though in the Figure 41, there is a slight
decrease in surface roughness when cutting speed increases of all ADI grades and DI 100 – 70 –
03. Also, there were also no significant difference in surface roughness between different
materials turned at the same cutting speed. Initial rapid tool wear observed on nose radius of the
tool after the first pass of cutting. Creating a measured surface roughness value for ADI grades at
all cutting conditions that were less than the theoretical average surface roughness –115 uin (feed
rate = 0.012 ipr, nose radius = 0.8 mm). This also suggests BUE formation during turning was not
significant. The characteristic rapid tool wear on nose can be expected to cause a surface wiping
effect that slightly improves surface finish as the tool wears. This effect which is likely the reason
for the decreasing trend of surface roughness observed during tool wear studies.

76
Chapter 7
CONCLUSION AND FUTURE WORK
Due to the lack of technical information on the machinability of ADI via turning, applications of
ADI for new products has been limited. The present research has addressed this need and was
started to analyze the machinability of different grades of ADI (GR900. GR1050, GR1200) via
turning. The effects of machining parameters on machining performance was measuring by tool
life, surface roughness and characterization the chip formation during lubricated turning trials
with coated carbide tools. All machining chip, for all grades were discontinuous. The generation
of discontinuous chips could be attributed to both the graphite nodules and the hardness of the
ADI matrix structure.
In general, from the view of tool life, The GR900 exhibited longer tool life than GR1050 and
GR1200. In terms of resultant surface roughness, GR1050 showed a slightly better surface finish
that the other grades of ADI. The as – cast DI 100-70-03 had the longest tool life. However, the
surface roughness was slightly higher than any other grades of ADI. Taylor tool life coefficients
for the ADI grades were calculated. The constant C was shown to be slightly dependent on the
grades of ADI. The constant n was very different for each grade of ADI. In addition, the influence
of cutting speed on tool life, surface roughness, and chip formation during turning were
investigated. The tool wear studies have characterized the relationship between cutting speed and
tool life. At high cutting speed, the tool wear is more rapid. Flank wear was the dominant wear
mechanisms; however, some fracturing of the cutting edge was observed during aggressive
machining. Cracking was observed at high cutting speeds in all grades of ADI. This change in
tool failure mechanism was associated with very high chip and tool temperatures.

77
Future extensions of this research should further investigate the machinability of ADI under
different turning conditions such as the depth of cut and feed rate. Also, the possible effect of
undesirable martensite transformation on the surface of ADI during turning should be thoroughly
investigated by careful microstructure characterization of machined surfaces.
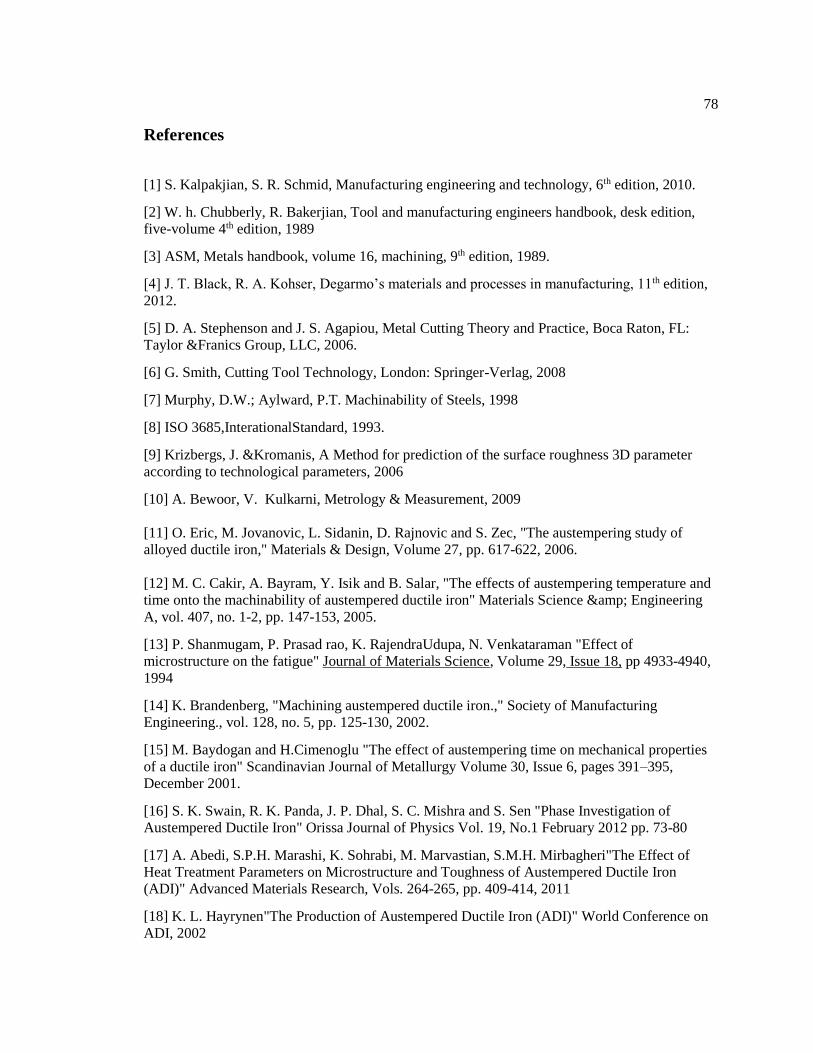
78
References
[1] S. Kalpakjian, S. R. Schmid, Manufacturing engineering and technology, 6th edition, 2010.
[2] W. h. Chubberly, R. Bakerjian, Tool and manufacturing engineers handbook, desk edition,
five-volume 4th edition, 1989
[3] ASM, Metals handbook, volume 16, machining, 9th edition, 1989.
[4] J. T. Black, R. A. Kohser, Degarmo’s materials and processes in manufacturing, 11th edition,
2012.
[5] D. A. Stephenson and J. S. Agapiou, Metal Cutting Theory and Practice, Boca Raton, FL:
Taylor &Franics Group, LLC, 2006.
[6] G. Smith, Cutting Tool Technology, London: Springer-Verlag, 2008
[7] Murphy, D.W.; Aylward, P.T. Machinability of Steels, 1998
[8] ISO 3685,InterationalStandard, 1993.
[9] Krizbergs, J. &Kromanis, A Method for prediction of the surface roughness 3D parameter
according to technological parameters, 2006
[10] A. Bewoor, V. Kulkarni, Metrology & Measurement, 2009
[11] O. Eric, M. Jovanovic, L. Sidanin, D. Rajnovic and S. Zec, "The austempering study of
alloyed ductile iron," Materials & Design, Volume 27, pp. 617-622, 2006.
[12] M. C. Cakir, A. Bayram, Y. Isik and B. Salar, "The effects of austempering temperature and
time onto the machinability of austempered ductile iron" Materials Science & Engineering
A, vol. 407, no. 1-2, pp. 147-153, 2005.
[13] P. Shanmugam, P. Prasad rao, K. RajendraUdupa, N. Venkataraman "Effect of
microstructure on the fatigue" Journal of Materials Science, Volume 29, Issue 18, pp 4933-4940,
1994
[14] K. Brandenberg, "Machining austempered ductile iron.," Society of Manufacturing
Engineering., vol. 128, no. 5, pp. 125-130, 2002.
[15] M. Baydogan and H.Cimenoglu "The effect of austempering time on mechanical properties
of a ductile iron" Scandinavian Journal of Metallurgy Volume 30, Issue 6, pages 391–395,
December 2001.
[16] S. K. Swain, R. K. Panda, J. P. Dhal, S. C. Mishra and S. Sen "Phase Investigation of
Austempered Ductile Iron" Orissa Journal of Physics Vol. 19, No.1 February 2012 pp. 73-80
[17] A. Abedi, S.P.H. Marashi, K. Sohrabi, M. Marvastian, S.M.H. Mirbagheri"The Effect of
Heat Treatment Parameters on Microstructure and Toughness of Austempered Ductile Iron
(ADI)" Advanced Materials Research, Vols. 264-265, pp. 409-414, 2011
[18] K. L. Hayrynen"The Production of Austempered Ductile Iron (ADI)" World Conference on
ADI, 2002
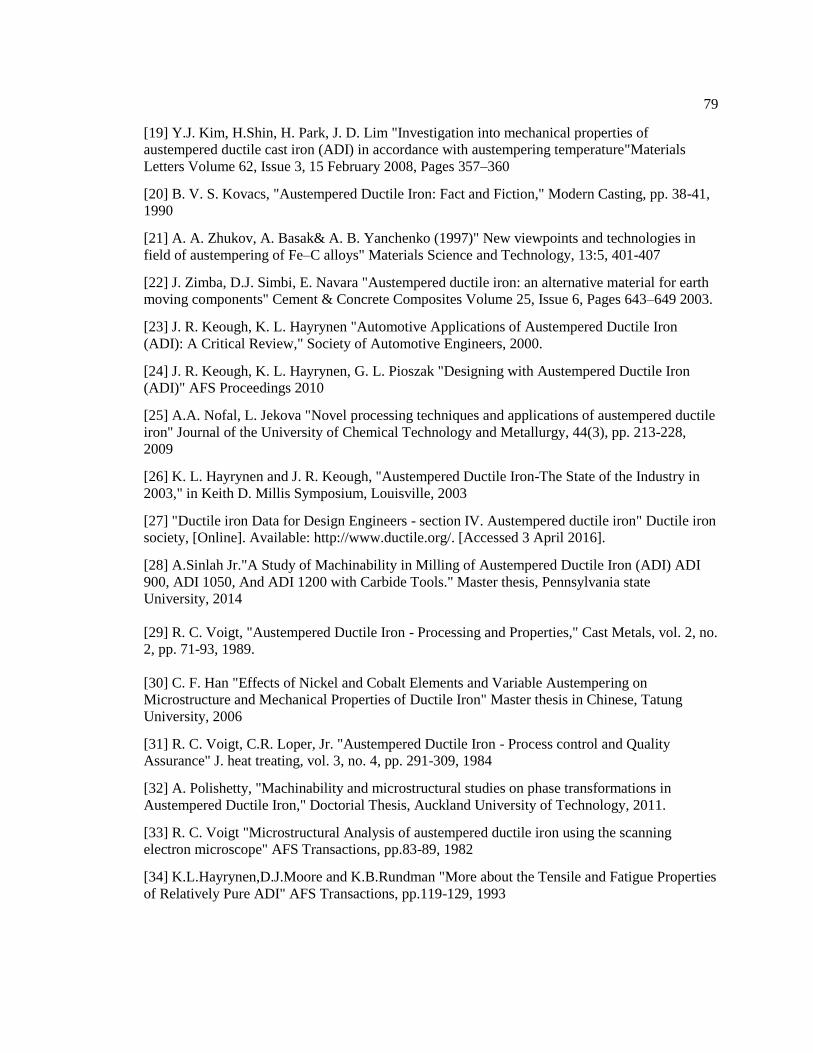
79
[19] Y.J. Kim, H.Shin, H. Park, J. D. Lim "Investigation into mechanical properties of
austempered ductile cast iron (ADI) in accordance with austempering temperature"Materials
Letters Volume 62, Issue 3, 15 February 2008, Pages 357–360
[20] B. V. S. Kovacs, "Austempered Ductile Iron: Fact and Fiction," Modern Casting, pp. 38-41,
1990
[21] A. A. Zhukov, A. Basak& A. B. Yanchenko (1997)" New viewpoints and technologies in
field of austempering of Fe–C alloys" Materials Science and Technology, 13:5, 401-407
[22] J. Zimba, D.J. Simbi, E. Navara "Austempered ductile iron: an alternative material for earth
moving components" Cement & Concrete Composites Volume 25, Issue 6, Pages 643–649 2003.
[23] J. R. Keough, K. L. Hayrynen "Automotive Applications of Austempered Ductile Iron
(ADI): A Critical Review," Society of Automotive Engineers, 2000.
[24] J. R. Keough, K. L. Hayrynen, G. L. Pioszak "Designing with Austempered Ductile Iron
(ADI)" AFS Proceedings 2010
[25] A.A. Nofal, L. Jekova "Novel processing techniques and applications of austempered ductile
iron" Journal of the University of Chemical Technology and Metallurgy, 44(3), pp. 213-228,
2009
[26] K. L. Hayrynen and J. R. Keough, "Austempered Ductile Iron-The State of the Industry in
2003," in Keith D. Millis Symposium, Louisville, 2003
[27] "Ductile iron Data for Design Engineers - section IV. Austempered ductile iron" Ductile iron
society, [Online]. Available: http://www.ductile.org/. [Accessed 3 April 2016].
[28] A.Sinlah Jr."A Study of Machinability in Milling of Austempered Ductile Iron (ADI) ADI
900, ADI 1050, And ADI 1200 with Carbide Tools." Master thesis, Pennsylvania state
University, 2014
[29] R. C. Voigt, "Austempered Ductile Iron - Processing and Properties," Cast Metals, vol. 2, no.
2, pp. 71-93, 1989.
[30] C. F. Han "Effects of Nickel and Cobalt Elements and Variable Austempering on
Microstructure and Mechanical Properties of Ductile Iron" Master thesis in Chinese, Tatung
University, 2006
[31] R. C. Voigt, C.R. Loper, Jr. "Austempered Ductile Iron - Process control and Quality
Assurance" J. heat treating, vol. 3, no. 4, pp. 291-309, 1984
[32] A. Polishetty, "Machinability and microstructural studies on phase transformations in
Austempered Ductile Iron," Doctorial Thesis, Auckland University of Technology, 2011.
[33] R. C. Voigt "Microstructural Analysis of austempered ductile iron using the scanning
electron microscope" AFS Transactions, pp.83-89, 1982
[34] K.L.Hayrynen,D.J.Moore and K.B.Rundman "More about the Tensile and Fatigue Properties
of Relatively Pure ADI" AFS Transactions, pp.119-129, 1993
80
[35] B. Avishan, S. Yazdani and D. JalaliVahid , "The influence of depth of cut on the
machinability of an alloyed austempered ductile iron.," Materials Science & Engineering, no.
523, pp. 93-98, 2009.
[36] J. Pilc, M. Šajgalík, J. Holubják, M. Piešová, L. Zaušková, O. Babík, V. Kuždák, J. Rákoci
"Austempered Ductile Iron Machining" Technological Engineering. Volume 12, Issue 1, Pages
9–12, 2015
[37] W.H. Yang, Y.S. Tarng"Design optimization of cutting parameters for turning operations
based on the Taguchi method" Journal of Materials Processing Technology, Volume 84, Issues 1–
3, Pages 122–129, 1998
[38] G. H. Gowd, M. V. Goud, K. D. Theja, M. G. Reddy "Optimal Selection Of Machining
Parameters In CNC Turning Process Of EN-31 Using Intelligent Hybrid Decision Making Tools"
Procedia Engineering, Volume 97,Pages 125–133, 2014
[39] M.E.R. Bonifacio, A.E. Diniz "Correlating tool wear, tool life, surface roughness and tool
vibration in finish turning with coated carbide tools"Wear, Volume 173, Issues 1–2, Pages 137-
144, 1994
[40] S.K Choudhury, K.K Kishore "Tool wear measurement in turning using force
ratio"International Journal of Machine Tools and Manufacture, Volume 40, Issue 6, Pages 899–
909, 2000
[41] A. Polishetty, M. Goldberg, G. Littlefair "Wear Characteristics of Ultra-Hard Cutting Tools
when Machining Austempered Ductile Iron" International Journal of Mechanical & Mechatronics
Engineering 10(01):1-6, 2010
[42] A. Akdemir, S. Yazman, H. Saglam and M. Uyaner, "The effects of cutting speed and depth
of cut on machinability characteristics of austempered ductile iron," Journal of Manufacturing
Science and Engineering-Transactions of the Asme, vol. 134, 2012
[43] K. Katuku, A. Koursaris and I. Sigalas, "Wear, cutting forces and chip characteristics when
dry turning ASTM grade 2 austempered ductile iron with PcBN cutting tools under finishing
conditions," Journal of Materials Processing Tech, vol. 209, no. 5, pp. 2412-2420, 2009
[44] K. Aslantas and I. Ucun, "Evaluation of the performance of CBN tools when turning
austempered ductile iron material," Journal of Manufacturing Science and Engineering, vol. 130,
no. 5, pp. 0545031-0545035, 2008
[45] K. Aslantas and I. Ucun, "The performance of ceramic and cermet cutting tools for the
machining of austempered ductile iron," The International Journal of Advanced Manufacturing
Technology, vol. 41, no. 7, pp. 642-650, 2009
[46] M.Arft, F.Klocke "High Performance Turning of Austempered Ductile Iron (ADI) with
adapted Cutting Inserts" 14th CIRP Conference on Modeling of Machining Operations (CIRP
CMMO), 2013
[47] M. V. De Carvalho, D. M. Montenegro and J. D. Gomes, "An analysis of the machinability
of ASTM grades 2 and 3 austempered ductile iron," Journal of Materials Processing Technology,
vol. 213, no. 560, 2013
81
[48] C. Wang, X. Guo, W. Wang, Q. Dong "Study on the Influence of Cutting Parameters on
Cutting Forces and Chip Shape of Austempered Ductile Iron (ADI)" The third International
Multi-Conference on Engineering and Technological Innovation: IMETI 2010
[49] P. Parhad,A. Likhite, J. Bhatt, D. Peshwe"The Effect of Cutting Speed and Depth of Cut on
Surface Roughness During Machining of Austempered Ductile Iron" Transactions of the Indian
Institute of Metals, Volume 68, Issue 1, pp 99-108, 2015
[50] I.V. Rao G.L. Lal, International journal of machine tool design and research volume 17, issue
4, 1977, page 235-243
[51] D. A. Stephenson and J. S. Agapiou, Metal Cutting Theory and Practice, Boca Raton, FL:
Taylor & Franics Group, LLC, 2006
[52] SECO tool online, Available: www.store.secotools.com
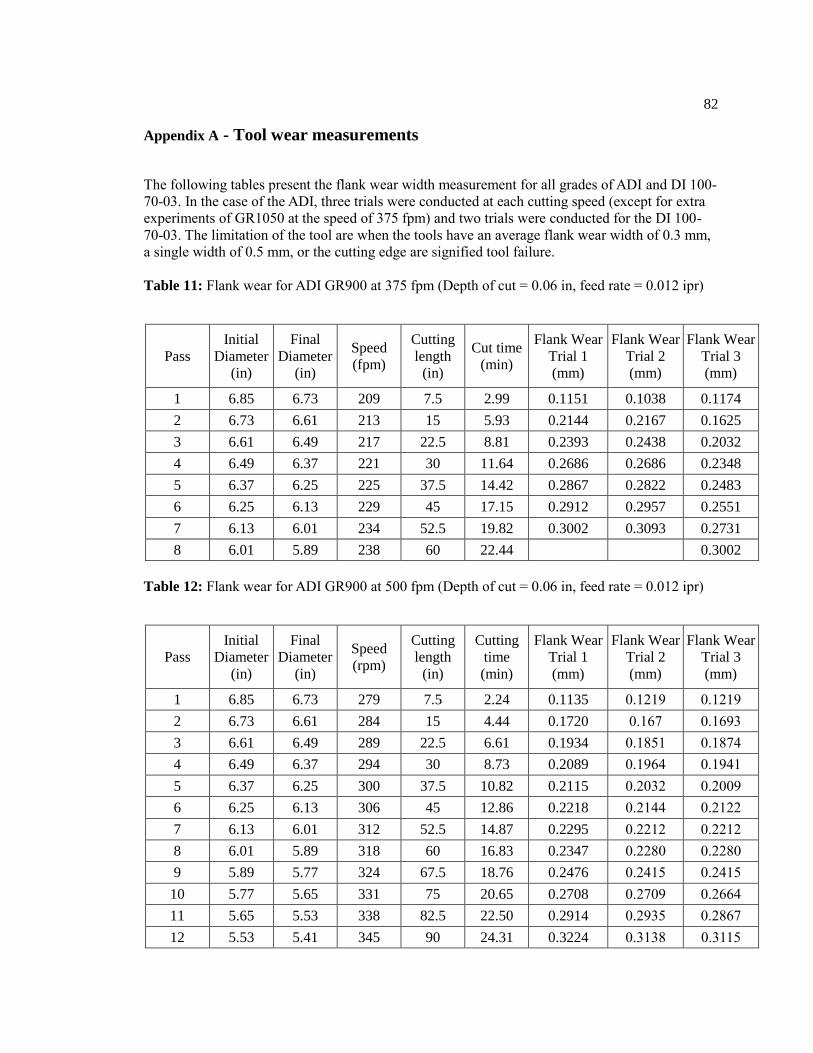
82
Appendix A - Tool wear measurements
The following tables present the flank wear width measurement for all grades of ADI and DI 100-
70-03. In the case of the ADI, three trials were conducted at each cutting speed (except for extra
experiments of GR1050 at the speed of 375 fpm) and two trials were conducted for the DI 100-
70-03. The limitation of the tool are when the tools have an average flank wear width of 0.3 mm,
a single width of 0.5 mm, or the cutting edge are signified tool failure.
Table 11: Flank wear for ADI GR900 at 375 fpm (Depth of cut = 0.06 in, feed rate = 0.012 ipr)
Pass
Initial
Diameter
(in)
Final
Diameter
(in)
Speed
(fpm)
Cutting
length
(in)
Cut time
(min)
Flank Wear
Trial 1
(mm)
Flank Wear
Trial 2
(mm)
Flank Wear
Trial 3
(mm)
1 6.85 6.73 209 7.5 2.99 0.1151 0.1038 0.1174
2 6.73 6.61 213 15 5.93 0.2144 0.2167 0.1625
3 6.61 6.49 217 22.5 8.81 0.2393 0.2438 0.2032
4 6.49 6.37 221 30 11.64 0.2686 0.2686 0.2348
5 6.37 6.25 225 37.5 14.42 0.2867 0.2822 0.2483
6 6.25 6.13 229 45 17.15 0.2912 0.2957 0.2551
7 6.13 6.01 234 52.5 19.82 0.3002 0.3093 0.2731
8 6.01 5.89 238 60 22.44 0.3002
Table 12: Flank wear for ADI GR900 at 500 fpm (Depth of cut = 0.06 in, feed rate = 0.012 ipr)
Pass
Initial
Diameter
(in)
Final
Diameter
(in)
Speed
(rpm)
Cutting
length
(in)
Cutting
time
(min)
Flank Wear
Trial 1
(mm)
Flank Wear
Trial 2
(mm)
Flank Wear
Trial 3
(mm)
1 6.85 6.73 279 7.5 2.24 0.1135 0.1219 0.1219
2 6.73 6.61 284 15 4.44 0.1720 0.167 0.1693
3 6.61 6.49 289 22.5 6.61 0.1934 0.1851 0.1874
4 6.49 6.37 294 30 8.73 0.2089 0.1964 0.1941
5 6.37 6.25 300 37.5 10.82 0.2115 0.2032 0.2009
6 6.25 6.13 306 45 12.86 0.2218 0.2144 0.2122
7 6.13 6.01 312 52.5 14.87 0.2295 0.2212 0.2212
8 6.01 5.89 318 60 16.83 0.2347 0.2280 0.2280
9 5.89 5.77 324 67.5 18.76 0.2476 0.2415 0.2415
10 5.77 5.65 331 75 20.65 0.2708 0.2709 0.2664
11 5.65 5.53 338 82.5 22.50 0.2914 0.2935 0.2867
12 5.53 5.41 345 90 24.31 0.3224 0.3138 0.3115

83
Table 13: Flank wear for ADI GR900 at 750 fpm (Depth of cut = 0.06 in, feed rate = 0.012 ipr)
Pass
Initial
Diameter
(in)
Final
Diameter
(in)
Speed
(rpm)
Cutting
length
(in)
Cutting
time
(min)
Flank Wear
Trial 1
(mm)
Flank Wear
Trial 2
(mm)
Flank Wear
Trial 3
(mm)
1 6.85 6.73 418 7.5 1.49 0.1367 0.1309 0.1332
2 6.73 6.61 426 15 2.96 0.165 0.1648 0.1670
3 6.61 6.49 433 22.5 4.40 0.1934 0.1941 0.1986
4 6.49 6.37 441 30 5.82 0.2192 0.2212 0.2235
5 6.37 6.25 450 37.5 7.21 0.2424 0.2506 0.2596
6 6.25 6.13 458 45 8.57 0.3095 0.3002 0.4063
Table 14: Flank wear for ADI GR900 at 1000 fpm (Depth of cut = 0.06 in, feed rate = 0.012 ipr)
Pass
Initial
Diameter
(in)
Final
Diameter
(in)
Speed
(rpm)
Cutting
length
(in)
Cutting
time
(min)
Flank Wear
Trial 1
(mm)
Flank Wear
Trial 2
(mm)
Flank Wear
Trial 3
(mm)
1 6.85 6.73 558 7.5 1.12 0.1467 0.1467 0.1422
2 6.73 6.61 568 15 2.22 0.1896 0.1919 0.1941
3 6.61 6.49 578 22.5 3.30 0.2596 0.2573 0.2573
4 6.49 6.37 589 30 4.37 0.3047 0.3093 0.4560
Table 15: Flank wear for ADI GR1050 at 375 fpm (Depth of cut = 0.06 in, feed rate = 0.012 ipr)
Pass
Initial
Diameter
(in)
Final
Diameter
(in)
Speed
(fpm)
Cutting
length
(in)
Cutting
time
(min)
Flank Wear
Trial 1
(mm)
1 6.85 6.73 209 7.5 2.99 0.1242
2 6.73 6.61 213 15 5.93 0.2257
3 6.61 6.49 217 22.5 8.81 0.2415
4 6.49 6.37 221 30 11.64 0.2460
5 6.37 6.25 225 37.5 14.42 0.2664
6 6.25 6.13 229 45 17.15 0.2822
7 6.13 6.01 234 52.5 19.82 0.2889
8 6.01 5.89 238 60 22.44 0.3228
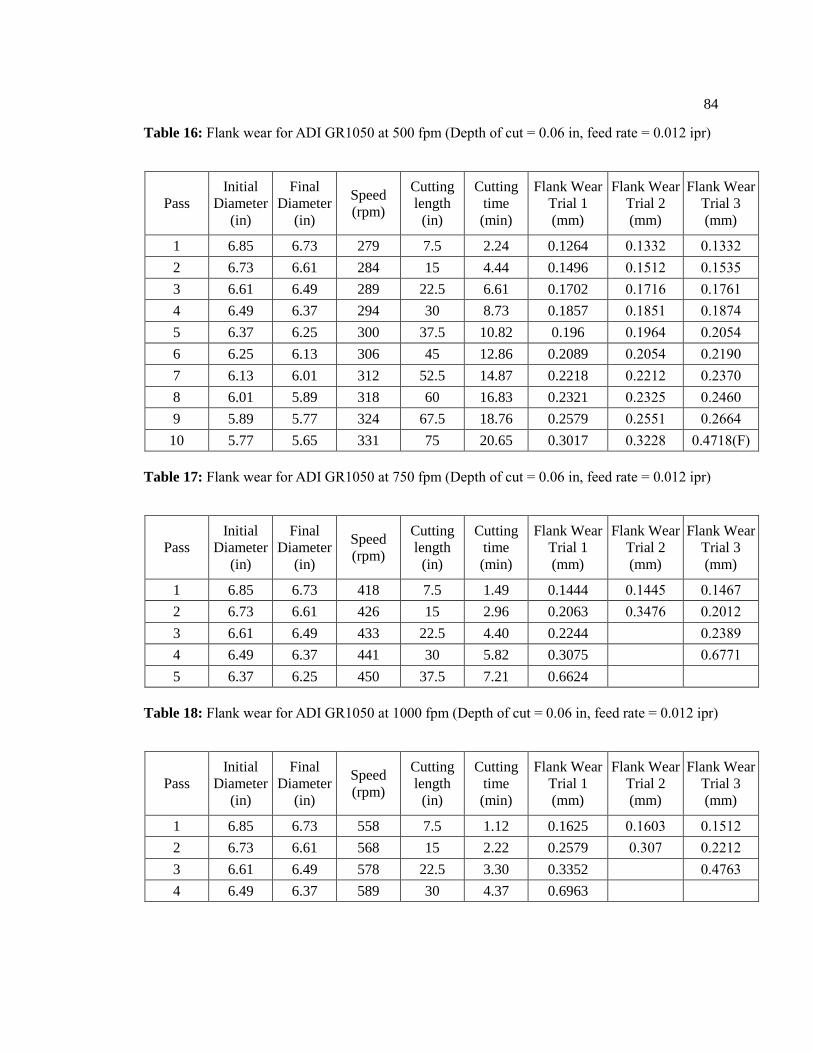
84
Table 16: Flank wear for ADI GR1050 at 500 fpm (Depth of cut = 0.06 in, feed rate = 0.012 ipr)
Pass
Initial
Diameter
(in)
Final
Diameter
(in)
Speed
(rpm)
Cutting
length
(in)
Cutting
time
(min)
Flank Wear
Trial 1
(mm)
Flank Wear
Trial 2
(mm)
Flank Wear
Trial 3
(mm)
1 6.85 6.73 279 7.5 2.24 0.1264 0.1332 0.1332
2 6.73 6.61 284 15 4.44 0.1496 0.1512 0.1535
3 6.61 6.49 289 22.5 6.61 0.1702 0.1716 0.1761
4 6.49 6.37 294 30 8.73 0.1857 0.1851 0.1874
5 6.37 6.25 300 37.5 10.82 0.196 0.1964 0.2054
6 6.25 6.13 306 45 12.86 0.2089 0.2054 0.2190
7 6.13 6.01 312 52.5 14.87 0.2218 0.2212 0.2370
8 6.01 5.89 318 60 16.83 0.2321 0.2325 0.2460
9 5.89 5.77 324 67.5 18.76 0.2579 0.2551 0.2664
10 5.77 5.65 331 75 20.65 0.3017 0.3228 0.4718(F)
Table 17: Flank wear for ADI GR1050 at 750 fpm (Depth of cut = 0.06 in, feed rate = 0.012 ipr)
Pass
Initial
Diameter
(in)
Final
Diameter
(in)
Speed
(rpm)
Cutting
length
(in)
Cutting
time
(min)
Flank Wear
Trial 1
(mm)
Flank Wear
Trial 2
(mm)
Flank Wear
Trial 3
(mm)
1 6.85 6.73 418 7.5 1.49 0.1444 0.1445 0.1467
2 6.73 6.61 426 15 2.96 0.2063 0.3476 0.2012
3 6.61 6.49 433 22.5 4.40 0.2244 0.2389
4 6.49 6.37 441 30 5.82 0.3075 0.6771
5 6.37 6.25 450 37.5 7.21 0.6624
Table 18: Flank wear for ADI GR1050 at 1000 fpm (Depth of cut = 0.06 in, feed rate = 0.012 ipr)
Pass
Initial
Diameter
(in)
Final
Diameter
(in)
Speed
(rpm)
Cutting
length
(in)
Cutting
time
(min)
Flank Wear
Trial 1
(mm)
Flank Wear
Trial 2
(mm)
Flank Wear
Trial 3
(mm)
1 6.85 6.73 558 7.5 1.12 0.1625 0.1603 0.1512
2 6.73 6.61 568 15 2.22 0.2579 0.307 0.2212
3 6.61 6.49 578 22.5 3.30 0.3352 0.4763
4 6.49 6.37 589 30 4.37 0.6963
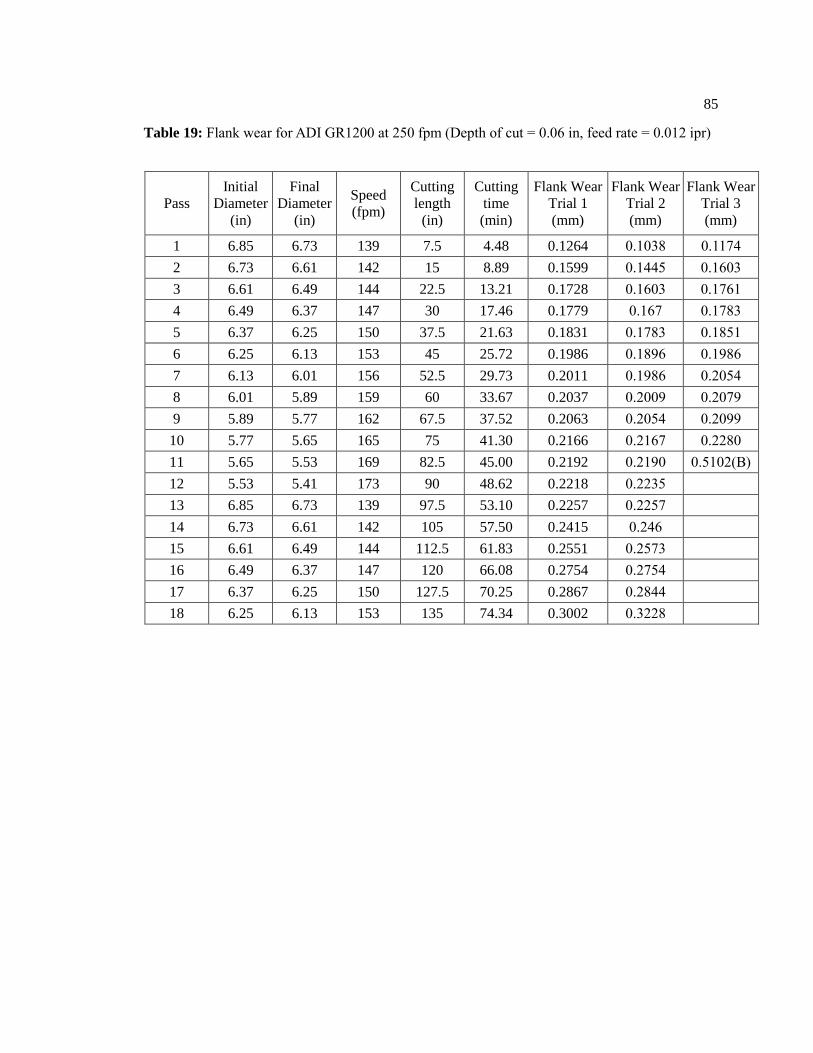
85
Table 19: Flank wear for ADI GR1200 at 250 fpm (Depth of cut = 0.06 in, feed rate = 0.012 ipr)
Pass
Initial
Diameter
(in)
Final
Diameter
(in)
Speed
(fpm)
Cutting
length
(in)
Cutting
time
(min)
Flank Wear
Trial 1
(mm)
Flank Wear
Trial 2
(mm)
Flank Wear
Trial 3
(mm)
1 6.85 6.73 139 7.5 4.48 0.1264 0.1038 0.1174
2 6.73 6.61 142 15 8.89 0.1599 0.1445 0.1603
3 6.61 6.49 144 22.5 13.21 0.1728 0.1603 0.1761
4 6.49 6.37 147 30 17.46 0.1779 0.167 0.1783
5 6.37 6.25 150 37.5 21.63 0.1831 0.1783 0.1851
6 6.25 6.13 153 45 25.72 0.1986 0.1896 0.1986
7 6.13 6.01 156 52.5 29.73 0.2011 0.1986 0.2054
8 6.01 5.89 159 60 33.67 0.2037 0.2009 0.2079
9 5.89 5.77 162 67.5 37.52 0.2063 0.2054 0.2099
10 5.77 5.65 165 75 41.30 0.2166 0.2167 0.2280
11 5.65 5.53 169 82.5 45.00 0.2192 0.2190 0.5102(B)
12 5.53 5.41 173 90 48.62 0.2218 0.2235
13 6.85 6.73 139 97.5 53.10 0.2257 0.2257
14 6.73 6.61 142 105 57.50 0.2415 0.246
15 6.61 6.49 144 112.5 61.83 0.2551 0.2573
16 6.49 6.37 147 120 66.08 0.2754 0.2754
17 6.37 6.25 150 127.5 70.25 0.2867 0.2844
18 6.25 6.13 153 135 74.34 0.3002 0.3228

86
Table 20: Flank wear for ADI GR1200 at 300 fpm (Depth of cut = 0.06 in, feed rate = 0.012 ipr)
Pass
Initial
Diameter
(in)
Final
Diameter
(in)
Speed
(fpm)
Cutting
length
(in)
Cutting
time
(min)
Flank Wear
Trial 1
(mm)
Flank Wear
Trial 2
(mm)
Flank Wear
Trial 3
(mm)
1 6.85 6.73 167 7.5 3.74 0.1084 0.1061 0.1174
2 6.73 6.61 170 15 7.41 0.2032 0.2009 0.2032
3 6.61 6.49 173 22.5 11.01 0.2032 0.2032 0.2077
4 6.49 6.37 177 30 14.55 0.2212 0.2167 0.2167
5 6.37 6.25 180 37.5 18.03 0.2212 0.2212 0.2235
6 6.25 6.13 183 45 21.43 0.2280 0.2280 0.2664
7 6.13 6.01 187 52.5 24.78 0.2348 0.2325 0.4002
8 6.01 5.89 191 60 28.06 0.2370 0.2348
9 5.89 5.77 195 67.5 31.27 0.2438 0.2415
10 5.77 5.65 199 75 34.42 0.2528 0.2686
11 5.65 5.53 203 82.5 37.50 0.4673 0.5576
Table 21: Flank wear for ADI GR1200 at 375 fpm (Depth of cut = 0.06 in, feed rate = 0.012 ipr)
Pass
Initial
Diameter
(in)
Final
Diameter
(in)
Speed
(fpm)
Cutting
length
(in)
Cutting
time
(min)
Flank Wear
Trial 1
(mm)
Flank Wear
Trial 2
(mm)
Flank Wear
Trial 3
(mm)
1 6.85 6.73 209 7.5 2.99 0.1289 0.1287 0.1287
2 6.73 6.61 213 15 5.93 0.1702 0.1738 0.1783
3 6.61 6.49 217 22.5 8.81 0.1934 0.1964 0.2212
4 6.49 6.37 221 30 11.64 0.2115 0.219 0.6117
5 6.37 6.25 225 37.5 14.42 0.2373 0.237
6 6.25 6.13 229 45 17.15 0.2759 0.2731
7 6.13 6.01 234 52.5 19.82 0.6163 0.5372
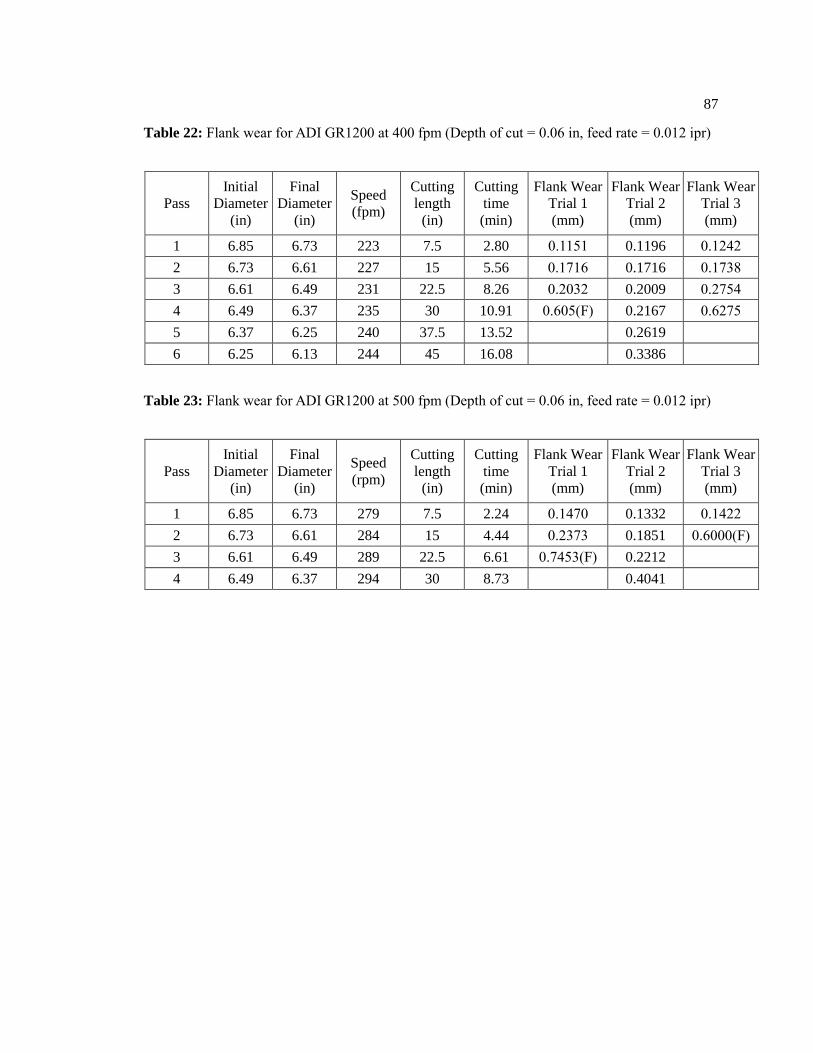
87
Table 22: Flank wear for ADI GR1200 at 400 fpm (Depth of cut = 0.06 in, feed rate = 0.012 ipr)
Pass
Initial
Diameter
(in)
Final
Diameter
(in)
Speed
(fpm)
Cutting
length
(in)
Cutting
time
(min)
Flank Wear
Trial 1
(mm)
Flank Wear
Trial 2
(mm)
Flank Wear
Trial 3
(mm)
1 6.85 6.73 223 7.5 2.80 0.1151 0.1196 0.1242
2 6.73 6.61 227 15 5.56 0.1716 0.1716 0.1738
3 6.61 6.49 231 22.5 8.26 0.2032 0.2009 0.2754
4 6.49 6.37 235 30 10.91 0.605(F) 0.2167 0.6275
5 6.37 6.25 240 37.5 13.52 0.2619
6 6.25 6.13 244 45 16.08 0.3386
Table 23: Flank wear for ADI GR1200 at 500 fpm (Depth of cut = 0.06 in, feed rate = 0.012 ipr)
Pass
Initial
Diameter
(in)
Final
Diameter
(in)
Speed
(rpm)
Cutting
length
(in)
Cutting
time
(min)
Flank Wear
Trial 1
(mm)
Flank Wear
Trial 2
(mm)
Flank Wear
Trial 3
(mm)
1 6.85 6.73 279 7.5 2.24 0.1470 0.1332 0.1422
2 6.73 6.61 284 15 4.44 0.2373 0.1851 0.6000(F)
3 6.61 6.49 289 22.5 6.61 0.7453(F) 0.2212
4 6.49 6.37 294 30 8.73 0.4041

88
Table 24: Flank wear for DI 100-70-03 at 500 fpm (Depth of cut = 0.06 in, feed rate = 0.012 ipr)
Pass
Initial
Diameter
(in)
Final
Diameter
(in)
Speed
(fpm)
Cutting
length
(in)
Cutting
time
(min)
Flank Wear
Trial 1
(mm)
Flank Wear
Trial 2
(mm)
1 6.85 6.73 279 7.5 2.24 0.0928 0.1196
2 6.73 6.61 284 15 4.44 0.1264 0.1287
3 6.61 6.49 289 22.5 6.61 0.1341 0.1377
4 6.49 6.37 294 30 8.73 0.1367 0.1400
5 6.37 6.25 300 37.5 10.82 0.1496 0.1490
6 6.25 6.13 306 45 12.86 0.1522 0.1535
7 6.13 6.01 312 52.5 14.87 0.1625 0.1648
8 6.01 5.89 318 60 16.83 0.1779 0.1761
9 5.89 5.77 324 67.5 18.76 0.1805 0.1806
10 5.77 5.65 331 75 20.65 0.1883 0.1874
11 5.65 5.53 338 82.5 22.50 0.1909 0.1919
12 5.53 5.41 345 90 24.31 0.1960 0.1964
13 6.85 6.73 279 97.5 26.55 0.2009 0.2009
14 6.73 6.61 284 105 28.75 0.2032 0.2032
15 6.61 6.49 289 112.5 30.92 0.2054 0.2054
16 6.49 6.37 294 120 33.04 0.2077 0.2077
17 6.37 6.25 300 127.5 35.12 0.2099 0.2099
18 6.25 6.13 306 135 37.17 0.2122 0.2122
19 6.13 6.01 312 142.5 39.18 0.2122 0.2122
20 6.01 5.89 318 150 41.14 0.2144 0.2144
21 5.89 5.77 324 157.5 43.07 0.2144 0.2167
22 5.77 5.65 331 165 44.96 0.2167 0.2167
23 5.65 5.53 338 172.5 46.81 0.2167 0.2212
24 5.53 5.41 345 180 48.62 0.2190 0.2212
25 6.85 6.73 279 187.5 50.86 0.2190 0.2212
26 6.73 6.61 284 195 53.06 0.2122 0.2257
27 6.61 6.49 289 202.5 55.22 0.2122 0.2257
28 6.49 6.37 294 210 57.35 0.2235 0.2280
29 6.37 6.25 300 217.5 59.43 0.2257 0.2280
30 6.25 6.13 306 225 61.48 0.2280 0.2370
31 6.13 6.01 312 232.5 63.48 0.2370 0.2370
32 6.01 5.89 318 240 65.45 0.2393 0.2483
33 5.89 5.77 324 247.5 67.38 0.2393 0.2483
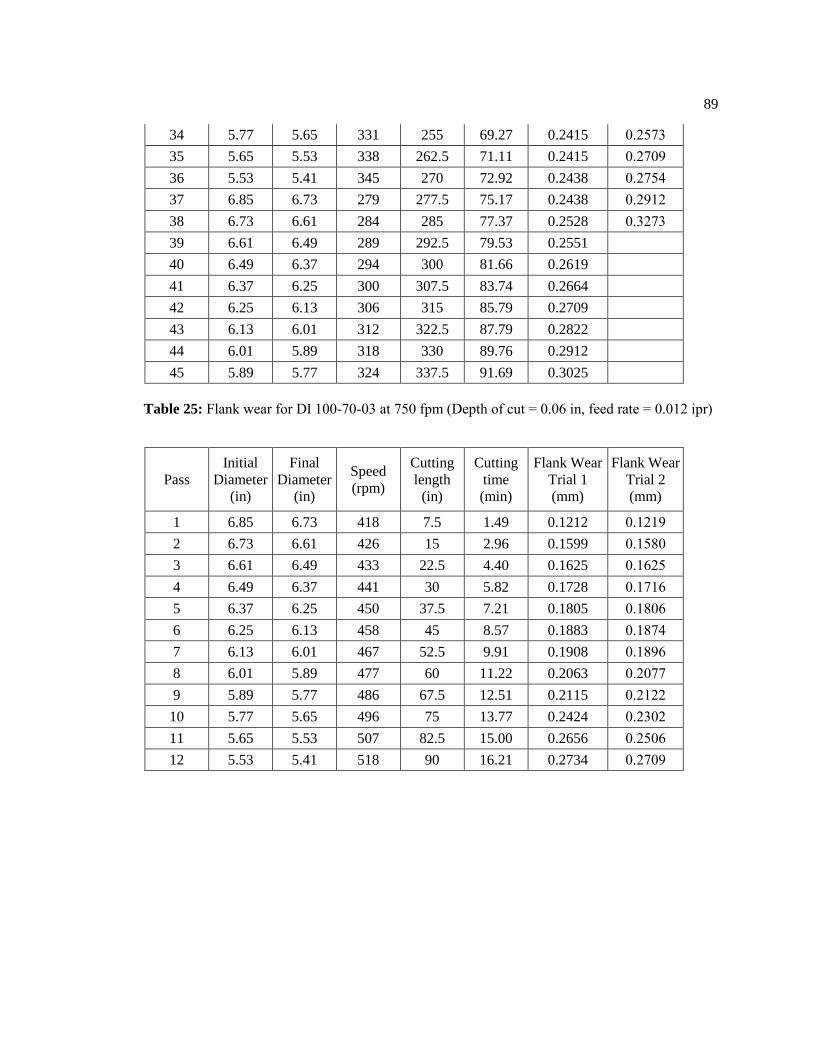
89
34 5.77 5.65 331 255 69.27 0.2415 0.2573
35 5.65 5.53 338 262.5 71.11 0.2415 0.2709
36 5.53 5.41 345 270 72.92 0.2438 0.2754
37 6.85 6.73 279 277.5 75.17 0.2438 0.2912
38 6.73 6.61 284 285 77.37 0.2528 0.3273
39 6.61 6.49 289 292.5 79.53 0.2551
40 6.49 6.37 294 300 81.66 0.2619
41 6.37 6.25 300 307.5 83.74 0.2664
42 6.25 6.13 306 315 85.79 0.2709
43 6.13 6.01 312 322.5 87.79 0.2822
44 6.01 5.89 318 330 89.76 0.2912
45 5.89 5.77 324 337.5 91.69 0.3025
Table 25: Flank wear for DI 100-70-03 at 750 fpm (Depth of cut = 0.06 in, feed rate = 0.012 ipr)
Pass
Initial
Diameter
(in)
Final
Diameter
(in)
Speed
(rpm)
Cutting
length
(in)
Cutting
time
(min)
Flank Wear
Trial 1
(mm)
Flank Wear
Trial 2
(mm)
1 6.85 6.73 418 7.5 1.49 0.1212 0.1219
2 6.73 6.61 426 15 2.96 0.1599 0.1580
3 6.61 6.49 433 22.5 4.40 0.1625 0.1625
4 6.49 6.37 441 30 5.82 0.1728 0.1716
5 6.37 6.25 450 37.5 7.21 0.1805 0.1806
6 6.25 6.13 458 45 8.57 0.1883 0.1874
7 6.13 6.01 467 52.5 9.91 0.1908 0.1896
8 6.01 5.89 477 60 11.22 0.2063 0.2077
9 5.89 5.77 486 67.5 12.51 0.2115 0.2122
10 5.77 5.65 496 75 13.77 0.2424 0.2302
11 5.65 5.53 507 82.5 15.00 0.2656 0.2506
12 5.53 5.41 518 90 16.21 0.2734 0.2709

90
Table 26: Flank wear for DI 100-70-03 at 1000 fpm (Depth of cut = 0.06 in, feed rate = 0.012
ipr)
Pass
Initial
Diameter
(in)
Final
Diameter
(in)
Speed
(rpm)
Cutting
length
(in)
Cutting
time
(min)
Flank Wear
Trial 1
(mm)
Flank Wear
Trial 2
(mm)
1 6.85 6.73 558 7.5 1.12 0.1264 0.1242
2 6.73 6.61 568 15 2.22 0.1496 0.1490
3 6.61 6.49 578 22.5 3.30 0.1728 0.1738
4 6.49 6.37 589 30 4.37 0.196 0.1964
5 6.37 6.25 600 37.5 5.41 0.2269 0.2235
6 6.25 6.13 611 45 6.43 0.3017 0.3002
Table 27: Effect of cutting speed on tool life for ADI grades in terms of cutting time for all trials
(Depth of cut = 0.06 in, feed rate = 0.012 ipr)
Grade
Cutting
Speed
[fpm]
Trial 1
[min]
Trial 2
[min]
Trial 3
[min]
Average
Tool life
[min]
Standard
Deviation
[min]
900 375 19.82 19.82 22.44 20.69 1.51
900 500 24.31 24.31 24.31 24.31 0.00
900 750 9.91 8.57 8.57 9.02 0.77
900 1000 6.43 4.37 4.37 5.06 1.19
1050 375 22.44 * * 22.44 *
1050 500 20.65 20.65 20.65 20.65 0.00
1050 750 7.21 2.96 5.82 5.33 2.17
1050 1000 4.37 2.22 3.3 3.30 1.08
1200 250 74.34 74.34 45 64.56 16.94
1200 300 37.5 37.5 24.78 33.26 7.34
1200 375 19.82 19.82 11.64 17.09 4.72
1200 400 10.91 16.08 10.91 12.63 2.98
1200 500 6.61 8.73 4.44 6.59 2.15
DI
100-70-03 500 91.69 77.37 * 84.53 10.13
DI
100-70-03 750 16.21 16.21 * 16.21 0.00
DI
100-70-00 1000 6.43 6.43 * 6.43 0.00

91
Appendix B - Surface roughness measurements
The following tables show the overall average surface roughness for each trial and for each grade
of ADI and ductile iron 100-70-03, as well as the actual three or five readings for each surface
profile.
Table 28: Average surface roughness for ADI GR900 (Depth of cut = 0.06 in, feed rate = 0.012
ipr)
Cutting
Speed
[fpm]
Average
Surface
Roughness
Trial 1
[μin]
Average
Surface
Roughness
Trial 2
[μin]
Average
Surface
Roughness
Trial 3
[μin]
Average
Surface
Roughness
[μin]
Standard
Deviation
[μin]
375 102.71 125.25 89.43 105.80 18.11
500 81.97 82.89 66.33 77.06 9.31
750 80.67 76.94 61.40 73.00 10.22
1000 57.17 43.08 50.70 50.32 7.05
Table 29: Average surface roughness for ADI GR1050 (Depth of cut = 0.06 in, feed rate = 0.012
ipr)
Cutting
Speed
[fpm]
Average
Surface
Roughness
Trial 1
[μin]
Average
Surface
Roughness
Trial 2
[μin]
Average
Surface
Roughness
Trial 3
[μin]
Average
Surface
Roughness
[μin]
Standard
Deviation
[μin]
375 106.90 * * 106.90 *
500 62.47 71.50 62.10 65.36 5.32
750 84.58 63.67 46.90 65.05 18.88
1000 66.92 58.33 70.20 65.15 6.13

92
Table 30: Average surface roughness for ADI GR1200 (Depth of cut = 0.06 in, feed rate = 0.012
ipr)
Cutting
Speed
[fpm]
Average
Surface
Roughness
Trial 1
[μin]
Average
Surface
Roughness
Trial 2
[μin]
Average
Surface
Roughness
Trial 3
[μin]
Average
Surface
Roughness
[μin]
Standard
Deviation
[μin]
250 129.33 103.57 91.09 108.00 19.50
300 121.76 112.18 90.60 108.18 15.96
375 63.22 65.52 70.40 66.38 3.67
400 90.75 75.39 63.00 76.38 13.90
500 84.67 72.83 57.00 71.50 13.88
Table 31: Average surface roughness for DI 100-70-03 (Depth of cut = 0.06 in, feed rate = 0.012
ipr)
Cutting
Speed
[fpm]
Average
Surface
Roughness
Trial 1
[μin]
Average
Surface
Roughness
Trial 2
[μin]
Average
Surface
Roughness
[μin]
Standard
Deviation
[μin]
500 103.79 77.82 90.80 18.37
750 82.92 78.33 80.63 3.24
1000 61.11 58.06 59.58 2.16

93
Table 32: Surface roughness measurements for ADI GR900 at 375 fpm (Depth of cut = 0.06 in,
feed rate = 0.012 ipr)
Cutting
length
(in)
Reading
1
(μin)
Reading
2
(μin)
Reading
3
(μin)
Reading
4
(μin)
Reading
5
(μin)
Average
roughness
(μin)
standard
deviation
(μin)
Trial 1
7.5 89 89 84 * * 87.33 2.89
15 121 111 110 * * 114.00 6.08
22.5 116 89 122 * * 109.00 17.58
30 107 97 117 * * 107.00 10.00
37.5 102 101 111 * * 104.67 5.51
45 94 90 117 * * 100.33 14.57
52.5 89 90 111 * * 96.67 12.42
Trial 2
7.5 109 95 101 * * 101.67 7.02
15 135 124 131 * * 130.00 5.57
22.5 137 125 113 * * 125.00 12.00
30 128 135 134 * * 132.33 3.79
37.5 144 138 133 * * 138.33 5.51
45 145 122 138 * * 135.00 11.79
52.5 150 120 159 * * 143.00 20.42
Trial 3
7.5 75 71 68 60 71 69.00 5.61
15 85 87 83 83 81 83.80 2.28
22.5 85 88 85 89 84 86.20 2.17
30 100 81 90 83 84 87.60 7.70
37.5 107 107 100 88 97 99.80 7.92
45 115 105 98 87 89 98.80 11.58
52.5 97 99 97 99 85 95.40 5.90
60 97 99 95 97 86 94.80 5.12
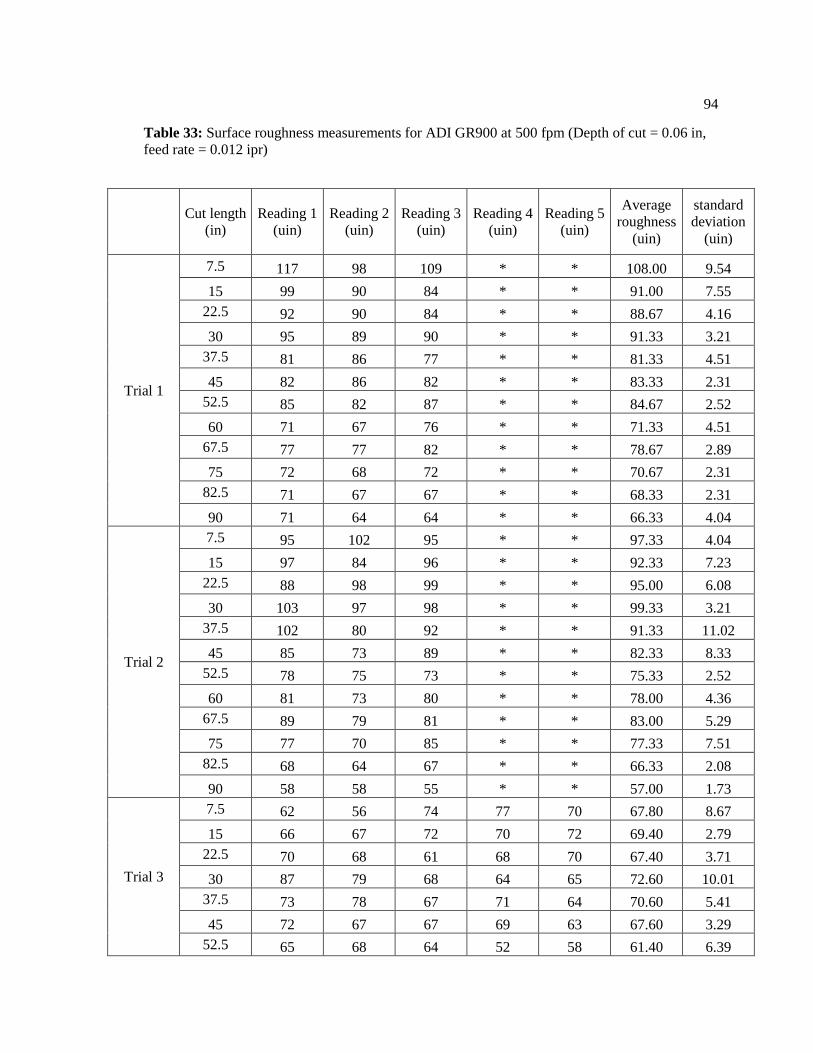
94
Table 33: Surface roughness measurements for ADI GR900 at 500 fpm (Depth of cut = 0.06 in,
feed rate = 0.012 ipr)
Cut length
(in)
Reading 1
(uin)
Reading 2
(uin)
Reading 3
(uin)
Reading 4
(uin)
Reading 5
(uin)
Average
roughness
(uin)
standard
deviation
(uin)
Trial 1
7.5 117 98 109 * * 108.00 9.54
15 99 90 84 * * 91.00 7.55
22.5 92 90 84 * * 88.67 4.16
30 95 89 90 * * 91.33 3.21
37.5 81 86 77 * * 81.33 4.51
45 82 86 82 * * 83.33 2.31
52.5 85 82 87 * * 84.67 2.52
60 71 67 76 * * 71.33 4.51
67.5 77 77 82 * * 78.67 2.89
75 72 68 72 * * 70.67 2.31
82.5 71 67 67 * * 68.33 2.31
90 71 64 64 * * 66.33 4.04
Trial 2
7.5 95 102 95 * * 97.33 4.04
15 97 84 96 * * 92.33 7.23
22.5 88 98 99 * * 95.00 6.08
30 103 97 98 * * 99.33 3.21
37.5 102 80 92 * * 91.33 11.02
45 85 73 89 * * 82.33 8.33
52.5 78 75 73 * * 75.33 2.52
60 81 73 80 * * 78.00 4.36
67.5 89 79 81 * * 83.00 5.29
75 77 70 85 * * 77.33 7.51
82.5 68 64 67 * * 66.33 2.08
90 58 58 55 * * 57.00 1.73
Trial 3
7.5 62 56 74 77 70 67.80 8.67
15 66 67 72 70 72 69.40 2.79
22.5 70 68 61 68 70 67.40 3.71
30 87 79 68 64 65 72.60 10.01
37.5 73 78 67 71 64 70.60 5.41
45 72 67 67 69 63 67.60 3.29
52.5 65 68 64 52 58 61.40 6.39

95
60 66 67 64 64 59 64.00 3.08
67.5 75 69 67 64 63 67.60 4.77
75 63 68 67 61 58 63.40 4.16
82.5 63 66 66 61 58 62.80 3.42
90 62 63 62 63 57 61.40 2.51
Table 34: Surface roughness measurements for ADI GR900 at 750 fpm (Depth of cut = 0.06 in,
feed rate = 0.012 ipr)
Cut length
(in)
Reading 1
(uin)
Reading 2
(uin)
Reading 3
(uin)
Reading 4
(uin)
Reading 5
(uin)
Average
roughness
(uin)
standard
deviation
(uin)
Trial 1
7.5 99 103 99 * * 100.33 2.31
15 92 99 94 * * 95.00 3.61
22.5 87 84 93 * * 88.00 4.58
30 75 82 87 * * 81.33 6.03
37.5 78 70 64 * * 70.67 7.02
45 64 76 64 * * 68.00 6.93
52.5 78 57 49 * * 61.33 14.98
Trial 2
7.5 87 97 103 * * 95.67 8.08
15 89 87 92 * * 89.33 2.52
22.5 85 80 83 * * 82.67 2.52
30 70 68 81 * * 73.00 7.00
37.5 65 64 67 * * 65.33 1.53
45 56 57 54 * * 55.67 1.53
Trial 3
7.5 65 62 65 72 72 67.20 4.55
15 57 59 67 65 70 63.60 5.46
22.5 63 67 58 63 56 61.40 4.39
30 64 69 65 63 67 65.60 2.41
37.5 31 38 55 54 62 48.00 12.94
45 56 79 76 56 46 62.60 14.24

96
Table 35: Surface roughness measurements for ADI GR900 at 1000 fpm (Depth of cut = 0.06 in,
feed rate = 0.012 ipr)
Cut length
(in)
Reading 1
(uin)
Reading 2
(uin)
Reading 3
(uin)
Reading 4
(uin)
Reading 5
(uin)
Average
roughness
(uin)
standard
deviation
(uin)
Trial 1
7.5 * * * * * * *
15 * * * * * * *
22.5 * * * * * * *
30 * * * * * * *
37.5 54 52 58 * * 54.67 3.06
45 53 69 57 * * 59.67 8.33
Trial 2
7.5 70 58 47 * * 58.33 11.50
15 36 46 57 * * 46.33 10.50
22.5 33 31 40 * * 34.67 4.73
30 35 36 28 * * 33.00 4.36
Trial 3
7.5 62 62 63 69 73 65.80 4.97
15 53 57 58 63 65 59.20 4.82
22.5 41 31 38 42 47 39.80 5.89
30 35 39 41 42 33 38.00 3.87
Table 36: Surface roughness measurements for ADI GR1050 at 375 fpm (Depth of cut = 0.06 in,
feed rate = 0.012 ipr)
Cut length
(in)
Reading 1
(uin)
Reading 2
(uin)
Reading 3
(uin)
Reading 4
(uin)
Reading 5
(uin)
Average
roughness
(uin)
standard
deviation
(uin)
Trial 1
7.5 75 76 82 91 80 80.80 *
15 94 100 90 88 82 90.80 *
22.5 106 92 93 103 92 97.20 *
30 116 101 106 99 104 105.20 *
37.5 124 119 107 95 108 110.60 *
45 125 121 119 110 110 117.00 *
52.5 111 127 122 117 121 119.60 *
60 137 145 128 130 130 134.00 *

97
Table 37: Surface roughness measurements for ADI GR1050 at 500 fpm (Depth of cut = 0.06 in,
feed rate = 0.012 ipr)
Cut length
(in)
Reading 1
(uin)
Reading 2
(uin)
Reading 3
(uin)
Reading 4
(uin)
Reading 5
(uin)
Average
roughness
(uin)
standard
deviation
(uin)
Trial 1
7.5 71 77 82 * * 76.67 5.51
15 68 74 94 * * 78.67 13.61
22.5 64 65 72 * * 67.00 4.36
30 63 61 65 * * 63.00 2.00
37.5 65 62 65 * * 64.00 1.73
45 56 52 51 * * 53.00 2.65
52.5 63 59 58 * * 60.00 2.65
60 57 61 62 * * 60.00 2.65
67.5 60 58 57 * * 58.33 1.53
75 35 45 52 * * 44.00 8.54
Trial 2
7.5 76 79 86 * * 80.33 5.13
15 78 71 72 * * 73.67 3.79
22.5 80 82 88 * * 83.33 4.16
30 84 77 75 * * 78.67 4.73
37.5 73 74 67 * * 71.33 3.79
45 73 69 74 * * 72.00 2.65
52.5 71 68 65 * * 68.00 3.00
60 73 67 63 * * 67.67 5.03
67.5 61 71 75 * * 69.00 7.21
75 38 52 63 * * 51.00 12.53
Trial 3
7.5 69 62 67 64 67 65.80 3.61
15 64 62 68 62 57 62.60 3.97
22.5 83 73 65 71 71 72.60 6.54
30 64 71 62 64 63 64.80 3.56
37.5 63 62 64 64 64 63.40 0.89
45 62 66 62 63 60 62.60 2.19
52.5 61 64 63 70 69 65.40 3.91
60 58 71 64 62 62 63.40 4.77
67.5 52 56 57 59 56 56.00 2.55
75 50 46 47 38 41 44.40 4.83
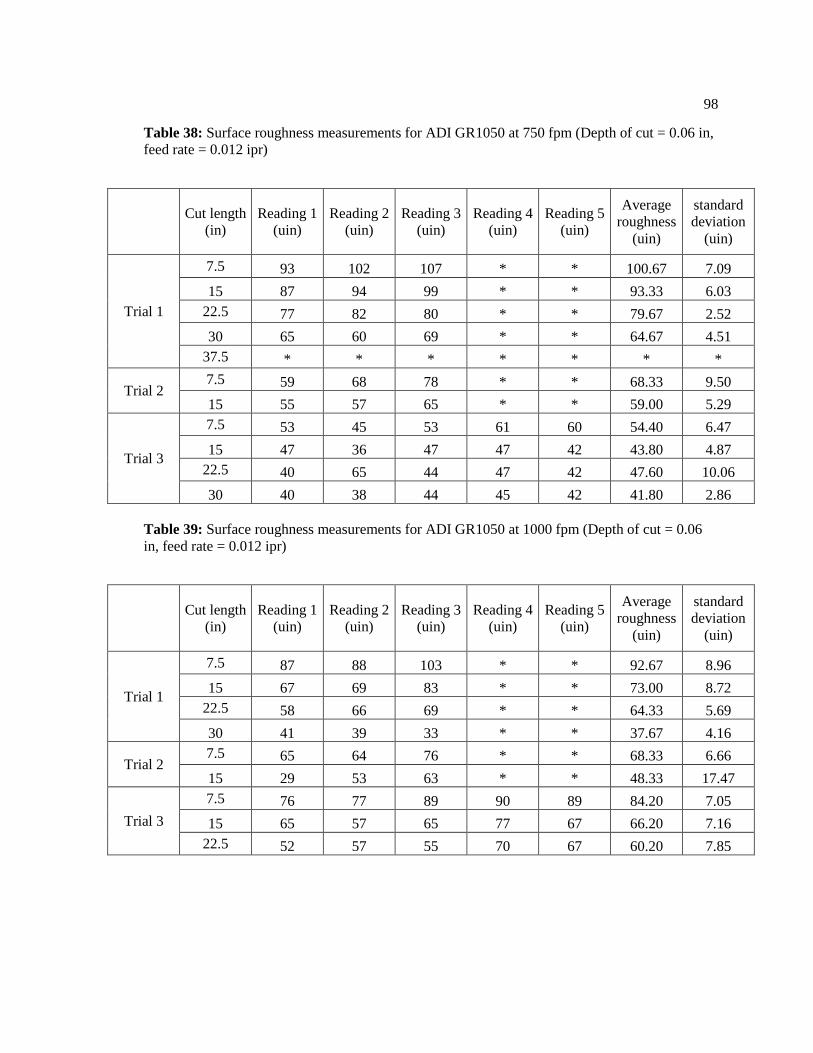
98
Table 38: Surface roughness measurements for ADI GR1050 at 750 fpm (Depth of cut = 0.06 in,
feed rate = 0.012 ipr)
Cut length
(in)
Reading 1
(uin)
Reading 2
(uin)
Reading 3
(uin)
Reading 4
(uin)
Reading 5
(uin)
Average
roughness
(uin)
standard
deviation
(uin)
Trial 1
7.5 93 102 107 * * 100.67 7.09
15 87 94 99 * * 93.33 6.03
22.5 77 82 80 * * 79.67 2.52
30 65 60 69 * * 64.67 4.51
37.5 * * * * * * *
Trial 2 7.5 59 68 78 * * 68.33 9.50
15 55 57 65 * * 59.00 5.29
Trial 3
7.5 53 45 53 61 60 54.40 6.47
15 47 36 47 47 42 43.80 4.87
22.5 40 65 44 47 42 47.60 10.06
30 40 38 44 45 42 41.80 2.86
Table 39: Surface roughness measurements for ADI GR1050 at 1000 fpm (Depth of cut = 0.06
in, feed rate = 0.012 ipr)
Cut length
(in)
Reading 1
(uin)
Reading 2
(uin)
Reading 3
(uin)
Reading 4
(uin)
Reading 5
(uin)
Average
roughness
(uin)
standard
deviation
(uin)
Trial 1
7.5 87 88 103 * * 92.67 8.96
15 67 69 83 * * 73.00 8.72
22.5 58 66 69 * * 64.33 5.69
30 41 39 33 * * 37.67 4.16
Trial 2 7.5 65 64 76 * * 68.33 6.66
15 29 53 63 * * 48.33 17.47
Trial 3
7.5 76 77 89 90 89 84.20 7.05
15 65 57 65 77 67 66.20 7.16
22.5 52 57 55 70 67 60.20 7.85
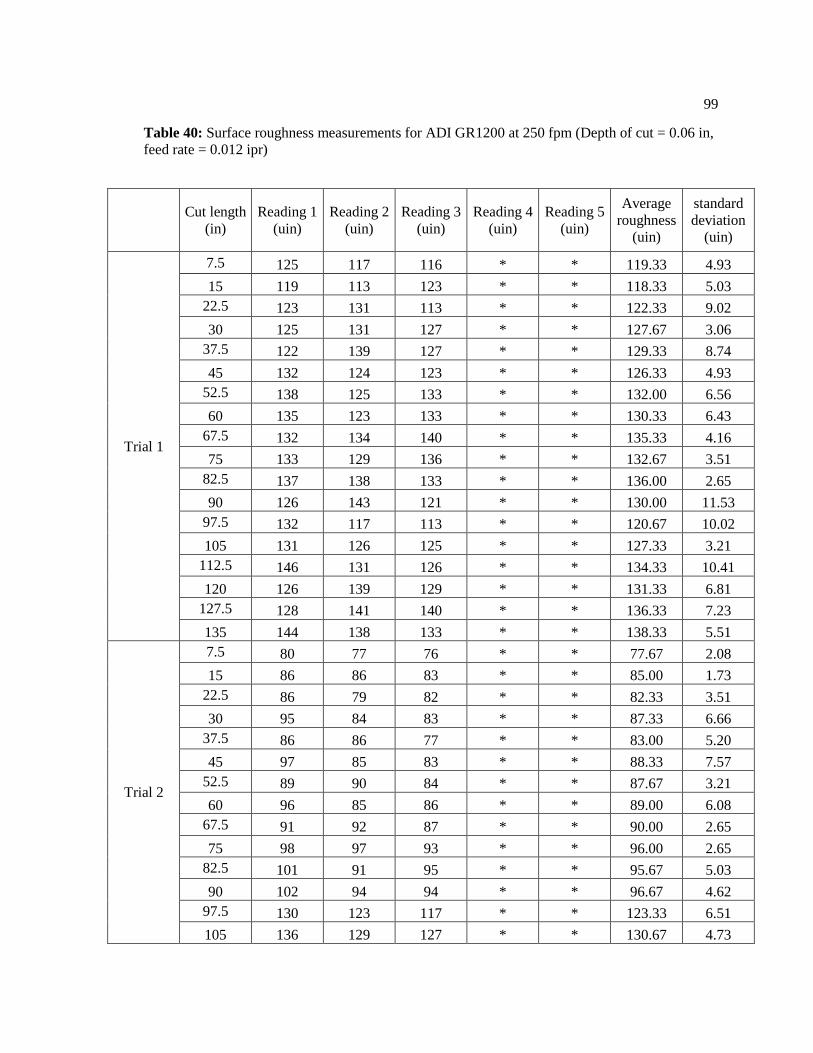
99
Table 40: Surface roughness measurements for ADI GR1200 at 250 fpm (Depth of cut = 0.06 in,
feed rate = 0.012 ipr)
Cut length
(in)
Reading 1
(uin)
Reading 2
(uin)
Reading 3
(uin)
Reading 4
(uin)
Reading 5
(uin)
Average
roughness
(uin)
standard
deviation
(uin)
Trial 1
7.5 125 117 116 * * 119.33 4.93
15 119 113 123 * * 118.33 5.03
22.5 123 131 113 * * 122.33 9.02
30 125 131 127 * * 127.67 3.06
37.5 122 139 127 * * 129.33 8.74
45 132 124 123 * * 126.33 4.93
52.5 138 125 133 * * 132.00 6.56
60 135 123 133 * * 130.33 6.43
67.5 132 134 140 * * 135.33 4.16
75 133 129 136 * * 132.67 3.51
82.5 137 138 133 * * 136.00 2.65
90 126 143 121 * * 130.00 11.53
97.5 132 117 113 * * 120.67 10.02
105 131 126 125 * * 127.33 3.21
112.5 146 131 126 * * 134.33 10.41
120 126 139 129 * * 131.33 6.81
127.5 128 141 140 * * 136.33 7.23
135 144 138 133 * * 138.33 5.51
Trial 2
7.5 80 77 76 * * 77.67 2.08
15 86 86 83 * * 85.00 1.73
22.5 86 79 82 * * 82.33 3.51
30 95 84 83 * * 87.33 6.66
37.5 86 86 77 * * 83.00 5.20
45 97 85 83 * * 88.33 7.57
52.5 89 90 84 * * 87.67 3.21
60 96 85 86 * * 89.00 6.08
67.5 91 92 87 * * 90.00 2.65
75 98 97 93 * * 96.00 2.65
82.5 101 91 95 * * 95.67 5.03
90 102 94 94 * * 96.67 4.62
97.5 130 123 117 * * 123.33 6.51
105 136 129 127 * * 130.67 4.73

100
112.5 131 143 132 * * 135.33 6.66
120 126 143 145 * * 138.00 10.44
127.5 135 142 137 * * 138.00 3.61
135 135 143 143 * * 140.33 4.62
Trial 3
7.5 86 80 82 90 70 81.60 7.54
15 101 93 93 84 77 89.60 9.26
22.5 105 95 103 93 100 99.20 5.12
30 104 92 96 100 100 98.40 4.56
37.5 104 96 103 98 98 99.80 3.49
45 103 110 101 99 103 103.20 4.15
52.5 107 99 116 103 101 105.20 6.72
60 105 98 105 106 110 104.80 4.32
67.5 98 90 103 105 106 100.40 6.58
75 51 71 87 81 72 72.40 13.67
82.5 67 64 42 33 31 47.40 17.07

101
Table 41: Surface roughness measurements for ADI GR1200 at 300 fpm (Depth of cut = 0.06 in,
feed rate = 0.012 ipr)
Cut length
(in)
Reading 1
(uin)
Reading 2
(uin)
Reading 3
(uin)
Reading 4
(uin)
Reading 5
(uin)
Average
roughness
(uin)
standard
deviation
(uin)
Trial 1
7.5 91 94 92 * * 92.33 1.53
15 136 114 110 * * 120.00 14.00
22.5 107 139 139 * * 128.33 18.48
30 159 158 119 * * 145.33 22.81
37.5 144 152 131 * * 142.33 10.60
45 139 138 125 * * 134.00 7.81
52.5 135 136 136 * * 135.67 0.58
60 130 134 136 * * 133.33 3.06
67.5 132 129 119 * * 126.67 6.81
75 116 111 101 * * 109.33 7.64
82.5 46 79 91 * * 72.00 23.30
Trial 2
7.5 89 83 84 * * 85.33 3.21
15 129 110 109 * * 116.00 11.27
22.5 122 133 124 * * 126.33 5.86
30 137 143 156 * * 145.33 9.71
37.5 149 137 151 * * 145.67 7.57
45 102 115 132 * * 116.33 15.04
52.5 124 122 119 * * 121.67 2.52
60 123 123 126 * * 124.00 1.73
67.5 119 117 110 * * 115.33 4.73
75 65 78 72 * * 71.67 6.51
82.5 49 78 72 * * 66.33 15.31
Trial 3
7.5 78 69 78 79 73 75.40 4.28
15 113 100 95 90 80 95.60 12.22
22.5 113 99 112 107 103 106.80 5.93
30 98 103 105 124 115 109.00 10.42
37.5 100 99 117 108 107 106.20 7.26
45 37 56 85 90 92 72.00 24.36
52.5 71 73 86 63 53 69.20 12.26
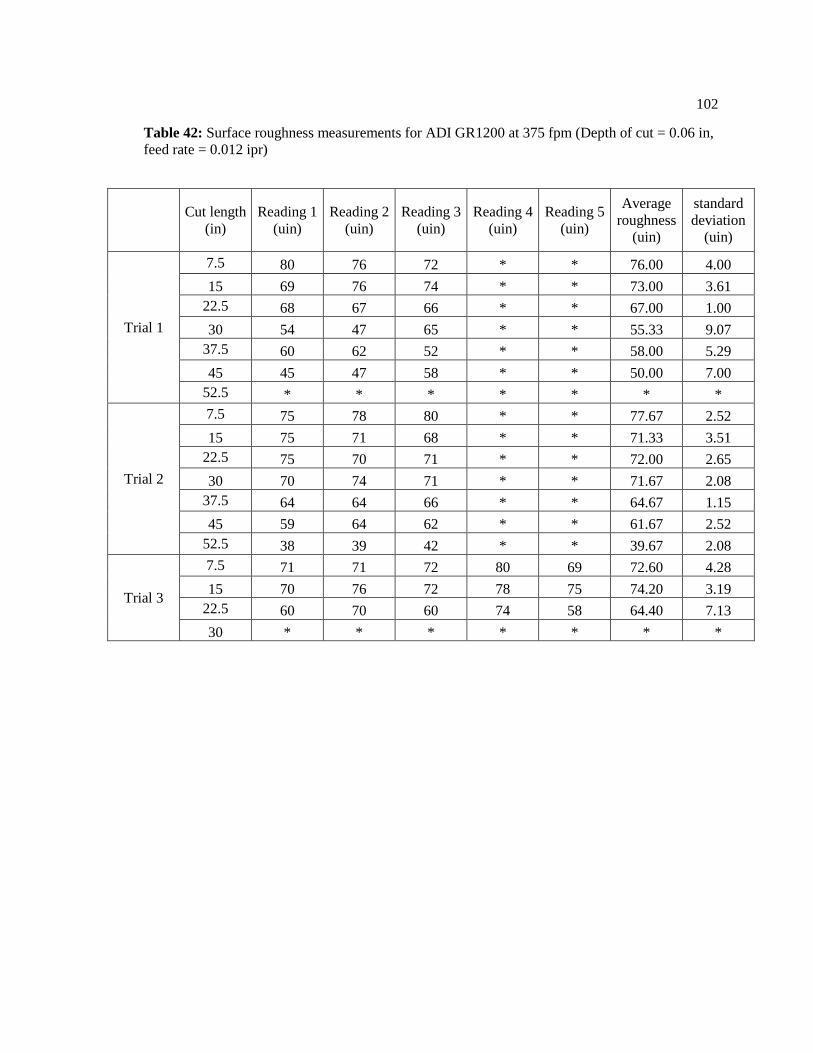
102
Table 42: Surface roughness measurements for ADI GR1200 at 375 fpm (Depth of cut = 0.06 in,
feed rate = 0.012 ipr)
Cut length
(in)
Reading 1
(uin)
Reading 2
(uin)
Reading 3
(uin)
Reading 4
(uin)
Reading 5
(uin)
Average
roughness
(uin)
standard
deviation
(uin)
Trial 1
7.5 80 76 72 * * 76.00 4.00
15 69 76 74 * * 73.00 3.61
22.5 68 67 66 * * 67.00 1.00
30 54 47 65 * * 55.33 9.07
37.5 60 62 52 * * 58.00 5.29
45 45 47 58 * * 50.00 7.00
52.5 * * * * * * *
Trial 2
7.5 75 78 80 * * 77.67 2.52
15 75 71 68 * * 71.33 3.51
22.5 75 70 71 * * 72.00 2.65
30 70 74 71 * * 71.67 2.08
37.5 64 64 66 * * 64.67 1.15
45 59 64 62 * * 61.67 2.52
52.5 38 39 42 * * 39.67 2.08
Trial 3
7.5 71 71 72 80 69 72.60 4.28
15 70 76 72 78 75 74.20 3.19
22.5 60 70 60 74 58 64.40 7.13
30 * * * * * * *
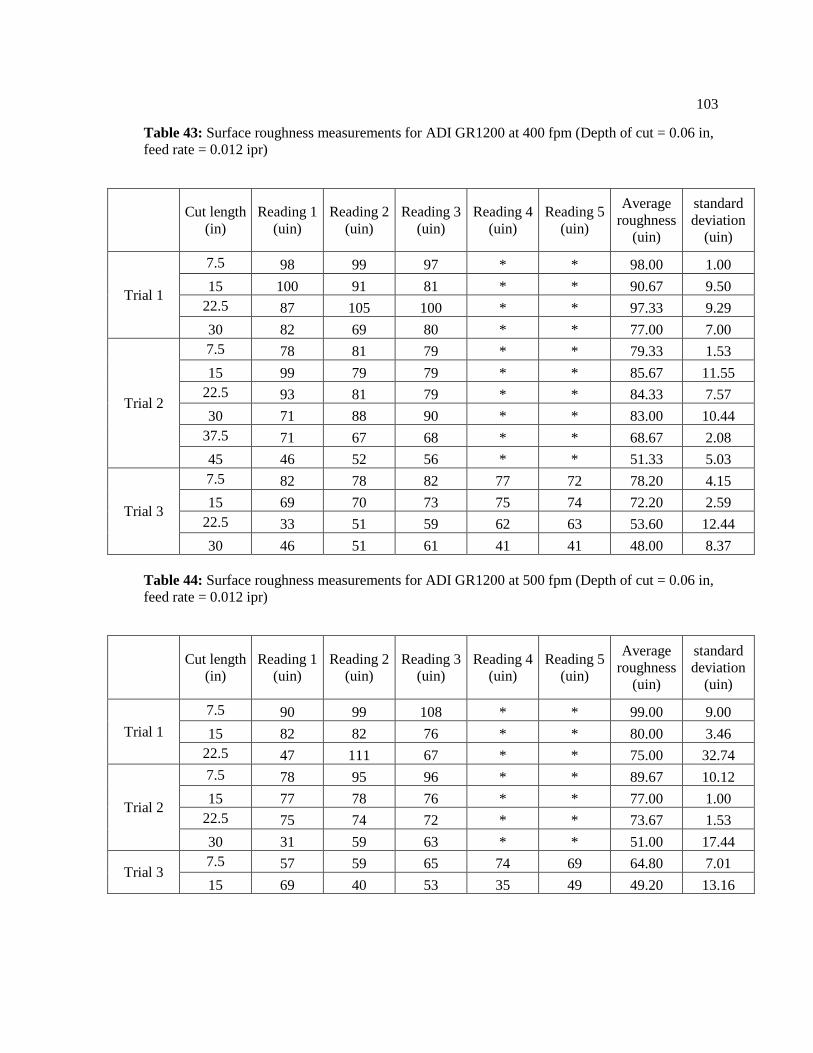
103
Table 43: Surface roughness measurements for ADI GR1200 at 400 fpm (Depth of cut = 0.06 in,
feed rate = 0.012 ipr)
Cut length
(in)
Reading 1
(uin)
Reading 2
(uin)
Reading 3
(uin)
Reading 4
(uin)
Reading 5
(uin)
Average
roughness
(uin)
standard
deviation
(uin)
Trial 1
7.5 98 99 97 * * 98.00 1.00
15 100 91 81 * * 90.67 9.50
22.5 87 105 100 * * 97.33 9.29
30 82 69 80 * * 77.00 7.00
Trial 2
7.5 78 81 79 * * 79.33 1.53
15 99 79 79 * * 85.67 11.55
22.5 93 81 79 * * 84.33 7.57
30 71 88 90 * * 83.00 10.44
37.5 71 67 68 * * 68.67 2.08
45 46 52 56 * * 51.33 5.03
Trial 3
7.5 82 78 82 77 72 78.20 4.15
15 69 70 73 75 74 72.20 2.59
22.5 33 51 59 62 63 53.60 12.44
30 46 51 61 41 41 48.00 8.37
Table 44: Surface roughness measurements for ADI GR1200 at 500 fpm (Depth of cut = 0.06 in,
feed rate = 0.012 ipr)
Cut length
(in)
Reading 1
(uin)
Reading 2
(uin)
Reading 3
(uin)
Reading 4
(uin)
Reading 5
(uin)
Average
roughness
(uin)
standard
deviation
(uin)
Trial 1
7.5 90 99 108 * * 99.00 9.00
15 82 82 76 * * 80.00 3.46
22.5 47 111 67 * * 75.00 32.74
Trial 2
7.5 78 95 96 * * 89.67 10.12
15 77 78 76 * * 77.00 1.00
22.5 75 74 72 * * 73.67 1.53
30 31 59 63 * * 51.00 17.44
Trial 3 7.5 57 59 65 74 69 64.80 7.01
15 69 40 53 35 49 49.20 13.16

104
Table 45: Surface roughness measurements for DI 100-70-03 at 500 fpm (Depth of cut = 0.06 in,
feed rate = 0.012 ipr)
Cut length
(in)
Reading 1
(uin)
Reading 2
(uin)
Reading 3
(uin)
Reading 4
(uin)
Reading 5
(uin)
Average
roughness
(uin)
standard
deviation
(uin)
Trial 1
7.5 113 97 104 * * 104.67 8.02
15 98 92 91 * * 93.67 3.79
22.5 108 89 96 * * 97.67 9.61
30 89 86 80 * * 85.00 4.58
37.5 89 94 91 * * 91.33 2.52
45 88 87 85 * * 86.67 1.53
52.5 86 80 84 * * 83.33 3.06
60 91 88 83 * * 87.33 4.04
67.5 89 85 88 * * 87.33 2.08
75 93 82 86 * * 87.00 5.57
82.5 82 84 83 * * 83.00 1.00
90 88 81 79 * * 82.67 4.73
97.5 141 112 120 * * 124.33 14.98
105 108 101 109 * * 106.00 4.36
112.5 105 103 113 * * 107.00 5.29
120 127 117 113 * * 119.00 7.21
127.5 115 107 107 * * 109.67 4.62
135 128 109 109 * * 115.33 10.97
142.5 112 115 110 * * 112.33 2.52
150 108 116 105 * * 109.67 5.69
157.5 111 111 103 * * 108.33 4.62
165 95 113 97 * * 101.67 9.87
172.5 112 109 109 * * 110.00 1.73
180 109 101 107 * * 105.67 4.16
187.5 123 103 124 * * 116.67 11.85
195 112 106 111 * * 109.67 3.21
202.5 108 109 104 * * 107.00 2.65
210 106 116 100 * * 107.33 8.08
217.5 118 108 104 * * 110.00 7.21
225 109 114 106 * * 109.67 4.04
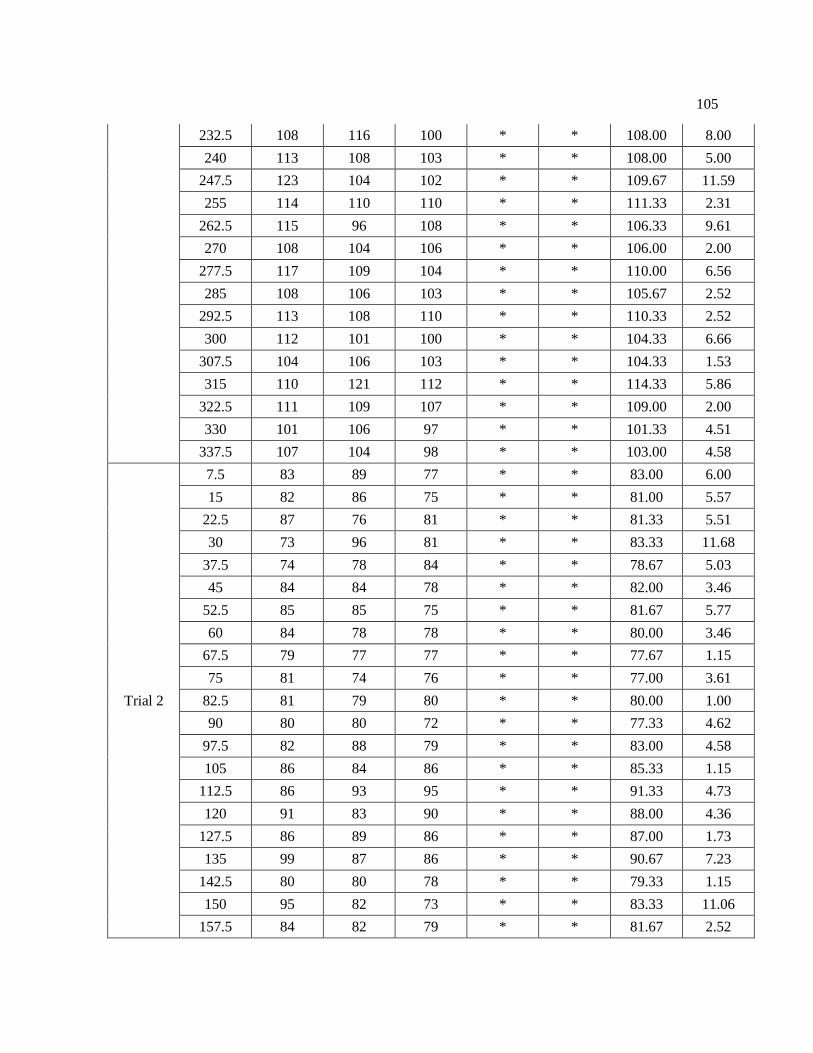
105
232.5 108 116 100 * * 108.00 8.00
240 113 108 103 * * 108.00 5.00
247.5 123 104 102 * * 109.67 11.59
255 114 110 110 * * 111.33 2.31
262.5 115 96 108 * * 106.33 9.61
270 108 104 106 * * 106.00 2.00
277.5 117 109 104 * * 110.00 6.56
285 108 106 103 * * 105.67 2.52
292.5 113 108 110 * * 110.33 2.52
300 112 101 100 * * 104.33 6.66
307.5 104 106 103 * * 104.33 1.53
315 110 121 112 * * 114.33 5.86
322.5 111 109 107 * * 109.00 2.00
330 101 106 97 * * 101.33 4.51
337.5 107 104 98 * * 103.00 4.58
Trial 2
7.5 83 89 77 * * 83.00 6.00
15 82 86 75 * * 81.00 5.57
22.5 87 76 81 * * 81.33 5.51
30 73 96 81 * * 83.33 11.68
37.5 74 78 84 * * 78.67 5.03
45 84 84 78 * * 82.00 3.46
52.5 85 85 75 * * 81.67 5.77
60 84 78 78 * * 80.00 3.46
67.5 79 77 77 * * 77.67 1.15
75 81 74 76 * * 77.00 3.61
82.5 81 79 80 * * 80.00 1.00
90 80 80 72 * * 77.33 4.62
97.5 82 88 79 * * 83.00 4.58
105 86 84 86 * * 85.33 1.15
112.5 86 93 95 * * 91.33 4.73
120 91 83 90 * * 88.00 4.36
127.5 86 89 86 * * 87.00 1.73
135 99 87 86 * * 90.67 7.23
142.5 80 80 78 * * 79.33 1.15
150 95 82 73 * * 83.33 11.06
157.5 84 82 79 * * 81.67 2.52
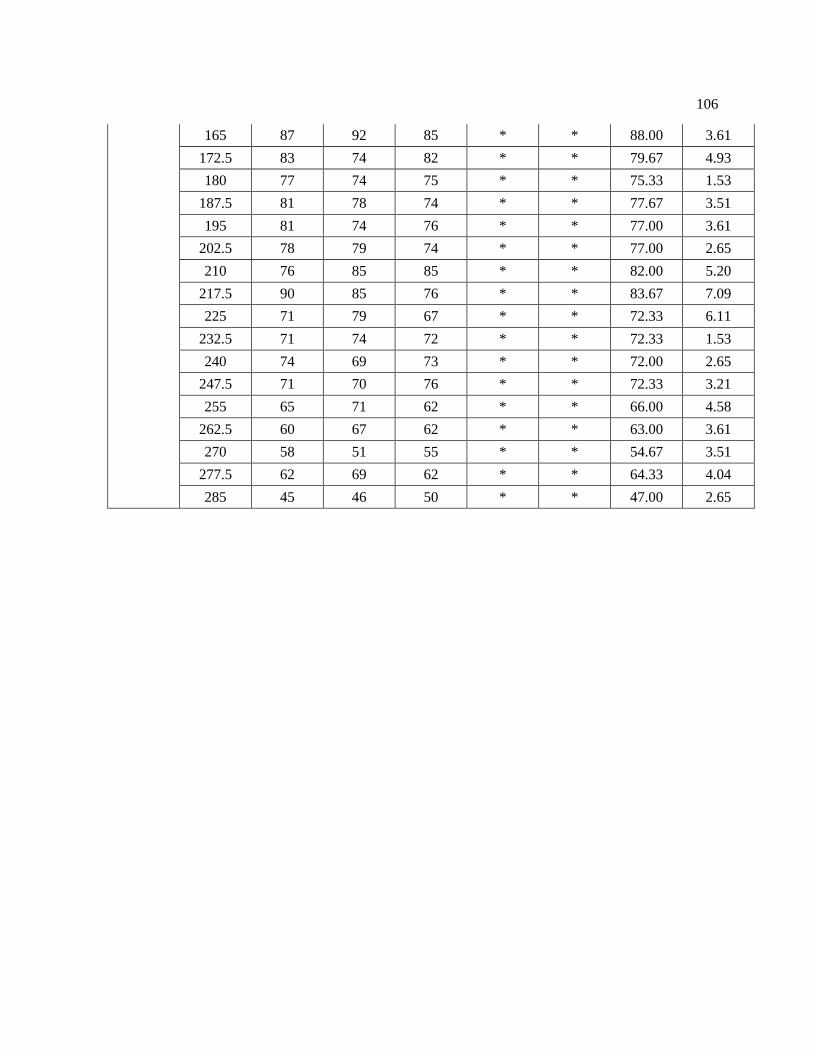
106
165 87 92 85 * * 88.00 3.61
172.5 83 74 82 * * 79.67 4.93
180 77 74 75 * * 75.33 1.53
187.5 81 78 74 * * 77.67 3.51
195 81 74 76 * * 77.00 3.61
202.5 78 79 74 * * 77.00 2.65
210 76 85 85 * * 82.00 5.20
217.5 90 85 76 * * 83.67 7.09
225 71 79 67 * * 72.33 6.11
232.5 71 74 72 * * 72.33 1.53
240 74 69 73 * * 72.00 2.65
247.5 71 70 76 * * 72.33 3.21
255 65 71 62 * * 66.00 4.58
262.5 60 67 62 * * 63.00 3.61
270 58 51 55 * * 54.67 3.51
277.5 62 69 62 * * 64.33 4.04
285 45 46 50 * * 47.00 2.65
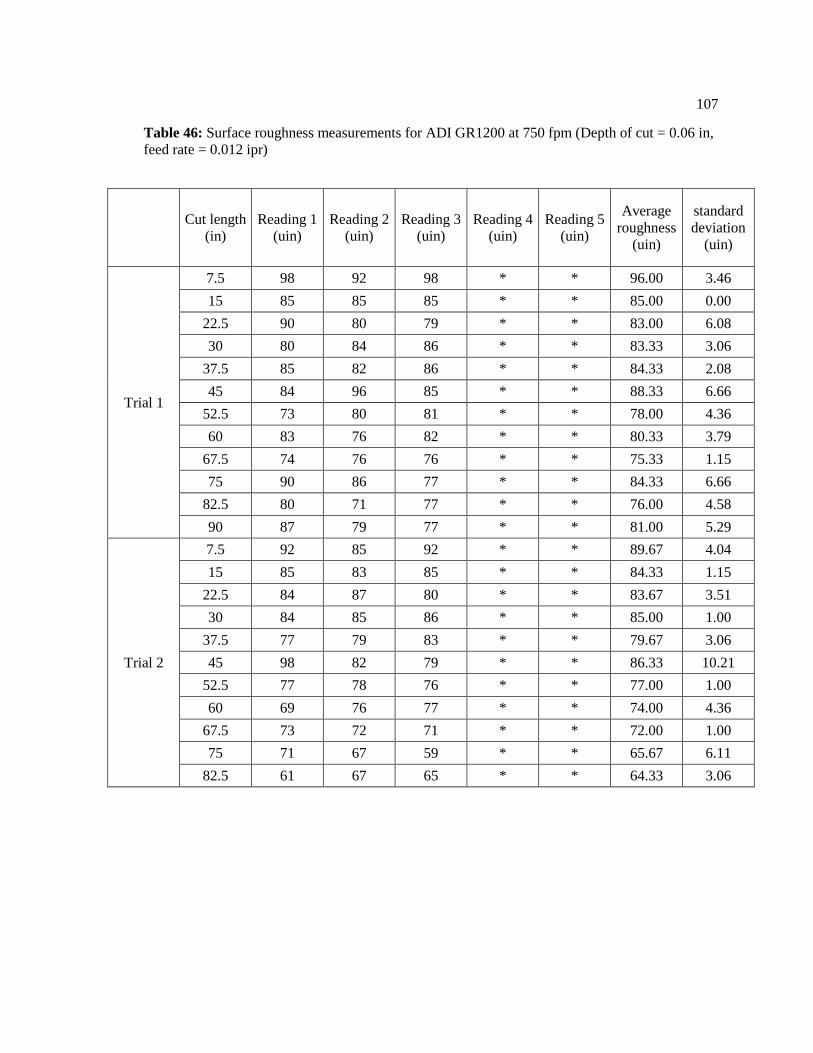
107
Table 46: Surface roughness measurements for ADI GR1200 at 750 fpm (Depth of cut = 0.06 in,
feed rate = 0.012 ipr)
Cut length
(in)
Reading 1
(uin)
Reading 2
(uin)
Reading 3
(uin)
Reading 4
(uin)
Reading 5
(uin)
Average
roughness
(uin)
standard
deviation
(uin)
Trial 1
7.5 98 92 98 * * 96.00 3.46
15 85 85 85 * * 85.00 0.00
22.5 90 80 79 * * 83.00 6.08
30 80 84 86 * * 83.33 3.06
37.5 85 82 86 * * 84.33 2.08
45 84 96 85 * * 88.33 6.66
52.5 73 80 81 * * 78.00 4.36
60 83 76 82 * * 80.33 3.79
67.5 74 76 76 * * 75.33 1.15
75 90 86 77 * * 84.33 6.66
82.5 80 71 77 * * 76.00 4.58
90 87 79 77 * * 81.00 5.29
Trial 2
7.5 92 85 92 * * 89.67 4.04
15 85 83 85 * * 84.33 1.15
22.5 84 87 80 * * 83.67 3.51
30 84 85 86 * * 85.00 1.00
37.5 77 79 83 * * 79.67 3.06
45 98 82 79 * * 86.33 10.21
52.5 77 78 76 * * 77.00 1.00
60 69 76 77 * * 74.00 4.36
67.5 73 72 71 * * 72.00 1.00
75 71 67 59 * * 65.67 6.11
82.5 61 67 65 * * 64.33 3.06

108
Table 47: Surface roughness measurements for ADI GR1200 at 1000 fpm (Depth of cut = 0.06
in, feed rate = 0.012 ipr)
Cut length
(in)
Reading 1
(uin)
Reading 2
(uin)
Reading 3
(uin)
Reading 4
(uin)
Reading 5
(uin)
Average
roughness
(uin)
standard
deviation
(uin)
Trial 1
7.5 65 73 79 * * 72.33 7.02
15 64 64 68 * * 65.33 2.31
22.5 65 62 61 * * 62.67 2.08
30 57 59 60 * * 58.67 1.53
37.5 58 53 64 * * 58.33 5.51
45 50 47 51 * * 49.33 2.08
Trial 2
7.5 74 65 68 * * 69.00 4.58
15 65 70 63 * * 66.00 3.61
22.5 74 63 63 * * 66.67 6.35
30 50 55 52 * * 52.33 2.52
37.5 40 49 55 * * 48.00 7.55
45 48 47 44 * * 46.33 2.08
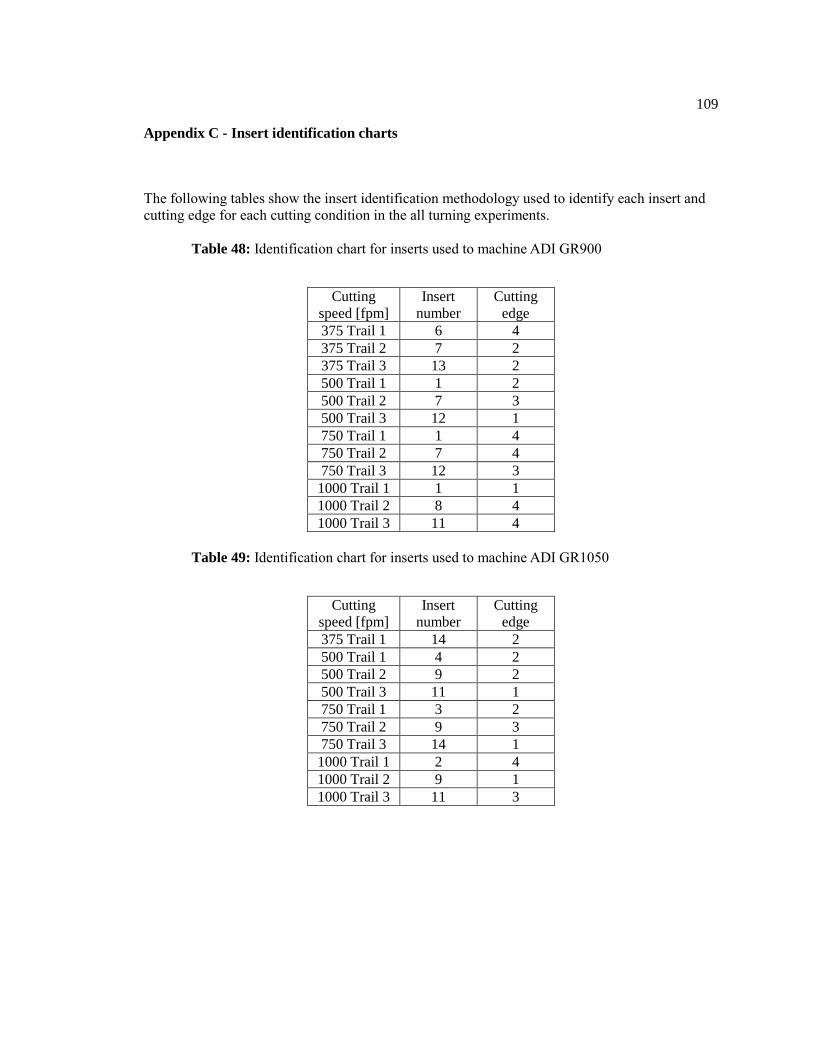
109
Appendix C - Insert identification charts
The following tables show the insert identification methodology used to identify each insert and
cutting edge for each cutting condition in the all turning experiments.
Table 48: Identification chart for inserts used to machine ADI GR900
Cutting
speed [fpm]
Insert
number
Cutting
edge
375 Trail 1 6 4
375 Trail 2 7 2
375 Trail 3 13 2
500 Trail 1 1 2
500 Trail 2 7 3
500 Trail 3 12 1
750 Trail 1 1 4
750 Trail 2 7 4
750 Trail 3 12 3
1000 Trail 1 1 1
1000 Trail 2 8 4
1000 Trail 3 11 4
Table 49: Identification chart for inserts used to machine ADI GR1050
Cutting
speed [fpm]
Insert
number
Cutting
edge
375 Trail 1 14 2
500 Trail 1 4 2
500 Trail 2 9 2
500 Trail 3 11 1
750 Trail 1 3 2
750 Trail 2 9 3
750 Trail 3 14 1
1000 Trail 1 2 4
1000 Trail 2 9 1
1000 Trail 3 11 3
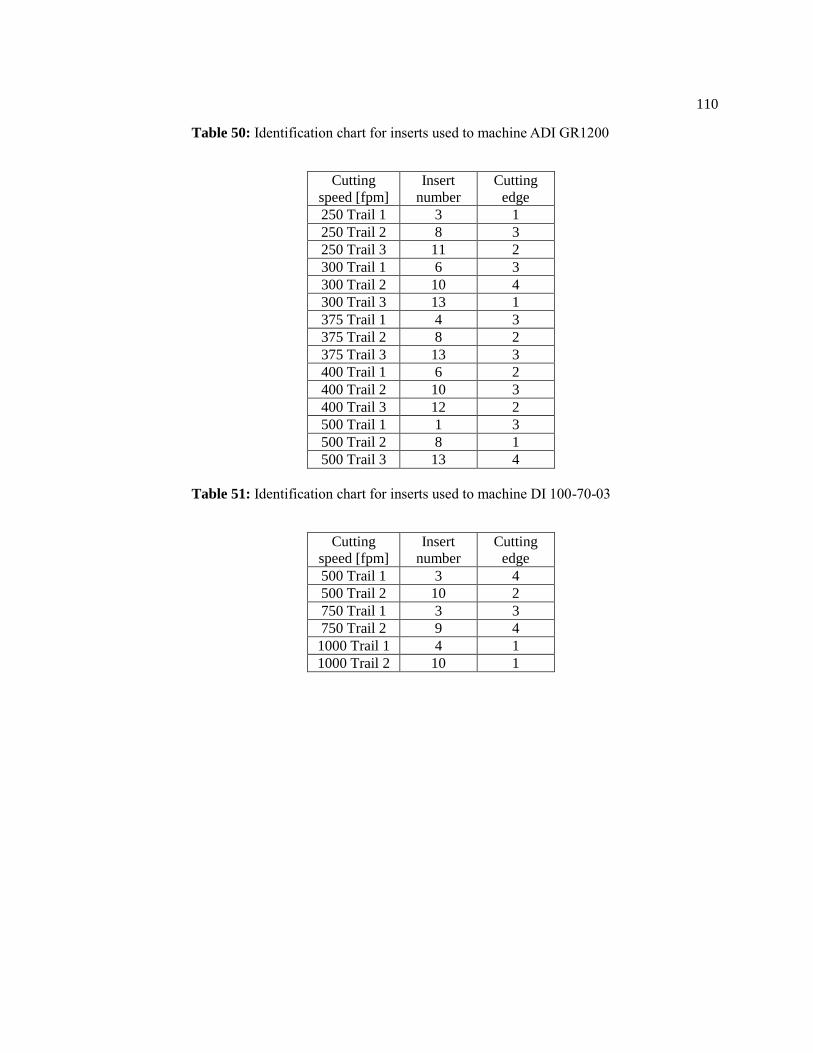
110
Table 50: Identification chart for inserts used to machine ADI GR1200
Cutting
speed [fpm]
Insert
number
Cutting
edge
250 Trail 1 3 1
250 Trail 2 8 3
250 Trail 3 11 2
300 Trail 1 6 3
300 Trail 2 10 4
300 Trail 3 13 1
375 Trail 1 4 3
375 Trail 2 8 2
375 Trail 3 13 3
400 Trail 1 6 2
400 Trail 2 10 3
400 Trail 3 12 2
500 Trail 1 1 3
500 Trail 2 8 1
500 Trail 3 13 4
Table 51: Identification chart for inserts used to machine DI 100-70-03
Cutting
speed [fpm]
Insert
number
Cutting
edge
500 Trail 1 3 4
500 Trail 2 10 2
750 Trail 1 3 3
750 Trail 2 9 4
1000 Trail 1 4 1
1000 Trail 2 10 1
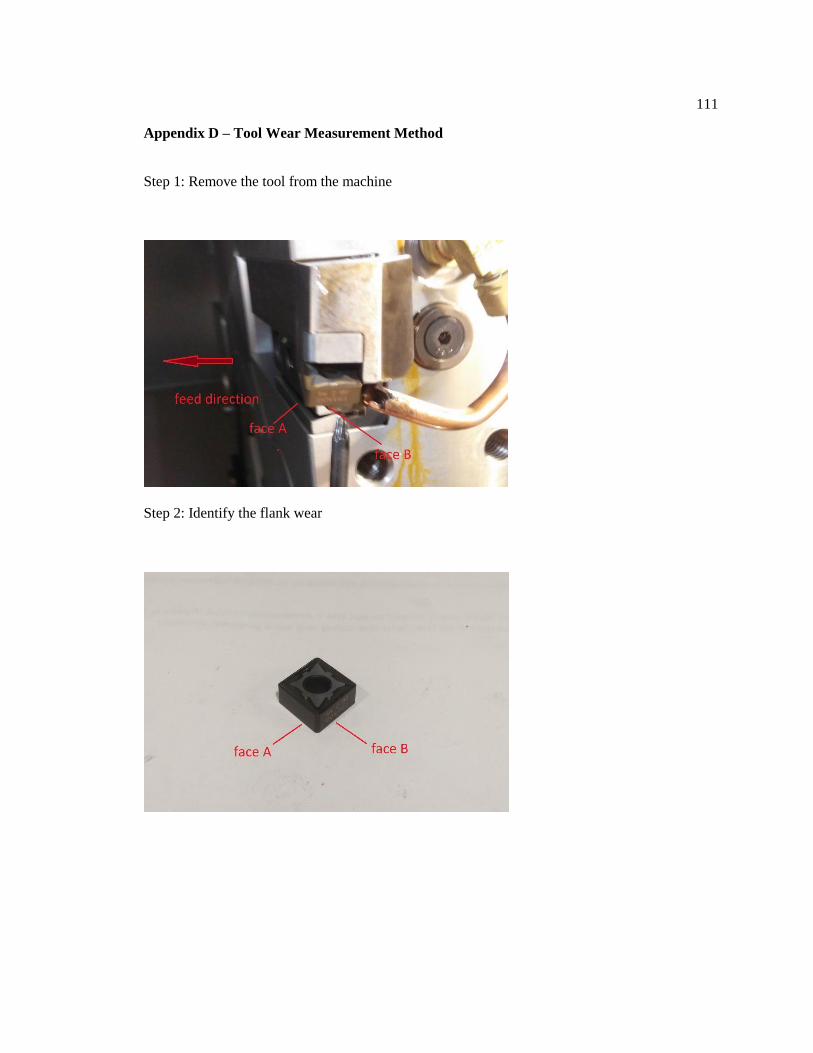
111
Appendix D – Tool Wear Measurement Method
Step 1: Remove the tool from the machine
Step 2: Identify the flank wear

112
Step 3: Place the insert on the fixture plate
Step 4: Measure the face B tool wear and record the result