a screening model for simulating dnapl flow and transport in porous media: theoretical development
TRANSCRIPT

Environmental Modelling & Software 21 (2006) 16–32
www.elsevier.com/locate/envsoft
A screening model for simulating DNAPL flow and transportin porous media: theoretical development
Clinton S. Willsona,*, James W. Weaverb,1, Randall J. Charbeneauc,2
aDepartment of Civil and Environmental Engineering, 3418D CEBA, Louisiana State University,
Baton Rouge, LA 70803, USAbNational Exposure Research Laboratory, U.S. Environmental Protection Agency,
960 College Station Road, Athens, GA 30605, USAcEnvironmental and Water Resources Engineering, Department of Civil Engineering, The University of
Texas at Austin, Austin, TX 78712, USA
Received 26 September 2003; received in revised form 22 June 2004; accepted 5 October 2004
Available online 15 December 2004
Abstract
In the last two decades there has been an increased awareness of the contamination of groundwater due to the presence of denser-
than-water nonaqueous phase liquids (DNAPLs). Numerous theoretical, experimental and numerical investigations have beenconducted to study the various processes that impact aquifer contamination. These studies have provided us with greater insight intothe individual processes and the complex nature of the problem. In spite of this progress, there still exists a need within theenvironmental community for a simple tool that will allow us to analyze a DNAPL contamination scenario from free-product
release to transport of soluble constituents to downgradient receptor wells. Such a model may be useful in source termcharacterization for DNAPL releases to groundwater. The objective of this manuscript is to present the conceptual model andformulate the equations and modules which are utilized in this screening model. Three hypothetical releases are simulated and the
results discussed to demonstrate the application and usefulness of this model. Due to its simplicity and ease of use, this screeningmodel will be useful to industry, regulatory agencies and educators for estimating the impact of a DNAPL release on an aquifer.� 2004 Elsevier Ltd. All rights reserved.
Keywords: Multiphase flow; Contaminant transport; Screening model
1. Introduction
Nonaqueous phase liquids that are denser-than-water(DNAPLs) are a major source of groundwater contam-ination due to their widespread use and historicalmethods of disposal. Most DNAPLs are characterizedby low viscosities and are therefore very mobile.Although DNAPLs are only slightly soluble in water,
* Corresponding author. Tel.: C1 225 578 8672; fax: C1 225 578
8652.
E-mail addresses: [email protected] (C.S. Willson), weaver.jim@
epamail.epa.gov (J.W. Weaver), [email protected] (R.J.
Charbeneau).1 Tel.: C1 405 355 8329.2 Tel.: C1 512 471 0070.
1364-8152/$ - see front matter � 2004 Elsevier Ltd. All rights reserved.
doi:10.1016/j.envsoft.2004.10.008
they or one or more of their constituents can haveaqueous solubilities that are orders of magnitude abovethe maximum contaminant levels established in the SafeDrinking Water Act.
If a sufficient volume of DNAPL is released so thatthe retention capacity of the unsaturated zone isexceeded, flow can pass through the capillary fringeand penetrate the saturated zone. The penetration of thewater table is very sensitive to heterogeneities and willoccur through regions where the entry pressures are thelowest (i.e., largest pore sizes). Due to the physicalproperties of the DNAPLs and natural aquifer hetero-geneities, the transport of DNAPL through the saturatedzone can be highly irregular (Schwille, 1988;Kueper et al.,1993). Following source depletion and redistribution,
17C.S. Willson et al. / Environmental Modelling & Software 21 (2006) 16–32
a highly complex distribution of free-phase DNAPL inboth residual and pooled states will reside in thesubsurface. The resulting DNAPL distribution createsa potentially long-term groundwater contaminationsource, and these characteristics and the toxicity of thesechemicals are what make assessment and remediation ofDNAPL-contaminated sites so difficult.
The simulation of subsurface multiphase, multicom-ponent flow and transport is a complex problem due tothe inherent complexity of multiphase systems and themarked heterogeneity that is characteristic of mostnatural environments (Gelhar, 1993). The accuratedescription of this problem requires mass and momen-tum balances; incorporation of physical phenomena thatoccur over several different length scales; and appropri-ate equations of state (EOS) and constitutive relationswhich provide closure to the system of formulatedbalance equations (Russell, 1996; Miller et al., 1998).Simplifying assumptions are essential and the EOS andconstitutive relations must be judiciously chosen toallow solutions while retaining accuracy. Multiphase,multicomponent models are theoretically useful fordifficult problems dealing with complex chemical inter-actions and/or highly variable hydraulic and porousmedia characteristics, or for remedial design. Unfortu-nately, these models require a large amount of field andchemical data to justify their use and require largeamounts of computer time and memory and a significantinvestment in user training. Furthermore, the observa-tions of transient flow and fluid emplacement that wouldprovide calibration data for multiphase flow and trans-portmodels are essentially never available as releases haveusually occurred long before any alarm was raised. Inaddition, the highly irregular distribution of DNAPL atmany sites defies detailed characterization by any means.
A simpler site/risk assessment approach is to usea groundwater flow and transport model with boundaryconditions which account for the mass transfer from oneor more stationary DNAPL sources. The source term isbased on experimentally- or mathematically-based con-ditions specific to DNAPLs (e.g., Anderson et al., 1992a;Johnson and Pankow, 1992). The transport models areuseful in that they are often easier to use than thecomplex multiphase models and can help investigatorsdetermine important parameters in remediationschemes. However, these models do not link thecontaminant transport with the release scenario or thefree-product characteristics (Anderson et al., 1992b).
Screening models provide an alternative to thesemodeling approaches. Screening models are based ona simplified interpretation of the hydrogeology, in-cluding the assumption of uniform aquifer flow ina specified direction and homogeneous conditions forother parameters (Charbeneau et al., 1995). Theseassumptions allow for the individual flow and transportproblems to be solved by analytic or semi-analytic
solutions. These solutions, which are coupled to formthe total model, have the advantage of simplicity, ease ofcomputation, and minimal (field and chemical) datarequirements. Screening models may be developedwhich capture, in an approximate sense, many of theimportant factors and processes that control the fateand behavior of chemicals in the environment. Screeningmodels (e.g., BIOPLUME III, BIOSCREEN) can alsobe linked with tools to evaluate potential risk (Khan andHusain, 2003) and for assessing aquifer vulnerability(Thirumalaivasan et al., 2003).
The U.S. Environmental Protection Agency (EPA)has developed a screening model, the Hydrocarbon SpillScreening Model (HSSM, Weaver et al., 1994a,b;Charbeneau et al., 1995) to investigate the contamina-tion of an aquifer due to a release of NAPLs that are lessdense than water (LNAPLs). HSSM simulates anLNAPL contamination event using three separatemodules: (1) a vadose zone flow and transport code(KOPT, Weaver et al., 1994a,b); (2) a model thatsimulates radial spreading of an LNAPL lens throughthe capillary fringe and dissolution of LNAPL constit-uents into a water table aquifer (OILENS); and (3)a contaminant transport model for estimating receptorwell concentrations (TSGPLUME). Over 3700 copies ofHSSM have been distributed to users in the U.S. andabroad. HSSM has been used to estimate the effects ofLNAPL loading, partition coefficients, groundwaterflow velocities, etc., on exposure levels at downgradientlocations (Weaver, 1996).
The objective of this paper is to present the devel-opment of a set of analytic and semi-analytic modules,consistent with the framework of HSSM, that simulatethe various processes associated with a DNAPL contam-ination event. These individual modules are then coupledto form a DNAPL screening model. The ultimateobjective of this research is the incorporation of thismodel into a HSSM version II. Because of the model’ssimplicity and the very real question as to whethercomprehensivemodels provide better estimates of aquifercontamination, especially under the typical conditions ofseverely restricted input parameters, calibration andvalidation data, users in industry, government, andeducation should find the model to be useful.
2. Conceptual model
In order to remain relatively simple to use andexecute, screening models are typically made up ofseparate, but coupled, sub-models. While this modularconcept allows for simpler solution techniques for theindividual processes, it restricts the range of problemsand scenarios that can be investigated. Thus, a cleardescription of the conceptual model is required to ensure

18 C.S. Willson et al. / Environmental Modelling & Software 21 (2006) 16–32
that the model is utilized properly. The conceptualmodel is described below and shown in Fig. 1.
The unsaturated vertical flow and transport modelcurrently utilized in HSSM (Weaver et al., 1994a,b) isalso valid for DNAPL flow. If a sufficient volume isreleased, the DNAPL will enter into and form a lens inthe capillary fringe overlying the water table. If the lensheight reaches a thickness sufficient to overcome theentry pressure at the water table, DNAPL will begin tomigrate down through the saturated zone underpressure and buoyancy forces. Due to the physicalproperties (e.g., non-wetting with respect to water), theDNAPL flow path will be highly dependent onheterogeneities and will most likely occur through thelargest pore sizes (Kueper et al., 1993; Illangasekareet al., 1995). However, to keep the model in a relativelysimple form, the porous media is assumed homogeneousand therefore any natural heterogeneities, and theassociated flow channeling, cannot be simulated.
However, it has been demonstrated, that, as opposedto flow channeling, fingering can occur during DNAPLmigration in saturated porous media (Held and Ill-angasekare, 1995a,b; Willson et al., 1996; Glass et al.,2000). While it is acknowledged that in natural systemsheterogeneities will dominate the flow path and thatthe incorporation of fingering is an approximation, wefeel that this conceptual model better represents themigration than would one-dimensional uniform flow.Furthermore, in virtually any practical situation thedistribution of DNAPL-controlling heterogeneities andeven the DNAPL itself is likely to be undefined bysampling during the site investigation. The preferentialpathways due to the fingering will result in the flow ofDNAPL deeper into the aquifer than if the migrationwas assumed to be uniform over the spill cross-section.Note, however, that fingering may not occur followingvery large spills or for highly viscous DNAPLs due tothe dominance of viscous forces (Ewing and Berkowitz,
* lens spreading anddissolution (OILENS)
* vadose zone flow andtransport (KOPT)
penetration ofthe water table
pool formation
saturated zone migration
impermeable layer
finger formation * transport from pool(TSGPLUME)
dissolution/transportfrom fingers
dissolution/transportfrom pool
Fig. 1. Conceptual model.
1998). While the incorporation of fingers will providea conservative estimate of the depth of DNAPLmigration (i.e., deeper penetration), this conceptualmodel only allows for one DNAPL pool to form. Ifthe DNAPL reaches a layer of lower permeability, itmay begin spreading radially and form a pool. This pooland the DNAPL trapped at residual saturation alongthe migration path will act as sources of contaminationinto the regional groundwater system.
The modules which describe the above processes aredesigned to add to the existing HSSM code and are notcalled until the DNAPL lens on the water tablegenerates sufficient head to overcome the entry pressureof the saturated zone. Fig. 2 is a flow chart describingthe various modules and how they are linked. Themodules which will be described in this paper are:
(1) A DNAPL migration module which includes:calculation of the entry pressure into the saturatedzone; a semi-analytic solution that approximates theDNAPL migration in saturated porous media underponded conditions; and, a wave solution to simulatethe redistribution process.
(2) A module which uses a semi-analytic solution tosimulate the spreading of a DNAPL pool over animpermeable layer.
(3) A fingering module which includes an equation,derived from hydrodynamic stability analysis ofimmiscible fluids in porous media, which gives anapproximation for the largest expected fingerdiameter; and an algorithm for determining thenumber of fingers formed.
KOPT*
OILENS* TSGPLUME*mass transfer
If Pced/w exceeded
Check stabilityIf unstable
If stableCalculate fingersize and #
If water table reached
Two-phasemigration problem
FTSPLUMEmass transfer
Pool modelmass transfer
TSGPLUME
Fig. 2. Flow chart (* denotes modules already in HSSM).

19C.S. Willson et al. / Environmental Modelling & Software 21 (2006) 16–32
(4) A finger dissolution and transport module whichincludes an equation which provides for the time-dependent mass transfer from a DNAPL finger, andan equation for the transport of the dissolvedconstituent to receptor well locations under transientsource conditions.
(5) A pool dissolution and transport module whichincludes an equation which provides for the time-dependent mass transfer from a DNAPL pool over-lying an impermeable layer, and an equation for thetransport of the dissolved constituent to receptor welllocations under transient source conditions.
3. Model formulation
3.1. DNAPL migration module
3.1.1. Entry pressureA sufficient pressure is required before the non-
wetting phase (DNAPL) can enter into a mediumcompletely saturated with the wetting phase, in thismodel assumed to be water. This entry pressure isa function of interfacial tension and the mean porediameter (Lake, 1989). While there are functions avail-able for calculating the entry pressure based on theinterfacial tension, permeability and porosity, the air/water entry pressure is typically one of the parametersdetermined from laboratory capillary pressure-satura-tion measurements, or can be estimated from the soiltype and found in tables (e.g., Carsel and Parrish, 1988).
The entry pressure for the DNAPL/water system,Pced/w, can be related to the entry pressure for theidentical air/water system, Pcea/w (or jba/w, the bubblingpressure) through
Pced=wZPcea=w
sd=w
sa=w
Zrwgjba=w
sd=w
sa=w
ð1Þ
(Charbeneau et al., 1995).
3.1.2. Migration problemOnce a DNAPL has passed through the capillary
barrier, it will begin migrating through the saturatedzone. This migration is a two-phase (water and DNAPL)flow problem, which includes capillary, viscous, andgravitational forces and will be simulated using a sharpfront model (SFM). The SFM is an idealization of thephysical system that assumes that fluids are immiscibleand has been applied to number of groundwater flow andtransport problems (Green and Ampt, 1911; Pinder andStotfhoff, 1988; Reible et al., 1990; El-Kadi, 1992). Theprimary advantage of an SFM is the ease with whichapproximate infiltration solutions can be obtained andthe few parameters required. SFMs prove suitable forpreliminary assessment of chemical or NAPL spills, butcannot be used for heterogeneous systems undergoing
wetting and drainage, to describe species transport, or todesign remediation schemes (Abriola, 1988; Pinder andStotfhoff, 1988). While analytic-numerical and exact,quasi-analytic solutions for 1-D two-phase flow havebeen presented in the literature (Chen, 1988; McWhorterand Sunada, 1990), the use of similarity variables restrictsthe generality of the initial and boundary conditions, andeliminates the possibility of their usage for this purpose.
Buckley and Leverett (1942) used fractional flowtheory to present the first analytical solution for two-phase flow. Corapcioglu and Hossain (1990) andRathfelder and Abriola (1992) use the method ofcharacteristics (MOC) to solve for the migration ofDNAPLs in saturated porous media. Weaver (1991)extends the method of characteristics solution to three-phases, includes discrete pulsed injections, and inves-tigates two-phase flow with a time-varying inflow. TheseMOC solutions result from neglecting the capillarypressure gradient so that the governing mass balanceequation reduces to a hyperbolic form. Hyperbolicfronts (waves) are characterized by sharp (shock) frontswhich move at the same mean displacement speed as thetrue front (Charbeneau, 1984). In nature, capillarypressure has a dissipating effect at the interface betweentwo phases and a shock would tend to dissipate.
Another option for modeling the flow is to usea plateau solutionda sharp front approximation of theflow problem where the saturation of the migratingphase is assumed to be constant with depth. Anadvantage of this method is the simplicity of trackingthe front vs. depth relationship. Morel-Seytoux andKhanji (1974) develop a plateau solution for a wettingfront that has equations that are similar in form to theGreen–Ampt equation. Reible et al. (1990) use thisconcept to develop a simple sharp front model for theinfiltration of NAPL in unsaturated porous media.
The following additional assumptions and definitionsare used in the migration model formulation (i.e.,Sections 3.1.3–3.1.5): (1) the flow is two-phase, one-dimensional and can be modeled with the multiphaseextension of Darcy’s law, with Cz directed downward;(2) isothermal conditions with all fluids being incom-pressible; (3) the porous media is rigid, isotropic andhomogeneous; (4) no chemical reactions or sink/sourceterms are considered; (5) the capillary fringe does notinterfere with the flow of DNAPL; (6) the capillarypressure, Pc, is defined as PcZ Pnw� Pw where the non-wetting fluid (nw) is assumed to be the DNAPL and thewetting fluid (w), the water; and (7) no dissolution ofDNAPL into the aqueous phase during migration andtherefore the saturation and physical properties do notchange during migration.
3.1.3. Migration saturationDuring the migration, the media and fluid properties
and the boundary conditions, which may be changing

20 C.S. Willson et al. / Environmental Modelling & Software 21 (2006) 16–32
with time, determine the saturation at the migrationfront. A plateau solution requires that the frontsaturation be determined a priori. In this model, themigration front saturation will be approximated as thesaturation which minimizes the resistant (viscous) force.
Darcy’s equation is a balance of viscous and drivingforces (Hubbert, 1956). Thus, for one-dimensional flowthe viscous force per unit volume, Fvi, is
FviZqimi
kkri
Z��vpivz
� rig
�ð2Þ
where subscript i refers to the fluid phase (d and w referto the DNAPL and water phases, respectively), qi is thevolume flux [L/T], k is the intrinsic permeability of theporous media [L2], kri the relative permeability (afunction of the water saturation) [�], mi the dynamic(absolute) viscosity [M/LT], pi, the fluid pressure [F/L2],ri the fluid density [M/L3], g the acceleration due togravity [L/T2], z is directed positive downward. Theright-hand side of the equation represents the drivingforce per unit volume.
It is assumed that as the DNAPL migrates, the waterphase is pushed out ahead of the DNAPL front andtherefore the individual phase flow rates are equal inboth direction and magnitude (i.e., co-current flow). Asthe fluids flow through the porous media, they will beretarded by viscous forces. Because the viscous force isa function of the relative permeability, each saturationcombination results in a unique DNAPL and waterviscous force. For this problem, it will be assumed thatthe DNAPL front saturation (Sdf) is the saturation thatminimizes the total viscous force (i.e., FvZ FvwC Fvd).
Summing the viscous forces and assuming that theflow rates are the same gives
FvZFvwCFvdZqwmw
kkrw
Cqdmd
kkrd
Zq
k
�mw
krwC
md
krd
�ð3Þ
The minimum resistant force will occur when dFv/dSdZ 0, which can be calculated from
dFv
dSd
ZvFv
vkrw
vkrwvSd
CvFv
vkrd
vkrd
vSd
Z0 ð4Þ
qZ
��pdf � pdwt
�C�pcf � pcwt
��
ZpcðzfÞpcðzwtÞ
fddpcC
Zzfzwt
fdgDrdwdzCrwg�zf � zwt
�Zzfz
dz
L
ð9Þ
wt
where Sdf is the saturation which satisfies Eq. (4). In thiswork, the Burdine relative permeability equations fortwo-phase flow (Burdine, 1953)
krwZ
�Sw �Swr
1�Swr
�3
ð5Þ
krdZ
�Sd �Sdr
1�Sdr
�2"1�
�1�Sd �Swr
1�Swr
�3�2#
ð6Þ
are used, where 3Zð2C3lÞ=l (Brooks and Corey, 1964),Sd is the DNAPL saturation, and Swr and Sdr theresidual water and DNAPL saturations, respectively.
3.1.4. Primary migration problemAfter the DNAPL penetrates the saturated zone,
gravity (buoyancy) and pressure forces will drive theflow while viscous and capillary forces will resist theflow. The magnitude and impact of these forces onthe flow will vary with time. The methodology in thissection follows Morel-Seytoux and Khanji (1974), whoused Darcy’s equation and fractional flow theory toderive the Green–Ampt equation and provide physically-based definitions of the terms comprising the Green–Ampt equation.
The derivation begins by summing the conservationof mass equations for DNAPL and water and using thedefinition of the total flow
vðSdCSwÞvt
C1
h
vðqdCqwÞvz
Zvq
vzZ0 ð7Þ
where h is the porosity of the medium [�] and Si is thesaturation (i.e., fraction of pore space filled by phase i)[�]; note that in this problem, SdC SwZ 1. Eq. (7)shows that the total flow (q) may vary with time, but isinvariant with z.
The total flow is found by summing Darcy’s equationfor the two phases. Use of several fractional definitionsfound in Table 1 results in
q
LZ� vpd
vzCð1� fdÞ
vpcvz
CfdgDrdwCrwg ð8Þ
Since the total flow is space-invariant, this equation canbe integrated to yield

21C.S. Willson et al. / Environmental Modelling & Software 21 (2006) 16–32
where the letters wt in the subscripts refers to the value ofthat property at thewater table and the letter f to the valueat the migration front. At the water table, the waterpressure will be equal to the pressure due to the pondedDNAPL (i.e., rdghL, where hL is the height of theDNAPLlens on the water table), while at the front the waterpressure is equal to the hydrostatic pressure (i.e., rwgzf).Applying these definitions and setting zwtZ 0, yields
qZ
rdghL �ZpcðzZzfÞ
pcðzwtZ0Þ
fddpcCDrdwg
Zzf0
fddz
Zzf0
dz
L
ð10Þ
The first term in the numerator (PLZ rdghL) accounts forthe pressure force due to the ponded DNAPL lens at thewater table. The second term is the effective capillaryresistance (Pceff) which gives a ‘‘weighted’’ capillarypressure which acts to resist the flow; note that in thewetting front problem this term has a positive sign in frontof it. Because pc and fd are relatively small in the range ofsaturations encountered in this problem, Pceff does not getvery large. The third term in the numerator (G) is theeffective or flowing gravity potential. Because the DNAPLsaturation duringmigration is assumed to be constant, andtherefore fd is constant, the third term can be approxi-mated by Drdwgfdzf where fd is evaluated at the migrationsaturation.
The denominator represents the total viscous re-sistance to flow and accounts for the simultaneous flowof the two phases. While the sharp front assumption issatisfactory for evaluating the gravity term, it does notprovide enough detail of the flow to evaluate the viscousresistance term (Morel-Seytoux and Khanji, 1974). TheMOC solution used to calculate the resistance term canbe found in Appendix A.
Using Eq. (A7), the term for the total resistance inEq. (10) becomes
Table 1
Fractional flow definitions
Parameter Symbol Definition
Total flow rate q qZ qwC qd
Fluid mobility li liZkkrimi
Relative fluid mobility lri lriZkri
mi
Total mobility L LZ ldC lw
Little f function fi fiZli
L
Fractional flow function Fi FiZqiq
Zzf0
dz
LZzfR ð11Þ
where
RZSdB=L
ZSdðBLÞSdðzZ0Þ
0@�d2FddS2
d
�L
1AdSd ð12Þ
where SdB/L refers to the Buckley–Leverett saturation(see Appendix A). Using the above definitions andnaming conventions, Eq. (10) becomes
qZPL �PceffCGzf
Rzfð13Þ
Assuming only DNAPL flows at zZ 0 (i.e., no waterexits the systems up through the DNAPL lens), then thetotal flow at zZ 0 will be equal to the DNAPL flowrate. Conservation of mass is then applied across theDNAPL/water interface at the migration front wherea denotes values ahead of the front and b denotes valuesbehind the front. With no DNAPL ahead of the front(qdaZ SdaZ 0), the conservation equation gives
dzfdt
Zqdb � qda
hðSdb �SdaÞZ
q
hSdf
Z1
hSdf
�PL �PceffCGzf
zfR
�ð14Þ
If PL is constant (i.e., constant head ponding), then ananalytical solution is possible. However, since the lensheight (hL) and therefore, PL, is a function of time, thisordinary differential equation is solved numerically.
3.1.5. The redistribution problemWhen the DNAPL saturation in the lens has been
reduced to residual, the DNAPL redistribution problembegins. During redistribution, the DNAPL will continueto flow under the force of gravity while being retardedby viscous and capillary forces until the DNAPL isrendered immobile and is trapped at residual saturation.Non-wetting phase residual saturations are a function ofpore geometry, organic fluid properties (interfacialtension, viscosity and density), system wettability, Darcyvelocity and saturation history (Mohanty et al., 1987;Powers et al., 1991; Hilpert et al., 2001). Residualsaturations are typically in the range of 10–35% insaturated regions of unconsolidated media, with levelsas high as 50% in low permeability media (Ng et al.,1978). Presently, there are no general models correlatingresidual DNAPL saturations, sizes and shapes to porousmedia and DNAPL properties, so the DNAPL residualsaturation will be a user-defined parameter.
Unlike the migration front problem, the redistribu-tion cannot be modeled as a sharp front, and a MOCsolution is required (see Appendix A). At each time, thetotal flow can be found from integrating Eq. (8) over theflow profile. Due to the shape of the fractional flow

22 C.S. Willson et al. / Environmental Modelling & Software 21 (2006) 16–32
derivatives, a discontinuity, or shock, appears in thesecond wave. This is a mathematical resultdin nature,capillary forces would spread this front resulting ina smooth distribution of saturations (Lake, 1989).
3.2. Pool formation
Due to the computational limitations, completemodeling of the pool formation will not be attempted.Instead, the method used to simulate the DNAPLpooling over an impermeable layer is a sharp frontmodel similar to the OILENS model (Charbeneau et al.,1995).
There is limited laboratory and field data concerningthe formation and geometry of pools. In a two-di-mensional experiment, Schwille (1988) found a length tothickness ratio of the resultant pool was about 125:1,while Johnson and Pankow (1992) report a ratio of100:1. In a field test, Kueper et al. (1993) found poolthicknesses ranging from a few mm to a few cm.
The assumptions used in this model are: (1) the lowpermeability layer on which the pool rests is flat andcompletely impermeable to the non-wetting phase; (2)the DNAPL spreads radially across this surface; (3)vertical equilibrium, with the pool head at any radiusdetermined from the Dupuit equation; and (4) the poolheight at the leading edge of the pool is large enough toovercome the entry pressure of the saturated porousmedia.
The conceptual model for the pool model is asfollows. The DNAPL migrates vertically within a circu-lar area of radius, Rs, until it reaches a layer of lowerpermeability where it will begin to mound within this‘‘source cylinder’’. When the DNAPL height within thiscylinder is large enough to overcome the entry pressureof the saturated porous media (hced/w), the pool willbegin to spread radially. Since it is assumed that thepressure at the leading edge of the pool must be largeenough to overcome the entry pressure, the pool heightthere will be equal to the hced/w. The changes in the poolradius, Rp, and the pool height beneath the source, hds,with respect to time are a function of the inflow rate, theradial spreading rate, and any losses due to dissolutionand trapping of residual DNAPL. Analogous to theOILENS formulation, the pool DNAPL saturation,Sdeff, is specified as a constant parameter, while hds andRp will vary with time.
3.2.1. Effective pool saturationThe technique described here to estimate Sdeff is based
upon principles described in Kueper et al. (1993). Underhydrostatic conditions, the capillary pressure is just thedifference between the DNAPL and water phase
pressure and therefore the capillary pressure profile ina pool of a given thickness, T, is given by
PcZðgd � gwÞðT� zÞCPced=w ð15Þ
where z is measured upward from the base of the pool.This assumes the top of the pool exists under drainageconditions and that the capillary pressure at the bottomof the pool is less than the entry pressure of theunderlying layer.
Since the capillary pressure and saturation can berelated in a functional form, the saturation profile canbe determined directly from the pressure profile. Herewe will use the Brooks and Corey (1964) capillarypressure relationship
SeffZ
�Sw �Swr
1�Swr
�Z
�Pced=w
Pc
�l
ð16Þ
where Seff is the effective water saturation, Swr is theirreducible water saturation, l is the pore size distribu-tion index, and Pced/w is the entry pressure for theDNAPL/water system. Now, the equation relating theDNAPL saturation and the pool depth is given by
SdZð1�SwrÞ"1�
�gd � gw
Pced=w
ðT� zÞC1
��l#
ð17Þ
From Eq. (17), it is obvious that the saturation profilesare not uniform. Therefore, the average DNAPLsaturation in the pool is calculated and used as Sdeff.
3.2.2. Pool equationsUsing the Dupuit assumptions and the conditions
that hZ hds at rZRs and hZ hced/w at rZRp, theheight of the pool (for Rs! r!Rp) is given by
hðrÞZ
ffiffiffiffiffiffiffiffiffiffiffiffiffiffiffiffiffiffiffiffiffiffiffiffiffiffiffiffiffiffiffiffiffiffiffiffiffiffiffiffiffiffiffiffiffiffiffiffiffiffiffiffiffiffiffiffiffiffiffi�h2ds � h2ced=w
�ln� rRp
�2ln�Rs
Rp
�2Ch2ced=w
vuuuut ð18Þ
Continuity principles are used to derive the ordinarydifferential equations describing the changes in Rp andhds with respect to time.
dhdsdt
Z1
phSdeff
0@Qin �
2pKrd
�h2ds � h2ced=w
�ln�Rp
Rs
�2 �Qlosses
1A
ð19Þ
dRp
dtZ
Qin �Qlosses � vVp
vhds
dhdsdt
vVp
vRp
ð20Þ
where Qin is the flow entering the pool from above (i.e.,from the migration problem), Krd is the effective
23C.S. Willson et al. / Environmental Modelling & Software 21 (2006) 16–32
hydraulic conductivity for the DNAPL (evaluated atSdeff), and Qlosses are the losses due to dissolution andDNAPL trapped as residual as the pool heightdecreases.
The total pool volume, Vp, is given by
VpZpR2
phSdeff
�hds � hced=w
� ffiffip4
perf
� ffiffiffiffiffiffiffiffiffiffiffiffiffiffiffiffiln�Rp
Rs
�2r �ffiffiffiffiffiffiffiffiffiffiffiffiffiffiffiffiln�Rp
Rs
�2rCpR2
phSdeffhced=w ð21Þ
Eq. (21) is used to provide two of the three derivativesrequired to solve Eq. (20) with Eq. (19) giving the third.
3.3. DNAPL fingering during migration
The DNAPL migration pathway greatly impacts thecontamination of an aquifer. It has been well-docu-mented that due to their physical and chemicalproperties (e.g., high density, low viscosity, non-wettingwith respect to the solid phase), DNAPLs are highlysensitive to aquifer physical heterogeneities and willtypically migrate through highly irregular and complexpathways (Schwille, 1988; Kueper et al., 1993; Ill-angasekare et al., 1995). Incorporating these hetero-geneities into numerical simulations is one of the majorchallenges facing researchers in the groundwater com-munity (Miller et al., 1998).
In addition to channeling, it has been shown thatDNAPL migration through saturated porous media issubject to fingering (Held and Illangasekare, 1995a,b;Willson et al., 1996; Glass et al., 2000). In homogeneoussystems, the flow fingering results in a much greaterdepth of DNAPL penetration than would be expectedwithout these preferential flow paths. The propensity forthe DNAPL to channel or finger is dependent on bothporous media (e.g., heterogeneous structure and lengthscales) and fluid (e.g., density, viscosity) properties.There is a question as to whether continuum basedmodels are capable of simulating fingering (Kueper andFrind, 1988) and whether fingering theory is evenappropriate to describe DNAPL migration (Glasset al., 2000). However, given the complexity of in-corporating heterogeneities and/or pore-scale propertiesinto numerical simulators and the importance ofpreferential flow paths on aquifer contamination, wefeel that it is appropriate to use viscous fingering theoryas a surrogate method of simulating preferential path-ways in this screening model.
The use of fingering theory to account for preferentialflow fronts has been used in both the hydrology andpetroleum communities (e.g., Saffman and Taylor, 1958;Hill and Parlange, 1972; Peters and Flock, 1981; Glasset al., 1991; Ewing and Berkowitz, 1998; Smith and
Zhang, 2000). Researchers investigating wetting frontstability have had good success in predicting the size ofthe fingers, but due to the increased complexity of theoil/water system, little progress has been made towardpredicting the propagation characteristics during multi-phase flow problems. Typically, petroleum-relatednumerical simulators incorporate the effects of viscousfingering through the use of psuedo-relative permeabil-ity functions developed through experimental studies ofcore samples.
3.3.1. Fingering theoryIn a mathematically homogeneous porous media, it
has been shown that the interface between twoimmiscible fluids will be unstable provided certainconditions are met (e.g., Kueper and Frind, 1988; Ewingand Berkowitz, 1998). The definition of the criticalvelocity, vc, provides a measure of whether a flow ishydrodynamically unstable. For the case of a downwardmigrating DNAPL with a lower viscosity than water,the critical velocity is always less than zerodimplyingthat the interface between the displacing DNAPL andwater will always be unstable.
The equations used here to simulate fingering aresimilar to equations developed by Peters and Flock(1981) and Glass et al. (1991). Bessel functions are usedto analyze the three-dimensional axisymmetric distur-bance of the immiscible interface and an equation isderived describing the wavelength of maximum growth.If it is then assumed that the finger diameter can be nolarger than one-half the wavelength of maximumgrowth, the formula for the expected finger diameter isfound to be
dZ4:8
3se
v�
mwkkw
� mdkkd
�Cgðrd � rwÞ
!1=2
ð22Þ
where se is the effective interfacial tension. For a givenfluid pair, se is not a constant, but depends on themicroscopic conditions of the medium. If it is assumedthat se is directly proportional to the interfacial tension,then
seZC�s ð23Þ
where C* is the wettability number (Chouke et al., 1959).Peters and Flock (1981) explain that the wettabilitynumber, C*, gives a quantitative indication of the abilityof the porous medium to imbibe the displacing water-dthe scenario considered in their work. Thus, in water-wet media where the imbibing forces are strong, C* islarge, while in oil-wet media C* is small. Fromexperimental results of water displacing oil, Peters andFlock (1981) determine C* to be 5.45 and 306.25 for oil-wet and water-wet media, respectively. Chouke et al.(1959) found that C* was 7.6 for a neutral wettability
24 C.S. Willson et al. / Environmental Modelling & Software 21 (2006) 16–32
sand. By calculating the wavelength of fingering forcommon DNAPLS, Kueper and Frind (1988) approx-imated C* to be 2. Finally, in a series of 2D tankexperiments looking at DNAPL fingering, Smith andZhang (2000) found C values varying between 1.7 and3.8 for a range of glass bead systems. In the scenarioconsidered here, a small wettability number is assumedsince the non-wetting DNAPL is displacing the wettingfluid, water.
An important result of a number of experimentalinvestigations (e.g., Held and Illangasekare, 1995a,b;Willson et al., 1996; Glass et al., 2000) was theobservation that if the migration front was assumedto be uniform and one-dimensional, the depth of thefree-product migration would have been grossly under-predicted. There is also some evidence (Held andIllangasekare, 1995a; Ewing and Berkowitz, 1998) tosuggest that there does exist an upper velocity limit that,if exceeded, may result in stable displacements. Exam-ples of cases where this may occur are very largeDNAPL spills or releases of highly viscous DNAPLs.
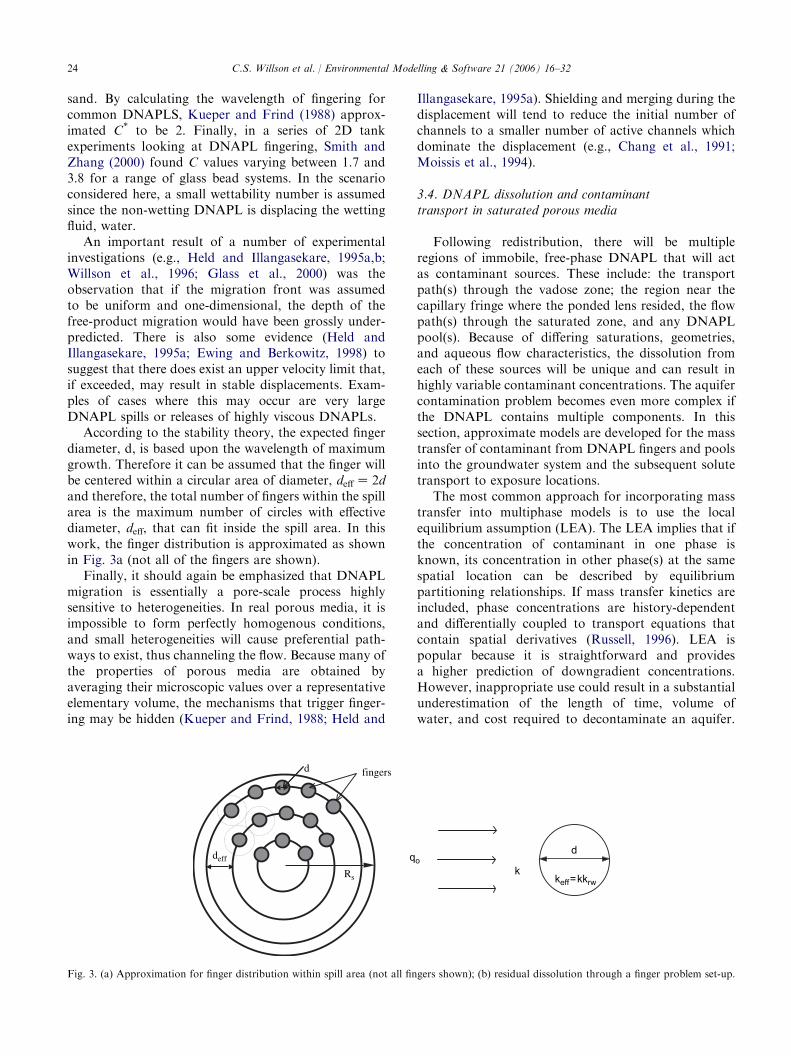
According to the stability theory, the expected fingerdiameter, d, is based upon the wavelength of maximumgrowth. Therefore it can be assumed that the finger willbe centered within a circular area of diameter, deffZ 2dand therefore, the total number of fingers within the spillarea is the maximum number of circles with effectivediameter, deff, that can fit inside the spill area. In thiswork, the finger distribution is approximated as shownin Fig. 3a (not all of the fingers are shown).
Finally, it should again be emphasized that DNAPLmigration is essentially a pore-scale process highlysensitive to heterogeneities. In real porous media, it isimpossible to form perfectly homogenous conditions,and small heterogeneities will cause preferential path-ways to exist, thus channeling the flow. Because many ofthe properties of porous media are obtained byaveraging their microscopic values over a representativeelementary volume, the mechanisms that trigger finger-ing may be hidden (Kueper and Frind, 1988; Held and
Illangasekare, 1995a). Shielding and merging during thedisplacement will tend to reduce the initial number ofchannels to a smaller number of active channels whichdominate the displacement (e.g., Chang et al., 1991;Moissis et al., 1994).
3.4. DNAPL dissolution and contaminanttransport in saturated porous media
Following redistribution, there will be multipleregions of immobile, free-phase DNAPL that will actas contaminant sources. These include: the transportpath(s) through the vadose zone; the region near thecapillary fringe where the ponded lens resided, the flowpath(s) through the saturated zone, and any DNAPLpool(s). Because of differing saturations, geometries,and aqueous flow characteristics, the dissolution fromeach of these sources will be unique and can result inhighly variable contaminant concentrations. The aquifercontamination problem becomes even more complex ifthe DNAPL contains multiple components. In thissection, approximate models are developed for the masstransfer of contaminant from DNAPL fingers and poolsinto the groundwater system and the subsequent solutetransport to exposure locations.
The most common approach for incorporating masstransfer into multiphase models is to use the localequilibrium assumption (LEA). The LEA implies that ifthe concentration of contaminant in one phase isknown, its concentration in other phase(s) at the samespatial location can be described by equilibriumpartitioning relationships. If mass transfer kinetics areincluded, phase concentrations are history-dependentand differentially coupled to transport equations thatcontain spatial derivatives (Russell, 1996). LEA ispopular because it is straightforward and providesa higher prediction of downgradient concentrations.However, inappropriate use could result in a substantialunderestimation of the length of time, volume ofwater, and cost required to decontaminate an aquifer.
keff=kkrwk
qod
sourcersadiu
deff
d fingers
Rs
Fig. 3. (a) Approximation for finger distribution within spill area (not all fingers shown); (b) residual dissolution through a finger problem set-up.

25C.S. Willson et al. / Environmental Modelling & Software 21 (2006) 16–32
Sensitivity analysis results (Powers et al., 1992) andexperimental studies (e.g., Miller et al., 1990; Imhoffet al., 1993; Geller and Hunt, 1993) indicate thatnonequilibrium mass transfer between NAPLs andgroundwater is expected to influence concentrations oforganic species for small spills, high Darcy velocities,large blob sizes and low residual NAPL saturations.Work by Imhoff et al. (1996) has shown that instabilitiesin the dissolution front can affect the NAPL/water masstransfer process. In a field-scale numerical investigation,Mayer and Miller (1996) showed that heterogeneity inthe porous media properties can be a dominant factor inthe NAPL dissolution process regardless of the relation-ship used to describe the dissolution process. Whilethese findings are important and need to be recognized,the limited general applicability of the results andcomputational issues involved in their implementationlead us to use the LEA in this screening model.
In contrast to residual ganglia, pools of DNAPLperched on lower-permeability zones have very lowprofiles with respect to the flowing groundwater, andcontact between the pool and the groundwater islimited. The mass transfer rate for the dissolution ofDNAPL pools will depend on the solubility of theDNAPL, the groundwater velocity, the length of thepool, and the vertical dispersion coefficient. The velocityand the vertical dispersion determine how quickly theDNAPL is moved away from the pool (Johnson andPankow, 1992).
In the case of a multicomponent DNAPL, thediffering mass transfer rates and solubilities of variouscomponents create a more complex system. Formulticomponent mixtures, the effective concentrationcan be estimated from Rauolt’s law (e.g., Geller andHunt, 1993) which states that the aqueous phaseconcentration is equal to the aqueous phase solubilityof the constituent in equilibrium with the pureconstituent phase, multiplied by the mole fraction ofthe constituent in the oil phase, or
CwkZgkCdkSk
uk
Pj
Cdj
uj
ð24Þ
where Cwk is the concentration of constituent k in theaqueous phase, gk the activity coefficient, Cdk theconcentration of constituent k in the DNAPL phase,Sk the aqueous solubility of the pure compound, uk themolecular weight of constituent k. j is the total numberof components of the mixture (Baehr and Corapcioglu,1987). For an ideal organic liquid mixture comprised ofstructurally related hydrophobic liquids, the activitycoefficient for each component equals unity (Banerjee,1984). Several lab and field studies have shown that theactivity coefficients in actual DNAPL mixtures do notalways equal one (e.g., Priddle and MacQuarrie, 1994;
Lesage and Brown, 1994). However, there is usuallyinsufficient data to justify an attempt at estimating gk.
3.4.1. Residual finger dissolutionSince the DNAPL migration is assumed to occur
through fingers, multiple cylindrical columns ofDNAPL will extend downward from the water table.Due to the presence of free-phase DNAPL within thefinger, the aqueous phase permeability is reduced andonly a fraction of the groundwater flow will come incontact with the DNAPL phase. The conceptual modelfor finger dissolution is shown in Fig. 3b and thefollowing assumptions/definitions are made: (1) theregional aquifer flow field, qo, is uniform and steady;(2) the porosity and intrinsic permeability of the cylinderand the aquifer are the same; (3) the permeability withinthe cylinder is kcylZ kkrw(Sw) (see motivation byManivannan et al., 1996); and (4) the fluid propertiesremain constant through the simulation.
The flow through a cylindrical heterogeneity perunit depth of finger can be found using complexpotential theory (Strack, 1989; Charbeneau et al.,1996) to be
qcylZ2qodkrw
1Ckrwð25Þ
where krw is the aqueous phase relative permeability.Now that the quantity of flow through the finger isknown, the mass transfer rate can be found. With theassumption that the aqueous phase concentration inthe groundwater moving through the fingers will be atthe solubility value, Ceff, the mass transfer rate per unitlength of cylinder is given by
_mZCeffqcylZ2Ceffqodkrw
1Ckrwð26Þ
In this model, it will be assumed that d will remainconstant while the DNAPL is flushed out of the finger.Eq. (26) shows that, for constant d and Ceff, as DNAPLis flushed out of the finger, Sd decreases and krwincreases. Thus, the flow through the cylinder andtherefore the mass transfer rate will increase with time.While this model will provide more conservativeaqueous phase concentrations downstream of thefingers, it may underpredict the amount of time beforethe finger is completely dissolved.
This mass transfer relationship for the fingers, givenby Eq. (26) must now be coupled with a contaminanttransport model. Here, a two-dimensional model isappropriate because vertical dispersion is typicallyorders of magnitude lower than in the other principaldirections and will not be a factor when the fingerextends the depth of the aquifer. For a vertically-mixedpoint source release, the transient solution to the

26 C.S. Willson et al. / Environmental Modelling & Software 21 (2006) 16–32
two-dimensional advection–dispersion-reaction (ADR)equation with a time-variable source strength ( _m) is
cðx;y; tÞZZt0
_mðt� tÞexp��ðx�vstÞ2
4D#xxt
� y2
4D#yyt
� lt
4nbtp
ffiffiffiffiffiffiffiffiffiffiffiffiffiffiffiDxxDyy
p dt ð27Þ
where vsZ v/Rd, v is the uniform groundwater seepagevelocity, Rd is the retardation factor given byRZ 1C rbkd/h, l is the first-order rate constant, n theporosity, b the finger depth, Dii#ZDii/Rd where Dii isthe coefficient of dispersion (Charbeneau et al., 1995;Willson, 1997).
Because this equation cannot be solved analytically,a quadrature scheme is used with Eq. (26) giving themass flux values. The contaminant transport from eachfinger is calculated using Eq. (26) and the principle ofsuperposition is used to calculate the concentration atthe receptor well from all the fingers. Finally, it shouldbe noted that this vertically-mixed point source releasemodel is appropriate if the width of the release zone isnot very large compared to the distance from the releasezone to the receptor well locations where aqueous phaseconcentrations are being estimated.
3.4.2. Dissolution and solute transportfrom a DNAPL pool
A majority of the DNAPL in a pool will be aboveresidual saturation resulting in a greatly reduced flow ofgroundwater through the pool. Therefore, it will beassumed that all mass transfer from the pool will occurat the interface between the top of the pool and thegroundwater. While this may slightly underpredictthe amount of mass transfer, this assumption reducesthe complexity of the problem.
The total flux from the circular pool into the aquiferis determined by calculating the flux from a longitudinalstrip and integrating over the entire pool (e.g., Charbe-neau et al., 1995) and is given by
_mZ4ceffhvRpId
ffiffiffiffiffiffiffiffiffiffiffiffiffi2Rpavp
rð28Þ
where Id is an integration factor equal to 0.87402.Within the model framework, only the pool radius, Rp,and ceff are functions of time. This model is similar tothat found in Anderson et al. (1992b) for a squareDNAPL pool.
The mass transfer from the pool must now becoupled with a plume model. To maintain consistencywith the HSSM model, the Transient Source GaussianPlume (TSGPLUME) model will be used to simulate thesolute transport to receptor well locations. The requiredboundary conditions are the source width and themaximum centerline concentration at the downgradientend of the pool, both of which may vary with time.
The maximum concentration above the pool isrelated to the mass rate of flow through
cmZ_mffiffiffi
p
2
rHvhs
ffiffiffiffiffiffiffiffiffiffiffiffiffiffiffiffiffiffi1C
4laLRp
v
q ð29Þ
where s is the standard deviation of Gaussian source; itis a site specific parameter that relates the contami-nant source distribution to the width of the actualsource (i.e., the pool) itself. The width and height of thecontamination front when it reaches the downgradientend of the pool can be estimated from
WZ2�RpC
ffiffiffiffiffiffiffiffiffiffiffiffiffi2aTRp
p �ð30Þ
and
HZffiffiffiffiffiffiffiffiffiffiffiffiffi4avRp
pð31Þ
The solution to the ADR equation for the transport ofdissolved constituents from the pool is
cðx;y;TÞZX exp
�X2
�ffiffiffiffiffiffi4p
p
!
ZT0
cmðT� tÞexph�ðXÞ2
4t� ðYÞ2
2C4Dt� 1C4L
4ti
ffiffiffiffiffiffiffiffiffiffiffiffiffiffiffiffiffiffiffiffiffiffiffiffit3ð1C2DtÞ
p dt
ð32Þ
where TZ v2x/DL, XZ vx/DL, YZ y/s, DZDLDT/s2v2, and LZRdlDL/v
2 are non-dimensional parame-ters (Charbeneau et al., 1995). Like in the fingertransport equation, this integral cannot be solvedanalytically, so a quadrature scheme must be used withEq. (29) giving the maximum concentration values (cm)as a function of time.
Superposition of the various contaminant distribu-tions from the sources (i.e., fingers and pool(s)) is usedto generate the overall concentration field. While thismay results in abnormally high concentrations close tothe sources, any other approach would add to thecomplexity without much added rigor.
4. Example problems
The following three scenarios are used to show howthe proposed modules simulate a simple DNAPL releasescenario. In each case 1000 L of chemical is released atthe water table through a source 2 m in diameter. Theporous media is assumed to be a sandy loam (Carsel andParrish, 1988) and an impermeable layer is located 5 mbelow the water table. The chemical(s) in cases 1, 2, and3 are TCE, PCE and a 50/50 mix of TCE/PCE,respectively. Porous media and chemical properties forthe examples are listed in Table 2.

27C.S. Willson et al. / Environmental Modelling & Software 21 (2006) 16–32
Several key model parameters are shown in Table 3.The finger module (Eq. (19)) predicts 289 5.2 cm fingersand 320 4.9 cm fingers for cases 1 and 2, respectively.These values are very similar to those predicted byKueper and Frind (1988) and found experimentally bySmith and Zhang (2000). For both cases 1 and 2, theassumption of fingering reduces the effective flow cross-sectional area to about 19% of the original 2 m diametercross-section. Fig. 4 shows the total flow (Eq. (11))versus time for cases 1 and 2. At early times, the pressuredue to the ponded DNAPL is the most significant termand there is not much resistance to the flow. As theDNAPL migrates deeper into the saturated zone, theimportance of the resistance term increases and the totalflow levels off to a constant value where the resistanceand gravity forces are balanced. When the redistributionportion of the problem begins, the total flow begins todecrease due to an increase in the resistance term anda decrease in the gravity term. Fig. 5 depicts thesaturation profiles through a finger for three timesduring the TCE migration in case 1. Note that theDNAPL migration front reaches the water table 4.6days after release and therefore the profiles at 12.23 and14.73 days differ only by the drainage saturations.
The effective pool saturation, Sdeff, is calculated toequal 0.32. For cases 1 and 2, Fig. 6 shows the inflowrate to the pool (i.e., from the migration problem) while
Table 3
Parameters from the DNAPL migration examples
Case 1 Case 2 Case 3
hL [cm] 6 6 6
Sdmig/SdB/L 0.33/0.36 0.34/0.37 0.36/0.39
d [cm] 5.2 4.9 5.0
# fingers 289 320 307
Sdeff 0.32 0.33 0.33
Rp [m] 2.57 2.70 2.72
H [m] 0.71 0.74 0.74
W [m] 8.3 8.7 8.7
Table 2
Properties for DNAPL migration examples
Property Value Property Value
Ks 3.5 m/d rTCE 1.46 gm/cc
h 0.42 mTCE 0.57 cp
l 0.460 sTCE 35 dyne/cm
hcea/w 15.9 cm Csol(TCE) 1100 mg/L
Swr 0.05 Koc(TCE) 126 L/kg
Sdr 0.20 rPCE 1.62 gm/cc
v 0.3 m/d mPCE 0.90 cp
aL 5.0 m sPCE 42 dyne/cm
at 0.5 m Csol(PCE) 200 mg/L
foc 0.001 Koc(PCE) 364 L/kg
Well 1: (x,y)Z 100 m, 0 m
Well 2: (x,y)Z 100 m, 15 m
Well 3: (x,y)Z 250 m, 0 m
the change in pool height (hds) and radius (Rp) with time(Eqs. (16) and (17), respectively) are shown in Fig. 7.The total amount of DNAPL that flows into the pools isslightly different due to the different number of fingersduring the migration and thus the quantities of DNAPLtrapped at residual saturation.
Fig. 8 shows the mass transfer rates from the residualfingers (Eq. (23)). As expected for the single-componentcases, the mass transfer rate for TCE is much higherthan PCE and the TCE is completely dissolved ina much shorter time. Fig. 8 also shows the dissolution ofTCE from the TCE/PCE mixture (i.e., case 3). Note thatthe length of time required for the TCE to dissolve fromthe mixture is nearly double that in the pure mixture, inspite of their only being half the TCE volume in case 3.Fig. 9 shows the aqueous phase concentrations for thecases 1 & 3 at a distance of 250 m from the source (Eq.(27)). Although hidden by the scale of the plot, bothcases result in aqueous phase TCE concentrations abovethe MCL for over 10 years.
Mass transfer from the three pools (Eq. (28))is shown in Fig. 10. Since the pool radius is assumedto be constant with time, the mass flux for the
0
0.05
0.1
0.15
0.2
0.25
0.3
0.35
0.4
0.45
0 5 10 15 20
t[d]
q[m
/d
]
Case 1Case 2
Fig. 4. Total flow vs. time for cases 1 & 2.
0
0.5
1
1.5
2
2.5
3
3.5
4
4.5
5
0 0.1 0.2 0.3 0.4TCE Saturation [-]
dep
th
[m
]
t=0.7 dt=12.23 dt=14.73
Fig. 5. Case 1 (TCE) saturation profiles.

28 C.S. Willson et al. / Environmental Modelling & Software 21 (2006) 16–32
single-component cases remains constant after the poolstops spreading until the very last time step when themass flux is limited by the amount of DNAPLremaining in the pool. As expected, the pools persist inthe aquifer for a much longer period of time than theresidual fingers. Fig. 11 shows the receptor well aqueousphase concentrations at Well 2. According to this model,the TCE and PCE pools contaminate the bottomportion of the aquifer with concentrations above theMCL for nearly 15 and 50 years, respectively.
5. Summary and conclusions
Here, we have presented the framework and equa-tions for a screening model that can be used to simulatethe contamination of a groundwater aquifer followingthe release of a DNAPL. The model was developed ina modular fashion in order to utilize analytic or semi-analytic solutions for the individual processes and toremain consistent with HSSM, a U.S. EPA screeningmodel for LNAPLs. Note that the original HSSM willbe used to simulate the NAPL release, migrationthrough the vadose zone, lens formation, and mass
0
0.01
0.02
0.03
0.04
0.05
0.06
0.07
0.08
0.09
0 5 10 15 20
t[d]
Po
ol Q
in
[m
^3/d
]
Case 1
Case 2
Fig. 6. Qin for cases 1 & 2.
0
0.5
1
1.5
2
2.5
3
0 5 10 15 20 25 30
t [d]
Rp
/h
ds [m
]
hds (Case 1)
hds (Case 2)
Rp (Case 1)
Rp (Case 2)
Fig. 7. Pool height and radius vs. time for cases 1 & 2.
transfer and contaminant transport from the lens intothe aquifer.
This model has the capability of simulating the flowand redistribution through homogeneous, saturatedporous media following a DNAPL release. Viscousfingering is incorporated into the model in an attempt tosemi-quantitatively account for the preferential flowpaths that are likely to occur in natural systems. A sharpfront model is used to simulate DNAPL pooling over animpermeable layer. Using the local equilibrium assump-tion, analytic expressions were developed to account forthe time-varying mass transfer from zones of residualand pooled DNAPL. Use of the equilibrium assump-tions will likely result in the matching of peakdissolution rates, while underestimating the durationof aquifer contamination. Semi-analytic transport mod-els are developed and linked to the mass transfermodules to simulate the contamination at downgradientreceptor locations. Rauolt’s law is used to account formulticomponent DNAPLs.
The biggest restriction of the model is the inability toaccount for subsurface heterogeneities. Because of this,the model is unable to account for micro-pools thatform during the DNAPL migration and may contam-inate an aquifer for long periods of time (e.g., Kueperand Gerhard, 1995). The inability to account for
0.00E+00
2.00E-01
4.00E-01
6.00E-01
8.00E-01
1.00E+00
1.20E+00
1.40E+00
1.60E+00
0 500 1000 1500 2000t [d]
ma
ss
flu
x [k
g/d
]
Case 1 (TCE)
Case 2 (PCE)
Case 3 (TCE fromTCE/PCE Mixture)
Fig. 8. Mass flux rates from residual fingers.
0
5
10
15
20
25
0 500 1000 1500 2000 2500 3000 3500 4000t [d]
C [m
g/L
]
Case 1 (TCE)/Well 2
Case 3 (TCE fromTCE/PCEmixture)/Well 2
Fig. 9. Well #3 concentrations from finger dissolution for cases 1 & 3.

29C.S. Willson et al. / Environmental Modelling & Software 21 (2006) 16–32
variability during the aqueous phase transport problemmakes it difficult to investigate ‘‘hot spots’’ and siteswhere system physical and chemical properties varywidely.
It is vital that users understand the assumptions andconditions under which each module was developed.While restrictive, it should be remembered that thismodel was developed for use as a preliminary tool for siteinvestigations and users should only expect to simulatetrends and concentration data to within an order ofmagnitude. The model is currently being used to simulateseveral DNAPL-contaminated sitesdthese applicationswill serve to highlight both the capabilities and thelimitations of the model to simulate actual field sites.
Acknowledgements
The United States Environmental Protection Agency(EPA) through its Office of Research and Developmentpartially funded and collaborated in the researchdescribed here under cooperative agreement CR-722-1-061 to The University of Texas at Austin. It has beensubjected toAgency review and approved for publication.
0
0.05
0.1
0.15
0.2
0.25
0.3
0.35
0.4
0.45
0 5000 10000 15000
t[d]
ma
ss
flu
x [k
g/d
]
Case 1 (TCE)
Case 2 (PCE)
Case 3 (TCE from TCE/PCEmixture)
Fig. 10. Mass flux rates from DNAPL pools.
0
0.5
1
1.5
2
2.5
0 10 20 30 40 50
t[yr]
C [m
g/L
]
60
Case 1 (TCE)/Well 2
Case 2 (PCE)/Well 2
Fig. 11. Well #2 Concentrations from pools for Cases 1 & 2.
Appendix A. Method of characteristics solution
The conservation of mass equation for the DNAPLphase can be written as
vSd
vtC
q
h
vFd
vSd
vSd
vzZ0 ðA1Þ
This equation is a single hyperbolic partial differentialequation for which the method of characteristicssolution is
dz
dt
Sd
Zq
h
dFd
dSd
Sd
ðA2Þ
Fd is defined in Table 1 and the chain rule can be used tocalculate dFd/dSd with all of the required derivativesfound using the definition for Fd and the relativepermeability functions. The relationship between thevelocity and saturation is highly non-linear and thissolution is valid only where the derivatives appearing inEq. (A2) exist at each point of the solution domain.When the saturation derivatives fail to exist in thesolution, an integral form of the continuity equation isused to find a generalized or weak solution
dzfdt
Zq
h
ðFd1 �Fd2ÞðSd1 �Sd2Þ
ðA3Þ
where subscripts 1 and 2 refer to values at locationsbehind and ahead of the front, respectively. In the casewhere there is no DNAPL ahead of the front, Fd2 andSd2 are equal to zero and the solution is referred to asa shock solution. Shocks are characteristic features ofhyperbolic equations and preserve the material (mass)balance. In nature, capillary pressures have a dissipatingeffect at the interface between the two phases anda shock would be smoothed. Lake (1989) shows how thesaturation of the shock is that which satisfies theequation,
q
h
dFd
dSd
Sd
Zq
h
ðFd1 �Fd2ÞðSd1 �Sd2Þ
ðA4Þ
which, with no DNAPL present initially, can besimplified to
dFd
dSd
Sd
ZFd1
Sd1
ðA5Þ
Thus, the solution is that saturation where the chordconnecting the origin to the Sd1, Fd1 point has the sameslope as the derivative of Fd � Sd curve (i.e., dFd/dSd) atthat point.

30 C.S. Willson et al. / Environmental Modelling & Software 21 (2006) 16–32
Calculation of the resistance term in Eq. (7)
In order to calculate the resistance term in thedenominator of Eq. (7) integrate Eq. (A2) and use: zZ 0at tZ 0; SdiZ 0 for all zO 0 at tZ 0; and qt/hZ(SdB/L� Sdi)zf, where Sdi is the initial DNAPL satura-tion; to get
zZSdB=LzfdFd
dSd
ðA6Þ
where SdB/L is the front saturation determined via theMOC (this is found from Eq. (A4) and is often called theBuckley–Leverett saturation). Eq. (A6) can be used tofind the saturation distribution at various depths for anMOC solution. Fig. A1 shows the DNAPL saturationprofile for front depths of 100 cm and 1000 cm using theparameters listed in Table 2. It can be seen from Fig. A1that the saturation at the shock front moves rapidlycompared to the other saturations for the given injectionconditions.
Differentiating Eq. (A6) and multiplying through bydSd yields
dzZSdB=Lzf
d2Fd
dS2d
!dSd ðA7Þ
This solution is only valid between the Buckley–Leverettsaturation, SdB/L, and the saturation at the injectionlocation.
0
200
400
600
800
1000
0.00 0.10 0.20 0.30 0.40
Sdz[
cm]
Fig. A1. Saturation vs. depth for Buckley–Leverett solution.
References
Abriola, L.M., 1988. Multiphase flow and transport models for
organic chemicals: a review and assessment. Technical Report
EPRI EA-5976, Electric Power Research Institute, Palo Alto, CA.
Anderson, M.R., Johnson, R.L., Pankow, J.F., 1992a. Dissolution
of dense chlorinated solvents into ground water: 1. Dissolution
from a well-defined residual source. Ground Water 30 (2),
250–256.
Anderson, M.R., Johnson, R.L., Pankow, J.F., 1992b. Dissolution of
dense chlorinated solvents into groundwater. 3. Modeling contam-
inant plumes from fingers and pools of solvent. Environ. Sci.
Technol. 26 (5), 901–908.
Baehr, A.L., Corapcioglu, M.Y., 1987. A compositional multiphase
model for groundwater contamination by petroleum products, 2.
Numerical solution. Water Resour. Res. 23 (1), 201–214.
Banerjee, S., 1984. Solubility of organic mixtures in water. Environ.
Sci. Technol. 18 (8), 587–591.
Brooks, R.H., Corey, A.T., 1964. Hydraulic Properties of Porous
Media. Colorado State University Hydrology Paper No. 3. Ft.
Collins.
Buckley, S.E., Leverett, M.C., 1942. Mechanism of fluid displacement
in sands. Trans. Am. Inst. Min. Eng. 146, 107–117.
Burdine, N.T., 1953. Relative permeability calculations from pore size
distribution data. Trans. Am. Inst. Min. Eng. 198, 71–78.
Carsel, R.F., Parrish, R.S., 1988. Developing joint probability
distributions of soil water retention characteristics. Water Resour.
Res. 24 (5), 755–769.
Chang, Y., Lim, M.T., Pope, G.A., Sepehrnoori, K., 1991. Carbon
dioxide flow patterns under multiphase flow, heterogeneous field
scale conditions. 66th Annual Technical Conference and Exhibition
of the SPE, Dallas, TX, Oct 6–9. pp. 611–621.
Charbeneau, R.J., 1984. Kinematic models for soil moisture and solute
transport. Water Resour. Res. 20 (6), 699–706.
Charbeneau, R.J., Weaver, J.W., Lien, B.K., 1995. The hydrocarbon
spill screening model (HSSM). Theoretical Background and Source
Codes, vol. 2. EPA/600/R-94/039b, April 1995.
Charbeneau, R.J., Ogintz, J., Aubert, W.G., 1996. Transport of
petroleum refinery waste after deep-well injection. In: Apps, J.A.,
Tsang, C.F. (Eds.), Deep Injection Disposal of Hazardous and
Industrial Waste: Scientific and Engineering Aspects. Academic
Press, pp. 775.
Chen, Z.-X., 1988. Some invariant solutions to two-phase fluid
displacement problems including capillary effect. SPERE May,
691–700.
Chouke, R.L., van Meurs, P., van der Poel, C., 1959. The instability of
slow, immiscible, viscous liquid–liquid displacements in permeable
media. Trans. Am. Inst. Min. Metall. Pet. Eng. 216, 188–194.
Corapcioglu, M.Y., Hossain, M.A., 1990. Ground-water contamina-
tion by high-density immiscible hydrocarbon slugs in gravity-
driven gravel aquifers. Ground Water 28 (3), 403–412.
El-Kadi, A.I., 1992. Applicability of sharp interface models for NAPL
transport: 1. Infiltration. Ground Water 30 (6), 849–856.
Ewing, R.P., Berkowitz, B., 1998. A generalized growth model for
simulating initial migration of dense non-aqueous phase liquids.
Water Resour. Res. 34, 611–622.
Gelhar, L.W., 1993. Stochastic Subsurface Hydrology. Prentice Hall,
Englewood Cliffs, NJ.
Geller, J.T., Hunt, J.R., 1993. Mass transfer from nonaqueous phase
organic liquids in water-saturated porous media. Water Resour.
Res. 29 (4), 833–845.
Glass, R.J., Parlange, J.-Y., Steenhuis, T.S., 1991. Immiscible
displacement in porous media: stability analysis of three-
dimensional, axisymmetric disturbances with application to gravi-
ty-driven wetting front instability. Water Resour. Res. 27 (8),
1947–1956.
31C.S. Willson et al. / Environmental Modelling & Software 21 (2006) 16–32
Glass, R.J., Conrad, S.H., Pepinski, W., 2000. Gravity-destabilized
nonwetting phase invasion in macroheterogeneous porous media:
experimental observations of invasion dynamics and scale analysis.
Water Resour. Res. 36 (11), 3121–3138.
Green, W.H., Ampt, G.A., 1911. Studies on soil physics. J. Agric. Sci.
21, 587.
Held, R.J., Illangasekare, T.H., 1995a. Fingering of dense nonaqueous
phase liquids in porous media, 1. Experimental investigation.
Water Resour. Res. 31 (5), 1213–1222.
Held, R.J., Illangasekare, T.H., 1995b. Fingering of dense nonaqueous
phase liquids in porous media, 2. Analysis and classification. Water
Resour. Res. 31 (5), 1223–1231.
Hill, D.E., Parlange, J.-Y., 1972. Wetting front instability in layered
soils. Soil Sci. Soc. Am. Proc. 36 (5), 697–702.
Hilpert, M., McBride, J.F., Miller, C.T., 2001. Investigation of
the residual-funicular nonwetting-phase-saturation relation. Adv.
Water Resour. 24, 157–177.
Hubbert, M.K., 1956. Darcy’s law and the field equations of
the flow of underground fluids. Petrol Trans, AIME 207,
222–239.
Illangasekare, T.H., Ramsey, J.L., Jensen, K.H., Butts, M., 1995.
Experimental study of movement and distribution of dense organic
contaminants in heterogeneous aquifers. J. Contam. Hydrol. 20,
1–25.
Imhoff, P.T., Jaffe, P.R., Pinder, G.F., 1993. An experimental study of
complete dissolution of a nonaqueous phase liquid in saturated
porous media. Water Resour. Res. 30 (2), 307–320.
Imhoff, P.T., Thyrum, G.P., Miller, C.T., 1996. Dissolution fingering
during the solubilization of nonaqueous phase liquids in saturated
porous media. 2. Experimental observations. Water Resour. Res.
33 (6).
Johnson, R.L., Pankow, J.F., 1992. Dissolution of dense chlorinated
solvents into groundwater. 2. Source functions for pools of solvent.
Environ. Sci. Technol. 26 (5), 896–901.
Khan, F.I., Husain, T., 2003. Evaluation of a petroleum hydrocarbon
contaminated site for natural attenuation using ‘RBMNA’
methodology. Environ. Mod. Softw. 18 (2), 179–194.
Kueper, B.H., Frind, E.O., 1988. An overview of immiscible fingering
in porous media. J. Contam. Hydrol. 2, 95–110.
Kueper, B.H., Gerhard, J.I., 1995. Variability of point source
infiltration rates for two-phase flow in heterogeneous porous
media. Water Resour. Res. 31 (12), 2971–2980.
Kueper, B.H., Redman, D., Starr, R.C., Reitsma, S., Mah, M., 1993.
A field experiment to study the behavior of tetrachloroethylene
below the water table: spatial distribution of residual and pooled
DNAPL. Ground Water 31 (5), 756–766.
Lake, L.W., 1989. Enhanced Oil Recovery. Prentice Hall, Englewood
Cliffs, NJ.
Lesage, S., Brown, S., 1994. Observation of the dissolution of NAPL
mixtures. J. Contam. Hydrol. 15, 57–71.
Manivannan, I., Powers, S.E., Curry, G.W., 1996. Dissolution of
NAPLs entrapped in heterogeneous porous media. In: Reddi, L.N.
(Ed.), American Society of Civil Engineers Conference on Non-
Aqueous Phase Liquids (NAPLs) in Subsurface Environment:
Assessment and Remediation, pp. 563–574.
Mayer, A.S., Miller, C.T., 1996. The influence of mass transfer
characteristics and porous media heterogeneity on nonaqueous
phase dissolution. Water Resour. Res. 32 (6), 1551–1567.
McWhorter, D.B., Sunada, D.K., 1990. Exact integral solutions for
two-phase flow. Water Resour. Res. 26 (3), 399–413.
Miller, C.T., Poirier-McNeill, M.M., Mayer, A.S., 1990. Dissolution
of trapped nonaqueous phase liquids: mass transfer characteristics.
Water Resour. Res. 26 (11), 2783–2796.
Miller, C.T., Christakos, G., Imhoff, P.T., McBride, J.F., Pedit, J.A.,
Trangenstein, J.A., 1998. Multiphase flow and transport modeling
in heterogeneous porous media: challenges and approaches. Adv.
Water Resour. 21 (2), 77–120.
Mohanty, K.K., Davis, H.T., Scriven, L., 1987. Physics of oil
entrapment in water-wet rock. SPERE 2, 113–128.
Moissis, D.E., Wheeler, M.F., Miller, C.A., 1994. Simulation of
miscible viscous fingering using a modified method of character-
istics: effects of gravity and heterogeneity. SPE Adv. Technol. Ser.
1 (1), 62–70.
Morel-Seytoux, H.J., Khanji, J., 1974. Derivation of an equation of
infiltration. Water Resour. Res. 10 (4), 795–800.
Ng, K.M., Davis, H.T., Scriven, L.E., 1978. Visualization of blob
mechanics in flow through porous media. Chem. Eng. Sci. 33,
1009–1017.
Peters, E.J., Flock, D.L., 1981. The onset of instability during two-
phase immiscible displacement in porous media. SPEJ. Soc. Pet.
Eng. 21, 249–258.
Pinder,F., Stotfhoff, S.A. 1988.Can the sharp interface salt-watermodel
capture transient behavior? Proceedings of the VII International
Conference,ComputationalMethods inWaterResources.Modeling
Surface and Sub-Surface Flows, vol. 1. June 1988, Computational
Mechanics Publications, Southampton, UK, pp. 217.
Powers, S.E., Loureiro, C.O., Abriola, L.M., Weber Jr., W.J., 1991.
Theoretical study of the significance of nonequilibrium dissolution
of nonaqueous phase liquids in subsurface systems. Water Resour.
Res. 27 (2), 463–477.
Powers, S.E., Abriola, L.M., Weber Jr., W.J., 1992. An experimental
investigation of nonaqueous phase liquid dissolution in saturated
subsurface systems: steady state mass transfer. Water Resour. Res.
28 (10), 2691–2705.
Priddle, M.W., MacQuarrie, K.T.B., 1994. Dissolution of creosote
in groundwater: an experimental and modeling investigation.
J. Contam. Hydrol. 15, 27–56.
Rathfelder, K., Abriola, L.M., 1992. Comparison of numerical
modeling approaches for subsurface immiscible contaminant
transport. ASCE Annual Conference on Hydraulic Engineering,
pp. 275–280.
Reible, D.D., Illangasekare, T.H., Dhoshi, D.V., Malhiet, M.E., 1990.
Infiltration of immiscible contaminants in the unsaturated zone.
Ground Water 28 (5), 685–692.
Russell, T.F., 1996. Modeling of multiphase, multicomponent
transport in the subsurface. Rev. Geophys. July (Suppl.),
1035–1047.
Saffman, P.G., Taylor, G.F.R.S., 1958. The penetration of a fluid into
a porous medium or Hele–Shaw cell containing a more viscous
liquid. Proc. R. Soc. Lond. Ser. A 246, 312–331.
Schwille, F., 1988. Dense Chlorinated Solvents in Porous and
Fractured Media, Lewis, Chelsea, Mich., 146 pp.
Smith, J.E., Zhang, Z.F., 2000. Determining the effective interfacial
tension and predicting finger spacing for DNAPL penetra-
tion into water-saturated porous media. J. Contam. Hydrol. 48,
167–183.
Strack, O.D.L., 1989. Groundwater Mechanics, Prentice Hall, NY.
Thirumalaivasan, D., Karmegam, M., Venugopal, K., 2003. AHP-
DRASTIC: software for specific aquifer vulnerability assessment
using DRASTIC model and GIS. Environ. Mod. Softw. 18 (7),
645–656.
Weaver, J.W., 1991. Approximate Multiphase Flow Modeling by
Characteristic Methods. U.S. Environmental Protection Agency,
EPA/600/2-91/015, NTIS PB91-190959.
Weaver, J.W., Charbeneau, R.J., Lien, B.K., 1994a. A screening model
for nonaqueous phase liquid transport in the vadose zone using
Green–Ampt and kinematic wave theory. Water Resour. Res. 30
(1), 93–105.
Weaver, J.W., Charbeneau, R.J., Tauxe, J.D., Lien, B.K., Provost,
J.B., 1994b. The Hydrocarbon Spill Screening Model (HSSM).
User’s Guide, vol. 1. EPA/600/R-94/039a, April 1994.
Weaver, J.W., 1996. Application of the hydrocarbon spill screening
model to field sites. In: Reddi, L.N. (Ed.), Non-Aqueous Phase
Liquids (NAPLs) in Subsurface Environment: Assessment and

32 C.S. Willson et al. / Environmental Modelling & Software 21 (2006) 16–32
Remediation. American Society of Civil Engineers, New York, pp.
788–799.
Willson, C.S., 1997. A Screening Model to Investigate DNAPL
Contamination of Porous Media. Ph.D. Dissertation, The Univer-
sity of Texas at Austin, Austin, TX, 216 pp.
Willson, C.S., Weaver, J.W., Illangasekare, T., Charbeneau, R.J., 1996.
Framework for a screening model for DNAPL contamination
of porousmedia. In:Reddi, L.N. (Ed.), Non-Aqueous PhaseLiquids
(NAPLs) in Subsurface Environment: Assessment and Remedia-
tion. American Society of Civil Engineers, New York, pp. 407–418.