site characterization technologies for dnapl … characterization technologies for dnapl...
TRANSCRIPT

Site Characterization Technologies for DNAPL Investigations


Office of Solid Waste and EPA 542-R-04-017 Emergency Response (5102G) September 2004
http://www.epa.gov/tio http://cluin.org
Site Characterization Technologies for DNAPLInvestigations


NOTICE
This report has been prepared by Environmental Management Support, Inc. for the U.S. Environmental Protection Agency (EPA) Office of Superfund Remediation and Technology Innovation under Contract Numbers 68-W-00-084 and 68-W-03-038. This report has undergone EPA and external review by subject-matter experts. Information in this report is derived from numerous sources (including personal communications with experts in the field), some of which has been peer reviewed. Case studies are presented as given in the article or report in which they appear and generally have not been peer reviewed by EPA. Mention of trade names or commercial products does not constitute endorsement or recommendation for use.
A PDF version of Site Characterization Techniques for DNAPL Investigations is available for viewing or downloading from the Hazardous Waste Cleanup Information (CLUIN) system web site at http:/cluin.org. A limited number of copies are available free of charge, and may be ordered via the web site, by mail, or by facsimile from:
U.S. EPA/National Service Center for Environmental Publications (NSCEP) P.O. Box 42419Cincinnati, Ohio 45242-0419 Telephone (800) 490-9198 or (513) 490-8190 Facsimile (513) 489-8695
FOREWORD
Because of their unique way of moving through the subsurface, DNAPLs can become ongoing groundwater contamination sources for many years if not centuries. Their ability to move as a mass through the vadose zone and penetrate the water table while following the path of least geologic resistance makes them very difficult to characterize and remediate. EPA’s Office of Superfund Remediation and Technology Innovation (OSRTI) funded this report to provide hazardous waste site managers with information on the application and performance of characterization technologies and approaches to locating and characterizing dense non-aqueous phase liquid (DNAPL) contamination. The document describes technologies and approaches that have been used or potentially could be used to locate and characterize DNAPLs. It is hoped that remedial project managers and other site managers can use this information in their systematic planning process for choosing technologies to address the problems associated with DNAPLs at contaminated sites.
ACKNOWLEDGMENTS
Special acknowledgment is given to the EPA Ground Water Forum for their thoughtful comments on this report and to the independent reviewers whose contributions were greatly appreciated.
v

This Page Left Intentionally Blank

CONTENTSPage
FIGURES . . . . . . . . . . . . . . . . . . . . . . . . . . . . . . . . . . . . . . . . . . . . . . . . . . . . . . . . . . . . . . . . . . . . . . . . . . x
TABLES . . . . . . . . . . . . . . . . . . . . . . . . . . . . . . . . . . . . . . . . . . . . . . . . . . . . . . . . . . . . . . . . . . . . . . . . . xii
ACRONYMS AND ABBREVIATIONS . . . . . . . . . . . . . . . . . . . . . . . . . . . . . . . . . . . . . . . . . . . . . . . . xiii
EXECUTIVE SUMMARY . . . . . . . . . . . . . . . . . . . . . . . . . . . . . . . . . . . . . . . . . . . . . . . . . . . . . . . . . . . xiv
INTRODUCTION . . . . . . . . . . . . . . . . . . . . . . . . . . . . . . . . . . . . . . . . . . . . . . . . . . . . . . . . . . . . . . . . . . . 1
THE DNAPL PROBLEM . . . . . . . . . . . . . . . . . . . . . . . . . . . . . . . . . . . . . . . . . . . . . . . . . . . . . . . . . . . . . 9
USING THE TRIAD APPROACH TO PLANNING THE INVESTIGATION . . . . . . . . . . . . . . . . . . . 11
USING A TECHNOLOGY TOOLBOX FOR BETTER SITE DNAPL CHARACTERIZATION . . . . 13
Combining Techniques for Maximum Effectiveness . . . . . . . . . . . . . . . . . . . . . . . . . . . . . . . . . . . . . . . . 14 Simple Hydrogeology . . . . . . . . . . . . . . . . . . . . . . . . . . . . . . . . . . . . . . . . . . . . . . . . . . . . . . . . . . . . 14 Multiple Hydrogeologic Units . . . . . . . . . . . . . . . . . . . . . . . . . . . . . . . . . . . . . . . . . . . . . . . . . . . . . . 15 Discontinuous Interbedded Layers . . . . . . . . . . . . . . . . . . . . . . . . . . . . . . . . . . . . . . . . . . . . . . . . . . 17 Fractured Bedrock . . . . . . . . . . . . . . . . . . . . . . . . . . . . . . . . . . . . . . . . . . . . . . . . . . . . . . . . . . . . . . . 18
USE OF NON-GEOPHYSICAL TECHNIQUES FOR DNAPL INVESTIGATIONS . . . . . . . . . . . . . 27 Diffusion Sampler . . . . . . . . . . . . . . . . . . . . . . . . . . . . . . . . . . . . . . . . . . . . . . . . . . . . . . . . . . . . . . . 27 Direct Push Technologies . . . . . . . . . . . . . . . . . . . . . . . . . . . . . . . . . . . . . . . . . . . . . . . . . . . . . . . . . 29
Cone Penetrometer Testing Rig . . . . . . . . . . . . . . . . . . . . . . . . . . . . . . . . . . . . . . . . . . . . . . . . . 30 Conductivity . . . . . . . . . . . . . . . . . . . . . . . . . . . . . . . . . . . . . . . . . . . . . . . . . . . . . . . . . . . . . 32 Induced Fluorescence . . . . . . . . . . . . . . . . . . . . . . . . . . . . . . . . . . . . . . . . . . . . . . . . . . . . . . 33
Laser Induced Fluorescence . . . . . . . . . . . . . . . . . . . . . . . . . . . . . . . . . . . . . . . . . . . . . . 34 Mercury Lamp Induced Fluorescence . . . . . . . . . . . . . . . . . . . . . . . . . . . . . . . . . . . . . . 36
In-Situ Camera . . . . . . . . . . . . . . . . . . . . . . . . . . . . . . . . . . . . . . . . . . . . . . . . . . . . . . . . . . . 37 Continuous Coring . . . . . . . . . . . . . . . . . . . . . . . . . . . . . . . . . . . . . . . . . . . . . . . . . . . . . . . . . . . 38 In-Situ Water Groundwater Sampling . . . . . . . . . . . . . . . . . . . . . . . . . . . . . . . . . . . . . . . . . . . . 42
BAT® . . . . . . . . . . . . . . . . . . . . . . . . . . . . . . . . . . . . . . . . . . . . . . . . . . . . . . . . . . . . . . . . . . 42 Small Diameter Telescoping Screen . . . . . . . . . . . . . . . . . . . . . . . . . . . . . . . . . . . . . . . . . . . 42 SimulProbe® . . . . . . . . . . . . . . . . . . . . . . . . . . . . . . . . . . . . . . . . . . . . . . . . . . . . . . . . . . . . 44 Waterloo Profiler® . . . . . . . . . . . . . . . . . . . . . . . . . . . . . . . . . . . . . . . . . . . . . . . . . . . . . . . . 45
Membrane Interface Probe . . . . . . . . . . . . . . . . . . . . . . . . . . . . . . . . . . . . . . . . . . . . . . . . . . . . . 46 Hydrophobic Dye Testing . . . . . . . . . . . . . . . . . . . . . . . . . . . . . . . . . . . . . . . . . . . . . . . . . . . . . . 50 Hydrophobic Flexible Membranes . . . . . . . . . . . . . . . . . . . . . . . . . . . . . . . . . . . . . . . . . . . . . . . 52
Optical Televiewer . . . . . . . . . . . . . . . . . . . . . . . . . . . . . . . . . . . . . . . . . . . . . . . . . . . . . . . . . . . . . . 53 Tracer Testing . . . . . . . . . . . . . . . . . . . . . . . . . . . . . . . . . . . . . . . . . . . . . . . . . . . . . . . . . . . . . . . . . . 54 Soil Gas Profiling . . . . . . . . . . . . . . . . . . . . . . . . . . . . . . . . . . . . . . . . . . . . . . . . . . . . . . . . . . . . . . . 55
USE OF GEOPHYSICAL METHODS IN DNAPL INVESTIGATIONS . . . . . . . . . . . . . . . . . . . . . . . 57 Overview . . . . . . . . . . . . . . . . . . . . . . . . . . . . . . . . . . . . . . . . . . . . . . . . . . . . . . . . . . . . . . . . . . . . . . 57 Frequently Used Geophysical Borehole Methods . . . . . . . . . . . . . . . . . . . . . . . . . . . . . . . . . . . . . . . 59
Acoustic Televiewer . . . . . . . . . . . . . . . . . . . . . . . . . . . . . . . . . . . . . . . . . . . . . . . . . . . . . . . . . . 61 Electromagnetic Induction . . . . . . . . . . . . . . . . . . . . . . . . . . . . . . . . . . . . . . . . . . . . . . . . . . . . . 61
vii

Gamma-Gamma Probe . . . . . . . . . . . . . . . . . . . . . . . . . . . . . . . . . . . . . . . . . . . . . . . . . . . . . . . . 62 Natural Gamma Probe . . . . . . . . . . . . . . . . . . . . . . . . . . . . . . . . . . . . . . . . . . . . . . . . . . . . . . . . . 62 Neutron Probe . . . . . . . . . . . . . . . . . . . . . . . . . . . . . . . . . . . . . . . . . . . . . . . . . . . . . . . . . . . . . . . 63 Resistivity Probe . . . . . . . . . . . . . . . . . . . . . . . . . . . . . . . . . . . . . . . . . . . . . . . . . . . . . . . . . . . . . 63 Spontaneous Potential . . . . . . . . . . . . . . . . . . . . . . . . . . . . . . . . . . . . . . . . . . . . . . . . . . . . . . . . . 64 Combining Commonly Collected Borehole Geophysical Information . . . . . . . . . . . . . . . . . . . . 64
Electrical Methods . . . . . . . . . . . . . . . . . . . . . . . . . . . . . . . . . . . . . . . . . . . . . . . . . . . . . . . . . . . . . . . 66 Electrical Resistivity . . . . . . . . . . . . . . . . . . . . . . . . . . . . . . . . . . . . . . . . . . . . . . . . . . . . . . . . . . 67 Electrical Resistivity Tomography . . . . . . . . . . . . . . . . . . . . . . . . . . . . . . . . . . . . . . . . . . . . . . . 68
Electromagnetic Methods . . . . . . . . . . . . . . . . . . . . . . . . . . . . . . . . . . . . . . . . . . . . . . . . . . . . . . . . . 69 Terrain Conductivity . . . . . . . . . . . . . . . . . . . . . . . . . . . . . . . . . . . . . . . . . . . . . . . . . . . . . . . . . . 71 Horizontal Loop Frequency Domain Electromagnetics . . . . . . . . . . . . . . . . . . . . . . . . . . . . . . . 72 Fixed Source Frequency Domain Electromagnetics (Sundberg and Turam Methods) . . . . . . . . 73 Very Low Frequency Electromagnetics . . . . . . . . . . . . . . . . . . . . . . . . . . . . . . . . . . . . . . . . . . . 73 Very Low Frequency Resistivity by EM Induction . . . . . . . . . . . . . . . . . . . . . . . . . . . . . . . . . . 74 Fixed Source Time Domain Electromagnetics . . . . . . . . . . . . . . . . . . . . . . . . . . . . . . . . . . . . . . 75
Ground Penetrating Radar . . . . . . . . . . . . . . . . . . . . . . . . . . . . . . . . . . . . . . . . . . . . . . . . . . . . . . . . . 75 Magnetics . . . . . . . . . . . . . . . . . . . . . . . . . . . . . . . . . . . . . . . . . . . . . . . . . . . . . . . . . . . . . . . . . . . . . 77 Seismic Methods . . . . . . . . . . . . . . . . . . . . . . . . . . . . . . . . . . . . . . . . . . . . . . . . . . . . . . . . . . . . . . . . 78
Seismic Reflection . . . . . . . . . . . . . . . . . . . . . . . . . . . . . . . . . . . . . . . . . . . . . . . . . . . . . . . . . . . 79 Seismic Refraction . . . . . . . . . . . . . . . . . . . . . . . . . . . . . . . . . . . . . . . . . . . . . . . . . . . . . . . . . . . 81 Cross-Borehole Seismic Techniques . . . . . . . . . . . . . . . . . . . . . . . . . . . . . . . . . . . . . . . . . . . . . 83
TECHNOLOGIES UNDER EVALUATION . . . . . . . . . . . . . . . . . . . . . . . . . . . . . . . . . . . . . . . . . . . . . 85 Complex Resistivity . . . . . . . . . . . . . . . . . . . . . . . . . . . . . . . . . . . . . . . . . . . . . . . . . . . . . . . . . . . . . 85 Downhole Thermal Desorption with Top-Side Analysis . . . . . . . . . . . . . . . . . . . . . . . . . . . . . . . . . 86 Electromagnetic Offset Logging . . . . . . . . . . . . . . . . . . . . . . . . . . . . . . . . . . . . . . . . . . . . . . . . . . . . 87 Halogen Specific Down Hole Detector . . . . . . . . . . . . . . . . . . . . . . . . . . . . . . . . . . . . . . . . . . . . . . . 89 Flux Methods . . . . . . . . . . . . . . . . . . . . . . . . . . . . . . . . . . . . . . . . . . . . . . . . . . . . . . . . . . . . . . . . . . . 90
Passive Flux Meter . . . . . . . . . . . . . . . . . . . . . . . . . . . . . . . . . . . . . . . . . . . . . . . . . . . . . . . . . . . 91 Integral Pumping . . . . . . . . . . . . . . . . . . . . . . . . . . . . . . . . . . . . . . . . . . . . . . . . . . . . . . . . . . . . . 92
Hydrosparge VOC Sampler . . . . . . . . . . . . . . . . . . . . . . . . . . . . . . . . . . . . . . . . . . . . . . . . . . . . . . . . 92 Proton Magnetic Resonance . . . . . . . . . . . . . . . . . . . . . . . . . . . . . . . . . . . . . . . . . . . . . . . . . . . . . . . 94 Sonic CPT Probing . . . . . . . . . . . . . . . . . . . . . . . . . . . . . . . . . . . . . . . . . . . . . . . . . . . . . . . . . . . . . . 94
CONCLUSIONS . . . . . . . . . . . . . . . . . . . . . . . . . . . . . . . . . . . . . . . . . . . . . . . . . . . . . . . . . . . . . . . . . . . 97 Non-Geophysical Methods . . . . . . . . . . . . . . . . . . . . . . . . . . . . . . . . . . . . . . . . . . . . . . . . . . . . . . . . 97 Geophysical Methods . . . . . . . . . . . . . . . . . . . . . . . . . . . . . . . . . . . . . . . . . . . . . . . . . . . . . . . . . . . . 97
REFERENCES . . . . . . . . . . . . . . . . . . . . . . . . . . . . . . . . . . . . . . . . . . . . . . . . . . . . . . . . . . . . . . . . . . . . . 99
GLOSSARY . . . . . . . . . . . . . . . . . . . . . . . . . . . . . . . . . . . . . . . . . . . . . . . . . . . . . . . . . . . . . . . . . . . . . . 105
APPENDIX A:ADDITIONAL READING . . . . . . . . . . . . . . . . . . . . . . . . . . . . . . . . . . . . . . . . . . . . . . . . . . . . . . . A-1
APPENDIX B:PHYSICAL/GEOCHEMICAL BEHAVIOR OF DNAPLS . . . . . . . . . . . . . . . . . . . . . . . . . . . . . . B-1 DNAPL Physical/Chemical Characteristics . . . . . . . . . . . . . . . . . . . . . . . . . . . . . . . . . . . . . . . . . . B-1
Specific Gravity . . . . . . . . . . . . . . . . . . . . . . . . . . . . . . . . . . . . . . . . . . . . . . . . . . . . . . . . . . . . B-1 Solubility . . . . . . . . . . . . . . . . . . . . . . . . . . . . . . . . . . . . . . . . . . . . . . . . . . . . . . . . . . . . . . . . . . B-2 Dynamic Viscosity . . . . . . . . . . . . . . . . . . . . . . . . . . . . . . . . . . . . . . . . . . . . . . . . . . . . . . . . . . B-2 Vapor Pressure . . . . . . . . . . . . . . . . . . . . . . . . . . . . . . . . . . . . . . . . . . . . . . . . . . . . . . . . . . . . . B-2
viii

Henry’s Law Constant . . . . . . . . . . . . . . . . . . . . . . . . . . . . . . . . . . . . . . . . . . . . . . . . . . . . . . . B-3 Soil and Groundwater Characteristics that Affect DNAPLs . . . . . . . . . . . . . . . . . . . . . . . . . . . . . . B-3
Initial Moisture Content . . . . . . . . . . . . . . . . . . . . . . . . . . . . . . . . . . . . . . . . . . . . . . . . . . . . . . B-3 Interfacial Tension . . . . . . . . . . . . . . . . . . . . . . . . . . . . . . . . . . . . . . . . . . . . . . . . . . . . . . . . . . B-3 Residual Saturation . . . . . . . . . . . . . . . . . . . . . . . . . . . . . . . . . . . . . . . . . . . . . . . . . . . . . . . . . . B-3 Relative Permeability . . . . . . . . . . . . . . . . . . . . . . . . . . . . . . . . . . . . . . . . . . . . . . . . . . . . . . . . B-4 Capillary Pressure . . . . . . . . . . . . . . . . . . . . . . . . . . . . . . . . . . . . . . . . . . . . . . . . . . . . . . . . . . . B-4 Groundwater Velocity . . . . . . . . . . . . . . . . . . . . . . . . . . . . . . . . . . . . . . . . . . . . . . . . . . . . . . . . B-4
DNAPL Movement in the Subsurface . . . . . . . . . . . . . . . . . . . . . . . . . . . . . . . . . . . . . . . . . . . . . . . B-5 References . . . . . . . . . . . . . . . . . . . . . . . . . . . . . . . . . . . . . . . . . . . . . . . . . . . . . . . . . . . . . . . . . . . . B-8
APPENDIX C:INTERNET RESOURCES . . . . . . . . . . . . . . . . . . . . . . . . . . . . . . . . . . . . . . . . . . . . . . . . . . . . . . . C-1
APPENDIX DVENDOR LIST . . . . . . . . . . . . . . . . . . . . . . . . . . . . . . . . . . . . . . . . . . . . . . . . . . . . . . . . . . . . . . . . D-1
ix
FIGURES
Figure Title Page
1-1. Distribution of Potential DNAPL Accumulation in a Hypothetical Karst Setting . . . . . . . . . . . . . . . 3 5-1. Diffusion Sampler. . . . . . . . . . . . . . . . . . . . . . . . . . . . . . . . . . . . . . . . . . . . . . . . . . . . . . . . . . . . . . . 27 5-2. All Terrain Cone Penetrometer Testing Rigs . . . . . . . . . . . . . . . . . . . . . . . . . . . . . . . . . . . . . . . . . . 30 5-3. CPT Probe with Pore Pressure Transducer and Electrical Conductivity Tool . . . . . . . . . . . . . . . . . 31 5-4. Conductivity Drive Probe for Fitting on DP Rig . . . . . . . . . . . . . . . . . . . . . . . . . . . . . . . . . . . . . . . 32 5-5. Laser Induced Fluorescence CPT Probe. . . . . . . . . . . . . . . . . . . . . . . . . . . . . . . . . . . . . . . . . . . . . . 34 5-6. LIF Printout Showing Predominantly Coal Tar Contamination Between 8 and 14 ft bgs. . . . . . . . 36 5-7. Fuel Fluorescence Detector . . . . . . . . . . . . . . . . . . . . . . . . . . . . . . . . . . . . . . . . . . . . . . . . . . . . . . . 36 5-8. DNAPL Image as Seen Through GeoVis . . . . . . . . . . . . . . . . . . . . . . . . . . . . . . . . . . . . . . . . . . . . . 37 5-9. Dual Tube Direct Push Rig . . . . . . . . . . . . . . . . . . . . . . . . . . . . . . . . . . . . . . . . . . . . . . . . . . . . . . . . 38 5-10. BAT® In Situ Groundwater Sampler. . . . . . . . . . . . . . . . . . . . . . . . . . . . . . . . . . . . . . . . . . . . . . . . 42 5-11. Hydropunch® II Sampler . . . . . . . . . . . . . . . . . . . . . . . . . . . . . . . . . . . . . . . . . . . . . . . . . . . . . . . . 43 5-12. Waterloo Profiler® . . . . . . . . . . . . . . . . . . . . . . . . . . . . . . . . . . . . . . . . . . . . . . . . . . . . . . . . . . . . . 45 5-13. Membrane Interface Probe . . . . . . . . . . . . . . . . . . . . . . . . . . . . . . . . . . . . . . . . . . . . . . . . . . . . . . . 48 5-14. Flexible Membrane Deployment . . . . . . . . . . . . . . . . . . . . . . . . . . . . . . . . . . . . . . . . . . . . . . . . . . 52 5-15. Optical Televiewer. . . . . . . . . . . . . . . . . . . . . . . . . . . . . . . . . . . . . . . . . . . . . . . . . . . . . . . . . . . . . . 53 6-1. Acoustic Viewer 3-D Image of Borehole . . . . . . . . . . . . . . . . . . . . . . . . . . . . . . . . . . . . . . . . . . . . . 61 6-2. Geophysical Log Using Multiple Methods . . . . . . . . . . . . . . . . . . . . . . . . . . . . . . . . . . . . . . . . . . . . 65 6-3. Electrical Resistivity Array Configurations. . . . . . . . . . . . . . . . . . . . . . . . . . . . . . . . . . . . . . . . . . . . 66 6-4. Ohmmapper Resistivity Instrument . . . . . . . . . . . . . . . . . . . . . . . . . . . . . . . . . . . . . . . . . . . . . . . . . 67 6-5. Vertical Resistivity Sounding Profile. . . . . . . . . . . . . . . . . . . . . . . . . . . . . . . . . . . . . . . . . . . . . . . . 67 6-6. 2-D Resistivity Pseudosections. . . . . . . . . . . . . . . . . . . . . . . . . . . . . . . . . . . . . . . . . . . . . . . . . . . . . 68 6-7. GEM-300 Multi-frequency Terrain Conductivity Meter . . . . . . . . . . . . . . . . . . . . . . . . . . . . . . . . . 71 6-8. Geonics EM-31 Terrain Conductivity Meter . . . . . . . . . . . . . . . . . . . . . . . . . . . . . . . . . . . . . . . . . . 72 6-9. EM16/EM16r VLF Receiver and TX 27 Transmitter . . . . . . . . . . . . . . . . . . . . . . . . . . . . . . . . . . . . 74 6-10. Ground Penetrating Radar Unit. . . . . . . . . . . . . . . . . . . . . . . . . . . . . . . . . . . . . . . . . . . . . . . . . . . . 76 6-11. GPR Cross Section Showing Buried Reflections . . . . . . . . . . . . . . . . . . . . . . . . . . . . . . . . . . . . . . 76 6-12. GSM-19 Overhauser Proton Magnetometer with Gradiometer . . . . . . . . . . . . . . . . . . . . . . . . . . . 77 6-13. GSMP-30 Alkali (Potassium) Magnetometer . . . . . . . . . . . . . . . . . . . . . . . . . . . . . . . . . . . . . . . . . 78 6-14. Common Point Shot and Geophone Configuration . . . . . . . . . . . . . . . . . . . . . . . . . . . . . . . . . . . . 80 6-15. Downhole Seismic Hammer . . . . . . . . . . . . . . . . . . . . . . . . . . . . . . . . . . . . . . . . . . . . . . . . . . . . . . 83 7-1. Downhole Thermal Desorption Probe . . . . . . . . . . . . . . . . . . . . . . . . . . . . . . . . . . . . . . . . . . . . . . . 86 7-2. Electrical Offset Logging System . . . . . . . . . . . . . . . . . . . . . . . . . . . . . . . . . . . . . . . . . . . . . . . . . . . 88 7-3. XSD Electrical Circuitry. . . . . . . . . . . . . . . . . . . . . . . . . . . . . . . . . . . . . . . . . . . . . . . . . . . . . . . . . . 89 7-4. XSD Probe Design of Downhole Components . . . . . . . . . . . . . . . . . . . . . . . . . . . . . . . . . . . . . . . . . 90 7-5. XSD Field data (0-1.0 volt scale) from Offutt AFB . . . . . . . . . . . . . . . . . . . . . . . . . . . . . . . . . . . . . 91 7-6. Hydrosparge Technique . . . . . . . . . . . . . . . . . . . . . . . . . . . . . . . . . . . . . . . . . . . . . . . . . . . . . . . . . . 93 7-7. NUMIS Proton Magnetic Resonance System. . . . . . . . . . . . . . . . . . . . . . . . . . . . . . . . . . . . . . . . . . 94
x

TABLES
Table Title Page
1-1. Non-Geophysical Tools for DNAPL Characterization . . . . . . . . . . . . . . . . . . . . . . . . . . . . . . . . . . . . 5 1-2. Geophysical Surface and Borehole Survey Tools for DNAPL Characterization . . . . . . . . . . . . . . . . 6 1-3. Technologies Under Evaluation . . . . . . . . . . . . . . . . . . . . . . . . . . . . . . . . . . . . . . . . . . . . . . . . . . . . . 6 4-1. Overview of Geophysical and Non-Geophysical Capabilities . . . . . . . . . . . . . . . . . . . . . . . . . . . . . 20 5-1. Vertical Profiling of TCE Groundwater Concentrations with Diffusion Samplers . . . . . . . . . . . . . 29 5-2. Dye Shake Test Results at Camp Lejeune Site . . . . . . . . . . . . . . . . . . . . . . . . . . . . . . . . . . . . . . . . 51 6-1. Geologic Applications of Most Common Surface Geophysical Survey Methods . . . . . . . . . . . . . . 59 6-2. Characteristics of Surface Geophysical Methods Commonly Used at Hazardous Waste Sites for
Evaluating Natural Hydrogeologic Conditions . . . . . . . . . . . . . . . . . . . . . . . . . . . . . . . . . . . . . . . . . 60 6-3. Geophysical Borehole Methods and Constraints . . . . . . . . . . . . . . . . . . . . . . . . . . . . . . . . . . . . . . . 61 B-1. Physical/Chemical Characteristics of Selected DNAPLs . . . . . . . . . . . . . . . . . . . . . . . . . . . . . . . B-2
xi

L
ACRONYMS AND ABBREVIATIONS
AVO C4F8 C6F12 C8F16 C9F18 cm CPT DC DCE DNAPL DoD DOE DPT DQO DSITMS ECD EM EOL EPA ERT FID GC GC/MS GPR HDPE HLEM HSA ITMS kHz
LIF LNAPL mg/l mg/kg MGP MHz MIP ml mm MS NAPL NAS ns OVA PAH PCE PID PITT ppb
amplitude versus offset octafluorocyclobutane dodecafluorodimethylcyclobutane perfluoro-1,3-dimethylcyclohexane perfluoro-1,3,5-trimethylcyclohexane centimeter cone penetrometer testing direct current dichloroethene dense non-aqueous phase liquid Department of Defense Department of Energy direct push technology data quality objective direct sampling ion trap mass spectrometer electron capture detector electromagnetic electromagnetic offset logging Environmental Protection Agency electrical resistivity tomography flame ionization detector gas chromatography gas chromatography/mass spectrometry ground penetrating radar high density polyethylene horizontal loop electromagnetics hollow stem auger ion trap mass spectrometer kilohertz liter laser-induced fluorescence light non-aqueous phase liquid milligram per liter milligram per kilogram manufactured gas plant megahertz membrane interface probe milliliter millimeter mass spectrometry non-aqueous phase liquid Naval Air Station nanoseconds organic vapor analyzer polynuclear aromatic hydrocarbon perchloroethene (tetrachloroethene) photoionization detector partitioning interwell tracer test parts per billion
xii

ACRONYMS AND ABBREVIATIONS (con't)
ppm QC RPM SF6 SVOC TCA TCE TDEM TRPH µg/kg µg/l VLF VOC
parts per million quality control remedial project manager sulfur hexafluoride semivolatile organic compound trichloroethane trichloroethene time domain electromagnetics total recoverable petroleum hydrocarbons microgram per kilogram microgram per liter very low frequency volatile organic compound
xiii

EXECUTIVE SUMMARY
Background
The U.S. EPA has compiled a summary of information on the current state of technologies available for locating and characterizing dense non-aqueous phase liquid (DNAPL) contaminated sites. This summary is intended to help managers at sites with potential or confirmed DNAPL contamination identify suitable characterization technologies, screen the technologies for potential application, learn about applications at similar sites, and locate additional information on these technologies.
Due to its unique manner of migrating and pooling within soil pores and rock fractures, DNAPL in free-phase or residual form is difficult to find and measure. DNAPLs typically contain chlorinated hydrocarbon compounds or industry-specific contaminants resulting from activities such as wood-treating, pesticide/herbicide manufacturing, or coking operations. Relatively small quantities of DNAPL that sink into soil and accumulate below the water table constitute a long-term source of groundwater contamination.
DNAPL characterization historically was attempted through geophysical methods to define major stratigraphic units and low areas on clays or bedrock where DNAPL may pool. Conventional drilling methods were used to obtain chemical samples that were analyzed at offsite laboratories. Technological advances over the last decade now provide the capability to access onsite geological and chemical data more quickly and at considerably lower costs. Innovative technologies are not a panacea that will lead the investigation directly to a DNAPL source but rather are used to increase the chances of locating the DNAPL at an acceptable expense.
DNAPL Characterization Planning and Tools
The Triad approach to planning investigations at sites with potential or known DNAPL contaminants is recommended to help reduce project time and costs. This approach involves the use of systematic planning, dynamic work plans, and quick-turnaround analytical results and data assessments for onsite decision making. Use of the Triad approach is designed to help ensure that the correct project tools are selected, to provide flexibility in field sampling as collected data are interpreted, and to refine a conceptual site model in real time.
The “technology toolbox” for a DNAPL site commonly includes more than one tool, and differs from one site to another. A variety of non-geophysical techniques and geophysical techniques (providing qualitative and quantitative information on subsurface conditions) can be used. Non-geophysical methods can be used to develop a geological profile, to trace contaminant plumes back to their DNAPL sources, and to obtain direct or indirect evidence of DNAPL. Geophysical methods are generally used to better understand the lithology and stratigraphy of a site and map preferential pathways. In rare cases they may be able to detect changes in the physical properties of the soil matrix caused by a DNAPL and steer an intrusive investigation to the area for further investigation. Table 4-1 provides a useful summary of the capabilities of both geophysical and non-geophysical tools.
Non-Geophysical Techniques for DNAPL Characterization
A number of non-geophysical tools and approaches have had some success in characterizing DNAPL sources and gaining access to subsurface strata where DNAPLs may be found. Non-geophysical methods presented in this document are classified in seven categories: diffusion sampling, direct push technology,
xiv
in-situ groundwater sampling, hydrophobic dyes, DNAPL partitioning tests, optical televiewer, and soil gas profiling. Each method has demonstrated success or potential use in DNAPL applications.
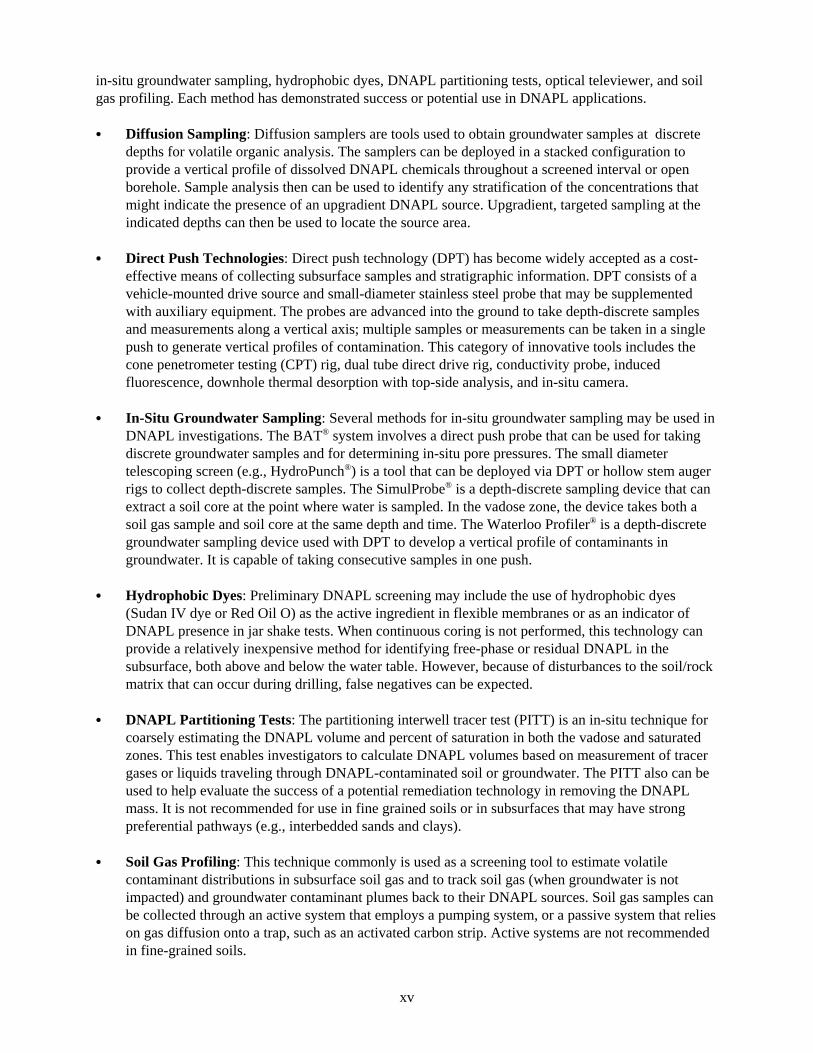
C Diffusion Sampling: Diffusion samplers are tools used to obtain groundwater samples at discrete depths for volatile organic analysis. The samplers can be deployed in a stacked configuration to provide a vertical profile of dissolved DNAPL chemicals throughout a screened interval or open borehole. Sample analysis then can be used to identify any stratification of the concentrations that might indicate the presence of an upgradient DNAPL source. Upgradient, targeted sampling at the indicated depths can then be used to locate the source area.
C Direct Push Technologies: Direct push technology (DPT) has become widely accepted as a cost-effective means of collecting subsurface samples and stratigraphic information. DPT consists of a vehicle-mounted drive source and small-diameter stainless steel probe that may be supplemented with auxiliary equipment. The probes are advanced into the ground to take depth-discrete samples and measurements along a vertical axis; multiple samples or measurements can be taken in a single push to generate vertical profiles of contamination. This category of innovative tools includes the cone penetrometer testing (CPT) rig, dual tube direct drive rig, conductivity probe, induced fluorescence, downhole thermal desorption with top-side analysis, and in-situ camera.
C In-Situ Groundwater Sampling: Several methods for in-situ groundwater sampling may be used in DNAPL investigations. The BAT® system involves a direct push probe that can be used for taking discrete groundwater samples and for determining in-situ pore pressures. The small diameter telescoping screen (e.g., HydroPunch®) is a tool that can be deployed via DPT or hollow stem auger rigs to collect depth-discrete samples. The SimulProbe® is a depth-discrete sampling device that can extract a soil core at the point where water is sampled. In the vadose zone, the device takes both a soil gas sample and soil core at the same depth and time. The Waterloo Profiler® is a depth-discrete groundwater sampling device used with DPT to develop a vertical profile of contaminants in groundwater. It is capable of taking consecutive samples in one push.
C Hydrophobic Dyes: Preliminary DNAPL screening may include the use of hydrophobic dyes (Sudan IV dye or Red Oil O) as the active ingredient in flexible membranes or as an indicator of DNAPL presence in jar shake tests. When continuous coring is not performed, this technology can provide a relatively inexpensive method for identifying free-phase or residual DNAPL in the subsurface, both above and below the water table. However, because of disturbances to the soil/rock matrix that can occur during drilling, false negatives can be expected.
C DNAPL Partitioning Tests: The partitioning interwell tracer test (PITT) is an in-situ technique for coarsely estimating the DNAPL volume and percent of saturation in both the vadose and saturated zones. This test enables investigators to calculate DNAPL volumes based on measurement of tracer gases or liquids traveling through DNAPL-contaminated soil or groundwater. The PITT also can be used to help evaluate the success of a potential remediation technology in removing the DNAPL mass. It is not recommended for use in fine grained soils or in subsurfaces that may have strong preferential pathways (e.g., interbedded sands and clays).
C Soil Gas Profiling: This technique commonly is used as a screening tool to estimate volatile contaminant distributions in subsurface soil gas and to track soil gas (when groundwater is not impacted) and groundwater contaminant plumes back to their DNAPL sources. Soil gas samples can be collected through an active system that employs a pumping system, or a passive system that relies on gas diffusion onto a trap, such as an activated carbon strip. Active systems are not recommended in fine-grained soils.
xv

Geophysical Techniques for DNAPL Characterization
Geophysical methods can be used to survey large areas or to describe small-scale conditions such as those in and around borehole walls. On either scale, these methods measure the physical properties of subsurface materials. Any changes in measurements are interpreted to indicate changes in the subsurface matrix (solids and/or fluids). For purposes of this report, geophysical methods have been classified into six general categories: commonly used single borehole methods, electrical methods, electromagnetic methods, ground penetrating radar, magnetics, and seismic methods.
• Borehole Methods: Commonly used borehole methods encompass a wide variety of geophysical tools to provide a profile of changes in specific properties of the soil/rock matrix and fluid chemistry surrounding a borehole. Typically, the tools used are meant to provide measurements close to the borehole and rarely exceed several feet. The methods include acoustic televiewer, electromagnetic induction, gamma-gamma, natural gamma, neutron, resistivity, and spontaneous potential.
• Electrical Methods: Surface electrical methods (including surface to borehole and borehole to borehole) measure the electrical resistance or conductance of the subsurface by transmitting a current between electrodes placed at, or into, the ground surface. The apparent resistivity or conductivity of the subsurface is the bulk average resistivity or conductivity of all soils, rock, and fluids (including potential DNAPL) influencing the flow of current. Complex resistivity, although still in the developmental stage, is of special interest in DNAPL investigations. It measures standard resistivity as well as the electrochemical response of subsurface materials to an applied current. Chargeability of the current can be used to differentiate soil/rock matrices and their content. In particular, this capability can help to distinguish soil with appropriate clays that contain organic chemicals from non-contaminated soil.
• Electromagnetic Methods: Electromagnetic (EM) methods measure changes in the bulk subsurface electrical conductivity due to changes in subsurface conductive features. EM systems have a transmitter coil that generates a primary EM field in the subsurface. This field interacts with subsurface materials to form secondary EM fields. The secondary fields induce a voltage in the subsurface materials that causes a current to flow that in turn produces a secondary magnetic field. The decay of the secondary magnetic field is measured by a surface receiver. Variations in measured currents of these fields can be interpreted as stratigraphic changes, the presence of conductive bodies, or buried wastes. Many of these methods have potential use in DNAPL characterizations because they can provide information on subsurface features. They have not found much use in looking for DNAPL directly. Different deployment techniques for EM include terrain conductivity, horizontal loops, fixed source frequency domain, fixed source time domain, very low frequency, and offset logging. EM offset logging is of particular interest to DNAPL detection due to its ability to produce a 3-D image of subsurface anomalies. This technology has had limited success in identifying common DNAPL components such as creosotes and (trichloroethene) solvents, but is still considered in the experimental stage of development.
• Ground Penetrating Radar: Ground penetrating radar instruments use electromagnetic wave pulses to measure changes in the subsurface due to changes in electromagnetic wave impedances. In operation, a transmitting antenna radiates short pulses of high-frequency electromagnetic waves into the subsurface while a receiving antenna records variations in the reflected return signal. Layers and objects with sharply contrasting electrical impedances (reflectors) can be identified and assigned a depth generally of less than 25 m (82 ft) (depending on the subsurface stratigraphy) by measuring the amplitudes of the successive reflected waves and their arrival times. Conductive soil such as high cation exchange capacity clays, have high attenuation rates that limit the depth of penetration the
xvi

signals can obtain (often less than 1 meter if at all), and resistive soil, such as sand, has the least attenuation affect. The data are generally displayed in a 2-D cross section. Depending upon site conditions and the DNAPL size and chemistry, GPR has had mixed success in locating them.
• Magnetics: Magnetometers measure anomalies in the earth’s magnetic field caused by different properties of, and responses to, the magnetic field of native soils and rock or anthropogenic materials. In a magnetometer survey, the interaction of the earth’s field with the target materials (buried drums or other subsurface features possessing magnetic properties) changes this general flux. The output is presented in an in-plan contour map or a 3-D map of highs and lows. The method is not used to look for DNAPLs directly.
• Seismic Methods: Seismic methods use an artificial acoustical source to create an energy wave that is directed into the ground. Source measurements of the wave reflection or refraction allow for the construction of cross sections of major stratigraphic units. Enhanced vertical resolution of seismic images may be possible through the use of cross-hole deployment techniques. Seismic applications can provide high resolution imagery of a large area with potential DNAPL. Recent use of seismic reflection with amplitude versus offset (AVO), which is a method widely used in the petroleum exploration industry, has shown a capability to distinguish changes in stratigraphy from changes in fluid density (i.e., water versus DNAPL). The application of seismic reflection with AVO to environmental problems involving DNAPLs is in the demonstration phase.
Conclusions
A growing range of screening and analytical tools can be used successfully to locate and characterize DNAPLs in a wide variety of—but not all—settings. In many cases, DNAPLs can be found by using the correct mix of tools for site-specific conditions. While locating and remediating DNAPL in bedrock poses the greatest challenge due to the high cost of direct sampling and the risk of creating unwanted preferential pathways, a systematic planning approach that considers a variety of complementary tools raises the probability of success. Real-time data collection and interpretation, and in-field refinement of the conceptual site model through a dynamic work planning strategy, can lower project costs and time frames significantly while increasing the effectiveness of follow-on remedial designs.
The past ten years have seen a marked improvement in the capability of non-geophysical technologies to collect and analyze soil and water samples in the field. Dual-tube DP equipment currently provides an inexpensive means of obtaining continuous cores for examination of preferential pathways and qualitative or quantitative onsite chemical analysis. In some settings, application of this method has expanded to include groundwater sampling. Advances also have been made in CPT rigs, which may be equipped with a variety of innovative probes in addition to their traditional soil testing cones and sleeves. The advantage of these probes lies in their speed of advance and their sensitivity to the type of soil matrix in which the conductivity probe, membrane interface probe, induced fluorescence tools, or camera is placed. While downhole samplers such as the BAT® and HydroPunch® require prior knowledge of a site’s stratigraphy to target specific flowpath regimes, they are useful in refining the conceptual site model. Other techniques, such as enhanced soil gas profiling, provide valuable screening tools for estimating contaminant distributions and locating DNAPL sources.
Geophysical techniques historically have been used for subsurface stratigraphic mapping that provides a geologic construct in which to place intrusive characterization technologies, rather than to locate DNAPLs directly. The resolution level of these methods is sufficient to locate thin preferential pathways or small pockets of residual DNAPL. Most surface techniques also encounter problems when interpreting heterogenous interbedded and discontinuous stratigraphies where DNAPLs are particularly difficult to
xvii

locate. In all geophysical applications, the residual mass must be large enough for the technique to generate imagery of adequate resolution, and it must present a sufficient geophysical contrast to the surrounding soil/rock matrix to appear as an anomaly. The anomaly produced by a DNAPL is not unique; other subsurface structures may produce similar anomalies. Since these methods measure changes in matrix properties rather than chemical makeup, confirmation data obtained through intrusive methods is required.
Geophysical technologies may be deployed most economically to define the areal extent of a known DNAPL located by other means. Several techniques, however, can provide a direct indication of the presence of a DNAPL mass. Where clays are involved, complex resistivity may locate anomalies caused by the interaction of soil with organic chemicals. In addition, EM offset logging technology and seismic reflection amplitude versus offset technology show promise in detecting anomalies caused by residual DNAPL masses.
xviii

SECTION 1INTRODUCTION
Introduction
Why Is DNAPL Characterization a Problem?
This report provides an overview of tools and approaches for locating and characterizing DNAPL contamination in subsurface environments. DNAPL contaminant releases commonly are associated with industrial operations using chlorinated solvents or industry-specific materials, such as wood preservatives or coal tar. DNAPL releases also are associated frequently with industrial processes involving metal cleaning/machining, paint removal, or underground storage of solvents, and, in the past, with industrial practices involving mixed chemical waste disposal in landfills or ponds.
DNAPL exists within the subsurface in either a free-phase form that moves downward through the soil along a path of least resistance until some geological impediment causes it to stop and pool, or in a residual form whereby it becomes trapped in soil pores or rock fractures. Relatively small quantities of DNAPLs that accumulate below the water table constitute a long-term source of groundwater contamination. Due to the complex nature of DNAPL fate and transport, characterization and remediation of DNAPL-contaminated sites pose significant challenges to site managers. Numerous site-specific investigations and remedial efforts have shown recently that DNAPL trapped in fractured bedrock is particularly difficult to identify and remove.
sites on the National Priorities List address suspected or
Approximately 22 percent of the Records of Decision for
actual DNAPL contamination.
Who Needs to Know About DNAPL Site Characterization Technologies?
This report may be used by remediation site managers to help screen characterization options at sites where DNAPL contamination is suspected. The report is not intended for remediation decision-making purposes, or as a “how to” manual, but rather to help:
C Identify DNAPL site characterization technologies; C Screen potential technologies based on performance, characterization goals, application-specific
characteristics, and cost; C Apply experience via presentation of case studies from sites with similar characterization challenges;
and C Find more detailed information on DNAPL characterization and geophysical aspects of technologies.
What Information Is Needed to Investigate Suspected DNAPL Sites?
Data on Existing Conditions
An understanding of the geochemical and geophysical behavior of DNAPLs in the subsurface is a key element of site investigations. Difficulties in identifying DNAPL increase with the depth and lateral distance of DNAPL from a release area, as well as the complexity of the groundwater system. DNAPLs are dense immiscible (hydrophobic) fluids whose migration patterns are determined primarily by subsurface characteristics, such as:
C Interfacial tension;
1

C Dynamic viscosity; C Specific gravity; and C Soil nature, particularly pore size and distribution, initial moisture content, relative permeability, and
capillary force.
These factors collectively account for dynamic geological conditions at a DNAPL-contaminated site, while groundwater flow plays only a minor role in the migration of heavy DNAPLs (e.g., chlorinated solvents) it can have a significant affect on those with specific gravities close to one. DNAPLs generally are more mobile in substrates containing large pores (high effective porosity) than in fine grained material such as silts and clays. The dense DNAPLs can commonly reach depths of 100 m (300 ft) below ground surface.
Investigations at sites with suspected DNAPL also rely upon a clear understanding of the site’s geology and stratigraphy. Geophysical methods often provide a cost-effective means for supplementing traditional information sources such as borehole data. Commonly used geophysical technologies include:
C Electromagnetic methods using changes in the bulk electrical conductivity of soil to identify
The presence of DNAPL
always visually apparent. in a soil sample is not
stratigraphic layers; C Electrical resistivity techniques that distinguish soil layers by their relative resistance to the passage
of an induced electrical current; • Magnetometry that uses the earth’s magnetic field to detect changes in the magnetic properties of the
subsurface caused by such things as buried drums and tanks; and C Seismic measurements of the time required for an acoustical signal to travel through subsurface
materials, which identifies changes in lithology.
Historical and Modeling Information
Formulating a preliminary conceptual site model (CSM) of the contaminant source areas is an important element of a DNAPL investigation. Typically, a conceptual model combines knowledge of the DNAPL geochemical behavior and site geology with information on the site’s historical operations. The model identifies additional data that must be collected and incorporated into the overall project decision-making process, including the design of dynamic sampling plans and selection of sampling technologies. The complexity of a DNAPL conceptual model is illustrated in Figure 1-1, which provides a preliminary conceptual model of potential DNAPL accumulation zones in a hypothetical karst setting.
Without direct detection of a free-phase contaminant mass, site investigators often must rely on indirect evidence and “rules of thumb” to determine whether DNAPLs may exist at a site. In Estimating Potential for Occurrence of DNAPL at Superfund Sites (Newell 1991), EPA provides a method for determining the likelihood of DNAPL presence and for developing appropriate sampling plans, if needed. DNAPL Site Evaluation (Cohen and Mercer 1993) also is a useful reference for developing sampling plans, but both documents are dated from the point of view of not discussing tools that are currently available to the investigator. EPA has determined that a high probability for past DNAPL releases exists at sites historically associated with specific types of industries, industrial processes, and chemicals.
To determine the likelihood of DNAPL based on site characterization data, the method recommends comparison of a chemical’s pure-phase solubility to its concentration in groundwater and soil.
2

When DNAPL consists of more than one chemical, the method recommends calculation of effective solubility (solubility of the mixture as a whole), which accounts for the proportion of chemicals in the mixture and their pure-phase solubilities. Comparison of the effective solubility against groundwater or soil concentrations then may be made.
A strong likelihood for DNAPL contamination is indicated if:
(1) Groundwater concentrations exceed one percent of the pure-phase or effective solubility,
(2) Soil concentrations of DNAPL-related compounds exceed 10,000 mg/kg (one percent of soil mass), or
(3) Soil gas concentrations of volatile DNAPLs exceed 100 to 1,000 ppm.
The absence of these conditions, however, does not necessarily indicate that DNAPL is not present. Other tools for determining the likelihood of DNAPL presence include hydrophobic dye jar shake tests, and headspace analysis using a generic detector, such as an organic vapor analyzer. For unconsolidated soils, direct push (DP) technologies with onsite analysis can create a sample data density that lowers the risk of missing DNAPL hotspots.
Which Planning Approach and Tools Are Best for Characterization of Sites with Suspected NAPL Contamination?
The Triad Approach
Increased efforts have been made by regulatory agencies and private industry to streamline the site characterization process in a consistent manner. The Triad approach uses systematic planning, dynamic work plans, and quick turnaround analytical results and data assessments for onsite decision making to meet project and program goals in less time and often lower cost. Systematic planning of a conceptual site model enables site investigators to evaluate:
C Available information on the chemical properties of the DNAPLs,
C DNAPL quantities and release patterns, and
Figure 1-1. Distribution of Potential DNAPL Accumulation in a Hypothetical Karst Setting.
Source: Wolfe et al. 1997
3

C Soil and groundwater characteristics of the site, using EPA data quality objectives.
When developing a work plan for DNAPL characterization, the integration of field tools and techniques that generate near-real time data is recommended. The dynamic work plan provides an initial sampling design that can be adapted or expanded as field data are collected and interpreted to refine the conceptual side model in real time, thereby allowing for onsite decision making. (Detailed information on the Triad approach is available on-line at http://www.triadcentral.org/, http://www.cluin.org/triad/ and http://www.epa.gov/superfund/programs/dfa.
The Technology Toolbox
The task of locating a DNAPL source commonly involves more than one tool, which may be selected from a variety of non-geophysical and geophysical choices. No single approach exists for DNAPL characterization—the “technology toolbox” differs among sites depending upon site conditions, the availability of existing data, project goals, and (most critically) the DNAPL migration path.
Non-geophysical methods for DNAPL characterization vary widely in their method of deployment, use, and end-product. Some, such as the CPT rig, can provide information on a geological profile but not the wide survey data gained through surface geophysical techniques. Others, such as the Waterloo Profiler®, can provide a profile of groundwater contamination with increasing depth, and can be used to trace plumes to their sources in unconsolidated matrices. Lastly, intrusive methods can identify DNAPLs through indirect evidence (such as induced fluorescence) or direct evidence (such as open borehole sample liners, the membrane interface probe, or core samples for onsite analysis).
Geophysical methods for DNAPL characterization provide qualitative and quantitative information on subsurface conditions that are often represented in a multidimensional image. These survey methods directly or indirectly measure the subsurface materials’ physical properties, such as conductivity, resistivity, and density. Measurement changes are interpreted to indicate changes in the physical and chemical properties of the subsurface.
Geophysical surveys may be used for characterization of site geology, the aquifer, contaminant plume distribution, and in some cases DNAPL mass location.
What Technologies Are Addressed in the Report?
This report focuses on technologies that have been successfully applied or identified as potentially effective in DNAPL environments. It describes technologies readily known in DNAPL site characterization applications, but may not include all emerging technologies or those involving unique applications.
During the 1980s, DNAPL characterization was attempted through geophysical surveys that were followed by conventional drilling methods. Discrete chemical samples commonly were collected using hollow stem augers, and analyzed by offsite laboratories. The high cost and marginal effectiveness of this approach led to increased efforts during the 1990s to develop characterization methods employing improved sampling and analytical techniques and enhanced computer support.
Geophysical methods still are used for defining stratigraphic units and locating water-bearing bedrock fractures. The use of new cross-borehole techniques using 2- and 3-D imaging, however, generates improved resolution in subsurface imagery. Similarly, DP and CPT rigs are more often used now for
4

sample collection, and can be equipped with auxiliary tools capable of locating residual DNAPL at depths reaching 30 m (100 ft). Continuous core sampling produced by this type of technology results in near-real time frame chemical analysis at a more reasonable cost.
Non-Geophysical Techniques
A number of recently developed non-geophysical tools have demonstrated success in characterizing DNAPL sites and sources and gaining access to subsurface strata where DNAPLs may be found. Table 1-1 lists general categories and specific sampling and analytical technologies that have been used to successfully aid in characterizing DNAPL sites.
Table 1-1. Non-Geophysical Tools for DNAPL Characterization
Diffusion Sampler Diffusion Sampler
Direct Push Technology Cone Penetrometer Testing Rig
Conductivity Probe
Induced Fluorescence
In-Situ Camera
Dual Tube Continuous Coring
In Situ Groundwater Sampling BAT®
Small Diameter Telescoping Screen (HydroPunch®)
SimulProbe®
Waterloo Profiler®
Membrane Interface Probe™
Hydrophobic Dye Testing Dye Shake Test
Hydrophobic Flexible Membranes
Tracer Testing Soil Gas Profiling Partitioning Interwell Tracer Test Active Sampling
Passive Sampling
Geophysical Techniques Geophysical techniques can be used to refine the lithological understanding on a small scale (as in downhole techniques for a single borehole) or stratigraphic information covering wide areas (which would be prohibitively expensive using intrusive methods). Table 1-2 lists geophysical surface and borehole methods that are discussed in this report.
Technologies Under Evaluation
These technologies, which include both non-geophysical and geophysical techniques, are either under development, have seen limited demonstration but no wide scale application, or in the case of one of the geophysical techniques has been proven in other applications but has not seen significant application in DNAPL site characterization work. Table 1-3 lists the technologies discussed in this report.
5

Table 1-2. Geophysical Surface and Borehole Survey Tools for DNAPL Characterization
Electrical Methods Electrical Resistivity
Electrical Resistivity Tomography
Electromagnetic Methods Terrain Conductivity (Frequency Domain)
Horizontal Loop Electromagnetics (Frequency
Domain)
Fixed Source Frequency Domain
Electromagnetics
Very Low Frequency Electromagnetic
Very Low Frequency Resistivity
Fixed Source Time Domain Electromagnetics
Radar Seismic Methods Ground Penetrating Radar Seismic Reflection
Magnetic Magnetometers
Seismic Reflection with Amplitude Versus Offset
Seismic Refraction
Cross Borehole Seismics
Table 1-3. Technologies Under Evaluation
Geophysical Methods Non-Geophysical Methods
Complex Resistivity Downhole Thermal Desorption with Top Side Analysis
Electromagnetic Offset Logging Mass Flux
Proton Magnetic Resonance Halogen Specific Downhole Detector
Hydrosparge VOC Sampler
Sonic CPT Probing
What Are the Structure and Contents of This Report?
This report describes 45 technologies that may be employed to aid in the characterization of DNAPL sources at hazardous waste sites. Following this introduction, Section 2 further discusses the unique problems posed by DNAPL contamination in soil and groundwater. Section 3 provides an overview of the Triad approach to planning site characterization, while Section 4 describes a toolbox approach for DNAPL site characterization.
Sections 5 and 6 describe non-geophysical and geophysical methods, respectively, that have been used in DNAPL site characterization. For each technology, these sections summarize:
How the technology works,
studies are provided in this report for technologies that have been used in DNAPL site characterization.
When available, brief case
6
C

C Effective uses of the technology, and C Drawbacks or limitations of the technology.
Section 7 presents non-geophysical and geophysical techniques that are experimental. Most of these technologies have been field demonstrated but have not found widespread use in DNAPL site characterizations either because of expense or newness.
Report conclusions are summarized in Chapter 8. Appendix A provides a bibliography of recent literature on the use and performance of non-geophysical and geophysical technologies for site characterization. In Appendix B, a discussion of the chemical/physical factors influencing DNAPL flow in the subsurface is provided along with a summary of the current understanding of DNAPL migration in different matrices. Appendices C and D contain listings of related Internet-based resources and equipment vendors, respectively.
What Are the Sources of Information for This Report?
This report is based on an electronic literature search and information gathered from readily-availabledata sources, including:
C Documents and databases prepared by EPA,C Technical literature,C Information supplied by technology vendors,C Internet sites, C Conferences/proceedings or workshops, andC Information from technology experts.
The authors and reviewers of this report identified information sources based on their experience withDNAPL site characterization.
What Other Types of Literature Were Searched and Referenced for This Report?
A Dialog® search for DNAPL characterization methods was run to supplement the above information.
7

This Page Left Intentionally Blank.

SECTION 2THE DNAPL PROBLEM
The cumulative experience with groundwater remediation that began in the Superfund program during the last decade demonstrated that remediating certain types of contaminants was more difficult than design engineers had anticipated. Many of the contaminants that were difficult to characterize and remediate could be assigned to one of four groups based largely on their manufacturing origins or end use:
• Chlorinated solvents used in metal finishing, semiconductor manufacturing, dry cleaning, chemical manufacturing, and equipment maintenance;
• Creosote mixtures used in treating wood products; • Polychlorinated biphenyls (PCBs) used primarily in electrical transformers and condensers; and • Byproducts (e.g., coal tars and oils) from manufactured gas plants (MGP).
Most of the contaminants in these four groups are relatively immiscible in water and have a specific gravity greater than one (MGP oils being an exception). Their immiscibility allows them to preferentially remain in a separate non-aqueous phase, dissolving slowly over time. Since their specific gravity is greater than one, these contaminants tend to migrate downward in groundwater under the influence of gravity and stratigraphy rather than through groundwater flow dynamics. The exception to this rule are DNAPLs with a specific gravity close to 1. For these groundwater flow direction may play some role. Movement of these chemicals can be affected by vertical groundwater gradients. Because of these characteristics, as a class these substances are referred to as DNAPLs. Appendix B contains a discussion of the specific physical/chemical properties that govern the flow of DNAPLs in the subsurface.
under the influence of gravity
through groundwater flow
DNAPLs generally migrate
and stratigraphy rather than
The ability of many DNAPLs to move as a mass virtually independent of groundwater flow often makes them difficult to locate and, depending upon the stratigraphy, difficult to remediate. Their ability to diffuse into finer grained materials limits the effectiveness of pump-and-treat systems since the mechanism to recover them in these situations is diffusion driven. Also, at the point where the pressure head becomes insufficient to drive the liquid farther into the soil matrix or a competent rock, the residual mass becomes a constant source of groundwater contamination as it slowly dissolves. Hence, if the objective of a response action is to treat or remove the contaminant source, these sources need to be located.
The following DNAPL properties should be kept in mind for site characterization purposes:
• As a chemical class, DNAPLs are electrically resistive (non-conductive). • Chlorinated solvents are generally volatile and may be found in soil gas plumes. • The dissolved phase of chlorinated solvents is relatively mobile and sufficiently soluble to be readily
detectable. • Most PCBs are not volatile and are not sufficiently soluble to be readily detectable in groundwater.
The lighter end PCBs do have some solubility (3 mg/l range) and will volatilize to some extent. • Coal tar byproducts are a mixture of phenols and cresols; benzene, toluene, ethylbenzene, and
xylenes (BTEX); naphthalenes and light oils; and tars and heavy oils (PAH rich). The aromatics and smaller polynuclear aromatics are volatile and sufficiently soluble to be detected as a groundwater plume. The tars and heavy oils weakly fluoresce.
• Coal tar creosote mixtures are very diverse and may or may not be associated with groundwater plumes. They may contain several chemicals that fluoresce.
9

This Page Left Intentionally Blank

SECTION 3USING THE TRIAD APPROACH TO PLANNING THE INVESTIGATION
The Triad approach takes advantage of systematic project planning, a dynamic work planning strategy for data collection and assessment and subsequent onsite decision making, using real-time measurements (usually provided by onsite analytical tools and micro-level geophysical surveys and measurements). A key theme for the Triad is tapping new science and technology tools to identify and manage information gaps (i.e., uncertainties) that could lead to unacceptable decision errors. Much of the uncertainty in environmental decision making stems directly from the heterogeneity of environmental systems. Marked heterogeneity is the hallmark of DNAPL contamination and the subsurface soil, bedrock, and aquifer systems in which it occurs. Although difficult technical issues are still the subject of intensive research, the Triad approach provides a framework for understanding as accurately and inexpensively as possible site-specific DNAPL release, past and future fate and transport, and effective options for risk reduction.
work plans and quick turnaround
detect DNAPLs.
The Triad approach combines systematic planning with dynamic
analytical techniques to improve the ability of the site characterization to
Systematic planning includes the task of developing a CSM. CSM is a general term that refers to a variety of tools that organize the information already known about the site, and then aid a project team to understand what more needs to be known (often by collecting additional data) in order to bring the project to a successful conclusion. To develop the CSM, the project team evaluates the available information on the chemical properties of the suspected DNAPLs, their quantities and release patterns (time and location), and the
soil and groundwater characteristics of the site. The CSM often takes the form of maps, graphics, or written descriptions that depict what the project planners believe has been (and will be) the fate and transport of the chemicals of concern. It also identifies potential exposure routes. For example, if there is reliable information that 1,000 gallons of a DNAPL have been released into a thick homogenous sand unit, the team will be able to predict with minimal uncertainty where the material will be and can plan the investigation around this knowledge. If, on the other hand, the release volume is unknown and the stratigraphy underlying the site is not well characterized, the team will know to address these data gaps during the investigation.
the uncertainties contained in
designs and allows the investigation to be structured to
Systematic planning identifies
the available analytical techniques and sampling
minimize them.
Systematic project planning involves planning for data collection, but it also includes planning for project work flow, health and safety concerns, procurement of various services, stakeholder or community involvement, and other tasks vital to project success. For data collection, EPA recommends the data quality objectives process to structure expectations for the type and rigor of data that will be required to support various project decisions (Guidance for the Data Quality Objectives Process, QA/G-4, USEPA 2000a). Dynamic work plans have been demonstrated to be the most cost-effective strategy for organizing work flow to investigate DNAPL sites. Dynamic work plans are designed to be flexible so that activities in the field (such as the placement of sampling points and choosing which samples are analyzed by which measurement technologies) can be readily adapted in response to actual field conditions as they are discovered (such as the presence or absence of contamination at a particular location). Because data gaps are identified and addressed in real-time, a dynamic work plan strategy requires fewer remobilizations to the field, saving time and money while increasing decision confidence by decreasing uncertainties. The key features of dynamic work plans include the following:
11

• Flexible sampling and analytical plans; • Reliance on quick turnaround analytical methods that are generally field based; • Iterative sampling to constantly refine the CSM; • Emphasis on accessing experienced technical staff to make decisions in the field; • Onsite decision making to reach project goals with a minimal number of mobilizations; and • Inclusion of stakeholders throughout the planning and implementation process.
to investigations to ensure the best tool is used as
data.
Dynamic work plans often employ a toolbox approach
indicated by the most recent
During systematic project planning, the project team uses prior experience with similar sites (both their own experience and that gleaned from other sources) to anticipate the appropriate combination of tools that can obtain the data necessary to answer questions raised by the CSM. A variety of tools that make dynamic refinement of the CSM feasible have become more widely available in recent years. These include innovative sampling technologies (e.g., direct push and in situ groundwater sampling), innovative analytical techniques (e.g., field gas chromatography, induced fluorescence, immunoassay, field
x-ray fluorescence), and more advanced geophysical software. Selecting particular tools for an investigation is very site-specific. It depends on the interactions among 1) the information needed to support decision making; 2) the characteristics of the environmental system being investigated, and 3) the capabilities of the tool itself. For example, if a DNAPL release is suspected at a site that has shallow groundwater, it may be appropriate to use direct push technologies combined with onsite analytical capabilities to perform iterative sampling of the shallow groundwater (if the shallow subsurface does not pose unacceptable obstacles to the direct push tool). The results should identify the initial source areas. Following this step, geophysical techniques could be used to identify deeper potential preferential subsurface pathways. These techniques also may involve more expensive and deeper intrusive sampling technologies. The dynamic work plan should lay out these steps and anticipate getting data in near real time to move the investigation forward.
DNAPL investigations will typically require a toolbox approach involving several onsite analytical tools. There are a large number of analytical methods and equipment that investigators can potentially apply at the sample site. They may include hand-held, portable equipment and more rigorous methods that require the controlled environments of a mobile laboratory. The full range of analytical and evaluation technologies should be considered to optimize the sampling and analysis design of a DNAPL investigation. The project team should keep in mind that no matter what analytical tools are used, data should be of known quality commensurate with data use. Demonstrating “known quality” means different things for different technologies, but in general, this means that the actual analytical performance should be shown to be consistent with expected performance. Enough quality control mechanisms should be in place to detect deviations from expected performance (should they occur), and to allow estimation of sampling and analytical uncertainties and their impact on decision making (Crumbling et al., 2001).
12

SECTION 4USING A TECHNOLOGY TOOLBOX FOR BETTER SITE DNAPL
CHARACTERIZATION
Because no tool or method is right for all situations, the best approach in many cases is to take advantage of the strengths of the available techniques. This section presents a summary table of techniques and uses (Table 4-1) along with investigation approaches to characterizing four general hydrogeologic settings. The approaches exemplify potential tool combinations that could be used to investigate a DNAPL release in each setting. The discussion also identifies tools that are not likely to be effective in certain situations.
The non-geophysical methods/techniques considered in this section and this document have been used for direct detection of DNAPLs as well as looking at surrogate values (e.g., dissolved phase and soil gas concentrations). Some, like CPT rigs, provide information on the geological profile but without the wide survey ability of the surface geophysical techniques. Other methods that provide a profile of groundwater contamination with depth can be used to trace dissolved plumes back to their sources in unconsolidated matrices. Finally, there are those that are also intrusive and either provide semi-quantitative evidence of DNAPLs, such as laser-induced fluorescence (LIFs) do, or direct evidence as do open borehole liners, membrane interface probe (MIP), or core samples for onsite analysis. The emphasis of the approaches is on using methods that in combination can provide onsite sampling and analysis results as quickly and cheaply as possible. As with any intrusive investigation, care should be exercised that fine-grained units are not breached without taking appropriate actions to prevent cross contamination.
All of the geophysical techniques applied to specific DNAPLs are indirect (detect changes in the physical properties of subsurface materials that may be caused by DNAPL presence but not the DNAPLs themselves) and can be devoted to refining the lithological understanding about a single borehole (as in downhole techniques) or to providing stratigraphic contact information over wide areas that would be prohibitively expensive using intrusive methods. However, some geophysical technologies are capable of providing more “direct” evidence of the presence of a DNAPL mass than those measuring properties like changes in subsurface conductivity. These technologies include:
• The neutron probe, which is sensitive to chlorine (chlorinated solvents) or any compound with a high hydrogen content;
• Seismic reflection with amplitude versus offset (AVO), which measures density differences potentially caused by DNAPL in a soil matrix; and
• Complex resistivity, which detects differences in chargeability mainly due to the chemical and physical makeup of the soil matrix. Organic chemicals in a soil matrix containing certain clays exhibit different chargeability values than the same matrix with water or air.
Both seismic reflection with AVO and complex resistivity have proven track records in other applications, but their use in DNAPL investigations is relatively new and still experimental.
By carefully considering existing data, and using the Triad process, a CSM can be constructed that helps the investigator choose the tools that will maximize the investigation design effectiveness while minimizing the cost. As with all investigations, data collection activities should be commensurate with the level of cleanup that is planned. For example, if source removal followed by monitored natural attenuation is the cleanup strategy then considerable effort to locate all the sources should be made. On the other hand, a cleanup strategy that envisions a pump-and-treat containment system with no source removal may require considerably less effort.
13

Combining Techniques for Maximum Effectiveness
Because of the way DNAPLs move through the subsurface, different hydrogeologic settings can present very different characterization challenges. It is therefore very important that the hydrogeologic framework of a site be well-characterized. The types of settings discussed below were developed to depict the variety of hydrogeologic conditions in which DNAPL characterizations take place and the tools that may be used to undertake them. These settings are meant as generalized examples. The hydrogeology at many sites may differ significantly from these examples. The discussion assumes that the initial release area is not known. When initial release areas are known, a much more focused investigation can be planned.
Simple Hydrogeology
A simple hydrogeologic setting might consist of a single, shallow, unconfined aquifer underlain by a single, continuous aquitard. The aquifer matrix consists primarily of sand and coarse materials with some fines. While there can be significant lateral spreading due to subtle changes in the permeability of the sand, there is no major impediment to the downward migration of DNAPLs as they pass through the vadose zone into the aquifer. The homogeneity and effective porosity of the aquifer materials makes DNAPL migration through the capillary fringe subject to hydrogeologic conditions similar to those found deeper in the aquifer. DNAPLs may be found in pools on the aquitard as well as in the aquitard itself (cracks, fractures, diffusion). The amount of DNAPL that may remain bound in the aquifer matrix in the near term depends on the site-specific mix of sands and silts or clays and the viscosity of the DNAPL. The less permeable silts or clays provide a matrix that may impede downward migration. The residual DNAPL that remains bound in the aquifer matrix can be difficult to detect directly. The distribution of a residual DNAPL is likely to be highly variable and depends on the spatial distribution of finer grained aquifer materials (sands as well as clays). Thus, soil samples taken only a few feet from each other can produce remarkably different results. For older releases of DNAPLs, such as chlorinated solvents that occur in coarser grained soil, the residual DNAPL in the vadose zone may be depleted and is no longer detectable, while the DNAPL at the aquitard continues to be a source of groundwater contamination (Cohen and Mercer 1993; Guilbeault 1999). In investigating this type of hydrogeologic setting, care should be taken to ensure that clean shallow water does not lead to an erroneous conclusion that there is no contamination at a deeper horizon.
Approach
Several characterization approaches may be used in this setting depending upon whether the DNAPL vaporizes or has detectable solubilities. Soil gas surveys conducted in sands on a tight grid using portable gas chromatography can be very successful in identifying release areas and tracking a dissolved plume. When the soil gas is taken directly off the vacuum hose, this technique can be done relatively quickly and cheaply. The soil gas technique is not used to directly locate DNAPLs but to identify areas with high probabilities of finding them using other characterization tools.
of the lateral extent of
Soil gas surveys may provide a good estimation
contamination.
In shallow aquifers, direct push rigs that take continuous cores and groundwater samples at multiple discrete depths (e.g., Waterloo Profiler®) can also be used to locate residual DNAPL by tracing the dissolved plume back to its source as well as sampling through the DNAPL mass. The continuous cores provide both good stratigraphic control and the opportunity to analyze any soil sample that looks promising (e.g., samples showing potential preferential pathways or
14

high OVA readings). The multiple depth groundwater samples provide a concentration profile that may indicate where source areas are.
Tools, such as the MIP and LIF, should also be considered to provide a profile of the relative concentration of contamination. Once the initial source area is
The MIP is a good technique for profiling the concentration gradients of volatile organics with depth.
identified, geophysical methods may be used to look for preferential migration pathways along the aquitard. Since there are only two units involved and the resistivity (sand) unit is on top, almost any of the resistive, EM, or seismic techniques in Table 4-1 can be used to map the aquitard topography. The depth of the aquitard however, may limit the use of some of them.
Once the general area of the DNAPL is defined, a technique, such as the partitioning interwell tracer test (PITT), might be used to estimate the volume of DNAPL present. The PITT technique is expensive and should be used with remedial technologies that require more refined volume estimates, such as surfactant flood.
DNAPLs like Aroclors 1254 and 1260 that do not significantly volatilize, have very low solubilities, and relatively high viscosities present a very different challenge. They may be candidates in this geologic setting for geophysical techniques, such as EM offset logging or complex resistivity. Because of their viscosity and adsorption properties, these types of chemicals leave a much more coherent residual in the soil column. While soil gas or dissolved plume tracking techniques are not likely to be of any value for these chemicals, they can be investigated using direct push technologies, such as continuous coring, which usually can provide an affordable tight grid search pattern.
offset logging.
Coherent, competent DNAPL masses are good candidates for complex resistivity or EM
The actual confirmation of the presence of a DNAPL is not as straightforward as it would appear. Depending upon the DNAPL and the soil matrix, the DNAPL may drain from a soil sampler before it
reaches the surface, or it may not be visible in the sample. In
of a DNAPL is not Confirmation of the presence
necessarily straight forward.
addition, downhole analysis by MIP or LIF needs to be correlated with the general range of ppm reading or fluorescence count that constitutes the presence of a DNAPL. Some investigations have used dye jar tests with soil samples to indicate DNAPL presence while others have used head space analysis of soil samples placed in jars (CIBA 1998). EPA has published guidance (Newell and Ross
1992) on determining the presence of DNAPLs at contaminated sites, and Feenstra and Cherry (1991) also provide some guidance on using chemical concentrations in determining the presence of DNAPL.
Multiple Hydrogeologic Units
A more complex hydrogeologic setting might include the presence of one or more aquitards separating multiple aquifers. In this setting, the surficial aquifer may be unconfined or fully or partially confined, while the deeper water-bearing units are fully confined by continuous aquitards. The aquifer materials like those in the simple hydrogeologic setting are mostly sand and coarse materials, grading only to finer materials at the aquitard interface.
15

Approach
If the uppermost unit is unconfined, then the approach laid out for a simple setting would be appropriate here for investigating contamination to the first aquitard. The depth to the first aquitard (too deep or too shallow) could limit the geophysical tools available.
If the first unit is a clay1/, an active soil gas option may not be effective and usually should not be considered. Depending upon the site conditions, a passive soil gas collection system may work. With a clay top layer, the DP dual tube sampling rigs could still be used to trace a dissolved groundwater plume back to the general area of its DNAPL source (see case study 1 page 39). A stratigraphic profile is needed to calibrate any geophysical technique that may be chosen. The dual
The dual tube DP is a good vehicle for this type of setting as it is less likely to cause cross contamination of the units.
tube is good for this type of exploration as it is less likely to be a vehicle for cross contamination of the units. If the DP investigation shows groundwater contamination, the second clay unit should be profiled to estimate its topography and identify any potential preferential flow pathways. As with the simple case, concentration profiling of the groundwater with depth in the second aquifer unit should be performed to determine if a DNAPL source has penetrated the first aquitard.
If the first unit is a clay, GPR and other EM
effective in profiling lower units.
methods will not be
For a thick clay where substantial volatile organic contamination is expected in the clay matrix, a DP rig employing a MIP device might provide more cost-effective profiling than a continuously coring DP although the latter would still be useful for obtaining stratigraphic information and soil samples for ex-situ analysis.
The electrically conductive clay layer generally eliminates GPR and may limit other EM methods from consideration for delineating the lower units. Seismic refraction is also problematic since the sand unit transmits sound slower than the clay, and refraction generally is not used to resolve more than three layers. Seismic reflection, time domain electromagnetics, or resistivity should be considered for the investigation. Research has shown that both seismic reflection with amplitude versus offset (AVO) and complex resistivity have a chance of locating the physical changes caused by the DNAPL mass on the second aquitard if the mass is sufficiently large. However, both of these methods are relatively expensive and in environmental uses have generally been limited to estimating volumes after the DNAPL has been found by other methods. The complex resistivity also may be able to locate anomalies caused by DNAPLs in the upper clay.
able to locate DNAPLs in the upper clay.
Complex resistivity may be
Before choosing any geophysical method, consideration should be given to the thickness of the units to be mapped and to the method’s potential resolution of that thickness at the expected depth. Also, if a geophysical method is considered for detecting DNAPL, it might be best to try to locate the DNAPL first with an intrusive method and then use the geophysical method to estimate the residual mass areal
1/ When referring to clay affecting the performance of geophysical methods, the term “clay” should be taken to mean clay with specific mineralogic structures and properties, such as aluminosilicate clay, and the more amorphorus clay, such as allophanes, that are electrically active, not those materials that simply have a particle size less than 2 :m.
16

extent. In general, however, geophysical techniques are most valuable in defining stratigraphic units and preferential pathways rather than the DNAPL mass. The literature indicates that while there have been some successes in locating NAPL masses by several geophysical techniques, the results are very uneven and problematic.
Discontinuous Interbedded Layers
The presence of discontinuous interbedded layers in the subsurface can greatly complicate DNAPL movement. Instead of the major direction of migration being vertical as in sand (note lateral spreading can also occur in sand), DNAPLs may migrate both laterally and vertically following the paths of least resistance. Also in this setting, hydrogeologic characteristics, such as groundwater flow rate and direction, porosity, transmissivity, and gradients, are likely to be highly variable between and within layers. The composition of the aquifer matrix may also change dramatically over short distances, which can cause a very uneven dissolved DNAPL chemical plume concentration distribution.
Approach
Gaining a broad understanding of unpredictable subsurface environments, such as interbedded and discontinuous layers, requires the collection of a large volume of data, due to the limit to which any one data point can be used to extrapolate over a wider area. The performance capability of geophysical methods to gather data on the stratigraphy found in such a geologic setting is limited. For example, resistivity methods while they can be used, are not recommended for laterally discontinuous or radically dipping units (USEPA 1993b and Parasnis 1997), and the clay may hamper the depth of penetration of frequency EM methods (Greenhouse et al., 1998; Parasnis 1997). Frequency EM methods may still be useful to look for shallow heavy end viscous coal tars, such as those found at MGP sites. If there are thin stratigraphic layers that gradually grade into each other, neither seismic methods or time domain EM will be able to resolve the individual units, and a four or more layer model starts to provide a challenge to interpretation.
The capability of surface geophysical methods to gather data on the stratigraphy found in this type of geologic setting is limited.
provide the best chance for locating DNAPLs in
DP methods probably
this environment.
If contamination is expected to reach a bedrock unit, then seismic reflection or refraction, one of the resistivity methods, or time domain EM should be useful in mapping the top of the rock topography to locate potential channels and surficial lows for intrusive sampling. Depending upon the presence of conductive clays, GPR might also be useful delineating the top of the bedrock.
While soil gas mapping may be successful in narrowing the release area locations if the soil matrix is not too fine grained, DP methods probably provide the best chance for locating both DNAPLs and their dissolved phase plumes in the overburden. Use of soil gas mapping should be carefully evaluated since channeling effects can present serious interpretation problems. Although the sampling design is site specific, it should include a suite of continuous coring/water sampling locations for both onsite chemical testing (soil and water) and lithology descriptions, which are done first. The lithology descriptions can then be used to calibrate any geophysical method (e.g., CPT) that might be chosen.
Depending upon the DNAPL being sought, the DP or CPT rig can be equipped with tools like
Most vertical groundwater profilers do not provide stratigraphic information. To avoid excessive sampling, this information generally needs to be provided by a different technique.
17

LIF or MIP. If a CPT is being used, it should be capable of measuring downhole conductivity. A CPT reading that indicates a clay or silt has been encountered, combined with a drop in conductivity over it, is a good sign that a DNAPL is present (case study page 33). The logs taken by the CPT can in turn be used to decide at what depths groundwater samples should be taken to obtain the best chance of profiling a dissolved phase plume. Unless open hole sampling is being done, groundwater profiling equipment (BAT® or HydroPunch® ) does not provide stratigraphic information. Hence, if depth profiling of discrete permeable zones is desired using these techniques, either a large number of samples will need to be taken, or the zones will have to be located with a separate piece of equipment that is capable of identifying them. Dual-tube continuous coring equipment offers the opportunity to identify a permeable zone by examining the core and then determining whether an open-hole groundwater sample should be taken. The disadvantages of this technique are that it slows down the process, and the sample is likely to be turbid.
The sampling design can be set up to either try to locate the DNAPL mass directly or to use the dissolved phase groundwater plume to trace the contamination back to the source. Either approach should take into account whether there is a danger of providing a conduit for DNAPLs to reach deeper clean areas. The design of most DP methods minimizes this problem. A continuous coring DP rig pushing on very small centers provides the best chance of locating the residual or free-phase mass of non-volatile, insoluble, and viscous DNAPLs.
If the contamination is deep, a thorough understanding of where the shallow residual DNAPL is will greatly aid in planning an approach to reach the deeper levels that may require a combination of CPT tools and conventional drill rigs.
Locating DNAPLs in fractured bedrock
spatial distribution and by the lack of
technologies provide.
is complicated by a highly variable
resolution that most characterization
Fractured Bedrock
Fractured bedrock creates one of the most complicated hydrogeologic settings for DNAPL investigations. Bedrock fracturing occurs during the formation of the rock (e.g., the primary fracturing seen in metamorphic and igneous rock) and with regional stressing (e.g., weathering, uplift, and glacial rebound). Sedimentary
bedrock often develops fractures along bedding planes, and in limestone and dolomite, these fractures often develop into solution channels as the more soluble materials are dissolved by groundwater. Fractured bedrock provides many small fractures, fissures, and channels in which DNAPLs can be deposited, or through which they may migrate.
Locating DNAPLs in fractured bedrock is complicated by a highly variable spatial distribution of the fractures and by the lack of resolution typical of most characterization technologies. The fractures can be small in size and random in their occurrence. While the fractures are porous, the rock surrounding the fractures is relatively impermeable. As DNAPLs migrate into the small fractures in the weathered bedrock face or diffuse into the rock itself, they may leave some residual that might act as a marker for investigators as well as a long-term source for groundwater contamination.
Approach
Mapping bedrock structures has long been a conventional application of geophysical technologies. These technologies are generally applied after fracture trace analysis across the surface of the site and at bedrock outcrops has been performed. An effective technology to locate DNAPLs
effective approach for locating preferential
bedrock.
Geophysical methods provide the most cost-
pathways in fractured
18

in fractured bedrock must provide information across a spatial area with sufficient resolution to discern fractures from other, similar geological structures and to differentiate fracture voids, fractures filled with water, and fractures containing DNAPL. At this time, no single geophysical method exists that is capable of doing all these things.
First, look at existing geologic data and conduct a survey of the area to identify outcrops (including examining aerial photographs for fracture traces). The general approach is to choose a geophysical tool, such as resistivity or EM, that can identify areas in rock bodies with sharp contrast in electrical conductivity due to the presence of groundwater. Surface GPR might also be useful for locating fractures. Knowledge of the local rock structure is also useful as localized changes in mineralogy can also cause sharp contrasts in conductivity.
The fracture zone is then drilled into to obtain a sample of the water. Again, the drilling is into a zone, and the fractures sampled may be clean while those 5 cm (2 in) away are not. Conversely, if one drilled fracture is contaminated, there is a possibility that the borehole will contaminate other fracture zones. Considerable care should be exercised in the drilling program to prevent cross contamination of different fracture zones.
Once one hole is drilled, there are a number of ways to help establish the geologic construct. If a drilling technique was used to produce a continuous core, the core can be compared to visuals produced by acoustic or optical televiewing to determine fracture orientation and size. Since coring rock is much more expensive than regular drilling, the number and placement of more cored boreholes should be
carefully considered. To aid in making this choice, the
FLUTe™ or other reactive ribbon
residual DNAPL.
During the drilling of the borehole, it might be advisable to periodically use a
sampler to check the borehole walls for
use of surface to borehole and borehole to borehole geophysical techniques to better refine the understanding of the flow regime should be evaluated. Also, unlike unconsolidated material investigations, it is generally necessary to conduct pumping tests to determine flow direction and fracture connectivity. The pumping tests are done by packing off fracture sets and observing drawdown in other boreholes. Ambient flow measurements using an appropriate flowmeter should
also be taken in the packed off areas. The U.S. Geological Survey has an ongoing study at Mirror Lake of various techniques to improve fractured bedrock investigations and hence aid in DNAPL bedrock investigations (http://toxics.usgs.gov/sites/mirror_page.html).
Cross contamination of fractures and fracture zones is a major concern in a DNAPL investigation. In addition to carefully inspecting the cuttings as they emerge, if the drilling is in an area of suspected DNAPL contamination, it might be advisable, but very expensive, to periodically check the borehole for DNAPL presence. If it is expected that the DNAPL can be visually identified then a downhole camera might also be used. It is always a good idea to chemically profile the fracture zones. This can be done as a point in time measurement during the packer pumping tests or for long-term monitoring with nested or multipoint sampling devices like the Westbay™ or CMT™ system.
19

Table 4-1. Overview of Geophysical and Non-Geophysical Capabilities
Method Physical Properties Measured DNAPL Detection Potential
NON-GEOPHYSICAL TECHNIQUES
Diffusion Sampling .
Diffusion Sampler Used in open holes or completed wells. Does notprovide stratigraphic information.
Can be used to profile concentrations of dissolved DNAPLchemicals in groundwater. Does not detect DNAPLs directly.
Direct Push Technology
Cone Penetrometer Testing Rig Provides a continuous reading of the relativeresistance and friction of soil matrices that can berelated to soil types. Should be calibrated againstactual soil logs taken where the pushing will bedone.
Cannot detect DNAPLs directly or indirectly. However, thestandard probe can be fitted with a number of tools that areuseful for DNAPL detection.
Conductivity Probe Aids in interpreting the CPT data. Can be used as an indirect indicator of DNAPL.
Induced Fluorescence The device is part of a CPT probe so the type ofmatrix it is in will be known as it is advanced.
Detects chemicals that fluoresce (aromatics/polynucleararomatics). Technique is generally able to distinguish amonglow, medium, and high concentrations of contaminants butdoes not indicate whether free phase or residual DNAPL ispresent. The response is not necessarily linear and (givencommercially available wavelengths) is weak for materials likecoal tars.
In-Situ Camera Visual of soil matrix as it passes by. Might beused to identify radically different matrices.
Point source, so the camera probe must be in the DNAPL. Canimage DNAPL micelles under certain conditions. Cannot relatevisual to an actual concentration or volume of DNAPL.
Continuous Coring Generally effective to 15.2 m (50 ft). Some rigscan attain 30.5 m (100 ft). Provides a continuouscore for direct examination. Likely to meet refusalin gravels, cobbles, and cemented sediments(caliche). May experience recovery problems(heaving sands).
Usually coupled with onsite analytical capabilities like portableGC. Provides point source confirmation of contaminationconcentrations. Can be used to trace shallow groundwaterplumes of dissolved DNAPL back to their source areas. Cancollect a DNAPL sample.
20

Table 4-1. Overview of Geophysical and Non-Geophysical Capabilities (continued)
Method Physical Properties Measured DNAPL Detection Potential
In Situ Groundwater Sampling
BAT ® Does not provide stratigraphic information of anykind. If discrete, preferential pathway sampling isneeded. The stratigraphy will need to be knownahead of time.
Drive sampler used to take discrete groundwater samples. Sinceit uses a sample container that is under vacuum, there is achance it could sample DNAPLs if it was driven into a free-phasepool.
Small Diameter TelescopingScreen
Does not provide stratigraphic information of anykind. If discrete, preferential pathway sampling isneeded. The stratigraphy will need to be knownahead of time.
Drive sampler, used to take discrete groundwater samples, isdriven to the target zone where the drive rod is retracted toexpose a screen that allows water to enter. If driven into a DNAPLpool, it is possible that a DNAPL sample could be taken with theproper sampling device.
SimulProbe® Core sample is taken at the same time as soilgas or water sample. If discrete, preferentialpathway sampling is needed the stratigraphy willneed to be known ahead of time.
Drive sampler used to take discrete groundwater, soil gas, andsoil samples. It is driven to the target zone and the drive rod isretracted to expose a small screen that allows water to enter. The sampling configuration may allow DNAPL entry to the downholesample canister if the target zone is in a mobile-phase DNAPL.The simultaneous taking of a soil sample should capture someresidual-phase DNAPL if it is present.
Waterloo Profiler® Soil types can be estimated from back pressuremeasurements. Use if discrete, preferentialpathway sampling is needed.
Continuous drive sampler used to take discrete groundwatersamples. If driven into a DNAPL mobile-phase zone, it is possiblefor the device’s pumping system to convey a DNAPL to thesurface. Samples can be taken in 15 cm (6 in) intervals.
Membrane Interface Probe (MIP) Does not provide stratigraphic information of anykind. Use if discrete, preferential pathwaysampling is needed. The stratigraphy will need tobe known ahead of time.
Provides point source depth specific sampling of soil/watercontamination against the down hole membrane by heating themembrane and bringing gases diffusing through the membrane tothe surface for analysis. Contaminant analysis can be generalwith photo ionization detector/organic vapor analyzer (PID/OVA)or specific with trap and purge equipment followed by GC orGC/MS.
Hydrophobic Dyes
Sudan IV Oil Red O Does not provide stratigraphic information of anykind.
Jar shake test to determine if DNAPL is in a soil sample. SudanIV requires careful handling as it is very toxic.
21

Table 4-1. Overview of Geophysical and Non-Geophysical Capabilities (continued)
Method Physical Properties Measured DNAPL Detection Potential
Hydrophobic Flexible Membranes
FLUTe™ Does not provide stratigraphic informationof any kind.
Direct indication of DNAPL presence. Requires an open holefor deployment. Does not provide speciation of contaminantsthat will require further processing and analysis. A negativefinding should not be taken as proof that there is no DNAPLin the hole.
Optical Televiewer
Optical Televiewer Aids in the evaluation of fractureorientation and aperture size in bedrockinvestigations.
If the borehole is drilled through a DNAPL, the camera maybe able to image it.
Tracer Testing
Partitioning Interwell Tracer Test (PITT) Does not provide stratigraphic informationof any kind.
Indirect indication of DNAPLs. Used to estimate volumebefore remediation and estimate residuals afterward.Requires a series of parallel wells for injection and extractionpurposes. Not effective in clay matrices. Will provide anincorrect estimate of volume if strong preferential pathwaysexist. Not used for initial characterization efforts.
Soil Gas
Soil Gas Profiling Does not provide stratigraphic informationof any kind.
Indirect indication of DNAPL presence. Provides directconcentrations of volatile chemicals in the subsurface. Canbe used to track groundwater plumes of dissolved DNAPLphase and find DNAPL sources by soil gas contaminantconcentration increases/decreases over the groundwater.Only effective for volatile organics. Active surveys are notgenerally effective in clayey soil.
GEOPHYSICAL TECHNIQUES
Conventional Borehole Methods
Acoustic Televiewer Provides an excellent tool for examiningfracture size and orientation in bedrock andaiding in determining preferential pathwaysfor potential DNAPL transport. It is noteffective for very small (50-200 microns)fractures.
Not likely to detect DNAPLs directly or indirectly.
22

Table 4-1. Overview of Geophysical and Non-Geophysical Capabilities (continued).
Method Physical Properties Measured DNAPL Detection Potential
EM Induction Provides a measure of bulk electrical conductivity ofthe subsurface surrounding a borehole (effectiveradius of about 30 in or 76 cm). The depth into thesurrounding medium is dependent upon thetransmitter and receiver configuration and thefrequency range measured.
May be able to detect changes caused byDNAPLs. Could indicate that the conductivity islower than expected for a given soil matrix andalert the investigator to look further at the anomaly.
Gamma-Gamma Probe Provides a measure of bulk density, porosity, andmoisture content with vertical resolution (dependingupon the instrument) as good as 1 cm (0.39 in). Helpful in locating preferential pathways.
Does not provide information on DNAPLs.
Natural Gamma Probe Provides an indication of stratigraphic differences suchas clays versus sands or shales versus sandstones.
Does not provide information on DNAPLs.
Neutron Probe Generally used to detect moisture (hydrogen) contentof the borehole environment.
Detects physical changes that may be caused byDNAPLs. DNAPL hydrogen and chlorine atomsinteract with neutrons emitted by the probe similarto water. A borehole passing through a DNAPLmay indicate more “moisture” than expected andbe a reason to revisit that soil horizon.
Resistivity Probe Measures the bulk resistivity of borehole fluids and theformation immediately adjacent to the borehole. Notparticularly sensitive to small changes in the matrix soit would not be a method of choice for providing datafor preferential pathway analysis. Tool limitationsdependent on electrode spacings. Some tools haveshort distances (better vertical resolution) others havelonger distances.
Provides non-unique solution to presence ofDNAPLs.
Spontaneous Potential Provides a gross measurement of the bulkresistivity/current flow in coherent rock and indicatespreferential flow in fractured rock. Can also locatestratigraphic contacts.
Is not expected to provide information on DNAPLs.
23

Table 4-1. Overview of Geophysical and Non-Geophysical Capabilities (continued).
Method Physical Properties Measured DNAPL Detection Potential
Electrical Methods (Surface, Surface-to-Borehole, or Borehole-to-Borehole)
Electrical Resistivity Used to resolve stratigraphic layers and lateraldiscontinuities. Can aid in locating water bearingfractures in bedrock that might act as preferentialpathways for DNAPL. No limit to depth ofpenetration but generally used to 100 m (328 ft).
Can detect changes caused in the subsurface byDNAPLs. Under the proper circumstances, a largebody of DNAPL may be identified as a resistiveanomaly in the subsurface but the solution is non-unique. Ground truth with intrusive methods isrequired to confirm DNAPL presence.
Electrical Resistivity Tomography Provides tomogram of relative resistivity values inspace that can be attributed to stratigraphic units.
Has been demonstrated in the laboratory to be ableto track DNAPL releases through soils. Has beenused in the field to gage the progress of steamthrough the subsurface during a DNAPL remediation.Has found best use in observing changing conditionsin the subsurface, not in locating DNAPLs directly orindirectly.
Electromagnetic Methods (Surface, Surface-to-Borehole, or Borehole-to-Borehole)
Terrain Conductivity (frequency domain) Usually used for profiling average conductivityvalues. Can be used for locating shallow laterallydiscontinuous clays and sands. Effective depth isapproximately 6 m (20 ft).
Can be used to locate conductive contaminantplumes that may contain dissolved DNAPLchemicals. Also has had mixed results in locatingshallow LNAPLs floating on the groundwater. Notlikely to be effective for directly or indirectly detectingDNAPLs.
Horizontal Loop Electromagnetics(frequency domain)
Similar to terrain conductivity. Most effective inrelatively uniform subsurfaces with sharpconductive interfaces. Could be used for contouringbedrock or clays for preferential pathway analysis.
Same as Terrain Conductivity technique.
Fixed Source Frequency Domain Electromagnetics
Primary commercial use in locating largeconducting bodies, such as ore bearing formations.Can be configured for smaller bodies and can beused for determining stratigraphic changes.
Not likely to be able to resolve a DNAPL mass. Canlocate ferrous containers that may have containedleaking DNAPLs.
24

Table 4-1. Overview of Geophysical and Non-Geophysical Capabilities (continued)
Method Physical Properties Measured DNAPL Detection Potential
Very Low Frequency Electromagnetics Useful in locating conductive structures like clays,weathered zones in bedrock, vertical conductivefractures, or large mineralized structures, such asdikes. Penetration to a few 10s of m (33-100 ft).
Not likely to be able to resolve a DNAPL mass butcan be useful in defining the hydrogeologicframework at a site or large conductive features,such as pipes, fractures, or joints.
Very Low Frequency Resistivity by EM Induction
Provides averaged value of soil resistivity to depthsof approximately 20 m (65.6 ft). Most effective insubsurfaces with horizontal, nondipping, andcontinuous layers. Can be used for locating waterfilled fractures in bedrock.
Can be used to locate conductive contaminantplumes that may contain dissolved DNAPLchemicals. Not effective for directly or indirectlydetecting DNAPLs.
Fixed Source Time DomainElectromagnetics
Can provide stratigraphic profiles to depths of 1,000m (3,281 ft) or more. Newer instruments can resolvedepths as shallow as 1-3 m (3.3-9.8 ft). Not likely tobe able to resolve thin resistive units, especially withdepth. Independent confirmation of what the layersare is required.
Not likely to be able to resolve a DNAPL mass butcan be useful in defining the hydrogeologicframework at a site. Can locate ferrous containersthat may have contained leaking DNAPLs.
Ground Penetrating Radar
Ground Penetrating Radar Useful in resolving stratigraphic layers to 25 m (82ft), although 10 m (30 ft) is more common.Independent confirmation of what the layers are isrequired. Highly conductive surface layer (clay) canlimit penetration to 1 m (3.3 ft) or less. GPR systemshave the capability to selectively apply differentfrequency antennas to target different depths.
Under certain circumstances, can be used to locatechanges in subsurface properties that may be causedby NAPLs when the conditions are favorable. Theseconditions would include a high reflective contrast(wide difference in dielectric permittivities) betweenthe NAPL and the soil matrix it is in or a competentNAPL with a sufficiently large areal extent to allowresolution. Locating NAPLs with GPR has seen verymixed results with weathering/biochemical changescausing interpretation problems. Intrusiveconfirmation is required. Can locate ferrouscontainers that may have contained leaking DNAPLs.
Magnetics
Magnetometers Can be used to locate bedrock overburdeninterfaces when the bedrock contains resolvablequantities of iron or nickel compounds. Can also beuseful in differentiating soils with different magneticmineral content.
Does not locate DNAPLs directly or indirectly. Goodfor locating buried drums, tanks, and utilities.
25

Table 4-1. Overview of Geophysical and Non-Geophysical Capabilities (continued)
Method Physical Properties Measured DNAPL Detection Potential
GEOPHYSICAL TECHNIQUES
Seismic Methods
Seismic Reflection Used to profile multiple layers to large depths. Hasgood vertical resolution. Unaffected by conductivesurface layers.
Although still in the demonstration stage, amplitudeversus offset methods have been used to locate largeDNAPL masses. However, the general location of therelease was known before the survey, and thistechnique is expensive and should not be used as aninitial search tool.
Seismic Refraction Because of energy requirements generally todepths of 91 m (300 ft) or less, typically it can onlyresolve 2-3 layers. Acoustical velocity in the layersmust increase with depth or the technique will notdetect lower velocity layers at depth.
Used only to locate potential topographicalpreferential pathways for DNAPL flow.
Cross Borehole Seismics Used to profile multiple layers between boreholes.Limited to the depth of the borehole. Dependingupon the acoustic source, the boreholes may needto be closely spaced (10-30 m or 32.8-98.4 ft) forgood resolution.
Good technique for fracture analysis in bedrock.Although still in the research stage, it has thepotential for locating large DNAPL masses.
26

SECTION 5 USE OF NON-GEOPHYSICAL TECHNIQUES FOR DNAPL
INVESTIGATIONS
Effective removal (as opposed to containment strategies) for DNAPL sites depends upon reasonably accurate knowledge of the location of the DNAPL. This section discusses some of the sampling and analytical technologies that may be used to locate and detect DNAPLs. Table 4-1 in the previous section summarizes the characteristics of these technologies. Most of the tools in this section can be obtained commercially from the manufacturer and in many cases have become part of the standard characterization toolbox. Many of the technologies included in this section could be used for any groundwater or soil contamination study. However, because of the way DNAPLs travel in the subsurface locating them is often done by evaluating their dissolved and vapor phases first. Because of their often irregular distribution patterns, the more discrete the measurements, the better the chance of finding the actual source areas. The technologies discussed below were included in this report because they offer cost-effective ways of collecting the discrete data needed for DNAPL characterizations. Metric units are rounded and hence do not represent their exact U.S. equivalent.
Diffusion Sampler
Diffusion samplers are used to obtain groundwater samples at a discrete depth for a variety of volatile organic analyses. They are generally constructed of a low density polyethylene tube filled with organic free water.
Figure 5-1. Diffusion Sampler. Courtesy of EON Products, Inc.
How It Works: Low density polyethylene is permeable to many volatile organic compounds. A weighted tube (Figure 5-1) is lowered into a well or open borehole to a target
depth. If left long enough (generally 48 hours at a minimum), dissolved chemicals diffuse through the tube wall into the organic free water until equilibrium is achieved. Depending upon groundwater flow velocities and any purging activities performed during the deployment, the bag can be retrieved at 48 hours or left for several weeks. Upon being brought to the surface, the tube is opened and the water poured into 40 ml vials for subsequent analysis. The technique does not produce investigation derived wastes and may be carried out by one technician. Care should be taken in evaluating large intervals by this method as vertical gradients in the borehole may result in redistribution of contaminants. The technique should not be used in close proximity to DNAPL that may flow, and vertical flowmeter testing should be used in conjunction with this type of sampling if the screen/open hole is greater than 3 m (10 ft). Sample transfer to vials should be done immediately to avoid contaminant loss.
DNAPL Uses: Since the samplers are affected only by the groundwater they contact directly, they can be deployed in a stacked configuration that provides a series of discrete depth samples through a screened interval. The resulting sample analyses may be used to determine if any differences exist in the dissolved phase concentrations of the DNAPL chemicals in the screened interval or borehole. A high concentration interval that might be diluted out by pump sampling methods indicates the potential for a DNAPL source somewhere upgradient of the well or borehole. Costs may be reduced if the samples can be split and screened in the field using a field GC.
27

Drawbacks: The method requires a completed well, well point, or a borehole that will remain open for a period of time. The diffusion sampler is an indirect tool for directing further characterization activities rather than locating the DNAPL directly.
Case Study 1: Groundwater is contaminated with TCE at the Tyson Wash site. The aquifer is predominantly silty fine sand with silty clay, gravel, and sand lenses that are highly variable across the site. Groundwater occurs between 13 and 17 m (43 and 54 ft) bgs. A 91 to 107-m (300 to 350-ft) thick clay/silty clay aquitard is found at approximately 24 m (80 ft) bgs. Flow directions and gradients are affected by the seasonal pumping of 471 shallow domestic wells within 805 m (½ mile) of the site.
There are 10 monitoring wells with 10 to 13 cm ( 4 to 5 in) diameters at the site, which are generally screened from 3 m (10 ft) above the water table to the aquitard (9 to 12 m or 30 to 40 ft). The wells have dedicated pumps. Two full rounds of diffusion sampling were conducted. The first round with bags positioned at 1 to 1.5 m (3 to 5 ft) intervals down to the top of the pumps, indicated an increase in PCE concentration with depth, but not as high as that obtained with the pumps. At this point, the state decided to pull the pumps and run a second round of diffusion samplers from the top of the water table to the bottom of the wells (personal communication with Arizona DEQ).
The results from the second round of sampling were uniformly low. An evaluation of the sampling and analysis procedure revealed that the sampling personnel had not emptied the bags into sample containers as they were retrieved but rather had placed them on the tailgate of a vehicle sitting in the sun causing whatever PCE that was in the bags to diffuse back out. The state plans to resample the site with diffusion bags. Laboratory tests indicate that the bags will start losing measurable concentrations of VOCs within 15 minutes of the sample being taken from the well head (personal communication with Arizona DEQ).
Case Study 2: A vertical profiling experiment using diffusion samplers was carried out at Naval Air Station (NAS) North Island during late 1999 (Vroblesky and Peters 2000). The purpose of the experiment was to compare results obtained from low flow sampling of wells with diffusion sampler arrays placed in them. The target chemicals were BTEX and chlorinated ethenes. While the overall finding was that the diffusion samplers generally produced higher concentrations at any given depth than the low flow sampling devices when the concentrations across the interval were similar, the low flow samplers tended to average the discrete intervals and hence did not accurately portray stratification. The ability to delineate stratification is important to a DNAPL investigation because it shows the depth at which source areas are more likely to be found upgradient of the sampling point. In several wells the concentrations of trichloroethene (TCE) were relatively stable over the length of the screened interval. On the other hand, several wells showed widely varying concentrations of TCE within their screened intervals (Table 5-1). Note in Well MW-68C2 there is a 6-m (20-ft) screened interval and during the first 3-m (10-ft) interval the TCE concentrations rise from 19 mg/l to 200 mg/l where upon they fall from 200 mg/l to 6.5 mg/l. There is a good probability that somewhere up gradient from this well is a DNAPL source that quite likely spans the entire 6-m (20-ft) interval with a more concentrated source area between 12 and 15 m (40 and 50 ft). Wells PW-66 and 5-D have steeply decreasing concentrations over their 3-m (10-ft) screened interval while PW-15 is steeply increasing with depth. The study did not attempt to link the concentration variations with changes in the soil matrices.
28

Table 5-1. Vertical Profiling of TCE Groundwater Concentrations with Diffusion Samplers
Well MW-68C2 Well 68B Well PW-15
Depth (ft) TCE Depth (ft) TCE Depth (ft) TCE Concentration Concentration Concentration
(:g/l) (:g/l) (:g/l)
37.3 19,000 34.5 49,000 25.4 4
39.1 47,000 37.0 62,000 27.1 7
40.5 84,000 38.5 130,000 28.5 180
42.1 200,000 Well PW-66 30.2 3,000
44.2 110,000 Depth (ft) TCE 31.8 5,500 Concentration
(:g/l)
46.1 110,000 25.5 17,000 33.2 7,500
47.9 110,000 27.3 9,000 Well 5-D
49.9 100,000 29.1 770 Depth (ft) TCE Concentration
(:g/l)
52.0 42,000 30.8 180 50.8 690
53.9 14,000 32.3 48 52.3 1,200
55.6 8,800 33.9 13 54.2 930
57.5 7,300 55.8 510
59.5 7,000 57.4 160
61.5 6,500 59.0 55
Direct Push Technologies
Over the last decade, DPT has become widely accepted as a cost-effective means of collecting subsurface samples. DPT consists of a small-diameter stainless steel probe and a vehicle-mounted drive source. The probes, which are typically 4 to 9 cm (1.5 to 3.5 in) in diameter are advanced into the ground by a static (hydraulic push), hammer (pneumatic, drop or hydraulic), vibration drive source, or a combination of these. The static method, utilized principally with CPT rigs, relies on the weight of the vehicle to drive the probe into the ground. The other drive methods use equipment that can be mounted on the back of a small pickup truck or van. Some vendors offer them on standard size fork lift type vehicles with or without
and cheaper than conventional drill Overall, DPT rigs are much faster
rigs and can provide more information per hole.
29
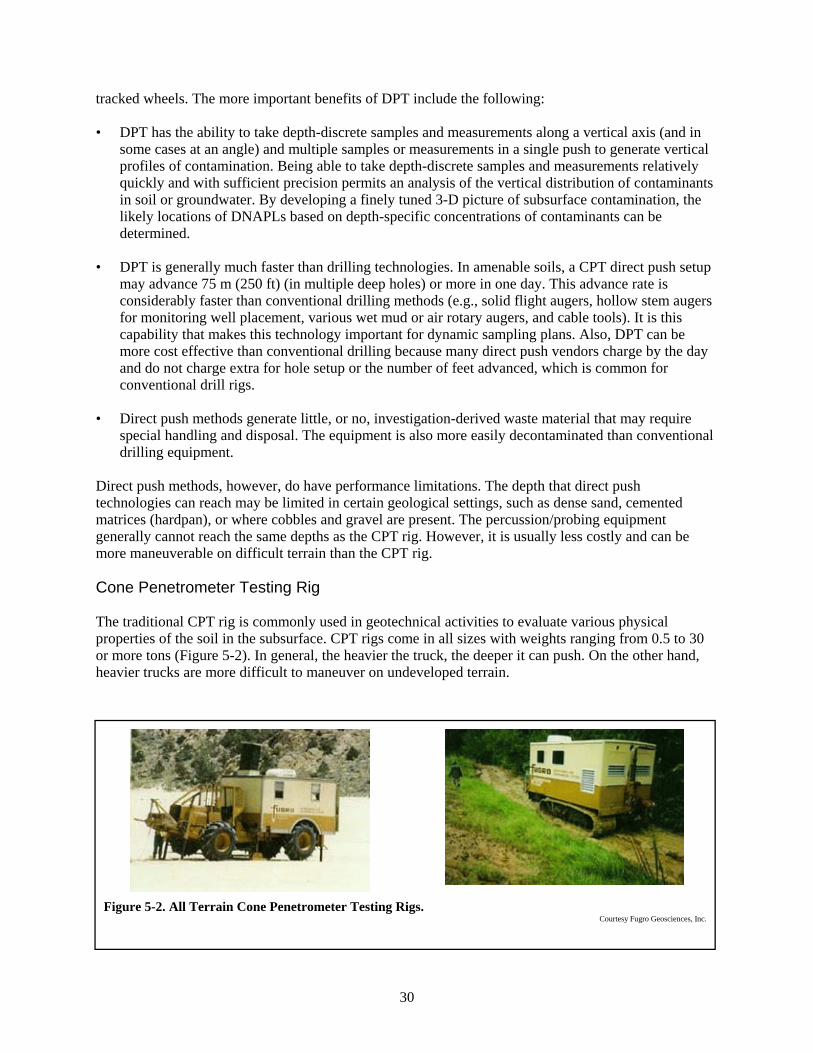
tracked wheels. The more important benefits of DPT include the following:
• DPT has the ability to take depth-discrete samples and measurements along a vertical axis (and in some cases at an angle) and multiple samples or measurements in a single push to generate vertical profiles of contamination. Being able to take depth-discrete samples and measurements relatively quickly and with sufficient precision permits an analysis of the vertical distribution of contaminants in soil or groundwater. By developing a finely tuned 3-D picture of subsurface contamination, the likely locations of DNAPLs based on depth-specific concentrations of contaminants can be determined.
• DPT is generally much faster than drilling technologies. In amenable soils, a CPT direct push setup may advance 75 m (250 ft) (in multiple deep holes) or more in one day. This advance rate is considerably faster than conventional drilling methods (e.g., solid flight augers, hollow stem augers for monitoring well placement, various wet mud or air rotary augers, and cable tools). It is this capability that makes this technology important for dynamic sampling plans. Also, DPT can be more cost effective than conventional drilling because many direct push vendors charge by the day and do not charge extra for hole setup or the number of feet advanced, which is common for conventional drill rigs.
• Direct push methods generate little, or no, investigation-derived waste material that may require special handling and disposal. The equipment is also more easily decontaminated than conventional drilling equipment.
Direct push methods, however, do have performance limitations. The depth that direct push technologies can reach may be limited in certain geological settings, such as dense sand, cemented matrices (hardpan), or where cobbles and gravel are present. The percussion/probing equipment generally cannot reach the same depths as the CPT rig. However, it is usually less costly and can be more maneuverable on difficult terrain than the CPT rig.
Cone Penetrometer Testing Rig
The traditional CPT rig is commonly used in geotechnical activities to evaluate various physical properties of the soil in the subsurface. CPT rigs come in all sizes with weights ranging from 0.5 to 30 or more tons (Figure 5-2). In general, the heavier the truck, the deeper it can push. On the other hand, heavier trucks are more difficult to maneuver on undeveloped terrain.
Figure 5-2. All Terrain Cone Penetrometer Testing Rigs. Courtesy Fugro Geosciences, Inc.
30

How It Works: The CPT probe consists of a cone that measures tip resistance and a sleeve (side) that measures soil friction as the probe is pushed at a predetermined rate into the subsurface. The resistance and friction values are then related to soil behavior type. The probe measurements cannot identify the specific type of soil (based on grain size) distribution that is encountered unless the resistance measurements can be compared to actual site soil core data. In the absence of onsite data, the CPT measurements identify changes in the soil’s behavior that can be related to changes in stratigraphy and and are usually referred to as soil behavior types. For geotechnical purposes, CPT probes have also been modified to provide pore pressure data. Pore pressure measurements are made with a pressure transducer contained within the probe and connected to a ceramic screen that is generally mounted just above the cone. As the probe advances, water is forced from the formation, which exerts pressure on the porous ceramic screen. This pressure is measured and can be related to hydraulic conductivity of the soil as well as the soil type. Soft clay has relatively large pore pressures, and sand has relatively low pore pressures since water can quickly seep back into the sand matrix. Figure 5-3 shows a probe designed to provide information on soil behavior type, hydraulic conductivity, and electrical conductivity.
Transducer and Electrical Conductivity Tool.
Figure 5-3. CPT Probe with Pore Pressure
Courtesy of Gregg Drilling & Testing, Inc.
DNAPL Uses: In appropriate soils, CPT rigs are generally capable of surveying 75 m (250 ft) or more of subsurface per day and hence are far cheaper to use than obtaining the same stratigraphical information with a conventional drill rig. Depending on how amenable the site is to surface geophysical techniques, CPT might offer the best alternative to mapping an unconsolidated subsurface to determine preferential pathways for DNAPL migration. While not its general purpose, soil cores and water grab samples may be obtained from a standard CPT rig.
Drawbacks: The CPT does not directly measure soil types or chemical species. Also, if the intention is to use the stratigraphy capability, it needs to be calibrated against one or more conventionally logged boreholes (drilled or direct push continuous soil sampling). However, a CPT rig can be fitted with direct push continuous coring capabilities so only one piece of equipment is required to conduct a survey. CPT cannot be used in hilly areas.
Case Study: The Wyckoff Superfund Site is a wood treating site that borders Puget Sound. Contaminated groundwater exists to 35 m (110 ft) bgs. There are eight stratigraphic units of concern that consist of varying thicknesses of clay, silt, and sand and gravel. An aquitard that is providing some protection to the underlying aquifer
consists of a stiff marine silt overlying a dense glacial clay (both with vertical permeabilities of 10-6 to 10-7 cm/sec) with discontinuous interbedded silt and sand. The subject investigation was in support of evaluation of containment and thermal treatment alternatives to prevent NAPLs (light and dense) from discharging to Eagle Harbor. The investigation goal was to provide more stratigraphic information along the proposed path of the slurry wall and identify areas of contamination.
The investigation employed a Triad approach and was generally carried out by direct-push methods, using SCAPS (Site Characterization and Analysis Penetrometer System) and Geoprobe® rigs. The
31

SCAPS rig was equipped with CPT and laser induced fluorescence (LIF) probes. An onsite laboratory conducted the chemical analysis of soil cores taken by both rigs. The onsite laboratory capabilities consisted of total recoverable petroleum hydrocarbons (TRPH) by a modified EPA 418.1 method, GC/flame ionization detector (FID) for PAHs, GC/FID for product fingerprinting, and GC/electron capture detector (ECD) for pentachlorophenol. Both rigs were successful in describing the stratigraphy, with the Geoprobe® using continuous coring. Because of the Geoprobe® ’s light weight and mobility it was able to investigate the subsurface on the tidal flats during low tide, which gave the investigators more information on how far out and deep the contamination had traveled. Mobile DNAPL was found in the sand lenses of the glacial aquitard at depths up to 21 m (70 ft).
Some technical notes:
• The Geoprobe® was able to penetrate areas where the CPT met refusal.
• The LIF required calibration with the site-specific contaminants for optimal interpretation. To obtain these soil samples for calibration purposes, the SCAPS soil sampler was used for pushes that were offset 0.5 m (1 to 2 ft) from the LIF probe locations.
• Soil core samples were valuable in identifying the presence of DNAPLs. However, it was pointed out that the NAPLs were often draining from the cores as they were retrieved from the hole. Hence an estimate of the pore volume content of DNAPL from the retrieved samples may tend to understate their mass.
The CPT LIF required calibration
calibration purposes required a
hole.
with the site-specific contaminants for optimal interpretation. To obtain these soil samples for
second adjacent (1 - 2 ft offset)
• Comparison of soil sampling data with LIF count data showed a rough, but statistically valid correlation.
During the past decade, there has been a great deal of interest, especially on the part of the military, to expand the capabilities of the CPT rig to include in situ or downhole indications of chemicals of interest. Conductivity, induced fluorescence, and in-situ camera are techniques that have been developed to expand these capabilities.
Conductivity
While the conductivity probe is a geophysical tool, it is placed in this section because it is deployed as a direct push technology. There are a variety of conductivity probe configurations. When designed specifically for CPT use, the probe is usually located above the standard penetrometer tip and consists of a pair or more of electrodes separated by an insulating material (Figure 5-3). Conductivity probes are also offered as stand-alone drive tips that can be used with CPT or other DPT rigs (Figure 5-4).
Figure 5-4. Conductivity Drive Probe for Fitting on DP Rig.
®Courtesy Geoprobe Systems
indicate the presence of a DNAPL when it is sufficiently large to affect the overall
A conductivity probe can
conductivity of the soil matrix.
How It Works: As the probe advances through the subsurface, the bulk conductivity (or resistivity) in the adjacent soil is measured by the electrodes and transmitted to electronics on the surface. The depth and speed of advancement is tracked to produce a continuous conductivity log. The differences in conductivity can be related to differences in stratigraphy, with clay being very conductive and sand
32

and gravel being much less so. When calibrated to a lithologic log produced by continuous coring or other drilling method, the differences in the conductivities can be related directly to site-specific features. Conductivity probes are also affected by soil-water content and ionic strength. Therefore, in many cases, they can be used to determine at what depth the probe has entered a contaminant plume and the depth it leaves the plume. The potential exists to detect DNAPL masses that have low conductivities when they are sufficiently dense enough to affect the overall conductivity of the soil matrix and the matrix itself is somewhat conductive.
DNAPL Uses: These methods provide real-time data of changes in subsurface conductivities caused by changes in soil matrix (sand to clay) and in water content (vadose zone to capillary fringe to water table). Depending upon the nature of the contaminant and how it affects groundwater conductivity, the conductivity probe can be used to delineate groundwater plumes. Dissolved DNAPL chemicals are not likely to appear in the groundwater at sufficient concentrations to be detectable by this method. DNAPL masses themselves may be detected under a narrow set of circumstances.
Drawbacks: The instrument measures the changes in a soil property rather than what is causing the changes. Hence it has to be resolved with actual chemical or soil matrix data. The probe is unlikely to detect the dissolved phase of a DNAPL chemical mass. A DNAPL mass would have to occupy a relatively high percentage of pore space and have a high conductivity contrast with the soil matrix to be detected by this probe.
Case Study: The Department of Energy (DOE) conducted a demonstration of a direct push conductivity probe at a former MGP in Marshalltown, Iowa. Contaminants of concern at the site were benzene, toluene, ethylbenzene, xylenes, phenols, and polynuclear aromatic hydrocarbons, with some contamination present as DNAPL. Site stratigraphy, from top to bottom, consists of fill and clay with interbedded sandy and gravelly clays overlying a sand unit, followed by a clay unit that overlies bedrock. Depth to groundwater averages between 5.5 and 6 m (18 and 20 ft) with the depth to bedrock ranging from 6 to 12 m (20 to 40 ft). One of the purposes of the demonstration was to test the ability of the conductivity probe to map the site stratigraphy. Before starting the field investigation, the probe was calibrated with site-specific soil cores.
The measurements showed that stratigraphic units had distinct conductivities and were sufficiently continuous to allow the probe to identify the bedding contacts accurately. There was a marked drop in conductivity in one area at the base of the sand unit before entering the underlying clay unit. This drop corresponded to a known area of DNAPL. Hence, it is possible to use this probe to identify areas where DNAPLs may be pooled. Note, however, that this tool identified an area for additional study; it did not specifically identify a DNAPL presence.
Induced Fluorescence
Induced fluorescence techniques measure the fluorescent response of a chemical to ultraviolet light to provide a qualitative indication of the presence of contamination in the subsurface. For the equipment commercially available, the most likely chemical contaminants to be measured are those containing two or more aromatic rings. This commercially available equipment can be divided into two design classes based on the method used to generate the ultraviolet light used to induce fluorescence: lasers and mercury vapor lamps.
33

Laser Induced Fluorescence
The Laser-Induced Fluorescence (LIF) probe is a sensor that was developed to be deployed on a CPT rig for depth-discrete detection of contaminants that fluoresce. LIF, however, can only provide a qualitative indication of the relative presence of fluorescing chemicals. These consist primarily of polynuclear aromatic hydrocarbons. Calcite and several other minerals also fluoresce, so background levels should always be checked to ensure proper readings. Most DNAPL compounds (excluding creosotes and coal tars) do not fluoresce at standard excitation wavelengths. However, LIF may be used to investigate them if there is evidence that they have been mixed with compounds, such as fuels, that do fluoresce. In these cases, fluorescence is used to infer the presence of DNAPLs. LIF screening is typically available from most commercial cone penetrometer companies.
How it Works: The LIF probe uses a pulsed laser to generate ultraviolet light that stimulates fluorescence in in-situ samples. The probe emits ultraviolet light and senses fluorescent responses through a sapphire window that is mounted flush with the exterior surface of the probe. A fiberoptic system in the probe transmits the response signal to a detection device at the surface (Figure 5-5). LIF probes can “collect” and analyze approximately one sample per second. When advanced continuously by a cone penetrometer, a reading for every 0.06-m (0.2-ft) interval is obtained. If soil cores are taken and analyzed by a quantitative method in contaminated areas that the LIF has been used in, a rough correlation between the LIF system response and actual contaminant levels can be established for the rest of the site. Note, however, that with increasing concentration, the response can become very non-linear. The LIF sensor response is also sensitive to soil matrix variations. Matrix properties that affect LIF sensitivity include soil grain size, mineralogy, moisture content, and surface area. Each of these factors influences the relative amount of analyte sorbed on or into the soil. Only the fraction of analyte optically accessible at the window of the probe contributes to the fluorescence signal.
Figure 5-5. Laser Induced Fluorescence CPT Probe.
Courtesy Army Corps of Engineers
The return fluorescence can be sampled at specified wavelengths (e.g., ROST™ system), displayed as total spectra, or displayed as the most intense wavelength within the spectra. If the sampling feature is available, wavelengths are chosen to represent the highest area of response intensity of a given target matrix (e.g., gasoline, diesel, creosote, coal tar) and these can be displayed separately as well as in total. The total reading indicates the amount of material present, and the separate displays can allow the matrix to be fingerprinted. In other words, in the ROST™ system, a coal tar will have an identifiable waveform (fingerprint). If the waveform does not match the expected fingerprint, then the matrix consists of a mixture of materials. The multichannel system can estimate the relative contribution of the materials in the mixture.
DNAPL Uses: The LIF technology has found extensive use in delineating petroleum related contamination. It has also been used at wood treating facilities where materials, such as creosote and
34

pentachlorophenol and other phenols, have been mixed with diesel fuel. It has the same depth limitations as the CPT. When used for coal tars, multiple components are measured and because the actual coal tar (heavy end) response is relatively weak (5 to 10 percent of light end aromatic standard), it can be missed if it is not looked for specifically.
Drawbacks: The technology has a limited number of chemical constituents that it can detect and most are not DNAPLs. It is subject to false positives and negatives. Results identifying potential DNAPL masses should be verified by taking subsequent cores and testing them with a quantitative method. The LIF technology cannot differentiate between calcite beds or other calcium carbonate rich areas as well as some minerals and organic acids and target compounds.
Case Study 1: A post remedial investigation/feasibility study (RI/FS) utilizing the Triad approach was conducted at the 29-acre former McCormick and Baxter woodtreating plant in Stockton, California, to better characterize the NAPLs found beneath the site during the RI. The primary target contaminant was coal-tar-derived creosote. The subsurface consisted of interbedded and interconnected clay and sand. Depth to groundwater was approximately 5 m (16 ft) bgs. A CPT rig using a LIF probe pushed approximately 200 holes over the course of the investigation. The average depth of these pushes was 30 m (100 ft). Refusal was encountered by the rig in areas having saturated fine-grained sand.
The LIF was unable to provide quantitative results, but by initially correlating counts to the degree of contamination identified in soil cores taken in the same area, a system was set up to determine if it was either not contaminated or definitely contaminated with NAPL or in need of further investigation. The initial correlation was done by pushing a hole with the LIF probe attached. The CPT rig was then moved slightly away from the hole, and a new hole was pushed to the depth of interest, where a soil core was taken. The contaminant condition of the retrieved core was then compared to the LIF reading. The drawback to this arrangement was that it established categories of "yes/no/maybe" for the areas of contamination with concentrations of concern, with a large number of "maybes" that required intrusive confirmation. The investigation found a number of areas where vertical stratification of the DNAPL had occurred with alternating layers of highly contaminated and clean soils.
Areas requiring deeper penetration than the CPT was capable of or where refusal had occurred were investigated using conventional drilling methods.
Case Study 2: As part of a feasibility study evaluation, a post RCRA Facility Investigation (RFI) characterization was performed at a former refinery. The characterization delineated an approximately 200-acre contaminated zone. The site is underlain by up to 3.5 m (12 ft) of fine grained alluvial deposits (silts, clays, and fine sand) that overlie an approximately 3-m (10-ft) thick transition zone consisting of gravelly silts, fine sands, silty gravels and small cobbles intermixed in a silt or sandy silt matrix. The transition zone overlies an approximately 30-m (100-ft) sequence of interbedded sands and sandy gravels that rest on a shale bedrock. Groundwater occurs at approximately 5 m (16 ft) bgs. This site is included in this report because the water table can fluctuate over 5.5 m (18 ft) a year creating a complex NAPL smear zone that resembles a DNAPL configuration when the water table is at its height.
A LIF/ROST™ system mounted in tandem with a cone penetrometer probe was used to push holes to depths of up to 12 m (40 ft) bgs. The LIF/ROST™ system provided semi-quantitative estimates of the presence of LNAPL in the smear zone that could be correlated with the soil behavior types identified by the CPT probe. The fine frequency of the readings (less than 15 cm (0.5 ft)) and the instrument’s ability to differentiate between areas with light fuels and those areas that also contain crude allowed for a more thorough evaluation of the feasibility of using surfactant enhanced remediation techniques. The vertical and horizontal contaminant profile developed by this characterization effort showed that LNAPL saturation in soils below the water table averaged about 3.5 percent.
35

Case Study 3: ROST™ LIF instruments weredeployed at a former MGP site to determinehow effective they would be in detecting by-product and coal tar wastes (USEPA 2003). Thesite consisted of approximately 3 m (10 ft) offill over 3 m (10 ft) of silt followed by a sandand gravel unit. Groundwater occurred between1 and 3 m (4 and 8 ft) bgs. The fluorescencewas measured at four wave-lengths—340, 390,440, and 490 nm. These four monitoringwavelengths cover the range of fluorescenceproduced by light fuels through heavycontaminants, such as coal tar and creosotemixtures, and enhance the detection of widelyranging product types. The LIF was successfulin distinguishing between coal tars, mixedmaterials, and light oils (Figure 5-6). It couldnot determine if these materials existed as“heavy” contamination, residual NAPLs, ormobile-phase NAPLs. However, theinformation provided could be useful indirecting a cleanup or more definitive soilsampling effort. One caution that came out of
Figure 5-6. LIF Printout Showing Predominantly Coal Tar Contamination Between 8 and 14 ft bgs.
Courtesy: Dakota Technologies
Figure 5-7. Fuel Fluorescence Detector.
Courtesy of Gregg Drilling & Testing, Inc.
the sampling and data evaluation was that contamination in the former MGP site subsurface was highly heterogenous and not amenable to modeling based on the LIF sampling points.
If soil cores are taken and analyzed by a quantitative method in contaminated areas that the LIF has been used in, a rough correlation between the LIF system response and actual contaminant levels can be established for the rest of the site.
Mercury Lamp Induced Fluorescence
This technology, sometimes referred to as a fuel fluorescence detector (FFD), is very similar to LIF except that it uses a mercury lamp as its light source, and the light is located in the probe at the sapphire window (Figure 5-7). This lamp provides a continuous source of light rather than the pulsed technique of the LIF. Although some vendors have begun to put the detectors downhole, fluorescence intensities from the soil are generally returned via fiber optic cable to the
surface for measurement. If the detector is a simple photomultiplier, it will give total fluorescence.
36

Some vendors have filtering capabilities to limit wavelength reception to their detectors within a prespecified range. The filters are used to enhance identification of product types but do not have the versatility of FFD systems equipped with a detector that measures the full spectrum. Since vendor set ups can be different, it is recommended that the vendor be queried about their methods to exclude extraneous source wavelength emissions, extraneous source scattering, and other potential background noise. Also it is prudent to inquire how the system handles background noise in general.
Case Study: In a test to determine its applicability to coal tar investigations, an FFD probe equipped with wavelength filters (475-nm long pass filter) was attached to a CPT rig for surveying an area at a MGP (USEPA 2003). Eighteen borings were pushed with a target depth of approximately 6 m (18 ft). Data from the probe indicated generalized contamination across the area of investigation from 0 to 3 m (0 to 8 ft) bgs, with 4 of the 18 boreholes indicating high readings. A downhole camera (videocone) was pushed next to these 4 holes and droplets of contamination were observed in the window. Although the filter is designed to block the primary wavelengths of the lighter PAHs, it is not clear in the report whether the material detected was heavy tars or lighter oils or both.
In-Situ Camera
As deployed in a CPT rig, the in-situ camera probe (e.g., GeoVis, videocone) produces visual images of subsurface soils. The images are collected in real time as the CPT probe is advanced into the subsurface.
How It Works: Like the LIF, these devices use a sapphire window flush mounted to a direct push probe. A white light emitting diode illuminates the soil, and a visual image is reflected on a mirror and recorded by a camera within the probe. The camera sends a video signal to a closed captioning device located in the CPT rig. This device takes depth information from the CPT computer and encodes it into the video signal. From the captioning device the signal is sent to an X-Y reference scale generator. In the standard configuration, GeoVis images have an area of approximately 2 by 3 mm. Objects as small as 10 :m can be resolved. In-situ cameras allow site investigators to see real conditions in the subsurface and make visual identifications of non-aqueous liquids.
DNAPL Uses: Cameras, such as GeoVis, provide an opportunity to directly view NAPLs in the subsurface. Since it is driven directly behind a penetrometer cone, the image can be correlated with soil matrices as well as depth. It also allows a visual evaluation of the stratigraphy as it is pushed into the subsurface. This evaluation might help identify preferential pathways for contaminant migration. Note, however, that the optimum pushing speed of some cameras may be slower than that required for a CPT run, which would preclude the CPT and the camera from acquiring data at the same time.
Drawbacks: In-situ cameras have the same subsurface penetration restrictions as the CPT. The area viewed is extremely small. Clear fluids may not be resolvable. Concentration correlations cannot be made.
Figure 5-8. DNAPL Image as Seen Through GeoVis.
Courtesy U.S. Navy
37

Case Study 1: The GeoVis was used as part of a NAPL site investigation at the former Alameda NAS. The investigation took place at an aircraft maintenance area where the contaminants of concern were fuel oils and chlorinated solvents. The local hydrogeology consists of fill and sand overlying bay mud. Groundwater occurs between 2 and 3 m (8 and 10 ft) bgs. A series of 22 pushes to the top of the bay mud, which is approximately 6 m (20 ft) bgs, was made over 2.5 days. The GeoVis successfully profiled the NAPL masses (Figure 5-8). The resulting data were used to optimize the placement of injection and recovery wells for a steam enhanced contaminant recovery system. Following the treatment, the GeoVis system was used to verify that the NAPL masses were gone.
Case Study 2: A videocone mounted on a CPT rig was deployed at a MGP site. The purpose of the investigation was to test the instrument’s ability to detect residual and free-phase coal tars. Because the optimum push rate for the videocone is one quarter that of a CPT cone penetrometer/LIF, the investigators elected to use the videocone as a confirmation device for the LIF. The videocone was pushed near holes where the LIF data had indicated high contamination. Contaminant globules were observed by the videocone in the intervals that showed high LIF readings, confirming NAPL presence.
Continuous Coring
Most direct push vendors offer continuous coring capabilities. While continuous coring can be done by conventional drilling methods, the DP method is much faster and delivers only the cores with no excess cuttings.
How It Works: Continuous coring by DP (Figure 5-9) is accomplished with a dual tube drive casing. An outer casing bears the force of the driving mechanism while a slightly smaller diameter inner casing is fitted with a sampling barrel that contains a set of 7 to 15-cm (3 to 6-in) long metal sampling sleeves or one 0.5 to 1-m (2 to 3-ft) long clear plastic liner. As the outer casing is driven or vibrated into the ground, soil is forced up into the sampling barrel. When the casing has been driven the length of the barrel, the inner casing is pulled to the surface, the full sampling barrel is replaced with a new one, and the process is repeated.
The sample sleeves are extruded by the geologist for testing and logging. When clear plastic is used, the samples can be examined quickly for the presence of staining or potential preferential transport pathways. To make maximum use of this system to locate DNAPLs, the project should have a quick scanning device such as a photoionization detector (PID) or organic vapor analyzer (OVA) to locate potential hot spots in the cores and a portable gas chromatograph (GC) to identify and quantitate them. The GC can be run as a screening device using a single column and short run times, or to provide high quality data using two columns with different packings, longer run times, and an increased number of calibration and quality control (QC) samples. Depending upon the subsurface matrix, most DP rigs are capable of driving the casing to 30 m (100 ft) (CPTs
Figure 5-9. Dual Tube Direct Push Rig.
Courtesy Precision Sampling
38

can probably go deeper). A single rig can core 30 to 61 m (100 to 200 ft) per day, and a GC in screening mode can analyze up to 40 samples per day. Though not specifically designed for it, groundwater samples may be taken in the inner casing with a bailer or pump. DP vendors generally charge a flat daily rate as opposed to drilling rigs, and do not charge for setups.
DNAPL Uses: Continuous coring DP equipment provides high quality lithology descriptions and allows for the identification of small changes in the soil matrix that could serve as preferential transport pathways. By allowing both visual and chemical scanning of the soil core, hot spots can be readily identified. The GC provides real-time data that may be used to guide the investigation. Cores suspected of containing residual DNAPL can be tested with dye shake tests. DP rigs are generally less expensive than CPT or conventional drilling equipment. They are also faster than conventional drilling equipment and some are configured with angle pushing capabilities.
Drawbacks: The equipment is depth limited and may experience problems in penetrating gravelly soil or hardpan. If the entire core needs to be examined, and metal, as opposed to plastic sleeves, are used, an extra crew member is required to extract the soil from them. The GC can only identify and quantitate chemicals that have been specifically calibrated for it. Hence, if the mixture is unknown, the GC may identify some of the chemicals but not others. Water samples taken through the drive casing tend to be turbid. However, turbidity should not be a problem for VOC or semivolatile organic compound (SVOC) analysis.
By repeatedly taking groundwater
concentrations, investigators were
to their residual phase DNAPL
the investigation.
transect samples and comparing the
able to trace the plumes upgradient
source areas, neither of which were in areas that were the initial focus of
Case Study 1: A Triad like investigation approach using dual-tube direct push methods was used to locate two TCE DNAPL masses at the Marine Corps Air Station in Tustin, California. The site encompassed drum storage areas, a warehouse, and an armory. The general subsurface geology at the base consists of interbedded silty sand and clay with groundwater occurring at approximately 2 m (7 ft) bgs. The near subsurface contains from top to bottom a 4 to 6-m (15 to 20-ft) layer of clay and silty clay, overlying a 1 to 2-m (3 to 7-ft) silty to clayey sand, overlying a 1 to 1.5-m (3 to 5-ft) clay, overlying a 1 to 1.5-m (3 to 5 ft) silty sand. In the initial
phase of the sampling, continuous cores were taken into the first permeable zone and were logged and screened by OVA. Candidate samples from the screening were sent for GC analysis at an onsite laboratory. Groundwater samples were also taken in each core hole and analyzed by the onsite GC. The technique allowed for complete delineation of two TCE groundwater plumes on the site with one being approximately 38-m (125-ft) wide and 122-m (400-ft) long and the other being 46 to 91-m (150 to 300-ft) wide and 457-m (1,500-ft) long. By repeatedly taking groundwater transect samples and comparing the concentrations, investigators were able to trace the plumes upgradient to their DNAPL source areas, neither of which, it turned out, were in the drum storage areas that were the initial focus of the investigation. Deeper sampling was subsequently performed to the second and third permeable layers to determine if they were contaminated. The larger plume extended to the second permeable zone indicating that DNAPL had penetrated through the second clay layer. The groundwater vertical gradient at this part of the base was up. As expected, the plumes were limited to the permeable zones with very little lateral transport of the TCE in the clay.
The project laboratory employed two portable GCs that were capable of analyzing up to 70 samples per day. They had detection limits for TCE of 5 µg/l in water and 25 to 50 µg/kg in soil. The DP rig could push seven 6 to 8-m (20 to 25-ft) deep holes per day that included continuous coring and groundwater sampling.
39

Case Study 2: A NAPL was the target of a site investigation at a closed refinery in Wyoming. The NAPL originated from the disposal of waste products from a coking operation and contained LNAPL oils, DNAPL tars, and a neutrally buoyant mixture of the two. The subsurface consists of a 5-m (16-ft) thick sand/fine sand alluvial/fluvial deposition overlying a competent sandstone bedrock. Groundwater occurred at 0.5 to 1 m (2 to 3 ft) bgs. The investigation found that the material was moving within a permeable paleochannel towards a nearby river. By using a Geoprobe® equipped with continuous coring capabilities, the NAPL masses, which occupied the entire unconsolidated soil column between the top of the water table and the bedrock, were vertically and laterally delineated.
Case Study 3. A preliminary assessment/site inspection (PA/SI) at the Callaway Drum Recycling site was conducted in 2001 using a Triad like approach. Systematic planning was used to develop a dynamic work plan that allowed field changes to be made based on data obtained from onsite analytical equipment. The approximately 11.5-acre site reconditioned drums for resale. Drum contents, if any, were disposed directly to the ground. The site is underlain by a 15 to 18-m (50 to 60-ft) thick surficial aquifer of quartz sands and clays overlying a 30-m (100-ft) thick intermediate system of discontinuous sand, limestone, and dolomite beds. Semi-confining clay layers separate the intermediate aquifer from the surficial aquifer and the underlying regional aquifer (Floridan).
The investigation was conducted by taking continuous soil cores to groundwater (1 to 3 m or 4 to 9 ft bgs) with a DPT rig. The cores were scanned using a total vapor analyzer and subsamples were taken for Color Tec analysis. At each borehole, a groundwater sample was also taken and analyzed by the Color Tec method. Altogether, 17 holes were pushed. Based on the screening results, 12 soil samples were sent to an offsite laboratory. The screening results from the 17 holes were used to located 4 permanent direct push installed monitoring wells. Since this was a preliminary assessment/site inspection (PA/SI), actually locating source zones was not a goal.
The Color Tec method combines the use of colorimetric gas detector tubes with sample purging to detect very low (ppb-range) concentrations of chlorinated compounds in groundwater and soil samples. Groundwater (or a soil and water mixture) is placed in a standard 40 ml volatile organic analysis (VOA) vial, leaving approximately 30 percent of headspace, and capped. After heating the sample to 40o C, a manual vacuum pump, two hollow needles, and Tygon® tubing are used to purge the contaminant vapors from the sample and send the vapor through the colorimetric gas detector tube. The tips of the needles are positioned so that one is in the headspace and the other is submerged at the bottom of the vial. As air passes from the headspace through one needle, ambient air is drawn into the bottom of the vial through the other needle.
Case Study 4: Three areas of contamination were investigated at Hanscom Air Force Base using a Triad like approach. One area was used for fire training where waste oils and solvents, flammables, aircraft wreckage, and fuselages were burned. The other two areas are sites where drums containing waste solvents, fuels, and paints were buried. The general stratigraphy consists of a 0 to 15-m (0 to 50ft) thick lacustrine sand that overlies a discontinuous semi-confining lacustrine silt and clay, followed by a sandy glacial till and a coarse sand and gravel outwash deposit. Bedrock is fractured and is generally granitic in nature. Before development, much of the area was swampy, and sandy fill was brought in to allow for development. Groundwater in the areas of concern is generally shallow.
A Geoprobe® DP rig was used to take continuous cores in 1-m (4-ft) long plastic sleeves. Small slits were made in the plastic sleeve at 30-cm (1-ft) intervals or where visual observation indicated a better sampling location, and the thermal desorption sampling probe head of a MS was placed over each hole. This instrument provided an analysis of the sample within 30 seconds and was used for screening
40

purposes. To ensure proper identity, 3 ions per compound were monitored. For each borehole, the core area producing the highest contaminant concentrations was subsampled and analyzed using a purge and trap extraction process coupled with a GC/MS. Over 600 samples were screened during the 2-week field work. One soil horizon was found to contain percent levels of PCE.
Case Study 5. The Triad approach was used for a site characterization to support the development of an engineering evaluation/cost analysis (EE/CA) for PCE contamination at the 3-acre Hamilton Road Impact Area in southeast Washington State. The purpose of the investigation was to identify source areas for a previously identified PCE plume. Site stratigraphy consisted of a partially confining silt unit overlying a sand and gravel unit containing varying amounts of silt that in turn overlies a clayey silt aquitard.
A soil gas survey was used to confirm PCE presence in a suspected source zone and to rule out a release scenario from a nearby highway. Stream bed samples were obtained using a 61-cm (24-in) long large bore sampler that is driven into the sediments with a 14-kg (30-lb) slide hammer. These samples were screened using Oil-Red-O dye, a sheen test and a PID. Several preplanned sample locations were taken with subsequent locations chosen based on the results of previous sample analysis. This effort identified a release area in the stream bed. Comparison of screening results with mobile laboratory results indicated that the dye and sheen tests were not effective, while the PID was capable of identifying only high concentration contaminant areas.
To better define the treatment zone, continuous cores from 19 9-m (30-ft) deep Geoprobe® pushes were collected and analyzed by the mobile laboratory. Because of the gravelly nature of the subsurface, the pushes took much longer than usual and the cores were very disturbed. Subsampling of the cores for analysis was done by visual inspection of the core material. Also, two to five discrete groundwater samples were taken at various depths from each of the push locations. An evaluation of the results from these pushes indicated that soil sample contamination fell dramatically as the investigation moved away from the source area. As a result of this evaluation, pushes taken to better delineate the plume were confined to water sampling only, which saved time.
A hollow stem auger (HSA) rig was used to facilitate the taking of discrete HydroPunch® groundwater samples from the 9 to 15 m (30 to 50 ft) bgs range that was unaccessible by the Geoprobe® rig. The HSA rig was also used to set monitoring and potential recovery wells. The locations of these sampling/monitoring well points were determined by evaluating the previously obtained field data.
Case Study 6: A site characterization using a Triad approach was performed at a former dry cleaners in Temple Terrace, Florida. PCE was present in the groundwater at concentrations up to 4.9 mg/L. Stratigraphy at the site consists of an approximately 7-m (22-ft) thick fine-grained sand that overlies an approximately 1.2-m (4-ft) thick clay. Beneath the clay layer are interbedded sandy clay, clay, and weathered limestone. The depth to groundwater is approximately 6 m (20 ft).
The contaminant characterization was carried out using a vibra-push DP rig with continuous soil coring. Groundwater samples were taken at discrete intervals within each borehole. Soil cores were screened by FID/PID instruments and selected samples were analyzed with an onsite GC. A 128-m (420-ft) groundwater plume was delineated by the DP rig with monitoring wells installed by hollow stem auger. Based on the results of the field investigation, a source removal action was executed whereby contaminated soil was excavated and screened with the onsite GC. Contaminated soil was placed on plastic sheeting and an ex-situ soil vapor extraction system was constructed. Contaminated groundwater was recovered using a box trench style system. PCE contamination levels in the groundwater have fallen significantly following the source removal.
41

In-Situ Water Groundwater Sampling
BAT®
The BAT® system is a direct push probe that can be used for taking discrete groundwater samples and determining insitu pore pressures.
How It Works: The probe (Figure 5-10) consists of a tip and housing, the top of which is sealed with a disc containing a flexible septum. The tip can be constructed of porous high density polyethylene (HDPE) that allows water to enter the body when put under vacuum. The tip also can be constructed of stainless steel. The stainless steel tip is driven to the desired sampling depth, and the body of the sampler is retracted to expose a stainless steel screen that allows water to enter the sample housing. A tool containing an evacuated sample vial (35 to 500 ml) with a septum cap and a double ended hypodermic needle is lowered down the push rod. When the tool encounters the sample housing, the needle penetrates the housing septum at the same time it penetrates the vial septum allowing water to enter the vial. When the vial is full, the tool is retrieved, and the vial is stored for subsequent analysis. The advantage of the porous HDPE filter tip is that it yields a sample with low turbidity.
Figure 5-10. BAT® In Situ Groundwater Sampler.
Courtesy of Stratigraphics, Inc
DNAPL Uses: The BAT® system is used to take very discrete groundwater samples at multiple depths in a single push. It can be used to profile a contaminant plume of dissolved DNAPL constituents. By comparing concentrations, it can potentially locate the depth at which a DNAPL mass may be concentrated. It does not require pumping equipment to function.
Drawbacks: The system does not identify stratigraphy, so the sampling profile points need to be identified by a separate technique. The sampling time may be longer than other techniques if large volumes of water are needed.
Small Diameter Telescoping Screen
The small diameter telescoping screen (e.g., HydroPunch®) is a direct push tool that can be used to take depth discrete groundwater samples. It may be deployed using CPT, direct push, or hollow stem auger rigs.
How It Works: The small diameter telescoping screen probe consists of a cone drive point attached to a short screen that fits into a drive rod. The rod is driven to the desired sampling depth and retracted slightly, exposing the screen. Groundwater then flows into the rod where it is sampled by a bailer, peristaltic pump, or a small diameter 2.5-cm (1-in) bladder pump. In some designs, if samples from a greater depth are required, the rod is pushed forward where it reconnects with the drive point and advances the sampler. A variation of this method is the HydroPunch® II (Figure 5-11). The HydroPunch® II can be operated as depicted above or can be equipped with an internal double ball valve
42

bailer-like device. The drive rod is retracted and water enters the screen. Under hydrostatic pressure it moves up through the bottom ball valve and fills the sample container. The probe is then withdrawn to retrieve the captured sample. The top valve prevents water from entering the chamber, and the bottom valve prevents its exit. The sample chambers typically contain a liter of water. To function as designed, the top of the sample chamber must be below the surface of the water table.
DNAPL Uses: The device can be used to provide a vertical profile of groundwater quality. Since it has a screen, it may yield less turbid samples than those taken in an open hole. It may be helpful in locating DNAPLs by profiling their dissolved chemical phase and following the high concentration layer back to the source. It is used most profitably after the subsurface geology has been characterized and preferential flow paths have been defined.
rather drill to the appropriate depth and then drive the tool just ahead of the augers.
To avoid damaging the tool, the driller may not want to drive it from the surface but
Drawbacks: The small diameter telescoping screen probe does not provide stratigraphic information, so preferential flow pathways need to be pre-defined. Due to imperfect sealing between the drive point and the drive rod, a purge step may be required after the first sample is taken.
Figure 5-11. Hydropunch®
II Sampler.
Environmental Protection Courtesy of New Jersey Department of
Case Study 1: Dissolved chlorinated solvents were discovered in a municipal water supply well. The subsurface stratigraphy consists of fill overlying sand and silty sand with local gravelly layers. Groundwater occurs at 10 to 13 m (35 to 45 ft) bgs and bedrock at 21 to 26 m (70 to 85 ft) bgs. During a 13-day dynamic field program, 10 CPT soundings were completed to estimate stratigraphy and determine where groundwater samples should be taken. Fifty-two groundwater samples were taken with a telescoping screen probe and analyzed using GC/MS in an onsite laboratory. The groundwater sampling enabled the investigators to define the vertical and horizontal extent of the plume and trace the contamination back to its source (a dry cleaning facility). Investigators performed a soil gas survey at the suspected source area to further refine that area after completing the initial groundwater investigation.
Case Study 2: A HydroPunch® II was employed in a DNAPL investigation at the Ciba Specialty Chemicals site in Toms River, New Jersey (Ciba 1998). A truck mounted rig equipped with 12-cm (4.75-in) ID hollow stem augers was used to advance the probe. The appropriate depth for the water sample to be taken was determined with separate borings. After choosing the appropriate depths, a hole was augered to that depth and the HydroPunch® II sampler was attached to the drill rods and lowered to the bottom of the hole. The sampler was then driven 1 m (3 ft) into the undisturbed soils. The body of the sampler was retracted approximately 30 cm (1 ft) to allow water to enter the screen. Thirty minutes was allowed for the sampler to fill. After retrieval of the groundwater sample, sample jars for volatiles were filled first and the remainder of the water was poured into bottles designated for SVOC and sulfate analysis. The procedure was repeated two more times at progressively deeper depths to obtain sufficient water for the required analyses. Chemicals of concern include chlorobenzenes and PCE.
43

The hydrogeology of the site that is relevant to this case study has a coarse to fine sand with occasional lenses of gravel or silt rich sand overlying an undulating clay that dips to the southeast. The clay unit which occurs at 6 to 12 m (20 to 40 ft ) bgs and is not continuous across the site supports a perched aquifer in the sand unit. Underlying the clay unit is the main aquifer of concern. Groundwater samples were taken by the HydroPunch® II sampler at the top of the main aquifer and at its base. Depth to groundwater ranges from 5 to 9 m (16 to 30 ft) bgs. The data obtained from the sampling supplemented and supported previous investigation data that showed either no NAPL likely at a potential source area (5 sites) or NAPL presence is probable (6 sites). The total evaluation included soil sample data as well as groundwater data.
SimulProbe®
The SimulProbe® is a depth-discrete groundwater sampling device that is unique in that it also allows taking a soil core at the point where the water is sampled. When used in the vadose zone, it allows a soil gas sample and soil core to be taken at the same depth and time.
How It Works: The SimulProbe® can be used as either a direct push instrument or lowered by wireline down the annulus of a conventional rig rod where it is driven in front of the auger. The latter deployment allows for a much greater depth capability than the direct push mode. In the groundwater sampling mode, the probe consists of a 46-cm (18-in) soil core barrel (split spoon type with sample sleeves) with a sliding drive cone. The probe is driven to the target sampling area and retracted slightly. This retraction trips latches on the cone and releases it. The probe is then driven into the target zone, and the cone is pushed by soil up into the soil core barrel. When the barrel is filled, a retraction of the probe exposes a 10-cm (4in) double filter wire mesh screen that completely encircles the core barrel. The screen chamber is connected to a reed valve on a sample canister by two Teflon tubes. The canister is under high positive pressure with nitrogen or helium gas. The pressurized canister prevents water from entering the canister until the pressure is released by the operator at the surface. When the pressure is released, the water flows into the canister. After the sampling is complete, the canister is repressurized to prevent any other water from entering it on the trip to the surface. The probe is available in 1-cm (2.5-in) and 32-mm (1.25-in) core diameters. The water canister for the 1-cm (2.5-in) diameter probe is 2 L with stacking capabilities and is 0.3 to 1 L with no stacking capabilities for the 32-mm (1.25-in) diameter model.
® is capable of taking groundwater and soil The SimulProbe
sample at identical depths at the same time.
DNAPL Uses: The probe provides for depth-discrete sampling of groundwater with very good assurance that the water sampled comes from the depth it was taken. Unless completely surrounded and immersed in a mobile DNAPL mass, it is unlikely that DNAPL itself can be captured by this device. By providing an accompanying soil core to match the water sample, much more information is obtained for data evaluation.
Drawbacks: If the sampling is performed in the direct push mode, it is done blind so it may be necessary to take continuous cores with a separate instrument before deciding where to take water samples with the SimulProbe®. The probe is most useful for detecting the dissolved phase of a DNAPL chemical, not the DNAPL mass itself. The vendor should be consulted before deciding to use this probe to determine if it would best be deployed as part of a DP rig or in conjunction with a conventional rig at the site being considered. The tool is not a continuous sampler and must be brought to the surface for decontamination and resetting between samples.
44

Waterloo Profiler®
The Waterloo Profiler® is a depth-discrete groundwater sampling device for use with direct push technology. The device enables investigators to perform vertical profiling which is a determination of the groundwater contaminant concentrations at multiple depths.
How It Works: The Profiler® has a series of small, screened, stainless steel ports that are distributed in a circle just above its drive tip (Figure 5-12). Water can freely enter and exit these ports. The ports attach to a central collection point that is linked to the surface with either stainless steel or polytetrafluoroethene tubing. Since the screens are open to the formation, clean water from the surface is pumped through them to prevent clogging as they are advanced into the formation. When the pre-selected sampling depth is reached, the pumping is reversed and water is brought to the surface. A purge step is necessary to ensure formation water is being sampled. Only a minimum amount of water is introduced to the formation, and the down hole pumping has the added advantage of purging contaminated water from the tubing back into the formation which minimizes the potential for cross contamination of the aquifer as the probe is driven deeper. Measurements of the back pressure on the water pumped into the formation provides information on the formation matrix (e.g., low back pressure in sand and high back pressure in clay). The back pressure information can be useful in determining where to sample next. The Profiler® is equipped with a knock-out tip that allows the hole to be pressure-grouted as the probe is withdrawn from the formation.
The Profiler® is usually set up to sample groundwater at depths up to 8 m (25 ft) using a peristaltic pump. To minimize potential volatile organic losses from the vacuum pumping technique, the sample vials are placed in front of the pump in a specially designed bottle holder. However, there may still be some negative bias in the sample results. For sample depths greater than 8 m (25 ft) or for projects in which even a little sample bias is undesirable, the system can be reconfigured to accommodate a different pumping system, such as a double valve pump.
Figure 5-12. Waterloo Profiler® .
Courtesy of Precision Sampling, Inc.
In coarse-grained materials, samples can be taken in less than ten minutes. However, in finer grained materials, such as fine- to medium-grained sand, 20 to 30 minutes should be allocated per sample interval. Silt and clay can be sampled, but the time required to take them may make the method economically unfeasible.
DNAPL Uses: The method can be used to sample groundwater in thin lenses that might be conduits for DNAPL flow and high-concentration dissolved-phase chemicals. It also can be used to provide a vertical profile of groundwater quality that can be used to look for DNAPL source areas by comparing dissolved phase concentrations.
Drawbacks: At highly contaminated sites, there is some evidence (Pitkin et al., 1999) of contaminant drag down that might overestimate the thickness of a contaminant concentration. The method is limited to the depth that the Profiler® can be driven at a site (generally less than 30 m or 100 ft). It may not be suitable for sampling fine grained materials.
45

Case Study 1: In preparation for placing a permeable reaction barrier, a supplemental groundwater investigation was conducted at an Alameda NAS site. The site had several previously installed wells with 3-m (10-ft) screens. The groundwater intercepted by some of these wells contained elevated chlorinated organic compound contamination. The supplemental investigation was carried out using a direct push soil sampler (Enviro-Core™) and the Waterloo Profiler® for taking discrete level groundwater samples. Three transects were placed perpendicular to the groundwater flow. Although the first saturated zone is described as a fairly homogeneous sand, groundwater samples taken by the Waterloo Profiler® and analyzed onsite by gas chromatograph/mass spectrometer (GC/MS) revealed a complex plume geometry with a concentrated core. The concentrated core probably indicates the presence of residual DNAPLs at former waste pits. The failure to find high concentrations of dissolved phase solvents in the sand along the base of the bay mud has been interpreted to mean that the DNAPL mass did not penetrate to the bay mud (Precision Sampling Inc. 2000).
Case Study 2: Guilbeau (1999) characterized potential DNAPL masses at three sites known to have had either PCE or TCE releases with attendant dissolved phase plumes. These plumes were believed to have residual source areas in the saturated zone that were not related to pooling on an aquitard. The stratigraphy of the three sites consisted of a 10-m (33-ft) thick braided glacio-fluvial sand (Ontario); a stratified sand and gravel valley fill of glacio-fluvial origin (New Hampshire); and a beach sand and bioclast aquifer with a 5 to15-cm (2 to 6-in) thick continuous clay layer at 9 m (27 ft) bgs. Water and soil samples were analyzed at three sites for PCE, TCE, DCE, and vinyl chloride by an onsite laboratory using a GC equipped with FID/PID and dry electrolytic conductivity detector. A portion of the samples were shipped to an offsite laboratory for analysis. Samples were taken on transects downgradient from known source areas.
At the Ontario site vertical measurements/samples were taken every 15 cm (6 in). The results indicated stratified sources ranging in thickness from 0.3 to 1 m (1 to 3 ft). These sources were not observed to be as wide as the downgradient plume. Eight localized maxima areas were identified with concentrations ranging from 1 to 15 percent of the solubility of PCE.
A total of 257 water samples were taken across a downgradient transect at the New Hampshire site. Sampling intervals ranged from 15 cm (6 in) to 75 cm (30 in). Concentrations of PCE ranged from nondetect to 62 percent of solubility. Using the hydrophobic dye method and looking at water concentration data, soil coring done in the suspected source area upgradient from the transect confirmed the presence of DNAPL at the elevations indicated by the Waterloo Profiler®. The shape of the DNAPL sources as indicated from the water data were not thin and elongated, but rather irregular and spread over a large vertical distance.
Three transects were pushed at a Florida site where TCE was the principal contaminant. Significant quantities of cis-1,2-DCE were also found. There was very little TCE located in the more permeable sands overlying the clay unit. Concentrations increased dramatically (>350 mg/l) at the top and bottom of the sand-clay interfaces and continued high for more than 2 m below the clay in a less permeable second sand indicating a residual mass in this area. Concentrations of TCE ranged up to 95 percent of its solubility over small maxima areas.
Membrane Interface Probe
The membrane interface probe (MIP), developed by Geoprobe®, is a sampling device that measures total VOCs extracted from soil and groundwater (Figure 5-13).
How It Works: The MIP consists of a thin permeable membrane impregnated into a stainless steel screen. The screen is mounted flush to the exterior surface of the probe in an opening that allows direct contact with the medium being sampled. When the membrane is heated to between 100 and 120o
46

Celsius, VOCs in soil or groundwater migrate across the membrane and into the probe. Inside the probe, VOCs are transported to an analytical device at the surface by a carrier gas line. The carrier gas is typically nitrogen or helium. Analytical devices used with MIP include photoionization detectors, flame ionization detectors, electron capture detectors, and ion-trap mass spectrometers. Depending on the analytical equipment applied, the MIP can be used to identify DNAPL chemicals present in soil or groundwater at a given point.
DNAPL Uses: The probe has been used to measure volatile organic contaminants to a depth of approximately 50 m (160 ft). Normal operating depth is 18 m (60 ft) (Christy undated). When paired with an electrical conductivity array, these measurements can be compared with changing soil conductivity, which typically reflects grain size variations or presence of contaminants. For DNAPL investigations, it is recommended that less sensitive measurement tools be used to avoid overwhelming the detector. Also, it may be prudent to dilute the sample stream. If specific chemical
Figure 5-13. Membrane Interface Probe. identification is needed, the sample stream can be captured by sample tube (Tenax®, carbon) or routed directly into a Courtesy of Geoprobe® Systems mass spectrometer. Caution should be exercised in the latter configuration since the MS alone cannot be used to measure complex mixtures and is not designed to measure extremely high concentrations. The probe may be used in both saturated and unsaturated conditions.
Drawbacks: As with all direct push devices, MIP is only useful for deployment in unconsolidated matrices.
Case Study 1: Christy (1998) used a direct push probe equipped with an electrical conductivity detector and a MIP to profile a PCE/TCE DNAPL mass/dissolved plume at a site in Europe. The logs revealed that the stratigraphy of the site consists of interbedded sand, silt, and clay with an apparent clay unit at 7 m (22 ft) bgs. Groundwater occurs between 2 and 3 m (6 and 8 ft) bgs. The conductivity probe was used to detail apparent changes in lithology. The MIP was connected to a PID detector at the surface. The interpreted MIP-PID data showed an entry point at the ground surface with increasing concentrations as the probe approached 7 m (22 ft) and decreasing concentrations as it moved into the clay.
Case Study 2. A combination of direct sensing screening, mobile analytical, and conventional sampling tools and methods were used for delineation of a residual DNAPL and dissolved chlorinated solvent plume at the 17-hectare (42-acre) Sherwood NPL site located in Deland, Florida. The work was performed using the dynamic work plan model.
This site had an ongoing pump-and-treat system in place; however, the system’s recovery rates had reached asymptotic levels. The general subsurface geology at the site consists of interbedded sand, silty sand, and some clay with groundwater occurring at approximately 0.3 to 3 m (1 to 10 ft) bgs, depending on surface elevation. Initial information indicated the possibility of the presence of a confining clay unit at approximately 12 m (40 ft) bgs. The delineation of the plume in the suspected source areas was performed using the MIP technology, with confirmatory groundwater sampling performed for correlation and data validation purposes.
47

The delineation on the fringes of the dissolved plume where only low ppb concentrations were expected was performed by direct push groundwater sampling and onsite laboratory analysis utilizing a combination of a screening GC and a GC/MS for performing EPA Method 8260 analysis. The logging and sampling was performed at dynamically selected locations based on a 16-m (50-ft) grid. The data collected in the field were processed in near real time in order to support the decision-making process. The MIP data allowed the project team to perform fast delineation of the extent of medium and high concentrations. The electron capture detector-equipped MIP unit achieved consistent detection of chlorinated hydrocarbons (CHC) at concentrations as low as 7 ppb with no false negatives recorded, based on 15-point confirmatory sampling. The overall correlation coefficient between MIP ECD response and confirmatory analytical data was 56.2 percent, with the coefficient for the low and medium range of the signal reaching 74 percent. MIP’s PID signal was used to supplement the ECD
The MIP identified four distinct areas of residual DNAPL.
Four distinct areas of residual DNAPL and high chlorinated VOC concentrations were identified. The dynamic work plan approach allowed the project team to achieve the highest resolution in the primary areas of concern while efficiently collecting information over the entire site. The high-resolution data set produced by the delineation effort is expected to provide information critical for design and installation of a source treatment system.
Case Study 3: A supplemental DNAPL investigation was conducted in 2001 at the Camp Lejeune Marine Corps Base Site 89. The investigation utilized an electrical conductivity/MIP probe mounted on a Geoprobe® rig. It also included continuous coring by the same rig and an onsite analytical laboratory with a GC/MS. Contaminants of concern were primarily TCE and 1,1,2,2-tetrachloroethane (PCA), although smaller amounts of other chlorinated compounds were present. The subsurface stratigraphy features 1.5 m (5 ft) of fill over a 1 to 3-m (3 to10-ft) thick unit of interbedded sand, silt, and clay underlain by a 0.6 to 2-m (2 to 6-ft) thick confining clay and silt unit. Beneath the confining unit is a calcareous sand with shell and fossil fragments. Groundwater occurs between 0.3 and 1.5 m (1 and 5 ft)
bgs. Sixty-three borings were pushed with the MIP probe, which was
the ionization potentials of Before deploying a MIP/PID
the chemicals of concern and the equipment should be compared.
connected to three detectors (ECD, FID, and PID). The plan was to use the ECD for low level detection and the PID for higher concentrations. FID results were not used. The MIP provided continuous (every 1.5 cm or 0.6 in) readings of total VOCs. After analyzing the results of the MIP, the Geoprobe® was used to take continuous cores at selected points, which were then analyzed by the onsite laboratory to confirm and calibrate the MIP readings. Selected cores were also subjected to a shake test with Sudan IV. A color
change in the dye indicated the presence of DNAPL. Finally, several of the core holes had hydrophobic flexible membranes placed in them (see technology below). Two DNAPL source areas were found by the investigation (Baker Environmental 2001). As a technical note, there was a problem with the PID in identifying the high PCA concentration areas. Prior to the beginning of the field work, the investigators failed to compare the ionization potentials of the chemicals of concern with the ionization potentials of the PID lamp they planned to use. Hence, the 10.2 eV lamp with which the PID was equipped was not strong enough to ionize PCA (ionization potential of 11.1 eV) and was only useful for the TCE portion of the investigation.
Case Study 4. The East Gate Disposal Yard at Fort Lewis, Washington, is the source of a 3963-m(13,000-ft) long and 73-m (240-ft) deep TCE plume that was being remediated by a pump and treatsystem. The Army decided that it might be more cost-effective if the source zone was identified and
48

removed, and a characterization using the Triad approach was undertaken. The disposal yard contains trenches that were filled with drums containing solvents and oils as well as solvents and oils directly disposed of there. The geology beneath the site consists of a recessional glacial outwash of sand and gravel deposits with till layers overlying a finer-grained till/glaciolacustrine deposit that acts as a partial aquitard and which separates the unconfined upper aquifer from the Sea Level Aquifer (about 30 to 61 m or 100 to 200 ft bgs). The depth to water is approximately 3 m (10 ft) bgs.
Because of funding constraints, the investigation was carried out in two phases. During the first phase, aerial photographs, exploratory trenching, an EM-61 survey, soil gas sampling, and drive point groundwater sampling were used to locate NAPL areas. The EM-61 is a time domain electromagnetic survey instrument designed specifically for locating metallic objects–generally at 3 m (10 ft) bgs or less. This instrument was successful in finding drums contained in the trenches. Trenching was utilized to evaluate the type of metallic material measured by the EM-61 survey, and confirmed that many drums with product were present in the vadose zone. The soil gas survey was useful in identifying extremely high values of TCE but was not able to define concentration contours across the site and was abandoned after a short time. Fifty DPT locations were pushed and the groundwater sampled by peristaltic pumps at four depths in each. The groundwater samples were analyzed by an onsite laboratory, and the results identified three major hot spots and one minor one.
A removal action excavated all trenches identified by the aerial and EM-61 surveys. In all, 412 drums had greater than 2.5 cm (1 in) of NAPL in them, and 723 were empty. It is estimated that the removal action accounted for approximately 22,727 kg (50,000 lbs) of TCE.
The objective of the second phase was to obtain volume and stratigraphy information for use in planning a thermal remediation. A suite of tools was identified through the Triad process that included SCAPS LIF, Geoprobe® MIP, resistivity survey, ground penetrating radar (GPR) survey, and continuous sonic coring. The SCAPS LIF was used to obtain a vertical profile of petroleum-related contaminants, and the Geoprobe® MIP was used for vertical profiling of chlorinated solvent concentrations. Both of these instruments had penetration problems when they encountered gravelly areas. Use of the SCAPS was abandoned early, and the Geoprobe® was only used for 30 pushes. The depth of penetration for the GPR survey was limited to approximately 3 m or 10 ft (water table depth) and the resistivity survey did not provide sufficient resolution to identify stratigraphic contacts. A rotosonic drill rig was brought on site to obtain the depth and stratigraphic resolution needed. Cores from the rig were tested using fluorescence, PID, and hydrophobic dyes, and the approximate extent of the NAPL zone was delineated.
Case Study 5: During a RCRA closure of an old photo neutralization pit, chlorinated VOC contamination was discovered in the groundwater. Over the course of two years, an RI and SRI determined that the source of the contamination was upgradient of the pit and that both the overburden and bedrock groundwater were contaminated. Neither of these investigations determined the location or strength of the source(s). A Triad approach was subsequently implemented to ascertain the area of highest contamination and determine the presence or absence of DNAPL.
The stratigraphy at the site consists of a clay and silt unit overlying a fine sand. Sandstone bedrock occurs between 7 and 9 m (23 and 30 ft) bgs. Groundwater is found between 1.5 and 3.7 m (5 and 12 ft) bgs. Initial site characterization with the Triad effort began with deploying passive diffusion bag samplers along the length of selected, existing well screens to gain an initial idea of potential contaminant stratification in the groundwater. The water samples were analyzed onsite with a direct sampling ion trap mass spectrometer (DSITMS). Following evaluation of the diffusion bag sample results, a DP rig with a MIP that was equipped with PID and ECD detectors was deployed. In place of
49

the normal FID detector used with the MIP, sorbent traps were employed. These traps were then analyzed by an onsite DSITMS. The DSITMS provided speciation of the chemicals on the trap and semi-quantitative concentrations. Results from the MIP and DSITMS analysis determined where new areas would be investigated. In addition, the results were also used to determine where collaborative soil samples would be taken using the DP rig for coring and collaborative groundwater samples using the DP rig for temporary well installation. Soil and water samples were analyzed by the onsite DSITMS, which provided quantitative analysis of them. Some samples were sent to an offsite laboratory for analysis.
The investigation determined that there were several small sources that appeared to be located within the first 4 m (13 ft) of the overburden. DNAPL pooling was not found, or indicated by concentration values.
Hydrophobic Dye Testing
This test uses a hydrophobic dye to determine the presence of DNAPLs in ex-situ soil samples suspected of DNAPL contamination based either on OVA screening results or on MIP results that show high concentrations of total VOCs in subsurface soils.
How It Works: The technique is designed to work with other analytical technologies. The sample is placed in a sample jar and a suitable dye is introduced (e.g., Sudan IV, Oil Red O). The jar is capped and vigorously shaken. A bright red coloration appears in the presence of DNAPL.
the presence of DNAPL. A color change confirms
DNAPL Uses: If the DNAPL is not clearly visible, most chemical analyses will provide the data necessary to calculate the potential presence of a DNAPL, not its actual presence. With this technique, a color change confirms the presence of DNAPL. Conversely, no color change is not necessarily proof there is no DNAPL in the soil sample or the soil horizon from which it was taken.
Drawbacks: Sample handling during extraction of the core sample from the formation may affect results (e.g., draining while being brought to the surface). Poor mixing with clayey soil may mask DNAPL presence.
Case Study 1: A dye shake test was used as part of the supplemental DNAPL investigation conducted at the Camp Lejeune Marine Corps Base Site 89 in 2001 (Case Study 3 page 48). Samples were chosen from Geoprobe® cores according to either visual observation or readings from an organic vapor analyzer equipped with a PID. Fifteen samples were subjected to the test. Four of these tested positive for DNAPL. Table 5-2 shows PID values, dye results, type of soil tested, and information on where in the sampling device the soil sample was located. Of interest is the fact that two of the positive hits were clayey silts, and the sand and gravel hits both had fine-matrix materials below them in the sampler. Also, one of the clay samples where DNAPL was observed inside the sampler sleeve did not test positive with the dye shake. While there does appear to be a correlation between a positive dye test and a saturated PID reading, there does not appear to be any correlation between the ppm level found by the PID and the presence of DNAPL when the instrument is not saturated. Although there are a limited number of samples in this study, three cautions can be drawn from it:
• The type of soil matrix and its position in the sampler may influence the outcome of the test. • It is prudent to test all soil samples that have high PID readings. Jar headspace readings with a PID
that are greater than 100 ppm have been suggested to indicate the potential for a NAPL (Ciba 1998; Watkins et al., 1995).
• The test is subject to false negatives.
50
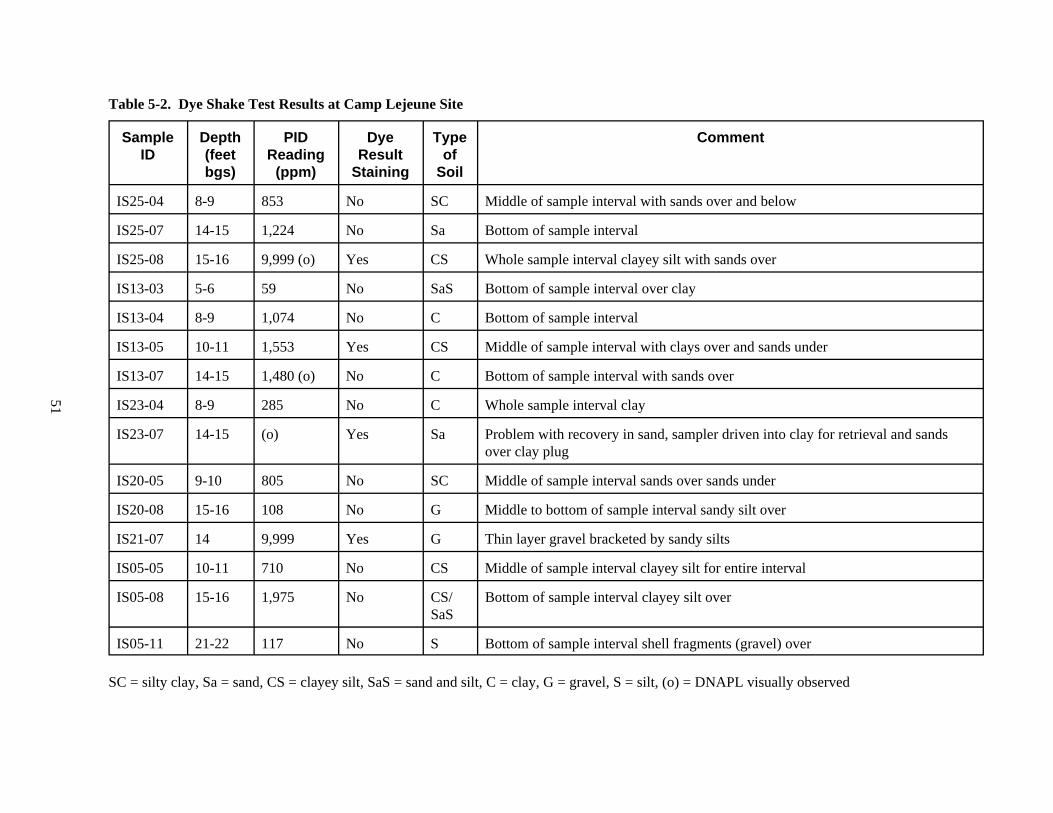
51
Table 5-2. Dye Shake Test Results at Camp Lejeune Site
SampleID
Depth(feetbgs)
PIDReading
(ppm)
DyeResult
Staining
Typeof
Soil
Comment
IS25-04 8-9 853 No SC Middle of sample interval with sands over and below
IS25-07 14-15 1,224 No Sa Bottom of sample interval
IS25-08 15-16 9,999 (o) Yes CS Whole sample interval clayey silt with sands over
IS13-03 5-6 59 No SaS Bottom of sample interval over clay
IS13-04 8-9 1,074 No C Bottom of sample interval
IS13-05 10-11 1,553 Yes CS Middle of sample interval with clays over and sands under
IS13-07 14-15 1,480 (o) No C Bottom of sample interval with sands over
IS23-04 8-9 285 No C Whole sample interval clay
IS23-07 14-15 (o) Yes Sa Problem with recovery in sand, sampler driven into clay for retrieval and sandsover clay plug
IS20-05 9-10 805 No SC Middle of sample interval sands over sands under
IS20-08 15-16 108 No G Middle to bottom of sample interval sandy silt over
IS21-07 14 9,999 Yes G Thin layer gravel bracketed by sandy silts
IS05-05 10-11 710 No CS Middle of sample interval clayey silt for entire interval
IS05-08 15-16 1,975 No CS/SaS
Bottom of sample interval clayey silt over
IS05-11 21-22 117 No S Bottom of sample interval shell fragments (gravel) over
SC = silty clay, Sa = sand, CS = clayey silt, SaS = sand and silt, C = clay, G = gravel, S = silt, (o) = DNAPL visually observed
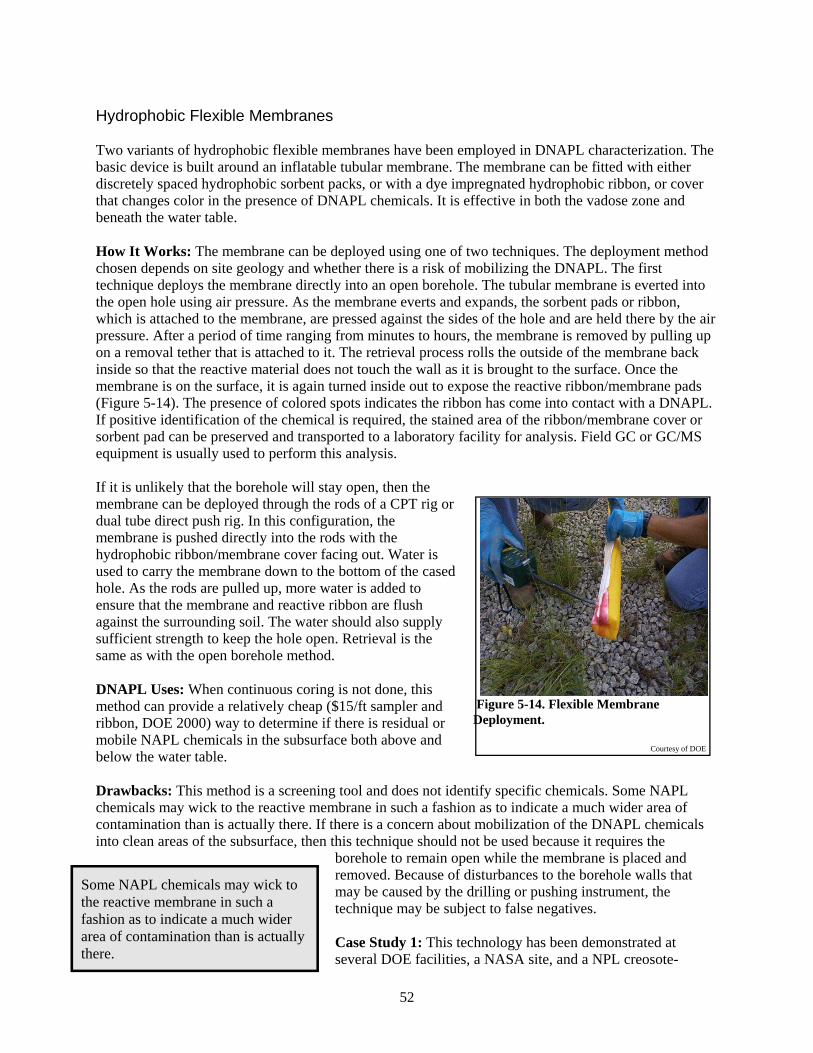
Hydrophobic Flexible Membranes
Two variants of hydrophobic flexible membranes have been employed in DNAPL characterization. The basic device is built around an inflatable tubular membrane. The membrane can be fitted with either discretely spaced hydrophobic sorbent packs, or with a dye impregnated hydrophobic ribbon, or cover that changes color in the presence of DNAPL chemicals. It is effective in both the vadose zone and beneath the water table.
How It Works: The membrane can be deployed using one of two techniques. The deployment method chosen depends on site geology and whether there is a risk of mobilizing the DNAPL. The first technique deploys the membrane directly into an open borehole. The tubular membrane is everted into the open hole using air pressure. As the membrane everts and expands, the sorbent pads or ribbon, which is attached to the membrane, are pressed against the sides of the hole and are held there by the air pressure. After a period of time ranging from minutes to hours, the membrane is removed by pulling up on a removal tether that is attached to it. The retrieval process rolls the outside of the membrane back inside so that the reactive material does not touch the wall as it is brought to the surface. Once the membrane is on the surface, it is again turned inside out to expose the reactive ribbon/membrane pads (Figure 5-14). The presence of colored spots indicates the ribbon has come into contact with a DNAPL. If positive identification of the chemical is required, the stained area of the ribbon/membrane cover or sorbent pad can be preserved and transported to a laboratory facility for analysis. Field GC or GC/MS equipment is usually used to perform this analysis.
If it is unlikely that the borehole will stay open, then the membrane can be deployed through the rods of a CPT rig or dual tube direct push rig. In this configuration, the membrane is pushed directly into the rods with the hydrophobic ribbon/membrane cover facing out. Water is used to carry the membrane down to the bottom of the cased hole. As the rods are pulled up, more water is added to ensure that the membrane and reactive ribbon are flush against the surrounding soil. The water should also supply sufficient strength to keep the hole open. Retrieval is the same as with the open borehole method.
DNAPL Uses: When continuous coring is not done, this method can provide a relatively cheap ($15/ft sampler and ribbon, DOE 2000) way to determine if there is residual or mobile NAPL chemicals in the subsurface both above and below the water table.
Drawbacks: This method is a screening tool and does not identify specific chemicals. Some NAPL chemicals may wick to the reactive membrane in such a fashion as to indicate a much wider area of contamination than is actually there. If there is a concern about mobilization of the DNAPL chemicals into clean areas of the subsurface, then this technique should not be used because it requires the
Deployment. Figure 5-14. Flexible Membrane
Courtesy of DOE
there.
Some NAPL chemicals may wick to the reactive membrane in such a fashion as to indicate a much wider area of contamination than is actually
borehole to remain open while the membrane is placed and removed. Because of disturbances to the borehole walls that may be caused by the drilling or pushing instrument, the technique may be subject to false negatives.
Case Study 1: This technology has been demonstrated at several DOE facilities, a NASA site, and a NPL creosote
52
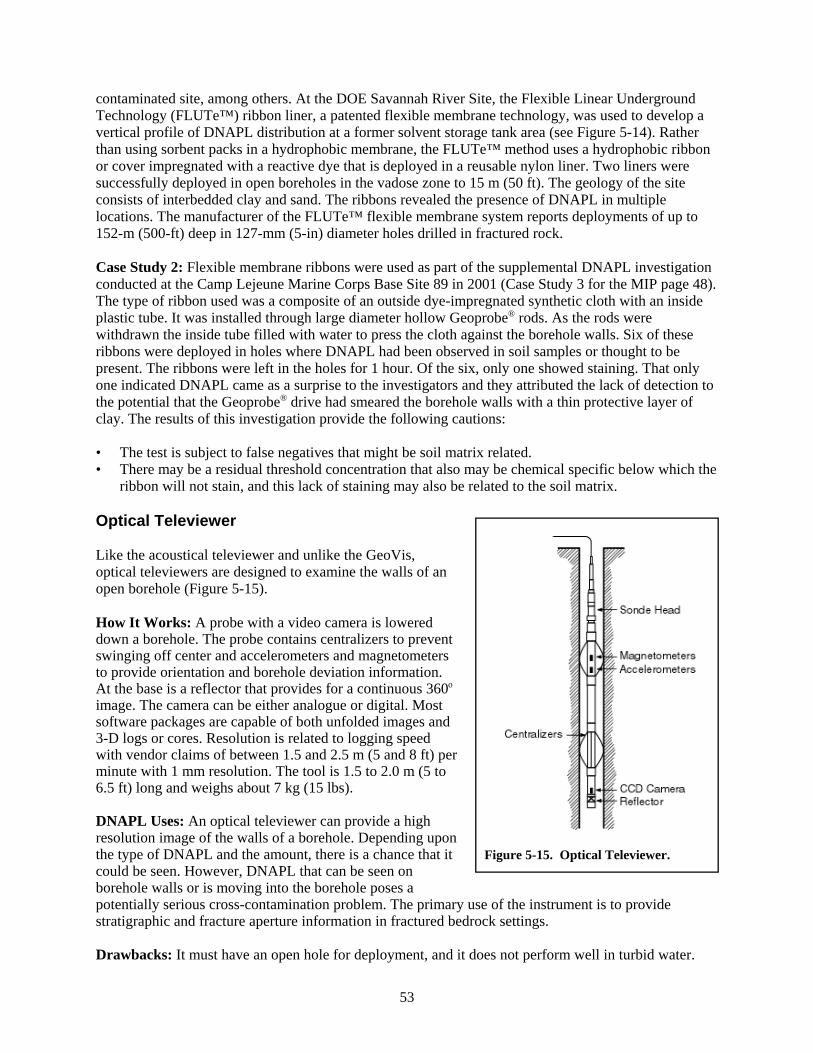
contaminated site, among others. At the DOE Savannah River Site, the Flexible Linear Underground Technology (FLUTe™) ribbon liner, a patented flexible membrane technology, was used to develop a vertical profile of DNAPL distribution at a former solvent storage tank area (see Figure 5-14). Rather than using sorbent packs in a hydrophobic membrane, the FLUTe™ method uses a hydrophobic ribbon or cover impregnated with a reactive dye that is deployed in a reusable nylon liner. Two liners were successfully deployed in open boreholes in the vadose zone to 15 m (50 ft). The geology of the site consists of interbedded clay and sand. The ribbons revealed the presence of DNAPL in multiple locations. The manufacturer of the FLUTe™ flexible membrane system reports deployments of up to 152-m (500-ft) deep in 127-mm (5-in) diameter holes drilled in fractured rock.
Case Study 2: Flexible membrane ribbons were used as part of the supplemental DNAPL investigation conducted at the Camp Lejeune Marine Corps Base Site 89 in 2001 (Case Study 3 for the MIP page 48). The type of ribbon used was a composite of an outside dye-impregnated synthetic cloth with an inside plastic tube. It was installed through large diameter hollow Geoprobe® rods. As the rods were withdrawn the inside tube filled with water to press the cloth against the borehole walls. Six of these ribbons were deployed in holes where DNAPL had been observed in soil samples or thought to be present. The ribbons were left in the holes for 1 hour. Of the six, only one showed staining. That only one indicated DNAPL came as a surprise to the investigators and they attributed the lack of detection to the potential that the Geoprobe® drive had smeared the borehole walls with a thin protective layer of clay. The results of this investigation provide the following cautions:
• The test is subject to false negatives that might be soil matrix related. • There may be a residual threshold concentration that also may be chemical specific below which the
ribbon will not stain, and this lack of staining may also be related to the soil matrix.
Optical Televiewer
Like the acoustical televiewer and unlike the GeoVis, optical televiewers are designed to examine the walls of an open borehole (Figure 5-15).
How It Works: A probe with a video camera is lowered down a borehole. The probe contains centralizers to prevent swinging off center and accelerometers and magnetometers to provide orientation and borehole deviation information. At the base is a reflector that provides for a continuous 360o
image. The camera can be either analogue or digital. Most software packages are capable of both unfolded images and 3-D logs or cores. Resolution is related to logging speed with vendor claims of between 1.5 and 2.5 m (5 and 8 ft) per minute with 1 mm resolution. The tool is 1.5 to 2.0 m (5 to 6.5 ft) long and weighs about 7 kg (15 lbs).
DNAPL Uses: An optical televiewer can provide a high resolution image of the walls of a borehole. Depending upon the type of DNAPL and the amount, there is a chance that it could be seen. However, DNAPL that can be seen on borehole walls or is moving into the borehole poses a potentially serious cross-contamination problem. The primary use of the instrument is to provide stratigraphic and fracture aperture information in fractured bedrock settings.
Figure 5-15. Optical Televiewer.
Drawbacks: It must have an open hole for deployment, and it does not perform well in turbid water.
53

Tracer Testing
The partitioning interwell tracer test (PITT) is an in-situ technique for estimating the volume and percent saturation of DNAPLs in both the vadose and saturated zones.
How It Works: In the vadose zone application, a line of injection wells is drilled on one side of the contaminant mass and a second line of extraction wells is placed on the other side. Tracer gases are introduced into the injection wells and removed from the extraction wells. The partitioning gases are chosen so that they will be slowed down at different rates by the DNAPLs as they move through the soil. Conservative gases are chosen that will be minimally affected by the DNAPLs and hence travel more quickly to the extraction wells. DNAPL volumes can be calculated based on breakthrough curves for the tracers across the well line. The time frame for the actual test is in the range of one week, depending on the geology and distance between wells, but it can be much longer.
The partitioning interwell tracer test
DNAPLs in both the vadose and saturated zones.
is an in-situ technique for estimating the volume and percent saturation of
In the saturated zone application the concept is the same. Partitioning tracer chemicals are chosen that will move, under pumping conditions, through the groundwater and soil matrix relatively easily, but will preferentially and reversibly attach themselves to DNAPLs. Conservative chemicals are chosen that will react minimally with both the natural matrix and the DNAPLs. By using the arrival times of both the partitioning and conservative chemicals in extraction wells the amount of DNAPLs present can be estimated.
DNAPL Uses: PITT can be useful in estimating the expected volume of DNAPL material that is in the subsurface in sand and gravel. It can also be useful in estimating the success of a remedial technology in removing the DNAPL mass. The success measurement requires a before and after application of the tracers and an assurance that the remedial technology did not alter the subsurface properties in a way that affects the movement (retardation) of the tracers.
Drawbacks: The system requires a number of closely spaced injection and extraction wells to achieve adequate resolution. It is not effective in clay and silt and can produce erroneous results in subsurfaces that have numerous fine grained lenses or pronounced preferential flow paths. It does not find DNAPL masses but rather measures their volume after they have been identified by other methods and it is relatively expensive.
Case Study 1: A partitioning interwell tracer test was performed at Site 88, Marine Corps Camp Lejuene, in support of a surfactant-enhanced aquifer remediation of a PCE release (USDoD 1999). Site 88 houses a dry cleaning facility that released PCE to the subsurface over a number of years. A relatively uniform depositional sequence of sediments has been observed in borings across the site. The surficial aquifer consists of fine- to very-fine sand and silt from the surface to a depth of approximately 5 m (18 ft) bgs. The shallow aquifer is bounded below by a silty clay layer that varies in thickness across the area. Depth to groundwater varies from 2 to 3 m (7 to 9 ft) bgs.
The purpose of the test was to verify DNAPL locations prior to the remediation, provide a volume estimate, and verify that the DNAPL was gone after the remediation. The above referenced report is concerned only with the first phase. The test was carried out using three injection, six extraction, and two hydraulic control wells. The tracers chosen were 1-propanol, 1-hexanol, 1-heptanol, and 4-methyl-2-propanol. The deployment required extensive laboratory testing, computer transport/partitioning modeling, and a pre-PITT deployment test. Problems were encountered with malfunctioning multi-sampling ports and clogging of the GC columns by calcium chloride that was added to the injected
54

water/tracer solution to prevent mobilization of fines during pumping. It was estimated that 89 gallons of PCE were pooled on the confining clay in a silty layer. The test took 40 days to complete.
Case Study 2: A vadose zone PITT test was conducted at the Sandia National Laboratories’ Chemical Waste Landfill. It is estimated that 362,872 kg (798,320 lb) of chlorinated solvents and other organic chemicals were disposed of in the unlined disposal areas. The subsurface at the site consists of several hundred feet of a heterogenous sequence of unconsolidated to semi-consolidated cobbles, gravels, very-fine to fine sand, silt, and clay of alluvial and fluvial origin. Groundwater occurs at approximately 149 m (490 ft) bgs. The upper 30 m (100 ft) of the vadose zone beneath the landfill consists primarily of gravelly sand with some silty sand interbeds (Struder et. al., 1996). A soil gas survey indicated that two disposal pits were responsible for the majority of the VOC detected. The principal chemical of concern was TCE.
The PITT test was designed to locate any DNAPL residual in the upper 30 m (100 ft) of the vadose zone. An injection and extraction well were located on opposite sides of the source areas and drilled to 24 m (80 ft) with screened intervals set at 3 to 11 m (10 to 35 ft) bgs, 12 to 18 m (40 to 60) ft bgs, and 20 to 24 m (65 to 80 ft) bgs. Tracers were chosen based on laboratory column studies. The flow between the wells was modeled and a preliminary test using methane as a conservative tracer and difluoromethane as a water partitioning tracer was conducted (Struder et al., 2000). The results of the preliminary test were used to recalibrate the model for the PITT tracers before the PITT test was conducted. Five tracers, two conservative (SF6 and C4F8) and three partitioning (C6F12, C8F16, and C9F18) were used. The tracers were mixed with nitrogen prior to injection. The test took 15 consecutive days and resulted in an estimate of 150 to 680 L of NAPL being present. This estimate was considerably less than what was thought to be contained in the interval tested. Subsequent remediation by SVE recovered approximately 350 L of material.
Soil Gas Profiling
This technique is generally used as a screening method to provide an idea of volatile contaminant distributions in the subsurface soil gas. Ideally, the closer the probe or collection device is to a volatile DNAPL source, the greater the concentration of the vapor phase of the DNAPL chemical.
How It Works: Soil gas samples can be collected actively or passively. In the dynamic method, a hollow probe with a porous tip (machined screen, drilled holes, retractable tip) is advanced to a target depth and a vacuum is applied to draw the soil vapors out. The soil gas may be captured in metal canisters, Tedlar® (polyvinylfluoride) bags, or measured directly off the vacuum pump tube. The choice of collection device depends on the method of analysis. When the samples have to be taken to a mobile laboratory for analysis, a Tedlar® bag is generally chosen. These bags are less expensive to use than canisters and are ideal for short-term storage and analysis. Canisters are preferred when the samples are to be shipped to an offsite laboratory, since they are more durable for handling and storage. Finally, if a portable GC or OVA is used, the instrument can be set up next to the probe, and a sample can be taken by gas-tight syringe directly from the vacuum hose. The depth that can be sampled depends on the probe chosen. For shallow systems, hand driven or hand held vibrators are used. A hand vibrator drive system combined with a portable GC can provide a large number of samples in a short time. Soil gas samples may also be obtained at depth using direct push rigs.
Soil gas surveys can help focus the more expensive deep intrusive sampling.
The other form of soil gas collection is a passive system. In this system a collector is buried in the shallow soil and left for several days to several weeks depending upon the soil type. Although several collector designs exist, they generally fall into two categories. The first consists of an open ended
55

container with a sorbent-coated wire attached to the closed end. The container is buried open end down and the gas inside the container is allowed sufficient time to equilibrate with that in the surrounding soils. The second category has the sorbent contained within a hydrophobic gas permeable bag. The bag is buried and left in the ground for a sufficient time to allow gases to permeate the outer bag and sorb onto the collector. The containers are retrieved and taken to a laboratory for desorption and analysis. The chemical concentrations obtained by this method are not necessarily indicative of what is in the soil gas, since the collectors will sorb until they reach their saturation point. Because it collects and holds the surrounding gases over time, this system can detect much lower concentrations in the soil gas than an active system. Hence, it is possible to obtain soil gas information in fine-grained soils where active systems are not effective.
DNAPL Uses: Soil gas sampling may be used to identify volatile organic hotspots in the subsurface as well as track groundwater plumes back to their sources. It is particularly effective in sandy soils.
Drawbacks: Dynamic soil gas profiling is not effective in clay and pure silt, and if it is deemed necessary to use soil gas at a site with fine grained materials, the passive method should be chosen. Unless the sampling is done behind a dual tube direct push device or the site has been well characterized, the type of soil matrix that is being sampled is unknown. An understanding of the soil matrix is important because the result obtained from a clay lense may be quite different than that obtained from sand 15 cm (6 in) deeper. Finally samples taken in a very heterogenous environment are difficult to interpret and may lead to erroneous conclusions about where the source area is.
56

SECTION 6USE OF GEOPHYSICAL METHODS IN DNAPL INVESTIGATIONS
Section 3 discussed the overall approach that involves constructing a conceptual model and dynamic work plan for evaluating the usefulness of techniques to investigate DNAPLs. This section describes generally available geophysical techniques that might aid in the characterization and remediation of DNAPLs. It provides an overview of the techniques followed by a detailed discussion of six specific geophysical categories with accompanying case histories if available. The categories are: commonly used borehole geophysical instruments, electrical, electromagnetic, ground penetrating radar, magnetics, and seismic. Depending upon the method, different deployment configurations, such as surface to borehole and borehole to borehole may be discussed. In general, none of the methods presented here are new and the instrumentation to conduct them is widely available. More experimental techniques, such as electrical resistivity tomography and electromagnetic offset logging, are discussed in Section 7.
As emphasized in Section 3, before choosing any geophysical method, consideration should be given to the thickness of the units to be mapped and the method’s potential resolution of that thickness at the expected depth. Also, if a geophysical method is being considered for detecting DNAPL, it might be best to try to locate the DNAPL first with an intrusive method and then use the geophysical method to estimate the DNAPL mass areal extent by identifying what the known DNAPL anomaly looks like and then trying to identify it elsewhere. In general, geophysical techniques are most valuable in defining stratigraphic units and preferential pathways rather than the DNAPL mass. Finally geophysical data interpretation requires highly trained and experienced personnel.
Overview
Geophysical methods provide qualitative and quantitative information on subsurface conditions. They can be deployed in a number of ways: purely surface surveys, surface to borehole, borehole to borehole, and single borehole. The various methods are used to measure the physical properties of the subsurface materials, such as conductivity/resistivity, dielectric constant, and density, among others. Changes in these measurements are interpreted to indicate changes in subsurface physical/chemical properties. Geophysical methods do not directly measure the matrix so it is almost always necessary to do intrusive sampling to confirm the interpretation. In fact, for many surface survey methods, an accurate interpretation requires that the geophysical data be matched or calibrated with nearby borehole data. Once calibrated, survey methods can be used to accurately describe large subsurface areas that would be prohibitively expensive to explore directly.
properties are used to interpret
Geophysical methods measure the physical properties of subsurface materials and changes in these
changes in the materials. They do not measure the material itself.
Depending upon the method and deployment, the results obtained with surface geophysical methods can be presented as graphs, in plan view contour maps, 2-D cross-sections of the study area, or in some cases, displayed with 3-D imaging software. Their resolution and accuracy depend on several factors. One factor is the degree of interpolation between measured points used to construct the image. Some geophysical methods, such as ground penetrating radar, produce effectively continuous measurements over a single transect. Other methods, such as seismic reflection measure data with geophones placed at specific points along a transect that require some interpolation. A second factor is depth. For all survey methods, there is a direct trade-off between the required depth of the measurement and the resolution obtained. The deeper the requirement, the poorer the resolution. Another factor that has a significant
57

influence on the resolution of a geophysical technique is the degree of physical property contrast between geological structures or targets in the subsurface. Most geophysical methods measure changes in some physical characteristic of the geology, and if these changes are not distinct, the ability of the instrument to detect them is lessened.
Borehole geophysical methods, such as electrical resistivity or natural gamma logs, provide continuous stratigraphic column information relevant to a specific location or station. Station measurements can be interpreted into a matrix diagram and then interpolated to produce a continuous generalized cross section of the study area. The accuracy and level of detail in such a cross section can be enhanced only by increasing the number of stations or by employing different instrumentation that can be deployed in surface to borehole or borehole to borehole configurations.
Surface to borehole and borehole to borehole tomography are finding increasing use in environmental geophysical applications. These methods can provide 3-D images with depth. The spacing of generators and receivers generally determine the degree of resolution and accuracy obtained.
Geophysical methods may be used for a number of purposes in DNAPL investigations and remediation:
• Geologic characterization, including lithology and thicknesses of strata and the topography of the bedrock surface below unconsolidated material, to assess preferential flow pathways;
• Aquifer characterization, including depth to water table, general water quality, and water bearing fractures;
DNAPL investigations and
Geophysical methods may be used for a number of purposes in
remediation.
• Contaminant plume distribution when a dissolved DNAPL chemical is mixed with other contaminants that have properties that can be distinguished by the geophysical method (e.g., conductive landfill leachate);
• DNAPL mass location when the mass is sufficiently large to cause a resolvable change in the physical characteristics of the host matrix;
• DNAPL mass remediation by steam where the geophysical technique is used to track the movement of the steam front to ensure the area thought to contain the DNAPL is completely immersed; and
• Buried leaking drums or tank locations.
Because many types of geophysical methods are available, selecting the right method requires careful evaluation. Multiple methods should be used during a single investigation to develop separate but complementary results. The choice of appropriate measures depends largely on site-specific geology, the types of subsurface anomalies that are of interest, and the cultural noise present at the site. The U.S. Geological Survey has developed an expert system designed to aid site managers in choosing appropriate geophysical methods (Olhoeft 1992). Table 6.1 presents a qualitative ranking of seven common geophysical methods in the order of their capability to characterize certain subsurface conditions. This table is intended as a general guide. The application ratings given are based upon actual experience at a large number of sites and upon the ability of each method to produce results under general field conditions when compared to other methods applied to the same task. Developing an optimal approach depends on site-specific conditions. For instance, site-specific conditions may dictate the choice of a method rated 2 or 3 in preference to a method rated 1 (Cohen and Mercer 1993). Table 6.2 (below) contains the major characteristics of six geophysical methods that are commonly used at hazardous waste sites.
58

Table 6-1. Geologic Applications of Most Common Surface Geophysical Survey Methods
Application Ground Penetrating
Radar
Electromagnetic
Conductivity (frequency and time domain)
Electrical Resistivity
Seismic Metal Detectors
Magnetometry
Evaluation of Natural Geologic and Hydrologic Conditions
Depth and thickness of soil and rock layers and vertical variations
1a 2 1 1 NA NA
Mapping lateral variations in soil and rock (fractures, karst features, etc.)
1a 1 2 2 (refr.) 1 (refl.)
NA NA
Depth of water table 3 2 1 - NA NA
Notes: 1 = Primary choice under most field conditions a = Shallow 2 = Secondary choice under most field conditions b = Assumes ferrous metals to be present 3 = Limited field application under most field conditions refr. = Refraction NA = Not applicable refl. = Reflection
Source: Cohen and Mercer 1993
Frequently Used Geophysical Borehole Methods
Unless the drilling equipment provides a continuous core as part of its operation (e.g., dual tube air percussion, NX coring for rock, sonic drilling, or dual tube direct push), it is generally financially impractical to continuously core all boreholes drilled at a site. Hence the stratigraphy of most boreholes placed in unconsolidated materials is determined from cuttings brought to the surface during the drilling. Boreholes placed in rock can be examined by acoustic or optical televiewers. For many investigations, this level of detail is adequate. However, the movement of DNAPL through an unconsolidated subsurface can be highly influenced by small changes in the soil matrix. For example, a thin sand lens in an otherwise clayey matrix or a thin clay lens in an otherwise sandy matrix can divert DNAPL flow. Preferential pathways caused by thin lenses are difficult if not impossible to detect in cuttings. However, they can be detected by downhole geophysical methods, and it might be wise to consider their use at sites where DNAPL chemicals are a concern. It is best to consider borehole logging in planning the characterization so that the hole size and/or well construction can accommodate all the desired parameters.
While the primary purpose of using conventional borehole geophysics during a DNAPL investigation is to refine the understanding of the geologic and hydrogeologic setting in which the DNAPL may have been introduced, there are instances where they can indicate the presence of an anomaly that may be caused by a DNAPL in the soil matrix. To detect the potential presence of a DNAPL, the borehole has to be drilled directly through or very close to the contaminated area, and the residual has to be present in sufficient quantities to affect the physical properties of the soil.
DNAPL investigation is to refine understanding of the site geologic
The primary purpose of using borehole geophysics during a
and hydrogeologic setting.
The type of borehole to be logged may place a constraint on the selection of an appropriate geophysical method. The presence of a casing, type of casing, borehole diameter (large enough for the instrument of
59

interest), presence of borehole fluid, and the required radius of measurement affect the choice of method to use. Some tools, such as optical and acoustic televiewers, require centralizers. Each tool will have a
Table 6-2. Characteristics of Surface Geophysical Methods Commonly Used at Hazardous Waste Sites for Evaluating Natural Hydrogeologic Conditions
Method General Continuous Depth of Major Limitations Application Measurements Penetration
Ground Highest Yes Typically less Penetration limited by increasing Penetrating Radar
resolution of any method for
than 9 m (30 ft) to 30 m (100 ft)
clay content, fluid content, and fluid conductivity
profiling and under ideal mapping conditions
EM Conductivity Very rapid Yes To 61 m (200 ft) Affected by cultural features, (Frequency Domain)
profiling and mapping
(to 15 m or 50 ft)
stationary method
including metal fences, pipes, buildings, and vehicles
EM Conductivity (Time Domain)
Soundings Yes To >305 m (1,000 ft stationary
Usually cannot be used to provide measurements shallower than about 3 m (10 ft). Affected by
method) cultural features, including metal fences, pipes, buildings, and vehicles
Electrical Soundings or Yes with No limit, but For most instruments, requires Resistivity profiling and
mapping capacitance
equipment. No commonly used at depths of <91
good ground contact and long electrode arrays; integrates a
with galvanic m (300 ft) large volume of subsurface.
Seismic Profiling and No No limit, but Requires considerable energy for Refraction mapping soil commonly used deeper surveys; sensitive to
and rock to <91 m (300 ft) ground vibrations
Seismic Profiling and No To >305 m Very slow surveying; requires Reflection mapping soil (1,000 ft) extensive data reduction;
and rock sensitive to ground vibrations
Magnetometry Profiling and Yes No limit, but Only applicable in certain rock mapping soil commonly used environments; limited by cultural and rock to <91 m (300 ft) ferrous metal features
Note: Actual results depend on site-specific conditions. In some applications, an alternate method may providebetter results and all potentially applicable techniques should be evaluated before choosing one.Source: Adapted from Cohen and Mercer 1993
specific speed range for movement up or down the hole while recording, and speeds can vary widely depending upon the method used. Commercial vendors typically provide only the data of their log runs; the interpretation is generally left to the client. If the borehole will accommodate them, multiparameter tools that can measure several properties at once can be used to save time and money. Table 6-3 summarizes some methods and constraints.
60

Acoustic Televiewer
The probe used by this method contains a rotating transducer for sending and receiving high frequency acoustic pulses, the electronics for recording these pulses, and devices (they differ by vendor) for maintaining the orientation of the unit. The acoustic pulse is bounced off the borehole wall and the probe creates an acoustic image by measuring the return time and intensity. Computer software can then
Table 6-3. Geophysical Borehole Methods and Constraints
Geophysical Method
Well Casing Type
Minimum Borehole
Diameter (in)
Borehole Fluid
Radius of Measurement
Electrical Uncased 1.5 - 5.5 Conductive Varies from near borehole surface to as much as 4 ft using induced polarization
Electromagnetic Uncased or nonmetallic
2 - 7 Wet or dry Varies from 30 in with induction to yards using radar
Nuclear Uncased or cased
2 - 4.5 Wet or dry 6 - 12 in
Source: EPA 1993b
produce a 3-D image of the borehole wall that may be rotated and evaluated for fracture occurrence and orientation (Figure 6-1). The hole must have liquid in it for the instrument to work. The logging speed for high resolution imaging is 1.5 to 1.8 m (5 to 6 ft) per minute. Acoustic televiewer images, such as the one shown, use false color for better imaging. The tool can only distinguish time and distance not color.
DNAPL Uses: This method, which is an excellent device for examining fracture size and orientation in bedrock, provides information on potential preferential flow paths and adds to the overall accuracy of the conceptual model.
Drawbacks: Cross contamination issues connected with open boreholes exist for DNAPL applications that may complicate the use of this instrument. The method does not identify DNAPLs directly. It does not have as good a resolution as an optical televiewer.
Electromagnetic Induction
The probe used in this method contains a transmitter coil at one end and a receiver coil at the other end. The transmitter coil generates an EM field that creates eddy currents in the earth around the instrument. The receiver coil intercepts both the primary and the secondary EM fields. The measured currents are proportional to the bulk electrical conductivity of the subsurface
Figure 6-1. Acoustic Viewer 3-D Image of Borehole.
Courtesy of Downhole Surveys, Ltd.
61
materials. With EM induction, the distance measured from the borehole is directly related to the distance between the transmitter and the receiver coils and the frequency employed. For a stand- alone borehole instrument, the distance measured is generally on the order of a 76-cm (30-in) radius (USEPA 1993b). The bulk conductivity of a material is a function of its fluid content, the electrical properties of the fluid, and the matrix. In a vadose zone, clays are distinctly more conductive than sand, and depending upon the degree of contamination, contaminated soil may exhibit very different properties than their uncontaminated counterparts. The tool can be used in or out of water and in uncased or plastic cased wells. Many tools require about 20 minutes for the electronics to stabilize prior to recording data.
DNAPL Uses: DNAPLs are generally non-conductive and when present in sufficient quantities can alter the bulk electrical conductivity of the matrix they are in. Although an EM instrument may be able to detect this change, it should not be anticipated that it will, nor should it be the instrument of choice to do so. This method provides a look at the soil matrix around the borehole, not just in it. Also, the method provides some confirmation of the borehole cuttings log which increases the accuracy of the conceptual model.
Drawbacks: Because the radius of measurement is short, the change in expected matrix conditions that may be attributed to the presence of a DNAPL mass needs confirmation by an intrusive method if the borehole does not directly penetrate the mass. These instruments cannot be used in metal cased wells.
Gamma-Gamma Probe
Gamma-gamma probes consist of a gamma source and a shielded detector to measure radiation backscatter and attenuation by the formation. The data gathered by the detector can be used to calculate bulk density, porosity, and moisture content for soil layers as thin as 1 cm (0.4 in). Since the bulk density of soil is a function of grain size, this method can be used to identify changes in the soil matrix. The probe requires special handling and licences because of the active radiation source. It can be used in a dry or fluid filled well that is cased or uncased.
DNAPL Uses: Gamma-gamma is used primarily to verify the stratigraphy used in the site conceptual model.
Drawbacks: Measurements are not reliable in materials containing expansive clays. An accurate measure of formation moisture requires an independent measurement of dry bulk density (i.e., determined on an ex-situ sample).
Natural Gamma Probe
Natural gamma probes measure the total gamma radiation that is given off by formation materials. The radiation is primarily from the decay of potassium-40, uranium-238, and thorium-232. While no soil or rock material has a characteristic level of natural radiation, the different matrices can be differentiated within a borehole by relative activities. For example, clays and shales tend to be much more radioactive than sand and dolomite.
DNAPL Uses: Natural gamma is used primarily to verify the stratigraphy used in the site conceptual model.
Drawbacks: The smaller the diameter of the probe, the higher the signal to noise ratio. Sensitivity is decreased in the presence of materials that may affect the gamma ray energy, such as drilling fluids and casing. A large borehole in relation to the diameter of the probe also may reduce its sensitivity.
62

Neutron Probe
The neutron probe contains a neutron source (usually americium-241/beryllium) and detection devices. The detectors measure the number of neutrons that are backscattered from interactions with hydrogen atoms in the formation wall. Neutron collisions with hydrogen produce a characteristic slowing down or thermalizing of the neutron. These thermalized neutrons are what is counted by the detector. Since most naturally occurring hydrogen in the earth’s crust is associated with water, the count can be directly related to the amount of water in the formation. The effective radius of the probe’s measurement is 15 to 30 cm (6 to12 in).
To obtain moisture values, the probe is lowered into the borehole to the desired depth and a reading is taken. The time taken for each reading determines its precision. The longer the count time, the better the precision. When the count is completed, the probe is moved to the next measurement position. Like gamma-gamma probes, neutron probes require special handling and licences because of the active radiation source.
Neutron probes have been used to detect chlorinated DNAPLs in the formation immediately adjacent to a completed borehole.
DNAPL Uses: Hydrogen is not the only fast neutron moderator. Materials that may affect the accuracy of the measurement and indicate that moisture is present when it is not are boron, cadmium, chlorine, and hydrocarbons among others. Hence, in the vadose zone, when the borehole is in or very close to a DNAPL mass, the apparent moisture content calculated from the probe may be very different from what is
expected. In this situation, the area should be further investigated for the potential presence of DNAPL. This was the case at a remedial action where neutron probe readings changed as chlorinated hydrocarbon mass was withdrawn from the area surrounding the borehole see Newmark, et al., 1998. This method is also used to refine the stratigraphy information for the conceptual site model.
Drawbacks: The effective radius is very short.
Resistivity Probe
Resistivity probes measure the bulk electrical resistance of formation materials to current flow in the immediate area of the borehole walls or an average between the borehole probe and the surface. There are several methods and instruments for measuring resistivity.
The dual laterolog method (also called focused resistivity) provides two resistivity measurements with different radial penetration depths. The probe consists of three electrodes. The central electrode is fed a current of constant intensity. The other two electrodes, located above and below the central one, receive varying intensities of current that are adjusted to achieve a zero voltage potential with the central electrode. The result is a confined current that is restricted to a radial flow outwards. The thickness of the radial flow is determined by the spacing of the two “guard” electrodes. The drop in voltage potential of the radiating current is measured by a remote electrode, which provides deeper penetration into the formation, and by an electrode mounted on the probe, which measures a much shallower penetration. This method is used extensively in oil and gas exploration activities. It should be noted that probes available from vendors are on the order of 9-m (30-ft) long and weigh several hundred pounds. The vertical resolution of these devices is generally greater than 46 to 61 cm (1.5 to 2 ft). Logging speeds of up to 49 m (160 ft) per minute are obtainable.
A variation of the laterolog method is the azimuthal resistivity imager. Developed primarily for oil and gas exploration activities, this device provides a resistive image of the borehole sides. It uses an array of
63

electrodes (corresponding to the central electrode in a normal laterolog) that allows for better vertical resolution (20 cm or 8 in) than the normal laterolog and provides information on fracture spacing and dip as well as resistivity. The probe is over 9 m (30 ft) long and has a maximum logging speed of approximately 9 m (30 ft) per minute.
A normal resistivity probe generally consists of an electrode at the top of the probe that introduces the current, a closely spaced electrode just beneath it to measure total system response, and up to four spaced electrodes along the probe for measuring various distances into the formation. It is generally used to provide a depth profile of water quality as a function of its resistivity. The typical size of these probes ranges from 1 to 3 m (3 to 9 ft).
The single point resistance method can be conducted using a probe with two electrodes that measure the resistance between them as the probe is lowered down the borehole. It also can be conducted by placing an electrode at the surface and lowering a second electrode down the borehole. The method can identify changes in borehole lithology and in water quality. It is useful for fracture detection in crystalline bedrock.
DNAPL Uses: Borehole resistivity is useful in developing a conceptual model of bedrock stratigraphy and potential preferential pathways of DNAPLs.
Drawbacks: The method has a shallow radius of investigation. Readings are affected by borehole diameter and have to be corrected if drilling fluids are used. The borehole cannot be cased and must be filled with water or other conductive fluid for the device to work. The presence of conductive clays in the rock or soil matrix complicates data interpretation.
Spontaneous Potential
The spontaneous potential probe measures the change in voltage that develops at the contacts of different lithologies. An electrode is lowered down the borehole and another electrode is placed in the ground next to the borehole. The potential between these electrodes is measured as the electrode travels through the conductive fluid in the borehole. The spontaneous potential method is used to measure bed thicknesses and can be used to measure water quality. Spontaneous potential also aids in the interpretation of other geophysical logs.
DNAPL Uses: Spontaneous potential is used primarily to reinforce “weight of evidence” for the stratigraphy interpretation used in the site conceptual model. It is not known whether it has any potential for locating anomalies due to DNAPL.
Drawbacks: The instrument should not be used to determine the quality of water containing less than 10,000 mg/l of total dissolved solids. It can only be used in an open borehole containing a conductive fluid (USEPA 1993b).
Combining Commonly Collected Borehole Geophysical Information
Because information gathered from a single borehole geophysical method is generally not conclusive, many investigators employ multiple methods. The geophysicist can compare the results of each method. For example in Figure 6-2, the two main units of concern are clay and silty sand. The natural gamma log indicates a potential clay unit between 61 and 150 cm (2 and 5 ft) bgs. The density and spectral gamma-gamma (SGG) ratio logs support the existence of the clay unit, as uncompacted clays are generally less dense (more porous) than sand, and the conductivity log shows the clay unit to be more conductive than
64

the sand which is also expected. Hence one could conclude, based on the measurement of three different parameters that a clay unit is present. However, if one of the three measurements had been counter indicative (e.g., had indicated results different than expected for a clay), yet another method would be applied to reach a definitive conclusion. In Figure 6-2, the spontaneous potential (SP) log indicates the three different units and a spike that occurs when the probe passes the silty sand to till interface. Also, the magnetics log indicates that the different units have slightly different magnetic properties. The use of multiple methods is particularly common with passive technologies, such as natural gamma, temperature, self potential, and magnetometry.
Figure 6-2. Geophysical Log Using Multiple Methods.
As indicated in the technology descriptions above, some of the downhole geophysical methods are capable of detecting changes in the physical properties of the soil matrix that may have been caused by DNAPLs. The detection of physical property change is particularly useful if the detected change is not expected for the matrix (e.g., a poorly conducting clay), which would alert the investigator to take a more definitive look at the anomalous area. In general, however, conventional downhole methods are not well suited for direct DNAPL investigation because they cover only a limited area of investigation around the borehole, and their ability to specifically identify anomalies caused by DNAPLs is limited. They can be useful in refining the conceptual model with reference to stratigraphy and preferential flow paths and used to corroborate interpretations from surface geophysical methods.
65

Electrical Methods
There are three types of surface electrical methods: direct current (DC) resistivity, complex resistivity, and spontaneous potential. DC methods measure the electrical resistance or conductance of the subsurface by transmission of a current between electrodes placed at, or into, the ground surface. Complex resistivity, in addition to measuring resistivity, also measures the electrochemical response of subsurface materials to an applied current. Complex resistivity is discussed in Section 7. The spontaneous potential technique measures the natural difference in electrical potential between two points. Spontaneous potential is not included in this review.
How It Works: During DC electrical surveys, a current is injected into the earth through a pair of current electrodes, and the potential difference is measured between a pair of potential electrodes. Common arrays include the dipole-dipole, Schlumberger, and Wenner configurations and the choice of which to employ will depend upon the survey target. Electrodes in the Schlumberger and Wenner arrays are generally arranged linearly, whereas the dipole-dipole array can have several configurations (Figure 6-3). The advantage of the dipole-dipole array over the other two is that the distance between the electrode pairs can be increased indefinitely and is limited solely by the sensitivity of the instrument and noise level. The distance between the Wenner and Schlumberger array electrodes is generally limited by cable length availability (Parasnis 1997). The apparent resistivity or conductivity is the calculated bulk average resistivity or conductivity of all soils and rock influencing the flow of current. The volume of earth over which the resistivity is averaged is directly related to the distance between the current electrodes. The wider the spacing, the deeper the probe. Electrical methods measure similar properties as those measured by EM methods, and the units of measurement are the same—ohms per meter (resistivity) or Siemens per meter (conductivity). It should be noted that each type of array will produce a different response to subsurface features.
Figure 6-3. Electrical Resistivity Array Configurations. Adapted from Parasnis 1997.
66
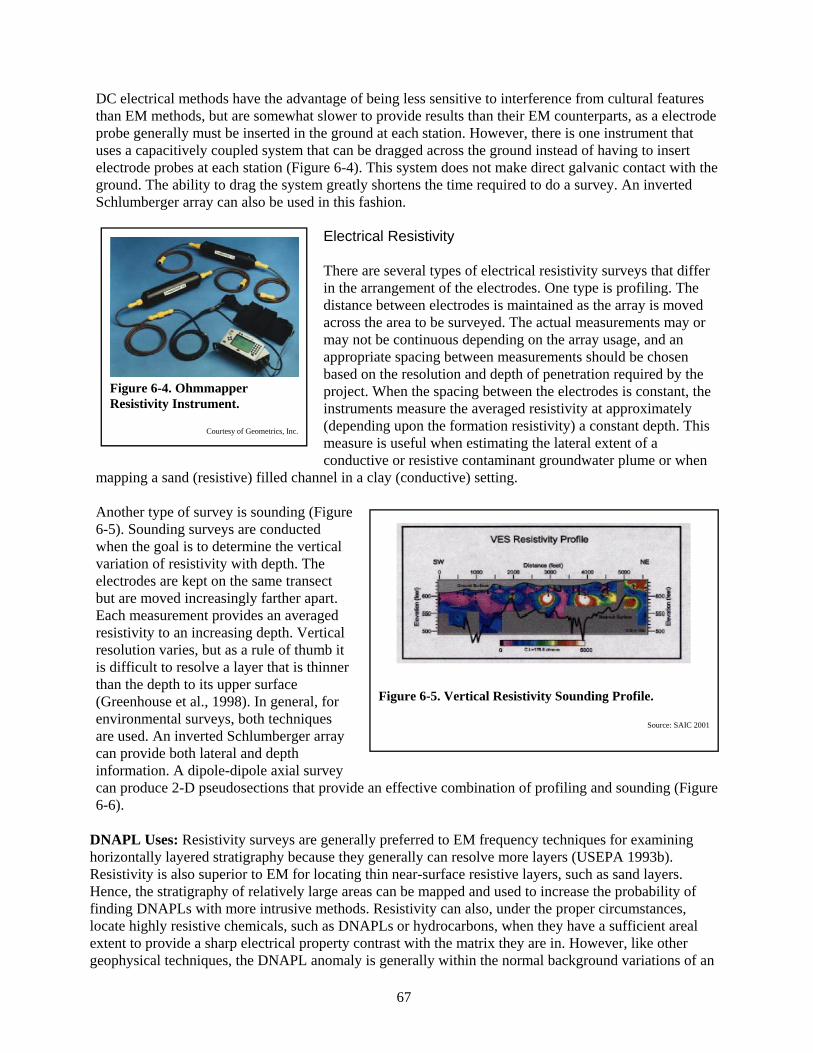
DC electrical methods have the advantage of being less sensitive to interference from cultural features than EM methods, but are somewhat slower to provide results than their EM counterparts, as a electrode probe generally must be inserted in the ground at each station. However, there is one instrument that uses a capacitively coupled system that can be dragged across the ground instead of having to insert electrode probes at each station (Figure 6-4). This system does not make direct galvanic contact with the ground. The ability to drag the system greatly shortens the time required to do a survey. An inverted Schlumberger array can also be used in this fashion.
Figure 6-4. Ohmmapper Resistivity Instrument.
Courtesy of Geometrics, Inc.
Electrical Resistivity
There are several types of electrical resistivity surveys that differ in the arrangement of the electrodes. One type is profiling. The distance between electrodes is maintained as the array is moved across the area to be surveyed. The actual measurements may or may not be continuous depending on the array usage, and an appropriate spacing between measurements should be chosen based on the resolution and depth of penetration required by the project. When the spacing between the electrodes is constant, the instruments measure the averaged resistivity at approximately (depending upon the formation resistivity) a constant depth. This measure is useful when estimating the lateral extent of a conductive or resistive contaminant groundwater plume or when
mapping a sand (resistive) filled channel in a clay (conductive) setting.
Another type of survey is sounding (Figure 6-5). Sounding surveys are conducted when the goal is to determine the vertical variation of resistivity with depth. The electrodes are kept on the same transect but are moved increasingly farther apart. Each measurement provides an averaged resistivity to an increasing depth. Vertical resolution varies, but as a rule of thumb it is difficult to resolve a layer that is thinner than the depth to its upper surface (Greenhouse et al., 1998). In general, for environmental surveys, both techniques are used. An inverted Schlumberger array can provide both lateral and depth information. A dipole-dipole axial survey can produce 2-D pseudosections that provide an effective combination of profiling and sounding (Figure 6-6).
Figure 6-5. Vertical Resistivity Sounding Profile.
Source: SAIC 2001
DNAPL Uses: Resistivity surveys are generally preferred to EM frequency techniques for examining horizontally layered stratigraphy because they generally can resolve more layers (USEPA 1993b). Resistivity is also superior to EM for locating thin near-surface resistive layers, such as sand layers. Hence, the stratigraphy of relatively large areas can be mapped and used to increase the probability of finding DNAPLs with more intrusive methods. Resistivity can also, under the proper circumstances, locate highly resistive chemicals, such as DNAPLs or hydrocarbons, when they have a sufficient areal extent to provide a sharp electrical property contrast with the matrix they are in. However, like other geophysical techniques, the DNAPL anomaly is generally within the normal background variations of an
67

Figure 6-6. 2-D Resistivity Pseudosections.
Source: SAIC 2001.
area and hence difficult to separate out. Resistivity has also been used to locate water filled fracture zones in bedrock, which can help with the placement of boreholes during a DNAPL investigation.
Drawbacks: Dipping strata and lateral heterogeneity of the soil matrix greatly complicate interpretation of the data (EPA 1993b). Two and three-D modeling can help with the interpretations in these situations. Unless holes are drilled for the electrodes, the equipment cannot be used in paved areas or directly on rock (the capacitively coupled design mentioned above is an exception). On rock, additional conductive mud can be used to make contact between the electrode and the subsurface.
Case Study: An electrical resistivity survey was performed at a former MGP. The site was adjacent to a river and had stratigraphy that consisted of a 3-m (10-ft) fill overlying a 2 to 3-m (8 to10-ft) silt to silty clay which was underlaid by a sand to sand and gravel unit. Groundwater generally occurred between 1 and 2.5 m (4 and 8 ft) bgs. The survey was not able to identify stratigraphic contact points, piping, or zones of contamination. It did indicate a number of areas with distinctly different resistivities but the solutions were all non-unique in that they could not differentiate between lithologic, dissolved chemical, or DNAPL sources. Many of the areas that did have resistivities that might indicate a DNAPL proved to be DNAPL free with intrusive sampling. The fill layer consisted of a resistive sand and gravel mixed with varying amounts of bricks; slag; fly ash; coal; and wooden, often oil soaked, boards. The presence of this spatially heterogeneous fill complicated survey interpretation (USEPA 2003).
Electrical Resistivity Tomography
Electrical resistivity tomography (ERT) and complex resistivity tomography use surface-to-surface, surface-to-borehole, borehole-to-borehole, or a combination of these resistivity measurements to construct 2- or 3-D images of subsurface resistivity distributions. By rotating through different combinations of electrode transmitter and receiver pairs, a data set containing a large number
Electrical resistivity has not
been successful in locating old (static) DNAPL releases.
tomography
68

of independent observations is produced. Once the measured transfer resistance is known, an image of apparent resistivity is reconstructed from the combined data. The image is constructed using an inversion algorithm. A considerable amount of research work is currently being conducted to improve and compare these inversion algorithms. The best resolution is with systems using borehole to borehole measurements that are supplemented with surface electrodes. The borehole measurements require a string of electrodes to be deployed downhole. Resolution of borehole measurements is directly dependent upon the ratio of the depth of the instrumented boreholes and the distance between them (aspect ratio). LaBrecque et al. 1997 estimate that the lowest ratio for obtaining acceptable resolution is 1.5:1 or the borehole depth has to be 1.5 times the borehole separation. The precision of the measurements is generally better than the ability to provide unique solutions, which makes the technique ideal for observing changes in resistance patterns rather than identifying existing target conditions.
DNAPL Uses: ERT and complex ERT have been successfully demonstrated in laboratory experiments to track the progress of a DNAPL release through soil (Newmark et al. 1998 and Ramirez et al. 1996). Complex ERT has also shown the expected induced polarization effects of the DNAPL on clays in the experimental vessels. ERT has been demonstrated in conjunction with steam-based remediation techniques to track the progress of the steam front through the subsurface to ensure full coverage of the contaminated area (LaBrecque et al., 1998).
Drawbacks: The technology is expensive to place and has not been particularly successful in identifying past releases when baseline data is not available to use for comparison. It does not give a unique solution because it does not positively identify a target or soil matrix. The deployment of a substantial number of electrode strings may be required to achieve project required resolutions.
Case Study: Cross borehole ERT was used to monitor the removal by pumping of a mobile-phase DNAPL (TCE) at Hill Air Force Base. Three fiberglas monitoring wells with fiber optic chemical sensors and electrical resistivity electrodes were placed across a known DNAPL pool. The wells were also logged using gamma and neutron probes. The neutron probe detected a drop in neutron counts near the interface of a sand overlying a clay unit. The gamma log showed a sharp contact point at the same location with no gradual grading that might explain the drop in neutron counts. As the pumping of the DNAPL progressed, the thickness of the low count area decreased—an indication that the neutron probe was tracking the chlorine/hydrogen content of the adjacent soil. Cross borehole ERT images were made before pumping began to provide a baseline image. Image difference comparisons over time indicated a gradual shifting of the resistive areas as the DNAPL drained towards the pumping well. However, not all areas shifted and intrusive sampling will be required to determine if DNAPL remains or if the anomaly is naturally occurring. (See Newmark, et al., 1998.)
Electromagnetic Methods
EM methods measure changes in the bulk subsurface electrical conductivity due to changes in subsurface conductive features. They can be operated in the frequency domain or the time domain. There are a number of deployment configurations that will be discussed below that include terrain conductivity, horizontal loop electromagnetics, fixed source frequency domain electromagnetics, and very low frequency electromagnetics, and fixed source time domain electromagnetics. Electromagnetic offset logging, which is a frequency domain technique is discussed in Section 7 as a technique that has potential for locating DNAPLs but is still in the research/demonstration stage.
How It Works: Frequency EM systems have a transmitter coil that generates a primary EM field at the surface. As this field propagates into the subsurface it induces a voltage which causes current to flow in
69

conductors. The current in turn produces a secondary magnetic field which is measured by a receiver at the surface. Most commercial systems include a receiver coil that can measure both the primary (inphase) and the secondary (quadrature phase) EM fields. The measured currents are proportional to the electrical conductivity of the subsurface materials. Variations in those values can be interpreted as stratigraphic changes, the presence of conductive bodies, or buried wastes. The strength of the secondary EM fields is a function of the type of soil or rock, its porosity, degree of connectivity, degree of saturation, and the conductivity of the fluids that fill the pore spaces.
EM measurements can be made in either the frequency or time domain. Frequency domain measurements sense the subsurface response of EM fields at one or more transmitted frequencies and generally measure the in-phase and quadrature phase of the signal.
Time domain measurements measure the decay in the secondary magnetic fields after the primary EM signal has been abruptly turned off. The decay time decreases with increasing resistivity. Time domain systems generally can resolve more layers than frequency systems, have greater depth penetration, and are less affected by shallow conductive layers (USEPA 1993b).
The depth of penetration (or skin depth) of a planar EM wave is defined as the depth needed for the amplitude of the wave to be reduced by 1/Q (.37) (Greenhouse 1998). The reduction is a function of the frequency of the wave and the resistivity of the material the wave is passing through. For example, an EM survey conducted over a highly resistive rock at low frequencies may have a penetration depth of hundreds of meters, while a survey using high frequencies over a highly conductive soil may have a skin depth of a meter (3 ft) or less. The size and/or separation distance of the transmitting and receiving coils as well as their orientation (horizontal, vertical) also influences the depth of penetration.
Care should be taken in
when there is a shallow conductive layer (e.g., clay,
interpreting subsurface EM data
graphitic shales) that may screen deeper targets from the primary field.
For environmental surveys, EM instruments can be divided into several groups according to the manner in which the survey is conducted. One group uses relatively small diameter receiver/transmitter coils that are moved at a fixed distance from each other over the survey area. This group is generally used for shallow investigations. A second group uses a fixed coil that can be deployed as a long cable grounded at both ends or a circular or rectangular transmitting coil laid out on the ground with the receiver placed either inside or outside of the coil. A third group uses coincident transmitter and receiver coils that can continuously acquire data.
One of the advantages of EM methods over galvanic resistivity methods is that they do not require a conductive connection to the ground. Another advantage is that the variable frequency range used in EM methods provides greater resolution at a given depth than the bulk volume averaging provided by the DC resistivity methods. The principal disadvantages to EM methods are that the interference caused by subsurface anomalies, such as buried utility lines or building foundations, increases with depth, and the resolution of the data decreases proportionally. Care should be taken in interpreting subsurface data when there is a shallow conductive layer (e.g., clay, graphitic shales) that may screen deeper targets from the primary field.
Several commonly deployed EM systems and techniques are discussed below.
70

Terrain Conductivity
Terrain conductivity surveys are conducted with frequency domain fixed loop systems. The instruments generally have transmitting and receiving coils attached to the ends of a rigid structure that can be manually carried across the area of concern (Figures 6-7 and 6-8). The coil orientations can be set by the user to be either in a horizontal or vertical orientation. The instruments measure both in-and quadrature-phases of the return signal. The quadrature phase can be directly related to ground conductivity. For this relationship to hold, the skin depth must be large compared to the fixed coil spacing. When ground conductivities are
for differentiating shallow subsurface conditions that provide distinct conductivity changes.
Terrain conductivity is useful
Figure 6-7. GEM-300 Multi-frequency Terrain Conductivity Meter.
Courtesy of Geophysical Survey Systems, Inc.
above 100 mS/m, these conditions begin to break down and the accuracy of the instrument deteriorates (Greenhouse et al., 1998). The fixed distance of the coils essentially limits the instrument to subsurface profiling (as opposed to sounding). Depending upon the model and vendor, the instrument can have multiple (Figure 6-7) or single (Figure 6-8) frequency capabilities. Since the depth of penetration is dependent in part on frequency, instruments with multiple frequency capabilities give the investigator more freedom to adjust the instrument to project needs and may allow some sounding capabilities. Measurements can be made continuously or at stations on a preset grid. While the in-phase signal is not linearly related to subsurface conductivities, it is very sensitive to buried metals and is often used for locating buried drums or other metallic targets. Generally, the effective depth of exploration is about 6 m (20 ft) but varies with the site. Data are usually displayed on contour maps as apparent conductivities.
DNAPL Uses: Terrain conductivity has been extensively used for mapping shallow, conductive, groundwater contamination plumes. If a conductive plume contained the dissolved phase of DNAPL chemicals, it would be a useful surrogate for guiding a hydrogeologic investigation. While terrain conductivity has had limited success in locating large, shallow light non-aqueous phase liquid (LNAPL) pools, it generally cannot resolve smaller residual DNAPL masses. However, there is a growing body of evidence (Abdel Aal 2003, Atekwana 2001 and 2004, Burton 2003, Mwanda 2002, Smart 2004, and Werkema 2002 and 2004) ) that suggests that some biodegradation processes associated with some NAPLs result in conductivity changes in the groundwater near and in contact with the NAPL. These conductivity changes would be detectable by EM instruments.
Drawbacks: The method has limited depth penetration capabilities and is affected by nearby surface metal (vehicles, fences), radio station transmitters, and power lines. It does not provide a unique solution and the results need to be compared to a known stratigraphic profile or investigated directly.
Case Study 1: A terrain conductivity survey was conducted with a multi-frequency GEM 300 system at the former Baker Wood Creosoting Company in Marion, Ohio. The subsurface consists of a 61 to 90-cm (2 to 3-ft) thick silt loam overlying a calcareous clay, which is followed by a glacial till with thin interbedded sand layers. A limestone dolomite bedrock unit occurs between 4 and 8 m (13 and 25 ft) bgs. Groundwater is in the bedrock at approximately 12 m (40 ft) bgs.
71

The geophysical survey covered a 30 by 91-m (100 by 300-ft) area that encompassed the former tank area and pump house. Grid lines were on 90cm (3-ft) centers, and measurements were taken every 61 cm (2 ft) using three frequencies (2, 4, and 9 kHz). The use of different frequencies allowed for some depth sounding. Strong conductors (in-phase) were found in the vicinity of the pump house and tank foundations indicating the rebar used in their construction. While there was some interference from the strong metal conductors, the low conductivity readings in an otherwise conductive soil indicated widespread soil contamination.
Figure 6-8. Geonics EM-31 Terrain Conductivity Meter.
.Courtesy of Clearview Geophysics, Inc
The low conductivity readings were very prevalent in the 9 kHz
The conditions that
targets and their location in a shallow conductive
favored the use of this method were the non-conducting nature of the
soil matrix.
survey and much less so in the 4 kHz measurements, which suggest that the majority of the contamination was shallow. Subsequent excavation activities at the site showed good agreement with the EM survey in terms of location and depth of contamination.
The non-conductive nature of the targets and their location in a shallow conductive soil matrix favored the use of this method. Unfavorable conditions were the presence of a nearby radio transmitter and subsurface metal clutter. For more information see USEPA 2000b.
Case Study 2: A terrain conductivity survey was conducted at a former MGP (USEPA 2003). Site stratigraphy consisted of a 3-m (10-ft) fill overlying a 2.5 to 3-m (8 to10-ft) silt to silty clay layer which was underlain by a sand to sand and gravel unit. Groundwater generally occurred between 1 and 2.5 m (4 and 8 ft) bgs. The survey was able to identify a number of subsurface features, such as large concrete gas tank holder foundations, reenforced concrete pads, and some piping corridors. It was unable to identify large pipes (10 plus inches in diameter) below 2.5 m (8 ft) or single small 5 to 20-cm (2 to 4-in) pipes at any depth. While the site had considerable contamination, the survey was not able to differentiate it from fill materials. This is to be expected since the fill consisted of a resistive sand and gravel mixed with varying and spatially diverse amounts of bricks; slag; fly ash; coal; and wooden, often oil soaked, boards.
Horizontal Loop Frequency Domain Electromagnetics
The principles of horizontal loop electromagnetics (HLEM), sometimes called the Slingram method, are very similar to terrain conductivity. The receiving and sending coils are carried by two investigators who prevent the coils from touching the ground and maintain a constant distance between them with a fixed-length reference cable. The cable length can be adjusted, allowing for sounding measurements to be taken as well as profiling. This method has a much deeper penetration depth potential (approximately 100 m or 328 ft) than typical terrain conductivity. Appropriate signal frequencies are chosen for the subsurface to be explored. The typical instrument can generate several signal frequencies. The method measures both the in-phase and quadrature signals but generally reads them out as a ratio. The ratio is a measure of the quality of the conductor generating the secondary field. HLEM has received its primary
72

use in mining exploration to locate strong conductors within 100 m (328 ft) of the ground surface and in water exploration to locate fracture zones on the top of bedrock. In environmental work, the method has been used to estimate lateral variations in the thickness or conductivity of an overburden unit or to determine the thickness and conductivity of a uniform overburden layer (Greenhouse et al., 1998). However, it is not an instrument for sorting out interbedded stratigraphies. It also has been used to look for boundaries of hazardous waste sites, locate non-ferrous metals, and track leachate plumes. The Apex MaxMin 1 is the most commonly used HLEM.
DNAPL Uses: HLEM could find limited DNAPL use in contouring overburden bedrock or sand clay interfaces for potential preferential flow pathways along the lower units or for aiding in locating bedrock fractures.
Drawbacks:. It is unlikely to be able to resolve DNAPLs in the subsurface.
Fixed Source Frequency Domain Electromagnetics (Sundberg and Turam Methods)
In another use of frequency domain electromagnetics, a long cable (typically 400 m (1,312 ft) or longer) is laid out on the ground along the strike of the formation to be investigated. The cable is grounded at both ends, and a low frequency current is passed through it. Large loop cable deployments can also be used. Both vertical and horizontal components of the EM field are then tested on regularly spaced lines perpendicular to the cable by recording both the in- and quadrature-phases of the signal. The in-phase or real component of the signal has to be corrected for the normal primary field and for topography if there is a height difference between the cable and the measurement point (Parasnis 1997). Shallow conductive materials such as clays, can complicate interpretation and at higher frequencies shield deeper anomalies altogether. Data are displayed as a plot of the amplitudes of the in-phase and quadrature-phase signals with distance from the source as a function of frequency. This technique has found its primary use in mineral exploration.
DNAPL Uses: This deployment configuration of EM has received little use in environmental work in general and may not yield satisfactory results in DNAPL investigations.
Drawbacks: The primary use of this technique is to locate the presence of relatively large conducting bodies (e.g., ore bearing formations) and not to map stratigraphic contacts or small discontinuous anomalies characteristic of many DNAPL masses. Data gathered are difficult to interpret and require modeling programs.
Very Low Frequency Electromagnetics
Very low frequency electromagnetics (VLF-EM) measure the effects of the magnetic field induced into the Earth’s surface by high powered military radio transmitters broadcasting in the 15 to 30 kHz range. The antennae of the VLF stations act as an oscillating dipole that induces both electric and magnetic fields. The electric field, measured at a distance from the transmitter station, consists of an electrical component in the direction of propagation and a vertical component. The magnetic field is horizontal and perpendicular to the electric field’s direction of propagation. Although the primary magnetic field is oriented horizontally and perpendicularly to its source, induced current flowing in conductors produces a secondary magnetic field that is out of phase with the primary magnetic field and is oriented in any direction. The vector sum of the two fields traces an ellipse over time, the tilt of which is measured in the VLF tilt angle mode and can be used to locate the conductor (Powers 1999).
73

Equipment used for VLF-EM (Figure 6-9) is usually capable of measuring VLF resistivity, allowing two types of measurements to be taken during the same survey. However, the EM portion does not require contact with the ground whereas the resistivity portion does. The VLF-EM is most often used to locate conductive structures like clayey or weathered zones in bedrock or large mineralized structures such as dikes. Measurement penetration is generally to a few tens of meters.
Figure 6-9. EM16/EM16r VLF Receiver and TX 27 Transmitter.
Courtesy of Terraplus
DNAPL Uses: VLF-EM is most frequently used in DNAPL investigations to locate bedrock fracture zones for future intrusive sampling.
Drawbacks: Steeply sloping topography can complicate the interpretation of the magnetic field. Depth information may not be accurate. VLF-EM is not useful for directly or indirectly locating DNAPLs.
Very Low Frequency Resistivity by EM Induction
The very low frequency (VLF) resistivity technique measures the effects of the electrical field induced into the earth’s surface by the same high powered military radio transmitters broadcasting in the 15 to 30 kHz range used in the VLF-EM
method. The electric field, as measured at a distance from the transmitter station, consists of an electrical component in the direction of propagation and a vertical component. The magnetic field is horizontal and perpendicular to the electric field’s direction of propagation. For practical purposes, these fields can be considered uniform within the small area of measurement interest. The direction the transmitter is pointed relative to the area of concern, may influence the ability of the instrument to detect narrow targets, such as a single large fracture or a conducting body. However, instruments are available that can process up to three signals at a time from three different stations, thereby reducing the likelihood of this problem. A value can be calculated for the apparent resistivity by measuring the horizontal amplitude of both the electrical and magnetic fields. The phase difference between the electrical and magnetic fields provide information on the vertical conductivity. VLF surveys are not laterally continuous and are usually performed at points on a grid or along a transect. For a typical overburden, with a resistivity of 100 ohm-m, the depth of penetration for VLF is approximately 20 m (66 ft) (Greenhouse et al., 1998). VLF data may be presented as profiles or in-plan contour maps of apparent resistivity and phase. There are also software packages capable of 2-D modeling.
investigations to locate water
also serve as conduits for DNAPL
Very low frequency resistivity is most useful in fractured rock
bearing fracture zones that might
movement.
DNAPL Uses: VLF can be used to track dissolved phase plumes when they are associated with other conductive materials (e.g., a landfill leachate plume), but it is not considered an appropriate tool to directly profile DNAPL masses. More commonly, VLF is used to help locate fracture zones containing water that may also be preferential pathways for DNAPL flow.
Drawbacks: This method is subject to polarization effects that can produce considerable ambiguity in the results. VLF resistivity is not a direct DNAPL measurement tool. The military transmitters used for VLF surveys can be unexpectedly shut down. Near surface conductors, such as conductive clays or
74

surface water, will attenuate the transmitted signals and resultant measurement depths. Energy from the transmitter may be too small if a deep target is of interest.
Fixed Source Time Domain Electromagnetics
Time domain electromagnetics (TDEM), also known as transient-field methods, measure the decay of induced secondary magnetic fields when the primary electrical current is abruptly shut off. Investigators generally place a square loop of wire (0.5 to over 200 m or 1.5 to over 656 ft on a side) on the ground and pulse a current through it. The direction of the current is changed after each pulse to avoid polarization of the ground. The receiver unit can be the wire loop itself or a separate unit that is placed at the center of the loop or just outside. The receiver unit samples the eddy currents over time. The sampling occurs immediately after the current is turned off and includes many preset separate time windows (gates). Reading times can be related to the depths of the decaying currents directly if the ground or target conductivity is known or estimated. Readings taken immediately after current interruption represent conductive bodies near the ground surface, and those taken later represent deeper conductors. The process is repeated and the results are stacked to provide better resolution. TDEM is capable of providing a stratigraphic profile to depths of 1,000 m (3,281 ft) or more. Newer instruments can resolve layers as shallow as 1 to 3 m (3 to 10 ft). The resolution of older units begins on the order of tens of meters deeper and may not be able to resolve thin resistive (sand, DNAPL) layers. Data are usually presented as combined plots of the calculated apparent resistivity versus time and the modeled resistivity versus depth. Interpretation of the data generally requires modeling (Greenhouse et al., 1998).
DNAPL Uses: A TDEM surface survey may, but is not likely, to be able to resolve a DNAPL mass. Hence its use is generally confined to mapping stratigraphic units.
Drawbacks: Conventional TDEM is not likely to be able to resolve a DNAPL residual mass, and TDEM solutions are not unique.
Ground Penetrating Radar
Ground penetrating radar instruments use electromagnetic wave pulses to measure changes in the subsurface due to changes in electromagnetic wave impedances.
How It Works: Ground penetrating radar (GPR) uses a transmitting antenna to radiate short pulses of high-frequency electromagnetic waves into the subsurface while a receiving antenna records variations in the reflected return signal (Figure 6-10). GPR generally operates at frequencies ranging from 10 to 1,000 MHz. Higher frequencies provide better resolution at shallow depth while lower frequencies provide greater depth penetration, but with lower resolution. The field logistics involved are similar to reflection seismology except that EM energy is used instead of acoustic energy. The pulse travels through the subsurface until it meets an interface between two media with different wave impedances that partly reflect and partly transmit the pulse. Layers and objects with sharply contrasting electrical impedances (reflectors) can be identified and assigned a depth generally of less than 25 m (82 ft) (depending on the subsurface stratigraphy) by measuring the amplitudes of the successive reflected waves and their arrival times. The penetration depth is governed by the dielectric constant and conductivity of the soil, scattering losses, and rock matrix. Water has a high dielectric constant and dry sand has a low dielectric constant. The depth to a reflector can be calculated from the two-way travel time if the propagation velocity in the subsurface can be estimated or measured. Conductive soil, such as high cation exchange capacity clays, have high attenuation rates that limit the
Ground penetrating radar is not useful in conductive soil, such as clay.
75

depth of penetration the signals can obtain (often less than 1 m if at all), and resistive soil, such as sand, has the least attenuation affect. The horizontal resolution is a function of the antenna radiation pattern and can be likened in shape to light from a flashlight that broadens with distance. Hence the instrument is sampling reflections from a roughly circular surface. As an example, if the radar frequency is 25 MHz and the velocity of the signal through the ground is 0.120 m/ns (0.34 ft/ns), a reflector at 12 m (39 ft) deep must be larger than 5.4 m (18 ft) in diameter for its form to be well mapped (Parasnis 1997).
Figure 6-10. Ground Penetrating Radar Unit.
Courtesy of Clearview Geophysics, Inc.
Investigators can use effectively continuous profiling (i.e., sampling at high rates) or stationary point collection to study the subsurface. The continuous mode involves pulling an instrument across the ground (generally by hand at a walking pace) and taking readings at a preset scan rate (e.g., 128 scans per second). The scans are sampled at a preset sampling frequency and stacked (averaged) to enhance weak reflections. In the stationary point collection mode, the instrument is not moved and the stacking is done over one point. This method can improve accuracy but at the cost of increased time for performing the survey. The data are generally displayed in a 2-D cross section (See Figure 6-11).
DNAPL Uses: GPR has been used in DNAPL investigations to map soil/rock stratigraphy and bedrock fracture zones for use in the conceptual site model. It also has been used in locating buried objects like tanks and drums that might have been sources for DNAPL contamination. GPR may be used to actually locate NAPLs when a high reflective contrast (wide difference in dielectric permittivities) exists between the NAPL and the soil matrix or when there is a high percentage occupancy of pore space and a sufficiently large area to allow resolution. GPR’s have had very mixed success in locating LNAPLs lying on the top of the groundwater even though there is a readily apparent contrast with high pore space occupancy.
.Figure 6-11. GPR Cross Section Showing Buried Reflections.
Courtesy of Clearview Geophysics, Inc
Drawbacks: Because the DNAPL signature is not unique, it requires intrusive verification. A conductive clay unit at the surface of the ground can limit penetration to less than 1 m (3 ft). An accurate interpretation of survey results requires separate knowledge of the subsurface stratigraphy.
Case Study: A GPR survey was conducted at a Ciba-Geigy site in Lewiston, Maine. Contaminants of concern were BTEX, naphthalene, ketones, and chlorinated solvents (perchloroethene (PCE), trichloroethane (TCA), and methylene chloride). The site geology consists of a stratified sequence of outwash sand, peat, marine clay, and sand and gravel layers. Groundwater occurs between 0 and 2 m (0 and 6 ft) bgs. On part of the site, the sand is mixed with fill materials. Investigators used a GPR unit to map the top of the marine clay, which dipped to the west. A topographic low was found in the clay that was approximately 3 m (10 ft) lower than the clay surface. While the GPR unit did not indicate the presence of DNAPLs in this area, it targeted an area needing further investigation. Subsequent placement of an
76

extraction well in the topographic low found PCE in DNAPL form along with other volatile organic compounds. For more information see USEPA 2000b.
Magnetics
Magnetometers are used to measure anomalies in the earth’s magnetic field caused by the different magnetic properties of native soils, rock, or anthropogenic materials.
How It Works: The earth produces a magnetic dipole field that varies in strength and direction depending upon where on the earth’s surface it is measured. In a magnetometer survey, the interaction of the field with target (buried drums, bedrock) materials changes this general flux. The output is presented in an in-plan (plan view) contour map or a 3-D map of highs and and cannot alone locate DNAPLs.
Magnetometers are primarily used to locate buried drums, tanks, or pipes
lows.
Surveys are usually conducted in parallel lines along a grid. Depending upon the instrument used, readings are taken at set points or almost continuously (every 0.1 second for some instruments) while walking the grid. Many instruments are integrated with a global positioning system that makes data reduction easier. Readings taken at two different heights in a vertical plane reveal the vertical gradient of the magnetic field intensity. This configuration for acquiring data is known as gradient mode and is useful in eliminating atmospheric interferences from the sun. Obtaining data with only one magnetic sensor is called the total field method and can contain erroneous data if it is not collected in conjunction with additional magnetic data from a base station The width of the magnetic anomaly limits the horizontal resolution of a target. The grid lines for buried objects, such as a single drum, should be set no farther apart than half the expected depth to the target and could be a meter (3 ft) or less. The nature and expected response of the system to the target also plays a part in grid line spacing.
There are three types of magnetometers:
Figure 6-12. GSM-19 Overhauser Proton Magnetometer with Gradiometer.
Courtesy of Terraplus
• Fluxgate; • Proton precession; and • High sensitivity alkali vapor (cesium vapor for example).
Fluxgate magnetometers measure a vector (specific direction) component of the magnetic field. Unlike proton precession or alkali vapor meters, fluxgate magnetometers must be leveled during measurements, which makes them more difficult to use and limits their application (Greenhouse 1998 and Parasnis 1997). On the other hand, they provide more information about the magnetic field than either of the other two configurations. They are very sensitive to orientation and are not commonly used for environmental surveys.
Proton precession instruments use an electrical current to polarize a proton-rich mixture such as water and then measure the relaxation frequency when the artificial field is removed. The rate at which the polarized protons return to normal is measured and this rate is determined by the strength of the local magnetic field. These instruments measure the total magnetic field and
77

generally do not have to be leveled for proper measurement, which allows them to be used in such applications as aerial and marine surveys. A variation on the standard proton magnetometer is a meter based on the Overhauser Effect (Figure 6-12). This variation involves adding free radicals to the proton rich liquid, which allows concurrent polarization and measurement to be obtained by producing a steady state generation of proton precession signals. Measurements can be taken considerably faster with this modification since the process does not have to measure discrete cycles.
High sensitivity alkali vapor magnetometers (Figure 6-13) use the polarization and depolarization of alkali (generally cesium, rubidium, or potassium) vapor contained in a cell to measure the strength of the magnetic field surrounding it. Polarizing light energizes and breaks loose the outer electron of the vapor gas. The magnetic field pulls these electrons back to their ground state, and when this happens they release the energizing energy in the form of a “spark” of light. The intensity of the light is related to the strength of the ambient field. This method does not require leveling and has the best sensitivity of the three types of instruments. There are sensitivity and maintenance differences between the instruments that are related to the specific metal used in the cell. Alkali vapor magnetometers can be used to collect data at high rates of speed.
Magnetometer. Figure 6-13. GSMP-30 Alkali (Potassium)
Courtesy of Terraplus
DNAPL Uses: Although magnetometers have limited use in DNAPL investigations, they are excellent tools for locating buried drums and tanks that may have contained DNAPLs. They can be used for this purpose in conductive soils (e.g., clay) where GPR fails. They also can be used to locate bedrock soil interfaces when the bedrock or soil exhibits strong magnetic properties.
Drawbacks: DNAPLs are unlikely to cause a sufficient change in the magnetic properties of the matrix they are in for a magnetometer to detect them. Magnetic surveys are also affected by temporal variations in the earth’s magnetic field caused by such things as sunspots.
Seismic Methods
Seismic methods use an artificial acoustical source to propagate acoustical energy directed downward into the ground. Acoustical sources can range from hitting a sledge hammer on a steel plate to setting dynamite charges at depth in a borehole. The penetration by acoustical waves generated by a hammer is generally limited to 10 m (33 ft) and by shotgun shells to 20 to 30 m (66 to 100 ft). If deeper penetration is needed, a hydraulic thumper can be used. Source measurements by electromechanical transducers (geophones) of the reflection or refraction of these waves allows for the construction of stratigraphic cross sections of major units.
How It Works: The speed of sound propagating through the subsurface is affected by the changes in acoustic impedances of various soil and rocks and the fluids that may be contained within them. An
78
acoustic wave travels more slowly through unconsolidated sand (300-800 m/s), gravel, and sediment than competent rock (4,600-7,000 m/s granites). The subsurface stratigraphy is mapped by measuring the travel time necessary for the acoustic wave to pass through one subsurface layer to another, reflect to the surface or refract along the interface, and return to the geophones that are attached to a seismograph at the surface.
The source sends out surface waves, shear waves (S waves) and compression waves (P waves). Only S and P waves will be considered in this discussion. S waves oscillate perpendicular to the direction of propagation and do not move through pure liquids or gases. P waves are affected by the motion of the medium, which is in the direction of the wave propagation. When P waves reach a lithologic contact with contrasting acoustic properties, some of the acoustic energy reflects upward and some energy deflects downward. Most of the energy refracts along the contact between the stratigraphic boundaries.
Reflection and refraction are the two seismic surveys that are used to measure S and P wave propagation in the subsurface. The data from both surveys are usually plotted on time-distance graphs and as a profile of stacked data of distance versus time. Most seismic instrumentation is capable of drawing vertical cross sections through the ground—or profiles—that appear as a layer-cake representation of depth to acoustic boundaries (stratigraphic horizons) and showing some types of acoustic anomalies. Maximum depth and resolution of the data depend upon the energy and frequency of the initial pulse and the acoustic geometry of the geophones.
While seismic methods (especially reflection) are relatively more expensive than other geophysical techniques they can be cost-effective in the information they provide compared to non-geophysical intrusive methods. The equipment is readily available, portable, and non-intrusive. The measurements have good resolution and provide relatively rapid (compared to intrusive methods) coverage of a large area. The disadvantages lie in the difficulty in interpreting the data, which requires substantial expertise. The performance of seismic methods can be significantly affected by cultural noises, such as highways and airports, as well as by buried building foundations. Seismic methods do not perform well in heterogeneous settings in which thin discontinuous soil layers may be missed.
Seismic Reflection
Seismic reflection surveys use geophones to record the arrival of reflected P waves after they have bounced back over time from a subsurface acoustic horizon. There are a number of arrays in which the source and geophones can be deployed. Two typical deployments are optimum offset and line transect. In optimum offset, a single source and geophone with a multi-channel seismograph are used. This technique is employed to map a known target, such as a bedrock surface, or to obtain detailed information on the overburden structure. An offset distance between the seismic source and geophone must be selected to “optimize” the receipt of the target reflection. The survey is carried out by moving the source and the geophone in sequence down a transect, keeping them the same distance apart until the transect is completed. The data recovered from optima offset are relatively straight forward and do not require significant manipulation for interpretation that line transect techniques do.
The line transect method is used for general subsurface exploration and employs a number of preset geophones along a single transect. The seismic source for a line transect deployment is placed at the head of a transect of geophones and the reflections are recorded. Whether the source is moved at this point depends on the stacking method that has been chosen for the survey. If vertical stacking is preferred, the source is repeatedly activated in the same place until a predetermined number of readings have been made. The improvement in data resolution by stacking is not linear and the value added by each additional “shot” (or pulse) falls. Another technique for stacking is the common middle point (also
79

called common depth point). In this technique the source is moved along the transect in a direction away from the geophones. The geophones are closely spaced and the outputs of several are added together to give a single trace (e.g., 24 geophones producing six traces). While the shots are read by all the geophones, the distances each shot point moves are selected to generate a single middle point for each of the six traces (Figure 6- 14). Shot one corresponds to geophone grouping 24, shot two to grouping 20,
Figure 6-14. Common Point Shot and Geophone Configuration.
Adapted from Parasnis 1997.
and shot 6 to grouping 4. The traces, run for a given transect length, are called a “CMP gather,” and the number of traces within a gather is the “fold” of the stack. Unlike the optimum offset method, common middle point stacking requires a considerable amount of subsequent manipulation for interpretation.
Seismic reflection can define sequential stratigraphy to great depths (>1,000 m or 3,281 ft) although a thick sequence of dry gravel can greatly affect its depth of penetration. Depending upon the application, seismic reflection can resolve layers down to 1-m (3-ft) thicknesses, and unlike ground-penetrating radar (GPR), it is not affected by highly conductive electrical surface layers. Although the shallowest depth that can generally be resolved is around 3 m (10 ft) bgs, Baker et al. 2000 and 2001 report some success in surveying at less than that by increasing the density of the geophones and reducing the source energy.
A seismic reflection method used in the oil industry and potentially applicable to DNAPL investigations is “amplitude versus offset” (AVO), also known as “amplitude variations with offset.” This method compares near and far offset stacks to determine if there is an impedance change as indicated by the reflection P wave amplitude for angles of incidence greater than 30°. Before beginning a survey, the area to be investigated is modeled using expected reflectors. For example, in a gas reservoir survey where the pore fluids are expected to be water if there is no gas, water would be used in the model. A difference in amplitude with distance from that predicted for the water model is an indication of a change in density that might be caused by gas. “Might” is the key word here since other subsurface changes could also cause a change with distance, the solution is non-unique and subject to error. The uncertainty contained in a P wave evaluation can be greatly reduced if source generated or mode-converted shear wave energy is evaluated. Shear waves are not as affected by pore fluids as P waves, but are affected by changes in the soil matrix. If shear wave measurements across the area do not indicate a change in matrix, then the P wave change is most likely due to a change in fluid type rather than matrix.
shown to be able to
the subsurface.
Seismic AVO has been
map anomalies caused by DNAPL masses in
80

DNAPL Uses: Seismic reflection is an excellent tool for mapping subsurface stratigraphy and for determining potential preferential pathways for DNAPL flow. It has good vertical resolution and may be used in conductive subsurfaces where GPR fails. If the DNAPL mass is large enough, the AVO method might be able to detect and map it. Because of its expense, the AVO method might best be deployed when the general location of the DNAPL is already known and the remedial technology under consideration requires a good understanding of its actual size and location.
Drawbacks: Intrusive verification of the stratigraphy and the potential DNAPL source is necessary for geological interpretation and positive identification of the DNAPL. The technique can be more expensive to execute than other geophysical techniques and the AVO method is more expensive than regular reflection.
Waddell and his colleagues (2000 and 2001) successfully demonstrated the ability of seismic reflection AVO techniques to detect DNAPL at the Department of Energy’s Savannah River and Hanford sites in 2000 and at the Charleston Naval Weapons Station in 2001.
Case Study 1: The purpose of the Savannah River investigation was to gather seismic reflection data in an area that was going to be treated by steam injection. The initial survey noted several areas that had a high probability of DNAPL presence. These areas corresponded to areas that had been identified previously as having high concentrations of PCE/TCE. The seismic data provided a better picture of the areal extent of the concentrated contamination at a depth of approximately 43 m (140 ft) bgs. The followup survey data to determine if the anomalies were still present following the treatment are not available.
Case Study 2: At the Hanford site, Waddell and his colleagues conducted a seismic reflection survey in the 200 W area where an estimated 159,000 gallons of carbon tetrachloride (CCl4) had been released. A series of survey lines were taken that supported the results of previous investigations about the presence of DNAPLs but also provided a better understanding of the DNAPL areal (vertical and horizontal) extent.
Case Study 3: The AVO deployment at the Charleston Naval Weapons Station was for the purpose of investigating a chlorinated solvents release at SWMU 12. The controlling stratigraphy was a sandy clay located 6 to 10 m (20 to 33 ft) bgs. The overlying unit consisted of sand. Groundwater occurred just below the ground surface. Investigators recorded the seismic lines using a 60-channel recording system with 100 Hz geophones on 0.3-m (1-ft) centers. Six blows per source point using a 1.8 kg (4-pound) sledgehammer were stacked and recorded. The survey showed an anomaly that when investigated further, revealed elevated levels of chlorinated solvents in the groundwater (-500 ppm), which probably meant much higher concentrations existed in the soil. The survey was not able to detect lower but still relatively high (134 ppm) values of contaminated groundwater, suggesting that the technique may not be useful for plume delineation.
Seismic Refraction
As in reflection, a refraction survey begins with the deployment of geophones along a transect in line with the acoustical source. Two measurements are made after the initiation of the acoustical source. The first is the surface wave (which usually is ignored) and the second is the first-arrival P wave. Seismic refraction assumes that density (velocity) increases with depth. The measurements and estimate of depth to the refracting surface are determined as follows.
81

The initial wave travels through the first layer until it meets a second layer with a different acoustic impedance. At the interface of the two layers, a portion of the wave refracts along the interface and another portion is transmitted through the second unit, where it encounters a third layer, and so on as the process repeats. As the refracted wave travels along the interface, it sends out secondary waves that are recorded at the surface. If the geophone is close to the sound source, the surface wave arrives before any refracted wave. However, as the distance from the shot point increases, the secondary refracted waves arrive first as they overtake the surface wave due to their faster horizontal transmission in the second unit. From these “first” arrivals, the depth to the refracting surface can be calculated. At some point farther out on the geophone transect, the secondary waves from the third transmitting layer begin to arrive. They move faster in the third unit than the waves at the surface or in the second unit interface. These first arrivals are used to calculate the depth to the third unit. The depth calculations are relatively simple to do for interfaces that are horizontal and parallel. They become somewhat more complex when the stratigraphy is undulating or dipping. Lateral resolution of a stratum is governed by the geophone spacing. Vertical resolution of a stratum requires that the stratum have a thickness that is a substantial fraction of the depth to its upper surface (Greenhouse et al., 1998). To improve resolution, multiple shots from the same point are generally done and the results are stacked (averaged) for interpretation as well as shots from the end of the spread to determine dip and act as quality assurance for reciprocity.
single overburden unit. Resolving
Seismic refraction is most often used to map the bedrock beneath a
more than three layers is difficult.
Seismic refraction is often used in shallow areas (less than 30 m or 100 ft) where the principal goal is to map the bedrock topography beneath a single overburden unit. It also is employed to map weathered bedrock and fracture zones during water prospecting. Refraction methods are less expensive than reflection methods but may have lower resolution. If the velocity of the transmitting unit used with seismic refraction does not increase with depth, the results may have to be modified or discarded. For example, a low velocity thin sand unit that is overlain by a high velocity clay unit may not be resolvable with the refraction technique.
DNAPL Uses: Seismic refraction has been used in DNAPL investigations where the stratigraphy is relatively simple and the object is to map the surface of a geologic layer that may control the direction of DNAPL flow.
Drawbacks: Seismic refraction does not identify DNAPL masses even as anomalies and usually cannot be used to define thin layers. Prior knowledge of the general stratigraphy is generally needed for proper interpretation.
Case Study: Murray et al., 1999 report on the use of a seismic refraction survey to map the top of limestone bedrock and the top of a clay layer at a site where DNAPLs had been released. The stratigraphy at the site consists of unconsolidated native soil and fill overlying various degrees of weathered limestone, followed by lightly fractured bedrock. The depth to the bedrock ranges from 1 to 12 m (3 to 40 ft) bgs. The dissolved plume from the DNAPL release is over 150-m (500-ft) long. Twenty 40-m (125-ft) lines were surveyed. Each line had geophones on 160-cm (5-ft) centers. Shots were made at each end, in the center, and at quarter points. Five to twenty stacks were collected from each source point depending upon the distance of the source to the farthest geophone. Initially a sledge hammer was used to generate the acoustic waves. However, the sledge hammer was later replaced with 227-kg (500-pound) and 455-kg (1,000-pound) weights that were dropped from a height of 2.5 m (8 ft) from the back of a pick up truck. The weights greatly improved the signal to noise ratio.
82

The results showed a line of high velocity rock in the center of the survey area that trended in a northeasterly direction. This result was interpreted as lightly fractured bedrock. Also revealed were low areas in the rock surface and areas underlain by less fractured bedrock, indicating that considerable weathering had occurred in these areas. These areas were targeted for potential placement of recovery and monitoring wells. Subsequent placement of wells in these areas revealed highly contaminated groundwater.
The seismic refraction survey at this site effectively solved a three-layer problem. First arrivals were read in real time using the critical distance method. The investigators believed that the highly variable thickness of the near surface, low velocity zone would hamper more complex methods.
Cross-Borehole Seismic Techniques
Cross-borehole seismic techniques are conducted by placing an acoustical source in one borehole and a geophone(s) receiver in one or more other boreholes. The source and geophones typically are set at the same depth, and a reading of both the P and S waves is recorded. The source can be as simple as the hammering of a split spoon sampler in front of an auger at selected depths or as complex as a specially made downhole hammer (Figure 6-15). Piezoelectric sources can also be used instead of a hammer system. They apply sequences of high voltage pulses to a stack of piezoelectric crystals to produce relatively high frequency acoustical waves. The geophone assembly may be pressed against an open borehole wall or completed casing using a spring loaded device or inflatable packer (Figure 6-16). The depth of the borehole generally is not an issue (more than 1,000 m or 3,281 ft is possible). However, care should be taken to either ensure the holes are plumb or an inclinometer test should be done to determine accurate lateral distances between the source and the geophone package. One of the advantages of cross hole seismics over surface seismics is they can use much higher frequencies and hence obtain better vertical resolution. Also, the resolution does not decrease with depth.
Hammer. Figure 6-15. Downhole Seismic
Courtesy of GPE, Inc.
DNAPL Uses: Cross-borehole seismic methods have been used in the oil industry to better define reservoir characteristics and could conceivably be used to locate sufficiently large DNAPL masses though this has not been proven. These methods also may be used to provide a better understanding of water flow in fractured rock and in locating fractures.
Drawbacks: Depending upon the acoustic source and geologic setting, these methods may require a number of closely spaced wells (10 to 30 m or 33 to 100 ft apart). They do not detect DNAPLs directly.
83

This Page Left Intentionally Blank

Section 7 TECHNOLOGIES UNDER EVALUATION
Technologies described in this section are either newly developed or have not found widespread use in DNAPL investigations. They have been included because they may be proposed by a vendor or characterization contractor for a DNAPL site.
Complex Resistivity
Complex resistivity (which includes induced polarization) is deployed in the same fashion as regular resistivity except that it also measures the electrochemical response of subsurface materials to an applied current. In general, this response is dependent upon the microgeometry, bulk fluid composition, and surface chemistry of the soil matrix. While the exact mechanisms are not well understood (Parasnis 1997), when an induced voltage is applied to subsurface materials, there is a delay in the resulting current that is related to the ability of the material to store/transfer the charge. The delay results in several measurable aspects that can be used to differentiate soil/rock matrices and their content.
The method can be operated in either the time or frequency domain. When operated in the time domain, the decay of the electrical signal is measured at different time windows after the induced voltage is abruptly stopped. The decay can be expressed in terms of the polarizability or more frequently the chargeability of the material. Two materials can have similar resistivities but exhibit very different chargeability values. This difference has been exploited in coastal groundwater studies to differentiate between sand units with saline water and clay units with fresh water that have similar resistivities. When used in the frequency domain, measurements are made of the apparent resistivity of the subsurface materials as they are subjected to currents with different frequencies (amplitude and phase differences between frequencies). Three calculations are generally made in the frequency domain: frequency effect, apparent metal factor, and phase shift. When expressed as a percentage change the frequency effect is also called the percent frequency effect, otherwise referred to as PFE.
A competent DNAPL may be identified by the difference in chargeability values that it exhibits compared with the chargeability values of the surrounding geologic matrix.
DNAPL Uses: Complex resistivity is especially sensitive to soil matrices containing clays. Clays that have been contaminated with organic constituents display different properties than uncontaminated clays (Olhoeft, G.R. 1985; Aristodemou, E. and A. Thomas-Betts 2000; Slater, L. et al., 2000). In addition, complex resistivity, including a regular apparent resistivity measurement as part of the process, can aid in resolving stratigraphic layers that simple resistivity measurements alone cannot.
Drawbacks: Complex resistivity requires more sophisticated equipment than other surveys, and interpretation of the results is difficult. The clay/chemical interactions that allow contaminated clay to be separated from clean clay or other soil matrices are very site specific. The method is also very susceptible to buried metallic objects.
can resolve stratigraphic differences
Complex resistivity surveys that include measuring apparent resistivity
that regular resistivity cannot.
Case Study: Granger and Peavy (2000) report on a study using electrical resistivity (ER) and time domain complex resistivity (induced polarization) to investigate tar-contaminated soil at a former shingle manufacturing plant in Fulton, New York. The site stratigraphy consists of a sandstone bedrock that is overlain by approximately 60 ft of
85

interbedded fill, glacial clays, sands, and gravels. A prior ER study identified a number of resistive anomalies that could be associated with tar masses. Further investigation of these anomalies showed that the ER method was not able to differentiate between resistive tars and large blocks of sandstone that had apparently been buried at the site during construction of the Erie Barge Canal network.
In their focused investigation comparing ER and complex resistivity (CR), the authors found that the early arrival CR chargeability data correctly separated tar masses from the resistive sandstone blocks. They also reported some problems with their initial dipole-dipole array because the location of the tars relative to the location of the current electrodes resulted in a poor signal to noise ratio. A second survey of the same area using a different array with the current electrodes located outside the tar zone provided much better data.
Downhole Thermal Desorption with Top-Side Analysis
This technology has generally been used by the Tri-Service Site Characterization and Analysis Penetrometer System (SCAPS). It is designed to collect soil samples at multiple depths, purge them of any volatile organic contaminants, and analyze these contaminants with an instrument located inside the CPT truck.
How It Works: A specially designed thermal desorption probe (Figure 7-1) is advanced by a CPT rig into the subsurface. When the probe reaches the sample depth, the probe tip retracts up into the probe body leaving a cylindrical tube of known diameter and length. Then the probe advances an additional 4.5 to 5.1 cm (1.8 to 2 in) to acquire a sample. Depending upon the density of the soil, the sampled plug weighs between 3.5 and 5 grams. Helium, heated to between 170° and 200° C, is introduced at the base of the soil sample. The heat plus potential sweeping of the helium through the sample volatilizes the contaminants, which are swept up to the surface through a 1.6 mm (0.06 in) fused silica-lined stainless steel transfer line. At the surface, they may be captured on a sorbent trap or, depending upon the expected concentration, directly injected into a portable ion trap mass spectrometer (ITMS) for analysis. The sorbent trap contains a mixture of tenax®, silica gel, and charcoal that can be regenerated after each sample event. If the concentrations of contaminants are expected to be very low the purge and trap concentrator can be used to improve the detection limits. Where the concentration is expected to be high, the trap is eluted with 1 ml of purge and trap grade methanol. An aliquot of the methanol is placed into water and then desorbed into the ITMS. This sample preparation method is similar to SW 846 Method 5035. The targeted detection limit of the system is 25 to 50 µg/kg. The sampling procedure takes approximately 45 minutes per sample to complete. Depending upon the concentration of the contaminants in the soil sample, in-situ decontamination of the probe can take 30 or more minutes. The spent soil sample is
Figure 7-1. Downhole Thermal Desorption Probe. Courtesy Army Corps of Engineers
86
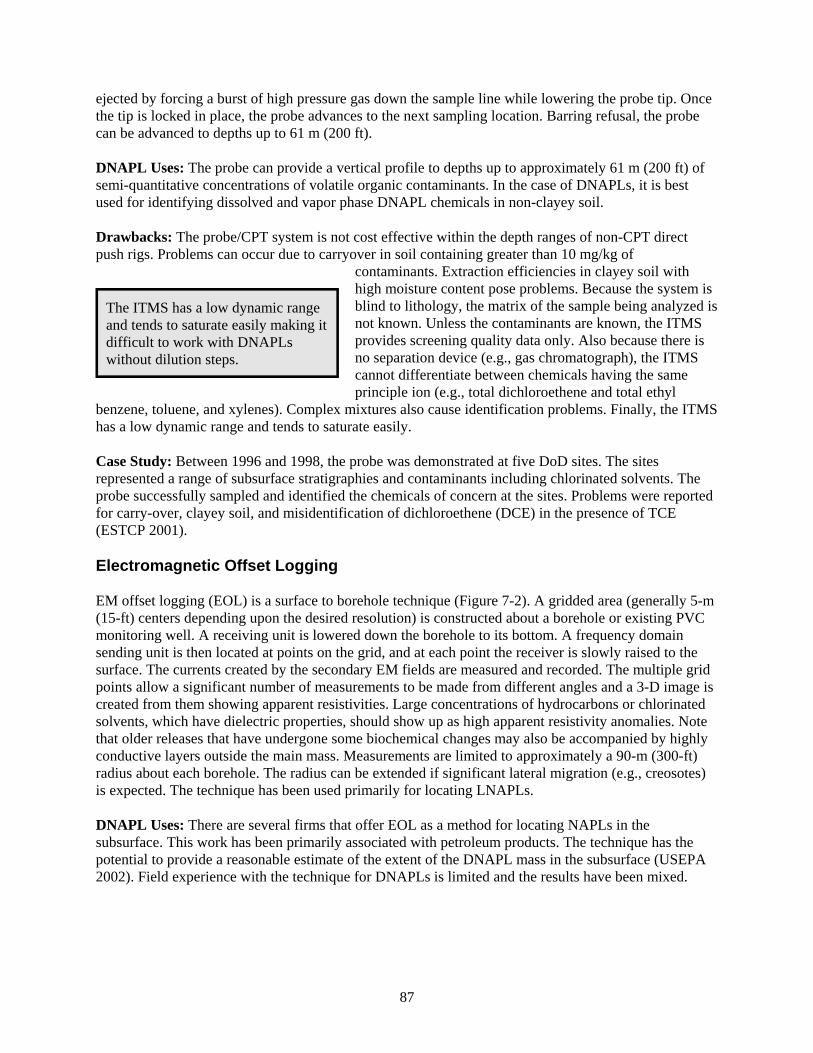
ejected by forcing a burst of high pressure gas down the sample line while lowering the probe tip. Once the tip is locked in place, the probe advances to the next sampling location. Barring refusal, the probe can be advanced to depths up to 61 m (200 ft).
DNAPL Uses: The probe can provide a vertical profile to depths up to approximately 61 m (200 ft) of semi-quantitative concentrations of volatile organic contaminants. In the case of DNAPLs, it is best used for identifying dissolved and vapor phase DNAPL chemicals in non-clayey soil.
Drawbacks: The probe/CPT system is not cost effective within the depth ranges of non-CPT direct push rigs. Problems can occur due to carryover in soil containing greater than 10 mg/kg of
contaminants. Extraction efficiencies in clayey soil with
difficult to work with DNAPLs without dilution steps.
The ITMS has a low dynamic range and tends to saturate easily making it
high moisture content pose problems. Because the system is blind to lithology, the matrix of the sample being analyzed is not known. Unless the contaminants are known, the ITMS provides screening quality data only. Also because there is no separation device (e.g., gas chromatograph), the ITMS cannot differentiate between chemicals having the same principle ion (e.g., total dichloroethene and total ethyl
benzene, toluene, and xylenes). Complex mixtures also cause identification problems. Finally, the ITMS has a low dynamic range and tends to saturate easily.
Case Study: Between 1996 and 1998, the probe was demonstrated at five DoD sites. The sites represented a range of subsurface stratigraphies and contaminants including chlorinated solvents. The probe successfully sampled and identified the chemicals of concern at the sites. Problems were reported for carry-over, clayey soil, and misidentification of dichloroethene (DCE) in the presence of TCE (ESTCP 2001).
Electromagnetic Offset Logging
EM offset logging (EOL) is a surface to borehole technique (Figure 7-2). A gridded area (generally 5-m (15-ft) centers depending upon the desired resolution) is constructed about a borehole or existing PVC monitoring well. A receiving unit is lowered down the borehole to its bottom. A frequency domain sending unit is then located at points on the grid, and at each point the receiver is slowly raised to the surface. The currents created by the secondary EM fields are measured and recorded. The multiple grid points allow a significant number of measurements to be made from different angles and a 3-D image is created from them showing apparent resistivities. Large concentrations of hydrocarbons or chlorinated solvents, which have dielectric properties, should show up as high apparent resistivity anomalies. Note that older releases that have undergone some biochemical changes may also be accompanied by highly conductive layers outside the main mass. Measurements are limited to approximately a 90-m (300-ft) radius about each borehole. The radius can be extended if significant lateral migration (e.g., creosotes) is expected. The technique has been used primarily for locating LNAPLs.
DNAPL Uses: There are several firms that offer EOL as a method for locating NAPLs in the subsurface. This work has been primarily associated with petroleum products. The technique has the potential to provide a reasonable estimate of the extent of the DNAPL mass in the subsurface (USEPA 2002). Field experience with the technique for DNAPLs is limited and the results have been mixed.
87

Drawbacks: Resolution may require a target as large as 3 m (10 ft) in diameter. The solution is not unique and requires intrusive sampling for verification. Measurement interpretation requires very experienced crews. The modeling software in general use is setup for lateral migration prediction and care should be exercised in interpreting the data when a vertical column is expected. Depth of interpretation is limited to the depth of the borehole. The technique requires a borehole and cannot be used in steel cased wells. It is also susceptible to metallic interference, such as those created by metal fences and pipelines.
Case Study 1: The Department of Defense (DoD) invited one of several vendors with a proven track record for locating LNAPLs with EOL to demonstrate the technology for a DNAPL site at the Alameda NAS. A plating shop was the target at NAS Alameda where TCA concentrations up to 790 mg/l were found. The site is underlain by up to 12 m (40 ft) of fill (sand, silty sand with clay and/or gravel, wood, concrete, and metal) that lies on a clay Bay Mud unit. Groundwater is encountered between 1.5 and 3 m (5 and 10 ft) bgs. Several areas were identified with resistive anomalies. However, intrusive sampling in the anomaly areas failed to find any DNAPL (USDoD 2000). The conclusions of the report were that the resolution of the technique may not be high enough to detect diffusely distributed DNAPLs. The known source (release) area at the site was not investigated.
Figure 7-2. Electrical Offset Logging System.
Courtesy ESTEP
Case Study 2: An EOL survey was performed at a creosote-contaminated landfill in Gulfport, Mississippi. A 15-m (50-ft) source grid and one receiver well were used to conduct the survey across 15 acres and to a depth of 24 m (80 ft). The water table at this site was located 2.5 m (8 ft) bgs. The survey model indicated three DNAPL-contaminated sands within 12 m (40 ft) of depth below the source area, and a second contaminated area 30 m (100 ft) away from the area. Intrusive sampling confirmed the presence of creosote DNAPL in the areas indicated.
Case Study 3: At the Tucson Airport in Arizona, an EOL survey was performed in a solvent-contaminated area using a 5-m (15-ft) source grid and two receiver wells. The water table was located at a depth of 29 m (95 ft). The four-acre survey indicated that the solvents migrated freely through a fractured caliche zone to approximately 11 m (35 ft), and then spread laterally and vertically through a section of (primarily) clay to the water table and sands at 29 m (95 ft). The survey model also indicated that the solvents migrated via French drains from the source areas to the edge of (historic and existing) cement aprons, where they cascaded to the water table sands. Although the accuracy of the survey results pertaining to near-surface and sub-surface contaminants could not be verified at the time, subsequent investigations at the site suggest that the EOL model developed at the Tucson Airport was valid.
88

Halogen Specific Down Hole Detector
This technology is designed for in situ detection of halogenated hydrocarbons and is deployed with a MIP probe. Its development was sponsored by the Air Force and it has been demonstrated at several sites with known chlorinated solvent contamination with favorable results.
How It Works: The probe employs a variation of a commercially available halogen specific GC detector (XSD) made by OI Analytical. OI Analytical literature describes the XSD principle of operation as: “ The reactor is operated in an oxidative mode, which pyrolizes the effluent from a GC column. This oxidative pyrolysis efficiently converts compounds containing halogen to their oxidation products and free halogen atoms. The cathodic current is measured by an electrometer and converted to a 0-1 or 0-10 V output signal which can be readily coupled to a chromatographic data handling system.” (Quoted from SERDP 2001). The system uses ultrapure air and the reactor core operates between 800o
and 1100o C. Figure 7-3 shows the detector circuitry and Figure 7-4 is a schematic of the downhole components.
The system is mounted above the membrane of a MIP. The carrier gas pulls the volatilized chemicals from the MIP through a Nafion™ module that separates the organic gas from water vapor and into the reactor chamber where the gases are burned and a measurement of total halogen is made. The signal voltage is passed to the surface where it is recorded and displayed on a monitor. The result is a depth
Source: SERDP 2001
Figure 7-3. XSD Electrical Circuitry.
specific profile of relative concentrations of halogens in the subsurface. The system is somewhat more accurate contaminant location information than a conventional MIP since the measurement is made in-situ rather than at the surface. The detector has a dynamic range greater than 1 X 10⁵ and a linear range of greater than 1 X 10⁴.
DNAPL Uses: The detector is specific to halogens and hence can provide a relative profile of halogenated hydrocarbon concentrations with depth on a near continuous basis. Since it is relatively easy to operate, and is part of a DP delivery system, transect profiling can be done very quickly.
Drawbacks: The detector measures total halogens and hence does not identify species. Given its linear and dynamic range, it will probably be saturated before it can measure DNAPL concentrations. It should
89

be useful for dissolved and vapor phase chemicals. On the other hand, an offscale reading would be a good indicator of where a more definitive sample for DNAPL should be obtained.
.
Source: SERDP 2001
Figure 7-4. XSD Probe Design of Downhole Components
Case Study 1:. This demonstration test was at a former dry cleaner in Moorhead, Minnesota. The site has clayey soil and a shallow water table. The test showed good repeatability and a transect of pushes provided plume depth and width. The continuous sampling indicated stratified contamination occurring at 3, 3.7, and 5 m (10, 12, and 16 ft) bgs (SERDP 2001).
Case Study 2: In this demonstration, 7 pushes on 6-m (20-ft) centers to approximately 12 m (40-ft) bgs were made at a former dry cleaner located in West Fargo, North Dakota. The data from this transect indicated the potential for two rather than one source area and showed that the contamination became deeper with distance from the suspected source areas. The distinct stratification of the plume observed at the Moorhead site was not as apparent at the West Fargo site (SERDP 2001).
Case Study 3: Another demonstration was performed at Offutt Air Force Base in Omaha, Nebraska. The subsurface at the Offutt site consists of sands and gravels with the water table occurring at 3 to 3.5 m (10 to 13 ft) bgs. Nine pushes on 3-m (10-ft) centers were made across a known plume area with a Geoprobe® DP rig. The sensor was advanced at 0.5 cm/sec (0.2 in/sec). Contamination was detected in seven of the pushes and was generally continuous with some stratification between 3 to 7.6 m (10 to 25 ft) bgs. However, in the two southern most holes (10 and 11) the contamination began at 7.6 m (25 ft) bgs (Figure 7.5). Note that like LIF technology, measurements are given in millivolts and show relative detection response rather than concentrations (SERDP 2001).
Flux Methods
A relatively new approach to groundwater monitoring is to measure the flux (or total mass) of contaminants passing a transect perpendicular to groundwater flow. Currently two demonstrated
90

techniques for making flux estimates exist. The first (passive flux meter) relies on placing a line of monitoring wells with screens of appropriate length in a transect across a dissolved phase plume. The second (intregal pumping) places a line of pumping wells across the path of the dissolved plume.
Source: SERDP 2001
Figure 7-5. XSD Field data (0-1.0 volt scale) from Offutt AFB.
Passive Flux Meter
This method is still in the demonstration phase and is not commercially available.
How It Works:
A line of wells on close centers with screens of an appropriate length are placed across the path of contaminated groundwater flow. The well screens are packed with cartridges that contain a sorbent material for capturing contaminants and a chemical that dissolves at a known rate for determining the groundwater flow rate. The result is a highly detailed vertical profile of concentrations and flow rates. Vapor diffusion bags or other devices can be substituted for the cartridges, but the detailed groundwater flow rate information, which can be valuable in evaluating the affects of remediation activities on the subsurface, will be lost.
DNAPL Uses: The continuous vertical profile combined with close horizontal spacing of the wells provides a good 2-D estimate of source area architecture and preferential flow paths. The technique is designed to aid in choosing remedies, remedial design, and determining the effects (differential flux) of a remedial action on a source zone. When two transects are deployed it provides information on flux differences with distance from the source that can be used to evaluate whether natural attenuation is occurring.
91
Limitations: Even on closely spaced centers, there is a possibility of missing a major flux zone. The technique requires the extraction and analysis of a large number of samples which, with a large plume cross section, can be expensive. The technique does not provide an estimate of 3-D architecture, hence it cannot be used to estimate contaminant mass available or predict the outcome of a remedial action.
Case Study 1: At Hill AFB a transect of passive flux meters was used to measure the reduction in flux from a DNAPL source zone following a surfactant flood. The subsurface consisted of an 2.5 to 3-m (8 to 10-ft) silty sand overlaying a 3 to 3.5-m (10 to12-ft) well sorted sand on an alpine clay layer. Groundwater occurs at approximately 5.5 m (18 ft) bgs.
Ten monitoring wells on approximately 10-ft centers were placed downgradient from the source zone. TCE mass flux passing through them was measured before and after the surfactant flood. The passive flux meters indicated a reduction in TCE flux of approximately 90%.
Integral Pumping
Integral pumping has been employed in Europe to evaluate the potential a site has for using natural attenuation as a remedy.
How It Works:
A transect of wells is placed across the contaminant plume such that when pumped, they have overlapping capture zones. As each is pumped, groundwater samples are taken at preset time intervals and analyzed. The time interval at which the water was sampled can be related to the water’s original distance from the well. An idea of where contaminant plume hotspots are and the total flux can be gained by comparing the analytical results of each pumping test.
DNAPL Uses: Integral pumping can be used to characterize DNAPL source strength. If the site has been sufficiently well characterized, the integral pumping test results can be used in conjunction with numerical modeling to estimate source locations and to some extent architecture.
Limitations: A well developed numerical model is needed to provide resolution on source location. The test is usually performed over an 80 to 120 hr period per well, which can generate a large amount of contaminated water that would need treatment. If information on source location is needed the technique requires that the groundwater flow paths be natural before pumping begins. The method is not practicable in low yielding formations. Like the cartridge method, 3-D architecture or source mass cannot be determined by this technique.
Case Study 1: Integral pumping has been demonstrated at a number of sites as part of the European Integrated Concept for Groundwater Remediation Project http://www.umweltwirtschaft-uw.de/incore/.
Hydrosparge VOC Sampler
The hydrosparge VOC sampler was developed by the Army for their SCAPS rig and is designed to take volatile organic samples from in situ groundwater and analyze them with an ion trap mass spectrometer.
How It Works: A drive point with well screen (e.g., HydroPunch®, PowerPunch™, small diameter telescoping screen) is pushed to the desired depth and the drive rods are pulled back to expose the screen. Water enters the screen and rises to a nominal head where it is allowed to stabilize (20 to 30 min). The sparge module is then lowered to a point where it straddles the equilibrium head (Figure 7-6) and helium gas is applied to the chamber containing the water. The gas strips volatiles from the water and carries them to the surface through Teflon™ tubing where they are introduced to an ITMS located
92

in the CPT rig. The purging step generally takes 4 to 5 min and tentative identification and quantitation of the contaminants occurs immediately afterward.
DNAPL Uses: The probe can provide a vertical profile in nominally compacted soils to depths up to approximately 61 m (200 ft) of semi-quantitative concentrations of volatile organic contaminants. In the case of DNAPLs, it is best used for identifying dissolved and vapor phase DNAPL chemicals in non-clayey matrices.
Drawbacks: Only one sample per push can be obtained. Problems can occur due to carryover in the Teflon™ return tube when samples containing greater than 10 mg/l of contaminants are encountered. Because the system is blind to lithology, the matrix in which the sample is being collected is not known without a prior push with a cone penetrometer. Also because there is no separation device (e.g., gas chromatograph), the ITMS cannot differentiate between chemicals having the same principle ion (e.g., total dichloroethene and total ethyl benzene, toluene, and xylenes). Complex mixtures also cause identification problems. Finally, the ITMS has a low dynamic range and tends to saturate easily.
Figure 7-6. Hydrosparge Technique.
Courtesy Corps of Engineers
As of 2000 the SCAPS HS had been deployed at over 25 sites by the Army Corps of Engineers (Corps). The short case studies discussed below are taken from a California Department of Environmental Protection Technology Certification Publication (2000).
Case Study 1: Building 525 at Aberdeen Proving Ground was used for cleaning and painting of vehicles and weapons systems. Solvents and petroleum products had been detected in the groundwater near the building during site investigations. Site stratigraphy investigations found surficial fill in some areas beneath which was clay, silt and silt/clay mixes to a depth of 3 to 5 m (10 to 15 ft) bgs. Below that depth, sand and sand/gravel mixes with narrow interbedded clay and silt/clay lenses were encountered down to 8 to 9 m (25 to 30 ft) bgs. The depth to the first groundwater aquifer, assumed to be unconfined, was generally 3.5 to 5 m (12 to 15 ft) bgs. This aquifer extends to about 9 m (30 ft) bgs, and is probably connected to a second aquifer from 9 to 15 m (30 to 50 ft) bgs.
In August 1995, the Corps completed 23 samples with the SCAPS HS at 22 locations near the building. The samples were collected from direct push sampling points with a 1-m (4-ft) screened interval. The center of the screened intervals was between 4 and 6 m (13 and 20 ft) bgs, except for one
93

location where samples were collected at 13 and 21 m (43 and 68 ft) bgs. After each hydrosparge sample a duplicate sample was collected by bailer for offsite laboratory analysis.
TCA was found in the samples at concentrations ranging from non-detect (<5 :g/L) to 1,300 :g/L. Correlation with the offsite laboratory results was good (R2= 0.98).
Case Study 2: NAS Whiting Field is a fixed-wing aircraft and helicopter training base with associated support facilities. Contaminants at the site include chlorinated solvents and petroleum hydrocarbons from an underground waste solvent storage area, an aviation gasoline tank sludge disposal area, and an open burning and disposal area. The stratigraphy consists of sand, clayey silt and silty clay interspersed with clay and gravel lenses, beds and stringers. Cone penetrometer penetrations were completed to depths ranging from 20 to 74 m (64 to 243 ft) bgs, while hydrosparge measurements were taken at depths between 27 to 56 m (87 and 184 ft) bgs. An initial push with a conventional CPT probe was completed at each sampling location to define soil stratigraphy and dynamic pore pressures. A separate push was completed for each groundwater sampling depth identified using the CPT probe. Five locations with measurements at one to three depths per location were taken with both the hydrosparge and EPA Method 8260B, for a total of nine determinations.
A comparison of the hydrosparge data with the offsite laboratory data indicated a good fit. TCE values ranged from 2 :g/L to 170 :g/L.
Proton Magnetic Resonance
While intended for groundwater prospecting, proton magnetic resonance is sensitive to the presence of hydrogen and might be used for locating contaminant masses that contain hydrogen (Figure 7-7).
Figure 7-7. NUMIS Proton Magnetic Resonance System.
Courtesy of IRIS Instruments
How It Works. Alternating current is pulsed through a wire loop that is placed on the ground. The frequency of the current is chosen based on the local magnetic field of the earth. The pulse creates a magnetic field that affects the hydrogen atom’s magnetic moment and causes the atoms to precess about the applied magnetic field. The interruption of the field produces a decay signal that can be measured at the surface. The decay signal is proportional to the hydrogen content of the soil. The hydrogen content of the soil is influenced by the presence of water, hydrogen containing DNAPL compounds, and minerals that contain hydrogen. Increasing the intensity of the signal increases its depth but does not affect the amplitude of the decay signal (unless more water is encountered with depth). The maximum penetration depth is about 150 m (490 ft).
DNAPL Uses: This technique might find a use in detecting DNAPL residuals in the vadose zone and estimating their volume, but to date has not been applied for this purpose.
Drawbacks: The technique does not differentiate between water and other hydrogen containingmaterials.
Sonic CPT Probing
Adding a sonic vibratory device to a conventional CPT rig increases its ability to penetrate subsurface matrices in which a regular CPT unit would meet refusal and increases its total depth capabilities.
94

How It Works. The sonic drive unit utilizes two counter-rotating eccentric weights to induce a sinusoidal driving force equivalent to the vertical acceleration of the eccentric weights times their mass. The counter-rotating weights are adjustable such that the eccentricity of the masses can be changed yielding five different eccentricity settings. This adjustability allows the operator to optimize the system’s performance by varying the operating frequency range and amplitude. The addition of vibratory energy to the CPT system reduces the frictional resistance of the soil along the rod string, which allows a greater proportion of the available push force to be directed to the tip. The additional tip force allows for greater penetration (Martin et al., 2000).
DNAPL Uses: This innovation extends the depth and type of soil matrix that a CPT can be used in. It also extends the capabilities of the various tools (discussed in Section 6) that are used with a CPT to investigate DNAPLs.
Drawbacks: When used in a sonic mode, the CPT does not produce standard tip to sleeve ratios that can be used to estimate the type of stratigraphy being penetrated. The tools used with the CPT (e.g., LIF, FFD, conductivity, downhole camera) have to be modified (hardened) to survive the added vibration.
95

This Page Left Intentionally Blank

Section 8 CONCLUSIONS
There is a growing range of screening and analytical tools that have been used to aid in locating and characterizing DNAPLs in a wide variety—but not all—settings. Some of the tools represent new technology, such as LIF and direct push rigs. Others represent innovative applications of traditional technologies, such as the use of CPT and seismic reflection AVO. This report has reviewed many of the technologies and approaches that have been used to characterize DNAPL sites.
Non-Geophysical Methods
The past ten years has seen a marked improvement in the capability of technologies to collect and analyze soil and water samples in the field. Dual tube DP equipment provides a means of inexpensively obtaining continuous cores for examination of preferential pathways and qualitative or quantitative onsite analysis. In some settings, dual tube DP equipment can also be used to obtain groundwater samples. Both DP and CPT rigs may be equipped with a variety of innovative probes. The advantage of new probes, such as conductivity, LIF, FFD, MIP, and downhole cameras, lies in their speed of advance and their ability to measure various soil properties and chemicals in-situ and nearly continuously. Vertical relative and actual concentration profiles provided by these instruments and the XSD discussed in Section 7 provide a key tool for increasing the probability of locating a DNAPL at a site that is not available with more conventional grab sampling.
While in-situ groundwater samplers, such as BAT® and HydroPunch®, require some prior knowledge of stratigraphy to target specific flowpath regimes, they are useful to refine the conceptual site model as to contaminant flowpaths and potentially locate DNAPLs. They can locate the DNAPL by identifying areas of high concentrations in the dissolved phase of the DNAPL chemical in an overall plume that can be traced back to their source. Their advantage over the screening tools is they provide samples that can be analyzed by standard methods with standard QA/QC to give a quantitative concentration. The hydrosparge method discussed in Section 7 can be used to screen a depth and use the onsite instrumentation result to determine if a sample should be taken for confirmatory analysis.
Geophysical Methods
Geophysical techniques have historically been used for stratigraphic mapping of the subsurface to provide a geologic construct that aids in determining sampling locations for intrusive techniques rather than looking for the DNAPLs themselves. The resolution of the methods is rarely sufficient to locate thin preferential pathways or small pockets of DNAPL. Most of the surface techniques also have problems with interpreting heterogenous interbedded and discontinuous stratigraphies where DNAPLs are particularly difficult to locate. However, they can be useful in some settings and should be evaluated when an investigation is planned.
There are several geophysical techniques that have shown promise of being able to detect anomalies associated with the presence of a DNAPL mass. Complex resistivity, which measures differences in subsurface chargeability, has been used to delineate the extent of DNAPLs associated with soils containing clays. EM offset logging, using surface to borehole techniques has had limited success in locating DNAPL masses. Finally, seismic reflection using AVO analysis has detected anomalies in areas previously known to have DNAPLs. These techniques, while not new to the geophysical community are relatively new to the environmental community and it remains to be seen how useful they may become in environmental investigations. They are generally sufficiently expensive to merit
97

consideration only when the remediation strategy calls for DNAPL removal and the general location of the DNAPL is already known.
In all geophysical methods, if a DNAPL mass is the target, it must be large enough for the technique to resolve and present a sufficient geophysical contrast to the surrounding soil/rock/fluid matrix to appear as an anomaly for the given method. As was discussed in the geophysics section, these conditions can be, but rarely are, met.
In summary, DNAPLs, while difficult to locate, have been found using the correct mix of tools for the site-specific conditions. While locating and remediating DNAPLs in bedrock poses the greatest challenge due to the cost of direct sampling and the risk of creating new, unwanted preferential pathways, a systematic planning approach that considers the wide variety of complementary tools available raises the probability of success.
98
REFERENCES
Abdel Aal, G., E. Atekwana, L. Slater, and C. Ulrich. 2003. Induced polarization (IP) measurements of soils from an aged hydrocarbon contaminated site. Proceedings of Symposium on the Application of Geophysics to Engineering and Environmental Problems, April 6-10, 2003, San Antonio, Texas. Environmental and Engineering Geophysical Society.
Aller, L. et al. 1987. DRASTIC: A Standardized System for Evaluating Ground Water Pollution Potential Using Hydrogeologic Settings. EPA 600-2-87-035, NTIS: PB87-213914.
Aristodemou, E. and A. Thomas-Betts. 2000. DC resistivity and induced polarization investigations at a waste disposal site and its environs. Journal of Applied Geophysics 44 (2000) p 275-302.
Atekwana, E. et al. 2001. Changes in geoelectrical properties accompanying Microbial degradation of LNAPL. Proceedings of Symposium on the Application of Geophysics to Engineering and Environmental Problems, March 4-7, 2001, Denver Colorado. Environmental and Engineering Geophysical Society.
Atekwana, E. et al. 2004. Relationship between biodegradation and bulk electrical conductivity. Proceedings of Symposium on the Application of Geophysics to Engineering and Environmental Problems, February 22-26, 2004, Colorado Springs, Colorado. Environmental and Engineering Geophysical Society.
Baker Environmental, Inc. 1999. DNAPL Site Characterization Using a Partitioning Interwell Tracer Test at Site 88, Marine Corps Base Camp Lejuene, North Carolina. Department of the Navy, Atlantic Division, Naval Facilities Engineering Command, Norfolk, VA. http://enviro.nfesc.navy.mil/erb/support/tat/dnapl.htm.
Baker Environmental, Inc. 2001. Supplemental Investigation and Technology Evaluation Report Operable Unit No. 15 (Site 89) Marine Corps Base Camp Lejeune, North Carolina. Department of the Navy, Atlantic Division, Naval Facilities Engineering Command, Norfolk, VA.
Baker, G., D. Steeples, C. Schmeissner, and K. Spikes. 2000. Collecting seismic-reflection data from depths shallower than three meters. Proceedings of Symposium on the Application of Geophysics to Engineering and Environmental Problems, February 20-24, 2000, Arlington, VA. Environmental and Engineering Geophysical Society.
Baker, G. and D. Steeples. 2001. Ultrashallow seismic reflection monitoring of seasonal fluctuations in the water table. The Geological Society of America Annual Meeting, November 5-8, 2001, Boston, Massachusetts.
Boulding, J. 1993. Use of Airborne, Surface, and Borehole Geophysical Techniques at Contaminated Sites. EPA 625-R-92-007, NTIS: PB94-123825.
Burton, M., E. Atekwana, and E. Atekwana. 2003. Mineral grain surface observations at a hydrocarbon-contaminated aquifer: implications for the geoelectrical properties of soils. Proceedings of Symposium on the Application of Geophysics to Engineering and Environmental Problems, April 6-10, 2003, San Antonio, Texas. Environmental and Engineering Geophysical Society.
California Environmental Protection Agency. 2000. Hazardous Waste Technology Certification Program Evaluation Report: Site Characterization and Analysis Penetrometer System Hydrosparge
99

VOC Sensor (SCAPS HS) as an In-situ Field Screening Technology for the Detection of Selected Volatile Organic Compounds in Groundwater. http://www.calepa.ca.gov/calcert/CertifiedTech/SCAPS.htm
Christy, T. 1998. A permeable membrane sensor for the detection of volatile compounds in soil. Symposium on the Application of Geophysics to Engineering and Environmental Problems, March 2226, 1998 Chicago, IL. p 65-72.
Christy, T. undated. A Permeable Membrane Sensor for the Detection of Volatile Compounds in Soil. Geoprobe Systems, Salina, Kansas. http://www.geoprobe.com/diweb/products/mip/mip.htm
Ciba Specialty Chemicals. 1998. Final Non-Aqueous Phase Liquid (NAPL) Action Plan Investigation Report, Toms River Site. Ciba Specialty Chemicals Corporate Remediation, Toms River, New Jersey.
Cohen, R. and J. Mercer. 1993. DNAPL Site Evaluation. CRC Press, Boca Raton, FL. [Also available as EPA Publication EPA 600-R-93-022, 1993].
Crumbling, D. et al. 2001. Managing uncertainty in environmental decisions: applying the concept of effective data at contaminated sites could reduce costs and improve cleanups. Environmental Science & Technology 35:9, p 404A-409A. Article reprint is available at the following website: http://cluin.org/download/char/oct01est.pdf
ESTCP. 2001. Tri-Service Site Characterization and Analysis Penetrometer System (SCAPS) Thermal Desorption Sampler for Volatile Organic Compounds. Environmental Security Technology Certification Program, USDoD. http://estcp.org/
Feenstra, D., M. Mackay, and J. Cherry. 1991. A method for assessing residual NAPL based on organic chemical concentrations in soil samples. Ground Water Monitoring Review, Spring.
Granger, E. and S. Peavy. 2000. Location and delineation of subsurface tar contamination using electrical methods. Symposium on the Application of Geophysics to Engineering and Environmental Problems, February 20-24, 2000 Arlington, VA. p 689-698.
Greenhouse, J., P. Guddjurgis, and D. Slaine. 1998. Reference Notes: Applications of Geophysics in Environmental Investigations. Environmental and Engineering Geophysical Society.
ITRC. 2003. Technical and Regulatory Guidance for the Triad Approach: A New Paradigm for Environmental Project Management. Interstate Technology and Regulatory Council. 110 pp.
Kram, M., A. Keller, J. Rossabi, and L. Everett. 2001. DNAPL characterization methods and approaches, Part 1: performance comparisons. Ground Water Monitoring and Remediation, Vol 21, No 4, p 109-123.
Kram, M., A. Keller, J. Rossabi, and L. Everett. 2002. DNAPL characterization methods and approaches, Part 2: cost comparisons. Ground Water Monitoring and Remediation, Vol 22, No 1, p 4661.
LaBrecque, D. et al. 1997. Effective electrical resistivity tomography surveys for environmental monitoring. The Symposium on the Application of Geophysics to Environmental and Engineering Problems (SAGEEP), 23-26 March 1997, Reno, Nevada. Environmental and Engineering Geophysical Society (EEGS), Wheat Ridge, CO. p 881-887.
100

LaBrecque, D. et al. 1998. Electrical resistivity tomography monitoring for process control in environmental remediation. The Symposium on the Application of Geophysics to Environmental and Engineering Problems (SAGEEP), 22-26 March 1998, Chicago, Illinois. Environmental and Engineering Geophysical Society (EEGS), Wheat Ridge, CO. p 613-622.
Martin, L., et al. 2000. Sonic CPT Probing in Support of DNAPL Characterization Final Report. AFRL-ML-TY-TR-2000-4574. Air Force Research Laboratory, Tyndall Air Force Base, FL.
Murray, C., D. Keiswetter, and E. Rostosky. 1999. Seismic refraction case studies at environmental sites. The Symposium on the Application of Geophysics to Engineering and Environmental Problems, March 14-18, 1999, Oakland, CA. p 235-244.
Mwanda, K , E. Atekwana, and W. Sauck. 2002. Multi-method geophysical examination of a hydrocarbon contaminated site. Proceedings of Symposium on the Application of Geophysics to Engineering and Environmental Problems, February 10-14, 2002, Las Vegas, Nevada. Environmental and Engineering Geophysical Society.
National Research Council (NRC). 1994. Alternatives for Ground Water Cleanup. National Academy Press, Washington, DC.
Newell, C. and R. Ross. 1992. Estimating Potential for Occurrence of DNAPL at Superfund Sites. EPA Publication 9355.4-07FS, NTIS: PB92-963338.
Newmark, R., W. Daly, K. Kyle, and A. Ramirez. 1998. Monitoring DNAPL pumping using integrated geophysical techniques. JEEG, Vol. 3, Issue 1, March 1998, p 7-13.
Olhoeft, G. 1985. Low frequency electrical properties. Geophysics, 50, pp. 2492-2503.
Olhoeft, G. 1992. Geophysics Advisor Expert System, Version 2.0. U.S. Geological Survey Open File Report 92-526. [Also available as EPA Publication EPA 600-R-92-200, 1992].
Parasnis, D. 1997. Principles of Applied Geophysics. Chapman & Hall, London.
Pankow, J., and J. Cherry. 1996. Dense Chlorinated Solvents and Other DNAPL’s in Groundwater: History, Behavior, and Remediation. Waterloo Press: Portland, Oregon.
Pitkin, S., J. Cherry, R. Ingleton, and M. Broholm. 1999. Field demonstrations using the Waterloo ground water Profiler. Ground Water Monitoring & Remediation, Vol 19, No.2, Spring, p 122-131.
Powers, C., K. Singha, and P. Haeni. 1999. Integration of surface geophysical methods for fracture detection in bedrock at Mirror Lake, New Hampshire. Proceedings: USGS Toxic Substances Hydrology Meeting, Charleston, SC, March 8-12, 1999.
Precision Sampling, Inc. 2000. Technical Note 3: The Waterloo Profiler for Groundwater Sampling. http://www.precisionsampling.com.
Ramirez, A., W. Daily, and D. LaBrecque. 1996. Complex electrical resistance tomography of a subsurface PCE plume. Symposium on the Application of Geophysics to Engineering and Environmental Problems (SAGEEP), 28 April-1 May 1996, Keystone, Colorado. p 753-762.
101

SAIC. 2001. Phase I of the Offpost Remedial Investigation Hydrogeologic Characterization of the Jacksonville Thrust Fault at Anniston Army Depot Anniston, Alabama. U.S. Army Corps of Engineers, Mobile District, Mobile AL.
SERDP. 2001. Final Report, SERDP/ESTCP Expert Panel Workshop on Research and Development Needs for Cleanup of Chlorinated Solvent Sites. Strategic Environmental Research and Development Program sponsored by USDoD, USDOE, and USEPA.
Slater, L., A. Binley, and A. Kemna. 2000. Case studies of engineering and environmental applications of induced polarization imaging. The First International Conference on the Application of Geophysical Methodologies & NDT to Transportation Facilities and Infrastructure, December 11-15th 2000 St. Louis, Missouri.
Smart, L., M. Nash, and W. Sauck. 2004. Wurtsmith Air Force Base revisited. Proceedings of Symposium on the Application of Geophysics to Engineering and Environmental Problems, February 22-26, 2004, Colorado Springs, Colorado. Environmental and Engineering Geophysical Society.
Struder, J. and P. Mariner. 2000. DNAPL and residual water characterization in the vadose zone using the partitioning interwell tracer test (PITT). Vadose Zone Science and Technology Solutions, B. Looney and R. Falta, eds. Battelle Press.
Struder, J. et al. 1996. Application of a NAPL Partitioning Interwell Tracer Test (PITT) to Support DNAPL Remediation at the Sandia National Laboratories/New Mexico Chemical Waste Landfill. DOE, SAND96-0899C.
Taylor, R. 1984. The determination of joint orientation and porosity from azimuthal resistivity measurements. Surface and Borehole Geophysical Methods in Ground Water Investigations. National Water Well Association, p 37-49.
Taylor, R. and A. Fleming. 1988. Characterizing jointed systems by azimuthal resistivity surveys. Ground Water; V26 N4; p 464-473.
USDoD. 2000. Cost and Performance Report: Electromagnetic Surveys for 3-D Imaging of Subsurface Contaminants. Environmental Security Technology Certification Program. http://www.estcp.org/documents/techdocs/index.cfm.
USDOE. 2000. Innovative Technology Summary Report: Ribbon NAPL Sampler. EM-0522, 23 pp. http://apps.em.doe.gov/ost/pubs/itsrs/itsr2238.pdf
USEPA. 1992. Dense Nonaqueous Phase Liquids: A Workshop Summary, Dallas, Texas, April 16-18, 1991. EPA 600-R-92-030, NTIS: PB92-178938. http://www.geotransinc.com/publications/DNAPL_Workshop.pdf
USEPA. 1993a. Guidance for Evaluating the Technical Impracticability of Ground-Water Restoration. EPA 540-R-93-080, EPA Directive 9234.2-25, NTIS: PB93-963507. http://www.epa.gov/superfund/resources/gwdocs/non_aqu.htm
USEPA. 1993b. Subsurface Characterization and Monitoring Techniques: A Desk Reference Guide, Vol. 1: Solids and Ground Water, Appendices A and B. EPA 625-R-93-003a, NTIS: PB94-136272. http://www.epa.gov/clariton/clhtml/pubtitleORD.html
102

USEPA. 1997. Field Analytical and Site Characterization Technologies: Summary of Applications. EPA 542-R-97-011. http://clu-in.org/download/char/fasc.pdf
USEPA. 2000a. Guidance for the Data Quality Objectives Process. EPA 600-R-96-055, EPA QA/G-4. http://www.epa.gov/quality/qa_docs.html
USEPA. 2000b. Innovations in Site Characterization: Geophysical Investigations at Hazardous Waste Sites. EPA 542-R-00-003. http://www.epa.gov/tio/pubichar.htm
USEPA. 2002. Technical Approaches to Characterizing and Cleaning up Brownfields Sites: Railroad Yards. EPA 625-R-02-007. Office of Research and Development. http://www.epa.gov/ORD/NRMRL/Pubs/625R02006/
USEPA. 2003. Report on Innovative Approaches to Manufactured Gas Plant Site Characterization. EPA 542-R-01-003. Technology Innovation Office.
USEPA. 2004. In Situ Thermal Treatment of Chlorinated Solvents: Fundamentals and Field Applications. EPA-542-R-04-010. Office of Superfund Remediation and Technology Innovation.
Vroblesky, D. and B. Peters. 2000. Diffusion Sampler Testing at Naval Air Station North Island, San Diego County, California, November 1999 to January 2000. Water Resources Investigation Report 004182. USGS in cooperation with Southwestern Division Naval Facilities Engineering Command.
Waddell, M., W. Domoracki, and T. Temples. 2000. Non-invasive determination of the location and distribution of free-phase dense nonaqueous phase liquids (DNAPL) by seismic reflection techniques. Industry Partnerships for Environmental Science and Technology, 17-19 October 2000.
Waddell, M., W. Domoracki, and T. Temples. 2001. Non-Invasive Determination of the Location and Distribution of Free-Phase Dense Nonaqueous Phase Liquids (DNAPL) by Seismic Reflection Techniques, Annual Technical Progress Report. Earth Sciences and Resources Institute, Columbia South Carolina.
Watkins, M., E. Sieber, and G. Christians. 1995. An integrated approach for assessing the potential presence and distribution of DNAPLs at a Superfund site in New Jersey. Proceedings of the Ninth National Outdoor Action Conference, National Ground Water Association.
Werkema, D., E. Atekwana, A. Endres, and W. Sauck. 2002. Temporal and spatial variability of high resolution in situ Vertical apparent resistivity measurements at a LNAPL Impacted site. Proceedings of Symposium on the Application of Geophysics to Engineering and Environmental Problems, February 10-14, 2002, Las Vegas, Nevada. Environmental and Engineering Geophysical Society.
Werkema, D. et al. 2004. Laboratory and field results linking high bulk conductivities to the microbial degradation of petroleum hydrocarbons. Proceedings of Symposium on the Application of Geophysics to Engineering and Environmental Problems, February 22-26, 2004, Colorado Springs, Colorado. Environmental and Engineering Geophysical Society.
103

This Page Left Intentionally Blank

GLOSSARY
accelerometer. A device for measuring acceleration or for detecting and measuring vibrations.acoustic. Operated by or using sound waves.apparent metal factor. Frequency domain measure of induced polarization. capillary fringe. The zone above the water table in which water is held by surface tension. Water in thecapillary fringe is under a pressure less than atmospheric (USGS). chargeability. The normalized area under an induced polarization decay curve, between two times,after the transmitted current is stopped in a time domain survey (Greenhouse et al., 1998).conductivity. The ability of a material to transmit an electric current.effective solubility. The solubility of a chemical mixture that takes into account each individualchemical’s concentration and solubility.electrode. A conductor used to establish electric contact with the ground.hardpan. A relatively hard, impervious, and usually clayey layer of soil lying at or just below landsurface; produced as a result of cementation by precipitation of insoluble minerals (USGS). hydraulic conductivity. The capacity of a rock or soil to transmit water. It is expressed as the volumeof water at the existing kinematic viscosity that will move in unit time under a unit hydraulic gradientthrough a unit area measured at right angles to the direction of flow (USGS).hydrophobic. Not capable of uniting with or absorbing water (USGS).inclinometer. An instrument for measuring the inclination of a borehole from true vertical. in-phase. In geophysics a signal that is coincident with a reference phase.Nafion™. A perfluorinated polymer containing small proportions of sulfonic or carboxylic ionicfunctional groups. It has found widespread use in separating hydrophobic from hydrophilic chemicals.overburden. Unconsolidated rock material, whether residual or transported, that overlies bedrock. phase shift. A change in the phase of a periodic signal.polarizability. A measurement that describes the average dipole moment induced on a particle in anapplied field.quadrature phase. In geophysics, a signal that is 90 degrees behind a reference phase.resistivity. The capacity of a material to resist the flow of electrical current.specific gravity. The ratio of the weight of a substance to the weight of an equal volume of a referencesubstance (typically water) measured at the same temperature (generally 4 degrees Celsius where waterequals 1 g/cm3).stacking. The process of taking multiple readings at the same location and averaging them.stratigraphy. The arrangement and order of rock layers (consolidated and unconsolidated).strike. The direction taken by a structural surface.thermistor. A device whose electrical resistance varies in a known manner with temperature.tomography. A method of determining the 3-D physical properties of a subsurface section bymathematically inverting the results of a large number of measurements.triaxial geophone. A downhole device for measuring compression and shear waves that contains threesensing elements, one vertical and two orthogonal.turbidity. The state, condition, or quality of opaqueness or reduced clarity of a fluid due to the presenceof suspended matter (USGS). ultraviolet light. Light with wavelengths ranging between 1 X 10⁻⁸ and 4 X 10⁻⁷ m.vadose zone. The area between land surface and the first saturated zone (water at atmospheric pressure).
105

This Page Left Intentionally Blank

APPENDIX A:REFERENCE APPENDIX

This Page Left Intentionally Blank

APPENDIX A:ADDITIONAL READING
Innovative Sampling and Measurement Tools and Approaches (Non-Geophysical)
Annable, M. et al. 1998. Field evaluation of interfacial and partitioning tracers for characterization of effective NAPL-water contact areas. Ground Water, Vol 36 No 3, p 495-500.
Baumann, T., S. Haaszio, and R. Niessner. 2000. Applications of a laser-induced fluorescence spectroscopy sensor in aquatic systems. Water Research, Vol 34 No 4, p 1318-1326.
Bennett, A., S. Jones, and R. Morris. 1999. Field measurement procedures for contaminants from former gasworks. Land Contamination and Reclamation, Vol 7 No 3, p 199-208.
Bürck, J. 1999. SPME in near-infrared fiber-optic evanescent field absorption spectroscopy: a method for rapid, remote in-situ monitoring of non-polar organic compounds in water. Applications of Solid Phase Microextraction, Springer-Verlag, NY. (RSC Chromatography Monographs) ISBN: 0-85404-525-2. Chapter 46, p 638-653.
Burton, J. et al. 1993. Expedited site characterization: a rapid, cost-effective process for preremedial site characterization. Proceedings of Superfund XIV Conference and Exhibition. Hazardous Materials Control Resources Institute, Rockville, MD. Vol 2, p 809-826.
Chapelle, F. 1993. Ground-Water Microbiology and Geochemistry. John Wiley, NY.
Costanza, J. and W. Davis. 2000. Rapid detection of volatile organic compounds in the subsurface by membrane introduction into a direct sampling ion-trap mass spectrometer. Field Analytical Chemistry & Technology, Vol 4 No 5, p 246-254.
Costanza, J. and W. Davis. 2000. Rapid detection of volatile organic compounds in the subsurface by membrane introduction into a direct sampling ion trap mass spectrometer. American Geophysical Union Spring Meeting 2000.
Davis, B., M. Humphrey, J. Istok, and L. Semprini. 1999. Radon-222 as a natural tracer for locating and quantifying residual NAPL contamination in the subsurface. 1999 American Geophysical Union Fall Meeting.
Deeds, N., G. Pope, and D. McKinney. 1999. Vadose zone characterization at a contaminated field site using partitioning interwell tracer technology. Environmental Science & Technology, Vol 33 No 16, p 2745-2751.
Duran, J.M. and J.A. Grounds. 1996. Site characterization of a complex DNAPL site: an Australian experience. Non-Aqueous Phase Liquids (NAPLS) in Subsurface Environment: Assessment and Remediation, 12-14 November 1996, Washington, DC. American Society of Civil Engineers, New York, NY, p 800-811.
Feenstra, S., D. Mackay, and J. Cherry. 1991. A method for assessing residual NAPL based on organic chemical concentrations in soil samples. Ground Water Monitoring and Remediation, Vol 11 No 2, p 128-136.
A-1

Gildea, M. et al. 2000. Sonic CPT Probing in Support of DNAPL Characterization, Report Number: ARA-4717. NTIS: ADA384783. 104 pp.
Gorshteyn, A., Z. Kataenko, S. Smarason, and A. Robbat. 1999. Subsurface detection of environmental pollutants. Instrumentation Science & Technology, Vol 27 No 1, 1999.
Gorshteyn, A. and A. Robbat. 2000. Rapid in situ collection and analysis of semivolatile organics by thermal extraction cone penetrometry gas chromatography/mass spectrometry. Field Analytical Chemistry & Technology, Vol 4 No 2-3, p 85-92.
Hwang, D., C. Reitman, and W. Richardson. 1996. Evaluation of a bedrock DNAPL pool site. Non-Aqueous Phase Liquids (NAPLS) in Subsurface Environment: Assessment and Remediation, 12-14 November 1996, Washington, DC. American Society of Civil Engineers, New York, NY, p 731-742.
Illangasekare, T., G. Barth, M. Hill, and H. Rajaram. 1999. Tracer sensitivity to entrapped nonaqueous-phase liquids: intermediate scale experiments in heterogeneous porous media. 1999 Conference on Hazardous Waste Research.
Kavanaugh, M. et al. 2003. The DNAPL Remediation Challenge: Is There a Case for Source Depletion? EPA-600-R-03-143. Office of Research and Development.
Kram, M., S. Lieberman, J. Fee, and A. Keller. 2001. Use of LIF for real-time in-situ mixed NAPL source zone detection. Ground Water Monitoring and Remediation, Vol 21 No 1, p 67-76.
Kram, M., A. Keller, S. Massick, and L. Laverman. 2004. Complex NAPL site characterization using fluorescence, Part 1: Selection of excitation wavelength based on NAPL composition. Soil and Sediment Contamination: An International Journal, Vol 13 No 2, p 103-118.
Kram, M. and A. Keller. 2004. Complex NAPL site characterization using fluorescence, Part 2: analysis of soil matrix effects on the excitation/mission matrix. Soil and Sediment Contamination: An International Journal, Vol 13 No 2, p 119-134.
Kram, M. and A. Keller. 2004. Complex NAPL site characterization using fluorescence, Part 3: detection capabilities for specific excitation sources. Soil and Sediment Contamination: An International Journal, Vol 13 No 2, p 135-148.
Lieberman, S. 2000. Direct push optical-based sensor systems for characterizing the subsurface soil environment. American Geophysical Union Spring Meeting 2000.
MacFabe, S., D. Rudolph, and C.J. Scholl. 1998. Delineation of a chlorinated-solvents plume in complex stratigraphy using the Waterloo (Ingleton) Profiler. SAGEEP 1998: Symposium on the Application of Geophysics to Environmental & Engineering Problems. Environmental and Engineering Geophysical Society, Denver, CO.
Meinardus, H., et al. 2002. Performance assessment of NAPL remediation in heterogeneous alluvium. Journal of Contaminant Hydrology, 54 (2002), pp. 173-193.
Michalski, A., M. Metlitz, and I. Whitman. 1995. A field study of enhanced recovery of DNAPL pooled below the water table. Ground Water Monitoring and Remediation, Vol 15 No 1, p 90-100.
A-2

Nicot, J., D. McKinney, and G. Pope. 1997. Inverse modeling of field tracer data to characterize DNAPL contamination. Aesthetics in the Constructed Environment: Proceedings of the 24th Annual Water Resources Planning and Management Conference, 6-9 April 1997, Houston, Texas. American Society of Civil Engineers, Reston, VA. ISBN: 0-7844-0228-0, p 420-425.
Pankow, J. and J. Cherry. 1996. Dense Chlorinated Solvents and Other DNAPLs in Groundwater: History, Behavior, and Remediation. Waterloo Press, Portland, OR.
Pirestani, K. and P. Imhoff. 2000. Effect of mass transfer rate limitations on the use of partitioning tracers for the characterization of DNAPL micropools in the subsurface. Eos Trans. AGU, Vol 81 No 48, Fall Meet. Suppl., Abstract H71B-08.
Precision Sampling, Inc. 1997. The Waterloo ProfilerTM for Groundwater Sampling. Technical Note No 5.
Robbat, A. 2001. Environmental applications of thermal extraction cone penetrometry and ultrafast gas chromatography/mass spectrometry. Field Analytical Chemistry & Technology, Vol 5 No 1-2, p 60-68.
RTDF. 1996. Guidance Handbook on Natural Attenuation of Chlorinated Solvents. Remediation Technologies Development Forum, Bioremediation of Chlorinated Solvents Consortium.
Schilling, K. and P. Provost. 1997. Expedited characterization and remediation of a PCE-contaminated site. Proceedings of the Eleventh Outdoor Action Conference and Exposition: Aquifer Remediation, Ground Water Monitoring, Geophysical methods, 1-3 April 1997, Las Vegas, Nevada. National Ground Water Association, Dublin, OH. p 247-258.
Schneider, I., I. Aggarwal, G. Nau, and T. King. 1995. Fiber-optic near-infrared reflectance sensor for detection of organics in soils. IEEE Photonics Technology Letters (Institute of Electrical and Electronics Engineers), Vol 71, p 87-88.
Smith, M. and M. Noll. 1995. Groundwater remediation field laboratory for DNAPL remediation research. Ground Water, Vol 33 No 5, p 837-838.
Trantham, H. and D. Durnford. 1998. DNAPL source zone characterization using a stochastic aggregation model. Proceedings of the 1998 Conference on Hazardous Waste Research: Bridging Gaps in Technology and Culture, 18-21 May 1998, Snowbird, UT.
Wickramanayake, G. and R. Hinchee (eds.). 1998. Nonaqueous-Phase Liquids: Remediation of Chlorinated and Recalcitrant Compounds. Battelle Press, Columbus, OH.
Young, C. et al. 1999. Characterization of a TCE DNAPL zone in alluvium by partitioning tracers . Ground Water Monitoring and Remediation, Vol 19 No 1, p 84-94.
Geophysical Methods
Abbey, D., C. Mwenifumbo, and P. Killeen. 1997. The application of borehole geophysics to the delineation of leachate contamination at the Trail Road Landfill Site: Nepean, Ontario. SAGEEP 1997: Symposium on the Application of Geophysics to Environmental & Engineering Problems. Environmental and Engineering Geophysical Society, Denver, CO. p 163-171.
A-3

Adams, M-L. et al. 1998. 3-D seismic reflection surveys for direct detection of DNAPL. First International Conference on Remediation of Chlorinated & Recalcitrant Compounds. Battelle Press, Columbus, OH.
Ahrens, T. (ed.). 1995. A Handbook of Physical Constants. American Geophysical Union.
Ajo-Franklin, J. et al. 2002. Integrated geophysical characterization of a NAPL-contaminated site using borehole and laboratory measurements. Eos Trans. AGU Fall Meet. Suppl., Vol 83 No 47, Abstract T22B-1142.
Ajo-Franklin, J. et al. 2003. Preliminary characterization of a NAPL-contaminated site using borehole geophysical techniques. SAGEEP 2003: Proceedings of the 15th Annual Symposium on the Application of Geophysics to Engineering and Environmental Problems. Environmental and Engineering Geophysical Society, Denver, CO. CD-ROM, p 202-220.
Ajo-Franklin, J. 2004. Using spatially integrated crosswell geophysics for environmental site assessment. 2004 Joint Assembly of the Canadian Geophysical Union, American Geophysical Union, Society of Exploration Geophysicists, and Environmental and Engineering Geophysical Society, 17-21 May 2004, Montreal, Canada. Eos Trans. AGU, Vol 85 No 17, Joint Assembly Supplement, Abstract NS23A-09.
Allen, P. 1997. Earth Surface Processes. Blackwell, Oxford.
Annan, A., et al. 1992. Geophysical monitoring of DNAPL migration in a sandy aquifer. Society of Exploration Geophysicists Technical Program, 62nd Annual International Meeting and Exposition, 2529 October 1992.
ASTM. 1973. Sampling, Standards and Homogeneity. ASTM, Spec. Tech. Publ. 540.
ASTM. 1970. Special Procedures for Testing Soil and Rock for Engineering Purposes. American Society for Testing & Materials.
Azaria, A. et al. 2000. 3-D seismic tomography survey at a groundwater contamination site. Eos Trans. AGU, 81 (48), Fall Meet. Suppl., Abstract S72A-04.
Bachrach, R., A. Nur, and J. Rickett. 1998. Seismic detection of viscous contaminant using shallow seismic reflection. SAGEEP 1998: Symposium on the Application of Geophysics to Environmental & Engineering Problems. Environmental and Engineering Geophysical Society, Denver, CO. p 685-694.
Bailey, J. and W. Sauck. 2000. Comparison of EM systems at the Western Michigan University geophysical test site. Proceedings of the Symposium on the Application of Geophysics to Engineering and Environmental Problems (SAGEEP), 20-24 February 2000, Arlington, Virginia. Environmental and Engineering Geophysical Society (EEGS), Wheat Ridge, CO. p 1147.
Bailey, J. et al. 1999. Geophysical imaging of a former landfill and its associated leachate plume. Proceedings of the Symposium on the Application of Geophysics to Engineering and Environmental Problems (SAGEEP), 14-18 March 1999, Oakland, California. Environmental and Engineering Geophysical Society (EEGS), Wheat Ridge, CO. p 487.
A-4

Bainer, R. et al. 1998. Preliminary Report on the Use of Geophysical Vertical Seismic Profiling Techniques for Site Characterization of Subsurface Structures at the Oak Ridge National Laboratory, Oak Ridge, Tennessee. Lawrence Livermore National Laboratory. UCRL-AR-129370.
Balanis, C. 1996. Antenna Theory: Analysis and Design. Wiley Press, NY.
Baldyga, C. and J. Fink. 2004. RPM—Residual potential mapping; a new approach to Mise-a-La-Masse. SAGEEP 2004: Symposium on the Application of Geophysics to Engineering and Environmental Problems, 22-26 February 2004, Colorado Springs, Colorado. Environmental and Engineering Geophysical Society, Denver, CO. CD-ROM, p 851-855.
Bauman, P. et al. 1999. Geophysics comes of age in oil sands development. Proceedings of the Symposium on the Application of Geophysics to Engineering and Environmental Problems (SAGEEP), 14-18 March 1999, Oakland, California. Environmental and Engineering Geophysical Society (EEGS), Wheat Ridge, CO. p 173.
Bauman, P., M. Lockhard, A. Sharma, and R. Kellett. 1997. Case studies of 2D resistivity surveying for soils, waste management, geotechnical, and groundwater contaminant investigations. SAGEEP 1997: Symposium on the Application of Geophysics to Environmental & Engineering Problems. Environmental and Engineering Geophysical Society, Denver, CO. p 261-269.
Bennett, A., S. Jones, and R. Morris. 1999. Field measurement procedures for contaminants from former gasworks. Land Contamination and Reclamation, Vol 7 No 3, p 199-208.
Berryman, J. 1995. Mixture theories for rock properties. Rock Physics & Phase Relations. American Geophysical Union.
Borns D., G. Newman, L. Stolarczyk, and W. Mondt. 1993. Cross borehole electromagnetic imaging of chemical and mixed waste landfills. SAGEEP 1993: Symposium on the Application of Geophysics to Environmental & Engineering Problems. Environmental and Engineering Geophysical Society, Denver, CO. p 91-105.
Bradford, J. 2004. 3D multi-offset, multi-polarization acquisition and processing of GPR data: a controlled DNAPL spill experiment. SAGEEP 2004: Symposium on the Application of Geophysics to Engineering and Environmental Problems, 22-26 February 2004, Colorado Springs, Colorado. Environmental and Engineering Geophysical Society, Denver, CO. p 514-527.
Brainard, J. et al. 2000. A hybrid hydrologic-geophysical inverse technique for the assessment and monitoring of leachates in the vadose zone. Eos Trans. AGU, Vol 81 No 48, Fall Meet. Suppl., Abstract H22C-10.
Brewster, M. et al. 1995. Observed migration of a controlled DNAPL release by geophysical methods. Ground Water, Vol 33 No 5, p 977-987.
Briggs, V. et al. 2004. Mapping of TCE and PCE contaminant plumes using a 3-D induced polarization borehole data. SAGEEP 2004: Symposium on the Application of Geophysics to Engineering and Environmental Problems, 22-26 February 2004, Colorado Springs, Colorado. Environmental and Engineering Geophysical Society, Denver, CO. p 472-483.
Bryar, T. and R. Knight. 2003. Detection limits for immiscible liquid organic contaminants using proton nuclear magnetic resonance. SAGEEP 2003: Symposium on the Application of Geophysics to
A-5
Engineering and Environmental Problems, 6-10 April 2003, San Antonio, Texas. Environmental and Engineering Geophysical Society, Denver, CO. CD-ROM, p 961-972.
Buderi, R. 1996. The Invention That Changed the World. Simon & Schuster.
Buettner, H. and J. Berryman. 1999. An electromagnetic induction tomography field experiment at Lost Hills, CA. Proceedings of the Symposium on the Application of Geophysics to Engineering and Environmental Problems (SAGEEP), 14-18 March 1999, Oakland, California. Environmental and Engineering Geophysical Society (EEGS), Wheat Ridge, CO. p 663, 1999.
Butler, D.K., et al. 1990. Comprehensive geophysics investigation of an existing dam foundation: engineering geophysics research and development. The Leading Edge, Vol 9 No 9, p 44-53.
Canan, B. 2001. Dielectric permittivity of clay-water-organic compound: frequency dependence. Proceedings of the Symposium on the Application of Geophysics to Engineering and Environmental Problems (SAGEEP), 4-7 March 2001, Denver, Colorado. Environmental and Engineering Geophysical Society (EEGS), Wheat Ridge, CO.
Carcione, J., H. Marcak, G. Seriani, and G. Padoan. 1999. GPR modeling study in a contaminated area of Krzywa Airbase. Journal of Conference Abstracts. European Union of Geosciences: EUG 10 Meeting, 28 March - 1 April 1999, Strasbourg, France.
Cardinell, A. and C. Daniel. 1997. Application of multiple geophysical methods to hydrologic and environmental investigations at U.S. Marine Corps installations in North Carolina. SAGEEP 1997: Symposium on the Application of Geophysics to Environmental & Engineering Problems. Environmental and Engineering Geophysical Society, Denver, CO.
Carr, M.H. 1996. Water on Mars. Oxford University Press, NY.
Chamberlain, S. and M. Neighbors. 2000. Characterization of DNAPLs at the Cape Canaveral Interagency Project. Proceedings of the Symposium on the Application of Geophysics to Engineering and Environmental Problems (SAGEEP), 20-24 February 2000, Arlington, Virginia. Environmental and Engineering Geophysical Society (EEGS), Wheat Ridge, CO. p 113.
Chambers, J. 2004. Noninvasive monitoring of DNAPL migration through a saturated porous medium using electrical impedance tomography. Journal of Contaminant Hydrology, Vol 68 No 1-2, p 1-22, Jan.
Clement, W., S. Cardimona, and K. Kadinsky-Cade. 1997. Geophysical and geotechnical site characterization data at the Groundwater Remediation Field Laboratory, Dover Air Force Base, Dover, Delaware. SAGEEP 1997: Symposium on the Application of Geophysics to Environmental & Engineering Problems. Environmental and Engineering Geophysical Society, Denver, CO. p 665-673.
Conyers, L. and D. Goodman. 1997. Ground-Penetrating Radar: an Introduction for Archaeologists. Altimira Press, Walnut Creek, CA.
Daily, W., A. Ramirez, D. LaBrecque, and J. Nitao. 1992. Electrical resistivity tomography of vadose water movement. Water Resources Research, Vol. 28, No. 5, p. 1429-1142.
Daily, W., A. Ramirez, and R. Johnson. 1998. Electrical impedance tomography of a perchloroethylene release. Journal of Environmental & Engineering Geophysics, Vol 2 No 3, p 189-201.
A-6

Daily, W. and A. Ramirez. 2004. Electrical Impedance tomography for detection of DNAPL contamination. SAGEEP 2004: Symposium on the Application of Geophysics to Engineering and Environmental Problems, 22-26 February 2004, Colorado Springs, Colorado. Environmental and Engineering Geophysical Society, Denver, CO. p 449-454.
Daley, T., J. Peterson, and E. Majer. 1999. Simultaneous acquisition of P- and S-wave crosswell seismic profiles in a contaminated basalt aquifer. Proceedings of the Symposium on the Application of Geophysics to Engineering and Environmental Problems (SAGEEP), 14-18 March 1999, Oakland, California. Environmental and Engineering Geophysical Society (EEGS), Wheat Ridge, CO. p 703.
Dana, D. et al. 2000. High resolution 3-D seismic investigations at a groundwater contamination site. Eos Trans. AGU, 81 (48), Fall Meet. Suppl., Abstract S72A-03.
Delaney, A. et al. 1997. Geophysical Investigations at a Buried Disposal Site on Fort Richardson, Alaska. U.S. Army Corps of Engineers Cold Regions Research and Engineering Laboratory. CRREL Report 97-4.
Dhont, J. and U. Singh. 1996. Addressing non-aqueous phase liquids and dissolved plumes at two adjacent Superfund sites with commingled groundwater contamination. Non-Aqueous Phase Liquids (NAPLS) in Subsurface Environment: Assessment and Remediation, 12-14 November 1996, Washington, DC. American Society of Civil Engineers, New York, NY, p 812-823.
Doll, W. et al. 2001. Evaluation of new geophysical tools for investigation of a landfill, Camp Roberts, California. Proceedings of the Symposium on the Application of Geophysics to Engineering and Environmental Problems (SAGEEP), 4-7 March 2001, Denver, Colorado. Environmental and Engineering Geophysical Society (EEGS), Wheat Ridge, CO. 2001.
Dubey, A., et al. (eds.). 1995. Detection technologies for mines and minelike targets. International Society for Optical Engineering, Bellingham, WA. Proceedings of SPIE, Vol 2496.
Duke, S. 1990. Calibration of Ground Penetrating Radar and Calculation of Attenuation and Dielectric Permittivity Versus Depth. MSc Thesis, Dept. of Geophysics, Colorado School of Mines, Golden, CO.
El-Hussain, I., J. Holbrook, and C. Sneed. 2000. Integrating geophysical and geological methods to delineate buried paleochannels in the New Madrid seismic zone of Southeastern Missouri. Proceedings of the Symposium on the Application of Geophysics to Engineering and Environmental Problems (SAGEEP), 20-24 February 2000, Arlington, Virginia. Environmental and Engineering Geophysical Society (EEGS), Wheat Ridge, CO. p 253.
Ellefsen, K. 1999. pick_xwell: A Program for Interactive Picking of Crosswell Seismic and Radar Data. U.S. Geological Survey Open-File Report 99-0534.
Farid, M., A. Alshawabkeh, and C. Rappaport. 2003. Laboratory experimental setup for cross-well radar. SAGEEP 2003: Symposium on the Application of Geophysics to Engineering and Environmental Problems, 6-10 April 2003, San Antonio, Texas. Environmental and Engineering Geophysical Society, Denver, CO. CD-ROM, p 623-634.
Farid, M., A. Alshawabkeh, and C. Rappaport. 2003. Modeling borehole dipole antenna patterns for cross-well radar DNAPL imaging. Proceedings of the 12th Pan-American Conference on Soil Mechanics and Foundation Engineering, Cambridge, Massachusetts, 22-25 June 2003, p 261-268.
A-7

Feddes, R.A. (ed.). 1995. Space and Time Scale Variability and Interdependences in Hydrological Processes. Cambridge University Press.
Finci, A. and D. Stanfill. 1998. Feasibility of Non-Intrusive and Remote Identification of Chemical Contaminants Using Ground Penetrating Radar (GPR). Report No: AFRL-MN-EG-TR-1999-7015. NTIS Order No: ADA363629. 37 pp.
Finci, A. and D. Stanfill. 1999. Electromagnetic radiography (EMR) for the detection of low-level chemical contamination in the ground. Environmental Monitoring and Remediation Technologies II. Proceedings of SPIE, Vol 3853, pp 49-59.
Gardiner, C.W. 1990. Handbook of Stochastic Methods for Physics, Chemistry and the Natural Sciences. 2nd corrected ed. Springer-Verlag, Berlin.
Gelb, S. and J. Wonder. 1998. ESC demonstration: D-Area oil seepage basin—Savannah River Site: a case study. SAGEEP 1998: Symposium on the Application of Geophysics to Environmental & Engineering Problems. Environmental and Engineering Geophysical Society, Denver, CO. p 551-560.
Geller, J., M. Kowalsky, P. Seifert, and K. Nihei. 2000. Acoustic detection of immiscible liquids in sand. Geophysical Research Letters, Vol 27 No 3, p 417-420.
Geller, J. et al. 2001. Mapping DNAPL Transport Contamination in Sedimentary and Fractured Rock Aquifers with High Resolution Borehole Seismic Imaging. Report No: LBNL-49385, 44 pp.
Geller, J., J. Ajo-Franklin, and E. Majer. 2003. Effect of immiscible liquid contaminants on P-wave Transmission through natural aquifer samples. SAGEEP 2003, Symposium on the Application of Geophysics to Engineering and Environmental Problems, 6-10 April 2003, San Antonio, TX. Environmental and Engineering Geophysical Society, Denver, CO. CD-ROM,[Paper No: LBNL-52131, 19 pp].
Geller, J. et al. 2003. NAPL Contaminant Location with High-Frequency Crosswell Seismic Methods. Lawrence Berkeley National Laboratory Environmental Remediation Technology Research Summary, p 94.
Gernand, J., B. Rundell, and C. Yen. 2001. Practical bedrock aquifer characterization using borehole geophysics and multi-level wells. Practice Periodical of Hazardous, Toxic, and Radioactive Waste Management, Vol 5 No 2, p 111-118.
Goldstein, L., S. Prasher, and S. Ghoshal. 2004. Porous media contamination: 3-dimensional visualization and quantification using x-ray computed tomography. 2004 Joint Assembly of the Canadian Geophysical Union, American Geophysical Union, Society of Exploration Geophysicists, and Environmental and Engineering Geophysical Society, 17-21 May 2004, Montreal, Canada. Eos Trans. AGU, Vol 85 No 17, Joint Assembly Supplement, Abstract NS23A-10, 2004.
Granger, E. and S. Peavy. 2000. Location and delineation of subsurface tar contamination using electrical methods. Proceedings of the Symposium on the Application of Geophysics to Engineering and Environmental Problems (SAGEEP), 20-24 February 2000, Arlington, Virginia. Environmental and Engineering Geophysical Society (EEGS), Wheat Ridge, CO. p 689.
Greenhouse, J. et al. 1993. Geophysics and solvents: the Borden experiment. The Leading Edge, Vol 12 No 4, p 261-267.
A-8

Griffin, T. and K. Watson. 2002. DNAPL site characterization: a comparison of field techniques. The Third International Conference Remediation of Chlorinated and Recalcitrant Compounds, 20-23 May 2002, Monterey, California. Battelle Press, Columbus, OH.
Grimm, R. and G. Olhoeft. 2004. Cross-hole complex resistivity survey for PCE at the SRS A-014 outfall. SAGEEP 2004: Symposium on the Application of Geophysics to Engineering and Environmental Problems, 22-26 February 2004, Colorado Springs, Colorado. Environmental and Engineering Geophysical Society, Denver, CO. p 455-464.
Gueguen, Y. and V. Palciauskas. 1994. Introduction to the Physics of Rocks. Princeton University Press, Princeton, NJ.
Guillen, D. and R. Hertzog. 2004. A survey of Department of Energy-sponsored geophysical research for shallow waste site characterization. Vadose Zone Journal Vol 3, p 122-133.
Guy, E. et al. 2000. Electromagnetic induction and GPR measurements for creosote contaminant investigation. Journal of Environmental & Engineering Geophysics, Vol 5 No 2, p 11-19.
Guy, G. et al. 2000. EM and GPR mapping of bedrock fractures as conduits for contaminated groundwater flow in a landfill. Proceedings of the Symposium on the Application of Geophysics to Engineering and Environmental Problems (SAGEEP), 20-24 February 2000, Arlington, Virginia. Environmental and Engineering Geophysical Society (EEGS), Wheat Ridge, CO. p 1029.
Guy, E., J. Daniels, and S. Radzevicius. 2000. Application of Electromagnetic Techniques for Organic Contaminant Detection. American Geophysical Union Spring Meeting 2000. [ed. note: the contaminant is creosote]
Hager, J. and M. Carnevale. 2001. GPR as a cost effective bedrock mapping tool for large areas. Proceedings of the Symposium on the Application of Geophysics to Engineering and Environmental Problems (SAGEEP), 4-7 March 2001, Denver, Colorado. Environmental and Engineering Geophysical Society (EEGS), Wheat Ridge, CO.
Hahesy, P., G. Heinson, A. Endres, and J. Hutson. 2000. Geophysical signature of moisture distributions in the vadose zone. Proceedings of the Symposium on the Application of Geophysics to Engineering and Environmental Problems (SAGEEP), 20-24 February 2000, Arlington, Virginia. Environmental and Engineering Geophysical Society (EEGS), Wheat Ridge, CO. p 233.
Heath, R. 1983. Basic Ground-Water Hydrology. U.S. Geological Survey Water Supply Paper 2220.
Hess, K. and S. Wolf. 1991 Techniques to Determine Spatial Variations in Hydraulic Conductivity of Sand and Gravel. EPA 600-2-91-006, NTIS: PB92-109123.
Hillel, D. and D. Elrick. 1990. Scaling in Soil Physics: Principles and Applications. Soil Science Society of America, Madison, WI. SSSA Special Publ. 25.
Hubert, A. and R. Schafer. 1998. Magnetic Domains. Springer, Berlin.
Huffman, A.. 1992. Characterization of Three-Dimensional Geological Heterogeneities Using Ground Penetrating Radar. MSc Thesis, Dept. Geophysics, Colorado School of Mines, Golden, CO.
A-9

Hughes, L. and N. Carlson. 2003. Mapping structural pathways for DNAPL transport in karst using induced polarization. SAGEEP 2003: Symposium on the Application of Geophysics to Engineering and Environmental Problems, 6-10 April 2003, San Antonio, Texas. Environmental and Engineering Geophysical Society, Denver, CO. CD-ROM, p 849-856.
Huling, S. and J. Weaver. 1991. Ground Water Issue: Dense Non-Aqueous Phase Liquids. EPA 540-4-91-002, NTIS: PB91-195974.
Hunt, C., et al. 1995. Magnetic properties of rocks and minerals. Rock Physics and Phase Relations. American Geophysical Union, Washington, DC.
Jansen, J., P. Osborn, and M.Wilson. 1999. A mise a la masse survey to track groundwater conduits in weathered bedrock near a salvage yard. Proceedings of the Symposium on the Application of Geophysics to Engineering and Environmental Problems (SAGEEP), 14-18 March 1999, Oakland, California. Environmental and Engineering Geophysical Society (EEGS), Wheat Ridge, CO. p 517.
Jordan, T. and G. Baker. 2002. A Conceptual model for the detection of NAPL using amplitude and phase variation with offset (APVO) analysis of ground penetrating radar data. SAGEEP 2002: Symposium on the Application of Geophysics to Engineering and Environmental Problems, 10-14 February 2002, Las Vegas, Nevada. Environmental and Engineering Geophysical Society, Denver, CO. CD-ROM, 12GPR10, 18 pp.
Jordan, T. and G. Baker. 2004. Reprocessing GPR data from the CFB Borden experiment using APVO/GPR techniques. SAGEEP 2004: Symposium on the Application of Geophysics to Engineering and Environmental Problems, 22-26 February 2004, Colorado Springs, Colorado. Environmental and Engineering Geophysical Society, Denver, CO. p 506-513.
Kalma, J. and M. Sivapalan. (eds.). 1995. Scale Issues in Hydrological Modeling. Wiley, NY.
Kaufmann, R., L. Yuhr, and J. Wonder. 1998. ESC phase 1: locating and mapping drilling mud pits at the Central Nevada Test Site. SAGEEP 1998: Symposium on the Application of Geophysics to Environmental & Engineering Problems. Environmental and Engineering Geophysical Society, Denver, CO. p 541-550.
Keithley, J. 1998. The Story of Electrical and Magnetic Measurements: From Early Days to the Beginnings of the 20th Century, 50 B.C. to about 1920 A.D. IEEE Press, NY.
Kirkendall, B. 1998. A Rapid Limited 3-Dimensional Near-Field Modeling Program for Ground Penetrating Radar. MSc thesis, Dept of Geophysics, Colorado School of Mines, Golden, CO.
Kowalsky, M. et al. 1998. Visibility of immiscible liquids in poorly consolidated sand. Society Of Exploration Geophysics Annual Meeting, 1998. 4 pp.
Kraus, J.D. 1991. Electromagnetics, 4th ed. McGraw-Hill, NY.
Kulessa, B. et al. 2000. Towards high-resolution imaging of subsurface pollution: an introduction to magneto-electrical resistivity imaging tool (MERIT). Proceedings of the Symposium on the Application of Geophysics to Engineering and Environmental Problems (SAGEEP), 20-24 February 2000, Arlington, Virginia. Environmental and Engineering Geophysical Society (EEGS), Wheat Ridge, CO. p 925.
A-10

LaBrecque, D., G. Morelli, and P. Lundegard. 1997. Effective electrical resistivity tomography surveys for environmental monitoring. Symposium on the Application of Geophysics to Engineering and Environmental Problems (SAGEEP), March 23- 26, 1997, Reno, Nevada. Environmental and Engineering Geophysical Society (EEGS), Wheat Ridge, CO. p 881-887.
LaBrecque, D. and X. Yang. 2000. Difference inversion of ERT data: a fast inversion method for 3-D in situ monitoring. Symposium on the Application of Geophysics to Engineering and Environmental Problems (SAGEEP) 20-24 February 2000, Arlington, Virginia. Environmental and Engineering Geophysical Society (EEGS), Wheat Ridge, CO. p 907-914.
LaBrecque, D. and X. Yang. 2001. The effects of anisotropy on ERT images for Vadose zone monitoring. Symposium on the Application of Geophysics to Engineering and Environmental Problems (SAGEEP) 4-7, March 2001, Denver, Colorado. Environmental and Engineering Geophysical Society (EEGS), Wheat Ridge, CO. p 1-13.
LaBrecque, D. and G. Morelli. 1996. 3-D electrical resistivity tomography for environmental monitoring. Proceedings on the Symposium on the Application of Geophysics to Engineering and Environmental Problems (SAGEEP), April 28-May 2, 1996, Keystone, CO. Environmental and Engineering Geophysical Society (EEGS), Wheat Ridge, CO. p 723-732.
LaBrecque, D. and X. Yang. 2001. Difference inversion of ERT data: a fast inversion method for 3-D in situ monitoring. Journal of Environmental & Engineering Geophysics, Vol 6 No 2, p 83-89.
LaBrecque, D. 2001. The role of advanced monitoring in steam stripping for in-situ remediation of DNAPL. Proceedings of the Symposium on the Application of Geophysics to Engineering and Environmental Problems (SAGEEP), 4-7 March 2001, Denver, Colorado. Environmental and Engineering Geophysical Society (EEGS), Wheat Ridge, CO.
LaBrecque, D. et al. 1996. The effects of noise on Occam’s inversion of resistivity tomography data. March- April 1996. Geophysics, Vol. 61, No. 2. p 538-548.
Lane, Jr., J. et al. 2001. Application of a geophysical "tool-box" approach to characterization of fractured rock aquifers: a case study from Norwalk, Connecticut. Proceedings of the Symposium on the Application of Geophysics to Engineering and Environmental Problems (SAGEEP), 4-7 March 2001, Denver, Colorado. Environmental and Engineering Geophysical Society (EEGS), Wheat Ridge, CO.
Larson, T., I. Krapac, W. Dey, and C. Suchomski. 1997. Electromagnetic terrain conductivity surveys used to screen swine confinement facilities for groundwater contamination. SAGEEP 1997: Symposium on the Application of Geophysics to Environmental & Engineering Problems. Environmental and Engineering Geophysical Society, Denver, CO. p 271-279.
Last, G. and D. Horton. 2000. Review of Geophysical Characterization Methods Used at the Hanford Site. Report No: PNNL-13149, 113 pp.
Lemke, S. and C. Young. 1998. Leachate plume investigation using mise-a-la-masse resistivity. SAGEEP 1998: Symposium on the Application of Geophysics to Environmental & Engineering Problems. Environmental and Engineering Geophysical Society, Denver, CO. p 839-847.
Lindsley, D.H. (ed.). 1991. Oxide Minerals: Their Petrologic and Magnetic Significance. Mineralogical Society of America, Washington, DC.
A-11

Liu, L. and Y. Quan. 1997. GPR attenuation tomography for detecting DNAPLS. SAGEEP 1997: Symposium on the Application of Geophysics to Environmental & Engineering Problems. Environmental and Engineering Geophysical Society, Denver, CO. p 241-259.
Liu, Z. and W. Doll. 1997. Seismic reflection processing for characterization of a hazardous waste site. SAGEEP 1997: Symposium on the Application of Geophysics to Environmental & Engineering Problems. Environmental and Engineering Geophysical Society, Denver, CO. p 291-299.
Lucius, J.E., et al. 1992. Properties and Hazards of 108 Selected Substances - 1992 Edition. U.S. Geological Survey Open-File Report 92-527.
Lucius, J., G. Olhoeft, and S. Duke (eds.). 1990. Third International Conference on Ground Penetrating Radar, Abstracts of the Technical Meeting. U.S. Geological Survey Open-File Report 90-414.
Lucius, J. 2000. Detectability of crude oil in the subsurface near Bemidji, Minnesota, using ground penetrating radar. Proceedings of the Symposium on the Application of Geophysics to Engineering and Environmental Problems (SAGEEP), 20-24 February 2000, Arlington, Virginia. Environmental and Engineering Geophysical Society (EEGS), Wheat Ridge, CO. p 293.
Lucius, J. and G. Olhoeft. 1993. Statistical analysis of field-scale subsurface heterogeneity at the Princeton, Minn., Management Systems Evaluation Area using ground penetrating radar. Proceedings of the Conference on Agricultural Research to Protect Water Quality, 21-24 February 1993, Minneapolis, Minnesota. Soil and Water Conservation Society, Ankeny, IA. p 355-358.
Lucius, J. and G. Olhoeft. 1996. Geophysical investigations of heterogeneity and scale at Princeton, Minnesota, Management Systems Evaluation Area. U. S. Geological Survey Toxic Substances Hydrology Program Review: Proceedings of the Technical Meeting, 20-23 September 1993, Colorado Springs, Colorado. U.S. Geological Survey Water Resources Investigations Report 94-4015, Vol 1, p 581-589.
Martin, D.H. 1967. Magnetism in Solids. Iliffe Books, London.
Mayer, V., K. Sandmeier, and H. Wilhelm. 1997. Monitoring controlled DNAPL contaminations using GPR. Proceedings of th 3rd meeting of the Environmental and Engineering Geophysical Society, European Section, Aarhus, Denmark, 8-11 September 1997, p 283-286.
Minsley, B. et al. 2004. Three dimensional self-potential inversion for subsurface contaminant detection and mapping at the DOE Savannah River Site, South Carolina. SAGEEP 2004: Symposium on the Application of Geophysics to Engineering and Environmental Problems, 22-26 February 2004, Colorado Springs, Colorado. Environmental and Engineering Geophysical Society, Denver, CO. p 465471.
Mitchell, J. 1993. Fundamentals of Soil Behavior, 2nd ed. Wiley, NY.
Morelli, G. and D. LaBrecque. 1996. Robust scheme for ERT inverse modeling. Proceedings on the Symposium on the Application of Geophysics to Engineering and Environmental Problems (SAGEEP), April 28-May 2 1996, Keystone CO. Environmental and Engineering Geophysical Society (EEGS), Wheat Ridge, CO. p 629-638.
Morey, R. 1998. Ground Penetrating Radar for Evaluating Subsurface Conditions for Transportation Facilities. National Academy Press, Washington, DC. Synthesis of Highway Practice Report 255.
A-12

Morgan, F. et al. 2003. Noninvasive contaminant site characterization using geophysical-induced polarization. The 225th ACS National Meeting, New Orleans, LA, March 23-27, 2003.
Moskowitz, B. 1995. Fundamental physical constants and conversion factors. Global Earth Physics: A Handbook of Physical Constants. American Geophysical Union, Washington, DC.
Moulton, C. and D. Wright. 2003. DNAPL detection sensitivity of a high-resolution directional borehole radar. SAGEEP 2003: Symposium on the Application of Geophysics to Engineering and Environmental Problems, 6-10 April 2003, San Antonio, Texas. Environmental and Engineering Geophysical Society, Denver, CO. CD-ROM, p 107-115.
Murray, C. and D. Keiswetter. 1998. Application of magnetic and multi-frequency EM techniques for landfill investigations: case histories. SAGEEP 1998: Symposium on the Application of Geophysics to Environmental & Engineering Problems. Environmental and Engineering Geophysical Society, Denver, CO. p 445-452.
Newmark, R., W. Daily, K. Kyle, and A. Ramirez. 1998. Monitoring DNAPL pumping using integrated geophysical techniques. Journal of Environmental and Engineering Geophysics, Vol 3 No 1, p 7-13, Mar.
Nimmer, R., J. Osiensky, and K. Sprenke. 2001. Borehole-surface and cross-borehole mise-a-la-masse delineation of a radial injection tracer experiment in partially saturated fractured basalt. Proceedings of the Symposium on the Application of Geophysics to Engineering and Environmental Problems (SAGEEP), 4-7 March 2001, Denver, Colorado. Environmental and Engineering Geophysical Society (EEGS), Wheat Ridge, CO.
Nobes, D.C. 1998. How important is the orientation of a horizontal loop EM system? Examples from a leachate plume and a fault zone. SAGEEP 1998: Symposium on the Application of Geophysics to Environmental & Engineering Problems. Environmental and Engineering Geophysical Society, Denver, CO. p 453-458.
Nyquist, J., B. Carr, and R. Davis. 1999. DC resistivity monitoring of potassium permanganate injected to oxidize TCE in situ. Journal of Environmental & Engineering Geophysics, Vol 4 No 3, pp 135-147.
Olhoeft, G., J. Lucius, and S. Phillips. 1994. Geophysical Tracking of the Injection of Trench Stabilization Material at U.S. DOE Hanford Site, Richland, Washington. U.S. Geological Survey Open File Report 94-146.
Olhoeft, G. 1994. Geophysical observations of geological, hydrological and geochemical heterogeneity. Symposium on the Application of Geophysics to Engineering and Environmental Problems, 27-31 March 1994. Environmental and Engineering Geophysical Society, Denver, CO. p 129-141.
Olhoeft, G. et al. 1994. Buried object detection with ground penetrating radar. Proceedings of Unexploded Ordnance (UXO) Detection and Range Remediation Conference, 17-19 May 1994, Golden, Colorado. p. 207-233.
Olhoeft, G. 1993. Velocity, attenuation, dispersion and diffraction hole-to-hole radar processing. Proceedings of the Fourth Tunnel Detection Symposium on Subsurface Exploration Technology, 26-29 April 1993, Colorado School of Mines, Golden, Colorado. U.S. Army, Belvoir Research, Development and Engineering Center. p 309-322.
A-13

Olhoeft, G. and D. Capron. 1994. Petrophysical causes of electromagnetic dispersion. Proceedings of the Fifth International Conference on Ground Penetrating Radar, 12-16 June 1994, Kitchener, Ontario. p 145-152.
Olhoeft, G. 1994. Modeling out-of-plane scattering effects. Proceedings of the Fifth International Conference on Ground Penetrating Radar, 12-16 June 1994, Kitchener, Ontario. p 133-144.
Olhoeft, G. 1992. Geophysics Advisor Expert System, Version 2.0. U.S. Geological Survey Open-File Report 92-526.
Olhoeft, G. 1991. Spatial variability. Proceedings of NSF/EPRI Workshop on Dynamic Soil Properties and Site Characterization. Electric Power Research Institute, Palo Alto. EPRI NP-7337, Vol 1, p 5.1-5.20.
Olhoeft, G. 1991. Quantitative statistical description of subsurface heterogeneities with ground penetrating radar at Bemidji, Minnesota. U.S. Geological Survey Toxic Substance Hydrology Program: Proceedings of the Technical Meeting, 11-15 March 1991, Monterey, California. U.S. Geological Survey Water Resources Investigations Report 91-4034, p 650-653.
Olhoeft, G. 1998. Electrical, magnetic and geometric properties that determine ground penetrating radar performance. Proceedings of 7th International Conference on Ground Penetrating Radar, 27-30 May 1998, University of Kansas, Lawrence, Kansas. p 177-182.
Olhoeft, G. 1992. Geophysical detection of hydrocarbon and organic chemical contamination. Proceedings on Application of Geophysics to Engineering and Environmental Problems. Environmental and Engineering Geophysical Society, Denver, CO. p 587-595.
Olhoeft, G. 1992. Site characterization tools. Proceedings of Third International Conference on Ground Water Quality Research, 21-24 June 1992, Dallas, TX. Rice University, National Center for Ground Water Research. p 29-31.
Olhoeft, G. and D. Capron. 1993. Laboratory Measurements of the Radio-Frequency Electrical and Magnetic Properties of Soils from Near Yuma, Arizona. U.S. Geological Survey Open-File Report 93701.
Olsen, L. and M. Lorah. 1998. Natural attenuation of chlorinated VOCs in wetlands. Groundwater Currents, No 29, September.
Opdyke, N. and J. Channell. 1996. Magnetic Stratigraphy. Academic Press, NY.
Peck, T., J. Lige, I. MacFarlane, and F. Barranco. 1996. Characterizing in situ DNAPL distribution, mobility state, and dissolution. Non-Aqueous Phase Liquids (NAPLS) in Subsurface Environment: Assessment and Remediation, 12-14 November 1996, Washington, DC. American Society of Civil Engineers, New York, NY. p 103-114.
Pellerin, L., D. Alumbaugh, and M. Pfeifer. 1997. The electromagnetic integrated demonstration at the Idaho National Engineering Laboratory cold test pit. SAGEEP 1997: Symposium on the Application of Geophysics to Environmental & Engineering Problems. Environmental and Engineering Geophysical Society, Denver, CO. p 725-734.
A-14

Pervizpour, M., S. Pamukcu, H. Moo-Young. 1999. Magnetic resonance imaging of hydrocarbon-contaminated porous media. Journal of Computing in Civil Engineering, Vol 13 No 2, p 96-102, Apr 1999. [Ed. note: the hydrocarbon is TCE]
Phillips, T. and M. Cox. 2001. Electromagnetic mapping (EM map) of perched water to improve remedial activities at Hill Air Force Base. Proceedings of the Symposium on the Application of Geophysics to Engineering and Environmental Problems (SAGEEP), 4-7 March 2001, Denver, Colorado. Environmental and Engineering Geophysical Society (EEGS), Wheat Ridge, CO.
Piggott, S., J. Redman, and A. Endres. 2000. Frequency dependence in the complex resistivity of Ottawa sand containing water-air and water-NAPL mixtures. Proceedings of the Symposium on the Application of Geophysics to Engineering and Environmental Problems (SAGEEP), 20-24 February 2000, Arlington, Virginia. Environmental and Engineering Geophysical Society (EEGS), Wheat Ridge, CO. p 945.
Powers, M. and G. Olhoeft. 1996. Modeling the GPR response of leaking, buried pipes. SAGEEP 1996: Symposium on the Application of Geophysics to Environmental & Engineering Problems. Environmental and Engineering Geophysical Society, Denver, CO. p 525-534.
Powers, M. and G. Olhoeft. 1995. GPRMODV2: One-Dimensional Full Waveform Forward Modeling of Dispersive Ground Penetrating Radar Data, Version 2.0. U.S. Geological Survey Open File Report 95-58.
Powers, M., et al. 1992. GPRMODEL: One-Dimensional Full Waveform Forward Modeling of Ground Penetrating Radar Data. U.S. Geological Survey Open-File Report 92-532.
Powers, M. and G. Olhoeft. 1994. Modeling dispersive ground penetrating radar data. Proceedings of the Fifth International Conference on Ground Penetrating Radar, 12-16 June 1994, Kitchener, Ontario, pp 173-183.
Powers, M. and G. Olhoeft. 1996. Computer modeling to transfer GPR UXO detectability knowledge between sites. UXO Forum Conference Proceedings, 26-29 March 1996, Williamsburg, Virginia. Dept. of Defense Explosives Safety Board, Alexandria, VA. p 347-356.
Ramirez, A. et al. 1993. Monitoring an underground steam injection process using electrical resistance tomography. Water Resources Research, Vol. 29 No. 1, p. 73-87.
Ramirez, A., W. Daily, A. Binley, and D. LaBrecque. 1999. Electrical impedance tomography of known targets. Journal of Environmental and Engineering Geophysics, 4, pp11-26.
Riha, B. 2004. FY03 DNAPL Characterization of the A-14 Outfall. Report No: WSRC-TR-2003-00540, 47 pp, Jan 2004. http://sti.srs.gov/fulltext/tr2003540/tr2003540.pdf
Rittman, B. 1994. In Situ Bioremediation, 2nd ed. Noyes Publications, Park Ridge, NJ.
Roberts, J. and D. Wildenschild. 2002. Electrical properties of sand-clay mixtures containing trichloroethylene and ethanol. SAGEEP 2002: Symposium on the Application of Geophysics to Engineering and Environmental Problems, 10-14 February 2002, Las Vegas, Nevada. Environmental and Engineering Geophysical Society, Denver, CO. CD-ROM, 12PET3, 12 pp.
A-15
Roberts, J. and D. Wildenschild. 2004. Electrical properties of sand-clay mixtures containing trichloroethylene and ethanol. Journal of Environmental & Engineering Geophysics, Vol 9 No 1, p 110, 2004.
Rossabi, J. et al. 1999. Field tests of three innovative DNAPL characterization methods American Geophysical Union 1999 Spring Meeting.
Rossabi, J., B. Riha, and D. Jackson. 2004. Sediment sampling at the A-014 outfall for comparison with complex resistivity measurements. SAGEEP 2004: Symposium on the Application of Geophysics to Engineering and Environmental Problems, 22-26 February 2004, Colorado Springs, Colorado. Environmental and Engineering Geophysical Society, Denver, CO. p 484-495.
Sandberg, S. et al. 2001. Mapping a paleochannel system controlling contaminant migration at a wood-treating facility using electromagnetics. Proceedings of the Symposium on the Application of Geophysics to Engineering and Environmental Problems (SAGEEP), 4-7 March 2001, Denver, Colorado. Environmental and Engineering Geophysical Society (EEGS), Wheat Ridge, CO.
Sandberg, S. et al. 1998. IP and TEM for discrimination and resolution in mapping groundwater contamination at Monument Valley. SAGEEP 1998: Symposium on the Application of Geophysics to Environmental & Engineering Problems. Environmental and Engineering Geophysical Society, Denver, CO. p 795-804.
Sander, K., G. Olhoeft, and J. Lucius. 1992. Surface and borehole radar monitoring of a DNAPL spill in 3D versus frequency, look angle and time. SAGEEP 1992: Proceedings of the Symposium on the Application of Geophysics to Engineering and Environmental Problems. Environmental and Engineering Geophysical Society, Denver, CO. p 455-469.
Sayler, S. 2000. Seismic applications for detecting preferential pathways at Tinker Air Force Base, Oklahoma. Proceedings of the Symposium on the Application of Geophysics to Engineering and Environmental Problems (SAGEEP), 20-24 February 2000, Arlington, Virginia. Environmental and Engineering Geophysical Society (EEGS), Wheat Ridge, CO. p 129.
Schmidbauer, E. and P.W. Mirwald. 1993. Electric conductivity of cordierite. Mineralogy and Petrology, Vol 48.
Schon, J.H. 1998. Physical Properties of Rocks. Fundamentals and Principles of Petrophysics, 2nd ed. Pergamon Press.
Smith, G.S. 1997. An Introduction to Classical Electromagnetic Radiation. Cambridge University Press.
Sneddon, K., G. Olhoeft, and M. Powers. 2000. Determining and mapping DNAPL saturation values from noninvasive GPR measurements. Proceedings of the Symposium on the Application of Geophysics to Engineering and Environmental Problems (SAGEEP), 20-24 February 2000, Arlington, Virginia. Environmental and Engineering Geophysical Society (EEGS), Wheat Ridge, CO. p 293.
Sneddon, K. 2001. Laboratory complex resistivity investigation of organic contaminants: Denver Federal Center soils. Proceedings of the Symposium on the Application of Geophysics to Engineering and Environmental Problems (SAGEEP), 4-7 March 2001, Denver, Colorado. Environmental and Engineering Geophysical Society (EEGS), Wheat Ridge, CO.
A-16

Sneddon, K. 2001. Determination of Porosity and DNAPL Saturation Values from Modeling of Noninvasive Ground Penetrating Radar Data. M.Sc. thesis, Colorado School of Mines, Golden. 2001.
Sneddon, K. et al. 2002. Modeling GPR Data to Interpret Porosity and DNAPL Saturations for Calibration of a 3-D Multiphase Flow Simulation. U.S. Geological Survey Open-File Report 02-451, 29 pp.
Sternberg, B. 1999. A new method of subsurface imaging—the LASI high frequency ellipticity system: Part 1. system design and development, lab. for advanced subsurface imaging (LASI). Journal of Environmental & Engineering Geophysics, Vol 4 No 4, p 197-213, 1999.
Stephens, D. et al. 1998. Discussion of DNAPL migration through a fractured perching layer. Ground Water, v. 36, no. 4: 605-610 .
Stewart, M. and L. North. A geophysical method for detection and quantification of dense non-aqueous phase liquids (DNAPL) in the subsurface. SAGEEP 2003: Symposium on the Application of Geophysics to Engineering and Environmental Problems, 6-10 April 2003, San Antonio, Texas. Environmental and Engineering Geophysical Society, Denver, CO. CD-ROM, p 1042-1058.
Stubben, M. and D. LaBrecque. 1998. 3-D ERT inversion used to monitor an infiltration experiment. The Symposium on the Application of Geophysics to Environmental and Engineering Problems (SAGEEP), 22-26 March 1998, Chicago, Illinois. Environmental and Engineering Geophysical Society (EEG), Wheat Ridge, CO. p 593-601.
Sullivan, E. and D. LaBrecque. 1998. Optimization of ERT surveys. The Symposium on the Application of Geophysics to Environmental and Engineering Problems (SAGEEP), 22-26 March 1998, Chicago, Illinois. Environmental and Engineering Geophysical Society (EGGS), Wheat Ridge, CO. p 571-581.
Tarling, D. and F. Hrouda. 1993. The Magnetic Anisotropy of Rocks. Chapman & Hall, London.
Temples, T. , M. Waddell, W. Domoracki, and J. Eyer. 2001. Noninvasive determination of the location and distribution of DNAPL using advanced seismic reflection techniques. Ground Water Vol. 39, No. 3, May- June 2001. p. 465-474.
Tezkan, B., S. Recher, M. Honig, and F. Neubauer. 2001. Joint application of radiomagnetotellurics (RMT) and induced polarization (IP) to a waste site exploration. Symposium on the Application of Geophysics to Engineering and Environmental Problems (SAGEEP), 4-7 March 2001, Denver, CO. Environmental and Engineering Geophysical Society (EEG), Wheat Ridge, CO.
Thompson, M. et al. 2002. Monitoring in-situ cleanup using resistivity imaging. SAGEEP 2002: Symposium on the Application of Geophysics to Engineering and Environmental Problems, 10-14 February 2002, Las Vegas, Nevada..Environmental and Engineering Geophysical Society, Denver, CO. CD-ROM, 13ESC2.
Tiab, D. and E. Donaldson. 1996. Petrophysics: Theory and Practice of Measuring Reservoir Rock and Fluid Transport Properties. Gulf Publishing Co.
Torquato, S. 1991. Random heterogeneous media: microstructure and improved bounds on effective properties. Applied Mechanics Reviews, Vol 44.
A-17

Tyburczy, J. and D. Fisler. 1995. Electrical properties of minerals and melts. Mineral Physics and Crystallography. American Geophysical Union, Washington, DC.
USDoD. 1998. High Resolution, Electromagnetic Resistivity Surveys For 3-D Imaging of DNAPL Contamination. Technical Data Sheet TDS-2052-ENV. Naval Facilities Engineering Service Center, Port Hueneme, CA., 2 pp.
USDoD. 1999. Three-Dimensional Site Characterization Technologies for DNAPL Contaminated Sites, NFESC TDS-2072-ENV. Naval Facilities Engineering Command, Washington, DC. 8 pp.
USDoD. 1999. High Resolution Seismic Reflection to Characterize and Plan Remediation at Hazardous Waste Sites., ESTCP Cost and Performance Report, 28 pp.
USDoD. 2001. Integrated Geophysical Detection of DNAPL Source Zones. Blackhawk Geoservices Inc., Golden, CO. NTIS: ADA409159, 68 pp, Nov. http://handle.dtic.mil/100.2/ADA409159
USDOE. 2002. Seismic Reflection Technology for the Detection of DNAPLs. National Energy Technology Laboratory, TMS Tech ID: 2306, 2 pp.
USEPA. 1998. Geophysical Techniques to Locate DNAPLs: Profiles of Federally Funded Projects, EPA 542-R-98-020. Federal Remediation Technologies Roundtable. NTIS: PB99-156804INX. 34 pp.
Versteeg, R., R. Birken, S. Sandberg, and L. Slater. 2000. Controlled imaging of fluid flow and a saline tracer using time lapse GPR and electrical resistivity tomography. Symposium on the Application of Geophysics to Engineering and Environmental Problems (SAGEEP) 20-24 February 2000, Arlington, Virginia. Environmental and Engineering Geophysical Society (EEG), Wheat Ridge, CO. p 283-292.
Waddell, M., W. Domoracki, and T. Temples. 2001. Use of seismic reflection amplitude versus offset (AVO) techniques to image dense nonaqueous phase liquids (DNAPL). Proceedings of the Symposium on the Application of Geophysics to Engineering and Environmental Problems (SAGEEP), 4-7 March 2001, Denver, Colorado. Environmental and Engineering Geophysical Society (EEGS), Wheat Ridge, CO.
Williams, J. 2003. Borehole geophysics for investigations of ground-water contamination in fractured bedrock. U.S. EPA Technical Support Project Meeting, 22 October 2003, Niagara Falls, NY. PowerPoint presentation, 29 pp. http://www.epa.gov/tio/tsp/download/2003_meeting_fall/williams_john.pdf
A-18

Wright, D. et al. 1993. High-speed digital radar systems and applications to subsurface exploration. Proceedings of the Fourth Tunnel Detection Symposium on Subsurface Exploration Technology, April 1993, Golden, Colorado. U.S. Army, Belvoir Research, Development, and Engineering Center. p 275-288.
Wright, D., G. Olhoeft, and T. Grover. 1996. Velocity, attenuation, and dispersion: electromagnetic tomography in fractured rock. U.S. Geological Survey Toxic Substances Hydrology Program: Proceedings of the Technical Meeting, 20-24 September 1993, Colorado Springs, Colorado. U.S. Geological Survey Water Resources Investigations Report 94-4015, p 111-118.
Wright, D. et al. 1995. Tomography between wells, a transient dielectric logging tool, and the very early time electromagnetic (VETEM) system. Symposium on the Application of Geophysics to Engineering and Environmental Problems (SAGEEP) April 23-26, 1995, Orlando, Florida. Environmental and Engineering Geophysical Society (EEG), Wheat Ridge, CO. p. 501-510.
Wright, D. et al. 1996. Electromagnetic and seismic tomography compared to borehole acoustic televiewer and flowmeter logs for subsurface fracture in mapping at the Mirror Lake Site, New Hampshire. U.S. Geological Survey Toxic Substances Hydrology Program: Proceedings of the Technical Meeting, September 20-24, 1993, Colorado Springs, Colorado. U.S. Geological Survey Water Resources Investigations Report 94-4015, p 119-126.
Wyatt, D. and T. Temples. 1996. Ground-penetrating radar detection of small-scale channels, joints and faults in the unconsolidated sediments of the Atlantic Coastal Plain. Environmental Geology - Abstracts, Vol 27 No 3, p 219-225.
Yang, X. et al. 2000. Three dimensional complex resistivity tomography. Symposium on the Application of Geophysics to Engineering and Environmental Problems (SAGEEP) 20-24 February 2000, Arlington, Virginia. Environmental and Engineering Geophysical Society (EEG), Wheat Ridge, CO. p 897-901.
Yang, X. and D. LaBrecque. 2000. Estimation of 3-D moisture content using ERT data at the Socorro-Tech vadose zone facility. Symposium on the Application of Geophysics to Engineering and Environmental Problems (SAGEEP) 20-24 February 2000, Arlington, Virginia. Environmental and Engineering Geophysical Society (EEG), Wheat Ridge, CO. p 915-924.
Yang, X. and D. LaBrecque. 1998. Stochastic inversion of 3D ERT data. The Symposium on the Application of Geophysics to Environmental and Engineering Problems (SAGEEP), 22-26 March 1998, Chicago, Illinois. Environmental and Engineering Geophysical Society (EEG), Wheat Ridge, CO. p 221-228.
Zang, J. 1997. Regularizing data in 3D DC resistivity tomography. Symposium on the Application of Geophysics to Engineering and Environmental Problems (SAGEEP), March 23- 26, 1997, Reno, Nevada. Environmental and Engineering Geophysical Society (EEG), Wheat Ridge, CO. p 911-915.
A-19

This Page Left Intentionally Blank

APPENDIX B:PHYSICAL/GEOCHEMICAL BEHAVIOR OF DNAPLs

This Page Left Intentionally Blank
APPENDIX B:PHYSICAL/GEOCHEMICAL BEHAVIOR OF DNAPLS
Dense, non-aqueous phase liquids (DNAPLs) are more dense than water and are relatively immiscible in water, allowing them to remain in a non-aqueous phase. While these are defining features of DNAPLs, there are a number of other physical and chemical properties that influence actual migration in the subsurface and their physical/geochemical behavior. Their behavior is determined by complex interactions between the DNAPL chemicals and the hydrogeological formations through which the DNAPLs move. DNAPL chemicals are subject to the following processes:
• Downward migration by gravity; • Absorption and adsorption on soil; • Volatilization into soil gas; • Dissolution and dispersion in groundwater; • Preferential solution of components; • Phase separation or the formation of emulsions; and • Transformation into other chemicals by microbiological and/or chemical processes (when chemicals
are in solution or air).
How these processes occur and to what degree they affect DNAPL migration are dependent on the chemical make up of the DNAPLs and the subsurface soil properties. When DNAPLs are composed of multiple compounds with differing physical characteristics, the characteristics of the mixture will be different than those of the pure substances. For example, the physical characteristics of a mixture of methylene chloride and trichloroethene will have a density and viscosity that is determined by the relative volumes of each constituent in the mixture. Mixtures with high proportions of methylene chloride will be less dense and viscous than mixtures with higher proportions of trichloroethene. With the right constituents and relative proportions, it is possible that a mixture of DNAPL and light nonaqueous phase (LNAPL, specific gravity < 1) chemicals can have offsetting physical characteristics, resulting in a mass that neither floats nor sinks in water.
DNAPL Physical/Chemical Characteristics
The physical/chemical properties of a DNAPL mass most important to subsurface migration are specific gravity and dynamic viscosity. Factors, such as vapor pressure, Henry’s Law constant, and solubility in water, contribute to the dissolution of the DNAPL chemicals into dissolved or soil gas vapor phases where they may undergo biodegradation and chemical transformation. Table B-1 lists several of these properties for five common DNAPL chemicals. Note that interfacial tension is site specific and the numbers given in the table are for comparison purposes only.
Specific Gravity In Section I, specific gravity was noted as a defining characteristic of DNAPLs, which have specific gravities greater than one. Given relatively equal viscosities, the greater the specific gravity, the greater the tendency of the substance to migrate under the influence of gravity through the subsurface. Provided there is sufficient mass to drive the movement, the DNAPL will continue to move downward through preferential pathways (i.e., coarser grained materials that provide less capillary resistance) until it meets a zone of low permeability where it will tend to pool or, if the zone has a dip, will move across the surface to lower areas.
B-1

Table B-1. Physical/Chemical Characteristics of Selected DNAPLs
Vapor Pressure Interfacial Specific (mm Hg at 25o Solubility Viscosity Tension
Chemical Gravity Celsius) (mg/l) (centipoise) (dynes/cm)
Methylene Chloride 1.32 350 20000 0.43 28
Tetrachloroethene 1.62 14 150 0.89 44
Trichloroethene 1.46 58 1100 0.57 35
Polychlorinated Biphenyl (Arochlor 1242)
1.39 0.0004 0.24 24 NA
Coal tar/creosote 1.01-1.2 Varies with Varies with 10 to 70 Varies with constituent constituent constituent
NA - Not available.Sources: Cohen and Mercer 1993; EPA 1993b; Huling and Weaver 1991
Solubility Limited solubility is another defining characteristic of most DNAPLs. When an organic chemical comes in contact with water, some or all of the chemical will dissolve or partition into the water up to the solubility limit of the chemical. The portion not dissolved remains as a non-aqueous liquid. Organic compounds are rarely found in groundwater at concentrations approaching their solubility limits, even when an organic liquid phase is present. Therefore, high concentrations of dissolved DNAPL chemicals in groundwater can be very strong indicators that DNAPL mass sources are present. However, this statement does not imply that only high concentrations are indicators of free-phase liquids. EPA has recommended that concentrations as low as one percent of solubility can be indicators of DNAPL presence (Cohen and Mercer 1993). DNAPLs that are a mixture of many chemicals will have solubilities that reflect their relative concentrations in the mixture. These solubilities are typically lower than the solubilities published for the pure chemical. Concentrations of individual chemicals found at less than one percent of their solubility does not mean there can be no DNAPL present at the site.
Dynamic Viscosity Dynamic, or fluid, viscosity is a measure of a fluid’s resistance to flow. Molecular cohesion, the tendency of a fluid to remain undispersed, is the main contributor to viscosity. With lower viscosity comes greater mobility and penetration of porous media. The viscosities for methylene chloride, tetrachloroethene, and PCBs are 0.43 centipoises (cp), 0.89 cp, and 4.8 (1221) to 700 (1254), respectively. (See Table B-1.) One would expect then that even though the PCBs have a specific gravity that is greater than methylene chloride they would move through the subsurface much more slowly.
Vapor Pressure Vapor pressure, often expressed in millimeters of mercury (mm Hg), is the pressure at a given temperature of a vapor in equilibrium with its liquid or solid form (note this is measured in a closed container). The higher a DNAPL’s vapor pressure, the higher its soil gas concentration will be. One factor that influences the vapor pressure of a DNAPL in the subsurface is temperature. Conditions such as DNAPL flow velocity may affect the ability for the DNAPL mass to reach equilibrium with its soil gas, and therefore prevent the DNAPL soil gas from reaching its equilibrium vapor pressure. Cohen and Mercer estimate that a soil gas concentration of a volatile DNAPL of 100 to 1,000 ppm is a good indication of the presence of a DNAPL source.
B-2

Henry’s Law Constant Henry’s law constant is sometimes referred to as the air-water partition coefficient. It is defined and often represented as the ratio of the partial pressure of a compound in air to the concentration of the compound in water at a given temperature under equilibrium conditions. It can be used to predict the tendency of dissolved DNAPL chemicals to remain in the dissolved state or to migrate into the soil gas. It is very useful in formulating the site conceptual model and in determining whether a soil gas survey would be practical for investigating a groundwater plume.
Soil and Groundwater Characteristics that Affect DNAPLs
Characteristics of the soil and groundwater also determine the fate and transport of a DNAPL. The following soil and groundwater qualities have the most significant influence on the fate of a DNAPL:
• Initial moisture content • Capillary pressure • Residual saturation C Interfacial tension • Relative permeability • Groundwater flow velocity
Initial Moisture Content The initial moisture content of soil can affect the potential for retaining the DNAPL in soil pores. This is due to the wettability of the pore space. Wettability refers to the preferential coating of a solid surface by one fluid in a multiple fluid system. In general, though not always, in a DNAPL water system the water is the wetting agent and will preferentially coat the walls of the pore space. The effect of this coating is to have the water occupy both the surface areas of the pores and smaller pores in the porous media while relegating the DNAPL to the larger openings (Cohen and Mercer 1993). When soils are relatively dry, the system is a DNAPL air system with the DNAPL becoming the wetting agent. Hence soil with a very low initial moisture content will tend to draw in and retain DNAPLs more than similar soils with a high initial moisture content. The subsurface vadose zone, however, is generally heterogeneous and moisture content is not uniform in it and rarely absent. This heterogenous distribution of water in the subsurface makes prediction of where DNAPL will be the wetting agent and where it will not be the wetting agent difficult at best.
Interfacial Tension According to Bear 1979, when a liquid is in contact with another substance (another liquid immiscible with the first, a gas, or solid) there is free interfacial energy present between them. The interfacial energy arises from the difference between the inward attraction of the molecules in the interior of each phase and those at the contact surface. Since a surface possessing free energy contracts if it can do so, the free interfacial energy manifests itself as an interfacial tension. Thus the interfacial tension for a pair of substances i and k is defined as the amount of work that must be performed to separate a unit area of i from k. Interfacial tension is related directly to the capillary pressure across a water-NAPL interface and is a factor in controlling wettability. As a result of interfacial tension, nonwetting DNAPLs may form globules in open water and water saturated media.
Residual Saturation Residual saturation is the amount of DNAPL that is retained or trapped in soil pores relative to the maximum retention capacity of the soil and is measured as a percentage of total pore volume. The propensity of a chemical to be retained is a function of the media pore size distribution, wettability, fluid viscosity ratio, density ratio, interfacial tension, and hydraulic gradients (Cohen and Mercer 1993).
In the vadose zone, NAPL is retained as films, wetting pendular rings, wedges surrounding aqueous pendular rings, and as nonwetting blobs in pore throats in the presence of water. Residual NAPL in the
B-3

saturated zone is immobilized by snap off and bypassing mechanisms. Snap off occurs in high aspect ratio pores where the pore body is much larger than the pore throat, which results in single droplets or blobs of residual NAPL. Bypassing is prevalent when wetting fluid flow disconnects the nonwetting fluid causing NAPL ganglia to be trapped in clusters of large pores surrounded by smaller pores (Cohen and Mercer 1993).
Relative Permeability When two or more fluids exist in a system, they will compete for pore space. The result is the mobility of each is reduced. Relative permeability is the ratio of the effective permeability through a medium of a fluid at a given saturation, to its intrinsic permeability at the same saturation. As such it varies with saturation from 0 to 1 (Cohen and Mercer 1993). Relative permeability values are generally required for fate and transport numerical modeling of immiscible fluids. Relative permeability values are rarely available for site specific problems and are generally estimated from the literature.
Capillary Pressure Capillary pressure is the tendency of a porous medium (soil) to draw in the wetting fluid and repel the nonwetting fluid. This is due to the dominant adhesive force between the wetting fluid and media solid surfaces. Capillary pressure is a function of interfacial tension, contact angle (between the fluid interfaces and the solid), and pore size. It increases with a decrease in the contact angle and the pore radius or with an increase in the interfacial tension. The higher the capillary pressure, the greater the tendency of the medium to draw the wetting fluid in. Capillary pressure is important in DNAPL transport because in most cases it greatly affects the ability of the nonwetting DNAPLs to enter soil pore space and forces them to flow through areas with lower capillary pressures. In saturated or capillary fringe areas the capillary pressure can be sufficiently large to form a capillary barrier that prevents DNAPL penetration unless large heads are developed. In a strictly air DNAPL system (no moisture present), which is very rare, the DNAPL would be pulled into the pore space.
Groundwater Velocity Movement of the dissolved phase of DNAPL chemicals is a function of advection and dispersion. As the groundwater velocity increases, so does the potential for increased advection and dispersion of dissolved DNAPL chemicals in that volume. Groundwater velocities vary from less than 1 ft per year to thousands of ft per year. As groundwater velocities increase, the rate of flow of water passing across the outer surface of the DNAPL mass increases. Thus, an increase in groundwater flow velocity causes the rates of dissolution and dispersion of the DNAPL chemicals to increase. Conversely, as groundwater flow velocity decreases, so do the rates of dissolution and dispersion of the DNAPL. It should be remembered, however, that if the DNAPL chemical has permeated a low permeability soil with relation to the rest of the aquifer (e.g., clay lenses) the dissolution and movement will be controlled by diffusion from the low permeability soil not the velocity of the water moving across it.
The affect of groundwater flow and gradient on DNAPL movement in the subsurface is related to the specific gravity of the DNAPL and its viscosity. Dense chlorinated solvents will tend to move based on gravity and stratigraphy with little influence from groundwater factors. On the other hand, DNAPLs with specific gravities close to 1 (e.g., creosotes and coal tars) can have their direction of flow strongly influenced by high groundwater flow velocities and gradients. An example of this would be creosote entering the bottom of a gaining surface water body. In this case, the flow of the DNAPL is up.
DNAPL Movement in the Subsurface
The following discussion is taken directly from Wolfe et al. 1997 and is provided because it succinctly ties together the concepts presented above.
B-4

In the vadose zone, capillary phenomena are the dominant mechanisms controlling the movement and distribution of DNAPL. In this situation, DNAPL can be either the wetting or nonwetting fluid, depending on the moisture content of the media. In dry media where DNAPL and air occupy the pore spaces, the DNAPL is usually the wetting fluid and will coat the geologic media and preferentially occupy the smaller pore spaces. Where DNAPL is the wetting fluid, capillary forces enhance DNAPL entry into fine-grained media.
More typically, the vadose zone is partly saturated or water-wet, resulting in DNAPL, water, and air occupying the pore spaces. Water will usually be the wetting fluid with respect to DNAPL and will coat the geologic media and preferentially occupy the smaller pore spaces. DNAPL will be wetting with respect to air and will coat the water, situating itself between the water and air phases. In this situation, capillary forces will act as a barrier to DNAPL entry into fine-grained media. When a dry medium with DNAPL as the wetting fluid is invaded by water, DNAPL is displaced from the solid surfaces by the water.
After a DNAPL mass has moved through the vadose zone, a part of the DNAPL will be retained by capillary forces as residual DNAPL. Values of residual saturation of chlorinated solvents in the vadose zone typically range from 0.01 to 0.10 for dry sands and 0.02 to 0.20 for moist sands (Schwille 1988; Poulsen and Kueper 1992; and Cohen and Mercer 1993). DNAPL may be retained as films, wetting pendular rings, wedges surrounding aqueous pendular rings, and as nonwetting blobs in pore throats and bodies (Cohen and Mercer 1993).
Two processes in the vadose zone work to deplete a DNAPL mass: volatilization into the air phase and dissolution into water. Direct volatilization of DNAPL into the soil gas is generally the most significant mechanism for depletion of chlorinated DNAPL's from the vadose zone (Pankow and Cherry 1996). The higher the vapor pressure of a compound, the more readily it volatilizes. Additionally, DNAPL that dissolves into water in the vadose zone would also be available to volatilize into the soil gas or sorb to solid surfaces. Subsequently, sorbed contaminant may be remobilized through volatilization or dissolution.
Vapor-phase contamination, whether from direct volatilization or dissolution and then volatilization, is a source for a dissolved-phase plume in the ground water, either from dissolution into infiltrating recharge water or diffusion at the water-table surface. The vapor-phase contamination will move by diffusion and sink by density-driven advection. The higher the relative vapor density, the greater the tendency for the vapor-phase contamination to sink. These processes will spread the source for the dissolved ground water plume over a larger area. Diffusive loss of vapors to the atmosphere can occur, but will be limited if the ground surface is covered with vegetation or finer-grained layers which will restrict vapor movement (Pankow and Cherry 1996).
Below the water table, where DNAPL and water occupy pore space, DNAPL is usually the nonwetting fluid and must overcome capillary forces to enter the smaller pore spaces occupied by the water. DNAPL will continue to move downward under the force of gravity until a finer-grained layer presents a capillary barrier. The DNAPL will then be diverted laterally, seeking a path downward, or will pool at the barrier until significant pressure builds to penetrate the capillary barrier.
DNAPL pools in porous media typically are wide and shallow. Compared with residual DNAPL, pools of DNAPL have less surface area per volume in contact with ground water. DNAPL pools can persist for long periods of time. The rate of dissolution from a DNAPL pool is controlled by the vertical dispersion and subsequent removal of the dissolved phase by the moving ground water.
As in the vadose zone, the trailing edge of the DNAPL mass will leave residual DNAPL trapped by capillary forces as isolated blobs and ganglia. Values of residual saturation of chlorinated solvents in
B-5

porous media in the ground-water zone have been measured in the range from 0.15 to 0.40 (Anderson, 1988). Residual saturation values in the ground-water zone are normally greater than the values in the vadose zone because the fluid density ratio (DNAPL to air as compared to DNAPL to water) favors greater drainage in the vadose zone and, as the nonwetting fluid in the ground-water zone, DNAPL is held in the larger pore spaces (Cohen and Mercer, 1993). The dominant natural process to remove residual DNAPL below the water table is dissolution into ground water. The residual DNAPL provides a source for dissolved-phase ground water plumes. Fractured Media DNAPL movement in fractures is controlled by the same properties and processes as in granular material. The concepts of wettability and capillary pressure apply to DNAPL movement in a fracture as they do in a granular material. If the capillary pressure at the leading edge of the DNAPL exceeds the entry pressure of a water-saturated fracture, the DNAPL will displace the water and enter the fracture. In most cases, water will be the wetting fluid and will coat the fracture walls, and DNAPL will be the nonwetting fluid and will fill the larger aperture spaces. The minimum pool height required to overcome the entry pressure is proportional to the DNAPL-to-water interfacial tension and inversely proportional to the difference in fluid densities and fracture aperture (Kueper and McWhorter, 1991). Using values of density and interfacial tension typical of chlorinated solvents, fracture apertures on the order of 2 to 100 microns (:) can be invaded with DNAPL pool heights in the range of 0.15 to 1.0 m (Kueper and McWhorter, 1991; Kueper and others, 1992; Pankow and Cherry, 1996). Fractures in this aperture range have been measured in fractured, unlithified clay deposits (McKay and others, 1993). Dissolution-enlarged fractures in carbonate aquifers have apertures of a scale significantly larger than this, commonly on the order of a millimeter to tens of centimeters. Therefore, the entry pressure for dissolution-enlarged fractures in carbonate rocks will be easily overcome by even a thin pool of DNAPL. In large open fractures (greater than 1 cm), capillary forces will be insignificant and DNAPL will drain freely under the influence of gravity. In fractures filled with residuum, DNAPL entry and movement is controlled by the pore size of the material filling the fracture.
Migrating DNAPL will not uniformly fill a fracture but will preferentially migrate along the larger aperture pathways that present the least capillary resistance. Progressively smaller aperture fractures will be invaded due to the increased fluid pressure at the base of the DNAPL accumulation if the DNAPL extends vertically as a continuous phase (Pankow and Cherry, 1996).
Large vertical accumulation of DNAPL will most likely occur in settings with small fracture apertures and may be less common in settings with dissolution-enlarged fractures. Once a DNAPL has entered a fracture network, it will most likely continue to drain into the network until the DNAPL source is depleted. DNAPL will move into an intersecting fracture if the local capillary pressure at the advancing front exceeds the entry pressure of the intersecting fracture.
DNAPL migration will be predominantly downward due to gravity, but significant lateral flow can occur along horizontal bedding planes or fractures in response to the closing of fractures with depth. Local structure, including degree of fracture interconnection and distribution of fracture apertures within individual fracture planes, will control DNAPL migration (Kueper and others 1992). The preferential pathways for DNAPL migration will not necessarily be the same as for ground water flow. Numerical models and laboratory studies (Schwille, 1988; Pruess and Tsang, 1990; Kueper and McWhorter, 1991; Murphy and Thomson, 1993) have indicated that rates of DNAPL movement in single, small-aperture (less than 1 mm), rough-walled fractures range from minutes to hours per 1 m length of fracture (Pankow and Cherry, 1996). If these rates are applied to field conditions, DNAPL could sink through hundreds of meters of fractured rock in a matter of days to weeks, depending on fracture openings and interconnection. Rates in dissolution-enlarged fractures would be even faster.
B-6

Once the supply of the DNAPL to a fracture has been depleted, the DNAPL will redistribute itself as residual DNAPL and pools. In laboratory experiments, Schwille (1988) showed increased solvent retention in fractures when the aperture was reduced. Pools are distinct from residual DNAPL in that they are formed when the leading edge of the migrating DNAPL can no longer overcome capillary resistance (Pankow and Cherry, 1996). This situation can occur where a fracture pinches down to a smaller aperture or where the fracture is filled with fine-grained material. Substantial amounts of DNAPL can be retained as pools in fractures. These pools could be remobilized if the balance of forces holding them static changes. In large conduits and dissolution-enlarged fractures where DNAPL would be expected to drain freely, large amounts of DNAPL can pool in depressions, particularly in horizontal to gently dipping fractures or bedding-plane openings. DNAPL pools in fractured media can be a network of small interconnected fractures filled with solvent or DNAPL accumulations in depressions of dissolution-enlarged fractures.
DNAPL pools can persist for long periods of time. Pools that fill interconnected fractures have limited surface area in contact with moving ground water. The rate of dissolution from a DNAPL pool is controlled by vertical dispersion or diffusion (depending on the location of the pool), the solubility of the DNAPL, and subsequent removal of the dissolved phase by the moving ground water (Hunt and others, 1988). Because both dispersion and diffusion are quite slow, the lifetime of chlorinated DNAPL pools will typically be on the order of decades to centuries. DNAPL pools in depressions of dissolution-enlarged fractures present more surface area to moving ground water than do pools filling interconnected fractures, but DNAPL removal is still limited by vertical mixing. Ground water flow in dissolution-enlarged fractures may be turbulent, enhancing mixing with DNAPL pools and decreasing the DNAPL pool lifetime. Matrix diffusion is an important mechanism in DNAPL depletion where DNAPL is pooled in interconnected fractures and the matrix porosity is high (as is typical in fractured clays, shales, and some sedimentary rocks) (VanderKwaak and Sudicky, 1996). In matrix diffusion, DNAPL slowly dissolves into the adjacent water wetting the fracture and then diffuses into the porous matrix. Diffusion of DNAPL into water held in matrix porosity decreases the DNAPL mass held in fractures (Parker and others, 1994) and slows the movement of the concentration front in fractured aquifers (Vogel and Giesel, 1989). Pankow and Cherry (1996) show that in media with small fracture apertures (less than 1 mm) and significant matrix porosity (greater than 5 percent) the total void space in the matrix of fractured porous media is commonly orders of magnitude larger than the void space provided by the fracture network, and matrix diffusion can account for the complete disappearance of DNAPL from fractures. They further show that for a clay with matrix porosity of 37 percent and typical fracture apertures of 1 to 100 :, TCE would disappear into the clay matrix on the order of days to a few years; for sedimentary rocks with matrix porosity of 10 percent and fracture apertures of 10 to 100 :, years or decades would be required. Given the same matrix porosity, time for complete removal increases as fracture aperture increases due to higher DNAPL volume in relation to surface area.
In formations with large fracture porosities where the matrix/fracture mass-storage capacity ratio is less than one, complete removal of DNAPL cannot occur by diffusion into the matrix alone because the pore-water volume is insufficient (Pankow and Cherry, 1996). Although matrix diffusion may be more effective in removing DNAPL mass in fractures than dissolution into ground water, once the DNAPL mass is depleted, the mass diffused into the matrix will provide a continuing source for a dissolved ground water plume as it diffuses back out of the matrix.
References Bear. J. 1979. Hydraulics of Groundwater. McGraw Hill, Inc. Cohen, R.. and J. Mercer. 1993. DNAPL Site Evaluation. CRC Press, Boca Raton, FL. [Also available as EPA Publication EPA 600-R-93-022, 1993].
B-7

Hunt, J., N. Sitar, and K. Udell. 1988. Nonaqueous phase liquid transport and cleanup, 1: Analysis of mechanisms. Water Resources Research, v. 24, no. 8, p. 1247-1258. Kueper, B. and D. McWhorter. 1991. The behavior of dense, nonaqueous phase liquids in fractured clay and rock. Ground Water, v. 29, p. 1-33. Kueper, B., C. Haase, and H. King. 1992. Leakage of dense, nonaqueous phase liquids from waste impoundments constructed in fractured rock and clay: Theory and case history: Canadian Geotechnical Journal, v. 29, no. 2, p. 234-244. McKay, L., J. Cherry, and R. Gillham. 1993, Field experiments in a fractured clay till: 1. Hydraulic conductivity and fracture aperture. Water Resources Research, v. 29, p. 1149-1162. Murphy, J. and N. Thomson. 1993. Two-phase flow in a variable aperture fracture. Water Resources Research, v. 29, p. 3453-3476. Pankow, J. and J. Cherry. 1988. Foreword to dense chlorinated solvents in porous and fractured media. Schwille, F., 1988, (English translation by Pankow, J.F.), Boca Raton, Fla., CRC Press, 146 p. Pankow, J., and J. Cherry. 1996. Dense Chlorinated Solvents and Other DNAPL’s in Groundwater: History, Behavior, and Remediation. Waterloo Press: Portland, Oregon. Parker, B., R. Gillham, and J. Cherry. 1994. Diffusive disappearance of immiscible-phase organic liquids in fractured geologic media. Ground Water, v. 32, no. 5, p. 805-820. Poulsen, M. and B. Kueper. 1992. A field experiment to study the behavior of tetrachloroethylene in unsaturated porous media. Environmental Science and Technology, v. 26, no. 5, p. 889-895. Pruess, K. and Y. Tsang. 1990. On two-phase relative permeability and capillary pressure of rough-walled rock fractures. Water Resources Research, v. 26, no. 9, p. 1915-1926. Schwille, F. 1988. Dense Chlorinated Solvents in Porous and Fractured Media. (English translation by Pankow, J.F.) Chelsea, Mich., Lewis Publishers, 146 p. VanderKwaak, J. and E. Sudicky. 1996. Dissolution of nonaqueous-phase liquids and aqueous-phase contaminant transport in discretely-fractured porous media. Journal of Contaminant Hydrology, v. 23, no. 1-2, p. 45-68. Vogel, P. and W. Giesel. 1989. Propagation of dissolved substances in rock: Theoretical consideration of the relationship between systems of parallel fractures and homogeneous aquifers, in H. Kobus and W. Kinzelbach, International Symposium on Contaminant Transport in Groundwater, Stuttgart, April 4-6, 1989, Proceedings: Rotterdam, A.A. Balkema, p. 275-280. Wolfe, W., et al. 1997. Preliminary Conceptual Models of the Occurrence, Fate, and Transport of Chlorinated Solvents in Karst Regions of Tennessee, WRI Report 97-4097. U.S. Geological Survey, Department of the Interior.
B-8

APPENDIX C:INTERNET RESOURCES

This Page Left Intentionally Blank

APPENDIX C:INTERNET RESOURCES
The following websites provide both general and specific information on technologies and applications:
California Environmental Protection Agency Technology Certification Program. Provides downloadable reports on the results of testing carried out on, among other things, SCAPS and online hydrocarbon monitoring. http://www.calepa.ca.gov/calcert/partner.htm#TechPartnership
Case studies of demonstrations and applications of technologies and streamlined strategies. http://www.frtr.gov
Case studies of applications of technologies and streamlined strategies. http://www.clu-in.org/char1_edu.cfm
Center for Public Environmental Oversight. Provides a searchable database of characterization and remediation technology descriptions. http://www.cpeo.org/techtree/about.htm
Cluin. EPA Office of Superfund Remediation and Technology Innovation sponsored web site. Provides wide variety of downloadable reports and updates on characterization and remediation technologies as well as links to other environmental sites. http://www.cluin.org
DOE Office of Science and Technology. Under the “publications” button, provides extensive listing of publications and reports on innovative characterization, monitoring, and sensor technologies. http://apps.em.doe.gov/ost/itsrall.html
DOE Expedited Site Characterization, Ames Laboratory. Provides descriptions of a variety of innovative geophysical and analytical equipment demonstrations as well as a list of publications, some of which are downloadable. http://www.etd.ameslab.gov/etd/technologies/projects/esc/index.html
EPA Environmental Technology Verification Program. Provides downloadable reports on the results of testing carried out on, among other things, monitoring and characterization equipment. http://www.epa.gov/etv/
EPA Superfund Dynamic Field Activities Internet Site. Provides resources to support a streamlined, dynamic approach to measurement and monitoring. Resources include a Superfund guidance document and links to resources on numerous field-based analytical and sampling methods. http://www.epa.gov/superfund/programs/dfa/index.htm
EPA Triad Internet Site. Provides information on the Triad approach to site characterization which can be used for DNAPL site investigations. http://www.triadcentral.org/
ETV Canada. Provides abstracts of evaluated technologies and vendor contact information. http://www.etvcanada.com
Field Analytical Technologies Encyclopedia (FATE). Provides information on theory of operation, strengths, weaknesses, and general operating costs for selected technology classes and vendors. http://fate.cluin.org
C-1

Field sampling and analytical technology screening matrices. Contains general descriptions of equipment and rates them according to a variety of characteristics (e.g., analyte of interest, media, ease of use, relative cost). http://www.frtr.gov/site
Interstate Technology and Regulatory Council. Provides guidance documents in areas of interest to the committee. http://www.itrcweb.org (click on “Guidance Documents”)
REACHIT. Provides searchable (by analyte, location, instrumentation) database of commercial technology vendors. http://www.epareachit.org/index3.html
Strategic Environmental Research and Development Program (DOE/DOD/EPA). Provides a searchable list of proceeding citations, but articles are not available. Also provides numerous summary reports on site characterization and project results sponsored by the program. http://www.serdp.org/search/search_directory.html#
U.S. EPA Ada Laboratory Subsurface Remediation Information Center. Provides downloadable reports, issue papers, and research briefs on issues involving subsurface characterization and remediation. http://www.epa.gov/ahaazvuc/publications.html
USACE Waterways Hazardous Waste Research Center. Provides downloadable reports and articles published as part of the Installation Restoration Program. Some articles are related to innovations in monitoring and characterization. http://www.wes.army.mil/el/elpubs/irrp.html
C-2

APPENDIX DVENDOR LIST

Inclusion in this list does not constitute endorsement by EPA.
GEOPHYSICS
ABEM Instrument AB Hamngatan 27 S-172 66 Sundbyberg SwedenTel: + 46 8 764 60 60 Fax: + 46 8 28 11 09 web address: http://www.abem.segeophysical instrument manufacturer
Apex Parametrics, Ltd. P.O. Box 818 Stn MainUxbridge, ON L9P1N2 Canada Tel: 905-852-5875 Fax: 905-852-9688
Blackhawk GeoSciences301 Commercial Road, Suite BGolden, CO 80401Tel: 303-278-8700Fax: 303-278-0789web address: http://www.blackhawkgeo.comgeophysical surveys
Chinook Geoconsulting, Inc. 26961 Hilltop Road Evergreen, CO 80439 Tel/Fax: 303-674-0252web address: http://www.chinook-inc.com/magnetotellurics/geophysics
Clearview Geophysics, Inc. 12 Twisted Oak Street Brampton, Ontario L6R 1T1 Canada Tel: 905-458-1883 Fax: 905-792-1884 web address: http://www.geophysics.ca/ geophysical surveys
Earth Dynamics, Inc.
2284 NW Thurman St.Portland, OR 97210Tel: 503-227-7659Fax: 503-227-1074web address: http://www.earthdyn.comgeophysical surveys
Electromagnetic Instruments, Inc.1301 S. 46th St. UCRFS Bldg. 300Richmond, CA 94804Tel: 510- 232-7997Fax: 510- 232-7998web address: http://www.emiinc.com/electromagnetic instruments including
GEHM Environmental Corporation 1480 Ashley Road P.O. Box 65Boonville, MO 65233Tel: 660-882-3485Fax: 660-882-5766web address: http://www.gehm.com/electromagnetic offset logging
Geo Instruments Pty Limited348 Rocky Point Rd, Ramsgate NSW 2217Sydney, Australia Tel: +61 2 9529 2355 Fax: +61 2 9529 9726web address: http://www.geoinstruments.com.au/geophysical instruments
Geophex, Ltd.605 Mercury Street, Raleigh, NC 27603Tel: 919-839-8515Fax: 919- 839-8528web address: http://www.geophex.comgeophysical surveys GEM em equipment
Geophysical Survey Systems, Inc.13 Klein Drive, PO Box 97North Salem, NH 03073-0097 Tel: 603-893-1109Fax: 603-889-3984web address: http://www.Geophysical.comground penetrating radar manufacturer
Geophysical Instrument Supply Company 6323 Cambridge St.
D-1
Minneapolis, MN 55416 Tel: 952-929-8000 Fax: 952-926-5498 web address: http://www.giscogeo.com/ geophysical equipment sales and rentals
GEOVision, Inc. 1151 Pomona Road, Unit P Corona, CA 92882 Tel: 909- 549-1234 web address: http://www.geovision.com geophysical surveys
GPE, Inc. 4509 NW 23rd Avenue, Suite 16 Gainesville, FL 32606 Tel: 352-372-2403 Fax: 352-372-3757 web address: http://www.gpe.org/ cross borehole seismic hammer
Hager-Richter Geoscience, Inc. 8 Industrial Way D-10 417 Salem, NH 03079 Tel: 603- 893-9944 Fax: 603- 893-8313 web address: http://www.hager-richter.com geophysics (electromagnetics)
IRIS Instruments 1 Avenue Buffon BP 6007 - 45060 Orleans Cedex 2 France Tel: + 33 238638100 Fax: + 33 238638182 web address: http://www.iris-instruments.com/ geophysical equipment sales
MALÅÅ GeoScience USA Inc. 2040 Savage Rd. PO Box 80430 Charleston, SC 29416 Tel: 843-852-5021 Fax: 843-769-7397 web address: http://www.malags.se Ground penetrating radar manufacturer
NAEVA Geophysics, Inc. 4707 Benson Avenue, Suite 104 Baltimore, MD 21227
Tel: 410- 536-7600 Fax: 410- 536-7602 web address: http://www.naevageophysics.com geophysical surveys
Northwest Geophysical Associates, Inc. 1600 SW Western Boulevard, Suite 200 Corvallis, OR 97333 Tel: 541- 757-7231 Fax: 541- 757-7331 web address: http://www.nga.com seismic surveys
SJ Geophysics Ltd. 11762-94 Avenue, Delta, BC Canada V4C 3R7 Tel: 604-582-1100 Fax: 604-589-7466 web address: http://www.sjgeophysics.com geophysical surveys
SCINTREX, Inc. 11002 Metric Boulevard, Suite 100 Austin, TX, 78758 Tel: 512- 346-0077 Fax: 512-346-0088 web address: http://www.scintrexltd.com/ geophysical surveys and equipment rentals
Spectrum Geophysics 622 Glenoaks Blvd. San Fernando, CA 91340 Tel: 818-365-9371 Fax: 818-361-1680 web address: http://www.spectrum-geophysics.com/ geophysical surveys
Terraplus USA 625 Valley Road Littleton, CO 80124 Tel: (303) 799-4140 Fax: (303) 799-4776 web address: http://www.terraplus.com/ geophysical equipment
WMI International, Inc. 4901 Milwee St. # 109 Houston, TX 77092 Tel: 713-956-4001
D-2

Fax: 713-956-7305 web address: http://www.wmi-intl.com/electromagnetic offset logging
Zonge Geosciences, Inc.924 Greg StreetSparks, NV 89431Tel: 775-355-7707Fax: 775- 355-9144 web address: http://www.zonge.com/geophysical surveys and equipment sales andrental
D-3
NON-GEOPHYSICAL
Columbia Technologies, LLC 1450 South Rolling Rd. Baltimore, MD 21227 Tel: 410-536-9911 Fax: 410-536-0222 web address: http://www.columbiadata.com DP, MIP, LIF and other downhole services
Dakota Technologies, Inc. 2201-A 12th St. N. Fargo ND 58102 Tel: 701-237-4908 Fax: 701-237-4926 web address: http://www.dakotatechnologies.com DP and LIF services
Environmental Support Technologies, Inc. 360 Goddard Irvine, CA 92618-4601 Tel: 949-679-9500 Fax: 949-679-9501 Web address: http://www.est-inc.com DP services
Fugro Geosciences, Inc. US Headquarters 6105 Rookin Houston, TX 77074 Tel: 713-346-4000 Fax: 713-346-4002 web address: http://www.geo.fugro.com/ CPT/DP rigs and geophysical surveys
GeoInsight 1680 Hickory Loop, Suite B Las Cruces, NM 88005 Tel: 505-523-5799 Fax: 505-523-0789 web address: http://www.geoinsightonline.com/ DP probes and wells
GeoNordic AB Reimersholmsgatan 23 S-117 40 Stockholm, Sweden Telephone: + 46 8 669 96 30 Fax: + 46 8 669 96 21 web address: http://www.geonordic.se GeoN groundwater sampler (BAT® style)
Geoprobe Systems, Inc. 601 N. Broadway Salina, KS 67401 Tel: 785-825-1842 Fax: 785-825-2097 web address: http://www.geoprobe.com DP equipment and services
Gregg Drilling and Testing, Inc. 950 Howe Road Martinez, CA 94553 Tel: (925) 313-5800 Fax: (925) 313-0302 web address: http://www.greggdrilling.com/ CPT/DP services
Precision Sampling, Inc. main office 1400 S. 50th Street Richmond, CA 94804 Telephone 510-237-4575 Fax 510-237-4574 web address: http://www.precisionsampling.com DP services
Solinst Canada Ltd. 35 Todd Rd. Georgetown, Ontario Canada L7G 4R8 Tel: 905-873-2255 Fax: 905-873-1992 web address: http://www.solinst.com groundwater sampling equipment sales
D-4