current and emerging techniques for dnapl site …...current and emerging techniques for dnapl site...
TRANSCRIPT
Current and emerging techniques for
DNAPL site characterization
Gary Wealthall, Neal Durant (Geosyntec Consultants, Inc.)
Torben Højbjerg Jørgensen, Bernt Grosen (COWI A/S)
and Mette Broholm (DTU Environment)
Presentation Outline
Challenges to DNAPL site characterization
Site Characterization Methods
Qualitative versus Quantitative data
Current and emerging techniques
Examples from chlorinated solvents and coal tar sites
Guidance documents

Challenges to DNAPL site characterization
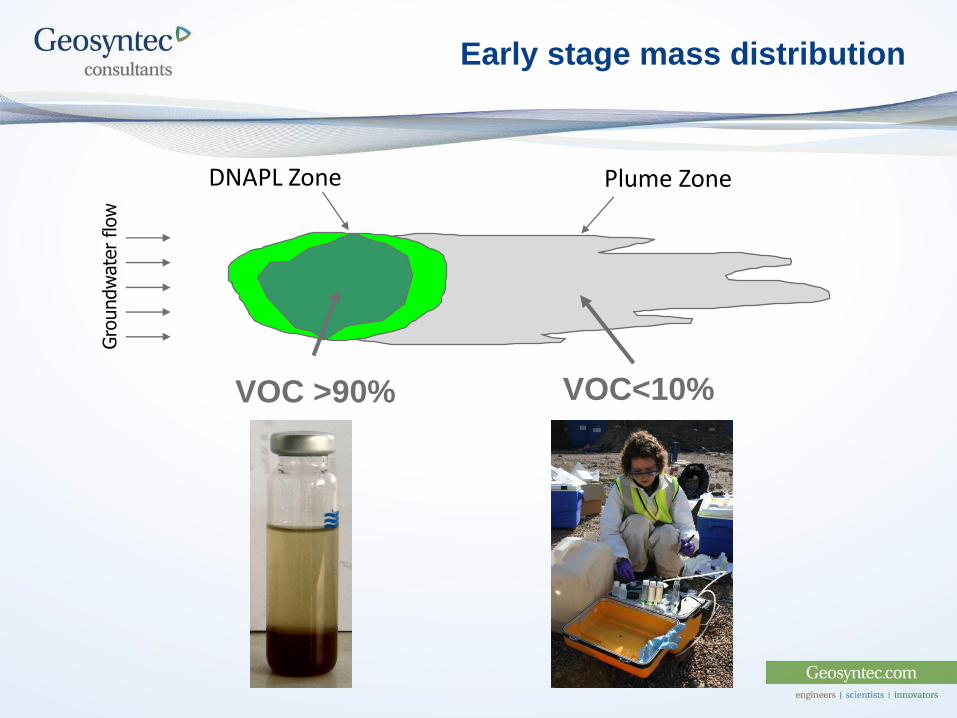
Early stage mass distribution
DNAPL Zone
Gro
undw
ate
r flow
Plume Zone
VOC<10% VOC >90%
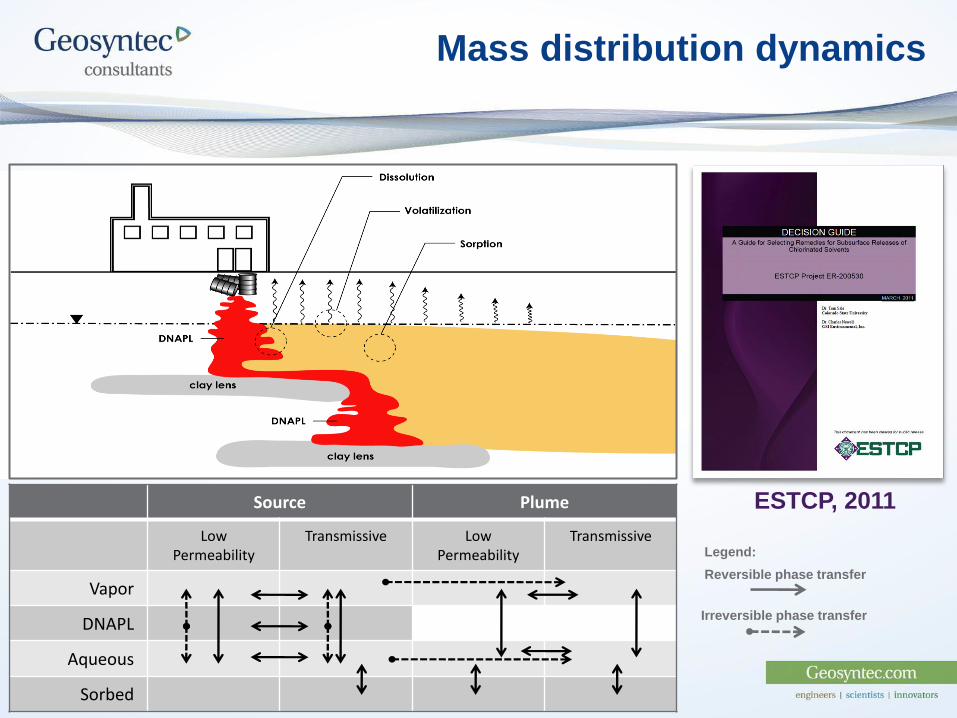
Mass distribution dynamics
Source Plume
Low Permeability
Transmissive Low Permeability
Transmissive
Vapor
DNAPL
Aqueous
Sorbed
Reversible phase transfer
Irreversible phase transfer
Legend:
ESTCP, 2011
Site Characterization Methods Qualitative versus Quantitative
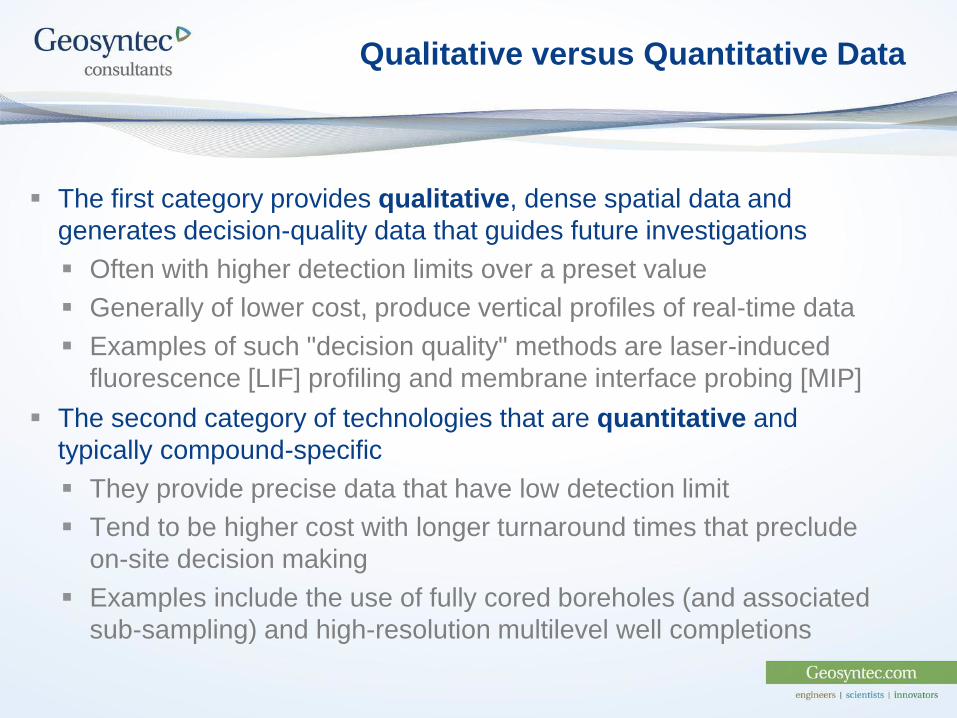
Qualitative versus Quantitative Data
The first category provides qualitative, dense spatial data and
generates decision-quality data that guides future investigations
Often with higher detection limits over a preset value
Generally of lower cost, produce vertical profiles of real-time data
Examples of such "decision quality" methods are laser-induced
fluorescence [LIF] profiling and membrane interface probing [MIP]
The second category of technologies that are quantitative and
typically compound-specific
They provide precise data that have low detection limit
Tend to be higher cost with longer turnaround times that preclude
on-site decision making
Examples include the use of fully cored boreholes (and associated
sub-sampling) and high-resolution multilevel well completions

Current and emerging techniques
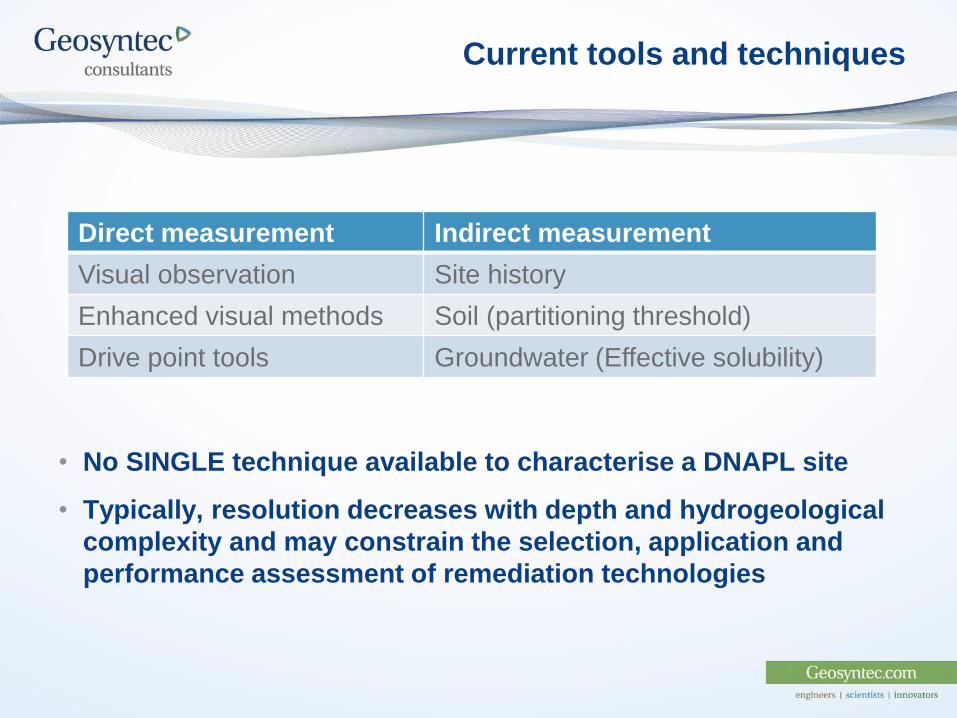
Current tools and techniques
• No SINGLE technique available to characterise a DNAPL site
• Typically, resolution decreases with depth and hydrogeological
complexity and may constrain the selection, application and
performance assessment of remediation technologies
Direct measurement Indirect measurement
Visual observation Site history
Enhanced visual methods Soil (partitioning threshold)
Drive point tools Groundwater (Effective solubility)
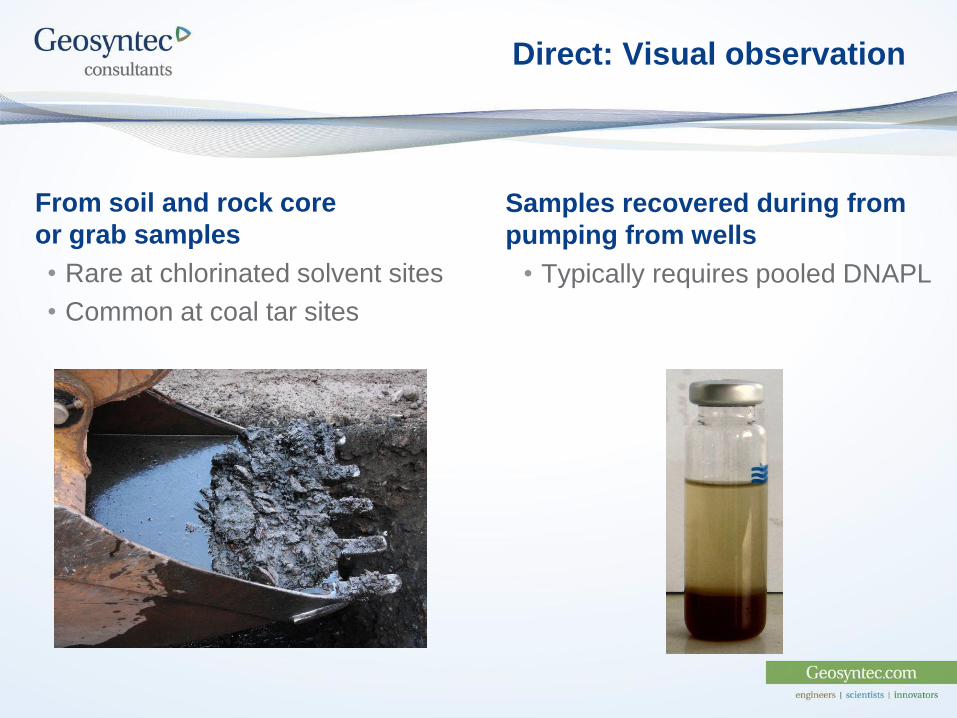
Direct: Visual observation
From soil and rock core
or grab samples
• Rare at chlorinated solvent sites
• Common at coal tar sites
Samples recovered during from
pumping from wells
• Typically requires pooled DNAPL
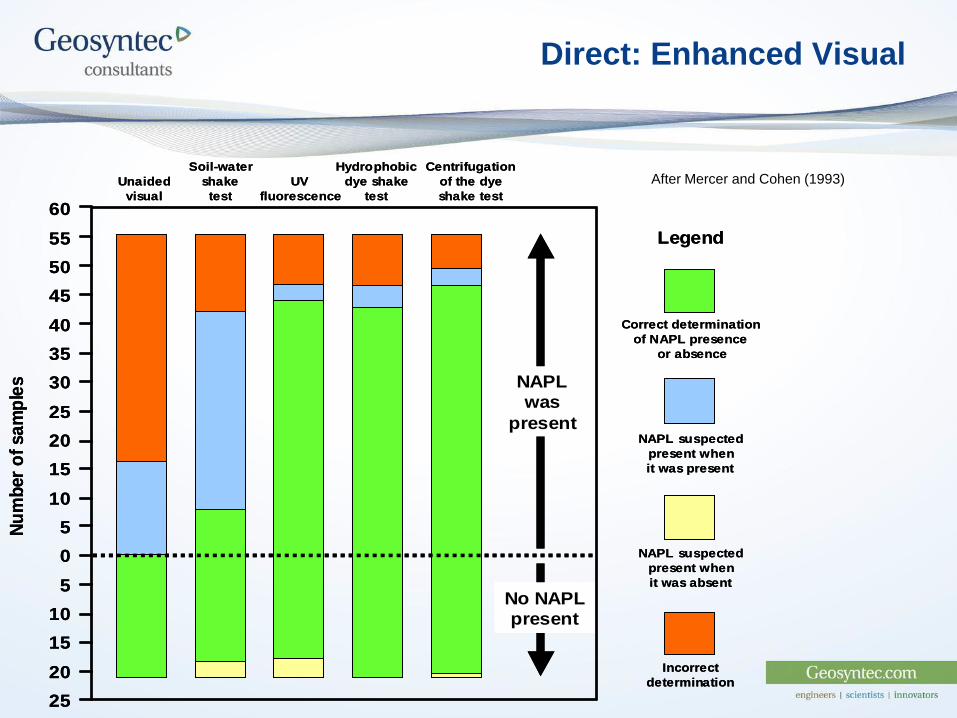
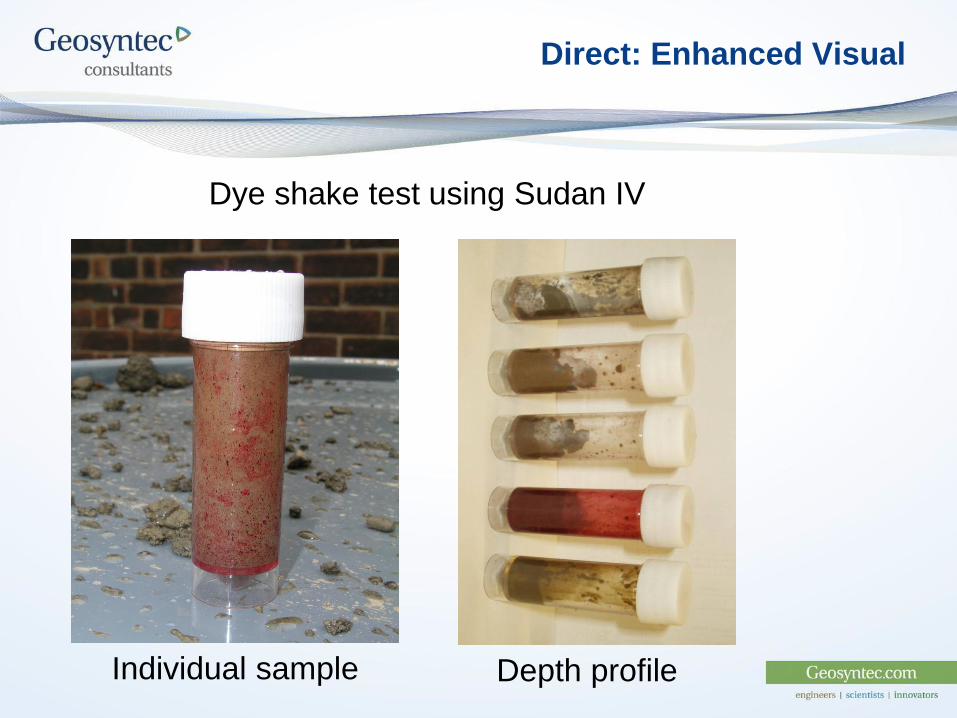
Direct: Enhanced Visual
After Mercer and Cohen (1993)
60
55
50
45
40
35
30
25
20
15
10
5
0
5
10
15
20
25
Legend
Correct determination
of NAPL presence
or absence
Incorrect
determination
NAPL suspected
present when
it was present
NAPL suspected
present when
it was absent
NAPLwas
present
No NAPLpresent
Unaided
visual
UV
fluorescence
Soil-water
shake
test
Hydrophobic
dye shake
test
Centrifugation
of the dye
shake test
Nu
mb
er
of
sa
mp
les
Direct: Enhanced Visual
Dye shake test using Sudan IV
Individual sample Depth profile
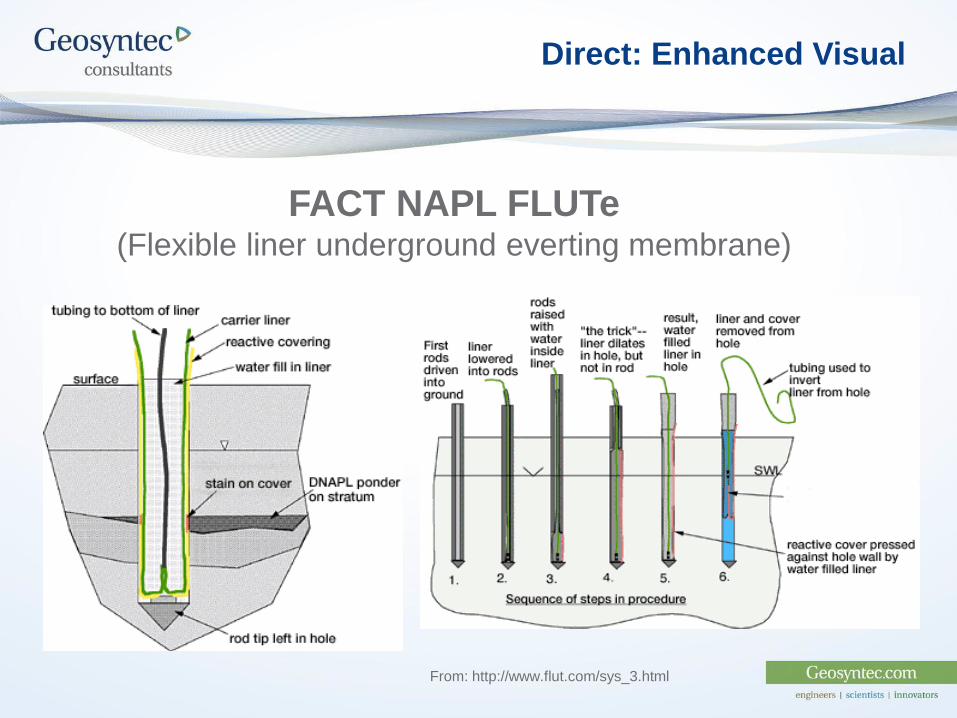
FACT NAPL FLUTe (Flexible liner underground everting membrane)
From: http://www.flut.com/sys_3.html
Direct: Enhanced Visual
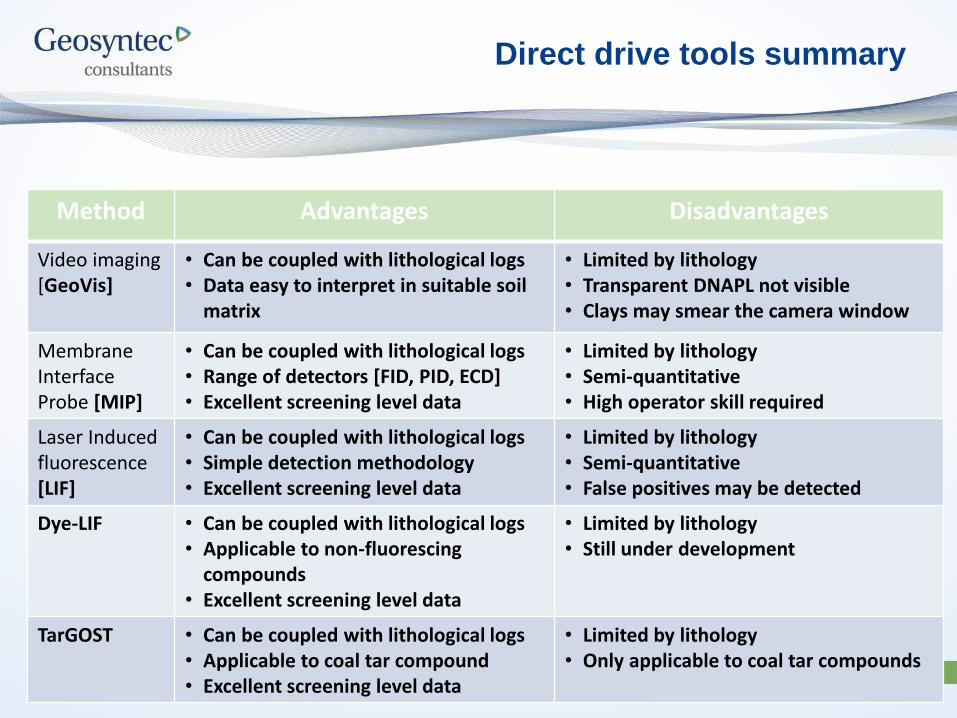
Direct drive tools summary
Method Advantages Disadvantages
Video imaging [GeoVis]
• Can be coupled with lithological logs • Data easy to interpret in suitable soil
matrix
• Limited by lithology • Transparent DNAPL not visible • Clays may smear the camera window
Membrane Interface Probe [MIP]
• Can be coupled with lithological logs • Range of detectors [FID, PID, ECD] • Excellent screening level data
• Limited by lithology • Semi-quantitative • High operator skill required
Laser Induced fluorescence [LIF]
• Can be coupled with lithological logs • Simple detection methodology • Excellent screening level data
• Limited by lithology • Semi-quantitative • False positives may be detected
Dye-LIF • Can be coupled with lithological logs • Applicable to non-fluorescing
compounds • Excellent screening level data
• Limited by lithology • Still under development
TarGOST • Can be coupled with lithological logs • Applicable to coal tar compound • Excellent screening level data
• Limited by lithology • Only applicable to coal tar compounds
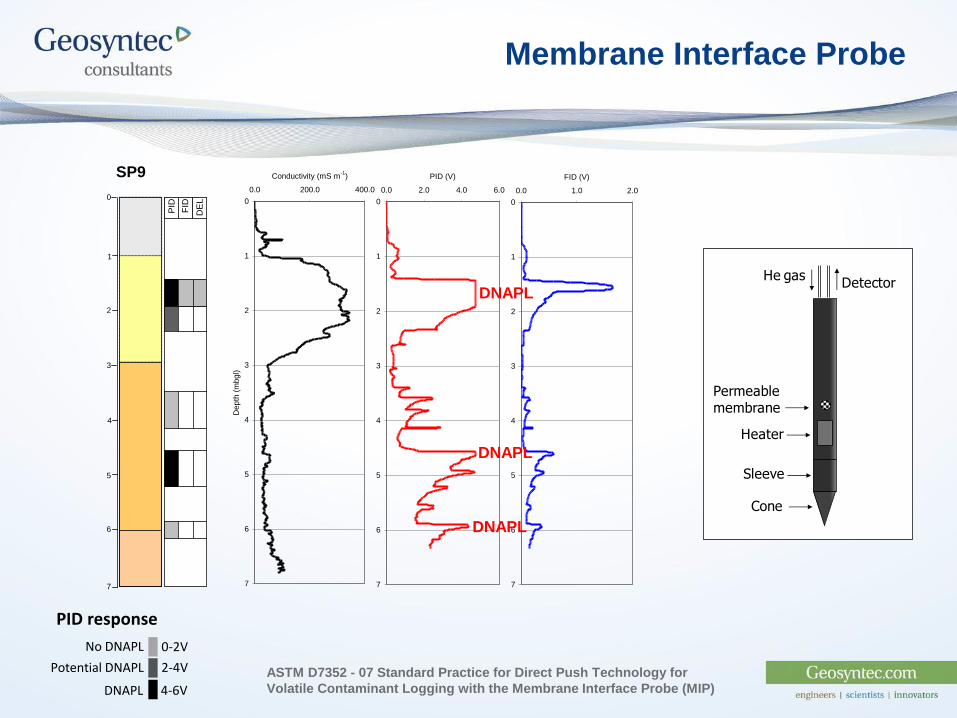
Membrane Interface Probe
Permeablemembrane
DetectorHe gas
Sleeve
Cone
Heater
ASTM D7352 - 07 Standard Practice for Direct Push Technology for
Volatile Contaminant Logging with the Membrane Interface Probe (MIP)
0
1
2
3
4
5
6
7
0.0 0.5 1.0 1.5
DELCD (V)
0
1
2
3
4
5
6
7
0.0 1.0 2.0
FID (V)
0
1
2
3
4
5
6
7
0.0 2.0 4.0 6.0
PID (V)
0
1
2
3
4
5
6
7
0.0 200.0 400.0
Conductivity (mS m-1
)
Depth
(m
bgl)
0
4
3
1
2
5
6
7
PID
FID
DE
L
SP9
DNAPL
DNAPL
DNAPL
0-2V
2-4V
4-6V
PID response
No DNAPL
Potential DNAPL
DNAPL
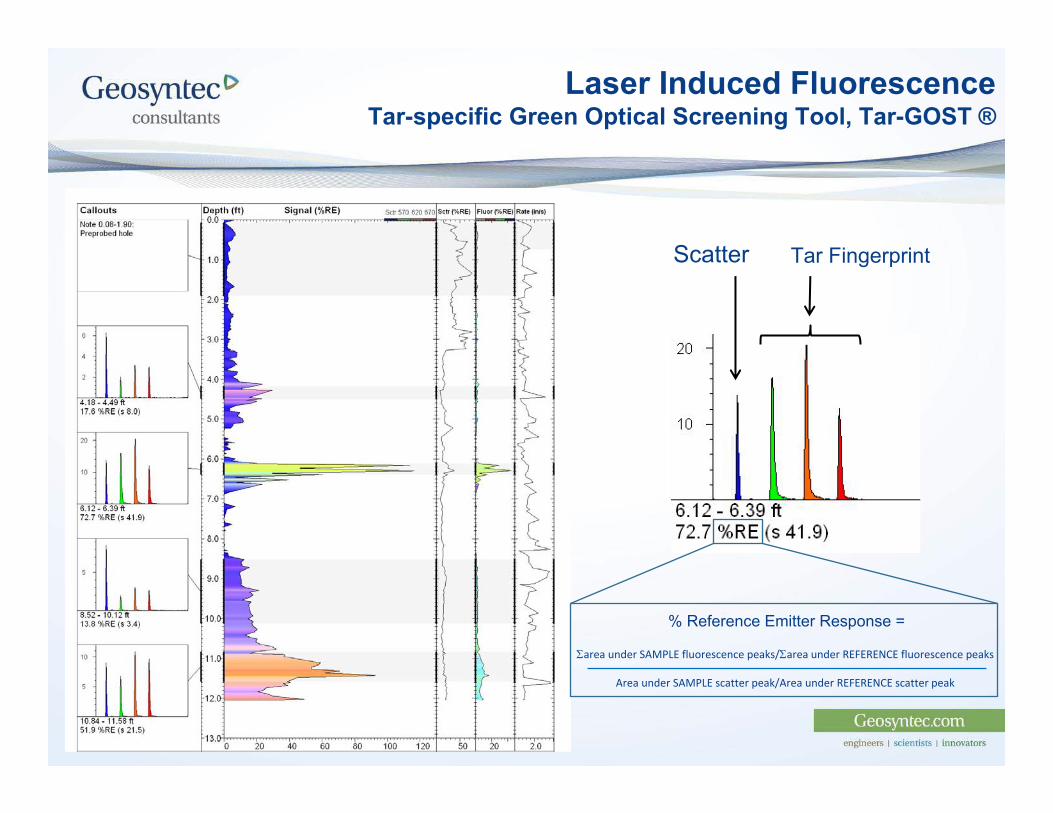
Scatter Tar Fingerprint
% Reference Emitter Response =
Σarea under SAMPLE fluorescence peaks/Σarea under REFERENCE fluorescence peaks
Area under SAMPLE scatter peak/Area under REFERENCE scatter peak
Laser Induced FluorescenceTar-specific Green Optical Screening Tool, Tar-GOST ®
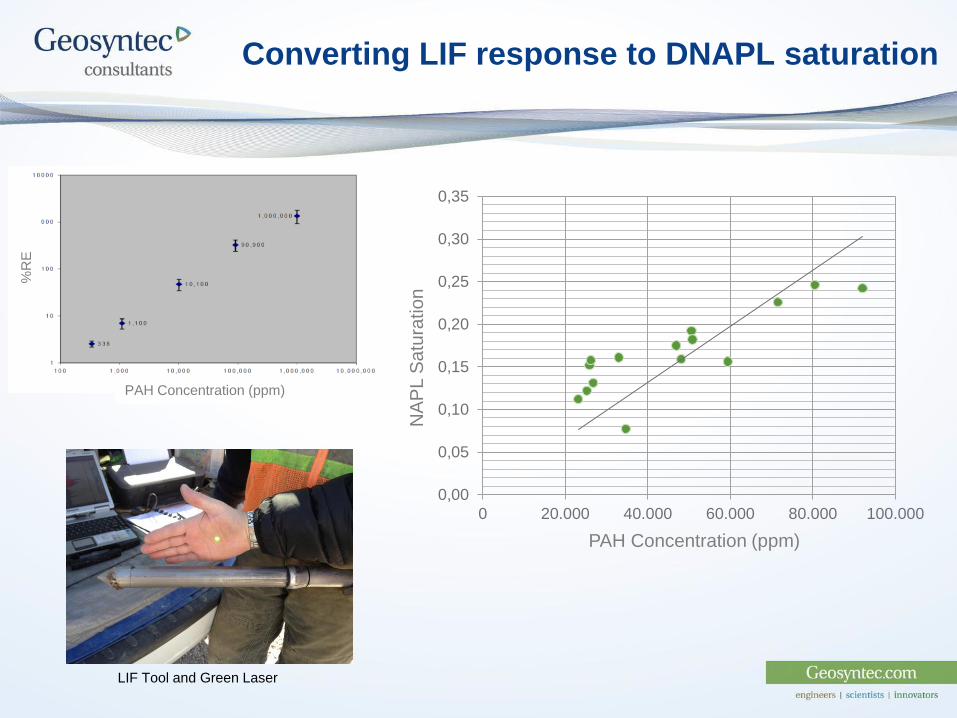
Converting LIF response to DNAPL saturation
NA
PL S
atu
ratio
n
PAH Concentration (ppm)
0,00
0,05
0,10
0,15
0,20
0,25
0,30
0,35
0 20.000 40.000 60.000 80.000 100.000
%R
E
PAH Concentration (ppm)
LIF Tool and Green Laser
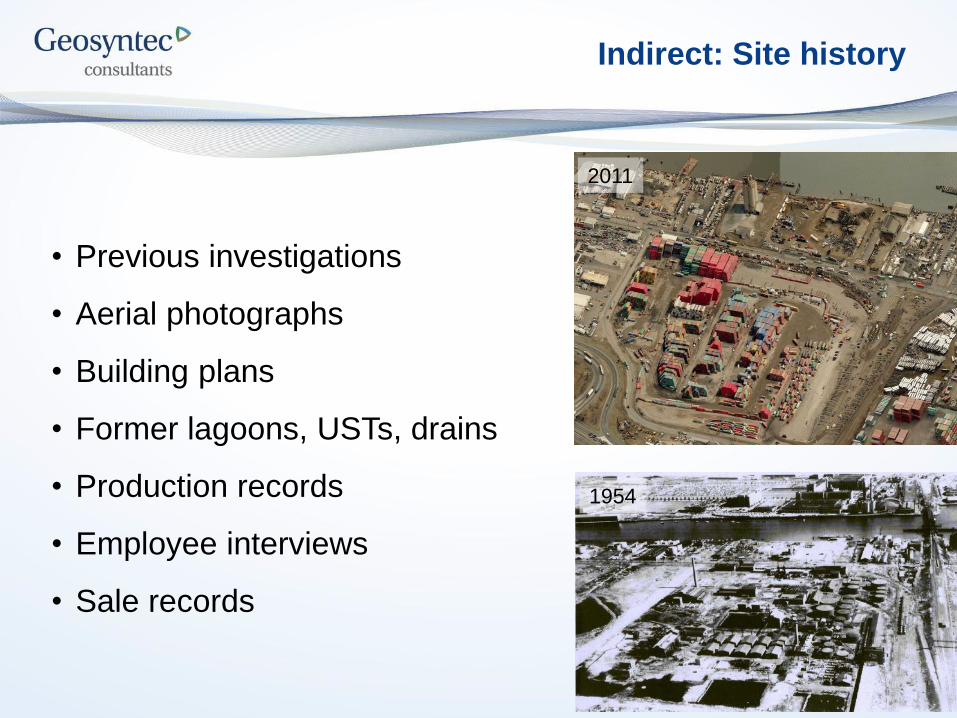
Indirect: Site history
• Previous investigations
• Aerial photographs
• Building plans
• Former lagoons, USTs, drains
• Production records
• Employee interviews
• Sale records
1954
2011
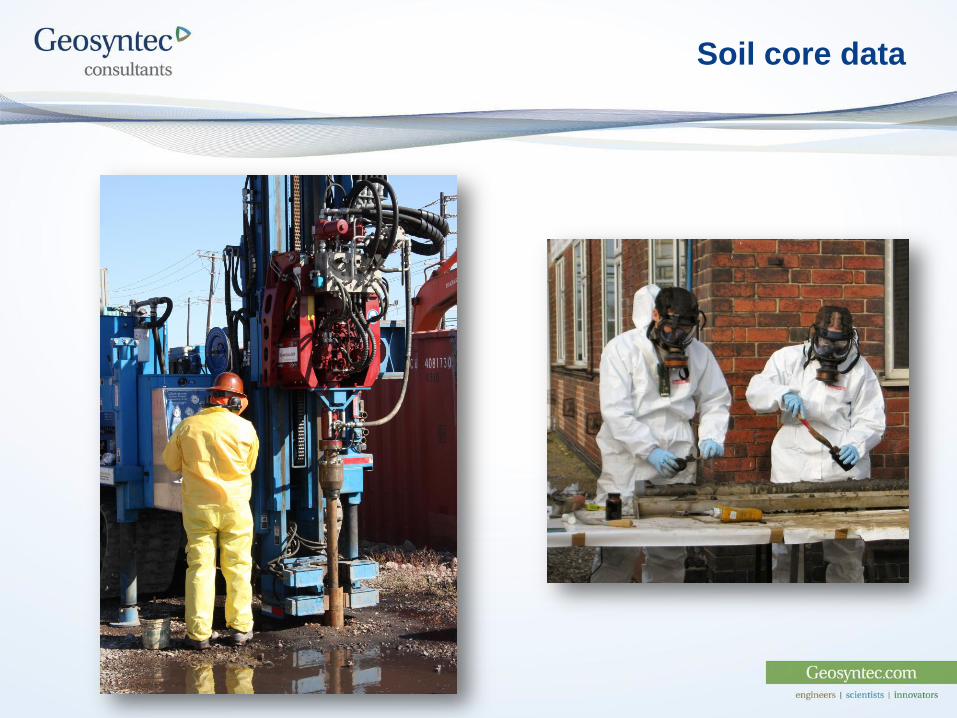
Soil core data
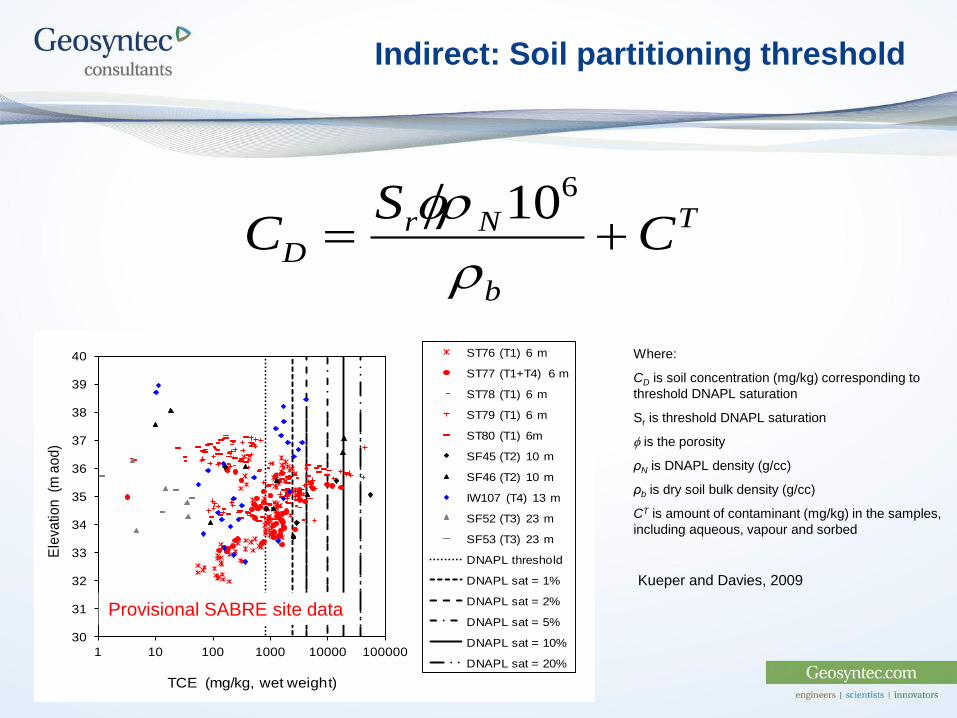
Indirect: Soil partitioning threshold
Where:
CD is soil concentration (mg/kg) corresponding to
threshold DNAPL saturation
Sr is threshold DNAPL saturation
f is the porosity
ρN is DNAPL density (g/cc)
ρb is dry soil bulk density (g/cc)
CT is amount of contaminant (mg/kg) in the samples,
including aqueous, vapour and sorbed
T
b
NrD C
SC
f 610
30
31
32
33
34
35
36
37
38
39
40
1 10 100 1000 10000 100000
Ele
vatio
n (
m a
od
)
TCE (mg/kg, wet weight)
ST76 (T1) 6 m
ST77 (T1+T4) 6 m
ST78 (T1) 6 m
ST79 (T1) 6 m
ST80 (T1) 6m
SF45 (T2) 10 m
SF46 (T2) 10 m
IW107 (T4) 13 m
SF52 (T3) 23 m
SF53 (T3) 23 m
DNAPL threshold
DNAPL sat = 1%
DNAPL sat = 2%
DNAPL sat = 5%
DNAPL sat = 10%
DNAPL sat = 20%
Provisional SABRE site data
Kueper and Davies, 2009
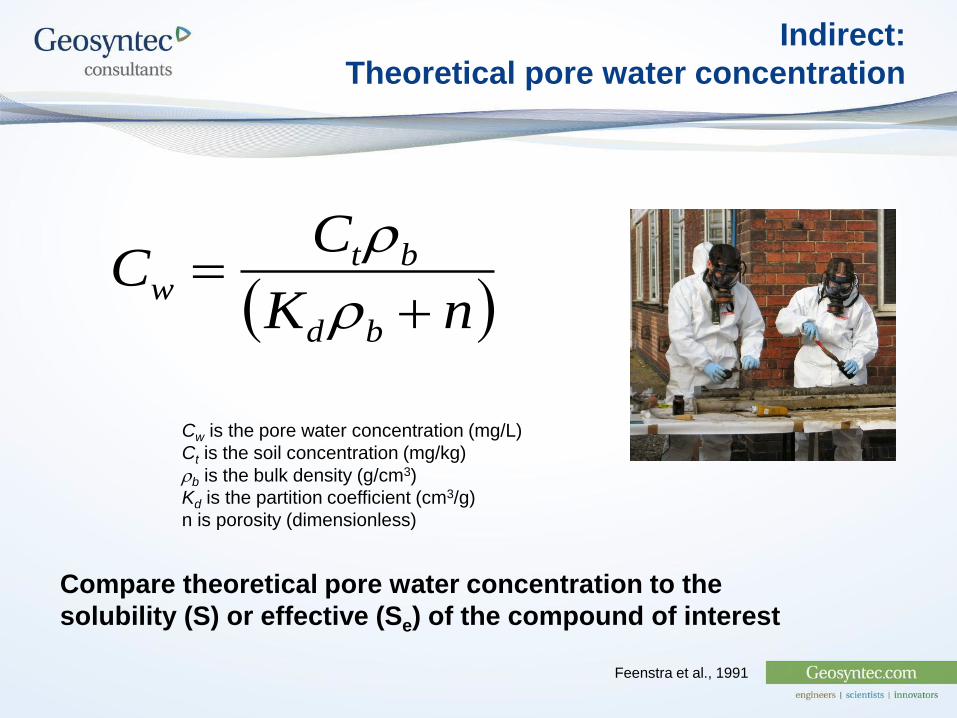
Indirect:
Theoretical pore water concentration
nK
CC
bd
btw
Cw is the pore water concentration (mg/L)
Ct is the soil concentration (mg/kg)
b is the bulk density (g/cm3)
Kd is the partition coefficient (cm3/g)
n is porosity (dimensionless)
Compare theoretical pore water concentration to the
solubility (S) or effective (Se) of the compound of interest
Feenstra et al., 1991
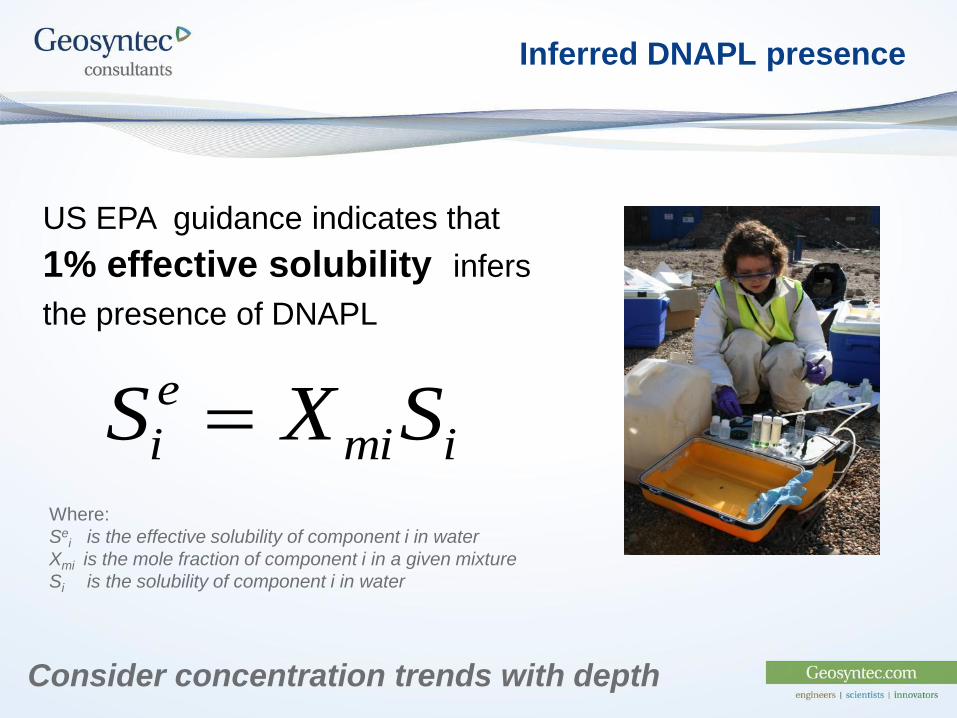
Inferred DNAPL presence
US EPA guidance indicates that
1% effective solubility infers
the presence of DNAPL
Where:
Sei is the effective solubility of component i in water
Xmi is the mole fraction of component i in a given mixture
Si is the solubility of component i in water
imi
e
i SXS
Consider concentration trends with depth
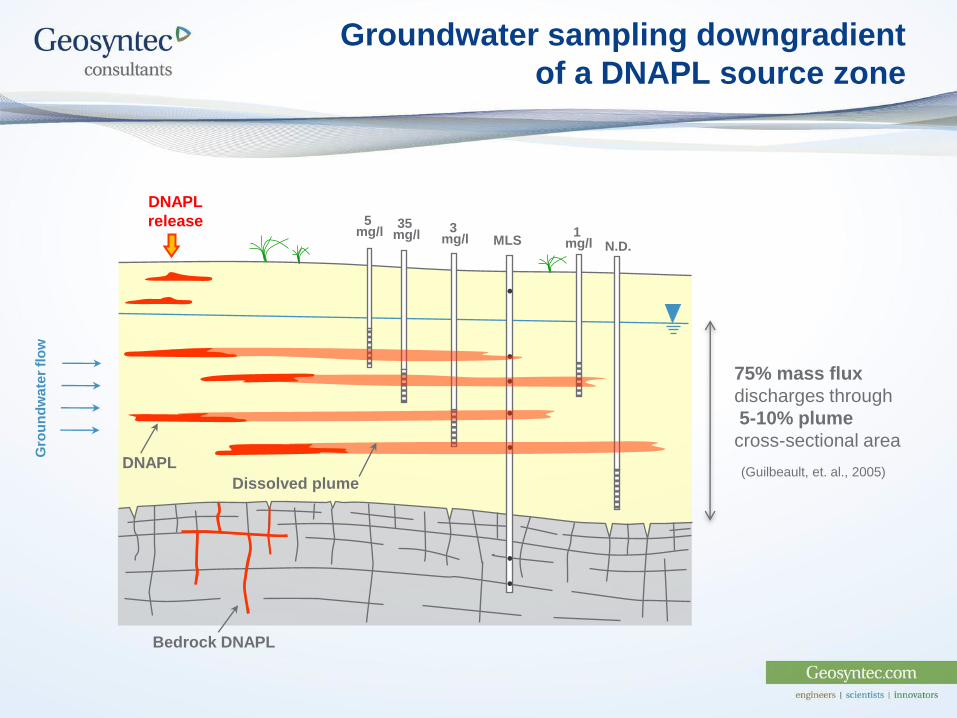
DNAPL
release 5 mg/l
35 mg/l
3 mg/l
1 mg/l N.D.
Gro
un
dw
ate
r fl
ow
Groundwater sampling downgradient
of a DNAPL source zone
75% mass flux
discharges through
5-10% plume
cross-sectional area
(Guilbeault, et. al., 2005)
MLS
DNAPL
Dissolved plume
Bedrock DNAPL
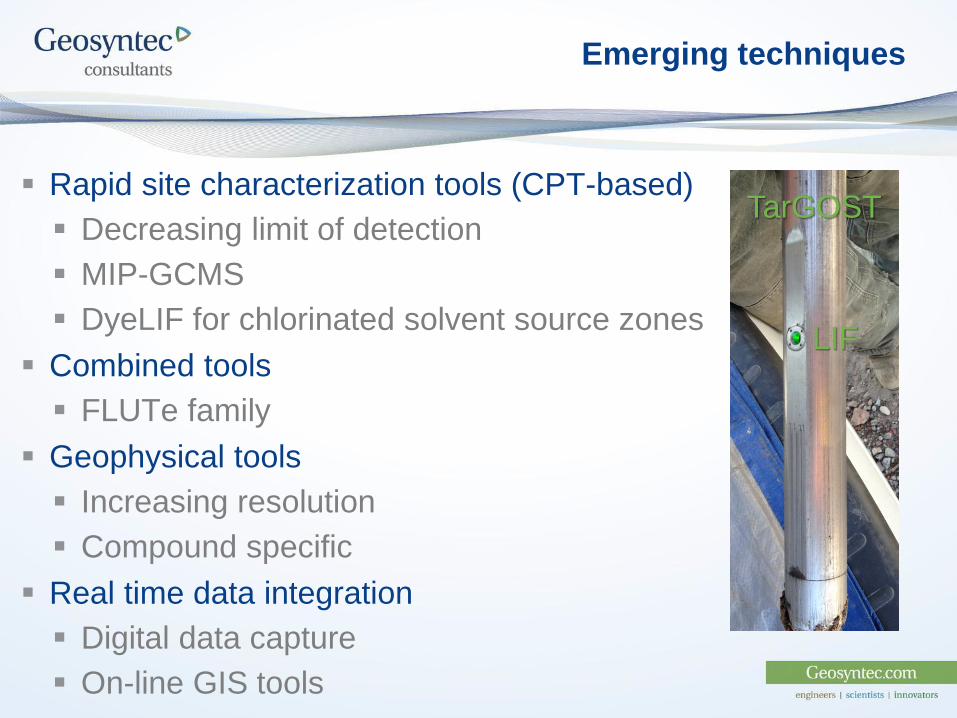
Emerging techniques
Rapid site characterization tools (CPT-based)
Decreasing limit of detection
MIP-GCMS
DyeLIF for chlorinated solvent source zones
Combined tools
FLUTe family
Geophysical tools
Increasing resolution
Compound specific
Real time data integration
Digital data capture
On-line GIS tools
TarGOST
LIF

Guidance Documents
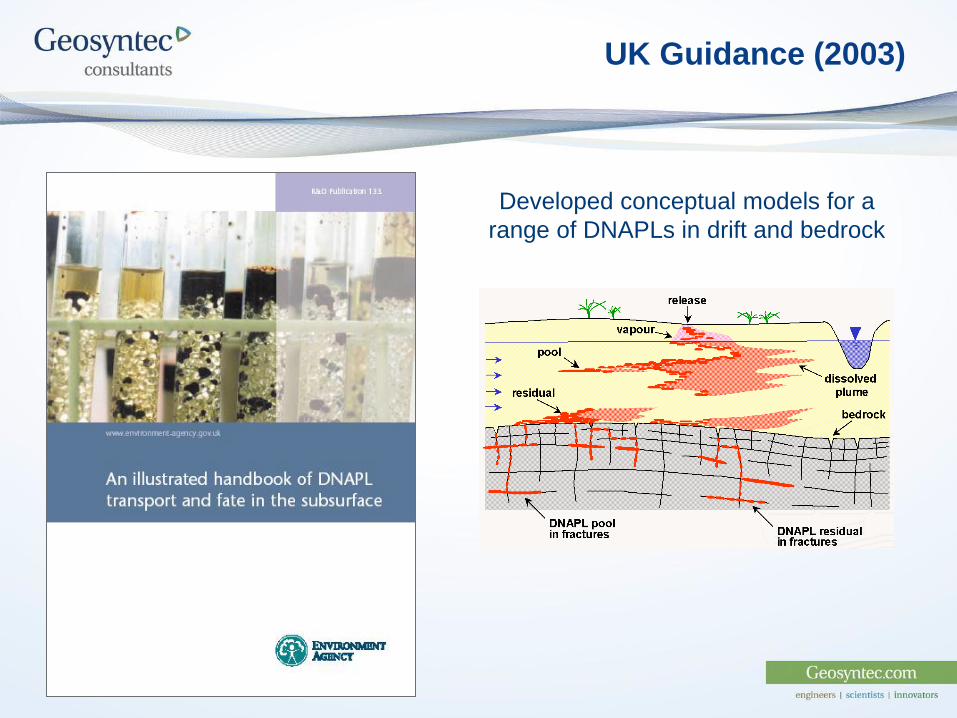
UK Guidance (2003)
Developed conceptual models for a
range of DNAPLs in drift and bedrock
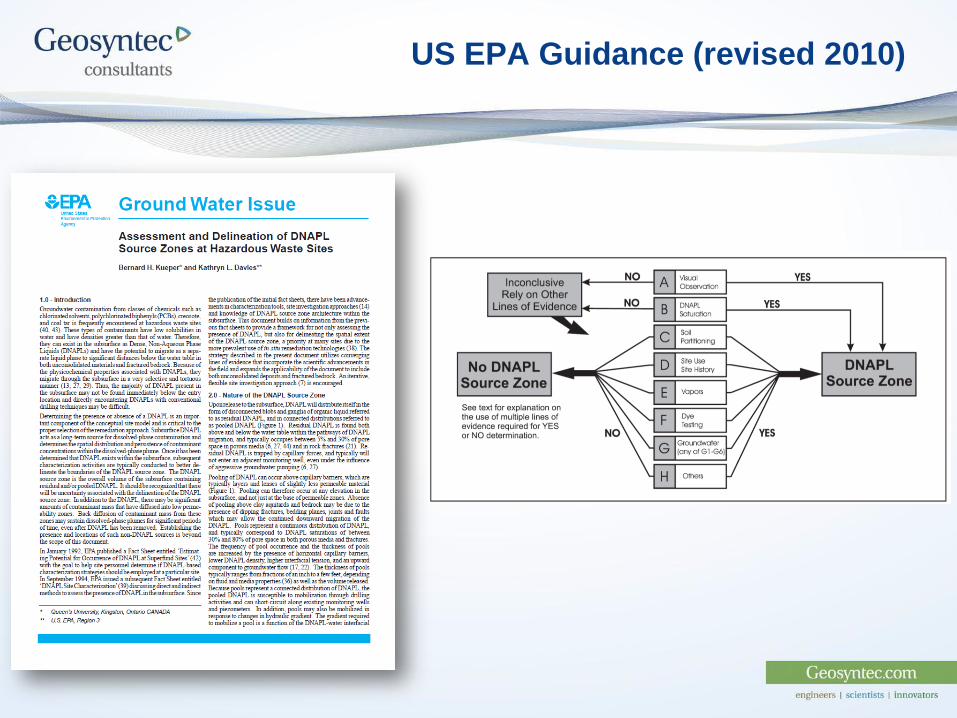
US EPA Guidance (revised 2010)
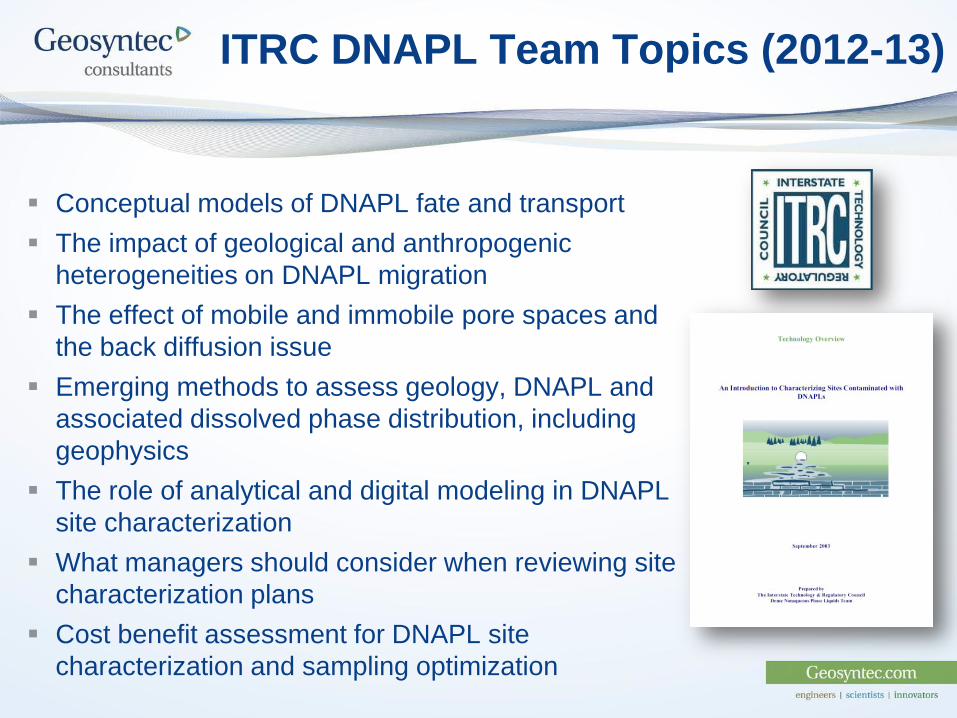
ITRC DNAPL Team Topics (2012-13)
Conceptual models of DNAPL fate and transport
The impact of geological and anthropogenic
heterogeneities on DNAPL migration
The effect of mobile and immobile pore spaces and
the back diffusion issue
Emerging methods to assess geology, DNAPL and
associated dissolved phase distribution, including
geophysics
The role of analytical and digital modeling in DNAPL
site characterization
What managers should consider when reviewing site
characterization plans
Cost benefit assessment for DNAPL site
characterization and sampling optimization