a practical guide to in-place balancing randall l. fox
TRANSCRIPT
A PRACTICAL GUIDE TO IN-PLACE BALANCING by
Randall L. Fox District Manager
IRD Mechanalysis, Inc. Houston, Texas
Randall L . Fox received his B .S . degree in Industrial Arts Education from Ohio State University in 1 966 and joined IRD Mechanalysis in 1 968 as a consultant engineer in vibration analysis and dynamic balancing . In 1 970 he joined IRD's Customer Training Department and held the position of training director until 1979, when he was appointed district sales manager for IRD's Houston Eas t Territory . He has c o n du c te d numerous seminars on vibration a n d noise control throughout the United States, Canada, the United Kingdom, Latin America, and many other countries, and has written and presented many technical papers for trade journals, technical societies, and engineering groups on the subjects of vibration and noise measurement, analysis and dynamic balancing .
ABSTRACT
Rotor unbalance remains one of the leading causes of deterioration and vibration of rotating machinery; but, if physical weight corrections can be made, many machines can be successfully balanced in-place with considerable savings in downtime and labor costs. In-place balancing can, however, pose some unique problems, and a prime concern is the time, expense, and wear and tear to simply start and stop the machine for trial data. Therefore, this paper is presented to provide guidelines for recognizing and overcoming some of the more common in-place balancing problems so that the number of balance runs can be kept to a minimum.
Vibration analysis techniques are presented as the first step to verify that the problem is truly unbalance and not looseness, weakness, distortion, resonance, misalignment, eccentricity, or other problems which could be mistaken for unbalance. Problems such as repeatability, rotor sag, stratification, thermal distortion, load effects, rotor speed and other variables which can influence rotor balance are discussed. Measurement techniques and common sources of measurement error are also presented.
The importance of identifying the type of rotor unbalance (static, couple, quasi-static, or dynamic) is presented along with a review of common single- and two-plane balancing procedures with emphasis on their suitability for in-place balancing. Methods are presented for determining suitable trial weights - both amount and position - to achieve the desired results. Finally, guidelines are presented for establishing realistic balance and vibration tolerances for rotors balanced in-place.
INTRODUCTION
The process of balancing a part without taking it out of the machine is called IN-PLACE BALANCING. In-place balancing eliminates costly, time consuming disassembly and pre-
113
vents the possibility of damaging the rotor during its removal, transportation to and from a balancing facility, and, finally, reinstallation in the machine. In-place balancing is a straightforward procedure; however, before a rotor can be balanced, certain conditions must be met:
1. There must be provisions for making weight corrections,
2. There must be provisions for obtaining accurate unbalance vibration amplitude and phase measurements,
3. It must be possible to start and stop the machine for making weight corrections, and
4. The vibration problem must be due to unbalance. Whether or not the first three conditions can be met is
generally obvious. There are numerous problems which can reveal vibration characteristics similar to unbalance including misalignment (of couplings or bearings), resonance, looseness, weakness, eccentricity, distortion, reciprocating forces, electrical problems, and aerodynamic or hydraulic forces. These problems cannot be totally corrected by balancing and attempting to balance and result in a costly waste of time and effort. Therefore, a thorough analysis of the vibration must be carried out first to confirm that the problem is actually unbalance.
ANALYZING THE PROBLEM
The first step in analyzing the problem doesn't requ.ire instrumentation or measurements. It simply involves learnmg and evaluating the circumstances leading up to the current situation. Review maintenance records. Talk with maintenance personnel and operators. Perhaps a c�upling, she.ave .or other component has just been replaced w1th one whiCh 1� out of balance or structural changes have been made, possibly resulting in a resonance condition. In many c�ses.' consid�rable analysis time and effort can be saved by reviCwm.g the .h1sto� of the machine to see if there are any factors whiCh mtght, m any way, be associated with �he vibration incre�se. A sudden, significant increase in vibration may be a warnmg of damage, such as a thrown blade, loose rotor bar or other problem which requires more attention than simple balancing.
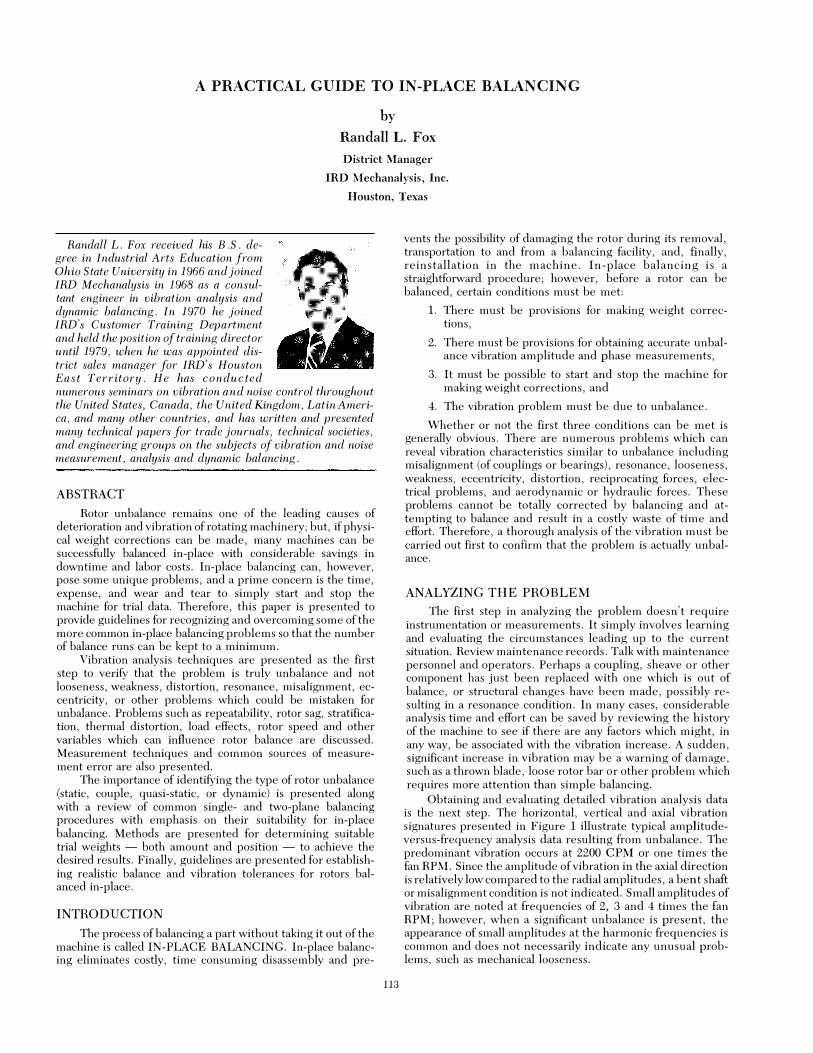
Obtaining and evaluating detailed vibration analysis data is the next step. The horizontal, vertical and axial vibration signatures presented in Figure 1 illustrate typical amplitudeversus-frequency analysis data resulting from unbalance. The predominant vibration occurs at 2200 CPM or one times the fan RPM. Since the amplitude of vibration in tlte axial direction is relatively low compared to the radial amplitudes, a bent shaft or misalignment condition is not indicated. Small amplitudes of vibration are noted at frequencies of 2, 3 and 4 times the fan RPM; however, when a significant unbalance is present, the appearance of small amplitudes at the harmonic frequencies is common and does not necessarily indicate any unusual problems, such as mechanical looseness.
ll4 PROCEEDINGS OF THE TENTH TURBOMACHINERY SYMPOSIUM
MACHINERY VIBRATION SI'GNATURE
'" ::o: .. • .. . l ..
Figure 1. Analysis Data Reveals Fan Unbalance.
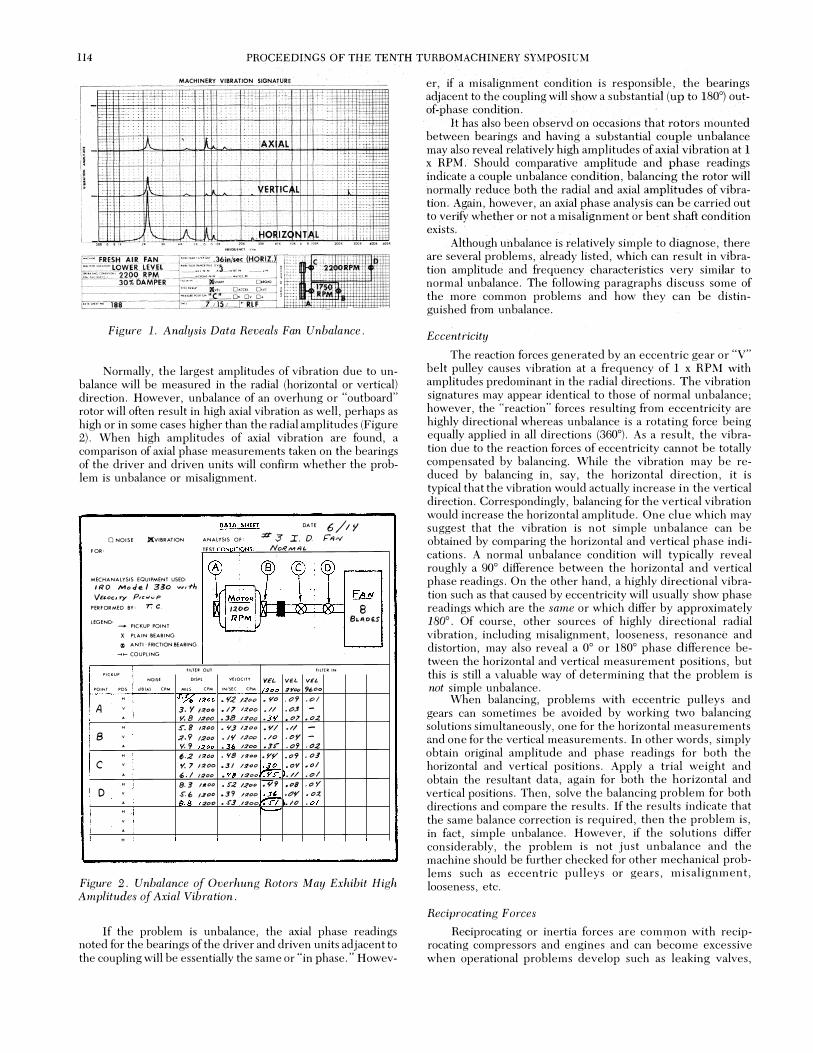
Normally, the largest amplitudes of vibration due to unbalance will be measured in the radial (horizontal or vertical) direction. However, unbalance of an overhung or "outboard" rotor will often result in high axial vibration as well, perhaps as high or in some cases higher than the radial amplitudes (Figure 2). When high amplitudes of axial vibration are found, a comparison of axial phase measurements taken on the bearings of the driver and driven units will confirm whether the problem is unbalance or misalignment.
� DATE 6/IY 0NOISE I(VIB R ATION ANAlYSIS OF' ::#'3 I. 0. P"'--t
FO R• TE5T CONDITIONS: Not? MAL. '
�, T � D -
MECHANAlYSIS EQUIPMENT USED: ·� M-� - . ! IRO MoJe I 330 wi-M VELt>f:.lyY Pn:�..,p w
PERFOR MED BY• r. c. l:lt>O 8 LEGENDJ
RPAot� :- . $UIDE$ - PICKUP POINT � ' X PLAIN BEARING i .. ANTI- FRICTION BEARING
'""".,_COUPLING ;
mruoor fllTU IN PICKUP
NOISE
POINT •os diiA) "
A ' A "
B ' A "
c ' A "
D ' A " ' A "
"" DISPl
MilS "" ��.l:iDO 3. y ��·· Y.B 13/Jo S'. 8 t:IIJO ;1.9 //100 'I· 9 1200 6 . ./l l:J/00 "· 7 ,1:100 ,,/ /QDD 8.3 /lfDD S:6 .t.roo 8.8 :IDD
VfLOCHY
IN/siC "" .¥.<' .l.:t•o . 17 l:ltJO .38 1�"0 • Y,J 1.21:1o • 1'/ 11/&l&l o 3/, 12DD o '18 /:fDD
.31 ·'�'"' • YB N�oo .1"2 .l��tl e3? ./:tOO .S'3 NIOO
VI!� 1�1>0 ·�'"' ./I • .3¥ .!II .10 .31-.���
� .Ys-.!19
� �
vu V£� ""'"" 'II. DO .0� ,0/ .0.3 -
0, .o.z .I/ -.oy -·"� .o.z .<>9 .0!/ .ov .ot .I/ .ol ·"' ,.,y .o.,- .o:t .10 • <>I
Figure 2. Unbalance of Overhung Rotors May Exhibit High Amplitudes of Axial Vibration .
If the problem is unbalance, the axial phase readings noted for the bearings of the driver and driven units adjacent to the coupling will be essentially the same or "in phase." Howev-
er, if a misalignment condition is responsible, the bearings adjacent to the coupling will show a substantial (up to 180°) out-of-phase condition.
·
It has also been observd on occasions that rotors mounted between bearings and having a substantial couple unbalance may also reveal relatively high amplitudes of axial vibration at l x RPM. Should comparative amplitude and phase readings indicate a couple unbalance <!ondition, balancing the rotor will normally reduce both the radial and axial amplitudes of vibration. Again, however, an axiai phase analysis can be carried out to verifY whether or not a misalignment or bent shaft condition exists,
·
Although unbalance is relatively simple to diagnose, there are several problems, already listed, which can result in vibration amplitude and frequency characteristics very similar to normal unbalance. The following paragraphs discuss some of the . more common problems and how they can be distinguished from unbalance.
Eccentricity
The reaction forces generated by an eccentric gear or "V" belt pulley causes vibration at a frequency of l x RPM with amplitudes predominant in the radial directions. The vibration signatures may appear identical to those of normal unbalance; however, the "reaction" forces resulting from eccentricity are highly directional whereas unbalance is a rotating force being equally applied in all directions (360°). As a result, the vibration due to the reaction forces of eccentricity cannot be totally compensated by balancing. While the vibration may be reduced by balancing in, say, the horizontal direction, it is typical that the vibration would actually increase in the vertical direction. Correspondingly, balancing for the vertical vibration would increase the horizontal amplitude. One clue which may suggest that the vibration is not simple unbalance can be obtained by comparing the horizontal and vertical phase indications. A normal unbalance condition will typically reveal roughly a 90° difference between the horizontal and vertical phase readings. On the other hand, a highly directional vibration such as that caused by eccentricity will usually show phase readings which are the same or which differ by approximately 180°. Of course, other sources of highly directional radial vibration, including misalignment, looseness, resonance and distortion, may also reveal a 0° or 180° phase difference between the horizontal and vertical measurement positions, but this is still a valuable way of determining that the problem is not simple unbalance.
When balancing, problems with eccentric pulleys and gears can sometimes be avoided by working two balancing solutions simultaneously, one for the horizontal measurements and one for the vertical measurements. In other words, simply obtain original amplitude and phase readings for both the horizontal and vertical positions. Apply a trial weight and obtain the resultant data, again for both the horizontal and vertical positions. Then, solve the balancing problem for both directions and compare the results. If the results indicate that the same balance correction is required, then the problem is, in fact, simple unbalance. However, if the solutions differ considerably, the problem is not just unbalance and the machine should be further checked for other mechanical problems such as eccentric pulleys or gears, misalignment, looseness, etc.
Reciprocating Forces
Reciprocating or inertia forces are common with reciprocating compressors and engines and can become excessive when operational problems develop such as leaking valves,
A PRACTICAL GUIDE TO IN-PLACE BALANCING 115
compression loss, or faulty injection/ignition. A common vibration frequency resulting from these problems is 1 x RPM and could easily be mistaken, for unbalance. However, as explained for eccentricity, reciprocating forces are generally very directional and, thus, comparative horizontal and vertical phase readings will likely be the same or differ by 180°. Here too, if in doubt, solve the balancing solutions simultaneously for both the horizontal and .vertical amplitude and phase data. If the problem is reciprocating forces; the two solutions will not agree.
Resonance
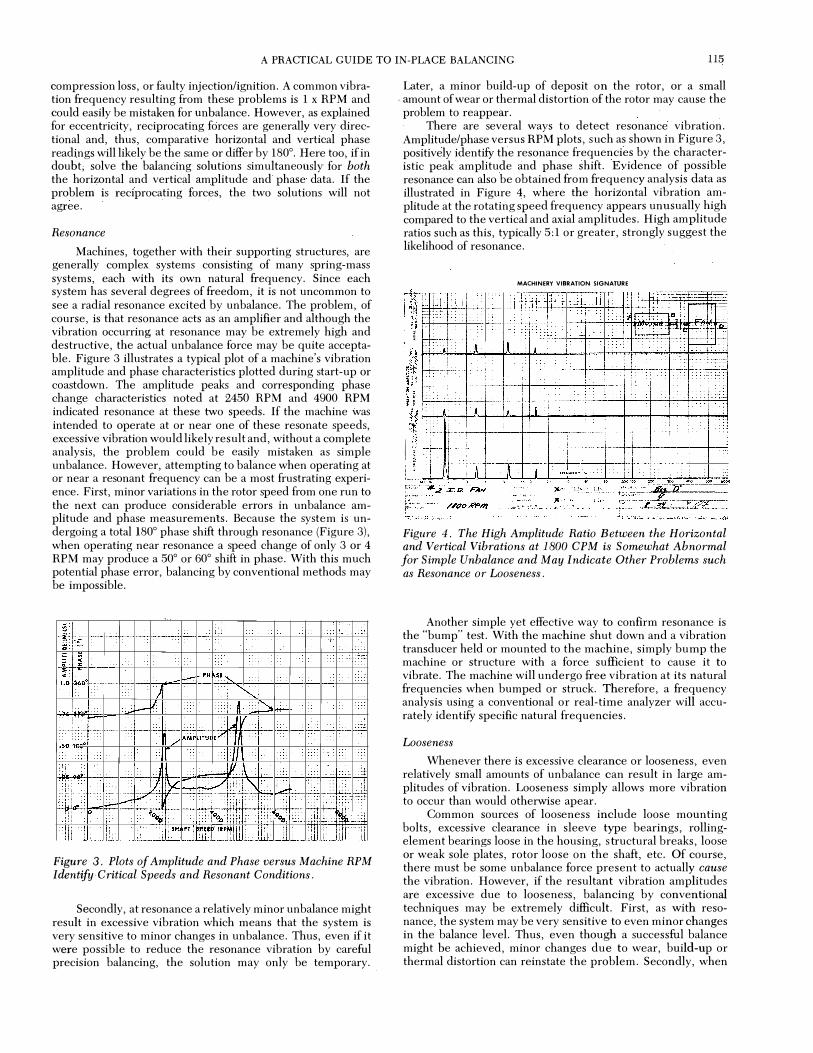
Machines, together with their supporting structures, are generally complex systems consisting of many spring-mass systems, each with its own natural frequency. Since each system has several degrees of freedom, it is not uncommon to see a radial resonance excited by unbalance. The problem, of course, is that resonance acts as an amplifier and although the vibration occurring at resonance may be extremely high and destructive, the actual unbalance force may be quite acceptable. Figure 3 illustrates a typical plot of a machine's vibration amplitude and phase characteristics plotted during start-up or coastdown. The amplitude peaks and corresponding phase change characteristics noted at 2450 RPM and 4900 RPM indicated resonance at these two speeds. If the machine was intended to operate at or near one of these resonate speeds, excessive vibration would likely result and, without a complete analysis, the problem could be easily mistaken as simple unbalance. However, attempting to balance when operating at or near a resonant frequency can be a most frustrating experience. First, minor variations in the rotor speed from one run to the next can produce considerable errors in unbalance amplitude and phase measurements. Because the system is undergoing a totall80° phase shift through resonance (Figure 3), when operating near resonance a speed change of only 3 or 4 RPM may produce a 50° or 60° shift in phase. With this much potential phase error, balancing by conventional methods may be impossible.
"--;:1 0 c:
J!: - - : i =' L ··� l::c,
I� -r�"" ....--�ti .:s., : r:-: :-:
/ - "'r-k �v I� 'I':-'
,I. ·�; / "" ,;?;; ,;/' I : ::
:: : 'U :c' : ,_: ! ;�;I ·-"" ' I -
; i[ i : :: ' : 'l/ v : i,ii, i! �; ir; ' � : : I :j ii �� f� -' i.' ; .;.;.;.; � � : : : -- ' : : : ; •• :1: :: �;c ; :; r:::-� 'i if: : �i'iil: -- ; : ' �: iiH ! '!�:- - i1l
llliili i!i i,f :i ; : : lim �m: rm� 1i1-l
Figure 3. Plots of Amplitude and Phase versus Machine RPM Identify-Critical Speeds and Resonant Conditions.
Secondly, at resonance a relatively minor unbalance might result in excessive vibration which means that the system is very sensitive to minor changes in unbalance. Thus, even if it were possible to reduce the resonance vibration by careful precision balancing, the solution may only be temporary. _
Later, a minor build-up of deposit on the rotor, or a small - amount of wear or thermal distortion of the rotor may cause the problem to reappear.
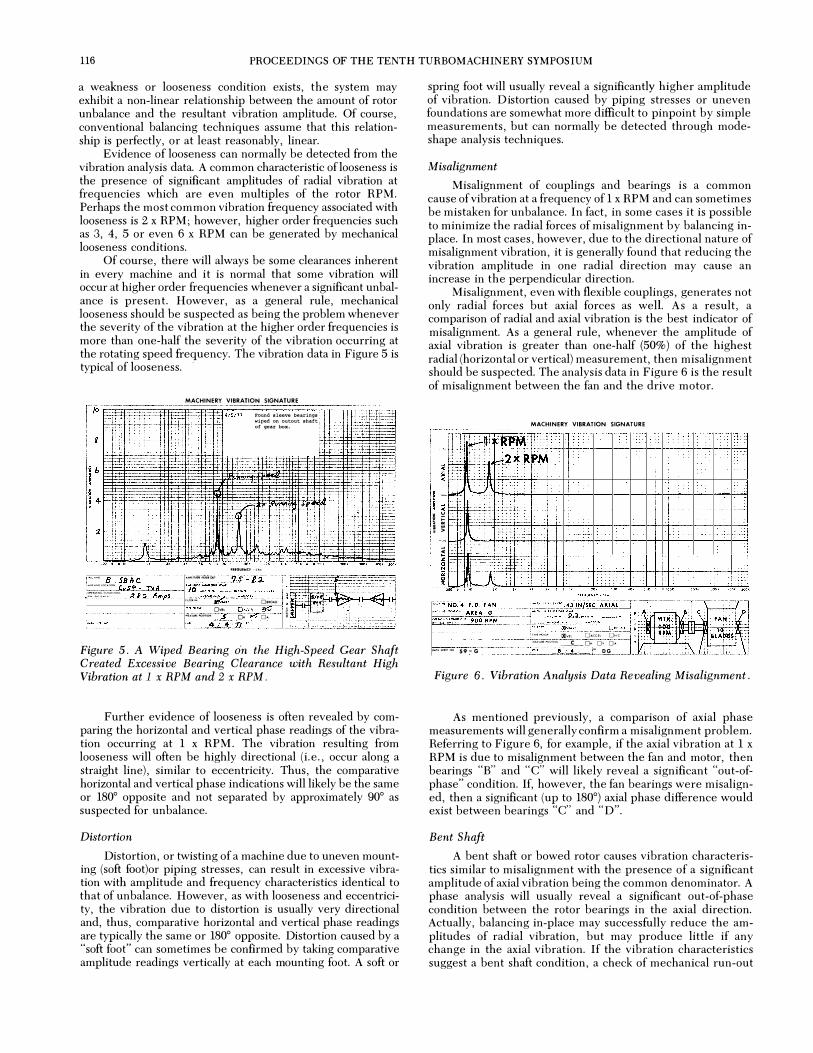
There are several ways to detect resonance vibration. Amplitude/phase versus RPM plots, such as shown in Figure 3, positively identify the resonance frequencies by the characteristic peak amplitude and phase shift. Evidence of possible resonance can also be obtained from frequency analysis data .as illustrated in Figure 4, where the horizontal vibration amplitude at the rotating speed frequency appears unusually high compared to the vertical and axial amplitudes. High amplitude ratios such as this, typically 5: 1 or greater, strongly suggest the likelihood of resonance.
ll - :�! : : : . ! '1"-'
MACHINERY VIBRATION SIGNATURE
'A l I t ·: c;;:,;,;,;-4i � - -
::_:_ :.:.'J� ��� �-��:�:=��=:=::=�==:=:=�:=::=:==:-: .. :·=-·�= :: t�� li ���������4-�����t+�����·��·,���:� �N : : A I -
Y�·�-&-��-1+-���-1+-�r-�� I y H--���+-�-++-�-+�r-�-++-�-+�r-��
� A lA I :':
�f�':�t"::-"��-q·:i-.���-t,_-::: ��'8}-!-, _-�j':�-i-�;=-.�-;\:��.:[=-.����-:-; .. _�;-��=*��-=�:;:: i�I���;:;;��j.��,�:;;:-; ;;--:J, �!:;,�;:C��o:t�=.�;.;,----�.�t:o�.�
Figure 4 . The High Amplitude Ratio Between the Horizontal and Vertical Vibrations at 1 800 CPM is Somewhat Abnormal for Simple Unbalance and May Indicate Other Problems such as Resonance or Looseness.
Another simple yet effective way to confirm resonance is the "bump" test. With the machine shut down and a vibration transducer held or mounted to the machine, simply bump the machine or structure with a force sufficient to cause it to vibrate. The machine will undergo free vibration at its natural frequencies when bumped or struck. Therefore, a frequency analysis using a conventional or real-time analyzer will accurately identify specific natural frequencies.
Looseness
Whenever there is excessive clearance or looseness, even relatively small amounts of unbalance can result in large amplitudes of vibration. Looseness simply allows more vibration to occur than would otherwise apear.
Common sources of looseness include loose mounting bolts, excessive clearance in sleeve type bearings, rollingelement bearings loose in the housing, s tructural breaks, loose or weak sole plates, rotor loose on the shaft, etc. Of course, there must be some unbalance force present to actually cause the vibration. However, if the resultant .vibration amplitudes are excessive due to looseness, balancing by conventional techniques may be extremely difficult. First, as with resonance, the system may be very sensitive to even minor changes in the balance level. Thus, even though a successful balance might be achieved, minor changes due to wear, build-up or thermal distortion can reinstate the problem. Secondly, when
116 PROCEEDINGS OF THE TENTH TURBO MACHINERY SYMPOSIUM
a weakness or looseness condition exists, the system may exhibit a non-linear relationship between the amount of rotor unbalance and the resultant vibration amplitude. Of course, conventional balancing techniques assume that this relationship is perfectly, or at least reasonably, linear.
Evidence of looseness can normally be detected from the vibration analysis data. A common characteristic of looseness is the presence of significant amplitudes of radial vibration at frequencies which are even multiples of the rotor RPM. Perhaps the most common vibration frequency associated with looseness is 2 x RPM; however, higher order frequencies such as 3, 4, 5 or even 6 x RPM can be generated by mechanical looseness conditions.
Of course, there will always be some clearances inherent in every machine and it is normal that some vibration will occur at higher order frequencies whenever a significant unbalance is present. However, as a general rule, mechanical looseness should be suspected as being the problem whenever the severity of the vibration at the higher order frequencies is more than one-half the severity of the vibration occurring at the rotating speed frequency. The vibration data in Figure 5 is typical of looseness. ·
1� ... R filAr ''""""�"- t.�� TV • . >::!'::.""::.�·-• !> It> A. ••
' I""W"�
MACHINERY VIBRATION SIGNATURE
--m•-
J'ound aleev. beu-inqa wipect an outout •haft of p,al:' box.
•a-•«·"•
? .. '-1.2-' --���---·· '!
...... ....... o-o ' ••- Ow• ]�<• 1B1'ii 1
••u• -·- , i 0• l!'l' Oo �·
Figure 5. A Wiped Bearing on the High-Speed Gear Shaft Created Excessive Bearing Clearance with Resultant High Vibration at 1 x RPM and 2 x RPM.
Further evidence of looseness is often revealed by comparing the horizontal and vertical phase readings of the vibration occurring at 1 x RPM. The vibration resulting from looseness will often be highly directional (i. e. , occur along a straight line), similar to eccentricity. Thus, the comparative horizontal and vertical phase indications will likely be the same or 180° opposite and not separated by approximately 90° as suspected for unbalance.
Distortion
Distortion, or twisting of a machine due to uneven mounting (soft foot)or piping stresses, can result in excessive vibration with amplitude and frequency characteristics identical to that of unbalance. However, as with looseness and eccentricity, the vibration due to distortion is usually very directional and, thus, comparative horizontal and vertical phase readings are typically the same or 180° opposite. Distortion caused by a "soft foot" can sometimes be confirmed by taking comparative amplitude readings vertically at each mounting foot. A soft or
spring foot will usually reveal a significantly higher amplitude of vibration. Distortion caused by piping stresses or uneven foundations are somewhat more difficult to pinpoint by simple measurements, but can normally be detected through modeshape analysis techniques.
Misalignment
Misalignment of couplings and bearings is a common cause of vibration at a frequency of 1 x RPM and can sometimes be mistaken for unbalance. In fact, in some cases it is possible to minimize the radial forces of misalignment by balancing inplace. In most cases, however, due to the directional nature of misalignment vibration, it is generally found that reducing the vibration amplitude in one radial direction may cause an increase in the perpendicular direction.
Misalignment, even with flexible couplings, generates not only radial forces but axial forces as well. As a result, a comparison of radial and axial vibration is the best indicator of misalignment. As a general rule, whenever the amplitude of axial vibration is greater than one-half (50%) of the highest radial (horizontal or vertical) measurement, then misalignment should be suspected. The analysis data in Figure 6 is the result of misalignment between the fan and the drive motor.
MACHINERY VIBRATION· SIGNATURE
mrm: ·••• :�:· J.2�:RPN.
I s : , • �:_• . �,_._ . .. . � ;: . •+=cr :c:: ·:_:_
� . . .. ; ; L�' ••.
o.-••$1<1".., 59- G
'"''"""' !Javu OACCII Owe ,.,.,.,...,.,."'� _J;_QH Ov OA.
L� "' DO
:::; ·····:n
:
Figure 6. Vibration Analysis Data Revealing Misalignment.
As mentioned previously, a comparison of axial phase measurements will generally confirm a misalignment problem. Referring to Figure 6, for example, if the axial vibration at 1 x RPM is due to misalignment between the fan and motor, then bearings "B" and "C" will likely reveal a significant "out-ofphase" condition. If, however, the fan bearings were misaligned, then a significant (up to 180°) axial phase difference would exist between bearings "C" and "D".
Bent Shaft
A bent shaft or bowed rotor causes vibration characteristics similar to misalignment with the presence of a significant amplitude of axial vibration being the common denominator. A phase analysis will usually reveal a significant out-of-phase condition between the rotor bearings in the axial direction. Actually, balancing in-place may successfully reduce the amplitudes of radial vibration, but may produce little if any change in the axial vibration. If the vibration characteristics suggest a bent shaft condition, a check of mechanical run-out
A PRACTICAL GUIDE TO IN -PLACE BALANCIN G 117
with a dial indicator should be carried out to verify the problem before attempting to balance.
Electrical Problems
Electrical problems that cause vibration in motors, generators and alternators are often mistaken for unbalance if only the amplitude-versus-frequency analysis data is taken. Common electrical problems that cause vibration include:
1. Broken rotor bars.
2. Unequal gap between rotor and stator.
3. Out-of-round stator.
4. Shorted stator laminations.
5. Unbalanced phases.
6. Eccentric or bowed rotor.
7. Shorted rotor bars or commutator bars.
For all the problems listed above, the cause of vibration is diametrically unequal magnetic forces between the rotor and stator. Of course, these forces vary with load and, thus, the vibration amplitude due to electrical problems is typically load dependent.
In the case of synchronous motors, the common frequency of electrical vibration will be exactly the same as the rotor speed and thus the amplitude, frequency and phase characteristics appear identical to unbalance. Checking for changes in the vibration amplitude under various load conditions is a good test for electrical problems. Another way to check for electrical problems is to observe the change in vibration amplitude the instant power is shut off. If the vibration disappears instantly, the vibration is likely due to electrical problems.
Electrical problems with induction type motors will often cause vibration where the amplitude pulsates in a cyclic manner. This pulsating amplitude is due to the fact that the speed of the rotor and the rotating speed of the magnetic field are not exactly the same. For example , with a four-pole induction motor powered by 60 Hz (3600 CPM) power, the armature, under normal load conditions, may rotate at 1750 RPM whereas the magnetic field of the stator rotates at exactly one-half the electrical frequency or 1800 RPM in this case. In the case of rotor problems such as broken or shorted bars, this difference between the rotating speeds of the magnetic field and rotor will result in a modulation of the amplitude of vibration, shown in Figure 7. The rate of amplitude pulsation is normally two times
Figure 7 . Armature Problems like Broken Rotor Bars Will Cause the Amplitude of the Electrical Vibration Frequency to be Modulated.
the slip frequency. In the case of stator-related electrical problems such as unequal air gap, the amplitude pulsation is due to the presence of two vibrations in "beat, " one at the rotor speed frequency and one at the electrical frequency (Figure 8).
Figure 8 . Stator Problems like Unequal Air Gap May Combine with Mechanical Problems to Produce an Amplitude Beat.
The stroboscopic light provided with most portable vibration analysis/balancing instruments is invaluable for diagnosing electrical problems with induction motors. Vibrations due predominately to mechanical problems will make the motor shaft appear to stand still when observed with the stroboscopic light. On the other hand, vibration due to electrical problems will cause the shaft to appear to rotate slowly when observed with the light.
MEASUREMENT EQUIPMENT AND TECHNIQUES
Vcqrifying that the problem is truly unbalance by analysis is, perhaps, the most important step in approaching an apparent balance problem. The next step is to obtain accurate measurements of the vibration amplitude and phase characteristics which will be used to represent that unbalance. These measurements must be taken carefully and accurately to minimize the number of starts and stops needed to achieve a successful balance. To illustrate , Table 1 shows the best possible ratio of unbalance reduction for various degrees of error in measuring the phase of unbalance. It is assumed, of course, that the amount of balance correction weight is correct.
TABLE 1. UNBALANCE REDUCTION REQUIRED FOR PHASE ERROR.
PHASE ERROR REDUCTION (DEGREES) RADIO
7V2° 8:1 15° 4:1 30° 2:1 60° None
Phase Measurement
Most portable vibration analyzers are furnished with a high-intensity stroboscopic light which, when triggered by the
118 PROCEEDINGS OF THE TENTH TURBOMACHINERY SYMPOSIUM
measured vibration, provides a quick and convenient means of obtaining phase readings for balancing. A reference mark is placed on the rotor at the end of the shaft or other location which can be readily observed. An existing key or keyway can also be used. For accuracy, an angular reference scaled in degrees should be superimposed around the shaft as shown in Figure 9. Where it is not possible to view the end of the rotor shaft, a rotating angular reference can be applied as illustrated in Figure 10.
Figure 9. A Stationary Angular Reference S ystem for Obtaining Accurate Phase Data for Balancing.
Figure 1 0 . Where It is Not Possible to See the End of the Shaft, an Angular Reference S ystem Can be Applied to the Rotating Shaft .
Where it is impractical or unsafe to obtain phase readings with a strobe light, special instruments are available with a remote phase readout on a meter. Such instruments generally require a 1 x RPM reference signal from a photocell, electromagnetic pickup or noncontact pickup for reference. An oscilloscope can also be used to obtain phase readings for balancing. Figure 11 shows the scope display of the filtered
Figure 1 1 . Applying a 1 x RPM Voltage Reference Pulse to the "Z" (Intensity) Axis of the Oscilloscope Produces a Blank S pot on the Waveform for Phase Reference.
unbalance vibration waveform. In addition, a 1 x RPM voltage pulse from a reference pickup has been applied to the "z" (intensity) input of the scope producing a blank spot on the waveform. Phase angle values are obtained by simply noting that portion of the vibration cycle which separates the reference pulse from a common point of reference on the waveform, such as the neutral-to-positive crossover point. In addition, the convention of phase determination must also be established. Specifically, it must be decided whether the phase angle recorded is the angle by which the reference pulse leads or lags the neutral-to-positive crossover point. Either convention is acceptable; however, the same convention must be applied to all balancing measurements.
Effect of Phase Convention on Balancing Rules
Any of the phase measurement techniques described above can be used to balance successfully. However, it is very important to understand that the convention used to obtain phase data affects the rules for calculating the angular location of unbalance. This must be remembered or several balance runs could be wasted.
The basic balancing approach involves measuring the original unbalance amplitude and phase, stopping the unit to apply a trial weight and operating the unit again to obtain the new amplitude and phase data. Through simple calculations or vector diagrams, the change in unbalance caused by the trial weight can be used to calculate the amount of correct weight as well as the angle by which the weight must be moved to be in the correct location. Calculating the amount of weight is no problem, but determining whether the weight must be moved clockwise or counter-clockwise is not so easy to sec. For example, using the phase measurement method in Figure 9, the weight should be shifted in a direction opposite the phase shift from the original to the trial run. However, just the opposite is true if the phase convention in Figure 10 is used. But if the angle numbers increased in the opposite direction of how they appear in Figure 10, then the same rules used for
A PRACTICAL GUIDE TO IN-PLACE BALANCING 119
Figure 9 would apply. In short, how phase measurements are obtained definitely affects tbe rules of balancing and it is important to KNOW which rules apply before attempting to balance. If the rules are unclear, practice the technique on a small test rotor before balancing the real thing.
When using a strobe light to obtain phase readings, the direction of shaft rotation is not important as long as it is the same for all balance runs. However, when remote phase readings are obtained using an oscilloscope or special remote-phase instrument, the direction of shaft rotation is important and affects the rules of balancing. In addition, whether the phase angles applied to your calculations are the angles by which the reference pulse leads or lags the vibration signal must also be taken into consideration.
Additional Measurement Errors
Sometimes the methods and equipment used to measure unbalance vibration can introduce errors that make balancing in-place most difficult. Velocity or accelerometer transducers applied with magnetic bases can rock when applied to uneven surfaces causing amplitude errors. The use of special pickup mounting brackets or adapters may create a resonance condi· tion at the running speed frequency. When using noncontact or proximity probes to measure shaft vibration, the presence of rim-out, either mechanical and/or electrical, can be very misleading. Of course, if the machine is operating, there is no easy way to measure run-out unless a Bode plot (amplitude arid phase-versus-RPM) or a Nyquist plot (polar amplitude-versusphase) was obtained during machine start-up or coastdown. If the machine is at rest, run-out can be measured by observing the pickup gap voltage variations as the shaft is slowly rotated. Of course, excessive run-out must be eliminated - physically, mathematically or electroniCally - to permit measurement of the actual shaft vibration.
If the balancing instrument being used is one having a manually tunable filter, it is most important that the filter be properly and carefully tuned for each measurement. In many cases the operator tunes the filter to the rotating speed initially and assumes that all subsequent readings will be accurate. However, it is quite possible that the machine being balanced may not operate at exactly the same RPM on subsequent trial runs. As a result, unless the instrument filter is checked and retuned accordingly, significant measurement errors - particularly phase errors- will result. To avoid errors, check to be sure the filter is accurately tuned for each set of data.
REVIEW
Thus far this paper has addressed the importance of analyzing the Vibration problem to be sure it is unbalance, and some of the major concerns regarding obtaining accurate unbalance amplitude and phase data have been outlined. The next portion of this paper will outline the various types of rotor unbalance, the importance of recognizing tbe specific type of unbalance, and the various solutions or approaches one can take to solve single- and two-place balancing problems.
TYPES OF ROTOR UNBALANCE
Fortunately, there are only four types or conditions of rotor unbalance - STATIC, COUPLE, QUASI-STATIC and DYNAMIC [1]. This is significant because, if the type of unbalance can be recognized, the balancing solution can sometimes be greatly simplified. In the following paragraphs each type of rotor unbalance is defined by the relationship between the central principal axis and the shaft axis of the rotor. The central principal axis is simply the axis about which the weight
of a rotor (or its moments) is equally distributed and the axis about which the part would rotate if free to do so.
Static Unbalance
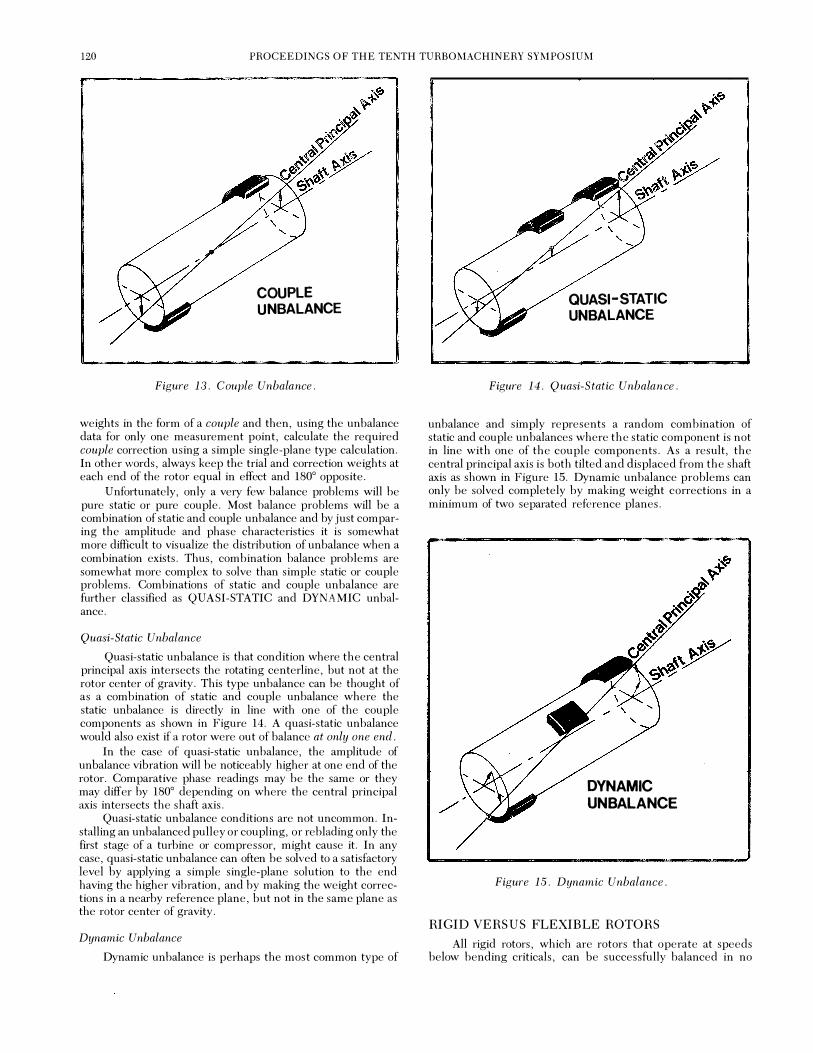
Static unbalance is the simplest form of unbalance, and is that condition where the central principal axis is displaced parallel to the shaft axis (Figure 12). The significance of static unbalance is that it is the only type of unbalance which, from a practical standpoint, can. be totally solved by making weight corrections in a single reference plane. Static unbalance can usually be identified by comparing the amplitude and phase readings obtained at the support bearings. For rotors supported between bearings, static unbalance will result in nearly identical amplitude and phase readings. This may not be true, however, for rotors which are mounted in an overhung or "outboard" configuration.
STATIC UNBALANCE
Figure 12. S tatic Unbalance.
If the problem is identified as a pure static unbalance, the entire balance problem can be solved with a single solution. The problem can be solved with a single correction weight placed in the same plane as the rotor center of gravity, or if it is not possible to make a weight correction in the center portion of the rotor, then equal corrections can be made in-line at opposite ends of the rotor.
Couple Unbalance
Couple unbalance is that condition where the central principal axis intersects the shaft axis at the rotor center of gravity (Figure 13). A couple is simply two parallel, equal forces acting in opposite directions but not on the same straight line. Couple unbalance, then, is a condition created by a heavy spot at each end of a rotor, but on opposite sides of the centerline, as illustrated in Figure 13. Unlike static unbalance, couple unbalance becomes apparent only when the part is rotated, but can often be identified by comparing the amplitude and phase readings at the rotor support bearings. Rotors supported between bearings will typically reveal equal amplitudes of vibration, but phase readings will differ by 180°. Again, this method of detecting couple unbalance does not apply to overhung rotors.
Like static unbalance, couple unbalance is a very easy balance problem to solve. The unbalance vibration at botb bearings can be reduced together by applying trial or test
120 PROCEEDINGS OF THE TENTH TURBOMACHINERY SYMPOSIUM
COUPLE UNBALANCE
Figure 13. Couple Unbalance.
weights in the form of a couple and then, using the unbalance data for only one measurement point, calculate the required couple correction using a simple single-plane type calculation. In other words, always keep the trial and correction weights at each end of the rotor equal in effect and 180° opposite.
Unfortunately, only a very few balance problems will be pure static or pure couple. Most balance problems will be a combination of static and couple unbalance and by just comparing the amplitude and phase characteristics it is somewhat more difficult to visualize the distribution of unbalance when a combination exists. Thus, combination balance problems are somewhat more complex to solve than simple static or couple problems. Combinations of static and couple unbalance are further classified as QUASI-STATIC and DYNAMIC unbalance.
Quasi-Static Unbalance
Quasi-static unbalance is that condition where the central principal axis intersects the rotating centerline, but not at the rotor center of gravity. This type unbalance can be thought of as a combination of static and couple unbalance where the static unbalance is directly in line with one of the couple components as shown in Figure 14. A quasi-static unbalance would also exist if a rotor were out of balance at only one end .
In the case of quasi-static unbalance, the amplitude of unbalance vibration will be noticeably higher at one end of the rotor. Comparative phase readings may be the same or they may differ by 180° depending on where the central principal axis intersects the shaft axis.
Quasi-static unbalance conditions are not uncommon. Installing an unbalanced pulley or coupling, or reblading only the first stage of a turbine or compressor, might cause it. In any case, quasi-static unbalance can often be solved to a satisfactory level by applying a simple single-plane solution to the end having the higher vibration, and by making the weight corrections in a nearby reference plane, but not in the same plane as the rotor center of gravity.
Dynamic Unbalance
Dynamic unbalance is perhaps the most common type of
QUASI-STATIC UNBALANCE
Figure 14. Quasi-Static Unbalance.
unbalance and simply represents a random combination of static and couple unbalances where the static component is not in line with one of the couple components. As a result, the central principal axis is both tilted and displaced from the shaft axis as shown in Figure 15. Dynamic unbalance problems can only be solved completely by making weight corrections in a minimum of two separated reference planes.
DYNAMIC UNBALANCE
Figure 15. Dynamic Unbalance .
RIGID VERSUS FLEXIBLE ROTORS
All rigid rotors, which are rotors that operate at speeds below bending criticals, can be successfully balanced in no
A PRACTICAL GUIDE TO IN-PLACE BALANCING 121
more than two planes. Flexible rotors, however, which operate at speeds above a rotor bending critical, may require that weight corrections be made in three, and sometimes more, correction planes in order to minimize both rotor deflection through and above the rotor critical speed(s), as well as the unbalance forces at the support bearings. This paper only deals with single- and two-plane balancing solutions since these are normally the only practical approaches which can be carried out in-place.
SINGLE-PLANE BALANCING
As mentioned previously, static, couple and some quasistatic unbalance problems can be solved with simple singleplane solutions even though, in the case of couple and some static unbalance problems, trial and correction weights may be added simultaneously in two reference planes. The following paragraphs, then, outline single-plane balancing techniques typically used for in-place balancing. However, since these balancing techniques require the addition of a test or trial weight, guidelines are first presented for selecting a suitable trial weight.
Determining a Safe Trial Weight
At the beginning of a balance problem, the amount and angular location of the unbalance (ounce-inches, gram-inches, etc.) are generally unknown. The objective of adding a trial weight is to produce a change in the original unbalance which can be used to determine the required balance correction. The obvious question, of course, is "How much trial weight should be added?" If the trial weight is too small, there may not be enough change to allow an accurate calculation. On the other hand, if the trial weight is too large the machine could be damaged.
A common approach for selecting a trial weight is to use a weight which will produce an unbalance force at the support bearing equal to 10% of the rotor weight supported by the bearing. For example, a rotor rotates at 3600 RPM and weighs 2000 pounds, each bearing supporting 1000 pounds of the rotor weight. For this rotor, a suitable trial weight for each correction plane should produce a force of 10% of 1000 lb or 100 lb.
Using the force formula the trial weight can be calculated as follows:
Force (lb) = 1. 77 X (RPM) 2 X ounce-inches
1000
100 lb = 1. 77 X ( 3600 ) 2 X ounce-inches
1000
ounce-inches = 4.36
For the example given, a suitable trial weight for each correction plane of the rotor would be 4.36 ounce-inches. If the trial was to be added at a radius of 6 inches, the amount of weight needed would be 4.36 ounce-inches/6 inches or 0. 73 ounces.
Determining Trial Weight Location
If a safe trial weight is calculated as outlined, selecting the best angular position for the trial weight is generally not that critical. However, if the machine already has a dangerous level of unbalance, it may be important to try to predict where the "heavy spot" is, to avoid adding the trial weight where it could damage the machine. Estimating the approximate location of the heavy spot is possible if the characteristics of the machine and measurement instrumentation are known.
Much in-place balancing is done with portable instruments which use velocity or accelerometer transducers attached to the bearing caps to sense the unbalance vibration and which use a strobe light for obtaining needed phase information. It is often said that the unbalance heavy spot causes the strobe light to flash; however, it is unlikely that the heavy spot will be directly in line with the vibration transducer when the strobe light flashes. Normally, there are two sources which delay the strobe flash to produce a "lag angle" which is defined as "that angle, measured in the direction of shaft rotation, between the vibration transducer and heavy spot when the strobe light flashes." The two sources of "lag angle" are:
1. Electrical or instrument lag, and
2. Mechanical or machine lag.
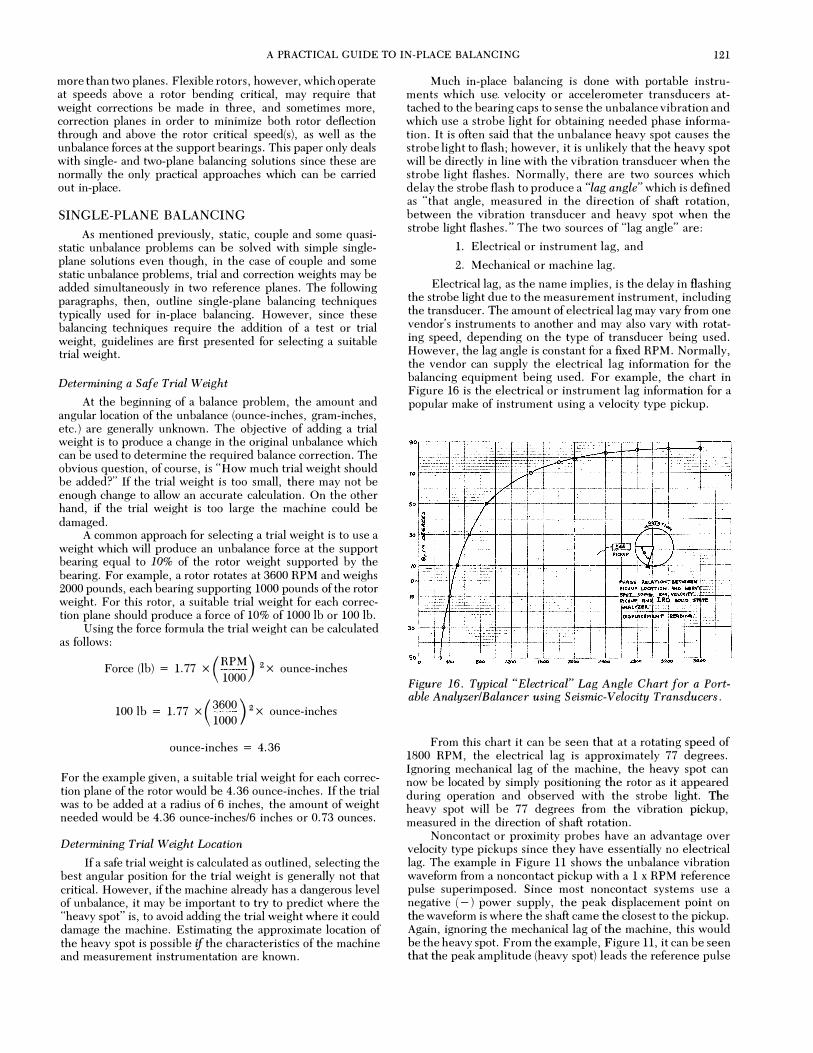
Electrical lag, as the name implies, is the delay in flashing the strobe light due to the measurement instrument, including the transducer. The amount of electrical lag may vary from one vendor's instruments to another and may also vary with rotating speed, depending on the type of transducer being used. However, the lag angle is constant for a fixed RPM. Normally, the vendor can supply the electrical lag information for the balancing equipment being used. For example, the chart in Figure 16 is the electrical or instrument lag information for a popular make of instrument using a velocity type pickup.
Figure 16. Typical "Electrical" Lag Angle Chart for a Portable Analyzer/Balance r using Seismic-Velocity Transducers.
From this chart it can be seen that at a rotating speed of 1800 RPM, the electrical lag is approximately 77 degrees. Ignoring mechanical lag of the machine, the heavy spot can now be located by simply positioning the rotor as it appeared during operation and observed with the strobe light. The heavy spot will be 77 degrees from the vibration pickup, measured in the direction of shaft rotation.
Noncontact or proximity .probes have an advantage over
velocity type pickups since they have essentially no electrical lag. The example in Figure 11 shows the unbalance vibration waveform from a noncontact pickup with a 1 x RPM reference pulse superimposed. Since most noncontact systems use a negative (-) power supply, the peak displacement point on the waveform is where the shaft came the closest to the pickup. Again, ignoring the mechanical lag of the machine, this would be the heavy spot. From the example, Figure 11, it can be seen that the peak amplitude (heavy spot) leads ·the reference pulse
122 PROCEEDINGS OF THE TENTH TURBOMACHINERY SYMPOSIUM
by approximately 140° . If the vibration and reference pickups were installed at the same angular position, the heavy spot would be located 140° ahead of the reference trigger on the shaft, measured in the direction of shaft rotation . If the vibration and reference probes are not in the same angular positions, it would be necessary to first subtract the angle by which the vibration probe leads the reference probe as measured in the direction of shaft rotation.
Most instruments that provide remote phase readout on a meter will typically read out the angle between the reference pulse and the neutral-to-positive crossover of the vibration signal. However, some instruments may measure this as a leading angle whereas others measure the lagging angle . In addition , some remote-phase instruments may include a 90° compensation to read directly the "high" spot or heavy spot. For these reasons, there are no firm rules for determining the instrument lag angle for remote phase devices. If in doubt, the instrument manufacturer can supply information on the phase convention being used as well as instrument lag characteristics.
Determining Mechanical Lag
Unfortunately, the vibration of the machine bearing or shaft due to unbalance may or may not be in-phase with the heavy spot of unbalance . The combined restoring forces of mass (inertia), stiffness and damping generally produce some delay or lag in the response of the machine to an unbalance force . This "mechanical lag" for a specific machine is difficult to predict unless the actual vibration amplitude and phase characteristics have been recorded o�er the operating speed range .
The most significant sources of mechanical lag are introduced by structural and rotor criticals at speeds below the balancing speed. Figure 3 represents a typical plot of unbalance vibration amplitude and phase characteristics recorded during the start-up or coastdown of a machine . In this example , criticals are noted at speeds of 2450 RPM and 4900 RPM. In addition to the characteristic amplitude peak, it can also be noted that a phase shift of approximately 180° is also associated with each critical. If the machine was being balanced at a speed of, say, 1800 RPM, which is below . the first critical, there would likely be little significant mechanical lag, and the trial balance weight could be located based solely on the electrical lag of the measurement equipment. However, if the rotor was being balanced at 3500 RPM, which is between the two criticals, it would be necessary to add 180° of mechanical lag to the electrical lag in order to locate the heavy spot. If the rotor was being balanced above both criticals, the mechanical lag would be approximately 180° + 180° = 360° = 0°, and the balance weight could, again, be located using only the electrical lag data.
If it is not possible or practical to obtain an actual plot of the amplitude and phase change characteristics during start-up or coastdown, the mechanical lag can usually be estimated by observing the overall (unfiltered) vibration amplitude during coastdown. Specifically, count the number of times the amplitude peaks, indicating a critical speed. If an even number of criticals was detected (i . e . , 2, 4, etc . ), use only the electrical lag of the measurement equipment. However, if an odd number of criticals is noted, then add 180° of mechanical lag to the electrical lag to estimate the heavy spot location. Of course, this is only an estimate and may be incorrect by as much as 180° if a critical speed was missed or if an amplitude peak was not the result of a critial excited by the 1 x RPM unbalance .
Single-Plane Vector Balancing
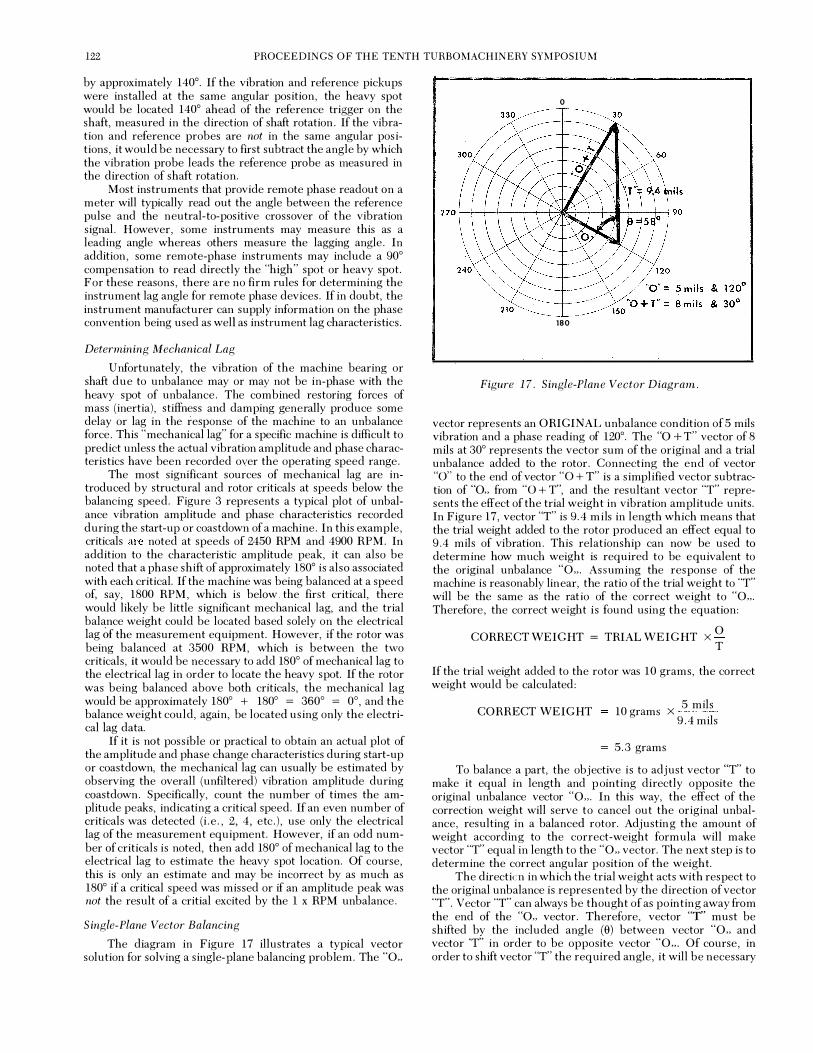
The diagram in Figure 17 illustrates a typical vector solution for solving a single-plane balancing problem. The "0"
0
180
Figure 1 7 . Single-Plane Vector Diagram .
vector represents an ORIGINAL unbalance condition of 5 mils vibration and a phase reading of 120°. The "0 + T" vector of 8 mils at 30° represents the vector sum of the original and a trial unbalance added to the rotor . Connecting the end of vector "0" to the end of vector "0 + T" is a simplified vector subtraction of "0" from "0 + T", and the resultant vector "T" represents the effect of the trial weight in vibration amplitude units. In Figure 17, vector "T" is 9 . 4 mils in length which means that the trial weight added to the rotor produced an effect equal to 9 . 4 mils of vibration . This relationship can now be used to determine how much weight is required to be equivalent to the original unbalance "0". Assuming the response of the machine is reasonably linear, the ratio of the trial weight to "T" will be the same as the ratio of the correct weight to "0". Therefore , the correct weight is found using the equation:
CORRECT WEIGHT = TRIAL WEIGHT x O T
If the trial weight added to the rotor was 10 grams, the correct weight would be calculated:
CORRECT WEIGHT 10 X 5 mils grams 9 . 4 mils
= 5. 3 grams
To balance a part, the objective is to adjust vector "T' to make it equal in length and p ointing directly opposite the original unbalance vector "0". In this way, the effect of the correction weight will serve to cancel out the original unbalance, resulting in a balanced rotor. Adjusting the amount of weight according to the correct-weight formula will make vector ' 'T" equal in length to the "0" vector. The next step is to determine the correct angular position of the weight.
The directicn in which the trial weight acts with respect to the original unbalance is represented by the direction of vector "T" . Vector "T" can always be thought of as pointing away from the end of the "0" vector . Therefore, vector '"f" must be shifted by the included angle (6) between vector "0" and vector 'T' in order to be opposite vector "0". Of course, in order to shift vector "T" the required angle, it will be necessary
A PRACTICAL GUIDE TO IN-PLACE BALANCING 123
to move the trial weight by the same angle. From the vector diagram, Figure 17, the measured angle (6) between "0" and "T" is 58° . Therefore, it will be necessary to move the weight 58° .
Which . direction to move the trial weight depends on the phase measurement convention being used. If phase readings are obtained using the stationary angular reference as shown in Figure 9, the weight must be shifted in the direction OPPOSITE the direction of phase shift frorri vector "0" to vector "O + T" . In Figure 17, this phase shift is counterclockwise. Therefore, the weight would be moved 58° clockwise. If phase readings are obtained using a rotating angular reference (Figure 10), remote phase meter or oscilloscope, the same rule may not apply.
Very small errors in measuring the phase angle, shifting the weight and adjusting the amount of weight may result in some remaining vibration still due to unbalance. If further correction is necessary, simply observe the new or resultant amplitude and phase data and work a new solution using this as the "0 + T" vector along with the original "0" vector. Also, be sure to use the amount of balance weight on the rotor as the trial weight data.
Earlier, guidelines were presented for calculating a safe trial weight and for estimating the combined "lag" angle of system for locating the trial weight. Of course, once the rotor has been balanced, the true lag angle can be determined fairly accurately to simplify future balancing of this or identical machines. In addition, knowing the original unbalance vibration and the amount of weight required to balance the part, a "weight-per-mil" constant can be calculated to aid in estimating balance weight requirements.
Single-Plane B alancing Without Phase
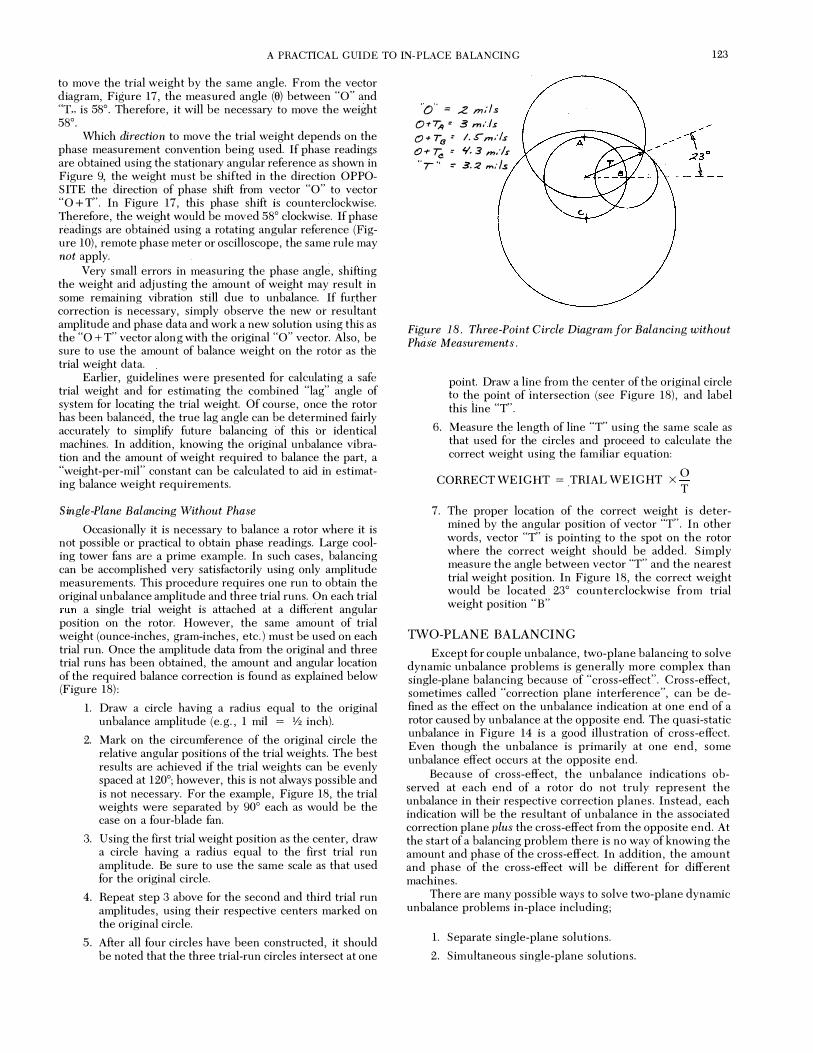
Occasionally it is necessary to balance a rotor where it is not possible or practical to obtain phase readings. Large cooling tower fans are a prime example. In such cases, balancing can be accomplished very satisfactorily using only amplitude measurements. This procedure requires one run to obtain the original unbalance amplitude and three trial runs. On each trial run a single trial weight is attached at a different angular position on the rotor. However, the same amount of trial weight (ounce-inches, gram-inches, etc. ) must be used on each trial run. Once the amplitude data from the original and three trial runs has been obtained, the amount and angular location of the required balance correction is found as explained below (Figure 18):
1. Draw a circle having a radius equal to the original unbalance amplitude (e. g. , 1 mil = ¥2 inch).
2. Mark on the circumference of the original circle the relative angular positions of the trial weights. The best results are achieved if the trial weights can be evenly spaced at 120°; however, this is not always possible and is not necessary. For the example, Figure 18, the trial weights were separated by 90° each as would be the case on a four-blade fan.
3. Using the first trial weight position as the center, draw a circle having a radius equal to the first trial run amplitude. Be sure to use the same scale as that used for the original circle.
4. Repeat step 3 above for the second and third trial run amplitudes, using their respective centers marked on the original circle.
5. After all four circles have been constructed, it should be noted that the three trial-run circles intersect at one
· ·o · · =: .z m:ls O + T,q = 3 m/ ls 0 + T6 = /. S"" m/ls () + T, = '1 . . 3 m:lr '" r ·· =- .3. :Z ,..: Is
Figure 1 8 . Three-Poin t C ircle Diagram for Bala ncing without Phase Measurements .
point. Draw a line from the center of the original circle to the point of intersection (see Figure 18), and label this line "T" .
6. Measure the length of line "T" using the same scale as that used for the circles and proceed to calculate the correct weight using the familiar equation:
CORRECT WEIGHT = TRIAL WEIGHT x O . T
7. The proper location of the correct weight is determined by the angular position of vector "T" . In other words, vector "T" is pointing to the spot on the rotor where the correct weight should be added. S imply measure the angle between vector ''T" and the nearest trial weight position. In Figure 18, the correct weight would be located 23° counterclockwise from trial weight position "B"
TWO-PLANE BALANCING
Except for couple unbalance, two-plane balancing to solve dynamic unbalance problems is generally more complex than single-plane balancing because of "cross-effect" . Cross-effect, sometimes called "correction plane interference", can be defined as the effect on the unbalance indication at one end of a rotor caused by unbalance at the opposite end. The quasi-static unbalance in Figure 14 is a good illustration of cross-effect. Even though the unbalance is primarily at one end, some unbalance effect occurs at the opposite end.
Because of cross-effect, the unbalance indications observed at each end of a rotor do not truly represent the unbalance in their respective correction planes. Instead, each indication will be the resultant of unbalance in the associated correction plane p lus the cross-effect from the opposite end. At the start of a balancing problem there is no way of knowing the amount and phase of the cross-effect. In addition, the amount and phase of the cross-effect will be different for different machines.
There are many possible ways to solve two-plane dynamic unbalance problems in-place including;
1. Separate single-plane solutions.
2. Simultaneous single-plane solutions.
124 PROCEEDINGS OF THE TENTH TURBOMACHINERY SYMPOSIUM
3. Two-plane vector calculation.
4. Static-couple derivation.
The problem can usually be solved using any one of these methods; however, depending on the degree of the crosseffect, some methods may require considerably more runs to achieve a satisfactory balance.
Separate S ingle-Plane Solutions
With the separate single-plane approach, each end of the rotor is treated as an individual single-plane problem. The usual procedure is to select the end of the machine which has the higher unbalance amplitude and balance it first using a standard single-plane solution.
After the first plane has been balanced successfully, the other end of the machine is balanced, again as a single-plane balancing problem. However, after the second end has been balanced, the cross-effect may have caused the first end to increase to an unacceptable level. Therefore, it may be necessary to rebalance the first end which, in turn, may adversely affect the second end. If the cross-effect is especially severe, this procedure may have to be repeated several times, alternately balancing first one end and then the other end, until both ends are balanced to an acceptable level.
Simultaneous Single-Plane S olutions
This approach is an extension of the separate single-plane approach in that each end of the rotor is treated as a separate single-plane problem, but the two problems are worked simultaneously. The original amplitude and phase readings are obtained for both ends of the machine. The rotor is then shut down so that trial weights can be applied to both ends. With trial weights added to both ends, the rotor is operated to obtain the "0 + T" data, again, for both ends. A single-plane solution is then calculated independently for each end and the indicated corrections made. Normally, if cross-effect influences are small, this approach will result in a decrease in the unbalance at both ends for each solution. However, it must be remembered that the cross-effect is not being taken into consideration and, thus, the solutions being worked for each end of the rotor will be in error by the cross-effect of the trial and balance correction weights. Therefore, if cross-effect values are significant, this approach may require several runs of the machine to achieve a satisfactory balance.
Two-Plane Vector Calculations
On machines which exhibit high levels of cross-effect, or machines which require a considerable amount of time to start and stop , the balancing problem can be greatly simplified and the amount of time required to balance significantly reduced by using the vector calculation for two-plane balancing. In brief, the two-plane vector solution makes it possible to balance in two planes with only three runs of the rotor. First, the original unbalance readings are recorded for the two bearings of the machine. Next, a trial weight is added to the first correction plane and the resultant readings at both bearings are again noted and recorded. Finally, the trial weight is removed from the first correction plane and a trial weight is added to the second correction plane. With the trial weight in the second plane, the resultant readings at both bearings are again noted and recorded.
Using the data recorded from the original and two trial runs, together with the known amount and location of the trial weights, a series of vector diagrams and calculations make it possible to eliminate the cross-effect of the machine and find
both the amount and location of the balance weight needed in each of the two correction planes.
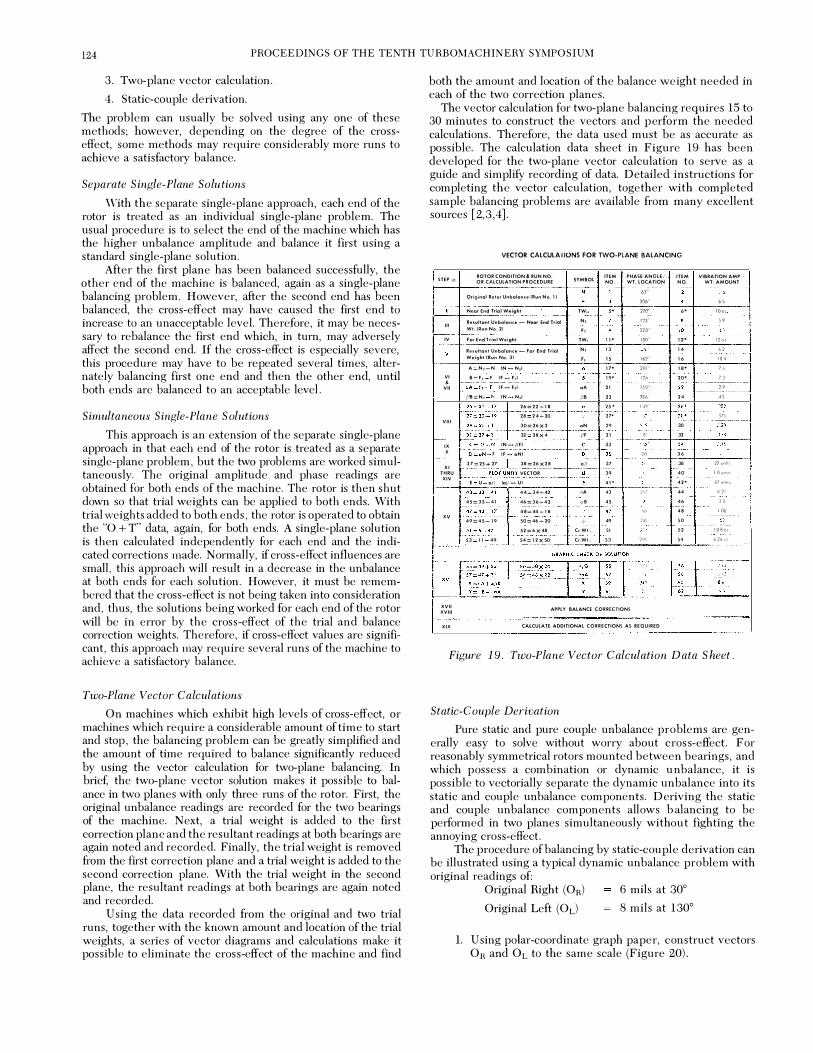
The vector calculation for two-plane balancing requires 15 to 30 minutes to construct the vectors and perform the needed calculations. Therefore, the data used must be as accurate as possible. The calculation data sheet in Figure 19 has been developed for the two-plane vector calculation to serve as a guide and simplifY recording of data. Detailed instructions for completing the vector calculation, together with completed sample balancing problems are available from many excellent sources [2,3 ,4] .
S T E P ;/;
I l l
I V
VI &
V I I
V I I I
I X X
X I T H R U
X I V
X V
X V I I X V I I I
X I X
VECTOR CALCULA liONS FOR TWO-PLANE BALANCING
R O T O R C O N D I T I O N & R U N N O . SYMBOl
I T E M PHASE A N G L E / O R CALCULATION P R O C E D U R E N O . WT. L O C A T I O N
63 ' Original Rotor Unbalance ! R u n N o . 1 1
206"
Noar End Tria i Wolght TW" ,. 270°
Resultant Unbolc'"co - Near End Tried N , 1 23 '0
W t . ( R u n N o . 2 J , , ,,. F a r E n d T r h:.: l Weight TW, , . ! BOn
R 1 u u l t a n t Unbalonce - Far lind Trial N , 1 3 36 '
Welght l lt u n N o . 3 l ,, " 1 62 °
A - N 1 - N I N - N11 1 7' 201 °
8 - F � f I F -. F 1 1 ,. \ 24 '
�! - F I F - FJI .. 2 1 l>O'
f!B ::: N l 1\. t N - N 1 1 ;18 2 3 ,,. 2 5 :::: 2 1 - 1 7 2 6 :::: 2 2 + 1 1 , . 1 49 °
1------ --· ·--�� 2 3 - 1 9 2 8 - 2 4 .;. 20 ,. ·i�J=-�--� �:;:� 3 0 :::: 26 )( 2 o N " 32 2 8 )( 4 fF " 3'
��-N t N - f:I F I " '"
D ::: a N f I F - a N I J S 2 0 '
3 7 ::;: 25 + 27 .. J : 3 8 :::: 26 )( 2 8 QjJ J7
�'�P-LOT UNITY VECTOR " 0 ' 1---· - - "
E U af! Ia/: - U l 4 1 •
4 3 :::: ;.1 3 - 4 1 1-- · - ' --
4 4 - 3 4 + 42 ,,. 4J '" 4 6 :::: 3 6 + 4 2 4 5 4 5 :::: 3 5 - 4 1 , . • f-cc---- · --
4 7 :::: 4 3 - 1 7 4 1 - 44 + 1 8 ,,, �----=- · - ---· 4 9 :::: 4 5 - 1 9 5 0 :::: 46 + 20 ,,. 49 ?<IS
1-_--- -5 1 :::: 5 - 4 1 5 2 :::: 6 )( 48 Cr.Wt. , . S1
5 3 1 1 4 9 5 4 :::: 1 2 )( 50 Cr.Wt. , 5 3 ' "
' '!.
APPLY BALANCE C O R R E C T I O N S
CALCULATE ADDITIONAL C O R R E CT I O N S A S R E Q U I R E D
I T E M N O .
..
,. 1 4
1 6
, .. 2 0 '
2-�-2 4
�2� , . _::::__ 30
32
I� 3 6
-'·· -4 0
4 2 '
4 4
4 6
4 8
5 0 --�-" . . , ,
5 4
VIBRATION A M P . I W T . AMOUNT
" 65
I O o�
;?
45
1 2 oz
" ' " 7.!.>
7J
----'-' ----4.2
'" - ---- · ·-575
' " c------ ·· ' "
�--�-� ·� 22 uno l s
1 0 ufl l l '
!;17 uno t •
$ . 2 1
3S " 1 08
�- ··-- -" --- ---- -- . l O B o,
6 24 (:)1
Figure 1 9 . Two-Plane Vector Calculation D ata S heet.
Static-Couple Derivation
I
Pure static and pure couple unbalance problems are generally easy to solve without worry about cross-effect. For reasonably symmetrical rotors mounted between bearings, and which possess a combination or dynamic unbalance, it is possible to vectorially separate the dynamic unbalance into its static and couple unbalance components. Deriving the static and couple unbalance components allows balancing to be performed in two planes simultaneously without fighting the annoying cross-effect.
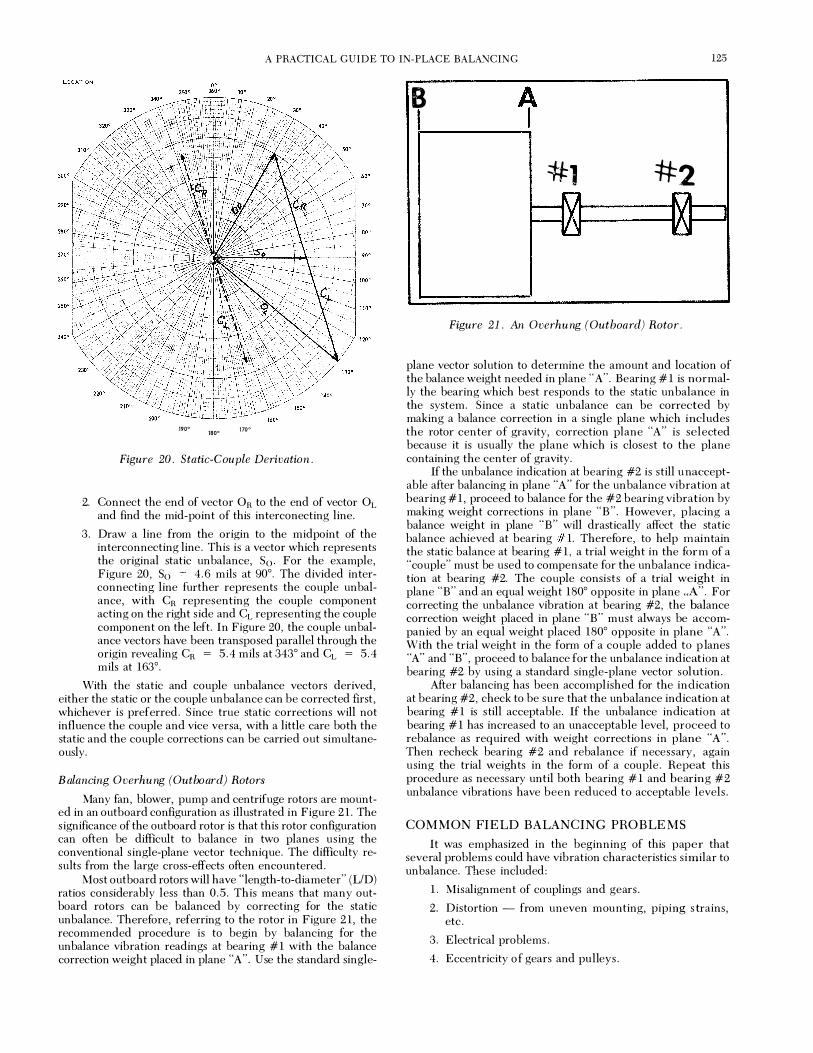
The procedure of balancing by static-couple derivation can be illustrated using a typical dynamic unbalance problem with original readings of:
Original Right (OR) 6 mils at 30°
Original Left (OL) 8 mils at 130°
l. Using polar-coordinate graph paper, construct vectors OR and OL to the same scale (Figure 20).
A PRACTICAL GUIDE TO IN-PLACE BALANCING 125
190° tsoo 1 70°
Figure 20 . Static-Couple Derivation.
2. Connect the end of vector OR to the end of vector OL and find the mid-point of this interconecting line.
3. Draw a line from the origin to the midpoint of the interconnecting line . This is a vector which represents the original static unbalance, S0. For the example, Figure 20, S0 = 4. 6 mils at 90° . The divided interconnecting line further represents the couple unbalance, with CR representing the couple component acting on the right side and CL representing the couple component on the left. In Figure 20, the couple unbalance vectors have been transposed parallel through the origin revealing CR = 5. 4 mils at 343° and CL = 5. 4 mils at 163° .
With the static and couple unbalance vectors derived, either the static or the couple unbalance can be corrected first, whichever is preferred. Since true static corrections will not influence the couple and vice versa, with a little care both the static and the couple corrections can be carried out simultaneously.
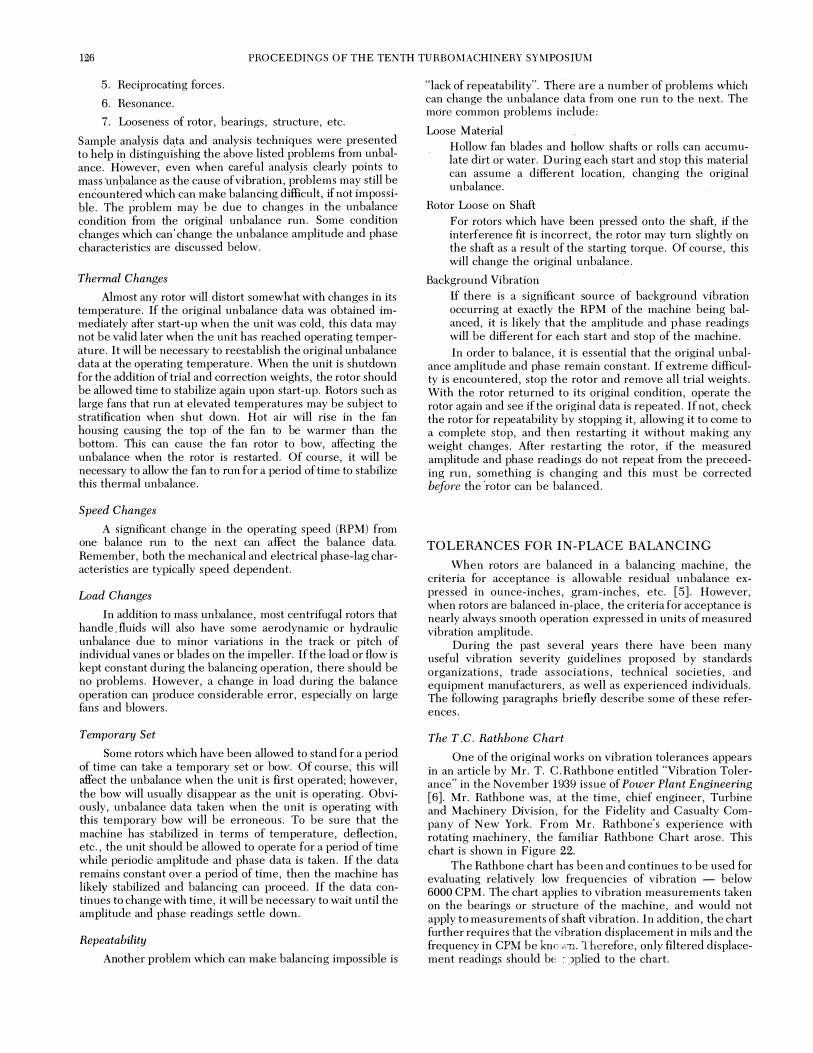
Balancin g Overhung (O utboard) Rotors
Many fan, blower, pump and centrifuge rotors are mounted in an outboard configuration as illustrated in Figure 21. The significance of the outboard rotor is that this rotor configuration can often be difficult to balance in two planes using the conventional single-plane vector technique. The difficulty results from the large cross-effects often encountered.
Most outboard rotors will have "length-to-diameter" (UD) ratios considerably less than 0 . 5. This means that many outboard rotors can be balanced by correcting for the static unbalance. Therefore, referring to the rotor in Figure 21, the recommended procedure is to begin by balancing for the unbalance vibration readings at bearing # 1 with the balance correction weight placed in plane "A". Use the standard single-
8 t I
#1 #2
;::::� r--
X r..- ......
Figure 21 . An Overhung (O utb oa rd) Rotor.
plane vector solution to determine the amount and location of the balance weight needed in plane "A" . Bearing # 1 is normally the bearing which best responds to the static unbalance in the system. Since a static unbalance can be corrected by making a balance correction in a single plane which includes the rotor center of gravity, correction plane "A" is selected because it is usually the plane which is closest to the plane containing the center of gravity.
If the unbalance indication at bearing #2 is still unacceptable after balancing in plane "A" for the unbalance vibration at bearing #1, proceed to balance for the #2 bearing vibration by making weight corrections in plane "B". However, p lacing a balance weight in plane "B" will drastically affect the static balance achieved at bearing # 1. Therefore, to help maintain the static balance at bearing # 1, a trial weight in the form of a "couple" must be used to compensate for the unbalance indication at bearing #2. The couple consists of a trial weight in plane "B" and an equal weight 180° opposite in plane "A" . For correcting the unbalance vibration at bearing #2, the balance correction weight placed in plane "B" must always be accompanied by an equal weight placed 180° opposite in plane "A". With the trial weight in the form of a couple added to p lanes "A" and "B", proceed to balance for the unbalance indication at bearing #2 by using a standard single-plane vector solution.
Mter balancing has been accomplished for the indication at bearing #2, check to be sure that the unbalance indication at bearing # 1 is still acceptable. If the unbalance indication at bearing # 1 has increased to an unacceptable level, proceed to rebalance as required with weight corrections in plane "A". Then recheck bearing #2 and rebalance if necessary, again using the trial weights in the form of a couple. Repeat this procedure as necessary until both bearing # 1 and bearing #2 unbalance vibrations have been reduced to acceptable levels.
COMMON FIELD BALANCING PROBLEM S
It was emphasized in the beginning of this paper that several problems could have vibration characteristics similar to unbalance. These included:
1. Misalignment of couplings and gears.
2. Distortion - from uneven mounting, piping s trains, etc.
3. Electrical problems.
4. Eccentricity of gears and pulleys.
126 PROCEE DINGS OF THE TENTH TURBOMACHINERY SYMPOSIUM
5. Reciprocating forces.
6. Resonance.
7. Looseness of rotor, bearings, structure, etc.
Sample analysis data and analysis techniques were presented to help in distinguishing the above listed problems from unbalance. However, even when careful analysis clearly points to mass unbalance as the cause of vibration, problems may still be encountered which can make balancing difficult, if not impossible. The problem may be due to changes in the unbalance condition from the original unbalance run. Some condition changes which can change the unbalance amplitude and phase characteristics are discussed below.
Thermal Changes
Almost any rotor will distort somewhat with changes in its temperature. If the original unbalance data was obtained immediately after start-up when the unit was cold, this data may not be valid later when the unit has reached operating temperature. It will be necessary to reestablish the original unbalance data at the operating temperature. When the unit is shutdown for the addition of trial and correction weights, the rotor should be allowed time to stabilize again upon start-up. Rotors such as large fans that run at elevated temperatures may be subject to stratification when shut down. Hot air will rise in the fan housing causing the top of the fan to be warmer than the bottom. This can cause the fan rotor to bow, affecting the unbalance when the rotor is restarted. Of course, it will be necessary to allow the fan to run for a period of time to stabilize this thermal unbalance.
Speed Changes
A significant change in the operating speed (RPM) from one balance run to the next can affect the balance data. Remember, both the mechanical and electrical phase-lag characteristics are typically speed dependent.
Load Changes
In addition to mass unbalance, most centrifugal rotors that handle . fluids will also have some aerodynamic or hydraulic unbalance due to minor variations in the track or pitch of individual vanes or blades on the impeller. If the load or flow is kept constant during the balancing operation, there should be no problems. However, a change in load during the balance operation can produce considerable error, especially on large fans and blowers.
Temporary Set
Some rotors which have been allowed to stand for a period of time can take a temporary set or bow. Of course, this will affect the unbalance when the unit is first operated; however, the bow will usually disappear as the unit is operating. Obviously, unbalance data taken when the unit is operating with this temporary bow will be erroneous. To be sure that the machine has stabilized in terms of temperature, deflection, etc., the unit should be allowed to operate for a period of time while periodic amplitude and phase data is taken. If the data remains constant over a period of time, then the machine has likely stabilized and balancing can proceed. If the data continues to change with time, it will be necessary to wait until the amplitude and phase readings settle down.
Repeatability
Another problem which can make balancing impossible is
"lack of repeatability". There are a number of problems which can change the unbalance data from one run to the next. The more common problems include:
Loose Material Hollow fan blades and hollow shafts or rolls can accumulate dirt or water. During each start and stop this material can assume a different location, changing the original unbalance.
Rotor Loose on Shaft For rotors which have been pressed onto the shaft, if the interference fit is incorrect, the rotor may turn slightly on the shaft as a result of the starting torque. Of course, this will change the original unbalance.
Background Vibration If there is a significant source of background vibration occurring at exactly the RPM of the machine being balanced, it is likely that the amplitude and phase readings will be different for each start and stop of the machine. In order to balance, it is essential that the original unbal-
ance amplitude and phase remain constant. If extreme difficulty is encountered, stop the rotor and remove all trial weights. With the rotor returned to its original condition, operate the rotor again and see if the original data is repeated. If not, check the rotor for repeatability by stopping it, allowing it to come to a complete stop, and then restarting it without making any weight changes. Mter restarting the rotor, if the measured amplitude and phase readings do not repeat from the preceeding run, something is changing and this must be corrected before the rotor can be balanced.
TOLERANCES FOR IN-PLACE BALANCING
When rotors are balanced in a balancing machine, the criteria for acceptance is allowable residual unbalance expressed in ounce-inches, gram-inches, etc. [5]. However, when rotors are balanced in-place, the criteria for acceptance is nearly always smooth operation expressed in units of measured vibration amplitude.
During the past several years there have been many useful vibration severity guidelines proposed by standards organizations, trade associations, technical societies, and equipment manufacturers, as well as experienced individuals. The following paragraphs briefly describe some of these references.
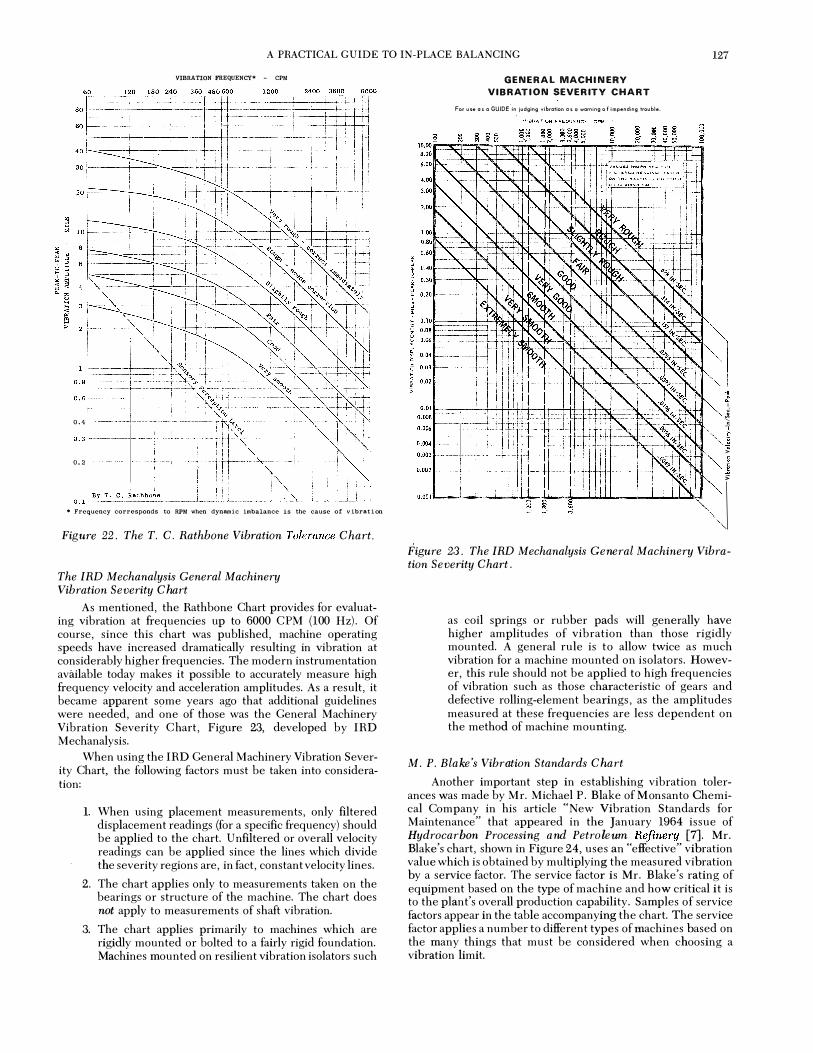
The T .C. Rathbone Chart
One of the original works on vibration tolerances appears in an article by Mr. T. C.Rathbone entitled "Vibration Tolerance" in the November 1939 issue of Power Plant Engineering [6]. Mr. Rathbone was, at the time, chief engineer, Turbine and Machinery Division, for the Fidelity and C asualty Company of New York. From Mr. Rathbone's experience with rotating machinery, the familiar Rathbone Chart arose. This chart is shown in Figure 22.
The Rathbone chart has been and continues to be used for evaluating relatively low frequencies of vibration - below 6000 CPM. The chart applies to vibration measurements taken on the bearings or structure of the machine, and would not apply to measurements of shaft vibration. In addition, the chart further requires that the vibration displacement in mils and the frequency in CPM be know-n. Therefore, only filtered displacement readings should be r ;Jplied to the chart.
A PRACTICAL GUIDE TO IN-PLACE BALANCING 127
VIBRATION FREQUENCY* - CPM
0 . 4
o . 2
• Frequency corr(.lsponds to RPM when dynamic imbalance is the cause of v ibrat i on
Figw·e 22 . The T. C. Rathbone Vibration Tolerance Chart.
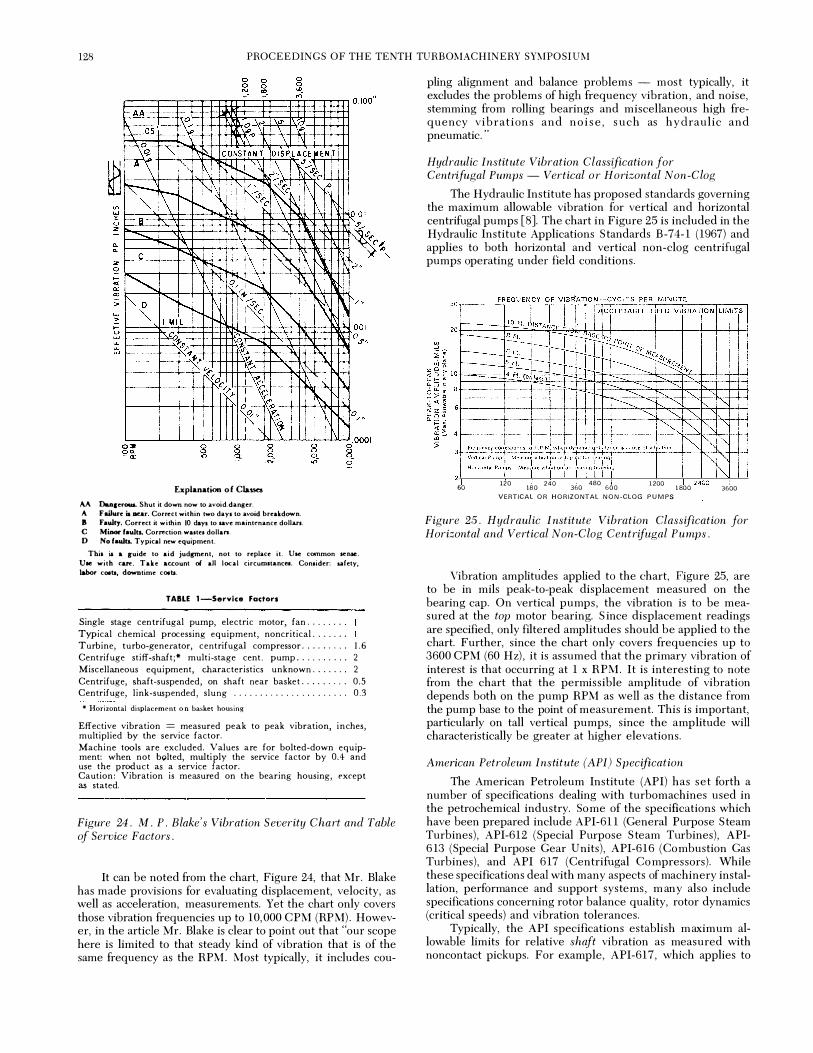
The IRD Mechanalysis General Machinery Vibration Severity Chart
As mentioned, the Rathbone Chart provides for evaluating vibration at frequencies up to 6000 CPM (100 Hz). Of course, since this chart was published, machine operating speeds have increased dramatically resulting in vibration at considerably higher frequencies. The modern instrumentation available today makes it possible to accurately measure high frequency velocity and acceleration amplitudes. As a result, it became apparent some years ago that additional guidelines were needed, and one of those was the General Machinery Vibration Severity Chart, Figure 23, developed by IRD Mechanalysis.
When using the IRD General Machinery Vibration Severity Chart, the following factors must be taken into consideration:
l. When using placement measurements, only filtered displacement readings (for a specific frequency) should be applied to the chart. Unfiltered or overall velocity readings can be applied since the lines which divide the severity regions are, in fact, constant velocity lines.
2. The chart applies only to measurements taken on the bearings or structure of the machine. The chart does not apply to measurements of shaft vibration.
3. The chart applies primarily to machines which are rigidly mounted or bolted to a fairly rigid foundation. Machines mounted on resilient vibration isolators such
G E N E R A L MACH I N ERY V I B R AT I O N SEVE R ITY C H A R T
For u se o s o GUIDE i n judging vi hrotion O s a worniny o f i mpending trouble.
1 '·
� j >
� 1: >
Figure 23 . The IRD Mechanalysis General Machinery Vibration Severity Chart.
as coil springs or rubber pads will generally have higher amplitudes of vibration than those rigidly mounted. A general rule is to allow twice as much vibration for a machine mounted on isolators. However, this rule should not be applied to high frequencies of vibration such as those characteristic of gears and defective rolling-element bearings, as the amplitudes measured at these frequencies are less dependent on the method of machine mounting.
M. P. Blake's Vibration Standards Chart
Another important step in establishing vibration tolerances was made by Mr. Michael P. Blake of Monsanto Chemical Company in his article "New Vibration Standards for Maintenance" that appeared in the January 1964 issue of Hydrocarbon Processing and Petroleum Refinery [7] . Mr. Blake's chart, shown in Figure 24, uses an "effective" vibration value which is obtained by multiplying the measured vibration by a service factor. The service factor is Mr. Blake's rating of equipment based on the type of machine and how critical it is to the plant's overall production capability. Samples of service factors appear in the table accompanying the chart. The service factor applies a number to different types of machines based on the many things that must be considered when choosing a vibration limit.
128 PROCEEDINGS OF THE TENTH TURBOMACHINERY SYMPOSI U M
Explanation of Classeo AA Daaaerou:a. Shut it down now to avoid .danser. A F-ailure is oear. Correct wichin two day• to avoid breakdO'Wn. J Faulty. Correct it w i thin 10 dayt to 11.ve maintenance dollan. C Mi.Dor fau.lta. Correction wattet dollan. D No fault&. Typical new equipmen t .
Tbia ia a auide to a i d judgment, not to replace i t . Ut.e common .e nte .
Ute w i t h C&ft. T a k e account of aU l oc a l circui'Jllta.ncet. Contider: aalety, labor cotta. downtime cotb.
TABLE 1 -Servlce Factors
Single stage cen trifugal pump, electric motor, fan . . . . . . . . Typical chemical processing equipment, noncri t ical . . . . . . . Turbine, turbo-generator, c e n t rifugal compressor . . . . . . . . . 1 . 6 Centrifuge st iff-shaft ;* mult i-stage cent . pump . . . . . . . . . . 2 Miscellaneous equipment, characteristics unknown . . . . . . . 2 Centrifuge, shaft-suspended, on shaft near baske t . . . . . . . . . 0 . 5 C en trifuge, l ink-suspended , s l u n g . . . . . . . . . . . . . . . . . . . . . . 0 . 3
* Horizontal displacf'ment o n basket housing
Effective vibration = measured peak to peak vibration, i n ches, multiplied by the s e rvice factor. Mach i n e tools are excluded. Values a re for bolted-down equipment: when not b"lted, multiply the service factor by 0.4 a n d use the p roduct as a service factor. Caution : Vibration is measured on the bearing housing, t'xrept as stated.
Figure 24 . M. P . Blake's Vibration Severity Chart and Table of Service Factors .
It can be noted from the chart, Figure 24, that Mr. Blake has made provisions for evaluating displacement, velocity, as well as acceleration, measurements. Yet the chart only covers those vibration frequencies up to 10, 000 CPM (RPM). However, in the article Mr. Blake is clear to point out that "our scope here is limited to that steady kind of vibration that is of the same frequency as the RPM . Most typically, it includes cou-
piing alignment and balance problems - most typically, it excludes the problems of high frequency vibration, and noise, stemming from rolling bearings and miscellaneous high frequency vibrations and noise , such as hydraulic and pneumatic. "
Hydraulic Institute Vibration Classification for Centrifugal Pumps - Vertical or Horizontal Non-Clog
The Hydraulic Institute has proposed standards governing the maximum allowable vibration for vertical and horizontal centrifugal pumps [8]. The chart in Figure 25 is included in the Hydraulic Institute Applications S tandards B-74-1 (1967) and applies to both horizontal and vertical non-clog centrifugal pumps operating under field conditions.
60 120 180 240 360 480 600 1 200 2400 1 800
VERTICAL O R H O R IZO NTAL N O N - C L O G P U M PS 3600
Figure 25 . Hydraulic Institute Vibration Classification for Horizontal and Vertical Non-Clog Centrifugal Pumps .
Vibration amplitudes applied to the chart, Figure 25, are to be in mils peak-to-peak displacement measured on the bearing cap. On vertical pumps, the vibration is to be measured at the top motor bearing. S ince displacement readings are specified, only filtered amplitudes should be applied to the chart. Further, since the chart only covers frequencies up to 3600 CPM (60 Hz), it is assumed that the primary vibration of interest is that occurring at 1 x RPM . It is interesting to note from the chart that the permissible amplitude of vibration depends both on the pump RPM as well as the distance from the pump base to the point of measurement. This is important, particularly on tall vertical pumps, since the amplitude will characteristically be greater at higher elevations.
American Petroleum Institute (API) Specification
The American Petroleum Institute (API) has set forth a number of specifications dealing with turbomachines used in the petrochemical industry. Some of the specifications which have been prepared include API-611 (General Purpose S team Turbines), API-612 (Special Purpose S team Turbines), API-6 13 (Special Purpose Gear Units), API-616 (Combustion Gas Turbines), and API 617 (Centrifugal Compressors). While these specifications deal with many aspects of machinery installation, performance and support systems, m any also include specifications concerning rotor balance quality, rotor dynamics (critical speeds) and vibration tolerances.
Typically, the API specifications establish m aximum allowable limits for relative shaft vibration as measured with noncontact pickups. For example, API-617, which applies to
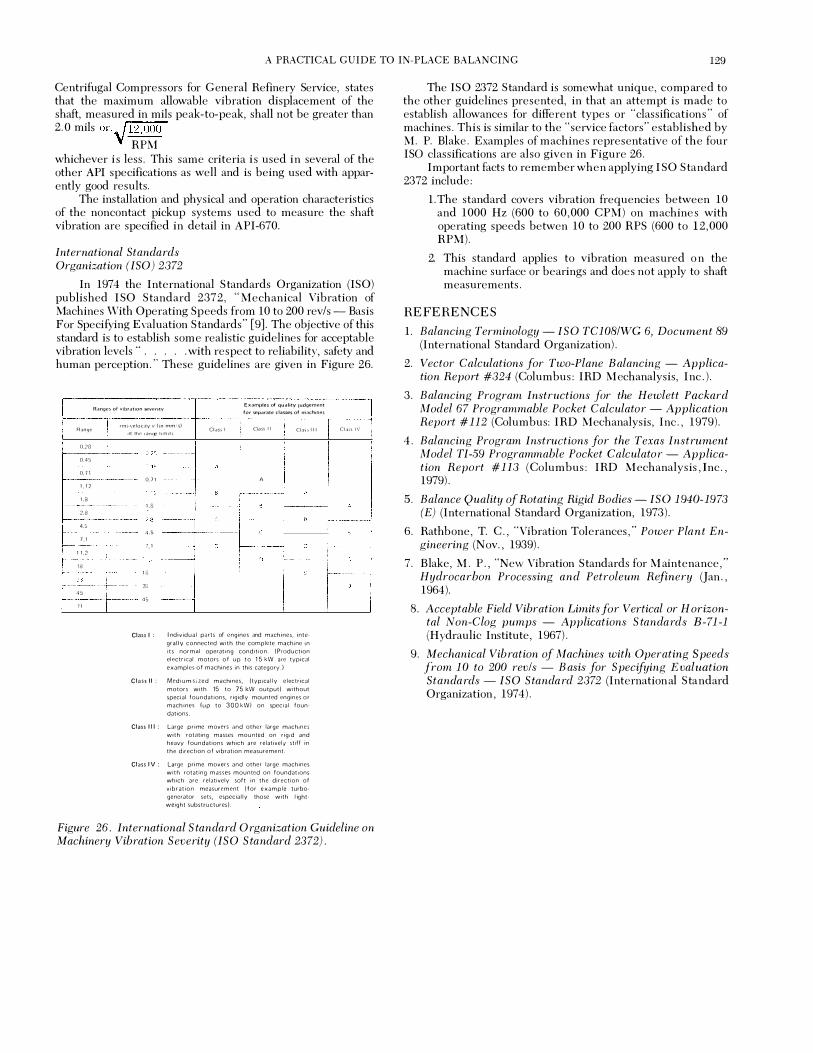
A PRACTICAL GUIDE TO IN-PLACE BALANCING 129
Centrifugal Compressors for General Refinery Service, states that the maximum allowable vibration displacement of the shaft, measured in mils peak-to-peak, shall not be greater than 2. 0 mils or,. /12 , 000
V RPM whichever is less. This same criteria is used in several of the other API specifications as well and is being used with apparently good results.
The installation and physical and operation characteristics of the noncontact pickup systems used to measure the shaft vibration are specified in detail in API-670.
International Standards Organization (ISO) 2372
In 1974 the International S tandards Organization (ISO) published ISO Standard 2372 , "Mechanical Vibration of Machines With Operating Speeds from 10 to 200 rev/s - Basis For Specifying Evaluation S tandards" [9]. The objective of this standard is to establish some realistic guidelines for acceptable vibration levels " . . . . . with respect to reliability, safety and human perception. " These guidelines are given in Figure 26.
Ranqe
0,28
0 . 4 5
0, 7 1
1 , 1 2
1 , 8
2,8
4,5
7 , 1
1 1 , 2
1 8
28
4 5
7 1
Rlmges of vibratloo severny
rmo·vr loc . ty v ( in mmfs! �! the range l im i t s
0, 29 -
0. 4 5 -
0. 7 1
1 . 1 2 -
1 , 8
2.8 -
4 , 5
' , 1 -
1 1 . 2 -
1 8 -
28 -
4 5 -
Cl t�ss I
E :>� amples of qu31ity judgement
f o r ooparate da$Ses of machm!i!s
Clau I I Cl;:ws I l l
A
Class I : I nd i v i d u a l p a r t s of e n g i n e s and mach i n e s , i n t e ·
g r a H y c o n n e c t e d w i t h t h e c o m p l e t e m a c h i n e i n
i t s n o r m a l o p e r a t i n g c o n d i t i o n . (Prod u c t i o n
e l e c t f i C a f m o t o r s o f u p t o 1 5 kW are t y p i c a l
e x a m p l e s o f m a c h i n e s i n t h i s categ o ry . )
C l a s s I I : Med i u m· s i z e d m a c h i n e s , ( t y p i ca l l y e l ec t r i c a l
m o t o r s w i t h 15 t o 7 5 kW o u t p u t ) w i t h o u t
s p ec i a l f o u n d a t i on s , r i g i d l y m o u n t ed e n g i n e s o r
m a c h i nes { u p t o 3 0 0 kW) o n spec i a l f o u n
d a t i o n s .
Class I l l : L a r g e p r i me m o v e r s a n d o t h e r l a r g e m a c h i n e s
w i t h r o t a t i n g m a s s e s m o u n ted o n r i g 1 d a n d
h e a v y f o u n d a t i o n s w h i c h a r e r e l a t i v e l y s t i f f i n
t h e d i r e c t i o n o f v i b r a t i o n m e a s u r e m e n t .
Clas s I V : Large p r i m e m o v e r s a n d o t h e r l a r g e m a c h i n e s
w i t h r o t a t i n g m a s s e s m o u n ted o n f o u n d a t 1 o n s
w h i c h a r e r e l a t i v e l y s o f t i n t h e d i r e c t i o n o f
v i b r a t i o n m e a s u r e m e n t ( f o r e x a m p l e turbo·
generator sets , e s p e c i a l l y those w i t h l ig h t ·
w e i g h t s u b s t r u c t u r es ) .
C l <l�S I V I
Figure 26 . International S tandard O rganization Guideline on Machinery Vibration Severity (ISO S tandard 2372) .
The ISO 2372 Standard is somewhat unique, comp ared to the other guidelines presented, in that an attempt is made to establish allowances for different types or "classifications" of machines. This is similar to the "service factors" established by M. P. Blake. Examples of machines representative of the four ISO classifications are also given in Figure 26.
Important facts to remember when applying ISO S tandard 2372 include:
1. The standard covers vibration frequencies between 10 and 1000 Hz (600 to 60,000 CPM) on machines with operating speeds betwen 10 to 200 RPS (600 to 12, 000 RPM).
2. This standard applies to vibration measured o n the machine surface or bearings and does not apply to shaft measurements.
REFERENCES
1. Balancing Terminology - I S O TC1 08/WG 6, Document 89 (International Standard Organization).
2. Vector Calculations for Two-Plane B alancing - Application Report #324 (Columbus: IRD M echanalysis, Inc . ).
3. Balancing Program Instructions for the Hewlett Packard Model 67 Programmable Pocket Calculator - Application Report # 1 1 2 (Columbus: IRD Mechanalysis, Inc . , 1979).
4. Balancing Program Instructions for the Texas Instrument Model TI-59 Programmable Pocket Calculator - Application Report #11 3 (Columbus : IRD M echanalysis , lnc . , 1979).
5. Balance Quality of Rotating Rigid Bodies - ISO 1 940-1973 (E) (International Standard Organization, 1973).
6. Rathbone, T. C . , "Vibration Tolerances, " Power Plant Engineering (Nov. , 1939).
7. Blake, M . P . , "New Vibration Standards for M aintenance, " Hydrocarbon Processing and Petroleum Refinery (Jan . , 1964).
8. Acceptable Field Vibration Limits for Vertical or H orizontal Non-Clog pumps - Applications S tandards B-71 -1 (Hydraulic Institute, 1967).
9. Mechanical Vibration of Machines with Operating Speeds from 1 0 to 200 rev/s - B asis for Specifying Evaluation Standards - ISO Standard 2372 (International S tandard Organization , 1974).

130 PROCEEDINGS OF THE TENTH TURBOMACHINERY SYMPOSIUM