a comsol flow and transport model in porous media for ... viera_paper.pdf · a comsol flow and...
TRANSCRIPT
A COMSOL Flow and Transport Model in Porous Media for Microbial Enhanced Oil Recovery Studies Martin A. Diaz-Viera*1 and Arturo Ortiz-Tapia2 1Instituto Mexicano del Petróleo (IMP), 2Instituto Mexicano del Petróleo (IMP) *Corresponding author: Eje Central Lázaro Cárdenas Norte 152, México, D.F, e-mail: [email protected] Abstract: A flow and transport model in porous media was implemented in COMSOL Multiphysics to simulate, analyze and interpret Microbial Enhanced Oil Recovery (MEOR) processes at core scale under laboratory conditions. The flow model is biphasic and is based on the oil phase pressure and total velocity formulation. Whereas, the transport model consists of two components: microorganisms and nutrients. It includes physical, chemical and biological phenomena such as advection, diffusion, dispersion, growth and decay of microorganisms. From the methodological point of view, each stage of the model development is described. The model is numerically validated in a case study. Keywords: Flow, transport, porous media, MEOR, FEM. 1. Introduction For the optimal design of oil recovery methods it is required to perform a variety of laboratory tests under controlled conditions to model the fundamental recovery mechanisms for a given recovery method. However, the laboratory tests commonly have a number of drawbacks, which include among others that they are very sophisticated, time consuming, expensive and always not enough to cover the whole range of field conditions involved. A proper modeling of the laboratory tests would be decisive in the interpretation, analysis and understanding of recovery mechanisms as well as in obtaining the relevant parameters for the subsequent implementation of recovery processes at the well and the reservoir scale. In this work we present a flow and transport model which was implemented in COMSOL Multiphysics using the finite element method to simulate, analyze and interpret MEOR processes at core scale under laboratory conditions. The flow model (Diaz-Viera et al. 2008) is a two-phase water-oil model and is based on the
oil phase pressure and total velocity formulation, which takes in account the relative permeability and capillary pressure curves, the effects of gravity and the dynamic modification of porosity and permeability. While the transport model was developed for two components (microorganisms and nutrients) and includes physical, chemical and biological phenomena such as advection, diffusion, dispersion, adsorption, growth and decay of microorganisms. The performance of the coupled flow and transport model was numerically evaluated and validated in a case study of oil displacement by the injection of water, followed by the injection of water with microorganisms and nutrients. 2. Conceptual Model The following hypotheses are considered: - There are three phases: water ( w ), oil ( o ) and solid ( s ). - There are four components: water ( w ), only in the water phase, oil (o ), only in the oil phase, rock ( r ), only in the solid phase, microorganisms ( m ) in the water phase (planktonic) and in the solid phase (sessile), and nutrients ( n ) in the water phase (fluents) and in the solid phase (adsorbed). - The rock and the fluids are incompressible. - The porous medium is fully saturated. - The fluid phases stay separated in the pores. - All phases are in thermodynamical equilibrium. - The porous medium is considered isotropic and homogeneous, but the dynamical porosity and permeability variation is allowed. - The dispersive flux of microorganisms and nutrients follows the Fick’s law:
, ,w w wwS D c m n (1)
where wS is the water saturation, wc is the concentration of the component in water, and
wD is the hydrodynamic dispersion tensor (Bear 1972).
Excerpt from the Proceedings of the 2015 COMSOL Conference in Boston
- For microorganisms and nutrients biological interaction a Monod growth rate function is used (Gaudy 1980):
max /
n n
w m n wc K c (2)
where max is the maximum specific growth rate,
/m nK is the Monod constant for nutrients and n
wc is the nutrients concentration in water. - Linear decay models for planktonic ( m
d w wk S c )
and sessile ( m
d bk ) microorganisms are used;
where dk is the specific decay rate, m
b is the density of microorganisms, is the volume fraction of sessile microorganisms, and m
wc is the concentration of planktonic microorganisms. - The clogging/declogging process is modelled as a quasilinear adsorption m m
a w wk S c (Corapcioglu and Haridas 1984) and an irreversible limited desorption m m
r b irrk
processes (Lappon and Fogler 1996). Here m
ak
and m
rk are the adsorption and desorption rate
coefficients, and irr is the minimum sessile cell concentration. Table 1: Intensive properties associated with the mass of the components by phases. Phase ( )
Component ( ) Extensive property
Intensive property
Water ( w ) Water ( w )
Microorganisms ( m ) Nutrients ( n )
w
wM t
m
wM t
n
wM t
w
w wS m
w wS c n
w wS c Oil ( o ) Oil ( o ) o
oM t o
o oS
Solid ( s )
Microorganisms ( m ) Rock ( r ) Nutrients ( n )
m
bM t
r
sM t
s
nM t
m m
b bc
1
r
s
r
s
ˆn r n
s s sc c
In Table 1 a summary of the intensive properties associated with the mass of each component by phases is given. 3. Mathematical Model
Applying the axiomatic formulation for continuum systems (Allen et al. 1988) and considering the assumptions established in the conceptual model, we can derive the governing equations for the flow and transport model. 3.1 The Flow Model The flow model (Diaz-Viera et al. 2008) is based on the oil phase pressure and total velocity formulation given by Chen (Chen 2000). Pressure equation ( op ):
cowo w w
w
o w o o w w
dpk p k SdS
q q k zt
(3)
Saturation equation ( wS ):
;
w coww o w w
w
w w w w
S dpk p k St dS
k z S qt
(4)
Phase velocities:
;;
coww w o w w
w
w w
o o o o o
dpu f k p f k SdS
f k zu f k p f k z
(5)
Here, u is the Darcy velocity
; ,rku k p z o w
(6)
where is the porosity, k is the absolute
permeability tensor, S is the saturation, is
the viscosity, is the density, p is the
pressure, rk is the relative permeability, and q is the source term, for each phase ,o w , is the absolute value of the gravity acceleration,
cowp is the capillary oil-water pressure and z is the vertical coordinate. For convenience, the following additional notation is introduced: rk is the phase
mobility, ,w o
is the total mobility,
f is the fractional flow and
w ou u u is the total velocity.
Excerpt from the Proceedings of the 2015 COMSOL Conference in Boston
3.2 The Transport Model The multicomponent transport model was derived based on the revision of the models introduced in (Corapcioglu and Haridas 1984) and in (Chang et al. 1992). Planktonic microorganisms equation ( m
wc ):
mm m mww w w w ww
m m m md a w w r b irr
S c c u S D ct
k k S c k
(7)
Sessile microorganisms equation ( ):
m m mb d r b
m m m ma w w r b irr
k ktk S c k
(8)
Nutrients equation ( n
wc ):
/
nn n nww w w w ww
m mw w b
m n
S c c u S D ct
S cY
(9)
3.3 Complementary Relationships For relative permeability and oil-water capillary pressure functions the Brooks-Corey model is used (Brooks and Corey 1964):
2 3 2
2 and 1 1rw e ro e ek S k S S
(10)
1cow w t ep S p S (11)
where eS is the effective or normalized saturation, which is defined as:
1w wr
ewr or
S SSS S
(12)
wrS and orS are the residual saturations for water
and oil, respectively, tp is the entry pressure, and characterizes the pore size distribution. The porosity modification due to the clogging/declogging processes (Chang et al. 1992):
0 (13)
is the actual porosity, 0 is the initial porosity and is the volume fraction occupied by sessile microorganisms. The permeability modification is expressed as a function of the porosity by the Kozeny-Carman equation (Carman 1956):
2 30
0 230
11
k k
(14)
where k and 0k are the actual and initial permeability, respectively. 3.4 Initial and Boundary Conditions Initial conditions:
0 0 0 0
0 0 0 0
0 0
, ,
, ,
o o w w
m m n nw w w w
p t p S t S
c t c c t c
t
(15)
Boundary conditions: The boundary conditions specified below are considering a particular domain, which is a cylindrical porous column (also known in the jargon of oil recovery “a core”) where fluid is injected at the bottom and produced at the top. a.) Inlet conditions (constant rate) at the bottom of the core
,
; ,iny
ino w w
ww w ww
inww
u n u n u n
c u S D c n
c u n m n
(16)
where in
wu is the water injection velocity, and
0inywc are injected concentrations for
microorganisms ( m ) and nutrients ( n ), respectively. b.) Outlet conditions (constant pressure, out
op ) at the top of the core
, 0,
0; , ;
outo o w
w
p p S nc n m n
(17)
where out
op is oil production pressure. c.) No-flow conditions for other boundaries.
4. Numerical and Computational Models
The numerical model consists in making the appropriate choice of the numerical methods in terms of accuracy and efficiency for the solution of the mathematical model. Once the numerical model have been chosen its computational implementation is required. In this case the resulting problem is a nonlinear system of partial differential equations with initial and boundary conditions. For the
Excerpt from the Proceedings of the 2015 COMSOL Conference in Boston
numerical solution we apply the following methods: - A backward finite difference discretization of second order for the temporal derivatives was used resulting a fully implicit scheme in time. - A standard finite element discretization with quadratic Lagrange polynomials. - An unstructured mesh with tetrahedral elements in 3D. - The Newton-Raphson method for the linearization of the nonlinear equation system. - A variant of the LU direct method for non-symmetric and sparse matrices, implemented in the UMFPACK library, for the solution of the resulting algebraic system of equations. The implementation of the computational model was performed using the COMSOL Multiphysics software by the PDE mode in general coefficient form for the time-dependent analysis (COMSOL Multiphysics 2007a). 5. Case Study Description The case study can be conventionally divided in two stages that were sequentially performed. In the first stage the oil is displaced by water (a secondary recovery process), and in the second one water is injected with microorganisms and nutrients (a MEOR process). All data used here for the case study are taken from the published literature (Hoteit and Firoozabadi 2008, Chang et al. 1991), see Table 2. 5.1 Secondary Recovery Given a Berea sandstone core (a cylindrical porous medium fragment) of 0.25 m of length and 0.04 m of diameter with porosity ( 0 =
0.2295) and isotropic permeability ( 0k = 326 mD) in vertical position and saturated with water and oil. A secondary recovery process is accomplished by the displacement of oil with the water flooding. The water is injected from the lower side of the core with a constant velocity of one foot per day (3.53×10⁻⁶ m/s), while the oil and water are produced at a constant pressure (10 kPa) in the opposite side of the core during 200 hours until a steady state is obtained. A summary of the data is given in Table 2.
Table 2: Data for the flow and transport model.
Property (Notation) Value [Unit]
Microorganism density ( m
b ) 1000 [kg m-3]
Irreducible biomass fraction ( irr )
0.003 [m3 m-3]
Water injection velocity ( wu )
1 [ft day-1]
Nutrient dispersion ( nwD ) 0.0083 [ft2 day-1]
Microorganism dispersion ( m
wD ) 0.0055 [ft2 day-1]
Maximum specific growth ( max )
8.4 [day-1]
Affinity coefficient ( /m nK ) 0.5 [lb ft-3]
Decay coefficient ( dk ) 0.22 [day-1]
Production coefficient ( /m nY )
0.5 [kg kg-1]
Desorption coefficient ( mrk ) 37 [day-1]
Adsorption coefficient ( mak ) 25 [day-1]
Injected nutrient concentration (
iny
nwc )
2.5 [lb ft-3]
Injected microorganism concentration (
iny
mwc )
1.875 [lb ft-3]
5.2 MEOR In the second stage, microorganisms and nutrients are continuously injected to the Berea sandstone core through the water phase during 24 hours until a steady state is obtained. The intention of this test consists in evaluating the additional oil production that can be recovered by mechanical effects because of the microbial activity (MEOR). As in the first step of the test data are those from Table 2.
6. Numerical Simulations
For the numerical simulation of the secondary recovery test it is enough to apply the flow model. The finite element discretization mesh for the numerical solution of this problem is shown in Figure 1, which is made of 1,702 tetrahedral
Excerpt from the Proceedings of the 2015 COMSOL Conference in Boston
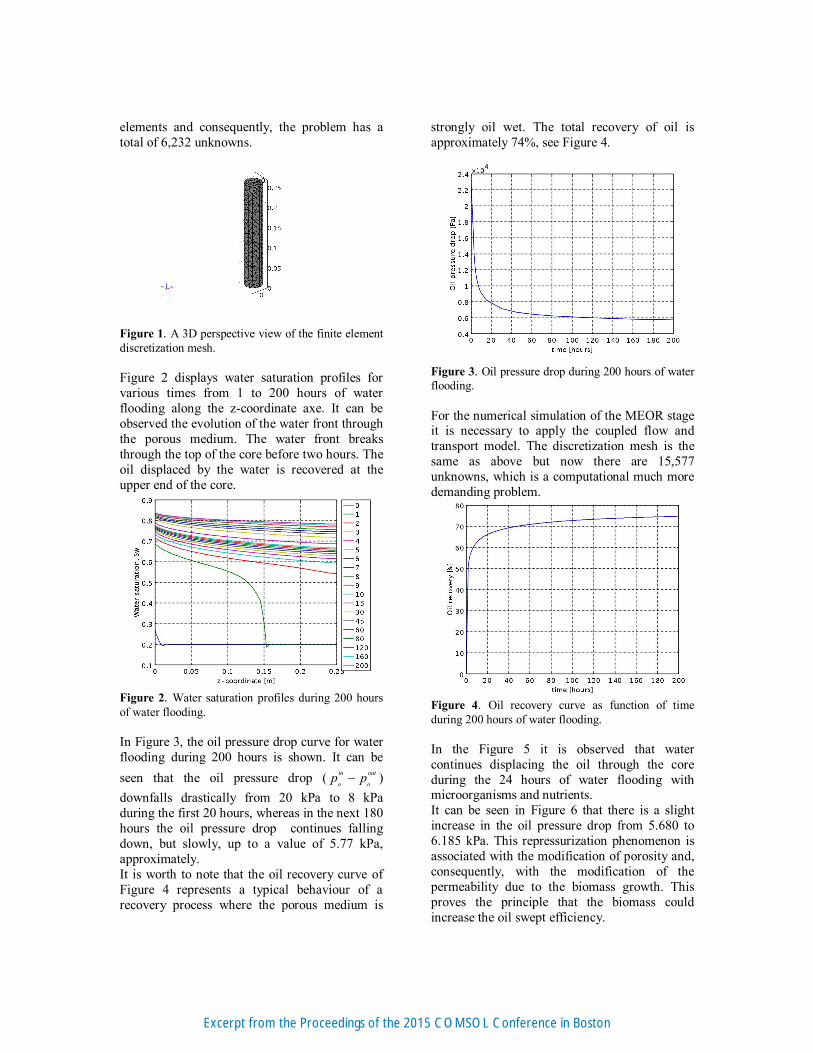
elements and consequently, the problem has a total of 6,232 unknowns.
Figure 1. A 3D perspective view of the finite element discretization mesh. Figure 2 displays water saturation profiles for various times from 1 to 200 hours of water flooding along the z-coordinate axe. It can be observed the evolution of the water front through the porous medium. The water front breaks through the top of the core before two hours. The oil displaced by the water is recovered at the upper end of the core.
Figure 2. Water saturation profiles during 200 hours of water flooding. In Figure 3, the oil pressure drop curve for water flooding during 200 hours is shown. It can be seen that the oil pressure drop ( in out
o op p ) downfalls drastically from 20 kPa to 8 kPa during the first 20 hours, whereas in the next 180 hours the oil pressure drop continues falling down, but slowly, up to a value of 5.77 kPa, approximately. It is worth to note that the oil recovery curve of Figure 4 represents a typical behaviour of a recovery process where the porous medium is
strongly oil wet. The total recovery of oil is approximately 74%, see Figure 4.
Figure 3. Oil pressure drop during 200 hours of water flooding. For the numerical simulation of the MEOR stage it is necessary to apply the coupled flow and transport model. The discretization mesh is the same as above but now there are 15,577 unknowns, which is a computational much more demanding problem.
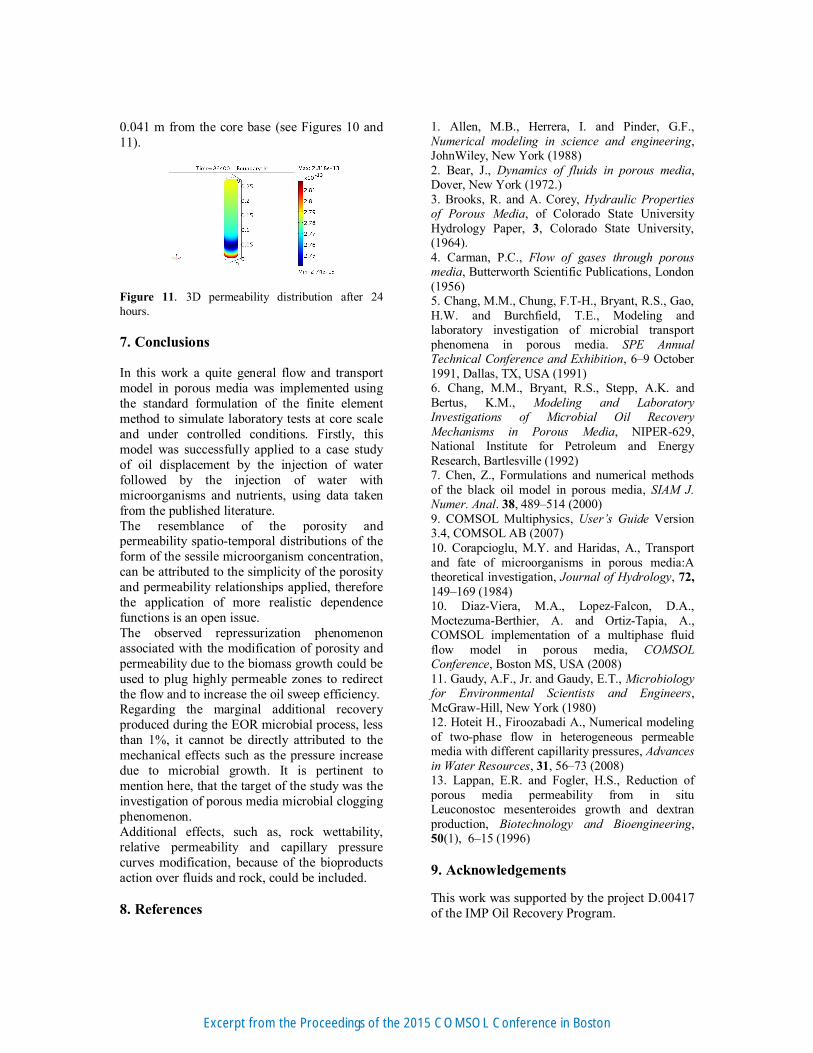
Figure 4. Oil recovery curve as function of time during 200 hours of water flooding. In the Figure 5 it is observed that water continues displacing the oil through the core during the 24 hours of water flooding with microorganisms and nutrients. It can be seen in Figure 6 that there is a slight increase in the oil pressure drop from 5.680 to 6.185 kPa. This repressurization phenomenon is associated with the modification of porosity and, consequently, with the modification of the permeability due to the biomass growth. This proves the principle that the biomass could increase the oil swept efficiency.
Excerpt from the Proceedings of the 2015 COMSOL Conference in Boston
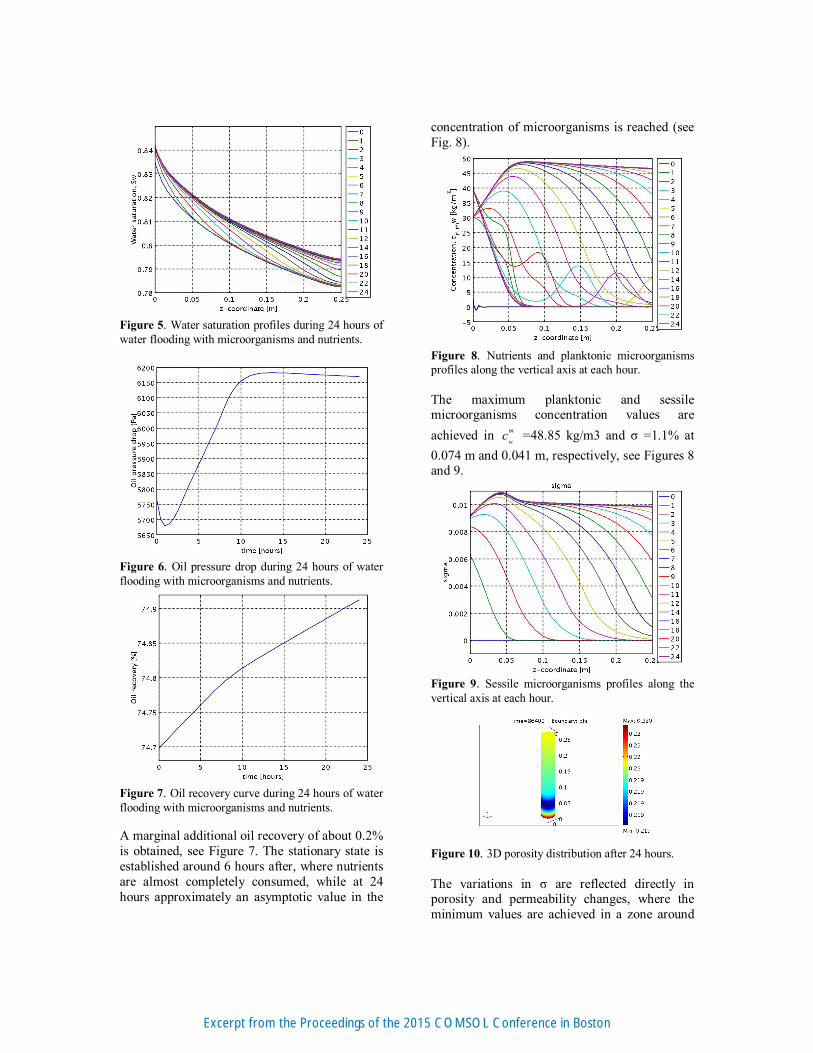
Figure 5. Water saturation profiles during 24 hours of water flooding with microorganisms and nutrients.
Figure 6. Oil pressure drop during 24 hours of water flooding with microorganisms and nutrients.
Figure 7. Oil recovery curve during 24 hours of water flooding with microorganisms and nutrients. A marginal additional oil recovery of about 0.2% is obtained, see Figure 7. The stationary state is established around 6 hours after, where nutrients are almost completely consumed, while at 24 hours approximately an asymptotic value in the
concentration of microorganisms is reached (see Fig. 8).
Figure 8. Nutrients and planktonic microorganisms profiles along the vertical axis at each hour. The maximum planktonic and sessile microorganisms concentration values are achieved in m
wc =48.85 kg/m3 and σ =1.1% at 0.074 m and 0.041 m, respectively, see Figures 8 and 9.
Figure 9. Sessile microorganisms profiles along the vertical axis at each hour.
Figure 10. 3D porosity distribution after 24 hours. The variations in σ are reflected directly in porosity and permeability changes, where the minimum values are achieved in a zone around
Excerpt from the Proceedings of the 2015 COMSOL Conference in Boston
0.041 m from the core base (see Figures 10 and 11).
Figure 11. 3D permeability distribution after 24 hours. 7. Conclusions In this work a quite general flow and transport model in porous media was implemented using the standard formulation of the finite element method to simulate laboratory tests at core scale and under controlled conditions. Firstly, this model was successfully applied to a case study of oil displacement by the injection of water followed by the injection of water with microorganisms and nutrients, using data taken from the published literature. The resemblance of the porosity and permeability spatio-temporal distributions of the form of the sessile microorganism concentration, can be attributed to the simplicity of the porosity and permeability relationships applied, therefore the application of more realistic dependence functions is an open issue. The observed repressurization phenomenon associated with the modification of porosity and permeability due to the biomass growth could be used to plug highly permeable zones to redirect the flow and to increase the oil sweep efficiency. Regarding the marginal additional recovery produced during the EOR microbial process, less than 1%, it cannot be directly attributed to the mechanical effects such as the pressure increase due to microbial growth. It is pertinent to mention here, that the target of the study was the investigation of porous media microbial clogging phenomenon. Additional effects, such as, rock wettability, relative permeability and capillary pressure curves modification, because of the bioproducts action over fluids and rock, could be included. 8. References
1. Allen, M.B., Herrera, I. and Pinder, G.F., Numerical modeling in science and engineering, JohnWiley, New York (1988) 2. Bear, J., Dynamics of fluids in porous media, Dover, New York (1972.) 3. Brooks, R. and A. Corey, Hydraulic Properties of Porous Media, of Colorado State University Hydrology Paper, 3, Colorado State University, (1964). 4. Carman, P.C., Flow of gases through porous media, Butterworth Scientific Publications, London (1956) 5. Chang, M.M., Chung, F.T-H., Bryant, R.S., Gao, H.W. and Burchfield, T.E., Modeling and laboratory investigation of microbial transport phenomena in porous media. SPE Annual Technical Conference and Exhibition, 6–9 October 1991, Dallas, TX, USA (1991) 6. Chang, M.M., Bryant, R.S., Stepp, A.K. and Bertus, K.M., Modeling and Laboratory Investigations of Microbial Oil Recovery Mechanisms in Porous Media, NIPER-629, National Institute for Petroleum and Energy Research, Bartlesville (1992) 7. Chen, Z., Formulations and numerical methods of the black oil model in porous media, SIAM J. Numer. Anal. 38, 489–514 (2000) 9. COMSOL Multiphysics, User’s Guide Version 3.4, COMSOL AB (2007) 10. Corapcioglu, M.Y. and Haridas, A., Transport and fate of microorganisms in porous media:A theoretical investigation, Journal of Hydrology, 72, 149–169 (1984) 10. Diaz-Viera, M.A., Lopez-Falcon, D.A., Moctezuma-Berthier, A. and Ortiz-Tapia, A., COMSOL implementation of a multiphase fluid flow model in porous media, COMSOL Conference, Boston MS, USA (2008) 11. Gaudy, A.F., Jr. and Gaudy, E.T., Microbiology for Environmental Scientists and Engineers, McGraw-Hill, New York (1980) 12. Hoteit H., Firoozabadi A., Numerical modeling of two-phase flow in heterogeneous permeable media with different capillarity pressures, Advances in Water Resources, 31, 56–73 (2008) 13. Lappan, E.R. and Fogler, H.S., Reduction of porous media permeability from in situ Leuconostoc mesenteroides growth and dextran production, Biotechnology and Bioengineering, 50(1), 6–15 (1996) 9. Acknowledgements This work was supported by the project D.00417 of the IMP Oil Recovery Program.
Excerpt from the Proceedings of the 2015 COMSOL Conference in Boston