a community pharmacy based anticoagulant management service
TRANSCRIPT
A community pharmacy based anticoagulant management service McLachlan, Spindler, Fois, Krass, Chen and Bajorek
1
A community pharmacy based
anticoagulant management service (2002-027)
Andrew J McLachlan
Megan Spindler
Romano Fois
Ines Krass
Timothy Chen
Beata Bajorek
Faculty of Pharmacy
University of Sydney
Submitted: June 2005
Revised: August 2005
This project was funded by the Commonwealth Department of Health and Ageing as
part of the Third Community Pharmacy Agreement.
A community pharmacy based anticoagulant management service McLachlan, Spindler, Fois, Krass, Chen and Bajorek
2
EXECUTIVE SUMMARY
Background In Australia, warfarin is a widely used anticoagulant for the prevention and treatment
of pulmonary embolism and deep venous thrombosis and for prophylaxis of
thromboembolic events in patients with atrial fibrillation, prosthetic heart valves and
myocardial infarction. Its use, however, is complicated by the risk of excessive
bleeding from over-anticoagulation which can be life threatening and which remains
the most significant adverse event for patients receiving the drug. The most important
predictor of outcome on warfarin therapy remains the clotting status of the patient
(measured by the INR) and its control within the target range selected according to the
indication for anticoagulation. Clinical studies have shown that anticoagulant
management programs that incorporate patient education and regular monitoring of
INR can reduce the incidence of serious misadventure and improve patient outcomes.
Patients receiving warfarin report significant impacts on their quality of life associated
with their therapy. Constant vigilance of diet and concomitant medications is
necessary and significant disruption to daily living and time management can be
associated with the requirement for long-term, periodic INR assessment. This study
seeks to address the challenges of warfarin therapy through community pharmacists
providing education and support to patients receiving warfarin therapy and applying a
point-of-care testing device for assessing INR and communicating the INR results in
consultation with general practitioners.
Aims and Objectives This project evaluated the impact of a community pharmacist managed anticoagulant
service conducted in collaboration with general practitioners on;
1. INR control, clinical outcome and quality of life of patients receiving warfarin;
2. a cost comparison of a pharmacy based service compared to usual care;
3. the professional links between community pharmacists and general practitioners in
providing patient care for persons taking warfarin.
A community pharmacy based anticoagulant management service McLachlan, Spindler, Fois, Krass, Chen and Bajorek
3
Methods Setting: This study was conducted in community pharmacies and general practices
across the greater Sydney metropolitan area.
Design: An observational study of patients on warfarin maintenance therapy who
received a pharmacist-general practitioner-based anticoagulation (intervention)
management service. Prospectively collected data from the intervention arm was
compared to retrospectively collected data from patients receiving usual care (control
and pre-intervention).
Pharmacist-general practitioners managed anticoagulation:
Trained pharmacists provided patient education and support, monitored INR (with
a point-of-care testing device) and made warfarin management recommendations.
INR Results and pharmacist’s recommendations were communicated to the
patient’s general practitioner for vetting, discussion and decision.
Clinical Endpoint: The primary clinical endpoint was the proportion of time INR
observations were within, below and above the specified range. This parameter has
been closely linked to patient outcome.
Humanistic Endpoints: The main humanistic endpoints included patient satisfaction,
quality of life assessment (using a validated structured questionnaire specific for
patients receiving warfarin), patient warfarin knowledge assessment (measured using
a previously validated questionnaire) and pharmacist experiences.
Economic Endpoint: A comparison was made between the costs of delivering the
community pharmacist-managed anticoagulant service compared to the costs of
providing usual care. This approach was selected based on the observations that
frequency of testing and patient INR control was the same between the intervention
and control arms of the study. The Medicare Benefits Schedule expenditure was also
compared for a limited number of patients.
Study Comparisons: Slow recruitment was a major issue which affected the size of
the final study cohort. In light of this issue, the investigators changed the protocol
(with the permission of the Pharmacy Guild of Australia) to allow three sets of
clinical and humanistic data to be collected. These are defined below;
Intervention – prospectively collected data from patients who received
pharmacist-general practitioner based anticoagulant management.

A community pharmacy based anticoagulant management service McLachlan, Spindler, Fois, Krass, Chen and Bajorek
4
Pre-intervention – retrospectively collected data from patients receiving usual
care prior to the intervention.
Control – retrospectively collected data from a separate group of patients who
received usual care over the same timeframe as the intervention.
Results This study combined data from 53 patients, 758 INR measurements and 537
pharmacist recommendations collectively representing approximately 40 years of
patient experience on warfarin.
Clinical Outcomes: There were no major (haemorrhagic and thromboembolic) or
minor (episodes of bruising or bleeding) warfarin-related adverse events recorded
during the trial. The table below presents a summary of all patient data and the
primary clinical endpoint for patients in the control and intervention group (note: pre-
intervention data were collected from the patients prior to the intervention).
Intervention cohort Parameter
Control Pre-
intervention Intervention
Patients 121 20 41 INR results 92 142 524 INR results per patient 15
(6 – 33) 2 7
(2 – 21) 2 13
(1 – 28) 2 Time in Study (months)
9.5 5.8
4.8 3.3
8.2 3.7
Frequency of monitoring (readings per month)
2.1 0.9 (1.2 -3.5)
1.7 1.1 (0.6 – 5.0)
1.6 0.7 (0.4 – 4.1)
Length of time INR readings were WITHIN range (%)3
81 17 % (52 – 95)
75 18 % (35 – 100)
81 16 % (45 – 100)
Length of time INR readings were BELOW range (%)3
12 15 % (0 – 32 )
6 3 % (2 – 12)
9 3 % (2 – 13 )
Length of time INR readings were ABOVE range (%)3
8 4 % (3 – 15)
10 14 % (0 – 46)
11 13 % (0 – 44)
1 INR data only available for 6 patients 2 median and range (shown in brackets) 3 Derived from data for 38 patients and 519 INR observations for Intervention and 14 patients and 126 INR observations for Pre-intervention.

A community pharmacy based anticoagulant management service McLachlan, Spindler, Fois, Krass, Chen and Bajorek
5
These data show that a pharmacist-managed anticoagulant service conducted in
collaboration with the patient’s GP using of point-of-care INR testing could maintain
safe and efficacious control of patient INR over the course of the study. However,
statistical analyses were not conducted on these data because of differences in patient
numbers and the combination of retrospective and prospective data.
Fourteen patients provided adequate clinical data for a rigorous comparison between
INR control during the pre-intervention and intervention phases. A summary of the
individual and mean results for the 14 patients that contributed adequate pre-
intervention and intervention INR data is summarised below.
Intervention Parameter
Pre- * During*
Time in Study (months) 4.7 1.6 8.8 4.0
Proportion of time INR readings were
WITHIN range (%)
75 17 %
(65 – 86)
78 18 %
(68 – 89)
Proportion of time INR readings were
BELOW range (%)
15 17 %
(5 – 25)
8 9 %
(2 – 13)
Proportion of time INR readings were
ABOVE range (%)
9 14 %
(1 – 18)
15 16 %
(5 – 25)
Mean standard deviation (and 95% confidence intervals) are reported.
These results show that there was no statistically significant difference (p=0.66;
paired 2-tailed t-test) between the proportion of time INR readings were within the
target range for these 14 patients in the pre-intervention and intervention period.
Furthermore, the proportions of time above and below the INR range were not
statistically significant different (p=0.15 and p=0.07, respectively) for the pre-
intervention and intervention periods.
Humanistic endpoints: Patients involved in the pharmacist-general practitioner
managed anticoagulant service were very satisfied with the service and highlighted
convenience as a major advantage. The quality of life of patients in the intervention
A community pharmacy based anticoagulant management service McLachlan, Spindler, Fois, Krass, Chen and Bajorek
6
group increased over the course of the study (based on a before and after comparison)
whereas warfarin related knowledge tended to be higher after the study but did not
reach statistical significance. Pharmacists participating in the study recorded a high
level of satisfaction in providing the service. This is reflected in the fact that general
practitioners actioned 96% of the 537 management recommendations made by
pharmacists.
Economic Comparison: A comparison was made of the cost of delivering the
community pharmacist-managed anticoagulant service compared to the associate
costs of providing usual care. The findings of the cost comparison suggest that in the
first year of delivery the community pharmacist-managed anticoagulant service was
more expensive to deliver (reflecting the need for set up costs and training) but in
subsequent years the pharmacy-based service conducted in collaboration with GPs
and using point-of-care INR testing offered considerable cost savings. The Medical
Benefits Schedule (MBS) data for 17 patients in this study showed a trend towards
lower MBS expenditure on anticoagulant monitoring but a significant difference
between the pre-intervention and intervention expenditure was not observed. The
frequency of INR monitoring by general practitioners during the pre-intervention and
by pharmacists and general practitioner in the intervention were not significantly
different.
Conclusions A community pharmacist-general practitioner managed anticoagulant service using
point-of-care INR testing can;
maintain the control of patient INR within the target range to help achieve
optimal anticoagulation outcomes;
improve patient knowledge which, in turn, has been linked to reduced risk of
warfarin-related complications;
improve patient quality of life by reducing treatment related distress;
foster timely and appropriate inter-professional collaboration between
pharmacists and general practitioners;
be delivered in a manner which is comparable to the cost of existing pathology
services.
A community pharmacy based anticoagulant management service McLachlan, Spindler, Fois, Krass, Chen and Bajorek
7
Furthermore, this study demonstrated that the community pharmacist-general
practitioner managed anticoagulant service was acceptable to patients and pharmacists
involved in the study. Trained and supported pharmacists were able to make credible
management recommendations about anticoagulation that were accepted by general
practitioners.
Taken together, the results of this study demonstrate that a community pharmacist-
general practitioner managed anticoagulant service is feasible and offers on
alternative option for some patients receiving warfarin.
An important note The “intervention” in this study consisted of trained pharmacists working in close
collaboration with general practitioners and patients to manage a patient’s
anticoagulant therapy. The title of this project might lead some readers to conclude
that pharmacists were working independently of general practitioners – this is not the
case. At all times during this study patients remained in the care of their general
practitioner and no clinical decisions (eg dose regimen changes) were made by
pharmacists without the prior approval of the patient’s general practitioner. This was a
fundamental aspect of the study.

A community pharmacy based anticoagulant management service McLachlan, Spindler, Fois, Krass, Chen and Bajorek
8
Recommendations
1. A community pharmacy based anticoagulant management service that
combines point-of-care INR testing, patient education and general practitioner
collaboration is feasible for patients receiving maintenance warfarin therapy.
2. The collaborative community pharmacist- general practitioner anticoagulant
management model examined in this study provides a suitable alternative (not
replacement) for existing anticoagulant management options.
3. We recommend that funding for community pharmacist- general practitioner
management of anticoagulation be considered in the future.
4. Future studies should be conducted over a longer time frame involving a larger
number of patients and pharmacists to allow an assessment of the long term
impact of community pharmacist-general practitioner based anticoagulant
management on patient care.
5. The use of point-of-care INR testing in pharmacy should be supported by
appropriate training of staff in the use of the device and competency evaluated
according to professional standards for near-patient testing procedures.
6. Anticoagulant management using point-of-care INR testing should be
conducted in association with an appropriate internal and external quality
control program.

A community pharmacy based anticoagulant management service McLachlan, Spindler, Fois, Krass, Chen and Bajorek
9
ACKNOWLEDGEMENTS
We are grateful for the financial support for this project, provided by the
Commonwealth Department of Health and Ageing, through the Third Community
Pharmacy Agreement Research and Development Grants Program, administered by
the Pharmacy Guild of Australia. We also gratefully acknowledge the hard work,
professional commitment and efforts of the community pharmacists involved in this
study. We sincerely thank the patients and general practitioners who participated in
this study. The technical expertise and support of Sean Gray from Point-of-care
Diagnostics Pty Ltd is gratefully acknowledged. Helpful discussions with Professor
Gregory Peterson are also acknowledged. We also thank the members of the Advisory
Board for helpful comments on the development and implementation of this project.
The members of the External Advisory Board for this project that included Ms
Maxine Goodman (Pharmaceutical Society of Australia, NSW branch), Dr Anne
Taylor (General Practitioner), Ms Judith Mackson (National Prescribing Service), Ms
Barbara Levin (Hospital Pharmacist with Anticoagulant Clinic experience, Royal
North Shore Hospital); and the support of others who were unable to attend the
advisory board including Mr Lance Emerson (Pharmacy Guild of Australia) and Prof
Gillian Shenfield (Clinical Pharmacology, Royal North Shore Hospital).

A community pharmacy based anticoagulant management service McLachlan, Spindler, Fois, Krass, Chen and Bajorek
10
RESEARCH TEAM
A/Prof Andrew J McLachlan
Ms Megan Spindler (Project Officer)
Dr Romano A Fois
A/Prof Ines Krass
Dr Timothy F Chen
Dr Beata V Bajorek
Faculty of Pharmacy, University of Sydney
Chief Investigator and Author for correspondence;
Associate Professor Andrew McLachlan
Faculty of Pharmacy, University of Sydney NSW 2006; Phone (02) 9351-4452; Fax (02) 9351-4391

A community pharmacy based anticoagulant management service McLachlan, Spindler, Fois, Krass, Chen and Bajorek
11
TABLE OF CONTENTS
Section Page 1.0 Introduction 13 1.1 Warfarin in the Australian Community 13 1.2 The Challenges of Anticoagulant Therapy 13 1.3 Hypothesis 15 1.4 Aim of this study 15 1.5 Objectives 15 2.0 Literature review 16
2.1 The benefits and risks of anticoagulants 16 2.2 Balancing the risks 17 2.3 Anticoagulant Management Models 18 2.4 Pharmacists Role in Anticoagulant Management 16 2.5 Point-of-Care testing devices to measure INR 21 2.6 The Australian Experience 23
3.0 RESEARCH METHODS 25 3.1 Study Design 25 3.2 Clinical Setting 25 3.2.1 Pharmacist and general practitioner recruitment 26 3.2.1.1 Pharmacist Training 26 3.2.2 Patient Recruitment 27 3.3 Role of the Pharmacist 28 3.3.1 Patient Education 28 3.3.2 INR assessment by the pharmacist and dose considerations 29 3.3.3 General Practitioner-Pharmacist interaction 29 3.4 INR measurement and Quality control 29 3.5 Adverse Event Reporting and Stopping Rules 31 3.6 STUDY ENPOINTS and DATA ANALYSIS 31
3.6.1 Clinical Outcomes 31 (a) INR readings within the target range 32 (b) Time the INR is within target range 32 (c) Episodes of adverse events 32
3.6.2 Humanistic Outcomes 33 (a) Patient satisfaction and experiences 33 (b) Quality of Life Assessment 33 (c) Patient Warfarin Knowledge Assessment 33 (d) Pharmacist Experiences 34
3.6.3 Economic Outcomes 34 3.7 Data Management and Statistical Analyses 36 3.8 Justification of patient numbers 36 3.9 Ethical Clearance 37 3.10 Deviations from Proposed to Actual Methodology 37
3.10.1 Randomisation 37 3.10.2 Patient recruitment targets and study timeframes 37 3.10.3 Control group comparisons 38 3.10.4 General Practitioners Experiences/Feedback 39 3.10.5 Economic Outcomes 40
A community pharmacy based anticoagulant management service McLachlan, Spindler, Fois, Krass, Chen and Bajorek
12
4.0 RESULTS 41 4.1 Patients and their data 41 4.2 Pharmacists and General Practitioners 42 4.3 CLINICAL OUTCOMES 44 4.3.1 Percent of INR readings within the target range 45 4.3.2 Percent of time the INR was within target range 48 4.3.3 Episodes of warfarin-related adverse events 49 4.4 HUMANISTIC OUTCOMES 49 4.4.1 Patient satisfaction 49 4.4.2 Quality of Life Assessment 52 4.4.3 Patient Warfarin Knowledge Assessment 54 4.4.4 Pharmacist Recommendations and GP Responses 55 4.4.5 Pharmacists Experiences 56 4.5 ECONOMIC OUTCOMES 58 4.6 QUALITY CONTROL DATA 63
5.0 DISCUSSION 66 5.1 Achievements against the study objections 66 5.1.1 Improve INR control and optimise clinical outcomes 66 5.1.2 Cost effectiveness compared to usual care 67 5.1.3 Professional links 67 5.2 Justification for study design 68 5.3 Impact on Quality of Life 68 5.4 Reliability of Point-of-Care INR testing 69 5.5 Patient Knowledge of warfarin therapy 70 5.6 Comparison with published studies 70 5.7 Limitations of this study 73
6.0 CONCLUSIONS 76 REFERENCES 77 APPENDICES 81

A community pharmacy based anticoagulant management service McLachlan, Spindler, Fois, Krass, Chen and Bajorek
13
1.0 INTRODUCTION
1.1 Warfarin in the Australian Community
In Australia, warfarin is a widely used anticoagulant for the prevention and treatment
of pulmonary embolism and deep venous thrombosis and for prophylaxis of
thromboembolic events in patients with atrial fibrillation, prosthetic heart valves and
myocardial infarction [Cardiovascular Drug Guideline, 2003].
1.2 The Challenges of Anticoagulant Therapy
Warfarin has an important place in cardiology. Its use, however, is complicated by the
risk of excessive bleeding from over-anticoagulation which can be life threatening and
remains the most significant adverse event for patients receiving the drug.
Unfortunately warfarin was responsible for more than 5,000 hospital admissions in
Australia in 1999-2000 (Second National Report on Patient Safety - Improving
Medication Safety, Australian Council for Safety and Quality in Health Care, July
2002). Patients who receive an inadequate dose of warfarin are at risk of thrombotic
events which can also have serious outcomes. There is considerable variability in the
pharmacokinetics and pharmacodynamics of warfarin [Chan et al, 1994a] and a
significant risk of drug interactions [Chan et al, 1994b; McLachlan, 2000]. Vigilance
is required on the part of the patient with respect to regulating dietary intake of
vitamin K rich foods and avoiding interacting medications. For these reasons, patients
on warfarin also require routine monitoring of blood clotting status (usually measured
by the International Normalised Ratio; INR) and careful warfarin dose titration to
meet their individual requirements.
Although the risk of bleeding increases as the INR increases, about 50% of episodes
occur while the INR is lower than 4.0 [Campbell et al, 2001]. This highlights the
important role that both regular INR monitoring and patient education can play in
avoiding serious outcomes for patients receiving warfarin. Furthermore, as the
Australian population ages more “at risk” people are likely to be receiving
anticoagulant therapy with warfarin which will require greater care in dose

A community pharmacy based anticoagulant management service McLachlan, Spindler, Fois, Krass, Chen and Bajorek
14
individualisation to minimise the risk and incidence of serious adverse events
[Campbell et al, 2001].
Patients receiving warfarin report significant impacts on their quality of life [Lane and
Lip, 2005] associated with their therapy. Constant vigilance with respect to diet and
concomitant medications is necessary and significant disruption to daily living and
time management can be associated with the requirement for long-term, periodic INR
assessment. This typically includes regular visits to a pathology collection centre or
general practitioner (GP) surgery to provide a venous blood sample. Once transported
and analysed by the pathology laboratory the INR result is communicated to the
patient’s general practitioner who then contacts the patient or is contacted by the
patient to discuss dosing recommendations or management options. The patient’s
perspective in this management approach should not be overlooked and the possible
impact on the patient’s quality of life could be a contributing factor to adherence to
therapy and appropriate monitoring [Das et al, 2005; Lane and Lip, 2005]. For
example, the discomfort of regular venipuncture might be poorly tolerated or the
delay in obtaining INR results and dosing advice might be unacceptable to some
patients. So, disruption to a patient’s daily living and ultimately their quality of life
can be affected by both the blood-collection process and in the process of seeking and
receiving the INR-assessment result and associated dosage or management
recommendations.
This study seeks to address the challenges of monitoring and optimising warfarin
therapy through community pharmacists (working with general practitioners)
providing education and support to patients receiving warfarin therapy and applying a
point-of-care approach for assessing INR and communicating the INR results and
associated recommendations to patients and their general practitioner.

A community pharmacy based anticoagulant management service McLachlan, Spindler, Fois, Krass, Chen and Bajorek
15
1.3 HYPOTHESIS
A community pharmacy program to manage, monitor and educate patients on
anticoagulant therapy improves outcomes in patients receiving warfarin.
1.4 AIM OF THIS STUDY
This study aimed to develop an expanded role for the community pharmacist to work
closely with general practitioners in managing, monitoring and educating patients
receiving anticoagulant therapy with the overall goal of improving outcomes for
patients receiving warfarin.
1.5 OBJECTIVES
This project evaluated the impact of a community pharmacist managed anticoagulant
service conducted in collaboration with general practitioners on;
1. INR control, clinical outcome and quality of life of patients receiving warfarin;
2. cost analysis of the pharmacy based service compared to standard or usual care;
3. the professional links between community pharmacists and general practitioners in
providing patient care for persons taking warfarin..

A community pharmacy based anticoagulant management service McLachlan, Spindler, Fois, Krass, Chen and Bajorek
16
2.0 LITERATURE REVIEW
This literature review examines and discusses the benefits and risks of anticoagulant
therapy and establishes the basis for monitoring INR in managing patients receiving
warfarin. This section also provides a synopsis of models that have been employed to
optimise warfarin management with a detailed emphasis on the role of the pharmacist
in managing oral anticoagulation.
2.1 The benefits and risks of anticoagulant medicines and the need for routine
monitoring of anticoagulant therapy
There is clear and convincing evidence of the benefits of warfarin therapy in reducing
the morbidity and mortality associated with a range of thromboembolic conditions
[Gallus et al, 2000; Levine et al, 2001]. This evidence has been accumulated over
decades and involves many years of patient experience receiving warfarin. The most
compelling evidence has come from outcome studies that have evaluated the
predictors of anticoagulant efficacy and the risk factors for anticoagulant related
unwanted effects (related to inefficacy or excessive anticoagulation) [e.g. Jones et al,
2005]. The major clinical studies have focussed on the risk of bleeding and stroke as
key endpoints of concern.
One such study was conducted by the Swedish researchers, Oden and Fahlen [2002],
who used a record linkage study design, including 42,451 patients, 3,533 deaths, and
1.25 million INR measurements, to study how mortality differs with different
intensities of anticoagulation measured using INR. These researchers showed that
mortality from all causes of death was strongly related to level of INR and the
minimum risk of death was attained at 2.2 INR for all patients. Furthermore, a high
INR was associated with increased mortality with an increase of every 1 unit of INR
above 2.5. Figure 1 summarises the risk of mortality as identified by Oden and
Fahlen [2002] clearly demonstrating the risks associated with both under and over
anticoagulation and the need to control patients INR within the target range.

A community pharmacy based anticoagulant management service McLachlan, Spindler, Fois, Krass, Chen and Bajorek
17
Figure 1: The risk of mortality associated with INR (adapted from Oden and Fahlen,
2002)
A study by Hylek et al [1996] used a hospital-based case-control methodology to
evaluate the risk of stroke associated with different INR targets. They found that the
risk of stroke rose steeply when INR was below 2.0 and that other (less important but
significant) independent risk factors were previous stroke, diabetes, hypertension and
current smoking.
There have been a number of comprehensive evaluations of the risks and implications
of bleeding related to anticoagulant therapy [Linkins et al, 2003] and Levine et al
[2001] make the important point that anticoagulant management decisions need to
find the balance between risks of bleeding and stroke. The most important predictor of
outcome on warfarin therapy remains the INR and its control within the target range
selected according to the indication for anticoagulation [Samsa and Matchar, 2002].
2.2 Balancing the risks to optimise outcomes for patients
Clinical studies have shown that anticoagulant management programs that incorporate
patient education and regular monitoring of INR can reduce the incidence of serious
misadventure and improve patient outcomes [Chiquette et al, 1998; Knowlton et al,
1999; McCrudy, 1993]. Patients who have a poor understanding of the reason for
their anticoagulant therapy and the potential adverse events (and how they are

A community pharmacy based anticoagulant management service McLachlan, Spindler, Fois, Krass, Chen and Bajorek
18
managed) are more likely to be non-compliant when compared to patients who
receive appropriate education about anticoagulant therapy [Campbell et al, 2001].
2.3 Anticoagulant Management Models
There have been numerous investigations to explore the most appropriate model for
anticoagulant management. These models include;
Physician-based dose adjustment
Hospital-based anticoagulation clinics
Community-based anticoagulation services
Patient self-monitoring
These anticoagulant management models typically incorporate routine INR
measurement, dosing protocols, clinical management protocols (eg for excessive
anticoagulation) and patient education. The setting has varied from hospital to
community and involved a number of health-care practitioners including general
practitioners, haematologists, practice nurses and pharmacists, and patients
themselves. The stage of anticoagulation (initiation or maintenance) has also varied
between different studies.
The evaluation of these models has usually attempted to assess the clinical and
economic benefit of each model in comparison to usual care. The key endpoint
evaluated is usually the control of a patient’s INR estimated as the time the patient’s
INR is maintained within the target range.
2.4 Pharmacists Role in Anticoagulant Management
A number of studies that have focused on the role that the pharmacist can play in the
management of anticoagulant therapy have clearly identified an opportunity for
pharmacists to provide a value-added service in this area. To and Pearson [1997]
conducted the ‘Pharmacist assisted warfarin dosing program’ (PAWD) in the hospital
setting where on the request of a clinician, patients were initiated on warfarin by a
pharmacist using a dosing protocol. The PAWD program was piloted on 240 patients,

A community pharmacy based anticoagulant management service McLachlan, Spindler, Fois, Krass, Chen and Bajorek
19
and compared to 340 control patients anticoagulated in the “standard” manner. There
were no significant differences in the time taken to achieve therapeutic INR and a low
incidence of bleeding (6% versus 8%, for “control” and PAWD, respectively) and
thromboembolic events (3% versus 0%, for “control” and PAWD, respectively) was
observed in both groups. It was concluded that the PAWD program was found to be
equally safe and effective as usual care, with an improvement in the administration of
doses [To and Pearson, 1997]. Hall and Radley [1994] identified a role for the
community pharmacist in the provision of anticoagulant management in a survey of
general practitioners. Following from this, Macgregor et al [1996] established a
pharmacist-led anticoagulation clinic in a general practitioner’s surgery. Using point-
of-care testing, this service maintained 90% of INR results within the therapeutic
range. Elderly and disabled patients felt that they benefited from this service, where
tailored counselling by the pharmacist improved their knowledge of treatment, and
decreased travel requirements resulted in financial savings for patients [Macgregor et
al, 1996].
One of the largest studies to evaluate the role of pharmacists in anticoagulant
management was recently published by Witt et al [2005]. This study explored the
impact of a Clinical Pharmacy Anticoagulation Service (CPAS) provided in a health
maintenance organisation. Witt et al [2005] followed 6,645 patients for 6 months
using a retrospective observational cohort study design with approximately half of the
patients in the intervention group that received the CPAS. These researchers found
that the involvement of pharmacists lead to a 39% reduction in anticoagulant-related
complications and this was a result of improved INR control. For patients receiving
the CPAS their INR was within the target range for 64% of the time compared to 55%
for the control group (p<0.001). As a result of these findings this service was
recommended for widespread implementation.
Pharmacists have successfully taken on some of the more challenging aspects of
anticoagulant management. Dager et al [2000] used a prospective study (with a
matched historical control cohort) to study the impact of hospital pharmacists on
patient outcome during initiation of warfarin. They found that during warfarin
initiation in hospital daily consultation by a pharmacist decreased the length of
A community pharmacy based anticoagulant management service McLachlan, Spindler, Fois, Krass, Chen and Bajorek
20
hospital stay and the need for treatment for excessive anticoagulation in patients
starting warfarin for the first time. These observations support the improvement in
patients outcome and are likely to translate to economic benefits. Witt and Humphries
[2003] (in an earlier study to the one described above) investigated the management
that pharmacists provide in dealing with excessively anticoagulated patients (INR>6)
as part of the centralised telephone Clinical Pharmacy Anticoagulant Service. These
researchers found that the management provided by pharmacists as part of the service
lead to improved clinical outcomes when compared with traditional management.
These data are supported by a Canadian study which compared the INR control
achieved by trained pharmacists (using a warfarin nomogram to make patient
management decisions) compared to physician management in 227 patients being
initiated on warfarin following prosthetic value surgery [Tschol et al, 2003].
Pharmacists were able to achieve equally safe and effective INR control in this patient
group.
Boddy [2001] reported on a study which showed that in the hospital setting
haematology pharmacists were better than clinicians in maintaining patients within
their target INR range during initiation of warfarin therapy. This researcher also found
that pharmacists recommendations lead to timely dose administration and the need for
few INR measurements which had benefits through associated cost reduction and
patient acceptability.
Relatively few studies of anticoagulant management have been conducted in a
community pharmacy setting. Holden and Holden [2000] compared pharmacist- and
general practitioner-managed anticoagulation in a community outreach service in the
United Kingdom. Using a retrospective analysis these researchers compared data on
proportion of time within the INR target range for 51 patients using 1782 INR
measurements. These researchers found that the pharmacy-managed service, which
maintained 73 17 % of the INR readings within the target range (INR 2-3), was not
inferior to general practitioner-managed anticoagulation which achieved 65 17 % of
INR readings within range. In another community pharmacy-based study, Knowlton
et al [1999] evaluated the impact of anticoagulant education and monitoring (with a
point-of-care INR testing device) in 26 patients using an observational study design.

A community pharmacy based anticoagulant management service McLachlan, Spindler, Fois, Krass, Chen and Bajorek
21
These workers showed that pharmacist-management could maintain patients within
their target INR 75% of the time.
Any anticoagulant management services must be able to be delivered in a cost
effective manner. Anderson [2004] conducted a cost analysis of a decentralised
outpatient pharmacy anticoagulant service (involving laboratory INR testing). The
costs associated with delivering the pharmacy service and the associated effectiveness
(based on INR control) was evaluated using data from 92 patients in a managed care
setting in the USA. This comprehensive analysis of the costs to deliver such a service
and comparison with the costs associated with managing warfarin complications (such
as stroke) showed that the pharmacist-managed service was relatively inexpensive
compared to managing the complications of ischemic stroke or intracranial bleeding.
In summary, these data provide strong support for pharmacist involvement in
anticoagulant management to ensure optimal monitoring and patients’ outcomes.
2.5 Point-of-Care testing devices to measure INR
The availability of point-of-care INR testing devices which use capillary blood to
determine prothrombin time and INR have facilitated the expansion of available
anticoagulant management models into the community. In recent years there have
been a number of point-of-care INR testing devices available for use in anticoagulant
management. The utility of these devices has been evaluated in a variety of settings
including monitoring by pharmacists and self-monitoring by patients.
One of the issues that is central to the clinical utility of point-of-care INR testing
devices is the need for acceptable accuracy and reliability of INR readings. There
have been a number of important studies which have assessed the performance of the
available point-of-care testing devices for INR measurement [including Douketis et
al, 1998; Murray et al, 1999; Jackson et al, 2004c, 2004e]. A recent study by Poller et
al [2003] compared the INR determined using two widely used point-of-care testing
(POCT) prothrombin time (PT) monitors (CoaguChek Mini and TAS PT-NC)
compared to conventional methods in 600 samples collected from patients. The

A community pharmacy based anticoagulant management service McLachlan, Spindler, Fois, Krass, Chen and Bajorek
22
authors found that one device over estimated the “true” INR by 15.2 % (95% CI; 13.4
to 17.0%) whereas the other device investigated displayed a deviation of -7.1 % (95%
CI; -8.9 to -5.4 %). These deviations from the “true” laboratory determined INR have
been attributed to a combination of differences in the calibration of the device (by the
manufacture), instrument error and operator error. In real terms these differences
equate to a 0.4 and 0.2 unit difference in INR for a patient with an INR reading in the
target range of 2 to 3.
An associated BMJ Editorial by Murray and Greaves [2003] puts some of these
results into perspective suggesting that the discrepancy in INR between point-of-care
systems and laboratory measurements is important but not surprising. These workers
confirm that it highlights the need for standardisation of point-of-care testing monitors
and improved quality assurance procedures. The balance of published clinical studies
that have employed point-of-care testing of INR suggest that these devices can be
effective in clinical practice. For example, a study involving 336 tests collected over 6
months by Fitzmaurice et al [2002], which used a point-of-care testing device
evaluated by Poller et al [2003], found no difference in the clinical outcome of
patients compared to patients receiving usual care. Murray and Greaves [2003]
highlight the importance of considering the difference between statistical and clinical
significance in anticoagulant decision making with respect to dose adjustments. This
was also discussed by van den Besselaar [2001] who concluded that point-of-care
testing devices provide less precise estimates of INR (when compared to automated
laboratory standards) but this should be weighed against the “clinical advantages” of
near patient testing. This author did highlight the importance that internal and external
quality control programs can offer for reliability but acknowledged the different
nature of quality control (QC) materials required for point-of-care INR testing
devices, which might not reflect a patient sample. All contributors to this debate
concede that larger studies are needed to exclude significant clinical differences in
outcome from using point-of-care testing devices to monitor anticoagulation.
However, at this stage it is clear that these devices do offer great promise for use in
the primary-care setting with the opportunity to streamline patient management and
improve quality of life [Murray and Greaves, 2003]

A community pharmacy based anticoagulant management service McLachlan, Spindler, Fois, Krass, Chen and Bajorek
23
2.6 The Australian Experience
There is clear evidence that adverse events related to warfarin represent a significant
burden to the Australian healthcare system (Runciman et al, 2003) and there are
barriers to the increase in utilisation of warfarin in some patient groups (Peterson et
al, 2002). This has lead to a call by Halstead et al (1999) to improve anticoagulant
management through actions such as the assessment of home- and practice-based
anticoagulant monitoring.
There have been a number of studies that have evaluated the impact of different
anticoagulant models in the Australian healthcare setting. Jackson et al [2004a] have
highlighted the important role that pharmacists can play in monitoring anticoagulant
therapy using a point-of-care INR testing device. Using a series of case studies these
researchers have made a clear case for “pharmacist-assisted anticoagulant monitoring”
in rural communities where there is limited access to pathology services. An essential
part of this service has been to evaluate and promote the need for quality use of
medicines in this area to optimise the outcome of patients with atrial fibrillation
[Jackson et al, 2004b; 2004d]. These workers also conducted a systematic evaluation
of the accuracy and clinical utility of the Coaguchek S point-of-care testing device
used in their studies [Jackson et al, 2004c; 2004e]
This “promise” of benefit that point-of-care testing devices can offer for patients on
warfarin has been highlighted in another Australian study. Jackson et al [2004c]
conducted a trial in a rural setting utilising 15 general medical practices involving data
from 169 patients to compare the performance of the point-of-care testing device to
laboratory-based INR measurements. The authors found that the point-of-care INR
testing device was accurate compared to laboratory INR readings. An important
aspect of this study was that the authors confirmed that the minor differences in INR
readings (90% were with 0.5 INR units) would not have lead to differences in the
clinical management decisions for people taking warfarin. Jackson et al [2004c] also
noted that, when used with appropriate training and a quality assurance program, the
point-of-care testing device provided a significant opportunity to optimise
A community pharmacy based anticoagulant management service McLachlan, Spindler, Fois, Krass, Chen and Bajorek
24
anticoagulant therapy in rural and remote communities where timely access to
pathology services may be limited.
Home visitation by a pharmacist after discharge from hospital was evaluated by
Jackson et al [2004d] using a randomised controlled trial involving 128 patients
initiated on warfarin and discharged from hospital into the care of their general
practitioner. They studied the impact of home monitoring by a pharmacist compared
to usual care. The results of this study highlighted an important role for pharmacists in
this area by demonstrating that home visits and the use of point-of care INR testing
improved INR control (within the target range) and reduced haemorrhagic
complications.
In summary, there is comprehensive evidence supporting the need for regular INR
assessment and patient education as key determinants of the clinical outcome for
patients receiving anticoagulants. There are a number of anticoagulation management
models that have been evaluated and each offers potential benefits to patients.
Importantly, there is strong evidence supporting the utility of point-of-care INR
testing devices. The role of the pharmacist in anticoagulant monitoring and
management has been evaluated in international and Australian studies. However,
there are relatively few studies that have evaluated the role of community pharmacists
working with general practitioners to deliver anticoagulant management service.
A community pharmacy based anticoagulant management service McLachlan, Spindler, Fois, Krass, Chen and Bajorek
25
3.0 RESEARCH METHODS
3.1 Study Design
This study was originally designed as a prospective, controlled evaluation of a
pharmacist-general practitioner managed anticoagulation service using a staggered
parallel design involving pre- and post-intervention assessment of coagulation status
(INR) and clinical and quality-of-life endpoints. Patients in the intervention group
were to receive anticoagulant management from their pharmacist in collaboration with
their general practitioner using a point-of-care INR testing device. Patient recruited
into the control group were to receive their usual care (i.e they were managed
essentially by their general practitioner using standard pathology laboratory INR
testing). Patients were recruited through community pharmacies and two groups of
pharmacies were to be involved; those providing the education, INR-testing and
warfarin management service and those who provided usual care.
As the study progress adequate numbers of pharmacies and patients could not be
recruited into the control arm of the study, despite the implementation of a variety of
strategies to facilitate and promote control-group recruitment. To allow a comparison
between usual care and the study intervention, clinical data were collected, pertaining
to a period (3-12 months) prior to recruitment into the study, for patients in the
intervention group. These data provide a pre- intervention dataset. The limitations of
this revised design are discussed later in this report.
3.2 Clinical Setting
This study was conducted in community pharmacies and general practices across the
greater Sydney metropolitan area.

A community pharmacy based anticoagulant management service McLachlan, Spindler, Fois, Krass, Chen and Bajorek
26
3.2.1 Pharmacist and general practitioner recruitment
A random sample of pharmacists in the greater Sydney metropolitan area were sent
invitations to participate in the study by letter and also recruited at Pharmacy
Continuing Education functions. Pharmacists were provided with a participant
information sheet and consent form (Appendix 1). Pharmacists who expressed an
interest in participating were invited to an educational seminar on anticoagulation
management and provided with information about the project. Before confirmation of
participation pharmacists were asked to give assurances that they could:
(a) recruit up to 10 patients receiving warfarin;
(b) ensure a physical environment and pharmacy-staffing profile in their
pharmacy that was conducive to providing services to patients participating in
the study for 12 months.
The original study plan was to recruit 5 pharmacies each into the Intervention and
Control arms of the study and each pharmacy would recruit 10 patients each.
However, due to slow progress in recruiting patients, another 3 pharmacies were
recruited to boost patient enrolment into the Intervention arm of the study.
General practitioners, of the patients interested in participating in the study, were
contacted by the pharmacist and provided with study information sheet and a consent
form (Appendix 2). General practitioners were given the opportunity to seek
clarification of any aspect of the study and additional information was provided on
several occasions by the investigators.
3.2.1.1 Pharmacist Training
Pharmacists participating in the intervention arm attended one and half days of
specialised pharmacy education which included;
information about the clinical use of warfarin with a focus on its use in the
community, importance of routine monitoring, dose adjustment, patients
education aids, dietary factors and drug interactions;

A community pharmacy based anticoagulant management service McLachlan, Spindler, Fois, Krass, Chen and Bajorek
27
skills training in counselling patients receiving warfarin;
instruction on appropriate procedures for collection and disposal of capillary
blood samples;
training in the use of the INRatio point-of-care testing device for monitoring
INR; and
an overview of the study protocol and associated data collection forms.
Further details of this training are provided in Appendix 4.
Once pharmacists consented to participate the study Project Officer visited each
pharmacy and provided onsite training in the use of the point-of-care INR testing
device and the data collection tools used in this study.
3.2.2 Patient Recruitment
It was planned to recruited a total of 100 patients (50 into each study arm) receiving
long-term warfarin therapy. Candidates were identified at the pharmacy and recruited
via referral from their general practitioner. Patients were approached directly by the
pharmacist and provided with an approved information sheet and asked to discuss this
with their general practitioner and pharmacist (Appendix 3). The study investigators
were not directly involved in patient recruitment but did provide further information
and resources to participating pharmacists to assist them in responding to questions
from patients and general practitioners.
The specific inclusion criteria for patients were:
Patients undergoing long-term warfarin therapy (longer than 12 months);
Patients receiving community-based care;
General practitioner referral and consent to participate
The exclusion criteria for patients were:
Patients receiving short term warfarin therapy (less than 12 months);
Patients with a known contraindication to warfarin;
Patients for whom their medication is administered and managed by a carer;
Patients from non-English speaking backgrounds or patients unable to give
informed consent in English.

A community pharmacy based anticoagulant management service McLachlan, Spindler, Fois, Krass, Chen and Bajorek
28
3.3 Role of the Pharmacist
In this study pharmacists actively recruited patients and facilitated the provision of
information to patients and general practitioners. Pharmacists co-ordinated the
“consenting” of patients and general practitioners. It was planned that pharmacists
would see patients at least once per month to check their INR, advise them on dietary
and lifestyle issues, and monitor adherence to the prescribed regimen.
During the patient’s first visit the pharmacist collected a detailed medical and
medication history. The pharmacist also administered a quality of life questionnaire
[Sawicki, 1999] and warfarin knowledge assessment tool [Walters and Bajorek,
2005]. The latter was used as a basis for tailoring initial patient education (see
Appendices).
The protocol for pharmacist activities in the intervention arm of the study is presented
in Appendix 6(a).
During each subsequent pharmacy visit the pharmacist provided additional patient
education (as required), monitored INR (using the point-of-care INR testing devices)
and made dosage recommendations in consultation with the patient’s general
practitioner. The details of these sessions where documented by pharmacists in each
patient’s file. Results and pharmacist’s recommendations were communicated to the
patient’s general practitioner for vetting, discussion and decision.
3.3.1 Patient Education
Patient education was provided to patients in this study by the pharmacist. On entry
into the study patient warfarin knowledge was assessed and education was provided to
fill in the gaps in the patient’s knowledge. This was re-enforced at each pharmacy
visit. A customised patient education booklet (successfully used in a previous study;
Bajorek, 2002) was provided to patients and employed in the patient education
sessions. A copy of the booklet is provided in Appendix 5.
A community pharmacy based anticoagulant management service McLachlan, Spindler, Fois, Krass, Chen and Bajorek
29
3.3.2 INR assessment by the pharmacist and dose considerations
INR results were assessed at least once per month. The frequency of INR monitoring
was at the discretion of the pharmacist and general practitioner based on the clinical
needs and observations in individual patients. This was dependent on the clinical signs
a patient was exhibiting, pharmacist assessment of compliance, whether a dose change
had been initiated or concomitant medicines started or stopped.
The result of the INR assessment (and any associate quality control data) was
recorded and the pharmacist made a recommendation about patient management
which was communicated to the general practitioner for consideration. Dose
recommendations were only implemented once they have been approved by the
patient’s general practitioner. In this study pharmacists were given (and trained in the
use of) a previously published warfarin dosing protocol which had been developed
and evaluated by Foss et al [1999]. A copy of the dosing protocol adapted for this
study is presented in Appendix 6(b).
3.3.3 General Practitioner-Pharmacist interaction
Dosing suggestions or monitoring recommendations made by the pharmacist were
immediately communicated to the patient’s general practitioner for vetting or
discussion by fax. No action was taken until the consent of the general practitioner
was obtained, even if by phone and later confirmed by fax. The pharmacist recorded
the outcome of the recommendations and the action recommendation by the general
practitioner. Appendix 7 contains the forms used by the pharmacists in the study to
communicate their recommendations to the general practitioners.
3.4 INR measurement and Quality control of the INRatio device
In this study the INRatio device, made by Hemosense Inc (USA) and supplied by
Point-of-care Diagnostics Pty Ltd in Australia, was employed in the intervention arm
for point-of-care INR testing. This device uses test strips that require capillary blood
and the device reports the International Normalised Ratio (INR). The test strips

A community pharmacy based anticoagulant management service McLachlan, Spindler, Fois, Krass, Chen and Bajorek
30
include a high and low quality control (QC) sample to assess prothrombin time which
serves as an internal quality control assessment.
Quality control of the device not only covers procedural (operator) error and
degradation of test strips, but also environmental factors that may cause sample
degradation. The INRatio device has an electronic self-checking system to check for
errors relating to temperature, humidity, current fluctuation and inadequate sample.
The test strip has three testing channels for the (i) patient’s sample, and for (ii) high
and (iii) low quality controls. These controls test for reagent validity, to ensure that
improper storage of the strips has not occurred and does not affect the patient’s
results. The controls are activated at the same time as the patient test is performed,
since the sample is used as a catalyst for activation of the reaction within the controls.
If there is any problem with any of the quality control results, the patient’s INR will
not be displayed by the device. Instead, it will display a “QC” error message.
In November 2004, 9 months after the commencement of the project, the Pharmacy
Guild of Australia funded an upgrade of the software of the INRatio devices being
used in the study. Hence, an internal quality control program was established for the
pharmacies involved. Each pharmacy was provided with test strips from an identical
batch for use in future INR determination. The low and high prothrombin time QC
data were recorded and collected on the EDCNet website (coordinated by National
Serology Reference Laboratory, Australia). This provided an independent data
management and recording framework for the internal QC program.
The feasibility of using an External Proficiency Testing program for pharmacies was
investigated but was not available at the time this study was conducted because of the
lack of availability of QC capillary (as opposed to venous) blood samples for
distribution and evaluation.
INR data were collected retrospectively in the control arm and pre-intervention period
of the study. The INR data were collected retrospectively from general practitioners
and their clinical record by pharmacists or the study project officer via a direct
approach. Clinical information was not collected from the pathology provider but only
A community pharmacy based anticoagulant management service McLachlan, Spindler, Fois, Krass, Chen and Bajorek
31
released by the patient’s general practitioner under the strict consenting protocol used
in this study. Patients were not directly approached by the researchers.
3.5 Adverse Event Reporting and Stopping Rules
The study incorporated checks to assess the possible risks to each patient. It was
important to note that;
1. Patients remained the in care of their general practitioner at all times in the study,
meaning that any adverse event would be identified by the patient, general
practitioner or pharmacists and appropriate medical management would result;
2. Pharmacists received training to recognised the signs of adverse events (due to
both sub-therapeutic or supra-therapeutic INR) and what to do if these occurred;
3. The protocol used in this study by pharmacists for making dose recommendations
for consideration by the general practitioner has a clear procedure for dealing with
low or high INR readings (Note: dose recommendations were only implemented
once they have been approved by the patient’s general practitioner);
4. Any adverse events related to the performance of the device would be reported via
the TGA IRIS Medical Device Incident Report Investigation Scheme.
3.6 STUDY ENPOINTS and DATA ANALYSIS
A broad evaluation plan including clinical, humanistic and economic measures was
developed. In the Intervention arm of the study these data were recorded in a
prospective manner from pharmacy, pathology laboratory and physician records.
These data were collected retrospectively for the Control phases of the study. Data
collection sheets used in this study are presented in Appendix 8. The following
sections describe these outcomes.
3.6.1 Clinical Outcomes
In the intervention study arm pharmacists recorded all relevant clinical data including
INR results. In the control arm and pre-intervention period the clinical data, such as
INR results, were obtained and recorded by pharmacists and general practitioners

A community pharmacy based anticoagulant management service McLachlan, Spindler, Fois, Krass, Chen and Bajorek
32
after a direct approach from the study project officer. At no time was clinical data
directly obtained from pathology providers or from patients by the research team. (a) INR readings within the target range
The number of INR readings within, below and above the patient-specific INR target
range (± 0.1) were counted and expressed as a percentage of the total number of INR
measurements collected for each patient during the study periods. The INR data for
individual patients in the Intervention and Pre-intervention periods or Control arm
were included if the patient contributed data for at least 3 months or they has at least 4
INR readings recorded.
(b) Proportion of Time the INR is within target range
Since the control of INR has been shown to correlate with a reduction in
complications [Samsa and Matchar, 2000], the measure of effectiveness used in this
study was based on the proportion of time (expressed as a percent) a patient’s INR
was maintained within the target INR range. This was determined for each patient
using their individual INR target range (± 0.1), INR observations and the time
(expressed in days) that INR measurements were within, below and above the
specified range. The calculation of time a patient’s INR was within range was
calculated using the linear interpolation method described by Rosendaal et al (1993).
This approach assumes that the INR changes in a linear manner between each INR
observation. The INR target range was specific for each patient and in these
calculations was considered to as ± 0.1. For example, the INR readings of a patient
with a target range of INR 2 to 3 was evaluated against the range 1.9 to 3.1.
(c) Episodes of adverse events including both haemorrhagic and
thromboembolic events
These were recorded in patient interviews by the pharmacist and investigators (at the
end of the study) and in medical records held by the general practitioner.
A community pharmacy based anticoagulant management service McLachlan, Spindler, Fois, Krass, Chen and Bajorek
33
3.6.2 Humanistic Outcomes
(a) Patient satisfaction and experiences
The patient satisfaction with the pharmacy-general practitioner managed
anticoagulant service was evaluated using a qualitative semi-structured interview with
patients conducted by telephone. These were conducted by investigators (not the
pharmacist) at the end of the project. The aim was to yield detailed information about
the patient’s experiences and the perceived benefits of the “pharmacy-general
practitioner” versus “general practitioner – pathology lab” services.
(b) Quality of Life Assessment
A structured questionnaire (specific for patients receiving anticoagulants) was used to
assess quality of life on entry to the study and on completion of intervention arm of
the study and on 2 occasions for patients in the Control arm [Sawicki, 1999]. The
questionnaire is validated and disease specific and covers 5 treatment related domains
over 32 questions. The domains are “medical treatment satisfaction, self efficacy,
general psychological distress, daily hassles and strained social network”. The
questionnaire uses a Likert-type scale for patients to respond with answers ranging
from ‘does not apply’ to ‘applies fully’. Each domain yields a score which is an
average out of 6 since each patient is given 6 options on the scale. As the instrument
is a self-completion questionnaire, this minimises potential bias from the pharmacist.
This tool was developed and validated by Sawicki [1999] and has been successfully
used by other researchers [Cromheecke et al, 2000]. A copy of this questionnaire is
included in Appendix 9.
(c) Patient Warfarin Knowledge Assessment
A previously validated questionnaire was employed to evaluate patient knowledge
and understanding of their warfarin therapy [Walters and Bajorek, 2005]. This was
administered at the beginning and end of the intervention arm of the study. It was
used as a tool to identify gaps in a patients knowledge which the pharmacist was

A community pharmacy based anticoagulant management service McLachlan, Spindler, Fois, Krass, Chen and Bajorek
34
encouraged to discuss with their patient. A copy of the questionnaire is presented in
Appendix 10.
(d) Pharmacist Experiences
The experiences of pharmacists in the study were evaluated at the end of the study
using a written open ended feedback sheet.
3.6.3 Economic Outcomes
(a) Cost to Deliver the Service
A cost analysis was conducted to identify the estimated costs required to deliver the
pharmacy-general practitioner managed anticoagulant service (as conducted in the
intervention). This was compared to the cost of usual care of patients managed by
their general practitioner assuming patients visit a pathology collection centre for
blood collection as a Medicare subsidised patient. Indicative costs were calculated to
determine the costs associated with delivering the intervention or usual care to 10
patients over the first and subsequent years of provision of this service. Acquisition
costs for equipment were obtained from the Point-of-care Diagnostics Pty Ltd (valid
for 2004). Pathology costs were obtained from the Royal Australian College of
Pathologist website (section of the Medical Benefits Schedule for pathology)
www.rcpamanual.edu.au/sections/mbsrestrictions.asp?#1. Pharmacist wages used in
these calculations were set at two levels (i) award wage of a Pharmacist-in-Charge
obtained from the Pharmacy Guild of Australia (11 June 2004) and (ii) set at $65 per
hour recognising that anticoagulant services would be provided by pharmacists with
considerable experience and training. In the cost analysis of usual care 4 general
practitioner visits per year and in the pharmacist-managed anticoagulation service 2
GP visit per year were included. This is based on the patient’s GP ordering 6 INR
requests at a time. The cost associated with the general practitioner’s time in
evaluating dose recommendations was not included because this time is likely to be
the same independent of the model of anticoagulant management.

A community pharmacy based anticoagulant management service McLachlan, Spindler, Fois, Krass, Chen and Bajorek
35
(b) Medical Benefits Schedule Expenditure
In order to evaluate the health care costs related to warfarin management in the 6
months prior to entering the study (“pre-intervention”) and up to 12 months in the
study (“intervention”) information was obtained from the Health Insurance
Commission (HIC). Ethical clearance was obtained from the HIC and informed
(signed) consent was obtained from patients who were willing to contribute Medicare
data to the study. Details of patient-specific items and expenditure on the Medicare
Benefit Schedule (MBS) were evaluated of the 6 month pre-intervention and 12
month intervention period was provided by the HIC. The data were analysed to allow
three comparisons, which were the;
Total MBS expenditure per patient per month;
Expenditure on “anticoagulant management” per patient per month;
Actual INR measurements, GP visits and Pathology collections per patient per
month.
Items associated with INR measurement, pathology sample collection and general
practitioner visits were identified using codes from the Medicare Benefits Schedule
(MBS) (www7.health.gov.au/pubs/mbs/).
Statistical comparisons were made between the “pre-intervention” and “intervention”
data. The frequency of INR measurements during the pre-intervention stage was also
compared to the frequency of visits to the pharmacy for point-of-care INR testing.
Both comparisons were made with a paired Student t-test. The number of INR
readings per month was compared between the pre-intervention period with the
frequency of INR measurements made by pharmacists during the intervention phase.

A community pharmacy based anticoagulant management service McLachlan, Spindler, Fois, Krass, Chen and Bajorek
36
3.7 Data Management and Statistical Analyses of Endpoints
The data were collated and analysed using Excel (Microsoft) and SPSS (Version
11.5). In this study comparisons were made using patient clinical and humanistic data
obtained from patients in the;
Intervention – prospectively collected data from patients who received
anticoagulant management by pharmacists in collaboration with general
practitioners.
Pre-intervention – retrospectively collected data from patients receiving usual
care prior to the intervention.
Control – retrospectively collected data from patients who received usual care
over the same time frame as the separate groups of patients received the
intervention.
Humanistic endpoints such as quality of life and warfarin knowledge were compared
on entry into the study and at the completion of the study for patients in the
intervention group and on 2 occasions for the control group.
A paired test with unequal variance (and Bonferroni correction) was employed to
compare clinical and humanistic endpoints between the intervention and pre-
intervention datasets. The quality of life questionnaire scores were not normally
distributed and a before and after comparison was conducted using a Wilcoxon
Signed Ranks test. Patient warfarin knowledge scores on entry and exit from the study
were compared using repeated measures analysis of variance. All analyses were
conducted at a significance level of 0.05.
3.8 Justification of patient numbers
The target number of patients in the original study was selected to allow this study to
detect a 15% change in the proportion of INR measurements within the target range
with 80% power (=0.05). This calculation assumes at baseline that 20% of patients
are likely to have INR measurements outside the range at baseline [Cromheecke et al,
2000] and assumes that at least 300 INR measurements will be compared during the

A community pharmacy based anticoagulant management service McLachlan, Spindler, Fois, Krass, Chen and Bajorek
37
stages of this study (ie, at least 3 INR levels from each patient). Given the revised
nature of the final study design the issue of study power is discussed later in this
report (Section 5.7).
3.9 Ethical Clearance
This study was approved by the Human Research Ethics Committee of the University
of Sydney (Protocol 6653). Patients could withdraw from the study at any time or the
consent of the patient’s general practitioner could be withdrawn at any time. 3.10 Deviations from Proposed to Actual Methodology
3.10.1 Randomisation
The original plan was to conduct a randomised control trial in which pharmacies were
recruited and then randomly allocated to intervention or control arm. The plan was
that pharmacists would then randomly recruit patients receiving warfarin from their
practices. Due to very slow recruitment randomisation was not possible if the study
was to be successful in recruiting adequate pharmacists and patients within the time
frame of the funding agreement. The exact reason for the slow recruitment of
pharmacists is unclear but factors affecting recruitment are described and discussed in
the Sections 4.2 and 5.7 of this report.
3.10.2 Patient recruitment targets and study timeframes
The original study plan was to recruit 50 patients into each study arm and follow these
patients for 12 months of the study representing a total of 100 patients recruited from
10 pharmacies. These targets were set based on the need to collected adequate INR
observations over an adequate time frame to ensure meaningful assessment of clinical
outcomes using the apriori assumptions. This study (despite a continuing and active
recruitment process) did not achieve the patient target numbers. However, the number
of INR readings and months of patient experience on warfarin did allow a meaningful
assessment of patient outcome associated with the intervention arm of the study.

A community pharmacy based anticoagulant management service McLachlan, Spindler, Fois, Krass, Chen and Bajorek
38
The combined data set contains data from 53 patients, 758 INR measurements and
537 pharmacist recommendations about anticoagulation. Collectively these data
represented approximately 40 years of patient experience on warfarin.
3.10.3 Study group comparisons and data analysis
Despite continued efforts involving different strategies, slow recruitment was a major
issue which affected the timeliness and size of the final study patient cohort. This led
to a change in the study protocol (with the permission of the Pharmacy Guild of
Australia) to allow three sets of clinical data to be collected. These are defined below;
Intervention – prospectively collected data from patients who received INR
management by pharmacists in collaboration with general practitioners.
Pre-intervention – retrospectively collected data from patients prior to the
intervention.
Control – retrospectively collected data from patients who received usual care
over the same time frame as the separate groups of patients received the
intervention.
The aim of the Control arm was to capture clinical and humanistic data on patients
who received usual care (ie anticoagulant management by general practitioners with
INR monitoring by a pathology laboratory). The original purpose was to allow a
parallel group comparison to data collected the intervention cohort. In the end, the
issues of;
Poor recruitment in the control arm of the study; and,
The challenges of combining a mixture of retrospective and prospective data;
meant that a comprehensive comparison of the control and intervention cohort could
not be justified.
However, in evaluating the utility of a pharmacist managed anticoagulant service
conducted in close collaboration with general practitioner the limited data collected
from the control arm of the study (combined with similar data from the literature) do

A community pharmacy based anticoagulant management service McLachlan, Spindler, Fois, Krass, Chen and Bajorek
39
provide some basis for a limited assessment of patient outcome while receiving the
intervention.
The descriptive statistics of the clinical endpoints for the available patients in each of
the three data sets were presented and summarised.
Formal statistical comparisons were made between the clinical (portion of time INR
readings are in range), humanistic and economic endpoint for selected patients in the
pre-intervention and intervention. This revised statistical comparison only includes
patients who provided pre-intervention INR data (up to 6 months) and intervention
INR data. The focus of the statistical analysis related to a comparison of the primary
clinical outcome “proportion of time that INR readings were within, above and below
the target INR range for that patient”. A paired t-test was employed to compare pre-
intervention and intervention data.
Note: It was not possible to include retrospectively collected pre-intervention INR
data for the exact same time period for each patient due to the naturalistic manner in
which these data were collected. Patients who had at least 3 months or 4 INR readings
before the intervention were included in this sub-group. INR readings beyond 6
months pre-intervention were not included in the analysis.
3.10.4 General Practitioners Experiences/Feedback
At the time of report writing no feedback from general practitioners had been received
although this had been requested (and reminders sent) on at the completion of the
study (February, 2005).
A community pharmacy based anticoagulant management service McLachlan, Spindler, Fois, Krass, Chen and Bajorek
40
3.10.5 Economic Outcomes
The planned incremental cost effectiveness analysis was not performed. An
assessment of the costs associated with delivering the pharmacist-general practitioner-
-managed service was estimated and compared to the cost of the general practitioner-
pathology services. A comparison of the Medical Benefits Schedule Expenditure
obtained through the Health Insurance Commission for selected patients during the
pre-intervention and intervention periods was also presented (as outlined in Section
3.6.3 b).

A community pharmacy based anticoagulant management service McLachlan, Spindler, Fois, Krass, Chen and Bajorek
41
4.0 RESULTS
The Results section will firstly describe the characteristics of the patients, pharmacists
and general practitioner who participated in this study to provide an overview of the
cohort that has been studied.
4.1 Patients and their data
This study followed the outcomes of pharmacist-general practitioner managed
anticoagulation (intervention group) in 41 patients for an average of 8.2 3.7 months
(range; 1 –13 months) representing a cumulative patient experience of 27.3 patient
years and 524 INR measurements. The pre-intervention data were obtained from 20
(of 41 intervention patients) with 142 INR observations collected over an average of
4.8 3.7 months representing a cumulative experience of 8 patient years. The control
data consisted of 92 INR readings collected from 6 (of the 12) patients who were
followed for a period of 9.5 3.7 months (cumulative experience of 4.7 patient
years). The demographic data for the patients in this study are presented in Table 1.
This patient cohort was elderly, predominantly male with atrial fibrillation and had
been receiving maintenance warfarin therapy for an average of 4 years.
Appendices 11(a) and 11(b) describe the individual patient clinical and demographic
characteristics and Appendix 12 provides a summary of patients recruited into the
study and the data they contributed.
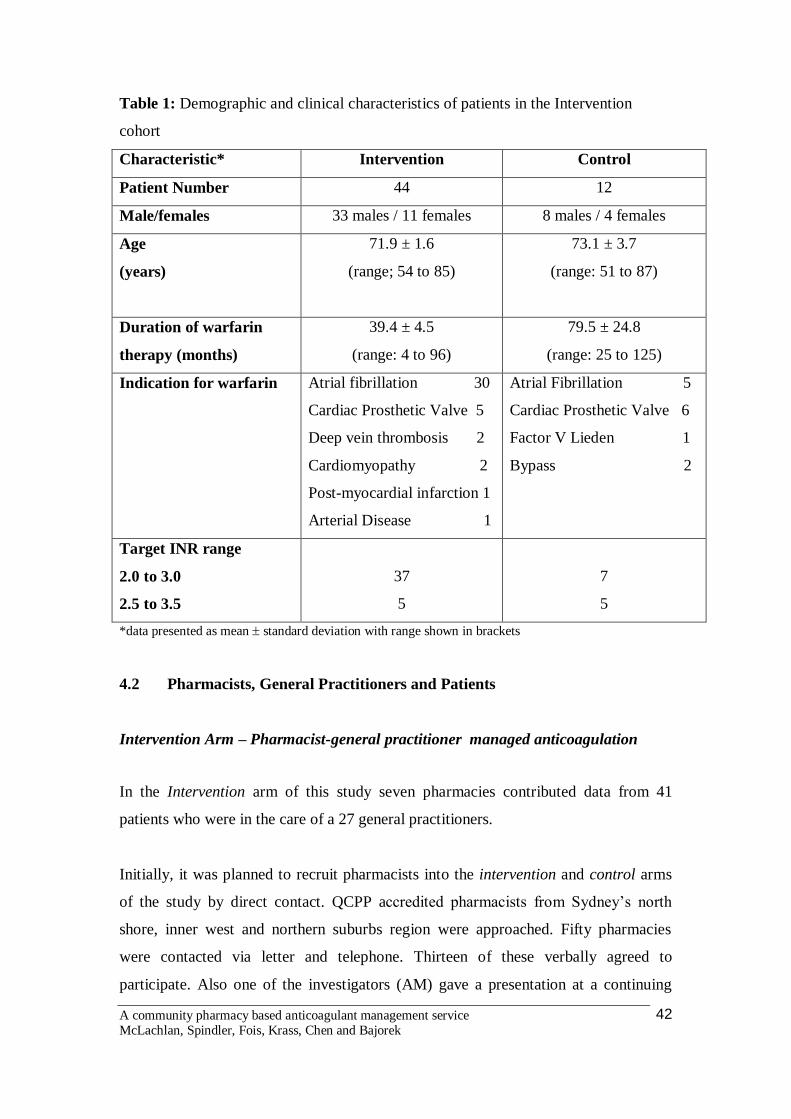
A community pharmacy based anticoagulant management service McLachlan, Spindler, Fois, Krass, Chen and Bajorek
42
Table 1: Demographic and clinical characteristics of patients in the Intervention
cohort
Characteristic* Intervention Control
Patient Number 44 12
Male/females 33 males / 11 females 8 males / 4 females
Age
(years)
71.9 ± 1.6
(range; 54 to 85)
73.1 ± 3.7
(range: 51 to 87)
Duration of warfarin
therapy (months)
39.4 ± 4.5
(range: 4 to 96)
79.5 ± 24.8
(range: 25 to 125)
Indication for warfarin
Atrial fibrillation 30
Cardiac Prosthetic Valve 5
Deep vein thrombosis 2
Cardiomyopathy 2
Post-myocardial infarction 1
Arterial Disease 1
Atrial Fibrillation 5
Cardiac Prosthetic Valve 6
Factor V Lieden 1
Bypass 2
Target INR range
2.0 to 3.0
2.5 to 3.5
37
5
7
5
*data presented as mean standard deviation with range shown in brackets
4.2 Pharmacists, General Practitioners and Patients
Intervention Arm – Pharmacist-general practitioner managed anticoagulation
In the Intervention arm of this study seven pharmacies contributed data from 41
patients who were in the care of a 27 general practitioners.
Initially, it was planned to recruit pharmacists into the intervention and control arms
of the study by direct contact. QCPP accredited pharmacists from Sydney’s north
shore, inner west and northern suburbs region were approached. Fifty pharmacies
were contacted via letter and telephone. Thirteen of these verbally agreed to
participate. Also one of the investigators (AM) gave a presentation at a continuing

A community pharmacy based anticoagulant management service McLachlan, Spindler, Fois, Krass, Chen and Bajorek
43
professional education lecture on anticoagulation run by the Pharmaceutical Society
of Australia (NSW Branch) to provide an overview of the study and an invitation to
participate. Two pharmacies showed interest in participating and 8 pharmacists
showed interest in being involved in the education and training offered as part of the
study but did not want to be directly involved.
Representatives from 8 of the 15 pharmacies who had been recruited to the study
indicated their willingness to attend a purpose designed training programme on 16th
November 2003. The training was attended by 14 pharmacists from 6 pharmacies.
Two of these pharmacists were interested in the training however declined
participation.
Of the 6 pharmacies, only 3 were able to successfully recruit patients, mainly due to
lack of interest from the general practitioners in their area.
This prompted a second round of pharmacist recruitment. This group consisted of
interested but previously untrained pharmacists from the initial contact round,
pharmacists who had contacted us due to word of mouth, and a smaller group of 20
pharmacies outside the initial recruitment zone. This was equal to 25 pharmacies. Five
pharmacists attended the second round of training. Of these only 4 were able to recruit
patients.
The 7 pharmacies in the intervention arm of the study recruited 44 patients in
collaboration with 27 general practitioners. Forty-one patients completed the study, with
3 withdrawing prior to commencement of data collection.
The pre-intervention data was obtained from 20 of the 44 patients initially recruited
into the study prior to receiving the intervention. Of these patients, only 14 patients
provided adequate clinical data for a rigorous comparison between INR control during
the pre-intervention and intervention phases.

A community pharmacy based anticoagulant management service McLachlan, Spindler, Fois, Krass, Chen and Bajorek
44
Control Arm
In the Control Arm, 5 pharmacies contributed retrospectively collected data from 15
patients. An initial contact was made with QCPP pharmacists from the greater Sydney
region. This contact was for control pharmacists only after the study design was
revisited in an attempt to improve patient recruitment. One hundred and three
pharmacies were contacted but of those contacted only 9 consented to being involved
in the control study. This involved 1 hour of in-house training on the data collection
forms. However, only 5 of those pharmacies were able to recruit 15 of the required 50
patients. Two of the 15 were unable to complete the quality of life and warfarin
knowledge assessments at end of the study due to cessation of warfarin prior to
project finish date. This reflects the difficulty encountered in attempting to recruit
pharmacies and patients into the control arm of the study.
4.3 CLINICAL OUTCOMES
Table 2 summarises the INR data and collection descriptive statistics for all of the
patients in the study. The mean INR reading during both the pre-intervention and
intervention stages of the study were in close agreement. The while the number of
patients and INR measurements is different between the pre-intervention and
intervention period there was no apparent difference in the frequency of INR testing
(1.6 vs 1.7 INR tests per month, respectively). The control patients received, on
average, slightly higher frequency of monitoring with 2.1 INR tests per month. These
latter data should be viewed with caution given the limited sample size and the
retrospective nature of the data included in the control arm of the study.
Figure 2 shows all of the INR versus time observations for intervention cohort of
patients during the pre-intervention phase and during the trial.
A community pharmacy based anticoagulant management service McLachlan, Spindler, Fois, Krass, Chen and Bajorek
45
4.3.1 Percent of INR readings within the target range
One measure of INR control is the number of readings for each patient that were
maintained within the target range ( 0.1 INR unit). As discussed previously, poor
control of INR is one of the main predictors of poor outcome for patients receiving
anticoagulants. During the intervention the pharmacists in collaboration with general
practitioner on average were able to maintain 73 % (range; 20 to 100%) of the INR
readings per patient within the target range (Table 1). This is in agreement with pre-
intervention data which showed that on average patients achieved 73 % (range; 33 to
100%) of INR readings were with range. The limited data from the control group
indicated that 74 % (range; 52 to 94%) of INR observations were within the target
INR range individual patients. Formal statistical comparisons were not appropriate
given the different patient numbers and the combination of retrospective and
prospective data.
These data were derived from 38 patients and 519 INR observations for Intervention
and 14 patients and 126 INR observations for Pre-intervention. Only patients who
contributed at least 5 INR observations or had been in the study for 3 months
contributed data to the endpoints that compared the control of INR according to the
target range ( 0.1). Including all patients would overly bias the results and not
provide meaningful information about patient INR control. Figure 2 shows the data
collected from patients in the intervention group. Data are presented from the pre-
intervention period (before the study) and also during the pharmacist-general
practitioner managed anticoagulation service. The characteristic variability in patient
INR is evident from these data in both the pre-intervention and intervention periods of
the study.

A community pharmacy based anticoagulant management service McLachlan, Spindler, Fois, Krass, Chen and Bajorek
46
Figure 2: The relationship between INR and time for patients in the intervention
group before (pre-intervention) and during (intervention) the study. Time zero
represents the time that patients entered into the study. Dotted lines represent patients
with INR target range of 2.5 to 3.5.
INR (pre- and post-intervention)
1
1.5
2
2.5
3
3.5
4
4.5
5
5.5
-350 -250 -150 -50 50 150 250 350Time (Days)
INR
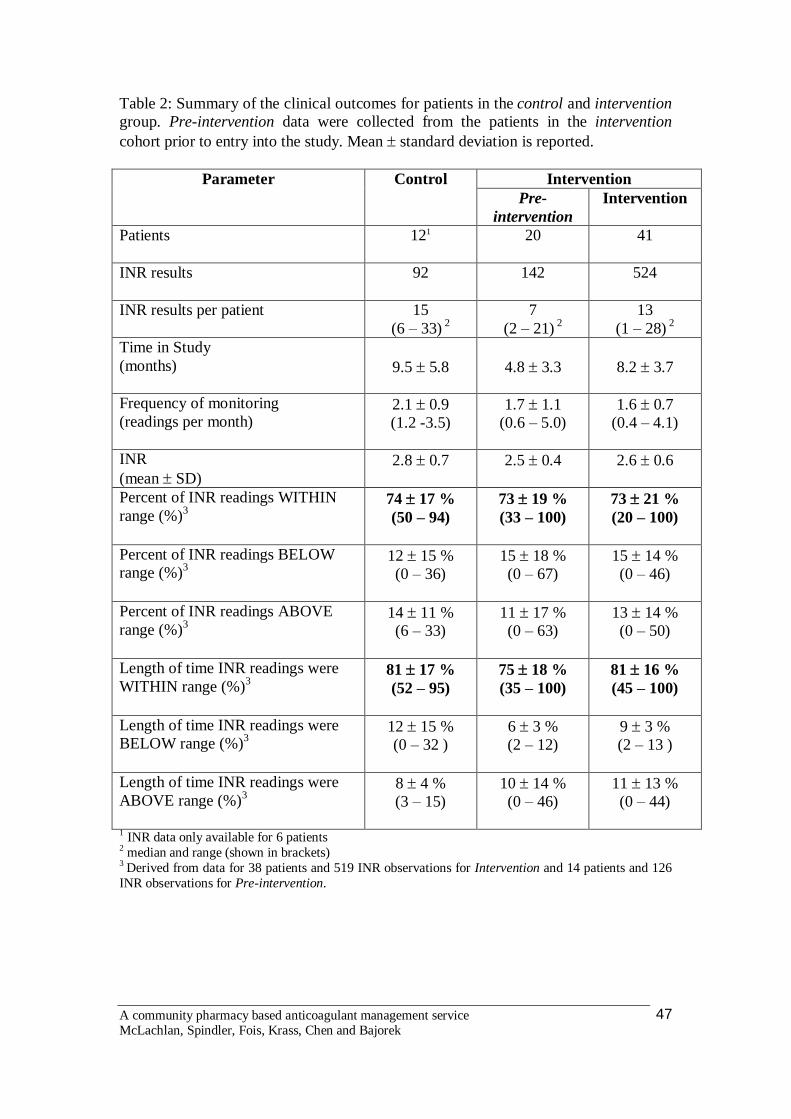
A community pharmacy based anticoagulant management service McLachlan, Spindler, Fois, Krass, Chen and Bajorek
47
Table 2: Summary of the clinical outcomes for patients in the control and intervention group. Pre-intervention data were collected from the patients in the intervention cohort prior to entry into the study. Mean standard deviation is reported.
Intervention Parameter
Control Pre-
intervention Intervention
Patients
121 20 41
INR results
92 142 524
INR results per patient 15 (6 – 33) 2
7 (2 – 21) 2
13 (1 – 28) 2
Time in Study (months)
9.5 5.8
4.8 3.3
8.2 3.7
Frequency of monitoring (readings per month)
2.1 0.9 (1.2 -3.5)
1.7 1.1 (0.6 – 5.0)
1.6 0.7 (0.4 – 4.1)
INR (mean SD)
2.8 0.7 2.5 0.4 2.6 0.6
Percent of INR readings WITHIN range (%)3
74 17 % (50 – 94)
73 19 % (33 – 100)
73 21 % (20 – 100)
Percent of INR readings BELOW range (%)3
12 15 % (0 – 36)
15 18 % (0 – 67)
15 14 % (0 – 46)
Percent of INR readings ABOVE range (%)3
14 11 % (6 – 33)
11 17 % (0 – 63)
13 14 % (0 – 50)
Length of time INR readings were WITHIN range (%)3
81 17 % (52 – 95)
75 18 % (35 – 100)
81 16 % (45 – 100)
Length of time INR readings were BELOW range (%)3
12 15 % (0 – 32 )
6 3 % (2 – 12)
9 3 % (2 – 13 )
Length of time INR readings were ABOVE range (%)3
8 4 % (3 – 15)
10 14 % (0 – 46)
11 13 % (0 – 44)
1 INR data only available for 6 patients 2 median and range (shown in brackets) 3 Derived from data for 38 patients and 519 INR observations for Intervention and 14 patients and 126 INR observations for Pre-intervention.

A community pharmacy based anticoagulant management service McLachlan, Spindler, Fois, Krass, Chen and Bajorek
48
4.3.2 Proportion of time the INR was within target range
Arguably the best predictor of patient outcome is actually the percent of time a
patient’s INR is within the target range because of the evidence linking this parameter
to clinical outcomes [Samsa and Matchar, 2000]. This reflects not only the quality of
monitoring but also dose recommendations and frequency of testing. In the
intervention group pharmacists in collaboration with general practitioners were able to
maintain patients INR within their target INR range for 81% (range; 45 to 100%) of
the time (Table 2). This was in close agreement with the pre-intervention data which
confirmed that patient INR was maintained in the target range for 77% (range; 35 to
100%) of the time and the separate control cohort of patients who were maintained
within the target range 81% (52 to 94%) of the time. These data are summarised
below in Figure 3. Statistical analyses were not conducted on these data because of
different patient numbers and the combination of retrospective and prospective data.
Figure 3: A comparison of the average percent of time a patient’s INR was below, in
or above the target INR range for the control (n = 6) and intervention (n= 38) group.
Pre-intervention (n=14) data was collected from the patients in the intervention cohort
prior to entry into the study. Data are presented as mean and error bars represent
standard deviation.
TIME IN RANGE
0
10
20
30
40
50
60
70
80
90
100
BASELINE INTERVENTION CONTROL
PER
CE
NT
OF
TIM
E (%
)
BELOWIN RANGEABOVE

A community pharmacy based anticoagulant management service McLachlan, Spindler, Fois, Krass, Chen and Bajorek
49
Fourteen patients provided adequate clinical data for a rigorous comparison between
INR control during the pre-intervention and intervention phases. It was not possible to
include retrospectively collected pre-intervention INR data for the exact same time
period for each patient due to the naturalistic manner in which these data were
collected. Patients who had at least 3 months or 4 INR readings before the
intervention were included in this sub-group. INR readings beyond 6 months pre-
intervention were not included in the analysis.
A summary of the individual and mean results for the 14 patients that contributed
adequate pre-intervention and intervention INR data is summarised in Table 3.
Table 3: A comparison of the proportion of time INR was in the range for 14 patients in the intervention and pre-intervention groups. Mean standard deviation (and 95% confidence intervals) are reported.
Intervention Parameter
Pre- * During*
Time in Study (months) 4.7 1.6 8.8 4.0
Proportion of time INR readings were
WITHIN range (%)
75 17 %
(65 – 86)
78 18 %
(68 – 89)
Proportion of time INR readings were
BELOW range (%)
15 17 %
(5 – 25)
8 9 %
(2 – 13)
Proportion of time INR readings were
ABOVE range (%)
9 14 %
(1 – 18)
15 16 %
(5 – 25)
These results show that there was no statistically significant difference (p=0.66;
paired 2-tailed t-test) between the proportion of time INR readings were within the
target range for these 14 patients in the pre-intervention and intervention period.
Furthermore, the proportions of time above and below the INR range were not
statistically significant different (p=0.15 and p=0.07, respectively) for the pre-
intervention and intervention periods.

A community pharmacy based anticoagulant management service McLachlan, Spindler, Fois, Krass, Chen and Bajorek
50
4.3.3 Episodes of warfarin-related adverse events
There were no major (haemorrhagic and thromboembolic) or minor (episodes of
bruising or bleeding) warfarin-related adverse events recorded during the trial. This
was confirmed during semi-structured interviews with patients.
4.4 HUMANISTIC OUTCOMES
4.4.1 Patient satisfaction
At the completion of the study patients were contacted to conduct a semi-structured
interview to record their level of satisfaction with the service and experiences within
the study. A particular emphasis was put on the comparison to the usual care and
whether or not they would consider paying for this service. The interview protocol
and the transcribed responses are shown in Appendix 13.
The response rate was relatively low with only a quarter of the patients participating
in this stage of the study. The majority of patients lost to follow-up were not available
or could not be contacted. Of the patients who were contacted none declined to be
interviewed. Although the response rate was low there was consistent agreement in
the comments raised by the patients who participated in the study.
All patients who responded were either satisfied or extremely satisfied with this
pharmacist-general practitioner managed anticoagulation service conducted using the
point-of-care testing device. The overwhelming comment from patients was that the
pharmacy service was more convenient than their usual care. The patients confirmed
that each encounter in the pharmacy lasted about 15 min (ranging from 5 to 20 min)
and many were attracted to the immediacy of the results. The point-of-care testing
device was an attractive alternative for some patients who did not like “needles” and
traditional blood sampling methods. Of those interviewed several patients perceived
that they had better INR control during the study when compared to their usual care.
At least one person found that being in the study improved their compliance with
therapy.

A community pharmacy based anticoagulant management service McLachlan, Spindler, Fois, Krass, Chen and Bajorek
51
Selected verbatim responses from interviewees illustrating positive aspects of the
anticoagulant monitoring service (see Appendix 13)
Convenience: “The convenience of going to the pharmacy in my local shops” “The pharmacy service was very quick and provided me with reassurance and the factors that influence warfarin” “Very flexible – we would chat about things as we went. The pharmacist did all the right precautionary stuff” ”It was quick and easy, no waiting and no booking” “The immediacy of the results was a real advantage compared to queuing up at the pathology lab” “No more convenient than the current GP and Hospital - I see my doctor regularly and am closely monitored – I have been on warfarin for 16 years” Improved relationships with health care professionals: “I like the close relationship with the pharmacist” “Helpful advice offered” “There was a three-way communication between me, the pharmacist and the doctor” “The regular interaction with the pharmacist and the chance to ask questions was good” Increased understanding: “Being in the study helped me to remember to take the medicine” “I like the opportunity to ask the pharmacists questions” Point of Care testing: “The finger prick was more acceptable to me as I do not like blood tests”
The majority of patients confirmed that they would continue to participate in an
anticoagulant monitoring service that was managed in community pharmacy and
would either pay for such a service or suggested that it should be a subsidised as an
alternative (not replacement) to the current pathology testing approach for
anticoagulant management. Of those who indicated a willingness to pay, the
suggested fee ranged from $10 to $20 per visit.

A community pharmacy based anticoagulant management service McLachlan, Spindler, Fois, Krass, Chen and Bajorek
52
Selected verbatim responses from interviewees illustrating willingness-to-pay for
the anticoagulant monitoring service (see Appendix 13)
“The fee should recognise the pharmacist time and maybe subsidised by Medicare” “As a DVA patient I would not expect to pay for this service but it should be subsidised” “A reasonable payment would be $20 per visit” “No, I have a pension. I could not put a price on this but I think it should be available and subsidised by Medicare”
A range of other valuable comments were contributed by the patients in the study.
These included insights into the pharmacist-patient relationship and also a number of
patients expressed an interest in self-monitoring using the point of care testing device.
One patient indicated that his local general practitioner now has a point of care testing
device since the study ended. The only criticisms of the service were about the time it
took for general practitioner and pharmacist communication about dosing.
4.4.2 Quality of Life Assessment
The patient’s quality of life was evaluated before and after the intervention arm and
on two occasions in the control arm using a 32-item assessment tool [Sawicki, 1999].
The instrument was designed to assess aspects of the quality of life relevant to
anticoagulation under 5 main categories. These are outlined in Table 4 which shows
the quality of life data for the Intervention and Control patients in the study.

A community pharmacy based anticoagulant management service McLachlan, Spindler, Fois, Krass, Chen and Bajorek
53
Table 4: Quality of life of patients in the Intervention and Control groups assessed
using the validated 32-item instrument of Sawicki (1999). Each score is presented as a
mean standard deviation within a range of 1 (minimum) to 6 (maximum).
Intervention (n=26) Control (n=12)
Treatment related
domain
Before
Mean SD
After
Mean SD
Entry
Mean SD
Exit
Mean SD
Medical Treatment
Satisfaction
4.67 1.17 5.03 0.92 5.07 1.02 4.98 1.10
Self Efficacy 4.49 1.14 4.90 1.30 5.00 1.44 4.94 1.44
General Psychological
Distress
2.09 0.85 1.84 0.76* 2.62 0.98 2.60 1.02
Daily Hassles 2.25 2.12 2.10 0.61 2.25 0.85 2.21 0.89
Strained Social Network 1.64 0.80 1.65 0.64 1.95 1.04 2.08 1.10
Score range from 1 (minimum) to 6 (maximum).
* Significant decrease in distress after the intervention (Wilcoxon Signed Rank test, p= 0.025)
All other statistical comparisons were not significantly different.
These data show that on entry into the study patients in both the intervention and
control groups had high levels of medical treatment satisfaction and self-efficacy.
While there was a trend towards an increase in these categories at the end of the
intervention arm of the study there was no statistically significant difference (p =
0.102). Both patient groups had relatively low levels of distress, daily hassles and
strained social network. However, patients in the intervention group who received
pharmacist-general practitioner managed anticoagulation showed a further and
statistically significant decrease (p=0.038) in distress as measured using this tool.

A community pharmacy based anticoagulant management service McLachlan, Spindler, Fois, Krass, Chen and Bajorek
54
4.4.3 Patient Warfarin Knowledge Assessment
An important part of this study was the provision and evaluation of patient education
using targeted counselling and written information. Table 5 provides a summary of
the impact of this education on patient knowledge about warfarin .
Table 5: Comparison of the pre- and post performance in the Warfarin Knowledge
assessment
Parameter Entry
(Pre)
Exit
(Post)
Percent Change
(Post – Pre)
Intervention
(n=26)
67 ± 12 %
82 ± 10 %
14.7 %
(8.3 - 21.2 %)*
Control
(n=12)
69 ± 15 %
76 ± 15 %
6.9 %
(1.7 – 12.2)# Data shown as mean ± standard deviation with 95% confidence interval shown in brackets
* Not significantly different (Repeated measures analysis of variance, p = 0.062)
The results show a trend towards improvement in the warfarin knowledge in both the
intervention and control patients as measured using the questionnaire (Table 5) but
this did not reach statistical significance (probably due to the relatively low sample
size). Both groups of patients had reasonable knowledge of warfarin on entry into the
study (67% vs 69%) but the 95% confidence interval for the change in knowledge
scores showed that the patients in the intervention group displayed a larger increase
during the study. This supports the observation that pharmacists used the warfarin
knowledge questionnaire to identify gaps in patient knowledge and used specific
counselling to address these gaps or misconceptions.
These data were consistent with data from the semi-structure interviews with patients.
Many patients indicated that the “Warfarin Medication Information Booklet For
Patients and their Carers” [Bajorek, 2002; Appendix 5] and education provided by
the pharmacist during the trial reinforced their knowledge of warfarin therapy and that

A community pharmacy based anticoagulant management service McLachlan, Spindler, Fois, Krass, Chen and Bajorek
55
it gave them a better understanding of what influences their INR and why they needed
dose changes from time to time.
Selected verbatim responses from interviewees illustrating the impact of
pharmacist education activities delivered as part of the anticoagulant
management service (see Appendix 13)
“By being in regular contact with the pharmacist and doctor I could ask questions – it gave me a greater understanding of INR and what influenced it for me. I had good feedback on diet. It was a motivator” “The pharmacist and the booklet gave me more information than I had previously. This reaffirmed what I know and reminded me what was important” “Discussing things that influenced my warfarin or why my dose was adjusted was great. You can’t always talk to the doctor about why (changes are made) especially when he has many patients. (The pharmacist) had a more personal approach” “I don’t remember being given any booklets. Talking to the pharmacist did reinforce what I knew about warfarin” “Talking to the pharmacist reinforced what I already new and addressed some of the “folklore” about warfarin” “I think I have a better understanding of INR and the dose changes through talking to the pharmacist”
4.4.4 Pharmacist Recommendations and General Practitioner Responses
An important aspect of this study was the role that pharmacists played in optimizing
anticoagulant therapy in collaboration with general practitioners. Pharmacists received
training and used a dosing protocol to make recommendations for consideration by
general practitioners. In the intervention arm of this study pharmacists made a total of
537 recommendations about warfarin management (with 20% of these involving an
alteration to therapy), in response to 524 INR measurements. These are summarised in
Table 6.

A community pharmacy based anticoagulant management service McLachlan, Spindler, Fois, Krass, Chen and Bajorek
56
Table 6: Summary of pharmacist recommendations and general practitioner responses
Recommendation Pharmacist Recommendations
General Practitioner Agreement
Rate of implementation of
pharmacist’s recommendation
Continue with this dose and monitor as recommended
427 419 98%
Decrease dose 53 48 91% Increase dose 48 42 88% Miss a dose 9 8 89% Overall 537 517 96%
General practitioners actioned 96% of the 537 recommendations made by pharmacists
in response to dosing and anticoagulant management suggestions.
4.4.5 Pharmacists Experiences
At the end of the study pharmacists involved in the intervention arm of the study were
surveyed to determine their experiences, opinions and perception of the utility of the
pharmacy-general practitioner managed anticoagulant service. Half of the pharmacists
returned surveys. The quantitative responses are summarised in Table 7 and the
transcribed open-ended responses are presented in Appendix 14.
These data address some of the important logistical aspects of delivering a pharmacy
managed anticoagulant service. The responses emphasise the importance of training
and support for pharmacists implementing such a service. All pharmacists referred to
the professional rewards involved in delivering the service and the benefits in further
developing pharmacy practice and even business opportunities. Pharmacists also
highlighted how their involvement lead to their own professional development related
to skills, knowledge and confidence.
A very positive aspect of the pharmacist feedback centred on the effect such a service
had on developing the pharmacist-patient relationship reinforcing the perception of
improved care and trust. There were mixed responses to the questions related to inter-

A community pharmacy based anticoagulant management service McLachlan, Spindler, Fois, Krass, Chen and Bajorek
57
professional relationships between pharmacists and general practitioners. Some
pharmacists identified the positive aspect of building professional collaborations and
trust with general practitioners whereas others identified concerns over general
practitioner resistance to engage in the trial with pharmacists. These findings reinforce
the need to ensure that any future pharmacy based anticoagulant management service
must be developed in close collaboration and consultation with general practitioners.
This latter point cannot be underestimated.
It is noteworthy that pharmacists agreed that they would offer such a service in the
future.
Table 7: Pharmacists experiences in the study
Question Response
The training provided to me was adequate to enable me to deliver the anticoagulant management service
4.0 0.8
Pharmacy was too busy to deliver this service 3.0 1.4 Customers were very keen to participate in this service 4.0 0.8 More support from the researchers was needed to implement and deliver this service
2.8 1.7
Changes in personal circumstances during the course of this study affect my ability to participate in the study
2.5 1.0
Local GPs were supportive of this service 3.3 1.2 Patients were reluctant to participate due to concerns about the changes to their anticoagulant management
3.3 1.2
Pharmacy is currently involved in other studies/projects, making it difficult to be involved in this study
1.7 0.6
Too much time was spent on administration in this study 2.3 0.6 Anticoagulant management is a priority area in my pharmacy 4.3 0.6 Patients appeared confident in the pharmacists ability to effectively manage their anticoagulation
4.0 ND
Local GPs were resistant to pharmacist involvement in anticoagulant management
2.7 1.5
It was difficult to recruit patients into this study 4.0 ND It was difficult to approach local GPs regarding this study 2.7 1.2 I would be happy to offer this anticoagulant management service in the future
4.3 1.2
Likert scale from to 1 = Strongly Disagree, 3 = Neutral, 5 = Strong Agree. Responses recorded as mean standard deviation (n = 3 or 4). ND – not determined (n = 2)

A community pharmacy based anticoagulant management service McLachlan, Spindler, Fois, Krass, Chen and Bajorek
58
4.5 ECONOMIC OUTCOMES
(a) Cost to deliver the service
A key finding of this study was that the clinical outcome of patients (based on INR
control) in the pharmacist-general practitioner managed anticoagulant service and
those receiving usual care were similar (see Table 2 and 3). The cost of delivering the
service to 10 patients for a period of 12 months was estimated. This is presented as a
per patient per year cost and the cost per INR test (Tables 8 to 10). The costs were
considered for the first year (Year 1) the service is established and then subsequent
years (Year 2) of the service.
Table 8: Estimated cost involved in delivering pharmacist-general practitioner
managed anticoagulant service in collaboration using of point-of-care testing based on
a pharmacist-in-charge earning $21.75 per hour (Option A).
Aspect of Service Year 1 Year 2 INRatio Point-of-care testing device $1,200.00 Quality control program (per year) $500.00 $500.00 Cost per INRatio test (including disposables) $6.27 $6.27 Pharmacist’s time ($21.75 per h) 0.5 h $10.88 $10.88 GP consultations (2 visits per year; based on MBS fees) $30.85 $30.85 Cost to deliver pharmacy managed anticoagulant service to 10 patients (20 INR tests per year) for 1 year $5,746.17 $4,546.00 Cost per patient per year $574.62 $454.60 Cost to deliver each INR test $28.73 $22.73

A community pharmacy based anticoagulant management service McLachlan, Spindler, Fois, Krass, Chen and Bajorek
59
Table 9: Estimated cost involved in delivering pharmacist-general practitioner
managed anticoagulant service in collaboration using of point-of-care testing on a
pharmacist earning $65.00 per hour (Option B).
Aspect of Service Year 1 Year 2 INRatio Point-of-care testing device $1,200.00 Quality control program (per year) $500.00 $500.00 Cost per INRatio test (including disposables) $6.27 $6.27 Pharmacist’s time ($65.00 per h) 0.5 h $32.50 $32.50 GP consultations (2 visits per year; based on MBS fees) $30.85 $30.85 Cost to deliver pharmacy managed anticoagulant service to 10 patients (20 INR tests per year) for 1 year $10,071.17 $8,871.00 Cost per patient per year $1,007.12 $887.10 Cost to deliver each INR test $50.36 $44.36
These results utilise information from the present study including the average time
spent by the pharmacist (15 min testing and counselling patients per visit and
approximately 15 min recording and communicating recommendations with the
general practitioner and patient). In total 30 min per test was allotted to the
pharmacists time and this has been costed at two levels – lower award level for
pharmacist-in-charge and a higher remuneration level of $65 for a pharmacist who
has experience and undergone training. These calculations are based on the
assumption of approximately 20 INR tests per year. Only two general practitioner
visits (related to warfarin management) per year are included in the cost analysis
which is half that expected for usual care. This was selected in light of expectations
that the close collaboration between pharmacists and general practitioner in patient
management will lead to the need for less general practitioner visits related to
warfarin management. These estimated costs do not include the cost for the time of
the general practitioner to review and communicate their management option for the
patients in light of the pharmacist recommendation. This was not included as the time
is expected to be the same whether this is a pharmacy-general practitioner managed
service or the patients usual care where they are tested at by a laboratory service and
seen by the general practitioner.

A community pharmacy based anticoagulant management service McLachlan, Spindler, Fois, Krass, Chen and Bajorek
60
Table 10: Estimated cost involved in delivering the anticoagulant services by the
general practitioner and the pathology provider from the perspective of the
Government.
Aspect of Service Year 1 or 2 Collection Centre (MBS) $17.40 INR pathology (MBS) $14.05 GP consultations (4 per year; 6 INR requests per visit) (MBS) $30.85 Cost to deliver this service to 10 patients for 1 year (20 INR tests per year) $7,524.00 Cost per patient per year $752.40 Cost to deliver each INR test $37.62
The calculations in Table 10 assume that patients visit their general practitioner at
least 4 times per year and visit a pathology collection centre to provide a blood test
which is communicated to the general practitioner who later contacts the patient to
advice of dose adjustments or management advice.
A direct comparison of the costs, suggests that the cost of delivering the pharmacist-
general practitioner managed service using of point-of-care testing is comparable to
the costs associated with usual care. The findings suggest that in the first year of
delivery the community pharmacist-general practitioner managed anticoagulant
service was considerably more expensive to deliver (reflecting the need for set up
costs and training) but in subsequent years the pharmacy based service offered
considerable cost savings.
(b) Medicare Benefits Schedule Expenditure
Seventeen patients in the intervention arm of the study provided consent for their
MBS expenditure data to be analysis for the 6 months prior (pre-intervention) to
entering the study (intervention). The results of the MBS data are summarised in
Tables 11, 12 and 13.

A community pharmacy based anticoagulant management service McLachlan, Spindler, Fois, Krass, Chen and Bajorek
61
Table 11: Actual Medical Benefits Schedule (all items) expenditure for 17 patients in
the pre-intervention and intervention phase. Data presented as mean ± standard
deviation (and 95% confidence intervals; CI).
Pre-intervention Intervention
Months Total $ per
month Months Total $ per
month Total 122 $21,807 159 $34,819
Mean
7.2 ± 2.3
$1,283 ± $1,023
$172 ± $106
9.3
± 2.8 $2,048
± $1,413 $208
± $140 95% CI
$726 - $1,838
$115 - $230
$1,280 - $2,817
$132- $284
Table 12: Frequency of utilisation of Medical Benefits Schedule items related to
anticoagulant management for 17 patients in the pre-intervention and intervention
phase. Data presented as mean ± standard deviation (and 95% confidence intervals;
CI) of items utilised per month.
Pre-intervention Intervention
Pathology 1 Collections
INR 2 Tests
GP visits3
Pathology Collections 1
INR 2 Tests
GP visits3
Mean
1.51 ± 0.60
1.38
± 0.73
1.18 ± 0.81
1.00 ± 0.77
0.76 ± 0.76
1.11 ± 0.76
95% CI
1.19 - 1.84
0.98- 1.77
0.74 - 1.62
0.58 -1.42
0.35-1.18
0.70-1.53
1 Comparison of Pre-intervention and during intervention, p=0.004 (Paired t-test) 2 Comparison of Pre-intervention and during intervention, p=0.005 (Paired t-test) 3 Comparison of Pre-intervention and during intervention, p=0.6283 (Paired t-test)

A community pharmacy based anticoagulant management service McLachlan, Spindler, Fois, Krass, Chen and Bajorek
62
Table 13: Actual expenditure of Medical Benefits Schedule items related to
anticoagulant management for 17 patients in the pre-intervention and intervention
phase. Data presented as mean ± standard deviation (and 95% confidence intervals;
CI) of total expenditure and expenditure per month (n=17).
Pre-intervention During intervention Total Per month Total Per month
TOTAL $9, 743 $10,077 Mean ± SD $ 573 ± $457 $ 73 ± $ 43 $ 593 ± $ 448 $ 63 ± $ 50
95% CI 325 - 822 50 - 96 349 - 836 36 - 90 The data in Table 11 show that the total MBS expenditure was not different in the
month prior to and drug the study. It should be noted that data for only 17 patients
make it difficult to detect subtle differences in expenditure given that this is a elderly
population with multiple conditions and expenditure is likely to be variable over time.
As expected the data in Table 12 show that the number of pathology visits and INR
tests utilised by these 17 patients significantly decreased during the intervention phase
(p=0.004 and p=0.005, respectively) of the study compared to the frequency of MBS
tests in the pre-intervention period. This is expected as patients were receiving the
pharmacist-general practitioner anticoagulant service at this time. The number of
visits to the general practitioner did not significantly change (p=0.63). However, this
analysis of MBS data provide by the HIC did not discriminate the reasons for the
general practitioner visit. A comparison between the number of INR tests conducted
per month under the MBS prior to the study (pre-intervention) and the number of INR
measurements made per month by pharmacists (1.51 ± 0.44 INR tests per month) in
the study were not significantly different (p=0.53, paired t-test, n=17). The MBS
expenditure on anticoagulant management (based on the costs attributed to relevant
MBS items) was not significantly different in these 17 patients (Table 13), although
the trend was towards lower expenditure during the intervention. The inability to
observe a different may be associated with the relatively low patient numbers and
significant variability.

A community pharmacy based anticoagulant management service McLachlan, Spindler, Fois, Krass, Chen and Bajorek
63
4.6 Quality Control Data for the INRatio device
In this study the quality control of the INR results provided by the INRatio point-of-
care testing device were collected over the last 3 to 4 months of the trial. The QC
prothrombin time results (recorded by the trained pharmacists using the device) were
compared against known low and high quality control (QC) samples. The mean
prothrombin times for the QC1 [low control] and QC2 [high control] was 11.8 sec and
20.5 sec, respectively. The cumulative data for the low and high QC data provided by
National Serology Reference Laboratory are presented in Figures 10 and 11.
In this study the INRatio device when used by the trained pharmacists showed a high
level of internal accuracy and precision was also shown for both the variability
compared with the 5% variability shown by the low control. However both the high
and low controls were well within the expected 8% error acceptable for INR testing in
Australia. The high level of inter-pharmacy conformity for both high and low controls
is shown in Figure 12 and 13 for QC1 (low control) and QC2 (high control),
respectively.
Figure 10: Low QC results versus time. Different coloured lines represent different
pharmacies.
Comparative QC1 (low control) for all Pharmacy based INRatio devices
x+2SD = 14.26x+2SD = 14.26
x = 11.82 x = 11.82
x-2SD = 9.38 x-2SD = 9.38
8.0
9.0
10.0
11.0
12.0
13.0
14.0
15.0
16.0
20/10/2004 9/11/2004 29/11/2004 19/12/2004 8/01/2005 28/01/2005 17/02/2005 9/03/2005 29/03/2005 18/04/2005 8/05/2005
Date
Prot
hrom
bin
Tim
e (s
econ
ds)
A-01 A-02 A-03 A-04 A-05 A-07 A-08

A community pharmacy based anticoagulant management service McLachlan, Spindler, Fois, Krass, Chen and Bajorek
64
Figure 11: High QC results versus time. Different coloured lines represent different
pharmacies.
Comparative QC 2 (high control) for all Pharmacy based INRatio devices.
x+2SD = 24.66x+2SD = 24.66
x = 20.46x = 20.46
x-2SD = 16.26 x-2SD = 16.26
14.0
16.0
18.0
20.0
22.0
24.0
26.0
28.0
20/10/2004 9/11/2004 29/11/2004 19/12/2004 8/01/2005 28/01/2005 17/02/2005 9/03/2005 29/03/2005 18/04/2005 8/05/2005
Date
Pro
thro
mbi
n Ti
me
(sec
onds
)
A-01 A-02 A-03 A-04 A-05 A-07 A-08
Figure 12: Low QC results compared between pharmacies.

A community pharmacy based anticoagulant management service McLachlan, Spindler, Fois, Krass, Chen and Bajorek
65
Figure 13: Low QC results compared between pharmacies.
The results of the quality control section of this study show that pharmacists are able
to use the INRatio point-of-care device in an appropriate manner to produce reliable
results. This also demonstrates a high level of precision and accuracy has been applied
to the INR results gained through the pharmacists’ use of the INRatio point-of-care
device. However, it is acknowledged that an external proficiency testing procedure
would be ideal for the evaluation of the INRatio device in future investigations or
services involving point-of-care testing.

A community pharmacy based anticoagulant management service McLachlan, Spindler, Fois, Krass, Chen and Bajorek
66
5.0 DISCUSSION
5.1 Achievements against the study objections
5.1.1 Improve INR control and optimise clinical outcomes of patients receiving
warfarin
In designing this study the original aim was to investigate if a community pharmacist
managed anticoagulant service, conducted in close collaboration with general
practitioners, point-of-care testing and patients education, could improve the
outcomes of patients receiving warfarin. The time frame of this study meant that
assessing outcomes using major clinical endpoints, such as episodes of bleeding,
hospitalisation and thrombosis or death, was not likely to be feasible. However, there
is compelling evidence that the proportion of time a patient’s INR is within the target
INR range is a good predictor of clinical outcome [Samsa and Matchar, 2000]. This
was the primary outcome evaluated in this study and it was shown that a community
pharmacist-general practitioner managed anticoagulant service was as effective in the
control of INR as usual care i.e., a general practitioner-pathology service. A
pharmacist-general practitioner managed service was not superior to usual care with
respect to patient outcomes but provided the same control of INR and the associated
benefits and risks to patients receiving warfarin.
5.1.2 Cost effectiveness compared to usual care
This apriori objective was evaluated using a comparison of the cost of delivering the
community pharmacist managed anticoagulant service compared to the associate costs
of providing usual care. This approach was selected based on the observations that
patient INR control (and therefore outcomes) was similar across the three data cohorts
evaluated in this study. Furthermore, over the total of 40 patient years experience on
warfarin collected in the three data cohorts of this study there were no major bleeds or
hospitalisations recorded. On the assumption that the pharmacist-general practitioner
managed anticoagulant service was not inferior to usual care and that the monthly
frequency of INR testing was similar, a cost comparison was conducted. The findings

A community pharmacy based anticoagulant management service McLachlan, Spindler, Fois, Krass, Chen and Bajorek
67
suggest that in the first year of delivery the community pharmacist managed
anticoagulant service was considerably more expensive to deliver (reflecting the need
for set up costs and training) but in subsequent years the pharmacy based service
offered considerable cost savings.
The Medical Benefits Schedule data clearly indicated that many general practitioners
continued to have patients monitored using the usual care model during the
intervention. Hence, while there was a trend towards lower MBS expenditure on
anticoagulant monitoring a difference between the pre-intervention and intervention
expenditure was not observed. The frequency of INR monitoring by general
practitioners during the pre-intervention and by pharmacists and general practitioner
in the intervention were not significantly different. This was an important finding
given that the convenience of point-of-care testing of INR may have lead to more
frequent monitoring of patients which would not reflect typical practice or clinical
need.
5.1.3 Professional links between community pharmacists and general
practitioners in providing patient care
The community pharmacist-general practitioner managed anticoagulant service
investigated in this study relied heavily on the close collaboration between
pharmacists, general practitioners and their patients. The findings from the
pharmacists’ experiences in the study reflect in both qualitative and quantitative terms
evidence of improved collaboration with general partitioners. The response from one
patient in the study reflected this with the comment “There was a three-way
communication between me, the pharmacist and the doctor”. However, the qualitative
data on pharmacist experiences also point to the fact that some barriers remain
between pharmacist and general practitioners and that this will be an important issue
for the future implementation of such as service.
A community pharmacy based anticoagulant management service McLachlan, Spindler, Fois, Krass, Chen and Bajorek
68
5.2 Justification for study design
The proposed study design brings together key elements explored in other research
studies involving pharmacy-based service provision, previous published studies
involving pharmacists in the provision of anticoagulant services and addresses
outcomes widely used by other researchers in the field. This provided the opportunity
to assess meaningful changes in the main clinical, economic and humanistic endpoints
between the intervention and pre-intervention. The clinical outcomes for this study
were selected to allow a rigorous assessment of the clinical significance that this
pharmacist-general practitioner anticoagulant service may provide. Studies have
clearly linked INR control to patient outcome [Samsa and Matchar, 2000;
Cromheecke et al, 2000] which was recently confirmed in a systematic review
conducted by Fitzmaurice et al, [2003] who indicated that at least 2 different clinical
outcome measure should be employed. As expected there were no haemorrhagic and
thromboembolic events within the time frame of this study so this study relied on INR
control parameters as the primary clinical endpoints. Jones et al [2005] have
demonstrated, using a record linkage study combining the data from over 2000
patients, that INR readings outside the target range increase the rate of hospitalisation.
Their work shows that a 10% increase in the time a patient spends outside the INR
target range is associated with a 29% increase in the likelihood of death and a 12%
increase in the risk of thromboembolic events.
5.3 Impact on Quality of Life
In this study a validated 32 item question was employed to evaluate aspects of quality
of life and the impact of warfarin therapy. A before and after comparison was made
between the intervention and control groups. There was a clear trend towards an
improvement in quality of life for the patients who received the community
pharmacist-general practitioner managed anticoagulant service. This was supported by
patient feedback data which strongly highlighted the convenience aspect and
acceptability of the pharmacy-general practitioner managed anticoagulation model
evaluated in this study (Section 4.4.1). It was clear from the quality of life assessment
that the general treatment satisfaction was already high being 4.7 1.2 and 5.1 1.0

A community pharmacy based anticoagulant management service McLachlan, Spindler, Fois, Krass, Chen and Bajorek
69
(on a 6 point scale) in the intervention and control groups, respectively. Gadisseur et
al [2004] also used a 32-item questionnaire and showed similar pre-intervention
observations and benefits on the quality of life of patients when they considered the
impact of patient education (about anticoagulation) and the self-monitoring
monitoring. Cromheecke et al [2000] compared the anticoagulant control and impact
on quality of life for patients who were trained in self-management compared to those
who received usual care. This study demonstrated a significant improvement in each
of the 5 treatment related domains during self-management highlighting the possible
improvements that different management strategies can achieve in patients quality of
life when compared to usual care.
The present study showed that community pharmacy managed anticoagulation service
could significantly reduce patient distress and this observation was supported by
feedback from patients in the semi-structured interviews used to evaluate this service
(Appendix 13).
5.4 Reliability of Point-of-Care INR testing using the INRatio device
The reproducibility and reliability of the INRatio device is central to this proposal.
While the manufacturer provides an exhaustive list of literature supporting the use of
the INRatio device, a recent independent study assessed the precision and accuracy of
the INRatio device compared to laboratory based INR results. Taborski et al [2004]
evaluated INR readings collected using the INRatio and Coaguchek S devices from 82
people in two centres who received warfarin. Readings from point-of-care INR testing
devices were compared to laboratory based measurements. Both point-of-care testing
devices provided accurate INR readings within 7 to 9% over the INR range of 1 to 5.
The precision of INR readings was approximately 8% which demonstrated that in the
hands of appropriately trained professionals these devices provide reliable results (see
also comments in Section 2.4).
In the latter part of this study an internal QC program (that was externally managed)
was implemented to assess the reliability of the INRatio device performance. Due to

A community pharmacy based anticoagulant management service McLachlan, Spindler, Fois, Krass, Chen and Bajorek
70
the lack of an available external QC sample, which is equivalent to capillary blood
sample, we utilised an identical batch of the INRatio test strips and recorded the
prothrombin time readings for the high and low QC samples which are run each time
a patient’s INR sample is analysed. These results, at the very least, confirm the
reproducibility of INR measurements and can identify any errors related to
systematic, device or operator errors. The internal QC data collected in this study
confirm the (internal) reproducibility of INR results generated as part of this study.
5.5 Patient Knowledge of warfarin therapy
An important feature of the community pharmacy-general practitioner based
anticoagulant service investigated in this study was the inclusion of warfarin
education provision and knowledge assessment. This targeted approach to “filling in
the gaps” in patient knowledge about warfarin lead to improvements in patient
understanding (although this did not reach statistical significance due to a limited
sample size). Interestingly, the patients in the control group also demonstrated an
increase in their warfarin knowledge (although to a lesser extent than patients in the
intervention arm of the study). Khan et al [2004] have demonstrated the important
link between patient education and improvements in patient outcome on warfarin.
These researchers allocated 125 patients receiving warfarin to usual care or to receive
an education intervention. The patients (n=85) that received the education
intervention were further allocated to receive either usual care or were trained in self-
monitoring. For those patients that received education alone, the percentage time their
INR readings were within the therapeutic range increased from 61 ± 15 % prior to the
study to 70 % ± 24% at the end of the study. This highlights the importance of
combing anticoagulant monitoring strategies with supportive measures such as
education to ensure optimal anticoagulation management.
5.6 Comparison with published studies
There is a comprehensive literature related to evaluating the clinical, humanistic and
economic outcome of patients receiving anticoagulant management under different
models (see Section 2.2 and 2.3). Figure 13 provides a graphical summary of the
A community pharmacy based anticoagulant management service McLachlan, Spindler, Fois, Krass, Chen and Bajorek
71
mean time that INR readings are within the target range for this study compared to
different anticoagulant management options from selected studies. The studies
selected for comparison were;
Knowlton et al [1999] who studied INR control using a prospective
observational study in a convenience sample of 26 patients using the
pharmacist-managed anticoagulant service (PMAS) employing point-of-care
INR testing;
Chiquette et al [1998] who compared INR control in an anticoagulant clinic
(AC) involving 183 patients and 145 patients receiving usual care (UC);
Wilson et al [2003] conducted a prospective study comparing INR control for
221 patients who received management by a pharmacist in an anticoagulant
clinic (AC) and a general practitioner-managed anticoagulant service (GPMS);
Holden and Holden [2000] used a sequential study design and retrospective
analysis to compare INR control in 51 patients who received anticoagulant
management by either a pharmacist (PMAS) or a general practitioner
(GPMAS).
This comparison shows that the control of INR varies from study to study. The
difference between these studies reflects a number of factors including the study
design and the nature of the patient population. The INR control achieved in this study
is comparable to results obtained from other published studies. Any conclusion about
the possible superiority of the collaborative pharmacist-general practitioner model
evaluated in this study needs to be cautiously interpreted in light of the factors
described above (See Section 5.7).

A community pharmacy based anticoagulant management service McLachlan, Spindler, Fois, Krass, Chen and Bajorek
72
Figure 13: Compares the mean proportion of time INR readings are within the range
for this study and previously published studies which utilise different ant icoagulant
management approaches. Abbreviations are presented in the text.
0 20 40 60 80 100
Intervention (n=38)
Control (n=6)
Pre-intervention (n=14)
PMAS (Holden & Holden, 2000)
GPMAS (Holden & Holden, 2000)
AC (Wilson et al, 2003)
GPMS (Wilson et al, 2003)
AC (Chiquette et al, 1998)
UC (Chiquette et al, 1998)
PMAS (Knowlton et al, 1999 )
Proportion of Time in target INR range (%)
A community pharmacy based anticoagulant management service McLachlan, Spindler, Fois, Krass, Chen and Bajorek
73
5.7 Limitations of this study
Despite the use a multiple recruitment strategies, this community pharmacy based
study was not able to enrol adequate numbers of patients into the control arm to allow
appropriate comparisons of key endpoints. This was overcome in a limited way by the
use of pre-intervention data collected from patients in the intervention group.
However, combining retrospective and prospective data is not optimal because of the
inherent difficulties in maintaining data integrity and completeness. Furthermore, the
temporal aspects related to patient care mean that direct comparisons of retrospective
and prospective data should be done with caution. Due to the same recruitment issues
the randomised nature of the original design was revised (with the permission of the
Pharmacy Guild of Australia) to include a convenience sample of pharmacists who
then invited patients within their practices to participate in the study. The impact of
these changes in the design and the nature of pharmacist and patient recruitment
should be carefully considered when interpreting the results of the present study and
may limit the generalisability of the findings. Although, the original plan to conduct a
controlled trial of anticoagulation monitoring could not be achieved due to the lack of
a suitable control data set or comprehensive pre-intervention data, the data from the
patients in the intervention arm of study do provide important information about the
control of INR and changes in quality of life and patient knowledge over the time of
the study. Based on historical comparisons, with previously published research, the
clinical endpoint data from the present study are in general agreement with other
models of anticoagulant management from different populations. The fact that time
within the INR range appears to better in the intervention group of the present study
cannot be considered a significant finding given that the patients recruited into this
study were not randomly selected and likely to be “uncomplicated” patients
(reflecting possible selection bias in the present study). This recruitment issue is likely
to bias the results in favour of the intervention. This observation is supported by the
lack of major bleeds or thromboembolic events observed in the intervention cohort of
patients despite examining a total of 27 years of patient experience data. Finally, it is
important to note that these data were collected during warfarin maintenance therapy
and cannot be extrapolated to warfarin initiation.

A community pharmacy based anticoagulant management service McLachlan, Spindler, Fois, Krass, Chen and Bajorek
74
The final statistical analysis of INR data obtained during the pre-intervention and
intervention phases of the study only included data from 14 patients. Although the
inter-patient variability observed in the key endpoint, proportion of time INR was
within the target range, was relatively small (approximately 23%) it is unlikely that
this relatively low number of patients provides adequate power to detect the size of
the difference in INR control planned prior to the study (see Section 3.8) with
adequate power.
Pharmacists in this study were trained to use the INRatio point-of-care INR testing
device. One of the limitations of using this device in this study was the lack of an
available external quality control program to monitor the reliability of the INR
measurements. The reasons for this are discussed above but an important
recommendation from this study is that both an internal and external proficiency
testing programs are essential if the uptake of this approach to anticoagulant
monitoring is to be successful and safe. In this study no haemorrhagic or
thromboembolic events were observed across the 40 patient years of experience
analysed. Patients remained in the care of their general practitioner and pharmacists
were trained to recognise (and subsequently educated patients about) the warning
signs of serious unwanted effects related to warfarin. Furthermore, the dosing
recommendation chart used by pharmacists had clear guidelines about when patients
should be retested or referred to their general practitioner. These latter measures
provided confidence that clinically significant problems could be identified and
appropriately managed if and when they occurred. However, an external proficiency
testing program would have reinforced the reliability and reproducibility of the INR
measurements obtained from the INRatio device – a point raised by both pharmacists
and general practitioner’s in this study.
A significant challenge to the successful implementation of this study was the lack of
engagement of pharmacists and general practitioners in patient recruitment and
clinical data collection. It is important to reflect on these challenges because it is
likely that the same issues are likely to influence the broader implementation of a
community pharmacist-general practitioner anticoagulant management service. The
willingness of practitioners to engage with this study (and this model of anticoagulant

A community pharmacy based anticoagulant management service McLachlan, Spindler, Fois, Krass, Chen and Bajorek
75
management) are likely to be multifactorial and are influenced by the following
factors which were identified through discussion with pharmacists involved or
invested to participate in this study;
Practitioner’s patient mix (pharmacists and general practitioners need to have a
relatively large number of patients receiving warfarin in their practice. A number
of pharmacists declined to enter the study as they did not have the patient mix to
support recruiting patients into the study);
Organisation of practice (some pharmacies did not have the staff profile or space
requirements to readily offer the anticoagulant management service);
Level of remuneration (the level of remuneration for pharmacist and general
practitioners was only a token amount– due to budget restrictions and did not
reflect the time and effort required by pharmacists and general practitioners. The
lack of “reasonable” financial incentives, especially amidst the numerous financial
imperatives in a practice setting is a critical factor);
Motivation for change (this is a novel service and requires a change in practice
for both general practitioners and pharmacists);
Relationship between health care practitioners (the successful implementation
of the service relies on close collaboration between pharmacists and general
practitioners. In this study some pharmacists indicated that general practitioners in
their area were not willing to refer patients to the study).
Consideration of these factors will be essential is subsequent studies and during the
implementation of a pharmacist-general practitioner managed anticoagulant service.

A community pharmacy based anticoagulant management service McLachlan, Spindler, Fois, Krass, Chen and Bajorek
76
6.0 CONCLUSIONS
A community pharmacist-general practitioner managed anticoagulant service using
point-of-care INR testing can;
maintain the control of patient INR within the target range to help achieve
optimal anticoagulation outcomes;
improve patient knowledge which, in turn, has been linked to reduced risk of
warfarin-related complications;
improve patient quality of life by reducing treatment related distress;
foster timely and appropriate inter-professional collaboration between
pharmacists and general practitioners;
be delivered in a manner which is comparable to the cost of existing pathology
services.
Furthermore, this study demonstrated that the community pharmacist-general
practitioner managed anticoagulant service was acceptable to patients and pharmacists
involved in the study. Trained and supported pharmacists were able to make credible
management recommendations about anticoagulation that were accepted by general
practitioners.
Taken together the results of this study demonstrate that a community pharmacist-
general practitioner managed anticoagulant service is feasible and an alternative
option for some patients receiving warfarin.
A community pharmacy based anticoagulant management service McLachlan, Spindler, Fois, Krass, Chen and Bajorek
77
REFERENCES
Anderson RJ. Cost analysis of a managed care decentralized outpatient pharmacy anticoagulation service. J Manag Care Pharm 2004;10:159-65. Bajorek B,V. “Stroke prevention in elderly patients with atrial fibrillation.” [Thesis] Faculty of Pharmacy, University of Sydney, 2002. Sydney, Australia. Boddy C. Pharmacist involvement with warfarin dosing for inpatients. Pharm World Sci 2001;23:31-5. Campbell P, Roberts G, Eaton V, Coghlan D, Gallus A. Managing warfarin therapy in the community. Australian Prescriber 2001;24:86-89. Cardiovascular Drug Guidelines 2003, Edition 3. Therapeutics Committee, Victorian Medical Postgraduate Foundation Inc. Chan E, McLachlan AJ Pegg M, MacKay AD, Cole RB, Rowland M.. Disposition of warfarin enantiomers and metabolites in patients during multiple dosing. Br J Clin Pharmacol 1994; 37: 563-569. Chan E, McLachlan AJ, O'Reilly RA, Rowland M. Stereochemical aspects of warfarin drug interactions: use of a combined pharmacokinetic-pharmacodynamic model. Clin Pharmacol Ther 1994; 56: 286-294. Chiquette E, Amato MG, Bussey HI. Comparison of an anticoagulation clinic with usual medical care: anticoagulation control, patient outcomes, and health care costs. Arch Intern Med. 998;158:1641-7. Coleman B, Patterson D, Long M, Farrell J. Setting quality standards for a community pharmacist-led anticoagulant clinic. Pharm J 2003; 308-311.
Cromheecke ME, Levi M, Colly LP, de Mol BJ, Prins MH, Hutten BA, Mak R, Keyzers KC, Buller HR. Oral anticoagulation self-management and management by a specialist anticoagulation clinic: a randomised cross-over comparison. Lancet 2000;356:97-102. Dager WE, Branch JM, King JH, White RH, Quan RS, Musallam NA, Albertson TE. Optimization of inpatient warfarin therapy: impact of daily consultation by a pharmacist-managed anticoagulation service. Ann Pharmacother. 2000;34:567-72. Das AK, Willcoxson P, Corrado OJ. Does long-term warfarin affect the quality of life of older people? Age Ageing. 2005;34:312-3. Douketis JD, Lane A, Milne J, Ginsberg JS. Accuracy of a portable International Normalization Ratio monitor in outpatients receiving long-term oral anticoagulant therapy: comparison with a laboratory reference standard using clinically relevant criteria for agreement. Thromb Res 1998 ; 92:11-7. Fitzmaurice DA, Murray ET, Gee KM, Allan TF, Hobbs FD. A randomised controlled trial of patient self management of oral anticoagulation treatment compared with primary care management. J Clin Pathol 2002; 55: 845-9. Fitzmaurice DA, Kesteven P, Gee KM, Murray ET, McManus R. A systematic review of outcome measures reported for the therapeutic effectiveness of oral anticoagulation. J Clin Pathol 2003 ; 56 :48-51 Foss MT, Schoch PH, Sintek CD. Efficient operation of a high-volume anticoagulation clinic. Am J Health Syst Pharm. 1999; 56: 443-9.
A community pharmacy based anticoagulant management service McLachlan, Spindler, Fois, Krass, Chen and Bajorek
78
Gadisseur AP, Kaptein AA, Breukink-Engbers WG, van der Meer FJ, Rosendaal FR. Patient self-management of oral anticoagulant care vs. management by specialized anticoagulation clinics: positive effects on quality of life. J Thromb Haemost 2004 ; 2: 584-91. Gallus AS, Baker RI, Chong BH, Ockelford PA, Street AM. Consensus guidelines for warfarin therapy. Recommendations from the Australasian Society of Thrombosis and Haemostasis. Med J Aust. 2000;172 :600-5. Hall, J. and Radley, A. A role for community pharmacists in the control of anticoagulant therapy. Pharm J 1994; 252, 230-232.
Havdra DE, Hawk TL, Marvin CM. Accuracy and precision of the Coaguchek S versus laboratory INRs in a clinic. Ann Pharmacother 2002;36:769-775. Halstead PJ, Roughead EE, Rigby K, Clark RB, Gallus AS. Towards the safer use of warfarin II: results of a workshop. J Qual Clin Pract. 1999;19:61-2. Holden J, Holden K. Comparative effectiveness of general practitioner versus pharmacist dosing of patients requiring anticoagulation in the community. J Clin Pharm Ther 2000;25:49-54 Hylek EM, Skates SJ, Sheehan MA, Singer DE. An analysis of the lowest effective intensity of prophylactic anticoagulation for patients with non-rheumatic atrial fibrillation. N Engl J Med 1996; 335: 540-6. Jackson SL, Peterson GM, House M, Bartlett T. Point-of-care monitoring of anticoagulant therapy by rural community pharmacists: description of successful outcomes. Aust J Rural Health. 2004a; 12:197-200. Jackson SL, Peterson GM, Vial JH. A community-based educational intervention to improve antithrombotic drug use in atrial fibrillation. Ann Pharmacother. 2004b; 38: 1794-9. Jackson SL, Bereznicki LR, Peterson GM, Marsden KA, Jupe DM, Vial JH, Rasiah RL, Misan G, Williams SM. Accuracy and clinical usefulness of the near-patient testing CoaguChek S international normalised ratio monitor in rural medical practice. Aust J Rural Health. 2004c ;12:137-42. Jackson SL, Peterson GM, Vial JH, Jupe DM. Improving the outcomes of anticoagulation: an evaluation of home follow-up of warfarin initiation. J Intern Med. 2004d; 256: 137-44. Jackson SL, Bereznicki LR, Peterson GM, Marsden KA, Jupe DM, Tegg E, Vial JH, Kimber RI. Accuracy, reproducibility and clinical utility of the CoaguChek S portable international normalized ratio monitor in an outpatient anticoagulation clinic. Clin Lab Haematol. 2004e;26:49-55. Jones M, McEwan P, Morgan CL, Peters JR, Goodfellow J, Currie CJ. Evaluation of the pattern of treatment, level of anticoagulation control, and outcome of treatment with warfarin in patients with non-valvar atrial fibrillation: a record linkage study in a large British population. Heart 2005; 91: 472-7. Khan TI, Kamali F, Kesteven P, Avery P, Wynne H. The value of education and self-monitoring in the management of warfarin therapy in older patients with unstable control of anticoagulation. Br J Haematol 2004 ;126 :557-64. Knowlton CH, Thomas OV, Williamson A, Gammaitoni AR, Kirchain WR, Buttaro ML, Zarus SA. Establishing community pharmacy-based anticoagulation education and monitoring programs. J Am Pharm Assoc 1999;39:368-74. Lane D, Lip GY. Anti-thrombotic therapy for atrial fibrillation and patients' preferences for treatment. Age Ageing. 2005;34:1-3. Levine MN, Raskob G, Landefeld S, Kearon C. Hemorrhagic complications of anticoagulant treatment. Chest. 2001;119 :108S-121S

A community pharmacy based anticoagulant management service McLachlan, Spindler, Fois, Krass, Chen and Bajorek
79
Linkins LA, Choi PT, Douketis JD. Clinical impact of bleeding in patients taking oral anticoagulant therapy for venous thromboembolism: a meta-analysis. Ann Intern Med. 2003 ;139 :893-900. McCurdy M. Oral anticoagulation monitoring in a community pharmacy. Am Pharm. 1993; NS33: 61-70. Macgregor, S., Hamley, J., Dunbar, J., Dodd, T. and Cromarty, J. Evaluation of a primary care anticoagulant clinic managed by a pharmacist. Brit Med J 1996; 312: 560. Mason, P. Near-patient testing in the pharmacy. Pharm J 2004; 272:708-710 McLachlan A. Warfarin drug interactions. Australian Pharmacist 2000; 19: 38-46. Murray ET, Greaves M. INRs and point of care testing. BMJ. 2003;327:5-6 Murray ET, Fitzmaurice DA, Allan TF, Hobbs FD. A primary care evaluation of three near patient coagulometers. J Clin Pathol 1999 ;52 :842-5. Oden A, Fahlen M. Oral anticoagulation and risk of death: a medical record linkage study. BMJ 2002; 325 :1073-5. Peterson GM, Boom K, Jackson SL, Vial JH. Doctors' beliefs on the use of antithrombotic therapy in atrial fibrillation: identifying barriers to stroke prevention. Intern Med J 2002; 32: 15-23. Poller L, Keown M, Chauhan N, van den Besselaar AM, Tripodi A, Shiach C, Jespersen J. Reliability of international normalised ratios from two point of care test systems: comparison with conventional methods. BMJ 2003;327:30: 1-5. Rosendaal FR, Cannegieter SC, van der Meer FJ, Briet E. A method to determine the optimal intensity of oral anticoagulant therapy. Thromb Haemost. 1993;69:236-9.
Runciman WB, Roughead EE, Semple SJ, Adams RJ. Adverse drug events and medication errors in Australia. Int J Qual Health Care. 2003;15 Suppl 1:i49-59.
Samsa GP, Matchar DB. Relationship between test frequency and outcomes of anticoagulation: a literature review and commentary with implications for the design of randomized trials of patients self-management. J Thromb Thrombolysis 2000; 9:283-292. Sawicki PT. A structured teaching and self-management program for patients receiving oral anticoagulation: a randomized controlled trial. Working Group for the Study of Patient Self-Management of Oral Anticoagulation. JAMA. 1999; 281:145-50. Taborski U, Braun SL, Voller H. Analytical performance of the new coagulation monitoring system INRatio for the determination of INR compared with the coagulation monitor Coaguchek S and an established laboratory method. J Thromb Thrombolysis. 2004; 18: 103-7. To, E. and Pearson, G. Implementation and evaluation of a pharmacist-assisted warfarin dosing program. Can J Hosp Pharm 1997; 50, 169-175. Tschol N, Lai DK, Tilley JA, Wong H, Brown GR. Comparison of physician- and pharmacist-managed warfarin sodium treatment in open heart surgery patients. Can J Cardiol 2003; 19:1413-7. Van den Besselaar. Accuracy, Precision and Quality Control for Point-of-care testing for oral anticoagulation. J Thrombosis Thrombolysis 2001; 21:35-40 Voller H, Dovifat C, Glatz J, Kortke H, Taborski U, Wegscheider K. Self management of oral anticoagulation with the IN Ratio system: impact of a structured teaching program on patient's

A community pharmacy based anticoagulant management service McLachlan, Spindler, Fois, Krass, Chen and Bajorek
80
knowledge of medical background and procedures. Eur J Cardiovasc Prev Rehabil. 2004 ; 11: 442-7 Walters K, Bajorek B. The Impact of Warfarin Knowledge on Quality of Life. J Pharm Prac Res 2005; in press Wilson SJ, Wells PS, Kovacs MJ, Lewis GM, Martin J, Burton E, Anderson DR. Comparing the quality of oral anticoagulant management by anticoagulation clinics and by family physicians: a randomized controlled trial. CMAJ 2003 ;169:293-8 Witt DM, Sadler MA, Shanahan RL, Mazzoli G, Tillman DJ. Effect of a centralized clinical pharmacy anticoagulation service on the outcomes of anticoagulation therapy. Chest. 2005;127:1515-22. Witt DM, Humphries TL. A retrospective evaluation of the management of excessive anticoagulation in an established clinical pharmacy anticoagulation service compared to traditional care. J Thromb Thrombolysis 2003 ;15 :113-8.
A community pharmacy based anticoagulant management service McLachlan, Spindler, Fois, Krass, Chen and Bajorek
81
Appendices 1. Pharmacist Study Information and Consent forms
2. General Practitioner Study Information and Consent forms
3. Patient Study Information and Consent forms
4. Educational training session for pharmacists – including copies of slides and
educational protocols
5. Patient Education Booklet
6. (a) Study flow chart
(b) Pharmacy Specific Dosing Protocol (adapted from Foss et al, 1999).
7. Pharmacist Recommendation Fax form for Communication to General
Practitioners
8. Data collection sheets used in this study
9. Quality of Life Assessment tool (adapted from Sawicki, 1999)
10. Warfarin Knowledge Assessment Questionnaire
11. Individual patient clinical and demographic characteristics
12. Summary of patients recruited into the study and the data they contributed
13. Patient Responses to Semi-structured interview on experiences in the study
14. Pharmacists Responses to questionnaire on experiences in the study