6 managing quality - johannessimatupang’s weblog · 6 managing quality powerpoint ... ðumanaging...
TRANSCRIPT
27/11/2014
1
6 - 1© 2011 Pearson Education, Inc. publishing as Prentice Hall
66 Managing QualityManaging Quality
PowerPoint presentation to accompanyHeizer and RenderOperations Management, 10ePrinciples of Operations Management, 8e
PowerPoint slides by Jeff Heyl
6 - 2© 2011 Pearson Education, Inc. publishing as Prentice Hall
Quality and Strategy
Strategi manajer operasisasarannya adalah membangun
sistem TQM yang mengidentifikasidan memuaskan pelanggan.
6 - 3© 2011 Pearson Education, Inc. publishing as Prentice Hall
Quality and Strategy
Managing quality supportsdifferentiation, low cost, andresponse strategies
Quality helps firms increasesales and reduce costs
Building a quality organization isa demanding task

27/11/2014
2
6 - 4© 2011 Pearson Education, Inc. publishing as Prentice Hall
Two Ways QualityImproves Profitability
ImprovedQuality
IncreasedProfits
Increased productivity Lower rework and scrap costs Lower warranty costs
Reduced Costs via
Improved response Flexible pricing Improved reputation
Sales Gains via
Figure 6.1
6 - 5© 2011 Pearson Education, Inc. publishing as Prentice Hall
The Flow of ActivitiesOrganizational Practices
Leadership, Mission statement, Effective operatingprocedures, Staff support, TrainingYields: What is important and what is to be
accomplishedQuality Principles
Customer focus, Continuous improvement, Benchmarking,Just-in-time, Tools of TQMYields: How to do what is important and to be
accomplishedEmployee Fulfillment
Empowerment, Organizational commitmentYields: Employee attitudes that can accomplish
what is importantCustomer Satisfaction
Winning orders, Repeat customersYields: An effective organization with
a competitive advantageFigure 6.2
6 - 6© 2011 Pearson Education, Inc. publishing as Prentice Hall
Defining Quality
The totality of features andcharacteristics of a product or
service that bears on its ability tosatisfy stated or implied needs
American Society for Quality

27/11/2014
3
6 - 7© 2011 Pearson Education, Inc. publishing as Prentice Hall
Different Views
User-based: better performance,more features
Manufacturing-based:conformance to standards,making it right the first time
Product-based: specific andmeasurable attributes of theproduct
6 - 8© 2011 Pearson Education, Inc. publishing as Prentice Hall
Implications of Quality1. Company reputation
Perception of new products Employment practices Supplier relations
2. Product liability Reduce risk
3. Global implications Improved ability to compete
6 - 9© 2011 Pearson Education, Inc. publishing as Prentice Hall
Key Dimensions of QualityKey Dimensions of Quality
Performance Features Reliability Conformance
Durability Serviceability Aesthetics Perceived quality Value

27/11/2014
4
6 - 10© 2011 Pearson Education, Inc. publishing as Prentice Hall
Costs of Quality
Prevention costs - reducing thepotential for defects
Appraisal costs - evaluatingproducts, parts, and services
Internal failure - producing defectiveparts or service before delivery
External costs - defects discoveredafter delivery
6 - 11© 2011 Pearson Education, Inc. publishing as Prentice Hall
External Failure
Internal Failure
Prevention
Costs of Quality
Appraisal
TotalCost
Quality Improvement
Total Cost
6 - 12© 2011 Pearson Education, Inc. publishing as Prentice Hall
Ethics and QualityManagement
Operations managers must deliverhealthy, safe, quality products andservices
Poor quality risks injuries, lawsuits,recalls, and regulation
Organizations are judged by howthey respond to problems
All stakeholders much beconsidered

27/11/2014
5
6 - 13© 2011 Pearson Education, Inc. publishing as Prentice Hall
International QualityStandards
ISO 9000 series (Europe/EC) Common quality standards for products
sold in Europe (even if made in U.S.) 2008 update places greater emphasis on
leadership and customer requirementsand satisfaction
ISO 14000 series (Europe/EC)
6 - 14© 2011 Pearson Education, Inc. publishing as Prentice Hall
ISO 14000Environmental Standard
Core Elements:
Environmental management Auditing Performance evaluation Labeling Life cycle assessment
6 - 15© 2011 Pearson Education, Inc. publishing as Prentice Hall
ISO 14000Environmental Standard
Advantages: Positive public image and reduced
exposure to liability Systematic approach to pollution
prevention Compliance with regulatory
requirements and opportunities forcompetitive advantage
Reduction in multiple audits

27/11/2014
6
6 - 16© 2011 Pearson Education, Inc. publishing as Prentice Hall
TQM
Encompasses entire organization,from supplier to customer
Stresses a commitment bymanagement to have a continuing,
companywide drive towardexcellence in all aspects of productsand services that are important to the
customer
6 - 17© 2011 Pearson Education, Inc. publishing as Prentice Hall
Seven Concepts of TQM1. Continuous improvement2. Six Sigma3. Employee empowerment4. Benchmarking5. Just-in-time (JIT)6. Taguchi concepts7. Knowledge of TQM tools
6 - 18© 2011 Pearson Education, Inc. publishing as Prentice Hall
Continuous Improvement
Represents continualimprovement of all processes
Involves all operations and workcenters including suppliers andcustomersPeople, Equipment, Materials,
Procedures

27/11/2014
7
6 - 19© 2011 Pearson Education, Inc. publishing as Prentice Hall
Six Sigma
Two meanings Statistical definition of a process that
is 99.9997% capable, 3.4 defects permillion opportunities (DPMO)
A program designed to reducedefects, lower costs, and improvecustomer satisfaction
6 - 20© 2011 Pearson Education, Inc. publishing as Prentice Hall
Two meanings Statistical definition of a process that
is 99.9997% capable, 3.4 defects permillion opportunities (DPMO)
A program designed to reducedefects, lower costs, and improvecustomer satisfaction
Six Sigma
Mean
Lower limits Upper limits
3.4 defects/million
±6
2,700 defects/million
±3
Figure 6.4
6 - 21© 2011 Pearson Education, Inc. publishing as Prentice Hall
Employee Empowerment Getting employees involved in product
and process improvements 85% of quality problems are due
to process and material
Techniques Build communication networks
that include employees Develop open, supportive supervisors Move responsibility to employees Build a high-morale organization Create formal team structures

27/11/2014
8
6 - 22© 2011 Pearson Education, Inc. publishing as Prentice Hall
BenchmarkingSelecting best practices to use as astandard for performance
1. Determine what tobenchmark
2. Form a benchmark team3. Identify benchmarking partners4. Collect and analyze benchmarking
information5. Take action to match or exceed the
benchmark
6 - 23© 2011 Pearson Education, Inc. publishing as Prentice Hall
Just-in-Time (JIT)
Relationship to quality:
JIT cuts the cost of quality JIT improves quality Better quality means less
inventory and better, easier-to-employ JIT system
6 - 24© 2011 Pearson Education, Inc. publishing as Prentice Hall
Just-in-Time (JIT)
‘Pull’ system of production schedulingincluding supply management Production only when signaled
Allows reduced inventory levels Inventory costs money and hides process
and material problems Encourages improved process and
product quality

27/11/2014
9
6 - 25© 2011 Pearson Education, Inc. publishing as Prentice Hall
Just-In-Time (JIT) Example
ScrapUnreliableVendors
CapacityImbalances
Work in processinventory level
(hides problems)
6 - 26© 2011 Pearson Education, Inc. publishing as Prentice Hall
Just-In-Time (JIT) Example
Reducing inventory revealsproblems so they can be solved
ScrapUnreliableVendors
CapacityImbalances
6 - 27© 2011 Pearson Education, Inc. publishing as Prentice Hall
Taguchi Concepts Engineering and experimental
design methods to improve productand process design Identify key component and process
variables affecting product variation Taguchi Concepts
Quality robustness Quality loss function Target-oriented quality

27/11/2014
10
6 - 28© 2011 Pearson Education, Inc. publishing as Prentice Hall
Quality Robustness
Ability to produce productsuniformly in adverse manufacturingand environmental conditions Remove the effects of adverse
conditions Small variations in materials and
process do not destroy productquality
6 - 29© 2011 Pearson Education, Inc. publishing as Prentice Hall
Quality Loss Function Shows that costs increase as the
product moves away from whatthe customer wants
Costs include customerdissatisfaction, warrantyand service, internalscrap and repair, and costs tosociety
Traditional conformancespecifications are too simplistic
6 - 30© 2011 Pearson Education, Inc. publishing as Prentice Hall
Unacceptable
Poor
GoodBest
Fair
Quality Loss FunctionHigh loss
Loss (toproducingorganization,customer,and society)
Low loss
Frequency
Lower Target UpperSpecification
Target-oriented qualityyields more product inthe “best” category
Target-oriented qualitybrings product towardthe target valueConformance-orientedquality keeps productswithin 3 standarddeviations
Figure 6.5
L = D2Cwhere
L = loss to societyD = distance from
target valueC = cost of deviation

27/11/2014
11
6 - 31© 2011 Pearson Education, Inc. publishing as Prentice Hall
Tools of TQM
Tools for Generating Ideas Check sheets Scatter diagrams Cause-and-effect diagrams
Tools to Organize the Data Pareto charts Flowcharts
6 - 32© 2011 Pearson Education, Inc. publishing as Prentice Hall
Tools of TQM Tools for Identifying Problems
Histogram Statistical process control chart
6 - 33© 2011 Pearson Education, Inc. publishing as Prentice Hall
//
/ / /// /// ///// ////
//////
HourDefect 1 2 3 4 5 6 7 8
ABC
////
/
Seven Tools of TQM(a) Check Sheet: An organized method of
recording data
Figure 6.6

27/11/2014
12
6 - 34© 2011 Pearson Education, Inc. publishing as Prentice Hall
Seven Tools of TQM(b) Scatter Diagram: A graph of the value
of one variable vs. another variable
Absenteeism
Prod
uctiv
ity
Figure 6.6
6 - 35© 2011 Pearson Education, Inc. publishing as Prentice Hall
Seven Tools of TQM(c) Cause-and-Effect Diagram: A tool that
identifies process elements (causes) thatmight effect an outcome
Figure 6.6
CauseMaterials Methods
Manpower Machinery
Effect
6 - 36© 2011 Pearson Education, Inc. publishing as Prentice Hall
Seven Tools of TQM(d) Pareto Chart: A graph to identify and plot
problems or defects in descending order offrequency
Figure 6.6
Freq
uenc
y
Perc
ent
A B C D E

27/11/2014
13
6 - 37© 2011 Pearson Education, Inc. publishing as Prentice Hall
Seven Tools of TQM(e) Flowchart (Process Diagram): A chart that
describes the steps in a process
Figure 6.6
6 - 38© 2011 Pearson Education, Inc. publishing as Prentice Hall
Seven Tools of TQM(f) Histogram: A distribution showing the
frequency of occurrences of a variable
Figure 6.6
Distribution
Repair time (minutes)
Freq
uenc
y
6 - 39© 2011 Pearson Education, Inc. publishing as Prentice Hall
Seven Tools of TQM(g) Statistical Process Control Chart: A chart with
time on the horizontal axis to plot values of astatistic
Figure 6.6
Upper control limit
Target value
Lower control limit
Time

27/11/2014
14
6 - 40© 2011 Pearson Education, Inc. publishing as Prentice Hall
Cause-and-Effect DiagramsMaterial
(ball)Method
(shooting process)
Machine(hoop &
backboard)Manpower(shooter)
Missedfree-throws
Figure 6.7
Rim alignment
Rim size
Backboardstability
Rim height
Follow-through
Hand position
Aiming point
Bend knees
Balance
Size of ball
Lopsidedness
Grain/Feel(grip)
Air pressure
Training
Conditioning Motivation
Concentration
Consistency
6 - 41© 2011 Pearson Education, Inc. publishing as Prentice Hall
Pareto Charts
Number ofoccurrences
Room svc Check-in Pool hours Minibar Misc.72% 16% 5% 4% 3%
124 3 2
54
– 100– 93– 88
– 72
70 –
60 –
50 –
40 –
30 –
20 –
10 –
0 –
Freq
uenc
y (n
umbe
r)
Causes and percent of the total
Cum
ulat
ive
perc
ent
Data for October
6 - 42© 2011 Pearson Education, Inc. publishing as Prentice Hall
Flow Charts
MRI Flowchart1. Physician schedules MRI2. Patient taken to MRI3. Patient signs in4. Patient is prepped5. Technician carries out MRI6. Technician inspects film
7. If unsatisfactory, repeat8. Patient taken back to room9. MRI read by radiologist10. MRI report transferred to
physician11. Patient and physician discuss
11
10
20%
9
880%
1 2 3 4 5 6 7

27/11/2014
15
6 - 43© 2011 Pearson Education, Inc. publishing as Prentice Hall
Statistical Process Control(SPC)
Uses statistics and control charts totell when to take corrective action
Drives process improvement Four key steps
Measure the process When a change is indicated, find the
assignable cause Eliminate or incorporate the cause Restart the revised process
6 - 44© 2011 Pearson Education, Inc. publishing as Prentice Hall
An SPC Chart
Upper control limit
Coach’s target value
Lower control limit
Game number
| | | | | | | | |1 2 3 4 5 6 7 8 9
20%
10%
0%
Plots the percent of free throws missed
Figure 6.8
6 - 45© 2011 Pearson Education, Inc. publishing as Prentice Hall
Inspection Involves examining items to see if
an item is good or defective Detect a defective product
Does not correct deficiencies inprocess or product
It is expensive Issues
When to inspect Where in process to inspect

27/11/2014
16
6 - 46© 2011 Pearson Education, Inc. publishing as Prentice Hall
When and Where to Inspect1. At the supplier’s plant while the supplier is
producing2. At your facility upon receipt of goods from
the supplier3. Before costly or irreversible processes4. During the step-by-step production
process5. When production or service is complete6. Before delivery to your customer7. At the point of customer contact
6 - 47© 2011 Pearson Education, Inc. publishing as Prentice Hall
Inspection Many problems
Worker fatigue Measurement error Process variability
Cannot inspect quality into aproduct
Robust design, empoweredemployees, and sound processesare better solutions
6 - 48© 2011 Pearson Education, Inc. publishing as Prentice Hall
Source Inspection
Also known as source control The next step in the process is
your customer Ensure perfect product
to your customer
Poka-yoke is the concept of foolproof devicesor techniques designed to pass only
acceptable product
27/11/2014
17
6 - 49© 2011 Pearson Education, Inc. publishing as Prentice Hall
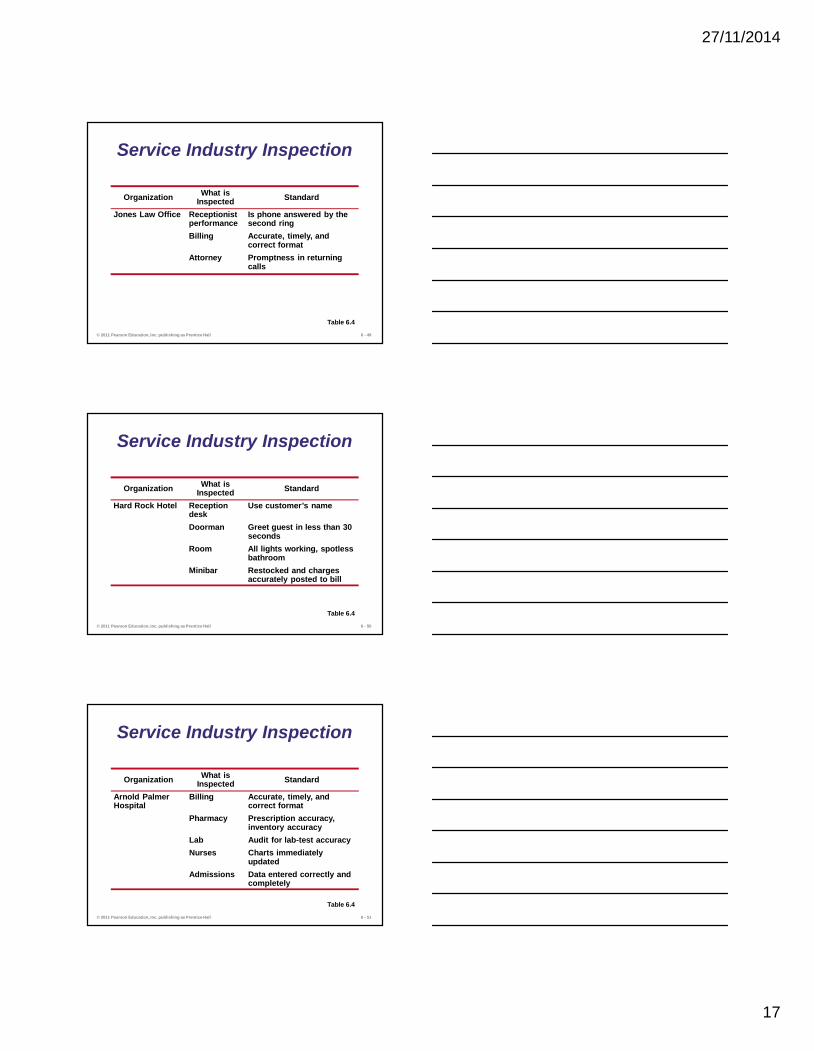
Service Industry Inspection
Organization What isInspected Standard
Jones Law Office ReceptionistperformanceBilling
Attorney
Is phone answered by thesecond ringAccurate, timely, andcorrect formatPromptness in returningcalls
Table 6.4
6 - 50© 2011 Pearson Education, Inc. publishing as Prentice Hall
Service Industry Inspection
Organization What isInspected Standard
Hard Rock Hotel ReceptiondeskDoorman
Room
Minibar
Use customer’s name
Greet guest in less than 30secondsAll lights working, spotlessbathroomRestocked and chargesaccurately posted to bill
Table 6.4
6 - 51© 2011 Pearson Education, Inc. publishing as Prentice Hall
Service Industry Inspection
Organization What isInspected Standard
Arnold PalmerHospital
Billing
Pharmacy
LabNurses
Admissions
Accurate, timely, andcorrect formatPrescription accuracy,inventory accuracyAudit for lab-test accuracyCharts immediatelyupdatedData entered correctly andcompletely
Table 6.4

27/11/2014
18
6 - 52© 2011 Pearson Education, Inc. publishing as Prentice Hall
Service Industry Inspection
Organization What isInspected Standard
Olive GardenRestaurant
Busboy
Busboy
Waiter
Serves water and breadwithin 1 minuteClears all entrée items andcrumbs prior to dessertKnows and suggestspecials, desserts
Table 6.4
6 - 53© 2011 Pearson Education, Inc. publishing as Prentice Hall
Service Industry Inspection
Organization What isInspected Standard
NordstromDepartmentStore
Display areas
Stockrooms
Salesclerks
Attractive, well-organized,stocked, good lightingRotation of goods,organized, cleanNeat, courteous, veryknowledgeable
Table 6.4
6 - 54© 2011 Pearson Education, Inc. publishing as Prentice Hall
Attributes Versus Variables Attributes
Items are either good or bad,acceptable or unacceptable
Does not address degree of failure Variables
Measures dimensions such as weight,speed, height, or strength
Falls within an acceptable range Use different statistical techniques

27/11/2014
19
6 - 55© 2011 Pearson Education, Inc. publishing as Prentice Hall
TQM In Services
Service quality is more difficult tomeasure than the quality of goods
Service quality perceptions dependon Intangible differences between
products Intangible expectations customers
have of those products
6 - 56© 2011 Pearson Education, Inc. publishing as Prentice Hall
Service QualityThe Operations Manager mustrecognize:
1. The tangible component ofservices is important
2. The service process is important3. The service is judged against the
customer’s expectations4. Exceptions will occur
6 - 57© 2011 Pearson Education, Inc. publishing as Prentice Hall
ServiceSpecifications
at UPS

27/11/2014
20
6 - 58© 2011 Pearson Education, Inc. publishing as Prentice Hall
Determinants of ServiceQuality
Reliability Consistency of performance and dependability
Responsiveness Willingness or readiness of employees
Competence Required skills and knowledge
Access Approachability and ease of contact
Courtesy Politeness, respect, consideration, friendliness
Communication Keeping customers informed
Credibility Trustworthiness, believability, honesty
Security Freedom from danger, risk, or doubtUnderstanding/knowing the customer Understand the customer’s needs
Tangibles Physical evidence of the service
Table 6.5
6 - 59© 2011 Pearson Education, Inc. publishing as Prentice Hall
Service Recovery Strategy
Managers should have a plan forwhen services fail
Marriott’s LEARN routine Listen Empathize Apologize React Notify
6 - 60© 2011 Pearson Education, Inc. publishing as Prentice Hall
All rights reserved. No part of this publication may be reproduced, stored in a retrievalsystem, or transmitted, in any form or by any means, electronic, mechanical, photocopying,
recording, or otherwise, without the prior written permission of the publisher.Printed in the United States of America.