5 th february 2014 india-california air-pollution mitigation program (icamp) initiative for air...
TRANSCRIPT
Congestion Management
Dr.Kayitha Ravinder & Dr Errampalli MadhuPrincipal Scientist
CSIR-Central Road Research InstituteNew Delhi-25
5th February 2014
India-California Air-Pollution Mitigation Program (ICAMP)
Initiative for Air Mitigating Pollution from the Transportation Sector
Introduction Overview of the Congestion Mitigation
Measures Congestion Mitigation measures feasibility/
relevance to Indian (Delhi) conditions Conclusions
Presentation Outline
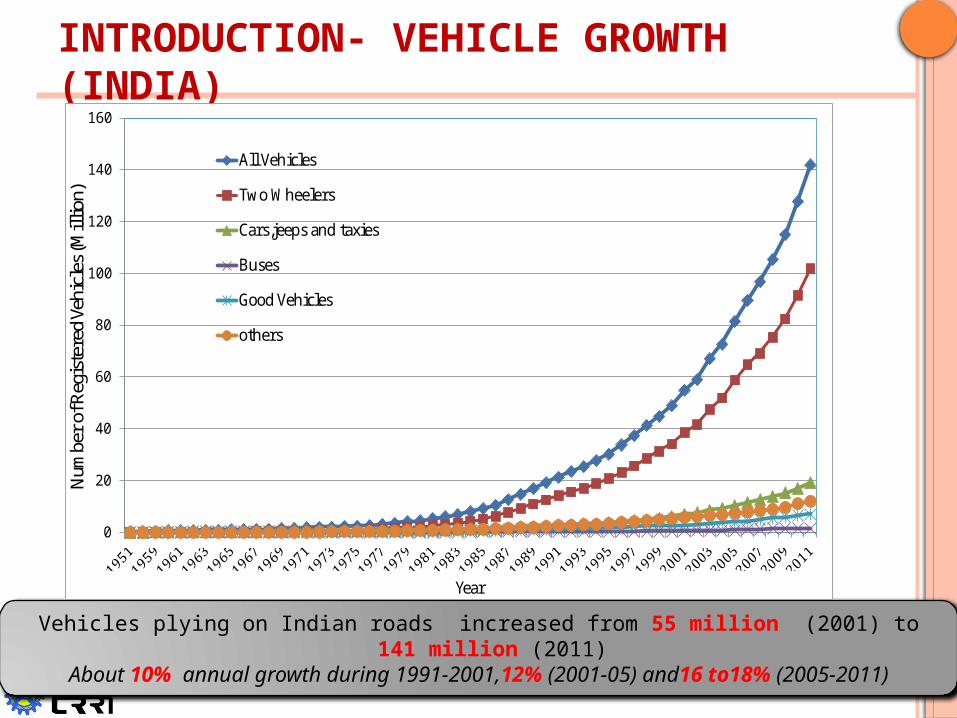
INTRODUCTION- VEHICLE GROWTH (INDIA)
Vehicles plying on Indian roads increased from 55 million (2001) to 141 million (2011)
About 10% annual growth during 1991-2001,12% (2001-05) and16 to18% (2005-2011)
0
20
40
60
80
100
120
140
160
Num
ber
of R
egis
tere
d Ve
hicl
es (M
illio
n)
Year
All Vehicles
Two Wheelers
Cars,jeeps and taxies
Buses
Good Vehicles
others
0.0 0.1 0.1 0.1 0.1 0.1 0.2 0.2 0.2 0.30.6 0.7 0.8 0.9 1.0 1.0
1.6
2.7 2.83.1 3.3 3.3
5.3 5.46.1
7.2 7.48.0
9.9 10.2
13.0 13.3
15.6
17.4
0
2
4
6
8
10
12
14
16
18
Num
ber o
f Reg
iste
red
Vehi
cles
(Mill
ion)
State/Union Territory
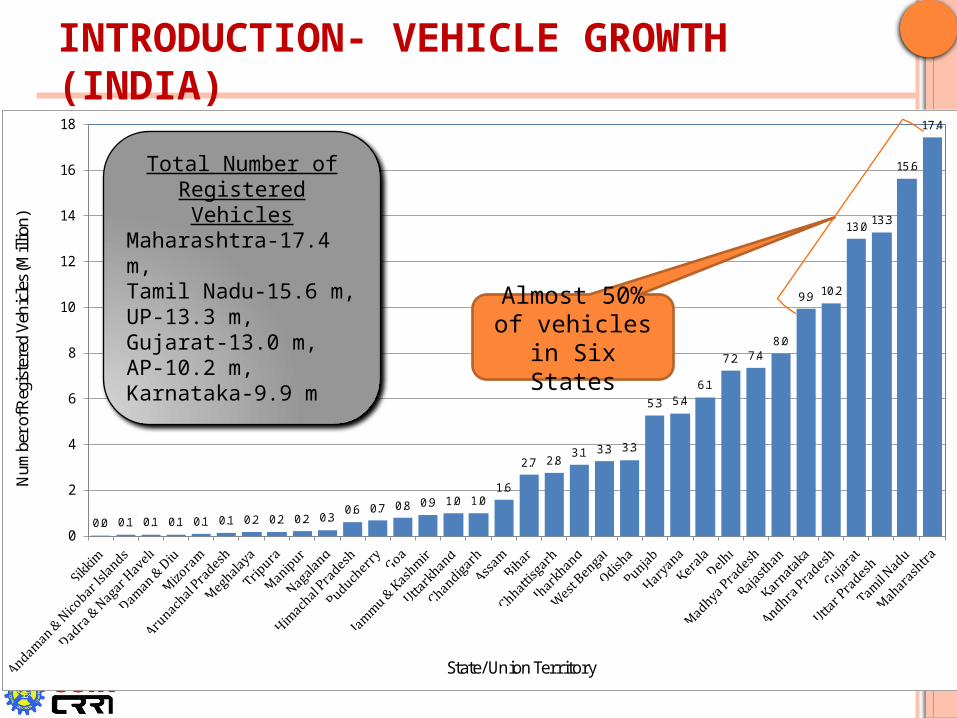
INTRODUCTION- VEHICLE GROWTH (INDIA)
Total Number of Registered Vehicles
Maharashtra-17.4 m,Tamil Nadu-15.6 m,UP-13.3 m, Gujarat-13.0 m,AP-10.2 m,Karnataka-9.9 m
Almost 50% of vehicles in
Six States
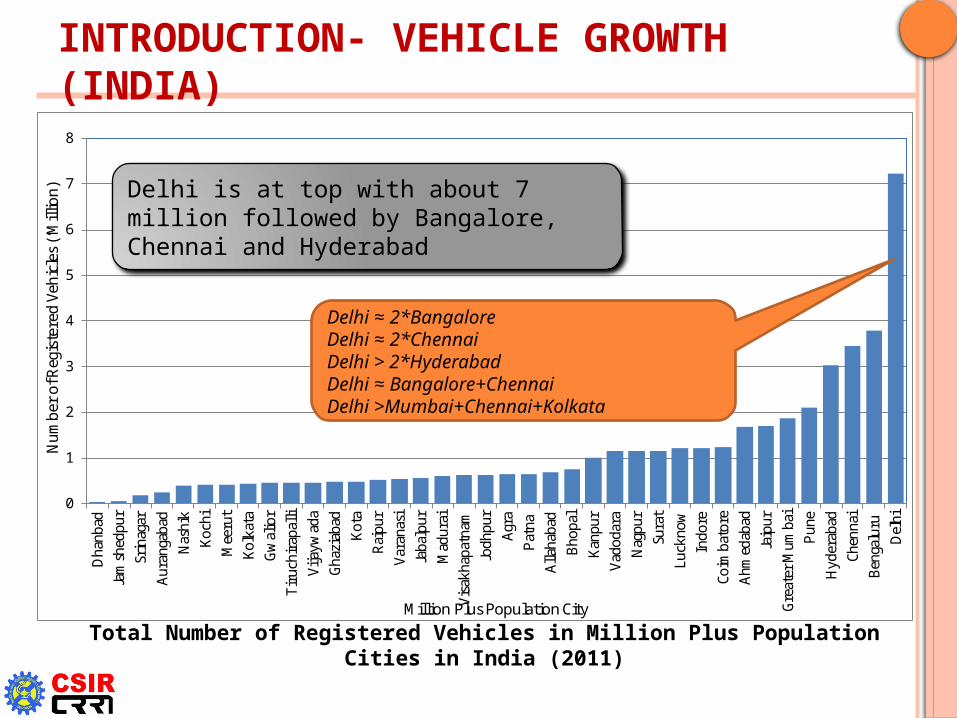
INTRODUCTION- VEHICLE GROWTH (INDIA)
Total Number of Registered Vehicles in Million Plus Population Cities in India (2011)
0
1
2
3
4
5
6
7
8
Dha
nbad
Jam
shed
pur
Srin
agar
Aur
anga
bad
Nas
hik
Koc
hi
Mee
rut
Kol
kata
Gw
alio
r
Tir
uchi
rapa
lli
Vija
ywad
a
Gha
ziab
ad
Kot
a
Rai
pur
Var
anas
i
Jaba
lpur
Mad
urai
Vis
akha
patn
am
Jodh
pur
Agr
a
Pat
na
Alla
haba
d
Bho
pal
Kan
pur
Vad
odar
a
Nag
pur
Sura
t
Luck
now
Indo
re
Coim
bato
re
Ahm
edab
ad
Jaip
ur
Gre
ater
Mum
bai
Pun
e
Hyd
erab
ad
Chen
nai
Ben
galu
ru
Del
hi
Num
ber
of R
egis
tere
d Ve
hicl
es (‘
Mill
ion)
Million Plus Population City
Delhi is at top with about 7 million followed by Bangalore, Chennai and Hyderabad
Delhi ≈ 2*BangaloreDelhi ≈ 2*ChennaiDelhi > 2*HyderabadDelhi ≈ Bangalore+ChennaiDelhi >Mumbai+Chennai+Kolkata
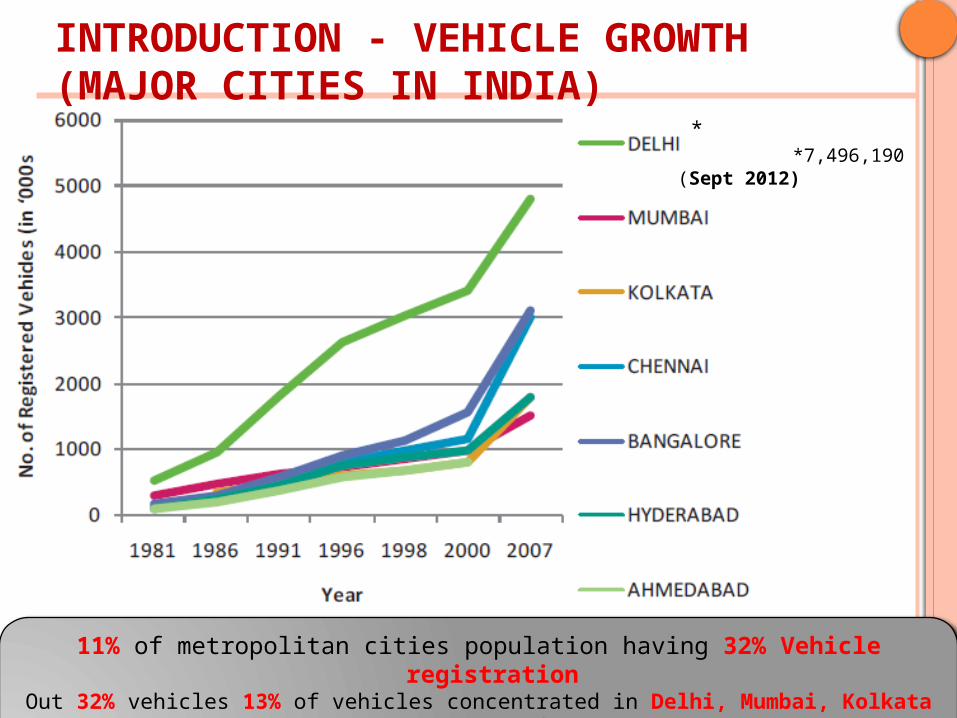
INTRODUCTION - VEHICLE GROWTH (MAJOR CITIES IN INDIA)
* *7,496,190 (Sept 2012)
11% of metropolitan cities population having 32% Vehicle registrationOut 32% vehicles 13% of vehicles concentrated in Delhi, Mumbai, Kolkata &
Chennai53.5 % in Delhi and rest 46.5% in (Mumbai, Kolkata & Chennai)
INTRODUCTION- VEHICLE GROWTH (INDIA)
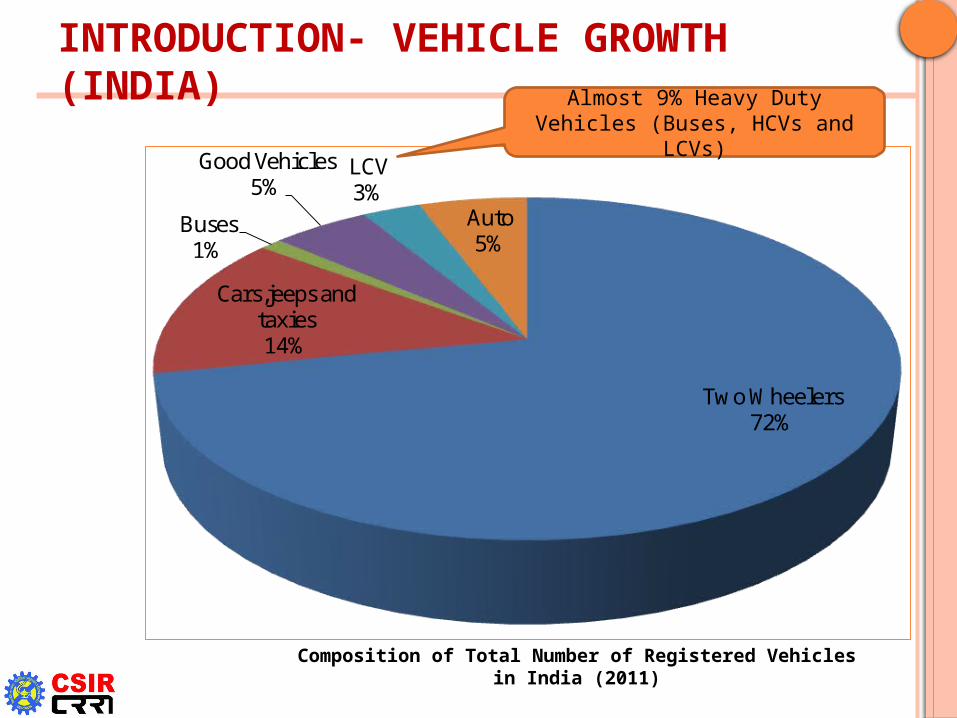
Two Wheelers72%
Cars,jeeps and taxies14%
Buses 1%
Good Vehicles5%
LCV3%
Auto5%
Composition of Total Number of Registered Vehicles in India (2011)
Almost 9% Heavy Duty Vehicles (Buses, HCVs and LCVs)
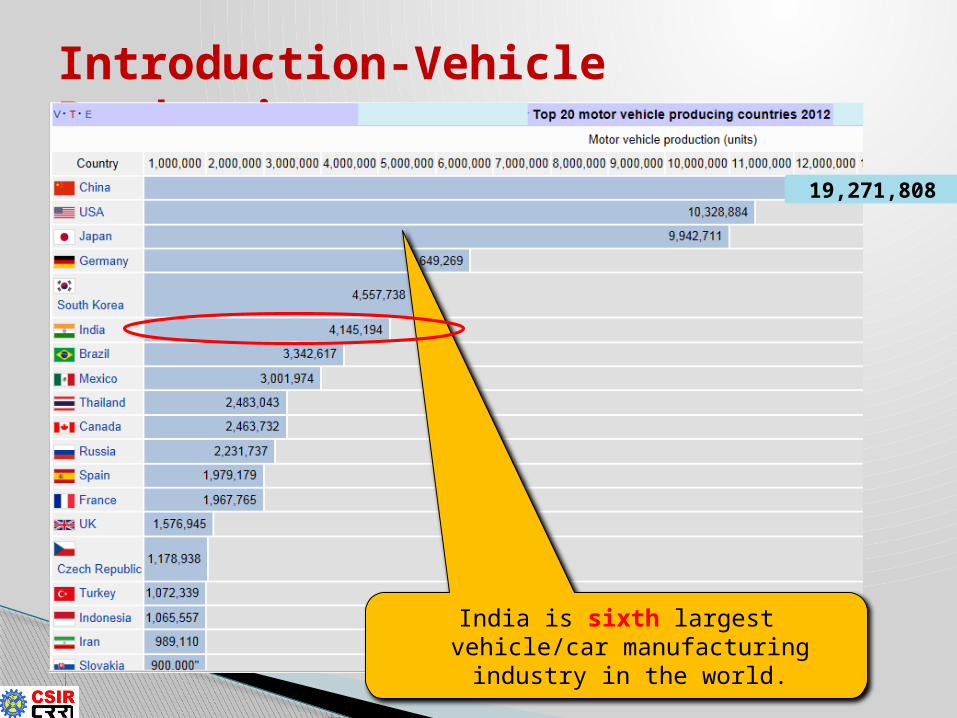
Introduction-Vehicle Production
19,271,808
India is sixth largest vehicle/car manufacturing industry in the world.
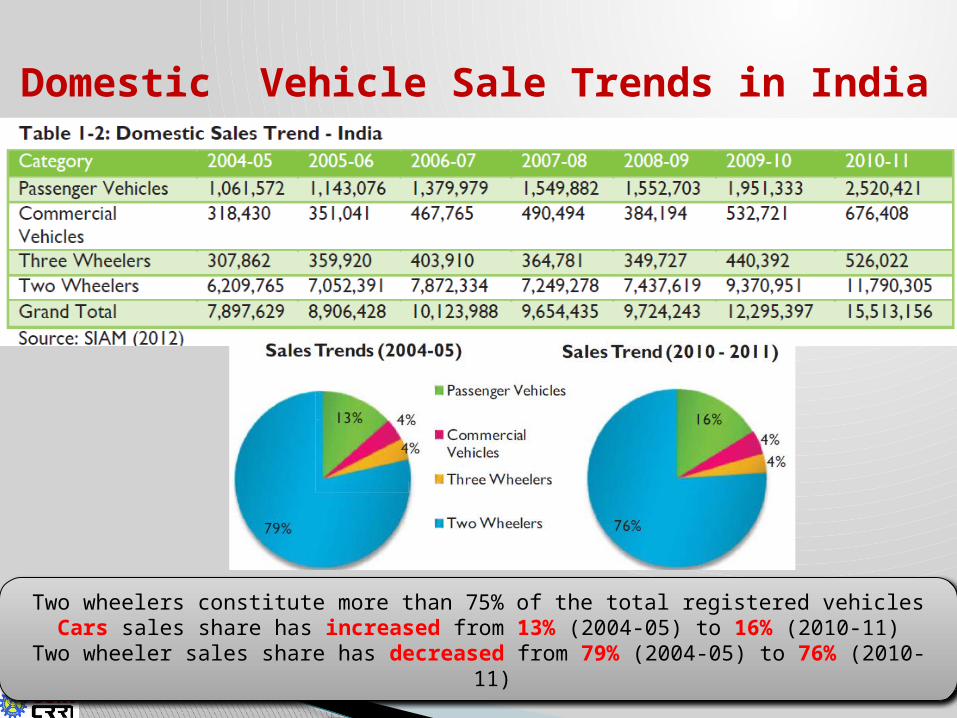
Domestic Vehicle Sale Trends in India
Two wheelers constitute more than 75% of the total registered vehiclesCars sales share has increased from 13% (2004-05) to 16% (2010-11)
Two wheeler sales share has decreased from 79% (2004-05) to 76% (2010-11)

Car Ownership in Mega Cities in India
Car modal share is between 30-40% of the total traffic in mega-cities, the vehicle share of car is only 8-14% % of cars is increasing, the peak hour journey speed is decreasingComparing it with public transport, it constitutes about 10-20% of thetotal traffic & its modal share is 30-55%.
2001
Delhi Traffic Conditions
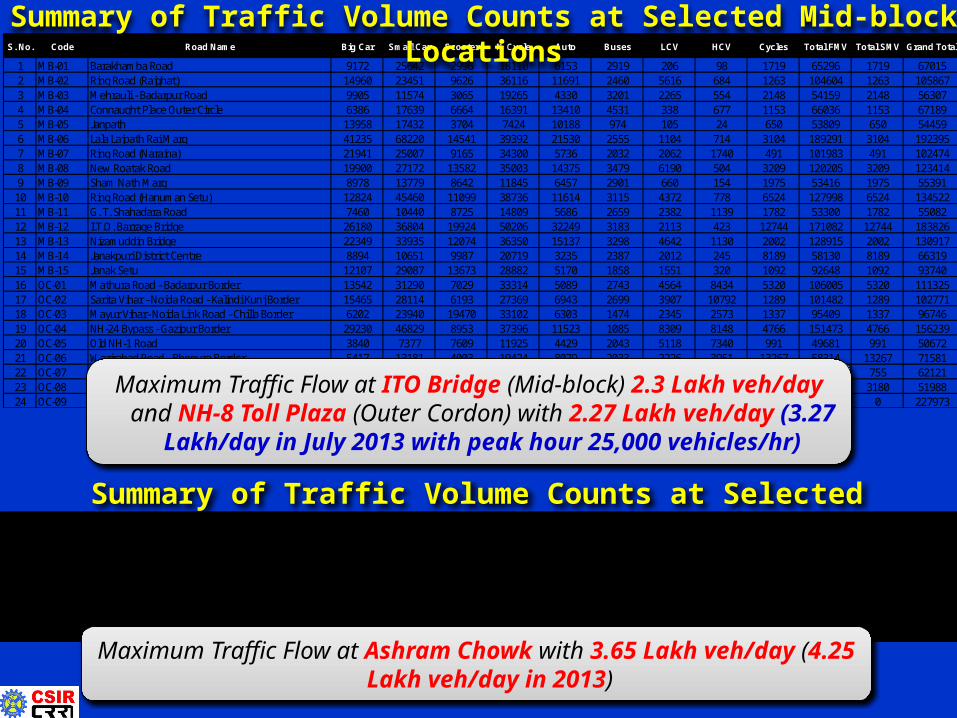
S. No. Code Road Name Big Car Small Car Scooter M Cycle Auto Buses LCV HCV Cycles Total FMV Total SMV Grand Total
1 MB-01 Barakhamba Road 9172 25642 2996 18110 6153 2919 206 98 1719 65296 1719 670152 MB-02 Ring Road (Rajghat) 14960 23451 9626 36116 11691 2460 5616 684 1263 104604 1263 1058673 MB-03 Mehrauli - Badarpur Road 9905 11574 3065 19265 4330 3201 2265 554 2148 54159 2148 563074 MB-04 Connaught Place Outer Circle 6386 17639 6664 16391 13410 4531 338 677 1153 66036 1153 671895 MB-05 Janpath 13958 17432 3704 7424 10188 974 105 24 650 53809 650 544596 MB-06 Lala Lajpath Rai Marg 41235 68220 14541 39392 21530 2555 1104 714 3104 189291 3104 1923957 MB-07 Ring Road (Naraina) 21941 25007 9165 34300 5736 2032 2062 1740 491 101983 491 1024748 MB-08 New Roatak Road 19900 27172 13582 35003 14375 3479 6190 504 3209 120205 3209 1234149 MB-09 Sham Nath Marg 8978 13779 8642 11845 6457 2901 660 154 1975 53416 1975 55391
10 MB-10 Ring Road (Hanuman Setu) 12824 45460 11099 38736 11614 3115 4372 778 6524 127998 6524 13452211 MB-11 G. T. Shahadara Road 7460 10440 8725 14809 5686 2659 2382 1139 1782 53300 1782 5508212 MB-12 I.T.O. Barrage Bridge 26180 36804 19924 50206 32249 3183 2113 423 12744 171082 12744 18382613 MB-13 Nizamuddin Bridge 22349 33935 12074 36350 15137 3298 4642 1130 2002 128915 2002 13091714 MB-14 Janakpuri District Centre 8894 10651 9987 20719 3235 2387 2012 245 8189 58130 8189 6631915 MB-15 Janak Setu 12107 29087 13673 28882 5170 1858 1551 320 1092 92648 1092 9374016 OC-01 Mathura Road - Badarpur Border 13542 31290 7029 33314 5089 2743 4564 8434 5320 106005 5320 11132517 OC-02 Sarita Vihar - Noida Road - Kalindi Kunj Border 15465 28114 6193 27369 6943 2699 3907 10792 1289 101482 1289 10277118 OC-03 Mayur Vihar- Noida Link Road - Chilla Border 6202 23940 19470 33102 6303 1474 2345 2573 1337 95409 1337 9674619 OC-04 NH-24 Bypass - Gazipur Border 29230 46829 8953 37396 11523 1085 8309 8148 4766 151473 4766 15623920 OC-05 Old NH-1 Road 3840 7377 7609 11925 4429 2043 5118 7340 991 49681 991 5067221 OC-06 Wazirabad Road - Bhopura Border 5417 13181 4003 19424 8079 2033 2226 3951 13267 58314 13267 7158122 OC-07 G. T. Karnal Road - Singhu Border 11610 15018 2858 6792 239 4459 9785 10605 755 61366 755 6212123 OC-08 Rohtak Road - Tikri Border 9517 13532 4181 9028 162 2616 4714 5058 3180 48808 3180 5198824 OC-09 NH-8 Gurgoan Road - Toll Plaza 78316 88413 4714 37437 0 3627 5868 9598 0 227973 0 227973
Summary of Traffic Volume Counts at Selected Mid-block Locations
Summary of Traffic Volume Counts at Selected IntersectionsCode Intersection Name Big Car Small Car Scooter M Cycle Auto Buses LCV HCV Cycles Total FMV Total SMV Grand Total
I-01 Moti Nagar Intersection 40806 55967 35970 56537 24757 6301 10681 3701 10431 234719 10431 245149I-02 I.I.T. Intersection 42709 52587 15301 48073 25221 4248 5403 5920 7010 199462 7010 206472I-03 Ashram Intersection 70785 114446 20433 84049 36586 9359 10498 14078 4637 360234 4637 364871I-04 Madhuban Chowk 32549 45050 23072 44483 13868 5849 6842 3839 7438 175552 7438 182990I-05 Preet Vihar Intersection 36340 62643 34379 72452 28533 6169 4730 2567 11781 247811 11781 259592I-06 I.T.O. Intersection 28292 50316 19849 54012 36360 4162 3063 1885 5218 197939 5218 203157
Maximum Traffic Flow at ITO Bridge (Mid-block) 2.3 Lakh veh/day and NH-8 Toll Plaza (Outer Cordon) with 2.27 Lakh veh/day (3.27 Lakh/day
in July 2013 with peak hour 25,000 vehicles/hr)
Maximum Traffic Flow at Ashram Chowk with 3.65 Lakh veh/day (4.25 Lakh veh/day in 2013)
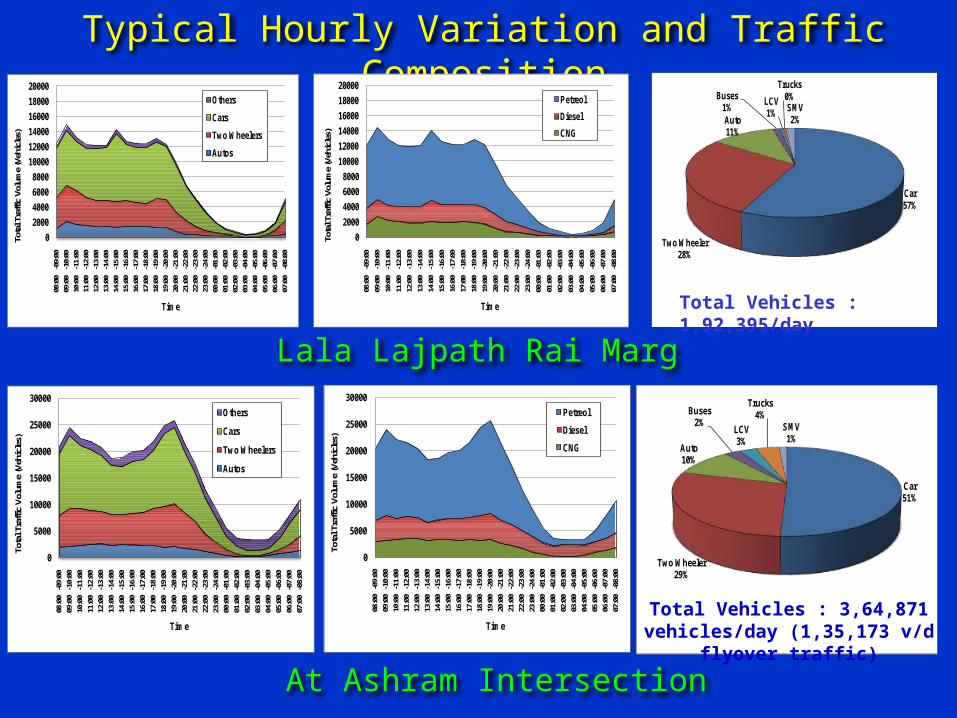
Typical Hourly Variation and Traffic Composition
0
2000
4000
6000
8000
10000
12000
14000
16000
18000
20000
08:0
0-0
9:00
09:0
0-1
0:00
10:0
0-1
1:00
11:0
0-1
2:00
12:0
0-1
3:00
13:0
0-1
4:00
14:0
0-1
5:00
15:0
0-1
6:00
16:0
0-1
7:00
17:0
0-1
8:00
18:0
0-1
9:00
19:0
0-2
0:00
20:0
0-2
1:00
21:0
0-2
2:00
22:0
0-2
3:00
23:0
0-2
4:00
00:0
0-0
1:00
01:0
0-0
2:00
02:0
0-0
3:00
03:0
0-0
4:00
04:0
0-0
5:00
05:0
0-0
6:00
06:0
0-0
7:00
07:0
0-0
8:00
Tota
l Tra
ffic
Volu
me
(Veh
icle
s)
Time
Others
Cars
Two Wheelers
Autos
0
2000
4000
6000
8000
10000
12000
14000
16000
18000
20000
08:0
0-0
9:00
09:0
0-1
0:00
10:0
0-1
1:00
11:0
0-1
2:00
12:0
0-1
3:00
13:0
0-1
4:00
14:0
0-1
5:00
15:0
0-1
6:00
16:0
0-1
7:00
17:0
0-1
8:00
18:0
0-1
9:00
19:0
0-2
0:00
20:0
0-2
1:00
21:0
0-2
2:00
22:0
0-2
3:00
23:0
0-2
4:00
00:0
0-0
1:00
01:0
0-0
2:00
02:0
0-0
3:00
03:0
0-0
4:00
04:0
0-0
5:00
05:0
0-0
6:00
06:0
0-0
7:00
07:0
0-0
8:00
Tota
l Tra
ffic
Volu
me
(Veh
icle
s)
Time
Petreol
Diesel
CNG
Car57%
Two Wheeler28%
Auto11%
Buses1%
LCV1%
Trucks0%SMV2%
Lala Lajpath Rai Marg
Total Vehicles : 1,92,395/day
0
5000
10000
15000
20000
25000
30000
08:0
0-0
9:00
09:0
0-1
0:00
10:0
0-1
1:00
11:0
0-1
2:00
12:0
0-1
3:00
13:0
0-1
4:00
14:0
0-1
5:00
15:0
0-1
6:00
16:0
0-1
7:00
17:0
0-1
8:00
18:0
0-1
9:00
19:0
0-2
0:00
20:0
0-2
1:00
21:0
0-2
2:00
22:0
0-2
3:00
23:0
0-2
4:00
00:0
0-0
1:00
01:0
0-0
2:00
02:0
0-0
3:00
03:0
0-0
4:00
04:0
0-0
5:00
05:0
0-0
6:00
06:0
0-0
7:00
07:0
0-0
8:00
Tota
l Tra
ffic
Volu
me
(Veh
icle
s)
Time
Others
Cars
Two Wheelers
Autos
0
5000
10000
15000
20000
25000
30000
08:0
0-0
9:00
09:0
0-1
0:00
10:0
0-1
1:00
11:0
0-1
2:00
12:0
0-1
3:00
13:0
0-1
4:00
14:0
0-1
5:00
15:0
0-1
6:00
16:0
0-1
7:00
17:0
0-1
8:00
18:0
0-1
9:00
19:0
0-2
0:00
20:0
0-2
1:00
21:0
0-2
2:00
22:0
0-2
3:00
23:0
0-2
4:00
00:0
0-0
1:00
01:0
0-0
2:00
02:0
0-0
3:00
03:0
0-0
4:00
04:0
0-0
5:00
05:0
0-0
6:00
06:0
0-0
7:00
07:0
0-0
8:00
Tota
l Tra
ffic
Volu
me
(Veh
icle
s)
Time
Petreol
Diesel
CNG
Car51%
Two Wheeler29%
Auto10%
Buses2%
LCV3%
Trucks4%
SMV1%
At Ashram Intersection
Total Vehicles : 3,64,871 vehicles/day (1,35,173 v/d flyover traffic)
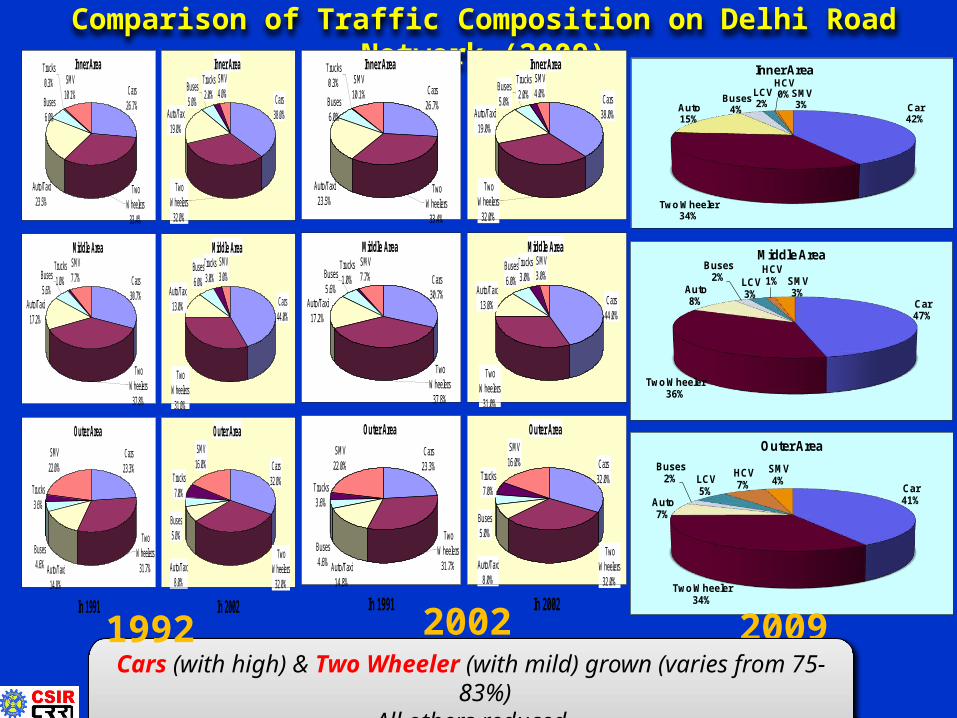
Comparison of Traffic Composition on Delhi Road Network (2009)
Car42%
Two Wheeler34%
Auto15%
Buses4%
LCV2%
HCV0%SMV
3%
Inner Area
Car47%
Two Wheeler36%
Auto8%
Buses2% LCV
3%
HCV1% SMV
3%
Middle Area
Car41%
Two Wheeler34%
Auto7%
Buses2% LCV
5%
HCV7%
SMV4%
Outer Area
In 1991 In 2002
Inner Area
Cars26.7%
SMV10.1%
Trucks0.3%
Buses6.0%
Two Wheelers
33.4%
Auto/Taxi23.5%
Inner AreaSMV4.0%
Trucks2.0%
Buses5.0%
Two Wheelers
32.0%
Auto/Taxi19.0%
Cars38.0%
Middle Area
Cars30.7%
SMV7.7%
Auto/Taxi17.2%
Two Wheelers
37.8%
Buses5.6%
Trucks1.0%
Middle Area
Cars44.0%
SMV3.0%
Trucks3.0%
Buses6.0%
Two Wheelers
31.0%
Auto/Taxi13.0%
Outer Area
Cars23.3%
SMV22.0%
Trucks3.6%
Buses4.6%
Two Wheelers
31.7%Auto/Taxi14.8%
Outer Area
Cars32.0%
SMV16.0%
Auto/Taxi8.0%
Two Wheelers
32.0%
Buses5.0%
Trucks7.0%
2002 2009Cars (with high) & Two Wheeler (with mild) grown (varies from 75-83%)
All others reduced
In 1991 In 2002
Inner Area
Cars26.7%
SMV10.1%
Trucks0.3%
Buses6.0%
Two Wheelers
33.4%
Auto/Taxi23.5%
Inner AreaSMV4.0%
Trucks2.0%
Buses5.0%
Two Wheelers
32.0%
Auto/Taxi19.0%
Cars38.0%
Middle Area
Cars30.7%
SMV7.7%
Auto/Taxi17.2%
Two Wheelers
37.8%
Buses5.6%
Trucks1.0%
Middle Area
Cars44.0%
SMV3.0%
Trucks3.0%
Buses6.0%
Two Wheelers
31.0%
Auto/Taxi13.0%
Outer Area
Cars23.3%
SMV22.0%
Trucks3.6%
Buses4.6%
Two Wheelers
31.7%Auto/Taxi14.8%
Outer Area
Cars32.0%
SMV16.0%
Auto/Taxi8.0%
Two Wheelers
32.0%
Buses5.0%
Trucks7.0%
1992
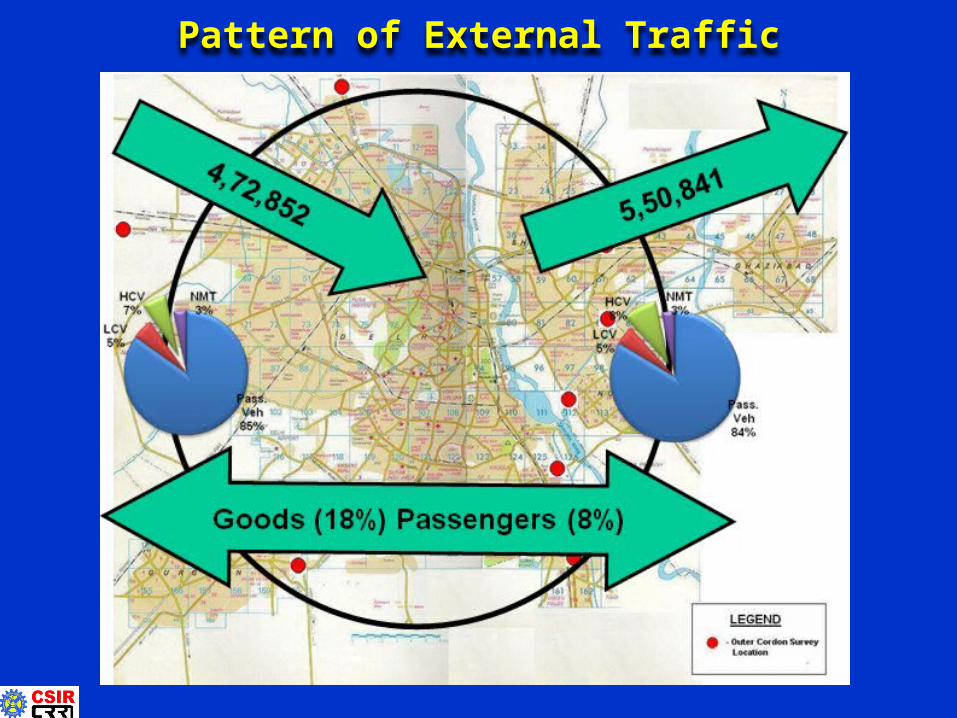
Pattern of External Traffic
Impacts of increasing Car Ownership Levels
Car ownership increases as income increasesCar ownership rises with per-capita income even among the developed countries.
Congestion Air Pollution Accidents
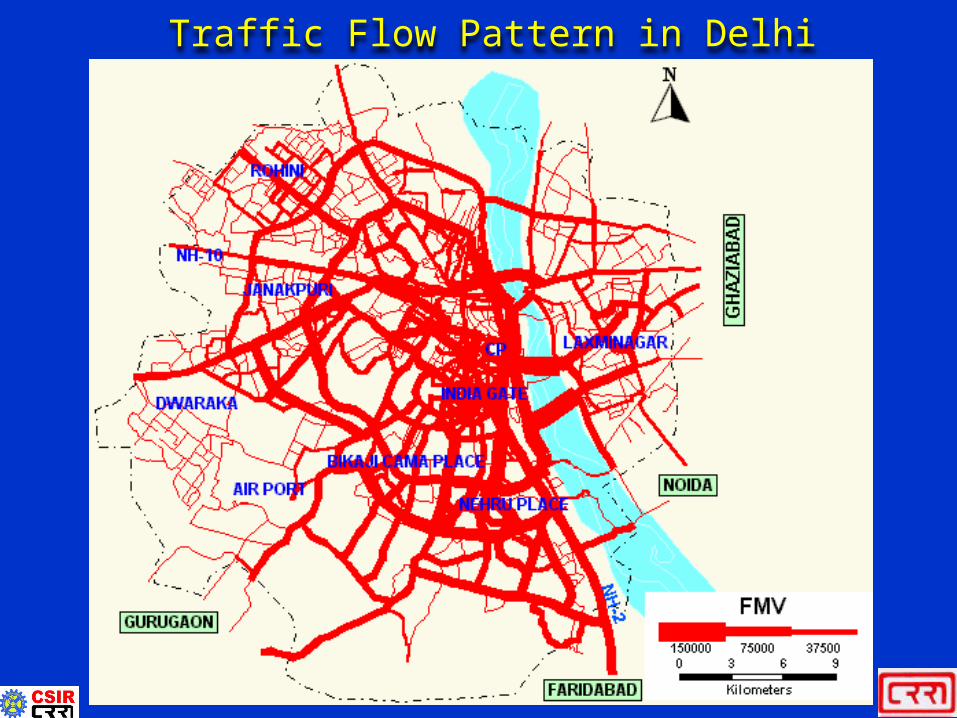
Traffic Flow Pattern in Delhi
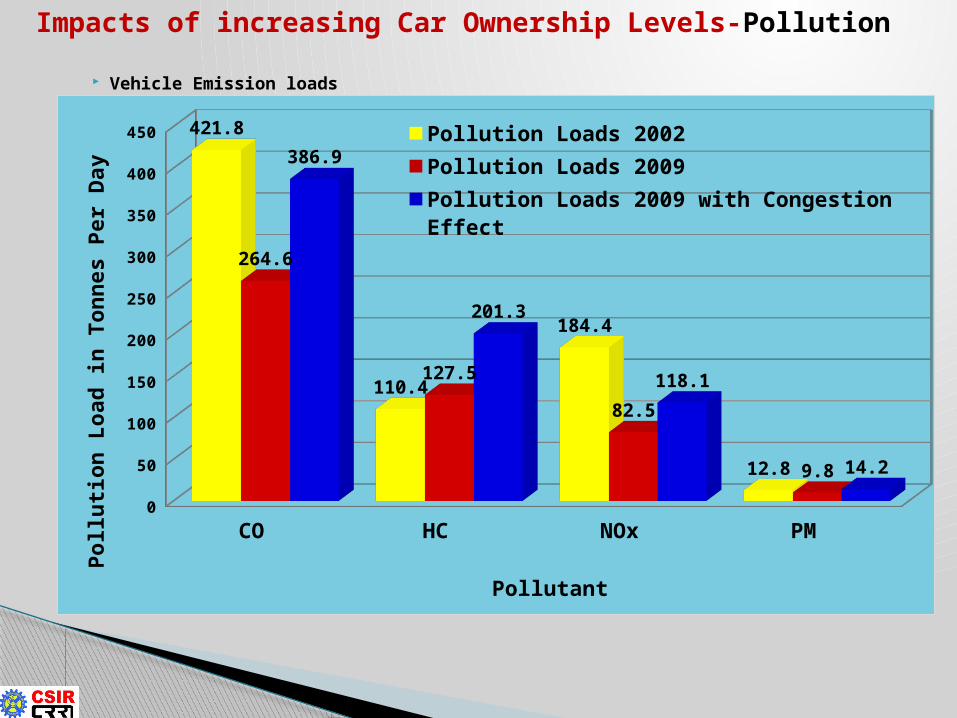
CO HC NOx PM 0
50
100
150
200
250
300
350
400
450 421.8
110.4
184.4
12.8
264.6
127.5
82.5
9.8
386.9
201.3
118.1
14.2
Pollution Loads 2002
Pollution Loads 2009
Pollution Loads 2009 with Congestion Effect
Pol
luti
on L
oad
in T
onn
es P
er D
ay
Pollutant
Impacts of increasing Car Ownership Levels-Pollution
Vehicle Emission loads
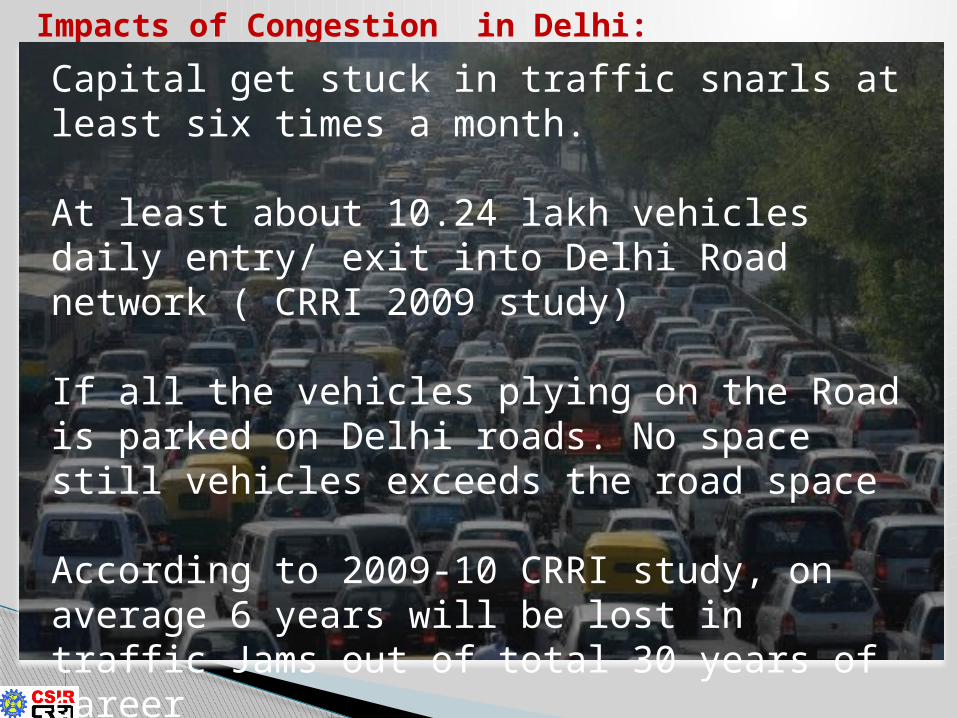
Impacts of Congestion in Delhi:
Capital get stuck in traffic snarls at least six times a month.
At least about 10.24 lakh vehicles daily entry/ exit into Delhi Road network ( CRRI 2009 study)
If all the vehicles plying on the Road is parked on Delhi roads. No space still vehicles exceeds the road space
According to 2009-10 CRRI study, on average 6 years will be lost in traffic Jams out of total 30 years of career
0
500
1000
1500
2000
2500
20092010
2015
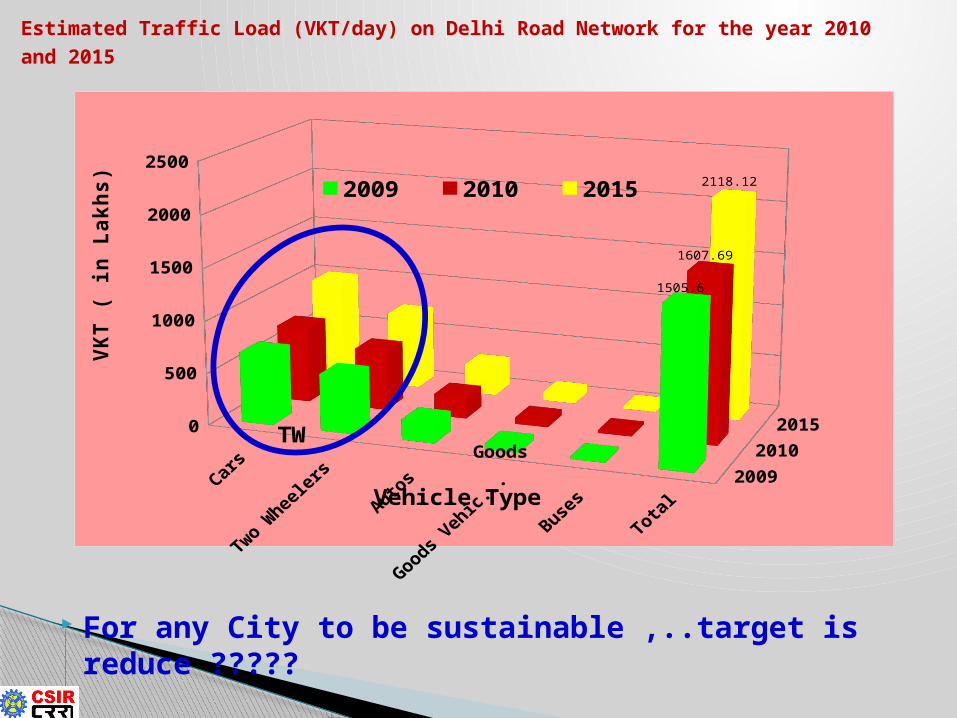
1505.6
1607.69
2118.122009 2010 2015
Vehicle Type
VKT
( in
Lakh
s)
TWGoods
For any City to be sustainable ,..target is reduce ?????
Estimated Traffic Load (VKT/day) on Delhi Road Network for the year 2010 and 2015
Congestion Mitigation Measures
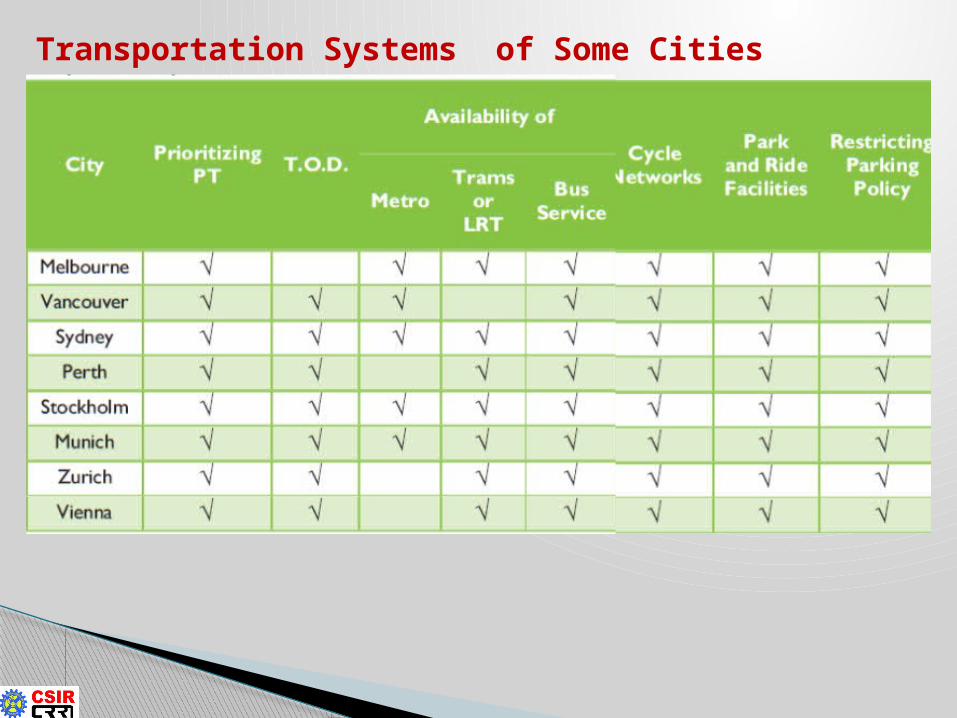
Transportation Systems of Some Cities
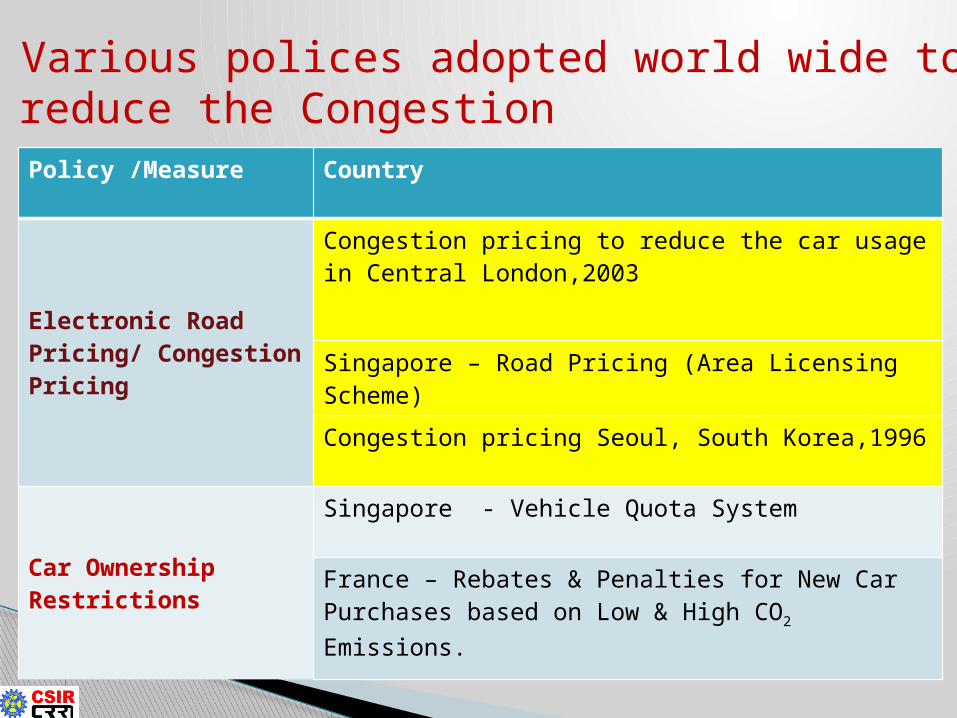
Various polices adopted world wide to reduce the CongestionPolicy /Measure Country
Electronic Road Pricing/ Congestion Pricing
Congestion pricing to reduce the car usage in Central London,2003
Singapore – Road Pricing (Area Licensing Scheme)
Congestion pricing Seoul, South Korea,1996
Car Ownership Restrictions
Singapore - Vehicle Quota System
France – Rebates & Penalties for New Car Purchases based on Low & High CO2 Emissions.
Policy /Measure
Country
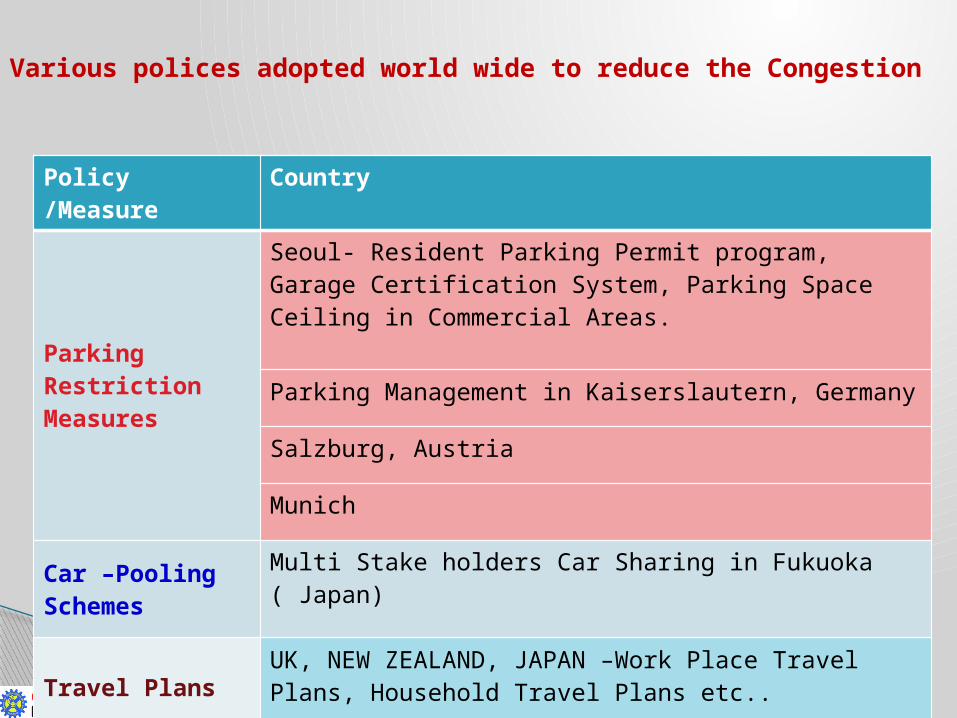
Parking Restriction Measures
Seoul- Resident Parking Permit program, Garage Certification System, Parking Space Ceiling in Commercial Areas.
Parking Management in Kaiserslautern, Germany
Salzburg, Austria
Munich
Car –Pooling Schemes
Multi Stake holders Car Sharing in Fukuoka ( Japan)
Travel Plans UK, NEW ZEALAND, JAPAN –Work Place Travel Plans, Household Travel Plans etc..
Various polices adopted world wide to reduce the Congestion

Various polices adopted world wide to reduce the Congestion
Policy /Measure
Country
Traffic Calming Measures
Walking street program in Bangkok, Thailand
Creation of Pedestrian Zones
Even & Odd Number of Car System Seoul –Car Free days program
Various polices adopted world wide to reduce the Congestion
Policy /Measure
Country
Improving Public
Transport & NMT
Services
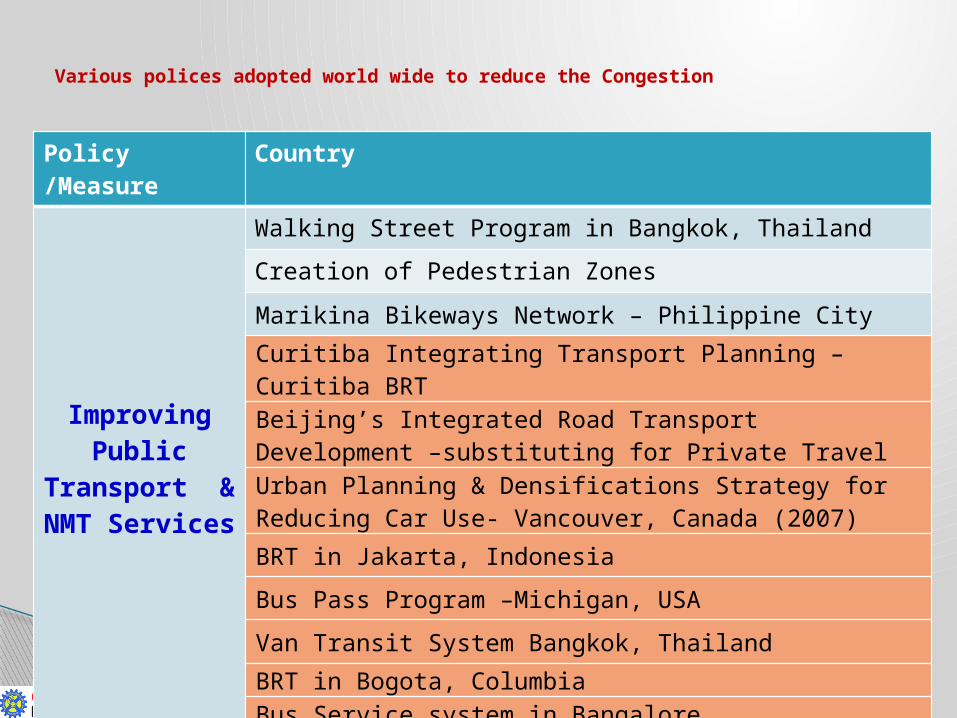
Walking Street Program in Bangkok, Thailand
Creation of Pedestrian Zones
Marikina Bikeways Network – Philippine City
Curitiba Integrating Transport Planning – Curitiba BRT
Beijing’s Integrated Road Transport Development –substituting for Private Travel
Urban Planning & Densifications Strategy for Reducing Car Use- Vancouver, Canada (2007)
BRT in Jakarta, Indonesia
Bus Pass Program –Michigan, USA
Van Transit System Bangkok, Thailand
BRT in Bogota, ColumbiaBus Service system in Bangalore

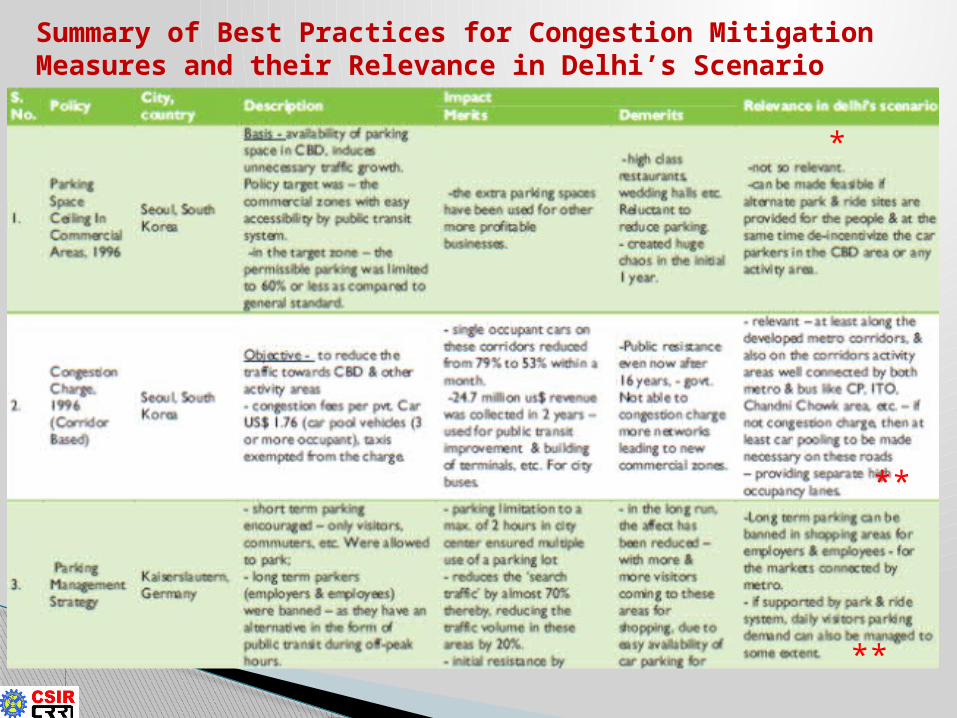
Summary of Best Practices for Congestion Mitigation Measures and their Relevance in Delhi’s Scenario
*
**
**
**
Summary of Best Practices for Congestion Mitigation Measures and their Relevance in Delhi’s Scenario
*
**
**
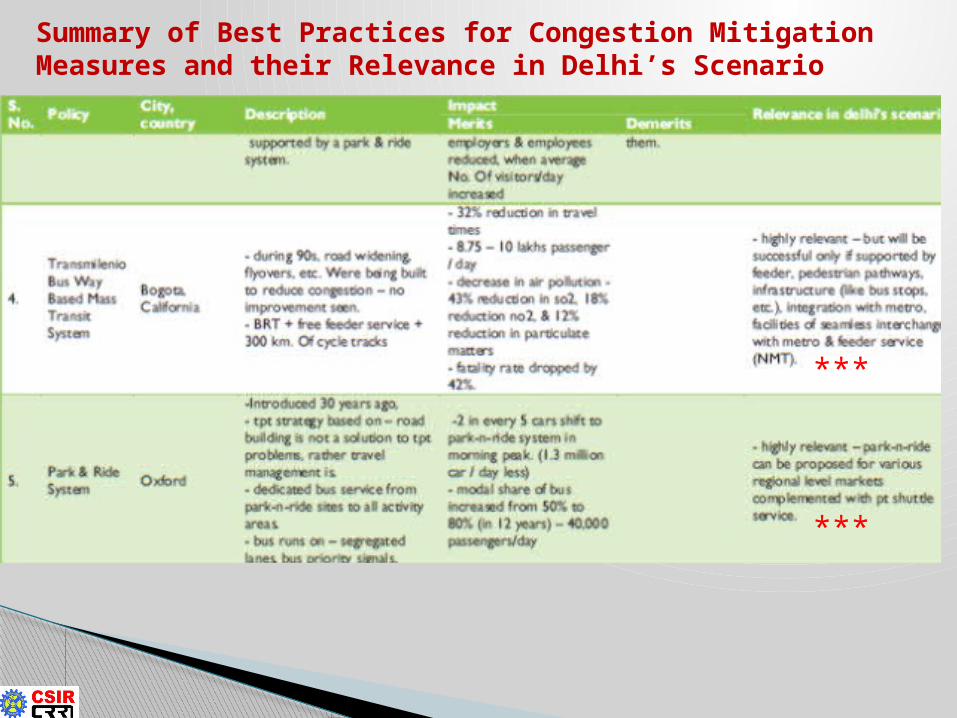
Summary of Best Practices for Congestion Mitigation Measures and their Relevance in Delhi’s Scenario
***
***

Expert Opinion Survey Results
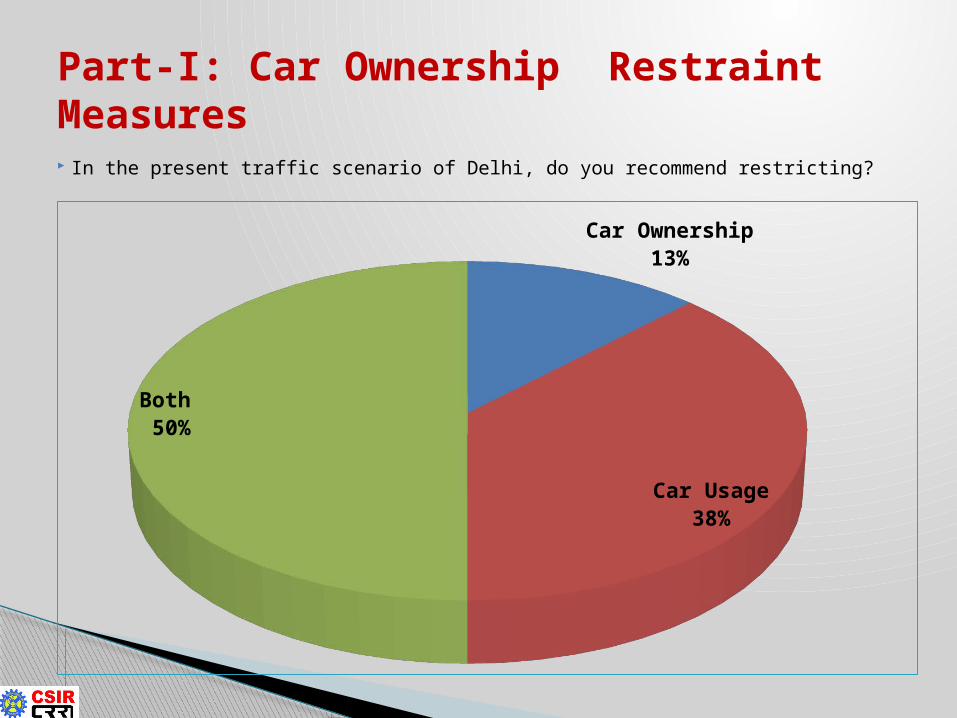
Part-I: Car Ownership Restraint Measures
Car Ownership13%
Car Usage38%
Both 50%
In the present traffic scenario of Delhi, do you recommend restricting?
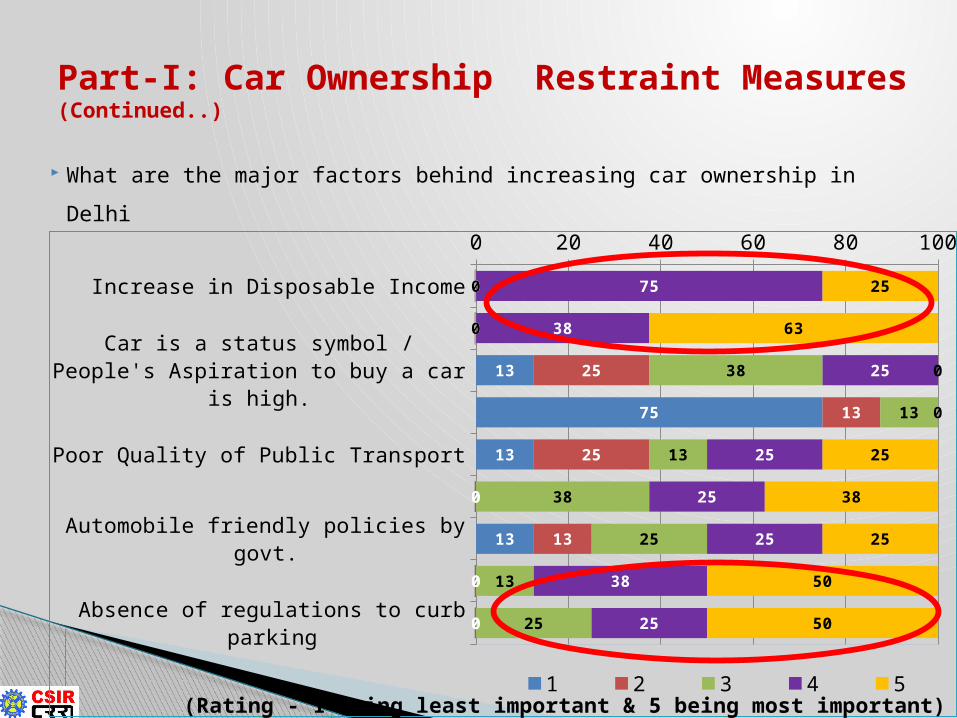
Part-I: Car Ownership Restraint Measures (Continued..)
What are the major factors behind increasing car ownership in Delhi
Increase in Disposable Income
Attractive Car Loan Policy
Car is a status symbol / People's Aspiration to buy a car is high.
Absence of connectivity (line haul / last mile) by Public Transport
Poor Quality of Public Transport
Increasing travel distances resulting in large travel times.
Automobile friendly policies by govt.
Absence of regulations to curb car ownership & use
Absence of regulations to curb parking
0 20 40 60 80 100
0
0
13
75
13
0
13
0
0
0
0
25
13
25
0
13
0
0
0
0
38
13
13
38
25
13
25
75
38
25
0
25
25
25
38
25
25
63
0
0
25
38
25
50
50
1 2 3 4 5(Rating - 1 being least important & 5 being most important)
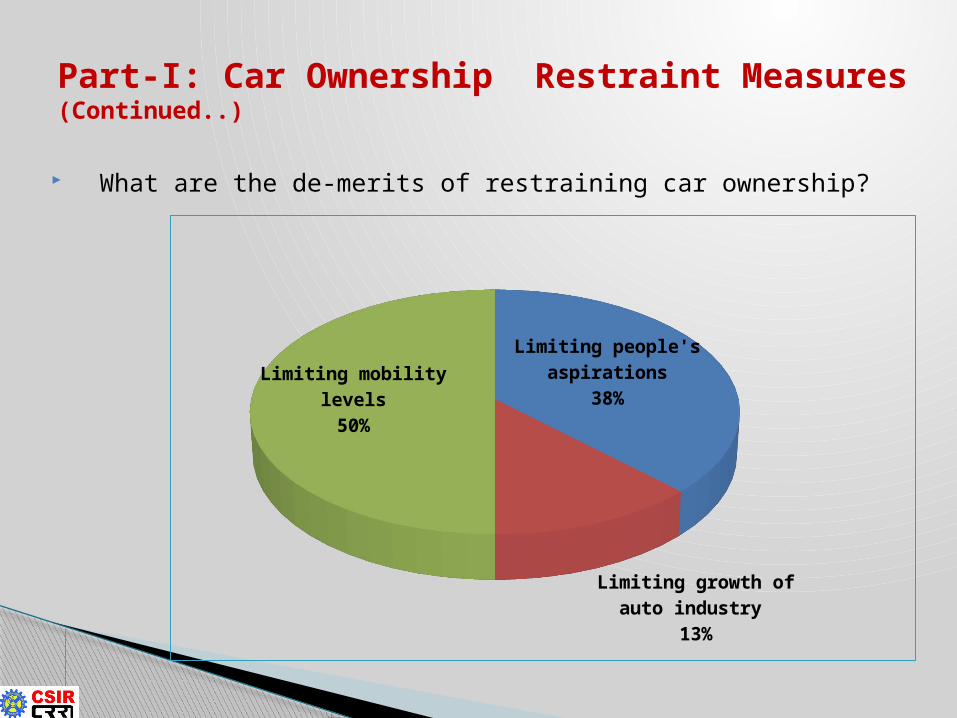
What are the de-merits of restraining car ownership?
Limiting people's aspira-tions38%
Limiting growth of auto industry
13%
Limiting mobility levels50%
Part-I: Car Ownership Restraint Measures (Continued..)
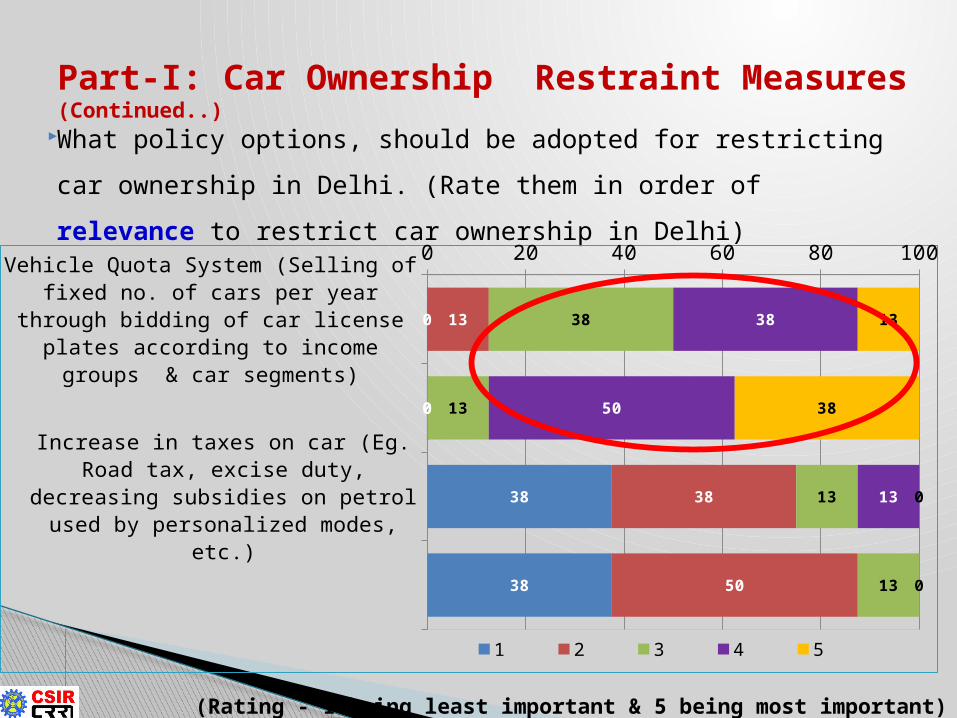
What policy options, should be adopted for restricting car
ownership in Delhi. (Rate them in order of relevance to
restrict car ownership in Delhi)
Vehicle Quota System (Selling of fixed no. of cars per year through bidding of car license plates according to income groups & car segments)
Resident Parking Permit Program or Garage Certificate System
Increase in taxes on car (Eg. Road tax, excise duty, decreasing subsidies on petrol used by personalized modes, etc.)
Increase in interest rates on car loans
0 20 40 60 80 100
0
0
38
38
13
0
38
50
38
13
13
13
38
50
13
0
13
38
0
0
1 2 3 4 5
(Rating - 1 being least important & 5 being most important)
Part-I: Car Ownership Restraint Measures (Continued..)
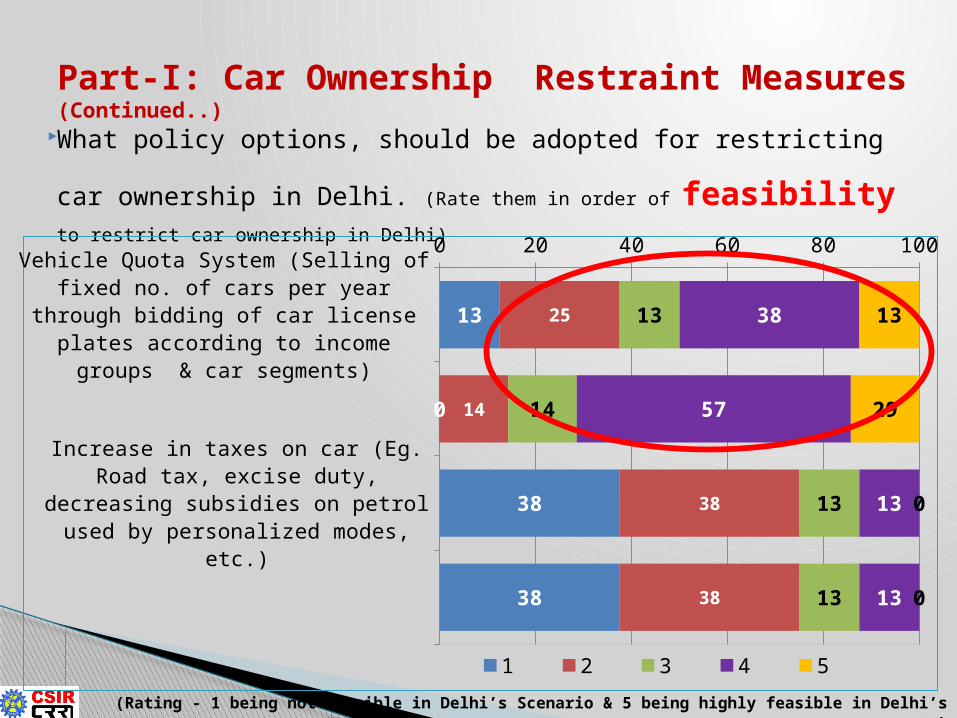
What policy options, should be adopted for restricting car
ownership in Delhi. (Rate them in order of feasibility to
restrict car ownership in Delhi)
(Rating - 1 being not feasible in Delhi’s Scenario & 5 being highly feasible in Delhi’s Scenario)
Vehicle Quota System (Selling of fixed no. of cars per year through bidding of car license plates according to income groups & car segments)
Resident Parking Permit Program or Garage Certificate System
Increase in taxes on car (Eg. Road tax, excise duty, decreasing subsidies on petrol used by personalized modes, etc.)
Increase in interest rates on car loans
0 20 40 60 80 100
13
0
38
38
25
14
38
38
13
14
13
13
38
57
13
13
13
29
0
0
1 2 3 4 5
Part-I: Car Ownership Restraint Measures (Continued..)
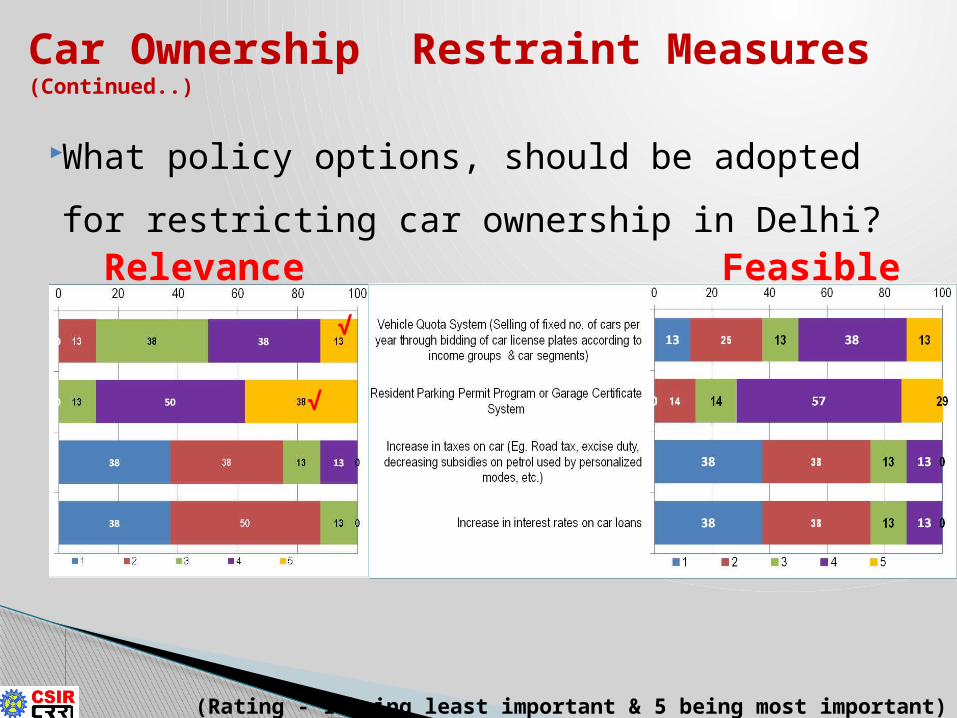
What policy options, should be adopted
for restricting car ownership in Delhi?
(Rating - 1 being least important & 5 being most important)
Car Ownership Restraint Measures (Continued..)
Relevance Feasible
√
√
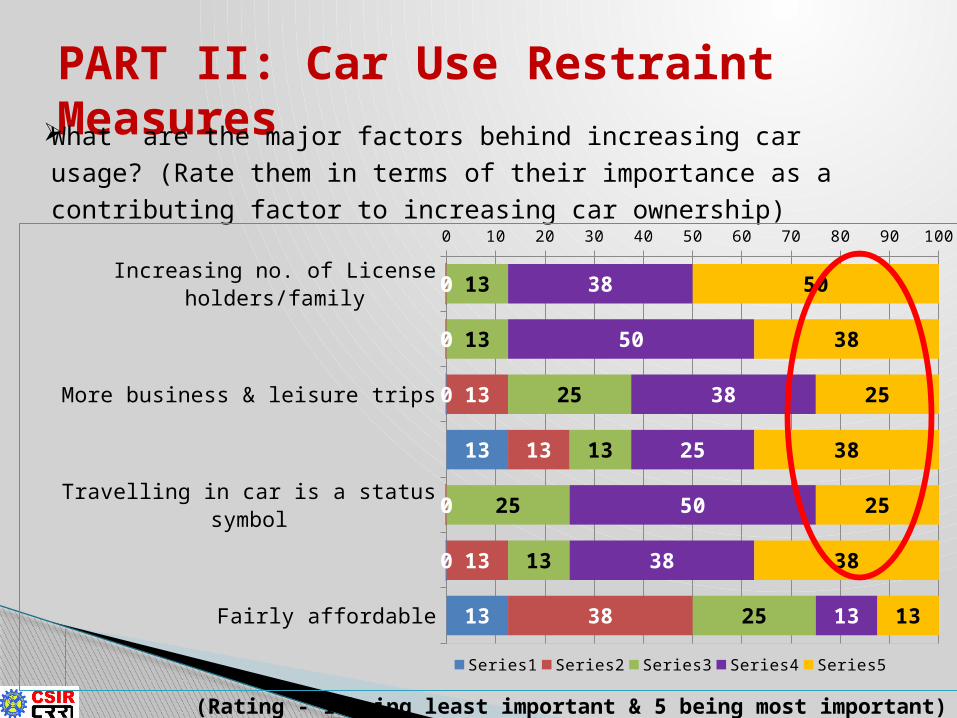
PART II: Car Use Restraint MeasuresWhat are the major factors behind increasing car usage? (Rate them in terms of their importance as a contributing factor to increasing car ownership)
(Rating - 1 being least important & 5 being most important)
Increasing no. of License holders/family
Increase in Average Trip Length
More business & leisure trips
Unreliable/Uncomfortable public transit system
Travelling in car is a status symbol
More convenient (Comfortable, Safer, Saves Time)
Fairly affordable
0 10 20 30 40 50 60 70 80 90 100
0
0
0
13
0
0
13
0
0
13
13
0
13
38
13
13
25
13
25
13
25
38
50
38
25
50
38
13
50
38
25
38
25
38
13
Series1 Series2 Series3 Series4 Series5
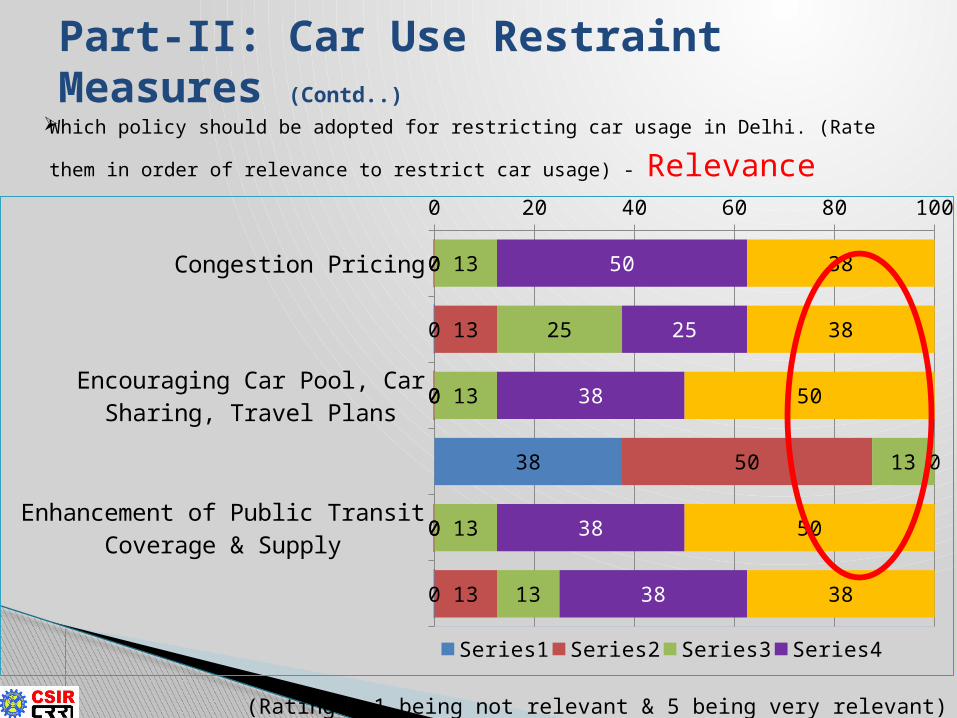
Part-II: Car Use Restraint Measures (Contd..)
Which policy should be adopted for restricting car usage in Delhi. (Rate
them in order of relevance to restrict car usage) - Relevance
(Rating - 1 being not relevant & 5 being very relevant)
Congestion Pricing
Parking Space ceiling in commercial areas
Encouraging Car Pool, Car Sharing, Travel Plans
Introduction of Even & Odd no. car system or Car free days system
Enhancement of Public Transit Coverage & Supply
Park & Ride Facilities complemented with Public Transport
0 20 40 60 80 100
0
0
0
38
0
0
0
13
0
50
0
13
13
25
13
13
13
13
50
25
38
0
38
38
38
38
50
0
50
38
Series1 Series2 Series3 Series4 Series5
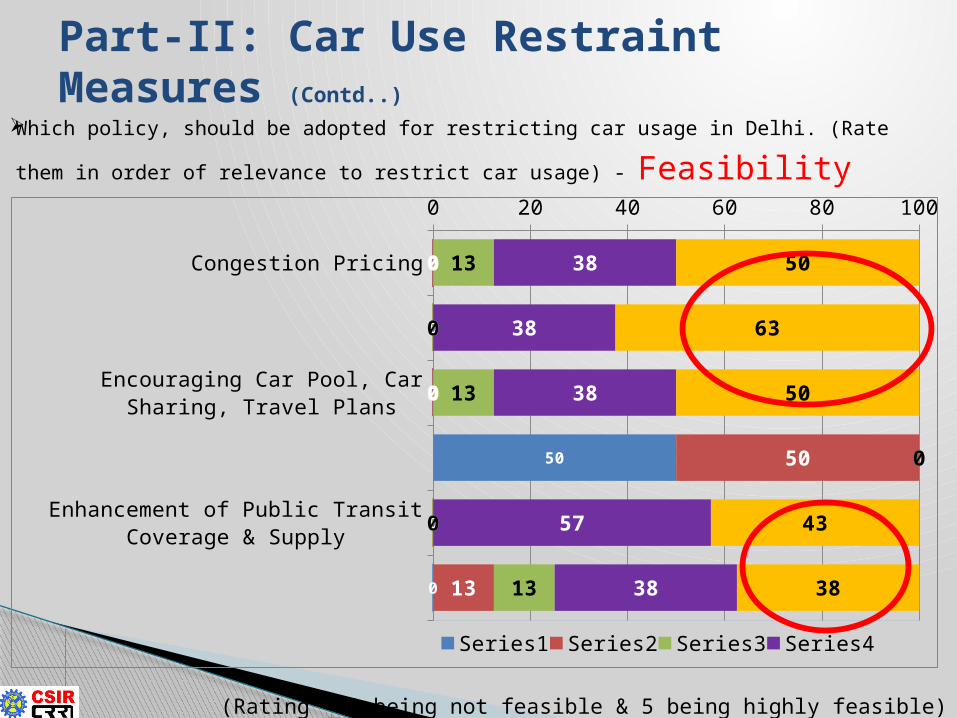
Which policy, should be adopted for restricting car usage in Delhi. (Rate
them in order of relevance to restrict car usage) - Feasibility
(Rating - 1 being not feasible & 5 being highly feasible)
Congestion Pricing
Parking Space ceiling in commercial areas
Encouraging Car Pool, Car Sharing, Travel Plans
Introduction of Even & Odd no. car system or Car free days system
Enhancement of Public Transit Coverage & Supply
Park & Ride Facilities complemented with Public Transport
0 20 40 60 80 100
0
0
0
50
0
0
0
0
0
50
0
13
13
0
13
0
0
13
38
38
38
0
57
38
50
63
50
0
43
38
Series1 Series2 Series3 Series4 Series5
Part-II: Car Use Restraint Measures (Contd..)
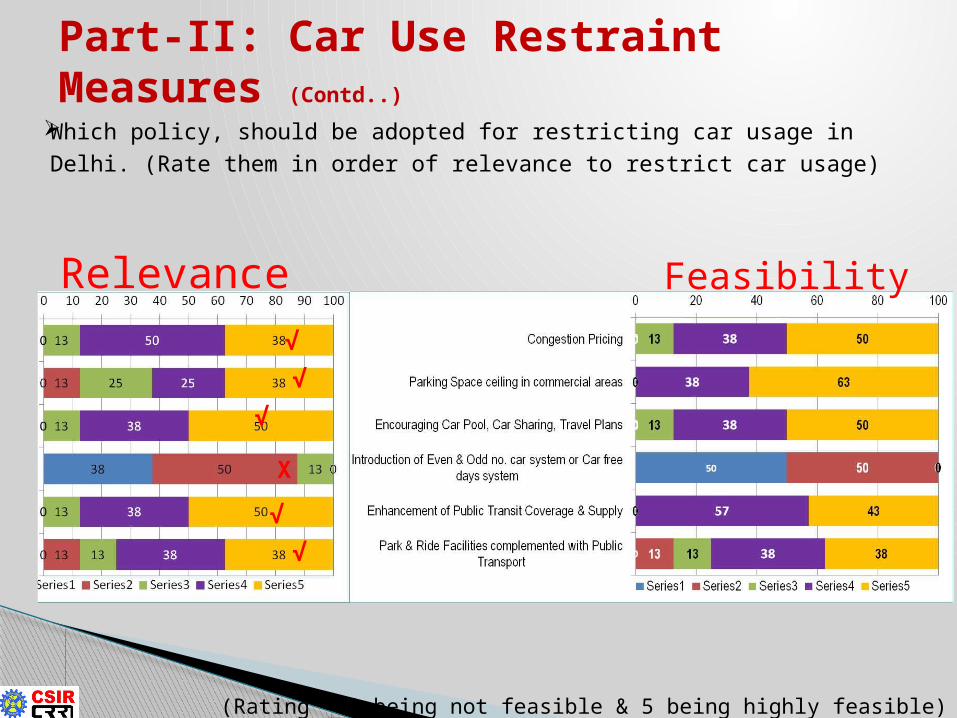
Which policy, should be adopted for restricting car usage in Delhi. (Rate them in order of relevance to restrict car usage)
(Rating - 1 being not feasible & 5 being highly feasible)
Part-II: Car Use Restraint Measures (Contd..)
FeasibilityRelevance√
√
√
√
√
X

Should congestion pricing be based on:
Area level75%
Corridor level25%
Part-II: Car Use Restraint Measures (Contd..)
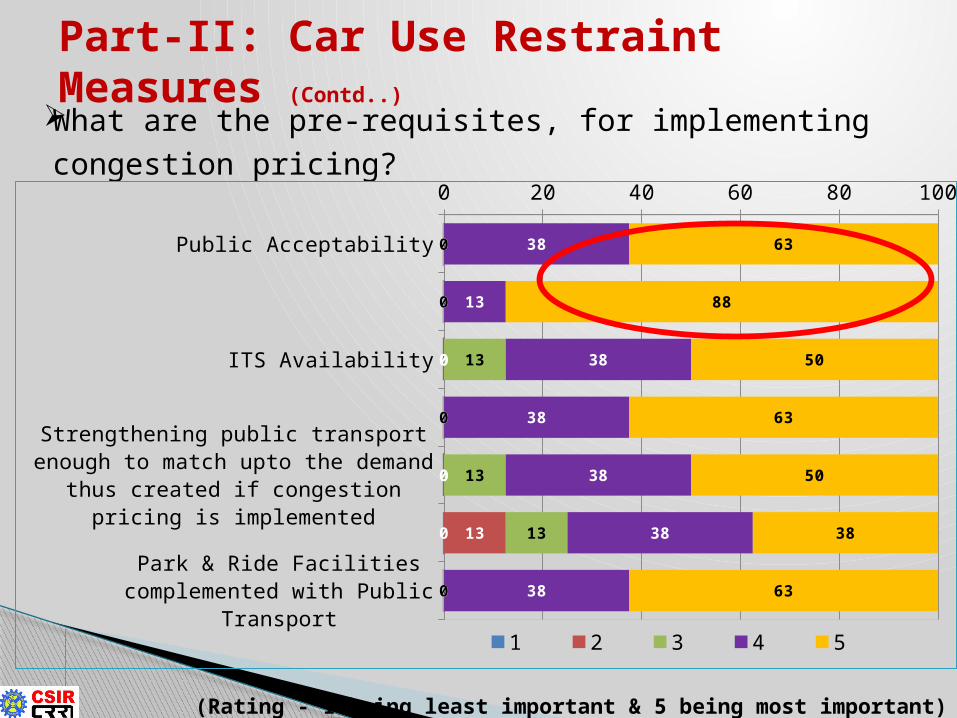
What are the pre-requisites, for implementing congestion pricing?
Public Acceptability
Political Support
ITS Availability
Delineating Cordon boundaries for congestion pricing zone
Strengthening public transport enough to match upto the demand thus created if congestion pricing is implemented
Availability of alternate system (in case a person doesn’t want to pay congestion charge)
Park & Ride Facilities complemented with Public Transport
0 20 40 60 80 100
0
0
0
0
0
0
0
0
0
0
0
0
13
0
0
0
13
0
13
13
0
38
13
38
38
38
38
38
63
88
50
63
50
38
63
1 2 3 4 5
(Rating - 1 being least important & 5 being most important)
Part-II: Car Use Restraint Measures (Contd..)
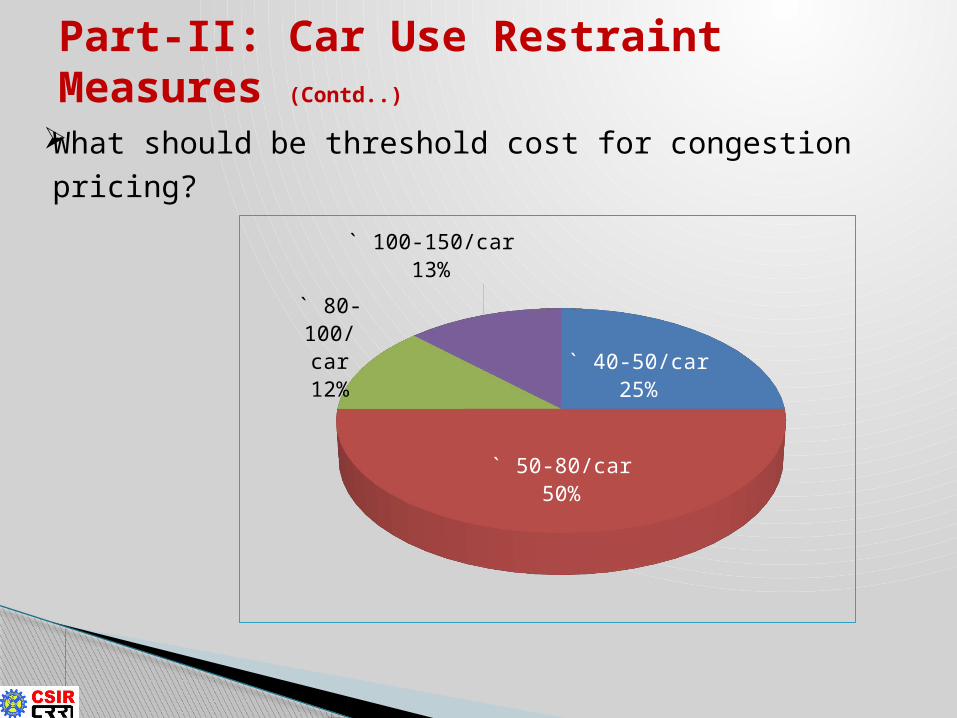
What should be threshold cost for congestion pricing?
` 40-50/car25%
` 50-80/car50%
` 80-100/car12%
` 100-150/car13%
Part-II: Car Use Restraint Measures (Contd..)
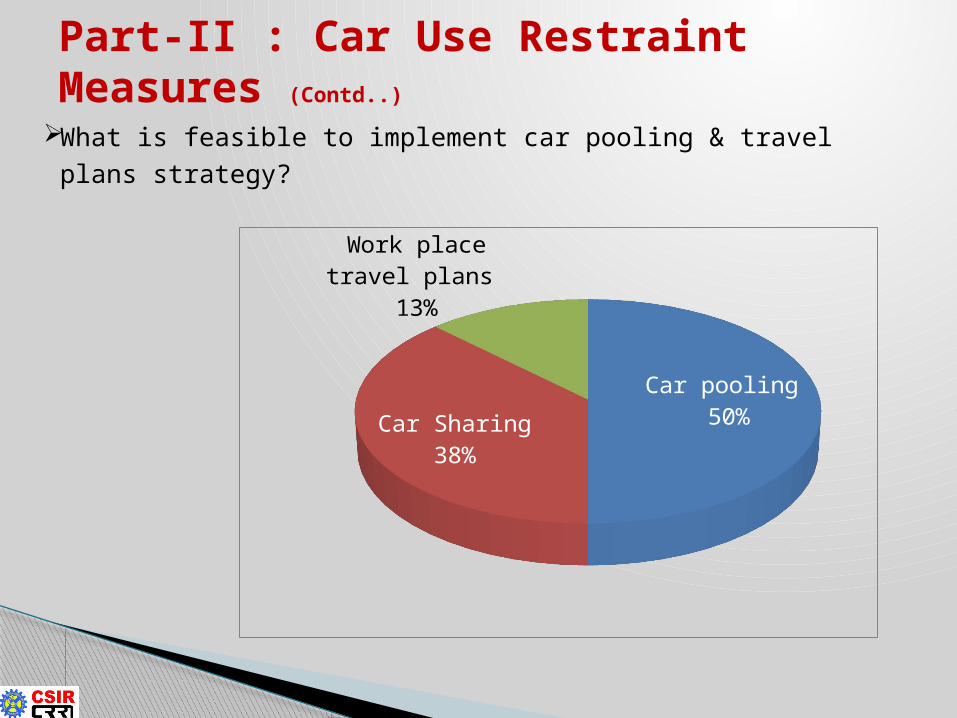
What is feasible to implement car pooling & travel plans strategy?
Car pooling 50%
Car Sharing38%
Work place travel plans 13%
Part-II : Car Use Restraint Measures (Contd..)
Vehicle Registration and Traffic is increasing rapidly at urban centers in India
Resulting in negative externalities Congestion, Air pollution, Accidents
Considering the Indian Socio-Economic and Polity Conditions. We should first attempt pilot study before we implement any policy
For the Indian Conditions we should attempt multi –policy oriented; only single policy do not work for sustainable transportation.
Conclusions


Regarding Parking fee which will be more effective?
Hike Parking Fees50%Variable Parking Fees
25%
Charges accord-ing to
area of parking
25%
Part-II : Car Use Restraint Measures (Contd..)