4.2 water quality in the middle catchment
TRANSCRIPT

99
4.2 Water Quality in the Middle Catchment
This section covers the middle reaches of the Little Swanport River from below Swanston Road
(LSWA10) to the upper gauging station (LSWA05b) and includes the three tributaries that enter the
river between these points; Nutting Garden Rivulet, Pages Creek and the lower section of Eastern
Marshes Rivulet (Figure 36). Flow was monitored in the Little Swanport River in this section
throughout the course of the study. Both Nutting Garden Rivulet and the Little Swanport River
receive inflows from the Hobbs Lagoon irrigation complex. Inputs to the Little Swanport River
from Nutting Garden Rivulet and Pages Creek can be very low at times, as surface flow in both
these tributaries was observed to have ceased at various times during the study.
Monthly sampling data from the 8 monitoring sites is presented in section 4.2.2. Continuous water
quality data (temperature, turbidity, conductivity, pH and dissolved oxygen) from multi-probe
installations at Nutting Garden Rivulet at Stonehenge (LSWA29) and Eastern Marshes Rivulet at
Swanston (LSWA22) is presented in section 4.2.4, along with daily aggregated water quality data
and modelled flow from station LSWA05b. A number of flood events at LSWA05b were sampled
by an autosampler, and analysis of selected variables and continuous data from the gauging station
for these flood events is presented in section 4.2.5, and these are then used to estimate transport
loads for the middle catchment in section 4.2.6.
4.2.1 Site descriptions
Nutting Garden Rivulet and the Little Swanport River above the confluence of Pages Creek fall
within geomorphic Zone 2. This area is dominated by a mudstone/sandstone geology and has
extensive floodplains of rich productive soil that have been cleared for agricultural purposes. This
zone acts as both a sediment storage and supply region for the downstream reaches.
Pages Creek and the remainder of the Little Swanport River from the Pages Creek confluence to the
upper gauging station below Eastern Marshes Rivulet (LSWA05b) are characterised as Zone 3
(partly confined). This zone is controlled by dolerite geology resulting in steeper valley sides. As a
result there is an increasing proportion of native vegetation. Where there is flood plain development
in this zone there has been extensive clearing of vegetation for agriculture. The Little Swanport
River in this section of the catchment becomes more hydrologically diverse, with large pools
appearing separated by riffles and runs.

100
The lower section of Eastern Marshes (below Eastern Marshes Rivulet at Manning Road ford) is
largely confined within a steep, narrow valley section defined as geomorphic Zone 4, before
emerging into the partly confined zone of the main river valley of the Little Swanport River.
Land use in the middle catchment is predominantly grazing, minor cropping for fodder and minor
forestry operations. Although the river flats and some of the surrounding hills have been cleared for
grazing, there is more remanent vegetation in this section of the catchment than in the upper
catchment.
Figure XXXX: Location of middle catchment sites.Figure 36: Location of water quality monitoring sites in the middle region of the Little Swanport catchment.
Nutting Garden Rivulet
Nutting Garden Rivulet has a similar catchment area to Crichton Creek and shares the same
geomorphic zone (mobile zone) and general catchment characteristics. Unlike Crichton Creek,
however, which ceased to flow at various times during the survey, Nutting Garden Rivulet was

101
observed to have flow throughout the study period. This may have been due to inflows from Hobbs
Lagoons, where water is released for flood irrigation, or possible differences in groundwater
resources between the two catchments. Two sites were monitored on Nutting Garden Rivulet,
Nutting Garden Rivulet at Tin Pot Marsh Road (LSWA31) and Nuttting Garden at Stonehenge
Track Ford (LSWA29). LSWA31 is immediately above the highest input from the irrigation canals,
while LSWA29 is immediately upstream of the confluence with the Little Swanport River. The
land either side of the rivulet between these two sites and above LSWA31 has been cleared for
grazing and stock have access to the stream (Plates 13 and 14). Riparian vegetation is largely
limited to introduced species, predominantly gorse.
Plate 13: Nutting Garden Rivulet at Tin Pot Marsh Road (LSWA31), showing low flow (upstream view) and high flow (downstream
view).
Plate 14: Nutting Garden Rivulet at Stonehenge Track ford (LSWA29), at low flow (note logger) and high flow conditions.

102
Pages Creek
Two sites were monitored on Pages Creek; Pages Creek at Big Lagoon (LSWA28) and Pages
Creek at Little Swanport confluence (LSWA26). Pages Creek falls within geomorphic Zone 3
(partly confined). Land use in the catchment consists of rough grazing and minor forestry
operations. While there is a significant proportion of natural vegetation within the catchment,
riparian vegetation along parts of the creek have been removed (Plates 15 and 16). Although Pages
Creek can receive inflows from the Hobbs Lagoons irrigation complex, it is not known if this
occurred during the study.
Plate 15: Pages Creek east of Big Lagoon (LSWA28), during low and high flow conditions.
Plate 16: Pages Creek at the confluence with the Little Swanport River (LSWA26), at low flow (downstream view) and high flow
(upstream view) conditions.

103
Eastern Marshes Rivulet
One site on Eastern Marshes Rivulet, Eastern Marshes Rivulet at Swanston Road (LSWA22) has
been included in the middle catchment. Below Eastern Marshes at Manning Road ford (LSWA23),
Eastern Marshes Rivulet enters a shallow valley of native grasses before descending into a narrow
gorge, characterised as geomorphic Zone 4, and joining the Little Swanport River. This gorge, with
its steep valley sides and exposed dolerite bedrock and shallow soils, has a high proportion of
native vegetation and is not subject to the intensive land use impacts of the upper catchment. Two
tributaries, Sligo Creek and Boomer Rivulet, with catchments entirely within this zone, enter the
gorge. The bottom site on Eastern Marshes, LSWA22, is immediately above the confluence with
the Little Swanport River. Above this site the rivulet exits the gorge into a short section defined as
geomorphic Zone 3 (partly confined). The river flats in this section have been partially cleared and
are used for rough grazing. Erosion of river banks is evident in the lower reaches, a feature seen
throughout the flood plains of the partly confined zone, particularly within the Little Swanport
River below the confluence with Eastern Marshes Rivulet.
Plate 17: Eastern Marshes Rivulet at Swanston Road (LSWA22). Photo on left shows logger installed in permanent pool during low
flow. Photo on right shows collapsing bank of the rivulet during moderate flow conditions.
Little Swanport River
Three sites were sampled on the Little Swanport River in this section; Little Swanport River above
Pages Creek (LSWA09), Little Swanport River upstream Eastern Marshes Rivulet (LSWA06) and
Little Swanport River at Swanston (stream gauge) (LSWA05b). LSWA09 marks the point where
the river leaves the mobile zone and enters the partly confined zone (Plate 18). Between LSWA09
and LSWA06 the river runs through a narrow valley and has a relatively intact riparian zone.
Between LSWA06 and LSWA05b the valley opens up and small floodplains develop. These flood

104
plains have been cleared for grazing and the riparian vegetation in these sections tends to be in
poorer condition. Pools are evident in this section, as are outcrops of Triassic sandstone. Both can
be seen at the gauging station at LSWA05b (see Plate 20). Land use in this section is a mix of
grazing with some forestry and an increasing proportion of native woodland.
Plate 18: Little Swanport River above Pages Creek (LSWA09). Photo on left shows the site during very low flow conditions (looking
downstream) and during higher flows (looking upstream).
Plate 19: Little Swanport River upstream Eastern Marshes Rivulet (LSWA06) during low and high flow conditions.

105
Plate 20: Little Swanport River downstream Eastern Marshes Rivulet (LSWA05b) during low flows (left) and high flow conditions (right).
4.2.2 Monthly sampling
Turbidity
With the exception of Nutting Garden Rivulet, median turbidity levels in the middle catchment
were all below 5 NTU (Figure 37). The two sites on Nutting Garden Rivulet, Nutting Garden
Rivulet at Tinpot Marsh Road (LSWA31) and Nutting Garden Rivulet at Stonehenge (LSWA29),
had median values of 10.7 NTU and 9.77 NTU respectively. Median turbidity for the Little
Swanport River sites was highest at Little Swanport River upstream Pages Creek (LSWA09) and
this is likely to be a result of the inflow of more turbid water from Nutting Garden Rivulet, which
enters the river above this site. The effect of inputs from Nutting Garden Rivulet on turbidity at
LSWA09 can be seen by comparing median turbidity at LSWA09 (4.99 NTU) with LSWA10 (2.49
NTU, with extra sampling results removed). The lowest median (1.09 NTU) was recorded at the
lower site on Eastern Marshes Rivulet, Eastern Marshes Rivulet at Swanston (LSWA22).
With the exception of Little Swanport River above Pages Creek, which was not sampled, and
Nutting Garden at Tinpot Marsh Road, all the maximum values for turbidity were recorded during
the high flow event of August 2003. It should be noted that these maximum turbidity values cannot
be compared to those measured for the upper catchment sites during this event, as they were taken
on the following day. Maximum turbidity recorded for the lower sites on the Little Swanport River,
Little Swanport River upstream Eastern Marshes Rivulet (LSWA06) and Little Swanport River
downstream Eastern Marshes Rivulet (LSWA05b) were 20.9 NTU and 20.1 NTU respectively.

106
LSWA05b LSWA06 LSWA09 LSWA29 LSWA31 LSWA26 LSWA28 LSWA22
Turbidity NTU
0
5
10
15
20
25
30
35
40
45
50
55
60
65
70
75
80
85
.
Figure 37: Statistics of monthly turbidity data for sites in the middle catchment of the Little Swanport River.
It would appear that the upper catchment of Nutting Garden Rivulet is a source of elevated turbidity
in this catchment, as a very high value of 70.4 NTU was recorded at Nutting Garden at Tinpot
Marsh Road (LSWA31) during the August 2003 event. A value of 80.4 NTU was recorded at
LSWA31 during the event in January 2004. A value of only 5.6 NTU was recorded at the lower
site, LSWA29 on the following day. The high turbidity values recorded at LSWA31 may be related
to runoff from ploughed fields above LSWA31. Differences in water quality between the two sites
may be influenced by inputs from the Hobbs Lagoon irrigation complex which enter Nutting
Garden Rivulet below LSWA31. Monthly turbidity for both sites is shown in Figure 38
The lowest median turbidity, and lowest flood value recorded during the August 2003 event, was at
Eastern Marshes Rivulet at Swanston (LSWA22). Between this site and the upstream site, Eastern
Marshes Rivulet at Manning Road (LSWA23)(see Chapter 4.1), Eastern Marshes Rivulet enters a
narrow gorge with steep valley sides vegetated by native woodland, defined as geomorphic Zone 4
(confined zone). This change in topography has prevented the intensive land clearing evident above
LSWA23. In addition, two significant tributaries, Sligo Creek and Boomer Rivulet, draining similar
country, enter above LSWA22.

107
0
10
20
30
40
50
60
70
80
90
25-Aug-03
8-Sep-03
22-Sep-03
6-Oct-03
20-Oct-03
3-Nov-03
17-Nov-03
1-Dec-03
15-Dec-03
29-Dec-03
12-Jan-04
26-Jan-04
9-Feb-04
23-Feb-04
8-Mar-04
22-Mar-04
5-Apr-04
19-Apr-04
3-May-04
17-May-04
31-May-04
14-Jun-04
28-Jun-04
12-Jul-04
26-Jul-04
9-Aug-04
23-Aug-04
6-Sep-04
20-Sep-04
4-Oct-04
18-Oct-04
1-Nov-04
15-Nov-04
Turbidity NTU
0.000
200.000
400.000
600.000
800.000
1000.000
1200.000
FLow ML/day
LSWA29 turbidity
LSWA31 turbidity
flow
Figure 38: Results from monthly turbidity sampling plotted along with modelled flow for Nutting Garden Rivulet.
05
10
15
20
25
30
35
25-Aug-03
8-Sep-03
22-Sep-03
6-Oct-03
20-Oct-03
3-Nov-03
17-Nov-03
1-Dec-03
15-Dec-03
29-Dec-03
12-Jan-04
26-Jan-04
9-Feb-04
23-Feb-04
8-Mar-04
22-Mar-04
5-Apr-04
19-Apr-04
3-May-04
17-May-04
31-May-04
14-Jun-04
28-Jun-04
12-Jul-04
26-Jul-04
9-Aug-04
23-Aug-04
6-Sep-04
20-Sep-04
4-Oct-04
18-Oct-04
1-Nov-04
15-Nov-04
Turbidity NTU
0200
400
600
800
1000
1200
1400
1600
1800
FLow ML/day
LSWA22
LSWA23
flow
Figure 39: Results from monthly turbidity sampling plotted along with modelled flow, Eastern Marshes Rivulet (LSWA22).

108
0.00
5.00
10.00
15.00
20.00
25.00
25-Aug-03
8-Sep-03
22-Sep-03
6-Oct-03
20-Oct-03
3-Nov-03
17-Nov-03
1-Dec-03
15-Dec-03
29-Dec-03
12-Jan-04
26-Jan-04
9-Feb-04
23-Feb-04
8-Mar-04
22-Mar-04
5-Apr-04
19-Apr-04
3-May-04
17-May-04
31-May-04
14-Jun-04
28-Jun-04
12-Jul-04
26-Jul-04
9-Aug-04
23-Aug-04
6-Sep-04
20-Sep-04
4-Oct-04
18-Oct-04
1-Nov-04
15-Nov-04
Turbidity NTU
0.00
1000.00
2000.00
3000.00
4000.00
5000.00
6000.00
7000.00
Flow ML/day
turbidity
flow
Figure 40: Results from monthly turbidity sampling plotted along with modelled flow, Little Swanport River downstream Eastern
Marshes Rivulet (LSWA05b).
Electrical Conductivity
Median conductivity levels at sites in the middle catchment are significantly lower than those
recorded for the upper catchment sites (Figure 41). Conductivity in the Little Swanport River
continues to decline in a downstream direction, however the rate of change is significantly less. In
the middle catchment, the Little Swanport River is less ephemeral than in the upper catchment with
some flow observed throughout the study. In comparison to the upper catchment, the river in the
middle catchment is generally less disconnected during periods of very low flow, and therefore less
influenced by local groundwater inputs. This increased connectivity results in less dissimilarity in
conductivity between sites, with all middle catchment sites on the Little Swanport River having
similar median, maximum and minimum values.
Middle catchment tributary sites also have lower median conductivity values than those recorded
for the upper catchment. Conductivity increases upstream in both Pages Creek and Eastern
Marshes, while in Nutting Garden Rivulet, there is a downstream increase. This may be due to
inputs from the Hobbs Lagoon irrigation complex or differences in geology or groundwater
character. The application of irrigation water may also be mobilising salts within this catchment.

109
LSWA05b LSWA06 LSWA09 LSWA29 LSWA31 LSWA26 LSWA28 LSWA22
Conductivity uS/cm
01002003004005006007008009001000110012001300140015001600170018001900200021002200
Figure 41: Statistics of monthly conductivity data for sites in the middle catchment of the Little Swanport River.
The downstream decrease in conductivity in Eastern Marshes Rivulet is likely to be due to changes
in land use and dilution by inflows, the same processes responsible for the decrease in turbidity. A
comparison between monthly conductivity readings at LSWA22 and LSWA23 is presented in
Figure 42. The January 2004 values, where conductivity at the upper site was less than the lower
200
400
600
800
1000
1200
1400
1600
1800
2000
2200
2400
2600
25-Aug-03
8-Sep-03
22-Sep-03
6-Oct-03
20-Oct-03
3-Nov-03
17-Nov-03
1-Dec-03
15-Dec-03
29-Dec-03
12-Jan-04
26-Jan-04
9-Feb-04
23-Feb-04
8-Mar-04
22-Mar-04
5-Apr-04
19-Apr-04
3-May-04
17-May-04
31-May-04
14-Jun-04
28-Jun-04
12-Jul-04
26-Jul-04
9-Aug-04
23-Aug-04
6-Sep-04
20-Sep-04
4-Oct-04
18-Oct-04
1-Nov-04
15-Nov-04
Conductivity uS/cm
0
200
400
600
800
1000
1200
1400
1600
1800
FLow ML/day
LSWA22LSWA23flow
Figure 42: Results from monthly conductivity sampling and modelled flow, Eastern Marshes Rivulet.

110
site, is a reflection of differing responses at the different sampling times to the rain event
immediately preceding the January 2004 flood. Flow at both sites was low at the time of sampling.
Median conductivity for all middle catchment tributary sites was less than that recorded for the
sites on the little Swanport River itself.
Although conductivity levels decrease in the middle catchment, they are still high, with all sites
having maximum values above 1000 µS/cm. All three middle catchment sites on the Little
Swanport River had median values in excess of 800 µS/cm, a level that may reduce the yield of tree
crops (ANZECC 2000).
Dissolved Oxygen
Monthly results for dissolved oxygen in the middle catchment do not show the same level of
variability recorded at sites throughout the upper catchment (Figure 43). In particular, the lower
variability of dissolved oxygen recorded for the lower sites on the Little Swanport River, LSWA06
and LSWA05b, show the result of the more consistent flow regime in these reaches. Dissolved
oxygen in the middle catchment tributaries showed greater variability than the Little Swanport
River sites, however the outlying values for dissolved oxygen were recorded at very low flow or
where surface flow had ceased. The exception is Eastern Marshes at Swanston (LSWA22) where
there were no high values recorded for low/cease to flow conditions. Dissolved oxygen at this site
was generally lower throughout the study period.
LSWA05b LSWA06 LSWA09 LSWA29 LSWA31 LSWA26 LSWA28 LSWA22
Dissolved Oxygen %saturation
0
10
20
30
40
50
60
70
80
90
100
110
120
130
140
150
160
170
Figure 43: Statistics of monthly conductivity data for the middle catchment of the Little Swanport River.

111
Temperature
Summary statistics for monthly temperature readings in the middle catchment are presented in
Table 14.
Table 14: Summary statistics for monthly temperature data in the middle catchment of the Little Swanport River.
Little
Swanport
River d/s
Eastern
Marshes
Rivulet
Little
Swanport
River u/s
Eastern
Marshes
Rivulet
Little
Swanport
River u/s
Pages Creek
Nutting
Garden
Rivulet at
Stonehenge
Nutting
Garden at
Tinpot Marsh
Rd
Pages Creek
u/s Little
Swanport
River
Pages Creek
at Big
Lagoon
Eastern
Marshes
Rivulet at
Swanston
Median 12.4 11.3 11.65 12.55 11.05 12.4 13.45 11.4
Maximum 20.8 25.3 21.3 23.7 16.7 27.6 23.3 18.5
Minimum 4.8 4.9 4.5 4.5 5.0 5.6 5.2 5.7
Samples 16 16 14 16 16 15 14 16
In-stream pH
In-stream pH results for the middle catchment indicate that waters in this part of the catchment tend
to be slightly more neutral than those recorded for the upper catchment. As in the upper catchment,
minimum values at all sites, except Little Swanport River above Pages Creek (LSWA09), which
was not sampled, were recorded during the high flow event in August 2003. During this event
waters in the middle catchment became more acidic in nature, as dilution by runoff/rainfall reduced
buffering capacity. Summary statistics for in-steam pH in the middle catchment are presented in
Table 15
Table 15: Summary statistics for monthly in-stream pH data in the middle catchment of the Little Swanport River.
Little
Swanport
River d/s
Eastern
Marshes
Rivulet
Little
Swanport
River u/s
Eastern
Marshes
Rivulet
Little
Swanport
River u/s
Pages Creek
Nutting
Garden
Rivulet at
Stonehenge
Nutting
Garden at
Tinpot Marsh
Rd
Pages Creek
u/s Little
Swanport
River
Pages Creek
at Big
Lagoon
Eastern
Marshes
Rivulet at
Swanston
Median 7.76 7.73 7.98 7.83 7.83 7.54 7.42 7.41
Maximum 8.14 8.09 8.65 8.33 8.82 8.42 7.84 8.28
Minimum 6.75 6.72 7.56 6.03 6.2 5.57 6.23 6.53
Samples 16 16 14 16 16 15 14 16
112
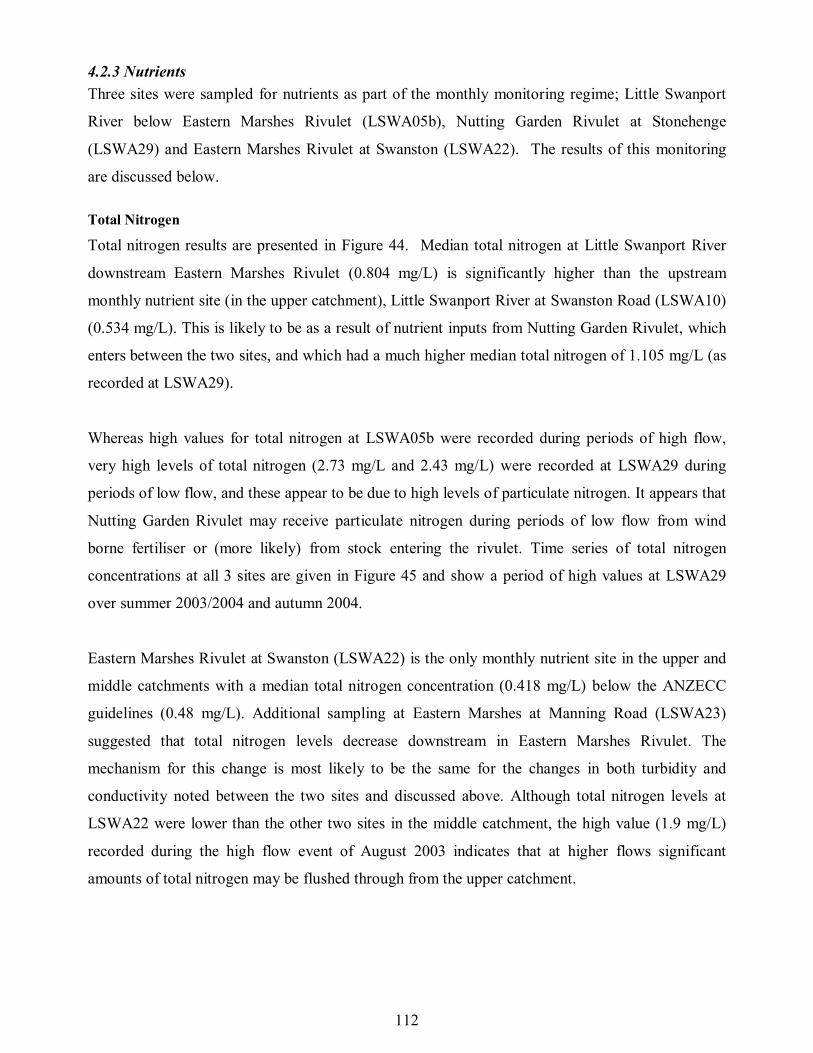
4.2.3 Nutrients
Three sites were sampled for nutrients as part of the monthly monitoring regime; Little Swanport
River below Eastern Marshes Rivulet (LSWA05b), Nutting Garden Rivulet at Stonehenge
(LSWA29) and Eastern Marshes Rivulet at Swanston (LSWA22). The results of this monitoring
are discussed below.
Total Nitrogen
Total nitrogen results are presented in Figure 44. Median total nitrogen at Little Swanport River
downstream Eastern Marshes Rivulet (0.804 mg/L) is significantly higher than the upstream
monthly nutrient site (in the upper catchment), Little Swanport River at Swanston Road (LSWA10)
(0.534 mg/L). This is likely to be as a result of nutrient inputs from Nutting Garden Rivulet, which
enters between the two sites, and which had a much higher median total nitrogen of 1.105 mg/L (as
recorded at LSWA29).
Whereas high values for total nitrogen at LSWA05b were recorded during periods of high flow,
very high levels of total nitrogen (2.73 mg/L and 2.43 mg/L) were recorded at LSWA29 during
periods of low flow, and these appear to be due to high levels of particulate nitrogen. It appears that
Nutting Garden Rivulet may receive particulate nitrogen during periods of low flow from wind
borne fertiliser or (more likely) from stock entering the rivulet. Time series of total nitrogen
concentrations at all 3 sites are given in Figure 45 and show a period of high values at LSWA29
over summer 2003/2004 and autumn 2004.
Eastern Marshes Rivulet at Swanston (LSWA22) is the only monthly nutrient site in the upper and
middle catchments with a median total nitrogen concentration (0.418 mg/L) below the ANZECC
guidelines (0.48 mg/L). Additional sampling at Eastern Marshes at Manning Road (LSWA23)
suggested that total nitrogen levels decrease downstream in Eastern Marshes Rivulet. The
mechanism for this change is most likely to be the same for the changes in both turbidity and
conductivity noted between the two sites and discussed above. Although total nitrogen levels at
LSWA22 were lower than the other two sites in the middle catchment, the high value (1.9 mg/L)
recorded during the high flow event of August 2003 indicates that at higher flows significant
amounts of total nitrogen may be flushed through from the upper catchment.

113
LSWA05b LSWA29 LSWA22
Total Nitrogen mg/L
0.00
0.25
0.50
0.75
1.00
1.25
1.50
1.75
2.00
2.25
2.50
2.75
3.00
Figure 44: Statistics of monthly total nitrogen data for the middle catchment of the Little Swanport River.
0
0.25
0.5
0.75
1
1.25
1.5
1.75
2
2.25
2.5
2.75
3
25-Aug-03
8-Sep-03
22-Sep-03
6-Oct-03
20-Oct-03
3-Nov-03
17-Nov-03
1-Dec-03
15-Dec-03
29-Dec-03
12-Jan-04
26-Jan-04
9-Feb-04
23-Feb-04
8-Mar-04
22-Mar-04
5-Apr-04
19-Apr-04
3-May-04
17-May-04
31-May-04
14-Jun-04
28-Jun-04
12-Jul-04
26-Jul-04
9-Aug-04
23-Aug-04
6-Sep-04
20-Sep-04
4-Oct-04
18-Oct-04
1-Nov-04
15-Nov-04
Total Nitrogen mg/L
0.00
1000.00
2000.00
3000.00
4000.00
5000.00
6000.00
7000.00
8000.00
FLow ML/day
LSWA05b total nitrogenLSWA 29 total nitrogenLSWA22 total nitrogenLSWA05b flow
Figure 45: Middle catchment monthly total nitrogen results and modelled flow at Little Swanport River downstream Eastern Marshes
Rivulet.
Nitrate
Median nitrate concentration at all 3 sites in the middle catchment were below the ANZECC
guideline for the protection of slightly disturbed ecosystems in South-eastern Australia and
Tasmania ( 0.19 mg/L). All maximum values were recorded during the flow event of August 2003.
Results for nitrate do not follow the same pattern as total nitrogen, with LSWA22 having a higher

114
median value than the other two sites. Elevated nitrate levels were recorded at this site for a range
of flow conditions and is most likely related to local groundwater inputs at this site. Results for
nitrate are presented in Figure 46.
LSWA05b LSWA29 LSWA22
Nitrate mg/L
0.0
0.1
0.2
0.3
0.4
0.5
0.6
0.7
0.8
0.9
1.0
1.1
Figure 46: Statistics of monthly nitrate data for the middle catchment of the Little Swanport River.
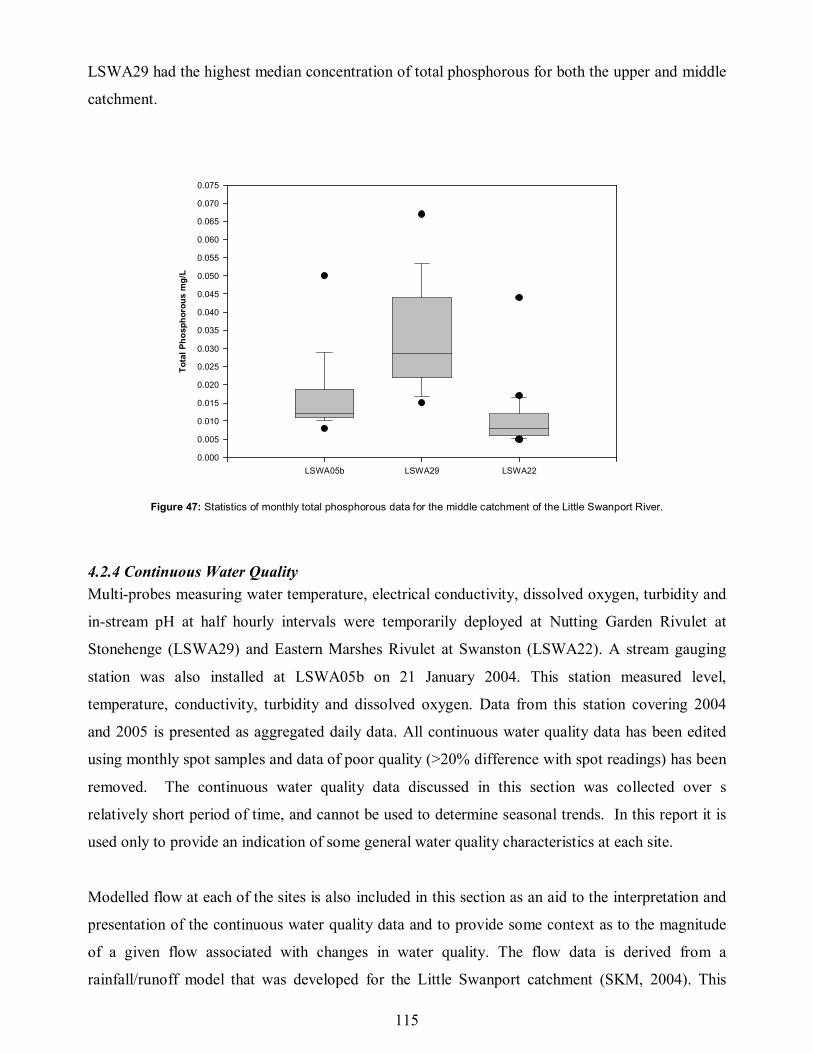
Total Phosphorous
Results for total phosphorous are shown in Figure 47. Median concentrations at LSWA05b and
LSWA22 were below the ANZECC guideline of 0.013 mg/L while the median value at LSWA29
(0.029 mg/L) was above this level. Results for total phosphorous follow the same trends as total
nitrogen. Again there are elevated levels of total phosphorous at LSWA29 during summer
2003/2004 and autumn 2004 and this pattern is also evident at LSWA05b. As with total nitrogen,
concentrations were lower at Eastern Marshes at Swanston (LSWA22) and decreased downstream
between Eastern Marshes at Manning Road (LSW23) and LSWA22.
During the flow event in August 2003, total phosphorous concentration at LSWA31 was measured
at 1.1 mg/L. This high value, reflected also in the high turbidity recorded for LSWA31 during this
event, is indicative of runoff from areas of soil disturbance, such as plowed paddocks, above
LSWA31. The high total phosphorous measured at LSWA29 over summer 2003/2004 and autumn
2003, however, were not reflected in the sample taken at LSWA31 during this period, again
indicating that the source of nutrients at LSWA29 during this period was below LSWA31.
115
LSWA29 had the highest median concentration of total phosphorous for both the upper and middle
catchment.
LSWA05b LSWA29 LSWA22
Total Phosphorous mg/L
0.000
0.005
0.010
0.015
0.020
0.025
0.030
0.035
0.040
0.045
0.050
0.055
0.060
0.065
0.070
0.075
Figure 47: Statistics of monthly total phosphorous data for the middle catchment of the Little Swanport River.
4.2.4 Continuous Water Quality
Multi-probes measuring water temperature, electrical conductivity, dissolved oxygen, turbidity and
in-stream pH at half hourly intervals were temporarily deployed at Nutting Garden Rivulet at
Stonehenge (LSWA29) and Eastern Marshes Rivulet at Swanston (LSWA22). A stream gauging
station was also installed at LSWA05b on 21 January 2004. This station measured level,
temperature, conductivity, turbidity and dissolved oxygen. Data from this station covering 2004
and 2005 is presented as aggregated daily data. All continuous water quality data has been edited
using monthly spot samples and data of poor quality (>20% difference with spot readings) has been
removed. The continuous water quality data discussed in this section was collected over s
relatively short period of time, and cannot be used to determine seasonal trends. In this report it is
used only to provide an indication of some general water quality characteristics at each site.
Modelled flow at each of the sites is also included in this section as an aid to the interpretation and
presentation of the continuous water quality data and to provide some context as to the magnitude
of a given flow associated with changes in water quality. The flow data is derived from a
rainfall/runoff model that was developed for the Little Swanport catchment (SKM, 2004). This
116
model is based on long-term rainfall data and is more accurate in modelling a long term flow record
rather than the short term records presented here. In addition, the catchment runoff model only
provides flow for the lower gauging station, and flow for upstream sites has been reduced
according to the reduction in catchment area. There are a number of inherent inaccuracies in doing
this, particularly as rainfall across the catchment is often variable. Rainfall that produces a given
flow at the lower gauging station may not fall evenly across the catchment and therefore flow at
upstream sites may not always be proportional to catchment area. There is good agreement,
however, between the modelled flow hydrographs and the level hydrograph at the upper gauging
station. And the data has been calibrated with field gaugings on several occasions.
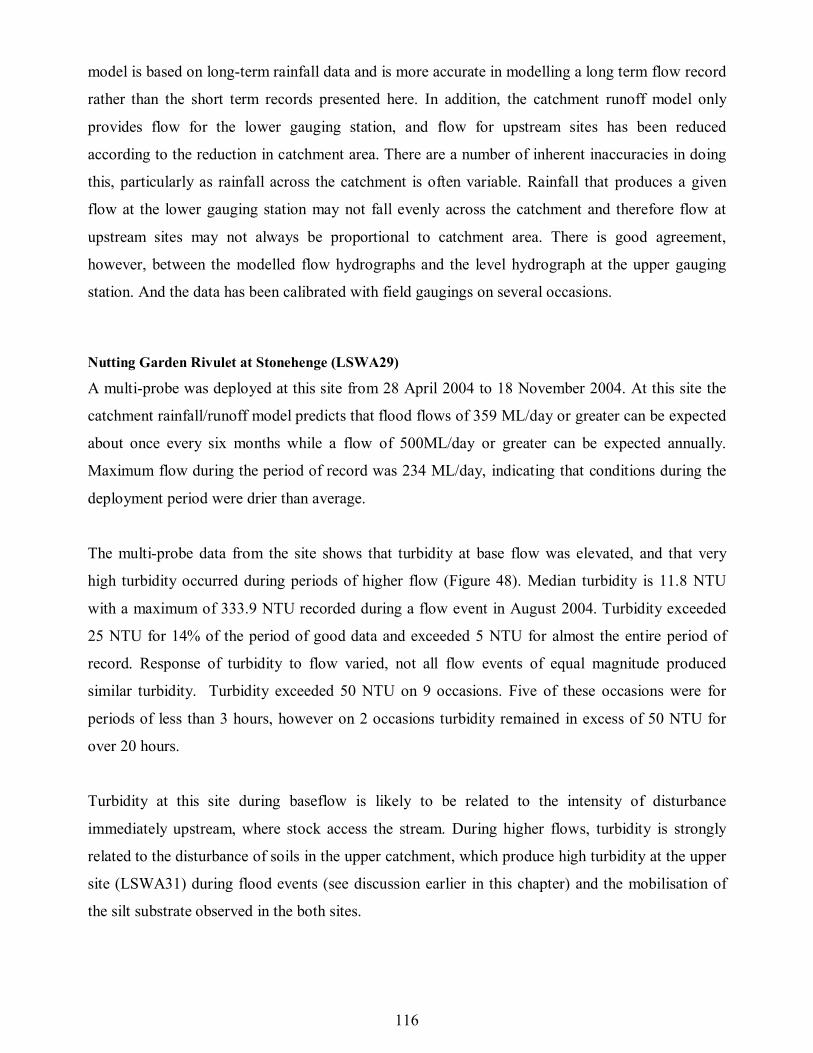
Nutting Garden Rivulet at Stonehenge (LSWA29)
A multi-probe was deployed at this site from 28 April 2004 to 18 November 2004. At this site the
catchment rainfall/runoff model predicts that flood flows of 359 ML/day or greater can be expected
about once every six months while a flow of 500ML/day or greater can be expected annually.
Maximum flow during the period of record was 234 ML/day, indicating that conditions during the
deployment period were drier than average.
The multi-probe data from the site shows that turbidity at base flow was elevated, and that very
high turbidity occurred during periods of higher flow (Figure 48). Median turbidity is 11.8 NTU
with a maximum of 333.9 NTU recorded during a flow event in August 2004. Turbidity exceeded
25 NTU for 14% of the period of good data and exceeded 5 NTU for almost the entire period of
record. Response of turbidity to flow varied, not all flow events of equal magnitude produced
similar turbidity. Turbidity exceeded 50 NTU on 9 occasions. Five of these occasions were for
periods of less than 3 hours, however on 2 occasions turbidity remained in excess of 50 NTU for
over 20 hours.
Turbidity at this site during baseflow is likely to be related to the intensity of disturbance
immediately upstream, where stock access the stream. During higher flows, turbidity is strongly
related to the disturbance of soils in the upper catchment, which produce high turbidity at the upper
site (LSWA31) during flood events (see discussion earlier in this chapter) and the mobilisation of
the silt substrate observed in the both sites.

117
0
50
100
150
200
250
300
350
28-Apr-04
3-May-04
7-May-04
11-May-04
16-May-04
20-May-04
25-May-04
29-May-04
2-Jun-04
7-Jun-04
11-Jun-04
16-Jun-04
20-Jun-04
24-Jun-04
29-Jun-04
3-Jul-04
8-Jul-04
12-Jul-04
16-Jul-04
21-Jul-04
25-Jul-04
30-Jul-04
3-Aug-04
7-Aug-04
12-Aug-04
16-Aug-04
21-Aug-04
25-Aug-04
29-Aug-04
3-Sep-04
7-Sep-04
12-Sep-04
16-Sep-04
20-Sep-04
25-Sep-04
29-Sep-04
4-Oct-04
8-Oct-04
12-Oct-04
17-Oct-04
21-Oct-04
26-Oct-04
30-Oct-04
3-Nov-04
8-Nov-04
12-Nov-04
17-Nov-04
Turbidity NTU
0
50
100
150
200
250
Flow ML/day
turbidity
flow
Figure 48: Continuous turbidity data and modelled flow at Nutting Garden Rivulet at Stonehenge (LSWA29).
Median conductivity for the period of record was 740 µS/cm with a maximum of 1153 µS/cm.
Conductivity exceeded 800 µS/cm for 32% of the period of good data. Conductivity rises steadily
during periods of low flow and generally drops substantially with increases in flow. Conductivity
was lowest over the winter months when rainfall is more common and flow is higher.
200
300
400
500
600
700
800
900
1000
1100
1200
28-Apr-04
3-May-04
8-May-04
12-May-04
17-May-04
22-May-04
26-May-04
31-May-04
5-Jun-04
9-Jun-04
14-Jun-04
19-Jun-04
23-Jun-04
28-Jun-04
3-Jul-04
8-Jul-04
12-Jul-04
17-Jul-04
22-Jul-04
26-Jul-04
31-Jul-04
5-Aug-04
9-Aug-04
14-Aug-04
19-Aug-04
24-Aug-04
28-Aug-04
2-Sep-04
7-Sep-04
11-Sep-04
16-Sep-04
21-Sep-04
25-Sep-04
30-Sep-04
5-Oct-04
9-Oct-04
14-Oct-04
19-Oct-04
24-Oct-04
28-Oct-04
2-Nov-04
7-Nov-04
11-Nov-04
16-Nov-04
Conductivity uS/cm
0
50
100
150
200
250
Flow ML/day
conductivity
flow
Figure 49: Continuous conductivity data and modelled flow at Nutting Garden Rivulet at Stonehenge (LSWA29).
Dissolved oxygen levels at this site were generally good, with dissolved oxygen exceeding 6 mg/l
for the entire period of good data. Diurnal variation increased during spring, a reflection of

118
increased temperature and production. Dissolved oxygen began to decline in late spring, possibly
indicating that during summer low dissolved oxygen levels may occur at this site.
Maximum and minimum water temperature recorded at this site over the period of record was
21.5 oC and 1.76
oC respectively. Average temperature in June was 6.4
oC, increasing to 12.5
oC in
October. Temperatures in spring were moderate, vary rarely exceeding 21 oC, although
temperatures in excess of 21 oC would be expected to be more frequent during summer. Periods of
increased diurnal fluctuation are also apparent in spring.
0
4
8
12
16
20
24
2-May-04
7-May-04
11-May-04
15-May-04
19-May-04
24-May-04
28-May-04
1-Jun-04
5-Jun-04
10-Jun-04
14-Jun-04
18-Jun-04
22-Jun-04
27-Jun-04
1-Jul-04
5-Jul-04
9-Jul-04
14-Jul-04
18-Jul-04
22-Jul-04
27-Jul-04
31-Jul-04
4-Aug-04
8-Aug-04
13-Aug-04
17-Aug-04
21-Aug-04
25-Aug-04
30-Aug-04
3-Sep-04
7-Sep-04
11-Sep-04
16-Sep-04
20-Sep-04
24-Sep-04
28-Sep-04
3-Oct-04
7-Oct-04
11-Oct-04
15-Oct-04
20-Oct-04
24-Oct-04
28-Oct-04
1-Nov-04
6-Nov-04
10-Nov-04
14-Nov-04
Temperature Deg C
0
50
100
150
200
250
Flow ML/day
temperature
flow
Figure 51: Continuous water temperature data and modelled flow at Nutting Garden Rivulet at Stonehenge (LSWA29).
Median pH at this site was 7.77, with maximum and minimum values of 8.61 and 6.31 respectively.
As with dissolved oxygen and temperature, diurnal pH fluctuations are more apparent in spring,
although the amplitude of these diurnal fluctuations was moderate.

119
7
7.2
7.4
7.6
7.8
8
8.2
8.4
8.6
8.8
2-May-04
6-May-04
10-May-04
14-May-04
19-May-04
23-May-04
27-May-04
31-May-04
4-Jun-04
8-Jun-04
12-Jun-04
16-Jun-04
20-Jun-04
24-Jun-04
28-Jun-04
2-Jul-04
6-Jul-04
10-Jul-04
14-Jul-04
18-Jul-04
23-Jul-04
27-Jul-04
31-Jul-04
4-Aug-04
8-Aug-04
12-Aug-04
16-Aug-04
20-Aug-04
24-Aug-04
28-Aug-04
1-Sep-04
5-Sep-04
9-Sep-04
13-Sep-04
17-Sep-04
22-Sep-04
26-Sep-04
30-Sep-04
4-Oct-04
8-Oct-04
12-Oct-04
16-Oct-04
20-Oct-04
24-Oct-04
28-Oct-04
1-Nov-04
5-Nov-04
9-Nov-04
13-Nov-04
18-Nov-04
pH
0
50
100
150
200
250
Flow ML/day
Figure 50: Continuous in-stream pH data and modelled flow at Nutting Garden Rivulet at Stonehenge (LSWA29).
Eastern Marshes at Swanston (LSWA22)
A multi-probe was deployed at this site from 22 July 2004 to 18 November 2004. At this site the
catchment surface water model predicts that a flow of 936 ML/day or greater can be expected
approximately every year while a flow of 567 ML/day or greater can be expected approximately
every six months. Maximum flow during the period of record was 319 ML/day.
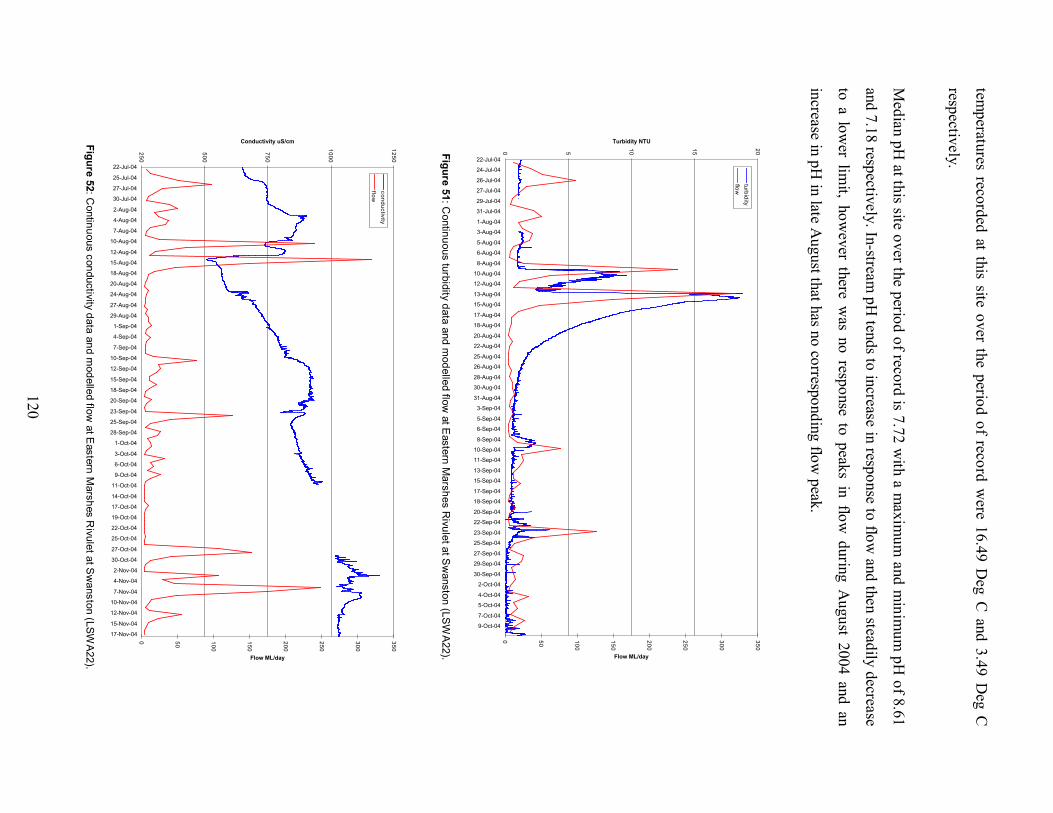
Turbidity at this site was generally low with a median of 0.87 NTU. Turbidity was below 5 NTU
for 91% of the period of good data (Figure 51). A maximum of 18.7 NTU was recorded during a
peak flow event of 192 ML/day in August 2004.
Conductivity at this site is high, with a median of 860 µS/cm and a maximum of 1192 µS/cm.
Conductivity exceeded 800 µS/cm for 62% of the period of good data (Figure 52).
Dissolved oxygen at this site exceeded 5 mg/l over the whole period of record. Two minor flow
peaks in September 2004 produced significant drops in dissolved oxygen (Figure 53), possibly a
result of an influx of organic material. Larger diurnal variations are apparent in spring.
Diurnal temperature changes at this site were more moderate than those recorded at Nutting Garden
Rivulet at Stonehenge and Little Swanport River at Swanston. This site has greater riparian shading
and shade is also provided by steep stream banks (see section 4.2.1). Maximum and minimum
120
temperatu
res recorded at th
is site over th
e perio
d of reco
rd w
ere 16.49 D
eg C
and 3.49 D
eg C
respectiv
ely.
Median pH at th
is site over th
e perio
d of reco
rd is 7
.72 w
ith a m
axim
um and m
inim
um pH of 8
.61
and 7.18 resp
ectively. In
-stream pH ten
ds to
increase in
response to
flow an
d th
en stead
ily decrea
se
to a lo
wer lim
it, however th
ere was n
o resp
onse to
peak
s in flo
w durin
g A
ugust 2
004 an
d an
increa
se in pH in
late August th
at has n
o co
rresponding flo
w peak
.
0 5
10
15
20
22-Jul-04
24-Jul-04
26-Jul-04
27-Jul-04
29-Jul-04
31-Jul-04
1-Aug-04
3-Aug-04
5-Aug-04
6-Aug-04
8-Aug-04
10-Aug-04
12-Aug-04
13-Aug-04
15-Aug-04
17-Aug-04
18-Aug-04
20-Aug-04
22-Aug-04
25-Aug-04
26-Aug-04
28-Aug-04
30-Aug-04
31-Aug-04
3-Sep-04
5-Sep-04
6-Sep-04
8-Sep-04
10-Sep-04
11-Sep-04
13-Sep-04
15-Sep-04
17-Sep-04
18-Sep-04
20-Sep-04
22-Sep-04
23-Sep-04
25-Sep-04
27-Sep-04
29-Sep-04
30-Sep-04
2-Oct-04
4-Oct-04
5-Oct-04
7-Oct-04
9-Oct-04
Turbidity NTU
0 50
100
150
200
250
300
350
Flow ML/day
turbidity
flow
Figure 51: Continuous turbidity data and modelled flow at Eastern Marshes Rivulet at Swanston (LSWA22).
250
500
750
1000
1250
22-Jul-04
25-Jul-04
27-Jul-04
30-Jul-04
2-Aug-04
4-Aug-04
7-Aug-04
10-Aug-04
12-Aug-04
15-Aug-04
18-Aug-04
20-Aug-04
24-Aug-04
27-Aug-04
29-Aug-04
1-Sep-04
4-Sep-04
7-Sep-04
10-Sep-04
12-Sep-04
15-Sep-04
18-Sep-04
20-Sep-04
23-Sep-04
25-Sep-04
28-Sep-04
1-Oct-04
3-Oct-04
6-Oct-04
9-Oct-04
11-Oct-04
14-Oct-04
17-Oct-04
19-Oct-04
22-Oct-04
25-Oct-04
27-Oct-04
30-Oct-04
2-Nov-04
4-Nov-04
7-Nov-04
10-Nov-04
12-Nov-04
15-Nov-04
17-Nov-04
Conductivity uS/cm
0 50
100
150
200
250
300
350
Flow ML/day
conductivity
flow
Figure 52: Continuous conductivity data and modelled flow at Eastern Marshes Rivulet at Swanston (LSWA22).

121
468
10
12
14
16
22-Jul-04
25-Jul-04
27-Jul-04
30-Jul-04
1-Aug-04
4-Aug-04
6-Aug-04
8-Aug-04
11-Aug-04
13-Aug-04
16-Aug-04
18-Aug-04
21-Aug-04
24-Aug-04
27-Aug-04
29-Aug-04
1-Sep-04
4-Sep-04
7-Sep-04
9-Sep-04
11-Sep-04
14-Sep-04
17-Sep-04
19-Sep-04
21-Sep-04
24-Sep-04
26-Sep-04
29-Sep-04
1-Oct-04
4-Oct-04
6-Oct-04
9-Oct-04
11-Oct-04
14-Oct-04
16-Oct-04
19-Oct-04
21-Oct-04
24-Oct-04
26-Oct-04
29-Oct-04
31-Oct-04
3-Nov-04
5-Nov-04
8-Nov-04
10-Nov-04
13-Nov-04
15-Nov-04
18-Nov-04
Dissolved Oxygen mg/l
050
100
150
200
250
300
350
FLow ML/day
dissolved oxygen
flow
Figure 53: Continuous dissolved oxygen data and modelled flow at Eastern Marshes Rivulet at Swanston (LSWA22).
02468
10
12
14
16
18
22-Jul-04
25-Jul-04
27-Jul-04
29-Jul-04
1-Aug-04
3-Aug-04
6-Aug-04
8-Aug-04
11-Aug-04
13-Aug-04
16-Aug-04
18-Aug-04
21-Aug-04
24-Aug-04
27-Aug-04
29-Aug-04
31-Aug-04
3-Sep-04
6-Sep-04
9-Sep-04
11-Sep-04
14-Sep-04
16-Sep-04
19-Sep-04
21-Sep-04
23-Sep-04
26-Sep-04
28-Sep-04
1-Oct-04
3-Oct-04
6-Oct-04
8-Oct-04
11-Oct-04
13-Oct-04
16-Oct-04
18-Oct-04
21-Oct-04
23-Oct-04
25-Oct-04
28-Oct-04
30-Oct-04
2-Nov-04
4-Nov-04
7-Nov-04
9-Nov-04
12-Nov-04
14-Nov-04
17-Nov-04
Temperature Deg C
050
100
150
200
250
300
350
FLow ML/day
temperature
flow
Figure 54: Continuous water temperature data and modelled flow at Eastern Marshes Rivulet at Swanston (LSWA22).

122
7
7.2
7.4
7.6
7.8
8
8.2
8.4
8.6
8.8
22-Jul-04
25-Jul-04
27-Jul-04
30-Jul-04
1-Aug-04
4-Aug-04
6-Aug-04
9-Aug-04
11-Aug-04
14-Aug-04
16-Aug-04
19-Aug-04
21-Aug-04
25-Aug-04
27-Aug-04
30-Aug-04
2-Sep-04
5-Sep-04
7-Sep-04
10-Sep-04
12-Sep-04
15-Sep-04
17-Sep-04
20-Sep-04
22-Sep-04
25-Sep-04
28-Sep-04
30-Sep-04
3-Oct-04
5-Oct-04
8-Oct-04
10-Oct-04
13-Oct-04
15-Oct-04
18-Oct-04
20-Oct-04
23-Oct-04
25-Oct-04
28-Oct-04
30-Oct-04
2-Nov-04
4-Nov-04
7-Nov-04
9-Nov-04
12-Nov-04
15-Nov-04
17-Nov-04
pH
0
50
100
150
200
250
300
350
FLow ML/day
pH
flow
Figure 55: Continuous in-stream pH data and modelled flow at Eastern Marshes Rivulet at Swanston (LSWA22).
Little Swanport River downstream Eastern Marshes Rivulet (LSWA05b)
Continuous water quality monitoring commenced at this site on 21 January 2004. The data has been
edited using monthly spot samples, and data that exceeds the spot reading by 20% has not been
used in this report. Aggregated daily data for 2004 and 2005 is presented along with modelled flow,
as at the time of writing an adequate rating has not been developed for this site.
During 2004/2005 flow at this site was highly variable, but was below 267.5 ML/day for 90% of
the time. An estimated maximum daily flow of 8610 ML/day occurred during a storm event in
September 2005. This event peaked at 2.405 metres above the cease to flow point at this site. A
flow event of this magnitude can be expected to occur approximately every 5 years, while a flow of
2390 ML/day can be expected every six months and a flow of 3947 ML/day can be expected
annually. In 2005 a series of significant flow events in spring 2005 followed by low levels in
winter, while in 2004 there were fewer significant events.
The mean turbidity for 2004-05 from the continuously recorded data is 4.03 NTU with a low
standard deviation around this mean of 0.25 NTU. A maximum of 83.1 NTU was recorded during
the large storm event in September 2005 (Figure 56). Turbidity was below 25 NTU for almost the
entire period of record and exceeded this level for short duration during 4 flood events, the longest
duration of which was 23 hours during the large September flood.

123
0
5
10
15
20
25
30
35
40
22-Jan-04
9-Feb-04
27-Feb-04
16-Mar-04
3-Apr-04
21-Apr-04
9-May-04
27-May-04
14-Jun-04
2-Jul-04
20-Jul-04
7-Aug-04
25-Aug-04
12-Sep-04
30-Sep-04
18-Oct-04
5-Nov-04
23-Nov-04
11-Dec-04
29-Dec-04
16-Jan-05
3-Feb-05
21-Feb-05
11-Mar-05
29-Mar-05
16-Apr-05
4-May-05
22-May-05
9-Jun-05
27-Jun-05
15-Jul-05
2-Aug-05
20-Aug-05
7-Sep-05
25-Sep-05
13-Oct-05
31-Oct-05
18-Nov-05
6-Dec-05
24-Dec-05
Turbidity NTU
0
1000
2000
3000
4000
5000
6000
7000
8000
9000
10000
Flow ML/day
turbidity
f low
Figure 56: Daily aggregated turbidity at Little Swanport River downstream Eastern Marshes Rivulet (LSWA05b) with modelled daily
flow.
Electrical conductivity is highly variable over time, with a minimum of 108 µS/cm recorded during
the September 2005 flood event and a maximum of 1307 µS/cm recorded in January 2004 after a
lengthy period of low flow. Conductivity at this site displays a typical pattern of slowly increasing
levels during periods of low flow with dramatically declines when increased flow from storm
events dilutes baseflow in the river (Figure 57). Conductivity exceeded 800 µS/cm for 52% of the
record of good data for 2004-05, indicating that there are substantial periods when the use of this
water for irrigation will produce sub-optimal yields and retarded crop growth.
The record for dissolved oxygen concentration displays a distinct, seasonal pattern with higher
levels occurring during winter (Figure 58). A maximum of 13.2 mg/L was recorded in August 2004
while a minimum of 4.3 mg/L was recorded in March 2005. Dissolved oxygen fell below 5 mg/L as
determined over one diurnal cycle on five occasions, all in summer 2005, including three occasions
over three days in March 2005. Dissolved oxygen concentrations at this site are well within the
ANZECC guidelines for a healthy ecosystem.

124
0
200
400
600
800
1000
1200
1400
22-Jan-04
9-Feb-04
27-Feb-04
16-Mar-04
3-Apr-04
21-Apr-04
9-May-04
27-May-04
14-Jun-04
2-Jul-04
20-Jul-04
7-Aug-04
25-Aug-04
12-Sep-04
30-Sep-04
18-Oct-04
5-Nov-04
23-Nov-04
11-Dec-04
29-Dec-04
16-Jan-05
3-Feb-05
21-Feb-05
11-Mar-05
29-Mar-05
16-Apr-05
4-May-05
22-May-05
9-Jun-05
27-Jun-05
15-Jul-05
2-Aug-05
20-Aug-05
7-Sep-05
25-Sep-05
13-Oct-05
31-Oct-05
18-Nov-05
6-Dec-05
24-Dec-05
Conductivity us/cm
0 1000
2000
3000
4000
5000
6000
7000
8000
9000
10000
Flow ML/day
conductivity
flow
Figure 57: Daily aggregated conductivity at Little Swanport R
iver downstream Eastern Marshes Rivulet (LSWA05b) with modelled daily
flow.
0 2 4 6 8
10
12
14
22-Jan-04
10-Feb-04
29-Feb-04
19-Mar-04
7-Apr-04
26-Apr-04
15-May-04
3-Jun-04
22-Jun-04
11-Jul-04
30-Jul-04
18-Aug-04
6-Sep-04
25-Sep-04
14-Oct-04
2-Nov-04
21-Nov-04
10-Dec-04
29-Dec-04
17-Jan-05
5-Feb-05
24-Feb-05
15-Mar-05
3-Apr-05
22-Apr-05
11-May-05
30-May-05
18-Jun-05
7-Jul-05
26-Jul-05
14-Aug-05
2-Sep-05
21-Sep-05
10-Oct-05
29-Oct-05
17-Nov-05
6-Dec-05
25-Dec-05
Dissolved Oxygen mg/L
0 1000
2000
3000
4000
5000
6000
7000
8000
9000
10000
Flow ML/day
dissolved oxygen
flow
Figure 58: Daily aggregated dissolved oxygen at Little Swanport River downstream Eastern Marshes Rivulet (LSWA05b) with modelled
daily flow.
Water te
mperatu
re at this site is co
mparativ
ely m
oderate, h
owever b
etween
December 2
004 an
d
February
2005 tem
peratu
re exceed
ed 21 oC
for 1
0% of th
e record w
ith a m
axim
um te
mperatu
re of
24.5 oC reco
rded in
Dece
mber 2
004. A
lthough th
e riparia
n vegetatio
n at th
is site is sparse, th
e

125
water is deep, in excess of 1 metre, which may explain the generally lower temperatures recorded at
this site in comparison with those recorded at LSWA10.
0
5
10
15
20
2522-Jan-04
9-Feb-04
27-Feb-04
16-Mar-04
3-Apr-04
21-Apr-04
9-May-04
27-May-04
14-Jun-04
2-Jul-04
20-Jul-04
7-Aug-04
25-Aug-04
12-Sep-04
30-Sep-04
18-Oct-04
5-Nov-04
23-Nov-04
11-Dec-04
29-Dec-04
16-Jan-05
3-Feb-05
21-Feb-05
11-Mar-05
29-Mar-05
16-Apr-05
4-May-05
22-May-05
9-Jun-05
27-Jun-05
15-Jul-05
2-Aug-05
20-Aug-05
7-Sep-05
25-Sep-05
13-Oct-05
31-Oct-05
18-Nov-05
6-Dec-05
24-Dec-05
Water Temperature Deg C
0
1000
2000
3000
4000
5000
6000
7000
8000
9000
10000
Flow ML/day
temperature
f low
Figure 59: Daily aggregated water temperature at Little Swanport River downstream Eastern Marshes Rivulet (LSWA05b) with
modelled daily flow.
4.2.5 Flood sampling
A flood sampler was installed at Little Swanport River downstream Eastern Marshes Rivulet
(LSWA05b). This sampler was activated by rise in water level past a set point, triggering a
sampling program. The sampler can take 24 samples following a predetermined program of
sampling times. During the course of the survey a significant flood was captured from 29 January
2004 to 4 February 2004. Two other flood events, captured after the survey in August 2005 and
September 2005, however these are not discussed in this section. The data from all three events has
been used to make estimates of catchment transport loads, which is the focus of the next section.
Although a large number of parameters were analysed from the samples collected during flood
flows, only those that illustrate fundamental or characteristic water quality changes with flow are
presented. It should be noted that the relationship between any particular parameter and flow may
vary with the magnitude and timing of any individual event, and is also influenced by the preceding
flow and weather conditions. For example, a flow event of a given magnitude in late summer might
have a different water quality signature than an identical event in late winter.

126
The flood event of January 2004 commenced with a rise in the river at 4 PM on the afternoon of
29th January, triggering the commencement of sampling by the automated machine. The event had
two distinct flood peaks, the first reaching 1.292 m above the cease to flow point on 29th January at
12:00 pm, and the second reaching a peak river level of 0.96 m at 3 am on the 2nd February
(Figure 60). The estimated discharge at the time of the first peak was 6471 ML/day, and a flood of
this magnitude or greater is expected to occur approximately once every 2 years. Both flood peaks
consisted of two minor peaks, which probably indicate a time lag between inputs from different
parts of the catchment.
Both flood peaks, although of different magnitude, produced similar peaks in turbidity (Figure 60),
with a maximum of 25.7 NTU for the first peak and 26.9 NTU for the second. The response of
turbidity to the second flood peak differs from the first, with 2 distinct peaks in turbidity
corresponding to flow, while during the first flood peak turbidity does not respond sharply to the
second smaller flow pulse. Given the magnitude of the flood event, turbidity is relatively low,
remaining below 27 NTU for the duration of the flood. The concentration of total suspended solids
followed turbidity with a peak value of 17 mg/L close to the flood peak (Figure 61). The maximum
concentration (25 mg/L) was recorded after the second flood peak and it is possible that higher
concentrations might have occurred over the second flood peak.
A demonstrated in an earlier section, electrical conductivity responded dramatically to the first rise
in the hydrograph with a drop over 7 hours from 1274 µS/cm to a minimum of 125 µS/cm at the
flood peak (Figure 62). There are only small responses to subsequent peaks in flow. Following the
flood conductivity gradually rises but does not exceed 1000 µS/cm again until late March 2004.
The drop in conductivity with the flood peak is a dramatic switch from groundwater inputs at
baseflow to overland runoff during the flood, followed by a gradual return to baseflow, dominated
by the now diluted groundwater sources.

127
0 5
10
15
20
25
30
28-Jan-04
28-Jan-04
28-Jan-04
28-Jan-04
28-Jan-04
29-Jan-04
29-Jan-04
29-Jan-04
29-Jan-04
29-Jan-04
30-Jan-04
30-Jan-04
30-Jan-04
30-Jan-04
30-Jan-04
31-Jan-04
31-Jan-04
31-Jan-04
31-Jan-04
31-Jan-04
1-Feb-04
1-Feb-04
1-Feb-04
1-Feb-04
2-Feb-04
2-Feb-04
2-Feb-04
2-Feb-04
2-Feb-04
3-Feb-04
3-Feb-04
3-Feb-04
3-Feb-04
3-Feb-04
4-Feb-04
4-Feb-04
4-Feb-04
4-Feb-04
4-Feb-04
5-Feb-04
5-Feb-04
5-Feb-04
5-Feb-04
Turbidity NTU
0 0.2
0.4
0.6
0.8
1 1.2
1.4
River level m
turbidity
level
Figure 60: Turbidity and river level during a flood event at Little Swanport R
iver downstream Eastern Marshes Rivulet (LSWA05b),
January 2004.
0 5
10
15
20
25
30
29-Jan-04
29-Jan-04
29-Jan-04
29-Jan-04
29-Jan-04
29-Jan-04
30-Jan-04
30-Jan-04
30-Jan-04
30-Jan-04
30-Jan-04
31-Jan-04
31-Jan-04
31-Jan-04
31-Jan-04
31-Jan-04
1-Feb-04
1-Feb-04
1-Feb-04
1-Feb-04
1-Feb-04
2-Feb-04
2-Feb-04
2-Feb-04
2-Feb-04
2-Feb-04
3-Feb-04
3-Feb-04
3-Feb-04
3-Feb-04
3-Feb-04
4-Feb-04
4-Feb-04
4-Feb-04
4-Feb-04
4-Feb-04
5-Feb-04
5-Feb-04
5-Feb-04
5-Feb-04
5-Feb-04
Total Suspended Solids mg/L
0.00
0.20
0.40
0.60
0.80
1.00
1.20
1.40
River level m
total suspended solids
level
Figure 61: Total suspended solids and river level during a flood event at Little Swanport R
iver downstream Eastern Marshes Rivulet
(LSWA05b), January 2004.

128
0
250
500
750
1000
1250
1500
29-Jan-04
29-Jan-04
29-Jan-04
29-Jan-04
29-Jan-04
29-Jan-04
30-Jan-04
30-Jan-04
30-Jan-04
30-Jan-04
30-Jan-04
30-Jan-04
31-Jan-04
31-Jan-04
31-Jan-04
31-Jan-04
31-Jan-04
1-Feb-04
1-Feb-04
1-Feb-04
1-Feb-04
1-Feb-04
1-Feb-04
2-Feb-04
2-Feb-04
2-Feb-04
2-Feb-04
2-Feb-04
2-Feb-04
3-Feb-04
3-Feb-04
3-Feb-04
3-Feb-04
3-Feb-04
4-Feb-04
4-Feb-04
4-Feb-04
4-Feb-04
4-Feb-04
4-Feb-04
5-Feb-04
5-Feb-04
5-Feb-04
5-Feb-04
5-Feb-04
Conductivity uS/cm
0
0.2
0.4
0.6
0.8
1
1.2
1.4
River level m
conductivity
level
Figure 62: Conductivity and river level during a flood event at Little Swanport River downstream Eastern Marshes Rivulet (LSWA05b),
January 2004.
The pattern of change in total nitrogen is quite different to that for turbidity and suspended solids.
Total nitrogen peaked immediately prior to the flood peak (Figure 63) with a maximum
concentration of 2.73 mg/L. A high proportion of this initial peak in total nitrogen consists of
nitrate (Figure 64), with a maximum concentration of 1.38 mg/L from the same sample. Nitrate
levels rapidly decline and total nitrogen after the flood peak consists predominantly of particulate
matter. This illustrates the processes discussed in section 4.1.3, where nitrate is flushed from the
soil during a rain event while subsequent overland flow carries particulate nitrogen into the system.
Total phosphorous concentration (Figure 65) strongly follows turbidity. Dissolved reactive
phosphorous remained low throughout the flood, indicating that phosphorous is transported
primarily in particulate form bound to sediment, and clearly illustrates that this nutrient is
mobilised in the landscape primarily through erosive processes.
The composition of major ions remained relatively constant throughout the event with sodium and
chloride dominant and the overall proportions consistent with the results of the catchment survey
(section 4.4). The exception is sulphate, where significantly higher concentrations were detected
after the second flood peak (Figure 66). The catchment survey data (section 4.4) showed high
sulphate levels at some sites in the upper catchment. High sulphate values detected after the second
flood peak may therefore be a result of the mobilisation of sulphate from the upper catchment or
more local weathering processes.

129
0
0.51
1.52
2.53
29-Jan-04
29-Jan-04
29-Jan-04
29-Jan-04
29-Jan-04
29-Jan-04
30-Jan-04
30-Jan-04
30-Jan-04
30-Jan-04
30-Jan-04
31-Jan-04
31-Jan-04
31-Jan-04
31-Jan-04
31-Jan-04
1-Feb-04
1-Feb-04
1-Feb-04
1-Feb-04
1-Feb-04
1-Feb-04
2-Feb-04
2-Feb-04
2-Feb-04
2-Feb-04
2-Feb-04
3-Feb-04
3-Feb-04
3-Feb-04
3-Feb-04
3-Feb-04
4-Feb-04
4-Feb-04
4-Feb-04
4-Feb-04
4-Feb-04
4-Feb-04
5-Feb-04
5-Feb-04
5-Feb-04
5-Feb-04
5-Feb-04
Total Nitrogen mg/L
0.00
0.20
0.40
0.60
0.80
1.00
1.20
1.40
River level m
total nitrogen
level
Figure 63: Total nitrogen and river level during a flood event at Little Swanport River downstream Eastern Marshes Rivulet (LSWA05b),
January 2004. 0
0.2
0.4
0.6
0.81
1.2
1.4
1.6
29-Jan-04
29-Jan-04
29-Jan-04
29-Jan-04
29-Jan-04
29-Jan-04
30-Jan-04
30-Jan-04
30-Jan-04
30-Jan-04
30-Jan-04
31-Jan-04
31-Jan-04
31-Jan-04
31-Jan-04
31-Jan-04
1-Feb-04
1-Feb-04
1-Feb-04
1-Feb-04
1-Feb-04
1-Feb-04
2-Feb-04
2-Feb-04
2-Feb-04
2-Feb-04
2-Feb-04
3-Feb-04
3-Feb-04
3-Feb-04
3-Feb-04
3-Feb-04
4-Feb-04
4-Feb-04
4-Feb-04
4-Feb-04
4-Feb-04
4-Feb-04
5-Feb-04
5-Feb-04
5-Feb-04
5-Feb-04
5-Feb-04
Nitrate mg/L
0.00
0.20
0.40
0.60
0.80
1.00
1.20
1.40
River level m
nitrate
river level
Figure 64: Nitrate and river level during a flood event at Little Swanport River downstream Eastern Marshes Rivulet (LSWA05b),
January 2004.

130
0
0.01
0.02
0.03
0.04
0.05
0.06
29-Jan-04
29-Jan-04
29-Jan-04
29-Jan-04
29-Jan-04
30-Jan-04
30-Jan-04
30-Jan-04
30-Jan-04
30-Jan-04
31-Jan-04
31-Jan-04
31-Jan-04
31-Jan-04
31-Jan-04
1-Feb-04
1-Feb-04
1-Feb-04
1-Feb-04
1-Feb-04
2-Feb-04
2-Feb-04
2-Feb-04
2-Feb-04
3-Feb-04
3-Feb-04
3-Feb-04
3-Feb-04
3-Feb-04
4-Feb-04
4-Feb-04
4-Feb-04
4-Feb-04
4-Feb-04
5-Feb-04
5-Feb-04
5-Feb-04
5-Feb-04
5-Feb-04
Total Phosphorous mg/L
0.00
0.20
0.40
0.60
0.80
1.00
1.20
1.40
River level m
total phosphorous
level
Figure 65: Total phosphorous and river level during a flood event at Little Swanport River downstream Eastern Marshes Rivulet
(LSWA05b), January 2004.
0
20
40
60
80
100
120
29-Jan-04
29-Jan-04
29-Jan-04
29-Jan-04
29-Jan-04
29-Jan-04
30-Jan-04
30-Jan-04
30-Jan-04
30-Jan-04
30-Jan-04
31-Jan-04
31-Jan-04
31-Jan-04
31-Jan-04
31-Jan-04
1-Feb-04
1-Feb-04
1-Feb-04
1-Feb-04
1-Feb-04
2-Feb-04
2-Feb-04
2-Feb-04
2-Feb-04
2-Feb-04
3-Feb-04
3-Feb-04
3-Feb-04
3-Feb-04
3-Feb-04
4-Feb-04
4-Feb-04
4-Feb-04
4-Feb-04
4-Feb-04
5-Feb-04
5-Feb-04
5-Feb-04
5-Feb-04
5-Feb-04
Sulphate mg/L
0.00
0.20
0.40
0.60
0.80
1.00
1.20
1.40
River level m
sulphate
level
Figure 66: Sulphate and river level during a flood event at Little Swanport River downstream Eastern Marshes Rivulet (LSWA05b),
January 2004.
131
4.2.6 Middle Catchment Transport Loads
Background
Estimates of transport loads in rivers can only be undertaken where streamflow data and water
quality data are readily available. In the middle region of the Little Swanport catchment,
monitoring of river level and flood sampling was carried out at station LWSA05 on the Little
Swanport River downstream Eastern Marshes. River level data from this station was used along
with the SKM hydrologic model to generate daily streamflow for the period 1st February 2004 to
28th February 2006.
In this study catchment transport load estimates have been made using water quality data from two
primary sources. Samples from which physical and chemical data were recorded were collected
during monthly visits to the site. Additional samples were also taken during some floods using
automated sampling equipment (as discussed in the previous section). In addition to these data,
continuous monitoring of conductivity and turbidity was carried out using permanently situated
sensors, which logged these parameters every 15 minutes.
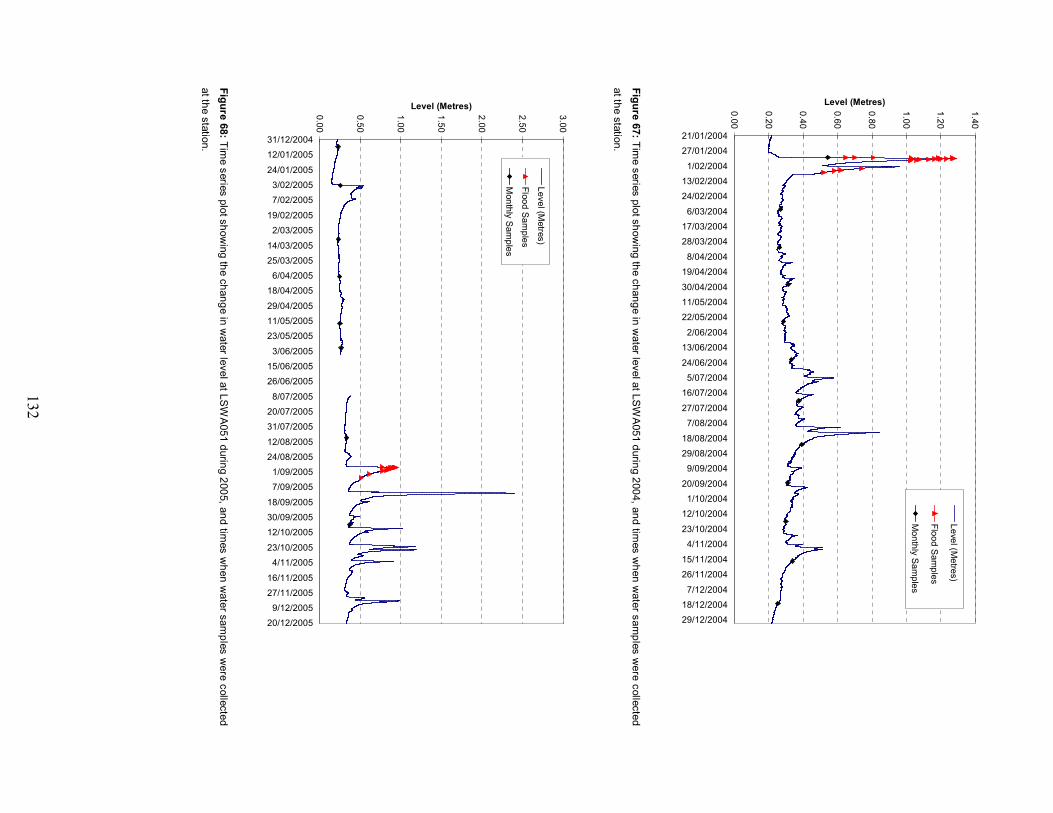
During the course of the study, 166 samples for turbidity and conductivity were collected, and up to
61 samples were collected from which data on dissolved and suspended solids, phosphorus and
nitrogen were derived. The plots below (Figures 67 to 69) show the times during which sampling
occurred during 2004 and 2005, and gives some indication of the spread of flows over which
samples were taken. Table 16 provides the descriptive statistics for these data.
132
0.00
0.20
0.40
0.60
0.80
1.00
1.20
1.40
21/01/2004
27/01/2004
1/02/2004
13/02/2004
24/02/2004
6/03/2004
17/03/2004
28/03/2004
8/04/2004
19/04/2004
30/04/2004
11/05/2004
22/05/2004
2/06/2004
13/06/2004
24/06/2004
5/07/2004
16/07/2004
27/07/2004
7/08/2004
18/08/2004
29/08/2004
9/09/2004
20/09/2004
1/10/2004
12/10/2004
23/10/2004
4/11/2004
15/11/2004
26/11/2004
7/12/2004
18/12/2004
29/12/2004
Level (Metres)Level (Metres)
Flood Samples
Monthly Samples
Figure 67: Time series plot showing the change in water level at LSWA051 during 2004, and tim
es when water samples were collected
at the station.
0.00
0.50
1.00
1.50
2.00
2.50
3.00
31/12/2004
12/01/2005
24/01/2005
3/02/2005
7/02/2005
19/02/2005
2/03/2005
14/03/2005
25/03/2005
6/04/2005
18/04/2005
29/04/2005
11/05/2005
23/05/2005
3/06/2005
15/06/2005
26/06/2005
8/07/2005
20/07/2005
31/07/2005
12/08/2005
24/08/2005
1/09/2005
7/09/2005
18/09/2005
30/09/2005
12/10/2005
23/10/2005
4/11/2005
16/11/2005
27/11/2005
9/12/2005
20/12/2005
Level (Metres)
Level (Metres)
Flood Samples
Monthly Samples
Figure 68: Time series plot showing the change in water level at LSWA051 during 2005, and tim
es when water samples were collected
at the station.

133
Table 16: Descriptive statistics of WQ data for Little Swanport River d/s Eastern Marshes (LWSA05).
Electrical
conductivity
(µµµµS/cm)
Turbidity
(NTU)
Total suspended
solids (mg/L)
Total dissolved
solids (mg/L)
TN
(mg/L)
TP
(mg/L)
N= 166 166 34 34 61 61
Mean 510 14.7 10.5 298 1.163 0.031
Median 454 15.7 9.5 259 1.145 0.034
Minimum 126.4 0.63 < 1 144 0.489 < 0.005
Maximum 1270 32.9 32 695 2.73 0.071
Load estimation
The method for making transport load estimates was the same as that used for other rivers in
Tasmania assessed under the ‘State of Rivers’ program (eg. DPIWE 1999; DPIWE 2003a &
2003b). As stated above, conductivity and turbidity were continuously monitored at LWSA05 using
permanently situated sensors and logging equipment. Where gaps in either of these water quality
records occurred as a result of probe or power failure, data for the period was modelled based on
known relationships between changes in flow and changes each of the parameters. Where data from
spot samples was available, these were used to verify or correct the real and modelled data.
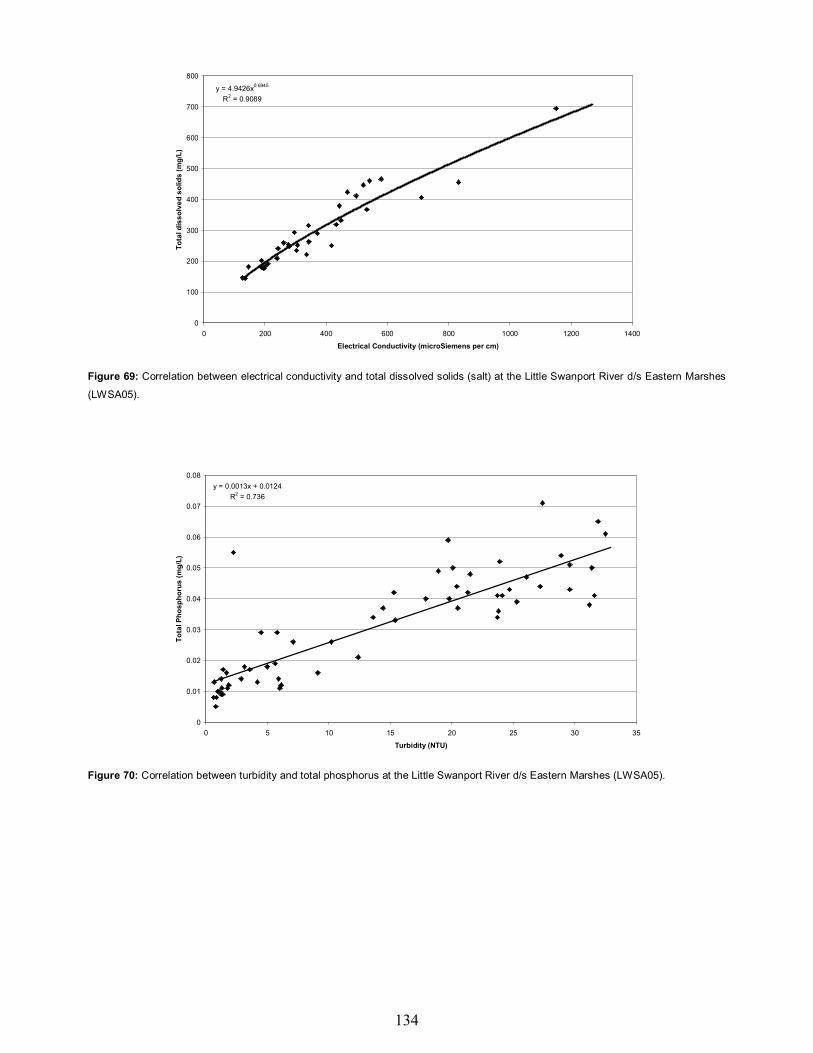
Estimates of transport loads have been made for nitrogen, phosphorus and total salt. Although the
data for suspended solids was examined, because of the very poor correlation, no transport load
estimates were made. The method for estimating loads is based on the development of relationships
of each of these parameters to turbidity or conductivity at the time of sampling using regression
analysis. Figures 69 & 70 show the relationships that have been determined for conductivity versus
dissolved solids and turbidity versus total phosphorus at LWSA05, and the degree of correlation
that exists in each case (expressed in the form of the R2 value). The equations that describe the
regression for each parameter, and their corresponding R2 values, are shown in Table 17.
134
y = 4.9426x0.6945
R2 = 0.9089
0
100
200
300
400
500
600
700
800
0 200 400 600 800 1000 1200 1400
Electrical Conductivity (microSiemens per cm)
Total dissolved solids (mg/L)
Figure 69: Correlation between electrical conductivity and total dissolved solids (salt) at the Little Swanport River d/s Eastern Marshes
(LWSA05).
y = 0.0013x + 0.0124
R2 = 0.736
0
0.01
0.02
0.03
0.04
0.05
0.06
0.07
0.08
0 5 10 15 20 25 30 35
Turbidity (NTU)
Total Phosphorus (mg/L)
Figure 70: Correlation between turbidity and total phosphorus at the Little Swanport River d/s Eastern Marshes (LWSA05).

135
Table 17: Mathematical expression of the relationships between the various water quality parameters (and their corresponding
correlation values) at LWSA05 on the Little Swanport River d/s Eastern Marshes.
Relationship R-squared No. samples
[Total dissolved solids] = 4.9426*EC0.6945
0.9089 34
[TSS] = 0.4946*Turbidity 0.2777 35
Log[Total Nitrogen] = 0.0137*Turbidity -
0.1649
0.6096 61
[Total Phosphorus] = 0.0013*Turbidity + 0.0124 0.736 61
Having established these relationships, continuously recorded turbidity was then transformed into
continuous series of phosphorus or nitrogen concentrations. In a similar manner, the continuous
record for conductivity was also transformed into a continuous record of salt concentration.
To provide an estimate of the instantaneous load for each parameter, the transformed time series
data were then simply multiplied by the coincident discharge volume for that time period. To
simplify the calculations the data was aggregated into daily time periods, thus providing a daily
load estimate.
Transport Load Estimates
The monthly transport load estimates for LSWA05 are shown in Table 18 below. From this table it
can been seen that variation in loads generally follow changes in discharge, and this is seen when
examining individual storm events. The largest rainfall event to occur during the study took place
on 12 September 2005, and resulted in an estimated discharge at LSWA05 of about 8,611
megalitres. The estimated transport loads for this event were;
Total phosphorus = 531 kg
Total nitrogen = 19,473 kg
Total dissolved solids (salt) = 1,525 tonnes
This event contributed about 50% of the total discharge for the month, and carried about 68% of the
TP and TN load, and 37% of the salt load for the month. It is interesting to note that while
LSWA05 drains the upper 65% of the Little Swanport catchment, the estimated load of nitrogen
carried by the river at this site during this event exceeded what was estimated to have been
transported by the river near to the catchment outlet at LSWA01.

136
From Table 18 it is also particularly interesting to note that during the first year, the annual load of
salt (as indicated by the TDS load) at LSWA05 was estimated to be about 20,000 tonnes, compared
an estimated load at LSWA01 of only 24,000 tonnes.
Table 18: Estimated monthly discharge (ML/day) and nutrients load for the Little Swanport River d/s
Eastern Marshes (LSWA05) between February 2004 and February 2006.
MONTH Discharge
(ML)
TP Load
(kg)
TN Load
(kg)
TDS Load
(tonnes)
Feb-04 3,205 91 3,275 961
Mar-04 687 10 497 386
Apr-04 2,684 42 1,983 1,732
May-04 1,976 30 1,449 1,221
Jun-04 7,468 125 5,678 3,969
Jul-04 7,700 181 6,943 3,652
Aug-04 4,987 125 4,704 2,505
Sep-04 2,344 39 1,779 1,357
Oct-04 2,232 34 1,639 1,403
Nov-04 3,571 78 3,109 1,835
Dec-04 893 14 663 487
Jan-05 1,208 19 900 715
Feb-05 7,229 166 6,422 3,093
Mar-05 751 11 545 357
Apr-05 1,651 23 1,177 807
May-05 819 11 578 496
Jun-05 7,022 115 5,292 2,812
Jul-05 3,157 56 2,453 1,298
Aug-05 4,661 105 4,152 2,490
Sep-05 17,240 794 28,699 4,165
Oct-05 9,464 254 9,239 3,080
Nov-05 2,604 50 2,119 1,008
Dec-05 3,537 85 3,246 1,077
Jan-06 1,175 17 842 561
Feb-06 1,767 24 1,243 918
The load data from Table 18 can be used to derive export coefficients (also known as ‘catchment
export coefficients’) for the top section of the Little Swanport catchment, allowing a more valid

137
comparison to be made between the upper and lower catchment, irrespective of the difference in
their size. Raw load data can be converted to export coefficients by simply dividing the annual
transport load estimated to pass a point on the river, by the volume of rainfall that has occurred per
kilometre of catchment area. The unit for the export coefficient is therefore kg/mm/km2 and is
equivalent to total load per megalitre of discharge. This is usually calculated using annual data.
For the Little Swanport River d/s Eastern Marshes (LSWA05) the annual export coefficients shown
in Table 19a have been calculated based on 12-month periods from February 2004. When these
coefficients are compared to those that have been derived for LSWA01 near the catchment outlet
(Table 19b), it is clear that the upper catchment is generating greater loads of nutrients per square
kilometre, particularly in terms of nitrogen. This is likely to reflect the higher level of agricultural
activity that occurs in the upper catchment.
Table 19a: Export coefficients for the Little Swanport River d/s Eastern Marshes (LSWA05) derived from
data collected between February 2004 and February 2006.
MONTH Catchment
area (km2)
Discharge
(ML)
Total P
(kg/mm/km2)
Total N
(kg/mm/km2)
Feb 2004 to Jan 2005 380 38,955 0.020 0.837
Feb 2005 to Jan 2006 380 59,310 0.028 1.092
Table 19b: Export coefficients for the Little Swanport River 3 km u/s Tasman Highway (LSWA01) derived
from data collected between February 2004 and February 2006.
MONTH Catchment
area (km2)
Discharge
(ML)
Total P
(kg/mm/km2)
Total N
(kg/mm/km2)
Feb 2004 to Jan 2005 600 61,202 0.017 0.668
Feb 2005 to Jan 2006 600 93,182 0.023 0.769
138
4.2.7 Summary
The two principal factors influencing water quality in the upper catchment, land use, specifically
the extensive clearing for grazing, and the ephemeral flow regime, continue to be major influences
on water quality throughout the middle catchment. However changes in geology, and consequently
relief, and geomorphology have resulted in an increasing proportion of native riparian and
surrounding vegetation, resulting in improved water quality in much of the middle catchment.
Within the Little Swanport River there is also a significant improvement in water quality resulting
from increased baseflow, although there is also an appreciable impact from Nutting Garden
Rivulet, where water quality is generally poor.
Significant reaches of the Little Swanport River and its tributaries have steeper valley sides that are
unsuitable for clearing and grazing. Consequently the riparian vegetation in these reaches in often
in good condition and land use impacts are moderated. The effect of these changes are evident in
Eastern Marshes Rivulet, where there is an improvement in overall water quality between the lower
most upper catchment site and the lower catchment site above its confluence with the Little
Swanport River.
There is an increase in baseflow through the Little Swanport River in the middle catchment. As a
result, water quality at individual sites is less strongly influenced by local site-specific impacts, as
there is greater connectivity between sites. This increased flow reduces the extreme variations in
dissolved oxygen seen at various sites in the upper catchment and also reduces the potential for the
high nutrient concentrations recorded at low flow in the upper catchment. Conductivity, although
still high, is considerably lower in the middle catchment sites on the Little Swanport River. This
change is not only a result of increased flow but also the increased proportion of native vegetation
cover as baseflow continues to reflect groundwater influences.
Although Nutting Garden Rivulet added a significant volume to the flow in the Little Swanport
River, the poor water quality of this tributary had a noticeable impact on water quality within the
Little Swanport River. Nutting Garden Rivulet contributes a significant nutrient and sediment load
to the Little Swanport River.