pub catchment report - ex20 3jn · 2019-10-23 · pub catchment report - ex20 3jn 20 minute wt...
TRANSCRIPT
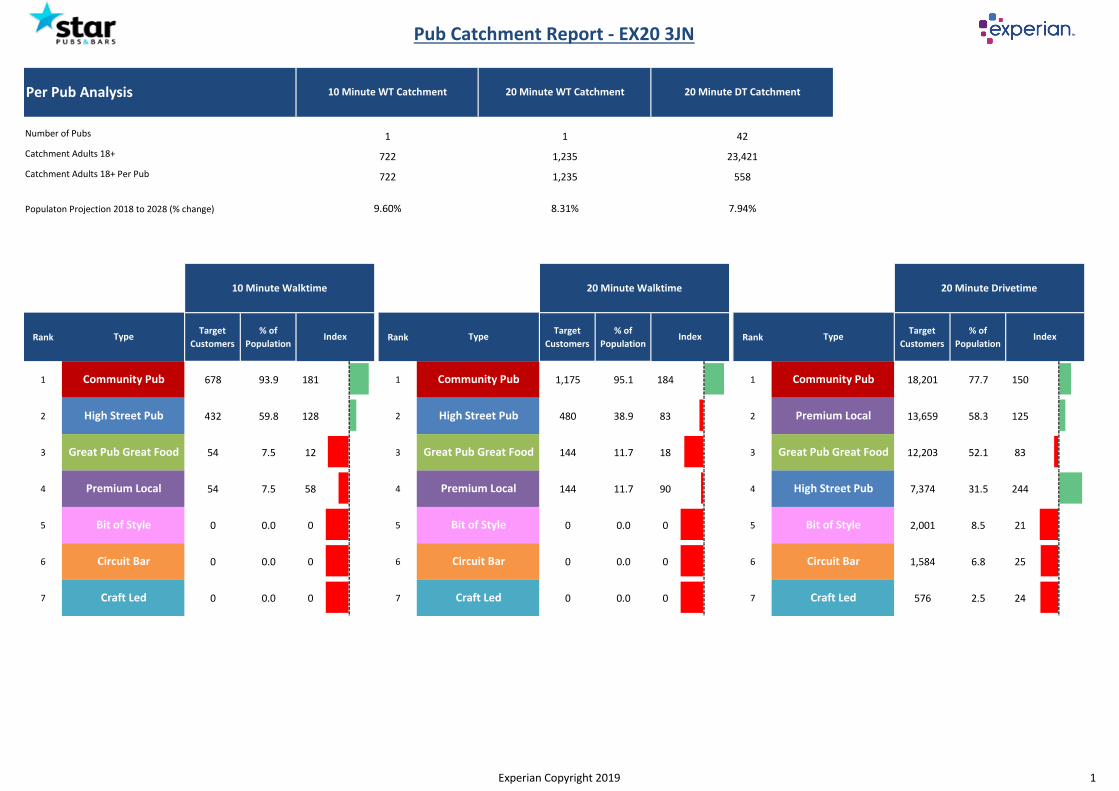
Number of Pubs
Catchment Adults 18+
Catchment Adults 18+ Per Pub
Populaton Projection 2018 to 2028 (% change)
RankTarget
Customers
% of
PopulationRank
Target
Customers
% of
PopulationRank
Target
Customers
% of
Population
1 678 93.9 181 1 1,175 95.1 184 1 18,201 77.7 150
2 432 59.8 128 2 480 38.9 83 2 13,659 58.3 125
3 54 7.5 12 3 144 11.7 18 3 12,203 52.1 83
4 54 7.5 58 4 144 11.7 90 4 7,374 31.5 244
5 0 0.0 0 5 0 0.0 0 5 2,001 8.5 21
6 0 0.0 0 6 0 0.0 0 6 1,584 6.8 25
7 0 0.0 0 7 0 0.0 0 7 576 2.5 24
1,235
8.31%
10 Minute Walktime
Type Index
Community Pub
Circuit Bar
Craft Led
Premium Local
Bit of Style
High Street Pub
Great Pub Great Food
722
722
9.60%
1,235 23,421
558
7.94%
Pub Catchment Report - EX20 3JN
20 Minute WT Catchment
1
Per Pub Analysis 10 Minute WT Catchment
1
20 Minute DT Catchment
42
Circuit Bar
Craft Led
20 Minute Drivetime
Premium Local
Type Index
Community Pub
20 Minute Walktime
Type Index
Community Pub
High Street Pub
High Street Pub
Great Pub Great Food
Premium Local
Great Pub Great Food
Bit of StyleBit of Style
Circuit Bar
Craft Led
Experian Copyright 2019 1

Target
Customers
% of
Population
Target
Customers
% of
Population
Target
Customers
% of
Population
AB 47 6.5 74 79 6.4 72 1,406 6.0 68
C1 75 10.4 85 116 9.4 77 2,055 8.8 72
C2 93 12.9 156 165 13.4 162 2,592 11.1 134
DE 69 9.6 93 135 10.9 106 2,072 8.8 86
Target
Customers
% of
Population
Target
Customers
% of
Population
Target
Customers
% of
Population
Low (0-6) 263 36.4 110 477 38.6 116 5,629 24.0 72
Medium (7-13) 311 43.1 130 487 39.4 119 8,709 37.2 112
High (14-19) 105 14.5 51 160 13.0 46 5,723 24.4 86
10 Minute WT Catchment 20 Minute WT Catchment 20 Minute DT Catchment
Affluence (Bands) Index Index Index
Pub Catchment Report - EX20 3JN
10 Minute WT Catchment 20 Minute WT Catchment 20 Minute DT Catchment
Social Grade Index Index Index
Experian Copyright 2019 2
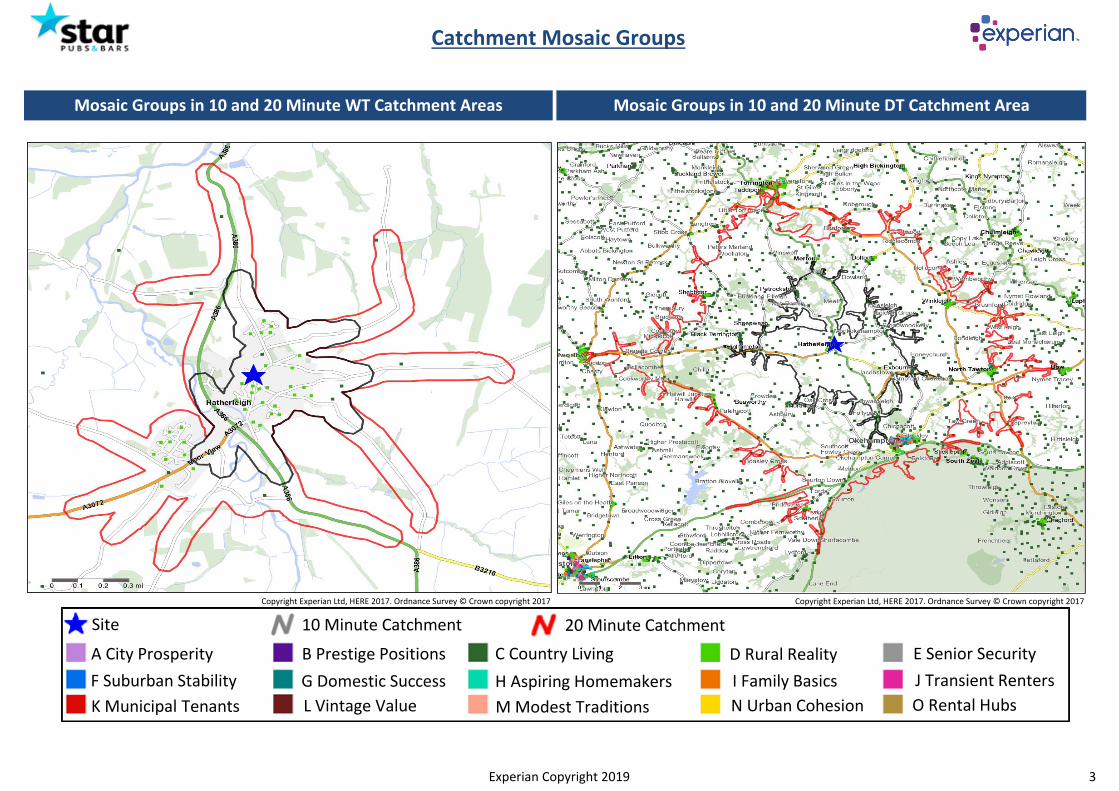
Copyright Experian Ltd, HERE 2017. Ordnance Survey © Crown copyright 2017 Copyright Experian Ltd, HERE 2017. Ordnance Survey © Crown copyright 2017
Catchment Mosaic Groups
Mosaic Groups in 10 and 20 Minute WT Catchment Areas Mosaic Groups in 10 and 20 Minute DT Catchment Area
A City Prosperity B Prestige Positions C Country Living D Rural Reality E Senior Security
F Suburban Stability G Domestic Success H Aspiring Homemakers I Family Basics J Transient Renters
K Municipal Tenants L Vintage Value M Modest Traditions N Urban Cohesion O Rental Hubs
Site 10 Minute Catchment 20 Minute Catchment
Experian Copyright 2019 3

10 Minute
WT
20 Minute
WT
10 Minute
DT
20 Minute
DT
10 Minute
WT
20 Minute
WT
10 Minute
DT
20 Minute
DT
Mosaic Type ProfileCatchment
Adults 18+
Catchment
Adults 18+
Catchment
Adults 18+
Catchment
Adults 18+Mosaic Type Profile
Catchment
Adults 18+
Catchment
Adults 18+
Catchment
Adults 18+
Catchment
Adults 18+
A01 World-Class Wealth 0 0 0 0 I36 Solid Economy 0 0 0 138
A02 Uptown Elite 0 0 0 0 I37 Budget Generations 0 0 0 223
A03 Penthouse Chic 0 0 0 0 I38 Economical Families 0 0 0 69
A04 Metro High-Flyers 0 0 0 0 I39 Families on a Budget 0 0 0 0
B05 Premium Fortunes 0 0 0 0 J40 Value Rentals 0 0 0 85
B06 Diamond Days 0 0 0 14 J41 Youthful Endeavours 0 0 0 0
B07 Alpha Families 0 0 0 0 J42 Midlife Renters 0 0 0 555
B08 Bank of Mum and Dad 0 0 0 39 J43 Renting Rooms 0 0 0 20
B09 Empty-Nest Adventure 0 0 0 17 K44 Inner City Stalwarts 0 0 0 0
C10 Wealthy Landowners 0 2 31 144 K45 City Diversity 0 0 0 0
C11 Rural Vogue 8 21 199 823 K46 High Rise Residents 0 0 0 0
C12 Scattered Homesteads 10 84 2,052 8,216 K47 Single Essentials 0 0 0 0
C13 Village Retirement 17 17 87 1,121 K48 Mature Workers 0 0 0 0
D14 Satellite Settlers 20 20 22 739 L49 Flatlet Seniors 0 0 0 0
D15 Local Focus 236 611 671 3,131 L50 Pocket Pensions 0 0 0 231
D16 Outlying Seniors 432 480 576 3,046 L51 Retirement Communities 0 0 0 153
D17 Far-Flung Outposts 0 0 3 7 L52 Estate Veterans 0 0 0 73
E18 Legacy Elders 0 0 0 21 L53 Seasoned Survivors 0 0 0 54
E19 Bungalow Heaven 0 0 3 701 M54 Down-to-Earth Owners 0 0 0 272
E20 Classic Grandparents 0 0 0 57 M55 Back with the Folks 0 0 0 322
E21 Solo Retirees 0 0 0 158 M56 Self Supporters 0 0 0 192
F22 Boomerang Boarders 0 0 0 66 N57 Community Elders 0 0 0 0
F23 Family Ties 0 0 0 0 N58 Culture & Comfort 0 0 0 0
F24 Fledgling Free 0 0 0 152 N59 Large Family Living 0 0 0 0
F25 Dependable Me 0 0 0 90 N60 Ageing Access 0 0 0 0
G26 Cafés and Catchments 0 0 0 0 O61 Career Builders 0 0 0 0
G27 Thriving Independence 0 0 0 0 O62 Central Pulse 0 0 0 0
G28 Modern Parents 0 0 0 146 O63 Flexible Workforce 0 0 0 0
G29 Mid-Career Convention 0 0 0 303 O64 Bus-Route Renters 0 0 0 230
H30 Primary Ambitions 0 0 0 113 O65 Learners & Earners 0 0 0 0
H31 Affordable Fringe 0 0 0 281 O66 Student Scene 0 0 0 0
H32 First-Rung Futures 0 0 0 324 U99 Unclassified 0 0 0 64
H33 Contemporary Starts 0 0 12 702 Total 723 1,235 3,656 23,420
H34 New Foundations 0 0 0 76
H35 Flying Solo 0 0 0 252
Adults 18+ by Mosaic Type in Each Catchment
Experian Copyright 2019 4

● Rural families
● Rent or own affordable homes
● Skilled trades
● Long distance from towns and cities
● Shop locally
● Online gaming
● Married couples aged 50+
● Most isolated housing
● Often oil central heating
● Reuse and recycle
● Highest levels of working at home
● Often oil central heating
● Low income
● Shop locally
● Lower use of Internet
● Shop locally
Older households appreciating rural calm in stand-alone houses within agricultural landscapes
● Married couples aged 50+
● Most isolated housing
● Highest levels of working at home
Pensioners living in inexpensive housing in out of the way locations
● Aged 60+
● Low cost housing
● Out of the way locations
● Low income
● Reuse and recycle
Top 3 Mosaic Types in a 20 Minute Drivetime
1. C12 Scattered Homesteads
● Dislike being contacted by marketers ● Online gaming
● Lower use of Internet
● Aged 60+
● Low cost housing
Rural families in affordable village homes who are reliant on the local economy for jobs
Pensioners living in inexpensive housing in out of the way locations
Full visualisation of all types and groups are available in Segmentation Portal: www.segmentationportal.com. If you do not have log in details for Segmentation Portal then please contact the Experian Helpdesk:
[email protected] | 0115 968 5099
● Dislike being contacted by marketers
● Out of the way locations
Rural families in affordable village homes who are reliant on the local economy for jobs
● Rural families
● Rent or own affordable homes
● Skilled trades
● Long distance from towns and cities
● Shop locally
2. D15 Local Focus
20 Minute Walktime and Drivetime Mosaic Type Visualisation
3. C12 Scattered Homesteads
2. D16 Outlying Seniors
1. D15 Local FocusOlder households appreciating rural calm in stand-alone houses within agricultural landscapes
Top 3 Mosaic Types in a 20 Minute Walktime
3. D16 Outlying Seniors
Experian Copyright 2019 5
Target
Customers
% of
Population
Target
Customers
% of
Population
Target
Customers
% of
Population
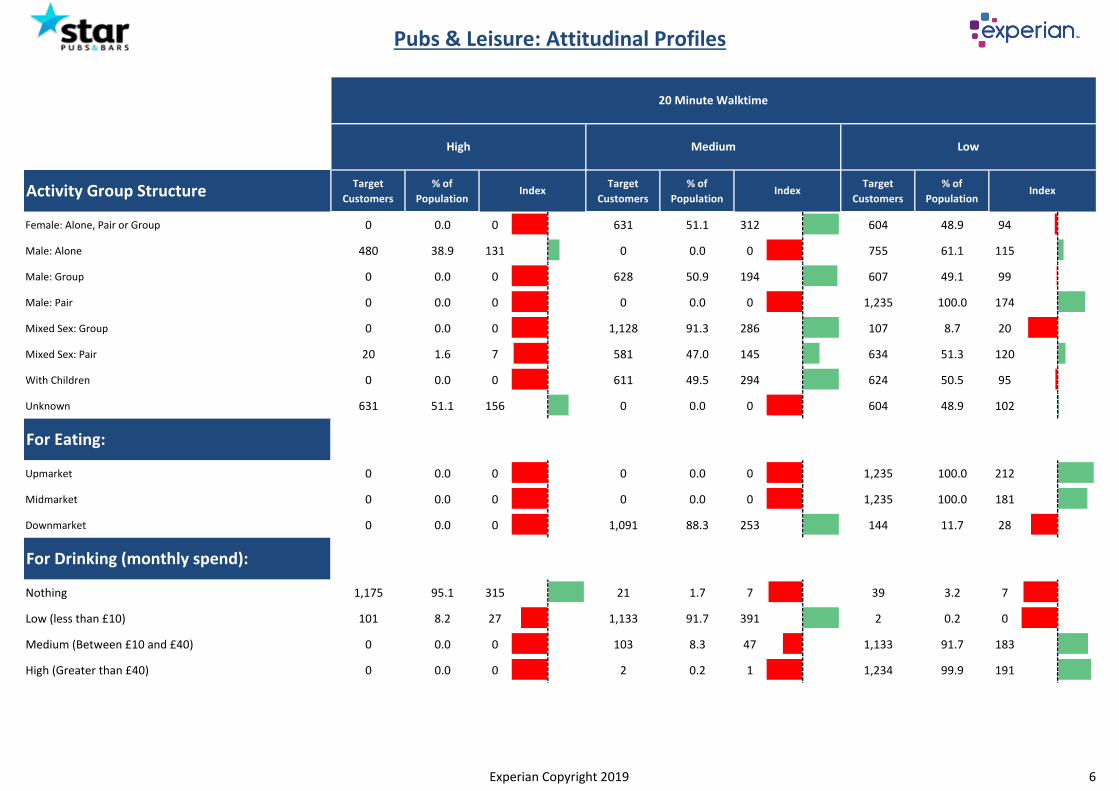
Female: Alone, Pair or Group 0 0.0 0 631 51.1 312 604 48.9 94
Male: Alone 480 38.9 131 0 0.0 0 755 61.1 115
Male: Group 0 0.0 0 628 50.9 194 607 49.1 99
Male: Pair 0 0.0 0 0 0.0 0 1,235 100.0 174
Mixed Sex: Group 0 0.0 0 1,128 91.3 286 107 8.7 20
Mixed Sex: Pair 20 1.6 7 581 47.0 145 634 51.3 120
With Children 0 0.0 0 611 49.5 294 624 50.5 95
Unknown 631 51.1 156 0 0.0 0 604 48.9 102
Upmarket 0 0.0 0 0 0.0 0 1,235 100.0 212
Midmarket 0 0.0 0 0 0.0 0 1,235 100.0 181
Downmarket 0 0.0 0 1,091 88.3 253 144 11.7 28
Nothing 1,175 95.1 315 21 1.7 7 39 3.2 7
Low (less than £10) 101 8.2 27 1,133 91.7 391 2 0.2 0
Medium (Between £10 and £40) 0 0.0 0 103 8.3 47 1,133 91.7 183
High (Greater than £40) 0 0.0 0 2 0.2 1 1,234 99.9 191
For Drinking (monthly spend):
For Eating:
Pubs & Leisure: Attitudinal Profiles
High Medium Low
Activity Group Structure Index Index Index
20 Minute Walktime
Experian Copyright 2019 6

Target
Customers
% of
Population
Target
Customers
% of
Population
Target
Customers
% of
Population
Female: Alone, Pair or Group 2,410 10.3 34 4,533 19.4 118 16,414 70.1 135
Male: Alone 5,489 23.4 79 534 2.3 15 17,334 74.0 139
Male: Group 1,676 7.2 31 6,278 26.8 102 15,403 65.8 133
Male: Pair 1,918 8.2 31 983 4.2 28 20,456 87.3 152
Mixed Sex: Group 1,493 6.4 28 11,052 47.2 148 10,811 46.2 105
Mixed Sex: Pair 2,961 12.6 54 13,803 58.9 181 6,592 28.1 66
With Children 2,807 12.0 41 4,565 19.5 116 15,985 68.3 129
Unknown 5,458 23.3 71 1,970 8.4 47 15,929 68.0 142
Upmarket 2,531 10.8 35 1,089 4.6 22 19,737 84.3 178
Midmarket 1,722 7.4 21 390 1.7 18 21,245 90.7 164
Downmarket 1,875 8.0 36 9,361 40.0 115 12,121 51.8 124
Nothing 15,981 68.2 226 2,733 11.7 49 4,643 19.8 44
Low (less than £10) 10,925 46.6 156 9,947 42.5 181 2,484 10.6 23
Medium (Between £10 and £40) 1,581 6.8 22 10,204 43.6 244 11,572 49.4 98
High (Greater than £40) 926 4.0 15 1,465 6.3 30 20,966 89.5 171
For Drinking (monthly spend):
For Eating:
Pubs & Leisure: Attitudinal Profiles
20 Minute Drivetime
High Medium Low
Activity Group Structure Index Index Index
Experian Copyright 2019 7
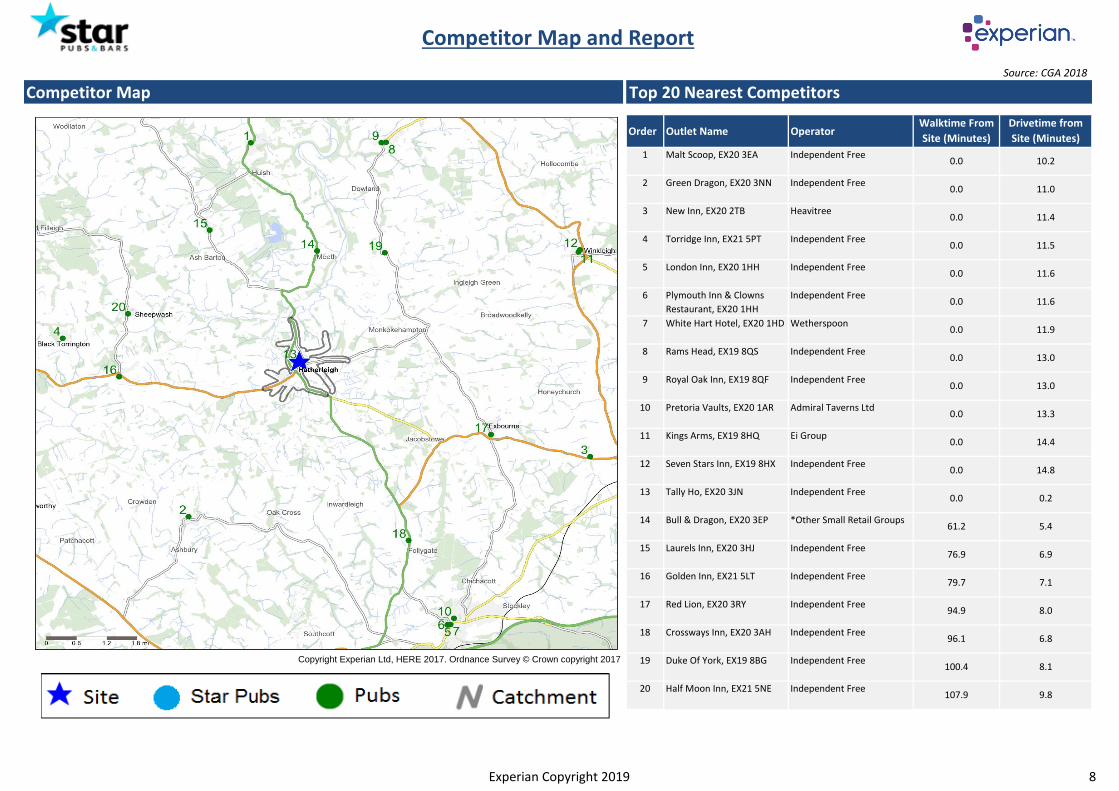
Source: CGA 2018
Competitor Map Top 20 Nearest Competitors
Order Outlet Name Operator
1
2
3
4
5
6
7
8
9
10
11
12
13
14
15
16
17
18
Copyright Experian Ltd, HERE 2017. Ordnance Survey © Crown copyright 2017 19
20
Independent Free
Independent Free
Independent Free
Independent Free
*Other Small Retail Groups
Independent Free
Independent Free
Independent Free
Golden Inn, EX21 5LT
Red Lion, EX20 3RY
Crossways Inn, EX20 3AH
Duke Of York, EX19 8BG
Bull & Dragon, EX20 3EP
Laurels Inn, EX20 3HJ
Half Moon Inn, EX21 5NE
Independent Free
Independent Free
Heavitree
Independent Free
Independent Free
Independent Free
Wetherspoon
Independent Free
Independent Free
Admiral Taverns Ltd
Ei Group
Independent Free
Kings Arms, EX19 8HQ
Seven Stars Inn, EX19 8HX
Tally Ho, EX20 3JN
Plymouth Inn & Clowns
Restaurant, EX20 1HH
White Hart Hotel, EX20 1HD
Rams Head, EX19 8QS
Royal Oak Inn, EX19 8QF
Pretoria Vaults, EX20 1AR
Malt Scoop, EX20 3EA
Green Dragon, EX20 3NN
New Inn, EX20 2TB
Torridge Inn, EX21 5PT
London Inn, EX20 1HH
0.0
0.0
Walktime From
Site (Minutes)
0.0
0.0
0.0
0.0
8.1
Drivetime from
Site (Minutes)
107.9
0.0
61.2
76.9
79.7
94.9
0.0
0.0
0.0
96.1
100.4
0.0
0.0
0.0
5.4
6.9
7.1
8.0
6.8
Competitor Map and Report
9.8
10.2
11.0
11.4
11.5
11.6
11.6
11.9
13.0
13.0
13.3
14.4
14.8
0.2
Experian Copyright 2019 8