3d finite element analysis of particle-reinforced aluminum · these models were used to study the...
TRANSCRIPT

1 --- - --- - ---
This report is a preprint of an article submitted to a journal for publication. Because of changes that may be made before formal publication, this preprint is made available with tbe understanding that it will not be cited or reproduced without the permission of the author. MATERIAlS
SCIENCE &. EIIGIIIEERIIiG
A ELSEVIER Materials Science and Engineering A338 (2002) 271-281
www.elsevier.comllocate/msea
3D finite element analysis of particle-reinforced aluminum
H. Shen, C .l. Lissenden * Department oj Engineering Science and Mechanics, Penn State University, University Park, PA 16802, USA
Received 25 July 2001 ; received in revised form 31 January 2002
Abstract
Deformation in particle-reinforced aluminum has been simulated using three distinct types of fInite element model: a threedimensional repeating unit ceil, a three-dimensional multi-particle model, and two-dimensional multi-particle models. The repeating unit cell model represents a fictitious periodic cubic array of particles. The 3D multi-particle (3D-MP) model represents randomiy placed and oriented particles . The 2D generalized plane strain multi-particle models were obtained from planar sections through the 3D-MP model. These models were used to study the tensile macroscopic stress- strain response and the associated stress and strain distributions in an elastoplastic matrix. The results indicate that the 2D model having a particle area fraction equal to the particle represnetative volume fraction of the 3D models predicted the same macroscopic stress-strain response as the 3D models. However, there are fluctuations in the particle area fraction in a representative volume element. As expected, predictions froin 2D models having different particle area fractions do not agree with predictions from 3D models . More importantly, it was found that the microscopic stress and strain distributions from the 2D models do not agree with those from the 3D-MP'mode!. SpecificalJy, the plastic strain distribution predicted by the 2D model is banded along lines inclined at 45° from the loading axis while the 3D model prediction is not. Additionally, the triaxial stress and maximum principal stress distributions predicted by 2D and 3D models do not agree. Thus, it appears necessary to use a multi-particle 3D model to accurately predict material responses that depend on local effects, such as strain-to-failure, fracture toughness, and fatigue life. © 2002 Elsevier Science B.V. All rights reserved.
Keywords: Discontinuously reinforced aluminum; Finite element analysis; Mechanical response; Plastic strain clistribution; Triaxial stress; Principal stress
1. Introduction
Discontinuously reinforced aluminum (DRA) has been the subject of research and development for many years and is currently in service in select structural applications in the automotive, aerospace, and sporting goods indust..ries such as: drive shafts, engine blocks, brake systems, aircraft access doors and ventral fins, and bicycle frames . These are primarily stiffness or wear critical applications. Ceramic particles are the most widely used form of discontinuous reinforcement, in part due to their availability from the abrasives industry. DRA is not typically chosen for use in toughness critical applications because of its relatively poor fracture toughness and strain-to-failure. This is the subject of current research; how to engineer DRA with improved
* Co.rresponding author. E-mail address: [email protected] (C.J. Lissenden).
fracture toughness_and strain-to-failure without sacrificing strength. Since these material characteristics are determined by local events such as intense local slip bands in the matrix and particle cracking or particle deb on ding, it is necessary to be able to predict these types of local events with a model. Analytical models, such as the ones presented in [1 - 5], are capable of predicting the material response under greatly idealized conditions or rely on Simplifying assumptions. Thus, numerical models are needed to realistically represent particle reinforcement systems that are typically heterogeneous. It is actually quite difficult to obtain a detailed description of most particle reinforcement systems because the particles can have different shapes, any orientation, a range of sizes, and ditJerent properties, as well as be distributed in a not entirely random fashion in that particle clustering is common. Clusters cause localized deformation to occur [6].
The range of numerical models that has been adopted to represent DRA and other particle-reinforced metal
0921-5093/02/$ - see front matter © 2002 Elsevier Science B.Y. All rights reserved. Pll:S092 1- 5093(02)0009 4 -1
https://ntrs.nasa.gov/search.jsp?R=20030032265 2018-06-15T10:28:55+00:00Z

H Shen, c.J. Lissenden I Maceriais Science and Engineering A338 (2002) 271-281 273
1 Strain - Deformation, Bij = '2 (F IJ kj - b ij) (2)
(3)
Plastic regime, d8~ = d}-sij (4)
where repeated indices imply summation, b ij is the Kronecker delta, E is Young's modulus, v is Poisson's ratio, IJ'ij is the Cauchy stress tensor, sij is the deviatoric
h · . E P part of the stress tensor, t e stram tensor IS 8ij = 8ij + B ij'
and the deformation gradient is Fij = F~Ffj.Evolution due to isotropic hardening is defmed by
3 d8P d A = -_c
2 (Jo
where
IJ'c ~= J~ sijsij
and
. dB~ = 2 ·' 3~, dB~dB~
(5)
(6)
(7)
where IJ'c and d8~denote equivalent stress and equivalent plastic strain increment, respectively. Yielding is predicted by the von Mises yield criterion, (Je = IJ' y(8~), where the yield strength depends on equivalent plastic strain.
The overall stress and strain are calculated by using volume averages,
(8)
N
(j .. = ~ f IJ' .. d V = ~ 2:= IJ'~rn) Vern) . Ij V Ij V m =1
V
(9)
where V is volume, superscript m denotes the element number, and N is the total number of elements in the model. The boundary conditions for the 3D models are shown in Table 1.
Table I Boundary conditions
Model face
Right Left Top Bottom Front Back
Boundary conditions
UI = constant 3D-UC, Ul = 0, 3D-MP, Ul = constant U2 = 0.02a U2= 0
U3 = constan t 3D-UC, U3 = 0, 3D-MP, U3 = constant
3D-UC, G= 7.70 Iffil; 3D-MP, a= 50.0 >UTI.
Table 2 Constituent properties
SiC 6061-T6
3.10 2.67
E (GPa)
450 68.9
v
0.17 0.33
We model silicon carbide (SiC) particles in the aluminum alloy 6061-T6. The elastic properties for the isotropic constituents are given in Table 2. Rateindependent plasticity is applied to the 6061-T6 aluminum. The yield strength of 6061-T6 is 276 MPa and the tangent modulus is constant, 200 MPa, thereafter (linear hardening). All simulations are at room temperature. Particles and matrix are well bonded and particle cracking is not considered. PartiCles take the form of 24-faced solids as shown in Fig. 2.
2.1. 3D unit cell finite element model
The 3D unit cell (3D-UC) model shown in Fig. 3, which contains a single particle at the center and has a 17.5% volume fraction, was created to compare with the results of the 3D-MP model that is discussed in the next section. The siZe of the cubic unit cell, a = 7.70 flm, is dictated by the symmetry conditions, the particle size, and the volume fraction. Periodicity in each of the three coordinate directions is assumed in the 3D-UC model. Thus, it is only necessary to analyze' a single repeating unit cell. Additionally, symmetry conditions are employed such that only one eighth of the unit cell needs to be analyzed. The model "fas constructed and meshed with ten-node tetrahedral elements. ~
2.2. 3D multi-particle finite element model
Recognizing that DRA has complex particle distributions rather than periodic ones, we now describe a 3DMP finite element model that is intended to be more realistic than the 3D-UC model. The size of the cubic
I 'I~ ~==;:::;:::;~ 1< 8 urn >1
< 10~rn )
Fig. 2. Idealized particle shape (24 faces) and size.

H Shen, c.J. Lissenden I Materials Science and Engineering A338 (2002) 271-281 275
2.3. 2D finite element models
2D finite element models are often used since the size of 3D models (having multiple particles) is large, which causes long run times, if the correct solution can be found at all. 2D models have been constructed for the minimum area fraction (9% at z = -13 ~m), called 2D-09; the area fraction matching the volume fraction (17.5% at z = 15 ~m), called 2D-18; and the maximum area fraction (26% at z = -21 ~m), called 2D-26. The microstructures of these three sections are shown in Fig. 6. These sections were meshed with six node quadratic triangular elements. The boundary conditions are the same as those applied to the left, right, top, and bottom faces of the 3D-MP model (Table 1) . Plane stress, generalized plane strain, and plane strain analyses
o ·
o o
. ~
. l..J
o Q
F ig. 6. Geometry of 2D sections; (a) z = - 13 ~m-model 2D-09, (b) z = 15 fUll-model 2D-18, (c) z = - 21 fUll - model 2D-26.
were conducted, but only generalized plane strain results are presented herein because these were found to be III the best agreement with the 3D results [29] .
2.4. Software and hardware
The geometry and mesh for the 3D-MP and 3D-UC models were created using the SDRC J-DEAS software [30]. The 3D-MP model was cut three times along planes parallel to the z-axis. Each section was discretized using SDRC I-DEAS. All the models are solved using the general purpose ABAQUS finite element code [31). SDRC I-DEAS
was used for all post-processing. All analyses were run on an IBM SP, which is a network of RISC 6000 processor nodes. Both single and mUlti CPU nodes are used with memory ranging from 128 to 4000 MB, clock speeds from 67 to 332 MHz, and performance ratings from 250 to 660 MFlops.
3. Results
3.1. Macroscopic response
The macroscopic true stress-true strain responses predicted by the 3D-MP and 3D-UC.models are shown . in Fig. 7. Also shown in the figure ' are the constituent stress-strain responses for the SiC particles and the 606l-T6 aluminum matrix. The 3D-MP predicted Young's modulus of 93 .6 GPa lies between the Hashin- Shtrikman bounds [32} of 90 and 112 GPa. The 3D-MP model predicted the 0.2% offset yield strength of approximately 314 MPa. For comparison, McDanels [33] reported Young's modulus and a range of 0.2% yield strengths of 87 GPa and 280-310 MPa, respectively, for a 15% particle volume fraction and 105
m 0..
~ VI VI
~ ii5 .
400
'iij 200 CD > o
o 0.0
- - --- --- - -- - ----- -
1.0 Overall Strain ('Yo)
Particles
3D-MP
3D-UC
Matrix
2. 0
Fig. 7. Overall stress-strain response- 3D model predictions.
__ J
H Shen, C. l . Lissenden / Materials Science and Engineering A338 (2002) 271-281 277
Table 3 Convergence study results
Model Number of elements Number of nodes
3D-VC l 1046 2035 3D-VC2 2391 4278 3D-UC3 4597 7832 3D-VC4 11 752 19056 3D-MPI 5170 10796 3D-MP2 19797 35775 3D-MP3 44997 65495 3D-MP4 63121 92975
~ Loading Direction
1.DEiilj UHl
, .OHl:
U[-1]
. ....",. ::- ::::1 , : 6.'DE-il
5".U[-1]
: ' DE"~ $,~f
UE-il
1.'nr.vo
Ut-lll "
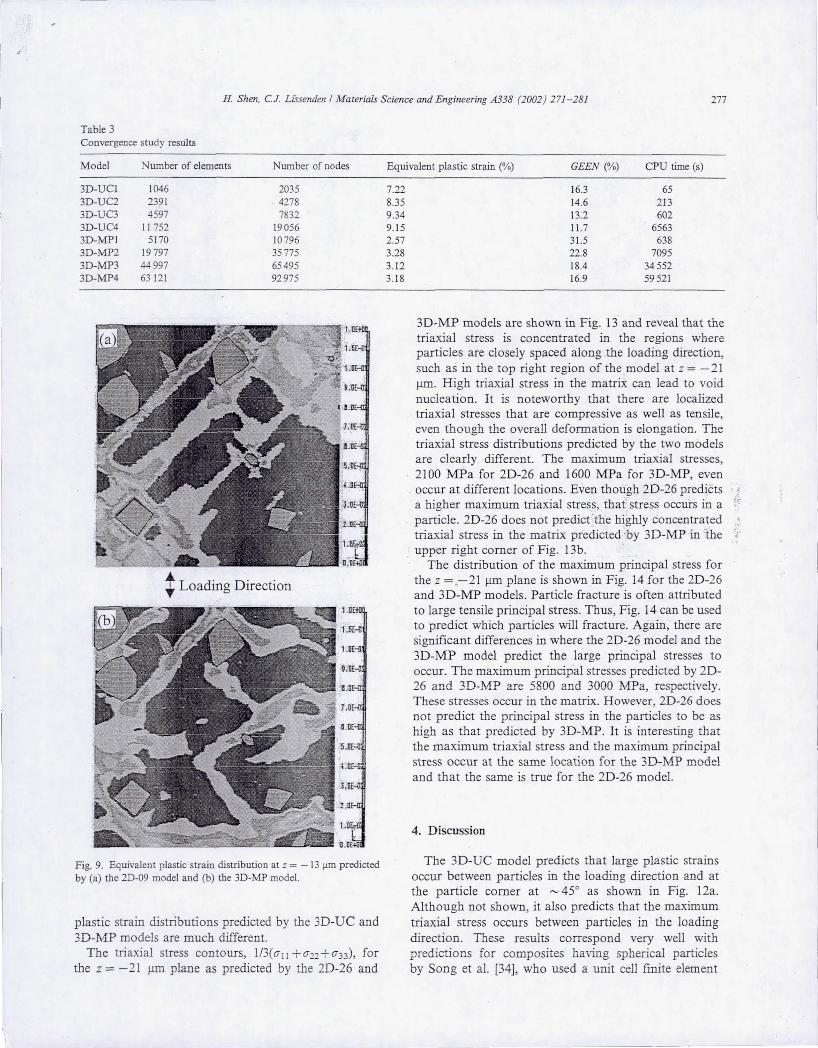
Fig. 9. Equivalent plastic strain distribution at z = -1 3 !illl predicted by (a) tbe 2D-09 model and (b) the 3D-MP model.
plastic strain distributions predicted by the 3D-UC and 3D-MP models are much different.
The triaxial stress contours, l/3(0'1l +0'22 + 0'33), for the z = -21 JlIll plane as predicted by the 2D-26 and
Equivalent plastic strain (%) GEEN (%) CPV time (s)
7.22 8.35 9.34 9.15 2.57 3.28 3.12 3.18
16.3 65 14.6 213 13.2 602 11.7 6563 31.5 638 22.8 7095 18.4 34552 16.9 59521
3D-MP models are shown in Fig. 13 and reveal that the triaxial stress is concentrated in the regions where particles are closely spaced along the loading direction, such as in the top right region of the model at z = -21 11m. High triaxial stress in the matrix can lead to void nucleation. It is noteworthy that there are localized triaxial stresses that are compressive as well as tensile, even though the overall deformation is elongation. The triaxial stress distributions predicted by the two models are clearly different. The maximum triaxial stresses, 2100 MFa for 2D-26 and 1600 MPa for 3D-MP, even
. occur at different locations. Even though 2D-26 predicts a higher maximum triaxial stress, that' stress occurs in a i;, particle. 2D-26 does not predict' the highly concentrated '. triaxial stress in the matrix predicted 'by 3D-MP in 'the ' upper right comer of Fig. 13b. .
The distribution of the maximum principal stress for the Z = ,-21 11m plane is shown in Fig. 14 for the 2D-26 and 3D-MP models. Particle fracture is often attributed to large tensile principal stress. Thus, Fig. 14 can be used to predict which particles will fracture. Again, there are significant differences in where the 2D-26 model and the 3D-MP model predict the large principal stresses to occur. The maximum principal stresses predicted by 2D-26 and 3D-MP are 5800 and 3000 MPa, respectively, These stresses occur in the matrix. However, 2D-26 does not predict the principal stress in the particles to be as high as that predicted by 3D-MP. It is interesting that the maximum triaxial stress and the maximum principal stress occur at the same location for the 3D-MP model and that the same is true for the 2D-26 model.
4, Discussion
The 3D-DC model predicts that large plastic strains occur between particles in the loading direction and at the particle comer at ~ 45° as shown in Fig. 12a. Although not shown, it also predicts that the maximum triaxial stress occurs between particles in the loading direction. These results correspond very well with predictions for composites having spherical particles by Song et al. [34], who used a unit cell finite element
_J

I .,
H. Shen, CJ. Lissenden / Materials Science and Engineering A338 (2002) 271-281 279
1.Dffii
1.0[-(1
UHl
~ . 2..t-.!!
7,O[-ll
D:or
LDHl
3.0[-1J
l.a&,!!
+ Loading Direction t Loading Direction
1, OEtll
1:5[-1J
1.D[-Q
U[-ll
I.'OE-(I
7.U[-ll
! .OHl
5.0[-(1
1:0[-(1
:;.o[-ll
Z.OHl
1.0~
O.OC-HI
Fig. 12. Equivalenc plastic strain distribution predicted by the 3D-UC model at (a) z = 0, (b) = = I ~m, (c) z = 3.85 ~m, (d) z = 7.7 ~.
models are necessary to understand the material response and improve it. Finite element models of particle-reinforced aluminum in 2D and 3D have been constructed and have lead us to the followi11g conclusIOns.
Equivalent plastic strain distributions in the matrix predicted by 2D models are significantly different from those predicted for the same plane by a 3D modeL While both 2D and 3D models predict intense localized deformation, the 2D models predict much more networked banding than does the 3D modeL
The triaxial stress distributions, which are important for void nucleation in the matrix, predicted by the 2D models do not agree with that predicted by the 3D model. These models suggest void nucleation will occur at different locations and the 2D models underestimate the triaxial stress concentration in the matrix.
The distributions of maximum principal stress, which are i..'11portant for particle fracture, predicted by the 2D models do not agree with that predicted by the 3D modeL These models predict different particles will fracture fIrst and the 2D models underestimate the maximum principal stress concentration in the particles.
2D models obtained from planar sections through the 3D-MP model give macroscopic results that are not representative of the material if the particle area fraction of the plane analyzed is not equal to the particle volume fraction. The area fraction ranged from 9 to 26% for a volume containing 41 particles and a volume fraction of 17.5%. While this range is expected to decrease for models containing more particles, analyzing larger 3D models is impractical at this time.
3D-UC models containing a single particle and 2D generalized plane strain models containing many parti-
.:..~ "

H. Shen, c.J. Lissenden I Materials Science and Engineering A338 (2002) 271-281 281
[9] J. L1orca, A. Needleman, S. Suresh, Acta Metall. Mater. 39 (1991) 2317-2335.
[IO] M.B. Bush, Mater. Sci. Eng. AI54 (1992) 139-148. [i I] E. Weissenbek, H.I. Bohm, F.G. Rammerstorfer, Comput.
Mater. Sci. 13 (1994) 263-278. [I2] C. G onzalez, I. Liorca, Scr. Mater. 35 (1996) 91-97. [J3] Y. Tomita, Y. Higa. T Fujimoto, Int. I . Mech. Sci. 42 (2000)
2249-2260. [14] N. Shi, B. Wilner, R.I. Arsenault, Acta Metall. Mater. 40 (1992)
2841-2854. [15] N. Shi, R.J. Arsenault, A.D. Krawitz, L.F. Smith, Metall. Trans.
24A (1993) 187-196. [16] A.M. Murpby, S.l. Howard, T.W. Clyne, Mater. Sci. Techno!. 14
(J 998) 959-968. [17] K. Gall, M. Horstemeyer, D.L. Mcdowell, I. Fan, Mech. Mater.
32 (2000) 277-30 I. [i8] I .W. Leggoe, A.A. Mammoli, M.B. Bush, X.Z. Hu, Acta Mater.
46 (1998) 6075-6088. [1 9] I .T. Brockenbrough, S. Suresh, H.A. Wienecke, Acta Metall .
Mater. 39 (1991) 735-752. [20] M. Li, S. Ghosh, O. Richmond, Acta Mater. 47 (\999) 3515-
3532. [21] K. Lee, S. Moorthy, S. Ghosh, Comput. Methods Appl. Mech.
Eng. 172 (1999) 175-201. [22] T. lung, M. Grange, Mater. Sci. Eng. AZOI (1995) L8 - LJI. [23] M. Ostoja-Starzewski, Int. I . Solids Struct. 35 (1998) 2429-2455. [24] l . Lemaitre, J.L. Chaboche, Mechanics of Solid Materials,
Cambridge University Press, Cambridge, 1994. [25:] W,J. Drugan, I .R . Willis , I . Mech. Phys. Solids 44 (1996) 497 - ._~ .
:'", 524. . :: '
[26] C.Z. Mooney, Monte Carlo Simulation, Sage Publications, Thousand Oaks, CA, 1997, pp. 50-65.
[27] M. Li, S. Ghosh, TN. Rouns, H. Weiland, O. Richmond, W. Hunt, Mater. Characterization 41 (1998) 81 -95.
[28] J.D. Wolodko, Z. Xia, F. Ellyin, Mater. Sci. Tech. 16 (2000) 837-842.
[29] H. Shen, C.l. Lissenden, in: A.B. Pandey, K.L. Kendig, TJ. Watson (Eds.), Affordable Metal-Matrix Composites for High Performance Applications, The Minerals, Metals, & Materials Society, Warrendale, PA, 200!.
[30] SDRe J-DEAS 7, www.sdrc.com as of OJl21 /2002. [3 1] Hibbitt, Karlsson, Sorensen, Inc., ABAQUS Ver. 5-7 Theory
Manual (1997). [32] Z. Hashin, S. Shtrikman, J. Mech. Phys. Solids 1 I (1963) 127-
140. [33] D.L. McDanels, Metal!. Trans. 16A (1985) 11 05-1115. [34] S.G. Song, N. Shi, G.T. Gray, m, I.A. Roberts, Metall. Mater.
Trans. 27A (1996) 3739-3746. [35] B. Wilner, J. Mech. Phys. Solids 36 (1988) 141 - 165. [36] P.M. Singh, l.l. Lewandowski, in: J.J. Lewandowski, W.H. Hunt
(Eds.), Intrinsic and Extrinsic Fracture Mechanisms in Inorganic Composite Systems, The Minerals, Metals, & Materials Society, Warrendale, PA, 1995, pp. 57-68.
[37] N. Shi, R.I. Arsenault, in: l.J. Lewandowski, W.H. Hunt (Eds.), Intrinsic and Extrinsic Fracture Mechanisms in Inorganic Composite Systems, .The Minerals, Metals, & Materials Society, Warrendale, PA, 1995, pp. 69 - 76.
[38] R.I. Arsenault, M. Taya, Acta Metall. 35 (1987) 651-659. ,,, {39] R .J . Arsenault, L. Wang, C,.R. 'peng, Acta Metal!. Mater. 39 f ' (l99J) 47-57. ''\ :. ' . . • I~ •