newsletter · 3 - newsletter enginsoft year 11 n°1 flash flash a theme for this first newsletter...
TRANSCRIPT

00101110101001110101100101001101110010100101010100101110101001110101100101
NewsletterSimulation Based Engineering & Sciences
Year n°1 Spring 201411
CAE technologies for aerospace research:Interview with CIRA
Forefront Technology and Design for Hunting and Sport Shotguns
Improvement on ballscrew design: load distribution on balls and influence on dynamic analyses
Multi-Objective Optimization of a Paper Machine Lead Roller Support
FEM Approach in Vertical Packaging Machines
Surge Pressure Dynamics in a Closed Fluid Circuit for Centrifugal Compressors
Martian Terrain TraversabilityAssessment from Orbital Images

A UNIQUE FORUM FORDISCOVERING THE MOST
INNOVATIVE DESIGNOPTIMIZATION STORIES
INTERNATIONAL USERS’ MEETING12th > 13th MAY 2014 | TRIESTE, (ITALY)
um14.esteco.com
6 EDITIONS 200 ATTENDEES
50 SPEAKERS from leading international
companies including BMW, Airbus, Fujitsu and JLR.
MODULARITY MASTERING COMPLEXITY

3 - Newsletter EnginSoft Year 11 n°1 Flash
FLASHA theme for this first newsletter of 2014 could be “connectedness”. A 19th Century naturalist, John Muir, wrote “When we try to pick out anything by itself we find that it is bound fast by a thousand invisible cords that cannot be broken, to everything in the universe.” The compartments in which we parcel up our knowledge and education are artificial: such divisions may be useful but each local problem is a simplification of reality insofar as those invisible cords to other domains are being ignored.In the world of virtual engineering we encounter this challenge in a very direct way. The mathematics which lies beneath our software is an attempt to quantify the effect of each cord in our problem. Each single analysis discipline then considers groups of strongly-interacting cords, finally leading us to consider the cords that cross between the disciplines as we consider “multiphysics” approaches.I write this considering the three innovation enablers described by CIRA’s Dr Gardi: software, optimisation and multiphysics. Establishing the individual cords is very much at the root of many of the papers you will read within, whether they describe fundamental experimental campaigns and their interpretation, modelling methods within existing tools, or the development of the capabilities of the tools themselves. These tools package the physics in increasingly - accessible ways - through discipline-specific customisation or more generic ease-of-use developments.We have noted that a particularly design considered within one discipline will be pulled differently by its local cords than the same design considered within the perspective of a second discipline. This is reflected in Dr Gardi’s second innovation enabler, optimisation. We must stand ready to balance these potentially-conflicting demands by the simultaneous consideration of the individual domains; the state-of-the-art in engineering design is fundamentally multidisciplinary, and several papers illustrate how leading companies are responding to this challenge.Dr Gardi’s third enabler – multiphysics – may be approaching us by stealth, as our software
tools incorporate more and more of the interdisciplinary cords. This, too, is illustrated within several of these papers, and we should certainly expect such an integrative trend to continue.However, perhaps the most important evidence of John Muir’s connectedness within this newsletter is reflected at an organisational level. Connecting cords require us to bring together domain knowledge from disparate organisations as well as tools. I am proud that EnginSoft values partnership – whether this is with our customers, in cooperation with our peers, or in more formal combinations such as the recently-announced link with Ingeciber.So allow me to conclude by thanking you for your connections with EnginSoft, however they are expressed. I can think of no better advertisement for the importance of physical and organisational links than the collection of papers presented here, and it is an ideal opportunity for me to express my appreciation of the value of interdependent connectedness as an spur for innovation and productivity.
Stefano Odorizzi, Editor in chief

Contents
Sommario - Contents
Newsletter EnginSoft Year 11 n°1 - 4
INTERVIEW
6 CAE technologies for aerospace research: Interview with CIRA Advanced Senior Specialist, Roberto Gardi
SUCCESS STORIES
11 Forefront Technology and Refined Design for Hunting and Sport Shotguns
CASE HISTORIES
10 Martian Terrain Traversability Assessment from Orbital Images13 Improvement on ballscrew design: load distribution on balls and influence on dynamic analyses15 Multi-Objective Optimization of a Paper Machine Lead Roller Support17 FEM Approach in Vertical Packaging Machines19 Evaluation of Surge Pressure Dynamics in a Closed Fluid Circuit for Centrifugal Compressors Applications24 Process simulation of multistage cold forging helps to reduce time-to-market and costs for a steel heating pipe fitting28 The key role of CAE in the development of the European ALMA Antenna32 CFD analysis of a fluidized bed reactor for industrial application35 Splashing regime in three-dimensional simulations of oblique drop impact on liquid films38 Design Optimization of Gear Transmission System with Nonlinear Properties
41 Multi-objective Optimization in the Conceptual Phase of Low-floor Minibus Development44 Multi-objective analysis and optimization of cold spray coatings47 Experimental Results of a 55kW Permanent Magnet Heater Prototype PMH - a Novel High Efficiency Heating System for Aluminium Billets51 Ventilation system modelling using Flowmaster54 Microair Vehicles in Search for Danger
SOFTWARE UPDATE
56 A look at the future improvements to the ANSYS platform58 ANSYS CFX R15.060 ANSYS FLUENT R15.061 Advanced tools for fatigue calculation-nCode 63 Vestas chooses Sigmetrix, LCC for Tolerance Analysis Solution64 Extended CAE Offering in the Civil Engineering&Energy Sector. A flagship of excellence in the international arena
JAPAN COLUMN
65 R&D trends in the manufacturing industry in Japan
RESEARCH
68 EnginSoft joins the COmpetency in Geotechnical ANalysis – COGAN project
TRAINING
69 Become a Scilab expert today!

5 - Newsletter EnginSoft Year 11 n°1
OUR ACKNOWLEDGEMENT AND THANKS TO ALL THE COMPANIES, UNIVERSITES AND RESEARCH CENTRES THAT HAVE CONTRIBUTED TO THIS ISSUE OF OUR NEWSLETTER
Contents
Newsletter EnginSoftYear 11 n°1 - Spring 2014To receive a free copy of the next EnginSoft Newsletters, please contact our Marketing office at: [email protected]
All pictures are protected by copyright. Any reproduction of these pictures in any media and by any means is forbidden unless written authorization by EnginSoft has been obtained beforehand. ©Copyright EnginSoft Newsletter.
EnginSoft S.p.A.24126 BERGAMO c/o Parco Scientifico TecnologicoKilometro Rosso - Edificio A1, Via Stezzano 87Tel. +39 035 368711 • Fax +39 0461 97921550127 FIRENZE Via Panciatichi, 40Tel. +39 055 4376113 • Fax +39 0461 97921635129 PADOVA Via Giambellino, 7Tel. +39 049 7705311 • Fax +39 0461 97921772023 MESAGNE (BRINDISI) Via A. Murri, 2 - Z.I.Tel. +39 0831 730194 • Fax +39 0461 97922438123 TRENTO fraz. Mattarello - Via della Stazione, 27Tel. +39 0461 915391 • Fax +39 0461 97920110133 TORINO Corso Moncalieri, 223Tel. +39 011 3473987 • Fax +39 011 3473987
www.enginsoft.it - www.enginsoft.come-mail: [email protected]
The EnginSoft NEWSLETTER is a quarterly magazine published by EnginSoft SpA
COMPANY INTERESTSCONSORZIO TCN www.consorziotcn.it • www.improve.it
EnginSoft GmbH - GermanyEnginSoft UK - United KingdomEnginSoft France - FranceEnginSoft Nordic - Swedenwww.enginsoft.com
Cascade Technologies www.cascadetechnologies.comReactive Search www.reactive-search.comSimNumerica www.simnumerica.itM3E Mathematical Methods and Models for Engineering www.m3eweb.it
ASSOCIATION INTERESTSNAFEMS International www.nafems.it • www.nafems.orgTechNet Alliance www.technet-alliance.com
AdvertisementFor advertising opportunities, please contact our Marketing office at: [email protected]
RESPONSIBLE DIRECTORStefano Odorizzi - [email protected]
PRINTINGGrafiche Dal Piaz - Trento
Auto
rizza
zione
del
Trib
unal
e di
Tre
nto
n° 1
353
RS d
i dat
a 2/
4/20
08
The EnginSoft Newsletter editions contain references to the following products which are trademarks or registered trademarks of their respective owners: ANSYS, ANSYS Workbench, AUTODYN, CFX, FLUENT and any and all ANSYS, Inc. brand, product, service and feature names, logos and slogans are registered trademarks or trademarks of ANSYS, Inc. or its subsidiaries in the United States or other countries. [ICEM CFD is a trademark used by ANSYS, Inc. under license]. (www.ansys.com) modeFRONTIER is a trademark of ESTECO Spa (www.esteco.com) Flowmaster is a registered trademark of Mentor Graphics in the USA (www.flowmaster.com) MAGMASOFT is a trademark of MAGMA GmbH (www.magmasoft.de) FORGE and COLDFORM are trademarks of Transvalor S.A. (www.transvalor.com)

Newsletter EnginSoft Year 11 n°1 - 6 Interview
CAE technologies for aerospace research:Interview with CIRA Advanced Senior Specialist, Roberto Gardi
CIRA was formed in 1984 to manage PRORA, the Italian Aerospace Research Program, and uphold Italy’s leadership in Aeronautics and Space. The company has both public and private sector shareholders. The participation of research bodies, local government and organizations from the aeronautics and space industries sharing a common goal has led to the development of unique test facilities including air and space flying laboratories that cannot be matched anywhere in the world.CIRA is located on a 180-hectare area in the immediate vicinity of Capua, in the province of Caserta, north of Naples. It has a staff of 320 people, most of whom are engaged in research activities within domestic and international programs.
The goals of the Italian Aerospace Research Center are the acquisition and transfer of knowledge aimed at improving the competitiveness of existing firms and stimulating the creation of new ones, as well as promoting training within and increasing awareness of the aerospace sector. To reach these goals CIRA develops research projects, domestic and international collaborations and activities to “disseminate” the knowledge and technologies it acquires.
EnginSoft has been collaborating with CIRA for many years, and we were interested to interview Dr. Roberto Gardi, Advanced Senior Specialist of Thermo-structural department, to explore his views on the importance of innovation, CAE technology and CIRA’s relationship with EnginSoft.
1. What is (and what should be) the role of innovation in the industrial world?
Personally speaking, I work in a research centre, oriented to applied research. Our task is that of a bridge between the pure science, developed by Universities and the industrial application of the new technologies. For us, innovation is therefore the core of all our activities.
2. How can we be more innovative and how do we move innovation forward?
In my opinion, innovation can be reached either by understanding changing requirements (new media, faster transportation), or looking for new ways to satisfy existing requirements. For instance: safer and less polluting means of transport, or more affordable and accessible means of communication
Eng. Gardi in command of a SIAI Marchetti SF-260

7 - Newsletter EnginSoft Year 11 n°1 Interview
3. What role does CAE and virtual prototyping tools play in this sense?
To build an “innovative” prototype is expensive task; it’s no longer common for a home-made product to be successful in the market. Nowadays, it is necessary to use numerical systems to design and simulate the innovative system we have in mind.
4. How have the users’ needs changed over the last few years and what advantages have you detected in your professional experience? In particular, how has your approach to design/production changed?
I was born when computers constituted a consolidated technology and I entered the working world when informatics was already dominating. Nevertheless, I have seen changes in the way in which computers are used to perform analyses and simulations. Once, calculation systems were complex and used by a limited number of professionals, spending most of their time and energy to transform a problem to be solved into an endless sequence of sheets or code lines for a huge computer. CAE systems have dramatically improved the user interface. The differential equations and matrices inside the calculation code are substantially the same, but the computation is faster and easier to use. Less energy and fewer man-hours are now needed to convert a problem into a solution. This has allowed a materials expert to also become a calculation system specialist, making the process faster and allowing the designer to directly handle the simulation results.
5. What has EnginSoft contributed to CIRA and has this had an impact to what CIRA can offer?
EnginSoft supports companies with its highly-experienced and trained staff, who are very competent on conventional issues and willing to understand and answer unconventional problems.EnginSoft goes far beyond supplying software, since it’s able to provide a wider perspective and approach on each operation.
EnginSoft is not just interested in selling its products, but also in ensuring that its customers get the most out of them.
6. In your view, what effect will calculation codes have in relation to future challenges?
They have to become more and more accessible, user-friendly and multi-physical. Internal CAD systems should be improved so as to allow an easier creation and modification of complex geometries. The multi-physics aspect should allow the increased coupling of different phenomena: thermal, aerodynamic, structural, and inertial in a comprehensive way. CAE systems should also head towards optimization. Optimization systems should be embedded in the software.
7. Which projects, new objectives and targets can be supported by these tools?
My department’s research area is focused on materials resistance to high temperatures. My dream is that of designing a whole hypersonic vehicle and to simulate aerodynamics, thermo-dynamics and thermo-chemistry of the atmosphere at a high Mach number simultaneously, considering both fluid structure interaction and thermo-structural aspects of materials.
8. And what would you advise the rest of the scientific and technological community who are longing for creativity and competitiveness?
A competitive product is the best available choice. In order to design and create something new, both great creativity and good engineering work are required. Creativity is something that software cannot design, but as far as engineering is concerned, we will handle more and more powerful tools, facilitating the transformation of brilliant ideas into innovative products.
A special acknowledgement to Eng. Gardi for his kind collaboration

Newsletter EnginSoft Year 11 n°1 - 8 Success Stories
Benelli Armi S.p.A. was formed in 1967. The idea behind the company, however, first came to the Benelli brothers, owners of the famous Benelli motorcycle company of Pesaro, in 1940. The Benelli brothers were passionate hunters as well as fine engineers, and at that time were already convinced that the future of hunting shotguns lay with semi-automatic models. This idea became reality when a brilliant designer from Bologna, Bruno Civolani, invented a revolutionary action. Civolani’s design led to the creation of an extraordinary hunting shotgun that used a simple inertia driven mechanism in place of a conventional gas operated system. With the bolt providing all the movement needed, this revolutionary design provided the fastest reloading action the world had ever seen, and permitted users to fire 5 rounds in less than a second. Benelli is a constantly growing company thanks to major investments in research and development. Over the years, innovative new products and advanced technology have consolidated Benelli’s prestige and spread its reputation among hunters and target shooters alike, aided by the company’s strategy of offering a range of semiautomatic shotguns that is recognised as the widest available today. Benelli was acquired by Beretta in 1983.Continuous innovation, research, the development of new technologies and materials, precision engineering and distinctive design are the keystones of Benelli’s philosophy.Benelli’s mission is focused on the design and production of semiautomatic shotguns that stand out from the competition for their advanced technology, refined styling and unrivalled reliability. Owning a Benelli shotgun means owning a product of distinction, and one to which all enthusiasts aspire.
Designing with modeFRONTIER The introduction of modeFRONTIER in the complex design and development process of Benelli Armi has proved to be essential in order to create new products and to improve the existing ones to overcome new market challenges and maintain their competitive edge. A pilot project has been set up within the R&D group, quickly leading to the full integration of their CAD and CAE tools used for design and analysis: UGS for CAD and MSC part and Patran/Marc for FEM calculation. This has allowed the verification of the efficacy of the modeFRONTIER optimization platform. modeFRONTIER is used for several reasons, both to analyze and improve product or part performance, and to enhance selected elements which influence the response of the market (weight and size of hunting
“Benelli Armi has always taken advantage from all
software solutions providing competitive advantage”,
explains Ing. Marco Vignaroli, Central and Technical Direc-
tor of Benelli Armi, “in such perspective modeFRONTIER
is a tool able to support and favor the calculation process,
the design and development of new products, allowing both
the evaluation of several design alternatives in a shorter
time and the improvement of their quality. Continuous
innovation, research and development of new technologies,
quality and constructive excellence: this is in brief
Benelli’s philosophy.”
Marco VignaroliCentral and Technical Director of Benelli Armi
Forefront Technology and Refined Design for Hunting and Sport Shotguns

9 - Newsletter EnginSoft Year 11 n°1 Success Stories
and sport shotguns), thus guaranteeing a consistent quality in performance.This has been achievable thanks to modeFRONTIER’s advanced DOE (design of experiments) and optimization algorithms, along with its powerful post-processing tools and user-friendly interface. These permit the user to easily modify design parameters to achieve the best performance possible.The opportunity to formalize and direct the optimization process in a structured way improves its applicability to more complex multidisciplinary problems involving still greater number of parameters, targets and constraints. This new methodological approach also enables the R&D group to exhaustively analyze the whole project in a relatively short time, improving on the industry’s previous best practice in terms of product quality and development timing.
“After having evaluated several technical solutions, we
have chosen modeFRONTIER as it represents, according to
our needs, the best Available technology on the market”,
Ing. Loredana Banci declares, Research & Development
Manager of Benelli Armi, “furthermore EnginSoft repre-
sent a key partner for us, skilled and reliable from the
very beginning of the pilot project, allowing us to grow in
autonomy in a very short time.”
“modeFRONTIER represents a real competitive advantage”,
Ing. Banci says, “since such software solution will enable a
more efficient and effective use of our numerical simulation
tools, thus reducing all those repetitive manual activities
and letting our designers and analysts to use their time in a
smarter and profitable way”.
Loredana Banci R&D Manager of Benelli Armi

Newsletter EnginSoft Year 11 n°1 - 10 Case Histories
Long before NASA’s Jet Propulsion Laboratory safely landed the rover “Curiosity” at Gale Crater on August 6th 2012, the Mars Science Laboratory (MSL) needed not only to evaluate the risk during entry descent and landing but also the traversability of the landing site. Due to the rover’s size and weight, MSL adopted a unique and more precise landing system which reduced the landing ellipse to 21x7 km. The small footprint allowed the rover to land in a relatively tight spot near Mt. Sharp, a mountain rising 5000 meters at the center of Gale Crater, the primary science objective for the mission (Fig 1). Due to the rugged terrain and steep slopes, Mt. Sharp was deemed too risky to directly land on, therefore it was necessary to determine if, once safely landed at the base of Mt. Sharp, the rover would be able to reach the mission goals within the vehicle specifications.
The previous rover missions, Mars Pathfinder’s Sojourner rover and Mars Exploration’s Spirit and Opportunity rovers, provided an understanding of how the rocker-bogie suspension arrangement performs on the Martian terrain. This passive suspension system allows vehicles to overcome very large obstacles while maintaining all wheels in contact with the ground. The rover drivers, the engineers who are in charge of commanding the vehicle motion on the Martian surface, use stereo images captured by the rovers to measure and assess the traversability of the terrain on which the vehicles are intended to move. Over the years, rover drivers have gathered enough experience to identify obstacles and difficult terrain. This tedious, manual process is applied to the small area visible from the
Martian Terrain Traversability Assessment from Orbital Images
Fig 2 - The High Resolution Imaging Science Experiment Camera being installed on the Mars Reconnaissance Orbiter
Fig 1- Gale Crater (5.4 S, 137.8 E) is a 150Km in diameter where Curiosity rover landed on Aug 6, 2012

11 - Newsletter EnginSoft Year 11 n°1
rover cameras and would have been impractical had it been applied to the entire Gale Crater area. A Computer Aided Engineering approach involving modeling and simulation was therefore developed.In August 2005 NASA’s Jet Propulsion Laboratory launched the Mars Reconnaissance Orbiter, a spacecraft flying about 250Km above the surface of Mars and carrying the HiRISE camera, a high resolution camera looking through a 50cm reflecting telescope. This camera is capable of providing images in stunning detail (about 30cm per pixel) of the planet’s surface. (Fig 2)
Images from HiRISE provided the necessary information to measure terrain slope, presence of obstacles such as rocks, scarps and ridges as well as assessing terrain composition. Terrain slopes have been derived from Digital Elevation Models (DEMs) computed from HiRISE stereo pairs, images of the same area taken from different orbits. Obstacles were identified by applying several machine vision filters (Fig 3). These data products are combined to determine the cost to traverse each location. Cost is set based on which flight software configuration is needed to traverse the terrain.
Low-slope terrain without any significant obstacles can be traversed without the rover taking and processing stereo images to locate obstacles and measure vehicle slip. Since this software configuration does not suit cameras it is often referred as “blind” driving, and it is the fastest method to move across the Martian surface. For areas where orbital images indicate presence of obstacles, the rover needs to use “Autonomous Navigation”, a flight software configuration in which the rover at each step takes stereo images of the terrain in the direction of motion and identifies the presence of steep terrain and geometric obstacles, protrusions or cavities as well as rough surfaces.The on-board software then tries to determine
the safest route to reach the goal. This software configuration is quite computationally heavy, reduces the drive rate (distance covered per unit of time) of the vehicle and is assigned a cost higher than blind driving.
The flight software updates the vehicle position based on wheel odometry and rover attitude but is unable to determine the amount of wheel slippage. On steep terrain or when traction is reduced, the positioning errors can be significant and it is often necessary to enable “Visual Odometry”, a software module that compares stereo image pairs and matches terrain features visible prior to and after each step. From the actual three-dimensional displacement of these features the rover is able to determine the actual motion of the
vehicle. This software modality is used to traverse steep slopes or whenever high position accuracy is needed. Similarly to Autonomous Navigation, Visual Odometry has much lower drive rates and is assigned a higher cost.
Areas that have steep slopes and obstacles are assigned a higher cost still as they need to be traversed using a combination of Autonomous Navigation and Visual Odometry. Terrain with features beyond the vehicle capabilities are marked as untraversable.By determining the software configuration needed to traverse each location, we populate a map where the cost is proportional to the traverse time. Carnegie Mellon’s Field D* algorithm is used to compute optimal paths between waypoints (Fig 4). Here the optimization refers to minimal traverse time, which is not necessarily the minimum distance between waypoints.
Case Histories
Fig 3 - Terrain Classification is obtained by applying several correlation filters to raw HiRISE images to identify potential difficult terrain sich as sand and dunes.
Fig 4 - Terrain slope, classification and obstacles are combined to compute terrain traversability

Newsletter EnginSoft Year 11 n°1 - 12 Case Histories
Once an optimal path has been computed, the total drive duration can be computed based on drive rates, power models and surface imaging limitation such as topography which governs the amount of “blind” driving that can be covered on each Sol (Martian day).The simulation and modeling tools have been entirely developed by the Jet Propulsion
Laboratory are being currently used in the day-to-day operations of the Mars Science Laboratory mission to study long term traverses for the Curiosity rover.
Paolo BelluttaJet Propulsion Laboratory
California Institute of Technology
Fig 5- Paolo Bellutta near the engineering models of Sojourner (1997, Front), Spirit/Opportunity (2004, Left) and Curiosity (2012, Right)
Jet Propulsion LaboratoryThe Jet Propulsion Laboratory numbers approximately 100 engineers working on all the different aspects of robotics related to space exploration and terrestrial applications.They develop autonomy software to drive the rovers on Mars and operations software to monitor and control them from Earth. They do the same for their instrument placement and sampling arms, and are also developing new systems with several limbs for walking and climbing.To achieve mobility off the surface, they are creating prototypes of airships which would fly through the atmospheres of Titan and Venus, and drills and probes which could go underground on Mars and Europa. In order to enable all these robots to interact with their surroundings, they have equipped them with cameras “to see” and with sensors “to measure” their environment.Taking advantage of such measurements, the robots are able to control themselves by means of algorithms, also developed by their research teams. They capture the control-and-sensor-processing software in unifying frameworks, which enable both reuse and transfer of data among different projects. While developing this technology, they build real end-to-end systems as well as high-fidelity simulations of how the robots would work on the worlds they are planning to visit.http://www-robotics.jpl.nasa.gov

13 - Newsletter EnginSoft Year 11 n°1 Case Histories
Umbra Cuscinetti is part and headquarter of the Umbra Group. The company is located in Foligno (PG) where have been developing and producing ballscrews, bearings and electrical mechanical actuators.
The Group consist of a Research Center in Albanella (SA) to develop electrical motors for the industrial and aeronautical applications; two companies in Germany, one produces ballscrews for industrial applications and the other produces balls.Another company of the Group is located in the U.S. in Washington State and produces components for aircraft applications.
ANSYS and Workbench , since the nineties, have been essential tools of the Technical Department of Umbra Cuscinetti, to design, optimize and verify ballscrews, bearings and electromechanical actuators. To model a ballscrew, in a way as close as possible to reality, the connection between the ballnut and screwshaft is represented by spring elements of appropriate stiffness in place of balls. The spring elements (contac52 or combin14 depending on the type of analysis) are placed between the ball tracks of the screwshaft and ball track of the ballnut. The stiffness’ value of spring is calculated applying Hertzian theory.
In the past, every spring element was inserted manually by selecting the spring’s initial and final nodes. Working in collaboration with EnginSoft, an automatic procedure was developed to insert the spring elements quickly and efficiently.
The procedure requires just the insertion of an APDL command in the preprocessor tree of Workbench. This work will present two cases of study to show the advantages due to modelling the balls between ballnut and screwshaft as spring elements.
The first case study concerns the structural analysis performed to optimize the distribution of load on the ballscrew of an electromechanical actuator for a cutting water-jet machine. The
Improvement on ballscrew design: load distribution on balls and influence on dynamic analyses
Fig. 3 - Spring elements in place of the balls
Fig. 1 - Ballscrew’s modelling
Fig. 2 - Ballscrew model

Newsletter EnginSoft Year 11 n°1 - 14 Case Histories
finite element analyses performed has helped to achieve a uniform load distribution on the balls of the ballscrew, starting from a strongly uneven distribution load due to a large number of ball circuits and a non-optimized radial distribution of the recirculating systems. The distribution of load on the balls has been evaluated as normal force FN on the spring elements contacts.
The second case study concerns the comparison, in terms of modal and PSD response as evaluated by FE analyses, of two different approaches to model the balls in the ballscrew. The first approach considers spring elements in place of balls; the second one provides for a bonded contact between balltracks on the ballnut and screwshaft.
Modal analysisIn terms of mode shapes, considering the first and the second natural frequency of the system, the ‘bonded’ model shows bendings of the shaft - highlighted in figure 6- due to the too-rigid connection between ballnut and screwshaft. On the contrary the ‘spring element’ model seems to have more realistic mode shapes.
PSD responseAnalysis by PSD response evaluation shows that the axial stress x is very similar to the stress equivalent
eq, and that the PSD response is dependent mainly on the first natural frequency. In case of the ‘bonded’ model, it is possible to relate the distribution of equivalent stress to the ‘unrealistic’ bending of the shaft in case of the first mode shape (Fig. 7).
ConclusionThis comparison between the two different approaches to simulate a ballscrew also gives a clear indication of which is the more realistic method for dynamic analyses. To recap:
• The modeling approach that consider spring elements in place of balls is closer to the real behavior of the ballscrew.
• The automatic procedure, developed in cooperation with Enginsoft, allows to save at least the 30% of the time to set up the finite element model and make a step forward in evolution of our work methodology.
Francesca Pacieri, Umbra Cuscinetti
Fig. 6 - Modal Analysis
Fig. 4 - Comparison: load distribution on balls
Fig. 7 - Dynamic analysis
Fig. 7 - PSD analysis

15 - Newsletter EnginSoft Year 11 n°1 Case Histories
Multi-Objective Optimization of a Paper Machine Lead Roller SupportThe intent of the study was to produce a new design for a cast iron (GJS400) lead roller support used in a paper machine which reduces its weight, while maintaining or reducing its fatigue life cycle resulting from regular production use. Since these two objectives could be construed as conflicting, a multi-disciplinary design simulation that encompassed the main life cycle stages of the component, from its design to its production and in-service use, was set up in order to produce a new design where both of these objectives were optimized.
The engineering simulation technologies involved in this study spanned three different design fields. MAGMASoft was used to evaluate the mechanical properties and residual stress caused by the forging process, ANSYS was used to calculate the torsional effect and modeFRONTIER was used to explore different geometric configurations to identify the optimum trade-off between the conflicting objectives.
The Multi-Disciplinary Design Optimization ApproachThe optimization process involved:• A preliminary study carried out on the original design to evaluate
its current state.• An optimization simulation to find the best design that would
decrease the component’s weight while maintaining or improving its fatigue life cycle. With respect to the original design the optimal weight was identified at 360 kg, a decrease from the original 476 kg, while its deformation from normal production use decreased
from 0.21mm to 0.187mm. This simulation assumed that the material is isotropic, without defects and residual stresses due to the manufacturing process.
• The next stage analyzed the manufacturing process. The optimized component geometry was evaluated for its castability and the corresponding mechanical properties and residual stresses due to the forging process were accounted for.
• A further structural simulation used the spatial distribution of
Fig. 1 - The lead roller support that was the object of this study (top); the pin and cover plate variable parameters with the ranges used in the study (bottom)

Newsletter EnginSoft Year 11 n°1 - 16 Case Histories
Fig. 2 - Peak Von-Mises Stress btw. integrated (top-left) and traditional (bottom-right) analysis: the integrated approach results in a decrease in peak stresses from 50 to 30 MPa
the mechanical properties and the residual stresses as an initial condition in order to analyze the stress change distribution with respect to the isotropic structural analysis results. Stresses were not homogeneously distributed on the component, due to different pre-stress conditions and non-homogeneous mechanical properties.
The Benefits of the Multi-Disciplinary Design Optimization ApproachAs verified in the initial study, the classic single objective design simulation neglects the presence of residual stress and assumes the component has isotropic properties at the end of the casting process. The benefits of the multi-objective study, including both the casting and structural simulations, are evident from the final results which gave a more realistic assessment of the fatigue life of the component. These results show some zones with high stress peaks which will result in a decreased fatigue life of the roller support.
The entire article is available to download online on Taylor & Francis online library:http://www.tandfonline.com/doi/full/10.1080/10426914.2011.564248#.UuZEW28uIht
Nicola Gramegna, Emilia Dalla Corte, Håkan Strandberg- EnginSoft
For more information:Nicola Gramegna, [email protected]
Fig. 3 - Optimization of geometry castability: information on the solidification time (top-left) and on the micro-structural phases formed during solidification (bottom-right)
The work described was made for Valmet Corporation.Valmet Corporation is a leading global developer and supplier of services and technologies for the pulp, paper and energy in-dustries. Our 11,000 professionals around the world work close to our customers and are committed to moving our customers’ performance forward – every day.
Valmet’s services cover everything from maintenance outsourc-ing to mill and plant improvements and spare parts. Our strong technology offering includes entire pulp mills, tissue, board and paper production lines, as well as power plants for bio-energy production.
The company has over 200 years of industrial history and was reborn through the demerger of the pulp, paper and power busi-nesses from Metso Group in December 2013. Valmet’s net sales in 2012 were approximately EUR 3 billion. Valmet’s objective is to become the global champion in serving its customers.http://www.valmet.com
Fig. 4 - Residual stresses

17 - Newsletter EnginSoft Year 11 n°1 Case Histories
FEM Approach in Vertical Packaging Machines
ILAPAK is one of the most experienced and fastest growing manufacturers of industrial wrapping machinery for primary packaging utilizing flexible wrapping materials. It provides a full range of products and dedicated services to customers that need to achieve success in their markets.Founded in 1970 on the principles that customer focus and a dedication to service were key to customer satisfaction, ILAPAK now generates an annual turnover of more than € 90 million, with over 450 skilled professionals delivering more than 650 individual machines and complete automatic packaging lines to its customers each year.
ILAPAK’s four production sites (Lugano, Switzerland; Arezzo, Italy; Lang Fang, China; Rogers, USA), totaling about 20,000 square meters of covered space, are centers of excellence, each of them dedicated to a specific packaging technology - designing, engineering and manufacturing industry-leading packaging machinery.
ObjectiveThe need for competitiveness that production companies have to face in the market, influences the complete production chain, in terms of the performance and efficiency of the whole company and its production lines. The role of a leading company in the sector of automatic machines is providing its customers with efficient machinery, with maximum achievable performance and tailor-made solutions for border-line applications when the existing technologies seem to not be enough.The experience of high-skilled professionals is the core of ILAPAK know-how, but new challenges have forced the adoption of a FEM approach, both as an integration and “exploration” tool, thus saving prototyping times and related costs. The choice of ANSYS as a FEM tool has almost been a compulsory one, as it represents the state-of-the-art in this sector. EnginSoft itself, as a partner, is a reference point for analysis support across Europe and one of the most qualified for virtual simulation on a worldwide level.
The machine series under investigation in this work are the vertical fillers “Vegatronic” of ILAPAK; these are machines for the production and simultaneous filling of bags of different shapes and sizes, in particular for loose products (pasta, chips, salad, coffee, cheese, plastic components, bolts and screws). Occasionally, applications of extremely customized machines have also been delivered for pre-packed products. The first objective and test-case for ILAPAK is represented by the definition of a new series of continuous vertical machines, the “Vegatronic VT6000 Open Frame”.
The continuous machines are principally characterized by a production rhythm which is almost double in comparison to the similar “alternating machines”: their speed can reach the 200 strokes/minute (that means the physical limit that is constituted by the falling speed of a product in the air). As for any other sector, when dealing with top level performance, other difficulties may arise that cannot be solved using a trial and error approach, considering the limited time to market.
The ANSYS license acquisition has been the result of activities in which EnginSoft is the technical partner. The initial problem was related to induced vibrations close to the resonance one: potentially significant
ANSYS integration as advanced partner in Vertical Machine designing workflow
Fig. 1 - Defeaturing in Design Modeler
Case Histories Newsletter EnginSoft Year 11 n°1 - 18
and certainly not acceptable by ILAPAK standards. Since ILAPAK had no FEM tool to analyze the machine normal mode vibration, EnginSoft performed the technical work on their behalf. The identified objective was the verification of the machine’s operation in terms of frequency, therefore requiring a modal analysis as a screening tool.
SolutionsThe modal analysis was carried out starting from the CAD provided by ILAPAK. The first phase was devoted to understanding the normal modes and frequencies of the structure and it was performed in ANSYS WB. Thanks to the Design Modeler (the internal CAD of ANSYS WB environment) some preliminary operations could easily be performed to prepare the geometry for FEM. Other minor details were also simplified for the analyses that were to be performed. The Design Modeler offers several functionalities for geometry preparation: operations like face deletion, hole filling and element bounding with Boolean operations may be performed quickly with easy geometry selection directly from the graphic interface. This step is necessary to overcome the difference existing between the details in a CAD model intended for production and the somewhat cleaner and simpler CAD required for FEM analysis. Considering that CAD 3D is mainly generated for production reasons, ANSYS has the ability to quickly modify the geometry to suit the FEM analysis requirements. It represents a great saving in time for mesh generation and it therefore provides a
significant saving in normal frequency calculation time by limiting the effort required by defeaturing. Where possible, components have been limited and substituted by concentrated masses.
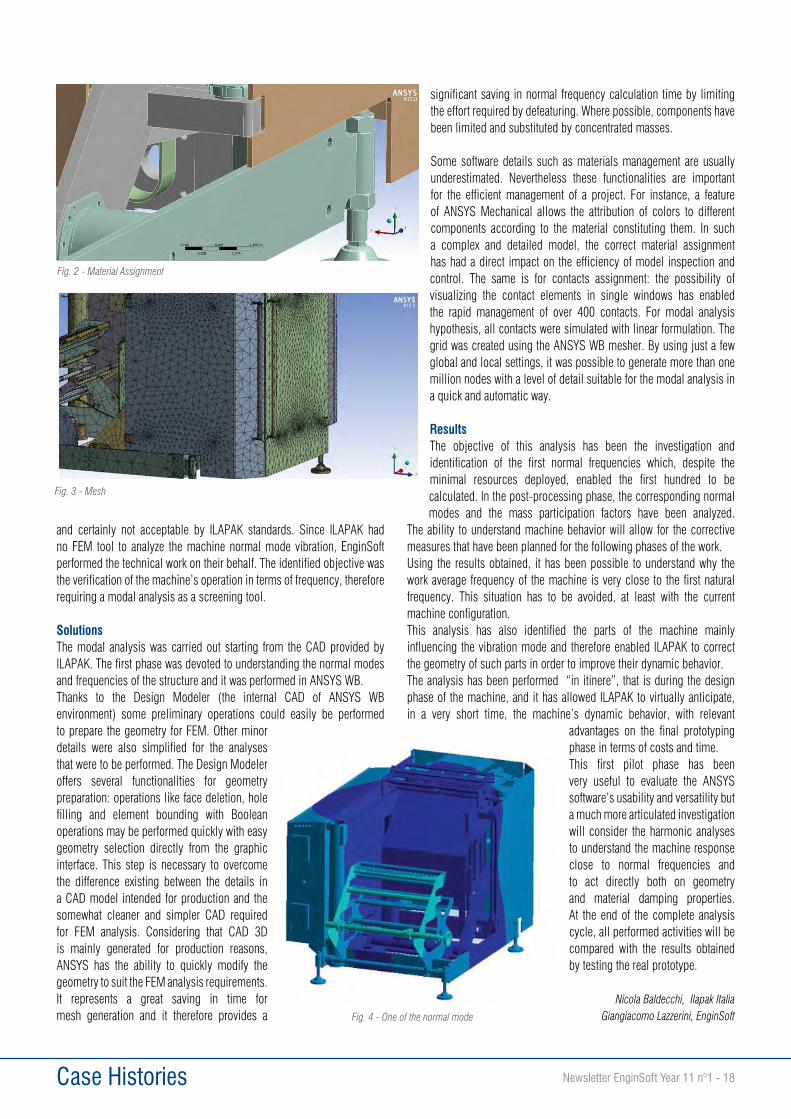
Some software details such as materials management are usually underestimated. Nevertheless these functionalities are important for the efficient management of a project. For instance, a feature of ANSYS Mechanical allows the attribution of colors to different components according to the material constituting them. In such a complex and detailed model, the correct material assignment has had a direct impact on the efficiency of model inspection and control. The same is for contacts assignment: the possibility of visualizing the contact elements in single windows has enabled the rapid management of over 400 contacts. For modal analysis hypothesis, all contacts were simulated with linear formulation. The grid was created using the ANSYS WB mesher. By using just a few global and local settings, it was possible to generate more than one million nodes with a level of detail suitable for the modal analysis in a quick and automatic way.
ResultsThe objective of this analysis has been the investigation and identification of the first normal frequencies which, despite the minimal resources deployed, enabled the first hundred to be calculated. In the post-processing phase, the corresponding normal modes and the mass participation factors have been analyzed.
The ability to understand machine behavior will allow for the corrective measures that have been planned for the following phases of the work.Using the results obtained, it has been possible to understand why the work average frequency of the machine is very close to the first natural frequency. This situation has to be avoided, at least with the current machine configuration.This analysis has also identified the parts of the machine mainly influencing the vibration mode and therefore enabled ILAPAK to correct the geometry of such parts in order to improve their dynamic behavior.The analysis has been performed “in itinere”, that is during the design phase of the machine, and it has allowed ILAPAK to virtually anticipate, in a very short time, the machine’s dynamic behavior, with relevant
advantages on the final prototyping phase in terms of costs and time.This first pilot phase has been very useful to evaluate the ANSYS software’s usability and versatility but a much more articulated investigation will consider the harmonic analyses to understand the machine response close to normal frequencies and to act directly both on geometry and material damping properties. At the end of the complete analysis cycle, all performed activities will be compared with the results obtained by testing the real prototype.
Nicola Baldecchi, Ilapak ItaliaGiangiacomo Lazzerini, EnginSoftFig. 4 - One of the normal mode
Fig. 2 - Material Assignment
Fig. 3 - Mesh

19 - Newsletter EnginSoft Year 11 n°1 Case Histories
Centrifugal compressors operability at low flow is normally limited by the onset of surge (large amplitude and periodic pressure oscillations) that occurs when operating near maximum achievable pressure rise at constant speed. Avoiding such events is a key task in the design of high-pressure centrifugal compressors, to reduce the risk of dangerous vibrations that can compromise the operability of the machine.Pressure data during surge occurrence has been acquired during the testing of a compressor and the system has been modeled according to the plenum-pipe assumption suggested by Greitzer and also by a 1D system model of the circuit. The results of both approaches are compared.
IntroductionCompressor surge is mostly approached by the low order state-space model developed by Moore and Greitzer. According to this model the whole compression system is represented as a compressible plenum, in which flow is at rest, connected to the compressor by the pipe in which it is installed. This model has proved effective in predicting both stall and surge. A more detailed description of a fluid system, in particular with a pipeline structure, can be obtained by a full 1D approach. Such a model can give an higher accuracy level provided that reliable and accurate geometrical information and proper parameters are used. The results of these two approaches are compared principally in terms of their description of surge event. The pipeline model was created using the commercial tool Flowmaster.
Test Rig Experimental MeasurementsLayout and instrumentationTo validate the surge models, experimental dynamic pressure signals were acquired during a performance test campaign. In Figure 1 the schematic view of the closed-loop test rig is reported, using only the pipes indicated by the pink arrows and a single regulation valve, permitting a fixed geometry for all modeled conditions. In Figure 2 some details of tested stage are reported. Performance curves are measured by pressure and temperature probes located at the inlet and outlet sections and
indicated in Figure 2 as sections 0 and 60 respectively. Additional pressure and temperature probes are located at sections 0 and 60, along with dynamic pressure sensors are introduced at both the inlet and outlet sections.
Evaluation of Surge Pressure Dynamics in a Closed Fluid Circuit for Centrifugal Compressors Applications
Figure 1 - Schematic view of the test loop
Figure 2 – Instrumentation

Case Histories Newsletter EnginSoft Year 11 n°1 - 20
Test procedure and data acquisitionDuring the test campaign the compressor inlet pressure was maintained around 1.1ata with the use of the pressure tank while the inlet temperature was regulated by the cooler at around 293K.Performance curves were acquired at constant rotational speed to ensure the design peripheral Mach number (Mu) equals 1.24. The regulation valve was progressively closed until a surge condition was reached. Curves of pressure ratio against flow coefficient (Figure 3) were used to characterize the onset of surge conditions.The density of the gas in test conditions was around 4.50 kg/m3 in the inlet section and around 9.0 kg/m3 in the outlet section at the design point. Both high pressure ratio and density increase the intensity of pressure fluctuations during surge events.The red dots indicate the points for which the behavior of the pressure signals will be analyzed. To investigate surge transients the experimental curves of pressure ratio need to be extended in the unstable region and this is usually done with a cubic polynomial interpolation (black dotted line).
The pressure ratio at zero flow is computed using the classical approach:
Simplified ApproachThe whole test rig system is reduced to an inlet volume V1, an outlet volume V2, a control valve Vt and the compressor (Figure 4).
In the inlet volume fluid is uniform at the inlet average temperature and pressure. The volume is assumed equal to the sum of the volumes of all the elements located between the outlet of the control valve and the inlet section of the compressor. The usual equations will now briefly be summarized.Inlet and outlet pressure are made non dimensional using the quantity
in which 2U is the impeller tip speed and is the initial
density. The non-dimensional pressure coefficients
and and their difference across the valve
12V are expressed as a function of flow rates across the valve and the compressor.The 1D mass balance equations written in non-dimensional form are used:
VCB12
9.92
2
2
2
ccLAV
cUB (1)
CVBC1 4.3
122
211
VTZVTZC (2)
VCV
BF
4.41 CF (3)
In (1), (2) and (3) Ht is the non-dimensional time with the
Helmholtz frequency H :
c
cH LV
Ac2
2
Figure 3 – Characteristic Curve of the stage
Figure 4 – Simplified Compressor Scheme

Case Histories21 - Newsletter EnginSoft Year 11 n°1
Both stall and rotor inertia have been neglected to focus on surge frequency prediction.The centrifugal compressor performance curve is described by the experimental pressure ratio characteristics.
CC F
The momentum equation can be applied to the compressor, which coupled with (3) leads to a system of two differential equations:
rVVCV
VCCC
uBF
B
, (4)
This system is integrated in time for the different operating points. A conventional law has been used in order to reproduce the different operating points of the system.
(5)
1D Pipeline ModelIn this approach the test rig is modeled using 1D components representing the main geometrical features of the system. The network used is illustrated in Figure 5. Since Mach numbers outside of the compressor are sufficiently low, SUVA gas is modeled as an incompressible gas. The compressor is represented by a library pump model. All straight pipes of the test rig have been described in terms of their length and diameter and friction losses.The discrete method of characteristics is used to evaluate the propagation
of pressure waves in pipes during time surge transitory, according to the following model equations:
The assumption of elastic behavior allows neglecting energy equation to solve fluid motion. The first consequence is that the thermal characterization of the cooler can be ignored and it can be modeled as a simple elastic pipe. Furthermore the compressor can be described by the pressure characteristic neglecting the knowledge of the work coefficient (as for the simplified model).
Before running the case a series of numerical tests were performed to select the best combination of computational parameters. In particular the impact of both time step and numerical weighting factor (WF) were investigated. For example, the result of time step effect on solution is shown in Figure 6 and was used to select a suitable timestep
ResultsResults with Simplified Gravdahl Model Surge frequency and pressure fluctuations results are reported in Figure 7 for point 2. In this figure the pressure fluctuations measured in 2.5s in [KPa] are plotted versus time (black lines) and compared with the computed pressure (blue lines).
The top left and right graphs refer to the inlet and outlet sections of the compressor respectively. Blue lines represent the numerical computations for the compressor in the outlet volume both computed with the simplified approach. The two experimental pressure signals show different behaviors and values. In the inlet section the main frequency content is located at 1.17[Hz], with amplitude of about 3[KPa] and with a big contribution of higher harmonics as shown in the FFT analysis of Figure 7. In the outlet section the main frequency content is found at the same frequency but with a lower value.The Greitzer model in the outlet section is able to capture the unstable nature of the flow and also the frequency of the phenomena for operating point number 2. The power content associated to the harmonic frequency is overestimated, as are the pressure fluctuations at the surge frequency. The scaling of harmonic power of a factor around 3 between inlet and outlet pressure fluctuation is similar to experiment.
Figure 5 – 1D Pipeline model
Figure 6 – Selection of numerical parameters
Figure 7 – Point 2: Pressure fluctuations and FFT

Case Histories Newsletter EnginSoft Year 11 n°1 - 22
From Figure 8 some more details about the computed surge loop can be inferred. At zero time the compressor is working at the nominal flow coefficient 0.29 (Point 1). Since the equilibrium is not stable the compressor mass flow and pressure reduce rapidly to zero mass flow and minimum pressure rise (Gravdahl point). This phase is very rapid due to the low inertia of the compressor. Also pressure in the outlet volume decreases due to lower pressure given by the compressor but very slowly compared with that of the compressor due the inertia of volume V2. As a consequence, at zero mass flow of the system, the pressure difference causes a flow inversion until a new equilibrium is found (Point 2). The pressure difference then slowly decreases and the operating point moves back towards zero mass flow. Even when this point is reached, the inertia of the compressor permits a brief continuation of the negative flow rate.The operating point then moves rapidly in the unstable part of the curve as flow reverses towards the stable equilibrium point at a slightly lower pressure than the Gravdahl point. The high positive mass flow rate fills the outlet volumes and empties the inlet, moving the operating point slowly up the performance curve. At this point an unstable region is encountered and the operating point rapidly moves towards stability. The cycle then repeats periodically with a frequency of 1.17Hz.From the previous basic description of the computed surge cycle it is clear that the proper capturing of both the pressure fluctuation during the surge event and the frequency are related to the pressure ratio at zero mass flow (Gravdahl point). In particular if the minimum point is higher the time spent in the stable negative part of the curve decreases and the frequency increases. Using the standard value suggested by Gravdahl (0.82 of the last stable point) the time spent in the negative region is 0.3s. With a value of 0.7 the time increases to 0.37s and the frequency decreases to 1Hz. In Figure 9 the analysis for point 3 is shown, characterized by a stable behavior provided that the initial position is located quite close to the equilibrium point. The model is able to capture the basic stability
properties of the system. In Figure 10 the pressure trends are shown for the operating point located close to the surge point (point 4 in Figure 3). The qualitative trend of both pressure fluctuations and frequency content is very similar to that observed for operating point 2. The oscillation frequency is correctly predicted at 1.17Hz, with power being overestimated. In the inlet section the amplitude of pressure fluctuations is higher: the main harmonic content is the same as the outlet section but with greater associated power of 6 [KPa]. In the computed spectrum the main frequency is captured as well as its second harmonics but the higher frequency content is low. It should be noted that the experimental peak at 5Hz is almost certainly due to acoustic propagation in the inlet, which can’t be captured in the simulation since the pipes are treated as a single volume.
Figure 5 – 1D Pipeline model
Figure 9 – Point 3: Pressure fluctuations and FFT

Case Histories23 - Newsletter EnginSoft Year 11 n°1
Results with Pipeline Model In Figure 11 the results obtained with the pipeline model for operating point 2 are reported and compared with experimental signal as done for the simplified model of Figure 7. The unstable nature of the equilibrium is captured with a computed harmonic at 1 Hz. This value is very close to the measured one 1.17Hz but slightly underestimated, possibly due to various approximations in the geometry of the system. The simplified model accounts for the compressor inertia by hydraulic inductance which is not present in the pipeline model and this can affect the surge frequency. The wave shape of the signal is closer to the experimental trends. It could be improved with a better knowledge of friction properties of pipes.Signal evolution across various sections of inlet volume are reported in Figure 12. Mass flow fluctuations are displayed for 4 points of the pipeline located between the control valve outlet (black curve) and the compressor inlet (red curve). The point located exactly outside control valve shows limited mass flow fluctuations. Only the 1Hz surge frequency can be seen and the flow direction is never inverted. The section located at compressor inlet experiences flow reversal with a time period of around 1s.
The intermediate points are located downstream of each one the three pipes connecting the valve to the compressor inlet: the harmonic of 6Hz becomes progressively more evident. The time required to travel the inlet pipeline (13.538m) and be reflected back is around 0.17s. The presence of friction causes a certain smoothing of the reflected wave but after 3 reflections the positive fluctuation is amplified by flow becoming positive again in phase with the reflected signal so the amplitude of fluctuation increases (resonance). In volume 2 the evolution of mass flow fluctuations downstream of the compressor is also shown, with the reverse flow region extending up to the cooler. This acts as an intermediate volume smoothing fluctuations in the mass flow upstream of the control valve.
ConclusionsTwo approaches for the simulation of surge transient have been compared: the simplified model proposed by Greitzer and a fluid pipeline approach. The first is a very simple but validated approach which allowed capturing basic surge dynamics and pressure frequency but misses the high order frequency content. The good match between test and model prediction indicates that both the compressor length and length-area ratio were correctly estimated. It is expected that the extension to more general systems and multistage compressors will require a certain tuning to match the frequency and amplitude of surge fluctuations and many works have been published about the topic.
The pipeline approach neglects the fluid inertia of the compressor, but is able to account for the presence of higher harmonics in pressure signals giving a more accurate time trend of pressure fluctuations. The pipeline approach can also provide indications about pressure propagation so that it is possible to identify the components more severely affected
by the surge event. Accurate descriptions of the phenomenon require good knowledge of pipe geometry and roughness and tuning the computation parameters.The 1D pipeline model offers more precise and detailed information than the Greitzer model. Moreover it provides detailed information in different points of the system, although the simulation requires more computational effort. This is not an issue when preliminary studies are performed since the computational time for one single run is a handful of seconds, but it could be an issue when this model needs to be linked to a control model, perhaps in a hardware-in-the-loop logic. Here the simplified Greitzer model or the creation of a meta-model based on the 1D pipeline model may be a better option.
Elisabetta Belardini, Dante Tommaso Rubino, Libero Tapinassi - GE Oil&Gas
Alberto Deponti, EnginSoft
Figure 10 – Point 4: Pressure Fluctuations and FFT Figure 11 – Point 2: Pressure fluctuations and FFT
Figure 12 – Mass flow evolution for Point 2

Case Histories Newsletter EnginSoft Year 11 n°1 - 24
Dealing with highly competitive markets is a constant battle. Being successful as a supplier often depends on the cost of production, delivered quality, time-to-market and sometimes also on product and/or process innovation.In this context, the challenge lies in the design phase and its crucial role in evaluating possible product and process solutions before the equipment and parameters are defined.The following case study presents the FE analysis of a multistage cold forging process of a heating pipe fitting made by Zoppelletto S.p.A. , which is a prestigious Italian company operating in the cold forged components market for more than 50 years. Cold forging process is the company’s core business and in these last 30 years the Zoppelletto has evolved rapidly from a craft manufacturer into an advanced industrial manufacturer, able to produce millions of specialist components and guaranteeing production to delivery in a short space of time. Production focuses on 5 principal sectors: thermohydraulic, oleodynamic, automotive, office chair and gates products. The high quality, reliability and product variety make Zoppelletto S.p.A. a star player in the world market. Company success is gained through the constant validation of internal competences and ensuring effective collaboration with customers and suppliers.The brain of this system is the technical department, which has at its disposal the latest CAD-CAM for the manufacture of work equipment and forging tools, internally developed and created Zoppelletto’s engineers. For the mass production of small or medium-sized components, multi-station automatic cold forging presses are being widely used. In cold-formed forging, initial materials are formed progressively to final shapes by automatic and synchronized operations,
including shearing, upsetting, forward and/or backward extrusion and piercing. The development of forging simulation software had brought the challenge of how best to introduce its use into forging companies. Its effectiveness introduction has required advances in the user-friendliness of the simulation software and its application to a wide range of problems. These capabilities include the precise control of material flow during forming, material savings, increasing tool life by means of optimizsation of pre-stressed dies, and development of profiled dies during forming that compensate for the elastic deformation of the tooling set. The traditional time-consuming and costly trial-and-error method has been replaced by increasingly sophisticated simulation software which can address the
Process simulation of multistage cold forging helps to reduce time-to-market and costs for a steel heating pipe fitting
Fig. 2 - (a) Forging tools used and (b-c-d-e-f) sequence of the four-stage cold forging process of heating pipe fitting

Case Histories25 - Newsletter EnginSoft Year 11 n°1
whole manufacturing process. In this paper, a process sequence for multi-stage cold forging is designed with a rigid-plastic finite element method to form a heating pipe fitting. The numerical model, carried out by using software Transvalor COLDFORM, includes effective strain distribution and forging loads, which are required for process design and defects prediction. The FE results are compared with those obtained in the real process and a very good agreement is observed. EnginSoft’s expertise and the Department of Management and Engineering at the University of Padua supported Zoppelletto S.p.A. in this study.
IntroductionCold forging process design is a process layout problem. Due to the variety of working procedures and the complexity of work-piece, it is very difficult to design cold forging process without the designer’s knowledge and experience.Because the choice of process plan affects the design, manufacture and maintenance of the dies, cold forging research emphasizes the improvement of this process planning. The design of a multistage forging process sequence involves the determination of the number of preforms along with their shapes and dimensions. The best design of preforming operations can be identified by their ability to achieve an adequate material distribution; this is one of the most important aspects in the cold-forging processes. Traditionally, forging-sequence design is carried out using mainly empirical guidelines, experience and trial-and-error, which results in a long process development time, and high product production costs. The use of computer-aided simulation techniques in metal forming before physical tests may reduce the cost and time of the process design. Many computer-aided approaches based on approximate analysis and empirically- established design rules have been published in literature.These techniques do not always provide detailed information concerning the mechanics of the process. However, the finite-element method has been shown to provide more accurate and detailed information, and thus has become widely used for simulating and analyzing various metal-forming processes.Finite element analysis (FEA) has become one of the most widely used engineering tools and has been adopted in practically all fields of industry due advances in both software capabilities and the availability of more
powerful computers. In addition, since FEA can simultaneously predict all the necessary stress-strain states in both die and work-piece, extensive applications of this method have been reported for large-scale deformation forging processes. Many researchers have focused on the effective strain, damage and flow patterns within the work-piece during cold forging processes. However, up to now, work on the process planning of cold forging has concentrated on rotationally symmetric parts. Work on non-axisymmetric parts has not been so actively pursued, due to difficulties of shape cognition and expression, calculations of the process variables such as forming load, effective strain, effective stress and so on.In this study, numerical simulations were carried out for the design of a cold forged heating pipe fitting used in thermohydraulic applications. The simulation was performed using the Transvalor COLDFORM software. A forging experiment of the heating pipe fitting was also carried out using the designed tool set. From a comparison of the results between the simulation and the experiment, it was found that the simulation showed good agreement with the experimental result.
Process description and modellingFig. 2 shows the sequence of the analyzed multi-stage non-axisymmetric cold forging process. The cold forging process-sequence to form the heating pipe fitting consists of four operations: preforming, first and second calibration and double deep backward extrusion.A 6300 kN multi-station general-purpose mechanical knuckle press and automatic workpiece transfer between stations is used. The cooling time of the workpiece was 2.86 s, which, for each stage, was calculated from the end of one forging operation to the beginning of the next one. The top dies in each forming stage and the bottom dies in the first and third operation are floating, and driven by the contact forces exerted during the forging process. Bottom punches are fixed during the forging process and act as workpiece extractors. The material used for the workpiece is a low-carbon alloy steel, whose chemical composition is listed in Tab. 1. Tools are assumed to be rigid with an infinite elasticity modulus and a constant temperature of 20°C. The heat transfer coefficient it taken as to 20 kW/m2. The die-workpiece interface is characterized by the constant factor friction law usually used for bulk metal-forming problems, t= mk. Here, t is the frictional shear stress, m is the friction factor, and k is the shear
flow stress. The shear friction coefficient (m) was set to 0.4.
Process sequence optimizationThe main objective of the process-sequence design in this study is to obtain intermediate preforms which produce a near-net-shape product. Also, design constraints, such as the limit of the press capacity and the avoidance of surface defects, should be satisfied.
As can be seen in the load-forming time relationship (Fig. 3a), the top punch load is almost constant at the beginning of the operation. However, immediately after the top die touches the bottom die, the punch load suddenly increases and reaches its maximum value at the end of the process.The maximum load in this process is 133
Tab. 1 - Chemical composition of C4C alloy used (wt.%).
Fig. 3 - Load - forging time curves of tools for the four-operation process: (a) preforming; (b) first and (c) second calibration; (d) double deep backward extrusion

Case Histories Newsletter EnginSoft Year 11 n°1 - 26
tonnes, which is less than the limit of the available press capacity of 642 tonnes. In the fourth operation, shown in Fig. 3d, a large deformation also occurs in the work-piece near to the walls of the punches and dies. From the load-forming time relationship (Fig. 3d), it is noted that the load applied to the dies increases steadily as the top punch moves forward. As expected, approaching the end of the operation this load becomes almost constant. In this stage, the maximum punch load is estimated to be 50 ton, which can be identified as the minimum value of the current four stage process. On the other hand, the maximum load on the top punch and the bottom die during the second calibration is 142 and 155 ton, respectively (Fig. 3b). During the third stage (the second calibration operation) the top punch doesn’t contact the work-piece, and therefore the maximum load revealed is zero. Moreover, due to the lower forging loads reached by the others tools in this third forging stage, the elimination of this operation is suggested . This gives a shorter development lead time, lower cost production, savings in tool material costs and the development of a higher precision part.
Defects evaluationDuring the preforming operation, the billet deforms asymmetrically and underfilling occurs. Underfilling problems are limited through the use of multiple forming stages. Fig. 4 shows the reduction of the underfilling areas (in blue) at the die corners obtained by the FE analysis, which is consistent with the experimental observation.By using FEM simulation, it was found that defects occur in each stage of the forming sequence. The numerical results coming from each forging stage are validated by means of experimental observations.In particular, during the second stage operation (calibration), a great amount of material flows to fill the area between the top punch and die, due to an excessive top punch stroke (Fig. 5).
Benefits of FE methodIn the “forming” process chain, the simulation of the forming process offers
substantial opportunities for improvement: for example optimizing the component and tools may provide opportunities to enhanced process reliability. The numerical simulation, carried out by using software Transvalor COLDFORM, could be extended in various directions in order to accommodate such new requirements.In metal forming, as mentioned above, process simulation is used to predict metal flow, strain, temperature distribution, stresses, tool forces and potential sources of defects and failures. In some cases, it is even possible to predict product microstructure and properties as well as elastic recovery and residual stresses.The main reasons for simulation are reducing time to market, reducing tool development costs, predicting the influence of process parameters, reducing production cost, increasing product quality, improving the understanding of material behaviour, and reducing material waste. These things are achieved by accurately predicting the material flow, determining the filling of the die, accurately assessing net shape, predicting if folds or other defects exist, determining the stresses, temperatures, and residual stresses in the workpiece, and determining the optimal shape of the preform.Also, as simulation allows us to capture behaviour that cannot be readily measured it provides deeper insights into the manufacturing process.There are several principal steps involved in integrated product and process design for metal forming. The geometry (shape, size, surface finishes, and tolerances) and the material are selected for a part depending on the functional requirements. The design activity represents only a small proportion (5 to 15 percent) of the total production costs of a part. However, decisions made at the design stage determine the overall manufacturing, maintenance and support costs associated with the specific product.
Once the part is designed for a specific process, the steps outlined in Tab. 2, lead to a rational process design. The application of the FE method in this complex cold forging process of a heating pipe fitting involves:• The conversion of the assembly-ready part geometry into a formable
geometry.• The preliminary design of tools/dies necessary to perform the
operations used for forming the parts.• The analysis and optimisation of each forming operation and
associated tool design, to reduce process development time and
Fig. 4 - Comparison between (a) analytical and (b) experimental evaluation of underfilling on stage 4 at final forming stroke. All front views are reported
Fig. 4 - Comparison between (a) analytical and (b) experimental evaluation of underfilling on stage 4 at final forming stroke

Case Histories27 - Newsletter EnginSoft Year 11 n°1
trial and error.• Manufacturing of tools and dies by CNC milling or by EDM or
another similar technology..
Ascertaining process-specific factors in production engineering by means of process simulation serves the efficient manufacture of products of specified properties.Three objectives are emphasised:• Review of the feasibility of an existing concept for the manufacture
of a product.• Assessment of product characteristic.• Enhancement of understanding as to what really goes on in a process
for the purpose of optimising the manufacturing technique.To achieve these goals, however, it only makes sense to use process
simulation if this is more economical in the long run than experimental repetition of the actual process.Focusing on a new product development chain of a multistage cold forged company’s component (Tab. 2), the actual time-to-market revealed is more than 4 months. Moreover, due to the company’s costly trial-and-error method, this time-to-market can increase exponentially (see red lines arrows on Tab. 2). Using the FE method, the company’s estimated time-to-market expected is less than 4 months (Tab. 3). In this case the traditional time-consuming and costly trial-and-error method has been replaced with a simulation-based approach using Transvalor COLDFORM that can now address the whole manufacturing process.The two approaches can seem similar if we look at the use of CAD\CAE design of tools instead of real trial-and-error on press machine, but it’s important to highlight that normally this trial-and-error step is the most time- and cost-consuming part of the traditional method of designing a new component. The number of “red” iterations needed to reach a good process can be very high if unexpected problems occur and this can have a great impact on the total time-to-market. As more simulation skill is developed in the company, the difference between the traditional approach and the FEM approach increases. This looks not only at man-hours, but also more deeply at other aspects of the cost of a new component. Completely removing the trial-and-error iterations saves the costs of trial tool production, so the time to recover the whole software and training investment decreases dramatically to some months (less than one year) depending on how widely this approach is adopted.Moreover, it is important to notice that one hours’ loss of production, due to a traditional time-consuming trial-and-error step, costs about 180-230 €. For this reason, Zoppelletto S.p.A. has decided to break with the traditional method of new product development and has committed to the use of the Transvalor COLDFORM software package to support their development process.
ConclusionsThe use of finite element methods as a tools within Zoppelletto S.p.A. results in cost reduction, time saving and improvements in product quality. The design of the deformation sequence and forging tools can be modeled before, and also during, production. This allows the engineer to identify process deficiencies easily, leading to cost and time savings. Such modelling efforts can be very valuable in identifying inhomogeneous deformations such as folds which could not easily be detected through regular visual inspection. Moreover, based on industrial experience, this approach is estimated to reduce the time required to set up new forging cycles by about 50%.
AcknowledgmentsThe author would like to thank Zoppelletto S.p.A., in particular Eng. Luca Zoppelletto, for giving information about the multistage cold forging process used to support this analysis. In addition, we want to thank Eng. Andrea Pallara and Eng. Marcello Gabrielli, EnginSoft S.p.A., for their interest in this work and helpful discussions, advices and suggestions.
Fabio Bassan, University of Padova Luca Zoppelletto, Zoppelletto - Marcello Gabrielli, EnginSoft
For more information:Marcello Gabrielli - EnginSoftE-mail: [email protected]
Tab. 2 - New product development of a multistage cold forged component using traditional method (five-stage forging process).
Tab. 3 - New product development of a multistage cold forged component using finite element method (five-stage forging process).

Newsletter EnginSoft Year 11 n°1 - 28 Case Histories
IntroductionThe already completed Atacama Large Millimeter/submillimeter Array (ALMA) is one of the largest groundbased astronomy projects ever built and currently represents the major existing facility for observations in the millimeter/submillimeter wavelengths. This radiation (between infrared light and radio waves in the electromagnetic spectrum) comes from the coldest and from the most distant objects in the cosmos and, being the Universe still relatively unexplored at these wavelengths, ALMA is expected to answer important questions about the cosmic origins.
Since millimiter and submillimiter radiations are scattered by the atmospheric water vapour, this kind of astronomy requires high and dry sites, otherwise the quality of the observation would be degraded. This is the reason why a very unique place has been chosen for the ALMA site: the 5000m altitude Chajnantor plateau, in the Atacama Desert (northern Chile), one of driest places in the world. Besides its scientific goals and the unprecedented technical requirements, the ALMA Observatory is therefore extraordinary because of the very specific, harsh environment and living conditions in which it is operated.
Most likely ALMA does not resemble many people’s image of a giant telescope, as it consists of 66 antennas that look like large metallic dishes (54 antennas have a 12m
diameter dish, the remaining 12 are smaller and have a 7m diameter dish). ALMA is indeed an interferometer, that is to say it will collect and combine the signals coming from each antenna of the array so to act like a single instrument.
The antennas are ultra-precise machines and represent one of the key elements of such a complex system. Although the mirror finish used for visible-light telescopes is not needed (for the operating wavelength ranging from 0.32 to 3.6 mm), the reflecting surfaces are accurate to within
25 micrometres. The antennas can besides be steered very precisely and pointed to an angular accuracy of 0.6 arcseconds (one arcsecond is 1/3600 of a degree). This is accurate enough to locate a golf ball at a distance of 15 kilometres.
In order to provide the telescope with a powerful “zoom”, the array can be arranged into different configurations whose diameter ranges from 150m up to 16km. For this reason the antennas are robust enough to be picked up and moved between concrete foundation pads by dedicated transporter vehicles without this affecting their performance.
Furthermore it is to be noticed that the antennas achieve their performance requirement without the protection of any enclosure, being directly exposed to the harsh environmental conditions of the high altitude
The key role of CAE in the development of the European ALMA Antenna
Fig. 1 - Antenna global FE model view

29 - Newsletter EnginSoft Year 11 n°1 Case Histories
Chajnantor plateau: with strong wind, intense sunlight, temperatures between +20 and -20 Celsius, possible snowfall, hailstones and severe seismic events. The European Southern Observatory (ESO) built 25 of the 12m antennas (with an option for an additional seven), with the AEM Consortium (European Industrial Engineering S.r.L., MT Aerospace and Thales AleniaSpace) that was in charge of the design, manufacture, transport and on-site integration of the antennas. Within the AEM consortium EIE played the role of design authority and was in charge of supplying various subsystems, including the apex structure, the subreflector mechanism, the linear drives, the encoder system, the antenna control system, the metrology system and the antenna thermal control system. Moreover EIE was responsible for the commissioning of the first three antennas.
This article is aimed at illustrating the key role of CAE techniques in the engineering workflow of the European ALMA Antenna, as wells as at showing how its challenging performance requirements have been met through the design process and afterwards experimentally validated.
The engineering workflowFigure 1 shows the engineering workflow of the AEM ALMA Antenna. CAD and FEM modelling represented the starting point and the core of the design process.
3D modelling is nowadays an essential tool in developing such a complicated system, as complex geometries have to be represented, interfaces and narrow design envelopes have to be respected, a large number of instruments, plants and equipments have to be housed on board and their accessibility have to be guaranteed. The CAD activities represented on the one hand the very first step in the conceptual and architectural design phases, on the other hand they provided with the necessary geometrical information all the other analysis and design tasks at first, then the manufacturing and control process.
The structural FEM activities were primarily aimed at carrying out the structural resistance verification of the Antenna and at providing data for subsequent performance verifications and other specific analyses.The Antenna global FE model had therefore to capture the overall static and dynamic behaviour of the Antenna and particularly its functioning performance. Despite it does not consist of a huge number of nodes
and elements, this model is quite complex as it represent a rotating structure and the mechanisms (i.e. the azimuth and elevation bearings and drives) have been represented by means of fictitious elements and equations that simulate their action. The Antenna has besides an hybrid structure: the base and the yoke being made of steel, the entire elevation structure being made of carbon-epoxy composites. The Antenna Global model is therefore made of several element types as it consists of beam, shell, multilayer shell, solid, spring and lumped mass elements. In order to obtain the required dynamic accuracy of the model, special attention has been paid to the model mass and to its correspondence with the design one. The mass of all non structural parts (like instruments, plants, mechanisms, counterweights etc.) have been taken into account by means of lumped mass elements.
If necessary, detailed models of parts and components have been prepared in order to perform accurate local verifications. Some examples are the connections between steel and composite parts, the lifting points, the hard stops supports, the drives supports, the locking pins supports, the receiver instrument flange etc.
Various operating scenarios have been taken into account and the Antenna behaviour have been analysed under operating, accidental, survival and transport conditions. Besides multiple antenna positions (with different combinations of azimuth and elevation angles) and dozens of load cases and load combination cases have been considered.
Among the considered elementary load cases: gravity, wind, thermal cases, seismic cases, Antenna motion (angular velocity and acceleration), transport accelerations and shocks, additional snow and ice loads, prestress due to misalignment.
The structural resistance of the antenna has been verified under all the considered loading cases; besides the stress verification, buckling and fatigue verifications have been performed too. Linear static, modal, spectrum, buckling and fatigue analyses have been performed.
Fig. 2 - Composite Receiver Cabin FE model detail – counterweights

Newsletter EnginSoft Year 11 n°1 - 30 Case Histories
The performance verification has been performed under the relevant operational cases and mainly consisted in monitoring the reflectors deformations and the receiver instrument position for subsequent surface accuracy and pointing error calculation through dedicated algorithms. Then the Antenna error budget has been performed by combining this information with other error contributions due to manufacturing, alignment operations, measurement, aging etc.
The FE model of the Antenna was also aimed at determining the transfer functions to be implemented in the Antenna Metrology System and in the Antenna Control System. The Metrology System is able to partly compensate the Antenna deformations due to temperature variations and wind loads by acting on its azimuth and elevation angular positions. In order to do that the temperature field across the antenna structure is monitored by 100 thermal sensors and the yoke arms inclination is monitored by two custom designed precision tiltmeters. The correlation matrix between the measured temperature field or the measured tilt and the angular corrections to be produced have been calculated through a campaign of FE simulations.Similarly the transfer function to be implemented into the Antenna Control System as well as into the servo model to simulate the behaviour of the system when subjected to dynamic loads has been derived by the Antenna FE model.
Wind and thermal loads to be implemented in the structural FEM have been assessed through dedicated CFD and thermal analyses.The Fluent family codes (Gambit, Fluent) was used for the CFD analysis. First a large number of steady state analyses has been performed in order to evaluate the air flow field generated by the atmospheric wind and to calculate the pressure load acting on the external Antenna surfaces. The analyses were performed under steady state conditions using a Reynolds
averaging approach; the closure of the model was obtained by implementing the Spalart-Allmaras model to describe turbulence phenomena. This set of analyses has also been used to evaluate the external heat transfer coefficients of the Antenna, which have then been used as input data for the Thermal model.
Calculations have been performed in accordance to the specified environmental conditions (in terms of wind velocity, ambient pressure, altitude, temperature); a total of 32 cases have been examined with various azimuth and elevation angle combinations, at two different reference wind velocities (namely 9.5m/s for the operational cases and 65m/s for the survival cases). The geometrical model of the antenna was derived by the CAD model.
Two different criteria of applying pressures for structural calculations have been compared: one refers to a quasi
static equivalent wind, the other to the average wind level plus its variable component. Results showed that the quasi static approach was conservative as the random dynamic wind component did not concern any resonance frequency of the Antenna. Finally unsteady analyses have been performed so to evaluate the vortex shedding induced on the Antenna under operational conditions. Results showed a 0.2Hz maximum vortex shedding frequency, while the first natural frequency of the Antenna is about 9Hz.
A complete and detailed thermal model of the Antenna has also been implemented, properly simulating all the involved heat transfer phenomena. Two different kinds of analysis have been performed: steady-state and transient, which respectively have constant and variable environmental conditions. Solar flux, ground and air temperatures, wind direction and intensity have been derived from the meteorological data recorded at the Chajnantor site across a five years period. No criticalities have been evidenced from the analyses results.Besides being aimed at providing the structural FE model with temperature input data, these analyses were aimed at demonstrating that the design fulfilled all the thermal requirements and to investigate some specific issues. As an example the secondary reflector overheating, for the Antenna being in fact a “solar concentrator”.
Fig 3 - FEA results – Displacement plot
Fig 4 - CFD results – Air flow pathlines

Case Histories31 - Newsletter EnginSoft Year 11 n°1
Structural FEM model validationThe FEM model has been finally validated through an onsite test campaign on the complete Antenna. Four different tests have been performed in order to investigate (i) the secondary reflector displacements due to gravity, (ii) the Back-Up Structure (BUS) behaviour, (iii) the steel structure behaviour and (iv) the modal behaviour of the Antenna. Experimental results have then been compared with the relevant FE model predictions. The test procedure is briefly surveyed in the following.(i) The secondary reflector have been monitored by installing a laser tracker at the centre of the BUS and by measuring the position of a series of reference targets opportunely placed on the structure. Particularly the displacement along the cross-elevation axis and the tilt have been measured along the entire elevation angle range of the antenna.(ii) A complete BUS (that is the structure which supports the primary reflector panels) has been tested after on site assembly. Loads have been applied by hanging concrete blocks at two of the four interfaces to the secondary reflector supporting structure and have been increased by steps up to 4000N on each side. The BUS deformation have been monitored again by means of a laser tracker that measured the position of a series of reference targets opportunely placed on the structure.(iii) The steel structure behaviour has been investigated by performing a pull test. The pulling action has been exerted by a tractor through a rope attached with a belt to top end of the Yoke arm; the rope has been tensioned by means of a tilfor, loads have been measured by a dynamometer. The structure response has been monitored by means of a series of inclinometers; an additional inclinometer has been placed close to the Antenna Base in order to check also the behaviour of the foundations. The pulling force has been increased by steps up to 10000N. This test have been performed on the two arms, both separately and simultaneously.(iv) The modal behaviour of the Antenna has been investigated by determining the azimuth and elevation close loop and open loop transfer functions. During these tests the two axes of the Antenna have been excited separately at various frequencies so to point out their relevant resonant frequencies. These values have
been compared with the FE determined natural frequencies of the system.Considering the uncertainty of the experimental measures - which is due to the measurement system errors, to the uncertain boundary conditions and to the fact that all the tests have been performed in the external environment rather than in a precision laboratory - and considering also the approximation of the FE model, an up to 20% deviation between the FEM predictions and the experimental results would have been a satisfactory result.For both the Subreflector (i) and the Steel Structure (iii) tests, the difference between the measured and the calculated values was found to be well below the 20%; in addition to this, the experimental and the numerical deflection / load curves exhibited the same trend. Similarly a 7% maximum difference was found between the experimental and the calculated values of the Antenna natural frequencies (iv). The BUS deformation (ii) was the only test that showed an experimental - numerical
results difference slightly over the 20%. It is yet to be underlined that the real BUS resulted to be stiffer than calculated; this confirming that the modelling approximations were on the safe side.As a conclusion, on site experimental results were found to be in good accordance with the calculated ones, this demonstrating the reliability of the FE model and more in general corroborating the entire design and engineering process of the Antenna.All the 25 European ALMA Antennas passed the customer acceptance tests and are currently operating at the ALMA observatory, thus crowning more than ten years of engineering efforts.
Gianpietro Marchiori, Francesco Rampini, Stefano Mian – EIE GROUP
For more information:Lisa Maretto – EIE [email protected]
Image at the top of the article: courtesy of EIE GROUP.
Fig. 6 - Natural frequencies experimental evaluation
Fig. 5 - M2 – M1 differential cross elevation displacement, numerical and experimental results

Case Histories Newsletter EnginSoft Year 11 n°1 - 32
The fluidized bed reactors are widely used in chemical, mining and pharmaceutical industries and energy applications because of the low pressure drop, the uniform distribution of temperature and of high-speed mass transfer of energy and speed. Fluidization behavior depends on the reactor geometry and internals as well as the particle size distribution and physical properties of the powder.This paper presents a 3D fluid dynamic simulation of a fluid bed reactor for the pharmaceutical processing of powder, such as mixing, granulation and drying. Firstly, sensitivity analyses based on a literature test-case were performed, for the validation of the computational model and the development of the additional components required for the simulation of the real fluid bed reactor. Then an URANS 3D simulation of a modular laboratory-scale fluid bed reactor, product of IMA S.p.A. Active Division, was performed to evaluate the velocity field and particle distribution of the powder involved in the mixing process.
IntroductionThe evaluation of the fluidization efficiency is determined through the behavior of the gas inside the reactor (distribution of the solid particles). Since the material in the bed (solid phase) is typically opaque in gas-solid systems, it is difficult to obtain detailed local data for the entire section of the bed. As the fluidization is a dynamic process, the methods of invasive monitoring can affect the whole internal flow, reducing the reliability of measurements. Currently, non-invasive monitoring techniques include electric tomography, computerized ultrasound, x-ray or computed tomography stereography. In particular, for combustion or pyrolysis
and gasification processes the fluidized bed reactors are central components and in this case the obtaining of experimental data is also affected by the high temperatures of the process. The design in commercial-scale fluidized bed reactors often depends from the experiments carried out on a scale model which however is quite expensive and difficult to configure. For these reasons there has been an increasing in the use of computational fluid dynamics, in order to complete the design of fluidized bed reactors. However, also the CFD simulation is quite complex because it entails multiphase flows and the solution of transport equations for each of the phases involved. Most of the CFD studies of fluid bed reactors in literature are based on 2D-simulation and this is mainly due to a lack of resources needed to generate the computational grid and to perform the calculation of a 3D numerical simulation.The object of the study is the 3D simulation of a packed fluid bed reactor composed of inert powder as solid phase and air as gas
CFD analysis of a fluidized bed reactor for industrial application
Table 1- Simulation set-up parameters

Case Histories33 - Newsletter EnginSoft Year 11 n°1
fluidizing phase. The aim of this work is the evaluation of porous models within multiphase simulations, through the velocity fluid field and powder distribution in a laboratory-scale real geometry fluidized bed reactor, in order to determine the possible simplification of the whole geometry of the fluidized bed to obtain useful information about the velocity field in the air distributor.
CFD simulation of the test-case: sensitivity analysisA 3D CFD simulation permits to investigate various characteristics of the fluidization process: the bubbling behavior, the hold-up of the solid phase and its volume distribution, the velocity field within the reactor. A literature test-case was choose to perform a simulation campaign with ASYS Fluent 13.0, in order to correctly setup the simulation of a real fluidized bed reactor. The paper considered is by Chen et al., 2011, “A fundamental CFD study of the flow field in gas-solid fluidized bed polymerization reactors”, that shows the trend of the fluidized bed for a simple 2D plane geometry 0.33 m width and 0.9 m height in the case of variation of the numerical models and parameters, the boundary conditions, the particle size and the shape of the distributor.Starting from the work of Chen et al., a 3D domain with the same dimensions was realized and used as a test-case domain for the sensitivity analysis on i) the drag law of the solid phase, ii) the solid particle dimensions and iii) the inlet gas phase velocity, in order to compare the results of the 2D and 3D simulation. The setting parameters of the simulations are reported in Table 1.
The results analysis pointed out that the 3D simplified model and the 2D model validated by Chen were comparable to the macroscopic level, in terms of solid volume fraction distribution and bed expansion. Then a sensitivity analysis of the model parameters and operational setting was performed to find the most appropriate simulation setup for a
simplified numerical domain. In particular, Figure 1 shows the distribution of the solid volume fraction at time step 0.25 s and 0.75 s, plotted on the longitudinal plane. The force acting on the particle increases as the fluidization gas velocity increase, determining the increase of bubbles and bed expansion (Figure 1 a); the maximum bed expansion occurs at 4 s, then the solid phase falls down on the distributor. The triangle distributor causes a faster fluidization (Figure 1 b), because of the change in the velocity direction, therefore the fluidization time decreases and at the same time bed expansion is lower.
Modelling of porous domainsAs in a real case of fluidized bed reactors systems for the powder sustaining and filtration in inlet or outlet are usually required, the 3D simplified domain was used for the characterization of a metallic net for the product sustaining and an air filter placed at the domain outlet for the gas phase cleaning. The
metallic net and the air filter were both simulated as porous domain using the Porous jump option of the Fluent solver based on the Darcy’s law: inertial and viscous terms were set according to the pressure drop curves determined by the manufacturer and then applied to the designed domains respectively. For the simulation set-up data reported in Table 1 were used.
Figure 2 shows the simulation results of the case with the metallic net and the air filter: the solid volume fraction distribution demonstrates that the metallic net domain can sustain the product and the air filter can stop the product before the exit section.
A fluidized bed reactor for granulation and dryingGhibli is a laboratory-scale modular bubbling fluidized bed, produced by IMA S.p.A., it is used to perform drying, granulation and agglomeration of the powder, before the tablet compression phase. The fluid bed has a metallic net for the product sustaining and air distribution, and air filters placed at the top of the bed for air cleaning before the exit section. The air enters from the bottom of the fluidized bed through the metallic net, fluidizes the product and leaves the filters in which the product stops. A comprehensive study of the product fluidization is essential for the good design and manufacturing process
Figure 1 - a) variation of the air inlet velocity; b) comparison between distributor’s geometries
Figure 2 - Test-case with porous domains (metallic net and air filter)

Case Histories Newsletter EnginSoft Year 11 n°1 - 34
and CFD simulation permits to evaluate the solid phase hold up, the speed of mixing and heat transfer, leading to a good mixing of the phases.The CFD analysis was performed on a non-commercial model of Ghibli fluidized bed for laboratory testing and experimentation. The simulation parameters are reported in Table 1 and the data coming from the test-case former analyses were used. A URANS simulation of 25 seconds of Total Time was performed.The simulation demonstrated the possibility to obtain precise informations about the behavior of the fluidized bed in time. For example, from Figure 3 it can be noted that the solid phase distribution affects the air velocity field within the air inlet and the mixing zone, while Figure 4 shows the behavior of the fluidization until the time 25 s. Furthermore, the filtration zone have been analyzed in order to evaluate the filters efficiency (Figure 5).
ConclusionsA test-case on a simplified gas-solid fluidized bed was realized for the multiphase model set-up and validation. Then, two porous domains have been added to the test-case in order to simulate the metallic net for the product sustaining and air distribution and the fabric filter, which are fundamental elements for the laboratory-scale fluidized bed geometry simulation.
The simplified 3D model gives macroscopic results similar to the 2D validated case and demonstrates the receptiveness of ANSYS Fluent 13.0 to the variation of model parameters and geometry within multiphase simulations. The simulation of the laboaratory-scale model of fluidized bed geometry was very useful to evaluate the velocity field in the air distributor and the possibility to obtain a reduced geometry model suitable for the CFD analysis. In fact, this type of simulation requires high computational effort and it is recommended to define a strategy to reduce it.
Michele Pinelli, Luca Pirani, Anna Vaccari - University of Ferrara
Nicola Gandolfi, IMA Active
Figure 3 -Air velocity and solid phase distributions on the longitudinal plane of the laboratory-scale fluidized bed reactor
Figure 4 - Solid phase distribution and air patterns within the laboratory-scale fluidized bed reactor
Figure 5 - Solid phase and air distributions on the filters of the laboratory-scale fluidized bed reactor

35 - Newsletter EnginSoft Year 11 n°1 Case Histories
Splashing regime in three-dimensional simulations of oblique drop impact on liquid films
Ice formation on aircraft wings and nacelles causes loss of lift, increase of drag and consequent reduction of aircraft maneuverability. Therefore, ice accretion is a high risk factor for aviation safety and it has a considerable economic impact on the operating costs of an air fleet. For these reasons, a keen interest has developed in the research of numerical methodologies which enable the prediction of ice formation and accretion on aircraft
surfaces. An important aspect of this analysis is the dynamics of the water drop impact on a liquid layer.Despite the large number of published studies, post-impact drop dynamics is far from being understood mainly because of the inherent complexity of the physical phenomenon and the large number of external parameters which influence it. The most relevant dimensionless groups are the Weber number (We= DV2/ ), the Reynolds number (Re= *D*V/μ) and the Ohnesorge number (Oh= μ/( * *D)1/2), where , μ and are the
drop density, dynamic viscosity and surface tension, D and V are the drop diameter and velocity.When a drop impinges on a thin liquid layer (where the ratio of the liquid layer thickness to the drop diameter is much less than 1) it can either spread over the free surface (spreading) or can create a structure with the shape of a crown (splashing). The transition between the two dynamics is still unclear.
Most of the numerical studies available in literature dealt with simulations of normal drop impact, while oblique drop impacts were simulated only under two-dimensional approximation. In this paper, three-dimensional numerical simulations of a water drop on a thin water layer are presented.
Numerical methodThe Volume-Of-Fluid (VOF) method was used to solve the two-phase flow of the drop impingement onto liquid film.
Fig. 1 - Break-up of the interface: initial condition (left); after first two steps of refinement (right)
Tab. 1 - Maximum resolution achieved in each case

Newsletter EnginSoft Year 11 n°1 - 36 Case Histories
Thermal and mass exchanges between the phases are not taken into account. A dynamic grid refinement technique was used. At each refinement step the edge of the cell is subdivided into two halves in every x-y-z direction, so that eight new cells are inserted in place of the initial one. The cells marked for refinement are those containing the interface, which are those with a volume fraction of the dispersed phase between 0 and 1. The initial grid was coarser than the final one and the first refinement steps destroyed the interface as shown in Fig. 1.
To ride-out this problem, the solver code was modified. The new procedure allows the application of initial conditions after few refinement cycles. In the meantime, the solution is not exported. At the end of this stage, the time is reset and the solution can be saved.
Numerical resultsThe numerical simulations presented here focus on oblique drop impact on a thin water layer, covering a range of impingement angles from 10° to 90°. The impingement angle is formed by the direction of the drop velocity and the free surface. Only one half of the whole problem is simulated using the symmetry along the xy plane. The liquid film is constrained by three side walls and a lower wall located at y=0. The distance between the drop center of gravity and the center of the film surface is 2.5D in all simulations. The dimensionless film thickness (the ratio between the film thickness and the drop diameter) was equal to 0.116.
The longitudinal dimension of the computational domain is variable since the evolution in this direction reduces as the impingement angle increases. The domain extends to 3.58D in both y and z directions to avoid interaction between the
Fig. 2 - Liquid volume fraction ( ) with Ux>1/5 Vx
Fig. 3 - Liquid volume fraction ( ) with Uy>1/5 Vy

Case Histories37 - Newsletter EnginSoft Year 11 n°1
evolution of the impact and the walls. The initial grid was made of 46080 hexahedral elements (80 x 24 x 24). To perform a grid refinement study, three different refinement levels equal to 2, 3 and 4 are used. The maximum resolution achieved in each case is shown in Tab. 1.
The dimensionless time ( = t*V/D) is equal to 10 in all cases. Four Weber numbers equal to 250, 437, 598 and 750 are considered. The first three numbers correspond to impacts at low velocity. The latter is typical of aeronautical problems. The numerical simulations at Weber number equal to 250 were taken as reference cases for grid convergence assessment. For each discretisation the liquid volume fraction with a velocity higher than one fifth of the impact velocity was computed. Fig. 2 and Fig. 3 refer to the velocity component along the longitudinal and the normal direction, respectively. For clarity, just four cases are shown. From Fig. 2 it is evident that at low impingement angles (
overlapping behavior, while at high impingement angles ( >40°) they are overlapped only for the first moments after impact. The impact at 20° and 40° generate particular structures and regions of perturbation, and their evolutions are difficult to characterize along the direction perpendicular to the free surface. This explains the differences between the refinement levels in Fig. 3. The impacts at 60° and 80° produce a well-defined crown and Fig. 3 shows that refinement level 3 and 4 have the same behavior. From this comparison it can be said that a good grid convergence is achieved even if complete convergence is not yet reached.Figures from Fig. 4 to Fig. 8 show the liquid-gas interface for impacts at 10°, 20°, 40°, 50° and 60°. The initial dimensionless time 0 is the time at which the drop impacts the free surface. Fig. 4 and Fig. 5 show that after the drop impacts the free surface at an impingement angle of 10° and 20° there is the development of a ship’s prow-like structure. At 40° (Fig. 6) some waves wrinkle the free surface of the liquid film producing a complex perturbation region. At higher impingement angles, a crown generates after
the impact. The higher the impingement angle, the more symmetric is the shape of the crown. From the results, it can be said that 40° is the angle which defines the transition between the two configurations, the prow and the crown, of the structure that generates after the impact.
ConclusionsA numerical investigation on drop impacts with non-normal trajectory on thin liquid films was presented. A dynamic grid refinement technique was used in the three-dimensional numerical simulations. Monitoring the volume fraction of liquid with a velocity higher than a chosen reference, a grid convergence assessment was studied. A good grid convergence was achieved. An important result is the detection of a transition angle. Indeed, it was found that at 40° there is a change of the shape of the structure generating after the impact: for values of the impingement angle lower than 40° it generates a ship’s prow-like structure, while at higher values it produces a crown which tends to a symmetric shape as the angle increases.
For more information:Paola Brambilla, [email protected]
Fig. 4 Evolution of the impact at an impingement angle equal to 10° and at We = 250.
Fig. 5 Evolution of the impact at an impingement angle equal to 20° and at We = 250.
Fig. 6 Evolution of the impact at an impingement angle equal to 40° and at We = 250.
Fig. 7 Evolution of the impact at an impingement angle equal to 50° and at We = 250.
Fig. 8 Evolution of the impact at an impingement angle equal to 60° and at We = 250.

Newsletter EnginSoft Year 11 n°1 - 38 Case Histories
Gear transmission systems possess strongly nonlinear characteristics which make their modeling and design a laborious task. In the latest version of the Dynamis solver a new gear-pair element was introduced. This element is designed to include gear backlash, meshing stiffness, transmission error properties and bearing stiffness nonlinearities. The optimal design of these various properties was facilitated through a seamless coupling between modeFRONTIER and Dynamis which enabled the automation of the design and simulation process. Finally, the MultiLevel Dynamic Substructuring method (MLDS) of Dynamis enables the development of high accuracy fine-mesh gearbox models. The MLDS method delivers a residual structure that possesses drastically smaller size , without sacrificing numerical accuracy. This increases the efficiency and speed of dynamical computation and facilitates multiple design evaluations during optimization.
Technical Problem The geared mechanical systems consist of gear pairs which are supported by a pair of flexible shafts (Fig. 1), which in turn are supported by the flexible engine block. In this model, the action due to gear contact and meshing is represented by an equivalent spring, whose stiffness depends on the relative position of the two mating gears. The form of this gear mesh stiffness is periodic and deviates significantly from its average value, as shown in Fig. 2. Dynamis provides a completely automated procedure to dynamically analyze this mechanical system examined and therby determine periodic steady state response spectra and provide a thorough investigation of the main effects due to the gear meshing action on the response. The gear shafts and the gearbox superstructure were modeled by finite elements and the gear-pair action was modeled as a single element using an appropriate lumped mass model (LMM) employing two rotating rigid disks.The gear meshing force is reproduced by a combination of a spring
and a damper (kg, cg). The inclusion of the helical and the normal pressure angles is achieved by introducing appropriate angles in describing the orientation of the connecting spring and damper. In addition, the spur gear-pair case is obtained by setting the helical angle equal to zero ( =0). The gear-pair contact is modeled by an equivalent spring, whose stiffness depends on the relative position of the two gears, as shown in Fig. 2. This form of the gear mesh stiffness creates a periodically varying forcing on the supporting structure, which produces periodic long-term dynamics.
In the full finite element model one can determine points such as the bearing elements and the monitoring points. The Dynamis MLDS method has the ability to exclude such points from its substructuring procedure through a suitable coordinate transformation and the nonlinear terms of the system are preserved and added in the final stage of the process. More specifically, the number of degrees of freedom of the system was reduced from 6 million to 165. This dramatically accelerates computation time without sacrificing accuracy in the numerical results, as shown in Table 1.
Design Optimization of Gear Transmission System with Nonlinear Properties
Figure 1 - Gearbox Shafts

Case Histories39 - Newsletter EnginSoft Year 11 n°1
Additionally, Dynamis provides the unique feature of Nonlinear Frequency Response Analysis (NFRA), which can be easily combined with the MLDS method, increasing the computational efficiency and speed. This facilitates the direct determination of periodic motions resulting from the gear mesh imposed periodic excitation. In fact, complete branches of periodic motions of the system examined were obtained by varying the fundamental forcing frequency through the application of proper numerical techniques.
Numerical ResultsA complete dynamic analysis of the prescribed model was performed. The most important findings are summarized in the following subsections.
DynamicsWhen a periodic gear mesh stiffness is employed in a model, classical harmonic analyses cannot compute the frequency response spectrum. Dynamis possesses a unique capability for such calculations, and even for performing Nonlinear Frequency Response Analysis (NFRA). Sample frequency spectra presenting node acceleration results and bearing forces are presented in Figure 3. The frequency response results derived from the analysis
performed are not harmonic but periodic. Therefore, using these results, waterfall spectra can be plotted by applying Fast Fourier Transformation. These plots are of great importance especially in acoustics analyses because they describe the vibration energy distribution within the frequency spectrum. Figure 4 presents some selected results of waterfall spectra.
OptimizationA multi-objective and multi-disciplinary optimization is design process using modeFRONTIER was explored, with input parameters such as meshing stiffness amplitude and variation, backlash properties and output parameters such as acceleration on selected points of the gearbox surface and forces on the bearings. Since Dynamis can also use ASCII input/output files it allows for a straightforward integration into a modeFRONTIER workflow. This was based on the use of a DOS Batch Script node to execute Dyanmis, preceded by an input file node to modify the model and followed by an output file node to extract the results. Five input parameters controlled the mass and force characteristics of the gear pairs in predefined ranges. Six output parameters for acceleration and forces are minimized. A full factorial DOE populated the design space with an initial 32 designs. The calculation of these 32 starter designs took only 2 hours on a single Xeon 3.6 GHz CPU. Response surfaces for all parameters were then created from these 32 designs using Kriging for the interpolations.
MOGA II was used to search these resulting response surfaces for minima. A scatter chart summarizes the optimization results and displays suitable candidates on a Pareto front. Both the RSM interpolations and the search for minima take only seconds. Since the chosen candidate is derived from a virtual optimization, the results need to be verified with a real simulation. The optimization application resulted in a reduction of 83 % for accelerations and 43 % for forces with respect to the nominal candidate.
Figure 2 - Gear Pair LMM Modeling in Dynamis
Table 1- Substructuring acceleration
Figure 3 - Frequency response results

Case Histories Newsletter EnginSoft Year 11 n°1 - 40
ConclusionsA seamless design and optimization procedure for gear transmission systems under dynamic loading has been demonstrated by integrating Dynamis with modeFRONTIER. In this model, the housing of the gearbox was modeled by using finite elements, while the essential effects of the gear-pair, the bearings and the shafts are taken into account via nonlinear modeling.In summary, the following unique features of Dynamis were used in seamless coupling with modeFRONTIER:• The gear-pair force element, which includes variable angle
meshing spring and damper forces (kg, cg), along with helical and normal pressure angles.
• The Multilevel Dynamic Substructuring Method (MLDS) to enable the use a fine mesh gearbox model.
• The Nonlinear Frequency Response Analysis (NFRA) for performing periodic steady state analysis of the coupled model with periodic gear mesh stiffness.
All features provided a seamless process, using a single solver for performing all the structural dynamic analyses and reducing the calculation time, so that a significant impact was achieved on the overall design process.
Christos Theodosiou, Anestis IakovidisDTECH Corporation SA
Stavroula Stefanatou, Johannes HeydenreichPhilonNet Engineering Solutions
Figure 4 - Sonogram and waterfall spectra
Figure 5 - modeFRONTIER workflow and RSM surface
About DTECHBased in Thessaloniki, Greece, DTECH (Dynamical System Technologies) Corp. S.A. is a consulting company offering simulation-based accurate and reliable solutions to mechanical and structural recurring problems of the automotive, railway, aerospace, marine and civil engineering sectors. DTECH’s expertise and knowledge include linear and non-linear vibrations, structural and multi-body dynamics, stability, optimization, reverse engineering, fluid-structure and ground-structure interaction.
DTECH develops its own software suite, known as DYNAMIS, covering the above FEM-based applications, and offering distinctive advantages such as the interface to/from MSC-Nastran, and an advanced model order reduction approach to both linear and non-linear problems.www.dtech.gr
PROJECT MANAGEMENT Il corso si propone di far acquisire e
quadro metodologico di riferimento
chi è coinvolto come risorsa su
e per gli altri corsi in calendario:
CORSO DI FORMAZIONE

41 - Newsletter EnginSoft Year 11 n°1 Case Histories
Competition in the automotive industry imposes a constant improvement of vehicles and vehicle development process. Improvements can be achieved through innovations and optimization and by reducing development time and costs. In order to improve the vehicle suspension system development process, this research is focused on the use of the optimization methods in the conceptual phase of vehicle development. Even when considering only vehicle dynamics, vehicle must meet various requirements. These requirements are related to stability, handling and ride comfort and they are often conflicting. Thus, the task of the designer is to find a suitable compromise.Although design process is and probably always will be based on designer intuition, dynamic simulations and optimization tools can provide significant improvement in the process itself. Using dynamic simulation tools, real driving conditions can be simulated in a virtual environment, meaning that many problems can be predicted and many deficiencies can be resolved at early development phase. Simulation models are used to predict the behaviour of the vehicle and its subsystems and to understand the influence of main parameters on vehicle behaviour. The next logical step is the ability of optimization of parameters with the goal to improve the behaviour of vehicles still in a virtual environment. Due to the existence of many influential parameters, complex and often conflicting objectives related to different aspects of vehicle dynamics, suspension system development process is a challenging multi-objective optimization task. Also, this is a multi-disciplinary task which presents a computational and modelling challenge.
Optimization modelMost of optimization problems in the development of vehicles are multi-objective and often include several conflicting objectives. Instead of one global optimal solution, there are usually numerous solutions for these
problems on Pareto front. The goal of any optimization algorithm is to generate a Pareto front that is uniformly filled, close to the theoretical Pareto front and completely stretched between the edges of objective functions space. In numerous papers evolutionary algorithms have been evaluated as a robust algorithm that can manage a large number of objective functions, can provide wide Pareto front and to achieve the desired convergence. These algorithms are imposed as a good choice for this problem. The goal in research was to develop of a multi-objective optimization model, capable of handling a large number of variables, constraints and objectives, by using modern evolutionary algorithms and vehicle dynamic simulation tools. Also, the intention was to analyse suspension system within the framework of complete vehicle. This research was focused on the integration of simulation tools for the analysis of the suspension system kinematics and of vehicle dynamics into multi-objective optimization tools. The basic concept for software packages interaction is shown in Figure 1.
The full vehicle model was built in CarSIM, which is one of the most used software packages for dynamics simulation of complete vehicle. The CarSIM math models cover the entire vehicle system and its inputs from
Multi-objective Optimization in the Conceptual Phase of Low-floor Minibus Development
Figure 1 – Interactions between simulation and optimization tools

Case Histories Newsletter EnginSoft Year 11 n°1 - 42
the driver, ground and aerodynamics. CarSIM suspension system model defines only kinematic characteristics of the suspension, such as gradients or curves, data of suspension and wheel parameters (camber, toe, caster, etc.) related to the vertical motion of the wheel. This type of modelling approach is suitable for fast simulation, but does not provide insight into the suspension system geometry or the position of the suspension system hard points. Lotus Suspension Analysis, a kinematics analysis program, is used to generate kinematic curves using suspension system hard points data. Its camber, caster, toe, and other kinematic curves are implemented in CarSIM model. In such way, the suspension kinematic was made interchangeable in term of optimization.Before coupling CarSIM and Lotus with modeFRONTIER, simulation tools were evaluated by simulating the driving performance of a vehicle from series production with known test results. The comparison between the simulation and the test results demonstrated good consistency. Some other necessary steps lead to the development of optimization models. These steps are identification of influence parameters, selection of criteria for the evaluation of vehicle dynamic characteristics and selection of optimization algorithms.
Influence parameters (input variables) are x, y and z coordinates of characteristic hard points of the suspension system, which define suspension geometry, and characteristics of the spring and the shock absorber. Test procedures or manoeuvres simulation results are the basis for the evaluation of dynamic characteristics of vehicles (output variables). There are different tests for the assessment of stability, handling and ride
comfort of vehicles. The goal is to use several manoeuvres to assess a specific dynamic behaviour of a vehicle, and each manoeuvre requires the evaluation of different dynamic characteristics. Some of the test procedures are standardized; required or recommended by different competent authority.Four different optimization algorithms are chosen for the optimization. Genetic algorithms NSGA-II and FMOGA-II, as well as (μ/ , ) evolutionary strategies, are chosen from class of evolutionary algorithm. For the purpose of results comparison deterministic optimization algorithm NBI-NLPQLP is chosen.
Optimization of minibus suspension parametersThe goal was to determine optimal suspension system parameters of low-floor minibus. This vehicle type should be produced in the low series production, concept development should be accomplished with virtual environment and physical prototypes should be avoided. Important task is the selection of reasonable initial values of parameters for simulation and optimization process. In the automotive industry, this is mostly based on historical data from previous or similar vehicles. The task is especially critical for completely new concepts. In the case of low-floor minibus, initial values are obtained by conventional engineering approach to vehicle development.
Depending on the vehicle class there are various test procedures defined to give the comprehensive figure of the real driving performance. For this research, 10 test procedures are used simultaneously to evaluate stability,
handling and ride comfort of the low-floor minibus (Table 1).For 10 simulated test procedures 42 objectives were defined. Definition of objectives and constraints in the example of double lane change test procedure is shown in table 2. A double lane change, typical handling test procedure, can provide valuable information about the handling of a vehicle in a highly transient situation. This is a path following (avoidance) manoeuvre that frequently occurs in the real world. Handling is measured in terms of lateral offset from design path, roll, yaw, yaw rate or lateral acceleration.
Figure 2 – modeFRONTIER workflow
Figure 3 – Input variables in optimization process
Table 1 – Relevant test procedures
Table 2 – Double lane change test procedure – objectives and constraints

Case Histories43 - Newsletter EnginSoft Year 11 n°1
ResultsIn the comparison of the algorithms, the best results were achieved with the FMOGA-II algorithm, which reached the convergence after 300 iterations and provide the shortest computing time. Besides that, FMOGA-II algorithm also provides the greatest number of solutions that meet the requirements while maintaining great diversity of solutions. Between the proposed evolutionary algorithms, FMOGA-II algorithm show the best fit to the results of deterministic method (NBI-NLPQLP) in approximating Pareto front. During the results analysis some results were taken and analyzed thoroughly. Three configurations close to the Pareto front, obtained by using optimization model, were compared with initial configuration (solution obtained by conventional engineering approach to vehicle development).On the double lane change test procedure, the lateral offset from design path was reduced (Fig.5 )Fishhook test procedure is related to the analysis of vehicle handling and stability. Primary, the vehicle response to the steering wheel input should be observed. Yaw rate of the vehicle was reduced (Fig. 6).
In the ride comfort related test procedures the vehicle acceleration is the main criterion to be observed. Bounce sine sweep test procedure is used to rate a vehicle ride comfort on a decreasing amplitude and period sine wave road. The objective and constraint are primarily set to vertical acceleration. Based on the vehicle acceleration the RMS value of acceleration could be calculated and used for the further analysis of the vehicles ride comfort (Fig. 7).Concerning the other objectives in all other test procedures simulated in the optimization process, the similar improvements were achieved.
ConclusionsAn optimization methodology of the suspension system parameters determination has been developed by integration of multi-objective optimization tools and simulation tools. Standard, fast and well proven simulation tools with a suitable degree of accuracy are used for the analysis of the suspension system kinematics and vehicle dynamics. Optimization model was examined on the example of low-floor minibus, and it was found as suitable to optimization of a large number of the suspension system variables with a large number of conflicting requirements.
This methodology showed promising results in parameters determination process compared to the conventional (intuitive) engineering approach to vehicle development. Proposed methodology can reduce the vehicle development time and reduces the probability of weak solutions or concepts at the conceptual phase of development.Result of the application of the optimization model is obtaining a set of optimal, numerically evaluated conceptual solutions that meet all in the optimization process defined requirements. After the optimization is done and a set of feasible solutions found, the only task remaining is the selection of the best solution by using some of the decision making methods.
This article is based on a previous work by Goran Šagi, Ph.D., M.E. and Zoran
International Conference on Concurrent Engineering in Trier, Germany, 2012 (Springer Proceedings) and 20th ISPE International Conference on Concurrent Engineering in Melbourne, Australia, 2013 (IOS Press Proceedings).
Figure 4 – Three optimal solutions near Pareto front
Figure 5 – Double lane change test procedure – Lateral offset from design path
Figure 6 – Fishhook test procedure – Yaw rate
Figure 7 – Bounce sine sweep test procedure – Vertical acceleration

Newsletter EnginSoft Year 11 n°1 - 44 Case Histories
This article explores the microstructural and mechanical properties of metal-metal cold spray deposits. Different spray particles deposited on different substrates were produced and the quality of such deposits was characterized in order to describe the evolution of microstructure and mechanical properties as a function of processing parameters such as particle velocity, particle dimensions, gas density, substrate hardness and temperature. The results were employed to build a database used to obtain a provisional model through a multi-objective optimization software. The error calculation of the final deposit properties demonstrated the precision of the developed model.
IntroductionCold spraying is a coating technology based on aerodynamics and high-speed impact dynamics. During such process, sprayed particles
�(typically 100-1200 m/s) by a high-speed gas (pre-heated air, nitrogen, or helium) flow that is generated through a convergent-divergent de Laval type nozzle. The particles severe plastic deformation due to the impact produce a coating in temperature conditions very far from the melting point of the sprayed material. The cold flow deposition process is emerging as an important alternative to other thermal spraying processes. Many Interesting papers are presented in literature in the most recent years [1-9]. The deep analysis of industrial processes depending on different parameters necessitates the employment of computational multi objective optimization tools. modeFRONTIER is a multidisciplinary and multi-objective software written to allow easy coupling to any computer aided engineering (CAE) tool. It enables the pursuit of the so-called “Pareto Frontier”: it’s the best trade-off between all the objective functions. The advanced algorithms within modeFRONTIER can spot the optimal results, even conflicting each other or belonging
to different fields. modeFRONTIER platform allows the managing of a wide range of software and an easy overview of the entire product development process. modeFRONTIER’s optimization algorithms identify the solutions which lie on the trade-off Pareto Frontier: none of them can be improved without prejudicing another. In other words the best possible solutions: the optimal solutions.
Experimental procedureDifferent cold spray deposits were prepared by employing CGT Kinetics 4000 series Cold spray system with a tungsten carbide MOC De Laval nozzle. The deposits were prepared on different substrates materials by employing different particles characterized by various dimensions. The cold spray parameters varied in the present study were: Substrate temperature, gas type, gas temperature and pressure, nozzle-substrate distance. The monitored outputs were: deposit grain size, microhardness, adhesion strength, porosity. The deposits mean
Multi-objective analysis and optimization of cold spray coatings
Figure 1 - Workflow of the analyses

Case Histories45 - Newsletter EnginSoft Year 11 n°1
grain size was measured through X-ray diffraction by using a Rigaku Ultima+ diffractometer. The microhardness and the adhesion strength were measured by employing NanoTest MICROMATERIALTM platform. The porosity was calculated through a statistical analysis performed on Zeiss EVO40 SEM observations, for each sample they were analysed 5 different images of 200x200 m2. To allow modeFRONTIER to compute the effect of the gas change they were introduced in the database the values of the different gases density as a function of their temperature. The experimental design consists of 376 input and output obtained from experimental data. To train the virtual surface in the training phase they were included 370 experimental design input and output. The remaining 6 we used in the design validation phase. In the validation phase, they were included in the RSM “trained” only the input remaining conditions and they were compared the numerical
Results and discussionIn the present analysis, it is fundamental to employ the so called ‘scatter matrix’ that allows the immediate recognition of how much the different variables are correlated between each other. Actually, the parameters are correlated strongly if the corresponding value in the table is distant from zero in a range between -1 and 1. If the value is 1, the parameters are directly proportional, while if the value is -1, the parameters are inversely proportional.The scatter matrix derived from the analyses performed in the present study is shown in Figure 2.By focusing the attention on the variation of the analyzed outputs, it can be underlined how the deposit microstructure is strongly influenced by the particles velocity which is directly related to gas temperature and pressure, by the gas density and by the starting particles dimension. The deposit microhardness is strongly related to the substrate microhardness, and, with the same weight, to the particles velocity and dimension. The adhesion strength is largely influenced by the particles velocity, by the substrate temperature and by the particles dimensions. The deposits porosity is mainly dependent on the substrate temperature and hardness. The grain size is strongly influenced by the particles velocity which is directly related to gas temperature and pressure, by the gas density and by the starting particles dimension.
In this study the results obtained were correlated (output) in the process of Cold Spray with the initial conditions (input) process. Correlating outputs with inputs through the use of experimental software modeFRONTIER was possible to “Phenomenological Modeling”, refine and calibrate the predictive models that simulate the phenomena in question (“Calibration”) and validating these models (“Validation”). The methodological approach used was an empirical approach without analytical framework pre-allocated. This approach is based on extrapolation of the laws looking from the experimental data through the use of RSM (Response Surface Methodology) using as said software modeFRONTIER. The
experimental data, appropriately filtered and reordered, are processed in order to build meta-models representative of the n-dimensional phenomenon and referring to an experimental database. Through the use of the algorithm AND (Evolutionary Design), which provides in output an analytical expression, have been obtained and validated the equations that simulate the processes of cold spray on the basis of the selected outputs. The advantage of this method is to use the very powerful numerical tools, which generate very complex forecasting models. The analytical expressions given algorithm ED are not manageable if not through a calculation tool, because of their complexity, while giving you visibility of how the variables are used in the formula is far from clear back to their physical interaction.
Taking a look to the results analyzed through modeFRONTIER, adhesion strength increases with increasing the particles velocity and decreasing the substrate temperature. The adhesion strength also increases with increasing the gas temperature. An interesting result is represented by the grain size behavior. The deposit grain size decreases as increasing the particles velocity and the substrate hardness. The deposit porosity decreases as increasing the substrate hardness and the substrate temperature. As a matter of fact, it can be underlined how each fundamental mechanical or microstructural property of the deposits is governed by different processing parameters. In such scenario it is possible to tune the processing parameters in order to optimize one of the analyzed mechanical or microstructural properties and at the same time reduce the potential performances of the coatings by worsening other properties. A multi objective optimization tool allows to optimize one or more output parameters indicating which processing parameters should be tuned and also individuate the ranges of modification inside the design space. Many examples can be underlined, deposit porosity is strongly influenced by the substrate hardness and temperature, so by increasing the substrate hardness and the substrate temperature it is possible to decrease the deposit porosity, in such conditions there is a very narrow range of possible particles velocity that can be employed to obtain a good quality deposit, if it is taken into account also the adhesion strength, such range is further reduced, on the contrary it is obtained a deposit with low porosity but with a low adhesion strength. An interesting situation is represented by the relationships between the adhesion strength and the deposit microhardness, they
Figure 2 - Scatter matrix relating the weight of the different input parameters on the output variation.

Case Histories Newsletter EnginSoft Year 11 n°1 - 46
are related to the same input parameters but with an inverse proportionality, they are strongly influenced by gas pressure and temperature and obviously by particles velocity but by tuning such input parameters it was demonstrated
that by increasing adhesion strength it is produced a decrease in grain size with a contemporary increase in mechanical properties. Another interesting analyses can be done on each single input parameter and by observing the effect on microstructural and mechanical behavior. All the output properties of the deposits are governed by the starting particles dimensions. The gas density has a strong influence on the deposit grain size and a minor effect on the remaining properties. Particles velocity appears to be the most influencing processing parameter. The substrate temperature appears to influence both adhesion strength and porosity while it has a lower effect on microhardness and grain size. The substrate hardness appears to strongly influence porosity, microhardness and grain size while it has a lower influence on adhesion strength. The analytical instrument used for the calculation of the error between output numerically and experimentally has been the Mean Square Error (MSE) applied on the points of measurement of the specific size of output.Expressing the discrepancy between experimental and numerical values as follows:
inumii yyy ,exp,
the Mean Square Error (MSE) for the outputs representative of a point is equal to:
6
1
2
6)(
i
iyMSE
In Table 1 shows the MSE calculated on the outputs relating to the cold spray. To give them a physical sense, that is attributable to the units of measure of the question, was sufficient to calculate the square root.
As already mentioned the results are a compromise between the minimal error and the fact that they are as representative as possible of the entire database. The errors calculated by modeFRONTIER for each validation design are shown in table 2-5.
A deep analyses of the calculated errors cal lead to the conclusion that the developed model is really precise, also due to the large number of experimental conditions employed to develop the used database. Such model can be used to optimize the properties of metal-metal cold spray deposits and to be used as a provisional instrument in the development of alternative and different deposition conditions.
ConclusionsIn the present paper they are described a large number of experimental results of mechanical and microstructural properties of cold sprayed deposits obtained in a broad range of processing parameters for metal particles deposited on metal substrates. The results were analyzed through a multi-objective optimization software (modeFRONTIER) in order to develop a provisional model capable of simulate the deposits properties as a function of different processing parameters. The good quality of the developed software has been demonstrated by the error calculation between the experimental results and the calculated ones.
P. Cavaliere, A. Perrone, A. SilvelloDepartment of innovation engineering, University of Salento
Table 1 - Output MSE cold spray Table 2 - Adhesion strength error calculated for the 6 validation design
Table 3- Microhardness error calculated for the 6 validation design
Table 4 - Deposit porosity error calculated for the 6 validation design
Table 5 - Deposit grain size calculated for the 6 validation design

47 - Newsletter EnginSoft Year 11 n°1 Case Histories
The article presents some laboratory electrical and thermal measurements done on an industrial scale Permanent Magnet Heater -PMH- prototype realized by the Laboratory for Electroheat of Padua University (LEP) and Inova Lab, a spin-off company of LEP. The prototype is able to heat aluminium billets with good total energy efficiency. Some comparisons between the results of numerical models, developed for the design of the prototype, with experimental ones are also presented. In the second part, numerical results of a system with two rotors, able to rotate at different and also opposite velocities, are proposed to verify the possibility of achieving a taper temperature distribution with a PMH system.
IntroductionThe mass heating of billets before hot metal forming plays a major role among industrial induction heating applications as regards
the number of installations, unit rated power of heaters and energy consumption. The efficiency of the classical induction process, i.e. the ratio between power transferred to the workpiece and the power supplied to the inductor, is in the range of 45-55 % for aluminium or copper billets. For these materials, a DC induction heating concept has been proposed to improve the process efficiency. In this approach the billet is forced to rotate inside a transverse DC magnetic field by means of an electric motor. Due to the magnetic flux variation an induced current distribution reacts to the driving torque during the rotation and generates thermal power within the billet.
Recently, LEP and Inova Lab have proposed an innovation of this approach based upon a rotating system of permanent magnets. This solution looks very promising because it allows to reach high efficiency, that depends mostly upon the efficiency of the motor
drive, without using an expensive superconductive system. An industrial scale prototype (Figure 1) has been recently realized and several tests are carried out. The prototype is designed to heat 200 mm diameter, 500 mm length aluminium billet of an approximate weight of 42 kg. The motor drive has a rated power of 52 kW at a rated speed of 2500 rpm, while the magnetic field is produced by SmCo rare earth permanent magnets.
Experimental Results of a 55kW Permanent Magnet Heater Prototype PMH - a Novel High Efficiency Heating System for Aluminium Billets
Figure 1 - Industrial scale laboratory prototype. (a) The prototype installed in the Laboratory of Electroheat of Padua University. (b) Arrangement of the permanent magnets inside the steel rotor.

Newsletter EnginSoft Year 11 n°1 - 48 Case Histories
In the paper, some experimental measurements are presented showing the effectiveness of the applied design procedure based upon a DOE -Design of Experiments- for the optimization of design parameters. Finally, some results are presented about recent research activities carried out at LEP devoted to improve the system performance, mostly to verify the possibility of obtaining controlled thermal profile, like a taper distribution using PMH.
Electrical and Thermal Measurements on PrototypeElectrical measurements were made by means of a three phase power analyzer (Chauvin-Arnoux, mod. C.A. 8335B Qualistar) and four current probes (Chauvin-Arnoux, mod. MN93BK). Thermal measurements at the end of the heating process were performed by means of an infrared thermocamera (AVIO, mod. TVS2000): the billet was blackened by means of a high temperature resistant paint to control the emissivity. Also thermocouples were used to monitor the billet surface after the thermal transient: K-type thermocouples were connected to
a data logger unit. In a previous work, we presented experimental results limited temporarily by the maximum electrical power (i.e. the rotational velocity) available in the laboratory (40 kW or a rotational speed 750 rpm of the rotor), so presented results were limited to 500 rpm and 750 rpm. In this paper we present results also for 900 rpm – 52 kW maximum adsorbed power (rated power for the induction motor installed in the system) and for 1000 rpm – 57 kW.
Figure 2 - Layout of thermal and electrical measuring system
Figure 3 - Experimental and numerical results for 2 different velocities: 500 rpm (upper) and 750 rpm (bottom). Measured values, continuous lines. Computed quantities: dashed lines
Figure 4 - Active Power adsorbed by the system for various rotational speed of the rotor and measured at the input of the inverter that drives the induction motor. The tests have been stopped at different times in order to adsorb roughly same energy
Figure 5 - Thermal transient corresponding to the tests presented in Figure 4. The continuous lines report the thermal transient measured without thermal insulation between the billet and the clamps, the dashed lines report the thermal transient with a thin layer of fiberglass between the billet and clamps used as insulating layer
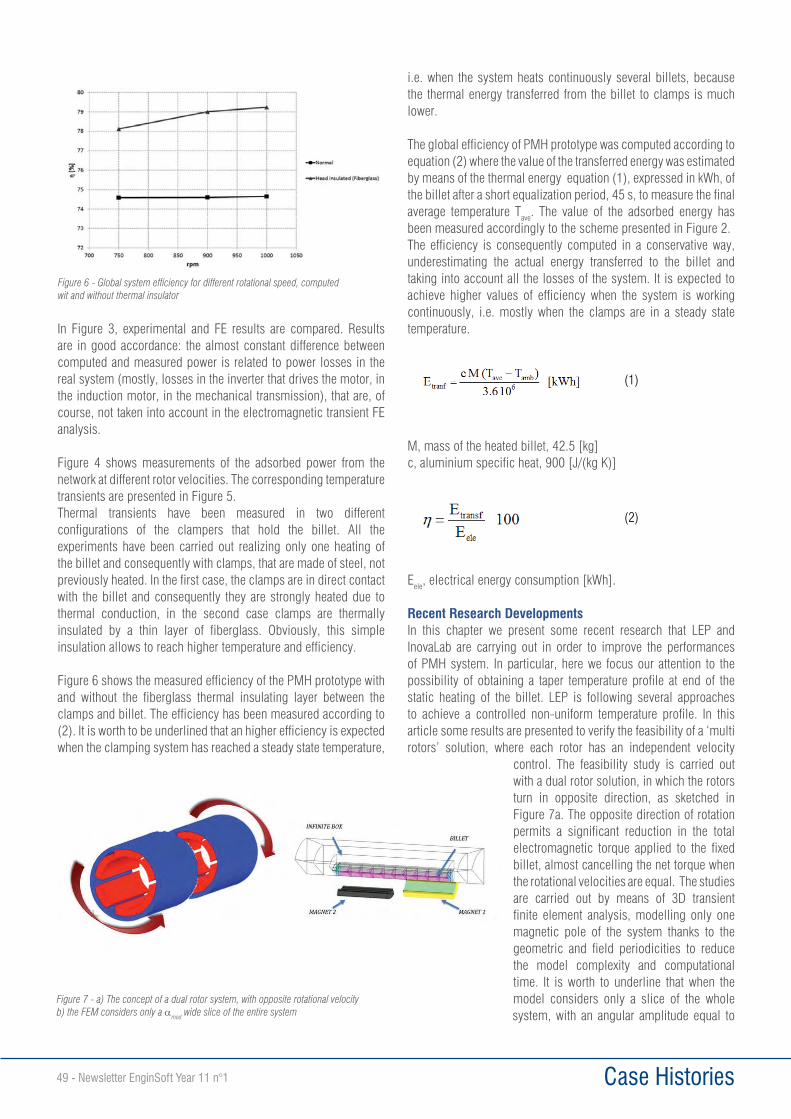
49 - Newsletter EnginSoft Year 11 n°1 Case Histories
In Figure 3, experimental and FE results are compared. Results are in good accordance: the almost constant difference between computed and measured power is related to power losses in the real system (mostly, losses in the inverter that drives the motor, in the induction motor, in the mechanical transmission), that are, of course, not taken into account in the electromagnetic transient FE analysis.
Figure 4 shows measurements of the adsorbed power from the network at different rotor velocities. The corresponding temperature transients are presented in Figure 5. Thermal transients have been measured in two different configurations of the clampers that hold the billet. All the experiments have been carried out realizing only one heating of the billet and consequently with clamps, that are made of steel, not previously heated. In the first case, the clamps are in direct contact with the billet and consequently they are strongly heated due to thermal conduction, in the second case clamps are thermally insulated by a thin layer of fiberglass. Obviously, this simple insulation allows to reach higher temperature and efficiency.
Figure 6 shows the measured efficiency of the PMH prototype with and without the fiberglass thermal insulating layer between the clamps and billet. The efficiency has been measured according to (2). It is worth to be underlined that an higher efficiency is expected when the clamping system has reached a steady state temperature,
i.e. when the system heats continuously several billets, because the thermal energy transferred from the billet to clamps is much lower.
The global efficiency of PMH prototype was computed according to equation (2) where the value of the transferred energy was estimated by means of the thermal energy equation (1), expressed in kWh, of the billet after a short equalization period, 45 s, to measure the final average temperature Tave. The value of the adsorbed energy has been measured accordingly to the scheme presented in Figure 2.The efficiency is consequently computed in a conservative way, underestimating the actual energy transferred to the billet and taking into account all the losses of the system. It is expected to achieve higher values of efficiency when the system is working continuously, i.e. mostly when the clamps are in a steady state temperature.
M, mass of the heated billet, 42.5 [kg]c, aluminium specific heat, 900 [J/(kg K)]
Eele, electrical energy consumption [kWh].
Recent Research DevelopmentsIn this chapter we present some recent research that LEP and InovaLab are carrying out in order to improve the performances of PMH system. In particular, here we focus our attention to the possibility of obtaining a taper temperature profile at end of the static heating of the billet. LEP is following several approaches to achieve a controlled non-uniform temperature profile. In this article some results are presented to verify the feasibility of a ‘multi rotors’ solution, where each rotor has an independent velocity
control. The feasibility study is carried out with a dual rotor solution, in which the rotors turn in opposite direction, as sketched in Figure 7a. The opposite direction of rotation permits a significant reduction in the total electromagnetic torque applied to the fixed billet, almost cancelling the net torque when the rotational velocities are equal. The studies are carried out by means of 3D transient finite element analysis, modelling only one magnetic pole of the system thanks to the geometric and field periodicities to reduce the model complexity and computational time. It is worth to underline that when the model considers only a slice of the whole system, with an angular amplitude equal to
Figure 6 - Global system efficiency for different rotational speed, computed wit and without thermal insulator
Figure 7 - a) The concept of a dual rotor system, with opposite rotational velocityb) the FEM considers only a mod wide slice of the entire system
(1)
(2)

Newsletter EnginSoft Year 11 n°1 - 50 Case Histories
mod, that depends on the number of magnetic poles p:
this kind of model allows to easily parameterize also the number of magnetic poles.
The volumetric region of aluminium billet has been subdivided into 10 different volumes in order to measure the integral of the induced power density in each single volume. The integral values of the power induced in each volume give a rough but useful evaluation of the distribution of the induced power along the axis. This approach to describe the axial distribution of power was chosen because (unlike traditional solenoidal induction heating) the power is not uniformly distributed along the azimuthal position. An example of induced current distribution is presented in Figure 8, for a 6 poles system where both the rotors turn at 900 rpm, with opposite directions.
In figure 9 the discretized distribution of the power density is presented for some combinations of the two rotors velocities: in Figure 9a the 6 magnetic poles case is presented while Figure 9b reports the 8 poles case.
This feasibility study demonstrates the effectiveness of the multi rotors approach: varying the speed each rotor independently different distributions of the heating sources can be achieved to heat the billet with a taper temperature profile.
Usually a temperature difference between the edges of the billet of about 60-80 °C is requested for a subsequent extrusion process. Thermal results, obtained solving the Fourier’s thermal equations with the power density computed with different rotor speeds, are summarized in Table 1. The maximum and minimum temperature in the billet are presented for 3 different combinations of rotor speeds at end of the heating and after 30 s of equalization.Obviously the net electromagnetic torque is not null when different velocities are applied to the rotors. Nevertheless the resulting net torque is significantly reduced.
ConclusionsIn the first part of this work, some experimental results measured on a pioneering prototype of PMH are summarized, showing the effectiveness of the first design developed for such a kind of innovative heating system. In the second part, a feasibility study carried out to verify the possibility of achieving a taper temperature profile in the billet is presented. The preliminary results look promising, but, due to large number of design variables, the optimal solution for the process can be investigated only by resorting to optimal design algorithms.
M. Bullo, F. Dughiero, M. Forzan, C. Pozza - Università di PadovaM. Bullo, F. Dughiero, M. Forzan, m. Zerbetto - Inovalab
Figure 8 - Distribution of eddy currents in the billet solved in 3D domain, on the right the current distribution on a planar cross section
Figure 9 - Induced power for different rotational velocities of the rotors in the 10 volumes that describe the billet. On the left, a 6 poles system is considered and on the right a 8 poles one
Table 1. Summary of calculated temperature in a dual rotor system, with different rotational speeds of the two rotors[case study: 6 magnetic poles]

51 - Newsletter EnginSoft Year 11 n°1 Case Histories
The number of ventilation systems in all sectors of industry is constantly increasing. Their functions are diverse:
• To improve comfort and hygiene in work areas.• To protect people against the emission of pollutants.• To protect products and materials.
Consequently, in order to design a system, it is important to know how different components should be used (fan, dampers or others) to respect various criteria and also to predict air flow rates, pressures etc.
IntroductionFlowmaster is a software tool which allows the modelling of HVAC systems using a 0D or 1D approach, with the potential for conducting steady-state or transient simulations with or without heat transfer. This permits the rapid determination of fluid pressure, flow rate and temperature across a network.
The studied system showed in figure 1 is composed of two main rooms (room 1 and room n2) with three doors: one between the two rooms, one between the room 1 and the external environment and the last between room 2 and a room with a relative pressure of -60 Pascal There are also eleven dampers. The initial relative
pressures are respectively -20 Pascal for the first room and -80 Pascal for the second. The initial leak for each door is specified in figure 1. Dampers 1 to 6 represent the blowing line with a constant volumetric flow rate of 4546 m3/h and dampers n7 to 11 represent the extraction line with a constant volumetric flow rate of 4641 m3/h. There is also a constant extraction of 126 m3/h from the system.The objective is to determine the optimal position of the dampers in order to maintain the flow rates and pressures in the rooms (see table 1), and then to run a transient simulation with the initial configuration in order to find the impact of opening doors 1 and 2 when a tanker truck enters the system.
Ventilation system modelling using FlowmasterOpening doors during the introduction of a tanker truck
Fig. 1 – Ventilation system scheme
Fig. 2 – Flowmaster representation of the network

Case Histories Newsletter EnginSoft Year 11 n°1 - 52
Creation of network and implementation of dataThe network is built based on the P&ID using corresponding Flowmaster components. Since Flowmaster does not allow 3D components, the rooms are each represented by a node. The volume of air in rooms is neglected in this study but it can be taken into account if necessary. The corresponding Flowmaster network
can be seen on figure 2. The corresponding data has been entered in each component.
Initial configuration The first step is to find a good opening ratio of dampers in order to meet the flow rates of initial configuration. For this, the “Flow balancing” module of Flowmaster is used. The flow rates are imposed in dampers and Flowmaster determines the corresponding opening ratios in order to meet these flow rate. Below is an example of flow balancing on the extraction line.
Table 1 shows required opening ratio obtained in order to respect flow rates demand for the different dampers.Once these opening ratio are determined, they can be entered in the Flowmaster dampers components in order to run a steady state simulation and see if the initial configuration is well modelled.
Opening doors during the introduction of a tankerThe final step is to run a transient analysis in order to see how flow rates behave when both the door between the first room and the external environment, and the door between the two rooms are opening.In this scenario, each door takes 3 minutes to open, dampers 4,5 and 6 are closed during the same period and consequently dampers 1 and 2
(which were initially closed) are opening in order to allow a volumetric flow rate of 1800 m3/h to pass (a flow balancing simulation allows the determination of the corresponding opening ratio). Tabular controllers are used in Flowmaster in order to control the position of doors and dampers over time. In the same time dampers 2,7,8,9,10 and 11 need to keep constant volumetric flow rates during all the process. For this, PID (proportional, integrate, derivative) controllers are used for each of these dampers. The
Figure 3 – Flow balancing on extraction line
Figure 4 – Flow balancing on extraction part
Table 1 – Flow balancing results Figure 5 – Volumetric flow rates in dampers versus time

Case Histories53 - Newsletter EnginSoft Year 11 n°1
corresponding network for this scenario can be seen on figure 4.Results of the transient simulation can be seen in figures 5 to 8. From 0s to 10s the system is running with the initial configuration and the three minutes cycle begins at 10s.Volumetric flow rates in all dampers are as expected and can be seen on figures 5 and 6. After three minutes volumetric flow rates for dampers 4,5 and 6 change from 1200 m3/h to 0 and consequently volumetric flow rates for dampers 1 and 2 change from 0 to 1800 m3/h. For the other dampers, volumetric flow rates are constant during the entire simulation.
The volumetric flow rates of the two doors which are opening are increasing over time due to opening of the doors and the variation of flow in the blowing line. An inversion can be observed on the second door due to relative pressure increase in the second room which increases from -80 Pascal to 0. The final room remains at -60 Pascal. This inversion is consistent.
The initial relative pressures for room 1 and 2 are respectively -20 Pascal and -80 Pascal and quickly increase to approximately 0 Pascal due to doors opening and the impact of the external environment (figure 8).
ConclusionResults show how flow rates for the different doors and pressures behave when doors are opening during the introduction of a tanker truck. Flowmaster can be used in ventilation systems in order to determine operating conditions with flow balancing and to predict what can happen during various scenarios in steady-state or transient simulations with or without heat transfer.It can also be used to model the head loss created in a system and so be used to size a fan.
For further information:Philippe Gessent – Enginsoft [email protected]
Figure 6 – Volumetric flow rates in dampers versus time
Figure 8 – Pressure versus time in each room
Figure 7 – Volumetric flow rates crossing doors versus time

Newsletter EnginSoft Year 11 n°1 - 54 Case Histories
When a contaminant is introduced into the environment, the effectiveness of a response operation is contingent upon the ability to assess its dispersion, locate its source, and forecast its dispersion at later times. Information used in the analysis may be sourced from both static sensors and mobile sensors. While distributing a set of sensors optimally is a vexing problem, moving them subsequently in an optimal way presents unique algorithmic challenges. In addition, miniaturization and limited processing capabilities of mobile sensors introduces accuracy limitations. However, a dynamic network of mobile sensors might guide and garner feedback from field agents in search operations, and be deployed to autonomously sample and characterize a dispersion field and respond more adequately than a static sensor to emergency scenarios.
The objective of the present work is to explore the dynamics of single and multiple mobile sensors, integrating an autonomous motion planning optimization algorithm with a strategy to cope with uncertain measurements.
The physical problem corresponds to a contamination scenario in a complex terrain; the typical (forward) analysis assumes knowledge of the source to quantify the contaminant levels in the environment. Imperfect knowledge of the location leads to a probabilistic assessment of the contaminant levels downstream as shown in Fig. 1a. On the other hand, in the present effort, the goal is to locate the source based on imperfect measurements: it is an inverse (backward) problem, Fig. 1b.
The stochastic inversion scheme we developed uses a pre-generated library of solutions. We use a Monte Carlo scheme with Latin Hypercube sampling whereby concentration samples drawn at the sensor locations are binned and mapped to the source’s posterior distribution. The resulting posterior distribution of the source’s location can then be used to construct composite forward solutions. These are in essence our best estimate of the dispersion.In our framework, the stochastic inversion analysis informs a motion planning algorithm that effectively directs the sensor(s) towards the next best location to measure. An optimal set of points are found through minimizing a specially designed utility-function which combines the need
Microair Vehicles in Search for Danger
Fig. 1 - The problem of contaminant dispersion in a complex terrain. The source is in the lower left corner and the sensors are shielded by buildings downstream. Left: forward problem: from an uncertain source location determine the contamination level downstream. Right: backward problem: from imprecise measurements of the contaminant levels determine the source location

Case Histories55 - Newsletter EnginSoft Year 11 n°1
Fig. 2 - The source localization problem using multiple autonomous mobile sensors. Left: the paths taken by two sensors jointly programmed to minimize the uncertainty in the source’s location. Right: the output of the stochastic inversion scheme with a single sensor (the red dot); note how the solution bifurcates in this case – two likely source locations.
to explore new regions with the reduction of the overall uncertainty. The diagram on the side illustrates the key steps in the algorithm. The statistics of the composite forward solution are then used to move the sensors in a way that minimizes the predicted uncertainty in the source’s location at the next time step. The sensors then sample the dispersion field at the new locations, and the process is repeated. Stochastic inversion presents many algorithmic challenges. In the previous examples, only a limited number of parameters were assumed to be uncertain. As the number of uncertain parameters increases, the search space quickly becomes difficult to manage. In the context of our algorithm, this manifests as an exponential increase in the amount of storage space required for our solution library, and an increase in the computational cost of binning a particular sample. As illustrated by the second example above, inverse problems also tend to be ill posed. This is, however, a problem we believe can be addressed by sensor mobility.
Acknowledgements. This work was partially supported by the Army High Performance Computing Research Center at Stanford.
Ibrahim AlAli, Gianluca IaccarinoDepartment of Mechanical Engineering, Stanford University, Stanford, CA
A Greenhouse Gas Emission sensor mounted on an unmanned micro-vehicle (Courtesy of Journal of Remote Sensing)
Researchers at Livermore are exploring the possibility of using unmanned aerial vehicles (UAVs) to place, operate, and maintain sensor networks in rugged terrain. In the figure, the sensors in the network are shown sending their information. (https://www.llnl.gov/str/JulAug01/Hills.html)
Prof. Gianluca IaccarinoGianluca Iaccarino has been an associate professor in Mechanical Engineering and Institute for Computational Mathematical Engineering at Stanford University since 2007. He received his PhD in Italy from the Politecnico di Bari in 2005 working on numerical methods to simulate turbulent industrial flows. Afterward, he has been a postdoc at the Center for Turbulence Research of NASA Ames working on physical models for flow simulations and heat transfer, with emphasis on high-performance computing.In 2008 Prof. Iaccarino started the Uncertainty Quantification Lab working on algorithms to assess the impact of tolerances and limited knowledge on the performance predictions of engineering systems, such as wind turbines, hypersonic propulsion systems, low-emission combustors.
Since 2009, he has served as the director of the Thermal and Fluid Sciences Industrial Affiliate Program a forum for technology transfer and interactions between members of the Stanford community and engineering corporations - GE, United Technologies, Honda, Enginsoft, Safran, Ansys, Dassault, Total are among the members.
In 2010 Prof. Iaccarino received the PECASE (Presidential Early Career Award for Scientists and Engineers) award from the US Department of Energy. In 2011 he received an Humboldt fellowship.
Homepage: http://www.stanford.edu/~jopsUQ Lab: http://uq.stanford.eduThermal & Fluid Sciences Affiliates Program: http://tfsa.stanford.edu

Newsletter EnginSoft Year 11 n°1 - 56 Software Update
A look at the future improvements to the ANSYS platform
The ANSYS technical/sales meeting between the parent company and its Channel Partners took place at the end of January. EnginSoft , a leading distributor of ANSYS in Italy, was present; participating in the discussion of current developments and the status of the software from both the technical and the commercial points of view, and the peculiar economic situations in which the different partners, corporate offices (or both, as in Italy) are located.
After substantially fulfilling the objectives set in 2013, there is a positive and optimistic outlook for 2014. This is reflected by ANSYS’s performance on the US stock exchange due to the increase in company productivity along with the growing robustness of the software. The commercial performance of ANSYS has been only marginally affected by the crisis, with the value of ANSYS stock steadily increasing, thanks to this financial performance, ANSYS can continue to invest a significant portion (i.e. 17.5%) of its revenues in Research and Development enabling them to develop leading multiphysics tools, a robust and responsive knowledge management system and a shared technology platform that delivers high-impact results for their customers. The number of customer around the world has risen, along with an increasingly diverse penetration of different engineering sectors, whilst Oil & Gas, Aeronautics and Automotive remain as the main
Fig. 1 - Advantages of the parallel solution with relation to the number of cores. It also shows how, with
the same number of cores, solutions in release 15.0 (R15) prove to be more efficient than in release 14.5
(R14.5)

New book from Prof. Yaroslav D. Sergeyev, the winner of the 2010 Pythagoras International Prize in Mathematics
Yaroslav D. Sergeyev, Arithmetic of Infinity, E-book, 2013This book presents a new type of arithmetic that allows one to execute arithmetical operations with infinite numbers in the same manner as we are used to do with finite ones. The problem of infinity is considered in a coherent way different from (but not contradicting to) the famous theory founded by Georg Cantor. Surprisingly, the introduced arithmetical operations result in being very simple and are obtained as immediate extensions of the usual addition, multiplication, and division of finite numbers to infinite ones. This simplicity is a consequence of a newly developed positional numeral system used to express infinite numbers. In order to broaden the audience, the book was written as a popular one. This is the second revised edition of the book (the first paperback edition has been published in 2003, available at European Amazon sites).
Yaroslav D. Sergeyev, Ph.D., D.Sc., D.H.C. is Distinguished Professor at the University of Calabria, Italy and Professor at N.I. Lobachevski Nizhniy Novgorod State University, Russia. He has been awarded several national and international research awards (Pythagoras International Prize in Mathematics, Italy, 2010; Outstanding Achievement Award from the 2010 World Congress in Computer Science, Computer Engineering, and Applied Computing, USA; Lagrange Lecture, Turin University, Italy, 2010; MAIK Prize for the best scientific monograph published in Russian, Moscow, 2008, etc.). His list of publications contains more than 200 items, among them 5 books. He is a member of editorial boards of 4 international scientific journals. He has given more than 30 keynote and plenary lectures at prestigious international congresses in mathematics and computer science. Software developed under his supervision is used in more than 40 countries of the world. Numerous magazines, newspapers, TV and radio channels have dedicated a lot of space to his research.
Software Update57 - Newsletter EnginSoft Year 11 n°1
user communities. Innovations in finite element technology remain significant after 40 years of great incremental development, as summarized in the graph below (figure 1), which clearly illustrates the growing capabilities of the ANSYS toolset.
Continuous improvements in “traditional” topics have not been neglected:: meshing, in-depth details for fracture mechanics applications, a strong focus on the engineering analysis of composites; along with enhancements to the user experience. This latter point includes the creation of ACT, or the ANSYS Customization Tool, enabling users to personalize ANSYS and integrate it with the other codes used by ANSYS customers in their daily work.
HPC (High Performance Computer) will play an increasingly important role in finite elements simulation technology. It has always been used in parallel solvers, such as fluid-dynamic analyses, but is now achieving increased efficacy for mechanical and electromagnetic studies, enhancing the advantages of parallel solvers both during meshing and computation, aided by newly developed parallel solvers (DANSYS) in these topics.Figures 1 and 2 display some software improvements available in the latest release R15.
For more information:Roberto Gonella, [email protected]
Fig. 2 - This figure illustrates the significant improvements made in parallel solver speedup of
DANSYS 15.0 over 14.5. The beneficial effects are even most pronounced for the smaller sized
models with less degrees of freedom (DOF) at the higher core counts

Newsletter EnginSoft Year 11 n°1 - 58 Software Update
ANSYS CFX R15.0
High Performance ComputingANSYS works continuously to optimize the parallel scalability and performance of its CFD solvers, allowing customers to leverage the latest hardware advancements and arrive at an accurate solution fast. A primary area of focus for R15.0 has been the CFX Solver’s HPC scalability, as this was increasingly being identified as a key issue by customers looking at larger problems with larger computational resources. Various aspects of the CFX solver were re-examined thoroughly, from equation assembly and the AMG linear solver, to partitioning, I/O, and communication. Bottlenecks and means to minimize these were identified with the aid of selected industrial benchmark cases, in particular multi-domain rotating machinery cases running both steady and transient analyses. It was previously not even possible to go beyond 2048 cores, but this limitation is now removed in R15.0, where the maximum number of mesh partitions has been increased to 16384.
A 64-bit version of MeTiS for partitioning large cases is now available. With 32-bit, MeTiS was limited to approximately 20 million node meshes. For larger meshes, other partitioning methods had to be used (e.g. recursive bi-section). This resulted in a deterioration in the partition quality when running larger cases. Thanks to the 64-bit version of MeTiS, this compromise is no longer necessary, and high quality partitioning is possible for even the largest meshes.The start-up is another important aspect that has been improved where the solver itself that in the previous releases did not scale well with core count.
Mesh motionThe CFX implementation of moving and deforming meshes was improved in variety of ways. One key issue in the past was the frequent need for users to make adjustments to the default settings, especially for the mesh stiffness. If not, the boundary motion
could frequently lead to the mesh quickly becoming invalid. The previous defaults led to a mesh stiffness that was essentially uniform, whereas new defaults ensure that critical areas with small cells are stiffer, so that they do not rapidly deteriorate during the simulation as the mesh moves. Moreover, sliding meshes on surfaces of revolution has been improved with respect to robustness on radial machines and parallel efficiency (in terms of memory).
Particle trackingFor particle tracking with CFX, a key need was for improved results analysis – many models exist, and many illuminating visualizations of particle-laden flows could be made – but quantitative assessment was recognized as needing enhancement. The following capabilities have been added in this respect in R15:• Additional variables for particle histograms: particle mass flow rate;
particle impact angle; particle velocity magnitude.• Ability to monitor particle mass flow and energy flow at boundaries:
analogous to already available momentum and forces. • Ability to output characteristic numbers for particles: Reynolds,
Nusselt, Sherwood, Eotvos, Morton, Weber, Ohnesorge, and Slip Velocity.
• Particle diagnostics for >106 particles: previously output in out file was being truncated due to an insufficient number of digits.
TurbomachineryA Significant effort continues to be made in CFX to improve the ability to accurately model the periodically transient flow found in turbomachinery applications, but at a fraction of the cost of modelling the full 360-degree wheel. Developments in this area continue in R15.0, providing turbomachinery analysts additional Transient Blade Row (TBR) capabilities to allow the equivalent full wheel transient solution to be obtained using only one (or a few) passages per blade row. The TBR
capabilities represent an enormous gain in calculation efficiency as well as reducing requirements with respect to disk space and RAM.At the top of the list of enhancements in R15.0 in this area is an effort to improve the workflow for TBR simulations, to make the setup easier and less error-prone for the user. First in this category is the ability to visualize profile vectors in CFX-Pre, so that the motion boundary condition being applied, for blade flutter in particular, can be easily verified visually by the user. An important addition to R15.0 was the direct ability to calculate and monitor aero-elastic damping during the solver calculation, the key quantity of interest in blade flutter assessment. This could be done before via CEL expressions, but its provision with R15.0 also
The last release of ANSYS CFX announces new capabilities and enhancements in order to allow engineers to improve their product designs. There are a wide range of enhancements, as reported in this article
Fig. 1 - Preview of motion profile vectors on blades directly in CFX-Pre

Software Update59 - Newsletter EnginSoft Year 11 n°1
contributes to making these analyses much easier to set-up and run.As a complement to blade flutter (where results of Modal analysis are used to define the motion of the blade), support was added for Forced Response analysis. CFX simulations can directly export the real and imaginary components of the complex pressure field in the frequency domain, which is directly in the correct form for application as a load in ANSYS Mechanical. The existing TBR methods (Time Transformation (TT) and Fourier Transformation (FT)) continue to be improved and enhanced, while new methods are under investigation to be released in the future.When performing simulation with one of the TBR methods, the transient result is stored in the result file for the modelled passage(s) in compressed form using Fourier compression. Post-processing then requires the ability to expand the solution data appropriately. With R15.0, the capability is directly integrated in CFD-Post with the addition of data instancing for each domain as desired, making it much easier to perform the desired visual and quantitative analysis of TBR results, on locations and plots of all types.Primarily for turbomachinery cases, there is a new outlet boundary condition (Exit-Corrected Mass Flow) that enables the user to sweep through the complete operational range of mass flow at the outlet, including machine operating points from choked flow to stall conditions. Previously, users would need to set different boundary condition types depending on the given operating point: close to stall they would want to specify the mass flow, and close to choke, the pressure. This complicated set-up significantly, by not only requiring boundary condition values to be changed, but also the boundary condition type. The new exit-corrected mass flow boundary condition can be applied to the entire operation range, improving ease-of-use and also avoiding discontinuities that can appear in the switch from one boundary condition type to another.
InitializationA significant enhancement to CFX usability was made in the extension of its solution initialization capabilities. Frequently customers may initially simulate a reduced portion of a model – e.g. a periodic section - but later need to look at the “full” model. Previously the move to the larger model meant a complete restart of the calculation, with no ability to take advantage of the fact that a solution might already exist for a portion of it. This meant additional calculation time, particularly “expensive” on a large model. R15.0 provides the ability to take previously calculated solutions and transform/replicate these in order to provide what should be at least a good initial guess for the subsequent “large” calculation.
With turbomachinery needs being a key driver, there are turbo-specific options provided for this type of initialization (e.g. define number of passages per 360 degrees, etc.), as well as generic rotation and transformation options.
CFD-PostAs with the solver, performance improvements are also being looked at in CFD-Post. Among the improvements already made, a highlight is the efficiency of CFD-Post when looking at cases with large numbers of expressions (i.e. 100s), which can quickly accumulate in more complex setups. In R15.0 responsiveness is essentially instantaneous. Another improvement is proper line charts for multi-domain cases, avoiding improperly connected lines. A significant usability enhancement was added to CFD-Post for large, complex cases with many domains and regions. Previously, creating a plot (e.g. contour, vector) on multiple locations meant a rather arduous specification of those regions from a flat list of all regions in the results file. Now, in R15, users can take advantage of the
available domain hierarchy to make it much easier to pick the desired collection of locations. For example by Ctrl-left click, users can pick any number of regions from the region listing, and then right-click to insert the desired plot on the collection of regions. Frequently users want to take advantage of the extensive quantitative and qualitative analysis and visualization capabilities of CFD-Post when looking at their mesh, in advance of running the solver. In R15.0, users can directly read a saved *msh file into CFD-Post, without necessarily first proceeding to Fluent or CFX-Pre.
MiscellaneousIn CFX, porous media modelling was enhanced to provide for a more accurate and robust solution in particular for cases where flow is tangential to the fluid-porous interface. Refrigerant Material HFO 1234yf (R-1234yf) is replacing the old materials (R-134a) used in the cooling system of many cars. This increasingly common material is therefore now available for direct selection, avoiding need for users to create material definition themselves. Several bug fixes and improvements have been made to the calculation and reporting of equation imbalances. The changes relate to the way that imbalance percentages are calculated, and can therefore affect the number of iterations the solver performs when percentage imbalances are used to determine convergence. Specific areas where imbalance percentages may have changed from previous versions include:• Multiphase cases without domain interfaces.• Particle transport cases.• Cases with point, boundary, or subdomain sources.Note that in all cases, only the way that the normalized (percentage) imbalances are calculated has been changed; the way that the equation imbalances are calculated is unchanged.
For further information:Alessandro Marini, [email protected]
Fig. 2 - TBR – Direct integration of solution data expansion in
CFD-Post
Fig. 3 - The solution of a “reduced model” can be transformed/replicated in order to provide a good initial guess
for a calculation on “full model”

Software Update Newsletter EnginSoft Year 11 n°1 - 60
ANSYS FLUENT R15.0
ANSYS Fluent Meshing now delivers key improvements to manage large and complex models and either CAD or surface mesh can be imported. Size functions, which capture model features, can be displayed to provide adequate feedback. Before volume meshing is done, diagnostic tools find and fix problems in assemblies (gaps or holes) and face connectivity (face overlapping or intersecting). Improved wrapping tools capture geometry features and diagnostic tools determine how well the geometry features is captured. Various tools are available to further improve quality and accuracy of the wrapping when needed and local surface remeshing tools locally improve surface mesh quality when needed, without having to remesh the entire geometry.Faster volume meshing and excellent scalability of parallel meshing when generating tet/prism meshes characterize this new release with faster graphics and keyboard shortcuts to allow for faster interaction
ANSYS Fluent 15.0 features a significantly improved solver and parallel efficiency at lower core counts. A scalability above 80 percent efficiency with as few as 10,000 cells per computer core has been demonstrated with a significant reduction in the time needed to read a simulation file and start the simulation on HPC cluster. At release 15.0, ANSYS Fluent supports solver computation on GPU. This can lead to a speedup of up to 2.5 times. ANSYS Fluent 15.0 deliver a comprehensive range of physics modeling capabilities, giving users the detailed insight needed to make design decisions for applications that involve complex physical phenomena. Many progresses for external aerodynamic simulations and applications like wind turbines have been achieved. The transition model is now compatible with the SAS and Delayed DES models and the improved accuracy and broader range of applicability of the New Wall Modeled LES model (WMLES S-W) is now available. The introduction of multilayer shell conduction permits the modelling of heat conduction in multiple shell layers of same/different materials that are in contact with one another without having to explicitly mesh the thin zones. For systems with multiple injections, more flexibility using different drag and breakup laws for different injections is available. The particle properties can be defined via UDF with great benefit in applications that consume solid or liquid fuel such as boilers, burners and furnaces.Simulations of immiscible fluid using the volume-of-fluid (VOF) model are now up to 36 percent faster. The suppression of
inflow boundary condition numerical reflections improve the accuracy and the fidelity of the simulation. The Eulerian multiphase flow simulations can now be accelerated thanks to the adaptive time-stepping support. A new log-normal particle size distribution for population balance model initialization is available for colloidal suspension or emulsion. A better prediction of heat transfer between phases can be done using new correlations (Hughmark, Two resistance Model). The splashing model in the Eulerian Wall Film modeling has been tested thoroughly and now a robust implementation allow the users to ensure physically accurate direction of the splashed particles. The support for evaporation-condensation with the Eulerian and mixture multiphase models can be apply for fogging and condensation applications.The combustion modeling targeted for ICE Engine and Gas Turbine combustion is now faster and the limit of the number of species has been extended to 500 species. A new dynamic mechanism is able to reduce the mechanism size at each cell to only the most important species and reactions needed for solving the equations. The Gas turbine CO emissions can now be evaluated using the new support for diffusion flametes. Improvement in the reacting flow channel can consider the catalyst in the tubes in the reformers and cracking furnaces. A non-reflective impedance boundary condition can now model the impact of pressure reflections from outside the domain of interest on the domain of interest without including those zones in the simulation with important benefits in the combustion simulations and dynamics.ANSYS Fluent 15.0 extends the capabilities of the adjoint solver, an advanced technology used in shape optimization, and the mesh morpher
and optimizer. The adjoin solver now supports problems with up to 30 million cells. The core functionality of the adjoint energy equation has been implemented such that observables can be defined as various integrals of heat flux and temperature. For the mesh morpher and optimizer, the control point selection is easier by allowing selections to be defined using right-mouse-button clicks.Release 15.0 offers coupling features that complete the ANSYS fluid-structure interaction. Two-way surface thermal FSI with ANSYS Fluent and ANSYS Mechanical via system coupling has been included completing the force/displacement fluid-structure interaction.
For more information:Michele Andreoli, [email protected]
The latest release of ANSYS FLUENT 15.0 brings together new capabilities and enhancements that offer a more comprehensive approach to guide and optimize complete product designs
Fig. 2 - Ansys Fluent HPC – high solver scalability at very large core counts for a combustor, with LES and species
transport, using the coupled solver
Fig. 1: Ansys Fluent Meshing Wrapping – Original STL Surface on the left and wrapper surface on the right for a nacelle

61 - Newsletter EnginSoft Year 11 n°1 Software Update
The present article aims at introducing one of the most advanced tools available on the market as far as fatigue calculation is concerned:a numerical technology devoted to reliability problem solving called nCode. nCode is based on two main technologies: nCode GlyphWorks and nCode DesignLife. The former consists of a wide collection of glyphs, allowing input processing (FEM analysis results and fatigue loads), analyses configuration and results visualization. The latter is the real computation tool.
Figure 1 shows an example of an nCode project. It can be seen how a very complex fatigue analysis is performed using a simple workflow, with a clear and easy visualisation of the analysis results. nCode permits the analyst to manage the input data as loads or signals, to customize the materials data and to perform several analyses:
• stress life;• strain life;• crack growth;• creep;• vibration fatigue;• seam weld fatigue; • etc.It can be easily interfaced with the most common finite elements software: ANSYS, ABAQUS, LS-DYNA, NASTRAN, among the others. Its great flexibility in generating fatigue loads is related to
the available tools, facilitating the ready application of complex FEM analysis results with within inside the nCode environment or imported ones through external files. The user can provide fatigue loads in the following ways:
• time series;• constant amplitude;• time step;• temperature (it provides heat maps to be linked to other stress
maps by means of hybrid); • vibration;• hybrid (it combines several kind of loads by means of
superposition);• duty cycle (it combines several kind of loads by means of
sequence).
Advanced tools for fatigue calculation – nCode
Fig. 1 – Example of nCode projects
Fig. 2 – Independent event processing in duty cycle Fig. 3 – Combined event processing in duty cycle
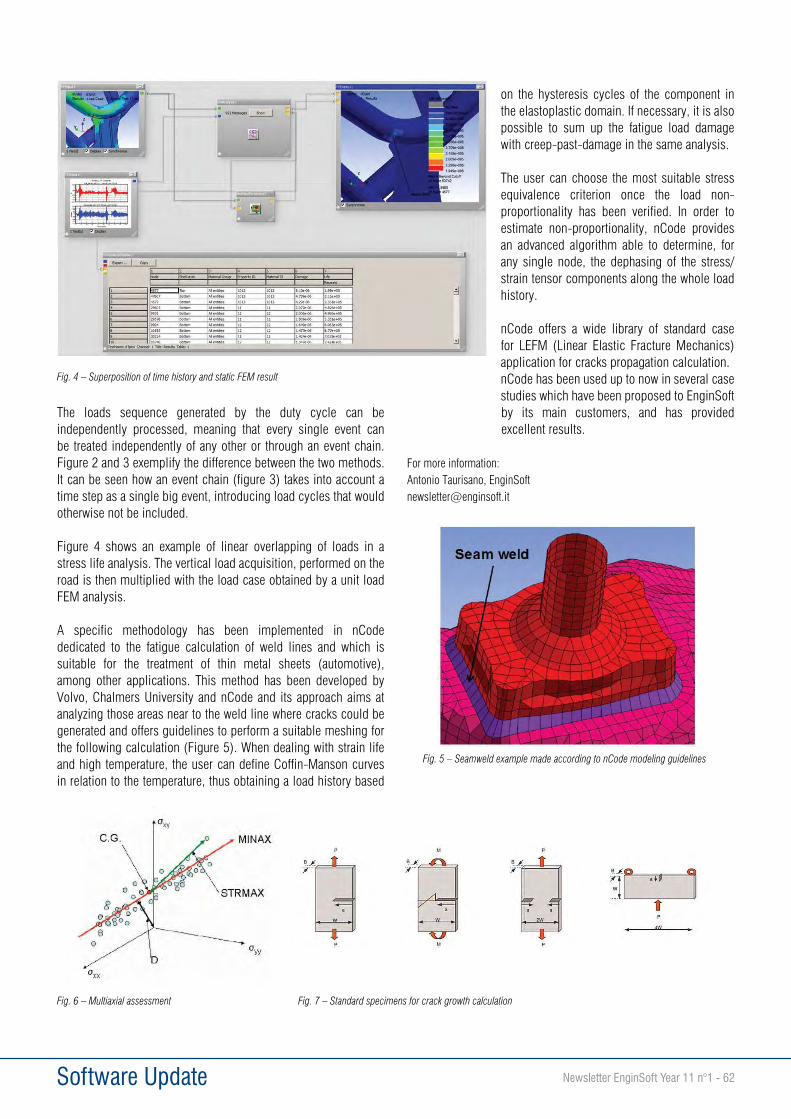
Software Update Newsletter EnginSoft Year 11 n°1 - 62
The loads sequence generated by the duty cycle can be independently processed, meaning that every single event can be treated independently of any other or through an event chain. Figure 2 and 3 exemplify the difference between the two methods. It can be seen how an event chain (figure 3) takes into account a time step as a single big event, introducing load cycles that would otherwise not be included.
Figure 4 shows an example of linear overlapping of loads in a stress life analysis. The vertical load acquisition, performed on the road is then multiplied with the load case obtained by a unit load FEM analysis.
A specific methodology has been implemented in nCode dedicated to the fatigue calculation of weld lines and which is suitable for the treatment of thin metal sheets (automotive), among other applications. This method has been developed by Volvo, Chalmers University and nCode and its approach aims at analyzing those areas near to the weld line where cracks could be generated and offers guidelines to perform a suitable meshing for the following calculation (Figure 5). When dealing with strain life and high temperature, the user can define Coffin-Manson curves in relation to the temperature, thus obtaining a load history based
on the hysteresis cycles of the component in the elastoplastic domain. If necessary, it is also possible to sum up the fatigue load damage with creep-past-damage in the same analysis. The user can choose the most suitable stress equivalence criterion once the load non-proportionality has been verified. In order to estimate non-proportionality, nCode provides an advanced algorithm able to determine, for any single node, the dephasing of the stress/strain tensor components along the whole load history.
nCode offers a wide library of standard case for LEFM (Linear Elastic Fracture Mechanics) application for cracks propagation calculation.nCode has been used up to now in several case studies which have been proposed to EnginSoft by its main customers, and has provided excellent results.
For more information:Antonio Taurisano, [email protected]
Fig. 4 – Superposition of time history and static FEM result
Fig. 5 – Seamweld example made according to nCode modeling guidelines
Fig. 6 – Multiaxial assessment Fig. 7 – Standard specimens for crack growth calculation

63 - Newsletter EnginSoft Year 11 n°1 Software Update
World leader in wind energy, Vestas Wind Systems A/S, has selected Sigmetrix’ CETOL 6 Sigma tolerance analysis solution and Sigmetrix’ GD&T Advisor as an integral part of its robust design and quality production initiative called Dimensional Management. This program is part of Vestas’ ongoing commitment to the development and production of cost effective, reliable, powerful wind turbines used to generate sustainable, wind energy worldwide.“As a leader in wind turbine manufacturing, robustness and quality is of the outmost importance to us and vital to the industry as the demand for more cost effective, reliable, green sources of energy continues to increase.” remarked Vestas Vice President of Engineering Integration Carl Erik Skjølstrup, “CETOL 6 Sigma and GD&T Advisor will play an integral part in improving our design robustness and the quality of wind energy solutions as well as optimizing our design and manufacturing goals. We look forward to working with Sigmetrix and ARIADNE as we initiate the enhancements to our R&D and quality production program for Dimensional Management.”CETOL 6 Sigma tolerance analysis software provides product development teams with the insight required to confidently release designs to manufacturing. Precise calculation of surface sensitivities exposes the critical-to-quality dimensions in the assembly. Utilizing advanced mathematical solutions, this tolerance analysis solution accelerates optimization to achieve robust designs ready for manufacturing.
“CETOL 6 Sigma is the dominant solution for variation analysis in many industries,” stated Sigmetrix President Chris Wilkes. “We’re excited to be incorporated into Vestas’ quality enhancement program and look forward to our involvement in the planning and manufacturing of their green energy solution products. We are proud to be partnering with ARIADNE Engineering as we assist Vestas with the integration of a complete GD&T and tolerance analysis solution into the design process.”For more information on CETOL 6 visit:http://www.sigmetrix.com/tolerance-analysis-software-cetol.htm
For more information on GD&T Advisor visit:http://www.sigmetrix.com/gdt-software/
About Sigmetrix, LLCSigmetrix is a global provider of comprehensive, easy-to-use software solutions that help users achieve robust designs through tolerance analysis and the correct application of GD&T. With over 20 years of research and development, Sigmetrix products eliminate the error between as designed assemblies and as produced products. For more information, visit their website at www.sigmetrix.com.
About Vestas Vestas has delivered wind energy in 73 countries, providing jobs for around 16,000 passionate people at our service and project sites, research facilities, factories and offices all over the world. With 62 percent more megawatts installed than our closest competitor and more than 60 GW of cumulative installed capacity worldwide, Vestas is the world leader in wind energy. For more information, visit their website at www.vestas.com.
About ARIADNE Engineering ABARIADNE Engineering AB is a provider of leading engineering CAD/CAE software, training and PLM-solutions to Scandinavian companies. Through its products and services, ARIADNE delivers added value to its customers and helps them to create better and innovative products more effectively. ARIADNE has operated in the Scandinavian market for20 years and has worked with Sigmetrix for 10 years. Its brand is well recognized within the field of mechanical engineering. For more information, visit their website at www.ariadne-eng.se/
For more information:Alessandro Festa, [email protected]
Vestas chooses Sigmetrix, LCC for Tolerance Analysis SolutionLeader in Wind Technology Employs CETOL 6 Sigma Solution for Enhanced Robust Design and Quality Production

Newsletter EnginSoft Year 11 n°1 - 64 Software Update
A significant collaboration agreement has been finalised between Ingeciber S.A., a Spanish company with a long tradition and a great reputation in Civil Engineering Simulation, and EnginSoft S.p.A.The agreement is targeted to extend their respective offerings in the Civil Engineering & Energy sector by combining technologies, technology enhancements, products and competencies to promote a comprehensive and unique simulation-based approach.Quite unlike the products of most manufacturing industries, civil engineering designs tend to be unique and bespoke – whether for new build or retrofit projects. The specific design challenges are also distinctive, requiring an up-front assessment of safety with respect to materials, construction sequences and working and environmental conditions, Many of the problem parameters are only partially known and difficult to describe, and the standards against which the designs must be assessed vary from country to country and from contractor to contractor. Nor are these Standards developed to support simulation-based evaluation. Numerical simulation in civil engineering is a league of its own.
The joint offering from EnginSoft and Ingeciber is targeted at complex project undertakings where numerical simulation can play a key role, such as large and light-weight roofing, power plants, bridges, site development and hydraulic works, off-shore structures, geomechanics, and situations where customized software technologies have to be implemented for special purposes. It will not address the trivial design problems, covered by software offered by a variety of small players or impacting only local markets.
About IngeciberFounded in Madrid in 1986, Ingeciber is by far the largest and best-established CAE player in the Iberian Peninsula. Ingeciber’s background lies in the application of simulation and testing to a variety of engineering fields, including mechanics, civil engineering, aerospace, automotive, naval, and more. A unique competence, established and systematically developed from the outset, is Ingeciber’s simulation-based approach to civil engineering. In this field Ingeciber has developed a variety of tools to satisfy a range of analysis requirements, from overall design down to local checks against design codes. This comprehensive software system is known as CivilFEM.It is through such protracted commitment along with the experience and reputation they have gained in the civil engineering sector that has earned Ingeciber the certificate of Application Qualified Supplier for the main Nuclear Industry companies such as AREVA NPP, Bechtel NPP and Westinghouse NPP.
Extended CAE Offering in the Civil Engineering&Energy Sector. A flagship of excellence in the international arena

Software Update65 - Newsletter EnginSoft Year 11 n°1
About ANSYS CivilFEMANSYS CivilFEM is the most comprehensive and advanced FE-based software system addressing the needs of civil and structural engineers. The system combines the state-of-the art general purpose structural analysis features of ANSYS and the unique and specific capabilities of CivilFEM in a single integrated environment, addressing a variety of design problems which are relevant to the civil engineering sectors in a broad sense.
ANSYS CivilFEM is divided into modules.The Bridges and Civil Nonlinearities module provides a complete solution for the bridge designers, includinga library of common bridge cross sections and wizards for the layout of a variety of structural shapes (e.g. suspension/cable stayed bridge), the generation of moving loads, and the post-processing of results in a sector-specific fashion.
The Advanced Prestressed Concrete module allows the user to rapidly and easily describe complex 3/D prestressed concrete structures, taking into account the pre-stressing actions and their evolution with time. This module includes a 3D Tendon Geometry Editor, the calculation of prestressing losses and the stress changes in the concrete after all the losses have been accounted for.
The Geotechnical module deals with 2/D and 3/D soil mechanics problems, and specifically with the soil-structure interaction, taking into account material and geometrical non-linearities, and offering wizards to ease the modelling and the analysis of tunnels, dams, piles and micro piles, foundation slabs, geotextiles-geogrids, reinforced soils, retaining structures, slope stability, and the like. Soil and rock libraries are included, as well as tools to generate and deal with layered soils, seepage, different constitutive laws, and more.
Besides these features, CivilFEM offers some unique tools which were designed on specification from the Nuclear Industry, such as the calculation of the seismic margin (following the ‘High confidence low probability of failure’ – HCLPF - approach), the design of the prestressed domes of the containment building enclosing the nuclear reactor, and a variety of checks according to the Nuclear Codes (ACI-349 and ACI-359).
For more information:Vito Boriolo, [email protected]
Fig. 2 - CivilFEM Geotechnical model example
Fig. 1 – Bridges and Civil Nonlinearities module
Images at the top of the article: Advanced Prestressed Concrete Module

Newsletter EnginSoft Year 11 n°1 - 66 Japan Column
JMAC (JMA Consultants Inc.) is the most established consulting firm in Japan and also supports a number of offices around the world which provide consulting services to local companies. Their main office in Europe is located in Milan, Italy.
Mr Tomoaki Onizuka, Senior Consultant at JMAC:I work in the Research Development & Engineering Innovating Force Department. Among our customers are many of the leading Japanese companies. We support and promote innovation management in R&D and product design in these companies. Our services help enterprises to compete globally. As part of our activities, we conduct research about new value creation every three years. While expectations in the R&D departments of the manufacturing industry have grown generally, we want to look at what factors R&D focuses on in Japan. To answer this question, I would like to explain some of the recent trends in R&D in Japan, by mentioning also the exact results of some of our studies.
1 A summary of the results regarding value creation in the future
1.1 The outline of the researchWe conduct this research every three years, to understand the reality of product competitiveness and what efforts are required to improve product competitiveness in the Japanese manufacturing industry. We have performed this study seven times so far.
What we describe here are mainly the results of the 135 answers to the survey
questions from 1600 Japanese companies.The survey consists of 7 topics: (1) Business environment and its characteristics, (2) Product competitiveness, (3) Product planning, (4) Cost innovation, (5) Business development in the global market, (6) Technical development, and (7) New business. In this article, I would like to introduce the following 4 topics “Product competitiveness”, “Product planning”, “Cost innovation” and “Technical development”.
1.2 The results for “Product competitiveness”In this research, we considered the product competitiveness from 4 different points of view: (1) Evaluation from the customer and the market, (2) Market share, (3) Profitability and (4) Price level compared to the competitors. Then we analyze the results.
R&D trends in the manufacturing industry in Japan
Fig 1 - Current and future focus in the manufacturing industry in Japan

Japan Column67 - Newsletter EnginSoft Year 11 n°1
(1) Evaluation from the customer and the marketThe result shows that 63% of respondents say “The customers are mostly satisfied with the products, and the evaluations from customers and the market are the same or higher than those for the competitors.” So, the self-evaluation is not so bad.
(2) Market shareWe can see that 45 % of the respondents possess the first market share, and the percentage reaches 61% if we include those respondents who have the second market share. This means that if companies possess only the third or fourth market share, they fall in business.
(3) ProfitabilityWhile 37% of the respondents have achieved goals for revenue and profit, another 37% have not reached either goals (less than 30%). Companies are polarized between moneymaking and shortfall.
(4) Price level compared to the competitorsMost respondents, which account for 65 %, answered that the products have the same price level as the products of the competitors. Typically, companies can offer their products at high prices, if their product competitiveness is high. However, only 19% of the respondents represented companies that are selling their own products at higher prices.
1.3 Diversification of product concept creationThe concept creation at the product planning stage is a very important element to increase product competitiveness. In industrial countries with mature markets like Japan, this makes the differentiation among competitors more difficult. We assume that the situation is the same in Europe. When we look at the current and future crucial factors for such markets, the following activities tend to increase:
• Close contact with leading and advanced customers.• Hypothesis verification for the customers at the planning stage.• Concept creation for opportunities linked to cross-industrial
co-operation.• Concept creation appealing to society’s values.
In contrast to traditional marketing styles, the recent trend shows activities to develop new values, in an open manner, through close contacts with customers and hypothesis verifications that are performed far more often than before.
1.4 The necessity of increasing levels at all stages of product development for cost innovationWith regard to cost reduction performances, we have asked the respondents to answer for different development stages. These include “Target value” and “Feasibility” in the target definition stage, “Concept design stage”, and “mass production stage”. The graph shows the 3 different levels, “less than 60%”, “from 60% to 100%” and “more than 100%”, of cost reduction performance, the results are illustrated in 3 colors for each stage.
The results reflect that there is a big difference in all stages between high performance and low performance companies. Low performance companies already define the target lower than the necessity at the first target definition stage, plus the value of feasibility and the value at the concept design stage are also low. Consequently, they are far away from their goal.
Fig 2 - Cost reduction performance
Fig 3 - Resource deployment of technology developments, which is separated from product development, with respect to “Target market” and “Development period”

Japan Column Newsletter EnginSoft Year 11 n°1 - 68
On the other hand, high performance companies define the goal higher than the necessity. Both, the value of feasibility and the value at the concept design stage, are about 90 % of the necessity, which is relatively high. As a result, their performance in the mass production stage is more than 100%.
For low performance companies, the definition of the goal is important. Yet, increasing feasibility is even more crucial. If the feasibility is low, the goal tends to be lower which leads to the result being lower than the necessity. This feasibility depends on how many items for cost reduction companies are able to introduce. In other words, what is important is how companies consider cost reduction by using advanced technology and simulation software. At the same time, modular design in such advanced technology developments to follow the diversification effectively, is key in the globalization of markets and competitors. Although advanced technology development and simulation software are usually applied to improve product functions and capabilities, high performance companies are also carrying out those measures for cost reduction and cost innovation.
Most likely, cost reduction will be required more highly in the future because of the growing power of emerging countries and the increase of production for developing countries. In such circumstances, the activities in the advanced technology development stages create the differences for some of the later phases.
1.5 Technology development is shifting to new markets and long term orientationWe conducted a survey about the resource deployment of technology developments, which is different from product development, as far as “Target market” and “Development period” are concerned.
(1) Target market (Existing market / New market)Currently, 66% of technology development is for the existing market. This will decrease to 59% while the percentage for the new market is expected to increase.
(2) Development period (1– 3 years / 4 – 6 years / more than 6 years)At present, the resources for short-term oriented development of 1 – 3 years occupy 65%. This figure will decrease to 51% in the future while the resources for long-term oriented development will increase by 7% for 4 – 6 years and by 7% for more than 6 years.
The main resources are still used for the current business; another strong focus is on R&D and technology developments for new business.
We should also mention that as of late companies are required to consider the business model and business framework at a stage when the technology development has been completed from the R&D phase. This means that enterprises have to change their traditional organization and management structure.
We have also noticed that the key motivation not only focuses on the improvement of R&D and technology developments in the short-term, it also leads to an emphasis on long-term issues. While basic research
is carried out by collaborating with universities, applied research and applied developments, which produce new differentiated and value-creation elements, it tends to be more focused and requires more time. The reason can be seen in the fact that only a little improvement will not significantly influence the creation of products in a highly competitive environment.
2 The R&D management trends in the Japanese manufacturing industry in the futureBased on the above survey, we can foresee the following R&D management trends in the Japanese manufacturing industry in the future :
2.1 Product planning• Placing importance on activities that create new value by
working closely with key customers• Placing importance on activities that involve co-operation with
different industries and competitors, rather than just acting within the company.
2.2 Cost innovation• It will become even more important to reduce costs by applying
simulation technologies at the early stages of the product development process.
• More activities and efforts will have to focus on cost reduction in the precedent technology developments before the actual product development phase. It is important to deal with the modular design method effectively at this stage to increase the earning power by taking the global market into consideration.
• Research and development, technology development
Currently, the main resources are used for research and development, and technology developments in the short-term. In a 2nd step, companies focus on new business and long-term objectives.
ConclusionsThe impact of the Japanese manufacturing industry on the global market tends to decline. Yet, we still maintain a strong presence in fields such as automotive, electronic components, and material industries. We are increasing competitiveness in these core business sectors by cooperating with other industries.
At JMAC, we support our customers to strengthen their development performances, and we are also interested in working with the readers of this Newsletter - Please contact us if you see any opportunities for collaboration!
Mr Tomoaki OnizukaSenior Consultant
Senior Vice President of the Research Development & Engineering Innovating Force Department
JMA Consultants Inc.
For more information, please e-mail:[email protected]
Images Courtesy of JAMAC Europe

69 - Newsletter EnginSoft Year 11 n°1 Research and Technology Transfer
Starting from October 2013, EnginSoft is partnering the COGAN– COmpetency in Geotechnical Analysis project. The project partnership is composed of companies and institutions active in the construction, geotechnics and numerical analysis sectors: NAFEMS (UK – project coordinator), GeoFEM (Cyprus), Skanska (Sweden), MottMacDonald (UK), Terrasolum (Spain), TU Graz (Austria), WeSI Geotecnica (Italy) and EnginSoft (Italy). The COGAN project, co-funded by the European Commission through its Leonardo Da Vinci FP7 programme, is coordinated by NAFEMS, a not-for-profit organisation whose mission includes the promotion of the safe and reliable use of engineering simulation analysis. COGAN builds on the successful CCOPPS and EASIT2 projects.
The CCOPPS project was aimed at defining a set of competencies, a competency certification and related training materials for the power and pressure systems industry. EASIT2 built on CCOPPS experience in order to deliver a set of tools for competency tracking, management and certification covering the full spectrum of the analysis and simulation industry: this resulted in a set of Professional Simulation Engineer (PSE) products, including the PSE Competencies, the PSE Competency Tracker competence management software and the PSE Certification scheme.The main aim of the COGAN project is to improve competency in geotechnical analysis.
The project aims to achieve this result by:• defining the minimum user competences required for the safe
implementation of analysis software to the geotechnical problems;• identifying training material to help gain these competences;• providing a web-based platform for viewing competences and
training material and tracking learning progresses;• preparing and run e-learning courses in key areas.
The project will achieve its objectives by setting out a database of the knowledge and skills that a competent simulation engineer should possess for geotechnical engineering. Additionally, it will develop a software framework for tracking and recording the relevant skills. The project will also produce e-Learning modules covering key technical areas. The competencies will be subdivided into categories and accompanied by bibliographic references for suitable educational resources, in order to allow direct access to book, papers, courses and the like.Additionally the project aims to produce and test two e-learning modules that will provide some of the identified competencies directly and which will also represent a template for the development of additional training material on the subject by education providers. In order to guarantee the accurate identification of the needs of industry regarding geotechnical analysis, a survey has already been finalized and launched. The survey received a strong response indicating a high level of interest in the project and the deliverables. In fact, more than 600 geotechnical analysts from across Europe participated in the survey, helping ensure that the future deliverables will meet needs of industry. The results of the survey are currently being evaluated by the project partners and will be used to shape the project deliverables. For further information about COGAN please visit: http://www.cogan.eu.com
For more information:Giovanni Borzi, [email protected]
EnginSoft joins the COmpetency in Geotechnical ANalysis – COGAN project

Training Newsletter EnginSoft Year 11 n°1 - 70
EnginSoft, through its Openeering.com initiative, has recently published the SBB - Scilab Black Belt web based course.
Scilab is the worldwide Open Source reference for numerical computation and simulation software. It is a free software, usually compared to MATLAB® because their languages and functionalities are very similar. Scilab provides a powerful computing environment for engineering and scientific applications in the areas of applied mathematics, simulation, visualization, optimization, statistics, control system design and analysis, signal processing, etc. Scilab allows also to develop custom standalone applications that can directly benefit from the wealth of features and modules also freely available and easily pluggable (ATOMS modules, also referred as “toolboxes”).The Scilab Black Belt course is designed to teach Scilab in depth, with the aim to provide a systematic approach to the Scilab framework and features: as such, it is designed not only for the Scilab newcomer but also to benefit the current Scilab user.
The Scilab Black Belt course is organized in 9 learning units, covering the following program:• Introduction to the Scilab environment.• Matrices.• Graphics.• Programming.• Data types.• Advanced programming.• ATOMS modules development.• Numerics.• Suggested Scilab projects.
The Scilab Black Belt course allows you to access high quality Scilab lectures at any time, and therefore to learn at your own pace, anywhere (for example while traveling or commuting). Each lecture is accompanied by hands on exercises, that include instructions, source code samples and data.
Each unit of the course features a dedicated forum (“Ask the expert”) that is designed to put you in direct contact with the Openeering.com team. Successful completion of the course will earn you the course diploma, and will get you ready for the Certified Scilab Professional exam.
The Scilab Black Belt course provides a cost and time effective learning solution. Download the latest version of Scilab for free from the http://www.scilab.org website on your device, join the Scilab Black Belt course and start learning today!For more information and subscription instructions please visit http://www.openeering.com
For more information:[email protected]
Become a Scilab expert today!

71 - Newsletter EnginSoft Year 11 n°1
2014 CAE EVENTS Stay tuned to:www.enginsoft.it/eventi - www.enginsoft.com/events/for the complete program of the events in 2014
Events
EVENT CALENDAR
Your FREE Newsletter CopyDo you want to receive a free printed copy of the EnginSoft Newsletter?Just scan the QRcode or connect to: www.enginsoft.it/nl
CAE WEBINARS 2014
EnginSoft continues the proposal of the CAE Webinar on specific topics of the virtual prototyping technologies, next topics: ANSYS CFX 15 - L’arte del Meshing nelle funzionalità di ANSYS R15.0 e come affrontare le tipiche complessità geometriche - ANSYS Fluent R15.0: novità del softwareStay tuned to www.enginsoft.it/webinarfor the complete program of webinars. The podcasts on past CAE Webinars are available at: www.enginsoft.it/webinar
June 11-13, 2014 Verona, ItalyMETEF 2014 http://www.metef.comExpo of customized technology for the aluminium&innovative metals industry. EnginSoft will be present with a booth.
October, 2014International CAE Conference http://www.caeconference.comEnginSoft will be the main sponsor of the International CAE Conference. Many of our engineers will be engaged in presenting industrial case histories during the parallel sessions of the Conference and technology updates during the workshops.
April 1-3, 2014 Torino, ItalyEXPO FERROVIARIA http://www.expoferroviaria.comEngin@Fire, a joint venture between EnginSoft, Desa and Lapi, will foster Safety Value Added Services and Product to the railways industry.
April 16-17, 2014 Torino, ItalyAFFIDABILITA’ E TECNOLOGIEhttp://www.affidabilita.euThe event is mainly focus on Innovative Technologies, Solutions, Instrumentation and Services for Competitive Manufacturers. EnginSoft will participate as member of MESAP association.
May 12-13, 2014 Trieste, ItalymodeFRONTIER International Users Meeting http://www.esteco.com/um14A conference dedicated to showcasing how modeFRONTIER has benefitted many users, providing them with a competitive edge throughout the product design process. EnginSoft and leading customers will participate with a wide range of technical contains and papers.
May 27-28, 2014 Graz, ItalyGraz Symposium Virtuelles Fahrzeug http://gsvf.at/cms/The Interdisciplinary Development of Road and Rail Vehicles symposium, provides to the participants Processes, Methods, Tools, Best Practices aimed to develop the next coming vehicle. EnginSoft will be exhibiting at our dedicated booth and presenting a paper at the event.
May 23-24, 2014 ItalyANSYS Users MeetingThis is the dedicated ANSYS Users Meeting for Italian users. EnginSoft will attend the initiative to provide participants with the latest developments and overview of Release 15.0.
May 7-9, 2014 Milano, ItalyICRF - Ingot Casting Rolling Forginghttp://www.aimnet.it/icrf2014.htmEnginSoft will present with a customer a paper on an innovative approach to design the hot ring rolling processes.Our experts will also be available at the Transvalor booth.
April 23, 2014 UKThe Engineering Simulation Showhttp://www.theengineeringsimulationshow.co.uk/EnginSoft are key sponsors of the Engineering Simulation Show, where you have the opportunity to meet our complex simulation experts at our stand OR11 or attend our the specialist sessions at Pod 6.

Your opportunityto be part
of the future!
Turin, October 27-28, 2014
www.caeconference.com