newsletter enginsoft - 11-2
DESCRIPTION
Newsletter EnginSoft - 11-2TRANSCRIPT

Two major events coming
together for the most significant
occasion in the Italian CAE Calendar
Tyre set-up for commercial vehicle
multi-body model: modeFRONTIER
as a calibration tool
Optimization Under Uncertainty
of Wind Turbines
Tecniche di modellazione
in Maxwell 14
MELiSSA PROJECT:
Plant Growing
Environment
Characterization
EnginSoft Gained a
New Partner:
M E S.r.l.3
Weather Forecasting
with Scilab
Year 8 n°2 Summer 2011
Ottimizzazione di ponti in curva
in struttura composta acciaio-calcestruzzo


EnginSoft FlashWhat is or what does CAE mean today?Where are we, the CAE Users, going? You may think that questions like thesesound rather philosophical, and I agreewith you. However, in our hectic professional livesand fast changing “CAE environments”these are the thoughts that hit many of usat times, and they make us wonder:
What is the right approach in the mid tolong term, from a technological, abusiness, a human point of view?
Having seen the recent worldwide financialcrisis and changing public views, such asthe growing belief in our nature’s resourcesand renewable energies, at EnginSoft, we believe that nowis the time to foster an even more holistic model for ourcustomers: state-of-the-art technologies complementedby a network of sound expertise, first-class support andservices along with a tailored training program.
In this light, EnginSoft and ANSYS Italy are proud towelcome users of engineering analysis and simulation tothis year’s International Conference and ANSYS ItalianUsers’ Meeting. The events will provide a culmination ofviews, engineering expertise and experiences from whicheverybody in the audience will benefit: user, developer,vendor, manager, engineer, scientist, researcher andstudent.
With this Summer Edition of the Newsletter, we would liketo give our readers a foretaste of what the Conferences inVerona will cover, among many other topics anddisciplines:
Iveco, a global leader in commercial vehicles, presentsmodeFRONTIER as a calibration tool while the Universityof Nantes, France, reports on Genetic AlgorithmOptimization for Soil Parameter Identification. StandfordUniversity and Università Federico II di Napoli explain theimportant role of optimization in the design of WindTurbines. Uniconfort produces plants for the energyconversion of biomass, this Newsletter features theirapplications with ANSYS CFX and ANSYS Mechanical. TheUniversità degli Studi di Trieste tell us about theiroptimization work for reinforced concrete.
With our Software News we would like to provide anupdate on ANSYS Maxwell 14, ANSYS Composite Pre-Postv.13.0 and Flowmaster V7.8. Fabiano Maggio fromEnginSoft Padova, demonstrates how ANSYS Workbench
and modeFRONTIER work together, efficientlyand successfully. We hear more about Scilab, its solution forthe cutting stock problem, and how thesoftware can even contribute to the weatherforecast! The use of the Forge software atFEAT Group and Gnutti Cirillo S.p.a. isillustrated in our in-depth study and successstory.
We inform our readers about EnginSoft’s rolein the MELiSSA Project, a developmentprogram for an artificial ecosystem.Moreover, we outline the successfulcompletion of the New Aero Engine CoreConcepts’ (NEWAC) Project which our CFDTeam was supporting heavily since 2005.
Our Corporate News report about the close collaboration ofUniversity of Cranfield and EnginSoft UK and how bothsupport, as key partners, the EPSRC Centre for InnovationManufacturing in Through-life Engineering Services. Wehear about EnginSoft’s new partner M3E which stands for“Mathematical Methods and Models for Engineering”. OurBook Review this time presents a recommendation by ATAon Fiat and the technological innovation of theautomobile.
Our Japan Column helps us to understand the people ofTohoku and the beauty of their homeland.While we admire their unbeaten will and strength toovercome the severe consequences of the recent naturaldisasters, we know that they will succeed because theysupport each another, their land, their nation - theirvalues.
We close this Newsletter with the Event Calendar and therecent conference and fair highlights including the ParisAir Show, the Wind Turbine Technology Forum and theTransvalor Users’ Meeting in Cannes.
Now, let us explore together how CAE and VirtualPrototyping can be true assets for our businesses andsubstantial successes in the future! Please refer to ourConference and Exhibitor Announcements on the followingpages and register in time on www.caeconference.com
The Editorial Team, EnginSoft and ANSYS Italy lookforward to welcoming you to Verona in beautiful Venetothis October!
Stefano OdorizziEditor in chief
Ing. Stefano OdorizziEnginSoft CEO and President
Newsletter EnginSoft Year 8 n°2 - 3
6 2011 EnginSoft International Conference: CAE TECHNOLOGIES FOR INDUSTRY
8 Tyre set-up for commercial vehicle multi-body model: modeFRONTIER as a calibration tool
11 Genetic Algorithm Optimization for Soil Parameter Identification As Applied to a Spread Footing Test
14 Optimization Under Uncertainty of Wind Turbines
18 Ottimizzazione cinematica di una pressa meccanica link-drive con tecnologia ANSYS Workbench emodeFRONTIER
22 Ottimizzazione di ponti in curva in struttura composta acciaio-calcestruzzo
26 Higher Energy Recovery and Longer Life for Heat Exchangers
29 ANSYS Composite Pre-Post v.13.0: lo stato dell’arte nella progettazione e nell’analisi delle strutture in mate-riale composito
31 Tecniche di modellazione in Maxwell 14
34 Flowmaster V7.8
36 MELiSSA PROJECT: Plant Growing Environment Characterization
40 EnginSoft Successfully Finishes the NEWAC Project
42 Optimization? Do It with Scilab!
47 Weather Forecasting with Scilab
51 Ottimizzare il processo per ottenere dei componenti stampati di elevata qualità: esperienze di simulazione distampaggio a caldo di acciaio con pressa o maglio
58 GNUTTI CIRILLO: Elevato standard qualitativo, orgogliosamente “Made in Italy”
59 Tohoku, the Beauty of Japan
4 - Newsletter EnginSoft Year 8 n°2
Sommario - Contents
The EnginSoft Newsletter editions contain references to the followingproducts which are trademarks or registered trademarks of their respec-tive owners:ANSYS, ANSYS Workbench, AUTODYN, CFX, FLUENT and any and all
ANSYS, Inc. brand, product, service and feature names, logos and slogans are
registered trademarks or trademarks of ANSYS, Inc. or its subsidiaries in the
United States or other countries. [ICEM CFD is a trademark used by ANSYS,
Inc. under license]. (www.ansys.com)
modeFRONTIER is a trademark of ESTECO srl (www.esteco.com)
Flowmaster is a registered trademark of The Flowmaster Group BV in the
USA and Korea. (www.flowmaster.com)
MAGMASOFT is a trademark of MAGMA GmbH. (www.magmasoft.de)
ESAComp is a trademark of Componeering Inc.
(www.componeering.com)
Forge and Coldform are trademarks of Transvalor S.A.
(www.transvalor.com)
AdvantEdge is a trademark of Third Wave Systems .
(www.thirdwavesys.com)
LS-DYNA is a trademark of Livermore Software Technology Corporation.
(www.lstc.com)
SCULPTOR is a trademark of Optimal Solutions Software, LLC
(www.optimalsolutions.us)
Grapheur is a product of Reactive Search SrL, a partner of EnginSoft
(www.grapheur.com)
For more information, please contact the Editorial Team
CASE STUDIES
IN DEPTH STUDIES
RESEARCH & TECHNOLOGY TRANSFER
SOFTWARE NEWS
TESTIMONIAL
JAPAN CAE COLUMN
Newsletter EnginSoftYear 8 n°2 - Summer 2011To receive a free copy of the next EnginSoft
Newsletters, please contact our Marketing office at:
All pictures are protected by copyright. Any reproduction
of these pictures in any media and by any means is
forbidden unless written authorization by EnginSoft has
been obtained beforehand.
©Copyright EnginSoft Newsletter.
AdvertisementFor advertising opportunities, please contact our
Marketing office at: [email protected]
EnginSoft S.p.A.24126 BERGAMO c/o Parco Scientifico Tecnologico
Kilometro Rosso - Edificio A1, Via Stezzano 87
Tel. +39 035 368711 • Fax +39 0461 979215
50127 FIRENZE Via Panciatichi, 40
Tel. +39 055 4376113 • Fax +39 0461 979216
35129 PADOVA Via Giambellino, 7
Tel. +39 49 7705311 • Fax 39 0461 979217
72023 MESAGNE (BRINDISI) Via A. Murri, 2 - Z.I.
Tel. +39 0831 730194 • Fax +39 0461 979224
38123 TRENTO fraz. Mattarello - Via della Stazione, 27
Tel. +39 0461 915391 • Fax +39 0461 979201
www.enginsoft.it - www.enginsoft.com
e-mail: [email protected]
COMPANY INTERESTSESTECO srl
34016 TRIESTE Area Science Park • Padriciano 99
Tel. +39 040 3755548 • Fax +39 040 3755549
www.esteco.com
CONSORZIO TCN
38123 TRENTO Via della Stazione, 27 - fraz. Mattarello
Tel. +39 0461 915391 • Fax +39 0461 979201
www.consorziotcn.it
EnginSoft GmbH - Germany
EnginSoft UK - United Kingdom
EnginSoft France - France
EnginSoft Nordic - Sweden
Aperio Tecnologia en Ingenieria - Spain
www.enginsoft.com
ASSOCIATION INTERESTSNAFEMS International
www.nafems.it
www.nafems.org
TechNet Alliance
www.technet-alliance.com
RESPONSIBLE DIRECTOR
Stefano Odorizzi - [email protected]
PRINTING
Grafiche Dal Piaz - Trento
The EnginSoft NEWSLETTER is a quarterly magazine published by EnginSoft SpA
Newsletter EnginSoft Year 8 n°2 - 5
Auto
rizz
azio
ne d
el T
ribu
nale
di
Tren
to n
° 13
53 R
S di
dat
a 2/
4/20
08
61 EnginSoft UK Key Partners with Cranfield University
62 EnginSoft Gained a New Partner: M3E S.r.l.,
63 FIAT: Storie di Innovazione Tecnologica nelle Automobili
64 Nuove pubblicazioni di NAFEMS
65 TechNet Alliance Spring Meeting 2011
66 La piattaforma SW Benimpact Suite di Enginsoft premiataalla mostra-concorso Fare Green
68 EnginSoft France Presents Flowmaster V7.8 Aerospaceand modeFRONTIER V4.4 to the Aerospace Industries
69 Il “Forge Italian Team” è presente a Cannes per lo Users’Meeting 2011 di Transvalor
69 Grande successo di WTT 2011
70 EnginSoft Event Calendar
71 12th International Summer School on Aluminum AlloyTechnology
EVENTS
CORPORATE NEWS
BOOK REVIEWS
PAGE 14 OPTIMIZATION UNDER
UNCENRTAINTY OF WIND TURBINES
PAGE 47 WEATHER
FORECASTING WITH SCILAB
PAGE 8 TYRE SET-UP FOR COMMERCIAL
VEHICLE MULTI-BODY MODEL:
modeFRONTIER AS A CALIBRATION TOOL
What is or what does CAE mean today? What is the impact ofVirtual Prototyping or the so-called “Engineering Simulation”on today’s product development and manufacturing cycles?Where are we, the CAE Users, going? What are the newparadigms of the application environments? …and, aboveall, is this a continuing evolution that answers the needs ofindustry, and more generally speaking, the needs of an everchanging economic and market environment? Thesequestions are debated at the Conference that EnginSoft isorganizing for 27 years, true to our values and tradition toprovide realistic and tangible insights into what theevolution is about.
The software technologies we are discussing certainly play animportant role in the challenges you are facing to innovateyour business. But there is more than just technology toconsider: the enablers on the business front, e.g.organizational, technological and human aspects that carrythese technologies to their very role for the success of yourbusiness!
Are we dealing with “commodities” of the design process,tools for which there is demand, but which are suppliedwithout any qualitative differentiation across their market?Or: could these technologies become true “assets” and thusgive your business a competitive edge? What should be doneto reach this goal? How should corporations and employeesre-engineer themselves? What is the role of the technologytransfer operators in this context?
All this will be discussed and answered by the conferencethemes, they will offer to the attendees:• an up-to-date critical overview of the topics and their
operational contexts, through various contributions byexecutives from industry, research, academia andtechnology providers;
• a Think Tank, chaired by experts, focused on the issuesof accuracy, reliability, accessibility and applicability ofEngineering Simulation, and hence on the possibilities ofbecoming a true asset of the design process;
• an exhibition, unprecedented in the sector in Italy,where software vendors and providers of complementaryservices and products, will showcase their new solutionsand share their visions and strategies with the attendees;
• an informal environment where delegates, technologyproviders, managers and experts can meet and shareexperiences, address key industry issues and challenges,and find new business opportunities.
As a tradition and to add further value to the occasion, theEnginSoft Conference will run concurrently with the ANSYSItalian Conference. In fact, ANSYS is the premier technologypartner of EnginSoft, and the major [FEA] software vendor
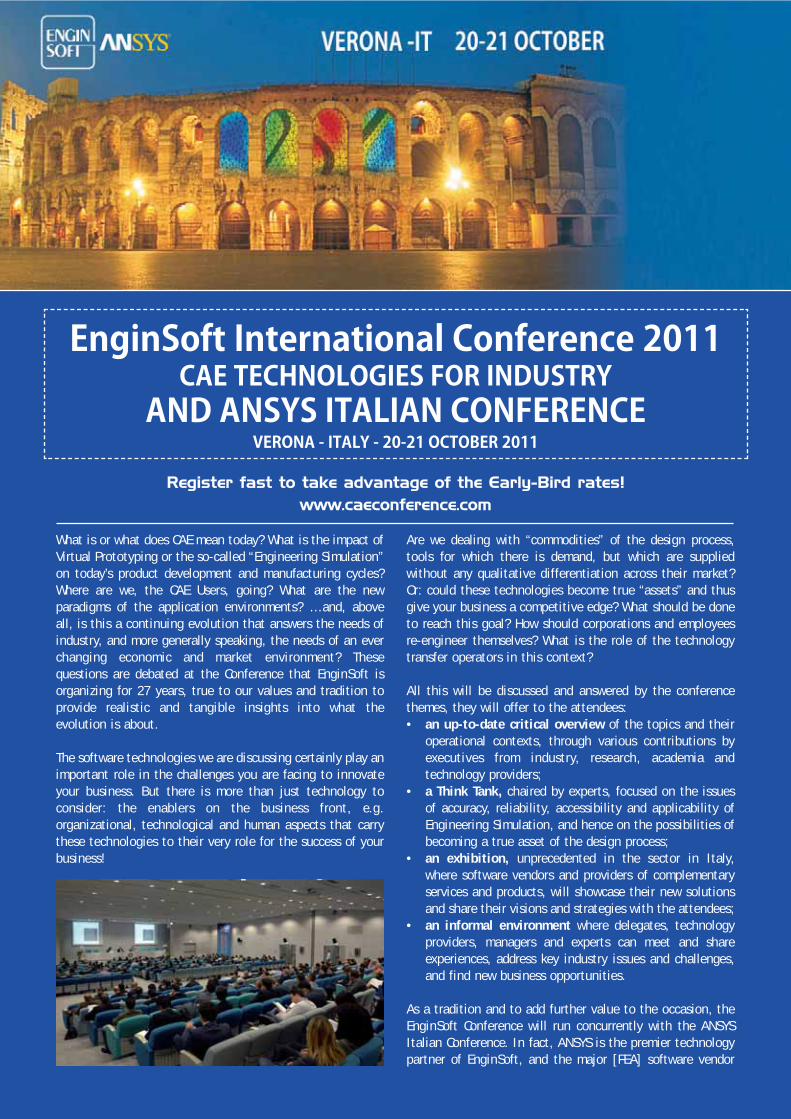
EnginSoft International Conference 2011CAE TECHNOLOGIES FOR INDUSTRY
AND ANSYS ITALIAN CONFERENCEVERONA ‑ ITALY ‑ 20‑21 OCTOBER 2011
Register fast to take advantage of the Early-Bird rates!www.caeconference.com

worldwide. When we speak about ANSYS today, we mean themost complete, co-ordinated, structured, and solid CAEtechnology available on the market. The combination of theEnginSoft and the ANSYS offering delivers to industryunprecedented and unsurpassable values, and the true “key”to the integration of simulation into the design andproduction process.
Don’t miss the 2 events! The 2011 event promises again tobe the country’s premier conference on EngineeringSimulation, and one of the most important events of its kindglobally.
CALL for PAPERS: The event organizers welcomecontributions on CAE Technology applications. Papers can besubmitted on-line, following the guidelines given on themeeting website: http://www.caeconference.com. Deadlinefor abstract submission: 30th June 2011; Deadline for finalpaper submission: 30th September 2011.
REGISTRATION: The registration fee is € 300,00. Early birdregistration fee is € 200,00 until 5th September 2011.
For any further information, please visit the official website: http://www.caeconference.com
or please contact:Luisa Cunico - EnginSoft SpAMarketing & Communication Office Ph: +39 0461 [email protected]
®GOLD SPONSORS
Ansaldo Breda Advanced CAE Design for increasing Railway Vehicles Fire Safety Level
Ansaldo Energia New materials and their constitutive models in Ansys. Experience in plasticity and viscoplasticity through z-Ansys.
ANSYS Overcoming the Challenges of Hybrid/Electric Vehicle Traction Motor Design
CADFEM Effective Electrothermal Simulation for Battery Pack and PowerElectronics in HEV/EV
CADFEM Swisse - IMI Nuclear Comparison of hydrodynamic mass for CFD-coupled analyses
CIRA - SUN Second Universityof Naples
Cohesive Zone Material model in ANSYS: a sensitivity analysis on a DCBtest case
Coretech System Integration of Injection Molding and Structure CAE for Mold Deformation Analysis
D'Apollonia Computational coupled procedure for probabilistic design of ceramic-based radomes under hypersonic loading
Dynamore New Features and Directions in Crash Simulation with LS-DYNA
Franco Tosi Meccanica Modeling different contact conditions in blade rows of turbomachinery
Key To Metals Development of a Database for Stress-Strain Curves and Cyclic Properties
Lombardini Motori A novel approach to simplified representation of threaded connections
Magneti Marelli Gasket FEA analysis for AIM application
MTA Numerical modeling of Automotive Fuses Melting Time
Nuovo Pignone Acoustic Simulation and Optimization of Silencing Systems for Gas Turbine Plants
Piaggio CAE analysis of a scooter crankshaft
Pierburg Pump Technology Modal Analysis Correlation By Means Of FEM Approaches
Pierburg Pump Technology Evaluation of the Lifetime of an Automotive Vacuum Pump Housing
Trasfor Fatigue Assessment of a Magnetic Component for Railway Application
Università di Padova Simulation and energy saving in simple solar collector with reflectivepanels and boiler
University of Malta Experimental Validation of Finite Element Simulations to predict WeldingInduced Residual Stresses
MECHANICAL SESSION
PROVISIONAL LIST OF PAPERS (updated on 19th July)
Ansaldo Breda Thermal comfort in Driverless Light Metro: CFD simulations versus expe-rimental data from climate chamber tests
Ansaldo Nucleare Analysis of the Sloshing of a Large Tank with design-basis andFukushima-like Seismic Excitations
ANSYS ANSYS fluid dynamics software at ANSYS 14.0
ANSYS UK Engineering Simulation For Unmanned Vehicle Design and Development
CINECA Porting, enabling and parallel performance of OpenFOAM on PLX's CINECA cluster
CRF - Centro Ricerche Fiat Fluid refrigerant leak in a cabin compartment: risk assessment by CFD approach
EnginSoft MELiSSA Project: plant growing environment characterization
EnginSoft GmBH Morphological Shape Optimization of a Multi-Element, Down-ForceGenerating Wing
Magneti Marelli SMART COOLING AIM Heat Exchanger Methodologies
Magneti Marelli Design Optimization Inverter Device
Nuovo Pignone Combined 1D & 3D CFD Approach for GT Ventilation System analysis
Piaggio The use of Ansys CFX to optimise the cooling circuit of an internal com-bustion engine - 2nd part: thermal analysis
SNECMA SNECMA: Time compression with ANSYS Workbench
SUPSI - Politecnico Torino Effects of Packed Bed Transport Properties Modeling on CFD Simulationsof a Short Contact Time Reactor for Methane Catalytic Partial Oxidation
Tecniplast Laminar flow cabinet study
Tetra Pak Modelling of a packaging machine filling system using a hierarchical approach
Università Bologna Improving the design and the separation performances of membranemodules for H2 purification by CFD simulations
Università di Ferrara Numerical Analysis of a Micro Gas Turbine Combustor fed by liquid fuels
Università di Genova -Consorzio SIRE
Engine exhaust jets redeseign for the P180 aircraft using multidisciplinary simulations
Università di Roma - Tor Vergata Fluid Structure Interaction (FSI) with RBF Morph: a Generic Formula 1 Front End
Università di Padova Effect of Airfoil Geometry on Darrieus Vertical-Axis Wind Turbine Performance
Zeco Virtual Testing of a Plant with Hydro Francis Turbine
CFD SESSION
Ansaldo Breda Structural optimization of new high speed train V300 Zefiro
Casappa Optimization of the valveplate geometry for a variable displacement axialpiston pump in case of multiple design constraints
CIRA Synergy between LS-DYNA and modeFRONTIER to predict low velocityimpact damage on CFRP plates
Continental Multi-Objective Virtual Optimization for a target GDI injector nozzle flowachievement
IVECO Tyre set-up for commercial vehicle multibody model: modeFrontier as acalibration tool
M3E Evaluation of the environmental impact of underground gas storage andsequestration
RFI Optimization of solar energy captation
Tetra Pak Integration of a fully 3D CFD model in a lumped parameter system simulation through the use of an explorative DOE methodology
Università di Bologna - Ferrari Numerical optimization of the exhaust ow of a high-perfomance engine
University of Salento modeFRONTIER analysis for reducing emissions of PCDD/F in a sintering ore plant
University of Salento Optimized solar collectors for nanofluids applications
University of Salento Multi Objective optimization of steel case hardening
OPTIMIZATION SESSION
8 - Newsletter EnginSoft Year 8 n°2
Iveco is an international leader in the development,manufacture, marketing and servicing of a vast range oflight, medium and heavy commercial vehicles. It is endowedwith a worldwide commercial network of sale outlets andservice points, and strives to provide its customers withclass-leading performances. Iveco currently employs over25000 people all over the world and is present in all fivecontinents. Its products have been renowned for many yearsas a valuable work tool for the most diverse applications.
IntroductionReliability is perhaps the most important feature requiredfrom a commercial vehicle, and it must be guaranteedeven on the most challenging missions without sacrificingride comfort. To address these issues, in the VirtualAnalysis Department of Iveco we developed multi-bodymodels in order to predict vehicle robustness and comfortsince the earliest product development stages. In suchmodels, tyres are one of the most critical components toset up, since their effect on the global vehicle behaviouris remarkable and their modelling very complex. There is currently a great variety of tyre models availableto simulate tyre behaviour in multi-body simulations: theone used for this study is Ftire [1]. Ftire is a physicalmodel which describes the most important tyrephenomena, encompassing stiffness nonlinearities, ringflexibility, internal damping, friction, and so on. A veryuseful feature of Ftire, which makes its use intuitive, isthat its input parameters are physical quantities and notjust numerical coefficients. These parameters, however,are not fed directly into the tyre model, but are pre-processed to build a mechanical system whose behaviourreflects the original input characteristics. This aspectconstitutes a complication in the model set-up, since thepassage from input parameters to model is not immediate,with possibly significant interactions among parameters.To fully exploit Ftire potentialities, it is necessarytherefore to make use of a tool which allows managingcorrectly such a complex model.
In this article, we describe our experience in usingmodeFRONTIER as a tool for calibrating Ftire models. Theultimate goal was to achieve a good numerical-experimental correlation in order to make significantreliability and comfort predictions by means of multi-bodymodels. The vehicle used throughout the analysis is anIveco Daily Van.
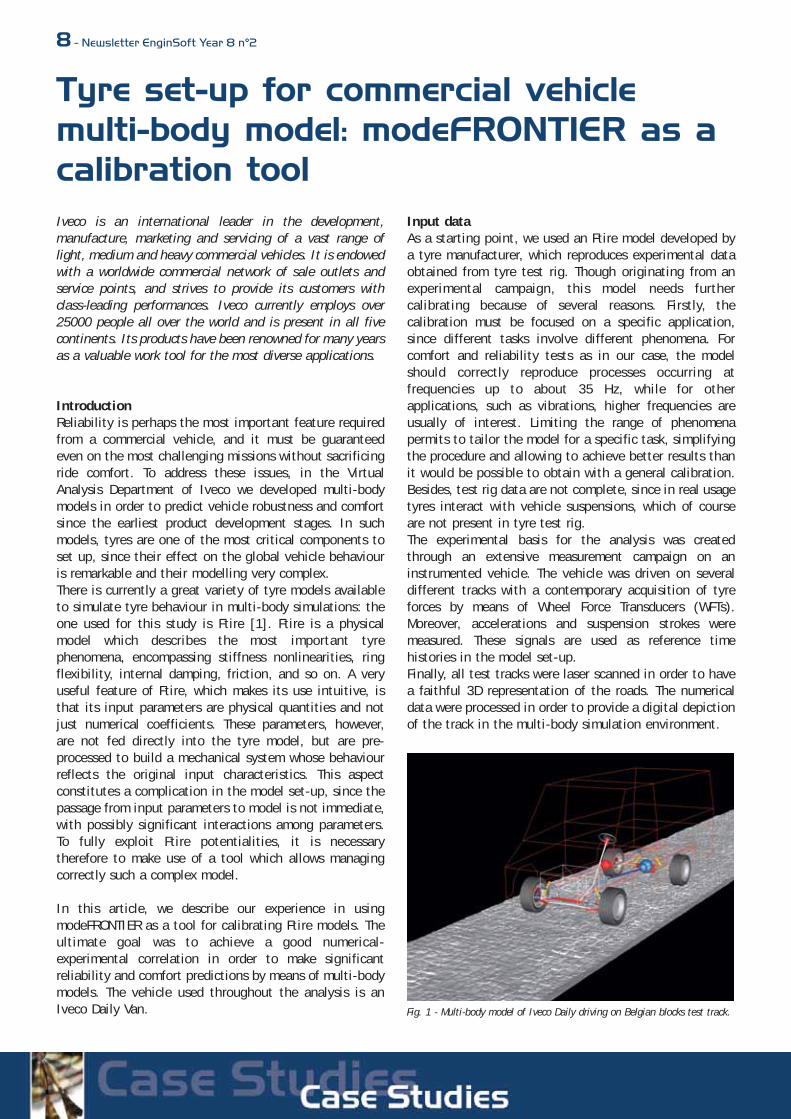
Input data As a starting point, we used an Ftire model developed bya tyre manufacturer, which reproduces experimental dataobtained from tyre test rig. Though originating from anexperimental campaign, this model needs furthercalibrating because of several reasons. Firstly, thecalibration must be focused on a specific application,since different tasks involve different phenomena. Forcomfort and reliability tests as in our case, the modelshould correctly reproduce processes occurring atfrequencies up to about 35 Hz, while for otherapplications, such as vibrations, higher frequencies areusually of interest. Limiting the range of phenomenapermits to tailor the model for a specific task, simplifyingthe procedure and allowing to achieve better results thanit would be possible to obtain with a general calibration.Besides, test rig data are not complete, since in real usagetyres interact with vehicle suspensions, which of courseare not present in tyre test rig.The experimental basis for the analysis was createdthrough an extensive measurement campaign on aninstrumented vehicle. The vehicle was driven on severaldifferent tracks with a contemporary acquisition of tyreforces by means of Wheel Force Transducers (WFTs).Moreover, accelerations and suspension strokes weremeasured. These signals are used as reference timehistories in the model set-up.Finally, all test tracks were laser scanned in order to havea faithful 3D representation of the roads. The numericaldata were processed in order to provide a digital depictionof the track in the multi-body simulation environment.
Fig. 1 - Multi-body model of Iveco Daily driving on Belgian blocks test track.
Tyre set-up for commercial vehiclemulti-body model: modeFRONTIER as acalibration tool
Newsletter EnginSoft Year 8 n°2 - 9ProcedureThe rationale behind the calibration process is to test thetyre behaviour on tracks of different complexity in orderto assess both the tyre behaviour and its interaction withthe suspensions. The reference tracks used in the analysisare • cleat• pothole• Belgian blocks
The cleat and pothole provide as result force andacceleration time histories which can be compareddirectly between the experimental data and the numericalsimulations. The cleat, in particular, includes mainly thetyre enveloping capability, while in the potholeinteractions with vehicle suspensions start to have alarger role. Once calibrated the model on these two tracks,the Belgian block track is used to give a final confirmationof the results, as well as to infer about the modelpredictivity on a real track which is typically used for
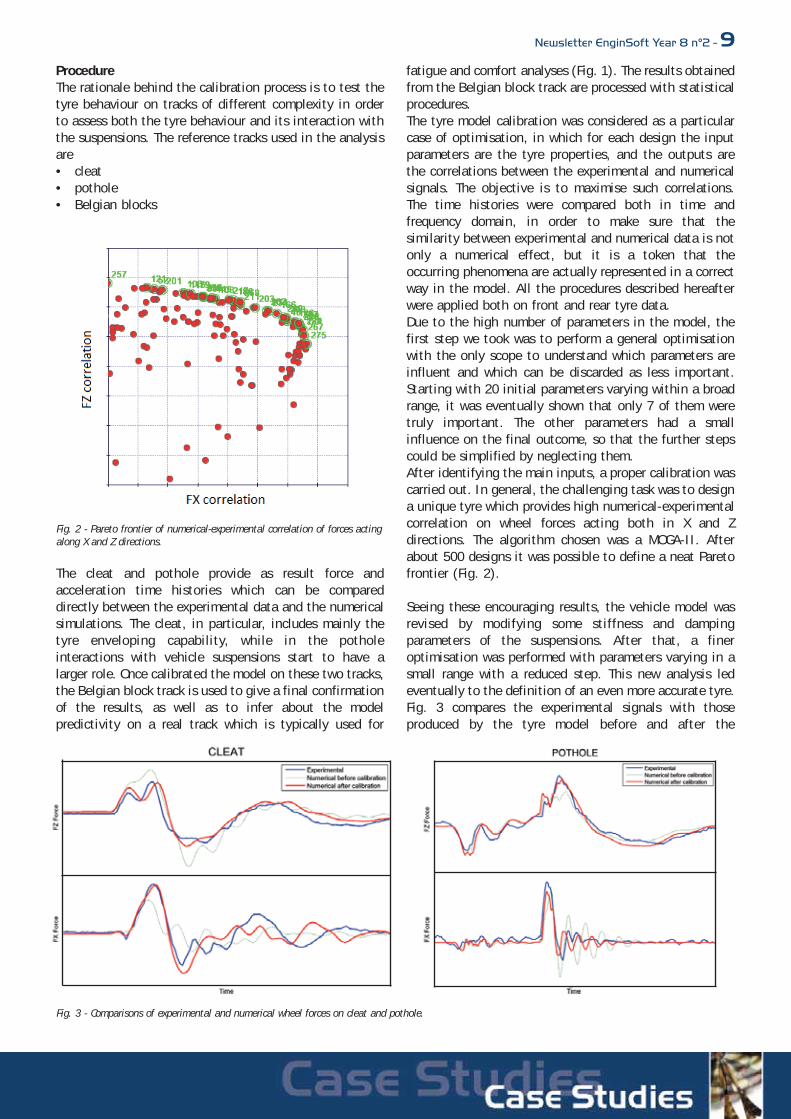
fatigue and comfort analyses (Fig. 1). The results obtainedfrom the Belgian block track are processed with statisticalprocedures.The tyre model calibration was considered as a particularcase of optimisation, in which for each design the inputparameters are the tyre properties, and the outputs arethe correlations between the experimental and numericalsignals. The objective is to maximise such correlations.The time histories were compared both in time andfrequency domain, in order to make sure that thesimilarity between experimental and numerical data is notonly a numerical effect, but it is a token that theoccurring phenomena are actually represented in a correctway in the model. All the procedures described hereafterwere applied both on front and rear tyre data.Due to the high number of parameters in the model, thefirst step we took was to perform a general optimisationwith the only scope to understand which parameters areinfluent and which can be discarded as less important.Starting with 20 initial parameters varying within a broadrange, it was eventually shown that only 7 of them weretruly important. The other parameters had a smallinfluence on the final outcome, so that the further stepscould be simplified by neglecting them.After identifying the main inputs, a proper calibration wascarried out. In general, the challenging task was to designa unique tyre which provides high numerical-experimentalcorrelation on wheel forces acting both in X and Zdirections. The algorithm chosen was a MOGA-II. Afterabout 500 designs it was possible to define a neat Paretofrontier (Fig. 2).
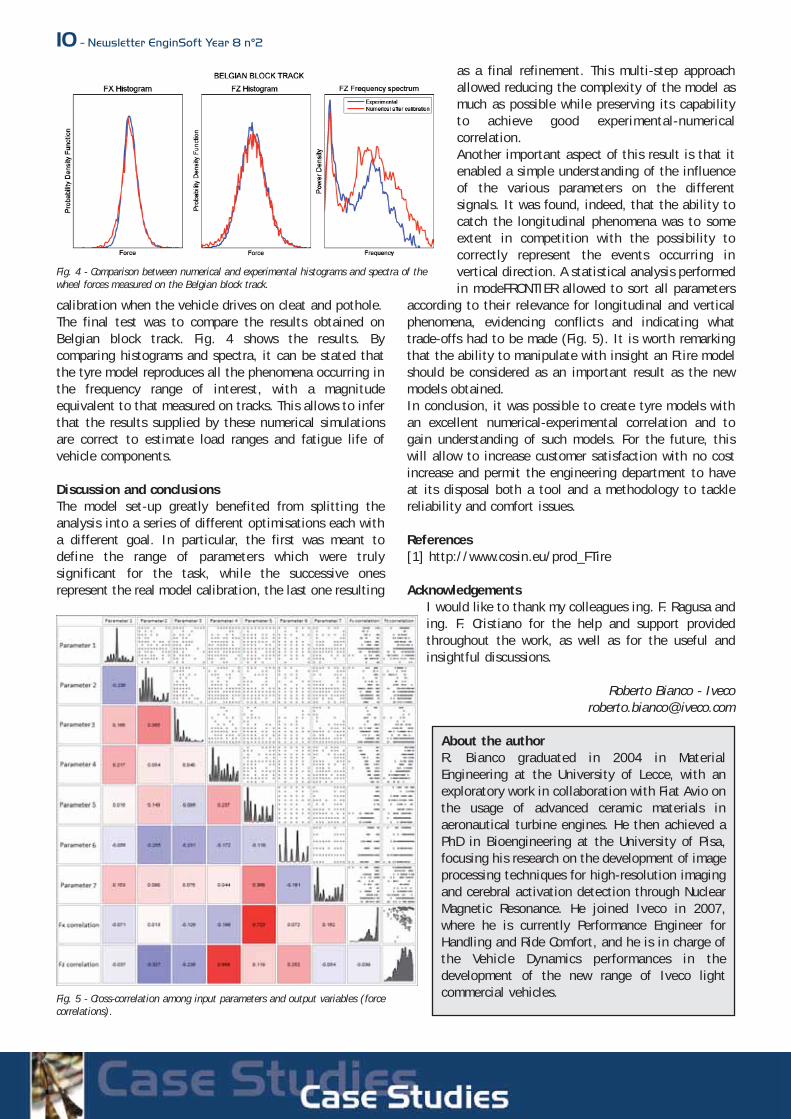
Seeing these encouraging results, the vehicle model wasrevised by modifying some stiffness and dampingparameters of the suspensions. After that, a fineroptimisation was performed with parameters varying in asmall range with a reduced step. This new analysis ledeventually to the definition of an even more accurate tyre.Fig. 3 compares the experimental signals with thoseproduced by the tyre model before and after the
Fig. 2 - Pareto frontier of numerical-experimental correlation of forces actingalong X and Z directions.
Fig. 3 - Comparisons of experimental and numerical wheel forces on cleat and pothole.
10 - Newsletter EnginSoft Year 8 n°2
calibration when the vehicle drives on cleat and pothole.The final test was to compare the results obtained onBelgian block track. Fig. 4 shows the results. Bycomparing histograms and spectra, it can be stated thatthe tyre model reproduces all the phenomena occurring inthe frequency range of interest, with a magnitudeequivalent to that measured on tracks. This allows to inferthat the results supplied by these numerical simulationsare correct to estimate load ranges and fatigue life ofvehicle components.
Discussion and conclusionsThe model set-up greatly benefited from splitting theanalysis into a series of different optimisations each witha different goal. In particular, the first was meant todefine the range of parameters which were trulysignificant for the task, while the successive onesrepresent the real model calibration, the last one resulting
as a final refinement. This multi-step approachallowed reducing the complexity of the model asmuch as possible while preserving its capabilityto achieve good experimental-numericalcorrelation.Another important aspect of this result is that itenabled a simple understanding of the influenceof the various parameters on the differentsignals. It was found, indeed, that the ability tocatch the longitudinal phenomena was to someextent in competition with the possibility tocorrectly represent the events occurring invertical direction. A statistical analysis performedin modeFRONTIER allowed to sort all parameters
according to their relevance for longitudinal and verticalphenomena, evidencing conflicts and indicating whattrade-offs had to be made (Fig. 5). It is worth remarkingthat the ability to manipulate with insight an Ftire modelshould be considered as an important result as the newmodels obtained. In conclusion, it was possible to create tyre models withan excellent numerical-experimental correlation and togain understanding of such models. For the future, thiswill allow to increase customer satisfaction with no costincrease and permit the engineering department to haveat its disposal both a tool and a methodology to tacklereliability and comfort issues.
References[1] http://www.cosin.eu/prod_FTire
AcknowledgementsI would like to thank my colleagues ing. F. Ragusa anding. F. Cristiano for the help and support providedthroughout the work, as well as for the useful andinsightful discussions.
Roberto Bianco - [email protected]
Fig. 4 - Comparison between numerical and experimental histograms and spectra of thewheel forces measured on the Belgian block track.
Fig. 5 - Cross-correlation among input parameters and output variables (forcecorrelations).
About the authorR. Bianco graduated in 2004 in MaterialEngineering at the University of Lecce, with anexploratory work in collaboration with Fiat Avio onthe usage of advanced ceramic materials inaeronautical turbine engines. He then achieved aPhD in Bioengineering at the University of Pisa,focusing his research on the development of imageprocessing techniques for high-resolution imagingand cerebral activation detection through NuclearMagnetic Resonance. He joined Iveco in 2007,where he is currently Performance Engineer forHandling and Ride Comfort, and he is in charge ofthe Vehicle Dynamics performances in thedevelopment of the new range of Iveco lightcommercial vehicles.
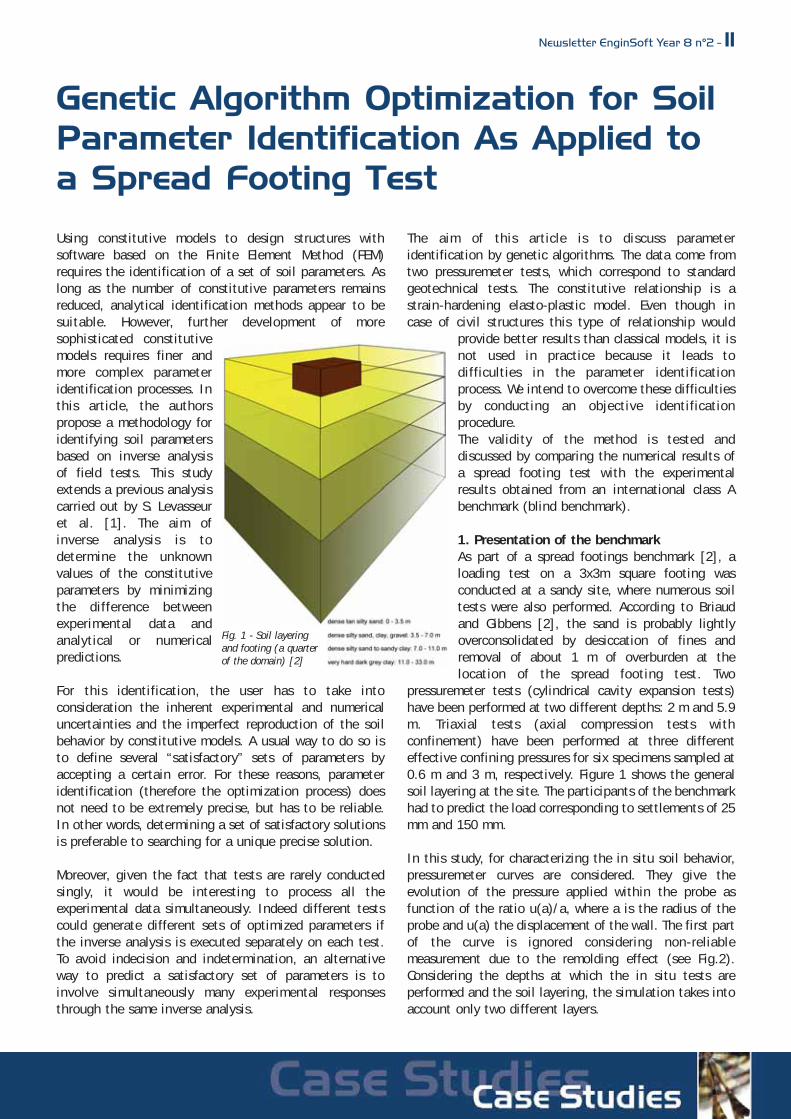
Using constitutive models to design structures withsoftware based on the Finite Element Method (FEM)requires the identification of a set of soil parameters. Aslong as the number of constitutive parameters remainsreduced, analytical identification methods appear to besuitable. However, further development of moresophisticated constitutivemodels requires finer andmore complex parameteridentification processes. Inthis article, the authorspropose a methodology foridentifying soil parametersbased on inverse analysisof field tests. This studyextends a previous analysiscarried out by S. Levasseuret al. [1]. The aim ofinverse analysis is todetermine the unknownvalues of the constitutiveparameters by minimizingthe difference betweenexperimental data andanalytical or numericalpredictions.
For this identification, the user has to take intoconsideration the inherent experimental and numericaluncertainties and the imperfect reproduction of the soilbehavior by constitutive models. A usual way to do so isto define several “satisfactory” sets of parameters byaccepting a certain error. For these reasons, parameteridentification (therefore the optimization process) doesnot need to be extremely precise, but has to be reliable.In other words, determining a set of satisfactory solutionsis preferable to searching for a unique precise solution.
Moreover, given the fact that tests are rarely conductedsingly, it would be interesting to process all theexperimental data simultaneously. Indeed different testscould generate different sets of optimized parameters ifthe inverse analysis is executed separately on each test.To avoid indecision and indetermination, an alternativeway to predict a satisfactory set of parameters is toinvolve simultaneously many experimental responsesthrough the same inverse analysis.
The aim of this article is to discuss parameteridentification by genetic algorithms. The data come fromtwo pressuremeter tests, which correspond to standardgeotechnical tests. The constitutive relationship is astrain-hardening elasto-plastic model. Even though incase of civil structures this type of relationship would
provide better results than classical models, it isnot used in practice because it leads todifficulties in the parameter identificationprocess. We intend to overcome these difficultiesby conducting an objective identificationprocedure.The validity of the method is tested anddiscussed by comparing the numerical results ofa spread footing test with the experimentalresults obtained from an international class Abenchmark (blind benchmark).
1. Presentation of the benchmark As part of a spread footings benchmark [2], aloading test on a 3x3m square footing wasconducted at a sandy site, where numerous soiltests were also performed. According to Briaudand Gibbens [2], the sand is probably lightlyoverconsolidated by desiccation of fines andremoval of about 1 m of overburden at thelocation of the spread footing test. Two
pressuremeter tests (cylindrical cavity expansion tests)have been performed at two different depths: 2 m and 5.9m. Triaxial tests (axial compression tests withconfinement) have been performed at three differenteffective confining pressures for six specimens sampled at0.6 m and 3 m, respectively. Figure 1 shows the generalsoil layering at the site. The participants of the benchmarkhad to predict the load corresponding to settlements of 25mm and 150 mm.
In this study, for characterizing the in situ soil behavior,pressuremeter curves are considered. They give theevolution of the pressure applied within the probe asfunction of the ratio u(a)/a, where a is the radius of theprobe and u(a) the displacement of the wall. The first partof the curve is ignored considering non-reliablemeasurement due to the remolding effect (see Fig.2).Considering the depths at which the in situ tests areperformed and the soil layering, the simulation takes intoaccount only two different layers.
Genetic Algorithm Optimization for SoilParameter Identification As Applied toa Spread Footing Test
Newsletter EnginSoft Year 8 n°2 - 11
Fig. 1 - Soil layeringand footing (a quarterof the domain) [2]
2. Constitutive modelA strain-hardening elasto-plastic model [3], implementedin CESAR-LCPC FEM software, is used in this study in orderto explore the relevance of the model.
This model is characterized by seven parameters. The fourfollowing parameters, reference elastic modulus Eref,friction angle ϕp, cohesion c and hardening parameter a,have a major influence in the design of spread footings.Therefore, high attention has to be paid to theiridentification. The friction angle is identified from triaxialtests. So the identification procedure by inverse analysisis conducted with three parameters, Eref, c and a.Moreover, taking into account the fact that a is not a trueintrinsic parameter, four parameters are optimized: twodifferent values of a, corresponding to the two differentpressuremeter tests, one cohesion value c assuming thehomogeneity of the soil profile and the value of Eref,assuming a certain evolution of the elastic modulus as afunction of the mean pressure. The other parameters,whose influence is minor, are fixed according to additionalexperimental data or to experience-based knowledge.ϕp = 35 degrees, rel = 0.7, v = 0.2, ϕc = 30 degrees, Κ0 =0.7
3. Identification of the constitutive parameters frompressuremeter tests3.1 FEM modelingAn axisymmetric condition (lateral direction) and a plain-strain condition (vertical direction) are assumed for themodeling of the pressuremeter test. The calculationsassume small strains, which is justified by the values ofthe local strains which are always smaller than 10%(without considering the close surrounding area of theprobe). The loading is displacement controlled and, ateach step, the same displacement increment is applied allalong the probe.
3.2 Identification procedureThe identification procedure is considered as anoptimization problem, more specifically as theminimization of a cost function. Due to some well-known drawbacks of deterministic methods and tothe limited use of genetic algorithms (GA), GA areinvolved in this optimization. Keeping in mind theavailable experimental data for the inverse analysis(two pressuremeter tests), two cost functions aredefined and minimized (two-objective problem). Thefact that GA allow the user to determine reliably thePareto frontier in one single run is a second reasonfor selecting them instead of deterministic methods.
The parameter range values of Eref, c and a aredetermined from resonant column test results onremolded samples [2] and from some priorsimulations.
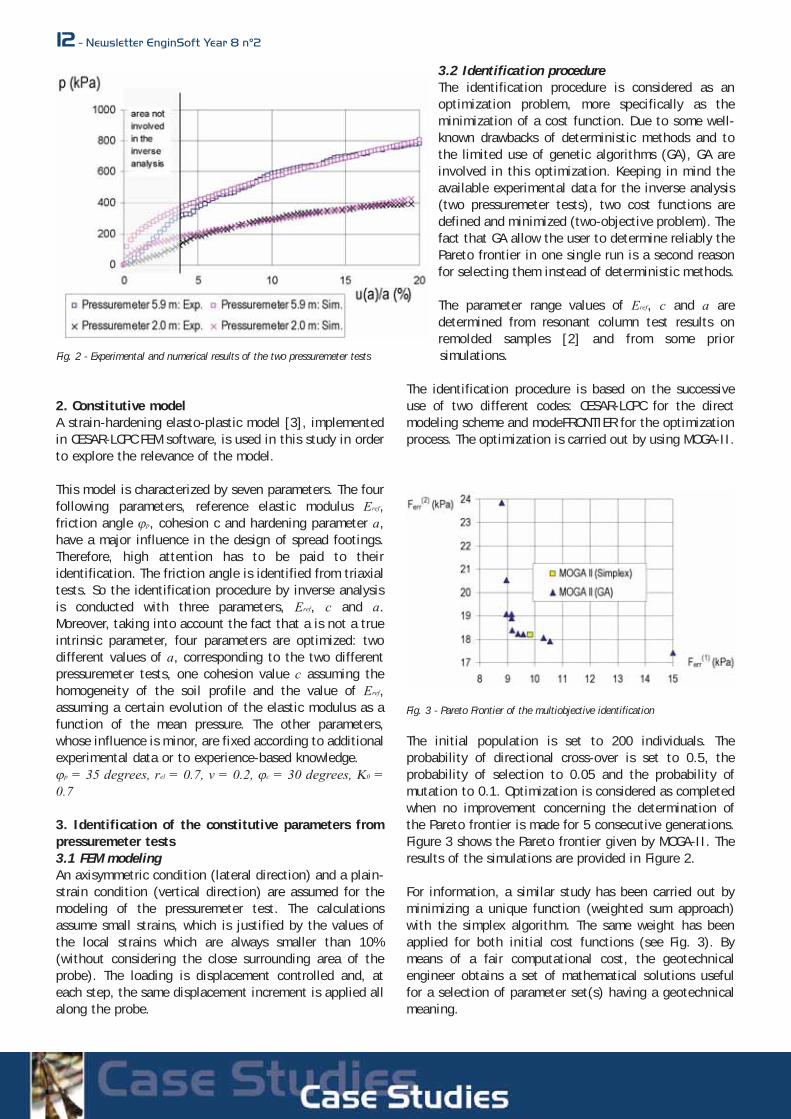
The identification procedure is based on the successiveuse of two different codes: CESAR-LCPC for the directmodeling scheme and modeFRONTIER for the optimizationprocess. The optimization is carried out by using MOGA-II.
The initial population is set to 200 individuals. Theprobability of directional cross-over is set to 0.5, theprobability of selection to 0.05 and the probability ofmutation to 0.1. Optimization is considered as completedwhen no improvement concerning the determination ofthe Pareto frontier is made for 5 consecutive generations.Figure 3 shows the Pareto frontier given by MOGA-II. Theresults of the simulations are provided in Figure 2.
For information, a similar study has been carried out byminimizing a unique function (weighted sum approach)with the simplex algorithm. The same weight has beenapplied for both initial cost functions (see Fig. 3). Bymeans of a fair computational cost, the geotechnicalengineer obtains a set of mathematical solutions usefulfor a selection of parameter set(s) having a geotechnicalmeaning.
Fig. 2 - Experimental and numerical results of the two pressuremeter tests
Fig. 3 - Pareto Frontier of the multiobjective identification
12 - Newsletter EnginSoft Year 8 n°2
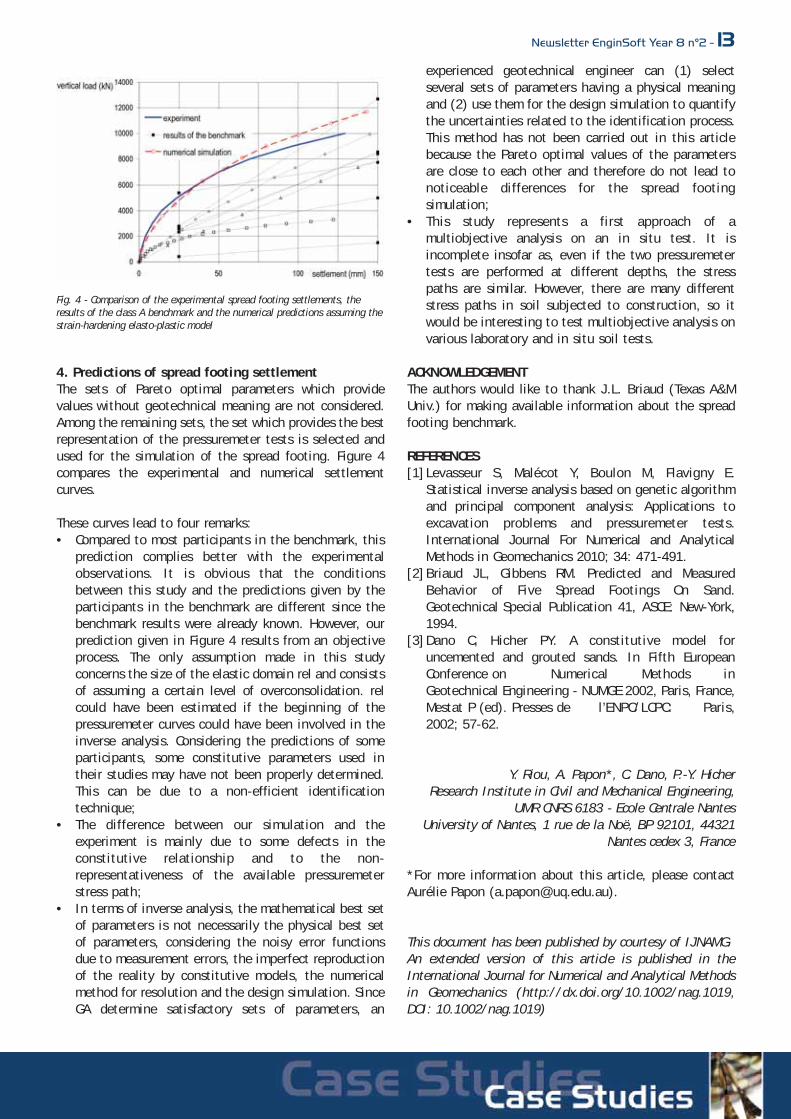
4. Predictions of spread footing settlementThe sets of Pareto optimal parameters which providevalues without geotechnical meaning are not considered.Among the remaining sets, the set which provides the bestrepresentation of the pressuremeter tests is selected andused for the simulation of the spread footing. Figure 4compares the experimental and numerical settlementcurves.
These curves lead to four remarks:• Compared to most participants in the benchmark, this
prediction complies better with the experimentalobservations. It is obvious that the conditionsbetween this study and the predictions given by theparticipants in the benchmark are different since thebenchmark results were already known. However, ourprediction given in Figure 4 results from an objectiveprocess. The only assumption made in this studyconcerns the size of the elastic domain rel and consistsof assuming a certain level of overconsolidation. relcould have been estimated if the beginning of thepressuremeter curves could have been involved in theinverse analysis. Considering the predictions of someparticipants, some constitutive parameters used intheir studies may have not been properly determined.This can be due to a non-efficient identificationtechnique;
• The difference between our simulation and theexperiment is mainly due to some defects in theconstitutive relationship and to the non-representativeness of the available pressuremeterstress path;
• In terms of inverse analysis, the mathematical best setof parameters is not necessarily the physical best setof parameters, considering the noisy error functionsdue to measurement errors, the imperfect reproductionof the reality by constitutive models, the numericalmethod for resolution and the design simulation. SinceGA determine satisfactory sets of parameters, an
experienced geotechnical engineer can (1) selectseveral sets of parameters having a physical meaningand (2) use them for the design simulation to quantifythe uncertainties related to the identification process.This method has not been carried out in this articlebecause the Pareto optimal values of the parametersare close to each other and therefore do not lead tonoticeable differences for the spread footingsimulation;
• This study represents a first approach of amultiobjective analysis on an in situ test. It isincomplete insofar as, even if the two pressuremetertests are performed at different depths, the stresspaths are similar. However, there are many differentstress paths in soil subjected to construction, so itwould be interesting to test multiobjective analysis onvarious laboratory and in situ soil tests.
ACKNOWLEDGEMENTThe authors would like to thank J.L. Briaud (Texas A&MUniv.) for making available information about the spreadfooting benchmark.
REFERENCES[1]Levasseur S, Malécot Y, Boulon M, Flavigny E.
Statistical inverse analysis based on genetic algorithmand principal component analysis: Applications toexcavation problems and pressuremeter tests.International Journal For Numerical and AnalyticalMethods in Geomechanics 2010; 34: 471-491.
[2]Briaud JL, Gibbens RM. Predicted and MeasuredBehavior of Five Spread Footings On Sand.Geotechnical Special Publication 41, ASCE: New-York,1994.
[3]Dano C, Hicher PY. A constitutive model foruncemented and grouted sands. In Fifth EuropeanConference on Numerical Methods inGeotechnical Engineering - NUMGE 2002, Paris, France,Mestat P (ed). Presses de l’ENPC/LCPC: Paris,2002; 57-62.
Y. Riou, A. Papon*, C. Dano, P.-Y. Hicher Research Institute in Civil and Mechanical Engineering,
UMR CNRS 6183 - Ecole Centrale NantesUniversity of Nantes, 1 rue de la Noë, BP 92101, 44321
Nantes cedex 3, France
*For more information about this article, please contactAurélie Papon ([email protected]).
This document has been published by courtesy of IJNAMG.An extended version of this article is published in theInternational Journal for Numerical and Analytical Methodsin Geomechanics (http://dx.doi.org/10.1002/nag.1019,DOI: 10.1002/nag.1019)
Fig. 4 - Comparison of the experimental spread footing settlements, theresults of the class A benchmark and the numerical predictions assuming thestrain-hardening elasto-plastic model
Newsletter EnginSoft Year 8 n°2 - 13
14 - Newsletter EnginSoft Year 8 n°2
1. IntroductionWind turbines are multi-physics devices in which theaerodynamic performance, the structural integrity of the blades,the energy conversion toolbox and the acoustic impact has to becarefully examined to achieve an effective design. Each one ofthese aspects introduces considerable hurdles to detailedsimulations.
The aerodynamic performance is dominated by the design of theblade cross-sections and the flow characterization iscomplicated by the need to predict laminar/turbulent transitionunder a variety of clean and perturbed wind conditions, theinherent angle of attack variability associated with rotation, thepresence of dynamic stall, aeroelasticity, etc. In spite of thedevelopment of advanced computational fluid dynamic toolsthat can predict with reasonable accuracy the aerodynamicperformance of helicopter rotors [1], the computations remainextremely expensive and often rely on simple models to captureimportant effects, such as transition, and are generally notconsidered to be predictive for extreme events such as bladestall.
In this case study we focus on building a flexible computationalinfrastructure based on low-fidelity models that are connectedtogether in a Matlab environment called Eolo. There are twomain advantages resulting from this choice: (i) control andflexibility in using different models developed for capturingcomplex phenomena, (ii) low computational costs. It is indeedthe second aspect that fundamentally enables us to performanalysis and optimization under uncertainty of this complexconfiguration.
2. A parallel computational framework for robustoptimization: LelandDue to the high cost of objective function evaluations in multi-disciplinary frameworks (i.e. aerodynamics, structure, control,etc.), we have developed an environment (hereafter calledLeland) for optimal resource allocation on a UNIX multiprocessorcluster. Leland can manage multiobjective robust optimizationby using state of the art genetic algorithms tightly coupled withan in-house uncertainty quantification strategy, the stochasticcollocation algorithm.
The structure of Leland is based on a workflow through I/O sub-systems that represent the software environments (i.e. X-foil,Fluent, FEM, NREL Tools, etc.) involved in the process. Thisenvironment is designed to run natively on any high-performance computing (HPC) system, by integrating with thejob-submission/queuing system (for example Torque). Moreover,it does not require administrator permissions: once the analysisis initiated multiple simulations are submitted and monitored
automatically. In Leland a “job” is an instance of the entiremulti-physics simulations, which might include grid generation,morphing, flow solution and structure coupling, acousticanalysis and post-processing. The main objective of Leland is toset-up a candidate design as a job and to manage it until it iscompleted, to gather relevant results that are used to inform therobust optimization process.
The various components of Leland are introduced below.
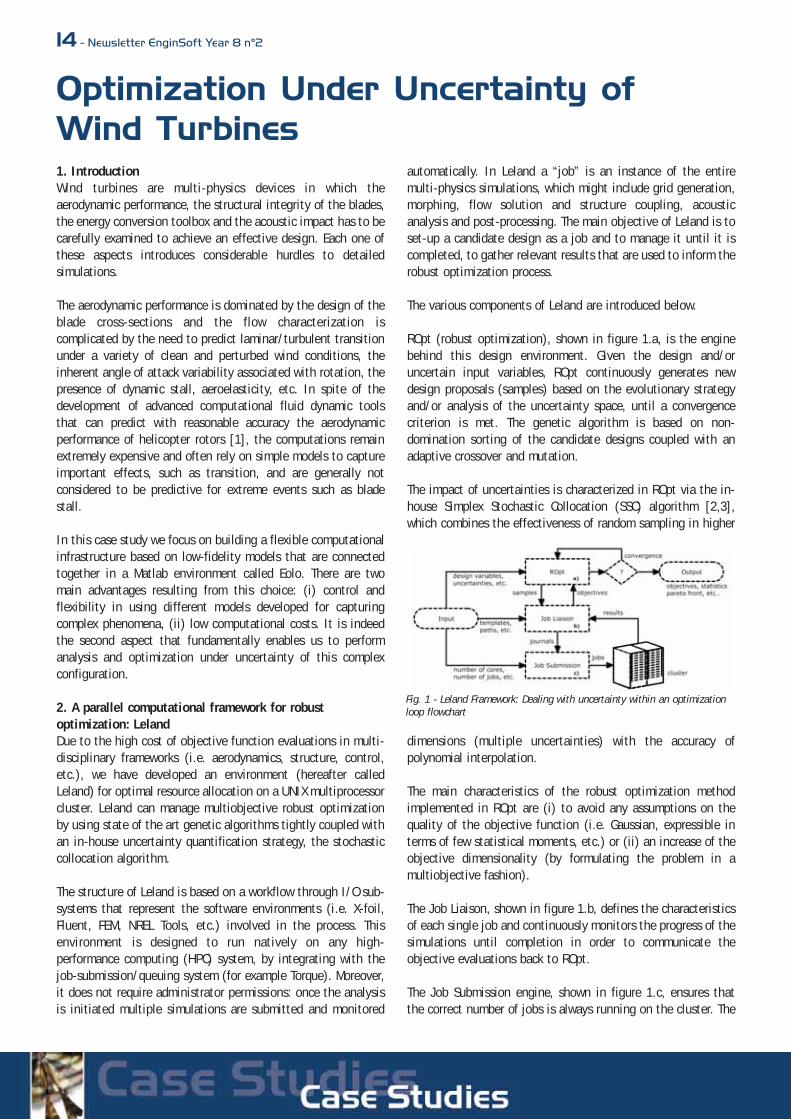
ROpt (robust optimization), shown in figure 1.a, is the enginebehind this design environment. Given the design and/oruncertain input variables, ROpt continuously generates newdesign proposals (samples) based on the evolutionary strategyand/or analysis of the uncertainty space, until a convergencecriterion is met. The genetic algorithm is based on non-domination sorting of the candidate designs coupled with anadaptive crossover and mutation.
The impact of uncertainties is characterized in ROpt via the in-house Simplex Stochastic Collocation (SSC) algorithm [2,3],which combines the effectiveness of random sampling in higher
dimensions (multiple uncertainties) with the accuracy ofpolynomial interpolation.
The main characteristics of the robust optimization methodimplemented in ROpt are (i) to avoid any assumptions on thequality of the objective function (i.e. Gaussian, expressible interms of few statistical moments, etc.) or (ii) an increase of theobjective dimensionality (by formulating the problem in amultiobjective fashion).
The Job Liaison, shown in figure 1.b, defines the characteristicsof each single job and continuously monitors the progress of thesimulations until completion in order to communicate theobjective evaluations back to ROpt.
The Job Submission engine, shown in figure 1.c, ensures thatthe correct number of jobs is always running on the cluster. The
Fig. 1 - Leland Framework: Dealing with uncertainty within an optimizationloop flowchart
Optimization Under Uncertainty of Wind Turbines
Newsletter EnginSoft Year 8 n°2 - 15variables (number of cores, number ofjobs, etc.) from the input file that areused to initialize the runs are dynamic,meaning they can be edited on the flyand the system will respondaccordingly.
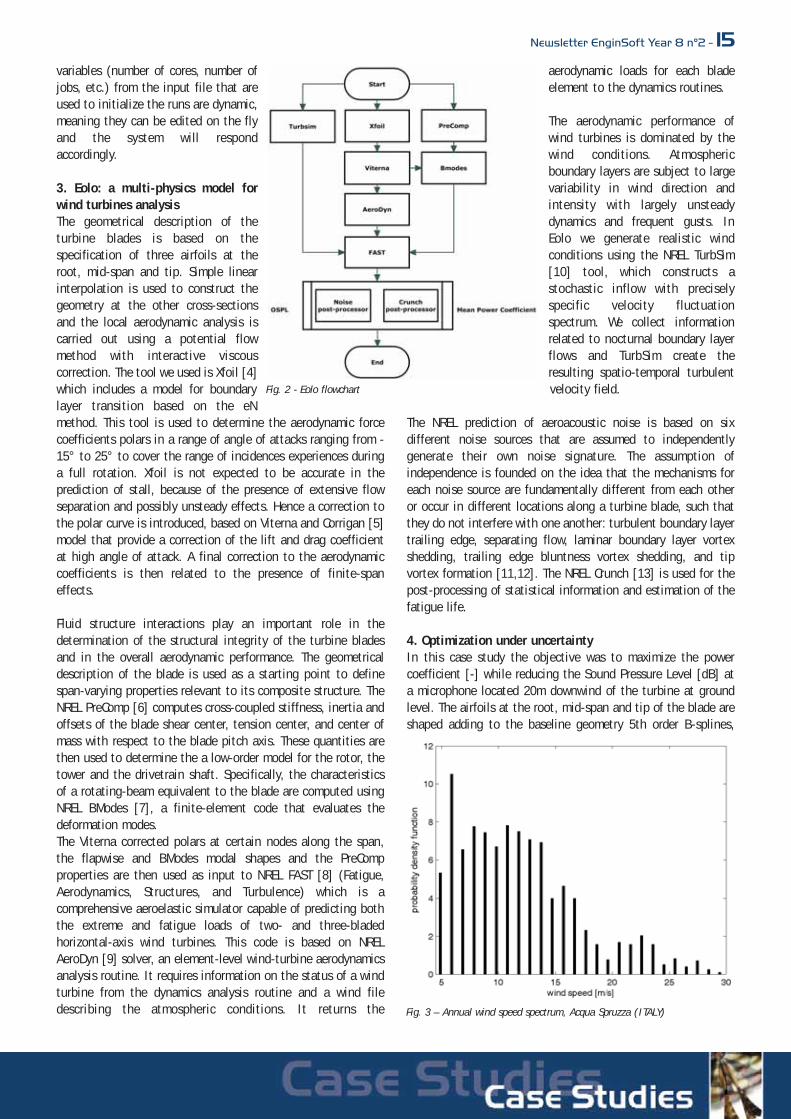
3. Eolo: a multi-physics model forwind turbines analysisThe geometrical description of theturbine blades is based on thespecification of three airfoils at theroot, mid-span and tip. Simple linearinterpolation is used to construct thegeometry at the other cross-sectionsand the local aerodynamic analysis iscarried out using a potential flowmethod with interactive viscouscorrection. The tool we used is Xfoil [4]which includes a model for boundarylayer transition based on the eNmethod. This tool is used to determine the aerodynamic forcecoefficients polars in a range of angle of attacks ranging from -15° to 25° to cover the range of incidences experiences duringa full rotation. Xfoil is not expected to be accurate in theprediction of stall, because of the presence of extensive flowseparation and possibly unsteady effects. Hence a correction tothe polar curve is introduced, based on Viterna and Corrigan [5]model that provide a correction of the lift and drag coefficientat high angle of attack. A final correction to the aerodynamiccoefficients is then related to the presence of finite-spaneffects.
Fluid structure interactions play an important role in thedetermination of the structural integrity of the turbine bladesand in the overall aerodynamic performance. The geometricaldescription of the blade is used as a starting point to definespan-varying properties relevant to its composite structure. TheNREL PreComp [6] computes cross-coupled stiffness, inertia andoffsets of the blade shear center, tension center, and center ofmass with respect to the blade pitch axis. These quantities arethen used to determine the a low-order model for the rotor, thetower and the drivetrain shaft. Specifically, the characteristicsof a rotating-beam equivalent to the blade are computed usingNREL BModes [7], a finite-element code that evaluates thedeformation modes.The Viterna corrected polars at certain nodes along the span,the flapwise and BModes modal shapes and the PreCompproperties are then used as input to NREL FAST [8] (Fatigue,Aerodynamics, Structures, and Turbulence) which is acomprehensive aeroelastic simulator capable of predicting boththe extreme and fatigue loads of two- and three-bladedhorizontal-axis wind turbines. This code is based on NRELAeroDyn [9] solver, an element-level wind-turbine aerodynamicsanalysis routine. It requires information on the status of a windturbine from the dynamics analysis routine and a wind filedescribing the atmospheric conditions. It returns the
aerodynamic loads for each bladeelement to the dynamics routines.
The aerodynamic performance ofwind turbines is dominated by thewind conditions. Atmosphericboundary layers are subject to largevariability in wind direction andintensity with largely unsteadydynamics and frequent gusts. InEolo we generate realistic windconditions using the NREL TurbSim[10] tool, which constructs astochastic inflow with preciselyspecific velocity fluctuationspectrum. We collect informationrelated to nocturnal boundary layerflows and TurbSim create theresulting spatio-temporal turbulentvelocity field.
The NREL prediction of aeroacoustic noise is based on sixdifferent noise sources that are assumed to independentlygenerate their own noise signature. The assumption ofindependence is founded on the idea that the mechanisms foreach noise source are fundamentally different from each otheror occur in different locations along a turbine blade, such thatthey do not interfere with one another: turbulent boundary layertrailing edge, separating flow, laminar boundary layer vortexshedding, trailing edge bluntness vortex shedding, and tipvortex formation [11,12]. The NREL Crunch [13] is used for thepost-processing of statistical information and estimation of thefatigue life.
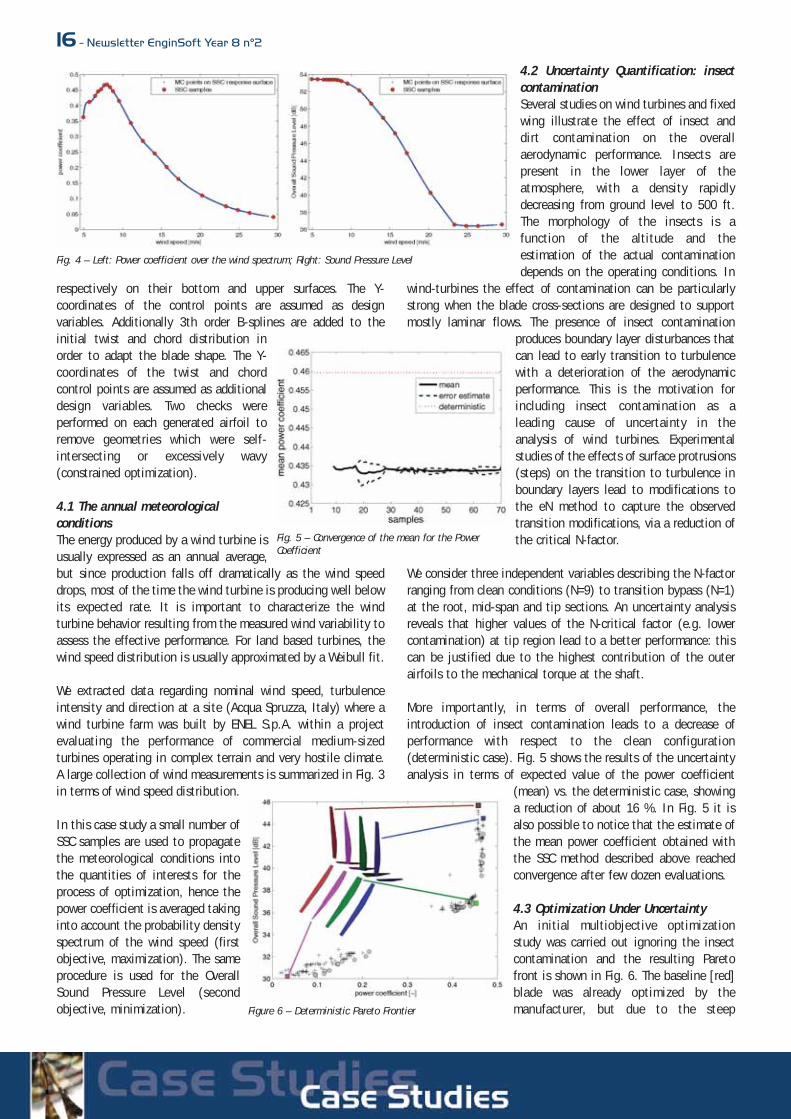
4. Optimization under uncertaintyIn this case study the objective was to maximize the powercoefficient [-] while reducing the Sound Pressure Level [dB] ata microphone located 20m downwind of the turbine at groundlevel. The airfoils at the root, mid-span and tip of the blade areshaped adding to the baseline geometry 5th order B-splines,
Fig. 2 - Eolo flowchart
Fig. 3 – Annual wind speed spectrum, Acqua Spruzza (ITALY)
16 - Newsletter EnginSoft Year 8 n°2
respectively on their bottom and upper surfaces. The Y-coordinates of the control points are assumed as designvariables. Additionally 3th order B-splines are added to theinitial twist and chord distribution inorder to adapt the blade shape. The Y-coordinates of the twist and chordcontrol points are assumed as additionaldesign variables. Two checks wereperformed on each generated airfoil toremove geometries which were self-intersecting or excessively wavy(constrained optimization).
4.1 The annual meteorologicalconditionsThe energy produced by a wind turbine isusually expressed as an annual average,but since production falls off dramatically as the wind speeddrops, most of the time the wind turbine is producing well belowits expected rate. It is important to characterize the windturbine behavior resulting from the measured wind variability toassess the effective performance. For land based turbines, thewind speed distribution is usually approximated by a Weibull fit.
We extracted data regarding nominal wind speed, turbulenceintensity and direction at a site (Acqua Spruzza, Italy) where awind turbine farm was built by ENEL S.p.A. within a projectevaluating the performance of commercial medium-sizedturbines operating in complex terrain and very hostile climate.A large collection of wind measurements is summarized in Fig. 3in terms of wind speed distribution.
In this case study a small number ofSSC samples are used to propagatethe meteorological conditions intothe quantities of interests for theprocess of optimization, hence thepower coefficient is averaged takinginto account the probability densityspectrum of the wind speed (firstobjective, maximization). The sameprocedure is used for the OverallSound Pressure Level (secondobjective, minimization).
4.2 Uncertainty Quantification: insectcontaminationSeveral studies on wind turbines and fixedwing illustrate the effect of insect anddirt contamination on the overallaerodynamic performance. Insects arepresent in the lower layer of theatmosphere, with a density rapidlydecreasing from ground level to 500 ft.The morphology of the insects is afunction of the altitude and theestimation of the actual contaminationdepends on the operating conditions. In
wind-turbines the effect of contamination can be particularlystrong when the blade cross-sections are designed to supportmostly laminar flows. The presence of insect contamination
produces boundary layer disturbances thatcan lead to early transition to turbulencewith a deterioration of the aerodynamicperformance. This is the motivation forincluding insect contamination as aleading cause of uncertainty in theanalysis of wind turbines. Experimentalstudies of the effects of surface protrusions(steps) on the transition to turbulence inboundary layers lead to modifications tothe eN method to capture the observedtransition modifications, via a reduction ofthe critical N-factor.
We consider three independent variables describing the N-factorranging from clean conditions (N=9) to transition bypass (N=1)at the root, mid-span and tip sections. An uncertainty analysisreveals that higher values of the N-critical factor (e.g. lowercontamination) at tip region lead to a better performance: thiscan be justified due to the highest contribution of the outerairfoils to the mechanical torque at the shaft.
More importantly, in terms of overall performance, theintroduction of insect contamination leads to a decrease ofperformance with respect to the clean configuration(deterministic case). Fig. 5 shows the results of the uncertaintyanalysis in terms of expected value of the power coefficient
(mean) vs. the deterministic case, showinga reduction of about 16 %. In Fig. 5 it isalso possible to notice that the estimate ofthe mean power coefficient obtained withthe SSC method described above reachedconvergence after few dozen evaluations.
4.3 Optimization Under UncertaintyAn initial multiobjective optimizationstudy was carried out ignoring the insectcontamination and the resulting Paretofront is shown in Fig. 6. The baseline [red]blade was already optimized by themanufacturer, but due to the steep
Fig. 4 – Left: Power coefficient over the wind spectrum; Right: Sound Pressure Level
Fig. 5 – Convergence of the mean for the PowerCoefficient
Figure 6 – Deterministic Pareto Frontier
Newsletter EnginSoft Year 8 n°2 - 17
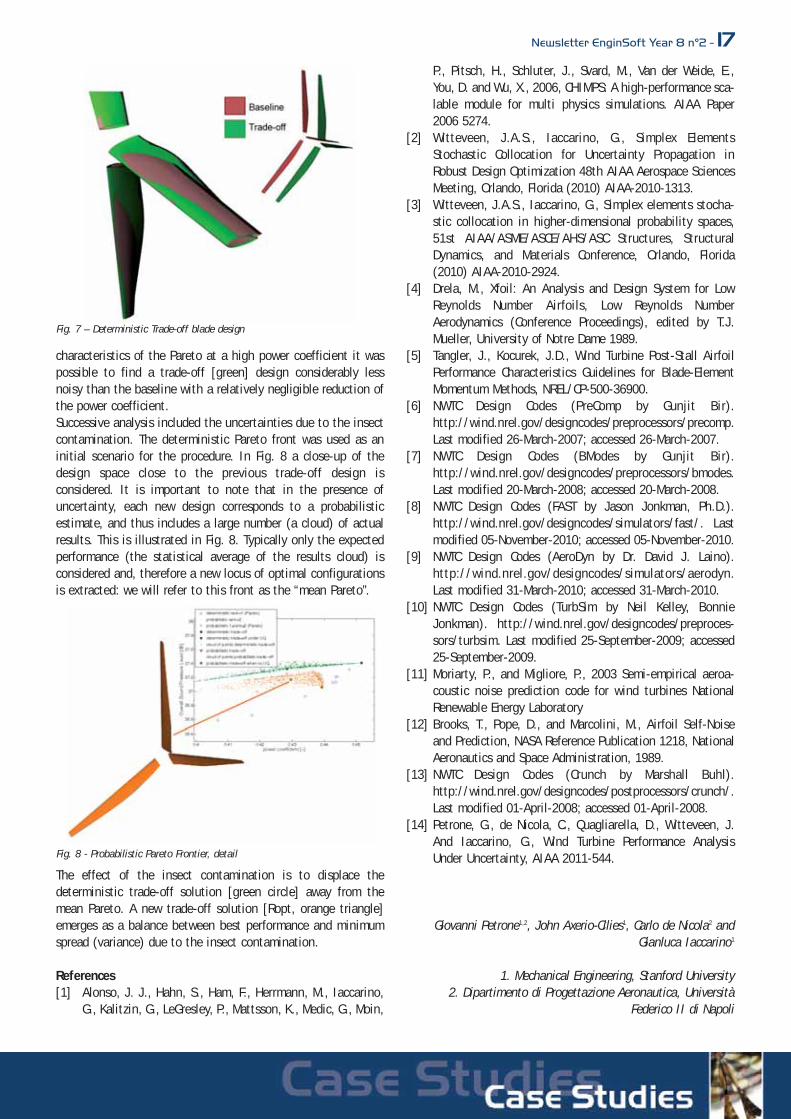
characteristics of the Pareto at a high power coefficient it waspossible to find a trade-off [green] design considerably lessnoisy than the baseline with a relatively negligible reduction ofthe power coefficient.Successive analysis included the uncertainties due to the insectcontamination. The deterministic Pareto front was used as aninitial scenario for the procedure. In Fig. 8 a close-up of thedesign space close to the previous trade-off design isconsidered. It is important to note that in the presence ofuncertainty, each new design corresponds to a probabilisticestimate, and thus includes a large number (a cloud) of actualresults. This is illustrated in Fig. 8. Typically only the expectedperformance (the statistical average of the results cloud) isconsidered and, therefore a new locus of optimal configurationsis extracted: we will refer to this front as the “mean Pareto”.
The effect of the insect contamination is to displace thedeterministic trade-off solution [green circle] away from themean Pareto. A new trade-off solution [Ropt, orange triangle]emerges as a balance between best performance and minimumspread (variance) due to the insect contamination.
References[1] Alonso, J. J., Hahn, S., Ham, F., Herrmann, M., Iaccarino,
G., Kalitzin, G., LeGresley, P., Mattsson, K., Medic, G., Moin,
P., Pitsch, H., Schluter, J., Svard, M., Van der Weide, E.,You, D. and Wu, X., 2006, CHIMPS: A high-performance sca-lable module for multi physics simulations. AIAA Paper2006 5274.
[2] Witteveen, J.A.S., Iaccarino, G., Simplex ElementsStochastic Collocation for Uncertainty Propagation inRobust Design Optimization 48th AIAA Aerospace SciencesMeeting, Orlando, Florida (2010) AIAA-2010-1313.
[3] Witteveen, J.A.S., Iaccarino, G., Simplex elements stocha-stic collocation in higher-dimensional probability spaces,51st AIAA/ASME/ASCE/AHS/ASC Structures, StructuralDynamics, and Materials Conference, Orlando, Florida(2010) AIAA-2010-2924.
[4] Drela, M., Xfoil: An Analysis and Design System for LowReynolds Number Airfoils, Low Reynolds NumberAerodynamics (Conference Proceedings), edited by T.J.Mueller, University of Notre Dame 1989.
[5] Tangler, J., Kocurek, J.D., Wind Turbine Post-Stall AirfoilPerformance Characteristics Guidelines for Blade-ElementMomentum Methods, NREL/CP-500-36900.
[6] NWTC Design Codes (PreComp by Gunjit Bir).http://wind.nrel.gov/designcodes/preprocessors/precomp.Last modified 26-March-2007; accessed 26-March-2007.
[7] NWTC Design Codes (BModes by Gunjit Bir).http://wind.nrel.gov/designcodes/preprocessors/bmodes.Last modified 20-March-2008; accessed 20-March-2008.
[8] NWTC Design Codes (FAST by Jason Jonkman, Ph.D.).http://wind.nrel.gov/designcodes/simulators/fast/. Lastmodified 05-November-2010; accessed 05-November-2010.
[9] NWTC Design Codes (AeroDyn by Dr. David J. Laino).http://wind.nrel.gov/designcodes/simulators/aerodyn.Last modified 31-March-2010; accessed 31-March-2010.
[10] NWTC Design Codes (TurbSim by Neil Kelley, BonnieJonkman). http://wind.nrel.gov/designcodes/preproces-sors/turbsim. Last modified 25-September-2009; accessed25-September-2009.
[11] Moriarty, P., and Migliore, P., 2003 Semi-empirical aeroa-coustic noise prediction code for wind turbines NationalRenewable Energy Laboratory
[12] Brooks, T., Pope, D., and Marcolini, M., Airfoil Self-Noiseand Prediction, NASA Reference Publication 1218, NationalAeronautics and Space Administration, 1989.
[13] NWTC Design Codes (Crunch by Marshall Buhl).http://wind.nrel.gov/designcodes/postprocessors/crunch/.Last modified 01-April-2008; accessed 01-April-2008.
[14] Petrone, G., de Nicola, C., Quagliarella, D., Witteveen, J.And Iaccarino, G., Wind Turbine Performance AnalysisUnder Uncertainty, AIAA 2011-544.
Giovanni Petrone1,2, John Axerio-Cilies1, Carlo de Nicola2 andGianluca Iaccarino1
1. Mechanical Engineering, Stanford University2. Dipartimento di Progettazione Aeronautica, Università
Federico II di Napoli
Fig. 8 - Probabilistic Pareto Frontier, detail
Fig. 7 – Deterministic Trade-off blade design
18 - Newsletter EnginSoft Year 8 n°2
In questo articolo viene ripreso il testcase di una pressa meccanica per im-butitura profonda a cui viene applica-to un processo di ottimizzazione cine-matica per incrementare le principaliprestazioni operative della macchina.Ricordiamo che la qualità finale delprodotto imbutito è fortemente legataai parametri del processo di lavorazio-ne, tra i quali spicca per importanza lavelocità di discesa del punzone neltratto di corsa in cui la lamiera vienedeformata (intervallo di lavoro).Idealmente, questa velocità dovrebbeessere bassa, per realizzare una defor-mazione graduale del materiale, e co-stante per evitare la formazione dipieghe e striature superficiali.
Per rispettare questi requisiti è possibile equipaggiare lepresse meccaniche da imbutitura con un meccanismo deno-minato “Link-Drive”. Grazie al suo schema cinematico, il“Link-Drive” produce un tratto con andamento regolare equasi costante della velocità. Inoltre, la sua maggiore com-plessità lo rende più flessibile rispetto ai meccanismi tradi-zionali: variando le dimensioni dei membri si possono otte-nere diverse curve di velocità del punzone.Nella newsletter “EnginSoft Anno 8 - n°1” abbiamo messo inrilievo le possibilità di analisi offerte dall’implementazioneparametrica di un modello di pressa “Link-Drive” all’internodi ANSYS Workbench 13 (ambiente Rigid Body Dynamics). Inquesto nuovo articolo dimostreremo che l’utilizzo di modelliparametrici, in accoppiamento con un ottimizzatore multio-biettivo come modeFRONTIER 4, consente di massimizzare ivantaggi derivanti dalla simulazione cinematica e dinamicadei meccanismi articolati.
Definizione del problema di ottimizzazioneL’ottimizzazione è un approccio numerico che si propone diindividuare massimi e/o minimi di una funzione di molte va-riabili. Il suo impiego nel campo della simulazione divieneparticolarmente efficace nel momento in cui le funzioni daanalizzare esprimono le prestazioni di un sistema descritto daun modello virtuale parametrico.Le variabili di input del problema di ottimizzazione sonoscelte sulla base di considerazioni di opportunità e fattibili-
tà. Solitamente vengono coinvolti nell’ot-timizzazione esclusivamente i parametriper i quali si possono accettare delle mo-difiche, sempre e comunque all’interno dilimiti prefissati e nel rispetto di eventua-li vincoli.Per quanto concerne le funzioni obietti-vo, esse sono definite a partire da gran-dezze scalari che descrivono in modo uni-voco il comportamento del sistema che sista cercando di ottimizzare.
La sintesi degli indici scalari è completa-mente delegata all’utente, che deveestrarla a partire dai risultati delle simu-lazioni. Si tratta di un’operazione crucia-le, dal momento che una definizione lacu-nosa degli obiettivi può pregiudicare la
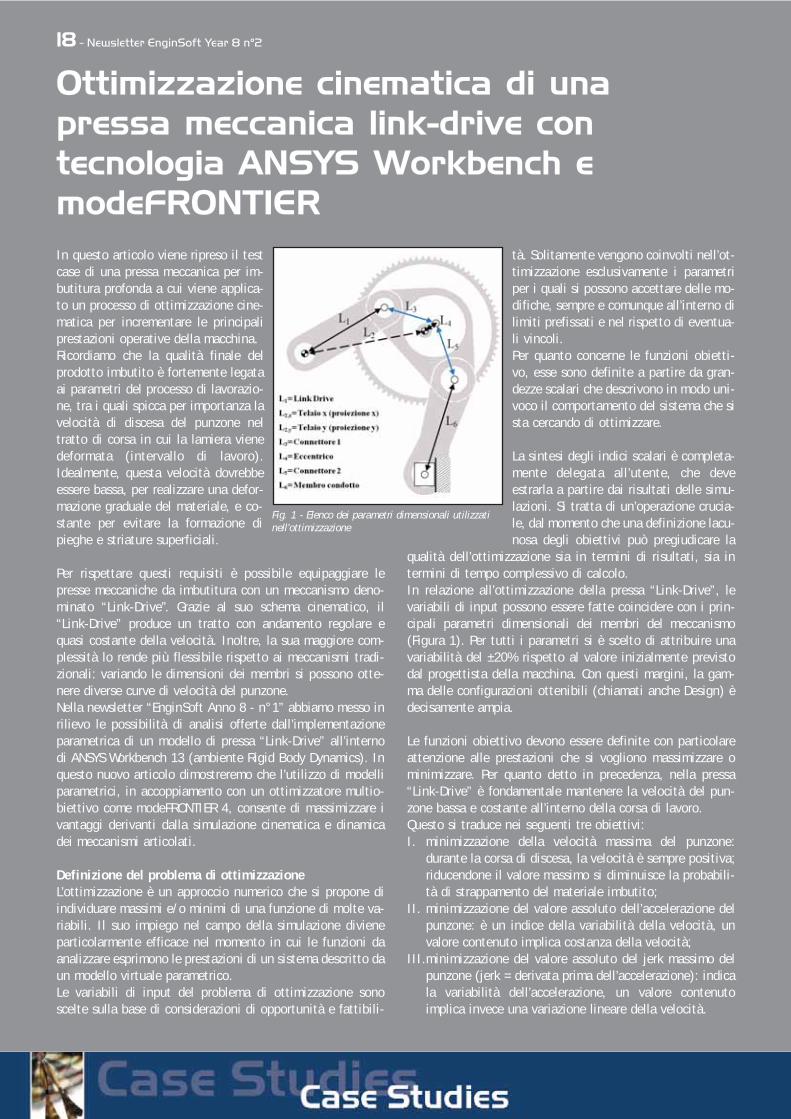
qualità dell’ottimizzazione sia in termini di risultati, sia intermini di tempo complessivo di calcolo.In relazione all’ottimizzazione della pressa “Link-Drive”, levariabili di input possono essere fatte coincidere con i prin-cipali parametri dimensionali dei membri del meccanismo(Figura 1). Per tutti i parametri si è scelto di attribuire unavariabilità del ±20% rispetto al valore inizialmente previstodal progettista della macchina. Con questi margini, la gam-ma delle configurazioni ottenibili (chiamati anche Design) èdecisamente ampia.
Le funzioni obiettivo devono essere definite con particolareattenzione alle prestazioni che si vogliono massimizzare ominimizzare. Per quanto detto in precedenza, nella pressa“Link-Drive” è fondamentale mantenere la velocità del pun-zone bassa e costante all’interno della corsa di lavoro.Questo si traduce nei seguenti tre obiettivi:I. minimizzazione della velocità massima del punzone:
durante la corsa di discesa, la velocità è sempre positiva;riducendone il valore massimo si diminuisce la probabili-tà di strappamento del materiale imbutito;
II. minimizzazione del valore assoluto dell’accelerazione delpunzone: è un indice della variabilità della velocità, unvalore contenuto implica costanza della velocità;
III.minimizzazione del valore assoluto del jerk massimo delpunzone (jerk = derivata prima dell’accelerazione): indicala variabilità dell’accelerazione, un valore contenutoimplica invece una variazione lineare della velocità.
Fig. 1 - Elenco dei parametri dimensionali utilizzatinell’ottimizzazione
Ottimizzazione cinematica di unapressa meccanica link-drive contecnologia ANSYS Workbench emodeFRONTIER

Newsletter EnginSoft Year 8 n°2 - 19I tre obiettivi sono di natura cinematica, ma va detto che sa-rebbe possibile affiancare ad essi anche degli obiettivi, adesempio, dinamici, strutturali, economici, etc.Dopo aver definito le variabili di input e gli obiettivi del pro-blema di ottimizzazione, risulta utile definire eventuali vin-coli. I vincoli sono condizioni numeriche che si applicano, inmodo generale, a qualsiasi variabile coinvolta nell’ottimizza-zione. Lo scopo dei vincoli è quello di scartare automaticamente leconfigurazioni del meccanismo che non sono realizzabili o,più in generale, che non garantiscono il rispetto di altri cri-teri costruttivi. Per la pressa “Link Drive” sono stati definitii seguenti vincoli:• vincolo di assemblabilità: rimuove le configurazioni non
assemblabili a causa delle inadeguate lunghezze deimembri coinvolti;
• vincolo di punto morto inferiore: serve a garantire che leconfigurazioni del meccanismo presentino una la luceminima tra punzone e matrice. Questo vincolo, assicurache la pressa permetta di stampare pezzi di altezza mini-ma garantita;
• vincolo sull’angolo dell’eccentrico: serve a garantire che ilpunto morto inferiore del punzone sia raggiunto con unarotazione dell’eccentrico L4 maggiore di 180° misuratirispetto alla posizione dell’eccentrico occupata quando ilpunzone è al punto morto superiore. Il rispetto di questovincolo assicura una maggiore estensione dell’intervallodi lavoro.
Struttura del progetto in modeFRONTIERUn generico progetto costruito in modeFRONTIER comprendequattro aree di interesse: 1. Variabili di input e relativi vincoli;2. Algoritmi e pianificatori di analisi;3. Operazioni (simulazioni e calcoli);4. Variabili di output, relativi vincoli, e obiettivi.
Lo schema utilizzato per ottimizzare la pressa è riportato inFigura 2:
Nel blocco dei pianificatori, sono distinguibili un nodo “DOE”ed un nodo “Algoritmi”. Il primo genera un insieme di confi-gurazioni che serve da punto di partenza per gli ottimizzato-ri. Il secondo serve a definire gli algoritmi di ottimizzazioneed i relativi parametri di controllo.
Nella sezione delle operazioni sono racchiuse tutte le simu-lazioni ed i calcoli che trasformano le variabili di input nellevariabili di output necessarie a definire gli obiettivi. Nel ca-so in esame, le operazioni necessarie sono le seguenti:1. le variabili di input vengono passate al nodo di ANSYS
Workbench 13 che provvede a realizzare una simulazionemultibody a corpi rigidi della pressa. I risultati vengonoautomaticamente esportati in un file di testo al terminedi ogni simulazione;
2. il file viene processato da uno script Visual Basic che ese-gue un ricampionamento dei segnali prodotti dal modellomultibody; i risultati sono salvati in un nuovo file ditesto;
3. i dati ricampionati vengono caricati in un foglio Excel cheprovvede al post processamento finale e quindi alla estra-zione degli output scalari di interesse.
Analisi dei risultatiIn primo luogo è utile verificare l’efficacia del processo di ot-timizzazione appena effettuato.
A questo scopo, risulta conveniente considerare l’evoluzionedelle variabili obiettivo al progredire dell’ottimizzazione.La Figura 3 illustra la variazione dei primi due obiettivi (suitre prescelti) operata da modeFRONTIER in circa 2500 Design.L’efficacia degli algoritmi è dimostrata dalla pendenza nega-tiva delle curve di regressione, in relazione al fatto che en-trambi gli obiettivi dovevano essere minimizzati.
Il grafico permette di osservare come l’efficacia degli algorit-mi sia maggiore nella prima fase del processo di ottimizza-zione, quando evidentemente i margini di miglioramento so-no più consistenti. A partire, all’incirca, dal Design n. 1500,le curve di regressione sono quasi orizzontali, a conferma delfatto che ulteriori miglioramenti di limitata entità sono pos-sibili.
Nel caso di ottimizzazioni mono obiettivo, il processo di ot-timizzazione cerca i design che riducono o incrementano ilvalore del singolo obiettivo scalare. L’ottimo è univocamentedeterminato dalla configurazione che produce il minimo o ilmassimo.Nel caso delle ottimizzazioni multiobiettivo, il processo diottimizzazione cerca di individuare i design che riducono o
incrementano simultaneamente i valori degli obiet-tivi predefiniti. Mentre nelle fasi iniziali dell’otti-mizzazione ciò accade regolarmente, man manoche la ricerca prosegue ci si imbatte in design peri quali non è possibile migliorare alcuni degliobiettivi senza peggiorare gli altri. Le configura-zioni con queste caratteristiche sono tutti designottimi perché non è possibile ottenere un ulterio-re miglioramento delle prestazioni. Il loro insieme,viene chiamato frontiera di Pareto del problemamultiobiettivo. La molteplicità delle soluzioni in-cluse in questo insieme di punti, rende la succes-siva scelta del design ottimo non univoca.Fig. 2 - Schema di modeFRONTIER utilizzato per il processo di ottimizzazione
20 - Newsletter EnginSoft Year 8 n°2
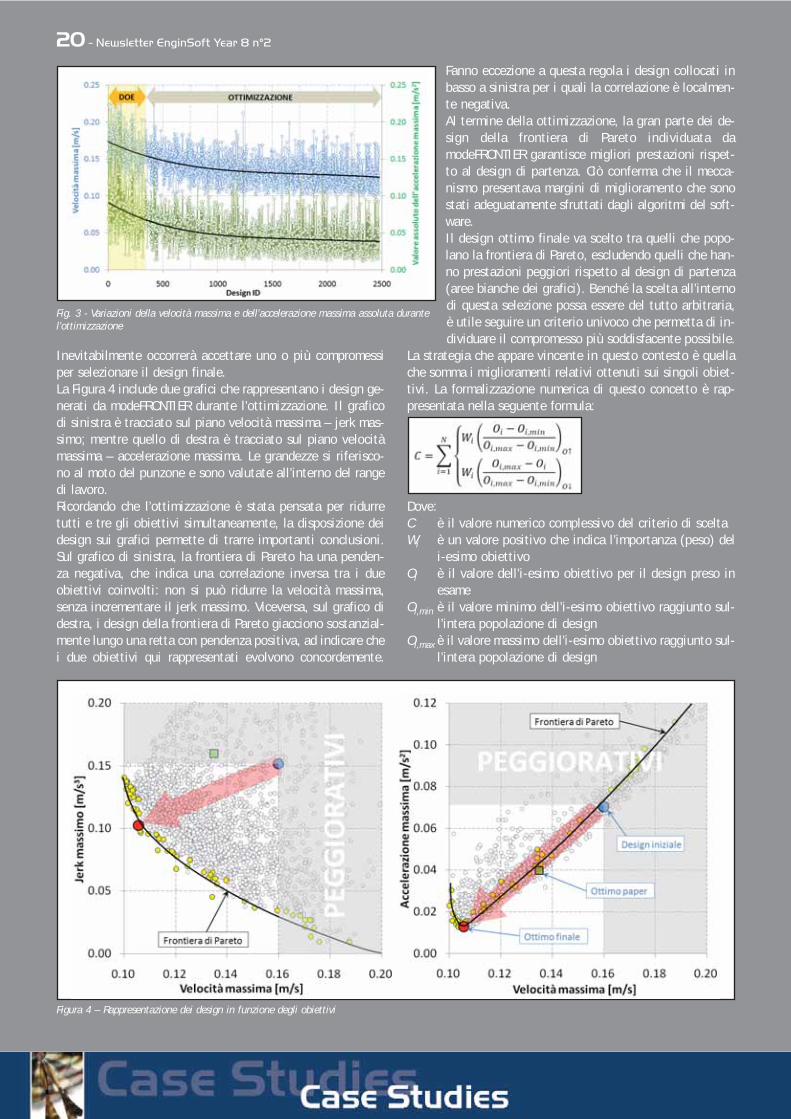
Inevitabilmente occorrerà accettare uno o più compromessiper selezionare il design finale.La Figura 4 include due grafici che rappresentano i design ge-nerati da modeFRONTIER durante l’ottimizzazione. Il graficodi sinistra è tracciato sul piano velocità massima – jerk mas-simo; mentre quello di destra è tracciato sul piano velocitàmassima – accelerazione massima. Le grandezze si riferisco-no al moto del punzone e sono valutate all’interno del rangedi lavoro.Ricordando che l’ottimizzazione è stata pensata per ridurretutti e tre gli obiettivi simultaneamente, la disposizione deidesign sui grafici permette di trarre importanti conclusioni.Sul grafico di sinistra, la frontiera di Pareto ha una penden-za negativa, che indica una correlazione inversa tra i dueobiettivi coinvolti: non si può ridurre la velocità massima,senza incrementare il jerk massimo. Viceversa, sul grafico didestra, i design della frontiera di Pareto giacciono sostanzial-mente lungo una retta con pendenza positiva, ad indicare chei due obiettivi qui rappresentati evolvono concordemente.
Fanno eccezione a questa regola i design collocati inbasso a sinistra per i quali la correlazione è localmen-te negativa.Al termine della ottimizzazione, la gran parte dei de-sign della frontiera di Pareto individuata damodeFRONTIER garantisce migliori prestazioni rispet-to al design di partenza. Ciò conferma che il mecca-nismo presentava margini di miglioramento che sonostati adeguatamente sfruttati dagli algoritmi del soft-ware.Il design ottimo finale va scelto tra quelli che popo-lano la frontiera di Pareto, escludendo quelli che han-no prestazioni peggiori rispetto al design di partenza(aree bianche dei grafici). Benché la scelta all’internodi questa selezione possa essere del tutto arbitraria,è utile seguire un criterio univoco che permetta di in-dividuare il compromesso più soddisfacente possibile.
La strategia che appare vincente in questo contesto è quellache somma i miglioramenti relativi ottenuti sui singoli obiet-tivi. La formalizzazione numerica di questo concetto è rap-presentata nella seguente formula:
Dove:C è il valore numerico complessivo del criterio di sceltaWi è un valore positivo che indica l’importanza (peso) del
i-esimo obiettivoOi è il valore dell’i-esimo obiettivo per il design preso in
esameOi,min è il valore minimo dell’i-esimo obiettivo raggiunto sul-
l’intera popolazione di designOi,max è il valore massimo dell’i-esimo obiettivo raggiunto sul-
l’intera popolazione di design
Fig. 3 - Variazioni della velocità massima e dell’accelerazione massima assoluta durantel’ottimizzazione
Figura 4 – Rappresentazione dei design in funzione degli obiettivi

Newsletter EnginSoft Year 8 n°2 - 21
Nella sommatoria si utilizza la prima equazione nel caso di unobiettivo da massimizzare ( ), la seconda equazione sel’obiettivo i-esimo deve essere minimizzato ( ).
Applicando questo metodo, si attribuisce ad ogni design unindice scalare che indica la sua attitudine a produrre un mi-glioramento prestazionale relativo in relazione agli obiettiviprecedentemente definiti. Il migliore tra i design generati ri-sulta essere quello per il quale il coefficiente C è massimo.
Per la pressa “Link Drive” è stato scelto il seguente ordine dipriorità per gli obiettivi:• minimizzazione del valore assoluto dell’accelerazione
massima (W1=4);• minimizzazione della velocità massima (W2=2);• minimizzazione del valore assoluto del jerk massimo
(W3=1).
Al termine del calcolo, il design ottimo finale coincide conquello evidenziato mediante un pallino rosso in Figura 4.Questa configurazione risulta ampiamente migliore rispettoalla configurazione da cui si è partiti.
A completamento di quanto esposto si è voluto confrontareil risultato ottenuto mediante ottimizzazione multiobiettivoguidata da modeFRONTIER con il risultato di una ottimizza-zione condotta sulla stessa macchina e descritta nell’articolo“Bojan Vohar, Karl Gotlih et Joze Flasker, Optimization ofLink-Drive Mechanism for Deep Drawing Mechanical Press”,Journal of Mechanical Engineering n. 48 (2002), pp. 601-612”.
I modelli utilizzati nella nostra applicazione ed in quella ci-tata sono sostanzialmente identici.Gli autori dell’articolo si sono limitati ad ottimizzare il mec-canismo imponendo la riduzione della accelerazione massimanel range di lavoro (ottimizzazione mono-obiettivo). Benchéabbiano ottenuto un buon risultato rispetto al punto di par-tenza in termini di accelerazione massima e velocità massi-
ma, il risultato trovato dagli algoritmi dimodeFRONTIER è ampiamente superiore. Oltre ad ave-re prodotto ulteriore riduzione di accelerazione e ve-locità massime, siamo riusciti a contenere anche iljerk massimo, a tutto vantaggio delle vibrazioni ge-nerate dalla macchina.
Il confronto prestazionale delle due macchine è benevidenziato nel grafico di Figura 5. Il range di lavorodelle due macchine si ottiene per diversi angoli dimanovella. Si noti che il punzone della pressa otti-mizzata da modeFRONTIER si muove circa 30 mm/spiù lentamente del pressa “concorrente”.
Per maggiori informazioni:Fabiano Maggio - [email protected]
L’esempio del meccanismo link drive solleva una serie diproblematiche tipiche della modellazione multibody.Infatti, l’utente deve scegliere con cura numero etipologia di vincoli se non vuole pervenire a risultatiincompleti o addirittura errati. L’utilizzo di strumenticome “ANSYS Transient Structural MBD” presuppone chel’utente possieda adeguate nozioni di meccanicaapplicata e calcolo numerico che gli consentano ditradurre correttamente un sistema fisico in un modellovirtuale. La schematizzazione può avvenire in modo più omeno raffinato, con conseguenze dirette sull’efficaciadella simulazione. È compito del modellista sceglieredimensione, grado di complessità e dettagli del modelloche vuole creare, considerando simultaneamente obiettivida raggiungere, onere computazionale e tempo adisposizione. Il miglior modello non è quello piùdettagliato, ma quello che risponde in modo più veloce edesauriente alle esigenze. Questa regola, che vale ingenerale per tutte le dimensioni del CAE, assume un ruolodecisivo per la simulazione multibody.
EnginSoft propone un corso di modellistica multibodydella durata di 2 giorni a tutti i progettisti che affrontanoquotidianamente problemi di cinematica e dinamica. Ilcorso è pensato e strutturato in modo da trasferire inbreve tempo le conoscenze che servono a formulareconsapevolmente le principali scelte di modellazionemultibody. Il corso verrà tenuto dal prof. Roberto Lotdell’Università di Padova in collaborazione con l’ing.Fabiano Maggio di EnginSoft.
Per informazioni sui contenuti consultare il sito delconsorzio TCN: www.consorziotcn.it
Per iscrizioni e informazioni generali consultare la sig.raMirella Prestini della segreteria del consorzio. E-mail:[email protected] Tel: 035 368711
Fig. 5 – Velocità del punzone nel ciclo della pressa
Tesi di laurea di Corrado ChisariUniversità degli Studi di Trieste
Relatore: Chiar.mo prof. Claudio AmadioCorrelatori: Chiar.mo prof. Salvatore Noè,
Dott. Ing. Roberto Zamparo
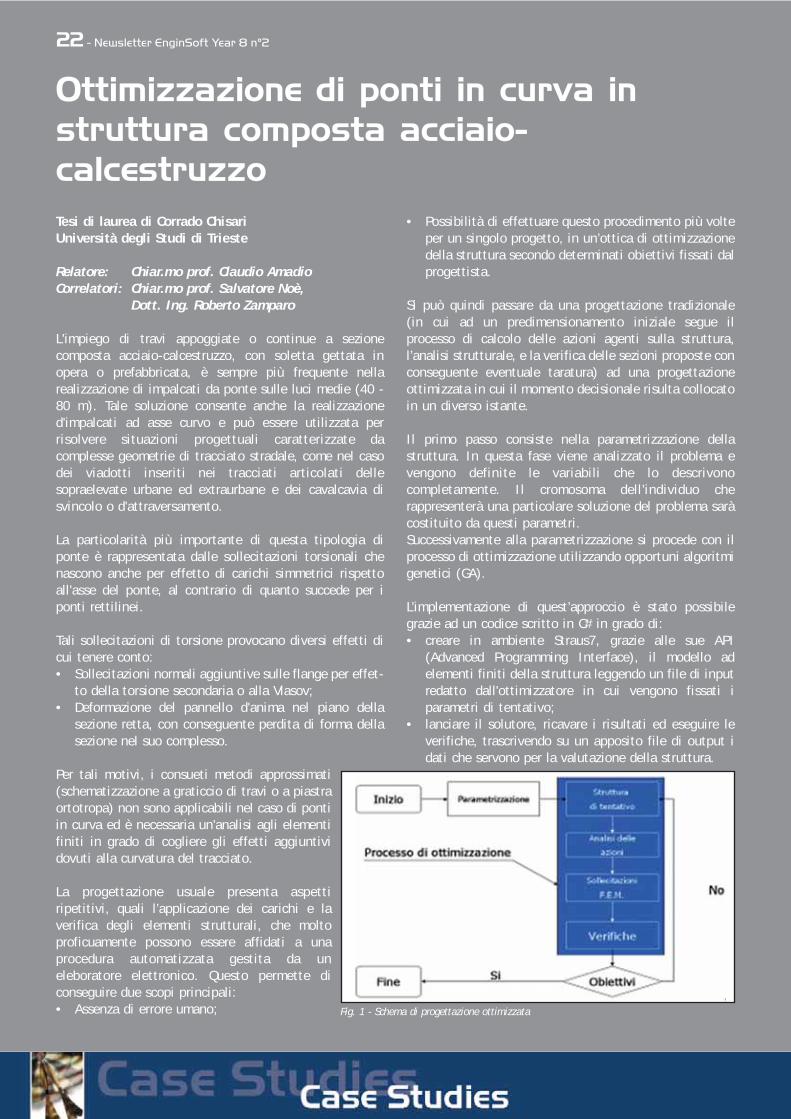
L'impiego di travi appoggiate o continue a sezionecomposta acciaio-calcestruzzo, con soletta gettata inopera o prefabbricata, è sempre più frequente nellarealizzazione di impalcati da ponte sulle luci medie (40 -80 m). Tale soluzione consente anche la realizzazioned'impalcati ad asse curvo e può essere utilizzata perrisolvere situazioni progettuali caratterizzate dacomplesse geometrie di tracciato stradale, come nel casodei viadotti inseriti nei tracciati articolati dellesopraelevate urbane ed extraurbane e dei cavalcavia disvincolo o d'attraversamento.
La particolarità più importante di questa tipologia diponte è rappresentata dalle sollecitazioni torsionali chenascono anche per effetto di carichi simmetrici rispettoall'asse del ponte, al contrario di quanto succede per iponti rettilinei.
Tali sollecitazioni di torsione provocano diversi effetti dicui tenere conto:• Sollecitazioni normali aggiuntive sulle flange per effet-
to della torsione secondaria o alla Vlasov;• Deformazione del pannello d'anima nel piano della
sezione retta, con conseguente perdita di forma dellasezione nel suo complesso.
Per tali motivi, i consueti metodi approssimati(schematizzazione a graticcio di travi o a piastraortotropa) non sono applicabili nel caso di pontiin curva ed è necessaria un'analisi agli elementifiniti in grado di cogliere gli effetti aggiuntividovuti alla curvatura del tracciato.
La progettazione usuale presenta aspettiripetitivi, quali l’applicazione dei carichi e laverifica degli elementi strutturali, che moltoproficuamente possono essere affidati a unaprocedura automatizzata gestita da uneleboratore elettronico. Questo permette diconseguire due scopi principali:• Assenza di errore umano;
• Possibilità di effettuare questo procedimento più volteper un singolo progetto, in un’ottica di ottimizzazionedella struttura secondo determinati obiettivi fissati dalprogettista.
Si può quindi passare da una progettazione tradizionale(in cui ad un predimensionamento iniziale segue ilprocesso di calcolo delle azioni agenti sulla struttura,l’analisi strutturale, e la verifica delle sezioni proposte conconseguente eventuale taratura) ad una progettazioneottimizzata in cui il momento decisionale risulta collocatoin un diverso istante.
Il primo passo consiste nella parametrizzazione dellastruttura. In questa fase viene analizzato il problema evengono definite le variabili che lo descrivonocompletamente. Il cromosoma dell’individuo cherappresenterà una particolare soluzione del problema saràcostituito da questi parametri. Successivamente alla parametrizzazione si procede con ilprocesso di ottimizzazione utilizzando opportuni algoritmigenetici (GA).
L’implementazione di quest’approccio è stato possibilegrazie ad un codice scritto in C# in grado di:• creare in ambiente Straus7, grazie alle sue API
(Advanced Programming Interface), il modello adelementi finiti della struttura leggendo un file di inputredatto dall'ottimizzatore in cui vengono fissati iparametri di tentativo;
• lanciare il solutore, ricavare i risultati ed eseguire leverifiche, trascrivendo su un apposito file di output idati che servono per la valutazione della struttura.
Fig. 1 - Schema di progettazione ottimizzata
Ottimizzazione di ponti in curva instruttura composta acciaio-calcestruzzo
22 - Newsletter EnginSoft Year 8 n°2
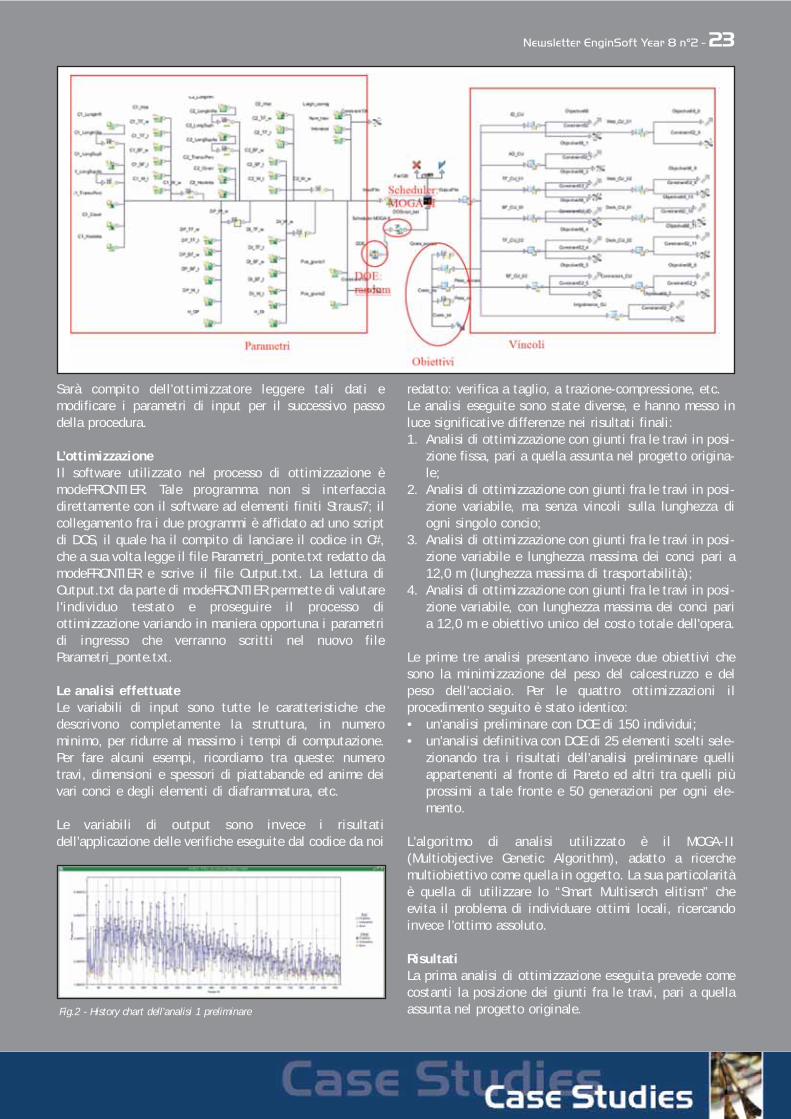
Sarà compito dell'ottimizzatore leggere tali dati emodificare i parametri di input per il successivo passodella procedura.
L’ottimizzazioneIl software utilizzato nel processo di ottimizzazione èmodeFRONTIER. Tale programma non si interfacciadirettamente con il software ad elementi finiti Straus7; ilcollegamento fra i due programmi è affidato ad uno scriptdi DOS, il quale ha il compito di lanciare il codice in C#,che a sua volta legge il file Parametri_ponte.txt redatto damodeFRONTIER e scrive il file Output.txt. La lettura diOutput.txt da parte di modeFRONTIER permette di valutarel'individuo testato e proseguire il processo diottimizzazione variando in maniera opportuna i parametridi ingresso che verranno scritti nel nuovo fileParametri_ponte.txt.
Le analisi effettuateLe variabili di input sono tutte le caratteristiche chedescrivono completamente la struttura, in numerominimo, per ridurre al massimo i tempi di computazione.Per fare alcuni esempi, ricordiamo tra queste: numerotravi, dimensioni e spessori di piattabande ed anime deivari conci e degli elementi di diaframmatura, etc.
Le variabili di output sono invece i risultatidell’applicazione delle verifiche eseguite dal codice da noi
redatto: verifica a taglio, a trazione-compressione, etc.Le analisi eseguite sono state diverse, e hanno messo inluce significative differenze nei risultati finali:1. Analisi di ottimizzazione con giunti fra le travi in posi-
zione fissa, pari a quella assunta nel progetto origina-le;
2. Analisi di ottimizzazione con giunti fra le travi in posi-zione variabile, ma senza vincoli sulla lunghezza diogni singolo concio;
3. Analisi di ottimizzazione con giunti fra le travi in posi-zione variabile e lunghezza massima dei conci pari a12,0 m (lunghezza massima di trasportabilità);
4. Analisi di ottimizzazione con giunti fra le travi in posi-zione variabile, con lunghezza massima dei conci paria 12,0 m e obiettivo unico del costo totale dell'opera.
Le prime tre analisi presentano invece due obiettivi chesono la minimizzazione del peso del calcestruzzo e delpeso dell'acciaio. Per le quattro ottimizzazioni ilprocedimento seguito è stato identico:• un'analisi preliminare con DOE di 150 individui;• un'analisi definitiva con DOE di 25 elementi scelti sele-
zionando tra i risultati dell’analisi preliminare quelliappartenenti al fronte di Pareto ed altri tra quelli piùprossimi a tale fronte e 50 generazioni per ogni ele-mento.
L'algoritmo di analisi utilizzato è il MOGA-II(Multiobjective Genetic Algorithm), adatto a ricerchemultiobiettivo come quella in oggetto. La sua particolaritàè quella di utilizzare lo “Smart Multiserch elitism” cheevita il problema di individuare ottimi locali, ricercandoinvece l’ottimo assoluto.
RisultatiLa prima analisi di ottimizzazione eseguita prevede comecostanti la posizione dei giunti fra le travi, pari a quellaassunta nel progetto originale.Fig.2 - History chart dell’analisi 1 preliminare
Newsletter EnginSoft Year 8 n°2 - 23

Dall’analisi dei risultati si nota come la presenza di diversiobiettivi non consenta la convergenza verso una soluzioneottima, ma la si ottenga in maniera quasi occasionale.Per tentare di capire il perché di questa mancataconvergenza, è stata lanciata una terza analisi con lostesso DOE di partenza di quella definitiva ora descritta,ma con numero di generazioni pari a 150.
È evidente che l'ottimizzatore trova due strade di possibileconvergenza, indicate con le lettere A e B. Trattandosi diun'analisi multiobiettivo non c'è parametro che facciascegliere una al posto dell'altra, per cui si spiega lamancanza di convergenza.A riprova di quanto detto, analizzando il diagrammascatter che riporta rispettivamente in ascissa il pesodell'acciaio e in ordinata quello del calcestruzzo, notiamoche i due gruppi di soluzioni appartengono entrambi alfronte di Pareto, ossia rappresentano entrambi individuicaratterizzati dal raggiungimento di un minimo obiettivoche non possono essere migliorati se non peggiorandol'altro obiettivo.
Poiché la posizione dei giunti in realtà non è fissata apriori ma è uno dei parametri variabili del progetto, è
stata lanciata una seconda analisi, in cui essa varialiberamente.Anche in questo caso sia l'analisi preliminare (con 150individui scelti con metodologia RANDOM e 30 generazioniper individuo) che l'analisi definitiva non mostranoconvergenza per la presenza dei diversi obiettivi.
Nell’analisi 3, come già detto, viene imposto un vincoloulteriore all’ottimizzatore: la lunghezza massima deiconci, pari a 12 m.
Confrontando tale analisi con quelle precedenti è possibilenotare che la convergenza viene qui raggiunta in manieradecisamente più rapida; tuttavia l'introduzione di unulteriore vincolo comporta un minore risparmio dimateriale. Per la prima volta compare un individuocaratterizzato da tre travi in acciaio, anziché due (Fig.10).
Fig. 5 - Diagramma scatter peso acciao-peso cls
Fig. 6 - Screenshot dell'individuo ottimo dell'analisi 1
24 - Newsletter EnginSoft Year 8 n°2
Fig. 3 - History chart dell’analisi 1 definitiva
Fig. 4 - Analisi 1 con 150 generazioniFig. 7 - History chart dell’analisi 2 definitiva
Fig. 8 - Individuo ottimo dell'analisi 2
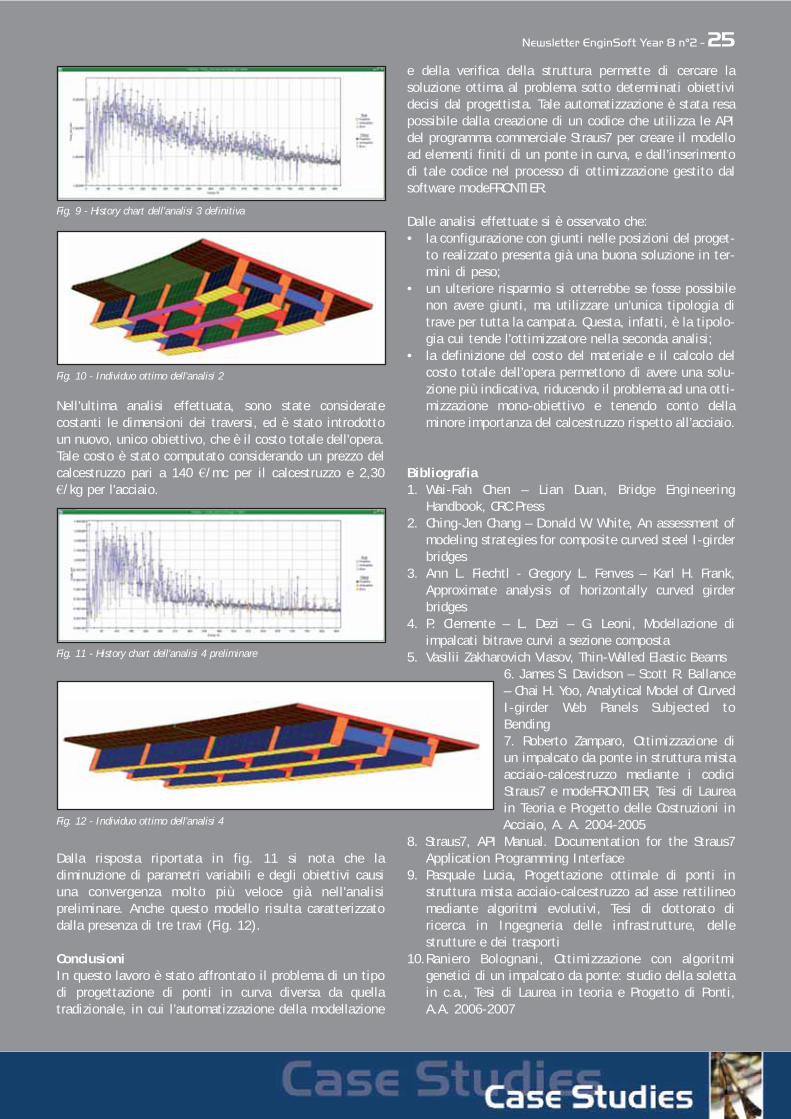
Nell’ultima analisi effettuata, sono state consideratecostanti le dimensioni dei traversi, ed è stato introdottoun nuovo, unico obiettivo, che è il costo totale dell'opera.Tale costo è stato computato considerando un prezzo delcalcestruzzo pari a 140 €/mc per il calcestruzzo e 2,30€/kg per l'acciaio.
Dalla risposta riportata in fig. 11 si nota che ladiminuzione di parametri variabili e degli obiettivi causiuna convergenza molto più veloce già nell'analisipreliminare. Anche questo modello risulta caratterizzatodalla presenza di tre travi (Fig. 12).
ConclusioniIn questo lavoro è stato affrontato il problema di un tipodi progettazione di ponti in curva diversa da quellatradizionale, in cui l’automatizzazione della modellazione
e della verifica della struttura permette di cercare lasoluzione ottima al problema sotto determinati obiettividecisi dal progettista. Tale automatizzazione è stata resapossibile dalla creazione di un codice che utilizza le APIdel programma commerciale Straus7 per creare il modelload elementi finiti di un ponte in curva, e dall’inserimentodi tale codice nel processo di ottimizzazione gestito dalsoftware modeFRONTIER.
Dalle analisi effettuate si è osservato che:• la configurazione con giunti nelle posizioni del proget-
to realizzato presenta già una buona soluzione in ter-mini di peso;
• un ulteriore risparmio si otterrebbe se fosse possibilenon avere giunti, ma utilizzare un'unica tipologia ditrave per tutta la campata. Questa, infatti, è la tipolo-gia cui tende l'ottimizzatore nella seconda analisi;
• la definizione del costo del materiale e il calcolo delcosto totale dell’opera permettono di avere una solu-zione più indicativa, riducendo il problema ad una otti-mizzazione mono-obiettivo e tenendo conto dellaminore importanza del calcestruzzo rispetto all’acciaio.
Bibliografia1. Wai-Fah Chen – Lian Duan, Bridge Engineering
Handbook, CRC Press2. Ching-Jen Chang – Donald W. White, An assessment of
modeling strategies for composite curved steel I-girderbridges
3. Ann L. Fiechtl - Gregory L. Fenves – Karl H. Frank,Approximate analysis of horizontally curved girderbridges
4. P. Clemente – L. Dezi – G. Leoni, Modellazione diimpalcati bitrave curvi a sezione composta
5. Vasilii Zakharovich Vlasov, Thin-Walled Elastic Beams6. James S. Davidson – Scott R. Ballance– Chai H. Yoo, Analytical Model of CurvedI-girder Web Panels Subjected toBending7. Roberto Zamparo, Ottimizzazione diun impalcato da ponte in struttura mistaacciaio-calcestruzzo mediante i codiciStraus7 e modeFRONTIER, Tesi di Laureain Teoria e Progetto delle Costruzioni inAcciaio, A. A. 2004-2005
8. Straus7, API Manual. Documentation for the Straus7Application Programming Interface
9. Pasquale Lucia, Progettazione ottimale di ponti instruttura mista acciaio-calcestruzzo ad asse rettilineomediante algoritmi evolutivi, Tesi di dottorato diricerca in Ingegneria delle infrastrutture, dellestrutture e dei trasporti
10.Raniero Bolognani, Ottimizzazione con algoritmigenetici di un impalcato da ponte: studio della solettain c.a., Tesi di Laurea in teoria e Progetto di Ponti,A.A. 2006-2007
Fig. 9 - History chart dell’analisi 3 definitiva
Fig. 10 - Individuo ottimo dell'analisi 2
Fig. 12 - Individuo ottimo dell'analisi 4
Fig. 11 - History chart dell'analisi 4 preliminare
Newsletter EnginSoft Year 8 n°2 - 25
26 - Newsletter EnginSoft Year 8 n°2
UNICONFORT srl is an Italian company which operatesvery successfully in the field of thermal technologyand providing solutions for the energy conversion ofpellets and biomasses coming from agriculture, woodworking and the forestry industry.The company provides turnkey installations fromstorage to chimney. Their main activities range fromproject to production of biomass-fired boilers toproduce hot water, superheated water, hot air, steamand thermal oil. Boilers can treat various types of biomasses,from pellets to fuel with high humidity content. The powerrange is from 24 KW to 5.800 KW.UNICONFORT relies on Computer Aided Engineering and hasselected EnginSoft as a key partner to develop and optimize itsproducts. The research activity is aimed at improving thethermal efficiency and the management of the plants. The heatexchanger that is placed downstream of the combustionchamber is a key component of the plant. That is the elementwhere energy is recovered, and it has to deal with hightemperatures, hence it is service life affects the maintenanceof the entire system. Increasing the energy recovery andextending the heat exchanger life are the aims of the CFD andFEM study carried out by UNICONFORT and EnginSoft.
The objectiveThe study presented here considers a heat exchanger used forheat recovery from biomass combustion.The first step is the evaluation of the flow conditions inside
the system by means of a 3Dthermo-fluid dynamic simulation,which will give an insight into theflow and temperature distributionsin the system.The second step is a Finite ElementAnalysis of the heat exchangerusing as inputs thermal loadswhich are derived from the CFDanalysis. The purpose is to verifythe stress levels in the structure,
Higher EnergyRecovery andLonger Life forHeat Exchangers
“Efficienza energetica” ed utilizzo di“fonti rinnovabili” sono due temi digrande attualità e che interessano di-versi aspetti della nostra vita quotidia-na, da quella domestica a quella lavo-rativa, perché la bolletta energetica èuna voce pesante sul bilancio familiareed aziendale.Uniconfort basa il proprio successo sul-
le tecnologie per l’utilizzo di fonti rinnovabili e investe, con ri-torno, nella ricerca dell’efficienza energetica.EnginSoft ha affiancato Uniconfort nello sviluppo di un nuovoscambiatore di calore che recupera energia da biomassa. Daquesta collaborazione è nata la scelta di verificare l’efficacia dialcune decisioni progettuali tramite la simulazione, riducendonotevolmente i tempi per l’immissione sul mercato di questoprodotto ed incrementandone la qualità e la durata.
Uniconfort produce impianti per la conversione energetica del-le biomasse provenienti dall’industria agro-forestale, alimenta-re, dalla lavorazione del legno e dall’industria del pellet.Propone impianti “chiavi in mano” di piccola e grande taglia(da 24 a 5800kW) e vanta un centro ricerche interno specializ-zato, che studia ed esegue prove di combustione di biomassesolide di tipo convenzionale e non convenzionale.Di fronte alla necessità di sviluppare un impianto con compo-nenti di nuova concezione, Uniconfort ha deciso di verificare lavalidità del proprio progetto e di ottimizzare un componenteparticolare, lo scambiatore che recupera energia dalla biomas-sa, tramite la simulazione fluidodinamica e meccanica.Lo scambiatore in questione si trova all’uscita della camera dicombustione e trasferisce l’energia dai fumi a un secondo flui-do, che permette poi la generazione di energia elettrica trami-te una turbina.L’investimento in ricerca e sviluppo ha come obiettivo quellodi proporre al mercato un prodotto che dia garanzie di efficien-za in termini di scambio energetico e che sia a bassa manuten-zione. Lo scambiatore infatti è soggetto ad elevate temperatu-re che mettono alla prova la resistenza e la durata del compo-
Energia dalle biomasse: Impiantiad alta efficienzae minore manutenzione grazie alla simulazione
Fig. 1 - CFD and FE model
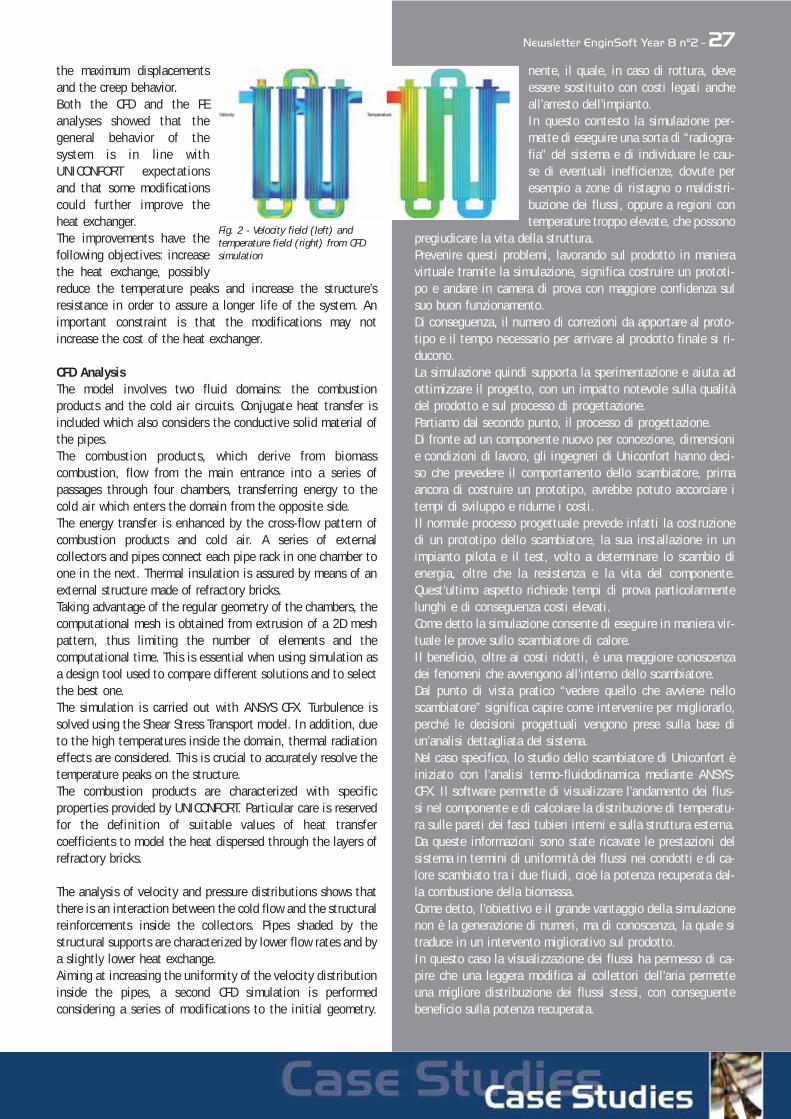
Newsletter EnginSoft Year 8 n°2 - 27the maximum displacementsand the creep behavior.Both the CFD and the FEanalyses showed that thegeneral behavior of thesystem is in line withUNICONFORT expectationsand that some modificationscould further improve theheat exchanger. The improvements have thefollowing objectives: increasethe heat exchange, possiblyreduce the temperature peaks and increase the structure’sresistance in order to assure a longer life of the system. Animportant constraint is that the modifications may notincrease the cost of the heat exchanger.
CFD AnalysisThe model involves two fluid domains: the combustionproducts and the cold air circuits. Conjugate heat transfer isincluded which also considers the conductive solid material ofthe pipes.The combustion products, which derive from biomasscombustion, flow from the main entrance into a series ofpassages through four chambers, transferring energy to thecold air which enters the domain from the opposite side.The energy transfer is enhanced by the cross-flow pattern ofcombustion products and cold air. A series of externalcollectors and pipes connect each pipe rack in one chamber toone in the next. Thermal insulation is assured by means of anexternal structure made of refractory bricks.Taking advantage of the regular geometry of the chambers, thecomputational mesh is obtained from extrusion of a 2D meshpattern, thus limiting the number of elements and thecomputational time. This is essential when using simulation asa design tool used to compare different solutions and to selectthe best one.The simulation is carried out with ANSYS CFX. Turbulence issolved using the Shear Stress Transport model. In addition, dueto the high temperatures inside the domain, thermal radiationeffects are considered. This is crucial to accurately resolve thetemperature peaks on the structure.The combustion products are characterized with specificproperties provided by UNICONFORT. Particular care is reservedfor the definition of suitable values of heat transfercoefficients to model the heat dispersed through the layers ofrefractory bricks.
The analysis of velocity and pressure distributions shows thatthere is an interaction between the cold flow and the structuralreinforcements inside the collectors. Pipes shaded by thestructural supports are characterized by lower flow rates and bya slightly lower heat exchange.Aiming at increasing the uniformity of the velocity distributioninside the pipes, a second CFD simulation is performedconsidering a series of modifications to the initial geometry.
nente, il quale, in caso di rottura, deveessere sostituito con costi legati ancheall’arresto dell’impianto.In questo contesto la simulazione per-mette di eseguire una sorta di “radiogra-fia” del sistema e di individuare le cau-se di eventuali inefficienze, dovute peresempio a zone di ristagno o maldistri-buzione dei flussi, oppure a regioni contemperature troppo elevate, che possono
pregiudicare la vita della struttura.Prevenire questi problemi, lavorando sul prodotto in manieravirtuale tramite la simulazione, significa costruire un prototi-po e andare in camera di prova con maggiore confidenza sulsuo buon funzionamento.Di conseguenza, il numero di correzioni da apportare al proto-tipo e il tempo necessario per arrivare al prodotto finale si ri-ducono.La simulazione quindi supporta la sperimentazione e aiuta adottimizzare il progetto, con un impatto notevole sulla qualitàdel prodotto e sul processo di progettazione.Partiamo dal secondo punto, il processo di progettazione.Di fronte ad un componente nuovo per concezione, dimensionie condizioni di lavoro, gli ingegneri di Uniconfort hanno deci-so che prevedere il comportamento dello scambiatore, primaancora di costruire un prototipo, avrebbe potuto accorciare itempi di sviluppo e ridurne i costi.Il normale processo progettuale prevede infatti la costruzionedi un prototipo dello scambiatore, la sua installazione in unimpianto pilota e il test, volto a determinare lo scambio dienergia, oltre che la resistenza e la vita del componente.Quest’ultimo aspetto richiede tempi di prova particolarmentelunghi e di conseguenza costi elevati.Come detto la simulazione consente di eseguire in maniera vir-tuale le prove sullo scambiatore di calore.Il beneficio, oltre ai costi ridotti, è una maggiore conoscenzadei fenomeni che avvengono all’interno dello scambiatore.Dal punto di vista pratico “vedere quello che avviene nelloscambiatore” significa capire come intervenire per migliorarlo,perché le decisioni progettuali vengono prese sulla base diun’analisi dettagliata del sistema.Nel caso specifico, lo studio dello scambiatore di Uniconfort èiniziato con l’analisi termo-fluidodinamica mediante ANSYS-CFX. Il software permette di visualizzare l’andamento dei flus-si nel componente e di calcolare la distribuzione di temperatu-ra sulle pareti dei fasci tubieri interni e sulla struttura esterna.Da queste informazioni sono state ricavate le prestazioni delsistema in termini di uniformità dei flussi nei condotti e di ca-lore scambiato tra i due fluidi, cioè la potenza recuperata dal-la combustione della biomassa.Come detto, l’obiettivo e il grande vantaggio della simulazionenon è la generazione di numeri, ma di conoscenza, la quale sitraduce in un intervento migliorativo sul prodotto.In questo caso la visualizzazione dei flussi ha permesso di ca-pire che una leggera modifica ai collettori dell’aria permetteuna migliore distribuzione dei flussi stessi, con conseguentebeneficio sulla potenza recuperata.
Fig. 2 - Velocity field (left) andtemperature field (right) from CFDsimulation
28 - Newsletter EnginSoft Year 8 n°2
These modifications involve only the internal structuralsupports inside the collectors, thus they do not have a relevantimpact on the manufacturing costs of the heat exchanger.The modified geometry succeeds in enhancing the distributionof the cold air inside the pipes, increasing the uniformity ofthe flow by 30%. As a consequence, the overall powerexchanged in the system increases.
FE AnalysisFE analysis calculates the thermo-structural behavior of theheat exchanger taking into consideration the pipes rack whichexperiences the highest temperatures, that is the first one nearthe combustion products inlet. The model includes the pipesrack and the upper and lower collectors attached to it.The calculation is performed with ANSYS MECHANICAL. Theanalysis is multi-step with both material and geometric non-linearity, large deflections and contacts. The material is steel,considered as isotropic and elastic-perfectly plastic. Young’smodulus and yield stress are functions of the materialtemperature.
The objective here is to verify that maximum stress levels anddisplacements are limited under a certain threshold and toevaluate the creep behavior of the structure.The structure stands on the refractory bricks, while appliedloads are the structure weight, an internal pressure and thetemperature distribution determined with the CFD simulation.Hence a 1-way Fluid-Structure-Interaction is carried outinterpolating the CFD results onto the FE mesh.Early post-processing underlines that stress is concentrated inthe upper and lower collectors. Due to this, a modifiedgeometry is proposed for these parts, with an increasedthickness for the collectors’ walls and additionalreinforcements above the upper collector.Further simulations on the second geometry verify theeffectiveness of the proposed modifications in reducingextension and magnitude of stress. Displacements are alsoreduced and the creep behavior is improved.
ConclusionsA 1-way fluid-structure interaction study is carried out on aheat exchanger used for heat recovery from biomasscombustion.The temperature distribution on the structure is calculatedusing a CFD model and is then transferred to a FE model forstress and creep analyses.Both the CFD and the FE simulations show that minor and low-cost modifications to the structure can improve both the heatexchange efficiency and assure a longer life to the system.The impact of simulation has been relevant not only for theimprovements achieved, but above all because of theknowledge acquired by UNICONFORT about the phenomena thatdetermine the performance of their products.
Silvio Geremia - UNICONFORTDavide Cerizza - EnginSoft
Massimo Galbiati - EnginSoft
Di comune accordo EnginSoft ed Uniconfort hanno deciso dimodificare i collettori e di ripetere la simulazione termo-flui-dodinamica. L’analisi ha confermato una maggiore uniformitàdei flussi nel fascio tubiero del 30%.Il passo successivo consiste nel trasferire le informazioni ditemperatura e pressione calcolate dall’analisi termo-fluidodina-mica al modello strutturale.In questo modo il modello strutturale utilizza le reali distribu-zioni di pressione e temperatura come condizione di carico peril fascio tubiero.
Un processo di analisi che coinvolge sia la parte fluidodinami-ca che quella strutturale riduce le semplificazioni e le assun-zioni riguardo ai carichi agenti sulla struttura e avvicina i mo-delli virtuali alla realtà.Il modello meccanico dello scambiatore ha consentito il calco-lo delle deformazioni dei fasci tubieri, della resistenza dellastruttura e ha fornito una stima della sua vita.Come nel caso dellafluidodinamica, difronte alla visualizza-zione dello stato disollecitazione gli inge-gneri di Uniconforthanno deciso di inseri-re alcuni rinforzi chehanno aumentato laresistenza ed hannoallungato la vita delloscambiatore.Le modifiche propostetramite la simulazionehanno avuto un impat-to molto ridotto intermini di costo, per-ché di lieve entità ri-spetto alla struttura complessiva, e sono state particolarmen-te efficienti, perché introdotte nella fase iniziale del progetto,quando si ha ancora facilità di intervento.
L’investimento di Uniconfort è stato ripagato in termini di qua-lità dello scambiatore, che significa prestazioni elevate e ga-ranzie di resistenza.Conoscere il proprio prodotto e sapere come migliorarlo forni-sce un ritorno economico e in termini di sicurezza e confiden-za su ciò che Uniconfort propone ai propri clienti.La capacità di “entrare dentro lo scambiatore” per vedere quel-lo avviene ai flussi e alla struttura si è tradotto nella capacitàdi intervenire per migliorare il progetto.Non solo, la conoscenza acquisita diventa un patrimonio azien-dale che permette di affrontare i progetti futuri da un gradinosuperiore e diventa la base per continuare ad innovare e man-tenere la propria posizione di mercato nel lungo termine.
Silvio Geremia - UNICONFORTDavide Cerizza - EnginSoft
Massimo Galbiati - EnginSoft
Fig. 3 - Temperature field from CFD (left),stresses and displacements results (right)
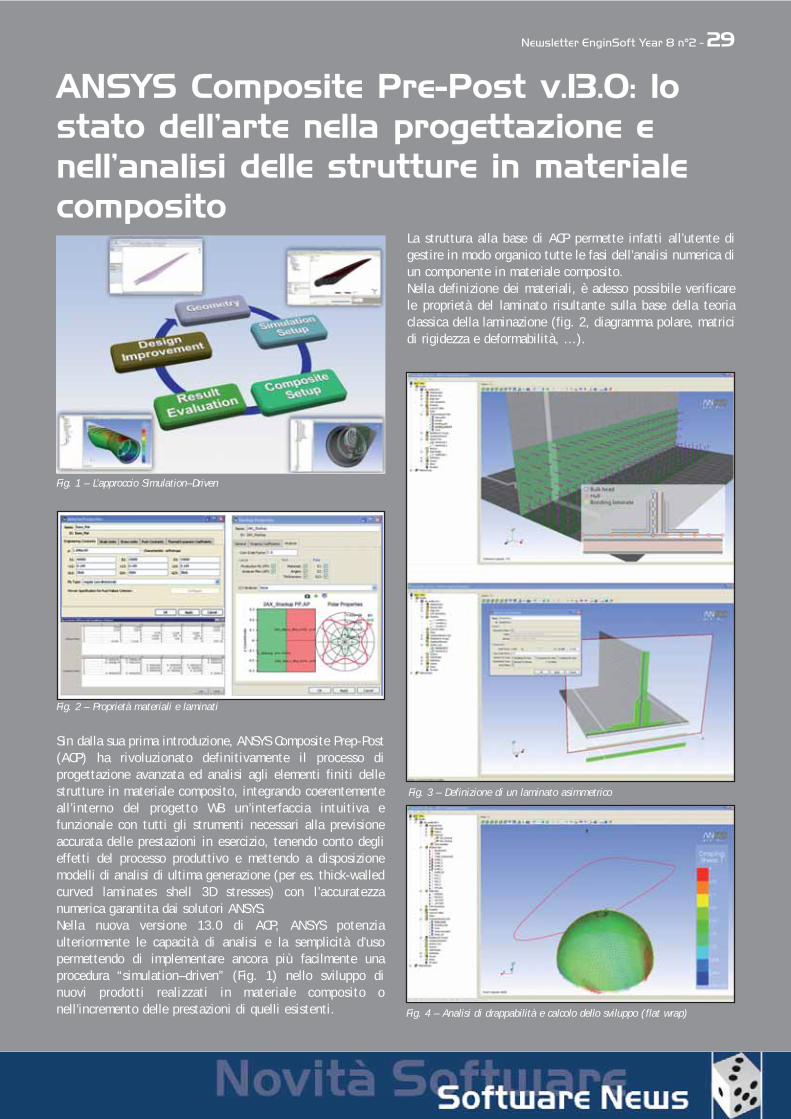
Newsletter EnginSoft Year 8 n°2 - 29
Sin dalla sua prima introduzione, ANSYS Composite Prep-Post(ACP) ha rivoluzionato definitivamente il processo diprogettazione avanzata ed analisi agli elementi finiti dellestrutture in materiale composito, integrando coerentementeall’interno del progetto WB un’interfaccia intuitiva efunzionale con tutti gli strumenti necessari alla previsioneaccurata delle prestazioni in esercizio, tenendo conto deglieffetti del processo produttivo e mettendo a disposizionemodelli di analisi di ultima generazione (per es. thick-walledcurved laminates shell 3D stresses) con l’accuratezzanumerica garantita dai solutori ANSYS.Nella nuova versione 13.0 di ACP, ANSYS potenziaulteriormente le capacità di analisi e la semplicità d’usopermettendo di implementare ancora più facilmente unaprocedura “simulation–driven” (Fig. 1) nello sviluppo dinuovi prodotti realizzati in materiale composito onell’incremento delle prestazioni di quelli esistenti.
La struttura alla base di ACP permette infatti all’utente digestire in modo organico tutte le fasi dell’analisi numerica diun componente in materiale composito.Nella definizione dei materiali, è adesso possibile verificarele proprietà del laminato risultante sulla base della teoriaclassica della laminazione (fig. 2, diagramma polare, matricidi rigidezza e deformabilità, …).
ANSYS Composite Pre-Post v.13.0: lostato dell’arte nella progettazione enell’analisi delle strutture in materialecomposito
Fig. 1 – L’approccio Simulation–Driven
Fig. 2 – Proprietà materiali e laminati
Fig. 3 – Definizione di un laminato asimmetrico
Fig. 4 – Analisi di drappabilità e calcolo dello sviluppo (flat wrap)
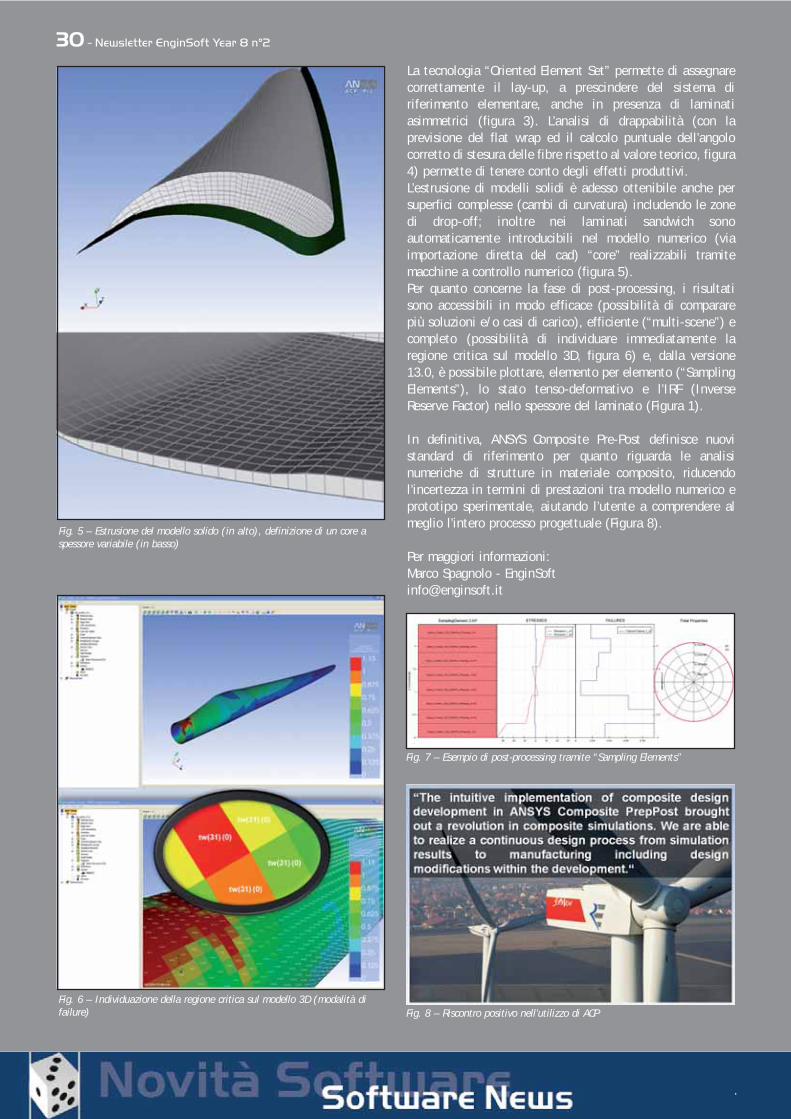
30 - Newsletter EnginSoft Year 8 n°2
La tecnologia “Oriented Element Set” permette di assegnarecorrettamente il lay-up, a prescindere del sistema diriferimento elementare, anche in presenza di laminatiasimmetrici (figura 3). L’analisi di drappabilità (con laprevisione del flat wrap ed il calcolo puntuale dell’angolocorretto di stesura delle fibre rispetto al valore teorico, figura4) permette di tenere conto degli effetti produttivi.L’estrusione di modelli solidi è adesso ottenibile anche persuperfici complesse (cambi di curvatura) includendo le zonedi drop-off; inoltre nei laminati sandwich sonoautomaticamente introducibili nel modello numerico (viaimportazione diretta del cad) “core” realizzabili tramitemacchine a controllo numerico (figura 5).Per quanto concerne la fase di post-processing, i risultatisono accessibili in modo efficace (possibilità di compararepiù soluzioni e/o casi di carico), efficiente (“multi-scene”) ecompleto (possibilità di individuare immediatamente laregione critica sul modello 3D, figura 6) e, dalla versione13.0, è possibile plottare, elemento per elemento (“SamplingElements”), lo stato tenso-deformativo e l’IRF (InverseReserve Factor) nello spessore del laminato (Figura 1).
In definitiva, ANSYS Composite Pre-Post definisce nuovistandard di riferimento per quanto riguarda le analisinumeriche di strutture in materiale composito, riducendol’incertezza in termini di prestazioni tra modello numerico eprototipo sperimentale, aiutando l’utente a comprendere almeglio l’intero processo progettuale (Figura 8).
Per maggiori informazioni:Marco Spagnolo - [email protected]
Fig. 5 – Estrusione del modello solido (in alto), definizione di un core aspessore variabile (in basso)
Fig. 6 – Individuazione della regione critica sul modello 3D (modalità difailure) Fig. 8 – Riscontro positivo nell’utilizzo di ACP
Fig. 7 – Esempio di post-processing tramite “Sampling Elements”
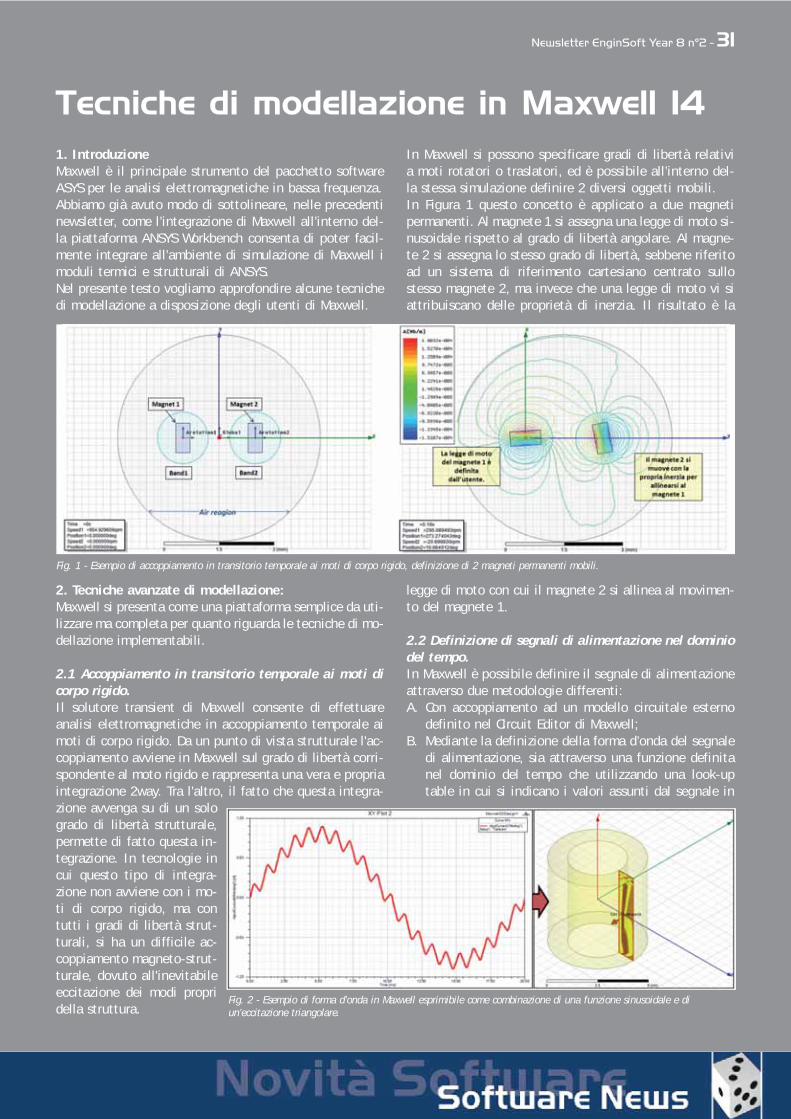
Newsletter EnginSoft Year 8 n°2 - 31
1. IntroduzioneMaxwell è il principale strumento del pacchetto softwareASYS per le analisi elettromagnetiche in bassa frequenza. Abbiamo già avuto modo di sottolineare, nelle precedentinewsletter, come l’integrazione di Maxwell all’interno del-la piattaforma ANSYS Workbench consenta di poter facil-mente integrare all’ambiente di simulazione di Maxwell imoduli termici e strutturali di ANSYS.Nel presente testo vogliamo approfondire alcune tecnichedi modellazione a disposizione degli utenti di Maxwell.
2. Tecniche avanzate di modellazione:Maxwell si presenta come una piattaforma semplice da uti-lizzare ma completa per quanto riguarda le tecniche di mo-dellazione implementabili.
2.1 Accoppiamento in transitorio temporale ai moti dicorpo rigido.Il solutore transient di Maxwell consente di effettuareanalisi elettromagnetiche in accoppiamento temporale aimoti di corpo rigido. Da un punto di vista strutturale l'ac-coppiamento avviene in Maxwell sul grado di libertà corri-spondente al moto rigido e rappresenta una vera e propriaintegrazione 2way. Tra l'altro, il fatto che questa integra-zione avvenga su di un sologrado di libertà strutturale,permette di fatto questa in-tegrazione. In tecnologie incui questo tipo di integra-zione non avviene con i mo-ti di corpo rigido, ma contutti i gradi di libertà strut-turali, si ha un difficile ac-coppiamento magneto-strut-turale, dovuto all'inevitabileeccitazione dei modi propridella struttura.
In Maxwell si possono specificare gradi di libertà relativia moti rotatori o traslatori, ed è possibile all’interno del-la stessa simulazione definire 2 diversi oggetti mobili. In Figura 1 questo concetto è applicato a due magnetipermanenti. Al magnete 1 si assegna una legge di moto si-nusoidale rispetto al grado di libertà angolare. Al magne-te 2 si assegna lo stesso grado di libertà, sebbene riferitoad un sistema di riferimento cartesiano centrato sullostesso magnete 2, ma invece che una legge di moto vi siattribuiscano delle proprietà di inerzia. Il risultato è la
legge di moto con cui il magnete 2 si allinea al movimen-to del magnete 1.
2.2 Definizione di segnali di alimentazione nel dominiodel tempo.In Maxwell è possibile definire il segnale di alimentazioneattraverso due metodologie differenti:A. Con accoppiamento ad un modello circuitale esterno
definito nel Circuit Editor di Maxwell;B. Mediante la definizione della forma d’onda del segnale
di alimentazione, sia attraverso una funzione definitanel dominio del tempo che utilizzando una look-uptable in cui si indicano i valori assunti dal segnale in
Tecniche di modellazione in Maxwell 14
Fig. 1 - Esempio di accoppiamento in transitorio temporale ai moti di corpo rigido, definizione di 2 magneti permanenti mobili.
Fig. 2 - Esempio di forma d’onda in Maxwell esprimibile come combinazione di una funzione sinusoidale e diun’eccitazione triangolare.
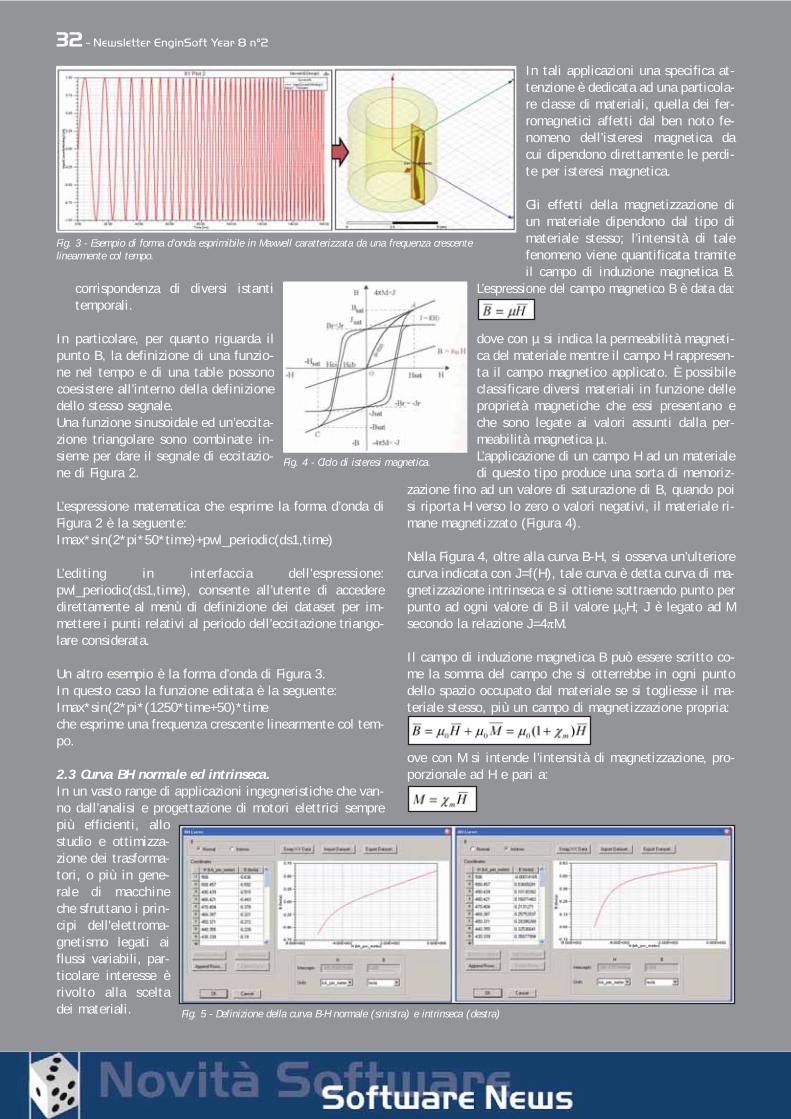
32 - Newsletter EnginSoft Year 8 n°2
corrispondenza di diversi istantitemporali.
In particolare, per quanto riguarda ilpunto B, la definizione di una funzio-ne nel tempo e di una table possonocoesistere all’interno della definizionedello stesso segnale. Una funzione sinusoidale ed un’eccita-zione triangolare sono combinate in-sieme per dare il segnale di eccitazio-ne di Figura 2.
L’espressione matematica che esprime la forma d’onda diFigura 2 è la seguente: Imax*sin(2*pi*50*time)+pwl_periodic(ds1,time)
L’editing in interfaccia dell’espressione:pwl_periodic(ds1,time), consente all’utente di accederedirettamente al menù di definizione dei dataset per im-mettere i punti relativi al periodo dell’eccitazione triango-lare considerata.
Un altro esempio è la forma d’onda di Figura 3. In questo caso la funzione editata è la seguente:Imax*sin(2*pi*(1250*time+50)*timeche esprime una frequenza crescente linearmente col tem-po.
2.3 Curva BH normale ed intrinseca. In un vasto range di applicazioni ingegneristiche che van-no dall’analisi e progettazione di motori elettrici semprepiù efficienti, allostudio e ottimizza-zione dei trasforma-tori, o più in gene-rale di macchineche sfruttano i prin-cipi dell'elettroma-gnetismo legati aiflussi variabili, par-ticolare interesse èrivolto alla sceltadei materiali.
In tali applicazioni una specifica at-tenzione è dedicata ad una particola-re classe di materiali, quella dei fer-romagnetici affetti dal ben noto fe-nomeno dell’isteresi magnetica dacui dipendono direttamente le perdi-te per isteresi magnetica.
Gli effetti della magnetizzazione diun materiale dipendono dal tipo dimateriale stesso; l’intensità di talefenomeno viene quantificata tramiteil campo di induzione magnetica B.
L’espressione del campo magnetico B è data da:
dove con µ si indica la permeabilità magneti-ca del materiale mentre il campo H rappresen-ta il campo magnetico applicato. È possibileclassificare diversi materiali in funzione delleproprietà magnetiche che essi presentano eche sono legate ai valori assunti dalla per-meabilità magnetica µ.L’applicazione di un campo H ad un materialedi questo tipo produce una sorta di memoriz-
zazione fino ad un valore di saturazione di B, quando poisi riporta H verso lo zero o valori negativi, il materiale ri-mane magnetizzato (Figura 4).
Nella Figura 4, oltre alla curva B-H, si osserva un’ulteriorecurva indicata con J=f(H), tale curva è detta curva di ma-gnetizzazione intrinseca e si ottiene sottraendo punto perpunto ad ogni valore di B il valore µ0H; J è legato ad Msecondo la relazione J=4πM.
Il campo di induzione magnetica B può essere scritto co-me la somma del campo che si otterrebbe in ogni puntodello spazio occupato dal materiale se si togliesse il ma-teriale stesso, più un campo di magnetizzazione propria:
ove con M si intende l’intensità di magnetizzazione, pro-porzionale ad H e pari a:
Fig. 3 - Esempio di forma d’onda esprimibile in Maxwell caratterizzata da una frequenza crescentelinearmente col tempo.
Fig. 4 - Ciclo di isteresi magnetica.
Fig. 5 - Definizione della curva B-H normale (sinistra) e intrinseca (destra)
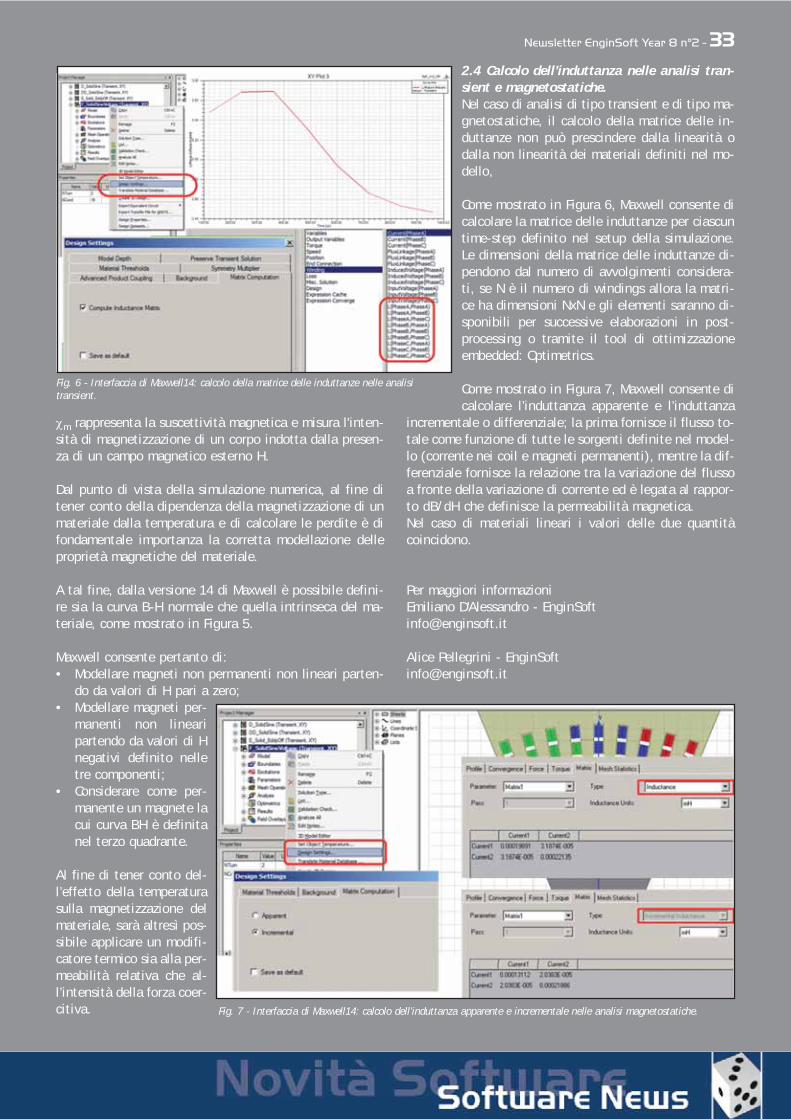
Newsletter EnginSoft Year 8 n°2 - 33
χm rappresenta la suscettività magnetica e misura l'inten-sità di magnetizzazione di un corpo indotta dalla presen-za di un campo magnetico esterno H.
Dal punto di vista della simulazione numerica, al fine ditener conto della dipendenza della magnetizzazione di unmateriale dalla temperatura e di calcolare le perdite è difondamentale importanza la corretta modellazione delleproprietà magnetiche del materiale.
A tal fine, dalla versione 14 di Maxwell è possibile defini-re sia la curva B-H normale che quella intrinseca del ma-teriale, come mostrato in Figura 5.
Maxwell consente pertanto di:• Modellare magneti non permanenti non lineari parten-
do da valori di H pari a zero;• Modellare magneti per-
manenti non linearipartendo da valori di Hnegativi definito nelletre componenti;
• Considerare come per-manente un magnete lacui curva BH è definitanel terzo quadrante.
Al fine di tener conto del-l’effetto della temperaturasulla magnetizzazione delmateriale, sarà altresì pos-sibile applicare un modifi-catore termico sia alla per-meabilità relativa che al-l’intensità della forza coer-citiva.
2.4 Calcolo dell’induttanza nelle analisi tran-sient e magnetostatiche.Nel caso di analisi di tipo transient e di tipo ma-gnetostatiche, il calcolo della matrice delle in-duttanze non può prescindere dalla linearità odalla non linearità dei materiali definiti nel mo-dello,
Come mostrato in Figura 6, Maxwell consente dicalcolare la matrice delle induttanze per ciascuntime-step definito nel setup della simulazione.Le dimensioni della matrice delle induttanze di-pendono dal numero di avvolgimenti considera-ti, se N è il numero di windings allora la matri-ce ha dimensioni NxN e gli elementi saranno di-sponibili per successive elaborazioni in post-processing o tramite il tool di ottimizzazioneembedded: Optimetrics.
Come mostrato in Figura 7, Maxwell consente dicalcolare l’induttanza apparente e l’induttanza
incrementale o differenziale; la prima fornisce il flusso to-tale come funzione di tutte le sorgenti definite nel model-lo (corrente nei coil e magneti permanenti), mentre la dif-ferenziale fornisce la relazione tra la variazione del flussoa fronte della variazione di corrente ed è legata al rappor-to dB/dH che definisce la permeabilità magnetica.Nel caso di materiali lineari i valori delle due quantitàcoincidono.
Per maggiori informazioniEmiliano D’Alessandro - [email protected]
Alice Pellegrini - [email protected]
Fig. 6 - Interfaccia di Maxwell14: calcolo della matrice delle induttanze nelle analisitransient.
Fig. 7 - Interfaccia di Maxwell14: calcolo dell’induttanza apparente e incrementale nelle analisi magnetostatiche.

34 - Newsletter EnginSoft Year 8 n°2
Flowmaster system simulation software enables designengineers and analysts to understand the complex internalflow and thermal effects within fluid systems at theconcept stage and throughout the development process.Flowmaster provides users with a greater understanding offluid systems much earlier, increasing quality andperformance while shortening the development cycle.
In May 2011, the new release V7.8 was launched. Thefeatures developed for Flowmaster V7.8 are based onextensive customer feedback and have been designed toprovide users with accurate and comprehensive softwarefor simulating complex fluid networks, improving accuracyand reducing costs.
Dr Alan Moore, Research and Development Director ofFlowmaster Ltd. says:“Customer research played a tremendous role in thedevelopment of Flowmaster V7.8. We spoke with many ofour customers to identify what their needs are, anddetermine the features and functionalities most importantto them. The result is that Flowmaster V7.8 offers some ofthe most advanced technology ever seen in the system CFDmarket coupled with intuitive user-friendly features andfunctionality.”
Developed with a particular focus on large plant andpiping operations, Flowmaster V7.8 boasts newfunctionality including data wizards for Pipe Roughnessand Pipe Schedules, Additional Heat Transfer Options forMultiple Pipe Layers, Flow Coefficient Curve Creator, newHeat Exchangers and a new Rigorous Energy BalanceSolver for compressible problems. In addition, two newImport Tools are available, one for 3D CAD Piping and asecond for GIS. The improved functionalities ofFlowmaster V7.8 reduce the need to spend time pre-processing data and thus reducing the risk of introducinghuman error.
3D CAD Piping and GIS Import ToolsThe 3D CAD Piping Import Tool provides engineers with aneasy to use interface which enables 3D CAD piping files tobe loaded directly into Flowmaster, utilizing componentmapping to reduce data entry time and minimize the riskof error through an automated process.The 3D CAD Piping Import tool automates the process ofcreating the Flowmaster network based on work alreadycompleted in other applications such as Bentley
AutoPLANT, AVEVA PDMS and Intergraph SmartPlant 3D.This becomes increasingly important as the size andcomplexity of the system increases. Automating theprocess in this way saves time and reduces the risk ofhuman error. This helps reduce the risk of error whenentering the data and will result in more efficient use ofengineers’ time by importing the data and allowing thetool to create the network instead of an engineermanually building the networks.
The GIS Import Tool provides users with an easy to useinterface enabling Shape Files to be imported directly intoFlowmaster without the need for recreation. The interface
Fig. 1 - Example of CAD piping model and 3D CAD Import Tool (courtesy ofBentley AutoPLANT)
Flowmaster V7.8
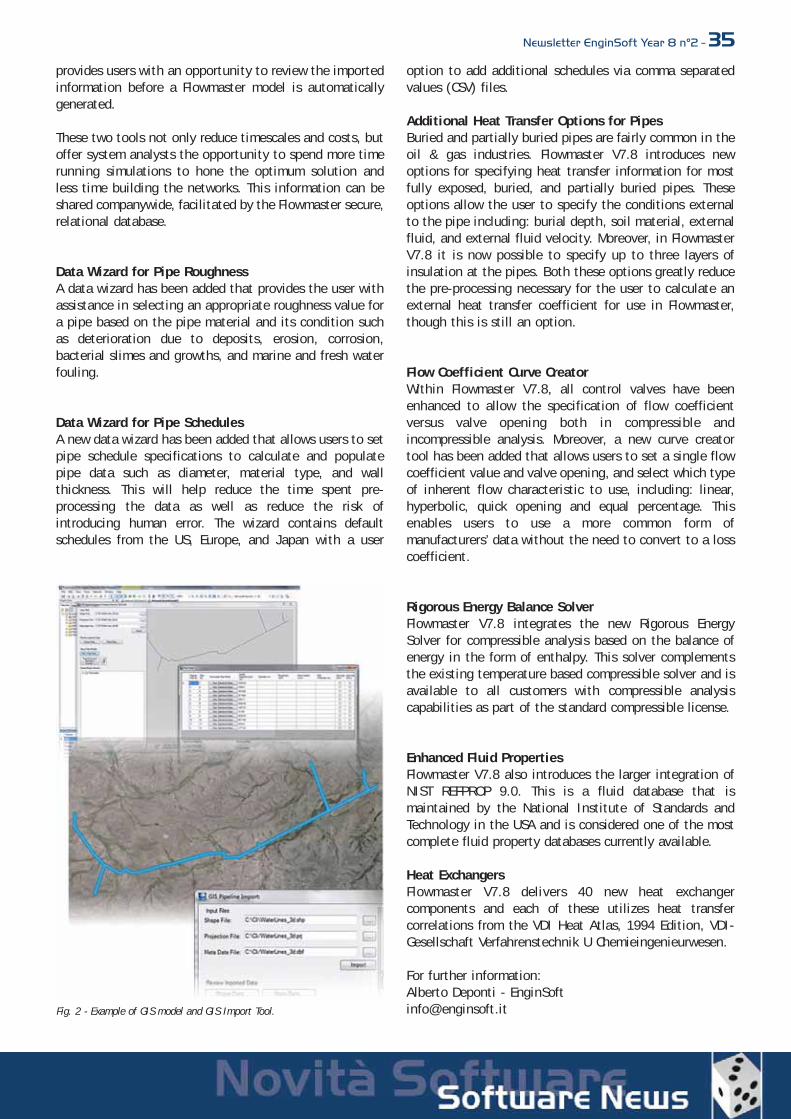
Newsletter EnginSoft Year 8 n°2 - 35provides users with an opportunity to review the importedinformation before a Flowmaster model is automaticallygenerated.
These two tools not only reduce timescales and costs, butoffer system analysts the opportunity to spend more timerunning simulations to hone the optimum solution andless time building the networks. This information can beshared companywide, facilitated by the Flowmaster secure,relational database.
Data Wizard for Pipe RoughnessA data wizard has been added that provides the user withassistance in selecting an appropriate roughness value fora pipe based on the pipe material and its condition suchas deterioration due to deposits, erosion, corrosion,bacterial slimes and growths, and marine and fresh waterfouling.
Data Wizard for Pipe Schedules A new data wizard has been added that allows users to setpipe schedule specifications to calculate and populatepipe data such as diameter, material type, and wallthickness. This will help reduce the time spent pre-processing the data as well as reduce the risk ofintroducing human error. The wizard contains defaultschedules from the US, Europe, and Japan with a user
option to add additional schedules via comma separatedvalues (CSV) files.
Additional Heat Transfer Options for PipesBuried and partially buried pipes are fairly common in theoil & gas industries. Flowmaster V7.8 introduces newoptions for specifying heat transfer information for mostfully exposed, buried, and partially buried pipes. Theseoptions allow the user to specify the conditions externalto the pipe including: burial depth, soil material, externalfluid, and external fluid velocity. Moreover, in FlowmasterV7.8 it is now possible to specify up to three layers ofinsulation at the pipes. Both these options greatly reducethe pre-processing necessary for the user to calculate anexternal heat transfer coefficient for use in Flowmaster,though this is still an option.
Flow Coefficient Curve Creator Within Flowmaster V7.8, all control valves have beenenhanced to allow the specification of flow coefficientversus valve opening both in compressible andincompressible analysis. Moreover, a new curve creatortool has been added that allows users to set a single flowcoefficient value and valve opening, and select which typeof inherent flow characteristic to use, including: linear,hyperbolic, quick opening and equal percentage. Thisenables users to use a more common form ofmanufacturers’ data without the need to convert to a losscoefficient.
Rigorous Energy Balance SolverFlowmaster V7.8 integrates the new Rigorous EnergySolver for compressible analysis based on the balance ofenergy in the form of enthalpy. This solver complementsthe existing temperature based compressible solver and isavailable to all customers with compressible analysiscapabilities as part of the standard compressible license.
Enhanced Fluid Properties Flowmaster V7.8 also introduces the larger integration ofNIST REFPROP 9.0. This is a fluid database that ismaintained by the National Institute of Standards andTechnology in the USA and is considered one of the mostcomplete fluid property databases currently available.
Heat ExchangersFlowmaster V7.8 delivers 40 new heat exchangercomponents and each of these utilizes heat transfercorrelations from the VDI Heat Atlas, 1994 Edition, VDI-Gesellschaft Verfahrenstechnik U Chemieingenieurwesen.
For further information:Alberto Deponti - [email protected]. 2 - Example of GIS model and GIS Import Tool.
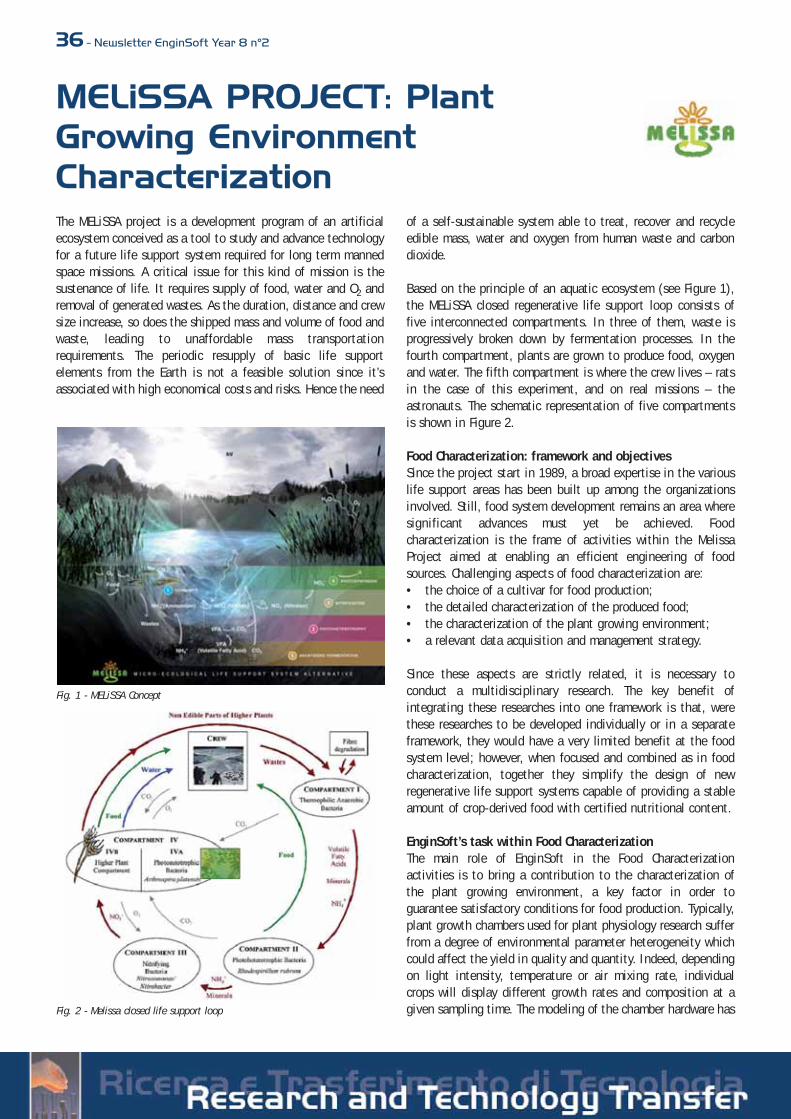
36 - Newsletter EnginSoft Year 8 n°2
The MELiSSA project is a development program of an artificialecosystem conceived as a tool to study and advance technologyfor a future life support system required for long term mannedspace missions. A critical issue for this kind of mission is thesustenance of life. It requires supply of food, water and O2 andremoval of generated wastes. As the duration, distance and crewsize increase, so does the shipped mass and volume of food andwaste, leading to unaffordable mass transportationrequirements. The periodic resupply of basic life supportelements from the Earth is not a feasible solution since it’sassociated with high economical costs and risks. Hence the need
of a self-sustainable system able to treat, recover and recycleedible mass, water and oxygen from human waste and carbondioxide.
Based on the principle of an aquatic ecosystem (see Figure 1),the MELiSSA closed regenerative life support loop consists offive interconnected compartments. In three of them, waste isprogressively broken down by fermentation processes. In thefourth compartment, plants are grown to produce food, oxygenand water. The fifth compartment is where the crew lives – ratsin the case of this experiment, and on real missions – theastronauts. The schematic representation of five compartmentsis shown in Figure 2.
Food Characterization: framework and objectivesSince the project start in 1989, a broad expertise in the variouslife support areas has been built up among the organizationsinvolved. Still, food system development remains an area wheresignificant advances must yet be achieved. Foodcharacterization is the frame of activities within the MelissaProject aimed at enabling an efficient engineering of foodsources. Challenging aspects of food characterization are:• the choice of a cultivar for food production; • the detailed characterization of the produced food; • the characterization of the plant growing environment;• a relevant data acquisition and management strategy.
Since these aspects are strictly related, it is necessary toconduct a multidisciplinary research. The key benefit ofintegrating these researches into one framework is that, werethese researches to be developed individually or in a separateframework, they would have a very limited benefit at the foodsystem level; however, when focused and combined as in foodcharacterization, together they simplify the design of newregenerative life support systems capable of providing a stableamount of crop-derived food with certified nutritional content.
EnginSoft’s task within Food CharacterizationThe main role of EnginSoft in the Food Characterizationactivities is to bring a contribution to the characterization ofthe plant growing environment, a key factor in order toguarantee satisfactory conditions for food production. Typically,plant growth chambers used for plant physiology research sufferfrom a degree of environmental parameter heterogeneity whichcould affect the yield in quality and quantity. Indeed, dependingon light intensity, temperature or air mixing rate, individualcrops will display different growth rates and composition at agiven sampling time. The modeling of the chamber hardware has
Fig. 1 - MELiSSA Concept
Fig. 2 - Melissa closed life support loop
MELiSSA PROJECT: PlantGrowing EnvironmentCharacterization
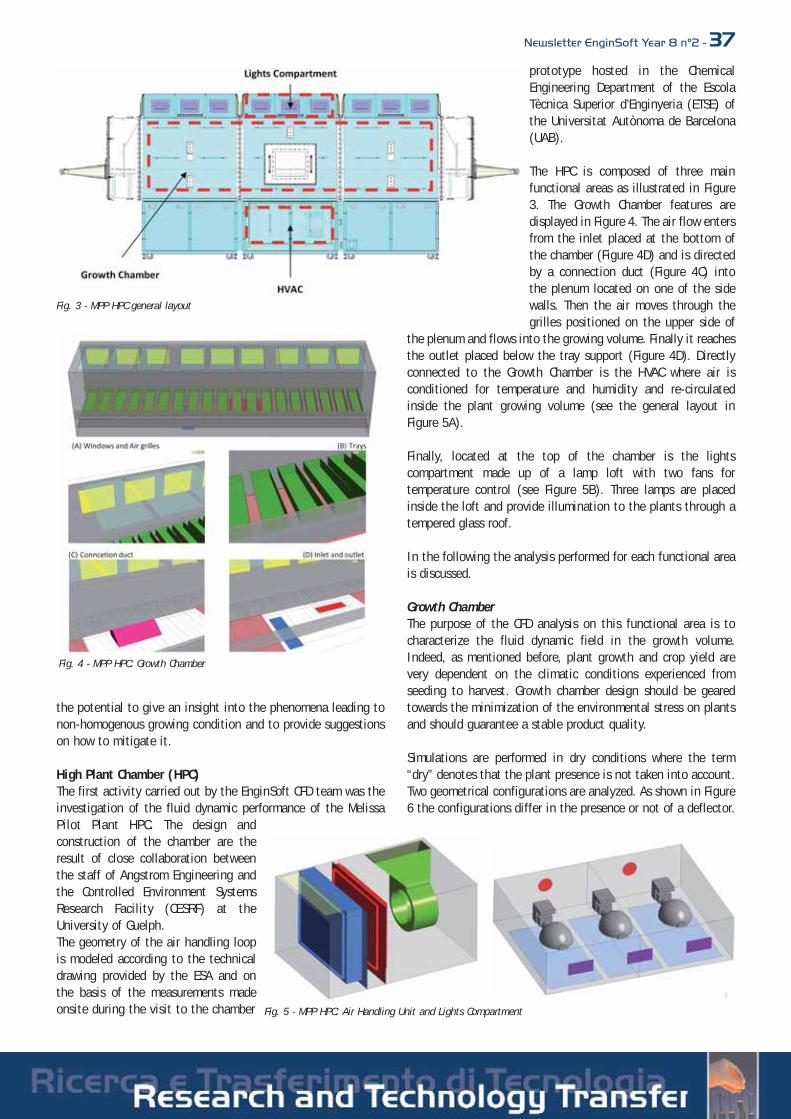
Newsletter EnginSoft Year 8 n°2 - 37
the potential to give an insight into the phenomena leading tonon-homogenous growing condition and to provide suggestionson how to mitigate it.
High Plant Chamber (HPC)The first activity carried out by the EnginSoft CFD team was theinvestigation of the fluid dynamic performance of the MelissaPilot Plant HPC. The design andconstruction of the chamber are theresult of close collaboration betweenthe staff of Angstrom Engineering andthe Controlled Environment SystemsResearch Facility (CESRF) at theUniversity of Guelph.The geometry of the air handling loopis modeled according to the technicaldrawing provided by the ESA and onthe basis of the measurements madeonsite during the visit to the chamber
prototype hosted in the ChemicalEngineering Department of the EscolaTècnica Superior d’Enginyeria (ETSE) ofthe Universitat Autònoma de Barcelona(UAB).
The HPC is composed of three mainfunctional areas as illustrated in Figure3. The Growth Chamber features aredisplayed in Figure 4. The air flow entersfrom the inlet placed at the bottom ofthe chamber (Figure 4D) and is directedby a connection duct (Figure 4C) intothe plenum located on one of the sidewalls. Then the air moves through thegrilles positioned on the upper side of
the plenum and flows into the growing volume. Finally it reachesthe outlet placed below the tray support (Figure 4D). Directlyconnected to the Growth Chamber is the HVAC where air isconditioned for temperature and humidity and re-circulatedinside the plant growing volume (see the general layout inFigure 5A).
Finally, located at the top of the chamber is the lightscompartment made up of a lamp loft with two fans fortemperature control (see Figure 5B). Three lamps are placedinside the loft and provide illumination to the plants through atempered glass roof.
In the following the analysis performed for each functional areais discussed.
Growth ChamberThe purpose of the CFD analysis on this functional area is tocharacterize the fluid dynamic field in the growth volume.Indeed, as mentioned before, plant growth and crop yield arevery dependent on the climatic conditions experienced fromseeding to harvest. Growth chamber design should be gearedtowards the minimization of the environmental stress on plantsand should guarantee a stable product quality.
Simulations are performed in dry conditions where the term“dry” denotes that the plant presence is not taken into account.Two geometrical configurations are analyzed. As shown in Figure6 the configurations differ in the presence or not of a deflector.
Fig. 3 - MPP HPC general layout
Fig. 4 - MPP HPC: Growth Chamber
Fig. 5 - MPP HPC: Air Handling Unit and Lights Compartment
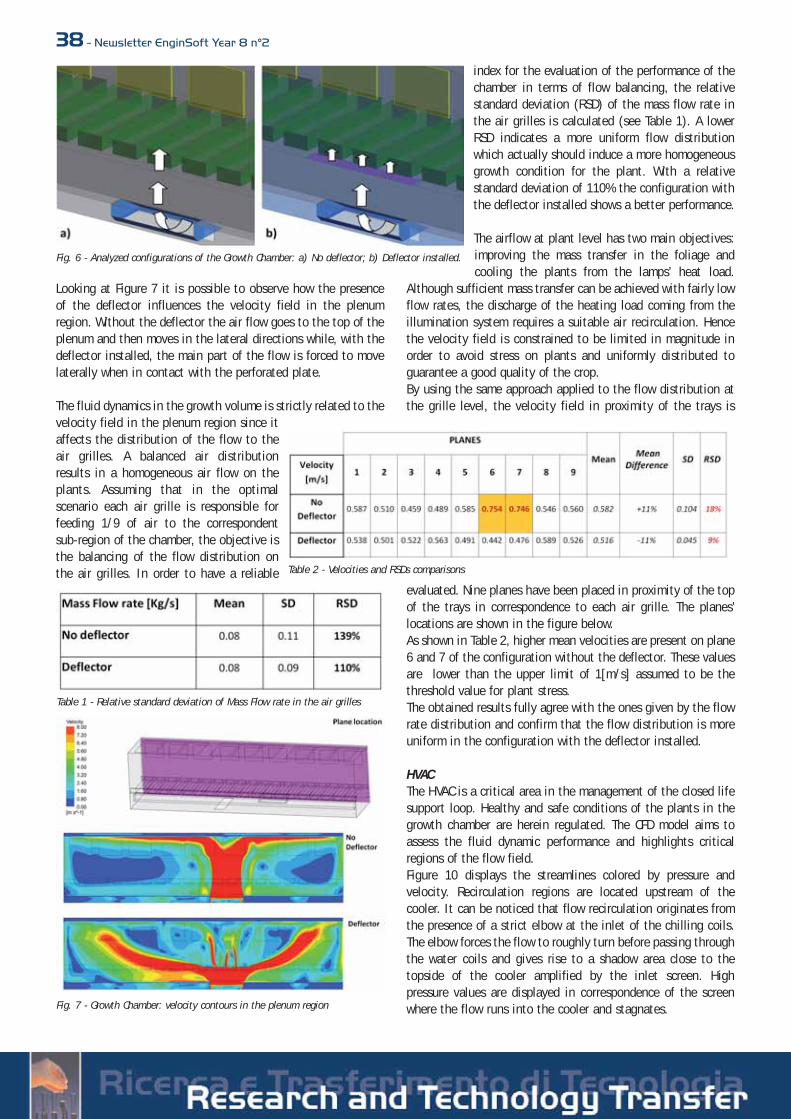
38 - Newsletter EnginSoft Year 8 n°2
Looking at Figure 7 it is possible to observe how the presenceof the deflector influences the velocity field in the plenumregion. Without the deflector the air flow goes to the top of theplenum and then moves in the lateral directions while, with thedeflector installed, the main part of the flow is forced to movelaterally when in contact with the perforated plate.
The fluid dynamics in the growth volume is strictly related to thevelocity field in the plenum region since itaffects the distribution of the flow to theair grilles. A balanced air distributionresults in a homogeneous air flow on theplants. Assuming that in the optimalscenario each air grille is responsible forfeeding 1/9 of air to the correspondentsub-region of the chamber, the objective isthe balancing of the flow distribution onthe air grilles. In order to have a reliable
index for the evaluation of the performance of thechamber in terms of flow balancing, the relativestandard deviation (RSD) of the mass flow rate inthe air grilles is calculated (see Table 1). A lowerRSD indicates a more uniform flow distributionwhich actually should induce a more homogeneousgrowth condition for the plant. With a relativestandard deviation of 110% the configuration withthe deflector installed shows a better performance.
The airflow at plant level has two main objectives:improving the mass transfer in the foliage andcooling the plants from the lamps’ heat load.
Although sufficient mass transfer can be achieved with fairly lowflow rates, the discharge of the heating load coming from theillumination system requires a suitable air recirculation. Hencethe velocity field is constrained to be limited in magnitude inorder to avoid stress on plants and uniformly distributed toguarantee a good quality of the crop.By using the same approach applied to the flow distribution atthe grille level, the velocity field in proximity of the trays is
evaluated. Nine planes have been placed in proximity of the topof the trays in correspondence to each air grille. The planes’locations are shown in the figure below. As shown in Table 2, higher mean velocities are present on plane6 and 7 of the configuration without the deflector. These valuesare lower than the upper limit of 1[m/s] assumed to be thethreshold value for plant stress.The obtained results fully agree with the ones given by the flowrate distribution and confirm that the flow distribution is moreuniform in the configuration with the deflector installed.
HVACThe HVAC is a critical area in the management of the closed lifesupport loop. Healthy and safe conditions of the plants in thegrowth chamber are herein regulated. The CFD model aims toassess the fluid dynamic performance and highlights criticalregions of the flow field.Figure 10 displays the streamlines colored by pressure andvelocity. Recirculation regions are located upstream of thecooler. It can be noticed that flow recirculation originates fromthe presence of a strict elbow at the inlet of the chilling coils.The elbow forces the flow to roughly turn before passing throughthe water coils and gives rise to a shadow area close to thetopside of the cooler amplified by the inlet screen. Highpressure values are displayed in correspondence of the screenwhere the flow runs into the cooler and stagnates.
Fig. 6 - Analyzed configurations of the Growth Chamber: a) No deflector; b) Deflector installed.
Fig. 7 - Growth Chamber: velocity contours in the plenum region
Table 1 - Relative standard deviation of Mass Flow rate in the air grilles
Table 2 - Velocities and RSDs comparisons
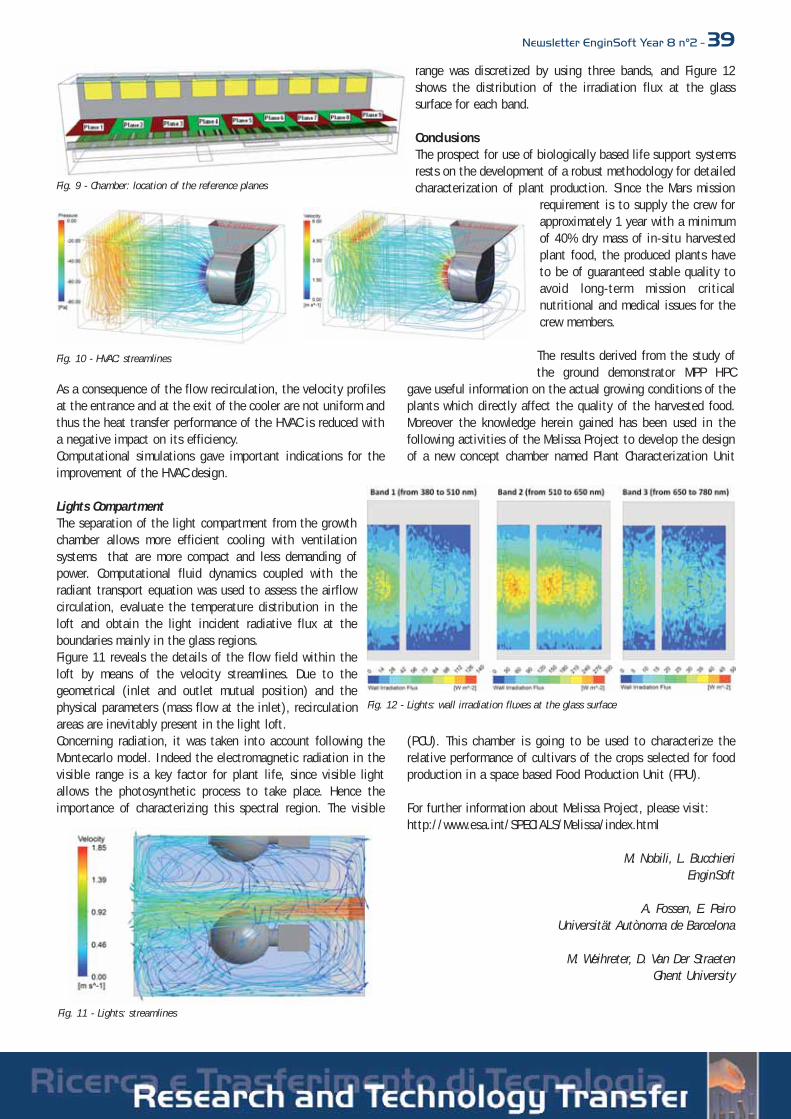
Newsletter EnginSoft Year 8 n°2 - 39
As a consequence of the flow recirculation, the velocity profilesat the entrance and at the exit of the cooler are not uniform andthus the heat transfer performance of the HVAC is reduced witha negative impact on its efficiency. Computational simulations gave important indications for theimprovement of the HVAC design.
Lights CompartmentThe separation of the light compartment from the growthchamber allows more efficient cooling with ventilationsystems that are more compact and less demanding ofpower. Computational fluid dynamics coupled with theradiant transport equation was used to assess the airflowcirculation, evaluate the temperature distribution in theloft and obtain the light incident radiative flux at theboundaries mainly in the glass regions. Figure 11 reveals the details of the flow field within theloft by means of the velocity streamlines. Due to thegeometrical (inlet and outlet mutual position) and thephysical parameters (mass flow at the inlet), recirculationareas are inevitably present in the light loft.Concerning radiation, it was taken into account following theMontecarlo model. Indeed the electromagnetic radiation in thevisible range is a key factor for plant life, since visible lightallows the photosynthetic process to take place. Hence theimportance of characterizing this spectral region. The visible
range was discretized by using three bands, and Figure 12shows the distribution of the irradiation flux at the glasssurface for each band.
ConclusionsThe prospect for use of biologically based life support systemsrests on the development of a robust methodology for detailedcharacterization of plant production. Since the Mars mission
requirement is to supply the crew forapproximately 1 year with a minimumof 40% dry mass of in-situ harvestedplant food, the produced plants haveto be of guaranteed stable quality toavoid long-term mission criticalnutritional and medical issues for thecrew members.
The results derived from the study ofthe ground demonstrator MPP HPC
gave useful information on the actual growing conditions of theplants which directly affect the quality of the harvested food.Moreover the knowledge herein gained has been used in thefollowing activities of the Melissa Project to develop the designof a new concept chamber named Plant Characterization Unit
(PCU). This chamber is going to be used to characterize therelative performance of cultivars of the crops selected for foodproduction in a space based Food Production Unit (FPU).
For further information about Melissa Project, please visit:http://www.esa.int/SPECIALS/Melissa/index.html
M. Nobili, L. BucchieriEnginSoft
A. Fossen, E. PeiroUniversität Autònoma de Barcelona
M. Weihreter, D. Van Der StraetenGhent University
Fig. 9 - Chamber: location of the reference planes
Fig. 10 - HVAC: streamlines
Fig. 11 - Lights: streamlines
Fig. 12 - Lights: wall irradiation fluxes at the glass surface
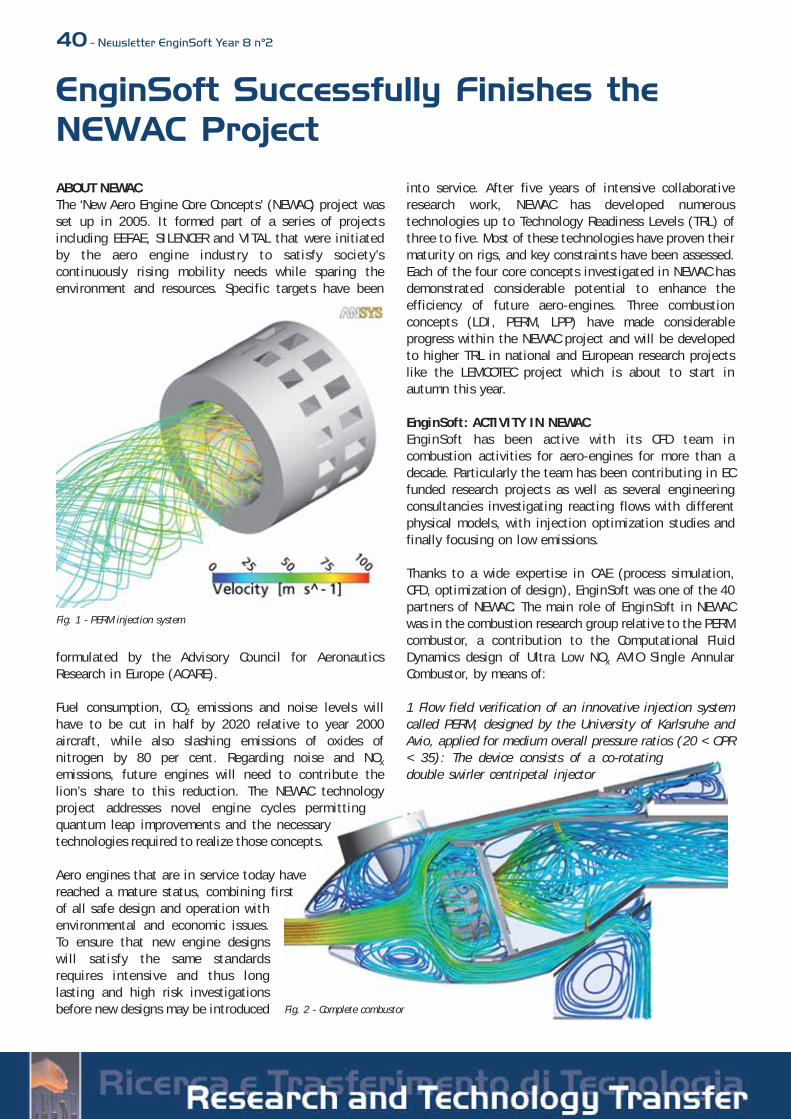
40 - Newsletter EnginSoft Year 8 n°2
ABOUT NEWACThe ‘New Aero Engine Core Concepts’ (NEWAC) project wasset up in 2005. It formed part of a series of projectsincluding EEFAE, SILENCER and VITAL that were initiatedby the aero engine industry to satisfy society’scontinuously rising mobility needs while sparing theenvironment and resources. Specific targets have been
formulated by the Advisory Council for AeronauticsResearch in Europe (ACARE).
Fuel consumption, CO2 emissions and noise levels willhave to be cut in half by 2020 relative to year 2000aircraft, while also slashing emissions of oxides ofnitrogen by 80 per cent. Regarding noise and NOx
emissions, future engines will need to contribute thelion’s share to this reduction. The NEWAC technologyproject addresses novel engine cycles permittingquantum leap improvements and the necessarytechnologies required to realize those concepts.
Aero engines that are in service today havereached a mature status, combining firstof all safe design and operation withenvironmental and economic issues.To ensure that new engine designswill satisfy the same standardsrequires intensive and thus longlasting and high risk investigationsbefore new designs may be introduced
into service. After five years of intensive collaborativeresearch work, NEWAC has developed numeroustechnologies up to Technology Readiness Levels (TRL) ofthree to five. Most of these technologies have proven theirmaturity on rigs, and key constraints have been assessed.Each of the four core concepts investigated in NEWAC hasdemonstrated considerable potential to enhance theefficiency of future aero-engines. Three combustionconcepts (LDI, PERM, LPP) have made considerableprogress within the NEWAC project and will be developedto higher TRL in national and European research projectslike the LEMCOTEC project which is about to start inautumn this year.
EnginSoft: ACTIVITY IN NEWACEnginSoft has been active with its CFD team incombustion activities for aero-engines for more than adecade. Particularly the team has been contributing in ECfunded research projects as well as several engineeringconsultancies investigating reacting flows with differentphysical models, with injection optimization studies andfinally focusing on low emissions.
Thanks to a wide expertise in CAE (process simulation,CFD, optimization of design), EnginSoft was one of the 40partners of NEWAC. The main role of EnginSoft in NEWACwas in the combustion research group relative to the PERMcombustor, a contribution to the Computational FluidDynamics design of Ultra Low NOx AVIO Single AnnularCombustor, by means of:
1 Flow field verification of an innovative injection systemcalled PERM, designed by the University of Karlsruhe andAvio, applied for medium overall pressure ratios (20 < OPR< 35): The device consists of a co-rotatingdouble swirler centripetal injector
Fig. 1 - PERM injection system
EnginSoft Successfully Finishes theNEWAC Project
Fig. 2 - Complete combustor
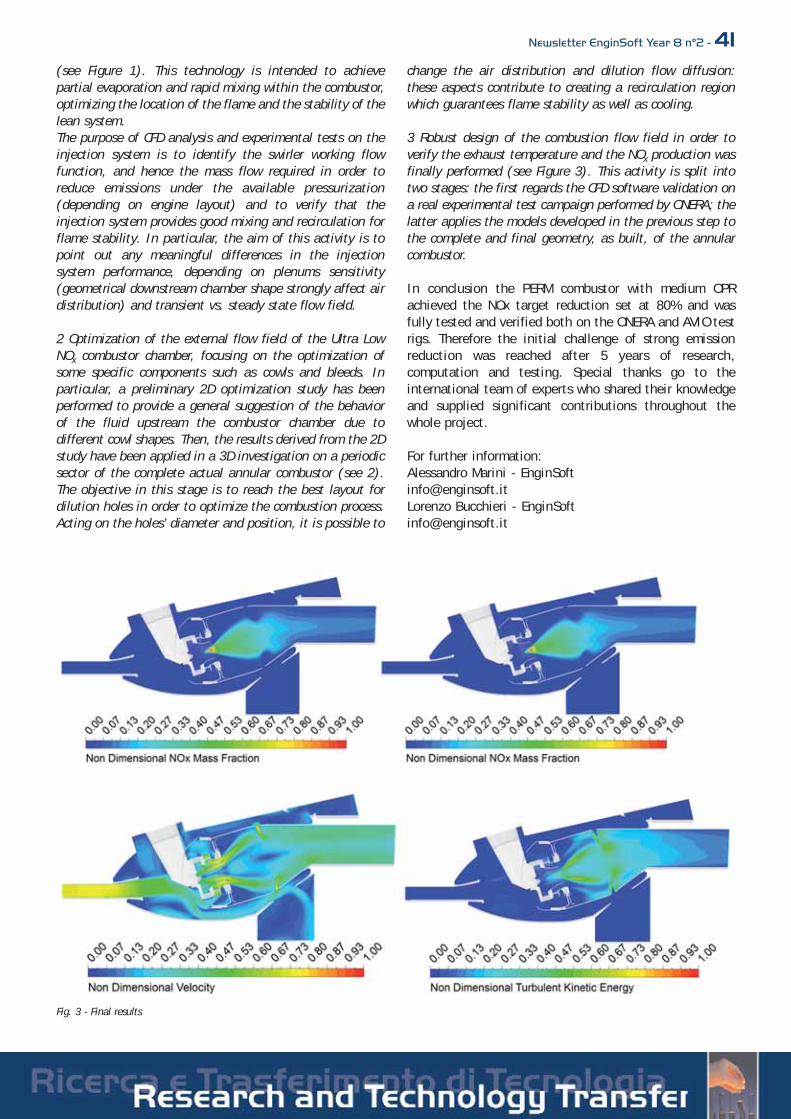
Newsletter EnginSoft Year 8 n°2 - 41(see Figure 1). This technology is intended to achievepartial evaporation and rapid mixing within the combustor,optimizing the location of the flame and the stability of thelean system. The purpose of CFD analysis and experimental tests on theinjection system is to identify the swirler working flowfunction, and hence the mass flow required in order toreduce emissions under the available pressurization(depending on engine layout) and to verify that theinjection system provides good mixing and recirculation forflame stability. In particular, the aim of this activity is topoint out any meaningful differences in the injectionsystem performance, depending on plenums sensitivity(geometrical downstream chamber shape strongly affect airdistribution) and transient vs. steady state flow field.
2 Optimization of the external flow field of the Ultra LowNOx combustor chamber, focusing on the optimization ofsome specific components such as cowls and bleeds. Inparticular, a preliminary 2D optimization study has beenperformed to provide a general suggestion of the behaviorof the fluid upstream the combustor chamber due todifferent cowl shapes. Then, the results derived from the 2Dstudy have been applied in a 3D investigation on a periodicsector of the complete actual annular combustor (see 2).The objective in this stage is to reach the best layout fordilution holes in order to optimize the combustion process.Acting on the holes’ diameter and position, it is possible to
change the air distribution and dilution flow diffusion:these aspects contribute to creating a recirculation regionwhich guarantees flame stability as well as cooling.
3 Robust design of the combustion flow field in order toverify the exhaust temperature and the NOx production wasfinally performed (see Figure 3). This activity is split intotwo stages: the first regards the CFD software validation ona real experimental test campaign performed by ONERA; thelatter applies the models developed in the previous step tothe complete and final geometry, as built, of the annularcombustor.
In conclusion the PERM combustor with medium OPRachieved the NOx target reduction set at 80% and wasfully tested and verified both on the ONERA and AVIO testrigs. Therefore the initial challenge of strong emissionreduction was reached after 5 years of research,computation and testing. Special thanks go to theinternational team of experts who shared their knowledgeand supplied significant contributions throughout thewhole project.
For further information:Alessandro Marini - [email protected] Bucchieri - [email protected]
Fig. 3 - Final results
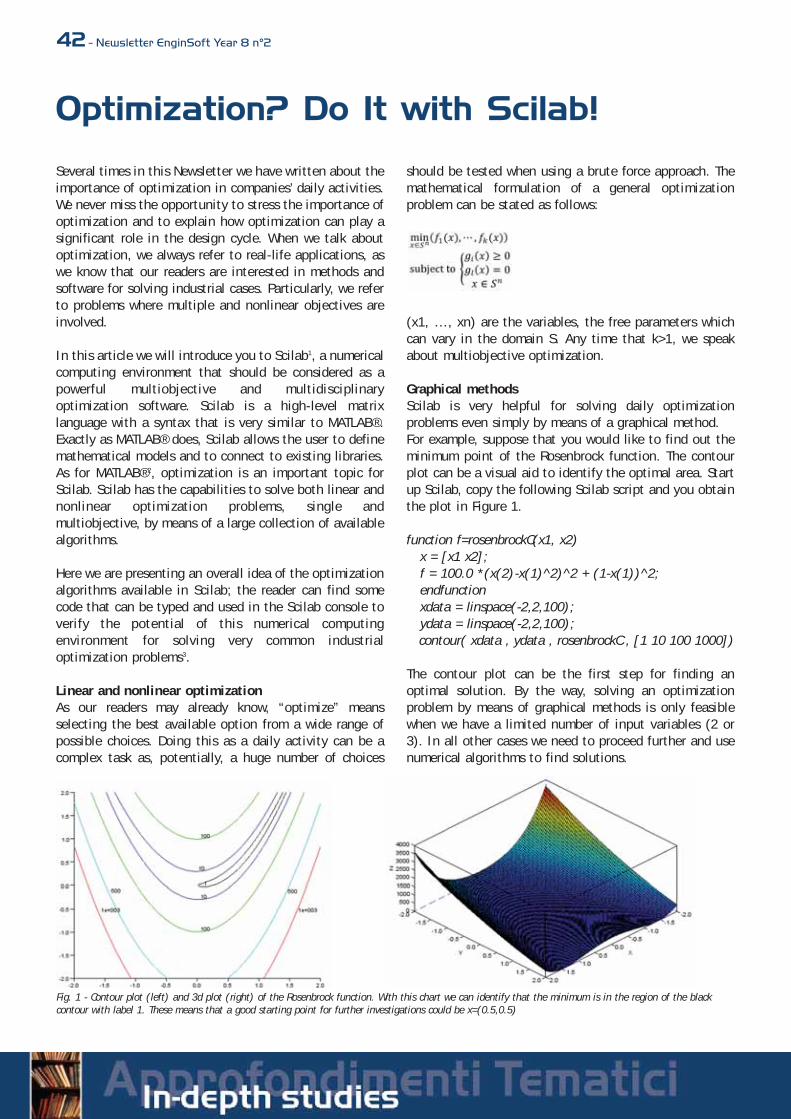
42 - Newsletter EnginSoft Year 8 n°2
Several times in this Newsletter we have written about theimportance of optimization in companies’ daily activities.We never miss the opportunity to stress the importance ofoptimization and to explain how optimization can play asignificant role in the design cycle. When we talk aboutoptimization, we always refer to real-life applications, aswe know that our readers are interested in methods andsoftware for solving industrial cases. Particularly, we referto problems where multiple and nonlinear objectives areinvolved.
In this article we will introduce you to Scilab1, a numericalcomputing environment that should be considered as apowerful multiobjective and multidisciplinaryoptimization software. Scilab is a high-level matrixlanguage with a syntax that is very similar to MATLAB®.Exactly as MATLAB® does, Scilab allows the user to definemathematical models and to connect to existing libraries.As for MATLAB®2, optimization is an important topic forScilab. Scilab has the capabilities to solve both linear andnonlinear optimization problems, single andmultiobjective, by means of a large collection of availablealgorithms.
Here we are presenting an overall idea of the optimizationalgorithms available in Scilab; the reader can find somecode that can be typed and used in the Scilab console toverify the potential of this numerical computingenvironment for solving very common industrialoptimization problems3.
Linear and nonlinear optimizationAs our readers may already know, “optimize” meansselecting the best available option from a wide range ofpossible choices. Doing this as a daily activity can be acomplex task as, potentially, a huge number of choices
should be tested when using a brute force approach. Themathematical formulation of a general optimizationproblem can be stated as follows:
(x1, …, xn) are the variables, the free parameters whichcan vary in the domain S. Any time that k>1, we speakabout multiobjective optimization.
Graphical methodsScilab is very helpful for solving daily optimizationproblems even simply by means of a graphical method.For example, suppose that you would like to find out theminimum point of the Rosenbrock function. The contourplot can be a visual aid to identify the optimal area. Startup Scilab, copy the following Scilab script and you obtainthe plot in Figure 1.
function f=rosenbrockC(x1, x2)x = [x1 x2];f = 100.0 *(x(2)-x(1)^2)^2 + (1-x(1))^2;endfunctionxdata = linspace(-2,2,100); ydata = linspace(-2,2,100);contour( xdata , ydata , rosenbrockC , [1 10 100 1000])
The contour plot can be the first step for finding anoptimal solution. By the way, solving an optimizationproblem by means of graphical methods is only feasiblewhen we have a limited number of input variables (2 or3). In all other cases we need to proceed further and usenumerical algorithms to find solutions.
Fig. 1 - Contour plot (left) and 3d plot (right) of the Rosenbrock function. With this chart we can identify that the minimum is in the region of the blackcontour with label 1. These means that a good starting point for further investigations could be x=(0.5,0.5)
Optimization? Do It with Scilab!
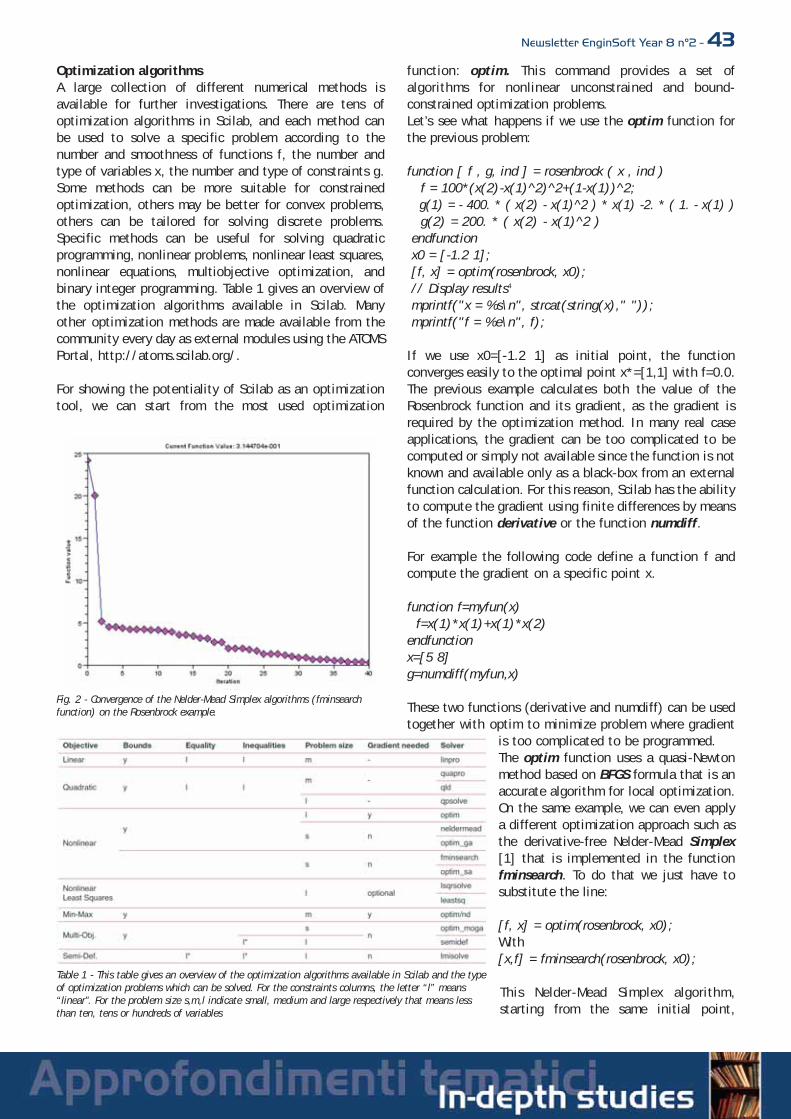
Newsletter EnginSoft Year 8 n°2 - 43Optimization algorithmsA large collection of different numerical methods isavailable for further investigations. There are tens ofoptimization algorithms in Scilab, and each method canbe used to solve a specific problem according to thenumber and smoothness of functions f, the number andtype of variables x, the number and type of constraints g.Some methods can be more suitable for constrainedoptimization, others may be better for convex problems,others can be tailored for solving discrete problems.Specific methods can be useful for solving quadraticprogramming, nonlinear problems, nonlinear least squares,nonlinear equations, multiobjective optimization, andbinary integer programming. Table 1 gives an overview ofthe optimization algorithms available in Scilab. Manyother optimization methods are made available from thecommunity every day as external modules using the ATOMSPortal, http://atoms.scilab.org/.
For showing the potentiality of Scilab as an optimizationtool, we can start from the most used optimization
function: optim. This command provides a set ofalgorithms for nonlinear unconstrained and bound-constrained optimization problems.Let’s see what happens if we use the optim function forthe previous problem:
function [ f , g, ind ] = rosenbrock ( x , ind )f = 100*(x(2)-x(1)^2)^2+(1-x(1))^2;g(1) = - 400. * ( x(2) - x(1)^2 ) * x(1) -2. * ( 1. - x(1) )g(2) = 200. * ( x(2) - x(1)^2 )
endfunctionx0 = [-1.2 1];[f, x] = optim(rosenbrock, x0);// Display results4
mprintf("x = %s\n", strcat(string(x)," "));mprintf("f = %e\n", f);
If we use x0=[-1.2 1] as initial point, the functionconverges easily to the optimal point x*=[1,1] with f=0.0.The previous example calculates both the value of theRosenbrock function and its gradient, as the gradient isrequired by the optimization method. In many real caseapplications, the gradient can be too complicated to becomputed or simply not available since the function is notknown and available only as a black-box from an externalfunction calculation. For this reason, Scilab has the abilityto compute the gradient using finite differences by meansof the function derivative or the function numdiff.
For example the following code define a function f andcompute the gradient on a specific point x.
function f=myfun(x)f=x(1)*x(1)+x(1)*x(2)
endfunctionx=[5 8]g=numdiff(myfun,x)
These two functions (derivative and numdiff) can be usedtogether with optim to minimize problem where gradient
is too complicated to be programmed. The optim function uses a quasi-Newtonmethod based on BFGS formula that is anaccurate algorithm for local optimization.On the same example, we can even applya different optimization approach such asthe derivative-free Nelder-Mead Simplex[1] that is implemented in the functionfminsearch. To do that we just have tosubstitute the line:
[f, x] = optim(rosenbrock, x0);With[x,f] = fminsearch(rosenbrock, x0);
This Nelder-Mead Simplex algorithm,starting from the same initial point,
Fig. 2 - Convergence of the Nelder-Mead Simplex algorithms (fminsearchfunction) on the Rosenbrock example.
Table 1 - This table gives an overview of the optimization algorithms available in Scilab and the typeof optimization problems which can be solved. For the constraints columns, the letter “l” means“linear”. For the problem size s,m,l indicate small, medium and large respectively that means lessthan ten, tens or hundreds of variables

44 - Newsletter EnginSoft Year 8 n°2
converges very closely to the optimal point and preciselyto x*=[1.000022 1.0000422] with f=8.177661e-010. Thisshows that the second approach is less accurate than theprevious one: this is the price to pay in order to have amore robust approach that is less influenced by noisyfunctions and local optima.Figure 2 shows the convergence of the Nelder-MeadSimplex method on the Rosenbrock function.
It is important to say that, in the previous example, thefunction is given by means of a Scilab script but this wasonly done for simplicity. It is always possible to evaluatethe function f as an external function such as a C, Fortranor Java program or external commercial solver.
Parameter identification using measured data In this short paragraph we show a specific optimizationproblem that is very common in engineering. Wedemonstrate how fast and easy it can be to make aparametric identification for nonlinear systems, based oninput/output data.
Suppose for example that we have a certain number ofmeasurements in the matrix X and the value of the outputin the vector Y. Suppose that we know the functiondescribing the model (FF) apart from a set of parametersp and we would like to find out the value of thoseparameters. It is sufficient to write few lines of Scilabcode to solve the problem:
//model with parameters pfunction y=FF(x, p)
y=p(1)*(x-p(2))+p(3)*x.*x;endfunction
Z=[Y;X];//The criterion for evaluating the errorfunction e=G(p, z)
y=z(1),x=z(2);e=y-FF(x,p),
endfunction
//Solve the problem giving an initial guess for pp0=[1;2;3] [p,err]=datafit(G,Z,p0);
This method is very fast and efficient, it can findparameters for a high number of input/output data.Moreover it can take into consideration parameters’bounds and weights for points.
Evolutionary Algorithms: Genetic and MultiobjectiveGenetic algorithms [2] are search methods based on themechanics of natural evolution and selection. Thesemethods are widely used for solving highly non-linearreal-life problems because of their ability to remain robusteven against noisy functions and local optima. Genetic
algorithms are largely used in real-world problems as wellas in a number of engineering applications that are hardto solve with “classical” methods.
Using the genetic algorithms in Scilab is very simple: in afew lines it is possible to set the required parameters suchas the number of generations, the population size, theprobability of cross-over and mutation. Fig. 3 shows asingle objective genetic algorithm optim_ga on theRosenbrock function. Twenty initial random points (inyellow) evolve through 50 generations towards theoptimal point. The final generation is plotted in red.
MultiobjectiveScilab is not only for single objective problems. It caneasily deal with multiobjective optimization problems.Just to list one of the available methods, Scilab users cantake advantage of the NSGA-II. NSGA-II is the secondversion of the famous “Non-dominated Sorting GeneticAlgorithm” based on the work of Prof. Kalyanmoy Deb [3].
Fig. 3 - Optimization of the Rosenbrock function by means of a GeneticAlgorithm. Initial random population is in yellow, final population is in redand converges to the real optimal solution.
Fig. 4 - ZDT1 problem solved with the Scilab’s NSGA-II optimizationalgorithm. Red points on the top represents the initial populations, blackpoints on the bottom the final Pareto population. The solid line representsthe Pareto frontier that, in this specific example, is a continuous convexsolution.
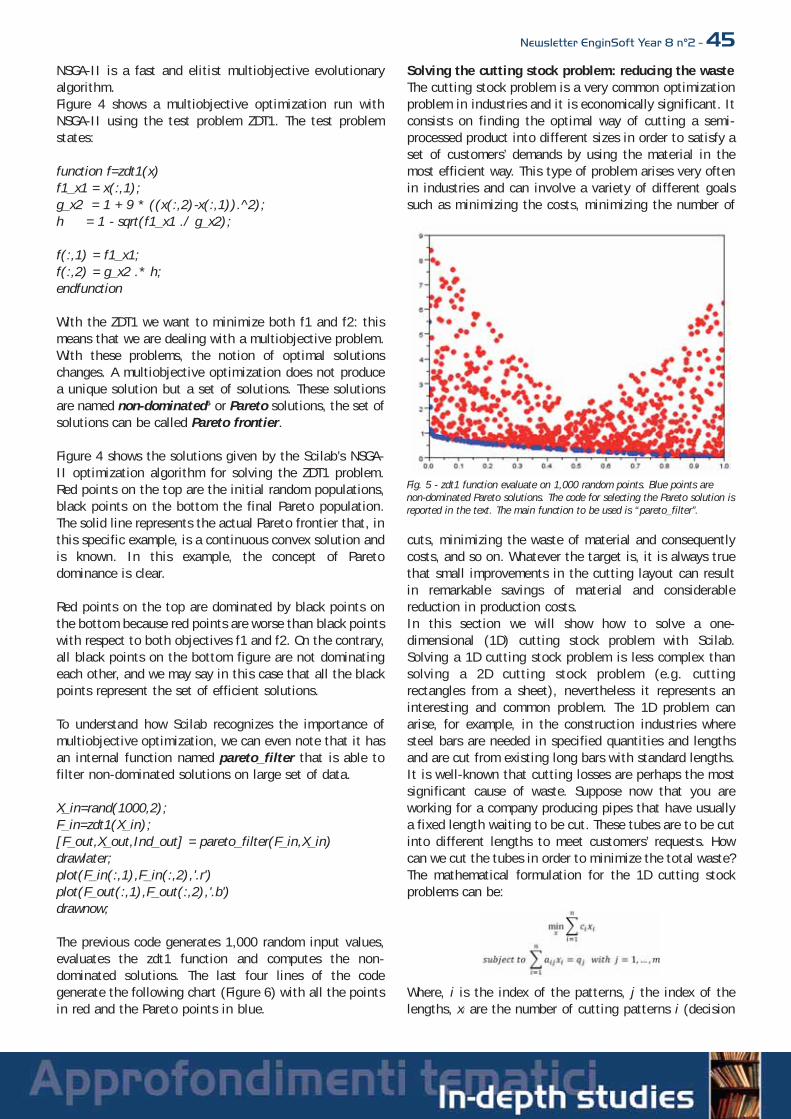
Newsletter EnginSoft Year 8 n°2 - 45NSGA-II is a fast and elitist multiobjective evolutionaryalgorithm.Figure 4 shows a multiobjective optimization run withNSGA-II using the test problem ZDT1. The test problemstates:
function f=zdt1(x)f1_x1 = x(:,1);g_x2 = 1 + 9 * ((x(:,2)-x(:,1)).^2);h = 1 - sqrt(f1_x1 ./ g_x2);
f(:,1) = f1_x1;f(:,2) = g_x2 .* h;endfunction
With the ZDT1 we want to minimize both f1 and f2: thismeans that we are dealing with a multiobjective problem.With these problems, the notion of optimal solutionschanges. A multiobjective optimization does not producea unique solution but a set of solutions. These solutionsare named non-dominated5 or Pareto solutions, the set ofsolutions can be called Pareto frontier.
Figure 4 shows the solutions given by the Scilab’s NSGA-II optimization algorithm for solving the ZDT1 problem.Red points on the top are the initial random populations,black points on the bottom the final Pareto population.The solid line represents the actual Pareto frontier that, inthis specific example, is a continuous convex solution andis known. In this example, the concept of Paretodominance is clear.
Red points on the top are dominated by black points onthe bottom because red points are worse than black pointswith respect to both objectives f1 and f2. On the contrary,all black points on the bottom figure are not dominatingeach other, and we may say in this case that all the blackpoints represent the set of efficient solutions.
To understand how Scilab recognizes the importance ofmultiobjective optimization, we can even note that it hasan internal function named pareto_filter that is able tofilter non-dominated solutions on large set of data.
X_in=rand(1000,2);F_in=zdt1(X_in);[F_out,X_out,Ind_out] = pareto_filter(F_in,X_in)drawlater;plot(F_in(:,1),F_in(:,2),'.r')plot(F_out(:,1),F_out(:,2),'.b')drawnow;
The previous code generates 1,000 random input values,evaluates the zdt1 function and computes the non-dominated solutions. The last four lines of the codegenerate the following chart (Figure 6) with all the pointsin red and the Pareto points in blue.
Solving the cutting stock problem: reducing the wasteThe cutting stock problem is a very common optimizationproblem in industries and it is economically significant. Itconsists on finding the optimal way of cutting a semi-processed product into different sizes in order to satisfy aset of customers’ demands by using the material in themost efficient way. This type of problem arises very oftenin industries and can involve a variety of different goalssuch as minimizing the costs, minimizing the number of
cuts, minimizing the waste of material and consequentlycosts, and so on. Whatever the target is, it is always truethat small improvements in the cutting layout can resultin remarkable savings of material and considerablereduction in production costs.In this section we will show how to solve a one-dimensional (1D) cutting stock problem with Scilab.Solving a 1D cutting stock problem is less complex thansolving a 2D cutting stock problem (e.g. cuttingrectangles from a sheet), nevertheless it represents aninteresting and common problem. The 1D problem canarise, for example, in the construction industries wheresteel bars are needed in specified quantities and lengthsand are cut from existing long bars with standard lengths.It is well-known that cutting losses are perhaps the mostsignificant cause of waste. Suppose now that you areworking for a company producing pipes that have usuallya fixed length waiting to be cut. These tubes are to be cutinto different lengths to meet customers’ requests. Howcan we cut the tubes in order to minimize the total waste?The mathematical formulation for the 1D cutting stockproblems can be:
Where, i is the index of the patterns, j the index of thelengths, xi are the number of cutting patterns i (decision
Fig. 5 - zdt1 function evaluate on 1,000 random points. Blue points arenon-dominated Pareto solutions. The code for selecting the Pareto solution isreported in the text. The main function to be used is “pareto_filter”.
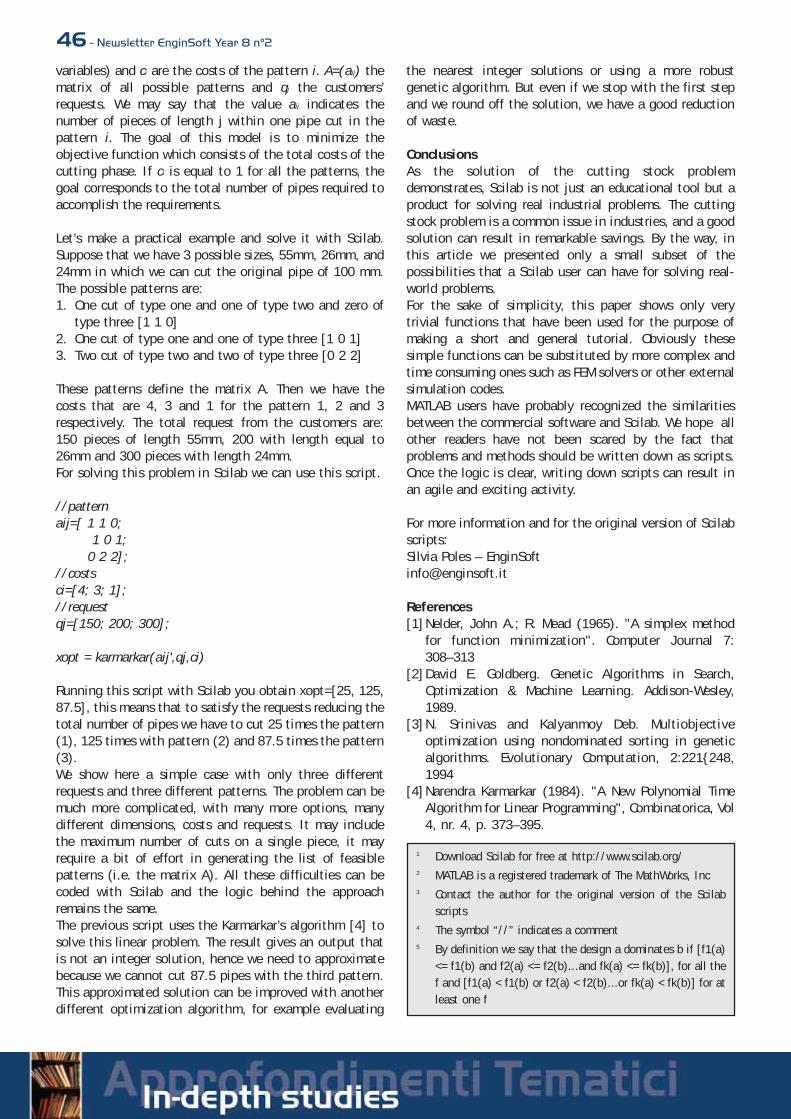
46 - Newsletter EnginSoft Year 8 n°2
variables) and ci are the costs of the pattern i. A=(aij) thematrix of all possible patterns and qj the customers’requests. We may say that the value aij indicates thenumber of pieces of length j within one pipe cut in thepattern i. The goal of this model is to minimize theobjective function which consists of the total costs of thecutting phase. If ci is equal to 1 for all the patterns, thegoal corresponds to the total number of pipes required toaccomplish the requirements.
Let’s make a practical example and solve it with Scilab.Suppose that we have 3 possible sizes, 55mm, 26mm, and24mm in which we can cut the original pipe of 100 mm.The possible patterns are:1. One cut of type one and one of type two and zero of
type three [1 1 0]2. One cut of type one and one of type three [1 0 1]3. Two cut of type two and two of type three [0 2 2]
These patterns define the matrix A. Then we have thecosts that are 4, 3 and 1 for the pattern 1, 2 and 3respectively. The total request from the customers are:150 pieces of length 55mm, 200 with length equal to26mm and 300 pieces with length 24mm.For solving this problem in Scilab we can use this script.
//patternaij=[ 1 1 0;
1 0 1;0 2 2];
//costs ci=[4; 3; 1];//requestqj=[150; 200; 300];
xopt = karmarkar(aij',qj,ci)
Running this script with Scilab you obtain xopt=[25, 125,87.5], this means that to satisfy the requests reducing thetotal number of pipes we have to cut 25 times the pattern(1), 125 times with pattern (2) and 87.5 times the pattern(3).We show here a simple case with only three differentrequests and three different patterns. The problem can bemuch more complicated, with many more options, manydifferent dimensions, costs and requests. It may includethe maximum number of cuts on a single piece, it mayrequire a bit of effort in generating the list of feasiblepatterns (i.e. the matrix A). All these difficulties can becoded with Scilab and the logic behind the approachremains the same.The previous script uses the Karmarkar’s algorithm [4] tosolve this linear problem. The result gives an output thatis not an integer solution, hence we need to approximatebecause we cannot cut 87.5 pipes with the third pattern.This approximated solution can be improved with anotherdifferent optimization algorithm, for example evaluating
the nearest integer solutions or using a more robustgenetic algorithm. But even if we stop with the first stepand we round off the solution, we have a good reductionof waste.
ConclusionsAs the solution of the cutting stock problemdemonstrates, Scilab is not just an educational tool but aproduct for solving real industrial problems. The cuttingstock problem is a common issue in industries, and a goodsolution can result in remarkable savings. By the way, inthis article we presented only a small subset of thepossibilities that a Scilab user can have for solving real-world problems. For the sake of simplicity, this paper shows only verytrivial functions that have been used for the purpose ofmaking a short and general tutorial. Obviously thesesimple functions can be substituted by more complex andtime consuming ones such as FEM solvers or other externalsimulation codes.MATLAB users have probably recognized the similaritiesbetween the commercial software and Scilab. We hope allother readers have not been scared by the fact thatproblems and methods should be written down as scripts.Once the logic is clear, writing down scripts can result inan agile and exciting activity.
For more information and for the original version of Scilabscripts:Silvia Poles – [email protected]
References[1]Nelder, John A.; R. Mead (1965). "A simplex method
for function minimization". Computer Journal 7:308–313
[2]David E. Goldberg. Genetic Algorithms in Search,Optimization & Machine Learning. Addison-Wesley,1989.
[3]N. Srinivas and Kalyanmoy Deb. Multiobjectiveoptimization using nondominated sorting in geneticalgorithms. Evolutionary Computation, 2:221{248,1994
[4]Narendra Karmarkar (1984). "A New Polynomial TimeAlgorithm for Linear Programming", Combinatorica, Vol4, nr. 4, p. 373–395.
1 Download Scilab for free at http://www.scilab.org/2 MATLAB is a registered trademark of The MathWorks, Inc3 Contact the author for the original version of the Scilab
scripts4 The symbol “//” indicates a comment5 By definition we say that the design a dominates b if [f1(a)
<= f1(b) and f2(a) <= f2(b)...and fk(a) <= fk(b)], for all thef and [f1(a) < f1(b) or f2(a) < f2(b)...or fk(a) < fk(b)] for atleast one f

Newsletter EnginSoft Year 8 n°2 - 47
The weather is probably one of the most discussed topicsall around the world. People are always interested inweather forecasts, and our life is strongly influenced bythe weather conditions. Let us just think of the farmer andhis harvest or of the happy family who wants to spend aweekend on the beach, and we understand that therecould be thousands of good reasons to be interested inknowing the weather conditions in advance.This probably explains why, normally, the weather forecastis the most awaited moment by the public in a televisionnewscast.Sun, wind, rain, temperature… the weather seems to beunpredictable, especially when we consider extremeevents. Man has always tried to develop techniques tomaster this topic, but practically only after the SecondWorld War the scientific approach together with theadvent of the media have allowed a large diffusion ofreliable weather forecasts.
To succeed in forecasting, it is mandatory to have acollection of measurements of the most importantphysical indicators which can be used to define theweather in some relevant points of a region at differenttimes. Then, we certainly need a reliable mathematicalmodel which is able to predict the values of the weatherindicators at points and times where no directmeasurements are available.Nowadays, very sophisticated models are used to forecastthe weather conditions, based on registeredmeasurements such as the temperature, the atmosphericpressure, the air humidity as so forth.It is quite obvious that the larger the dataset ofmeasurements the better the prediction: this is the reasonwhy the institutions involved in monitoringand forecasting the weather usually have alarge number of stations spread on theterrain, opportunely positioned to capturerelevant information.
This is the case of Meteo Trentino (see [3]),which manages a network of measurementstations in Trentino region and providesdaily weather forecasts.Among the large amount of interestinginformation we can find in their website,there are the temperature maps, where thepredicted temperature at the terrain level forthe Trentino province is reported for achosen instant. These maps are based on aset of measurements available from the
stations: an algorithm is able to predict the temperaturefield in all the points within the region and, therefore, toplot a temperature map.We do not know the algorithm that Meteo Trentino uses tobuild these maps, but we would like to set up our ownprocedure able to obtain similar results. To this aim, wedecided to use Scilab (see [1]) as a platform to developsuch a predictive model and gmsh (see [2]) as a tool todisplay the results.Probably one of the most popular algorithms in the geo-sciences domain used to interpolate data is Kriging (see[5]). This algorithm has the notable advantage of exactlyinterpolating known data; it is also able to potentiallycapture non-linear responses and, finally, to provide anestimation of the prediction error. This valuable lastfeature could be used, for example, to choose in anoptimal way the position of new measurement stations onthe terrain.Scilab has an external toolbox available through ATOMS,named DACE (which stands for Design and Analysis ofComputer Experiments), which implements the Krigingalgorithm. This obviously allows us to implement morerapidly our procedure because we can use the toolbox asa sort of black-box, avoiding in this way spending timeimplementing a non-trivial algorithm.
The weather dataWe decided to download from [3] all the availabletemperatures reported by the measurement stations. As aresult we have 102 formatted text files (an example isgiven in Figure 1) containing the maximum, the minimumand the mean temperature with a timestep of one hour.In our work we only consider the “good” values of the
Weather Forecasting with Scilab
Fig. 1 - The hourly temperature measures for the Moena station: the mean, the minimum and themaximum values are reported together with the quality of the measure.
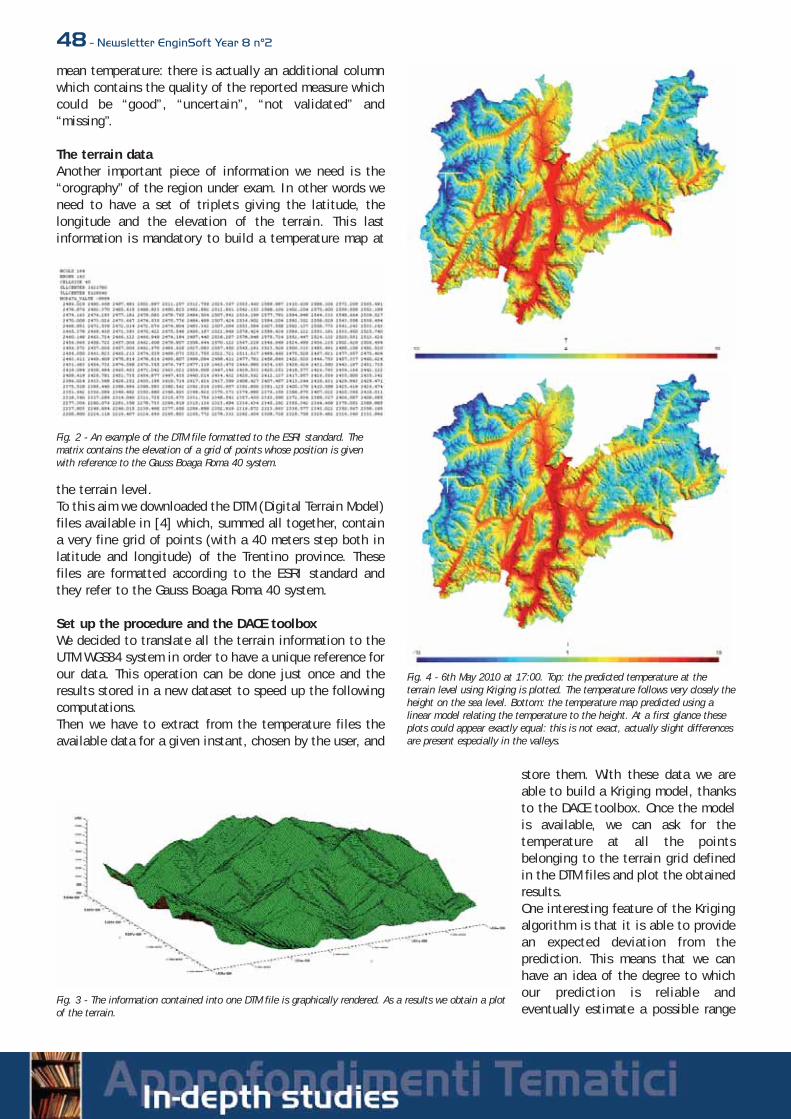
48 - Newsletter EnginSoft Year 8 n°2
mean temperature: there is actually an additional columnwhich contains the quality of the reported measure whichcould be “good”, “uncertain”, “not validated” and“missing”.
The terrain dataAnother important piece of information we need is the“orography” of the region under exam. In other words weneed to have a set of triplets giving the latitude, thelongitude and the elevation of the terrain. This lastinformation is mandatory to build a temperature map at
the terrain level.To this aim we downloaded the DTM (Digital Terrain Model)files available in [4] which, summed all together, containa very fine grid of points (with a 40 meters step both inlatitude and longitude) of the Trentino province. Thesefiles are formatted according to the ESRI standard andthey refer to the Gauss Boaga Roma 40 system.
Set up the procedure and the DACE toolboxWe decided to translate all the terrain information to theUTM WGS84 system in order to have a unique reference forour data. This operation can be done just once and theresults stored in a new dataset to speed up the followingcomputations.Then we have to extract from the temperature files theavailable data for a given instant, chosen by the user, and
store them. With these data we areable to build a Kriging model, thanksto the DACE toolbox. Once the modelis available, we can ask for thetemperature at all the pointsbelonging to the terrain grid definedin the DTM files and plot the obtainedresults.One interesting feature of the Krigingalgorithm is that it is able to providean expected deviation from theprediction. This means that we canhave an idea of the degree to whichour prediction is reliable andeventually estimate a possible range
Fig. 2 - An example of the DTM file formatted to the ESRI standard. Thematrix contains the elevation of a grid of points whose position is givenwith reference to the Gauss Boaga Roma 40 system.
Fig. 3 - The information contained into one DTM file is graphically rendered. As a results we obtain a plotof the terrain.
Fig. 4 - 6th May 2010 at 17:00. Top: the predicted temperature at theterrain level using Kriging is plotted. The temperature follows very closely theheight on the sea level. Bottom: the temperature map predicted using alinear model relating the temperature to the height. At a first glance theseplots could appear exactly equal: this is not exact, actually slight differencesare present especially in the valleys.
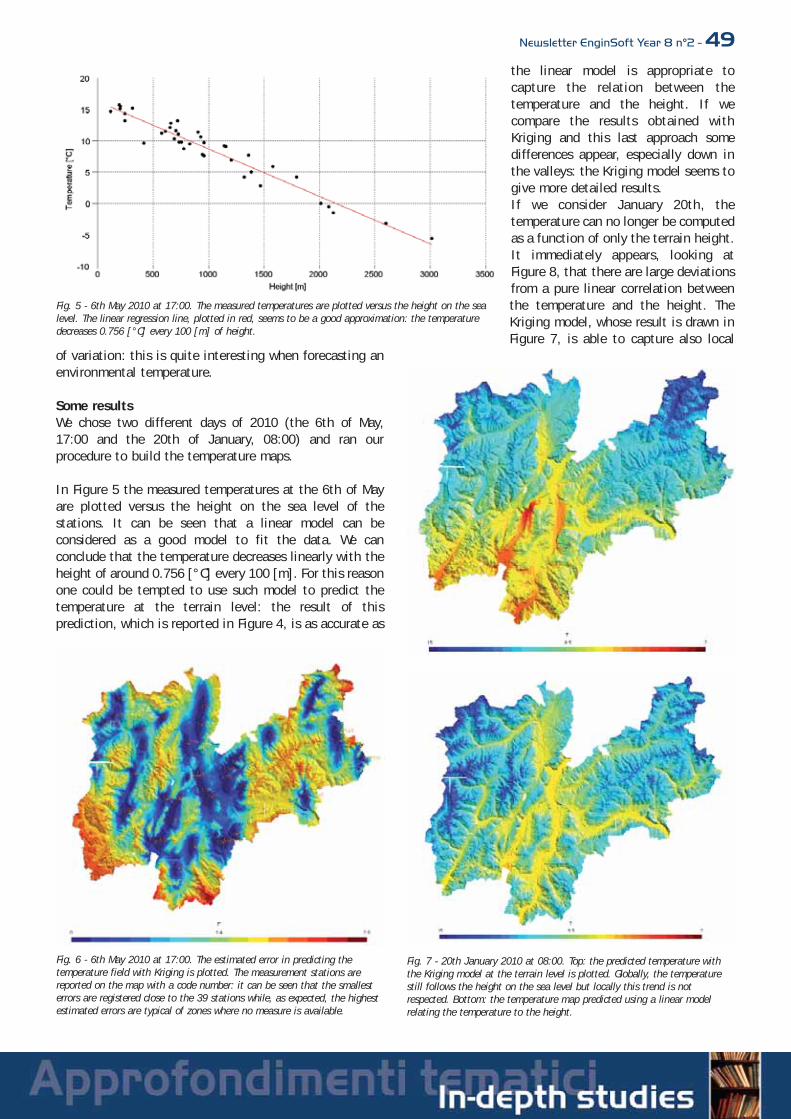
Newsletter EnginSoft Year 8 n°2 - 49
of variation: this is quite interesting when forecasting anenvironmental temperature.
Some resultsWe chose two different days of 2010 (the 6th of May,17:00 and the 20th of January, 08:00) and ran ourprocedure to build the temperature maps.
In Figure 5 the measured temperatures at the 6th of Mayare plotted versus the height on the sea level of thestations. It can be seen that a linear model can beconsidered as a good model to fit the data. We canconclude that the temperature decreases linearly with theheight of around 0.756 [°C] every 100 [m]. For this reasonone could be tempted to use such model to predict thetemperature at the terrain level: the result of thisprediction, which is reported in Figure 4, is as accurate as
the linear model is appropriate tocapture the relation between thetemperature and the height. If wecompare the results obtained withKriging and this last approach somedifferences appear, especially down inthe valleys: the Kriging model seems togive more detailed results.If we consider January 20th, thetemperature can no longer be computedas a function of only the terrain height.It immediately appears, looking atFigure 8, that there are large deviationsfrom a pure linear correlation betweenthe temperature and the height. TheKriging model, whose result is drawn inFigure 7, is able to capture also local
Fig. 5 - 6th May 2010 at 17:00. The measured temperatures are plotted versus the height on the sealevel. The linear regression line, plotted in red, seems to be a good approximation: the temperaturedecreases 0.756 [°C] every 100 [m] of height.
Fig. 6 - 6th May 2010 at 17:00. The estimated error in predicting thetemperature field with Kriging is plotted. The measurement stations arereported on the map with a code number: it can be seen that the smallesterrors are registered close to the 39 stations while, as expected, the highestestimated errors are typical of zones where no measure is available.
Fig. 7 - 20th January 2010 at 08:00. Top: the predicted temperature withthe Kriging model at the terrain level is plotted. Globally, the temperaturestill follows the height on the sea level but locally this trend is notrespected. Bottom: the temperature map predicted using a linear modelrelating the temperature to the height.
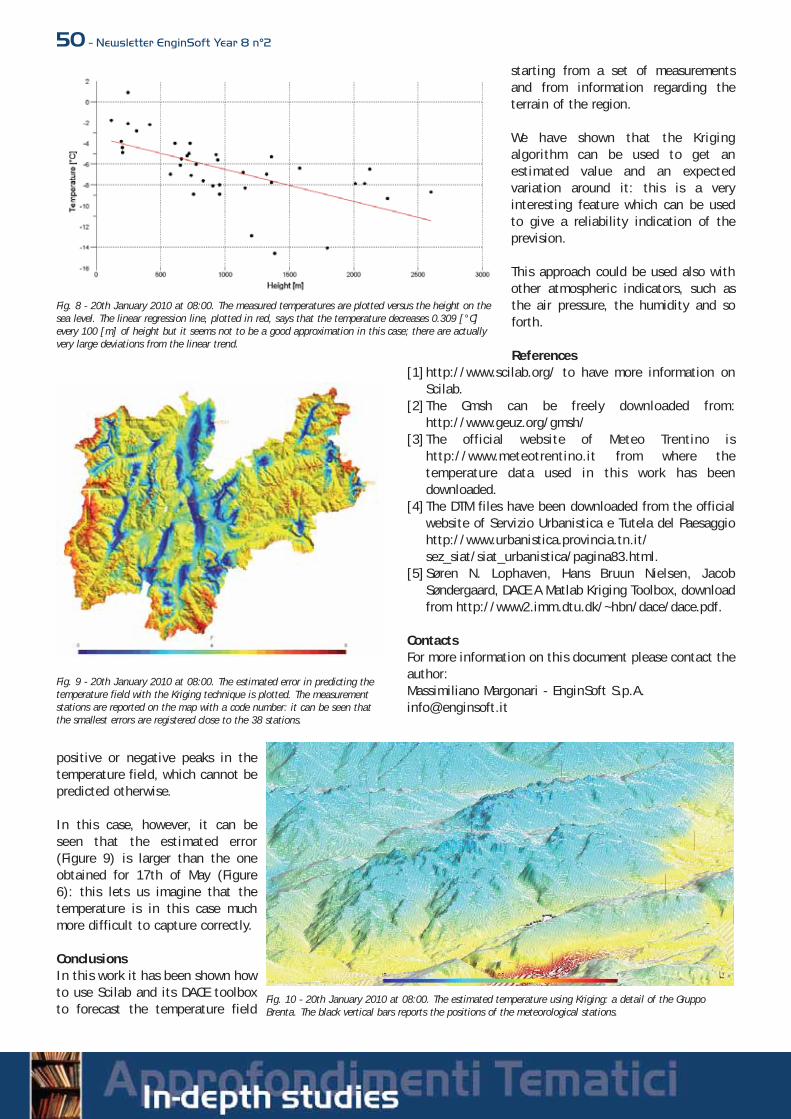
50 - Newsletter EnginSoft Year 8 n°2
positive or negative peaks in thetemperature field, which cannot bepredicted otherwise.
In this case, however, it can beseen that the estimated error(Figure 9) is larger than the oneobtained for 17th of May (Figure6): this lets us imagine that thetemperature is in this case muchmore difficult to capture correctly.
ConclusionsIn this work it has been shown howto use Scilab and its DACE toolboxto forecast the temperature field
starting from a set of measurementsand from information regarding theterrain of the region.
We have shown that the Krigingalgorithm can be used to get anestimated value and an expectedvariation around it: this is a veryinteresting feature which can be usedto give a reliability indication of theprevision.
This approach could be used also withother atmospheric indicators, such asthe air pressure, the humidity and soforth.
References[1]http://www.scilab.org/ to have more information on
Scilab.[2]The Gmsh can be freely downloaded from:
http://www.geuz.org/gmsh/[3]The official website of Meteo Trentino is
http://www.meteotrentino.it from where thetemperature data used in this work has beendownloaded.
[4]The DTM files have been downloaded from the officialwebsite of Servizio Urbanistica e Tutela del Paesaggiohttp://www.urbanistica.provincia.tn.it/sez_siat/siat_urbanistica/pagina83.html.
[5]Søren N. Lophaven, Hans Bruun Nielsen, JacobSøndergaard, DACE A Matlab Kriging Toolbox, downloadfrom http://www2.imm.dtu.dk/~hbn/dace/dace.pdf.
ContactsFor more information on this document please contact theauthor:Massimiliano Margonari - EnginSoft [email protected]
Fig. 8 - 20th January 2010 at 08:00. The measured temperatures are plotted versus the height on thesea level. The linear regression line, plotted in red, says that the temperature decreases 0.309 [°C]every 100 [m] of height but it seems not to be a good approximation in this case; there are actuallyvery large deviations from the linear trend.
Fig. 9 - 20th January 2010 at 08:00. The estimated error in predicting thetemperature field with the Kriging technique is plotted. The measurementstations are reported on the map with a code number: it can be seen thatthe smallest errors are registered close to the 38 stations.
Fig. 10 - 20th January 2010 at 08:00. The estimated temperature using Kriging: a detail of the GruppoBrenta. The black vertical bars reports the positions of the meteorological stations.
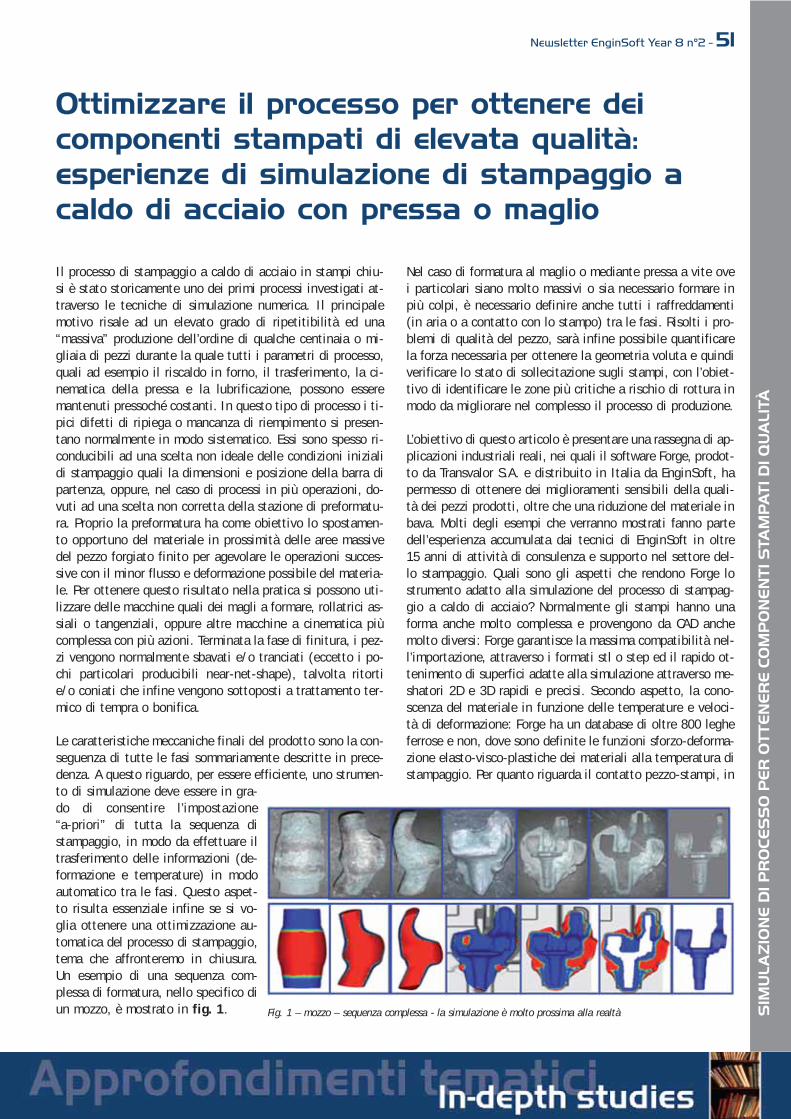
Newsletter EnginSoft Year 8 n°2 - 51
Il processo di stampaggio a caldo di acciaio in stampi chiu-si è stato storicamente uno dei primi processi investigati at-traverso le tecniche di simulazione numerica. Il principalemotivo risale ad un elevato grado di ripetitibilità ed una“massiva” produzione dell’ordine di qualche centinaia o mi-gliaia di pezzi durante la quale tutti i parametri di processo,quali ad esempio il riscaldo in forno, il trasferimento, la ci-nematica della pressa e la lubrificazione, possono esseremantenuti pressoché costanti. In questo tipo di processo i ti-pici difetti di ripiega o mancanza di riempimento si presen-tano normalmente in modo sistematico. Essi sono spesso ri-conducibili ad una scelta non ideale delle condizioni inizialidi stampaggio quali la dimensioni e posizione della barra dipartenza, oppure, nel caso di processi in più operazioni, do-vuti ad una scelta non corretta della stazione di preformatu-ra. Proprio la preformatura ha come obiettivo lo spostamen-to opportuno del materiale in prossimità delle aree massivedel pezzo forgiato finito per agevolare le operazioni succes-sive con il minor flusso e deformazione possibile del materia-le. Per ottenere questo risultato nella pratica si possono uti-lizzare delle macchine quali dei magli a formare, rollatrici as-siali o tangenziali, oppure altre macchine a cinematica piùcomplessa con più azioni. Terminata la fase di finitura, i pez-zi vengono normalmente sbavati e/o tranciati (eccetto i po-chi particolari producibili near-net-shape), talvolta ritortie/o coniati che infine vengono sottoposti a trattamento ter-mico di tempra o bonifica.
Le caratteristiche meccaniche finali del prodotto sono la con-seguenza di tutte le fasi sommariamente descritte in prece-denza. A questo riguardo, per essere efficiente, uno strumen-to di simulazione deve essere in gra-do di consentire l’impostazione “a-priori” di tutta la sequenza distampaggio, in modo da effettuare iltrasferimento delle informazioni (de-formazione e temperature) in modoautomatico tra le fasi. Questo aspet-to risulta essenziale infine se si vo-glia ottenere una ottimizzazione au-tomatica del processo di stampaggio,tema che affronteremo in chiusura.Un esempio di una sequenza com-plessa di formatura, nello specifico diun mozzo, è mostrato in fig. 1.
Nel caso di formatura al maglio o mediante pressa a vite ovei particolari siano molto massivi o sia necessario formare inpiù colpi, è necessario definire anche tutti i raffreddamenti(in aria o a contatto con lo stampo) tra le fasi. Risolti i pro-blemi di qualità del pezzo, sarà infine possibile quantificarela forza necessaria per ottenere la geometria voluta e quindiverificare lo stato di sollecitazione sugli stampi, con l’obiet-tivo di identificare le zone più critiche a rischio di rottura inmodo da migliorare nel complesso il processo di produzione.
L’obiettivo di questo articolo è presentare una rassegna di ap-plicazioni industriali reali, nei quali il software Forge, prodot-to da Transvalor S.A. e distribuito in Italia da EnginSoft, hapermesso di ottenere dei miglioramenti sensibili della quali-tà dei pezzi prodotti, oltre che una riduzione del materiale inbava. Molti degli esempi che verranno mostrati fanno partedell’esperienza accumulata dai tecnici di EnginSoft in oltre15 anni di attività di consulenza e supporto nel settore del-lo stampaggio. Quali sono gli aspetti che rendono Forge lostrumento adatto alla simulazione del processo di stampag-gio a caldo di acciaio? Normalmente gli stampi hanno unaforma anche molto complessa e provengono da CAD anchemolto diversi: Forge garantisce la massima compatibilità nel-l’importazione, attraverso i formati stl o step ed il rapido ot-tenimento di superfici adatte alla simulazione attraverso me-shatori 2D e 3D rapidi e precisi. Secondo aspetto, la cono-scenza del materiale in funzione delle temperature e veloci-tà di deformazione: Forge ha un database di oltre 800 legheferrose e non, dove sono definite le funzioni sforzo-deforma-zione elasto-visco-plastiche dei materiali alla temperatura distampaggio. Per quanto riguarda il contatto pezzo-stampi, in
Fig. 1 – mozzo – sequenza complessa - la simulazione è molto prossima alla realtà
Ottimizzare il processo per ottenere dei componenti stampati di elevata qualità: esperienze di simulazione di stampaggio acaldo di acciaio con pressa o maglio
SIM
ULA
ZIO
NE
DI P
RO
CE
SS
O P
ER
OT
TE
NE
RE
CO
MP
ON
EN
TI S
TAM
PA
TI D
I QU
ALI
TÀ
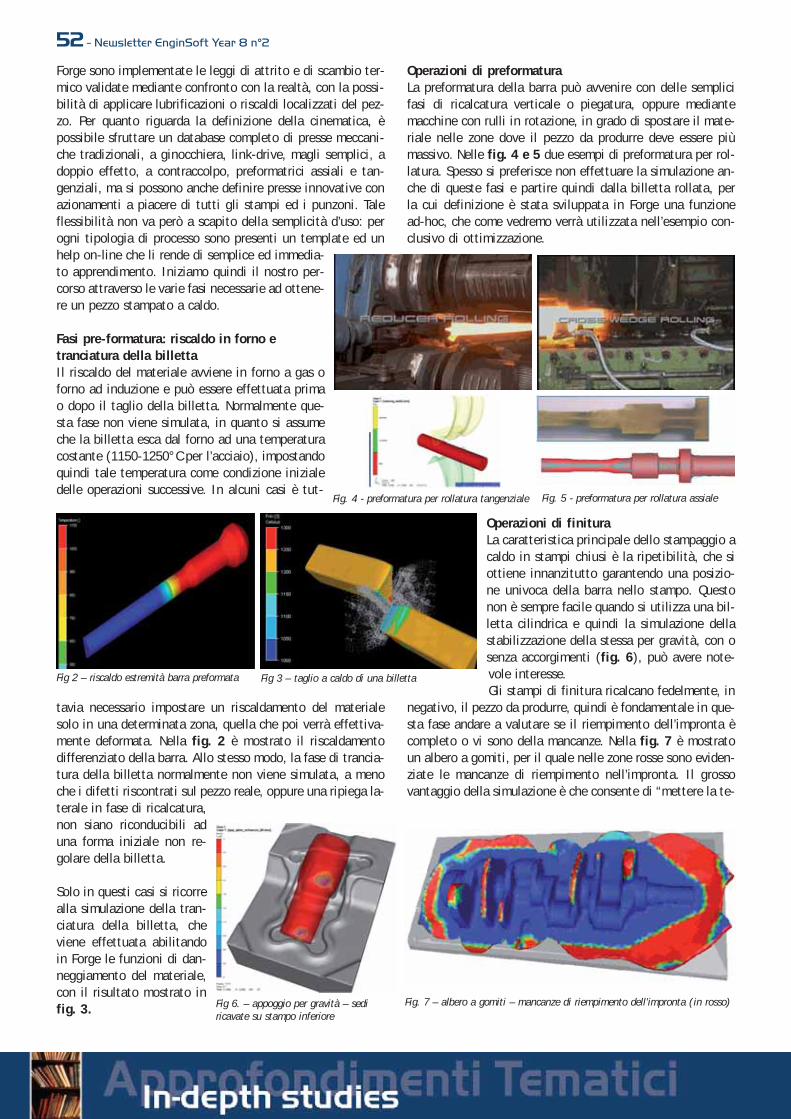
52 - Newsletter EnginSoft Year 8 n°2
Forge sono implementate le leggi di attrito e di scambio ter-mico validate mediante confronto con la realtà, con la possi-bilità di applicare lubrificazioni o riscaldi localizzati del pez-zo. Per quanto riguarda la definizione della cinematica, èpossibile sfruttare un database completo di presse meccani-che tradizionali, a ginocchiera, link-drive, magli semplici, adoppio effetto, a contraccolpo, preformatrici assiali e tan-genziali, ma si possono anche definire presse innovative conazionamenti a piacere di tutti gli stampi ed i punzoni. Taleflessibilità non va però a scapito della semplicità d’uso: perogni tipologia di processo sono presenti un template ed unhelp on-line che li rende di semplice ed immedia-to apprendimento. Iniziamo quindi il nostro per-corso attraverso le varie fasi necessarie ad ottene-re un pezzo stampato a caldo.
Fasi pre-formatura: riscaldo in forno e tranciatura della billettaIl riscaldo del materiale avviene in forno a gas oforno ad induzione e può essere effettuata primao dopo il taglio della billetta. Normalmente que-sta fase non viene simulata, in quanto si assumeche la billetta esca dal forno ad una temperaturacostante (1150-1250°C per l’acciaio), impostandoquindi tale temperatura come condizione inizialedelle operazioni successive. In alcuni casi è tut-
tavia necessario impostare un riscaldamento del materialesolo in una determinata zona, quella che poi verrà effettiva-mente deformata. Nella fig. 2 è mostrato il riscaldamentodifferenziato della barra. Allo stesso modo, la fase di trancia-tura della billetta normalmente non viene simulata, a menoche i difetti riscontrati sul pezzo reale, oppure una ripiega la-terale in fase di ricalcatura,non siano riconducibili aduna forma iniziale non re-golare della billetta.
Solo in questi casi si ricorrealla simulazione della tran-ciatura della billetta, cheviene effettuata abilitandoin Forge le funzioni di dan-neggiamento del materiale,con il risultato mostrato infig. 3.
Operazioni di preformaturaLa preformatura della barra può avvenire con delle semplicifasi di ricalcatura verticale o piegatura, oppure mediantemacchine con rulli in rotazione, in grado di spostare il mate-riale nelle zone dove il pezzo da produrre deve essere piùmassivo. Nelle fig. 4 e 5 due esempi di preformatura per rol-latura. Spesso si preferisce non effettuare la simulazione an-che di queste fasi e partire quindi dalla billetta rollata, perla cui definizione è stata sviluppata in Forge una funzionead-hoc, che come vedremo verrà utilizzata nell’esempio con-clusivo di ottimizzazione.
Operazioni di finituraLa caratteristica principale dello stampaggio acaldo in stampi chiusi è la ripetibilità, che siottiene innanzitutto garantendo una posizio-ne univoca della barra nello stampo. Questonon è sempre facile quando si utilizza una bil-letta cilindrica e quindi la simulazione dellastabilizzazione della stessa per gravità, con osenza accorgimenti (fig. 6), può avere note-vole interesse.Gli stampi di finitura ricalcano fedelmente, in
negativo, il pezzo da produrre, quindi è fondamentale in que-sta fase andare a valutare se il riempimento dell’impronta ècompleto o vi sono della mancanze. Nella fig. 7 è mostratoun albero a gomiti, per il quale nelle zone rosse sono eviden-ziate le mancanze di riempimento nell’impronta. Il grossovantaggio della simulazione è che consente di “mettere la te-
Fig 2 – riscaldo estremità barra preformata Fig 3 – taglio a caldo di una billetta
Fig. 4 - preformatura per rollatura tangenziale Fig. 5 - preformatura per rollatura assiale
Fig 6. – appoggio per gravità – sediricavate su stampo inferiore
Fig. 7 – albero a gomiti – mancanze di riempimento dell’impronta (in rosso)
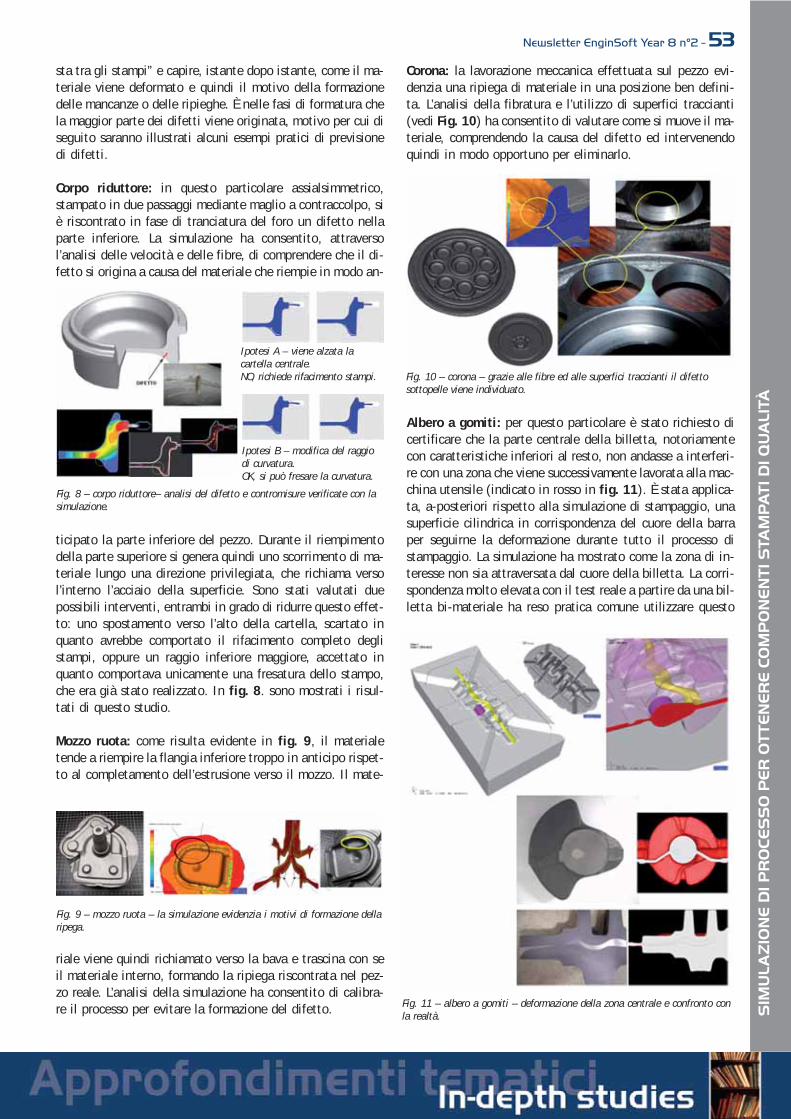
SIM
ULA
ZIO
NE
DI P
RO
CE
SS
O P
ER
OT
TE
NE
RE
CO
MP
ON
EN
TI S
TAM
PA
TI D
I QU
ALI
TÀ
Newsletter EnginSoft Year 8 n°2 - 53sta tra gli stampi” e capire, istante dopo istante, come il ma-teriale viene deformato e quindi il motivo della formazionedelle mancanze o delle ripieghe. È nelle fasi di formatura chela maggior parte dei difetti viene originata, motivo per cui diseguito saranno illustrati alcuni esempi pratici di previsionedi difetti.
Corpo riduttore: in questo particolare assialsimmetrico,stampato in due passaggi mediante maglio a contraccolpo, siè riscontrato in fase di tranciatura del foro un difetto nellaparte inferiore. La simulazione ha consentito, attraversol’analisi delle velocità e delle fibre, di comprendere che il di-fetto si origina a causa del materiale che riempie in modo an-
ticipato la parte inferiore del pezzo. Durante il riempimentodella parte superiore si genera quindi uno scorrimento di ma-teriale lungo una direzione privilegiata, che richiama versol’interno l’acciaio della superficie. Sono stati valutati duepossibili interventi, entrambi in grado di ridurre questo effet-to: uno spostamento verso l’alto della cartella, scartato inquanto avrebbe comportato il rifacimento completo deglistampi, oppure un raggio inferiore maggiore, accettato inquanto comportava unicamente una fresatura dello stampo,che era già stato realizzato. In fig. 8. sono mostrati i risul-tati di questo studio.
Mozzo ruota: come risulta evidente in fig. 9, il materialetende a riempire la flangia inferiore troppo in anticipo rispet-to al completamento dell’estrusione verso il mozzo. Il mate-
riale viene quindi richiamato verso la bava e trascina con seil materiale interno, formando la ripiega riscontrata nel pez-zo reale. L’analisi della simulazione ha consentito di calibra-re il processo per evitare la formazione del difetto.
Corona: la lavorazione meccanica effettuata sul pezzo evi-denzia una ripiega di materiale in una posizione ben defini-ta. L’analisi della fibratura e l’utilizzo di superfici traccianti(vedi Fig. 10) ha consentito di valutare come si muove il ma-teriale, comprendendo la causa del difetto ed intervenendoquindi in modo opportuno per eliminarlo.
Albero a gomiti: per questo particolare è stato richiesto dicertificare che la parte centrale della billetta, notoriamentecon caratteristiche inferiori al resto, non andasse a interferi-re con una zona che viene successivamente lavorata alla mac-china utensile (indicato in rosso in fig. 11). È stata applica-ta, a-posteriori rispetto alla simulazione di stampaggio, unasuperficie cilindrica in corrispondenza del cuore della barraper seguirne la deformazione durante tutto il processo distampaggio. La simulazione ha mostrato come la zona di in-teresse non sia attraversata dal cuore della billetta. La corri-spondenza molto elevata con il test reale a partire da una bil-letta bi-materiale ha reso pratica comune utilizzare questo
Fig. 8 – corpo riduttore– analisi del difetto e contromisure verificate con lasimulazione.
Ipotesi A – viene alzata lacartella centrale.NO, richiede rifacimento stampi.
Ipotesi B – modifica del raggiodi curvatura. OK, si può fresare la curvatura.
Fig. 9 – mozzo ruota – la simulazione evidenzia i motivi di formazione dellaripega.
Fig. 10 – corona – grazie alle fibre ed alle superfici traccianti il difettosottopelle viene individuato.
Fig. 11 – albero a gomiti – deformazione della zona centrale e confronto conla realtà.
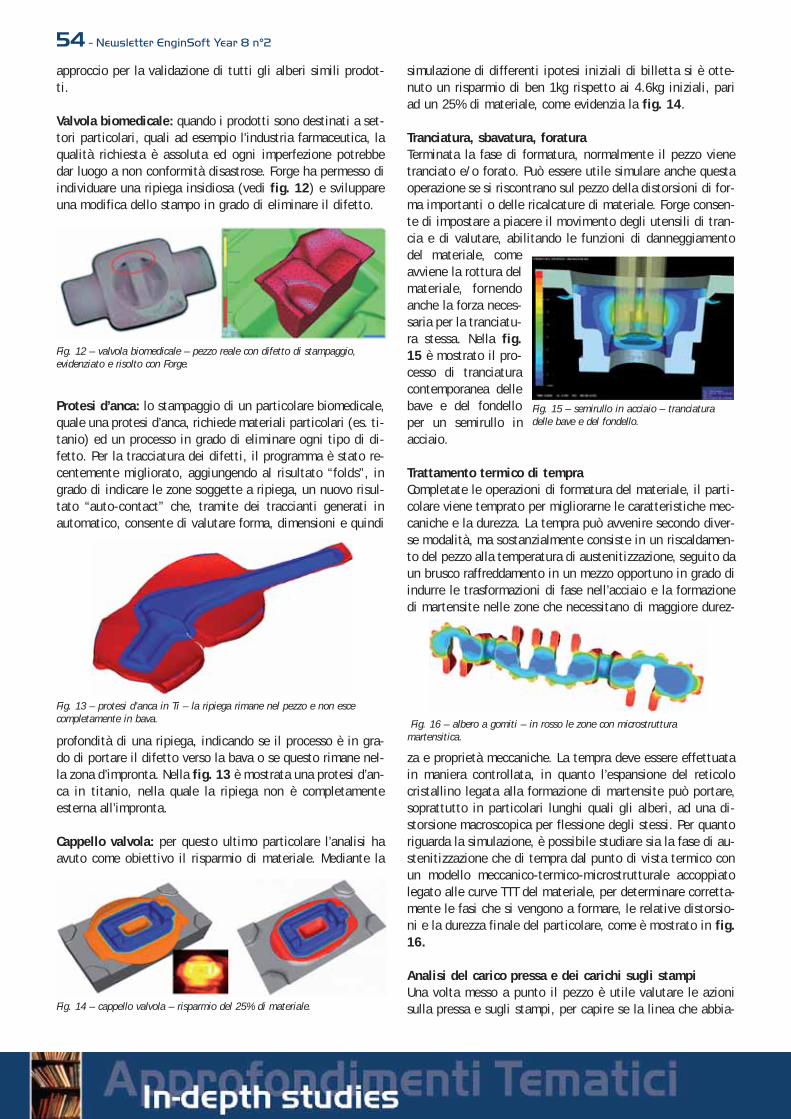
54 - Newsletter EnginSoft Year 8 n°2
approccio per la validazione di tutti gli alberi simili prodot-ti.
Valvola biomedicale: quando i prodotti sono destinati a set-tori particolari, quali ad esempio l'industria farmaceutica, laqualità richiesta è assoluta ed ogni imperfezione potrebbedar luogo a non conformità disastrose. Forge ha permesso diindividuare una ripiega insidiosa (vedi fig. 12) e sviluppareuna modifica dello stampo in grado di eliminare il difetto.
Protesi d’anca: lo stampaggio di un particolare biomedicale,quale una protesi d’anca, richiede materiali particolari (es. ti-tanio) ed un processo in grado di eliminare ogni tipo di di-fetto. Per la tracciatura dei difetti, il programma è stato re-centemente migliorato, aggiungendo al risultato “folds”, ingrado di indicare le zone soggette a ripiega, un nuovo risul-tato “auto-contact” che, tramite dei traccianti generati inautomatico, consente di valutare forma, dimensioni e quindi
profondità di una ripiega, indicando se il processo è in gra-do di portare il difetto verso la bava o se questo rimane nel-la zona d’impronta. Nella fig. 13 è mostrata una protesi d’an-ca in titanio, nella quale la ripiega non è completamenteesterna all’impronta.
Cappello valvola: per questo ultimo particolare l’analisi haavuto come obiettivo il risparmio di materiale. Mediante la
simulazione di differenti ipotesi iniziali di billetta si è otte-nuto un risparmio di ben 1kg rispetto ai 4.6kg iniziali, pariad un 25% di materiale, come evidenzia la fig. 14.
Tranciatura, sbavatura, foraturaTerminata la fase di formatura, normalmente il pezzo vienetranciato e/o forato. Può essere utile simulare anche questaoperazione se si riscontrano sul pezzo della distorsioni di for-ma importanti o delle ricalcature di materiale. Forge consen-te di impostare a piacere il movimento degli utensili di tran-cia e di valutare, abilitando le funzioni di danneggiamentodel materiale, comeavviene la rottura delmateriale, fornendoanche la forza neces-saria per la tranciatu-ra stessa. Nella fig.15 è mostrato il pro-cesso di tranciaturacontemporanea dellebave e del fondelloper un semirullo inacciaio.
Trattamento termico di tempraCompletate le operazioni di formatura del materiale, il parti-colare viene temprato per migliorarne le caratteristiche mec-caniche e la durezza. La tempra può avvenire secondo diver-se modalità, ma sostanzialmente consiste in un riscaldamen-to del pezzo alla temperatura di austenitizzazione, seguito daun brusco raffreddamento in un mezzo opportuno in grado diindurre le trasformazioni di fase nell’acciaio e la formazionedi martensite nelle zone che necessitano di maggiore durez-
za e proprietà meccaniche. La tempra deve essere effettuatain maniera controllata, in quanto l’espansione del reticolocristallino legata alla formazione di martensite può portare,soprattutto in particolari lunghi quali gli alberi, ad una di-storsione macroscopica per flessione degli stessi. Per quantoriguarda la simulazione, è possibile studiare sia la fase di au-stenitizzazione che di tempra dal punto di vista termico conun modello meccanico-termico-microstrutturale accoppiatolegato alle curve TTT del materiale, per determinare corretta-mente le fasi che si vengono a formare, le relative distorsio-ni e la durezza finale del particolare, come è mostrato in fig.16.
Analisi del carico pressa e dei carichi sugli stampiUna volta messo a punto il pezzo è utile valutare le azionisulla pressa e sugli stampi, per capire se la linea che abbia-
Fig. 12 – valvola biomedicale – pezzo reale con difetto di stampaggio,evidenziato e risolto con Forge.
Fig. 13 – protesi d’anca in Ti – la ripiega rimane nel pezzo e non escecompletamente in bava.
Fig. 14 – cappello valvola – risparmio del 25% di materiale.
Fig. 15 – semirullo in acciaio – tranciaturadelle bave e del fondello.
Fig. 16 – albero a gomiti – in rosso le zone con microstrutturamartensitica.

SIM
ULA
ZIO
NE
DI P
RO
CE
SS
O P
ER
OT
TE
NE
RE
CO
MP
ON
EN
TI S
TAM
PA
TI D
I QU
ALI
TÀ
Newsletter EnginSoft Year 8 n°2 - 55mo a disposizione è in grado di produrre effettivamente ilparticolare, se la pressa lavora bilanciata e se gli sforzi suglistampi non siano eccessivi. Alcuni risultati sono disponibiliin Forge già con le analisi semplificate a stampi “rigidi”,mentre per risultati avanzati è necessario ricorrere all’analisielastica degli stampi considerati deformabili durante lo stam-paggio.A seguire vengono riportati alcuni esempi di valutazioni pos-sibili mediante l’analisi dei risultati sugli stampi.
Albero bicilindrico: l’analisi della risultante sugli stampievidenzia come nella sezione longitudinale la risultante siaallineata rispetto al centro stampi, mentre nella sezione tra-sversale vi sia un disallineamento legato al fatto che il pez-zo risulta più lungo da un lato (fig. 17). Questo nella realtàprovoca delle misure in chiusura non corrette la cui causa èdifficile da individuare. La simulazione ha mostrato questoeffetto di momento torcente sulla pressa in grado di influen-zare le misure in chiusura. Una volta individuato il motivo,l’azione di torsione è stata annullata con una revisione dellostampo in grado di centrare la risultante degli sforzi a cuoredel porta stampo.
Suola per cingoli: la produzione di suole per cingoli general-mente è ottenuta per tranciatura e punzonatura, ma per tipidi forma complessa è necessario ricorrere allo stampaggio,con preformatura su pressa idraulica e finitura sulla maxipres-sa. La sezione delle suole si sviluppa generalmente su tre pia-ni inclinati da cui deriva la nascita di forze orizzontali moltopericolose per la vita degli stampi e dei portastampi. Nellaversione originale si è disposta la figura della suola nel mo-do tradizionale, con il piano centrale parallelo al piano deglistampi. Tale soluzione origina nella realtà delle componentiorizzontali in grado di rompere le chiavette di fissaggio tra
stampo e portastampo. La simulazione ha consentito di valu-tare il valore e le componenti della forza risultante suglistampi. Sono state considerate diverse geometrie, identichein termini di impronta, ma differenti per quanto riguarda l’in-clinazione dei piani degli stampi ottimizzandone la calibra-zione in modo da contrastare la componente orizzontale del-la forza. La configurazione scelta ha consentito di ridurre lacomponente orizzontale da 1800 a 600 tonnellate, come mo-strato in fig. 18, con un deciso allungamento della vita de-gli stampi.
Albero a gomiti: in alcune configurazioni gli stampi denota-no una rottura prematura in zone ben specifiche come nel ca-so illustrato in fig. 19. Mediante una rapida simulazione del-la deformazione elastica subita dagli stampi per effetto deglisforzi trasferiti dal pezzo, è possibile individuare le zone
maggiormente sollecitate. Il confronto tra differenti configu-razioni di stampaggio consente quindi, a parità di scala, divalutare le soluzioni più efficaci per ridurre il sovraccarico eportare quindi la configurazione ad un incremento spesso in-finito della vita degli stampi. In altri casi si riscontra una
flessione dei setti tale da originare, dopo un certo numero diparticolari stampati, una rottura per fatica dei setti stessi.Anche in questo caso la simulazione della deformazione de-gli stampi, come mostra la fig. 20, è in grado di evidenziarei setti soggetti a flessione ed il confronto tra diverse confi-gurazioni, a parità di scala, consente di individuare quellapiù efficace.
Fig. 17 – albero bicilindrico – la risultante degli sforzi nella sezionetrasversale genera una torsione.
Fig. 18 – suola per cingoli – la modifica dell’inclinazione del piano di sformoriduce dell’80% le tensioni tangenziali sugli stampi
Fig. 19 – albero a gomiti – l’analisi degli stampi evidenzia le zone a rischiodi rottura.
Fig. 20 – albero a gomiti – l’analisi degli stampi evidenzia i setti a rischio diflessione.
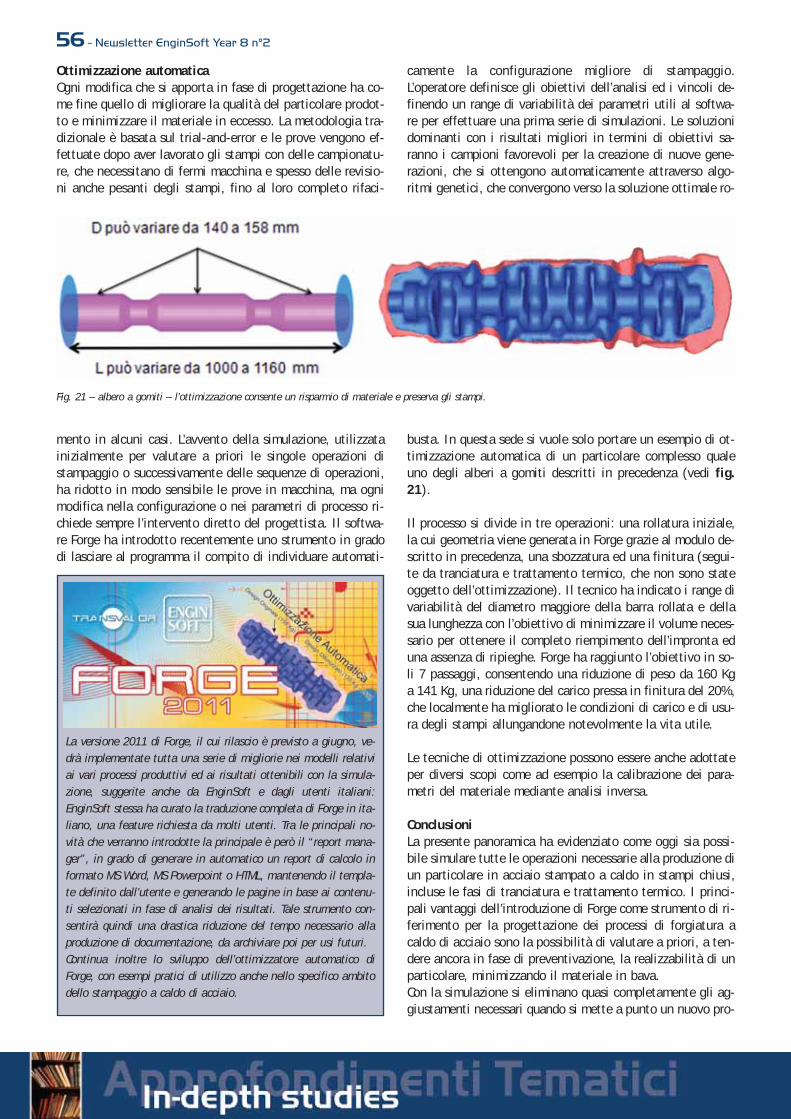
56 - Newsletter EnginSoft Year 8 n°2
Ottimizzazione automaticaOgni modifica che si apporta in fase di progettazione ha co-me fine quello di migliorare la qualità del particolare prodot-to e minimizzare il materiale in eccesso. La metodologia tra-dizionale è basata sul trial-and-error e le prove vengono ef-fettuate dopo aver lavorato gli stampi con delle campionatu-re, che necessitano di fermi macchina e spesso delle revisio-ni anche pesanti degli stampi, fino al loro completo rifaci-
mento in alcuni casi. L’avvento della simulazione, utilizzatainizialmente per valutare a priori le singole operazioni distampaggio o successivamente delle sequenze di operazioni,ha ridotto in modo sensibile le prove in macchina, ma ognimodifica nella configurazione o nei parametri di processo ri-chiede sempre l’intervento diretto del progettista. Il softwa-re Forge ha introdotto recentemente uno strumento in gradodi lasciare al programma il compito di individuare automati-
camente la configurazione migliore di stampaggio.L’operatore definisce gli obiettivi dell’analisi ed i vincoli de-finendo un range di variabilità dei parametri utili al softwa-re per effettuare una prima serie di simulazioni. Le soluzionidominanti con i risultati migliori in termini di obiettivi sa-ranno i campioni favorevoli per la creazione di nuove gene-razioni, che si ottengono automaticamente attraverso algo-ritmi genetici, che convergono verso la soluzione ottimale ro-
busta. In questa sede si vuole solo portare un esempio di ot-timizzazione automatica di un particolare complesso qualeuno degli alberi a gomiti descritti in precedenza (vedi fig.21).
Il processo si divide in tre operazioni: una rollatura iniziale,la cui geometria viene generata in Forge grazie al modulo de-scritto in precedenza, una sbozzatura ed una finitura (segui-te da tranciatura e trattamento termico, che non sono stateoggetto dell’ottimizzazione). Il tecnico ha indicato i range divariabilità del diametro maggiore della barra rollata e dellasua lunghezza con l’obiettivo di minimizzare il volume neces-sario per ottenere il completo riempimento dell’impronta eduna assenza di ripieghe. Forge ha raggiunto l’obiettivo in so-li 7 passaggi, consentendo una riduzione di peso da 160 Kga 141 Kg, una riduzione del carico pressa in finitura del 20%,che localmente ha migliorato le condizioni di carico e di usu-ra degli stampi allungandone notevolmente la vita utile.
Le tecniche di ottimizzazione possono essere anche adottateper diversi scopi come ad esempio la calibrazione dei para-metri del materiale mediante analisi inversa.
ConclusioniLa presente panoramica ha evidenziato come oggi sia possi-bile simulare tutte le operazioni necessarie alla produzione diun particolare in acciaio stampato a caldo in stampi chiusi,incluse le fasi di tranciatura e trattamento termico. I princi-pali vantaggi dell’introduzione di Forge come strumento di ri-ferimento per la progettazione dei processi di forgiatura acaldo di acciaio sono la possibilità di valutare a priori, a ten-dere ancora in fase di preventivazione, la realizzabilità di unparticolare, minimizzando il materiale in bava. Con la simulazione si eliminano quasi completamente gli ag-giustamenti necessari quando si mette a punto un nuovo pro-
La versione 2011 di Forge, il cui rilascio è previsto a giugno, ve-drà implementate tutta una serie di migliorie nei modelli relativiai vari processi produttivi ed ai risultati ottenibili con la simula-zione, suggerite anche da EnginSoft e dagli utenti italiani:EnginSoft stessa ha curato la traduzione completa di Forge in ita-liano, una feature richiesta da molti utenti. Tra le principali no-vità che verranno introdotte la principale è però il “report mana-ger”, in grado di generare in automatico un report di calcolo informato MS Word, MS Powerpoint o HTML, mantenendo il templa-te definito dall’utente e generando le pagine in base ai contenu-ti selezionati in fase di analisi dei risultati. Tale strumento con-sentirà quindi una drastica riduzione del tempo necessario allaproduzione di documentazione, da archiviare poi per usi futuri.Continua inoltre lo sviluppo dell’ottimizzatore automatico diForge, con esempi pratici di utilizzo anche nello specifico ambitodello stampaggio a caldo di acciaio.
Fig. 21 – albero a gomiti – l’ottimizzazione consente un risparmio di materiale e preserva gli stampi.

SIM
ULA
ZIO
NE
DI P
RO
CE
SS
O P
ER
OT
TE
NE
RE
CO
MP
ON
EN
TI S
TAM
PA
TI D
I QU
ALI
TÀ
Newsletter EnginSoft Year 8 n°2 - 57cesso, evitando i costi relativi alla lavorazione di stampi pro-totipo e i fermi macchina necessari per la campionatura. Sele simulazioni sono fatte a-posteriori, ogni modifica apporta-ta agli stampi ed il relativo effetto sulla qualità del pezzo so-no valutabili senza la necessità di costosi test fisici sotto lapressa. L’introduzione di Forge in ufficio tecnico consente in-fatti una profonda comprensione delle dinamiche di flusso delmateriale tra gli stampi e delle criticità del proprio processo.Risolvere una problematica attraverso la simulazione consen-te ai tecnici di acquistare via via una maggiore sicurezza nel-l’affrontare famiglie di prodotti simili, ma anche di fare dellevalutazioni, ancora in fase di preventivazione, delle criticitàdi nuovi particolari da produrre: tutte le esperienze fatte conil software possono infatti essere archiviate e diventano pa-trimonio dell’azienda, utile anche a far crescere rapidamentedelle nuove figure che andranno via via ad integrare e poi so-stituire le figure storiche esperte di stampaggio.
L’acquisto del software Forge e il know-how che l’azienda ac-quisisce con la formazione specifica di EnginSoft costituisco-no un vantaggio competitivo che ha immediate ricadute con-
crete sul miglioramento del proprio modo di produrre, con-sentendo un rapido ammortamento dell’investimento neces-sario. EnginSoft ha una esperienza di oltre 15 anni nell’uti-lizzo di Forge ed è in grado di ascoltare le più svariate esi-genze provenienti dalle industrie e rispondere con delle solu-zioni su misura, dai servizi alla formazione, base ed avanza-ta, all’uso del software, agli affiancamenti on-job.
Per informazioni, rivolgersi a:Ing. Marcello Gabrielli – [email protected]
RIGANTIL'uso di magli di medie-grandidimensioni è una delle caratteri-stiche che distinguono il prodot-to Riganti ed il software Forge èstato personalizzato ed imple-mentato secondo le particolarinecessità del processo di forma-tura con magli a contraccolpo edoppio effetto. Il continuo affi-namento del programma ha reso i risultati delle simulazioni sem-pre più realistici, rendendo Forge insostituibile sia in fase di valu-tazione preventiva che nella fase di ottimizzazione. Possiamo direche l'esperienza analitico-scientifica con Forge non sostituiscecompletamente la conoscenza pratica dell'esperto forgiatore, ma laaffianca e la sostiene, dando logica e spiegazione ad un patrimo-nio quasi esoterico, frutto di tramandate conoscenze e di svariatianni di lavoro sul campo, legate però al singolo individuo e non alknow-how aziendale.L'uso di Forge si è rivelato fondamentale nell'esame di fattibilitàpreventiva dando così modo alla parte commerciale di esplorarenuovi mercati e nuove tipologie di prodotto, con la sicurezza disoddisfare una fornitura, anche al limite delle possibilità produtti-ve dei magli a disposizione.Forge si è dimostrato indispensabile sia per l'ottimizzazione dicommesse ad elevato numero di pezzi, ma ancor di più per lotti diproduzione con basso numero di particolari di grossa dimensione,per i quali non è fattibile una fase di prototipazione e per i qualiun errore progettuale è inaccettabile, per il grosso dispendio eco-nomico e per i conseguenti ritardi nella consegna dei pezzi.Il dott. Marco Riganti ci ha detto: “Ho visitato la Transvalor nel1999 per rendermi conto personalmente del livello tecnico di que-sta azienda e del suo software Forge, prima di deciderne l’acqui-sto. L’impressione di eccellenza che ne ricavai allora si è conferma-ta negli anni e per questo continuo a sostenere l’importanza diquesta scelta per il progresso della mia azienda. Il continuo lavo-ro di sviluppo del programma, a cura di Transvalor, e l'assistenzacontinua di EnginSoft nell’implementazione di progetti sempre piùcomplessi, sono elemento essenziale per utilizzare quotidianamen-te questo strumento e trarne il massimo vantaggio”, dichiaranoDario Bressan, responsabile dell’Ufficio Tecnico, e FrancoCermisoni, l’utilizzatore del programma.
FEAT GROUPL'introduzione di Forge inFeat risale al 2003, quando itest effettuati ci hanno con-vinto che questo tipo di soft-ware potesse aiutarci ad otte-nere risparmi di materia pri-ma e un approccio più metodico alla progettazione degli stampicon conseguente codifica del know-how aziendale acquisito.L'utilizzo delle simulazioni è diventato un passaggio d'uso comuneogni volta che vogliamo studiare una nuova famiglia di prodottooppure re-ingegnerizzare uno stampato esistente. È ormai diventa-ta una prassi per tutto lo staff tecnico, incontrarsi in sala corsi perpotere analizzare e discutere in team le simulazioni sviluppate. Dasoddisfazione vedere i responsabili di produzione essere oggi i pri-mi a voler simulare prima di emettere una quotazione o definireun'attrezzatura. Riteniamo che Forge ci abbia aiutato ad ottenerebenefici sensibili nei seguenti campi: riduzione sfrido, prevenzioneproblematiche di stampaggio, individuazione difettologie comemancato riempimento, cricche o ripieghe, analisi dell'andamentodelle fibre, robotizzazione della movimentazione, vita stampi. Ilbeneficio più importante è stato quello di stimolare il lavoro digruppo, con un linguaggio scientifico comune per integrare le va-rie competenze in soluzioni innovative. Il supporto di EnginSoft,attraverso l’assistenza telefonica ed affiancamenti dedicati, è fon-damentale per essere aggiornati sui miglioramenti dello strumentoe ci consente di applicarlo a problemi nuovi e sempre più comples-si.
Dichiarazioni di utilizzatori diForge nello stampaggio a caldo diacciaio in stampi chiusi
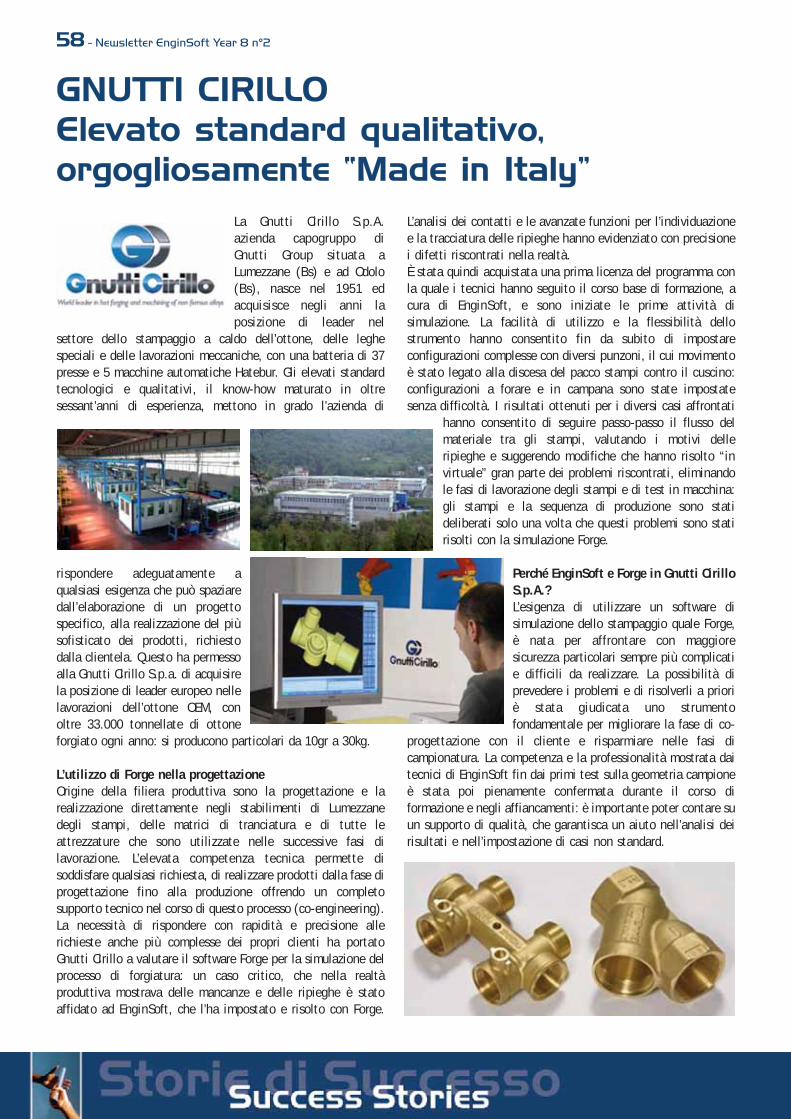
58 - Newsletter EnginSoft Year 8 n°2
La Gnutti Cirillo S.p.A.azienda capogruppo diGnutti Group situata aLumezzane (Bs) e ad Odolo(Bs), nasce nel 1951 edacquisisce negli anni laposizione di leader nel
settore dello stampaggio a caldo dell’ottone, delle leghespeciali e delle lavorazioni meccaniche, con una batteria di 37presse e 5 macchine automatiche Hatebur. Gli elevati standardtecnologici e qualitativi, il know-how maturato in oltresessant’anni di esperienza, mettono in grado l’azienda di
rispondere adeguatamente aqualsiasi esigenza che può spaziaredall’elaborazione di un progettospecifico, alla realizzazione del piùsofisticato dei prodotti, richiestodalla clientela. Questo ha permessoalla Gnutti Cirillo S.p.a. di acquisirela posizione di leader europeo nellelavorazioni dell’ottone OEM, conoltre 33.000 tonnellate di ottoneforgiato ogni anno: si producono particolari da 10gr a 30kg.
L’utilizzo di Forge nella progettazione Origine della filiera produttiva sono la progettazione e larealizzazione direttamente negli stabilimenti di Lumezzanedegli stampi, delle matrici di tranciatura e di tutte leattrezzature che sono utilizzate nelle successive fasi dilavorazione. L’elevata competenza tecnica permette disoddisfare qualsiasi richiesta, di realizzare prodotti dalla fase diprogettazione fino alla produzione offrendo un completosupporto tecnico nel corso di questo processo (co-engineering).La necessità di rispondere con rapidità e precisione allerichieste anche più complesse dei propri clienti ha portatoGnutti Cirillo a valutare il software Forge per la simulazione delprocesso di forgiatura: un caso critico, che nella realtàproduttiva mostrava delle mancanze e delle ripieghe è statoaffidato ad EnginSoft, che l’ha impostato e risolto con Forge.
L’analisi dei contatti e le avanzate funzioni per l’individuazionee la tracciatura delle ripieghe hanno evidenziato con precisionei difetti riscontrati nella realtà. È stata quindi acquistata una prima licenza del programma conla quale i tecnici hanno seguito il corso base di formazione, acura di EnginSoft, e sono iniziate le prime attività disimulazione. La facilità di utilizzo e la flessibilità dellostrumento hanno consentito fin da subito di impostareconfigurazioni complesse con diversi punzoni, il cui movimentoè stato legato alla discesa del pacco stampi contro il cuscino:configurazioni a forare e in campana sono state impostatesenza difficoltà. I risultati ottenuti per i diversi casi affrontati
hanno consentito di seguire passo-passo il flusso delmateriale tra gli stampi, valutando i motivi delleripieghe e suggerendo modifiche che hanno risolto “invirtuale” gran parte dei problemi riscontrati, eliminandole fasi di lavorazione degli stampi e di test in macchina:gli stampi e la sequenza di produzione sono statideliberati solo una volta che questi problemi sono statirisolti con la simulazione Forge.
Perché EnginSoft e Forge in Gnutti CirilloS.p.A.?L’esigenza di utilizzare un software disimulazione dello stampaggio quale Forge,è nata per affrontare con maggioresicurezza particolari sempre più complicatie difficili da realizzare. La possibilità diprevedere i problemi e di risolverli a prioriè stata giudicata uno strumentofondamentale per migliorare la fase di co-
progettazione con il cliente e risparmiare nelle fasi dicampionatura. La competenza e la professionalità mostrata daitecnici di EnginSoft fin dai primi test sulla geometria campioneè stata poi pienamente confermata durante il corso diformazione e negli affiancamenti: è importante poter contare suun supporto di qualità, che garantisca un aiuto nell’analisi deirisultati e nell’impostazione di casi non standard.
GNUTTI CIRILLOElevato standard qualitativo,orgogliosamente “Made in Italy”
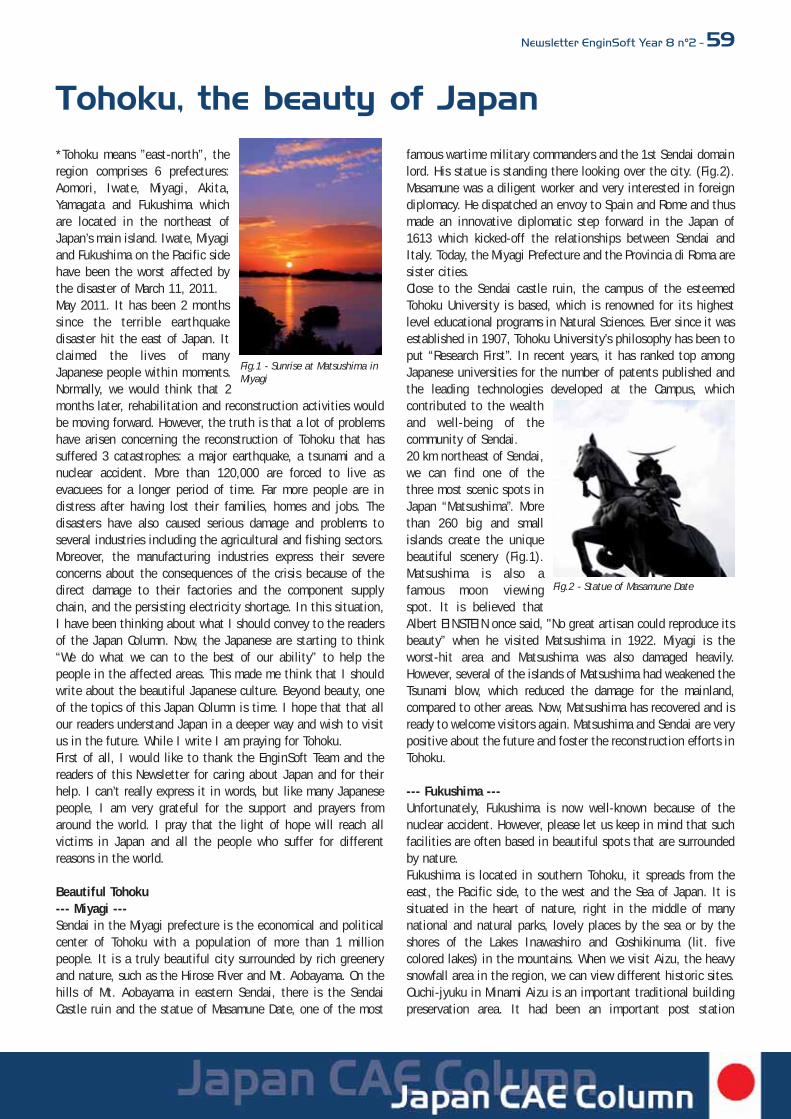
Newsletter EnginSoft Year 8 n°2 - 59
*Tohoku means ”east-north”, theregion comprises 6 prefectures:Aomori, Iwate, Miyagi, Akita,Yamagata and Fukushima whichare located in the northeast ofJapan’s main island. Iwate, Miyagiand Fukushima on the Pacific sidehave been the worst affected bythe disaster of March 11, 2011.May 2011. It has been 2 monthssince the terrible earthquakedisaster hit the east of Japan. Itclaimed the lives of manyJapanese people within moments.Normally, we would think that 2months later, rehabilitation and reconstruction activities wouldbe moving forward. However, the truth is that a lot of problemshave arisen concerning the reconstruction of Tohoku that hassuffered 3 catastrophes: a major earthquake, a tsunami and anuclear accident. More than 120,000 are forced to live asevacuees for a longer period of time. Far more people are indistress after having lost their families, homes and jobs. Thedisasters have also caused serious damage and problems toseveral industries including the agricultural and fishing sectors.Moreover, the manufacturing industries express their severeconcerns about the consequences of the crisis because of thedirect damage to their factories and the component supplychain, and the persisting electricity shortage. In this situation,I have been thinking about what I should convey to the readersof the Japan Column. Now, the Japanese are starting to think“We do what we can to the best of our ability” to help thepeople in the affected areas. This made me think that I shouldwrite about the beautiful Japanese culture. Beyond beauty, oneof the topics of this Japan Column is time. I hope that that allour readers understand Japan in a deeper way and wish to visitus in the future. While I write I am praying for Tohoku.First of all, I would like to thank the EnginSoft Team and thereaders of this Newsletter for caring about Japan and for theirhelp. I can’t really express it in words, but like many Japanesepeople, I am very grateful for the support and prayers fromaround the world. I pray that the light of hope will reach allvictims in Japan and all the people who suffer for differentreasons in the world.
Beautiful Tohoku--- Miyagi ---Sendai in the Miyagi prefecture is the economical and politicalcenter of Tohoku with a population of more than 1 millionpeople. It is a truly beautiful city surrounded by rich greeneryand nature, such as the Hirose River and Mt. Aobayama. On thehills of Mt. Aobayama in eastern Sendai, there is the SendaiCastle ruin and the statue of Masamune Date, one of the most
famous wartime military commanders and the 1st Sendai domainlord. His statue is standing there looking over the city. (Fig.2).Masamune was a diligent worker and very interested in foreigndiplomacy. He dispatched an envoy to Spain and Rome and thusmade an innovative diplomatic step forward in the Japan of1613 which kicked-off the relationships between Sendai andItaly. Today, the Miyagi Prefecture and the Provincia di Roma aresister cities. Close to the Sendai castle ruin, the campus of the esteemedTohoku University is based, which is renowned for its highestlevel educational programs in Natural Sciences. Ever since it wasestablished in 1907, Tohoku University’s philosophy has been toput “Research First”. In recent years, it has ranked top amongJapanese universities for the number of patents published andthe leading technologies developed at the Campus, whichcontributed to the wealthand well-being of thecommunity of Sendai.20 km northeast of Sendai,we can find one of thethree most scenic spots inJapan “Matsushima”. Morethan 260 big and smallislands create the uniquebeautiful scenery (Fig.1).Matsushima is also afamous moon viewingspot. It is believed thatAlbert EINSTEIN once said, "No great artisan could reproduce itsbeauty” when he visited Matsushima in 1922. Miyagi is theworst-hit area and Matsushima was also damaged heavily.However, several of the islands of Matsushima had weakened theTsunami blow, which reduced the damage for the mainland,compared to other areas. Now, Matsushima has recovered and isready to welcome visitors again. Matsushima and Sendai are verypositive about the future and foster the reconstruction efforts inTohoku.
--- Fukushima ---Unfortunately, Fukushima is now well-known because of thenuclear accident. However, please let us keep in mind that suchfacilities are often based in beautiful spots that are surroundedby nature.Fukushima is located in southern Tohoku, it spreads from theeast, the Pacific side, to the west and the Sea of Japan. It issituated in the heart of nature, right in the middle of manynational and natural parks, lovely places by the sea or by theshores of the Lakes Inawashiro and Goshikinuma (lit. fivecolored lakes) in the mountains. When we visit Aizu, the heavysnowfall area in the region, we can view different historic sites.Ouchi-jyuku in Minami Aizu is an important traditional buildingpreservation area. It had been an important post station
Fig.1 - Sunrise at Matsushima inMiyagi
Fig.2 - Statue of Masamune Date
Tohoku, the beauty of Japan
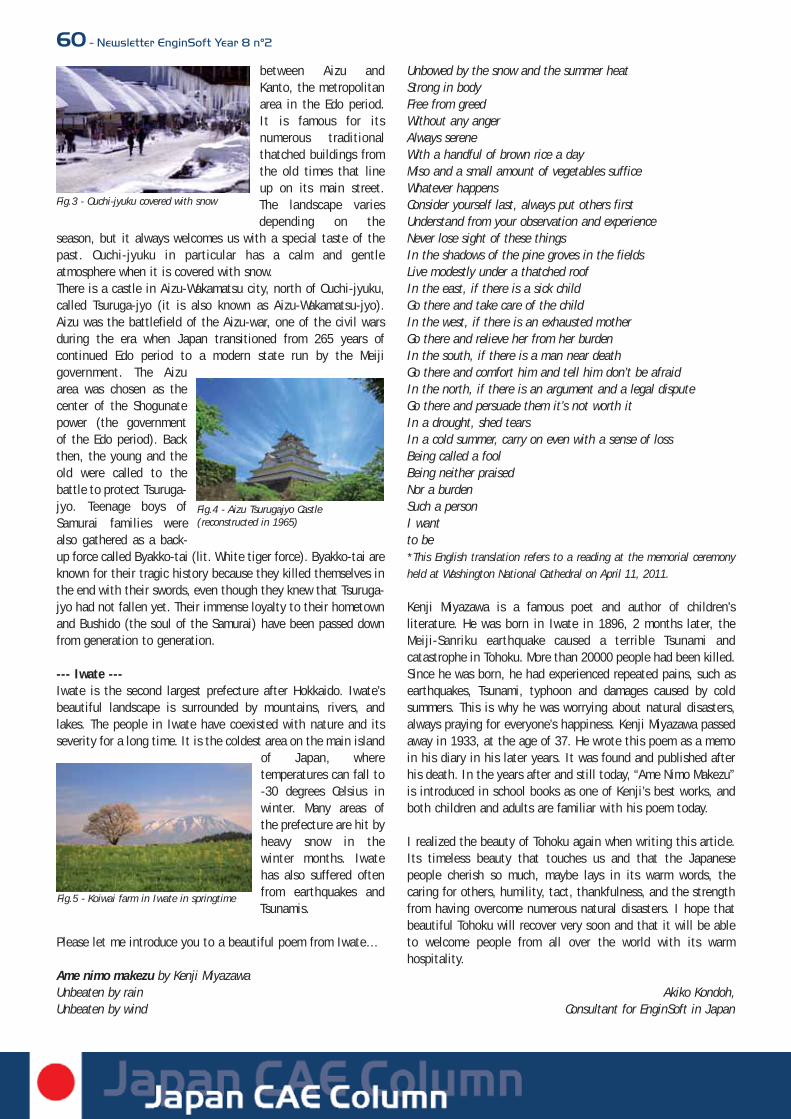
60 - Newsletter EnginSoft Year 8 n°2
between Aizu andKanto, the metropolitanarea in the Edo period.It is famous for itsnumerous traditionalthatched buildings fromthe old times that lineup on its main street.The landscape variesdepending on the
season, but it always welcomes us with a special taste of thepast. Ouchi-jyuku in particular has a calm and gentleatmosphere when it is covered with snow. There is a castle in Aizu-Wakamatsu city, north of Ouchi-jyuku,called Tsuruga-jyo (it is also known as Aizu-Wakamatsu-jyo).Aizu was the battlefield of the Aizu-war, one of the civil warsduring the era when Japan transitioned from 265 years ofcontinued Edo period to a modern state run by the Meijigovernment. The Aizuarea was chosen as thecenter of the Shogunatepower (the governmentof the Edo period). Backthen, the young and theold were called to thebattle to protect Tsuruga-jyo. Teenage boys ofSamurai families werealso gathered as a back-up force called Byakko-tai (lit. White tiger force). Byakko-tai areknown for their tragic history because they killed themselves inthe end with their swords, even though they knew that Tsuruga-jyo had not fallen yet. Their immense loyalty to their hometownand Bushido (the soul of the Samurai) have been passed downfrom generation to generation.
--- Iwate ---Iwate is the second largest prefecture after Hokkaido. Iwate’sbeautiful landscape is surrounded by mountains, rivers, andlakes. The people in Iwate have coexisted with nature and itsseverity for a long time. It is the coldest area on the main island
of Japan, wheretemperatures can fall to-30 degrees Celsius inwinter. Many areas ofthe prefecture are hit byheavy snow in thewinter months. Iwatehas also suffered oftenfrom earthquakes andTsunamis.
Please let me introduce you to a beautiful poem from Iwate…
Ame nimo makezu by Kenji MiyazawaUnbeaten by rainUnbeaten by wind
Unbowed by the snow and the summer heatStrong in bodyFree from greedWithout any angerAlways sereneWith a handful of brown rice a dayMiso and a small amount of vegetables sufficeWhatever happensConsider yourself last, always put others firstUnderstand from your observation and experienceNever lose sight of these thingsIn the shadows of the pine groves in the fieldsLive modestly under a thatched roof In the east, if there is a sick childGo there and take care of the childIn the west, if there is an exhausted motherGo there and relieve her from her burdenIn the south, if there is a man near deathGo there and comfort him and tell him don’t be afraidIn the north, if there is an argument and a legal disputeGo there and persuade them it’s not worth itIn a drought, shed tearsIn a cold summer, carry on even with a sense of lossBeing called a foolBeing neither praisedNor a burdenSuch a personI wantto be*This English translation refers to a reading at the memorial ceremonyheld at Washington National Cathedral on April 11, 2011.
Kenji Miyazawa is a famous poet and author of children'sliterature. He was born in Iwate in 1896, 2 months later, theMeiji-Sanriku earthquake caused a terrible Tsunami andcatastrophe in Tohoku. More than 20000 people had been killed.Since he was born, he had experienced repeated pains, such asearthquakes, Tsunami, typhoon and damages caused by coldsummers. This is why he was worrying about natural disasters,always praying for everyone’s happiness. Kenji Miyazawa passedaway in 1933, at the age of 37. He wrote this poem as a memoin his diary in his later years. It was found and published afterhis death. In the years after and still today, “Ame Nimo Makezu”is introduced in school books as one of Kenji’s best works, andboth children and adults are familiar with his poem today.
I realized the beauty of Tohoku again when writing this article.Its timeless beauty that touches us and that the Japanesepeople cherish so much, maybe lays in its warm words, thecaring for others, humility, tact, thankfulness, and the strengthfrom having overcome numerous natural disasters. I hope thatbeautiful Tohoku will recover very soon and that it will be ableto welcome people from all over the world with its warmhospitality.
Akiko Kondoh, Consultant for EnginSoft in Japan
Fig.3 - Ouchi-jyuku covered with snow
Fig.4 - Aizu Tsurugajyo Castle(reconstructed in 1965)
Fig.5 - Koiwai farm in Iwate in springtime
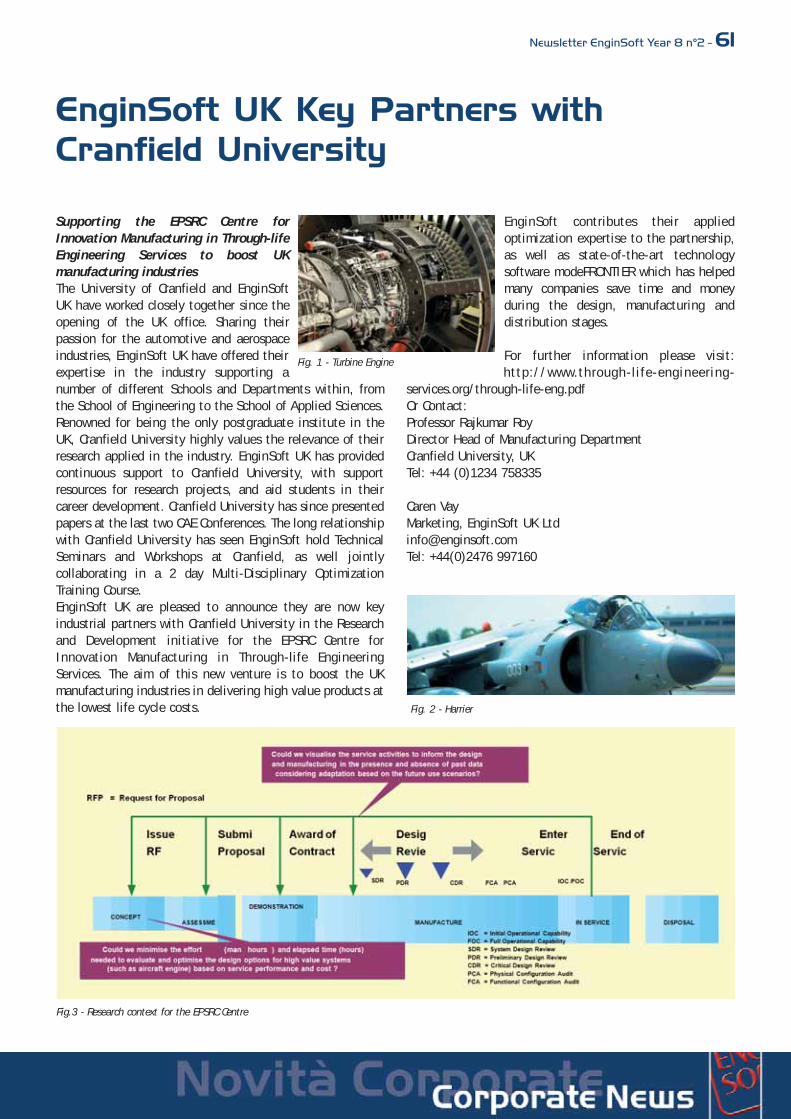
Newsletter EnginSoft Year 8 n°2 - 61
Supporting the EPSRC Centre forInnovation Manufacturing in Through-lifeEngineering Services to boost UKmanufacturing industriesThe University of Cranfield and EnginSoftUK have worked closely together since theopening of the UK office. Sharing theirpassion for the automotive and aerospaceindustries, EnginSoft UK have offered theirexpertise in the industry supporting anumber of different Schools and Departments within, fromthe School of Engineering to the School of Applied Sciences.Renowned for being the only postgraduate institute in theUK, Cranfield University highly values the relevance of theirresearch applied in the industry. EnginSoft UK has providedcontinuous support to Cranfield University, with supportresources for research projects, and aid students in theircareer development. Cranfield University has since presentedpapers at the last two CAE Conferences. The long relationshipwith Cranfield University has seen EnginSoft hold TechnicalSeminars and Workshops at Cranfield, as well jointlycollaborating in a 2 day Multi-Disciplinary OptimizationTraining Course. EnginSoft UK are pleased to announce they are now keyindustrial partners with Cranfield University in the Researchand Development initiative for the EPSRC Centre forInnovation Manufacturing in Through-life EngineeringServices. The aim of this new venture is to boost the UKmanufacturing industries in delivering high value products atthe lowest life cycle costs.
EnginSoft contributes their appliedoptimization expertise to the partnership,as well as state-of-the-art technologysoftware modeFRONTIER which has helpedmany companies save time and moneyduring the design, manufacturing anddistribution stages.
For further information please visit:http://www.through-life-engineering-
services.org/through-life-eng.pdfOr Contact:Professor Rajkumar Roy Director Head of Manufacturing Department Cranfield University, UK Tel: +44 (0)1234 758335
Caren Vay Marketing, EnginSoft UK Ltd [email protected] Tel: +44(0)2476 997160
EnginSoft UK Key Partners withCranfield University
Fig.3 - Research context for the EPSRC Centre
Fig. 1 - Turbine Engine
Fig. 2 - Harrier
62 - Newsletter EnginSoft Year 8 n°2
On 25th May 2011 EnginSoft gained a new partner,M3E S.r.l., a recently founded spin-off company ofthe University of Padua. M3E is an acronym: theletter M is taken to the power of three and standsfor “Mathematical”, “Methods” and “Models”,while the E for “Engineering”.
So, the complete title is: “Mathematical Methodsand Models for Engineering”.The main goals of this new company are thedevelopment and distribution of numericalsoftware packages in order to find an efficientsolution to advanced problems in scientificcomputing, especially regarding linear algebra tools,optimization algorithms, and their application to severalengineering problems. For its customers M3E provides notonly software packages, but also maintenance andconsultancy services, especially when dealing withproblems related to surface and undergroundenvironmental processes, such as management ofgroundwater resources, exploitation of gas and oil fromdeep reservoirs, coupling between surface and subsurfaceflow, transport and diffusion of contaminants intofreshwater aquifers, prediction of land subsidencephenomena and design of their possible mitigation.
The expertise the new company applied in the applicationsdescribed above is due to the internationalacknowledgement of the research carried out in the lasttwo decades by the founding members. The founders ofM3E S.r.l. are also members of the research group, whichis headed by Professor Giuseppe Gambolati at theUniversity of Padua. The research group also includesassociate and assistant professors, as well as younger
post-doc students. Only over this last decade, the grouphas published over 200 papers in scientific peer-reviewedjournals and collected few million Euro funds to invest indeveloping and implementing new numerical algorithmsfor an effective solution to several linear algebraproblems, along with their application in engineeringprojects accounting for environmental surface andunderground processes. The models coded by the foundingmembers have been already used in high performancecomputing systems in a large amount of research studies,including projects funded by the European Union and theUS Department of Energy.
EnginSoft gives a warm welcome to M3E S.r.l. and is proudto have it as a member of its network. This partnershipaims at attracting and connecting new actors which couldtake advantage of the services offered by the M3Eexpertise. The target is not only represented by a largepublic or private companies and agencies operating in thefield of energy resources and the related environmentalimpact, but also small companies that need specific
software tools which cannot beeasily found in the universe ofcomputer aided engineering.Furthermore, the advancednumerical algorithms providedby M3E, taking into account thelatest achievements ofnumerical analyses, can beattractive also for a substantialimprovement of the packagesdistributed by large andrenowned software producers.
For more information:[email protected]
EnginSoft gained a new partner:M3E S.r.l.,
Geomechanical model of a deep gas reservoir
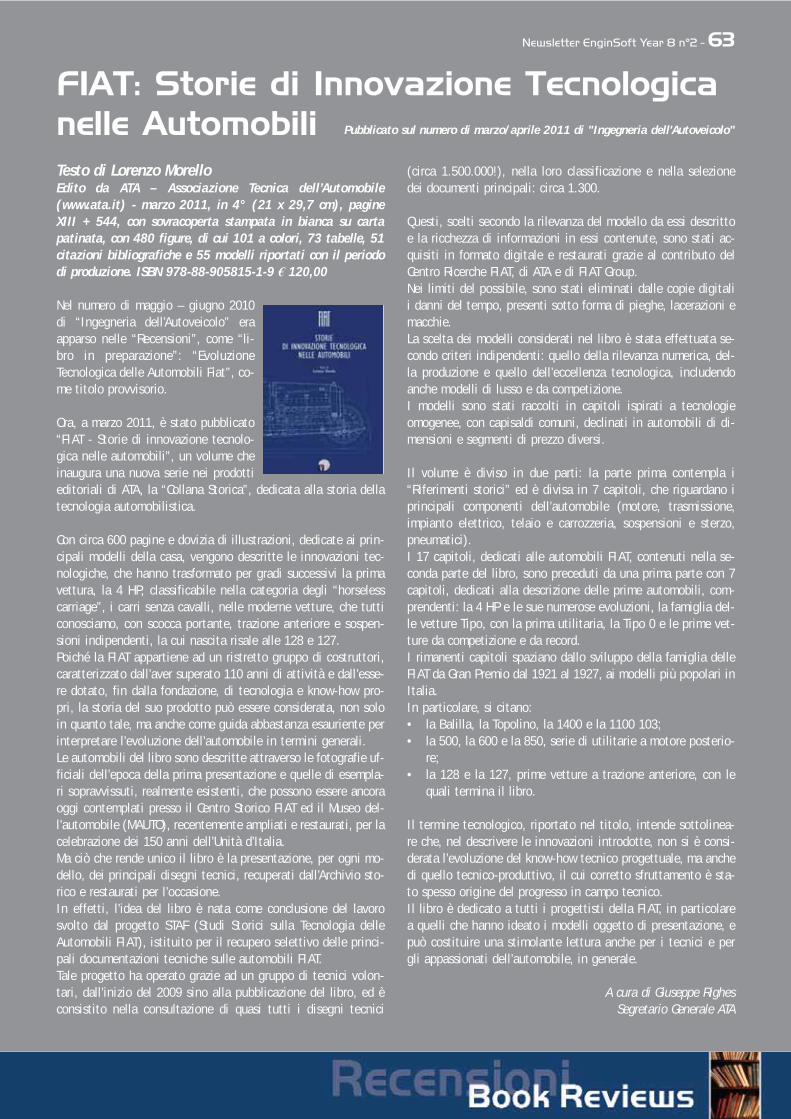
Newsletter EnginSoft Year 8 n°2 - 63
Testo di Lorenzo MorelloEdito da ATA – Associazione Tecnica dell’Automobile(www.ata.it) - marzo 2011, in 4° (21 x 29,7 cm), pagineXIII + 544, con sovracoperta stampata in bianca su cartapatinata, con 480 figure, di cui 101 a colori, 73 tabelle, 51citazioni bibliografiche e 55 modelli riportati con il periododi produzione. ISBN 978-88-905815-1-9 € 120,00
Nel numero di maggio – giugno 2010di “Ingegneria dell’Autoveicolo” eraapparso nelle “Recensioni”, come “li-bro in preparazione”: “EvoluzioneTecnologica delle Automobili Fiat”, co-me titolo provvisorio.
Ora, a marzo 2011, è stato pubblicato“FIAT - Storie di innovazione tecnolo-gica nelle automobili”, un volume cheinaugura una nuova serie nei prodottieditoriali di ATA, la “Collana Storica”, dedicata alla storia dellatecnologia automobilistica.
Con circa 600 pagine e dovizia di illustrazioni, dedicate ai prin-cipali modelli della casa, vengono descritte le innovazioni tec-nologiche, che hanno trasformato per gradi successivi la primavettura, la 4 HP, classificabile nella categoria degli “horselesscarriage”, i carri senza cavalli, nelle moderne vetture, che tutticonosciamo, con scocca portante, trazione anteriore e sospen-sioni indipendenti, la cui nascita risale alle 128 e 127.Poiché la FIAT appartiene ad un ristretto gruppo di costruttori,caratterizzato dall’aver superato 110 anni di attività e dall’esse-re dotato, fin dalla fondazione, di tecnologia e know-how pro-pri, la storia del suo prodotto può essere considerata, non soloin quanto tale, ma anche come guida abbastanza esauriente perinterpretare l’evoluzione dell’automobile in termini generali.Le automobili del libro sono descritte attraverso le fotografie uf-ficiali dell’epoca della prima presentazione e quelle di esempla-ri sopravvissuti, realmente esistenti, che possono essere ancoraoggi contemplati presso il Centro Storico FIAT ed il Museo del-l’automobile (MAUTO), recentemente ampliati e restaurati, per lacelebrazione dei 150 anni dell’Unità d’Italia.Ma ciò che rende unico il libro è la presentazione, per ogni mo-dello, dei principali disegni tecnici, recuperati dall’Archivio sto-rico e restaurati per l’occasione.In effetti, l’idea del libro è nata come conclusione del lavorosvolto dal progetto STAF (Studi Storici sulla Tecnologia delleAutomobili FIAT), istituito per il recupero selettivo delle princi-pali documentazioni tecniche sulle automobili FIAT.Tale progetto ha operato grazie ad un gruppo di tecnici volon-tari, dall’inizio del 2009 sino alla pubblicazione del libro, ed èconsistito nella consultazione di quasi tutti i disegni tecnici
(circa 1.500.000!), nella loro classificazione e nella selezionedei documenti principali: circa 1.300.
Questi, scelti secondo la rilevanza del modello da essi descrittoe la ricchezza di informazioni in essi contenute, sono stati ac-quisiti in formato digitale e restaurati grazie al contributo delCentro Ricerche FIAT, di ATA e di FIAT Group.Nei limiti del possibile, sono stati eliminati dalle copie digitalii danni del tempo, presenti sotto forma di pieghe, lacerazioni emacchie.La scelta dei modelli considerati nel libro è stata effettuata se-condo criteri indipendenti: quello della rilevanza numerica, del-la produzione e quello dell’eccellenza tecnologica, includendoanche modelli di lusso e da competizione.I modelli sono stati raccolti in capitoli ispirati a tecnologieomogenee, con capisaldi comuni, declinati in automobili di di-mensioni e segmenti di prezzo diversi.
Il volume è diviso in due parti: la parte prima contempla i“Riferimenti storici” ed è divisa in 7 capitoli, che riguardano iprincipali componenti dell’automobile (motore, trasmissione,impianto elettrico, telaio e carrozzeria, sospensioni e sterzo,pneumatici).I 17 capitoli, dedicati alle automobili FIAT, contenuti nella se-conda parte del libro, sono preceduti da una prima parte con 7capitoli, dedicati alla descrizione delle prime automobili, com-prendenti: la 4 HP e le sue numerose evoluzioni, la famiglia del-le vetture Tipo, con la prima utilitaria, la Tipo 0 e le prime vet-ture da competizione e da record.I rimanenti capitoli spaziano dallo sviluppo della famiglia delleFIAT da Gran Premio dal 1921 al 1927, ai modelli più popolari inItalia.In particolare, si citano:• la Balilla, la Topolino, la 1400 e la 1100 103;• la 500, la 600 e la 850, serie di utilitarie a motore posterio-
re;• la 128 e la 127, prime vetture a trazione anteriore, con le
quali termina il libro.
Il termine tecnologico, riportato nel titolo, intende sottolinea-re che, nel descrivere le innovazioni introdotte, non si è consi-derata l’evoluzione del know-how tecnico progettuale, ma anchedi quello tecnico-produttivo, il cui corretto sfruttamento è sta-to spesso origine del progresso in campo tecnico.Il libro è dedicato a tutti i progettisti della FIAT, in particolarea quelli che hanno ideato i modelli oggetto di presentazione, epuò costituire una stimolante lettura anche per i tecnici e pergli appassionati dell’automobile, in generale.
A cura di Giuseppe RighesSegretario Generale ATA
FIAT: Storie di Innovazione Tecnologicanelle Automobili Pubblicato sul numero di marzo/aprile 2011 di "Ingegneria dell'Autoveicolo"
64 - Newsletter EnginSoft Year 8 n°2
La Nafems, “the International association for the enginee-ring analysis community”, sostiene una collana di pubbli-cazioni particolarmente completa ed utile soprattutto achi si occupa concretamente di applicazioni della simula-zione all’ingegneria.
La collana si è, recentemente, arricchita di due nuovi li-bretti.Il primo, “ WHAT IS a probabilistic or stochastic analysis?”funge da sommario rispetto all’argomento, trattato piùestesamente in altre pubblicazioni, quali “ WHAY DO pro-babilistic analysis?” e “WHAT IS sensistivity analysis?”, e,comunque, nei documenti prodotti dal gruppo di lavoro
sull’analisi stocastica. Partendo dalla considerazione delproblema del trattamento delle incertezze, e del rischioassociato, viene precisata la differenza che esiste tra unapproccio probabilistico ed un approccio stocastico.
Vengono, inoltre, indicati e sommariamente classificati imetodi che trattano dell’analisi dell’affidabilità, dalMetodo Montecarlo, agli ORM (Order Reliability Methods),mettendo in luce il valore che si può trarre da un’analisidi sensitività, e, soprattutto, da un’analisi di affidabilità(Reliability Analysis). Infine il libretto da indicazione del-le direzioni di sviluppo dei metodi, nell’ottica dei softwa-re commerciali.
Il secondo libretto appartiene alla collana “HOW TO”, ed,in questo caso, suggerisce “HOW TO Analyse PracticalProblems using FE Software”. Il libretto può essere consi-derato una guida all’impiego di software commerciali ba-sati sul metodo degli elementi finiti, nell’ottica di realiz-zare modelli affidabili, e di evitare gli errori che possonoderivare dall’impiego scorretto dei software stessi.
Il libretto è diviso in sei capitoli, ciascuno dedicato ad untema specifico, ed è corredato da otto casi di studio, chepossono servire per apprendere – con riferimenti pratici –i ‘trucchi del mestiere’. I temi trattati riguardano:• la scelta dell’elemento finito più adatto al problema,
ed i criteri per portare il modello a convergenza versola soluzione compatibile con le scelte fatte, relativa-
mente ad applicazioni mono, bi, tri-dimensionali emiste;
• l’applicazione delle condizioni al contorno, in situazio-ni non banali, illustrate sia attraverso esempi ricorren-ti nella pratica quotidiana – quali quello della simula-zione degli ingranaggi – che attraverso esempi ‘esoti-ci’ – quali lo studio di cesoie per la regolarizzazionedelle siepi -;
• la corretta gestione delle porzioni strutturali trattatecome rigide, inclusi i problemi relativi alla connessio-ne di sotto-sistemi trattati con elementi finiti tra loroincompatibili; applicazioni tipiche agli assemblaggi,alle giunzioni bullonate, alle connessioni tra porzionisimulate con elementi guscio, e porzioni simulate in3D;
• il problema dei contatti , nelle varie forme in cui que-sti possono essere o sono descritti nei codici di calco-lo commerciali (punto-punto, superficie-superficie);tecniche di iterazione del problema non-lineare; gran-di deformazioni; determinazione delle pressioni dicontatto;
• la simulazione dell’impatto ed il ‘drop test’, a partiredalla classificazione delle azioni dinamiche, delle cor-rispondenti equazioni del moto e modalità di soluzio-ne; smorzamento; problemi relativi alla lettura edinterpretazione dei risultati;
• il trattamento delle simmetrie e delle a-simmetrie;simmetrie cicliche in presenza di carichi non-ciclici;applicazione agli assemblaggi; azioni dinamiche; trat-tamento delle non-linearità.
La lettura di questi libretti è molto facile. E l’utilità – spe-cie per chi si affaccia al calcolo numerico senza esperien-ze specifiche – notevole. Il principio seguito è quelloespresso da Peter Drucker, il famoso guru dei manager: “Dothe Right Thing first, The Thing Right afterwards”, in cuiil concetto del fare “the right thing” esprime l’efficacia, equello del fare “the thing right”, esprime l’efficienza.Quando si parla di elementi finiti, fare “the right thing”significa utilizzare il modello giusto, applicare le condizio-ni al contorno in modo congruente, e rappresentare ade-guatamente la fisica del problema; fare the “thing right”significa affinare il modello, aggiungere quanto ne possaaumentare l’utilità, e facilitarne la lettura.
Per informazioni:[email protected]
Nuove pubblicazioni di NAFEMS

Newsletter EnginSoft Year 8 n°2 - 65
TechNet Alliance Spring Meeting 2011 29th – 30th April 2011Hotel Barceló Asia Gardenz, Alicante - Spain
During the last days of April, members of the TechNetAlliance and their invited guests met at the Hotel BarcelóAsia Gardens in Alicante, in Southern Spain. As always, theTechNet Alliance had selected a charming venue thatunderlined the good spirit, positive outlook and thepromising future projects of the Alliance. The meeting sawa high attendance; it was organized and hosted in thetypical TechNet Alliance style: attention to detail, a highquality agenda, excellent speakers from around the globeand different fields - a format that has proven to besuccessful since the late 90s.
The TechNet Alliance is a unique consortium in theComputer Aided Engineering (CAE) or Simulation BasedEngineering Sciences industry. It is comprised of a largenetwork of engineering solution providers, dedicated tothe application, development, training, support andmarketing of CAE best-of-class software. Today, the global alliance comprises more than 2500 CAEemployees in 56 companies, 25 countries, communicatingin 20 languages.The management of EnginSoft is on the board of theTechNet Alliance and attends the bi-annual meetings,often presentations are contributed to the agenda.
At the 2011 Spring Meeting, potential synergies betweenANSYS and the Alliance were discussed. Several ideas cameup including the possible sponsorship of a project in thetraining and educational sector which may involve the TCNConsortium and esocaet. During the talks, the EnginSoftManagement suggested that ANSYS should take the lead inorganizing 1-day events, possibly workshops, at which aselected number of TechNet Alliance Members wouldpromote the ANSYS proposals and technologies byillustrating specific advanced case histories. In this way,the TechNet Alliance concept and the ANSYS brand wouldbe supported simultaneously.The presentations, that were delivered on Saturday 30thApril in Alicante, covered such interesting topics and talksas:
o the use of Social Media to help promoting the TechNetAlliance on a global level;
o a Material Database for ANSYS 13.0;o potential new Charter Members. EnginSoft had
suggested Flowmaster, and Morgan Jenkins ofFlowmaster UK, gave a lively presentation based on thetuning of a Ferrari Dreamcar engine. Furtherpresentations were contributed by organizations fromthe USA and Spain;
o Representatives from the Polytechnic University ofMadrid and UNED in Spain were welcomed as potentialHonorary Members.
The presentations of TechNet Alliance Members included: o Dynardo’s description of their ANSYS RDO
implementation; o InuTech and FTT and the upgrade of their technologies
and product portfolios;o Ingeciber Spain presented a series of convincing
applications in the fields of hydraulics andenvironmental applications of CFD;
o EnginSoft continued the series of presentations onmetal processing. The aim here is also to develop acomprehensive documentation for this area ofEnginSoft’s expertise. This time the topic was forging-metal forming. It built on the previous presentation atthe TechNet Alliance Fall Meeting 2010 in Aachen,Germany, which had been focused on casting. In thefuture, machining, heat treatments, databases, thermalfatigue will be outlined as further topics;
o The new design of the TechNet Alliance Website wasdiscussed. This is an important activity to mostmembers as it will further strengthen the brand of theAlliance and provide a window to promote theirspecific competencies.
The Spring Meeting 2011 was another excellentnetworking occasion for the attendees. It underlined oncemore the validity of the working model of the TechNetAlliance and its bi-annual Meetings at alternating venuesin Europe.
Stefano Odorizzi,CEO of EnginSoft
EnginSoft is a Member of the TechNet Alliance since 2003
For more information on the TechNet Alliance, please visit:www.technet-alliance.comand contact Mrs Kristin Schuhegger at:[email protected]
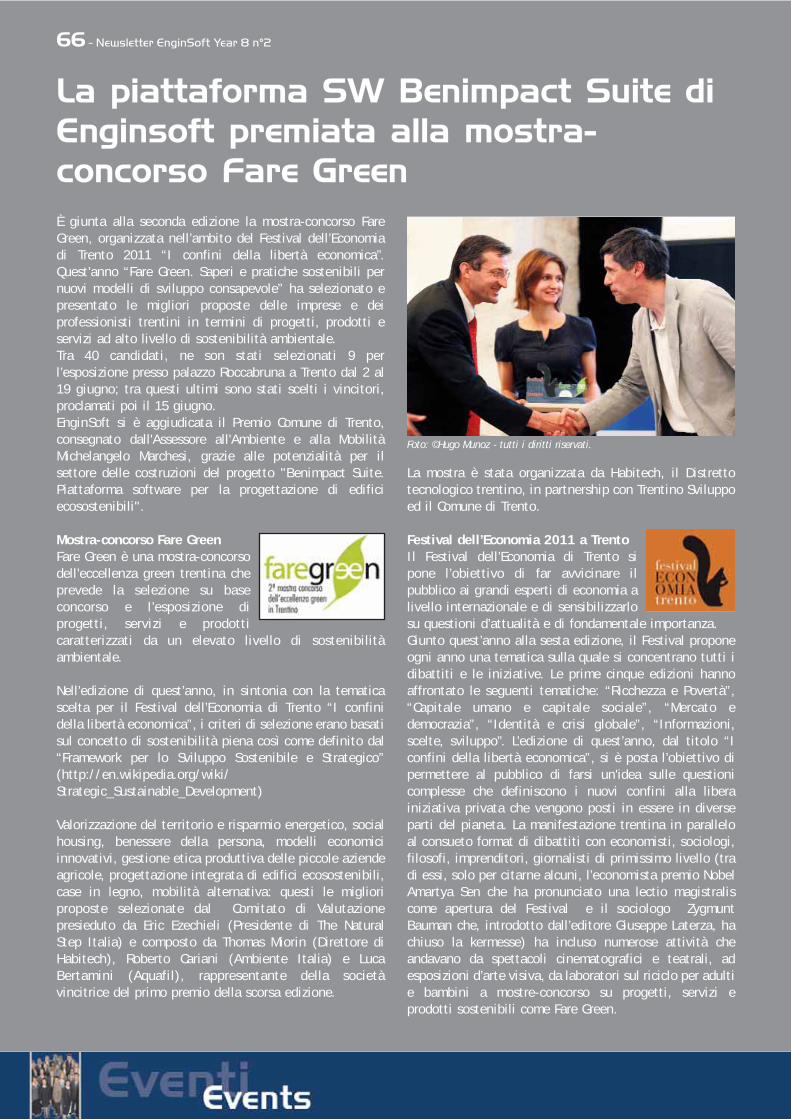
66 - Newsletter EnginSoft Year 8 n°2
È giunta alla seconda edizione la mostra-concorso FareGreen, organizzata nell’ambito del Festival dell’Economiadi Trento 2011 “I confini della libertà economica”.Quest’anno “Fare Green. Saperi e pratiche sostenibili pernuovi modelli di sviluppo consapevole” ha selezionato epresentato le migliori proposte delle imprese e deiprofessionisti trentini in termini di progetti, prodotti eservizi ad alto livello di sostenibilità ambientale.Tra 40 candidati, ne son stati selezionati 9 perl’esposizione presso palazzo Roccabruna a Trento dal 2 al19 giugno; tra questi ultimi sono stati scelti i vincitori,proclamati poi il 15 giugno.EnginSoft si è aggiudicata il Premio Comune di Trento,consegnato dall'Assessore all'Ambiente e alla MobilitàMichelangelo Marchesi, grazie alle potenzialità per ilsettore delle costruzioni del progetto "Benimpact Suite.Piattaforma software per la progettazione di edificiecosostenibili".
Mostra-concorso Fare GreenFare Green è una mostra-concorsodell’eccellenza green trentina cheprevede la selezione su baseconcorso e l’esposizione diprogetti, servizi e prodotticaratterizzati da un elevato livello di sostenibilitàambientale.
Nell’edizione di quest’anno, in sintonia con la tematicascelta per il Festival dell’Economia di Trento “I confinidella libertà economica”, i criteri di selezione erano basatisul concetto di sostenibilità piena così come definito dal“Framework per lo Sviluppo Sostenibile e Strategico”(http://en.wikipedia.org/wiki/Strategic_Sustainable_Development)
Valorizzazione del territorio e risparmio energetico, socialhousing, benessere della persona, modelli economiciinnovativi, gestione etica produttiva delle piccole aziendeagricole, progettazione integrata di edifici ecosostenibili,case in legno, mobilità alternativa: questi le miglioriproposte selezionate dal Comitato di Valutazionepresieduto da Eric Ezechieli (Presidente di The NaturalStep Italia) e composto da Thomas Miorin (Direttore diHabitech), Roberto Cariani (Ambiente Italia) e LucaBertamini (Aquafil), rappresentante della societàvincitrice del primo premio della scorsa edizione.
La mostra è stata organizzata da Habitech, il Distrettotecnologico trentino, in partnership con Trentino Sviluppoed il Comune di Trento.
Festival dell’Economia 2011 a TrentoIl Festival dell’Economia di Trento sipone l’obiettivo di far avvicinare ilpubblico ai grandi esperti di economia alivello internazionale e di sensibilizzarlosu questioni d’attualità e di fondamentale importanza.Giunto quest’anno alla sesta edizione, il Festival proponeogni anno una tematica sulla quale si concentrano tutti idibattiti e le iniziative. Le prime cinque edizioni hannoaffrontato le seguenti tematiche: “Ricchezza e Povertà”,“Capitale umano e capitale sociale”, “Mercato edemocrazia”, “Identità e crisi globale”, “Informazioni,scelte, sviluppo”. L’edizione di quest’anno, dal titolo “Iconfini della libertà economica”, si è posta l’obiettivo dipermettere al pubblico di farsi un'idea sulle questionicomplesse che definiscono i nuovi confini alla liberainiziativa privata che vengono posti in essere in diverseparti del pianeta. La manifestazione trentina in paralleloal consueto format di dibattiti con economisti, sociologi,filosofi, imprenditori, giornalisti di primissimo livello (tradi essi, solo per citarne alcuni, l’economista premio NobelAmartya Sen che ha pronunciato una lectio magistraliscome apertura del Festival e il sociologo ZygmuntBauman che, introdotto dall’editore Giuseppe Laterza, hachiuso la kermesse) ha incluso numerose attività cheandavano da spettacoli cinematografici e teatrali, adesposizioni d’arte visiva, da laboratori sul riciclo per adultie bambini a mostre-concorso su progetti, servizi eprodotti sostenibili come Fare Green.
La piattaforma SW Benimpact Suite diEnginsoft premiata alla mostra-concorso Fare Green
Foto: ©Hugo Munoz - tutti i diritti riservati.
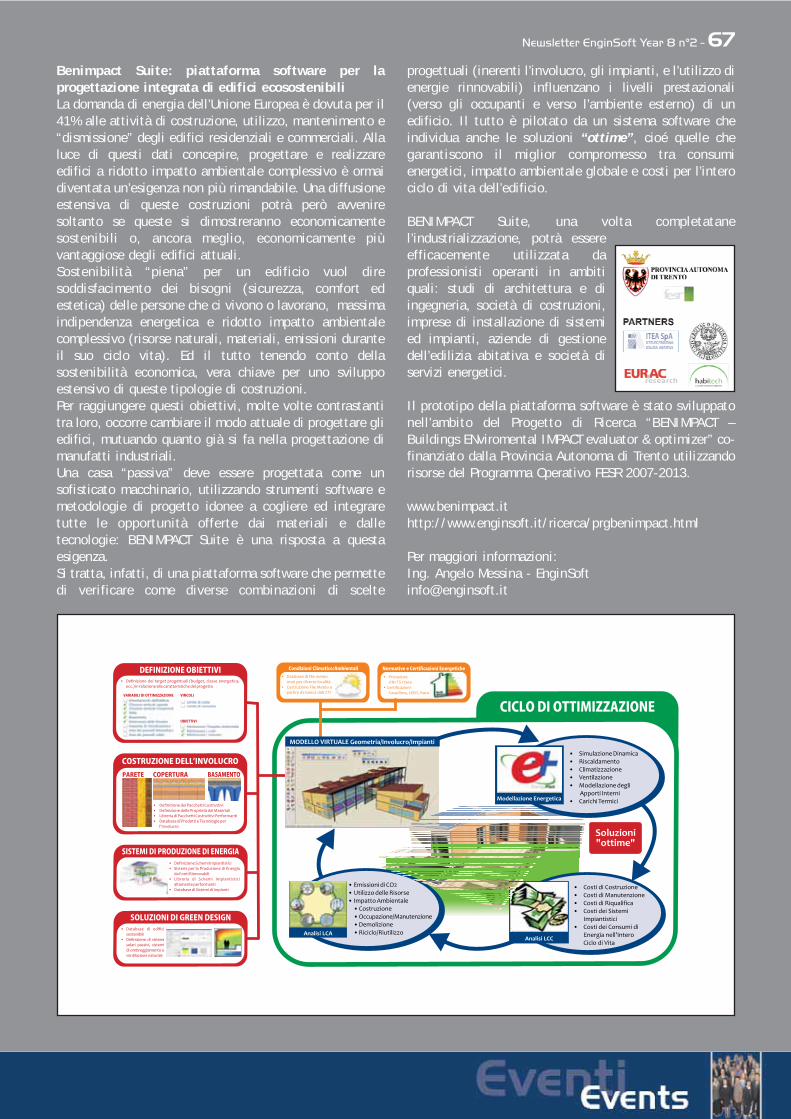
Newsletter EnginSoft Year 8 n°2 - 67Benimpact Suite: piattaforma software per laprogettazione integrata di edifici ecosostenibiliLa domanda di energia dell’Unione Europea è dovuta per il41% alle attività di costruzione, utilizzo, mantenimento e“dismissione” degli edifici residenziali e commerciali. Allaluce di questi dati concepire, progettare e realizzareedifici a ridotto impatto ambientale complessivo è ormaidiventata un’esigenza non più rimandabile. Una diffusioneestensiva di queste costruzioni potrà però avveniresoltanto se queste si dimostreranno economicamentesostenibili o, ancora meglio, economicamente piùvantaggiose degli edifici attuali.Sostenibilità “piena” per un edificio vuol diresoddisfacimento dei bisogni (sicurezza, comfort edestetica) delle persone che ci vivono o lavorano, massimaindipendenza energetica e ridotto impatto ambientalecomplessivo (risorse naturali, materiali, emissioni duranteil suo ciclo vita). Ed il tutto tenendo conto dellasostenibilità economica, vera chiave per uno sviluppoestensivo di queste tipologie di costruzioni.Per raggiungere questi obiettivi, molte volte contrastantitra loro, occorre cambiare il modo attuale di progettare gliedifici, mutuando quanto già si fa nella progettazione dimanufatti industriali.Una casa “passiva” deve essere progettata come unsofisticato macchinario, utilizzando strumenti software emetodologie di progetto idonee a cogliere ed integraretutte le opportunità offerte dai materiali e dalletecnologie: BENIMPACT Suite è una risposta a questaesigenza. Si tratta, infatti, di una piattaforma software che permettedi verificare come diverse combinazioni di scelte
progettuali (inerenti l’involucro, gli impianti, e l’utilizzo dienergie rinnovabili) influenzano i livelli prestazionali(verso gli occupanti e verso l’ambiente esterno) di unedificio. Il tutto è pilotato da un sistema software cheindividua anche le soluzioni “ottime”, cioé quelle chegarantiscono il miglior compromesso tra consumienergetici, impatto ambientale globale e costi per l’interociclo di vita dell’edificio.
BENIMPACT Suite, una volta completatanel’industrializzazione, potrà essereefficacemente utilizzata daprofessionisti operanti in ambitiquali: studi di architettura e diingegneria, società di costruzioni,imprese di installazione di sistemied impianti, aziende di gestionedell’edilizia abitativa e società diservizi energetici.
Il prototipo della piattaforma software è stato sviluppatonell’ambito del Progetto di Ricerca “BENIMPACT –Buildings ENviromental IMPACT evaluator & optimizer” co-finanziato dalla Provincia Autonoma di Trento utilizzandorisorse del Programma Operativo FESR 2007-2013.
www.benimpact.ithttp://www.enginsoft.it/ricerca/prgbenimpact.html
Per maggiori informazioni:Ing. Angelo Messina - [email protected]
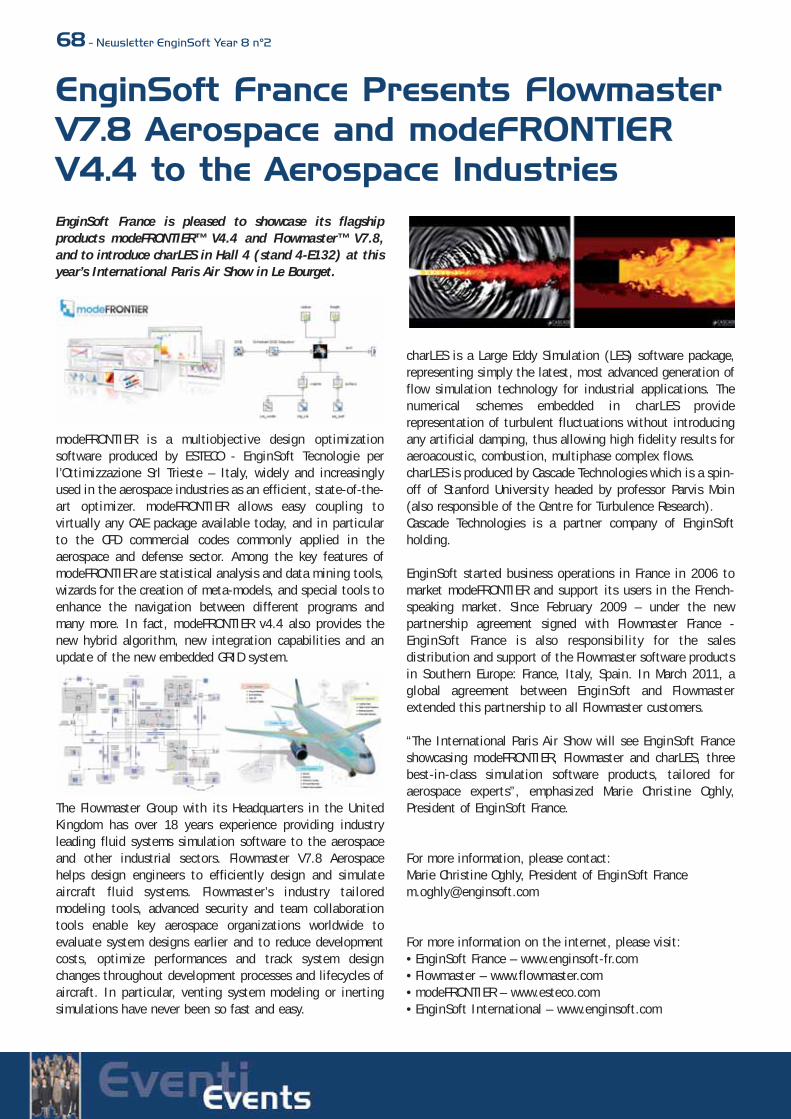
68 - Newsletter EnginSoft Year 8 n°2
EnginSoft France is pleased to showcase its flagshipproducts modeFRONTIER™ V4.4 and Flowmaster™ V7.8,and to introduce charLES in Hall 4 (stand 4-E132) at thisyear’s International Paris Air Show in Le Bourget.
modeFRONTIER is a multiobjective design optimizationsoftware produced by ESTECO - EnginSoft Tecnologie perl’Ottimizzazione Srl Trieste – Italy, widely and increasinglyused in the aerospace industries as an efficient, state-of-the-art optimizer. modeFRONTIER allows easy coupling tovirtually any CAE package available today, and in particularto the CFD commercial codes commonly applied in theaerospace and defense sector. Among the key features ofmodeFRONTIER are statistical analysis and data mining tools,wizards for the creation of meta-models, and special tools toenhance the navigation between different programs andmany more. In fact, modeFRONTIER v4.4 also provides thenew hybrid algorithm, new integration capabilities and anupdate of the new embedded GRID system.
The Flowmaster Group with its Headquarters in the UnitedKingdom has over 18 years experience providing industryleading fluid systems simulation software to the aerospaceand other industrial sectors. Flowmaster V7.8 Aerospacehelps design engineers to efficiently design and simulateaircraft fluid systems. Flowmaster’s industry tailoredmodeling tools, advanced security and team collaborationtools enable key aerospace organizations worldwide toevaluate system designs earlier and to reduce developmentcosts, optimize performances and track system designchanges throughout development processes and lifecycles ofaircraft. In particular, venting system modeling or inertingsimulations have never been so fast and easy.
charLES is a Large Eddy Simulation (LES) software package,representing simply the latest, most advanced generation offlow simulation technology for industrial applications. Thenumerical schemes embedded in charLES providerepresentation of turbulent fluctuations without introducingany artificial damping, thus allowing high fidelity results foraeroacoustic, combustion, multiphase complex flows. charLES is produced by Cascade Technologies which is a spin-off of Stanford University headed by professor Parvis Moin(also responsible of the Centre for Turbulence Research). Cascade Technologies is a partner company of EnginSoftholding.
EnginSoft started business operations in France in 2006 tomarket modeFRONTIER and support its users in the French-speaking market. Since February 2009 – under the newpartnership agreement signed with Flowmaster France -EnginSoft France is also responsibility for the salesdistribution and support of the Flowmaster software productsin Southern Europe: France, Italy, Spain. In March 2011, aglobal agreement between EnginSoft and Flowmasterextended this partnership to all Flowmaster customers.
“The International Paris Air Show will see EnginSoft Franceshowcasing modeFRONTIER, Flowmaster and charLES, threebest-in-class simulation software products, tailored foraerospace experts”, emphasized Marie Christine Oghly,President of EnginSoft France.
For more information, please contact: Marie Christine Oghly, President of EnginSoft [email protected]
For more information on the internet, please visit:• EnginSoft France – www.enginsoft-fr.com• Flowmaster – www.flowmaster.com• modeFRONTIER – www.esteco.com• EnginSoft International – www.enginsoft.com
EnginSoft France Presents FlowmasterV7.8 Aerospace and modeFRONTIERV4.4 to the Aerospace Industries

Newsletter EnginSoft Year 8 n°2 - 69
La seconda giornata del Wind Turbine Technology Forum 2011 haevidenziato come sia sempre più importante migliorarel’approccio alla progettazione delle turbine eoliche.
Venezia, 13 maggio 2011 - In fase di progettazione di turbine avento un approccio che si proponga diversi obiettivi può esseremolto importante per aiutare gli ingegneri a evitare l'errore didare priorità direttamente al prodotto, piuttosto che all'interoprocesso. Anche se questo è purtroppo un problema diffuso, èormai chiaro che qualsiasi fattore che accorcia i tempi dellaricerca, dei test e del processo di progettazione e di produzione,avrà un impatto importante sulla qualità globale. Questo èquanto è stato dichiarato da Silvia Poles di EnginSoft, inoccasione della seconda e conclusiva giornata WTT - WindTurbine Technology Forum 2011, la prima conferenza nelMediterraneo esclusivamente dedicata alla filiera manifatturieradelle turbine eoliche, che si è svolta nel Centro Congressidell’Arsenale di Venezia.Secondo quanto ha affermato Silvia Poles, è necessario prenderein considerazione, in un’unica ottica di ottimizzazione, tutte lediscipline e i parametri che intervengono nel processo diprogettazione delle turbine, in particolar modo l'uso di algoritmievolutivi come l’algoritmo genetico multiobiettivo. Sarebbeinoltre preferibile utilizzare un metodo di interpolazioneintelligente per avvicinarsi al miglior risultato possibile.Abbiamo analizzato la strategia di controllo più adatta perpiccole turbine eoliche in siti a bassa ventosità e perquantificare i vantaggi reali (in termini di ROI) derivantidall'adozione di sistemi di controllo e funzionamento a velocitàvariabile - ha spiegato Lorenzo Battisti dell’Università di Trento.Nella ricerca sono stati analizzati i vantaggi economici previstidall’aumento del diametro del rotore e, quindi, della superficiedi ingombro. I risultati preliminari hanno dimostrato l'efficaciaeconomica della progettazione di turbine eoliche con dischi piùgrandi, una strategia valida per migliorare la produzione dienergia, con piccoli costi aggiuntivi, in siti a bassa ventosità.Lorenzo Bianco di Peikko, infine, ha presentato la nuovasoluzione Eco per la protezione contro la corrosione delleturbine. Anche la pericolosa caratteristica della fragilità daidrogeno è stata sottoposta a ricerca. La fragilità da idrogeno èil processo attraverso il quale diversi metalli, soprattutto inacciaio ad alta resistenza (come l'acciaio utilizzato perl'ancoraggio delle torri delle turbine del vento) diventano fragilie possono rompersi in seguito all'esposizione a idrogeno. Questoè spesso il risultato dell’introduzione accidentale di idrogeno inmetalli sensibili, ad esempio durante le operazioni di finitura adalte temperature. Con Eco, abbinato all’utilizzo di bulloni ad altaresistenza, il problema è ora superato.Siamo molto soddisfatti di questa prima edizione di WTT, che hadimostrato di rispondere a un’esigenza di confronto eaggiornamento professionale molto diffusa in tutta la filieramanifatturiera delle turbine eoliche - ha dichiarato MarcoPinetti, presidente di Artenergy Publishing, la società
organizzatrice - WTT è destinato, quindi, a diventare unappuntamento fisso per tutti gli operatori di questo settore inforte evoluzione.
L’appuntamento con la prossima edizione di WTT - Wind TurbineTechnology Forum è a maggio 2012.
Ulteriori informazioni su WTT 2011 sono disponibili nel sitowww.windforum.pro http://www.windforum.pro/
Grande successo di WTT 2011
Il “Forge Italian Team” èpresente a Cannes per lo Users’Meeting 2011 di TransvalorCannes, 6-7 giugno 2011
Una nutrita rappresentativa di utenti italiani ha preso parteai primi di giugno alla Conferenza Internazionale degliutilizzatori del software Forge, che ha visto la presenza dioltre un centinaio di persone nella splendida cornice diCannes, Costa Azzurra. EnginSoft, distributore in esclusivadei prodotti di Transvalor per l’Italia, è stata pubblicamenteelogiata da Marc Antonicelli, general manager di Transvalor,per gli eccellenti risultati di vendita ottenuti nel 2010 e perla continua e proficua collaborazione, che dura ormai da 15anni. Nelle sessioni tecniche è stata presentata la release
2011 del software FORGE, ormai rilasciata, che migliora inmodo significativo l’efficienza del lavoro di preparazione edanalisi dei risultati (una release notes completa verràpubblicata nel prossimo numero della newsletter). Durante laserata di gala gli ospiti hanno avuto la possibilità dicimentarsi in una sfida tra i tavoli alla rolulette ed alblackjack, nella quale però l’”Italian Team” non ha avutomolta fortuna.
Come di consueto, EnginSoft da appuntamento a tutti gliinteressati il 21 ottobre a Verona, dove all’interno dellaInternational CAE Conference 2011 (www.caeconference.com)sarà organizzata una sessione dedicata, il “Forge Users’Meeting Italiano”, nel quale verranno riassunte le novitàdell’ultima release e sarà inoltre possibile assistere allepresentazioni di alcuni utilizzatori italiani.

70 - Newsletter EnginSoft Year 8 n°2
ITALY
EnginSoft is pleased to announce the next Seminars andWebinars. For more information, please contact:[email protected] visit www.enginsoft.com (Events)
19 July - Seminario Presso la Magneti Marelli di BolognaCome essere competitivi con l'utilizzo della simulazioneSeminar: How to stay competitive by using simulation!sedi/venue: Magneti Marelli, Bologna
20-21 October - EnginSoft International Conference 2011CAE Technologies for Industry and ANSYS Italian Conference Fiera Verona. Please stay tuned to www.caeconference.com for Italy’s premier conference on Engineering Simulationand one of the most important events of its kind globally!
The conference program will feature applications of CAE in:mechanics, industrial applications, structural engineering,optimization, manufacturing process simulation,computational fluid dynamics, emerging technologies,durability and fatigue, rapid and impact dynamics, CAD/CAEintegration, …
FRANCE
EnginSoft France 2011 Journées porte ouverte dans nos locaux à Paris et dans d’autres villes de France, encollaboration avec nos partenaires.Pour plus d'information visitez: www.enginsoft-fr.com, contactez: [email protected]
20-26 June - Salon du Le Bourget - Paris Air ShowLe Bourget, ParisTalk to our experts at the EnginSoft / Flowmaster booth!http://www.paris-air-show.com/en
28-29 June – Teratec Conference Ecole Polytechnique PalaiseauMeet us at the EnginSoft / Flowmaster booth!http://www.enginsoft-fr.com/events/index.html
12 October - User Group Meeting modeFRONTIER France Paris. http://www.enginsoft-fr.com/events/index.html
13 October - User Group Meeting Flowmaster France Paris. http://www.enginsoft-fr.com/events/index.html
GERMANY
Please stay tuned to: www.enginsoft-de.comContact: [email protected] for more information.
modeFRONTIER Seminars 2011EnginSoft GmbH, Frankfurt am Main
Attend our regular Webinars and Seminars to learn more on how design optimization withmodeFRONTIER can enhance your product developmentprocesses!
Seminars Process Product Integration. EnginSoft GmbH,Frankfurt am Main. How to innovate and improve yourproduction processes!Seminars hosted by EnginSoft Germany and EnginSoft Italy
SPAIN
Programa de cursos de modeFRONTIER and other localeventsPlease contact our partner, APERIO Tecnología:[email protected] tuned to: www.aperiotec.es
21-30 June ESAComp eTrainingIntroduction to Design of Composite Structures withESAComp Software. Web-based training course Componeering offers an e-learning course for compositestructures design with ESAComp software. Web-based trainingis an effective and cost-efficient way to get started with theuse of ESAComp. Live training can be followed withoutleaving the desk.For more information, please contact: Juan Lorenzo,[email protected]
SWEDEN
2011 Training Courses on modeFRONTIER - Drive yourdesigns from good to GREAT. EnginSoft Nordic office in Lund, SwedenThe Training Courses are focused on optimization, bothmulti- and single-objective, process automation andinterpretation of results. Participants will learn differentoptimization strategies in order to complete a projectwithin a specified time and simulation budget. Other topics, such as design of experiments, meta modelingand robust design are introduced, as well. The two daytraining consists of a mix of theoretical sessions andworkshops.• 11-12 August• 5-6 September • 4-5 October • 2-3 November • 1-2 December To discuss your needs, for more information and to register,please contact EnginSoft Nordic: [email protected]
EnginSoft Event Calendar

Newsletter EnginSoft Year 8 n°2 - 71UKThe workshops are designed to give delegates a goodappreciation of the functionality, application and benefitsof modeFRONTIER. The workshops include an informal blendof presentation plus ‘hands-on’ examples with the objectiveof enabling delegates to be confident to evaluatemodeFRONTIER for their applications using a trial license atno cost.
modeFRONTIER Workshops Warwick Digital Laboratory, Warwick University • 17 August• 14 September • 13 October• 22 November • 14 December
modeFRONTIER Workshops with InfoWorks CSWarwick Digital Laboratory • 20 July • 9 November
Please register for free on www.enginsoft-uk.com Multi-Disciplinary Optimisation Training CourseInternational Digital Lab, Warwick University• 16-17 May • 6-7 September
For more information and to register, please visitwww.enginsoft-uk.comContact: Bipin Patel, [email protected]
14-16 July – GECCO 2011 Genetic and EvolutionaryComputation Conference. Dublin, Ireland EnginSoft will be presenting on 15 Julyhttp://www.sigevo.org/gecco-2011/ecp.html
USA Courses and Webinars on Design Optimization withmodeFRONTIER.Sunnyvale, CA For more information, please contact:[email protected]
EUROPE, VARIOUS LOCATIONS
modeFRONTIER Academic TrainingPlease note: These Courses are for Academic users only. TheCourses provide Academic Specialists with the fastest routeto being fully proficient and productive in the use ofmodeFRONTIER for their research activities. The coursescombine modeFRONTIER Fundamentals and AdvancedOptimization Techniques. For more information, please contact Rita Podzuna,[email protected]
To meet with EnginSoft at any of the above events, pleasecontact us: [email protected]
12th International SummerSchool on Aluminum AlloyTechnologyLight Alloys Casting: from Innovative Design toAdvanced Application - 25th-29th July – Vicenza
The 2011 International Summer School is a joint effortamong NTNU (Norway), WPI (USA)and DTG (Italy). The school has previously been offered inTrondheim, Norway and Worcester, USA. Topics concerninglight alloys solidification and processing have beentraditionally debated during Summer School, but this yearthe focus will be on the path to be followed frominnovative design to advanced applications in order tomake light alloys castings suitable to sustain thechallenges of product reliability, industrialcompetitiveness and technological sustainability.As demonstrated by recent Integrated Research Projects,such challenges require, from light alloyscasting industry, innovative and integrated approachesbased on:• metallurgy fundamentals;• process modeling and simulation;• knowledge of conventional and innovative treatments
and processing solutions;• availability of advanced criteria and tools for casting
and component design.
The Panel of Lecturers is very qualified, and includes Diran Apelian, MPI, Worcester Polytechnic Institute, USALars Arnberg, NTNU, University of Trondheim, NorwayFranco Bonollo, DTG, University of Padova, ItalyDiego Cacciatore, Automobili Lamborghini S.p.AArne Dahle, University of Queensland, AustraliaPaolo Ferro, DTG, University of Padova, ItalyAlois Franke, Aluminium Rheinfelden, GermanyNicola Gramegna, EnginSoft, Padova, ItalyLindsay Greer, Cambridge University, UKKarl Kainer, GKSS Forschungszentrum Geesthacht, GermanyLothar Kallien, GTA, University of Applied Science, Aalen,GermanyJohn Jorstad, JLJ Technologies, USAClaudio Mus, Consultant, ItalyRodney Riek, Harley-Davidson Motor CompanyGiulio Timelli, DTG, University of Padova, ItalyDavid Weiss, Eck Industries, USA
The School will be held at the Department of Managementand Engineering in Vicenza (DTG, www.gest.unipd.it), atown in the North-East of Italy (30 min by train fromVenice, less than 2 hours by train from Milan).
For further information, visit: http://static.gest.unipd.it/iss12/home.html

ENGINSOFT INTERNATIONAL
CAE TECHNOLOGIES FOR INDUSTRYCONFERENCE 2011
CONFERENCE 2011ANSYS ITALIAN
®
www.caeconference.com
20-21 OCTOBER
VERONA -IT
®GOLD SPONSORS
Two major events coming
together for the most significant
occasion in the Italian CAE Calendar