2021 radio ratings tool kit - gfk
TRANSCRIPT

Level 6, 157 Walker St, North Sydney, NSW 2060 T +61 2 9900 2888 F +61 2 9900 2828 W www.gfk.com/home © GfK
2021
RADIO RATINGS TOOL KIT

Level 6, 157 Walker St, North Sydney, NSW 2060 T +61 2 9900 2888 F +61 2 9900 2828 W www.gfk.com/home © GfK
The 2021 Tool Kit provides all the information you require regarding the GfK radio ratings.
You can click on each link below to move straight to that section and select the GfK logo to return to this contents page.
• The GfK radio team • 2021 survey schedule • 2021 radio reporting periods • 2021 rolling radio schedule - metropolitan • 2021 rolling radio schedule - regional • Survey area maps
- Sydney - Melbourne - Brisbane - Adelaide - Perth - Newcastle - Canberra - Gold Coast/Tweed Heads
• Metropolitan population potentials
• Regional population potentials
• 2021 radio ratings training calendar
• Occupation classifications
• 2021 lifestyle categories
• Radio ratings glossary
• Accessing and sourcing radio ratings
• How the ratings are collected
• Commercial Radio Australia
CONTENTS

Level 6, 157 Walker St, North Sydney, NSW 2060 T +61 2 9900 2888 F +61 2 9900 2828 W www.gfk.com/home © GfK
For additional support, please call the GfK helpdesk on
1800 097 713
Or send an email to [email protected]
Dr Morten Boyer Managing Director, ANZ
Email: [email protected] Mobile: 0430 305 662
Deb Hishon Media Measurement Director, ANZ
Email: [email protected] Mobile: 0415 670 350
Sian Gillen Account Director, Radio
Email: [email protected] Mobile: 0417 257 021
Ann-Maree Nolan Account Director, Radio
Email: [email protected] Mobile: 0413 585 332
Jack Burton Data Services Executive Email: [email protected]
THE GfK RADIO TEAM
Level 6, 157 Walker St, North Sydney, NSW 2060 T +61 2 9900 2888 F +61 2 9900 2828 W www.gfk.com/home © GfK
Wee
k no
Sydney Melbourne Brisbane Adelaide Perth Newcastle Canberra Gold Coast
27 2
1 Jan 3 9
2 10 16
3 17 23
4 24 30
5 31 Feb 6
6 Feb 7 13
7 14 20
8 21 27
9 28 Mar 6
10 Mar 7 13
11 14 20
12 21 27
13 28 Apr 3 S1: Apr 14
14 Apr 4 10
15 11 17
16 18 24
17 25 May 1 S1: May 14 S1: May 13
18 May 2 8
19 9 15
20 16 22
21 23 29
22 30 Jun 5
23 Jun 6 12
24 13 19
25 20 26 S2: Jul 7
26 27 Jul 3
27 Jul 4 10
28 11 17
29 18 24
30 25 31 S2: Aug 12
31 Aug 1 Aug 7 S2: Aug 20
32 8 1433 15 2134 22 2835 29 Sep 436 Sep 5 1137 12 18 S3: Sept 29
38 19 2539 26 Oct 240 Oct 3 941 10 1642 17 2343 24 3044 31 Nov 6 S3: Nov 18
45 Nov 7 13 S3: Nov 26
46 14 2047 21 27
48 28 Dec 4
49 Dec 5 11
50 12 18 Metropolitan Release51 19 25 Survey #1 Thu Mar 11 Survey #3 Tue Jun 1 Survey #5 Tue Aug 24 Survey #7 Tue Nov 9
Easter Weekend Survey #2 Thu Apr 15 Survey #4 Tue Jul 6 Survey #6 Tue Sept 28 Survey #8 Tue Dec 14
School Holidays
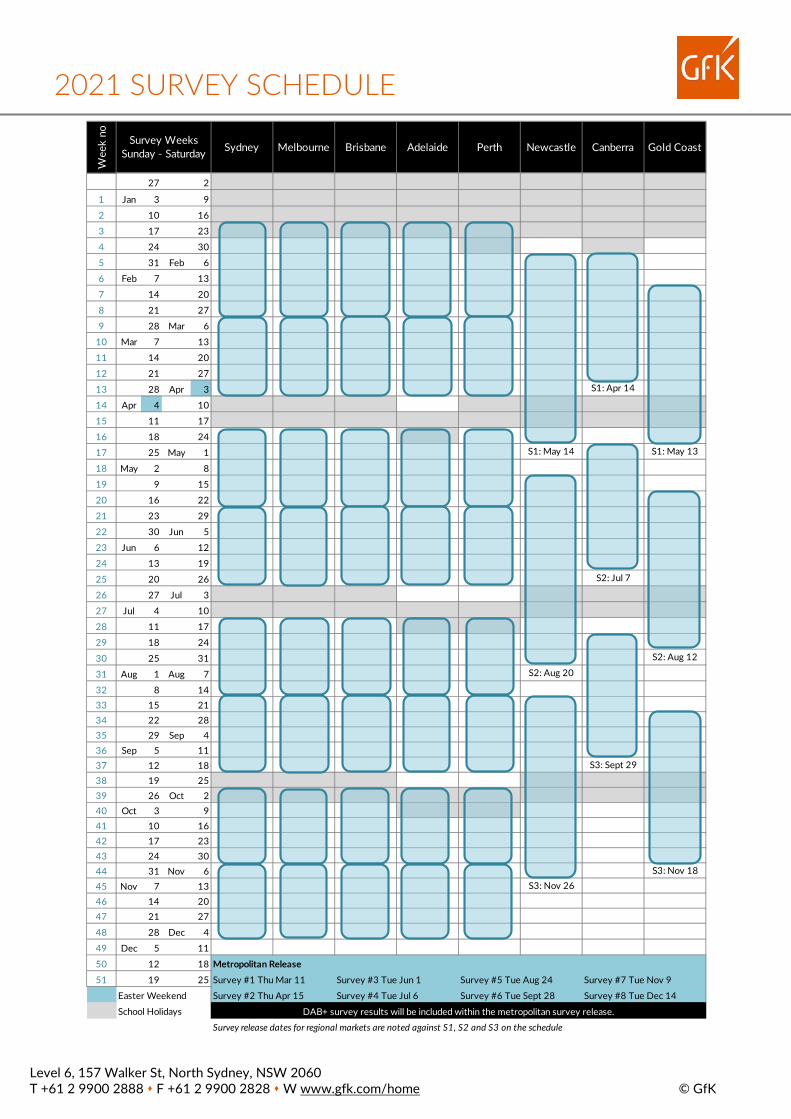
Survey release dates for regional markets are noted against S1, S2 and S3 on the schedule
Survey Weeks Sunday - Saturday
DAB+ survey results will be included within the metropolitan survey release.
2021 SURVEY SCHEDULE

Level 6, 157 Walker St, North Sydney, NSW 2060 T +61 2 9900 2888 F +61 2 9900 2828 W www.gfk.com/home © GfK
SYDNEY, MELBOURNE, BRISBANE, ADELAIDE & PERTH S1 Jan 17 to Feb 27 Thu Mar 11
S2 Feb 7 to Feb 27 & Feb 28 to Apr 3 Thu Apr 15
S3 Feb 28 to Apr 3 & Apr 18 to May 22 Tue Jun 1
S4 Apr 18 to Jun 26 Tue Jul 6
S5 May 23 to Jun 26 & Jul 11 to Aug 14 Tue Aug 24
S6 Jul 11 to Sept 18 Tue Sept 28
S7 Aug 15 to Sept 18 & Sept 26 to Oct 30 Tue Nov 9
S8 Sept 26 to Dec 4 Tue Dec 14
NEWCASTLE (Blind) S1 Jan 31 to Apr 24 Fri May 14
S2 Second half of S1 & May 9 to Jul 31 Fri Aug 20
S3 May 9 to Jul 31 & Aug 15 to Nov 6 Fri Nov 26
CANBERRA S1 Jan 31 to Mar 27 Wed Apr 14
S2 Feb 28 to Mar 27 & Apr 25 to Jun 19 Wed Jul 7
S3 Apr 25 to Jun 19 & Jul 18 to Sept 11 Wed Sept 29
GOLD COAST / TWEED HEADS S1 Feb 14 to Apr 24 Thu May 13
S2 Mar 21 to Apr 24 & May 16 to Jul 24 Thu Aug 12
S3 May 16 to Jul 24 & Aug 22 to Oct 30 Thu Nov 18
Please note: survey release dates are staggered to allow for the different dynamics and logistic requirements of each market.
UNDERSTANDING BLIND SURVEYS A non blind survey (rolling or otherwise) has a fixed and known survey period where the sample is placed evenly across the survey weeks. For blind surveys, the ‘in’ survey period is fixed and known to the market (12 week periods for Newcastle). The actual eight weeks of placement, from the published 12, are selected at random and the dates withheld from the market, i.e. they are not aware the weeks the sample is being placed, hence the term ‘blind’.
2021 RADIO REPORTING PERIODS
Level 6, 157 Walker St, North Sydney, NSW 2060 T +61 2 9900 2888 F +61 2 9900 2828 W www.gfk.com/home © GfK
Wee
k no
Waves Survey 1(Thu Mar 11)
Survey 2(Thu Apr 15)
Survey 3(Tue Jun 01)
Survey 4(Tue Jul 06)
Survey 5(Tue Aug 24)
Survey 6(Tue Sept 28)
Survey 7(Tue Nov 09)
Survey 8(Tue Dec 14)
27 21 Jan 3 92 10 16
3 17 23
4 24 30
5 31 Feb 6
6 Feb 7 13
7 14 20
8 21 27
9 28 Mar 6
10 Mar 7 13
11 14 20
12 21 27
13 28 Apr 3
14 Apr 4 10
15 11 17
16 18 24
17 25 May 1
18 May 2 8
19 9 15
20 16 22
21 23 29
22 30 Jun 5
23 Jun 6 12
24 13 19
25 20 26
26 27 Jul 3
27 Jul 4 10
28 11 17
29 18 24
30 25 31
31 Aug 1 Aug 7
32 8 14
33 15 21
34 22 28
35 29 Sep 4
36 Sep 5 11
37 12 18
38 19 25
39 26 Oct 2
40 Oct 3 9
41 10 16
42 17 23
43 24 30
44 31 Nov 6
45 Nov 7 13
46 14 20
47 21 27
48 28 Dec 4
49 Dec 5 11
50 12 18
51 19 25Easter Weekend
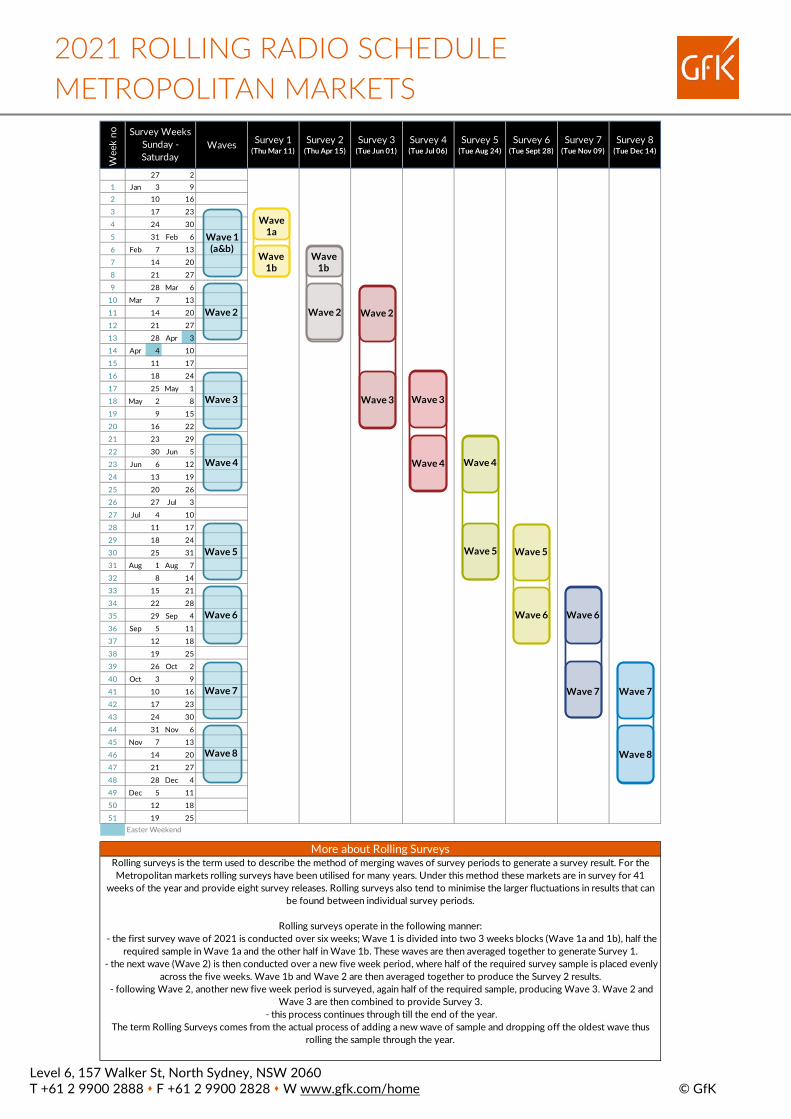
More about Rolling SurveysRolling surveys is the term used to describe the method of merging waves of survey periods to generate a survey result. For the Metropolitan markets rolling surveys have been utilised for many years. Under this method these markets are in survey for 41
weeks of the year and provide eight survey releases. Rolling surveys also tend to minimise the larger fluctuations in results that can be found between individual survey periods.
Rolling surveys operate in the following manner: - the first survey wave of 2021 is conducted over six weeks; Wave 1 is divided into two 3 weeks blocks (Wave 1a and 1b), half the
required sample in Wave 1a and the other half in Wave 1b. These waves are then averaged together to generate Survey 1. - the next wave (Wave 2) is then conducted over a new five week period, where half of the required survey sample is placed evenly
across the five weeks. Wave 1b and Wave 2 are then averaged together to produce the Survey 2 results. - following Wave 2, another new five week period is surveyed, again half of the required sample, producing Wave 3. Wave 2 and
Wave 3 are then combined to provide Survey 3. - this process continues through till the end of the year.
The term Rolling Surveys comes from the actual process of adding a new wave of sample and dropping off the oldest wave thus rolling the sample through the year.
Survey Weeks Sunday - Saturday
Wave 1(a&b)
Wave 2
Wave 3
Wave 4
Wave 5
Wave 6
Wave 7
Wave 8 Wave 8
Wave 7 Wave 7
Wave 6 Wave 6
Wave 5 Wave 5
Wave 4 Wave 4
Wave 3 Wave 3
Wave 2 Wave 2
Wave 1b
Wave 1a
Wave 1b
2016 ROLLING RADIO SCHEDULE METROPOLITAN REGION
2021 ROLLING RADIO SCHEDULE METROPOLITAN MARKETS

Level 6, 157 Walker St, North Sydney, NSW 2060 T +61 2 9900 2888 F +61 2 9900 2828 W www.gfk.com/home © GfK
Wee
k no
Newcastle Survey 1
N: Fri May 14
Survey 2N: Fri Aug
20
Survey 3N: Fri Nov
26Canberra
Survey 1C: Wed Apr
14
Survey 2C: Wed Jul
07
Survey 3C: Wed Sept 29
Gold Coast / Tweed
Survey 1GC: Thu May 13
Survey 2GC: Thu Aug 12
Survey 3GC: Thu Nov 18
27 21 Jan 3 92 10 16
3 17 23
4 24 30
5 31 Feb 6
6 Feb 7 13
7 14 20
8 21 27
9 28 Mar 6
10 Mar 7 13
11 14 20
12 21 27
13 28 Apr 3
14 Apr 4 10
15 11 17
16 18 24
17 25 May 1
18 May 2 8
19 9 15
20 16 22
21 23 29
22 30 Jun 5
23 Jun 6 12
24 13 19
25 20 26
26 27 Jul 3
27 Jul 4 10
28 11 17
29 18 24
30 25 31
31 Aug 1 Aug 7
32 8 14
33 15 21
34 22 28
35 29 Sep 4
36 Sep 5 11
37 12 18
38 19 25
39 26 Oct 2
40 Oct 3 9
41 10 16
42 17 23
43 24 30
44 31 Nov 6
45 Nov 7 13
46 14 20
47 21 27
48 28 Dec 4
49 Dec 5 11
50 12 18
51 19 25
Easter Weekend
Survey Weeks Sunday - Saturday
Rolling surveys is the term used to describe the method of merging waves of survey periods to generate a survey result. In 2021, Newcastle will be in survey for 36 weeks of the year, Gold Coast for 30 weeks and Canberra for 24 weeks. All three markets will have three survey releases.
Newcastle Blind Rolling surveys operate in the following manner: - the first survey wave of 2021 is conducted over a 12 week period; GfK then selects eight weeks within the wave without informing the market of the selected dates, this is why it is
called a blind survey. A full sample is placed evenly over these eight weeks and they are then combined to generate Survey 1. - the next wave (Wave 2) is then conducted over a new 12 week period, where half of the required survey is placed evenly across 8 blind weeks. The last four weeks of Wave 1 and
Wave 2 are then combined to produce the Survey 2. - following Wave 2, another new 12 week period is surveyed across 8 blind weeks, again half of the required survey, producing Wave 3. Wave 2 and Wave 3 are then combined to
produce Survey 3.
Gold Coast and Canberra Rolling Survey operates in the following manner: - the first survey wave of 2021 is conducted over 10 weeks for Gold Coast, divided into two five week periods (Wave 1a and 1b), and 8 weeks for Canberra, divided into two four
week periods. A full sample is placed evenly across Wave 1a and 1b in this wave. The weeks are then averaged to producte Survey 1. - the next wave (Wave 2) is then conducted over a new 10 week period for Gold Coast and 8 week period for Canberra, where half of the required sample is placed. Then Wave 1b
and Wave 2 are averaged to provide Survey 2. - the final wave (Wave 3) is conducted over a new 10 week period for Gold Coast and 8 week period for Canberra, again half the required sample is placed. Wave 2 and Wave 3
are averaged to provide Survey 3.
The term Rolling Surveys comes from the actual process of adding a new wave of sample and dropping off the oldest wave thus rolling the sample through the year.
More about Rolling Surveys
Wave 2
Wave 2(8 blind from 12
wks surveyed)
Wave 1(8 blind from 12
wks surveyed)
Wave 1(last 4wks surveyed)
Wave 3(8 blind from 12
wks surveyed)
Wave 2(8 blind from 12
wks surveyed)
Wave 3
Wave 2
Wave 1
Wave 1(a&b)
Wave 2
Wave 3
Wave 1a
Wave 1b Wave 1b
Wave 2
Wave 3
Wave 1(a&b)
Wave 2
Wave 3
Wave 1a
Wave 1b
Wave 2
Wave 1b
Wave 2
Wave 3
2016 ROLLING RADIO SCHEDULE METROPOLITAN REGION
2021 ROLLING RADIO SCHEDULE NEWCASTLE, CANBERRA AND GOLD COAST

Level 6, 157 Walker St, North Sydney, NSW 2060 T +61 2 9900 2888 F +61 2 9900 2828 W www.gfk.com/home © GfK
Sydney Regions 1 North 2 Central & Inner
West 3 South 4 South West 5 West
SURVEY AREA MAPS
SYDNEY
Jun Jun

Level 6, 157 Walker St, North Sydney, NSW 2060 T +61 2 9900 2888 F +61 2 9900 2828 W www.gfk.com/home © GfK
Sydney Statistical Areas
Statistical Areas Population 0+
Percent 0+
Interviewing Areas Statistical Areas Population
0+ Percent
0+ Interviewing
Areas 1. North 4. South West
Baulkham Hills (partial) 25,499 0.5% 1 Auburn 712 0.0% 0
Carlingford 8,577 0.2% 0 Bankstown 185,204 3.5% 7
Chatswood - Lane Cove 123,703 2.3% 5 Blue Mountains - South 4 0.0% 0
Dural - Wisemans Ferry 12,977 0.2% 0 Bringelly - Green Valley 124,629 2.3% 5
Gosford 176,959 3.3% 7 Camden 71,720 1.4% 3
Hornsby 86,614 1.6% 3 Campbelltown (NSW) 172,433 3.2% 7
Ku-ring-gai 127,477 2.4% 5 Canterbury (partial) 8,755 0.2% 0
Manly 46,042 0.9% 2 Fairfield 195,781 3.7% 7
North Sydney - Mosman 103,564 1.9% 4 Illawarra Catchment Reserve 5 0.0% 0
Pennant Hills - Epping 43,345 0.8% 2 Liverpool 131,825 2.5% 5
Pittwater 64,567 1.2% 2 Merrylands - Guildford 37,259 0.7% 1
Ryde - Hunters Hill 146,868 2.8% 6 Penrith (partial) 6,594 0.1% 0
Warringah 162,890 3.1% 6 Wollondilly 45,129 0.8% 2
Wyong 167,057 3.1% 6 Wollongong 278 0.0% 0
1. North Total 1,296,139 24.4% 49 4. South West Total 980,328 18.5% 37
2. Central & Inner West 5. West
Bankstown 1,663 0.0% 0 Auburn 104,019 2.0% 4
Botany (partial) 7 0.0% 0 Baulkham Hills 129,582 2.4% 5
Canada Bay 93,248 1.8% 4 Blacktown 145,065 2.7% 5 Canterbury (partial) 1,505 0.0% 0 Blacktown - North 113,109 2.1% 4 Eastern Suburbs - North 139,415 2.6% 5 Blue Mountains 79,002 1.5% 3 Eastern Suburbs - South 155,639 2.9% 6 Carlingford 66,006 1.2% 3
Leichhardt 61,510 1.2% 2 Dural - Wisemans Ferry (partial) 14,764 0.3% 1
Marrickville - Sydenham - Petersham 59,889 1.1% 2 Fairfield (partial) 1,898 0.0% 0
Strathfield - Burwood - Ashfield 153,065 2.9% 6 Hawkesbury 25,503 0.5% 1
Sydney Inner City 253,736 4.8% 10 Merrylands - Guildford 129,668 2.4% 5
2. Central & Inner West Total 919,677 17.3% 35 Mount Druitt 119,106 2.2% 4
3. South Parramatta 157,064 2.9% 6
Botany 54,631 1.0% 2 Pennant Hills – Epping (partial) 10,390 0.2% 0
Canterbury 136,484 2.6% 5 Penrith 147,224 2.8% 6 Cronulla - Miranda - Caringbah 118,001 2.2% 4 Richmond - Windsor 37,768 0.7% 1
Hurstville 138,359 2.6% 5 Rouse Hill - McGraths Hill 43,152 0.8% 2
Kogarah - Rockdale 154,889 2.9% 6 Ryde - Hunters Hill (partial) 4,306 0.1% 0
Liverpool (partial) 623 0.0% 0 St Marys 56,907 1.1% 2 Strathfield - Burwood – Ashfield (partial) 16,598 0.3% 1 5. West Total 1,384,533 26.1% 52
Sutherland - Menai - Heathcote 112,181 2.1% 4 Sydney Total 5,312,443 100.0% 200
3. South Total 731,766 13.8% 27
SURVEY AREA MAPS
Level 6, 157 Walker St, North Sydney, NSW 2060 T +61 2 9900 2888 F +61 2 9900 2828 W www.gfk.com/home © GfK
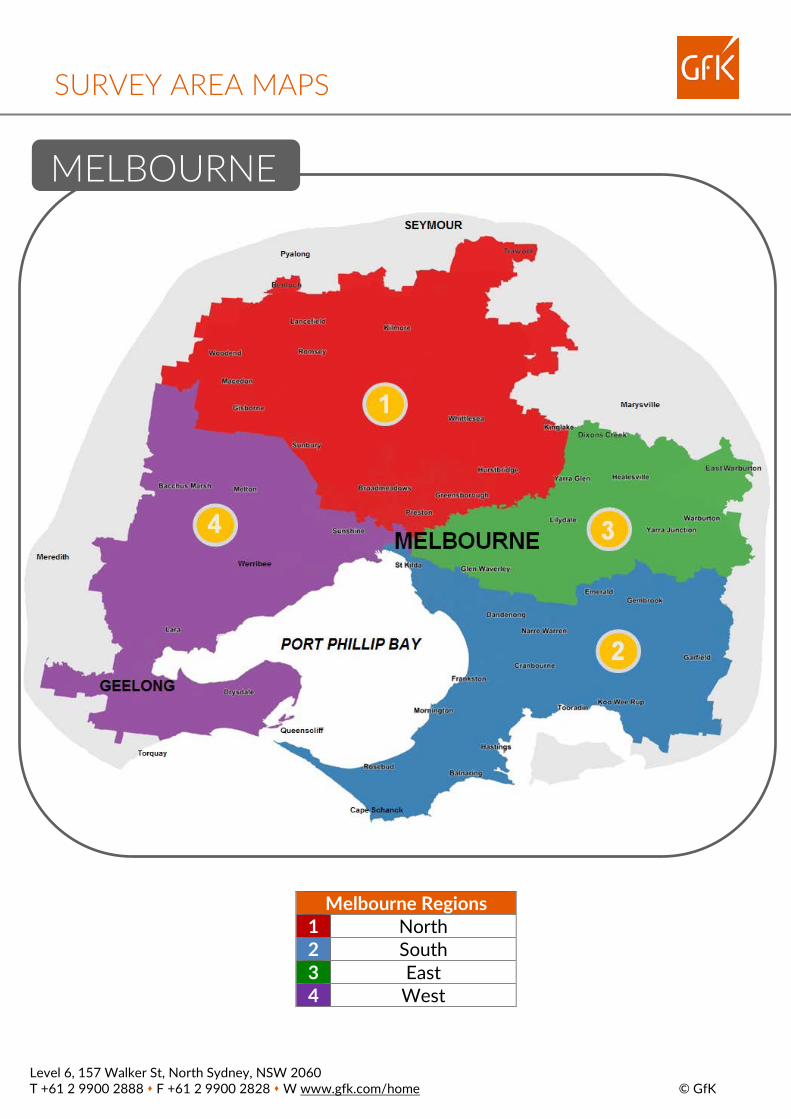
Melbourne Regions 1 North 2 South 3 East 4 West
MELBOURNE
SURVEY AREA MAPS
Level 6, 157 Walker St, North Sydney, NSW 2060 T +61 2 9900 2888 F +61 2 9900 2828 W www.gfk.com/home © GfK
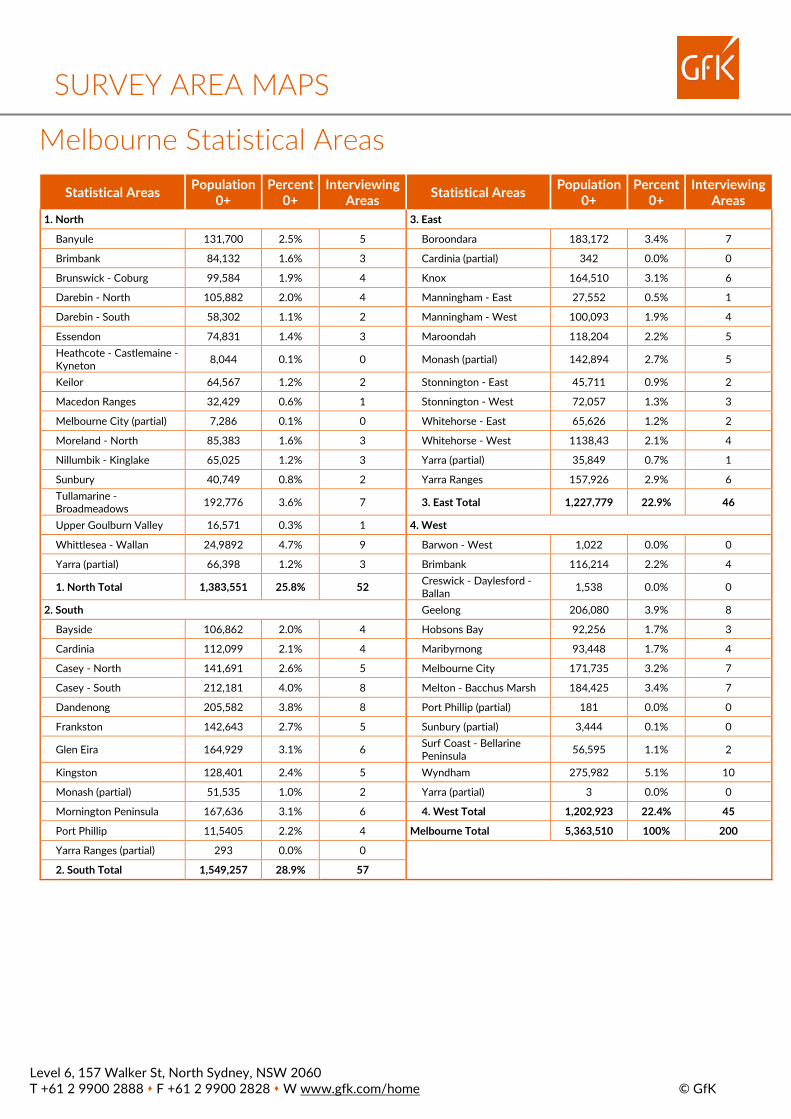
Melbourne Statistical Areas Statistical Areas Population
0+ Percent
0+ Interviewing
Areas Statistical Areas Population 0+
Percent 0+
Interviewing Areas
1. North 3. East
Banyule 131,700 2.5% 5 Boroondara 183,172 3.4% 7
Brimbank 84,132 1.6% 3 Cardinia (partial) 342 0.0% 0
Brunswick - Coburg 99,584 1.9% 4 Knox 164,510 3.1% 6
Darebin - North 105,882 2.0% 4 Manningham - East 27,552 0.5% 1
Darebin - South 58,302 1.1% 2 Manningham - West 100,093 1.9% 4
Essendon 74,831 1.4% 3 Maroondah 118,204 2.2% 5 Heathcote - Castlemaine - Kyneton 8,044 0.1% 0 Monash (partial) 142,894 2.7% 5
Keilor 64,567 1.2% 2 Stonnington - East 45,711 0.9% 2
Macedon Ranges 32,429 0.6% 1 Stonnington - West 72,057 1.3% 3
Melbourne City (partial) 7,286 0.1% 0 Whitehorse - East 65,626 1.2% 2
Moreland - North 85,383 1.6% 3 Whitehorse - West 1138,43 2.1% 4
Nillumbik - Kinglake 65,025 1.2% 3 Yarra (partial) 35,849 0.7% 1
Sunbury 40,749 0.8% 2 Yarra Ranges 157,926 2.9% 6 Tullamarine - Broadmeadows 192,776 3.6% 7 3. East Total 1,227,779 22.9% 46
Upper Goulburn Valley 16,571 0.3% 1 4. West
Whittlesea - Wallan 24,9892 4.7% 9 Barwon - West 1,022 0.0% 0
Yarra (partial) 66,398 1.2% 3 Brimbank 116,214 2.2% 4
1. North Total 1,383,551 25.8% 52 Creswick - Daylesford - Ballan 1,538 0.0% 0
2. South Geelong 206,080 3.9% 8
Bayside 106,862 2.0% 4 Hobsons Bay 92,256 1.7% 3
Cardinia 112,099 2.1% 4 Maribyrnong 93,448 1.7% 4
Casey - North 141,691 2.6% 5 Melbourne City 171,735 3.2% 7
Casey - South 212,181 4.0% 8 Melton - Bacchus Marsh 184,425 3.4% 7
Dandenong 205,582 3.8% 8 Port Phillip (partial) 181 0.0% 0
Frankston 142,643 2.7% 5 Sunbury (partial) 3,444 0.1% 0
Glen Eira 164,929 3.1% 6 Surf Coast - Bellarine Peninsula 56,595 1.1% 2
Kingston 128,401 2.4% 5 Wyndham 275,982 5.1% 10
Monash (partial) 51,535 1.0% 2 Yarra (partial) 3 0.0% 0
Mornington Peninsula 167,636 3.1% 6 4. West Total 1,202,923 22.4% 45
Port Phillip 11,5405 2.2% 4 Melbourne Total 5,363,510 100% 200
Yarra Ranges (partial) 293 0.0% 0
2. South Total 1,549,257 28.9% 57
SURVEY AREA MAPS

Level 6, 157 Walker St, North Sydney, NSW 2060 T +61 2 9900 2888 F +61 2 9900 2828 W www.gfk.com/home © GfK
Sydney Regions 1 North 2 Central & Inner
West 3 South 4 South West 5 West
Brisbane Regions 1 East 2 West 3 South 4 City & City North 5 North
SURVEY AREA MAPS
BRISBANE

Level 6, 157 Walker St, North Sydney, NSW 2060 T +61 2 9900 2888 F +61 2 9900 2828 W www.gfk.com/home © GfK
Brisbane Statistical Areas Statistical Areas Population
0+ Percent
0+ Interviewing
Areas Statistical Areas Population 0+
Percent 0+
Interviewing Areas
1. East 4. City & City North Brisbane Inner - East 45,445 1.9% 3 Brisbane Inner 83,681 3.4% 6 Capalaba 76,185 3.1% 5 Brisbane Inner - North 99,065 4.1% 7 Carindale 40,907 1.7% 3 Brisbane Inner - West 43,702 1.8% 3
Cleveland - Stradbroke 91,508 3.8% 6 Holland Park – Yeronga (partial) 8,516 0.4% 1
Holland Park - Yeronga 71,297 2.9% 5 Nundah 1,532 0.1% 0 Mt Gravatt (partial) 3,092 0.1% 0 The Gap - Enoggera 54,207 2.2% 3 Nathan 23,065 0.9% 2 4. City & City North Total 290,703 12.0% 20 Wynnum - Manly 73,900 3.0% 5 5. North 1. East Total 425,399 17.5% 29 Bald Hills - Everton Park 44,986 1.9% 3 2. West Bribie - Beachmere 36,114 1.5% 3 Brisbane Inner – West (partial) 18,472 0.8% 1 Caboolture 74,983 3.1% 5
Centenary 33,987 1.4% 2 Caboolture Hinterland 8738 0.4% 1 Forest Lake - Oxley 78,625 3.2% 6 Chermside 75,379 3.1% 5 Ipswich Hinterland 3,389 0.1% 0 Hills District 91,999 3.8% 6 Ipswich Inner 114,753 4.7% 8 Narangba - Burpengary 67,777 2.8% 5 Kenmore - Brookfield - Moggill 48,161 2.0% 3 North Lakes 88,070 3.6% 6
Sherwood - Indooroopilly 56,840 2.3% 4 Nundah 41,846 1.7% 3 Springfield - Redbank 101,433 4.2% 7 Redcliffe 62,602 2.6% 4 The Gap - Enoggera 0 0.0% 0 Sandgate 60,554 2.5% 4 2. West Total 455,660 18.8% 31 Strathpine 39,040 1.6% 3 3. South 5. North Total 692,088 28.5% 48 Beaudesert 3,536 0.1% 0 Brisbane Total 2,430,080 100.0% 167 Beenleigh 40,733 1.7% 3 Browns Plains 87,756 3.6% 6 Carindale 14,263 0.6% 1 Gold Coast Hinterland 3,652 0.2% 0 Ipswich Hinterland (partial) 331 0.0% 0 Jimboomba 55,843 2.3% 4 Loganlea - Carbrook 64,768 2.7% 4 Mt Gravatt 75,738 3.1% 5 Nathan (partial) 19,383 0.8% 1 Rocklea - Acacia Ridge 66,232 2.7% 5 Springwood - Kingston 80,284 3.3% 6 Sunnybank 53,711 2.2% 4 3. South Total 566,230 23.3% 39
SURVEY AREA MAPS
Level 6, 157 Walker St, North Sydney, NSW 2060 T +61 2 9900 2888 F +61 2 9900 2828 W www.gfk.com/home © GfK
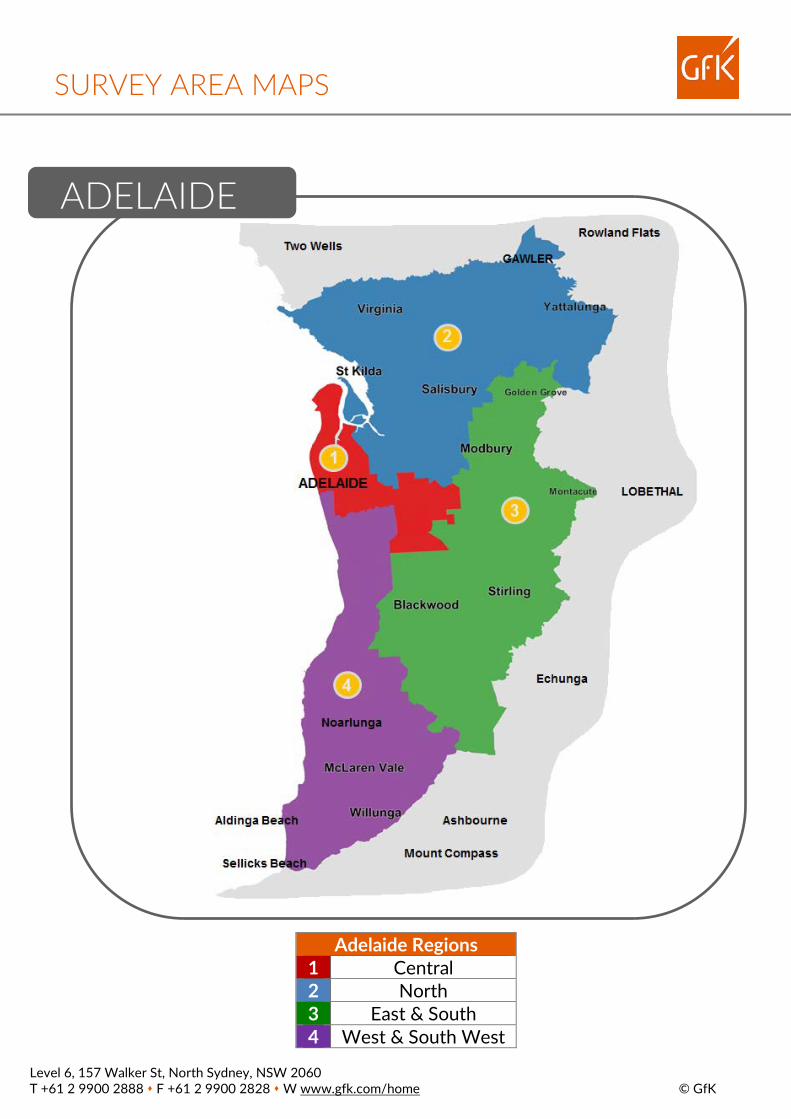
Adelaide Regions 1 Central 2 North 3 East & South 4 West & South West
SURVEY AREA MAPS
ADELAIDE

Level 6, 157 Walker St, North Sydney, NSW 2060 T +61 2 9900 2888 F +61 2 9900 2828 W www.gfk.com/home © GfK
Adelaide Statistical Areas Statistical Areas Population
0+ Percent
0+ Interviewing
Areas Statistical Areas Population 0+
Percent 0+
Interviewing Areas
1. Central 4. West & South West
Adelaide City 25,456 2.0% 3 Charles Sturt 15,148 1.2% 2
Charles Sturt 100,616 7.8% 11 Holdfast Bay 35,641 2.8% 4 Norwood - Payneham - St Peters 37,056 2.9% 4 Marion 95,027 7.3% 11
Port Adelaide - West 40,856 3.2% 5 Onkaparinga 130,592 10.1% 15
Prospect - Walkerville 29,520 2.3% 3 Port Adelaide – West (partial)
3 0.0% 0
Unley 39,208 3.0% 5 West Torrens 64,075 4.9% 6
1. Central Total 272,712 21.0% 31 4. West & South West Total
340,486 26.3% 38
2. North Adelaide Total 1,295,645 100.0% 146
Gawler - Two Wells 24,693 1.9% 3
Playford 95,598 7.4% 11
Port Adelaide - East 69,941 5.4% 8
Port Adelaide - West 19,138 1.5% 2
Salisbury 139,952 10.8% 16
Tea Tree Gully (partial) 867 0.1% 0
2. North Total 350,189 27.0% 40
3. East & South
Adelaide Hills 23,659 1.8% 3
Burnside 45,816 3.5% 5
Campbelltown (SA) 52,739 4.1% 6
Mitcham 66,121 5.1% 7
Onkaparinga 43,670 3.4% 5 Port Adelaide – East (partial) 2,984 0.2% 0
Salisbury (partial) 2,162 0.2% 0
Tea Tree Gully 95,107 7.3% 11
3. East & South Total 332,258 25.6% 37
SURVEY AREA MAPS
Level 6, 157 Walker St, North Sydney, NSW 2060 T +61 2 9900 2888 F +61 2 9900 2828 W www.gfk.com/home © GfK
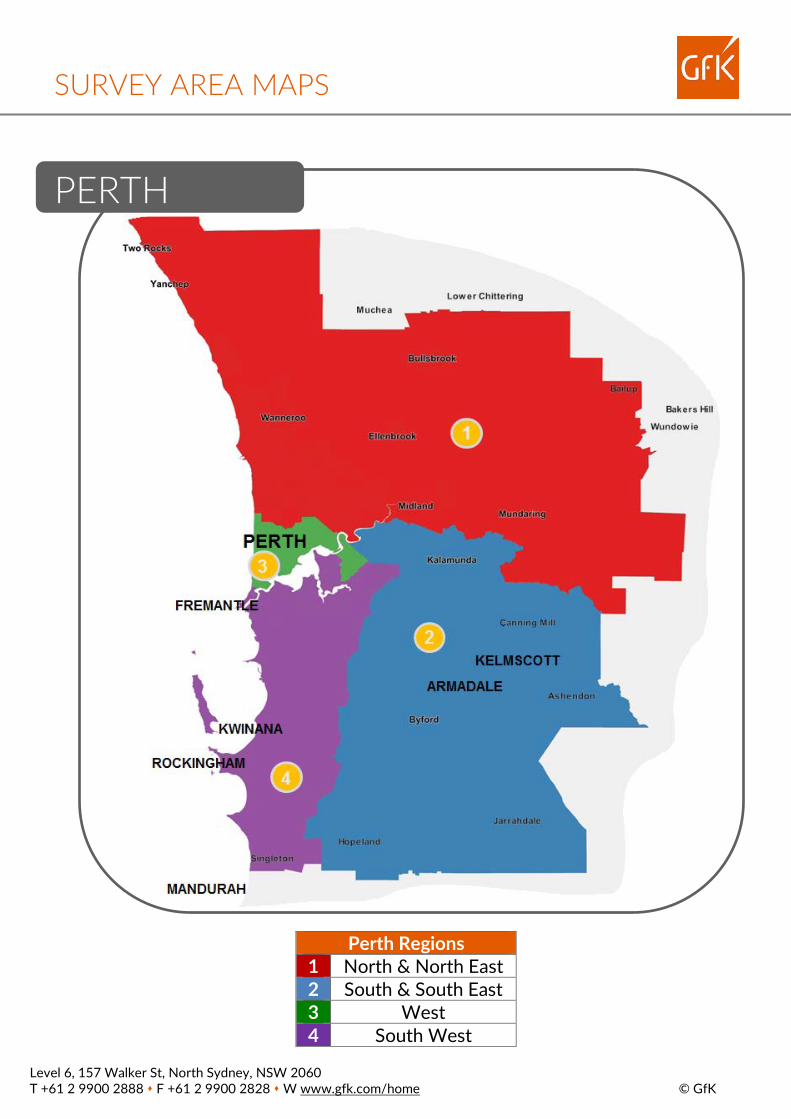
Perth Regions 1 North & North East 2 South & South East 3 West 4 South West
SURVEY AREA MAPS
PERTH

Level 6, 157 Walker St, North Sydney, NSW 2060 T +61 2 9900 2888 F +61 2 9900 2828 W www.gfk.com/home © GfK
Perth Statistical Areas Statistical Areas Population
0+ Percent
0+ Interviewing
Areas 1. North & North East
Bayswater - Bassendean 83,474 4.2% 7
Joondalup 160,185 8.1% 12
Mundaring 42,999 2.2% 3
Perth City 19,913 1.0% 2
Stirling 202,838 10.3% 16
Swan 143,410 7.3% 11
Wanneroo 201,406 10.2% 16
1. North & North East Total 854,225 43.3% 67
2. South & South East
Armadale 87,339 4.4% 7
Belmont - Victoria Park 42,054 2.1% 3
Gosnells 124,081 6.3% 10
Kalamunda 58,923 3.0% 5
Serpentine - Jarrahdale 32,753 1.7% 2
2. South & South East Total 345,150 17.5% 27
3. West
Belmont - Victoria Park 32,937 1.7% 3
Canning (partial) 4,016 0.2% 0
Cottesloe - Claremont 72,264 3.7% 6
Perth City 90,649 4.6% 7
South Perth (partial) 467 0.0% 0
3. West Total 200,333 10.2% 16
4. South West
Canning 92,448 4.7% 7
Cockburn 11,1729 5.7% 9
Fremantle 39,246 2.0% 3
Kwinana 45,092 2.3% 3
Melville 104,986 5.3% 8
Rockingham 135,933 6.9% 11
South Perth 43,352 2.2% 3
4. South West Total 572,786 29.0% 44
Perth Total 1,972,494 100.0% 154
SURVEY AREA MAPS

Level 6, 157 Walker St, North Sydney, NSW 2060 T +61 2 9900 2888 F +61 2 9900 2828 W www.gfk.com/home © GfK
Newcastle Regions 1 Central & North 2 West 3 South
SURVEY AREA MAPS
NEWCASTLE

Level 6, 157 Walker St, North Sydney, NSW 2060 T +61 2 9900 2888 F +61 2 9900 2828 W www.gfk.com/home © GfK
Newcastle Statistical Areas Statistical Areas Population
0+ Percent
0+ Interviewing
Areas 1. Central & North
Lake Macquarie - East 485 0.1% 0
Newcastle 169,265 28.6% 23
Port Stephens 69,407 11.7% 9
1. Central & North Total 239,157 40.4% 32
2. West
Lower Hunter 62,430 10.5% 9
Maitland 81,955 13.8% 11
Newcastle 3,018 0.5% 0
2. West Total 147,403 24.9% 20
3. South
Lake Macquarie - East 123,441 20.8% 17
Lake Macquarie - West 79,693 13.5% 11
Newcastle 2,781 0.5% 0
3. South Total 205,915 34.8% 28
Newcastle Total 592,475 100.0% 80
SURVEY AREA MAPS

Level 6, 157 Walker St, North Sydney, NSW 2060 T +61 2 9900 2888 F +61 2 9900 2828 W www.gfk.com/home © GfK
SURVEY AREA MAPS
CANBERRA

Level 6, 157 Walker St, North Sydney, NSW 2060 T +61 2 9900 2888 F +61 2 9900 2828 W www.gfk.com/home © GfK
Canberra Statistical Areas Statistical Areas Population
0+ Percent
0+ Interviewing
Areas Canberra
Belconnen 100,997 22.0% 14
Cotter - Namadgi 4,249 0.9% 1
Fyshwick - Pialligo - Hume 1,610 0.3% 0
Gungahlin 81,765 17.8% 12
North Canberra 58,350 12.7% 8
Queanbeyan 38,109 8.3% 5
South Canberra 30,016 6.5% 4
Tuggeranong 85,163 18.5% 12
Weston Creek 23,290 5.1% 3
Woden 36,482 7.9% 5
Canberra Total 460,031 100% 64
SURVEY AREA MAPS

Level 6, 157 Walker St, North Sydney, NSW 2060 T +61 2 9900 2888 F +61 2 9900 2828 W www.gfk.com/home © GfK
Gold Coast/Tweed Regions
1 North 2 South
SURVEY AREA MAPS
GOLD COAST/TWEED

Level 6, 157 Walker St, North Sydney, NSW 2060 T +61 2 9900 2888 F +61 2 9900 2828 W www.gfk.com/home © GfK
Gold Coast/Tweed Heads Statistical Areas Statistical Areas Population 0+ Percent 0+ Interviewing Areas
1. North
Broadbeach - Burleigh 66,027 9.6% 8
Gold Coast - North 71,234 10.3% 8
Gold Coast Hinterland 4,764 0.7% 1
Mudgeeraba - Tallebudgera 29,492 4.3% 4
Nerang 71,755 10.4% 8
Ormeau - Oxenford 122,304 17.7% 14
Robina 54,454 7.9% 6
Southport 63,270 9.2% 7
Surfers Paradise 45,669 6.6% 5
1. North Total 528,969 76.6% 61
2. South
Coolangatta 57,715 8.4% 7
Mudgeeraba - Tallebudgera 6,690 1.0% 1
Tweed Valley 96,928 14.0% 11
2. South Total 161,333 23.4% 19
Gold Coast Total 690,302 100% 80
SURVEY AREA MAPS

Level 6, 157 Walker St, North Sydney, NSW 2060 T +61 2 9900 2888 F +61 2 9900 2828 W www.gfk.com/home © GfK
Sydney Melbourne Brisbane Adelaide Perth Min. Sample Size 2,400 2,400 2,000 1,750 1,850
People
10+ 4,793,000 4,817,000 2,156,000 1,161,000 1,778,000 10-17 495,000 494,000 245,000 118,000 200,000 18-24 548,000 572,000 253,000 128,000 190,000 25-39 1,354,000 1,345,000 576,000 276,000 476,000 40-54 1,027,000 1,040,000 477,000 247,000 397,000 55-64 588,000 584,000 263,000 161,000 226,000 65+ 781,000 782,000 342,000 231,000 289,000 13+ 4,596,000 4,619,000 2,059,000 1,117,000 1,698,000 18+ 4,298,000 4,323,000 1,911,000 1,043,000 1,578,000
16-24 664,000 690,000 311,000 159,000 238,000 25-34 931,000 931,000 396,000 187,000 322,000 35-44 780,000 770,000 340,000 169,000 288,000 45-59 983,000 996,000 461,000 250,000 384,000 60+ 1,056,000 1,054,000 461,000 309,000 394,000
Men
10+ 2,372,000 2,371,000 1,058,000 568,000 883,000 10-17 256,000 256,000 126,000 61,000 105,000 18-24 282,000 294,000 127,000 66,000 97,000 25-39 676,000 671,000 284,000 137,000 237,000 40-54 507,000 512,000 234,000 122,000 197,000 55+ 651,000 638,000 287,000 183,000 247,000 13+ 2,271,000 2,268,000 1,007,000 545,000 841,000 18+ 2,116,000 2,115,000 932,000 507,000 778,000
16-24 342,000 355,000 157,000 82,000 122,000 25-34 463,000 463,000 195,000 93,000 160,000 35-44 391,000 389,000 168,000 84,000 145,000 45-59 482,000 481,000 224,000 122,000 189,000 60+ 498,000 488,000 218,000 142,000 187,000
Women
10+ 2,421,000 2,446,000 1,098,000 593,000 895,000 10-17 239,000 238,000 119,000 57,000 95,000 18-24 266,000 278,000 126,000 62,000 93,000 25-39 678,000 674,000 292,000 139,000 239,000 40-54 520,000 528,000 243,000 125,000 200,000 55+ 718,000 728,000 318,000 210,000 268,000 13+ 2,325,000 2,351,000 1,052,000 572,000 857,000 18+ 2,182,000 2,208,000 979,000 536,000 800,000
16-24 322,000 335,000 154,000 77,000 116,000 25-34 468,000 468,000 201,000 94,000 162,000 35-44 389,000 381,000 172,000 85,000 143,000 45-59 501,000 515,000 237,000 128,000 195,000 60+ 558,000 566,000 243,000 167,000 207,000
METROPOLITAN POPULATION POTENTIALS

Level 6, 157 Walker St, North Sydney, NSW 2060 T +61 2 9900 2888 F +61 2 9900 2828 W www.gfk.com/home © GfK
Sydney Melbourne Brisbane Adelaide Perth Min. Sample Size 2,400 2,400 2,000 1,750 1,850
Regions
Region 1 1,154,000 1,222,000 378,000 251,000 756,000 Region 2 848,000 1,390,000 397,000 306,000 308,000 Region 3 662,000 1,103,000 491,000 296,000 199,000 Region 4 870,000 1,102,000 271,000 308,000 515,000 Region 5 1,259,000 619,000
Please note:
- The total 10+ population estimates are GfK’s estimate, based on the latest census data available from the Australian Bureau of Statistics.
- The minimum sample size represents the minimum number of diaries that will be used to generate the radio ratings results for each survey release.
- The population potential figures are GfK’s estimates of the number of people, by age cell, for each survey area.
- Each 10+ population and potential figure is estimated as at 16 December 2020. Note about grocery buyer potentials
From 2014, grocery buyers will not be a demographic group that has a controlled weighting variable. This means the potential is not established at the beginning of each year, so when analysing the data the potential may vary from survey to survey, based on the number of respondents claiming to be grocery buyers in the reporting sample.
METROPOLITAN POPULATION POTENTIALS

Level 6, 157 Walker St, North Sydney, NSW 2060 T +61 2 9900 2888 F +61 2 9900 2828 W www.gfk.com/home © GfK
Newcastle Canberra Gold Coast Min. Sample Size 1,500 1,100 1,500
People
10+ 523,000 407,000 620,000 10-17 57,000 42,000 66,000 18-24 55,000 50,000 65,000 25-39 117,000 112,000 141,000 40-54 110,000 92,000 136,000 55-64 74,000 49,000 84,000 65+ 110,000 62,000 128,000 13+ 500,000 391,000 595,000 18+ 466,000 365,000 554,000
16-24 68,000 60,000 81,000 25-34 80,000 76,000 96,000 35-44 72,000 68,000 89,000 45-59 113,000 86,000 136,000 60+ 146,000 85,000 168,000
Men
10+ 256,000 200,000 299,000 10-17 30,000 21,000 34,000 18-24 28,000 25,000 32,000 25-39 58,000 55,000 68,000 40-54 54,000 46,000 65,000 55+ 86,000 53,000 100,000 13+ 244,000 192,000 286,000 18+ 226,000 179,000 265,000
16-24 35,000 30,000 40,000 25-34 40,000 37,000 46,000 35-44 35,000 34,000 43,000 45-59 55,000 43,000 65,000 60+ 68,000 40,000 79,000
Women
10+ 267,000 207,000 321,000 10-17 27,000 21,000 32,000 18-24 27,000 25,000 33,000 25-39 59,000 57,000 73,000 40-54 56,000 46,000 71,000 55+ 98,000 58,000 112,000 13+ 256,000 199,000 309,000 18+ 240,000 186,000 289,000
16-24 33,000 30,000 41,000 25-34 40,000 39,000 50,000 35-44 37,000 34,000 46,000 45-59 58,000 43,000 71,000 60+ 78,000 45,000 89,000
REGIONAL POPULATION POTENTIALS

Level 6, 157 Walker St, North Sydney, NSW 2060 T +61 2 9900 2888 F +61 2 9900 2828 W www.gfk.com/home © GfK
Newcastle Canberra Gold Coast Min. Sample Size 1,500 1,100 1,500
Regions Region 1 215,000 407,000 473,000 Region 2 126,000 147,000 Region 3 182,000
Please note:
- The total 10+ population estimates are GfK’s estimate, based on the latest census data available from the Australian Bureau of Statistics.
- The minimum sample size represents the minimum number of diaries that will be used to generate the radio ratings results for each survey release.
- The population potential figures are GfK’s estimates of the number of people, by age cell, for each survey area.
- Each 10+ population and potential figure is estimated as at 16 December 2020. Note about Grocery Buyer Potentials
From 2014, grocery buyers will not be a demographic group that has a controlled weighting variable. This means the potential is not established at the beginning of each year, so when analysing the data the potential may vary from survey to survey, based on the number of respondents claiming to be grocery buyers in the reporting sample.
REGIONAL POPULATION POTENTIALS

Level 6, 157 Walker St, North Sydney, NSW 2060 T +61 2 9900 2888 F +61 2 9900 2828 W www.gfk.com/home © GfK
The GfK Radio Ratings Certificate Training Course is free to current radio ratings subscribers and covers all aspects of radio audience measurement in Australia. SYDNEY, MELBOURNE, BRISBANE, ADELAIDE & PERTH: Due to COVID-19 all training will be conducted remotely via Teams / Zoom until further notice. Training will be offered to each Network/Agency for all subscribers. An email seeking expression of interest will be sent each month to determine level of demand. If you have urgent training requirements, please contact GfK directly. REMOTE TRAINING SCHEDULE:
* Please note depending on demand more sessions can be offered. GOLD COAST, NEWCASTLE & CANBERRA: Training is run on an ad-hoc basis Contact: Ann-Maree Nolan 0413 585 332 [email protected] GfK TRAINING CONDITIONS You must advise GfK if you plan to attend a training session by accepting the training invitation via teams. Training invitations can be forwarded to other team members.
Minimum class size is 4, and GfK reserves the right to cancel a training session due to low demand.
GfK must be advised of any cancellations at least 48 hours before the course is due to commence – another staff member can attend in place of a cancellation. If the training session falls under 4 people, the session will be cancelled.
E-LEARNING – GfK Radio Ratings – Introduction to the data. Our new e-learning course gives subscribers the flexibility to complete the GfK Radio Ratings training at a time that suits them. On completion of the course participants will be able to use the four basic radio statistics effectively and understand the relationship between the statistics; as well as be able to understand and interpret Reach & Frequency.
For more information on Remote or E-learning courses contact: Contact: Ann-Maree Nolan 0413 585 332 [email protected]
Sian Gillen 0417 257 021 [email protected]
Date Feb Tuesday, 9th 10:30am & 1:00pm Mar Tuesday, 30th 10:30am & 1:00pm May Tuesday, 25th 10:30am & 1:00pm July Tuesday, 20th 10:30am & 1:00pm Sept Tuesday, 21st 10:30am & 1:00pm Nov Tuesday, 30th 10:30am & 1:00pm
2021 Radio Ratings Training Schedule
Level 6, 157 Walker St, North Sydney, NSW 2060 T +61 2 9900 2888 F +61 2 9900 2828 W www.gfk.com/home © GfK
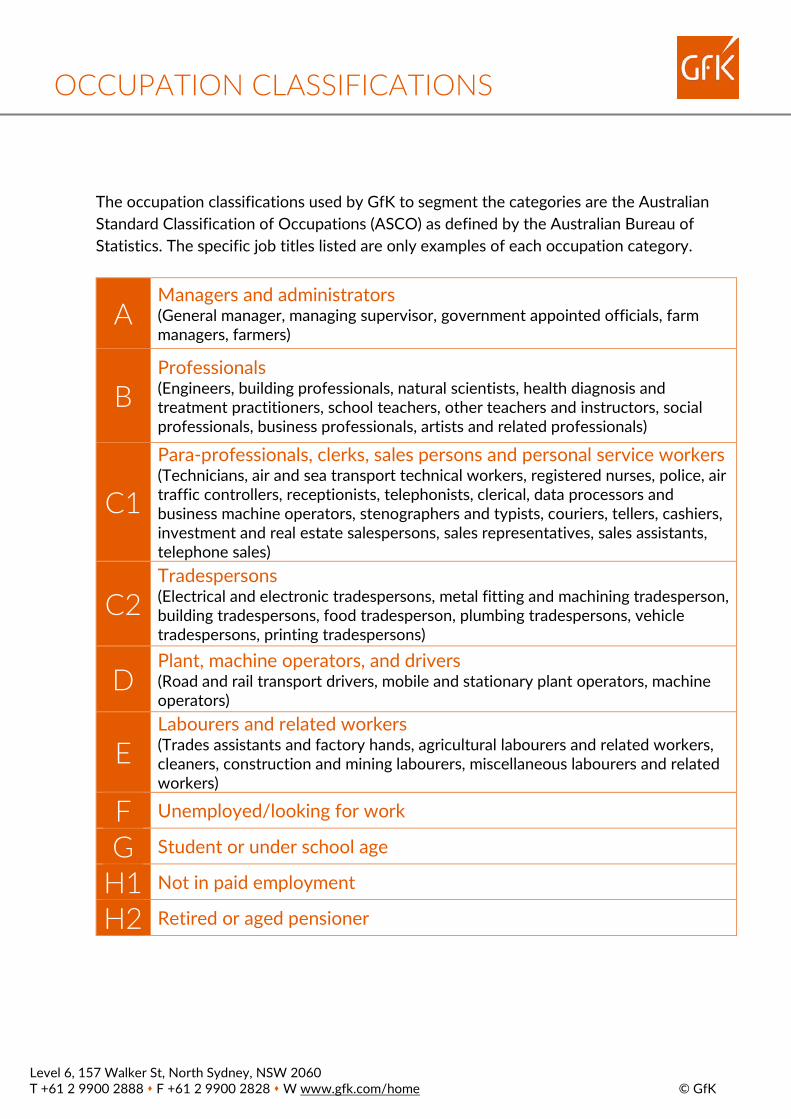
The occupation classifications used by GfK to segment the categories are the Australian Standard Classification of Occupations (ASCO) as defined by the Australian Bureau of Statistics. The specific job titles listed are only examples of each occupation category.
A Managers and administrators (General manager, managing supervisor, government appointed officials, farm managers, farmers)
B Professionals (Engineers, building professionals, natural scientists, health diagnosis and treatment practitioners, school teachers, other teachers and instructors, social professionals, business professionals, artists and related professionals)
C1
Para-professionals, clerks, sales persons and personal service workers (Technicians, air and sea transport technical workers, registered nurses, police, air traffic controllers, receptionists, telephonists, clerical, data processors and business machine operators, stenographers and typists, couriers, tellers, cashiers, investment and real estate salespersons, sales representatives, sales assistants, telephone sales)
C2 Tradespersons (Electrical and electronic tradespersons, metal fitting and machining tradesperson, building tradespersons, food tradesperson, plumbing tradespersons, vehicle tradespersons, printing tradespersons)
D Plant, machine operators, and drivers (Road and rail transport drivers, mobile and stationary plant operators, machine operators)
E Labourers and related workers (Trades assistants and factory hands, agricultural labourers and related workers, cleaners, construction and mining labourers, miscellaneous labourers and related workers)
F Unemployed/looking for work
G Student or under school age
H1 Not in paid employment
H2 Retired or aged pensioner
OCCUPATION CLASSIFICATIONS

Level 6, 157 Walker St, North Sydney, NSW 2060 T +61 2 9900 2888 F +61 2 9900 2828 W www.gfk.com/home © GfK
The single source lifestyle questionnaire forms part of the GfK radio survey. The data it provides gives users an excellent insight into listeners' lifestyles and purchasing habits or intentions.
The 2021 categories are:
Media - Newspaper readership (market specific) – paper and online - TV Viewing - Commercial, ABC, and Pay TV - Subscription TV - Video on demand
Lifestyle and travel
- Air travel, interstate and overseas - Holiday travel intentions - Sporting event attendance - Casino/licensed club visit - TAB betting - Internet or mobile phone gambling - Tobacco smoker/intention to quit - Lotteries, lotto, or scratchies purchase - Gym/Fitness centre membership/intentions - Physical activity /intention to start - Start or continue low calorie/controlled diet - Cinema attendance
Household and home
- Pet ownership - Home renovations
- Painting - Landscaping/gardening - Extensions/repair work - Kitchen/bathroom renovations - General household refurbishment - None
- Likely to purchase or sell house/unit within next 12 months - Have an investment property - Intend to purchase an investment property in the next 12
months - Utility provider decision maker
Technology
- Digital radio purchase - Radio station social media usage & engagement - Social media usage - Mobile phone contract type - Mobile phone network carrier and intention to switch - Internet surfing - time spent - Computer tablet device purchase intention - Computer video games, software and hardware/accessories,
purchase intention
2021 LIFESTYLE CATEGORIES

Level 6, 157 Walker St, North Sydney, NSW 2060 T +61 2 9900 2888 F +61 2 9900 2828 W www.gfk.com/home © GfK
Purchase behaviour
- Hardware store purchase - Garden nursery purchase - Furniture/appliance store purchase - Department store or discount retailer purchase - Newsagency, music/record store purchase - Shopping for clothing/accessories - Pharmacy/chemist purchase - Purchased goods over the internet - Whitegoods, air-conditioning/heaters, furniture purchase
intention - Audio/visual equipment, digital radio purchase intention - Motor vehicle purchase intention - Household green items purchase next 12 months (eg solar,
batteries, windows/glazing)
Finance and insurance
- Mortgage provider and intention to change - Comprehensive motor vehicle insurance - Home and/or contents insurance - Private health insurance - Credit card ownership - Finance and investment purchase intention - Personal loan and investments
Food and beverage
- Restaurant dining frequency - Hotel and licensed club visit - Take-away/fast-food purchases by food category and
frequency - Purchase of beer/wine/spirits/pre-mixed spirits for home or
social occasions
2021 LIFESTYLE CATEGORIES

Level 6, 157 Walker St, North Sydney, NSW 2060 T +61 2 9900 2888 F +61 2 9900 2828 W www.gfk.com/home © GfK
The most commonly referred to statistics are outlined in the tables below. Your software system may have additional statistics, please refer to your software provider for more information or contact GfK for further information.
Share %
Share of audience: Indicates a station’s relative strength within a market. It shows the percentage of total radio listening audience during a given time period tuning to a particular station. Share is a station’s average audience expressed as a percentage of the total radio audience for the same period.
For example, 8.4% of all radio listening is to Station G, Mon-Sun, 5:30am to midnight.
Average audience
(000’s)
Average audience or average quarter-hour audience: the average number of listeners tuned to a radio station per quarter hour in any given time period. Usually expressed in thousands (000’s).
For example, in any given quarter hour between Mon-Fri 5:30am to 9am, on average 55,000 listeners were listening to Station F.
Cumulative audience/
cumes/ reach
(000’s or %)
Cumulative audience (cumes): the total number of different people who listen to a station for at least eight minutes (one quarter-hour) during any time period. Cumes illustrate audience size, as they estimate the unduplicated number of people reached by a station at least once during a particular time period.
For example, Station K has 575,000 unique listeners between 5.30am and midnight, Mon- Fri.
Note that the cumes from two stations cannot be added together, nor can you add daypart cumes together, because listeners may be listening in both sessions and duplication will occur. Station cumes may be added across discrete demographics within a time period, e.g., cume Men 18-24 + cume Men 25-34 = cume Men 18-34
Cumulative audience is expressed in thousands (000’s) and can also be expressed as a percentage of the total population or total available audience.
For example, Station K has 575,000 unique listeners between 5.30am and 12mn Monday- Friday. 54% of People 10+ tuned in at least once to Station K in this time period.
Time Spent Listening
(TSL) hrs:mins
Time Spent Listening or TSL: an estimate of the amount of time a station’s cumulative audience spends listening during a specified time period, expressed in hours and minutes. Note that TSL does not denote audience size.
For example, between 5:30am and midnight, Mon-Fri, Station C listeners tune in for 8 hours and 15 minutes (8:15).
RADIO RATINGS GLOSSARY

Level 6, 157 Walker St, North Sydney, NSW 2060 T +61 2 9900 2888 F +61 2 9900 2828 W www.gfk.com/home © GfK
Exclusive audience (000’s/%)
Exclusive audience: is the number of people who listen exclusively to one station during any particular session. This can be expressed as a number or a proportion of the station’s total audience.
For example, 90,000 people listened only to Station R 5.30-12mn Mon-Fri or 35% of Station R’s audience only listen to Station R during this time period.
Below are statistics that are more commonly found when using reach and frequency analyses:
Average frequency (effective
and exclusive)
Average frequency: this is the average number of times that a station’s listeners hear an advertisement. Also known as opportunity to hear.
For example, Station A’s audience heard an advertising campaign on average 3.1 times.
Frequency can either be: • Effective: displays the number of times the audience has heard
the advertising campaign at least once, at least twice etc. Displayed as 1+, 2+, 3+ etc.
• Exclusive: displays the number of times the audience has heard the advertising campaign exactly once, exactly twice, exactly three times. Displayed as 1, 2, 3 etc.
Reach / Cume
Net reach: expresses the total number of different people who are reached at least once by an advertising schedule, displayed as numbers of people and/or as a percentage of the population group being targeted. Reach is similar to cumulative audience but is usually quoted in the context of an advertising campaign.
For example, 15 x 30 second commercials placed in Breakfast by Brand A, Mon-Fri, for one week on Station X will reach 312,000 people 25-54, or 30% of 25-54 year olds.
Gross impacts
Gross impacts: Shows the total number of times the advertisement was heard, it measures the weight of a campaign. Each quarter-hour audience figure is added together to create gross impacts, it is a duplicated figure as the listener is likely to hear the spot more than once.
For example, Station X plays a spot at 6.05 a.m., 7.05 a.m., 10.05 a.m., 1.05 p.m. and 4.05 p.m. If each spot attracts an average audience of 10,000 then the Gross Impacts would be 50,000.
Cost per thousand or
CPM
Cost per thousand: this is the cost of an advertising campaign or spot, based on the number of times an audience is reached (gross impacts) i.e. how much it costs to achieve 1000 impacts. It does not measure how much it costs to reach 1000 different individuals.
CPM is calculated by dividing the cost by the number of gross impacts.
For example, a five-spot advertising campaign run on Station X is estimated to achieve 853,000 gross impacts. Each spot cost $500.
CPM = $2,500/853 = $2.93
RADIO RATINGS GLOSSARY

Level 6, 157 Walker St, North Sydney, NSW 2060 T +61 2 9900 2888 F +61 2 9900 2828 W www.gfk.com/home © GfK
The radio ratings are collected and prepared by GfK and the copyright is owned by Commercial Radio Australia (CRA). The radio ratings are confidential information that can only be obtained by having a license to access these ratings. As such, the radio ratings cannot be passed to third parties without written consent from Commercial Radio Australia. This consent can only be obtained by application to GfK. In addition, using the radio ratings data for commercial purposes without permission of Commercial Radio Australia is also prohibited and such use and approval can only be given to an approved subscriber. To obtain a license to access the radio ratings or more information, please contact GfK on 02 9900 2888.
Any licence holder of the CRA radio ratings data must use an accredited software package, which at all times must comply with CRA’s Gold Standard in relation to the use and reporting of the elemental data. For more detail on the Gold Standard Accredited Software Providers please visit CRA’s website at www.commercialradio.com.au
Any publishing of the radio ratings will need to be sourced “GfK Radio Ratings” or GfK must be used in conjunction with the data release. GfK acknowledges that licensed users will be able to release the following level of data:
1. The use of the radio ratings in a narrative form to support insights or audience research claims made in reference to a story, sales brochure, or sales pitch.
2. The top line Share, Average, and Cumulative Audience figures in each capital city or regional market for the standard sessions and demographics for the AM/FM stations:
Sessions Demographics ROS: Mon-Sun 5:30am-12mn People 10+
Weekdays: Mon-Fri 5:30am-12mn People 10-17 Breakfast: Mon-Fri 5:30am-9am People 18-24
Morning: Mon-Fri 9am-12md People 25-39 Afternoon: Mon-Fri 12md-4pm People 40-54
Drive: Mon-Fri 4pm-7pm People 55-64 Evenings: Mon-Fri 7pm-12mn People 65+
Weekends: Sat & Sun 5:30am-12mn
3. The top line Cumulative Audience figures in each capital city for the standard sessions and demographics for the DAB+ stations as per the table above.
4. Radio ratings data referring to the Other AM, Other FM, and Other Digital station groups CANNOT be published.
5. Any supply of radio ratings beyond the above will breach the confidential information rights of CRA and GfK. GfK may discontinue supply to license holders and subscribers who provide the data to third parties without authorisation and may commence legal proceedings against those parties.
Please note that any release of ratings data, including press releases, is embargoed until 9:30am (AEST / AEDT) on survey day.
ACCESSING AND SOURCING THE RADIO RATINGS

Level 6, 157 Walker St, North Sydney, NSW 2060 T +61 2 9900 2888 F +61 2 9900 2828 W www.gfk.com/home © GfK
Guidelines for sourcing and reporting GfK radio ratings DO NOT reference software or a software platform in the sourcing e.g. GfK
Radio Ratings (GfK Probe, eRAM, BCC).
Any claim referencing a daypart not based on one of the standard BMADE or weekend dayparts (as listed on the previous page) must be clearly defined in the claim or source.
It must be clear what statistic, demographic and daypart is being used when stating claims like #1 or #2 either in the document or the source.
Headline claims should have a footnote reference that indicates the reader should seek clarification in the sourcing i.e. #1 Station1 or #2 Station*
The source must contain the market, survey, demographic, daypart and statistic references.
An overarching statement of ‘Unless otherwise stated’ can be used within a source to remove the need to list all different types of ratings data included.
Any Combined station or Network results should identify the stations included either in the document or the source.
External use of estimated audience figures derived from the radio ratings is not permitted.
An example of a correct source statement:
Source: GfK Radio Ratings, Syd S1 2021, Share %, People 10+, Mon-Sun 5:30-12mn, unless otherwise stated.
Any publication of the radio ratings that does not follow the above guidelines may be breaching the copyright and IP rights of CRA and GfK and may result in false or misleading statements. GfK may cease supply to license holders and subscribers who continue to or deliberately breach the guidelines and may commence legal proceedings against those parties.
ACCESSING AND SOURCING THE RADIO RATINGS
Level 6, 157 Walker St, North Sydney, NSW 2060 T +61 2 9900 2888 F +61 2 9900 2828 W www.gfk.com/home © GfK
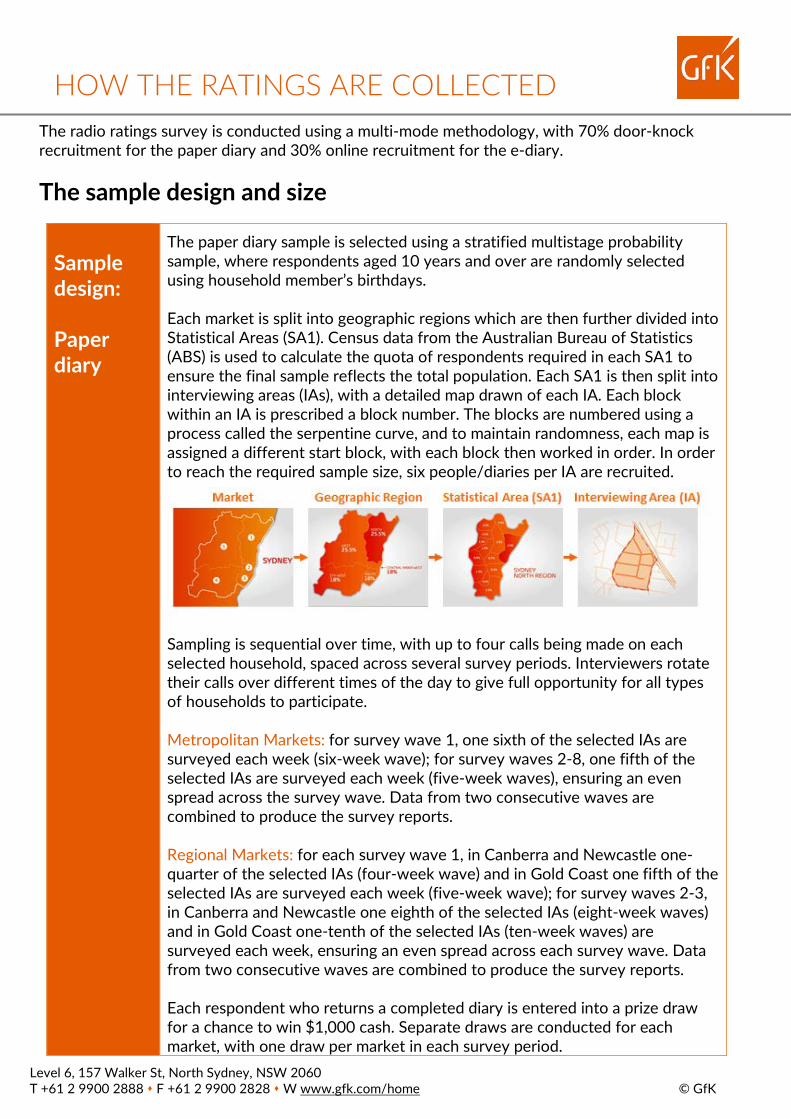
The radio ratings survey is conducted using a multi-mode methodology, with 70% door-knock recruitment for the paper diary and 30% online recruitment for the e-diary.
The sample design and size
Sample design: Paper diary
The paper diary sample is selected using a stratified multistage probability sample, where respondents aged 10 years and over are randomly selected using household member’s birthdays.
Each market is split into geographic regions which are then further divided into Statistical Areas (SA1). Census data from the Australian Bureau of Statistics (ABS) is used to calculate the quota of respondents required in each SA1 to ensure the final sample reflects the total population. Each SA1 is then split into interviewing areas (IAs), with a detailed map drawn of each IA. Each block within an IA is prescribed a block number. The blocks are numbered using a process called the serpentine curve, and to maintain randomness, each map is assigned a different start block, with each block then worked in order. In order to reach the required sample size, six people/diaries per IA are recruited. Sampling is sequential over time, with up to four calls being made on each selected household, spaced across several survey periods. Interviewers rotate their calls over different times of the day to give full opportunity for all types of households to participate.
Metropolitan Markets: for survey wave 1, one sixth of the selected IAs are surveyed each week (six-week wave); for survey waves 2-8, one fifth of the selected IAs are surveyed each week (five-week waves), ensuring an even spread across the survey wave. Data from two consecutive waves are combined to produce the survey reports. Regional Markets: for each survey wave 1, in Canberra and Newcastle one-quarter of the selected IAs (four-week wave) and in Gold Coast one fifth of the selected IAs are surveyed each week (five-week wave); for survey waves 2-3, in Canberra and Newcastle one eighth of the selected IAs (eight-week waves) and in Gold Coast one-tenth of the selected IAs (ten-week waves) are surveyed each week, ensuring an even spread across each survey wave. Data from two consecutive waves are combined to produce the survey reports.
Each respondent who returns a completed diary is entered into a prize draw for a chance to win $1,000 cash. Separate draws are conducted for each market, with one draw per market in each survey period.
HOW THE RATINGS ARE COLLECTED

Level 6, 157 Walker St, North Sydney, NSW 2060 T +61 2 9900 2888 F +61 2 9900 2828 W www.gfk.com/home © GfK
Sample design: e-diary
Recruitment of respondents to complete the e-diary is undertaken using online research panels. E-diary respondents make up 30% of the radio ratings sample. Using this method of recruitment allows the pre-screening and selection of respondents to reflect the spread of the population by age and gender and by geographic area within each market, in line with ABS figures. Each respondent is incentivised to participate using the online panel provider’s incentive scheme.
Sample size: paper and e-diary combined
Minimum effective target samples for each city per report period are:
• SYDNEY 2,400 individuals aged 10 years and over. • MELBOURNE 2,400 individuals aged 10 years and over • BRISBANE 2,000 individuals aged 10 years and over • ADELAIDE 1,750 individuals aged 10 years and over. • PERTH 1,850 individuals aged 10 years and over. • NEWCASTLE 1,500 individuals aged 10 years and over. • GOLD COAST 1,500 individuals aged 10 years and over. • CANBERRA 1,100 individuals aged 10 years and over.
HOW THE RATINGS ARE COLLECTED HOW THE RATINGS ARE COLLECTED

Level 6, 157 Walker St, North Sydney, NSW 2060 T +61 2 9900 2888 F +61 2 9900 2828 W www.gfk.com/home © GfK
The paper diary, placement, and collection
Paper diary design: metropolitan and regional markets
A GfK sticker diary is used by 70% of respondents, across both metropolitan and major regional markets. Each diary contains space for the respondent to record their radio listening for a period of up to nine days, commencing on a Friday (depending on the day the diary is placed).
In the sticker diary, each column heading is blank and a separate sheet is supplied with stickers bearing the names of each radio station that can be received in the market (a separate sticker per station). The respondent selects stickers for the station(s) they listen to, and places them on the blank column headings. Those column(s) are then used to record all listening to the station(s). Blank stickers are provided for the respondent to record listening to any radio station that does not have a pre-printed sticker. Seven columns are provided for stickers in each diary, with additional pages provided to record listening if more than seven stations are listened to.
For each day (midnight to midnight), time is listed in quarter-hours down the page for a 24-hour period, with listening information recorded for each station listened to (eight minutes or more) by placing crosses in the appropriate squares. There are additional columns provided for the respondent to record their place of listening – at work, at home, in car, or elsewhere; and to record the device they used to listen to the radio – AM/FM radio, DAB+ radio, mobile phone, PC/tablet, smart speaker or other, and whether they were listening using headphones.
The diary also contains a two-page lifestyle questionnaire, as well as information about the purpose of the survey and the importance of accurately recording their listening or non-listening behaviour.
HOW THE RATINGS ARE COLLECTED HOW THE RATINGS ARE COLLECTED
Level 6, 157 Walker St, North Sydney, NSW 2060 T +61 2 9900 2888 F +61 2 9900 2828 W www.gfk.com/home © GfK
Paper diary placement: metropolitan
Paper diary placement is made face-to-face by specially selected and trained interviewers who are managed by Field Supervisors. One person is randomly selected in each household, using a birthday recruitment method.
GfK interviewers record all recruitment information electronically via a tablet PC (CAPI), allowing live management of quota requirements and instant feedback on completion rates.
To ensure 10-24 year olds are recruited in line with the population, interviewers can proxy place a diary with the parent, partner, or guardian of the selected respondent. Quota recruitment can also be used to recruit 10-24 year olds if there is a shortfall of 10-24 year olds using birthday recruitment.
During the diary placement the interviewer personally demonstrates how the paper-diary is to be completed (a demonstration page is included in each diary) and informs the respondent of the privacy considerations (detailed on the GfK website). They also explain the lifestyle questionnaire and inform respondents that they will be entered in a draw to win a prize for completing the survey.
All calls to establish contact are made on Thursday, Friday, and Saturday, with the time rotated between day, night, and Saturday, according to an established procedure. Each interviewer works through a list of areas in a different order to the previous wave, to ensure the timing of calls at any home alters from wave-to-wave, increasing the contact rate.
If the respondent identified through birthday recruitment is not at home at the time of placement, a leaflet is left explaining the purpose of the survey and the importance of accurately recording their listening or non-listening. This is left to reassure the potential respondent that the project is legitimate and worthwhile. If a respondent declines to participate (e.g., busy/going out) but does not refuse outright, they also receive the explanatory leaflet. These respondents are contacted again in subsequent waves to attempt to obtain their participation. The leaflets can also be left at unattended homes so that when the interviewer calls back in a future wave the household members are better prepared for recruitment.
HOW THE RATINGS ARE COLLECTED HOW THE RATINGS ARE COLLECTED

Level 6, 157 Walker St, North Sydney, NSW 2060 T +61 2 9900 2888 F +61 2 9900 2828 W www.gfk.com/home © GfK
Paper diary placement: regional face-to-face and CATI
Diary placement in major regional markets is made both via face-to-face (50% of sample) by specially selected and trained interviewers who are managed by Field Supervisors and via Computer Aided Telephone Interviewing (CATI) (20% of sample). The remaining 30% of the sample is recruited online for the e-diary.
Household flooding methodology is used in these markets; this requires diaries to be placed with all people living in the household aged 10 years and over. The interviewer recruits the household through a person living in the household aged 18 years or over, and all household recruitment information is recorded electronically via a tablet PC (CAPI) or during the CATI recruitment.
Each diary owner’s name and an identifying person number is recorded on the front cover of their diary, as well as the dates for listening and date the diary will be collected. The interviewer conducts the demonstration with the person at the door and, where possible, the other members of the household. They also explain privacy considerations, the lifestyle questionnaire, and inform respondents that they will be entered in a draw to win a prize for completing the survey.
For CATI placement, phone sample is split by geographical postcodes and is used to recruit households to participate in the survey. All household recruitment information is recorded electronically.
Diaries are posted to the household and each diary has the owner’s name and identifying person number recorded on the front cover of each diary as well as the dates for listening and date for posting the diaries back (a reply paid envelope is included with the diaries).
After the diaries have been posted, a call is made to the home to confirm the diaries have been received by the household and to ask them to start recording their listening. Households are called mid-week to follow up on progress and make sure that the diaries are being completed. At the end of the survey, another call is made to thank the household, advise that the survey week has ended, and to request that the diaries be posted back.
Mid-week calls to respondents
A telephone call is made to the respondent/household on Tuesday or Wednesday during the week of diary completion. The purpose of the mid-week call is to remind the respondent to participate in the survey, enquire whether they require clarification of what they are to do, and to confirm the diary collection day and time.
The mid-week call also offers the opportunity for quality control checks to be made, with respondents asked a series of validation questions about themselves, their household and the interviewer’s recruitment process.
HOW THE RATINGS ARE COLLECTED

Level 6, 157 Walker St, North Sydney, NSW 2060 T +61 2 9900 2888 F +61 2 9900 2828 W www.gfk.com/home © GfK
Sunday collection: metropolitan and regional
A telephone call is made on Saturday evening to confirm an approximate time for diary collection and to check that the diary has been completed fully, including the lifestyle questionnaire.
On Sunday at the end of each survey week, the interviewer conducts up to two personal collection visits to the respondent’s home in an effort to collect and clarify the diary in person. If the respondent is not at home on the second visit, the interviewer will leave a pre-paid envelope and a thank you card asking for the diary to be returned by post.
Paper Diary Data Collation
Once completed diaries are returned to GfK, they are subject to result coding by experienced staff members, independent of field interviewers. A diary may be given one of three codes: usable, nil listening, or unusable.
In-office coding procedures aim to check the consistency of diary records and the coding department will follow up with respondents to clarify information where necessary.
HOW THE RATINGS ARE COLLECTED
Level 6, 157 Walker St, North Sydney, NSW 2060 T +61 2 9900 2888 F +61 2 9900 2828 W www.gfk.com/home © GfK
The e-diary
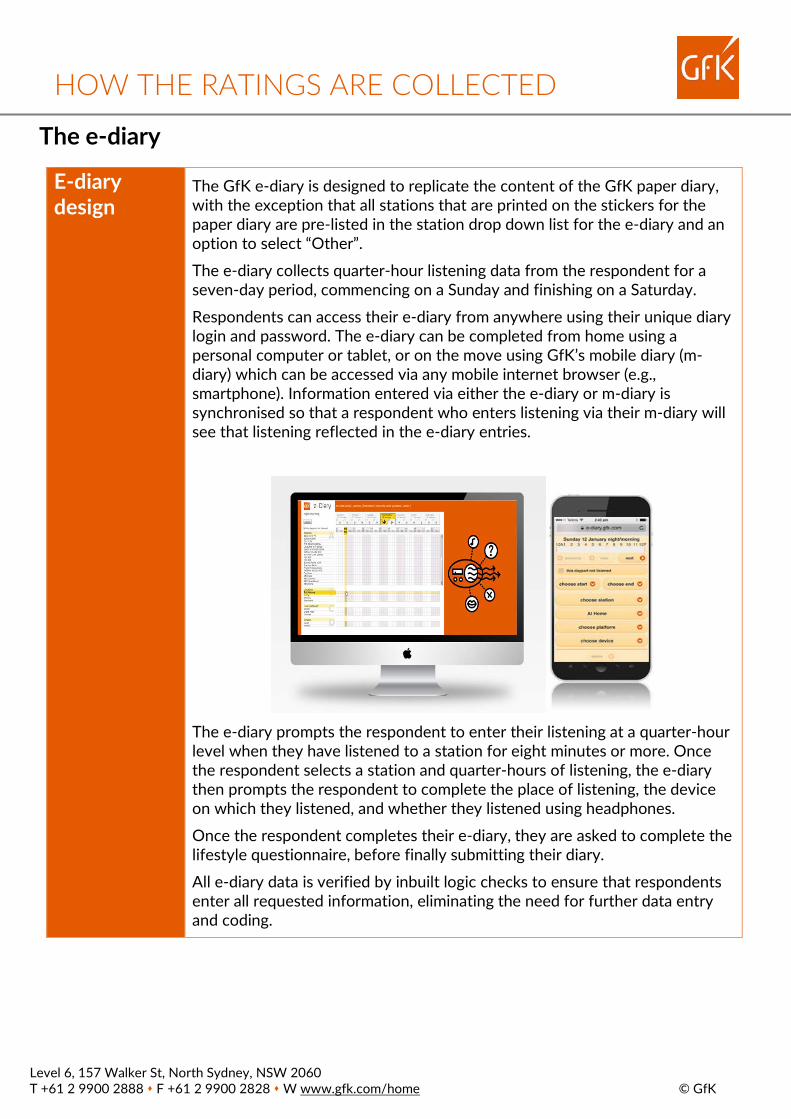
E-diary design
The GfK e-diary is designed to replicate the content of the GfK paper diary, with the exception that all stations that are printed on the stickers for the paper diary are pre-listed in the station drop down list for the e-diary and an option to select “Other”.
The e-diary collects quarter-hour listening data from the respondent for a seven-day period, commencing on a Sunday and finishing on a Saturday.
Respondents can access their e-diary from anywhere using their unique diary login and password. The e-diary can be completed from home using a personal computer or tablet, or on the move using GfK’s mobile diary (m-diary) which can be accessed via any mobile internet browser (e.g., smartphone). Information entered via either the e-diary or m-diary is synchronised so that a respondent who enters listening via their m-diary will see that listening reflected in the e-diary entries.
The e-diary prompts the respondent to enter their listening at a quarter-hour level when they have listened to a station for eight minutes or more. Once the respondent selects a station and quarter-hours of listening, the e-diary then prompts the respondent to complete the place of listening, the device on which they listened, and whether they listened using headphones.
Once the respondent completes their e-diary, they are asked to complete the lifestyle questionnaire, before finally submitting their diary.
All e-diary data is verified by inbuilt logic checks to ensure that respondents enter all requested information, eliminating the need for further data entry and coding.
HOW THE RATINGS ARE COLLECTED

Level 6, 157 Walker St, North Sydney, NSW 2060 T +61 2 9900 2888 F +61 2 9900 2828 W www.gfk.com/home © GfK
Producing the Radio Ratings
Data harmonisation
Data from the GfK paper diaries and e-diaries are combined or harmonised via GfK’s internal processing systems. Data is processed as a combined file and splits via diary collection method are not released.
Weighting the sample to create the
ratings
The data is weighted to adjust for differences between the achieved survey sample and the population profile of the market being surveyed.
Sample weights are calculated using a rim-weighting methodology, with age, sex and region population benchmarks (as determined by ABS figures), and used to produce estimates for the population aged ten or more in each market.
The weight associated with a respondent is effectively the number of people in the population that person represents. These weights adjust for differences in probabilities of selection and also calibrate the estimates to population benchmarks.
Error-free data
While every effort is made to ensure the data and reports are accurate and complete, each report is issued subject to any errors and omissions. GfK will take all immediate steps to rectify any inaccuracy or omission.
HOW THE RATINGS ARE COLLECTED

Level 6, 157 Walker St, North Sydney, NSW 2060 T +61 2 9900 2888 F +61 2 9900 2828 W www.gfk.com/home © GfK
Commercial Radio Australia Ltd is the national industry body representing Australia's commercial radio broadcasters.
Commercial radio broadcasting began in 1925. Commercial Radio Australia Ltd was established in 1930 as the Federation of Australian Radio Broadcasters (FARB). FARB became an incorporated company in 1993 and changed its name to Commercial Radio Australia Limited in 2002. FARB was founded with 33 members. Today, Commercial Radio Australia Ltd has 261 members, representing 99% of commercial radio licensees on air.
The Board of Commercial Radio Australia is elected by the industry at the annual general meeting and includes a chairman and a vice chairman (regional) and up to nine other directors, representing metropolitan and regional commercial radio broadcasters.
Commercial Radio Australia pursues a range of issues on behalf of its member stations. The staff of Commercial Radio Australia specialise in areas such as industrial relations, human resources, marketing, industry events management, industry regulation, advertising advice, audience surveys and research and digital radio.
Handy links:
• For more information on CRA please visit www.commercialradio.com.au
• To read the CRA Codes of Practice (note: you need to be a member to access this page) http://www.commercialradio.com.au/legal/regulation-codes
• Commercial Radio Calendar and Commercial Radio Stations Map
• For more information on radio advertising and surveys please visit www.radioalive.com.au
COMMERCIAL RADIO AUSTRALIA