2016 radio ratings tool kit - gfk global · 2016 radio ratings tool kit level 7, ... gfk radio...
TRANSCRIPT
2016
RADIO RATINGS TOOL KIT
Level 7, 107 Mount St, North Sydney, NSW 2060 T +61 2 9900 2888 F +61 2 9900 2828 W www.gfk.com/au © GfK
The 2016 Tool Kit provides all the information you require regarding the GfK radio ratings.
You can click on each link below to move straight to that section and select the GfK logo to return to this contents page.
• Understanding the radio ratings• The GfK radio team• 2016 survey schedule• 2016 radio reporting periods• 2016 rolling radio schedule - metropolitan• 2016 rolling radio schedule - regional• Survey area maps
- Sydney - Melbourne - Brisbane - Adelaide - Perth - Newcastle - Canberra - Gold Coast/Tweed Heads
• Metropolitan population potentials
• Regional population potentials
• 2016 radio ratings training calendar
• Occupation classifications
• 2016 lifestyle categories
• Radio ratings glossary
• Accessing and sourcing radio ratings
• How the ratings are collected
• Commercial Radio Australia
CONTENTS
Level 7, 107 Mount St, North Sydney, NSW 2060 T +61 2 9900 2888 F +61 2 9900 2828 W www.gfk.com/au © GfK
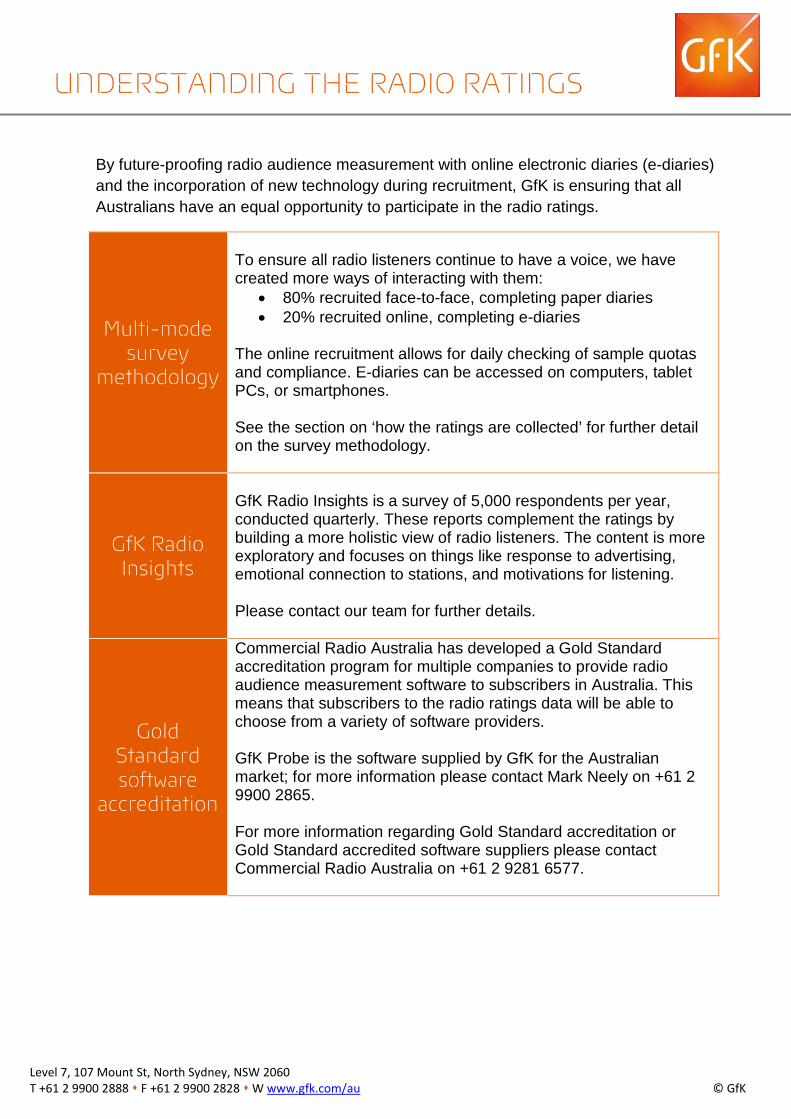
By future-proofing radio audience measurement with online electronic diaries (e-diaries) and the incorporation of new technology during recruitment, GfK is ensuring that all Australians have an equal opportunity to participate in the radio ratings.
Multi-mode survey
methodology
To ensure all radio listeners continue to have a voice, we have created more ways of interacting with them:
• 80% recruited face-to-face, completing paper diaries• 20% recruited online, completing e-diaries
The online recruitment allows for daily checking of sample quotas and compliance. E-diaries can be accessed on computers, tablet PCs, or smartphones.
See the section on ‘how the ratings are collected’ for further detail on the survey methodology.
GfK Radio Insights
GfK Radio Insights is a survey of 5,000 respondents per year, conducted quarterly. These reports complement the ratings by building a more holistic view of radio listeners. The content is more exploratory and focuses on things like response to advertising, emotional connection to stations, and motivations for listening.
Please contact our team for further details.
Gold Standard software
accreditation
Commercial Radio Australia has developed a Gold Standard accreditation program for multiple companies to provide radio audience measurement software to subscribers in Australia. This means that subscribers to the radio ratings data will be able to choose from a variety of software providers.
GfK Probe is the software supplied by GfK for the Australian market; for more information please contact Mark Neely on +61 2 9900 2865.
For more information regarding Gold Standard accreditation or Gold Standard accredited software suppliers please contact Commercial Radio Australia on +61 2 9281 6577.
UNDERSTANDING THE RADIO RATINGS
Level 7, 107 Mount St, North Sydney, NSW 2060 T +61 2 9900 2888 F +61 2 9900 2828 W www.gfk.com/au © GfK
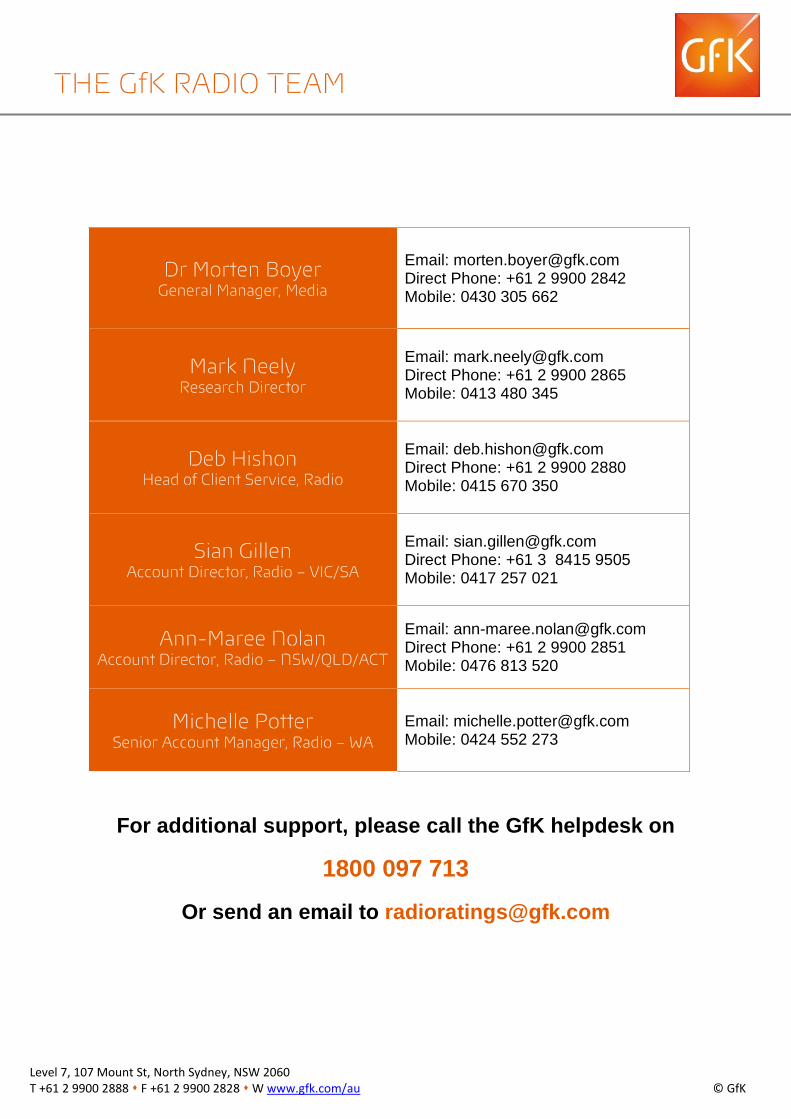
For additional support, please call the GfK helpdesk on
1800 097 713
Or send an email to [email protected]
Dr Morten Boyer General Manager, Media
Email: [email protected] Direct Phone: +61 2 9900 2842 Mobile: 0430 305 662
Mark Neely Research Director
Email: [email protected] Direct Phone: +61 2 9900 2865 Mobile: 0413 480 345
Deb Hishon Head of Client Service, Radio
Email: [email protected] Direct Phone: +61 2 9900 2880 Mobile: 0415 670 350
Sian Gillen Account Director, Radio – VIC/SA
Email: [email protected] Direct Phone: +61 3 8415 9505 Mobile: 0417 257 021
Ann-Maree Nolan Account Director, Radio – NSW/QLD/ACT
Email: [email protected] Direct Phone: +61 2 9900 2851 Mobile: 0476 813 520
Michelle Potter Senior Account Manager, Radio – WA
Email: [email protected] Mobile: 0424 552 273
THE GfK RADIO TEAM
Level 7, 107 Mount St, North Sydney, NSW 2060 T +61 2 9900 2888 F +61 2 9900 2828 W www.gfk.com/au © GfK
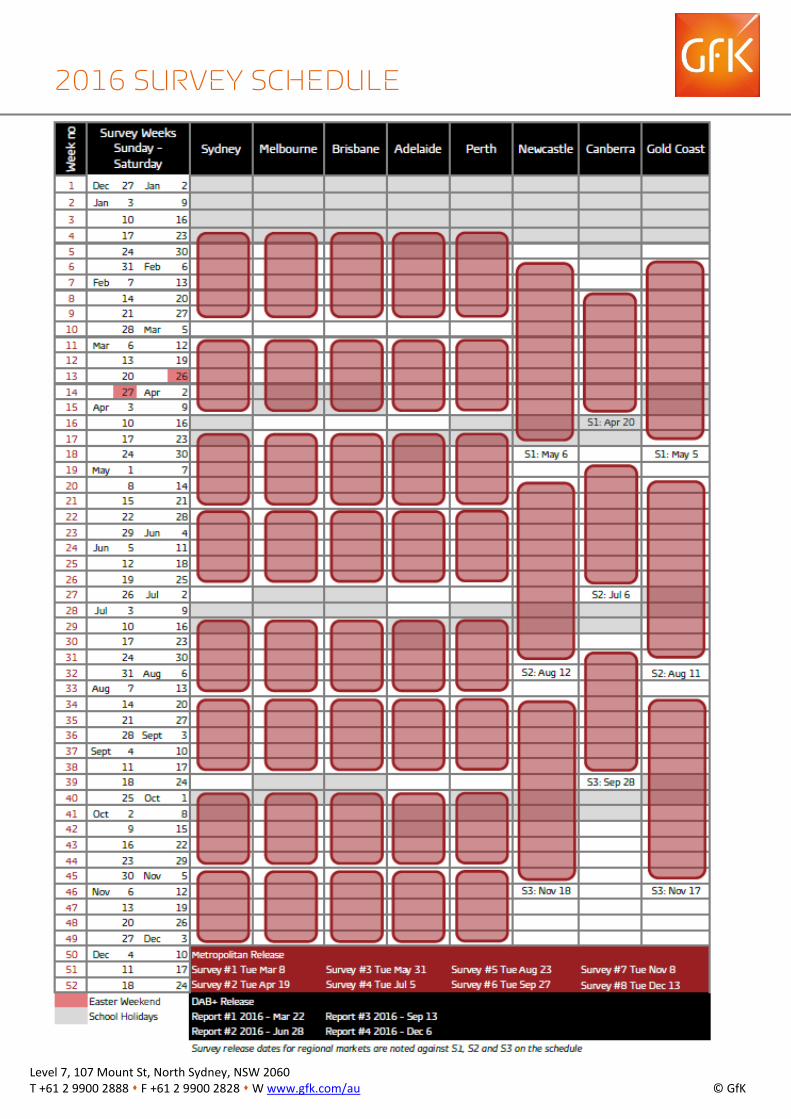
2016 SURVEY SCHEDULE
Level 7, 107 Mount St, North Sydney, NSW 2060 T +61 2 9900 2888 F +61 2 9900 2828 W www.gfk.com/au © GfK
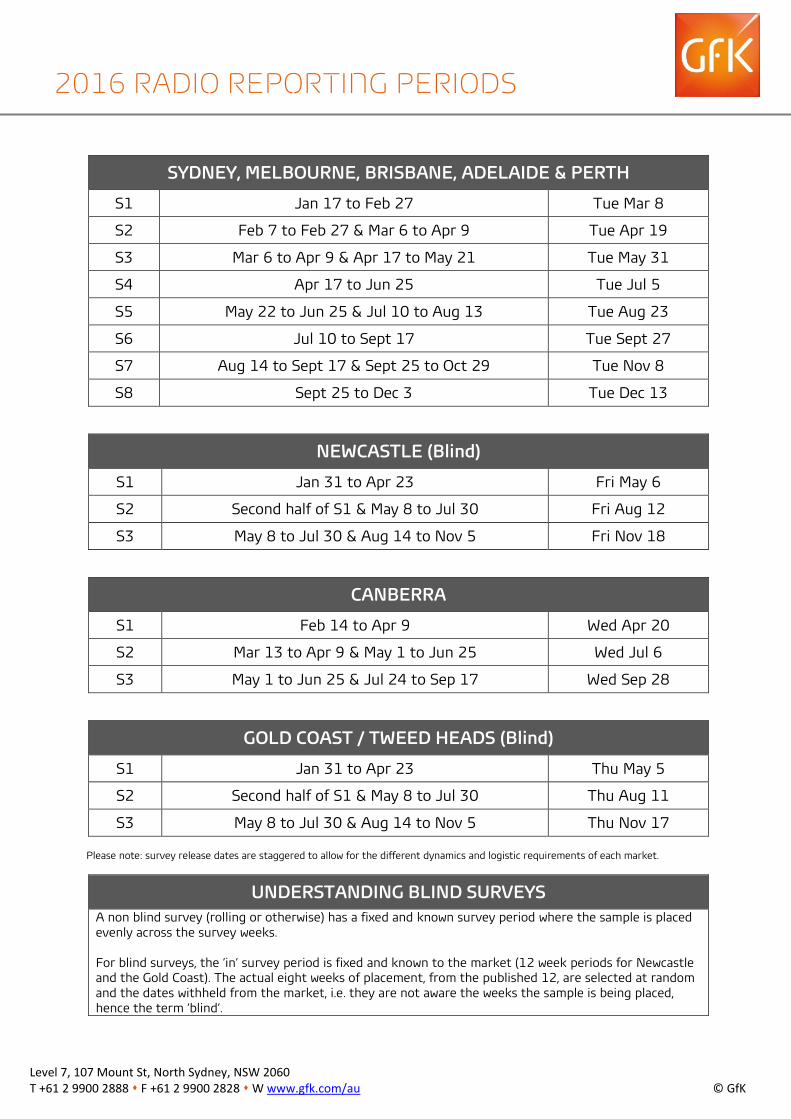
SYDNEY, MELBOURNE, BRISBANE, ADELAIDE & PERTH
S1 Jan 17 to Feb 27 Tue Mar 8
S2 Feb 7 to Feb 27 & Mar 6 to Apr 9 Tue Apr 19
S3 Mar 6 to Apr 9 & Apr 17 to May 21 Tue May 31
S4 Apr 17 to Jun 25 Tue Jul 5
S5 May 22 to Jun 25 & Jul 10 to Aug 13 Tue Aug 23
S6 Jul 10 to Sept 17 Tue Sept 27
S7 Aug 14 to Sept 17 & Sept 25 to Oct 29 Tue Nov 8
S8 Sept 25 to Dec 3 Tue Dec 13
NEWCASTLE (Blind)
S1 Jan 31 to Apr 23 Fri May 6
S2 Second half of S1 & May 8 to Jul 30 Fri Aug 12
S3 May 8 to Jul 30 & Aug 14 to Nov 5 Fri Nov 18
CANBERRA
S1 Feb 14 to Apr 9 Wed Apr 20
S2 Mar 13 to Apr 9 & May 1 to Jun 25 Wed Jul 6
S3 May 1 to Jun 25 & Jul 24 to Sep 17 Wed Sep 28
GOLD COAST / TWEED HEADS (Blind)
S1 Jan 31 to Apr 23 Thu May 5
S2 Second half of S1 & May 8 to Jul 30 Thu Aug 11
S3 May 8 to Jul 30 & Aug 14 to Nov 5 Thu Nov 17
Please note: survey release dates are staggered to allow for the different dynamics and logistic requirements of each market.
UNDERSTANDING BLIND SURVEYS A non blind survey (rolling or otherwise) has a fixed and known survey period where the sample is placed evenly across the survey weeks.
For blind surveys, the ‘in’ survey period is fixed and known to the market (12 week periods for Newcastle and the Gold Coast). The actual eight weeks of placement, from the published 12, are selected at random and the dates withheld from the market, i.e. they are not aware the weeks the sample is being placed, hence the term ‘blind’.
2016 RADIO REPORTING PERIODS
Level 7, 107 Mount St, North Sydney, NSW 2060 T +61 2 9900 2888 F +61 2 9900 2828 W www.gfk.com/au © GfK
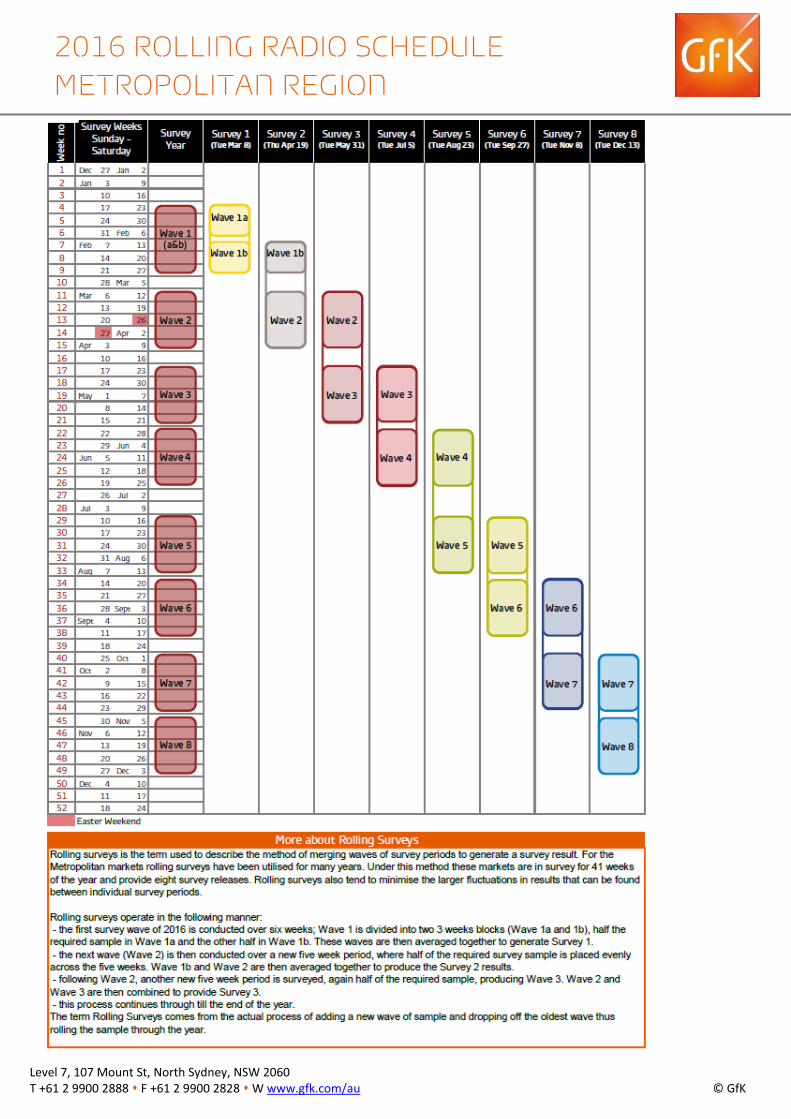
2016 ROLLING RADIO SCHEDULE METROPOLITAN REGION 2016 ROLLING RADIO SCHEDULE METROPOLITAN REGION
Level 7, 107 Mount St, North Sydney, NSW 2060 T +61 2 9900 2888 F +61 2 9900 2828 W www.gfk.com/au © GfK
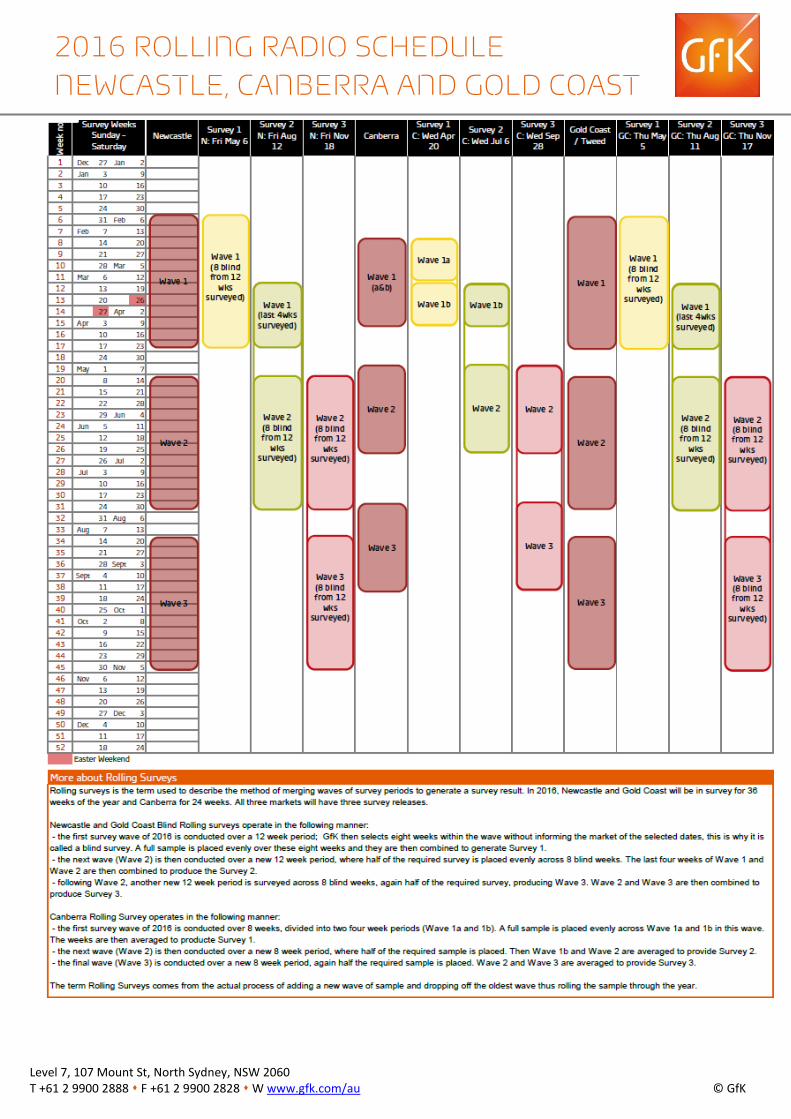
2016 ROLLING RADIO SCHEDULE METROPOLITAN REGION 2016 ROLLING RADIO SCHEDULE NEWCASTLE, CANBERRA AND GOLD COAST
Level 7, 107 Mount St, North Sydney, NSW 2060 T +61 2 9900 2888 F +61 2 9900 2828 W www.gfk.com/au © GfK
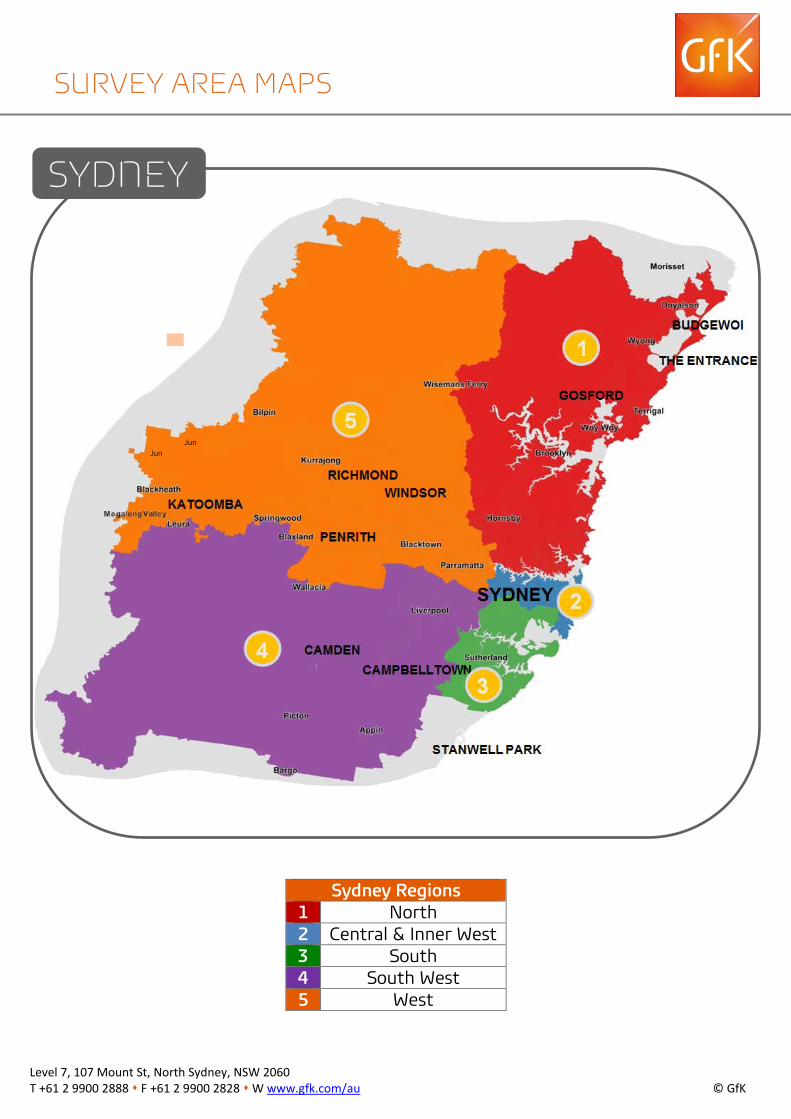
Sydney Regions 1 North 2 Central & Inner West 3 South 4 South West 5 West
SURVEY AREA MAPS
SYDNEY
Jun Jun
Level 7, 107 Mount St, North Sydney, NSW 2060 T +61 2 9900 2888 F +61 2 9900 2828 W www.gfk.com/au © GfK
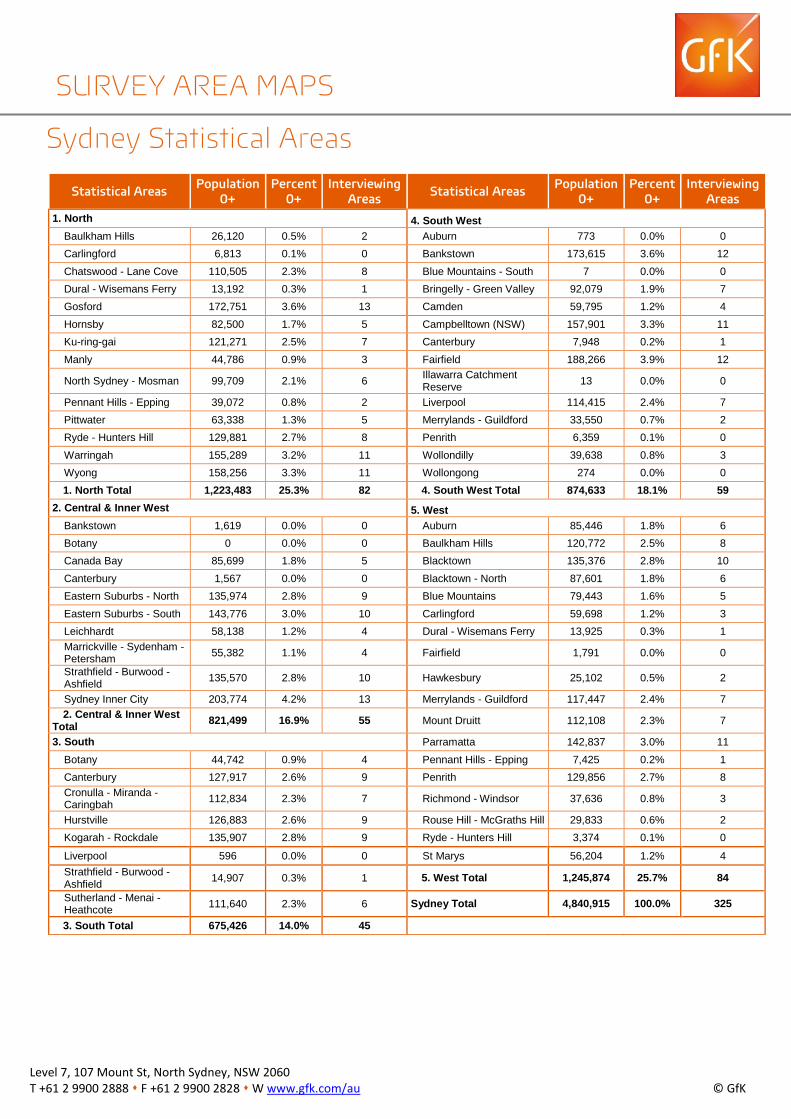
Sydney Statistical Areas
Statistical Areas Population 0+
Percent 0+
Interviewing Areas Statistical Areas Population
0+ Percent
0+ Interviewing
Areas 1. North 4. South West
Baulkham Hills 26,120 0.5% 2 Auburn 773 0.0% 0 Carlingford 6,813 0.1% 0 Bankstown 173,615 3.6% 12 Chatswood - Lane Cove 110,505 2.3% 8 Blue Mountains - South 7 0.0% 0 Dural - Wisemans Ferry 13,192 0.3% 1 Bringelly - Green Valley 92,079 1.9% 7 Gosford 172,751 3.6% 13 Camden 59,795 1.2% 4 Hornsby 82,500 1.7% 5 Campbelltown (NSW) 157,901 3.3% 11 Ku-ring-gai 121,271 2.5% 7 Canterbury 7,948 0.2% 1 Manly 44,786 0.9% 3 Fairfield 188,266 3.9% 12
North Sydney - Mosman 99,709 2.1% 6 Illawarra Catchment Reserve 13 0.0% 0
Pennant Hills - Epping 39,072 0.8% 2 Liverpool 114,415 2.4% 7 Pittwater 63,338 1.3% 5 Merrylands - Guildford 33,550 0.7% 2 Ryde - Hunters Hill 129,881 2.7% 8 Penrith 6,359 0.1% 0 Warringah 155,289 3.2% 11 Wollondilly 39,638 0.8% 3 Wyong 158,256 3.3% 11 Wollongong 274 0.0% 0 1. North Total 1,223,483 25.3% 82 4. South West Total 874,633 18.1% 59
2. Central & Inner West 5. WestBankstown 1,619 0.0% 0 Auburn 85,446 1.8% 6 Botany 0 0.0% 0 Baulkham Hills 120,772 2.5% 8 Canada Bay 85,699 1.8% 5 Blacktown 135,376 2.8% 10 Canterbury 1,567 0.0% 0 Blacktown - North 87,601 1.8% 6 Eastern Suburbs - North 135,974 2.8% 9 Blue Mountains 79,443 1.6% 5 Eastern Suburbs - South 143,776 3.0% 10 Carlingford 59,698 1.2% 3 Leichhardt 58,138 1.2% 4 Dural - Wisemans Ferry 13,925 0.3% 1 Marrickville - Sydenham - Petersham 55,382 1.1% 4 Fairfield 1,791 0.0% 0
Strathfield - Burwood - Ashfield 135,570 2.8% 10 Hawkesbury 25,102 0.5% 2
Sydney Inner City 203,774 4.2% 13 Merrylands - Guildford 117,447 2.4% 7 2. Central & Inner West
Total 821,499 16.9% 55 Mount Druitt 112,108 2.3% 7
3. South Parramatta 142,837 3.0% 11 Botany 44,742 0.9% 4 Pennant Hills - Epping 7,425 0.2% 1 Canterbury 127,917 2.6% 9 Penrith 129,856 2.7% 8 Cronulla - Miranda - Caringbah 112,834 2.3% 7 Richmond - Windsor 37,636 0.8% 3
Hurstville 126,883 2.6% 9 Rouse Hill - McGraths Hill 29,833 0.6% 2 Kogarah - Rockdale 135,907 2.8% 9 Ryde - Hunters Hill 3,374 0.1% 0
Liverpool 596 0.0% 0 St Marys 56,204 1.2% 4 Strathfield - Burwood - Ashfield 14,907 0.3% 1 5. West Total 1,245,874 25.7% 84
Sutherland - Menai - Heathcote 111,640 2.3% 6 Sydney Total 4,840,915 100.0% 325
3. South Total 675,426 14.0% 45
SURVEY AREA MAPS
Level 7, 107 Mount St, North Sydney, NSW 2060 T +61 2 9900 2888 F +61 2 9900 2828 W www.gfk.com/au © GfK
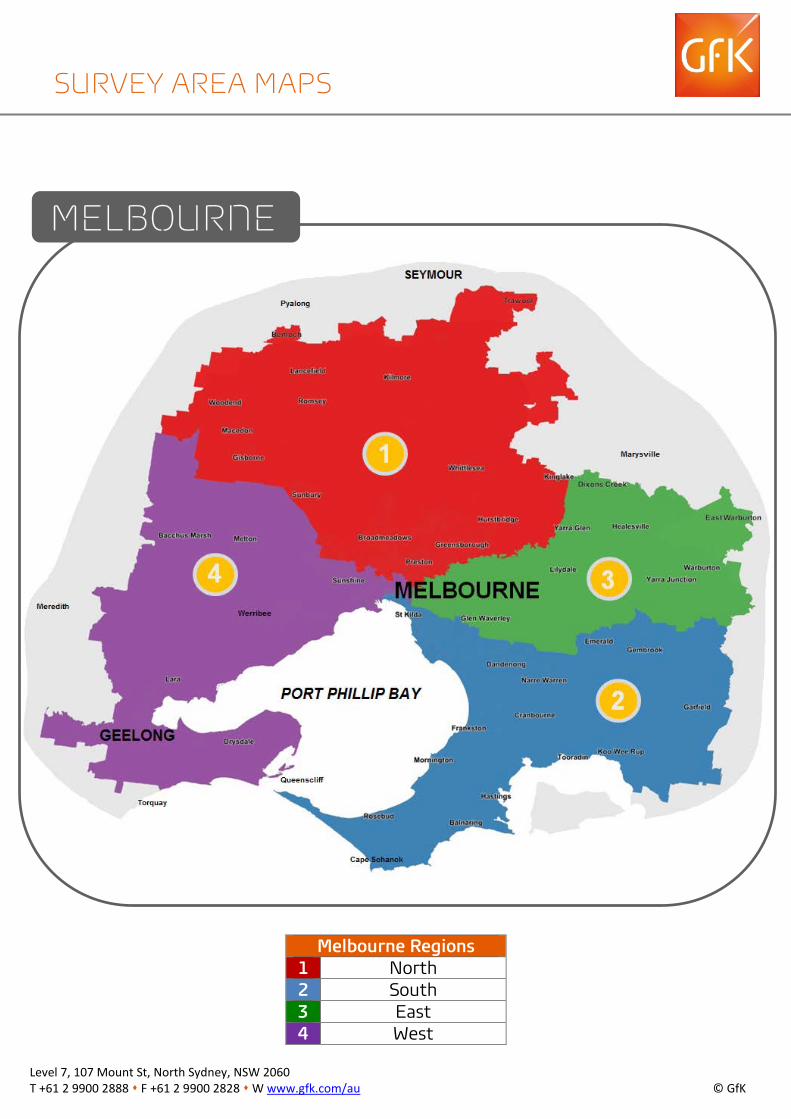
Melbourne Regions 1 North 2 South 3 East 4 West
MELBOURNE
SURVEY AREA MAPS
Level 7, 107 Mount St, North Sydney, NSW 2060 T +61 2 9900 2888 F +61 2 9900 2828 W www.gfk.com/au © GfK
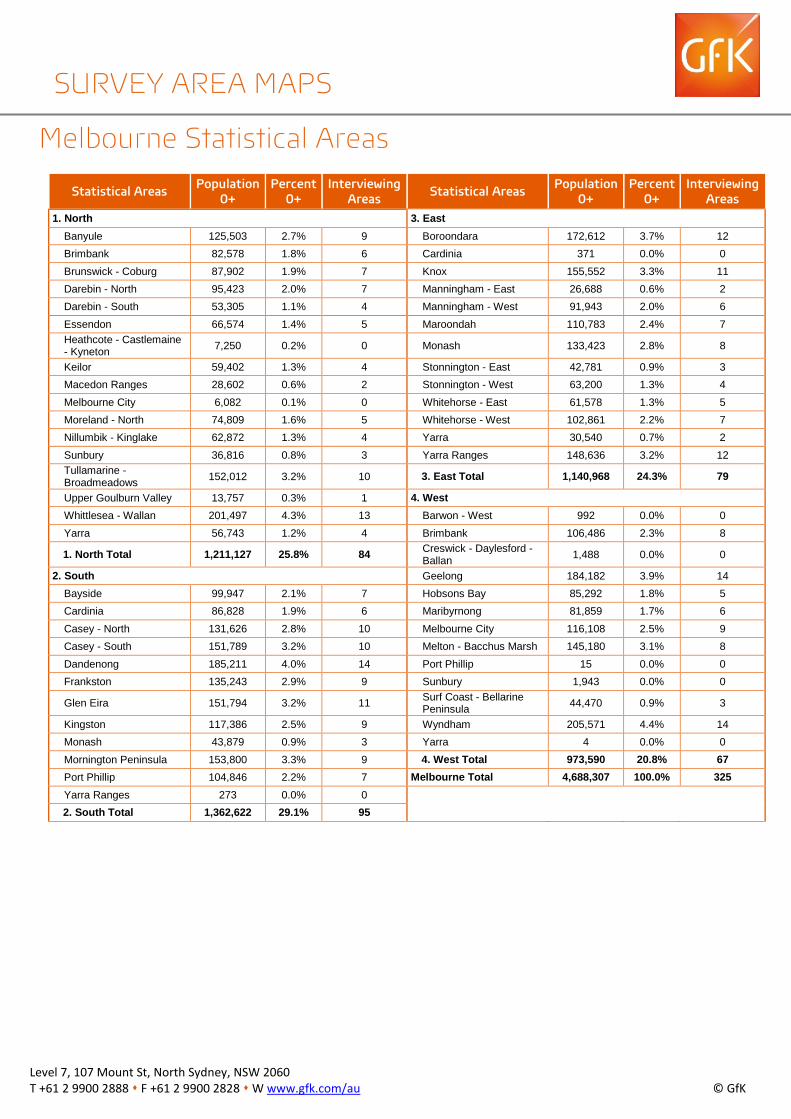
Melbourne Statistical Areas
Statistical Areas Population 0+
Percent 0+
Interviewing Areas Statistical Areas Population
0+ Percent
0+ Interviewing
Areas 1. North 3. East
Banyule 125,503 2.7% 9 Boroondara 172,612 3.7% 12 Brimbank 82,578 1.8% 6 Cardinia 371 0.0% 0 Brunswick - Coburg 87,902 1.9% 7 Knox 155,552 3.3% 11 Darebin - North 95,423 2.0% 7 Manningham - East 26,688 0.6% 2 Darebin - South 53,305 1.1% 4 Manningham - West 91,943 2.0% 6 Essendon 66,574 1.4% 5 Maroondah 110,783 2.4% 7 Heathcote - Castlemaine - Kyneton 7,250 0.2% 0 Monash 133,423 2.8% 8
Keilor 59,402 1.3% 4 Stonnington - East 42,781 0.9% 3 Macedon Ranges 28,602 0.6% 2 Stonnington - West 63,200 1.3% 4 Melbourne City 6,082 0.1% 0 Whitehorse - East 61,578 1.3% 5 Moreland - North 74,809 1.6% 5 Whitehorse - West 102,861 2.2% 7 Nillumbik - Kinglake 62,872 1.3% 4 Yarra 30,540 0.7% 2 Sunbury 36,816 0.8% 3 Yarra Ranges 148,636 3.2% 12 Tullamarine - Broadmeadows 152,012 3.2% 10 3. East Total 1,140,968 24.3% 79
Upper Goulburn Valley 13,757 0.3% 1 4. WestWhittlesea - Wallan 201,497 4.3% 13 Barwon - West 992 0.0% 0 Yarra 56,743 1.2% 4 Brimbank 106,486 2.3% 8
1. North Total 1,211,127 25.8% 84 Creswick - Daylesford - Ballan 1,488 0.0% 0
2. South Geelong 184,182 3.9% 14 Bayside 99,947 2.1% 7 Hobsons Bay 85,292 1.8% 5 Cardinia 86,828 1.9% 6 Maribyrnong 81,859 1.7% 6 Casey - North 131,626 2.8% 10 Melbourne City 116,108 2.5% 9 Casey - South 151,789 3.2% 10 Melton - Bacchus Marsh 145,180 3.1% 8 Dandenong 185,211 4.0% 14 Port Phillip 15 0.0% 0 Frankston 135,243 2.9% 9 Sunbury 1,943 0.0% 0
Glen Eira 151,794 3.2% 11 Surf Coast - Bellarine Peninsula 44,470 0.9% 3
Kingston 117,386 2.5% 9 Wyndham 205,571 4.4% 14 Monash 43,879 0.9% 3 Yarra 4 0.0% 0 Mornington Peninsula 153,800 3.3% 9 4. West Total 973,590 20.8% 67 Port Phillip 104,846 2.2% 7 Melbourne Total 4,688,307 100.0% 325 Yarra Ranges 273 0.0% 0 2. South Total 1,362,622 29.1% 95
SURVEY AREA MAPS
Level 7, 107 Mount St, North Sydney, NSW 2060 T +61 2 9900 2888 F +61 2 9900 2828 W www.gfk.com/au © GfK
Sydney Regions 1 North 2 Central & Inner West 3 South 4 South West 5 West
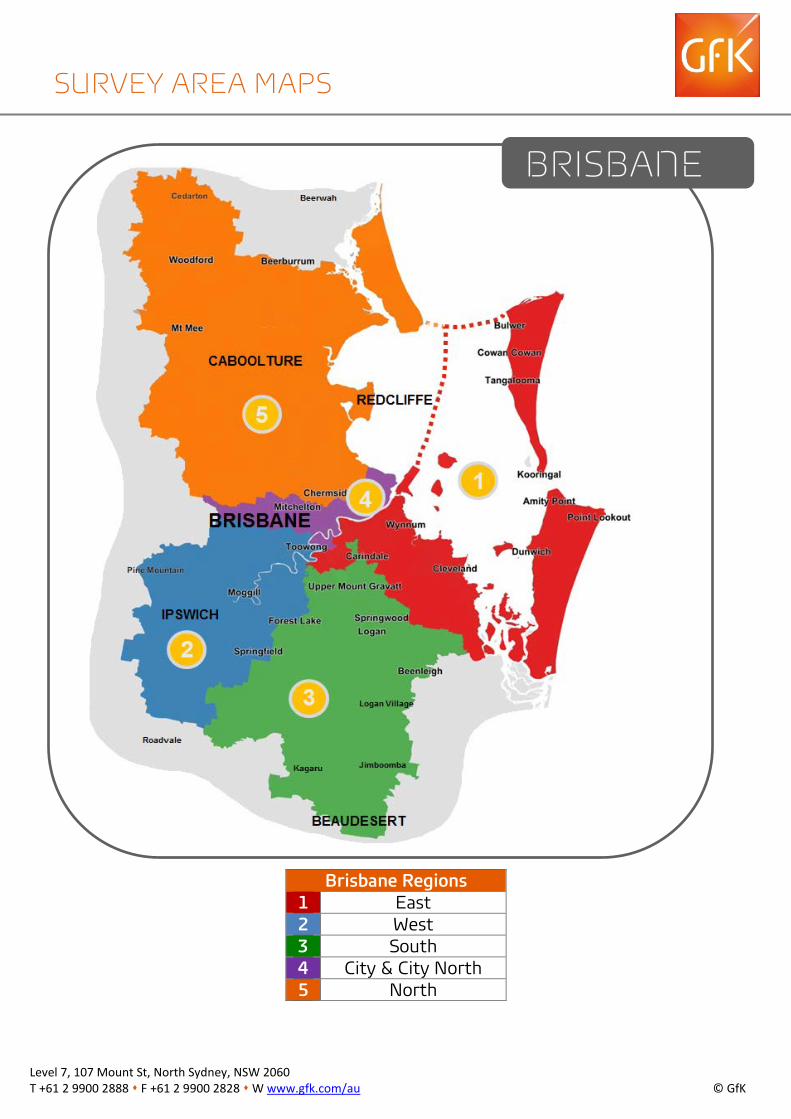
Brisbane Regions 1 East 2 West 3 South 4 City & City North 5 North
SURVEY AREA MAPS
BRISBANE
Level 7, 107 Mount St, North Sydney, NSW 2060 T +61 2 9900 2888 F +61 2 9900 2828 W www.gfk.com/au © GfK
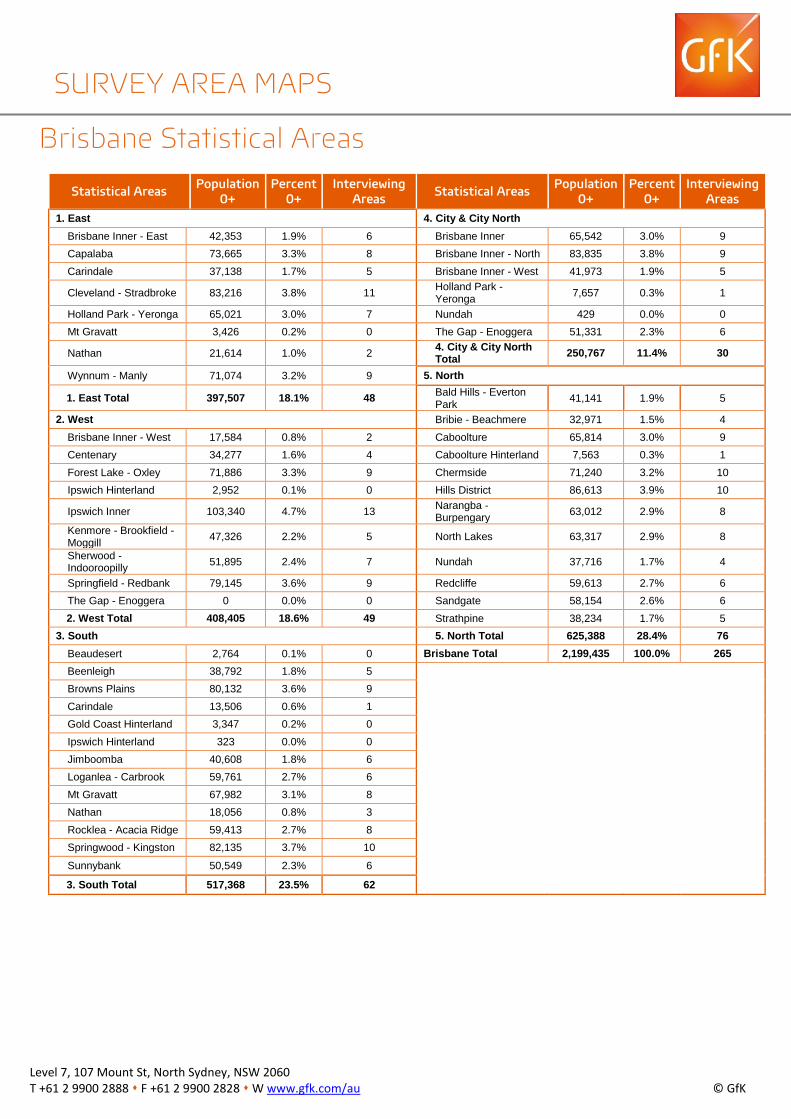
Brisbane Statistical Areas
Statistical Areas Population 0+
Percent 0+
Interviewing Areas Statistical Areas Population
0+ Percent
0+ Interviewing
Areas 1. East 4. City & City North
Brisbane Inner - East 42,353 1.9% 6 Brisbane Inner 65,542 3.0% 9 Capalaba 73,665 3.3% 8 Brisbane Inner - North 83,835 3.8% 9 Carindale 37,138 1.7% 5 Brisbane Inner - West 41,973 1.9% 5
Cleveland - Stradbroke 83,216 3.8% 11 Holland Park - Yeronga 7,657 0.3% 1
Holland Park - Yeronga 65,021 3.0% 7 Nundah 429 0.0% 0 Mt Gravatt 3,426 0.2% 0 The Gap - Enoggera 51,331 2.3% 6
Nathan 21,614 1.0% 2 4. City & City NorthTotal 250,767 11.4% 30
Wynnum - Manly 71,074 3.2% 9 5. North
1. East Total 397,507 18.1% 48 Bald Hills - Everton Park 41,141 1.9% 5
2. West Bribie - Beachmere 32,971 1.5% 4 Brisbane Inner - West 17,584 0.8% 2 Caboolture 65,814 3.0% 9 Centenary 34,277 1.6% 4 Caboolture Hinterland 7,563 0.3% 1 Forest Lake - Oxley 71,886 3.3% 9 Chermside 71,240 3.2% 10 Ipswich Hinterland 2,952 0.1% 0 Hills District 86,613 3.9% 10
Ipswich Inner 103,340 4.7% 13 Narangba - Burpengary 63,012 2.9% 8
Kenmore - Brookfield - Moggill 47,326 2.2% 5 North Lakes 63,317 2.9% 8
Sherwood - Indooroopilly 51,895 2.4% 7 Nundah 37,716 1.7% 4
Springfield - Redbank 79,145 3.6% 9 Redcliffe 59,613 2.7% 6 The Gap - Enoggera 0 0.0% 0 Sandgate 58,154 2.6% 6 2. West Total 408,405 18.6% 49 Strathpine 38,234 1.7% 5
3. South 5. North Total 625,388 28.4% 76 Beaudesert 2,764 0.1% 0 Brisbane Total 2,199,435 100.0% 265 Beenleigh 38,792 1.8% 5 Browns Plains 80,132 3.6% 9 Carindale 13,506 0.6% 1 Gold Coast Hinterland 3,347 0.2% 0 Ipswich Hinterland 323 0.0% 0 Jimboomba 40,608 1.8% 6 Loganlea - Carbrook 59,761 2.7% 6 Mt Gravatt 67,982 3.1% 8 Nathan 18,056 0.8% 3 Rocklea - Acacia Ridge 59,413 2.7% 8 Springwood - Kingston 82,135 3.7% 10
Sunnybank 50,549 2.3% 6
3. South Total 517,368 23.5% 62
SURVEY AREA MAPS
Level 7, 107 Mount St, North Sydney, NSW 2060 T +61 2 9900 2888 F +61 2 9900 2828 W www.gfk.com/au © GfK
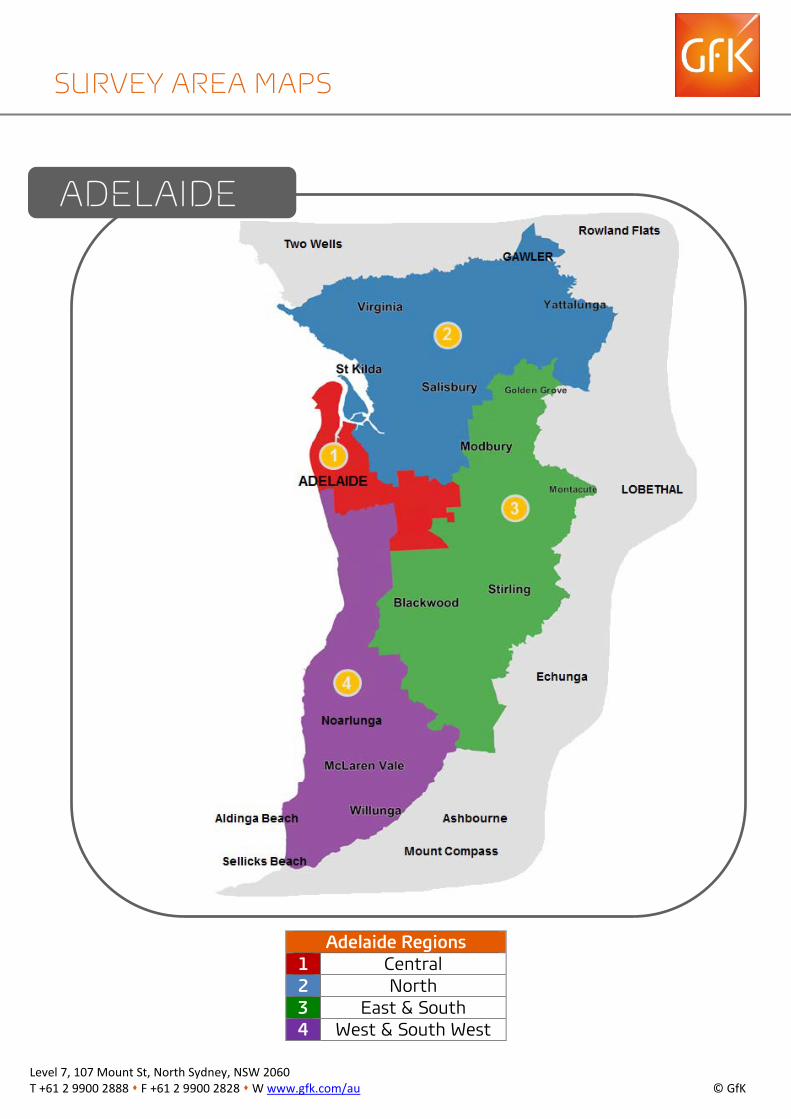
Adelaide Regions 1 Central 2 North 3 East & South 4 West & South West
SURVEY AREA MAPS
ADELAIDE
Level 7, 107 Mount St, North Sydney, NSW 2060 T +61 2 9900 2888 F +61 2 9900 2828 W www.gfk.com/au © GfK
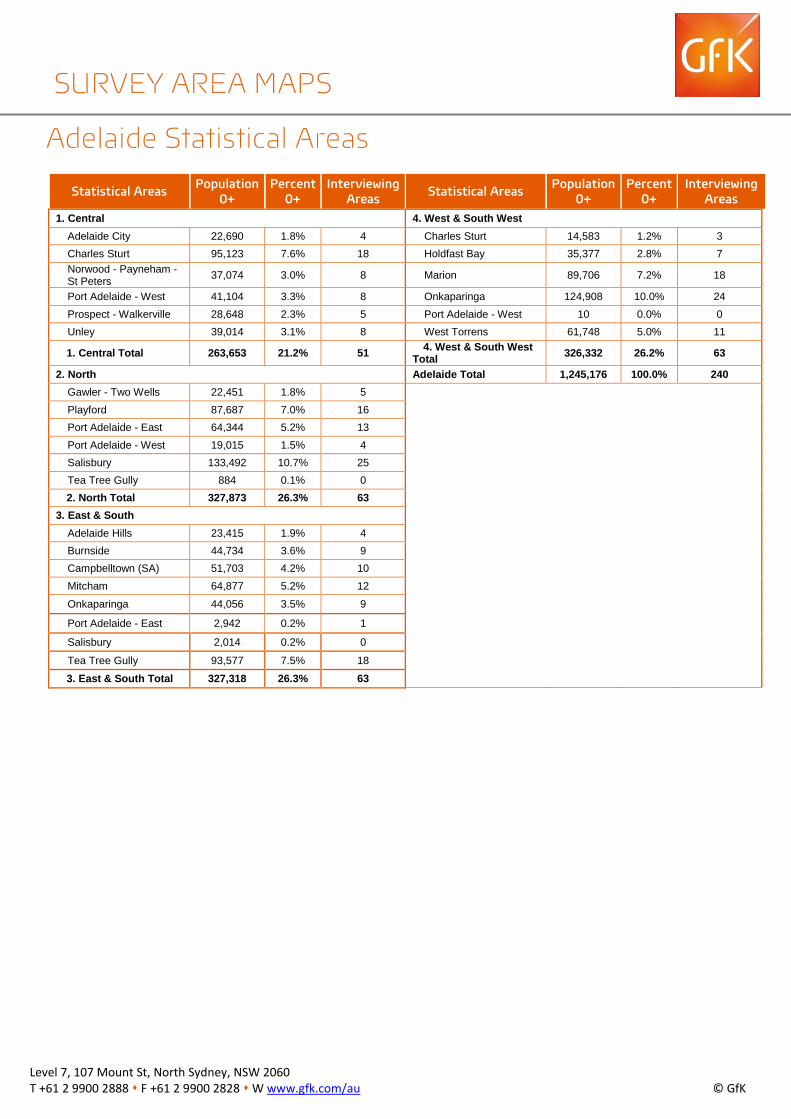
Adelaide Statistical Areas
Statistical Areas Population 0+
Percent 0+
Interviewing Areas Statistical Areas Population
0+ Percent
0+ Interviewing
Areas 1. Central 4. West & South West
Adelaide City 22,690 1.8% 4 Charles Sturt 14,583 1.2% 3 Charles Sturt 95,123 7.6% 18 Holdfast Bay 35,377 2.8% 7 Norwood - Payneham - St Peters 37,074 3.0% 8 Marion 89,706 7.2% 18
Port Adelaide - West 41,104 3.3% 8 Onkaparinga 124,908 10.0% 24 Prospect - Walkerville 28,648 2.3% 5 Port Adelaide - West 10 0.0% 0 Unley 39,014 3.1% 8 West Torrens 61,748 5.0% 11
1. Central Total 263,653 21.2% 51 4. West & South WestTotal 326,332 26.2% 63
2. North Adelaide Total 1,245,176 100.0% 240 Gawler - Two Wells 22,451 1.8% 5 Playford 87,687 7.0% 16 Port Adelaide - East 64,344 5.2% 13 Port Adelaide - West 19,015 1.5% 4 Salisbury 133,492 10.7% 25 Tea Tree Gully 884 0.1% 0 2. North Total 327,873 26.3% 63
3. East & SouthAdelaide Hills 23,415 1.9% 4 Burnside 44,734 3.6% 9 Campbelltown (SA) 51,703 4.2% 10 Mitcham 64,877 5.2% 12
Onkaparinga 44,056 3.5% 9
Port Adelaide - East 2,942 0.2% 1
Salisbury 2,014 0.2% 0
Tea Tree Gully 93,577 7.5% 18
3. East & South Total 327,318 26.3% 63
SURVEY AREA MAPS
Level 7, 107 Mount St, North Sydney, NSW 2060 T +61 2 9900 2888 F +61 2 9900 2828 W www.gfk.com/au © GfK
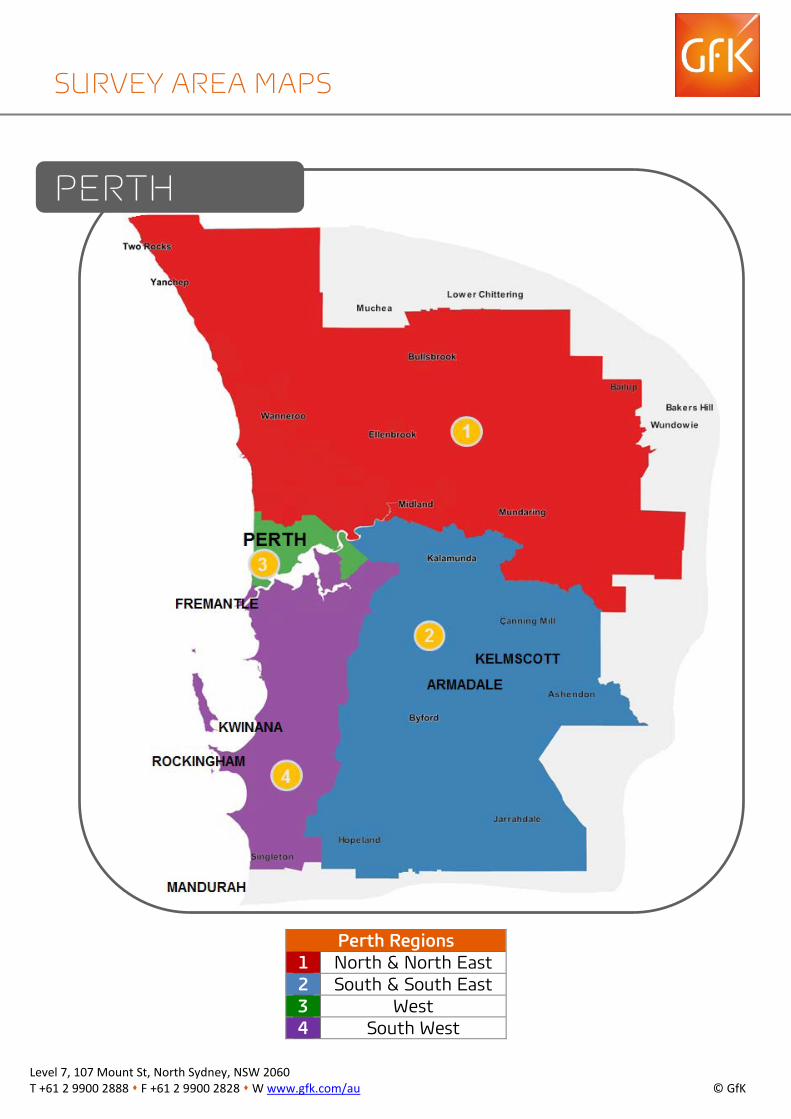
Perth Regions 1 North & North East 2 South & South East 3 West 4 South West
SURVEY AREA MAPS
PERTH
Level 7, 107 Mount St, North Sydney, NSW 2060 T +61 2 9900 2888 F +61 2 9900 2828 W www.gfk.com/au © GfK
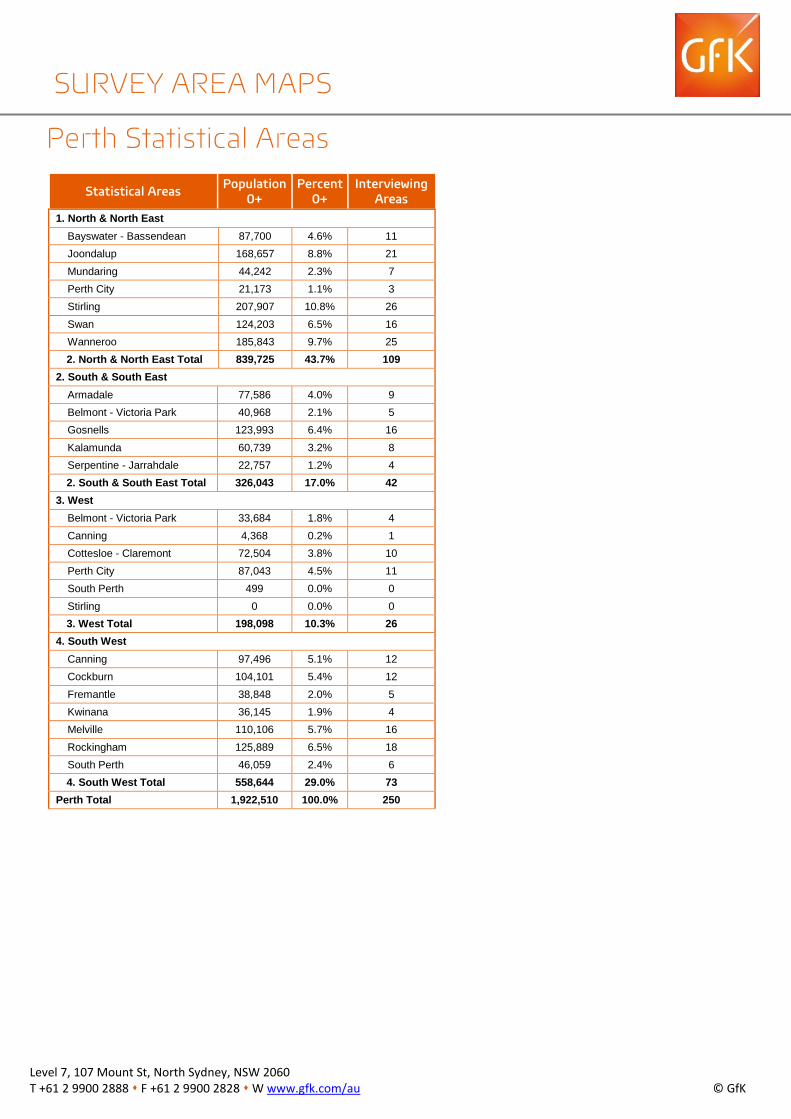
Perth Statistical Areas
Statistical Areas Population 0+
Percent 0+
Interviewing Areas
1. North & North EastBayswater - Bassendean 87,700 4.6% 11 Joondalup 168,657 8.8% 21 Mundaring 44,242 2.3% 7 Perth City 21,173 1.1% 3 Stirling 207,907 10.8% 26 Swan 124,203 6.5% 16 Wanneroo 185,843 9.7% 25 2. North & North East Total 839,725 43.7% 109
2. South & South EastArmadale 77,586 4.0% 9 Belmont - Victoria Park 40,968 2.1% 5 Gosnells 123,993 6.4% 16 Kalamunda 60,739 3.2% 8 Serpentine - Jarrahdale 22,757 1.2% 4 2. South & South East Total 326,043 17.0% 42
3. WestBelmont - Victoria Park 33,684 1.8% 4 Canning 4,368 0.2% 1 Cottesloe - Claremont 72,504 3.8% 10 Perth City 87,043 4.5% 11 South Perth 499 0.0% 0 Stirling 0 0.0% 0 3. West Total 198,098 10.3% 26
4. South WestCanning 97,496 5.1% 12 Cockburn 104,101 5.4% 12 Fremantle 38,848 2.0% 5 Kwinana 36,145 1.9% 4 Melville 110,106 5.7% 16 Rockingham 125,889 6.5% 18 South Perth 46,059 2.4% 6 4. South West Total 558,644 29.0% 73
Perth Total 1,922,510 100.0% 250
SURVEY AREA MAPS
Level 7, 107 Mount St, North Sydney, NSW 2060 T +61 2 9900 2888 F +61 2 9900 2828 W www.gfk.com/au © GfK

Newcastle Regions 1 Central & North 2 West 3 South
SURVEY AREA MAPS
NEWCASTLE
Level 7, 107 Mount St, North Sydney, NSW 2060 T +61 2 9900 2888 F +61 2 9900 2828 W www.gfk.com/au © GfK
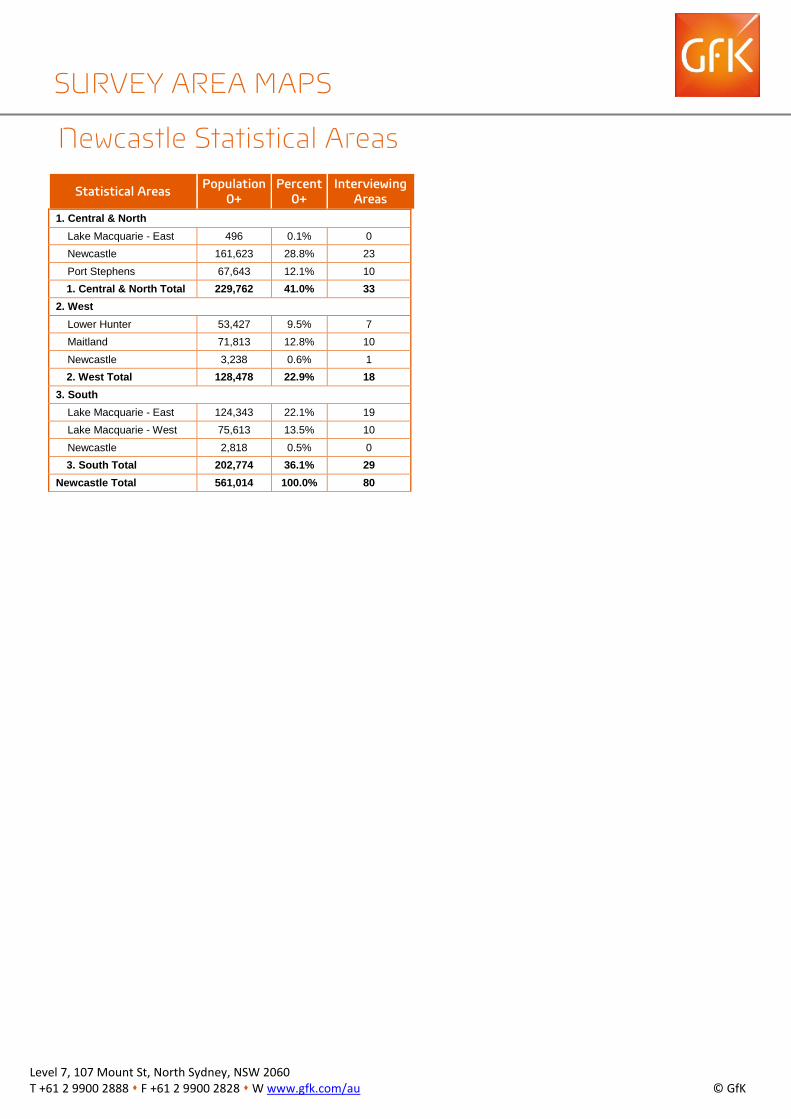
Newcastle Statistical Areas
Statistical Areas Population 0+
Percent 0+
Interviewing Areas
1. Central & North Lake Macquarie - East 496 0.1% 0 Newcastle 161,623 28.8% 23 Port Stephens 67,643 12.1% 10 1. Central & North Total 229,762 41.0% 33
2. West Lower Hunter 53,427 9.5% 7 Maitland 71,813 12.8% 10 Newcastle 3,238 0.6% 1 2. West Total 128,478 22.9% 18
3. South Lake Macquarie - East 124,343 22.1% 19 Lake Macquarie - West 75,613 13.5% 10 Newcastle 2,818 0.5% 0 3. South Total 202,774 36.1% 29
Newcastle Total 561,014 100.0% 80
SURVEY AREA MAPS
Level 7, 107 Mount St, North Sydney, NSW 2060 T +61 2 9900 2888 F +61 2 9900 2828 W www.gfk.com/au © GfK
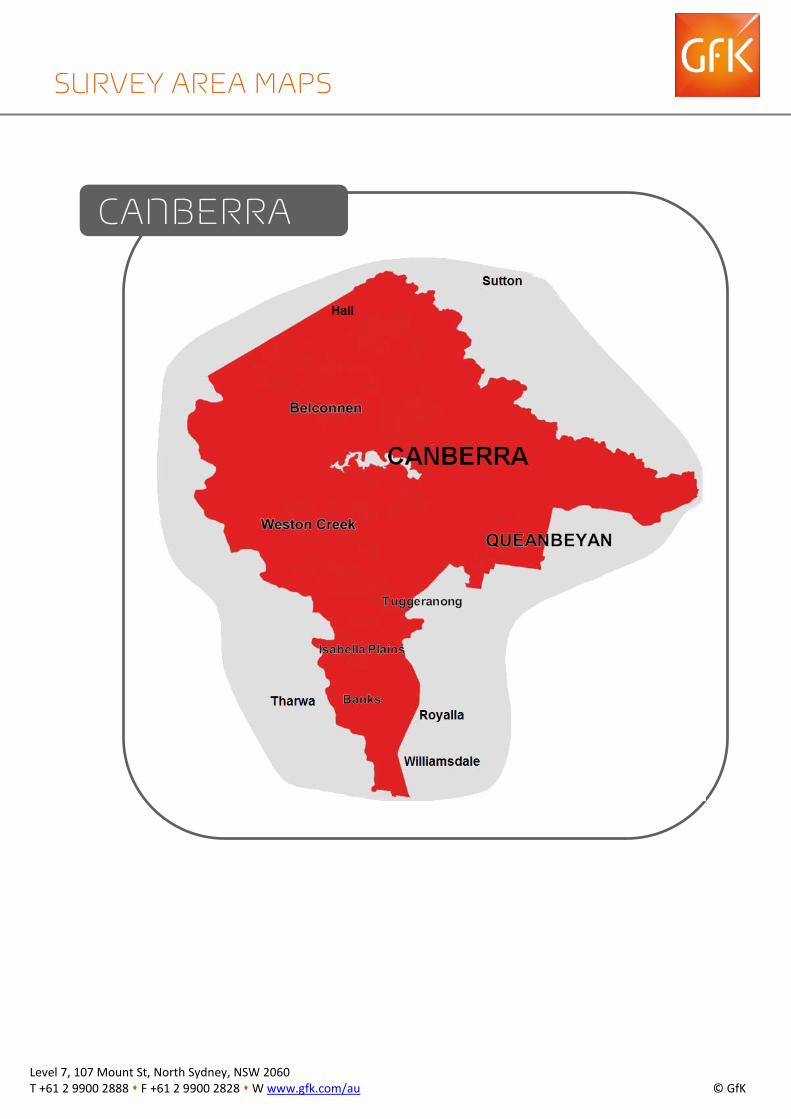
SURVEY AREA MAPS
CANBERRA
Level 7, 107 Mount St, North Sydney, NSW 2060 T +61 2 9900 2888 F +61 2 9900 2828 W www.gfk.com/au © GfK
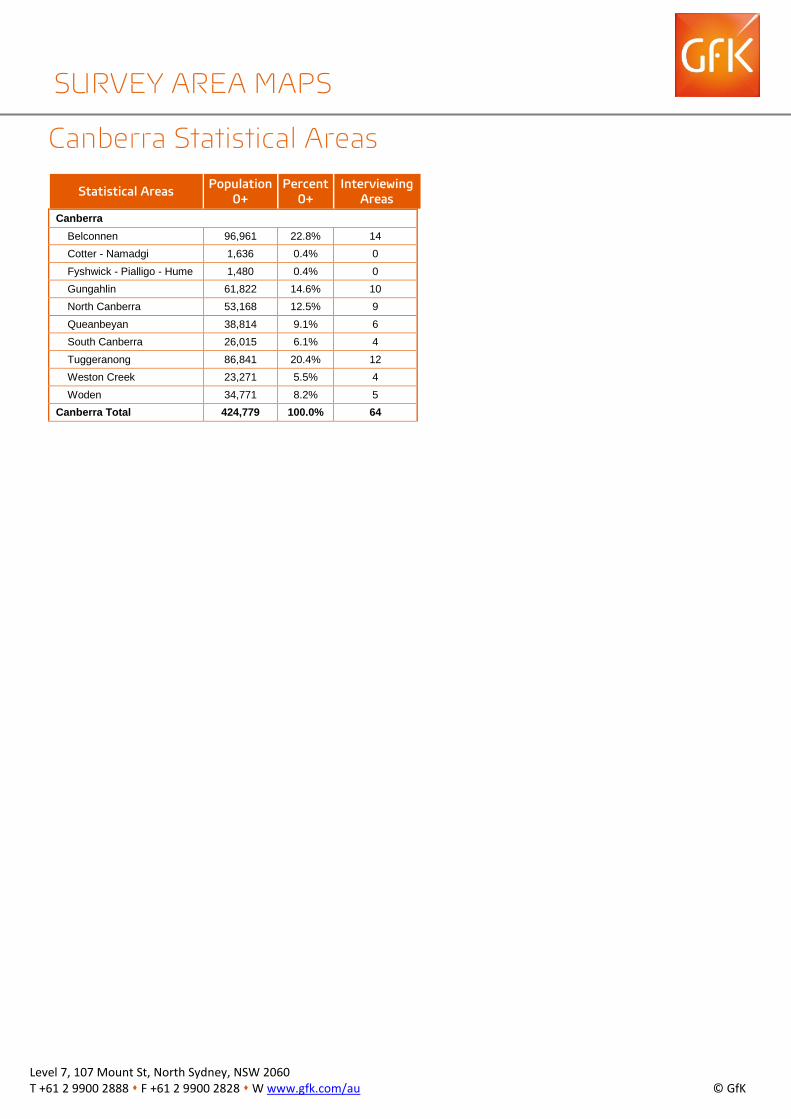
Canberra Statistical Areas
Statistical Areas Population 0+
Percent 0+
Interviewing Areas
Canberra Belconnen 96,961 22.8% 14 Cotter - Namadgi 1,636 0.4% 0 Fyshwick - Pialligo - Hume 1,480 0.4% 0 Gungahlin 61,822 14.6% 10 North Canberra 53,168 12.5% 9 Queanbeyan 38,814 9.1% 6 South Canberra 26,015 6.1% 4 Tuggeranong 86,841 20.4% 12 Weston Creek 23,271 5.5% 4 Woden 34,771 8.2% 5
Canberra Total 424,779 100.0% 64
SURVEY AREA MAPS
Level 7, 107 Mount St, North Sydney, NSW 2060 T +61 2 9900 2888 F +61 2 9900 2828 W www.gfk.com/au © GfK
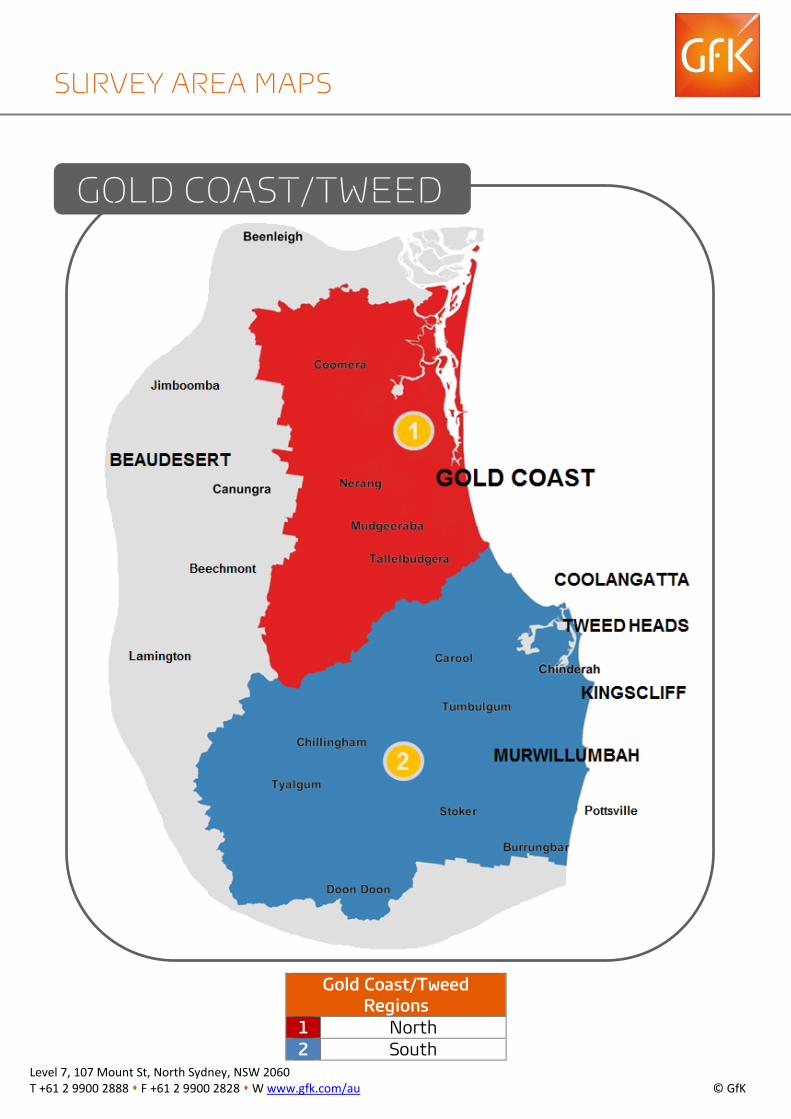
Gold Coast/Tweed Regions
1 North 2 South
SURVEY AREA MAPS
GOLD COAST/TWEED
Level 7, 107 Mount St, North Sydney, NSW 2060 T +61 2 9900 2888 F +61 2 9900 2828 W www.gfk.com/au © GfK
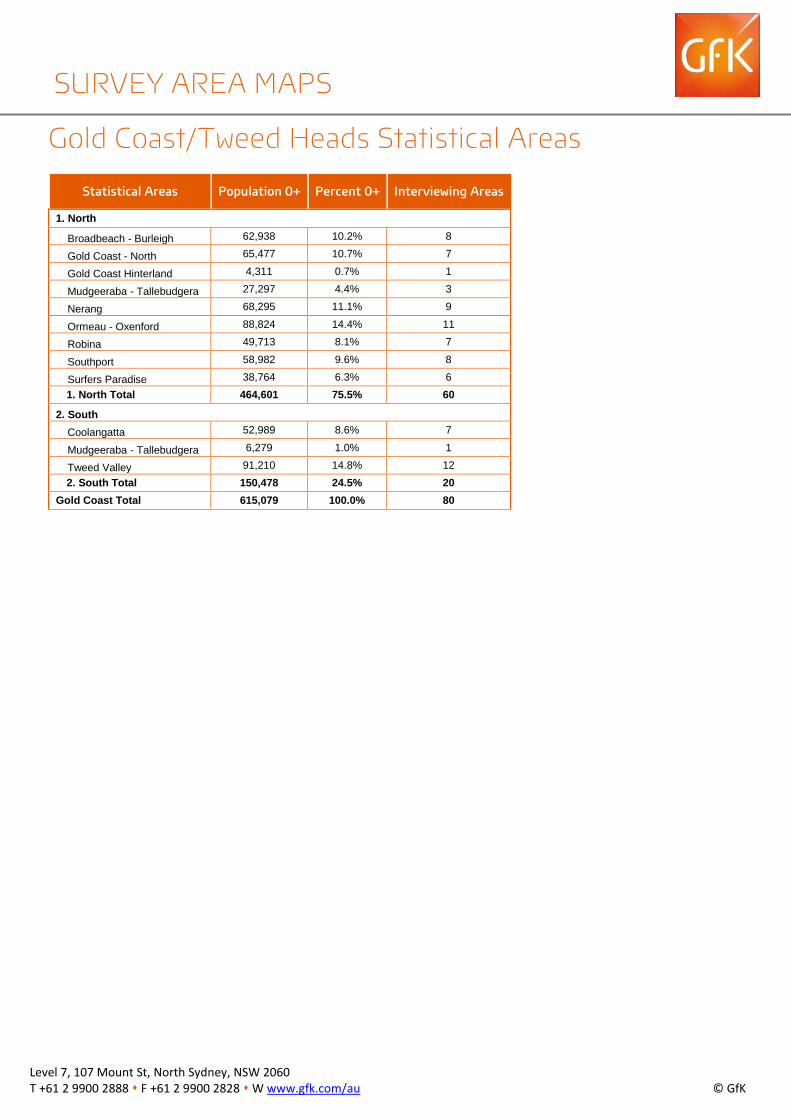
Gold Coast/Tweed Heads Statistical Areas
Statistical Areas Population 0+ Percent 0+ Interviewing Areas
1. North
Broadbeach - Burleigh 62,938 10.2% 8
Gold Coast - North 65,477 10.7% 7
Gold Coast Hinterland 4,311 0.7% 1
Mudgeeraba - Tallebudgera 27,297 4.4% 3
Nerang 68,295 11.1% 9
Ormeau - Oxenford 88,824 14.4% 11
Robina 49,713 8.1% 7
Southport 58,982 9.6% 8
Surfers Paradise 38,764 6.3% 6 1. North Total 464,601 75.5% 60
2. SouthCoolangatta 52,989 8.6% 7
Mudgeeraba - Tallebudgera 6,279 1.0% 1
Tweed Valley 91,210 14.8% 12 2. South Total 150,478 24.5% 20
Gold Coast Total 615,079 100.0% 80
SURVEY AREA MAPS
Level 7, 107 Mount St, North Sydney, NSW 2060 T +61 2 9900 2888 F +61 2 9900 2828 W www.gfk.com/au © GfK
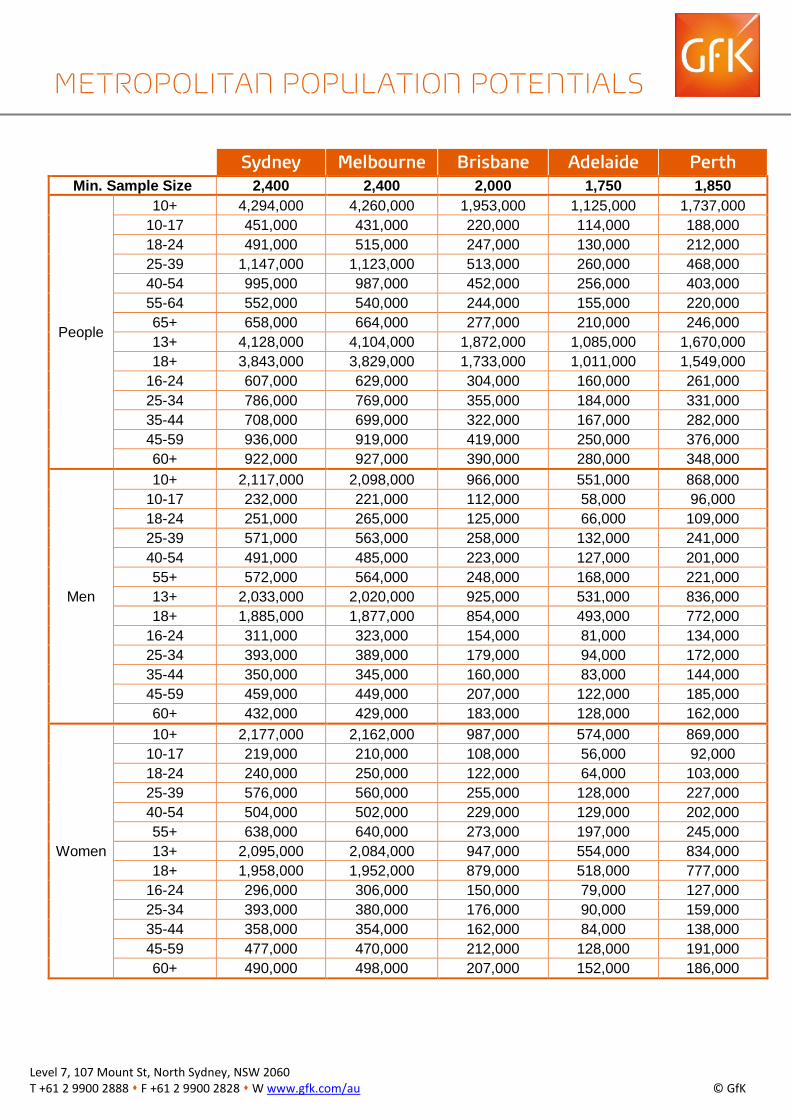
Sydney Melbourne Brisbane Adelaide Perth Min. Sample Size 2,400 2,400 2,000 1,750 1,850
People
10+ 4,294,000 4,260,000 1,953,000 1,125,000 1,737,000 10-17 451,000 431,000 220,000 114,000 188,000 18-24 491,000 515,000 247,000 130,000 212,000 25-39 1,147,000 1,123,000 513,000 260,000 468,000 40-54 995,000 987,000 452,000 256,000 403,000 55-64 552,000 540,000 244,000 155,000 220,000 65+ 658,000 664,000 277,000 210,000 246,000 13+ 4,128,000 4,104,000 1,872,000 1,085,000 1,670,000 18+ 3,843,000 3,829,000 1,733,000 1,011,000 1,549,000
16-24 607,000 629,000 304,000 160,000 261,000 25-34 786,000 769,000 355,000 184,000 331,000 35-44 708,000 699,000 322,000 167,000 282,000 45-59 936,000 919,000 419,000 250,000 376,000 60+ 922,000 927,000 390,000 280,000 348,000
Men
10+ 2,117,000 2,098,000 966,000 551,000 868,000 10-17 232,000 221,000 112,000 58,000 96,000 18-24 251,000 265,000 125,000 66,000 109,000 25-39 571,000 563,000 258,000 132,000 241,000 40-54 491,000 485,000 223,000 127,000 201,000 55+ 572,000 564,000 248,000 168,000 221,000 13+ 2,033,000 2,020,000 925,000 531,000 836,000 18+ 1,885,000 1,877,000 854,000 493,000 772,000
16-24 311,000 323,000 154,000 81,000 134,000 25-34 393,000 389,000 179,000 94,000 172,000 35-44 350,000 345,000 160,000 83,000 144,000 45-59 459,000 449,000 207,000 122,000 185,000 60+ 432,000 429,000 183,000 128,000 162,000
Women
10+ 2,177,000 2,162,000 987,000 574,000 869,000 10-17 219,000 210,000 108,000 56,000 92,000 18-24 240,000 250,000 122,000 64,000 103,000 25-39 576,000 560,000 255,000 128,000 227,000 40-54 504,000 502,000 229,000 129,000 202,000 55+ 638,000 640,000 273,000 197,000 245,000 13+ 2,095,000 2,084,000 947,000 554,000 834,000 18+ 1,958,000 1,952,000 879,000 518,000 777,000
16-24 296,000 306,000 150,000 79,000 127,000 25-34 393,000 380,000 176,000 90,000 159,000 35-44 358,000 354,000 162,000 84,000 138,000 45-59 477,000 470,000 212,000 128,000 191,000 60+ 490,000 498,000 207,000 152,000 186,000
METROPOLITAN POPULATION POTENTIALS
Level 7, 107 Mount St, North Sydney, NSW 2060 T +61 2 9900 2888 F +61 2 9900 2828 W www.gfk.com/au © GfK
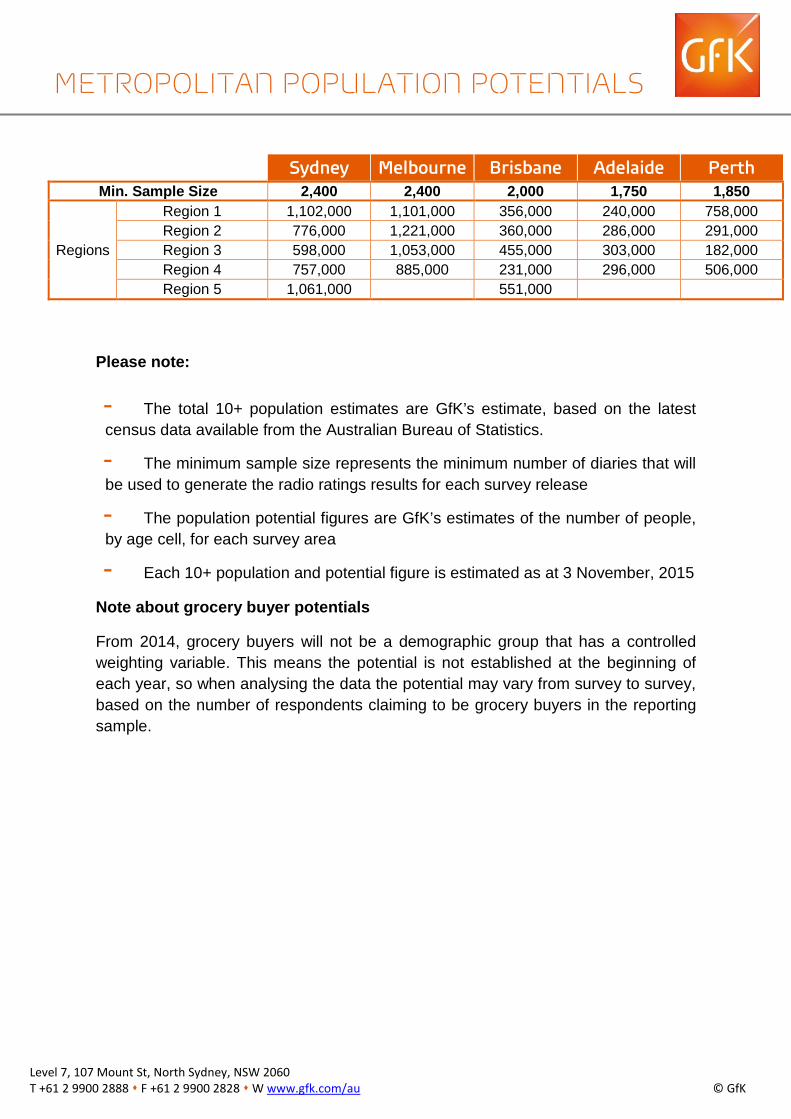
Sydney Melbourne Brisbane Adelaide Perth Min. Sample Size 2,400 2,400 2,000 1,750 1,850
Regions
Region 1 1,102,000 1,101,000 356,000 240,000 758,000 Region 2 776,000 1,221,000 360,000 286,000 291,000 Region 3 598,000 1,053,000 455,000 303,000 182,000 Region 4 757,000 885,000 231,000 296,000 506,000 Region 5 1,061,000 551,000
Please note:
- The total 10+ population estimates are GfK’s estimate, based on the latestcensus data available from the Australian Bureau of Statistics.
- The minimum sample size represents the minimum number of diaries that willbe used to generate the radio ratings results for each survey release
- The population potential figures are GfK’s estimates of the number of people,by age cell, for each survey area
- Each 10+ population and potential figure is estimated as at 3 November, 2015 Note about grocery buyer potentials
From 2014, grocery buyers will not be a demographic group that has a controlled weighting variable. This means the potential is not established at the beginning of each year, so when analysing the data the potential may vary from survey to survey, based on the number of respondents claiming to be grocery buyers in the reporting sample.
METROPOLITAN POPULATION POTENTIALS
Level 7, 107 Mount St, North Sydney, NSW 2060 T +61 2 9900 2888 F +61 2 9900 2828 W www.gfk.com/au © GfK
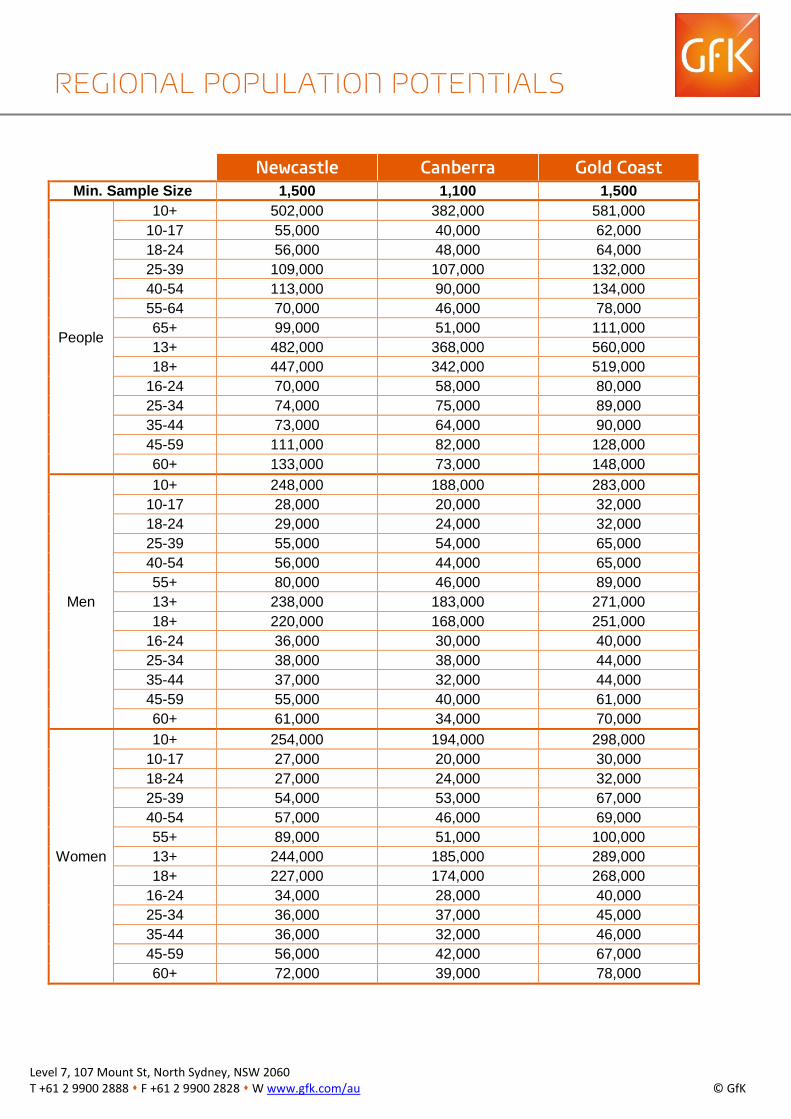
Newcastle Canberra Gold Coast Min. Sample Size 1,500 1,100 1,500
People
10+ 502,000 382,000 581,000 10-17 55,000 40,000 62,000 18-24 56,000 48,000 64,000 25-39 109,000 107,000 132,000 40-54 113,000 90,000 134,000 55-64 70,000 46,000 78,000 65+ 99,000 51,000 111,000 13+ 482,000 368,000 560,000 18+ 447,000 342,000 519,000
16-24 70,000 58,000 80,000 25-34 74,000 75,000 89,000 35-44 73,000 64,000 90,000 45-59 111,000 82,000 128,000 60+ 133,000 73,000 148,000
Men
10+ 248,000 188,000 283,000 10-17 28,000 20,000 32,000 18-24 29,000 24,000 32,000 25-39 55,000 54,000 65,000 40-54 56,000 44,000 65,000 55+ 80,000 46,000 89,000 13+ 238,000 183,000 271,000 18+ 220,000 168,000 251,000
16-24 36,000 30,000 40,000 25-34 38,000 38,000 44,000 35-44 37,000 32,000 44,000 45-59 55,000 40,000 61,000 60+ 61,000 34,000 70,000
Women
10+ 254,000 194,000 298,000 10-17 27,000 20,000 30,000 18-24 27,000 24,000 32,000 25-39 54,000 53,000 67,000 40-54 57,000 46,000 69,000 55+ 89,000 51,000 100,000 13+ 244,000 185,000 289,000 18+ 227,000 174,000 268,000
16-24 34,000 28,000 40,000 25-34 36,000 37,000 45,000 35-44 36,000 32,000 46,000 45-59 56,000 42,000 67,000 60+ 72,000 39,000 78,000
REGIONAL POPULATION POTENTIALS
Level 7, 107 Mount St, North Sydney, NSW 2060 T +61 2 9900 2888 F +61 2 9900 2828 W www.gfk.com/au © GfK
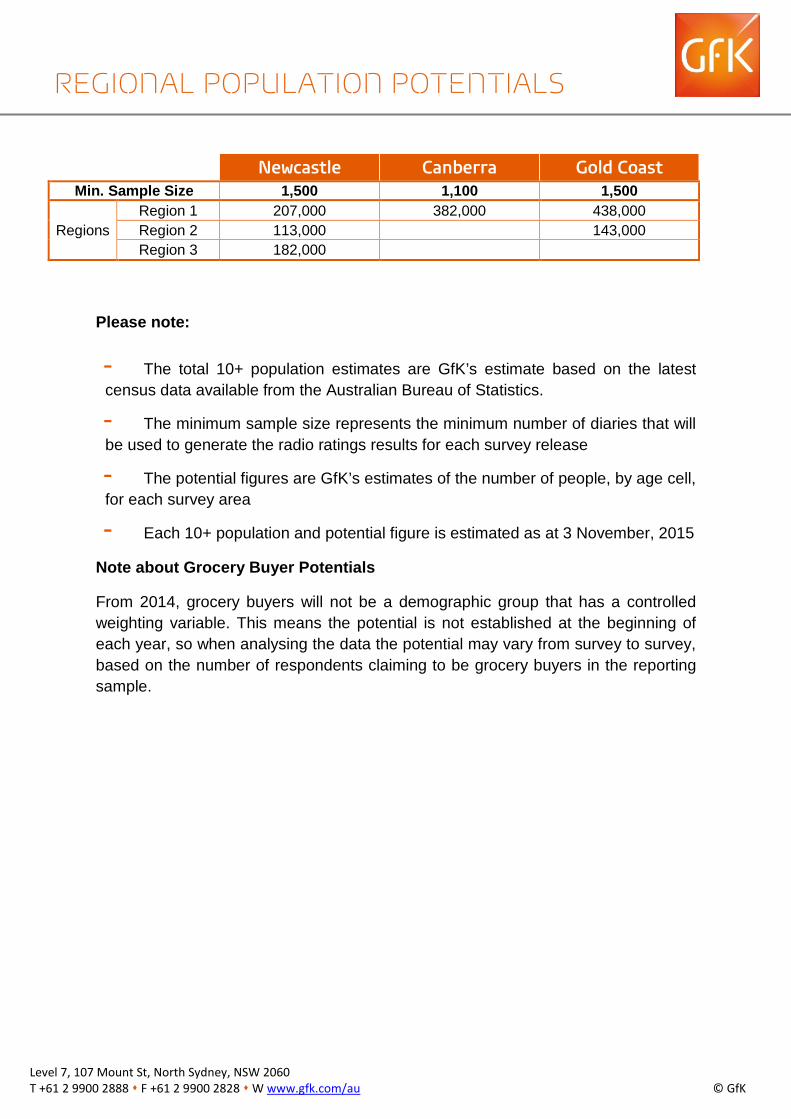
Newcastle Canberra Gold Coast Min. Sample Size 1,500 1,100 1,500
Regions Region 1 207,000 382,000 438,000 Region 2 113,000 143,000 Region 3 182,000
Please note:
- The total 10+ population estimates are GfK’s estimate based on the latestcensus data available from the Australian Bureau of Statistics.
- The minimum sample size represents the minimum number of diaries that willbe used to generate the radio ratings results for each survey release
- The potential figures are GfK’s estimates of the number of people, by age cell,for each survey area
- Each 10+ population and potential figure is estimated as at 3 November, 2015 Note about Grocery Buyer Potentials
From 2014, grocery buyers will not be a demographic group that has a controlled weighting variable. This means the potential is not established at the beginning of each year, so when analysing the data the potential may vary from survey to survey, based on the number of respondents claiming to be grocery buyers in the reporting sample.
REGIONAL POPULATION POTENTIALS
Level 7, 107 Mount St, North Sydney, NSW 2060 T +61 2 9900 2888 F +61 2 9900 2828 W www.gfk.com/au © GfK
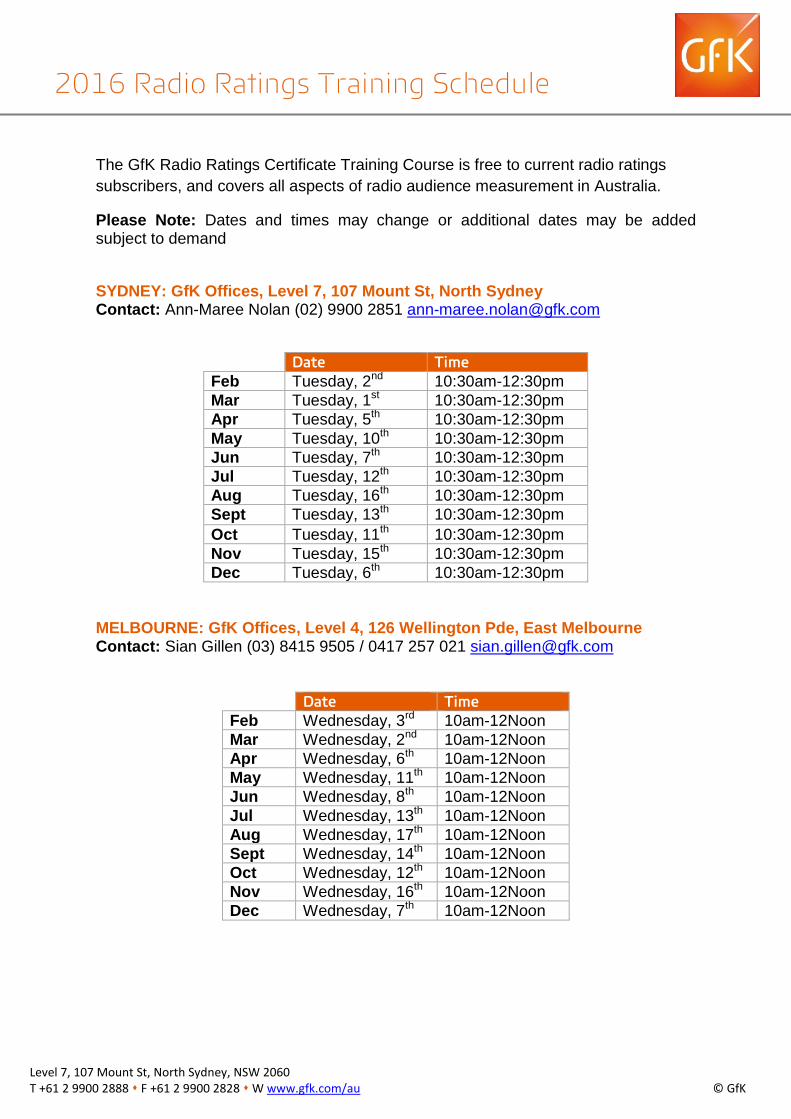
The GfK Radio Ratings Certificate Training Course is free to current radio ratings subscribers, and covers all aspects of radio audience measurement in Australia.
Please Note: Dates and times may change or additional dates may be added subject to demand
SYDNEY: GfK Offices, Level 7, 107 Mount St, North Sydney Contact: Ann-Maree Nolan (02) 9900 2851 [email protected]
Date Time Feb Tuesday, 2nd 10:30am-12:30pm Mar Tuesday, 1st 10:30am-12:30pm Apr Tuesday, 5th 10:30am-12:30pm May Tuesday, 10th 10:30am-12:30pm Jun Tuesday, 7th 10:30am-12:30pm Jul Tuesday, 12th 10:30am-12:30pm Aug Tuesday, 16th 10:30am-12:30pm Sept Tuesday, 13th 10:30am-12:30pm Oct Tuesday, 11th 10:30am-12:30pm Nov Tuesday, 15th 10:30am-12:30pm Dec Tuesday, 6th 10:30am-12:30pm
MELBOURNE: GfK Offices, Level 4, 126 Wellington Pde, East Melbourne Contact: Sian Gillen (03) 8415 9505 / 0417 257 021 [email protected]
Date Time Feb Wednesday, 3rd 10am-12Noon Mar Wednesday, 2nd 10am-12Noon Apr Wednesday, 6th 10am-12Noon May Wednesday, 11th 10am-12Noon Jun Wednesday, 8th 10am-12Noon Jul Wednesday, 13th 10am-12Noon Aug Wednesday, 17th 10am-12Noon Sept Wednesday, 14th 10am-12Noon Oct Wednesday, 12th 10am-12Noon Nov Wednesday, 16th 10am-12Noon Dec Wednesday, 7th 10am-12Noon
2016 Radio Ratings Training Schedule
Level 7, 107 Mount St, North Sydney, NSW 2060 T +61 2 9900 2888 F +61 2 9900 2828 W www.gfk.com/au © GfK
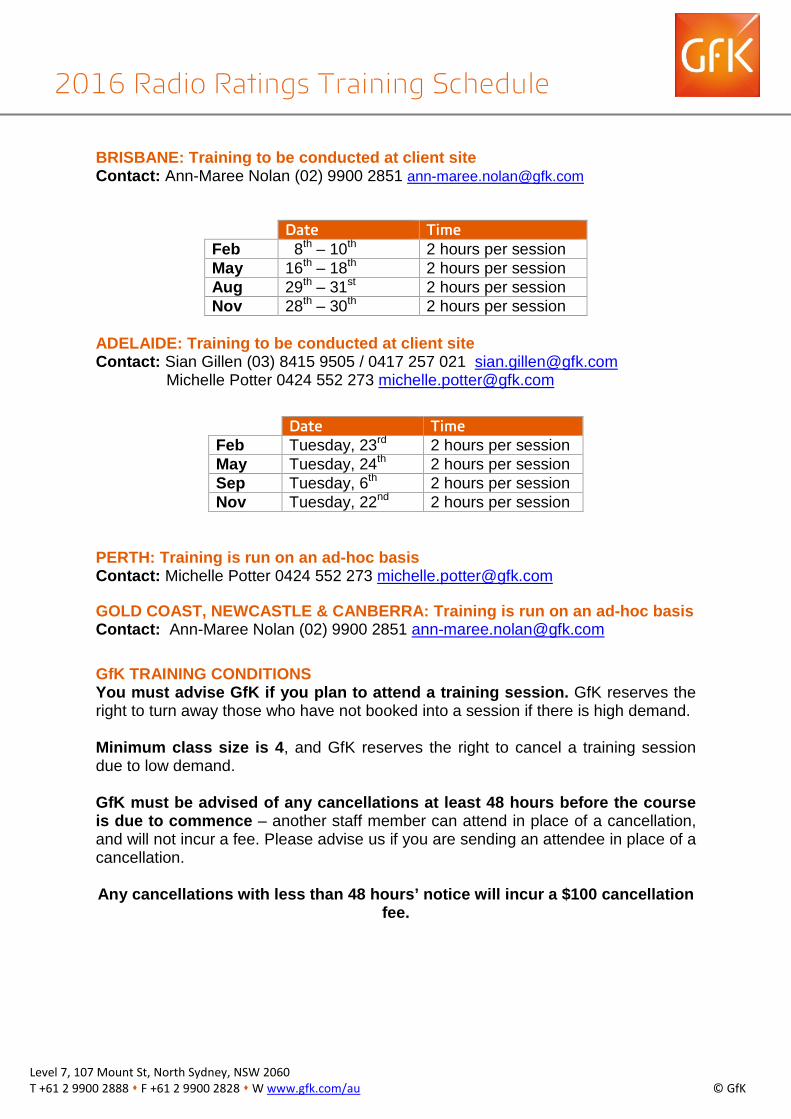
BRISBANE: Training to be conducted at client site Contact: Ann-Maree Nolan (02) 9900 2851 [email protected]
Date Time Feb 8th – 10th 2 hours per session May 16th – 18th 2 hours per session Aug 29th – 31st 2 hours per session Nov 28th – 30th 2 hours per session
ADELAIDE: Training to be conducted at client site Contact: Sian Gillen (03) 8415 9505 / 0417 257 021 [email protected] Michelle Potter 0424 552 273 [email protected]
Date Time Feb Tuesday, 23rd 2 hours per session May Tuesday, 24th 2 hours per session Sep Tuesday, 6th 2 hours per session Nov Tuesday, 22nd 2 hours per session
PERTH: Training is run on an ad-hoc basis Contact: Michelle Potter 0424 552 273 [email protected] GOLD COAST, NEWCASTLE & CANBERRA: Training is run on an ad-hoc basis Contact: Ann-Maree Nolan (02) 9900 2851 [email protected] GfK TRAINING CONDITIONS You must advise GfK if you plan to attend a training session. GfK reserves the right to turn away those who have not booked into a session if there is high demand. Minimum class size is 4, and GfK reserves the right to cancel a training session due to low demand. GfK must be advised of any cancellations at least 48 hours before the course is due to commence – another staff member can attend in place of a cancellation, and will not incur a fee. Please advise us if you are sending an attendee in place of a cancellation. Any cancellations with less than 48 hours’ notice will incur a $100 cancellation
fee.
2016 Radio Ratings Training Schedule
Level 7, 107 Mount St, North Sydney, NSW 2060 T +61 2 9900 2888 F +61 2 9900 2828 W www.gfk.com/au © GfK
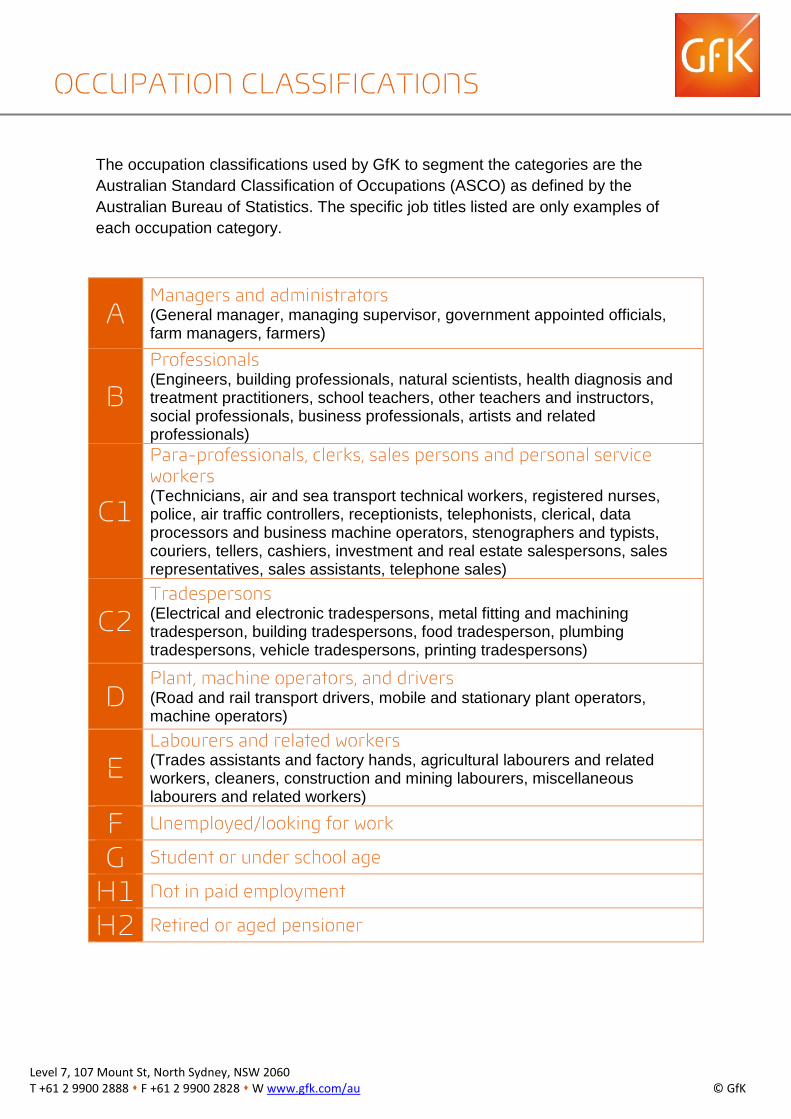
The occupation classifications used by GfK to segment the categories are the Australian Standard Classification of Occupations (ASCO) as defined by the Australian Bureau of Statistics. The specific job titles listed are only examples of each occupation category.
A Managers and administrators (General manager, managing supervisor, government appointed officials, farm managers, farmers)
B Professionals (Engineers, building professionals, natural scientists, health diagnosis and treatment practitioners, school teachers, other teachers and instructors, social professionals, business professionals, artists and related professionals)
C1
Para-professionals, clerks, sales persons and personal service workers (Technicians, air and sea transport technical workers, registered nurses, police, air traffic controllers, receptionists, telephonists, clerical, data processors and business machine operators, stenographers and typists, couriers, tellers, cashiers, investment and real estate salespersons, sales representatives, sales assistants, telephone sales)
C2 Tradespersons (Electrical and electronic tradespersons, metal fitting and machining tradesperson, building tradespersons, food tradesperson, plumbing tradespersons, vehicle tradespersons, printing tradespersons)
D Plant, machine operators, and drivers (Road and rail transport drivers, mobile and stationary plant operators, machine operators)
E Labourers and related workers (Trades assistants and factory hands, agricultural labourers and related workers, cleaners, construction and mining labourers, miscellaneous labourers and related workers)
F Unemployed/looking for work
G Student or under school age
H1 Not in paid employment
H2 Retired or aged pensioner
OCCUPATION CLASSIFICATIONS
Level 7, 107 Mount St, North Sydney, NSW 2060 T +61 2 9900 2888 F +61 2 9900 2828 W www.gfk.com/au © GfK
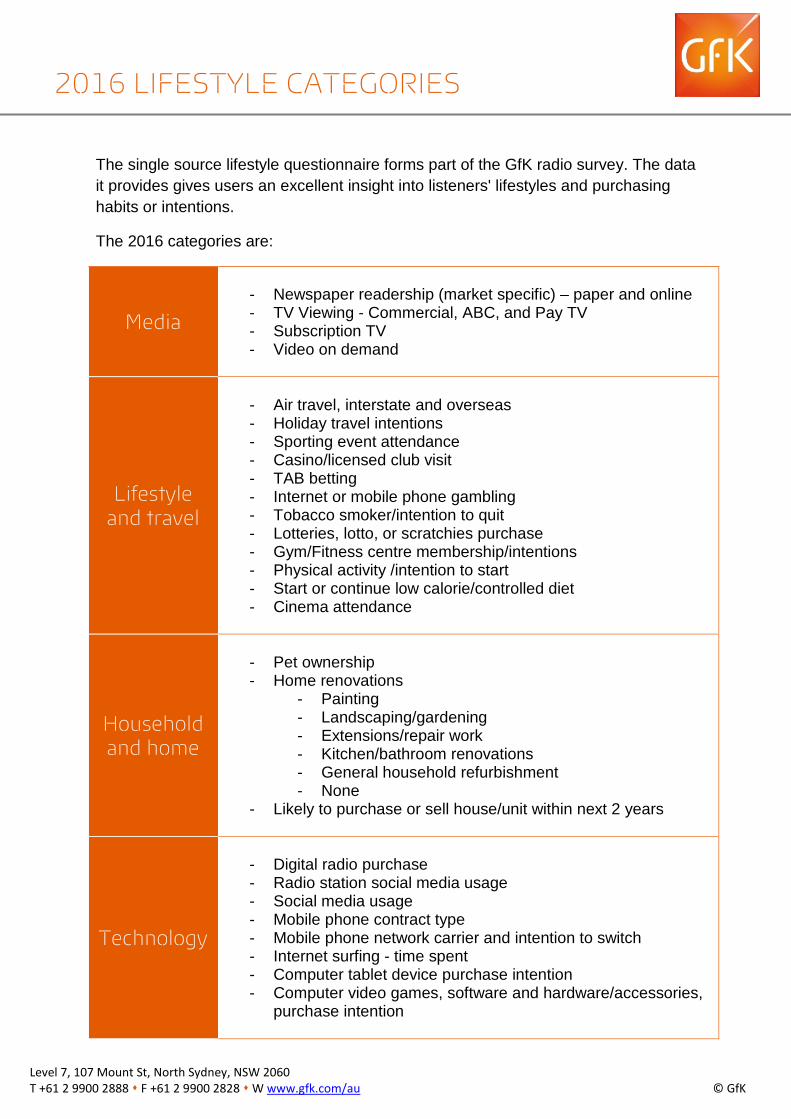
The single source lifestyle questionnaire forms part of the GfK radio survey. The data it provides gives users an excellent insight into listeners' lifestyles and purchasing habits or intentions.
The 2016 categories are:
Media - Newspaper readership (market specific) – paper and online - TV Viewing - Commercial, ABC, and Pay TV - Subscription TV - Video on demand
Lifestyle and travel
- Air travel, interstate and overseas - Holiday travel intentions - Sporting event attendance - Casino/licensed club visit - TAB betting - Internet or mobile phone gambling - Tobacco smoker/intention to quit - Lotteries, lotto, or scratchies purchase - Gym/Fitness centre membership/intentions - Physical activity /intention to start - Start or continue low calorie/controlled diet - Cinema attendance
Household and home
- Pet ownership - Home renovations
- Painting - Landscaping/gardening - Extensions/repair work - Kitchen/bathroom renovations - General household refurbishment - None
- Likely to purchase or sell house/unit within next 2 years
Technology
- Digital radio purchase - Radio station social media usage - Social media usage - Mobile phone contract type - Mobile phone network carrier and intention to switch - Internet surfing - time spent - Computer tablet device purchase intention - Computer video games, software and hardware/accessories,
purchase intention
2016 LIFESTYLE CATEGORIES
Level 7, 107 Mount St, North Sydney, NSW 2060 T +61 2 9900 2888 F +61 2 9900 2828 W www.gfk.com/au © GfK
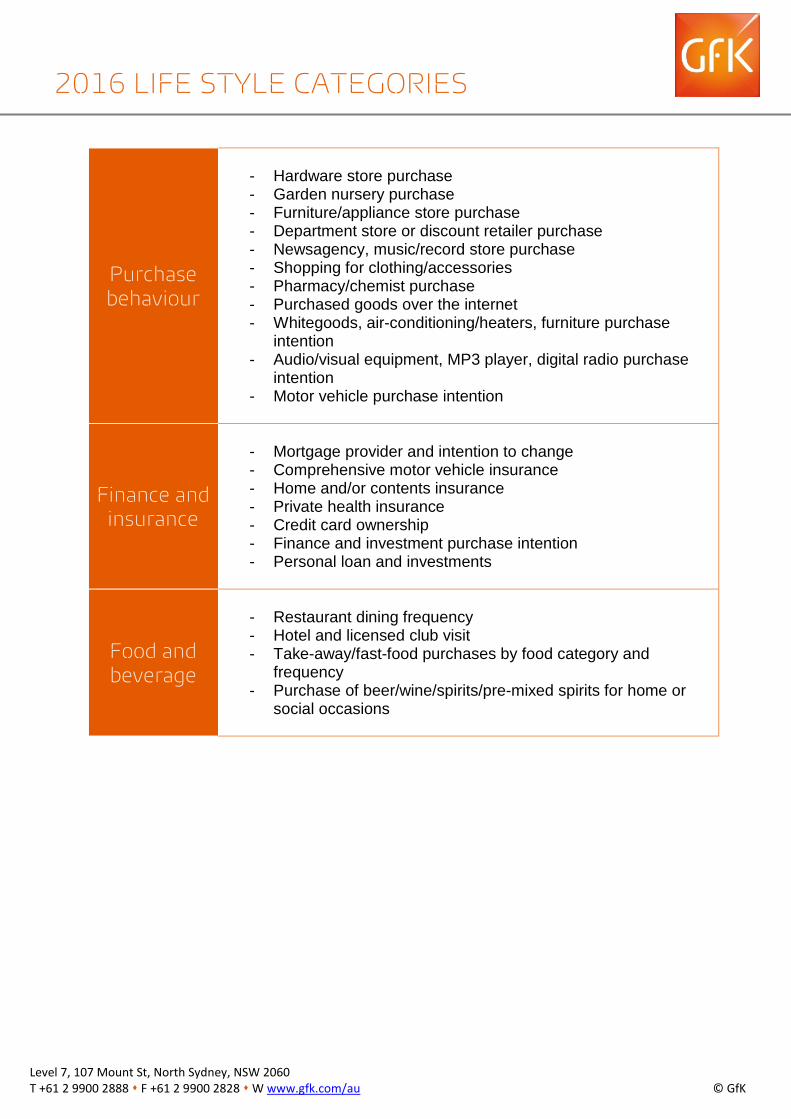
Purchase behaviour
- Hardware store purchase - Garden nursery purchase - Furniture/appliance store purchase - Department store or discount retailer purchase - Newsagency, music/record store purchase - Shopping for clothing/accessories - Pharmacy/chemist purchase - Purchased goods over the internet - Whitegoods, air-conditioning/heaters, furniture purchase
intention - Audio/visual equipment, MP3 player, digital radio purchase
intention - Motor vehicle purchase intention
Finance and insurance
- Mortgage provider and intention to change - Comprehensive motor vehicle insurance - Home and/or contents insurance - Private health insurance - Credit card ownership - Finance and investment purchase intention - Personal loan and investments
Food and beverage
- Restaurant dining frequency - Hotel and licensed club visit - Take-away/fast-food purchases by food category and
frequency - Purchase of beer/wine/spirits/pre-mixed spirits for home or
social occasions
2016 LIFE STYLE CATEGORIES
Level 7, 107 Mount St, North Sydney, NSW 2060 T +61 2 9900 2888 F +61 2 9900 2828 W www.gfk.com/au © GfK
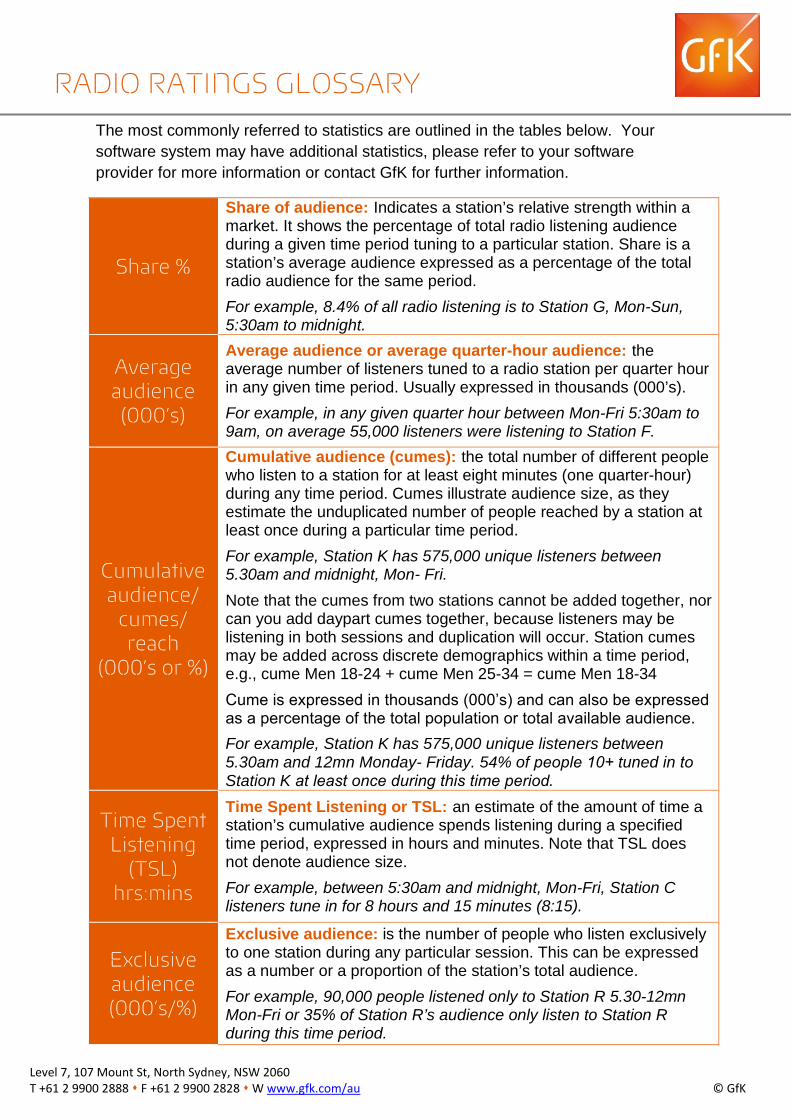
The most commonly referred to statistics are outlined in the tables below. Your software system may have additional statistics, please refer to your software provider for more information or contact GfK for further information.
Share %
Share of audience: Indicates a station’s relative strength within a market. It shows the percentage of total radio listening audience during a given time period tuning to a particular station. Share is a station’s average audience expressed as a percentage of the total radio audience for the same period. For example, 8.4% of all radio listening is to Station G, Mon-Sun, 5:30am to midnight.
Average audience (000’s)
Average audience or average quarter-hour audience: the average number of listeners tuned to a radio station per quarter hour in any given time period. Usually expressed in thousands (000’s). For example, in any given quarter hour between Mon-Fri 5:30am to 9am, on average 55,000 listeners were listening to Station F.
Cumulative audience/
cumes/ reach
(000’s or %)
Cumulative audience (cumes): the total number of different people who listen to a station for at least eight minutes (one quarter-hour) during any time period. Cumes illustrate audience size, as they estimate the unduplicated number of people reached by a station at least once during a particular time period. For example, Station K has 575,000 unique listeners between 5.30am and midnight, Mon- Fri. Note that the cumes from two stations cannot be added together, nor can you add daypart cumes together, because listeners may be listening in both sessions and duplication will occur. Station cumes may be added across discrete demographics within a time period, e.g., cume Men 18-24 + cume Men 25-34 = cume Men 18-34Cume is expressed in thousands (000’s) and can also be expressed as a percentage of the total population or total available audience. For example, Station K has 575,000 unique listeners between 5.30am and 12mn Monday- Friday. 54% of people 10+ tuned in to Station K at least once during this time period.
Time Spent Listening
(TSL) hrs:mins
Time Spent Listening or TSL: an estimate of the amount of time a station’s cumulative audience spends listening during a specified time period, expressed in hours and minutes. Note that TSL does not denote audience size. For example, between 5:30am and midnight, Mon-Fri, Station C listeners tune in for 8 hours and 15 minutes (8:15).
Exclusive audience (000’s/%)
Exclusive audience: is the number of people who listen exclusively to one station during any particular session. This can be expressed as a number or a proportion of the station’s total audience. For example, 90,000 people listened only to Station R 5.30-12mn Mon-Fri or 35% of Station R’s audience only listen to Station R during this time period.
RADIO RATINGS GLOSSARY
Level 7, 107 Mount St, North Sydney, NSW 2060 T +61 2 9900 2888 F +61 2 9900 2828 W www.gfk.com/au © GfK
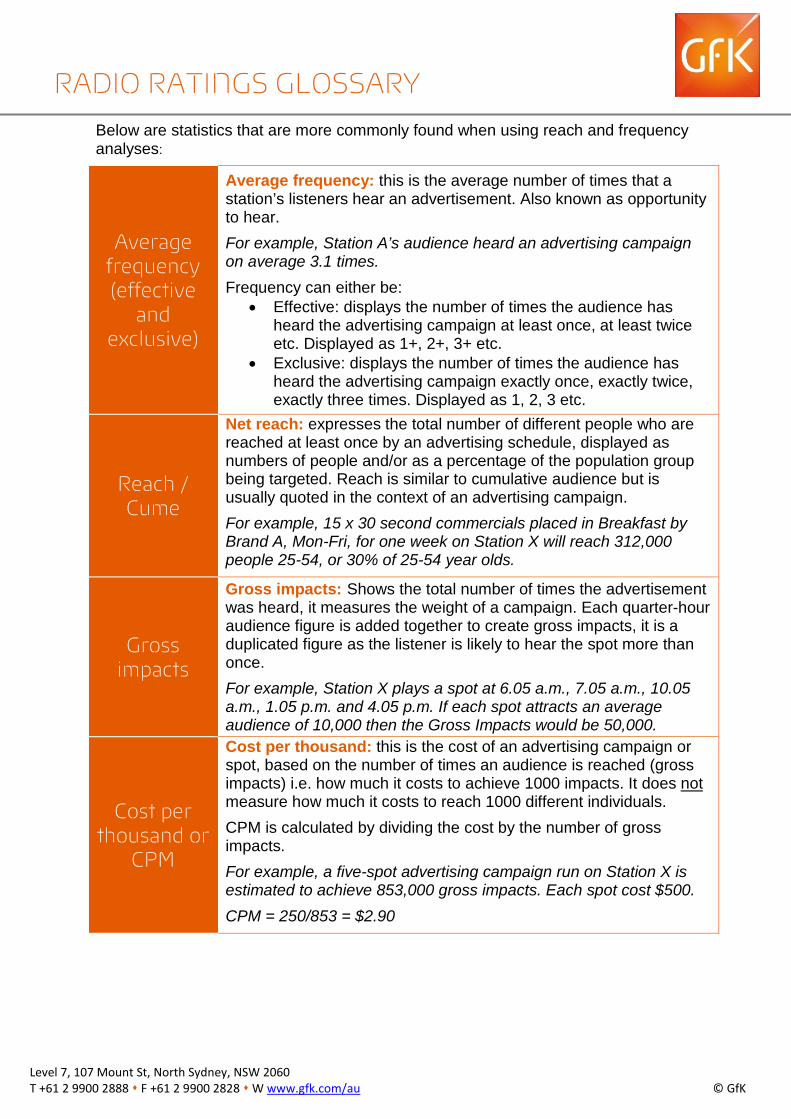
Below are statistics that are more commonly found when using reach and frequency analyses:
Average frequency (effective
and exclusive)
Average frequency: this is the average number of times that a station’s listeners hear an advertisement. Also known as opportunity to hear. For example, Station A’s audience heard an advertising campaign on average 3.1 times. Frequency can either be:
• Effective: displays the number of times the audience hasheard the advertising campaign at least once, at least twiceetc. Displayed as 1+, 2+, 3+ etc.
• Exclusive: displays the number of times the audience hasheard the advertising campaign exactly once, exactly twice,exactly three times. Displayed as 1, 2, 3 etc.
Reach / Cume
Net reach: expresses the total number of different people who are reached at least once by an advertising schedule, displayed as numbers of people and/or as a percentage of the population group being targeted. Reach is similar to cumulative audience but is usually quoted in the context of an advertising campaign. For example, 15 x 30 second commercials placed in Breakfast by Brand A, Mon-Fri, for one week on Station X will reach 312,000 people 25-54, or 30% of 25-54 year olds.
Gross impacts
Gross impacts: Shows the total number of times the advertisement was heard, it measures the weight of a campaign. Each quarter-hour audience figure is added together to create gross impacts, it is a duplicated figure as the listener is likely to hear the spot more than once. For example, Station X plays a spot at 6.05 a.m., 7.05 a.m., 10.05 a.m., 1.05 p.m. and 4.05 p.m. If each spot attracts an averageaudience of 10,000 then the Gross Impacts would be 50,000.
Cost per thousand or
CPM
Cost per thousand: this is the cost of an advertising campaign or spot, based on the number of times an audience is reached (gross impacts) i.e. how much it costs to achieve 1000 impacts. It does not measure how much it costs to reach 1000 different individuals. CPM is calculated by dividing the cost by the number of gross impacts. For example, a five-spot advertising campaign run on Station X is estimated to achieve 853,000 gross impacts. Each spot cost $500. CPM = 250/853 = $2.90
RADIO RATINGS GLOSSARY
Level 7, 107 Mount St, North Sydney, NSW 2060 T +61 2 9900 2888 F +61 2 9900 2828 W www.gfk.com/au © GfK
With the proliferation of reporting the ratings, it is important that all subscribers and licence holders are aware of the permitted use and sourcing requirements.
The radio ratings are collected and prepared by GfK and the copyright is owned by Commercial Radio Australia (CRA). The radio ratings are confidential information that can only be obtained by having a licence to access these ratings. As such, the radio ratings cannot be passed to third parties without written consent from Commercial Radio Australia. This consent can only be obtained by application to GfK. To obtain a licence to access the radio ratings, please contact GfK on 02 9900 2888.
Any licence holder of the CRA radio ratings data must use an accredited software package, which at all times must comply with CRA’s Gold Standard in relation to the use and reporting of the elemental data. For more detail on the Gold Standard Accredited Software Providers please visit CRA’s website at www.commercialradio.com.au
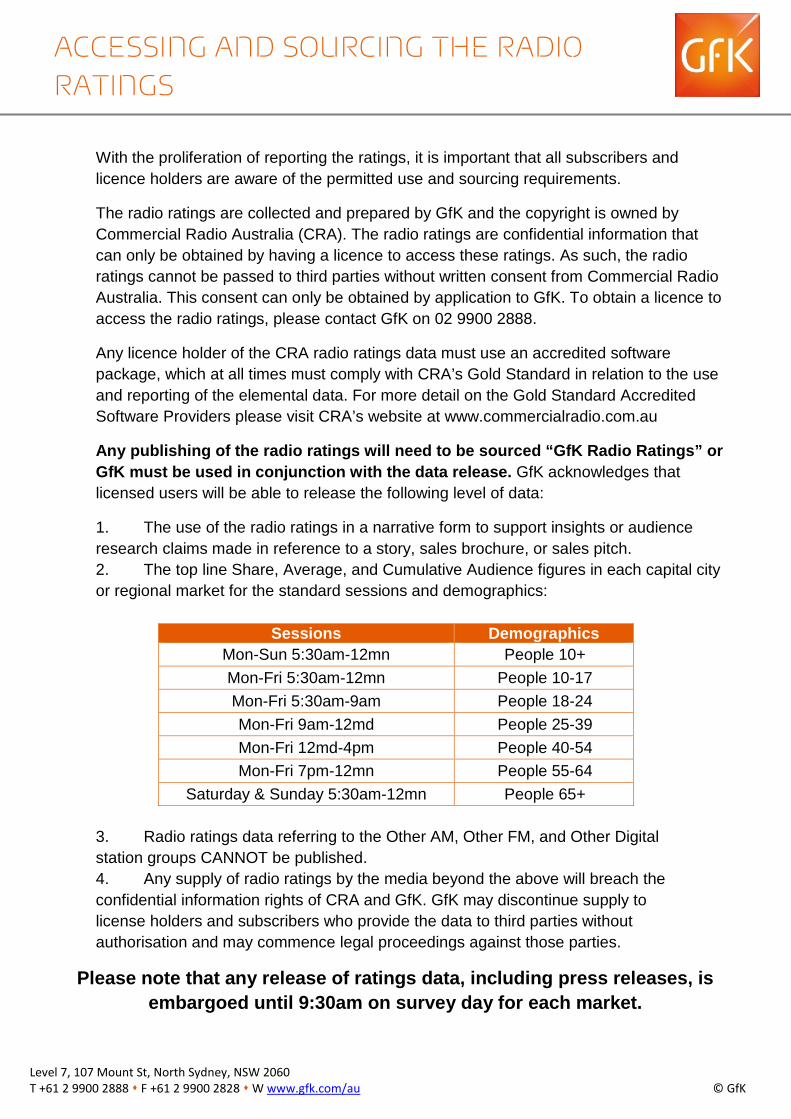
Any publishing of the radio ratings will need to be sourced “GfK Radio Ratings” or GfK must be used in conjunction with the data release. GfK acknowledges that licensed users will be able to release the following level of data:
1. The use of the radio ratings in a narrative form to support insights or audience research claims made in reference to a story, sales brochure, or sales pitch. 2. The top line Share, Average, and Cumulative Audience figures in each capital city or regional market for the standard sessions and demographics:
Sessions Demographics Mon-Sun 5:30am-12mn People 10+ Mon-Fri 5:30am-12mn People 10-17 Mon-Fri 5:30am-9am People 18-24 Mon-Fri 9am-12md People 25-39 Mon-Fri 12md-4pm People 40-54 Mon-Fri 7pm-12mn People 55-64
Saturday & Sunday 5:30am-12mn People 65+ 3. Radio ratings data referring to the Other AM, Other FM, and Other Digital station groups CANNOT be published. 4. Any supply of radio ratings by the media beyond the above will breach the confidential information rights of CRA and GfK. GfK may discontinue supply to license holders and subscribers who provide the data to third parties without authorisation and may commence legal proceedings against those parties.
Please note that any release of ratings data, including press releases, is embargoed until 9:30am on survey day for each market.
ACCESSING AND SOURCING THE RADIO RATINGS
Level 7, 107 Mount St, North Sydney, NSW 2060 T +61 2 9900 2888 F +61 2 9900 2828 W www.gfk.com/au © GfK
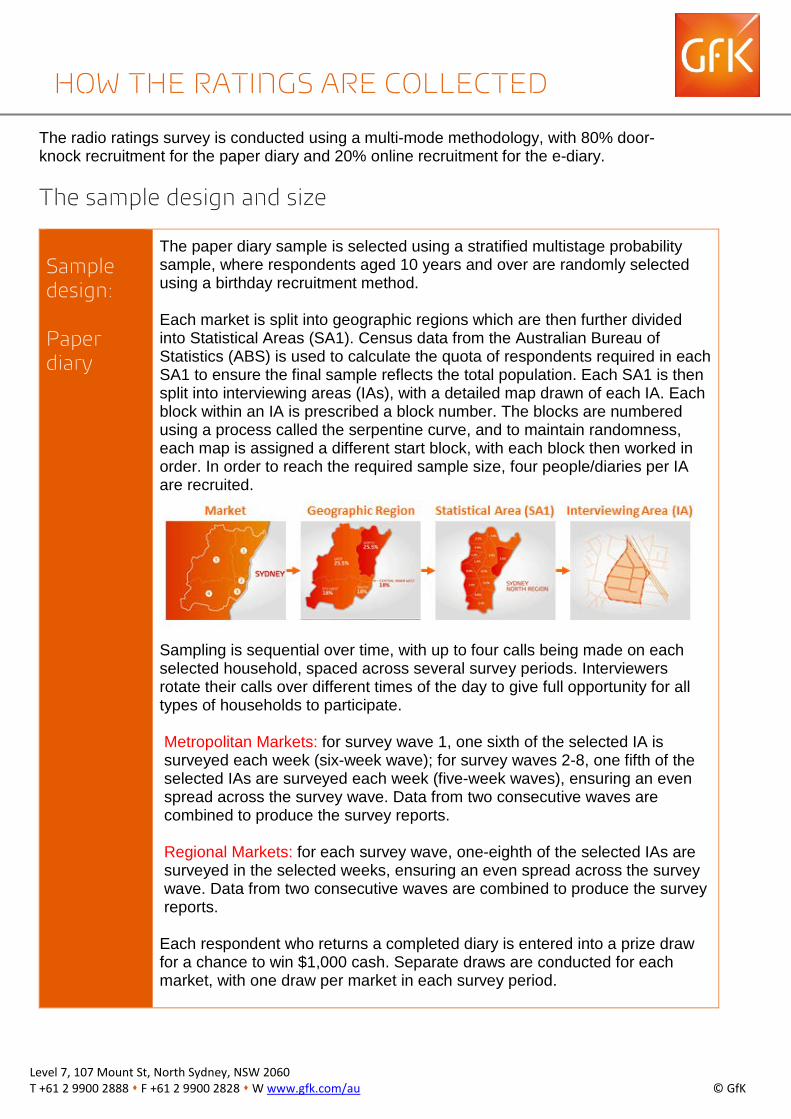
The radio ratings survey is conducted using a multi-mode methodology, with 80% door-knock recruitment for the paper diary and 20% online recruitment for the e-diary.
The sample design and size
Sample design: Paper diary
The paper diary sample is selected using a stratified multistage probability sample, where respondents aged 10 years and over are randomly selected using a birthday recruitment method.
Each market is split into geographic regions which are then further divided into Statistical Areas (SA1). Census data from the Australian Bureau of Statistics (ABS) is used to calculate the quota of respondents required in each SA1 to ensure the final sample reflects the total population. Each SA1 is then split into interviewing areas (IAs), with a detailed map drawn of each IA. Each block within an IA is prescribed a block number. The blocks are numbered using a process called the serpentine curve, and to maintain randomness, each map is assigned a different start block, with each block then worked in order. In order to reach the required sample size, four people/diaries per IA are recruited. Sampling is sequential over time, with up to four calls being made on each selected household, spaced across several survey periods. Interviewers rotate their calls over different times of the day to give full opportunity for all types of households to participate. Metropolitan Markets: for survey wave 1, one sixth of the selected IA is surveyed each week (six-week wave); for survey waves 2-8, one fifth of the selected IAs are surveyed each week (five-week waves), ensuring an even spread across the survey wave. Data from two consecutive waves are combined to produce the survey reports. Regional Markets: for each survey wave, one-eighth of the selected IAs are surveyed in the selected weeks, ensuring an even spread across the survey wave. Data from two consecutive waves are combined to produce the survey reports.
Each respondent who returns a completed diary is entered into a prize draw for a chance to win $1,000 cash. Separate draws are conducted for each market, with one draw per market in each survey period.
HOW THE RATINGS ARE COLLECTED HOW THE RATINGS ARE COLLECTED
Level 7, 107 Mount St, North Sydney, NSW 2060 T +61 2 9900 2888 F +61 2 9900 2828 W www.gfk.com/au © GfK
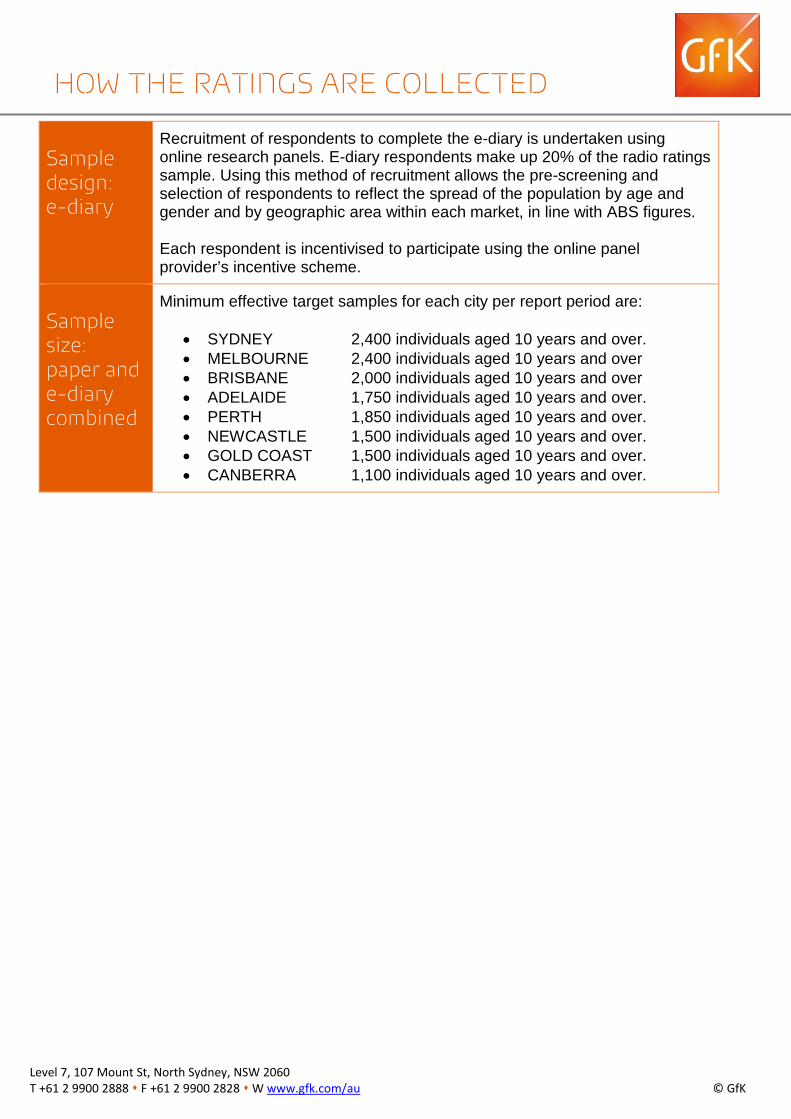
Sample design: e-diary
Recruitment of respondents to complete the e-diary is undertaken using online research panels. E-diary respondents make up 20% of the radio ratings sample. Using this method of recruitment allows the pre-screening and selection of respondents to reflect the spread of the population by age and gender and by geographic area within each market, in line with ABS figures. Each respondent is incentivised to participate using the online panel provider’s incentive scheme.
Sample size: paper and e-diary combined
Minimum effective target samples for each city per report period are:
• SYDNEY 2,400 individuals aged 10 years and over. • MELBOURNE 2,400 individuals aged 10 years and over • BRISBANE 2,000 individuals aged 10 years and over • ADELAIDE 1,750 individuals aged 10 years and over. • PERTH 1,850 individuals aged 10 years and over. • NEWCASTLE 1,500 individuals aged 10 years and over. • GOLD COAST 1,500 individuals aged 10 years and over. • CANBERRA 1,100 individuals aged 10 years and over.
HOW THE RATINGS ARE COLLECTED
Level 7, 107 Mount St, North Sydney, NSW 2060 T +61 2 9900 2888 F +61 2 9900 2828 W www.gfk.com/au © GfK
The paper diary, placement, and collection
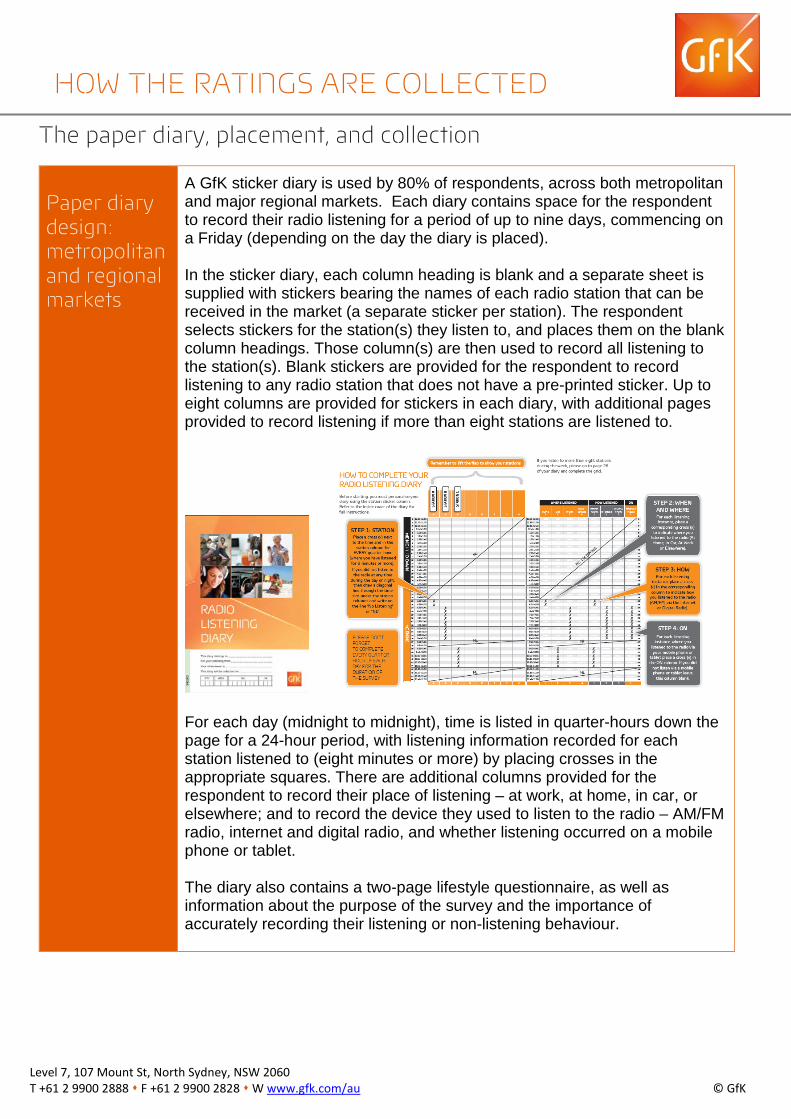
Paper diary design: metropolitan and regional markets
A GfK sticker diary is used by 80% of respondents, across both metropolitan and major regional markets. Each diary contains space for the respondent to record their radio listening for a period of up to nine days, commencing on a Friday (depending on the day the diary is placed). In the sticker diary, each column heading is blank and a separate sheet is supplied with stickers bearing the names of each radio station that can be received in the market (a separate sticker per station). The respondent selects stickers for the station(s) they listen to, and places them on the blank column headings. Those column(s) are then used to record all listening to the station(s). Blank stickers are provided for the respondent to record listening to any radio station that does not have a pre-printed sticker. Up to eight columns are provided for stickers in each diary, with additional pages provided to record listening if more than eight stations are listened to.
For each day (midnight to midnight), time is listed in quarter-hours down the page for a 24-hour period, with listening information recorded for each station listened to (eight minutes or more) by placing crosses in the appropriate squares. There are additional columns provided for the respondent to record their place of listening – at work, at home, in car, or elsewhere; and to record the device they used to listen to the radio – AM/FM radio, internet and digital radio, and whether listening occurred on a mobile phone or tablet. The diary also contains a two-page lifestyle questionnaire, as well as information about the purpose of the survey and the importance of accurately recording their listening or non-listening behaviour.
HOW THE RATINGS ARE COLLECTED
Level 7, 107 Mount St, North Sydney, NSW 2060 T +61 2 9900 2888 F +61 2 9900 2828 W www.gfk.com/au © GfK
Paper diary placement: metropolitan
Paper diary placement is made face-to-face by specially selected and trained interviewers who are managed by Field Supervisors. One person is selected in each household, using a random selection process of identification called the Last Birthday Method (LBM), i.e., the household member aged 10 or over who has had the most recent birthday. GfK interviewers record all recruitment information electronically via a tablet PC (CAPI), allowing live management of quota requirements and instant feedback on completion rates. To ensure 10-24 year olds are recruited in line with the population, interviewers can proxy place a diary with the parent, partner, or guardian of the selected respondent. Quota recruitment can also be used to recruit 10-24 year olds if there is a shortfall of 10-24 year olds using LBM recruitment. During the diary placement the interviewer personally demonstrates how the paper-diary is to be completed (a demonstration page is included in each diary) and informs the respondent of the privacy considerations (detailed on the GfK website). They also explain the lifestyle questionnaire and inform respondents that they will be entered in a draw to win a prize for completing the survey. All calls to establish contact are made on Thursday, Friday, and Saturday, with the time rotated between day, night, and Saturday, according to an established procedure. Each interviewer works through a list of areas in a different order to the previous wave, to ensure the timing of calls at any home alters from wave-to-wave, increasing the contact rate. If the respondent identified through LBM is not at home at the time of placement, a leaflet is left explaining the purpose of the survey and the importance of accurately recording their listening or non-listening. This is left to reassure the potential respondent that the project is legitimate and worthwhile. If a respondent declines to participate (e.g., busy/going out) but does not refuse outright, they also receive the explanatory leaflet. These respondents are contacted again in subsequent waves to attempt to obtain their participation. The leaflets can also be left at unattended homes so that when the interviewer calls back in a future wave the household members are better prepared for recruitment.
HOW THE RATINGS ARE COLLECTED
Level 7, 107 Mount St, North Sydney, NSW 2060 T +61 2 9900 2888 F +61 2 9900 2828 W www.gfk.com/au © GfK
Paper diary placement: regional face-to-face and CATI
Diary placement in major regional markets is made both via face-to-face (50% of sample) by specially selected and trained interviewers who are managed by Field Supervisors and via Computer Aided Telephone Interviewing (CATI) (30% of sample). The remaining 20% of the sample is recruited online for the e-diary. Household flooding methodology is used in these markets; this requires diaries to be placed with all people living in the household aged 10 years and over. The interviewer recruits the household through a person living in the household aged 18 years or over, and all household recruitment information is recorded electronically via a tablet PC (CAPI) or during the CATI recruitment. Each diary owner’s name and an identifying person number is recorded on the front cover of their diary, as well as the dates for listening and date the diary will be collected. The interviewer conducts the demonstration with the person at the door and, where possible, the other members of the household. They also explain privacy considerations, the lifestyle questionnaire, and inform respondents that they will be entered in a draw to win a prize for completing the survey.
For CATI placement, phone sample is split by geographical postcodes and is used to recruit households to participate in the survey. All household recruitment information is recorded electronically. Diaries are posted to the household and each diary has the owner’s name and identifying person number recorded on the front cover of each diary as well as the dates for listening and date for posting the diaries back (a reply paid envelope is included with the diaries). After the diaries have been posted, a call is made to the home to confirm the diaries have been received by the household and to ask them to start recording their listening. Households are called mid-week to follow up on progress and make sure that the diaries are being completed. At the end of the survey, another call is made to thank the household, advise that the survey week has ended, and to request that the diaries be posted back.
Mid-week calls to respondents
A telephone call is made to the respondent/household on Tuesday or Wednesday during the week of diary completion. The purpose of the mid-week call is to remind the respondent to participate in the survey, enquire whether they require clarification of what they are to do, and to confirm the diary collection day and time. The mid-week call also offers the opportunity for quality control checks to be made, with respondents asked a series of validation questions about themselves, their household and the interviewer’s recruitment process.
HOW THE RATINGS ARE COLLECTED HOW THE RATINGS ARE COLLECTED
Level 7, 107 Mount St, North Sydney, NSW 2060 T +61 2 9900 2888 F +61 2 9900 2828 W www.gfk.com/au © GfK
Sunday collection: metropolitan and regional
A telephone call is made on Saturday evening to confirm an approximate time for diary collection and to check that the diary has been completed fully, including the lifestyle questionnaire. On Sunday at the end of each survey week, the interviewer conducts up to two personal collection visits to the respondent’s home in an effort to collect and clarify the diary in person. If the respondent is not at home on the second visit, the interviewer will leave a pre-paid envelope and a thank you card asking for the diary to be returned by post.
Paper Diary Data Collation
Once completed diaries are returned to GfK, they are subject to result coding by experienced staff members, independent of field interviewers. A diary may be given one of three codes: usable, nil listening, or unusable. In-office coding procedures aim to check the consistency of diary records and the coding department will follow up with respondents to clarify information where necessary.
HOW THE RATINGS ARE COLLECTED
Level 7, 107 Mount St, North Sydney, NSW 2060 T +61 2 9900 2888 F +61 2 9900 2828 W www.gfk.com/au © GfK
The e-diary
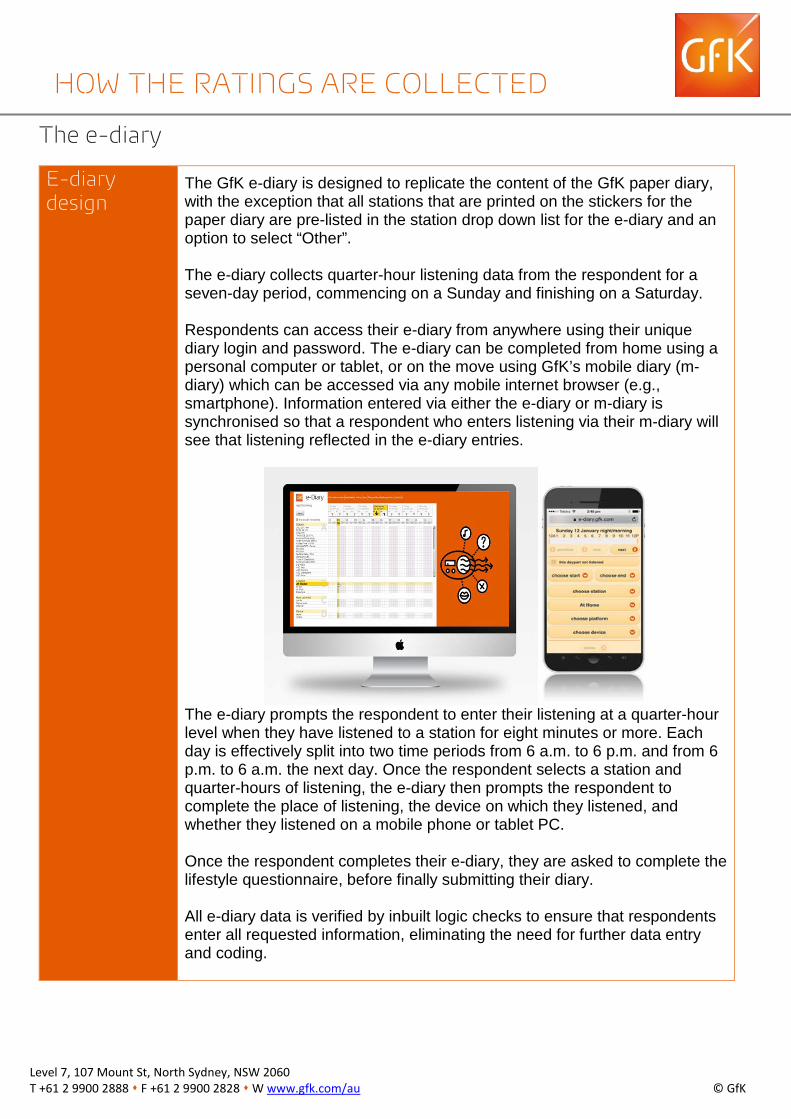
E-diary design
The GfK e-diary is designed to replicate the content of the GfK paper diary, with the exception that all stations that are printed on the stickers for the paper diary are pre-listed in the station drop down list for the e-diary and an option to select “Other”. The e-diary collects quarter-hour listening data from the respondent for a seven-day period, commencing on a Sunday and finishing on a Saturday. Respondents can access their e-diary from anywhere using their unique diary login and password. The e-diary can be completed from home using a personal computer or tablet, or on the move using GfK’s mobile diary (m-diary) which can be accessed via any mobile internet browser (e.g., smartphone). Information entered via either the e-diary or m-diary is synchronised so that a respondent who enters listening via their m-diary will see that listening reflected in the e-diary entries.
The e-diary prompts the respondent to enter their listening at a quarter-hour level when they have listened to a station for eight minutes or more. Each day is effectively split into two time periods from 6 a.m. to 6 p.m. and from 6 p.m. to 6 a.m. the next day. Once the respondent selects a station and quarter-hours of listening, the e-diary then prompts the respondent to complete the place of listening, the device on which they listened, and whether they listened on a mobile phone or tablet PC. Once the respondent completes their e-diary, they are asked to complete the lifestyle questionnaire, before finally submitting their diary. All e-diary data is verified by inbuilt logic checks to ensure that respondents enter all requested information, eliminating the need for further data entry and coding.
HOW THE RATINGS ARE COLLECTED
Level 7, 107 Mount St, North Sydney, NSW 2060 T +61 2 9900 2888 F +61 2 9900 2828 W www.gfk.com/au © GfK
Producing the Radio Ratings
Data harmonisation
Data from the GfK paper diaries and e-diaries are combined or harmonised via GfK’s internal processing systems. Data is processed as a combined file and splits via diary collection method are not released.
Weighting the sample to create the
ratings
The data is weighted to adjust for differences between the achieved survey sample and the population profile of the market being surveyed. Sample weights are calculated using a rim-weighting methodology, with age, sex and region population benchmarks (as determined by ABS figures), and used to produce estimates for the population aged ten or more in each market. The weight associated with a respondent is effectively the number of people in the population that person represents. These weights adjust for differences in probabilities of selection and also calibrate the estimates to population benchmarks.
Error-free data
While every effort is made to ensure the data and reports are accurate and complete, each report is issued subject to any errors and omissions. GfK will take all immediate steps to rectify any inaccuracy or omission.
HOW THE RATINGS ARE COLLECTED
Level 7, 107 Mount St, North Sydney, NSW 2060 T +61 2 9900 2888 F +61 2 9900 2828 W www.gfk.com/au © GfK
Commercial Radio Australia Ltd is the national industry body representing Australia's commercial radio broadcasters.
Commercial radio broadcasting began in 1925. Commercial Radio Australia Ltd was established in 1930 as the Federation of Australian Radio Broadcasters (FARB). FARB became an incorporated company in 1993 and changed its name to Commercial Radio Australia Limited in 2002. FARB was founded with 33 members. Today, Commercial Radio Australia Ltd has 260 members, representing 99% of commercial radio licensees on air.
The Board of Commercial Radio Australia is elected by the industry at the annual general meeting and includes a chairman and a vice chairman (regional) and up to nine other directors, representing metropolitan and regional commercial radio broadcasters.
Commercial Radio Australia pursues a range of issues on behalf of its member stations. The staff of Commercial Radio Australia specialise in areas such as industrial relations, human resources, marketing, industry events management, industry regulation, advertising advice, audience surveys and research and digital radio.
Handy links:
• For more information on CRA please visit www.commercialradio.com.au
• To read the CRA Codes of Practice (note: you need to be a member to access this page) http://www.commercialradio.com.au/legal/regulation-codes
• Commercial Radio Calendar and Commercial Radio Stations Map
COMMERCIAL RADIO AUSTRALIA
Level 7, 107 Mount St, North Sydney, NSW 2060 T +61 2 9900 2888 F +61 2 9900 2828 W www.gfk.com/au © GfK