2016-2017 school enrolment report - home - cbe home · the 2016-2017 school enrolment report, ......
TRANSCRIPT

2016-2017 School Enrolment Report
Date December 6, 2016
Meeting Type Regular Meeting, Public Agenda
To Board of Trustees
From David Stevenson, Chief Superintendent of Schools
Purpose Information
Originator Dany Breton, Superintendent, Facilities & Environmental Services
Governance Policy
Reference Operational Expectations: OE-8: Communication With and Support for the Board OE-9: Communication With the Public OE-12: Facilities
Resource Person(s) Carrie Edwards, Director, Planning & Transportation
Anne Trombley, Manager, Planning Sheri Lambourne, Manager, Real Estate and Leasing Heather Kirkwood, Manager, Learning Lori Walsh, System Assistant Principal, Learning
1 | Recommendation
It is recommended:
This report is being provided for information to the Board. No decision is required at this time.
2 | Issue
Each year in late November or early December, Administration presents a School Enrolment Report to the Board of Trustees for information.
Page 1 | 8

3 | Background
Calgary Board of Education is currently in the process of adding two new administrative areas. The addition of these two new areas will result in a shift in the area reporting structure that is based on feeder school patterns for high schools rather than the previous geographically based model. For the purpose of the 2016-2017 School Enrolment Report, data will continue to be reported based on the current five geographic administrative areas.
The purpose of the report is to provide enrolment data for CBE schools and programs. This report is intended to provide a snapshot of key CBE data based on the September 30 enrolment each year. It does not provide analysis of CBE growth trends. The information contained in this report is used throughout the year by CBE administration to prepare other key documents such as the annual Three Year School Capital Plan and the Ten Year Student Accommodation and Facilities Strategy that provides updated analysis of projected enrolment growth and population trends.
The School Enrolment Report does not provide any financial data or information on class size within schools. School RAM budgets are adjusted in the fall to allocate resources to schools based on actual enrolment on September 30.
The School Enrolment Report includes several attachments that provide the following information:
The number of students enrolled in each school, by grade and program, including alternative programs, complex learning classes, and the number of out-of-attendance area students enrolled in each school as of September 30th in the current school year;
Provincial capacity of schools, including the number of modular classrooms, the utilization rate of each school building including lease exemptions and the amount of instructional space available in each school based on the number of classrooms (rated room capacity); and
A list of the leases and the amount of space leased for each building.
4 | Analysis
City of Calgary's Population
Total population for 2016 is 1,235,171 up 4,256 residents from 2015. This represents an increase of 0.36%. This level of population growth is similar to what was experienced in 2010.
The following information about the City of Calgary’s population is taken directly from the Calgary & Region Economic Outlook 2016-2021:
Page 2 | 8

The 2016 civic census placed the city of Calgary’s population at 1.235 million persons, down from the 2016 estimate of 1.246 million but up from the 2015 census count of 1.231 million. The below average population increase (of 4,256 persons) is explained by a weak economy and depressed labour market;
The combination of weak job creation and high unemployment rates is a deterrent for job seekers and potential migrants to Calgary in the short-term; and
Calgary’s population is anticipated to grow from 1.235 million in 2016 to 1.313 million in 2021, up by 78,000 persons. This is below the population growth for the 2010 - 2015 period of 144,200 persons. Below average net migration levels would be a drag on population growth from 2017 to 2021 as job creation remains weak and the unemployment rate stays stubbornly high.
Calgary's population growth is comprised of two factors; natural increase and net migration. Natural increases are the result of the excess of births over deaths. The natural increase was 10,783 persons, down by 20 from the previous period of 2014-2015.
The following information about natural increase is taken directly from the Calgary & Region Economic Outlook 2016-2021:
Natural increase (births less deaths) is anticipated to reach 10,712 persons in 2017 and 8,980 persons by 2021; and
Natural increase will fall throughout the forecast period (2017 – 2021) as
deaths rise relative to births. During this period, the population will continue to age and move into those cohorts with higher death rates and lower fertility rates. The numbers of women in the childbearing cohort will decline because of reduced migration levels. A reduction in migration levels implies a decrease in births. The age structure data for migrants shows that a significant proportion of this cohort tend to be young and therefore in their family formation years.
Net migration fluctuates, making it difficult to predict from year to year. Net migration is the difference between the total population growth recorded and the natural increase. At -6,527, there was a decrease in net migration from 2015’s net migration of 24,909 that is similar to that seen in 2010.
The following information about net migration is taken directly from the Calgary & Region Economic Outlook 2016-2021:
Net migration will total 1,558 persons in 2017 and 1,479 persons in 2018 and then increase to 12,529 by 2021, up from -6,526 persons in 2016. Annual net migration for the 2017 to 2021 period is expected to fall below the average (16,947 persons) for the 2005 to 2015 period;
Page 3 | 8
Below average net migration levels would lower population growth in the early years of the forecast (2017 – 2020), as Calgary’s unemployment rate remains high relative to the national rate. Specifically, net inter-provincial migrants would be discouraged from coming to Calgary in search of employment because of limited job opportunities;
From 2020 and beyond, Calgary’s unemployment rate should decline relative to the national rate as employment growth exceeds labour force growth; and
Net migration is expected to return to more normal levels from 2021 onwards as job creation improves and the unemployment rate falls.
Population and housing statistics are monitored on an annual basis for all residential districts. From April 2015 to April 2016 there were seven communities that grew by more than 1,000 residents compared to eight communities in the previous census. The communities that grew by more than 1,000 residents are listed below in order of increased level of growth:
Community CBE
Administrative Area
Number of New Residents 2014-2015
Mahogany V 2,040
Nolan Hill II 2,033
Evanston II 1,381
Auburn Bay V 1,368
Skyview Ranch III 1,245
Copperfield V 1,137
Legacy V 1,056
Source: 2016 Civic Census Results
Calgary Board of Education
The 2016-2017 Student Enrolment Summary, which was presented to the Board of Trustees on October 11, indicated a total enrolment of 119,147 students. As noted in that report, changes to the initial September 30 enrolment occur as Administration works with the province to review enrolment data submitted through the PASI System (Provincial Approach to Student Information). This year even though there were some changes made, the total September 30 enrolment after completion of this review process is 119,147, the same total number of students in the previously reported enrolment.
Enrolment has increased for the ninth consecutive year. Over the past nine years, enrolment has increased by just over 17,500 students with enrolment increasing
Page 4 | 8

by 1.85% or 2,162 students from 2015 to 2016. The enrolment increase this year is lower than the 2,485 student increase last year. The highest increase over the past nine years was 3,737 between September 2012 and September 2013.
The table below compares September 30, 2015 student enrolment to September 30, 2016 by division:
The most significant increases occurred at Grades 4-6 (1,274 students), Grades 7-9 (668 students) and Grades 1-3 (522 students).
Sixteen schools offer a full day kindergarten program and reported total enrolment of 714 students on September 30, 2016. The CBE has 11 Early Development Centre (EDC) locations that offer pre-kindergarten programming.
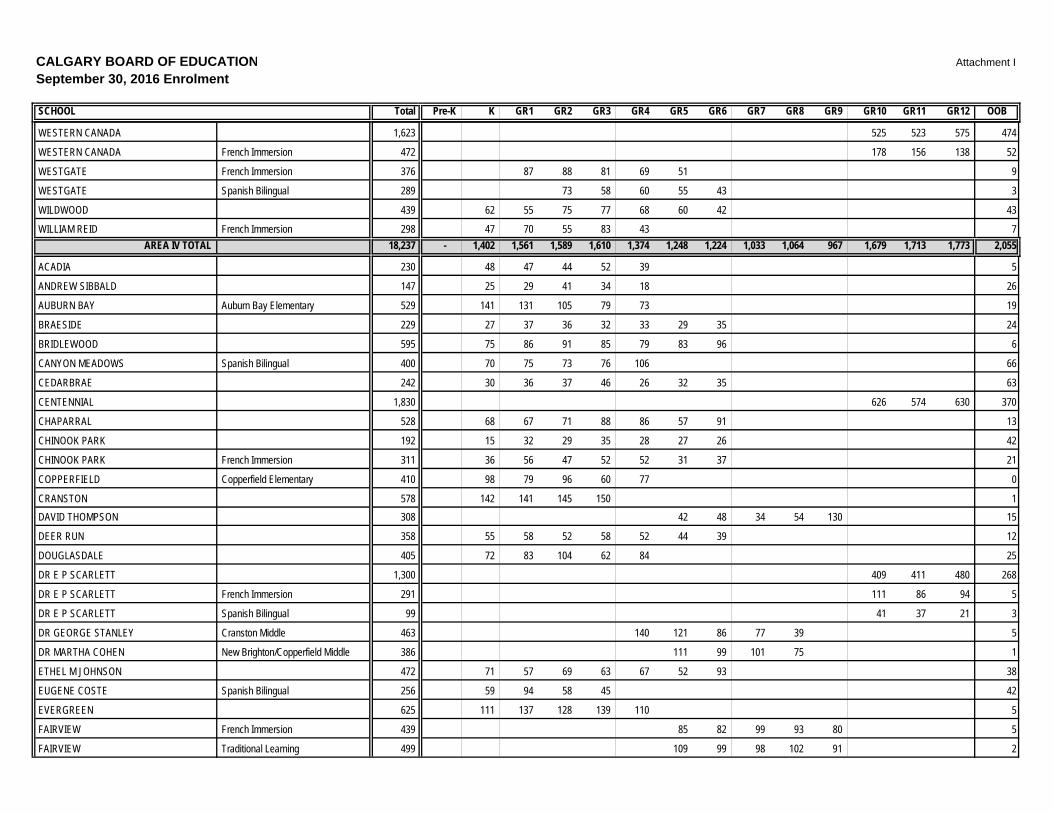
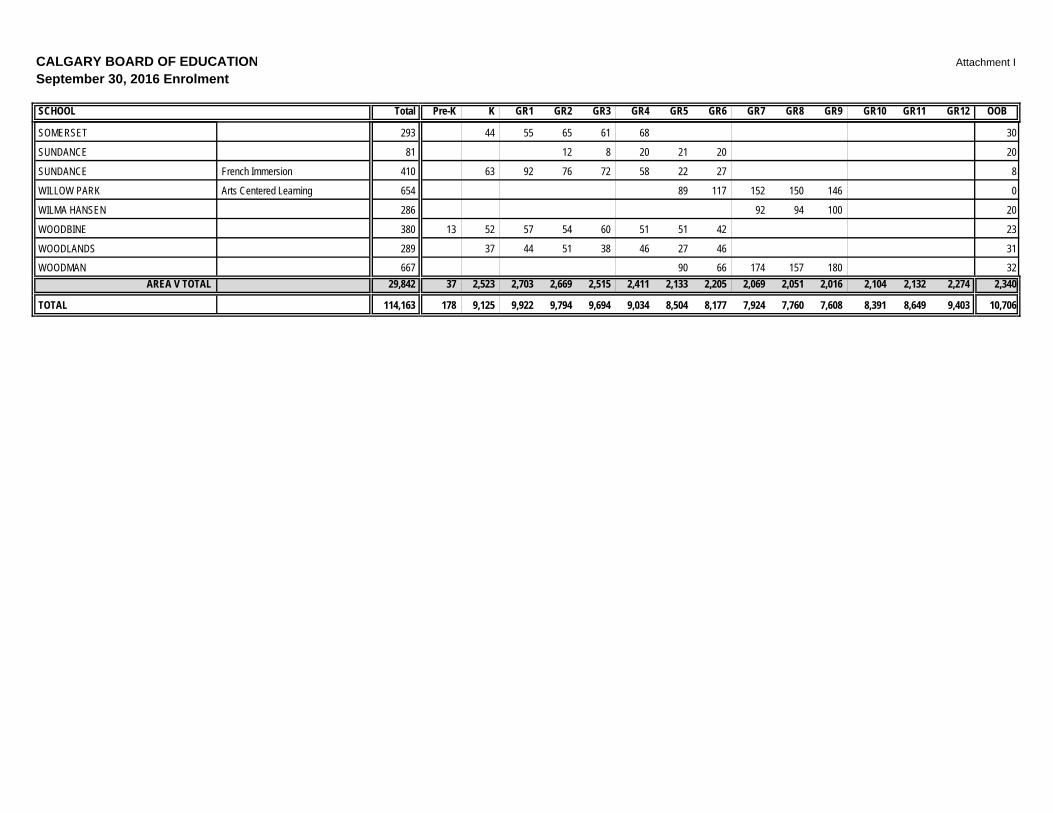
School Enrolment
Attachment I lists enrolment by Area for each school by grade. It also reports the number of out-of-attendance area students in each school. For schools and/or programs whose attendance area is the same as the CBE boundary, the number of out-of-attendance area students, if any, are students attending from outside of the city. There are several CBE schools in established communities where enrolment from the designated communities may be low or declining. Accepting out of attendance area students each year allows these schools to maintain strong programming for students. High schools typically have a high number of out of attendance area students.
Enrolment in classes for students with complex needs is included in the regular program enrolment. A few schools have classes for students with complex learning needs and do not offer a regular program for the same grades as the
September 30, 2015
September 30, 2016 Difference
Pre-Kindergarten 180 197 17Kindergarten 9,209 9,106 -103Grades 1-3 28,888 29,410 522Grades 4-6 24,441 25,715 1,274Grades 7-9 22,624 23,292 668Grades 10-12 26,375 26,443 68Sub-Total (Pre-K to GR12) 111,717 114,163 2,446Home Education 270 249 -21Outreach Programs 1,384 1,337 -47Unique Settings 676 729 53CBe-learn 611 458 -153Chinook Learning Services 2,327 2,211 -116Total 116,985 119,147 2,162
Comparison of September 30, 2015 to September 30, 2016
Page 5 | 8

complex learning classes. In these cases enrolment in the complex learning classes is noted separately.
A graph of the total student enrolment in the last decade and the projected enrolment in the next three years is included in Attachment VI.
Attachment IX is a map of student population change by community. It shows pre-k to Grade 12 enrolment growth by community from September 30, 2015 to September 30, 2016. The map also indicates the locations of the new schools that opened this year as well as those that are projected to open for the 2017 and 2018 school years.
This year, the CBE opened an unprecedented number of new schools. Many of these schools welcomed students at the start of September while others opened as a school within a school and students will transfer to their new buildings once construction is complete during this school year. These new schools made it possible for almost 7,000 students to be accommodated at schools within their communities.
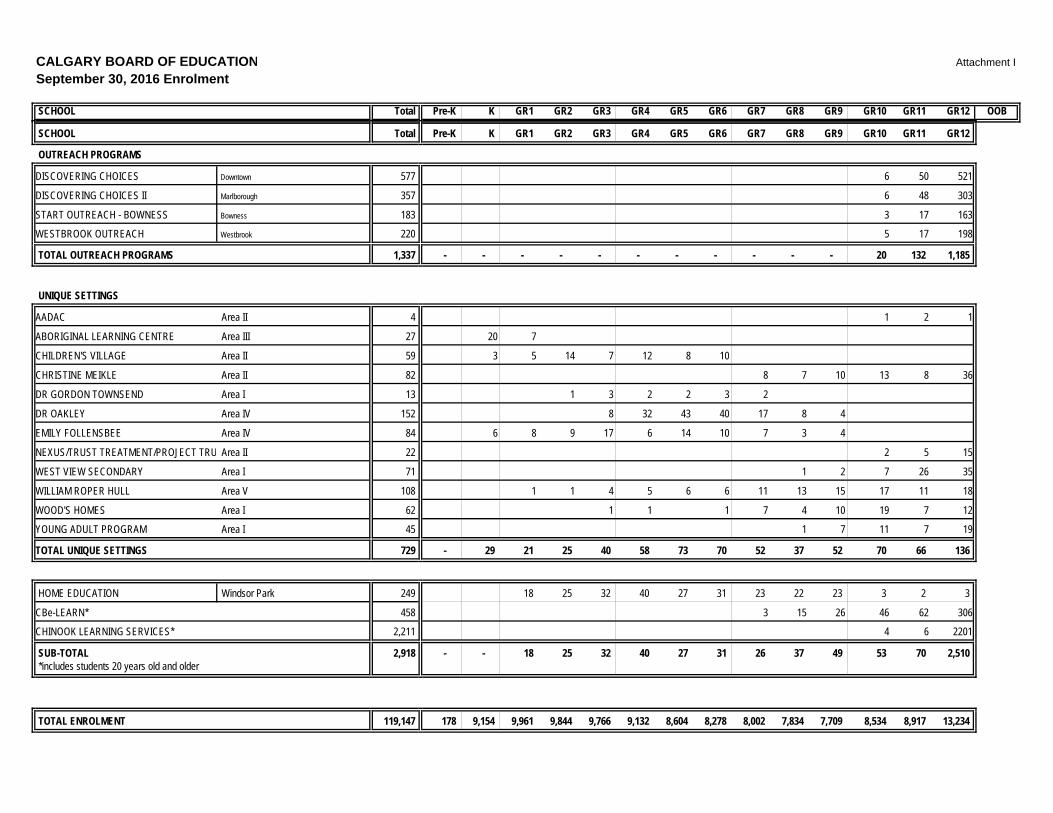
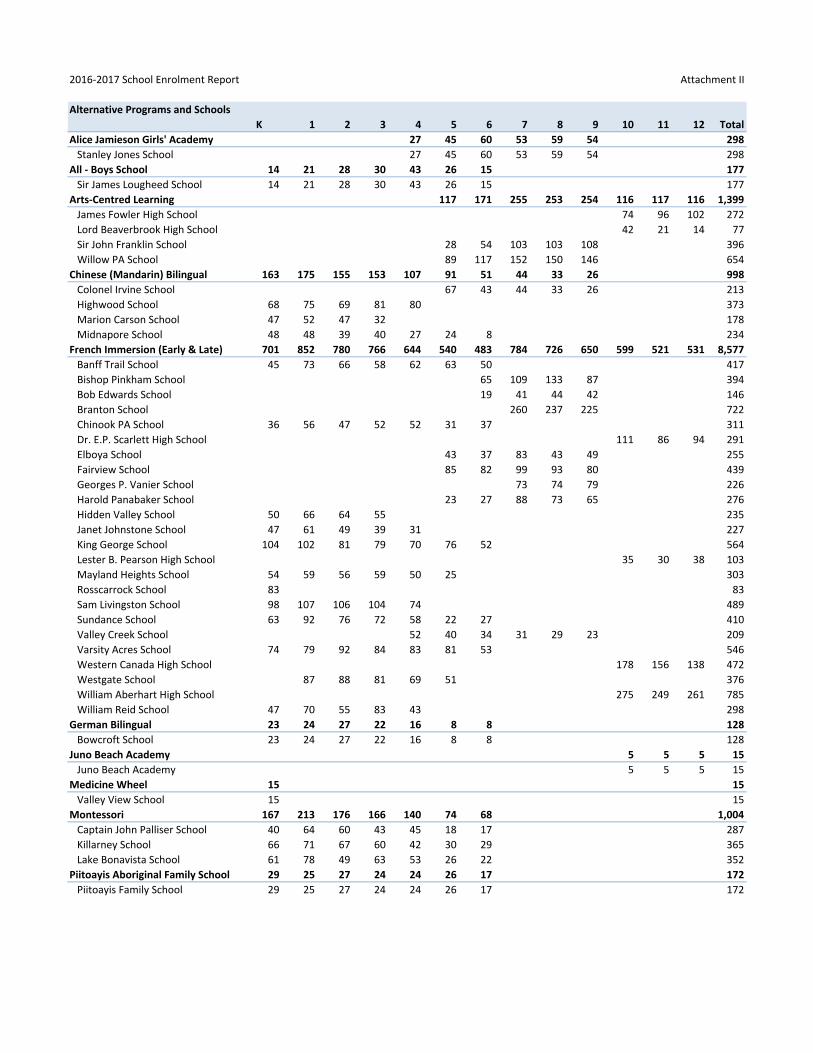
Alternative Programs
Enrolment in alternative programs by school is reported in Attachment II. Enrolment in alternative programs is 24,158, an increase of 465 students from last year. This increase in alternative program enrolment is lower than the 779 increase from the previous year.
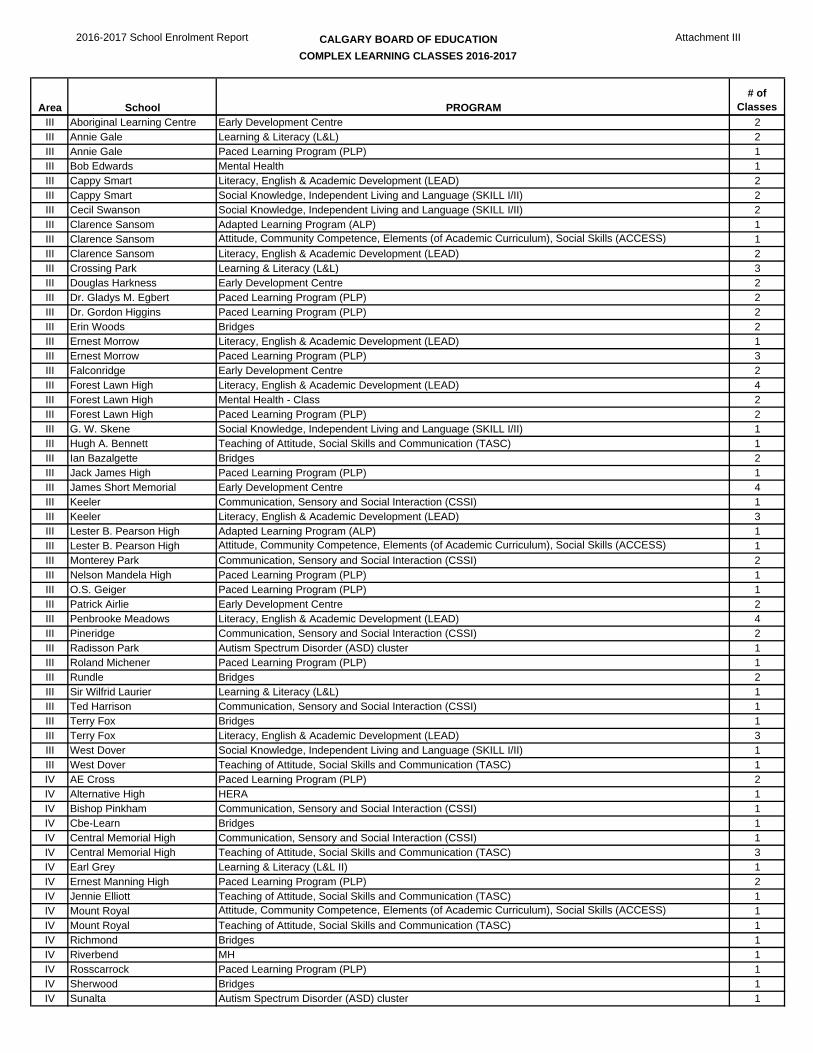
Complex Learning Needs
A detailed list of classes and enrolment for students with complex learning needs is reported in Attachments III and IV. Enrolment in classes for students with complex learning needs is 3,138, an increase of 281 students from last year.
A list of definitions and acronyms of classes for students with complex learning needs is included in Attachment X.
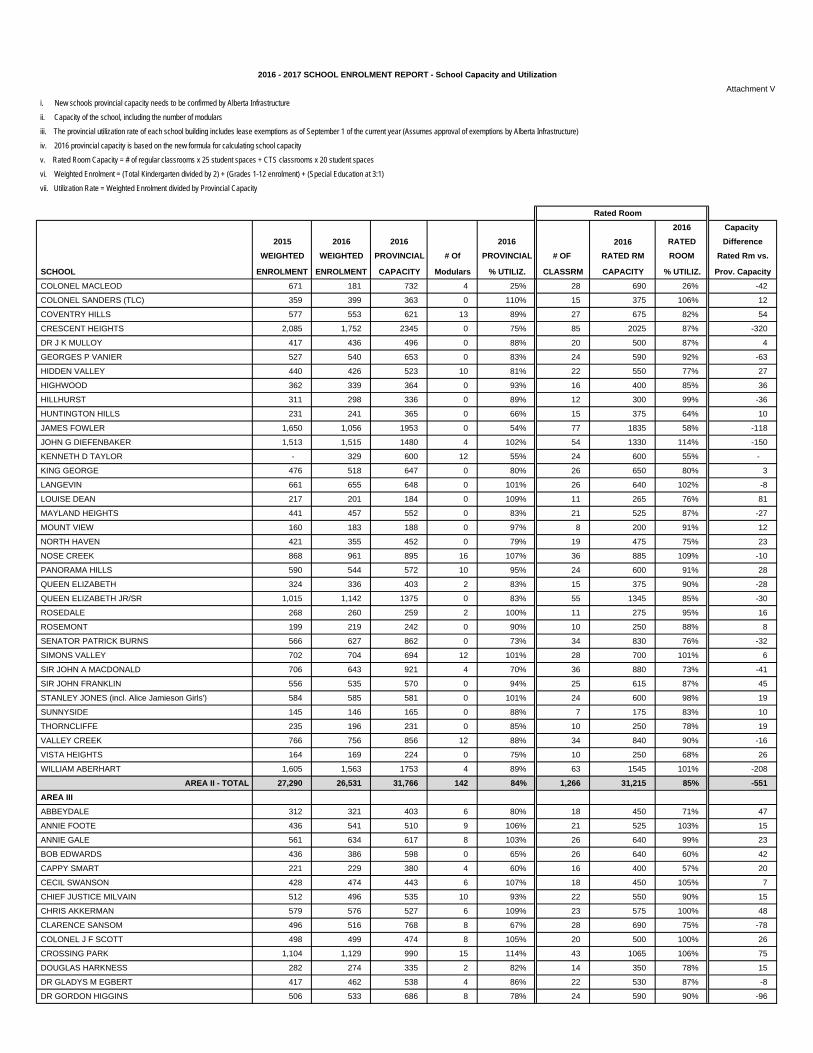
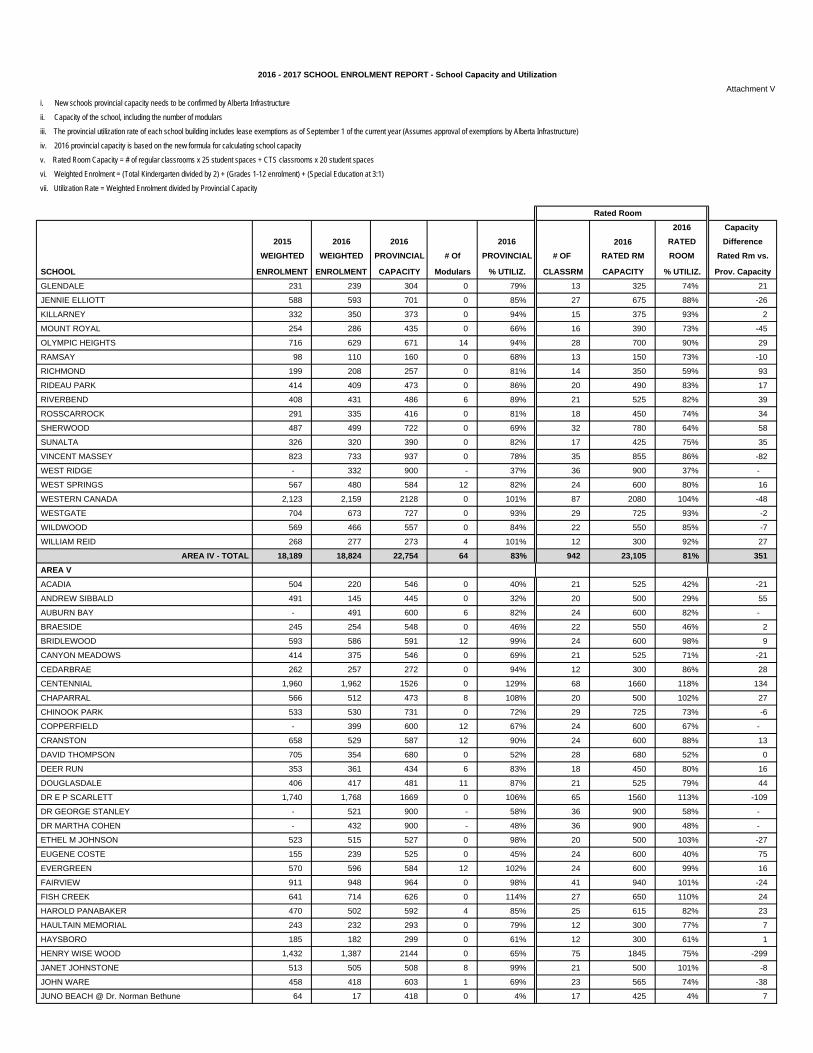
Capacity and Utilization
Attachment V provides capacity and utilization rates for schools, including lease exemptions, on both a provincial and a rated room basis. The formula mandated by the Province to calculate the capacity and utilization of a school was revised and implemented for the first time for the 2014-2015 school year. This new method focuses on the “instructional” area of a school.
The following instructional spaces, if applicable for a particular school, are exempted and deducted from the total capacity of a school:
areas leased to the public sector and non-profit groups, with the lease rate being at cost or for a nominal fee (e.g. not for profit daycare);
areas leased by private schools;
Page 6 | 8

areas leased by charter schools; and
decentralized administration space in schools.
Area exemptions are not granted for space leased to the private sector.
The way in which the new method allows for lease exemptions will mean that provincial capacities of schools may change from year to year if a new lease is added to a school or if an existing lease arrangement has changed or been discontinued.
The Provincial capacity may not always reflect the amount of usable space available for instructional purposes in a particular school. When addressing specific accommodation concerns, the number of students an individual school may accommodate is best measured through assessing the number of teaching spaces in the school. For this reason, CBE Administration also calculates a rated room capacity and utilization for all schools.
Leases
Leases of space by Area and leasing of surplus school facilities are reported in Attachments VII and VIII.
The following table provides a summary of changes in pre-kindergarten to Grade 12 enrolments, out of attendance area students and school capacity utilization rates from September 30, 2015 to September 30, 2016 by Area.
Effective in this year’s School Enrolment Report, kindergarten students who are not attending their designated school are included in the calculation of out of attendance for each elementary school. This change was made to align with a change to AR6090 whereby out of attendance area students are now able to remain in a school for the duration of the grade configuration of the school. Prior to this change, out of attendance area students may only have been accepted for their kindergarten year and not able to remain at the non-designated school beyond that year. This change in reporting accounts, in part, for the increase in the number of out of attendance students from 2015 to 2016.
2015 2016 Change 2015 2016 Change 2015 2016 Change 2015 2016 Change
Area I 17,584 17,817 233 1,490 1,652 162 88% 83% -5% 88% 84% -4%Area II 26,462 25,667 -795 3,149 3,129 -20 90% 84% -6% 91% 85% -6%Area III 20,719 22,600 1,881 1,368 1,530 162 85% 82% -3% 84% 81% -3%Area IV 17,809 18,237 428 1,833 2,055 222 86% 83% -3% 84% 81% -3%Area V 29,143 29,842 699 2,245 2,340 95 88% 79% -9% 88% 79% -9%
111,717 114,163 2,446 10,085 10,706 621 87% 82% -5% 87% 82% -5%
Note: Kindergarten included in out of boundary effective the 2016-2017 school year to align with changes to AR 6090 (December 2015)
Rated Room Utilization
Rates
Analysis excludes Home Education, Outreach Programs, Unique Settings, Chinook Learning and CBe-learn
Enrolment
Out of Attendance Provincial Utilization
Rates
Page 7 | 8

With the opening of new schools this year, the provincial utilization rate for the system is now 82%, a 5% decrease from the 87% system utilization rate last year. The largest number of new schools was opened in Area V and is reflected in the 9% decrease in the utilization rate from 88% in 2015 to 79% this year. Finally, the total number of CBE schools with utilization rates above 80% is 125, there are 4 schools with a utilization rate that is exactly at the 80% mark and the total number of schools with utilization rates below 80% is 89.
5 | Conclusion
Total student enrolment increased by 2,162 students from September 30, 2015 to September 30, 2016 with notable increases at Grades 4-6 (1,274 students), Grades 7-9 (668 students) and Grades 1-3 (522 students).
DAVID STEVENSON CHIEF SUPERINTENDENT OF SCHOOLS
ATTACHMENTS
Attachment I: September 30 enrolment including out of attendance area Attachment II: Alternative program enrolment by school and grade Attachment III: Complex learning classes 2016-2017 Attachment IV: Enrolment in complex learning classes 2016-2017 Attachment V: School capacity and utilization 2016-2017 Attachment VI: CBE actual enrolment 2007-2016 & projected enrolment 2017-2020 Attachment VII: 2016-2017 Leased space in operating schools Attachment VIII: 2016-217 Lease of surplus school facilities Attachment IX: 15-16 Student population change Attachment X: Complex learning definitions
GLOSSARY – Developed by the Board of Trustees
Board: Board of Trustees Governance Culture: The Board defined its own work and how it will be carried out. These policies clearly state the expectations the Board has for individual and collective behaviour. Board/Chief Superintendent Relationship: The Board defined in policy how authority is delegated to its only point of connection – the Chief Superintendent – and how the Chief Superintendent’s performance will be evaluated. Operational Expectations: These policies define both the nonnegotiable expectations and the clear boundaries within which the Chief Superintendent and staff must operate. They articulate the actions and decisions the Board would find either absolutely necessary or totally unacceptable. Results: These are our statements of outcomes for each student in our district. The Results policies become the Chief Superintendent’s and the organization’s performance targets and form the basis for judging organization and Chief Superintendent performance.
Page 8 | 8

CALGARY BOARD OF EDUCATION Attachment ISeptember 30, 2016 Enrolment
SCHOOL Total Pre-K K GR1 GR2 GR3 GR4 GR5 GR6 GR7 GR8 GR9 GR10 GR11 GR12 OOB
ARBOUR LAKE 877 132 142 177 198 228 35
BELVEDERE PARKWAY 284 46 37 46 42 37 43 33 76
BOWCROFT 132 23 29 15 14 17 18 16 21
BOWCROFT German Bilingual 128 23 24 27 22 16 8 8 3
BOWNESS 683 233 217 233 83
BRENTWOOD System Classes 12 2 2 2 2 4 0
BRENTWOOD Traditional Learning 690 99 115 130 115 127 104 5CAPTAIN JOHN PALLISER 314 19 28 33 27 36 88 83 23
CAPTAIN JOHN PALLISER Montessori 287 40 64 60 43 45 18 17 2
CITADEL PARK 444 73 102 85 93 91 9
DALHOUSIE Spanish Bilingual 516 73 78 73 85 115 92 53
DR E W COFFIN 180 24 24 25 24 29 23 31 95
EDGEMONT 721 104 99 93 100 125 100 100 3
ERIC HARVIE Tuscany Elementary #2 346 100 84 72 90 3
F E OSBORNE 451 146 153 152 36
H D CARTWRIGHT 378 114 126 138 49
HAMPTONS (THE) 203 31 37 58 30 47 41
HAWKWOOD 604 64 103 110 84 95 87 61 52
MARION CARSON 347 37 43 56 54 52 56 49 32
MARION CARSON Chinese (Mandarin) Bil 178 47 52 47 32 2
RANCHLANDS 443 79 56 63 73 50 70 52 13
ROBERT THIRSK 1,262 348 427 487 147
ROYAL OAK 500 138 111 127 124 5
SCENIC ACRES 142 24 28 23 43 24 12
SILVER SPRINGS 235 36 36 43 34 22 30 34 34
SIMON FRASER 379 103 101 175 41
SIR WINSTON CHURCHILL 2,165 691 741 733 490
TERRACE ROAD 164 26 19 22 29 16 19 22 11 36
THOMAS B RILEY 175 45 70 60 26
THOMAS B RILEY Traditional Learning 331 112 79 76 64 0
TOM BAINES 655 203 222 230 40
TUSCANY 489 71 75 79 94 170 12
TWELVE MILE COULEE 797 174 173 152 168 130 8

CALGARY BOARD OF EDUCATION Attachment ISeptember 30, 2016 Enrolment
SCHOOL Total Pre-K K GR1 GR2 GR3 GR4 GR5 GR6 GR7 GR8 GR9 GR10 GR11 GR12 OOB
UNIVERSITY 401 79 58 65 57 57 46 39 102
VARSITY ACRES French Immersion 546 74 79 92 84 83 81 53 10
W O MITCHELL 93 18 26 18 31 27
W O MITCHELL Spanish Bilingual 341 70 84 101 86 2
WEST DALHOUSIE 326 30 34 46 60 42 57 57 23
WILLIAM D. PRATT Rocky Ridge/Royal Oak Middle 598 127 132 141 108 90 1AREA I TOTAL 17,817 26 1,423 1,504 1,600 1,546 1,454 1,403 1,243 1,127 1,204 1,177 1,272 1,385 1,453 1,652
ALEX MUNRO 274 42 39 37 40 49 41 26 24
BALMORAL Traditional Learning 615 125 130 150 108 102 33
BANFF TRAIL French Immersion 417 45 73 66 58 62 63 50 40
BEDDINGTON HEIGHTS 446 51 80 68 68 64 65 50 32
BELFAST 254 38 32 45 41 33 36 29 204
BRANTON French Immersion 722 260 237 225 36
BRIAR HILL 252 43 33 38 30 36 34 38 117
BUCHANAN 195 34 36 16 27 31 29 22 46
BUFFALO RUBBING STONE Panorama Hills Elementary #2 441 92 100 83 107 59 29
CAMBRIAN HEIGHTS 242 20 17 28 20 52 51 54 32
CAPITOL HILL 327 41 50 42 61 44 44 45 55
CAPTAIN NICHOLA GODDARD 818 198 153 169 156 142 3
CATHERINE N GUNN 355 38 63 52 61 49 54 38 103
COLLINGWOOD Spanish Bilingual 511 77 100 82 95 80 77 35
COLONEL IRVINE 120 44 28 48 17
COLONEL IRVINE Traditional Learning 404 99 89 85 87 44 45
COLONEL IRVINE Chinese (Mandarin) Bil 213 67 43 44 33 26 0
COLONEL MACLEOD 145 17 33 95 8
COLONEL SANDERS Traditional Learning 399 98 102 101 98 3
COVENTRY HILLS 615 22 146 147 141 159 6
CRESCENT HEIGHTS 1,572 434 526 612 411
CRESCENT HEIGHTS Traditional Learning 76 76
DR J K MULLOY Traditional Learning 477 95 100 96 94 92 12
GEORGES P VANIER 282 91 85 106 57
GEORGES P VANIER French Immersion 226 73 74 79 18
HIDDEN VALLEY 231 50 54 61 66 2

CALGARY BOARD OF EDUCATION Attachment ISeptember 30, 2016 Enrolment
SCHOOL Total Pre-K K GR1 GR2 GR3 GR4 GR5 GR6 GR7 GR8 GR9 GR10 GR11 GR12 OOB
HIDDEN VALLEY French Immersion 235 50 66 64 55 9
HIGHWOOD Chinese (Mandarin) Bil 373 68 75 69 81 80 0
HILLHURST 299 18 25 25 30 68 81 52 46
HUNTINGTON HILLS 241 25 30 39 43 34 38 32 45
JAMES FOWLER 690 124 154 412 192
JAMES FOWLER Arts Centered Learning 272 74 96 102 6
JOHN G DIEFENBAKER 1,437 422 483 532 156
KENNETH D. TAYLOR Evanston Elementary 352 106 102 69 75 2KING GEORGE French Immersion 564 104 102 81 79 70 76 52 11
LANGEVIN System Classes 10 5 4 1
LANGEVIN Science 632 42 51 47 54 77 53 57 86 85 80 4
LOUISE DEAN 119 18 31 70 6
MAYLAND HEIGHTS 155 21 15 32 23 24 23 17 60
MAYLAND HEIGHTS French Immersion 303 54 59 56 59 50 25 6
MOUNT VIEW 185 29 37 26 27 30 22 14 59
NORTH HAVEN 338 23 39 34 40 32 62 61 47 29
NOSE CREEK 859 148 135 149 154 147 126 29
PANORAMA HILLS 561 87 95 107 121 151 12
QUEEN ELIZABETH 333 50 55 55 50 37 46 40 21
QUEEN ELIZABETH JR/SR 976 190 162 150 160 136 178 193
ROSEDALE 259 22 25 24 24 25 30 26 23 27 33 66
ROSEMONT 232 38 30 38 41 32 31 22 52
SENATOR PATRICK BURNS 86 23 31 32 36
SENATOR PATRICK BURNS Spanish Bilingual 527 162 137 114 114 8
SIMONS VALLEY 707 79 101 112 97 120 99 99 49
SIR JOHN A MACDONALD 567 175 182 210 84
SIR JOHN FRANKLIN Arts Centered Learning 341 27 54 103 76 81 8
SIR JOHN FRANKLIN System Classes 114 23 8 9 35 39 0
STANLEY JONES 230 30 49 44 44 22 22 19 20
STANLEY JONES Alice Jamieson 298 27 45 60 53 59 54 0
SUNNYSIDE 147 18 21 23 23 21 19 22 70
THORNCLIFFE 161 24 26 16 22 30 21 22 30
THORNCLIFFE Traditional Learning 81 81 2

CALGARY BOARD OF EDUCATION Attachment ISeptember 30, 2016 Enrolment
SCHOOL Total Pre-K K GR1 GR2 GR3 GR4 GR5 GR6 GR7 GR8 GR9 GR10 GR11 GR12 OOB
VALLEY CREEK 505 69 71 75 93 107 90 31
VALLEY CREEK French Immersion 209 52 40 34 31 29 23 12
VISTA HEIGHTS 151 31 25 24 19 21 15 16 10
WILLIAM ABERHART 514 110 158 246 382
WILLIAM ABERHART French Immersion 785 275 249 261 11
WILLIAM ABERHART Spanish Bilingual 190 75 66 49 4AREA II TOTAL 25,667 45 1,828 2,045 1,948 2,027 1,999 1,986 1,846 2,015 1,899 1,900 1,692 1,899 2,538 3,129
ABBEYDALE 303 44 61 49 61 46 42 10
ANNIE FOOTE 547 88 92 115 81 64 56 51 24
ANNIE GALE 369 117 124 128 36
ANNIE GALE Traditional Learning 225 58 62 63 42 7
BOB EDWARDS 204 51 46 42 65 59
BOB EDWARDS French Immersion 146 19 41 44 42 1
CAPPY SMART 202 27 31 27 36 30 51 28
CECIL SWANSON 430 79 71 70 58 45 59 48 62
CHIEF JUSTICE MILVAIN 222 22 34 41 40 32 24 29 9
CHIEF JUSTICE MILVAIN Traditional Learning 301 49 50 50 51 51 50 2
CHRIS AKKERMAN Traditional Learning 625 103 108 103 103 104 104 4
CLARENCE SANSOM 458 164 151 143 70
COLONEL J F SCOTT 503 60 77 83 73 76 70 64 36
CROSSING PARK 1,151 112 114 112 114 111 115 123 126 111 113 24
DOUGLAS HARKNESS 282 15 34 35 38 44 44 39 33 5
DR GLADYS M EGBERT 418 111 95 102 110 53
DR GORDON HIGGINS 491 158 153 180 21
ERIN WOODS 381 57 74 71 64 60 55 25
ERNEST MORROW 696 142 206 173 175 24
FALCONRIDGE 488 22 76 77 70 82 62 41 58 54
FOREST LAWN 1,327 408 370 549 145
G W SKENE 198 65 74 59 9
GRANT MACEWAN 639 112 89 99 100 97 78 64 26
GUY WEADICK 505 111 90 88 77 54 34 51 4
HUGH A. BENNETT Saddleridge Elementary #2 403 82 96 91 85 49 8
IAN BAZALGETTE 441 106 106 111 118 19

CALGARY BOARD OF EDUCATION Attachment ISeptember 30, 2016 Enrolment
SCHOOL Total Pre-K K GR1 GR2 GR3 GR4 GR5 GR6 GR7 GR8 GR9 GR10 GR11 GR12 OOB
JACK JAMES 412 99 112 201 6
JAMES SHORT MEMORIAL 286 27 79 105 75 13
KEELER 313 51 49 44 50 58 61 46
LESTER B PEARSON 1,511 425 509 577 182
LESTER B PEARSON French Immersion 103 35 30 38 2
MARLBOROUGH 208 36 47 31 37 26 31 7MONTEREY PARK 538 67 84 76 78 70 70 93 41
NELSON MANDELA Northeast High School 1,176 677 499 54
O S GEIGER 433 61 58 67 67 52 58 70 54
PATRICK AIRLIE 209 6 45 39 35 41 24 19 31
PENBROOKE MEADOWS 214 23 35 24 34 46 52 33
PETER LOUGHEED Saddleridge Middle 476 156 115 121 84 3
PINERIDGE 274 33 36 37 49 35 40 44 45
RADISSON PARK 281 50 58 44 41 49 39 10
ROLAND MICHENER 216 20 51 39 32 36 38 39
RUNDLE 532 80 71 68 93 87 73 60 16
SADDLE RIDGE 588 118 139 113 109 109 31
SIR WILFRID LAURIER 18 18 2
SIR WILFRID LAURIER Traditional Learning 416 120 130 99 67 5
TARADALE 680 145 133 131 142 129 5
TED HARRISON 750 144 149 164 129 164 37TERRY FOX 483 144 156 183 36VALLEY VIEW 250 31 49 44 38 44 44 35
VALLEY VIEW Medicine Wheel 14 14 0
WEST DOVER 264 40 56 53 51 32 32 32AREA III TOTAL 22,600 70 1,949 2,109 1,988 1,996 1,796 1,734 1,659 1,680 1,542 1,548 1,644 1,520 1,365 1,530
A E CROSS 515 171 179 165 34
ALEXANDER FERGUSON 262 29 40 46 46 30 30 41 39
ALL BOYS Sir James Lougheed 177 14 21 28 30 43 26 15 2
ALTADORE 357 52 62 54 52 48 45 44 43
ALTERNATIVE HIGH 117 1 3 19 16 78 9
BANTING AND BEST 209 52 57 51 49 15
BATTALION PARK 701 96 104 115 112 89 98 87 15

CALGARY BOARD OF EDUCATION Attachment ISeptember 30, 2016 Enrolment
SCHOOL Total Pre-K K GR1 GR2 GR3 GR4 GR5 GR6 GR7 GR8 GR9 GR10 GR11 GR12 OOB
BISHOP PINKHAM 115 29 56 30 14
BISHOP PINKHAM French Immersion 394 65 109 133 87 7
BISHOP PINKHAM Spanish Bilingual 100 35 41 24 1
CENTRAL MEMORIAL 1,036 329 366 341 141
COLONEL WALKER 127 24 24 17 12 17 15 18 9
CONNAUGHT 324 83 68 44 47 28 26 28 24
DR ROBERTA BONDAR Aspenwoods/Strathcona Elementary 268 45 62 61 59 41 7
EARL GREY 213 19 30 35 36 31 30 32 92
ELBOW PARK 187 21 25 37 17 37 13 37 15
ELBOYA 393 32 44 45 52 37 46 39 24 50 24 56
ELBOYA French Immersion 255 43 37 83 43 49 33
ERNEST MANNING 1,783 587 605 591 170
GLAMORGAN Traditional Learning 707 82 74 75 96 89 100 82 58 28 23 4
GLENBROOK 288 37 47 44 52 35 30 43 18GLENDALE 240 30 40 34 34 36 30 36 89
JENNIE ELLIOTT 589 89 94 117 94 64 66 65 15
KILLARNEY Montessori 365 66 71 67 60 42 30 29 10
MOUNT ROYAL 254 77 80 97 31NATIONAL SPORT SCHOOL 170 32 41 47 50 36
OLYMPIC HEIGHTS 649 73 80 79 100 83 121 113 65
PIITOAYIS FAMILY SCHOOL Colonel Walker 172 29 25 27 24 24 26 17 1
RAMSAY 115 23 24 15 20 14 10 9 38
RICHMOND 201 43 33 24 31 23 19 28 48
RIDEAU PARK 399 20 32 23 21 32 24 25 65 79 78 98
RIVERBEND 413 68 65 74 68 56 43 39 33
ROSSCARROCK 201 35 22 36 27 28 26 27 44
ROSSCARROCK Spanish Bilingual 106 44 62 1
ROSSCARROCK French Immersion 83 83 1
SHERWOOD 415 53 43 43 87 97 92 32
SUNALTA 303 27 47 42 53 48 43 43 114
VINCENT MASSEY 709 222 224 263 52
WEST RIDGE West Springs/Cougar Ridge Middle 322 99 97 73 53 4
WEST SPRINGS 506 77 96 108 119 106 7
CALGARY BOARD OF EDUCATION Attachment ISeptember 30, 2016 Enrolment
SCHOOL Total Pre-K K GR1 GR2 GR3 GR4 GR5 GR6 GR7 GR8 GR9 GR10 GR11 GR12 OOB
WESTERN CANADA 1,623 525 523 575 474
WESTERN CANADA French Immersion 472 178 156 138 52
WESTGATE French Immersion 376 87 88 81 69 51 9
WESTGATE Spanish Bilingual 289 73 58 60 55 43 3
WILDWOOD 439 62 55 75 77 68 60 42 43
WILLIAM REID French Immersion 298 47 70 55 83 43 7AREA IV TOTAL 18,237 - 1,402 1,561 1,589 1,610 1,374 1,248 1,224 1,033 1,064 967 1,679 1,713 1,773 2,055
ACADIA 230 48 47 44 52 39 5
ANDREW SIBBALD 147 25 29 41 34 18 26
AUBURN BAY Auburn Bay Elementary 529 141 131 105 79 73 19
BRAESIDE 229 27 37 36 32 33 29 35 24
BRIDLEWOOD 595 75 86 91 85 79 83 96 6
CANYON MEADOWS Spanish Bilingual 400 70 75 73 76 106 66
CEDARBRAE 242 30 36 37 46 26 32 35 63
CENTENNIAL 1,830 626 574 630 370
CHAPARRAL 528 68 67 71 88 86 57 91 13
CHINOOK PARK 192 15 32 29 35 28 27 26 42
CHINOOK PARK French Immersion 311 36 56 47 52 52 31 37 21
COPPERFIELD Copperfield Elementary 410 98 79 96 60 77 0
CRANSTON 578 142 141 145 150 1DAVID THOMPSON 308 42 48 34 54 130 15
DEER RUN 358 55 58 52 58 52 44 39 12
DOUGLASDALE 405 72 83 104 62 84 25
DR E P SCARLETT 1,300 409 411 480 268
DR E P SCARLETT French Immersion 291 111 86 94 5
DR E P SCARLETT Spanish Bilingual 99 41 37 21 3
DR GEORGE STANLEY Cranston Middle 463 140 121 86 77 39 5
DR MARTHA COHEN New Brighton/Copperfield Middle 386 111 99 101 75 1
ETHEL M JOHNSON 472 71 57 69 63 67 52 93 38
EUGENE COSTE Spanish Bilingual 256 59 94 58 45 42
EVERGREEN 625 111 137 128 139 110 5
FAIRVIEW French Immersion 439 85 82 99 93 80 5
FAIRVIEW Traditional Learning 499 109 99 98 102 91 2

CALGARY BOARD OF EDUCATION Attachment ISeptember 30, 2016 Enrolment
SCHOOL Total Pre-K K GR1 GR2 GR3 GR4 GR5 GR6 GR7 GR8 GR9 GR10 GR11 GR12 OOB
FISH CREEK 744 96 106 108 109 121 89 115 6
HAROLD PANABAKER 184 44 68 72 23
HAROLD PANABAKER French Immersion 276 23 27 88 73 65 25
HAULTAIN MEMORIAL 255 24 47 35 33 27 22 36 31 39
HAYSBORO 175 22 24 30 26 26 21 26 16
HENRY WISE WOOD 1,154 373 419 362 149
HENRY WISE WOOD Traditional Learning 75 75 0
JANET JOHNSTONE 302 54 65 59 66 58 6
JANET JOHNSTONE French Immersion 227 47 61 49 39 31 3
JOHN WARE 358 126 114 118 85
JUNO BEACH ACADEMY Dr Norman Bethune 15 5 5 5
LAKE BONAVISTA Montessori 352 61 78 49 63 53 26 22 4
LE ROI DANIELS Traditional Learning 535 103 108 111 110 103 2
LORD BEAVERBROOK 1,669 497 579 593 139
LORD BEAVERBROOK Arts Centered Learning 77 42 21 14 1
LOUIS RIEL Science 601 69 64 63 63 81 53 60 53 52 43 15
LOUIS RIEL GATE 273 15 49 46 45 61 57 3
MAPLE RIDGE 156 26 35 26 30 39 22
MCKENZIE HIGHLANDS McKenzie Towne Middle 271 92 71 67 41 5
MCKENZIE LAKE 487 94 86 124 79 104 14
MCKENZIE TOWNE 651 134 127 143 121 126 1
MIDNAPORE 260 39 43 39 38 43 30 28 45
MIDNAPORE Chinese (Mandarin) Bilingual 234 48 48 39 40 27 24 8 5
MIDSUN 802 263 268 271 30
MOUNTAIN PARK 816 130 171 153 170 192 53
NELLIE McCLUNG 414 56 72 56 69 56 54 51 28
NEW BRIGHTON New Brighton Elementary 488 149 108 86 81 64 7
NICKLE 597 89 93 128 137 150 48
PRINCE OF WALES 353 41 43 64 55 55 60 35 187
R T ALDERMAN 214 15 25 29 59 86 58
ROBERT WARREN Spanish Bilingual 345 94 77 58 63 53 6
SAM LIVINGSTON French Immersion 489 98 107 106 104 74 27
SAMUEL W SHAW 811 125 135 188 181 182 42
CALGARY BOARD OF EDUCATION Attachment ISeptember 30, 2016 Enrolment
SCHOOL Total Pre-K K GR1 GR2 GR3 GR4 GR5 GR6 GR7 GR8 GR9 GR10 GR11 GR12 OOB
SOMERSET 293 44 55 65 61 68 30
SUNDANCE 81 12 8 20 21 20 20
SUNDANCE French Immersion 410 63 92 76 72 58 22 27 8
WILLOW PARK Arts Centered Learning 654 89 117 152 150 146 0
WILMA HANSEN 286 92 94 100 20
WOODBINE 380 13 52 57 54 60 51 51 42 23
WOODLANDS 289 37 44 51 38 46 27 46 31
WOODMAN 667 90 66 174 157 180 32AREA V TOTAL 29,842 37 2,523 2,703 2,669 2,515 2,411 2,133 2,205 2,069 2,051 2,016 2,104 2,132 2,274 2,340
TOTAL 114,163 178 9,125 9,922 9,794 9,694 9,034 8,504 8,177 7,924 7,760 7,608 8,391 8,649 9,403 10,706
CALGARY BOARD OF EDUCATION Attachment ISeptember 30, 2016 Enrolment
SCHOOL Total Pre-K K GR1 GR2 GR3 GR4 GR5 GR6 GR7 GR8 GR9 GR10 GR11 GR12 OOB
SCHOOL Total Pre-K K GR1 GR2 GR3 GR4 GR5 GR6 GR7 GR8 GR9 GR10 GR11 GR12
OUTREACH PROGRAMS
DISCOVERING CHOICES Downtown 577 6 50 521
DISCOVERING CHOICES II Marlborough 357 6 48 303
START OUTREACH - BOWNESS Bowness 183 3 17 163
WESTBROOK OUTREACH Westbrook 220 5 17 198
TOTAL OUTREACH PROGRAMS 1,337 - - - - - - - - - - - 20 132 1,185
UNIQUE SETTINGS
AADAC Area II 4 1 2 1
ABORIGINAL LEARNING CENTRE Area III 27 20 7
CHILDREN'S VILLAGE Area II 59 3 5 14 7 12 8 10
CHRISTINE MEIKLE Area II 82 8 7 10 13 8 36
DR GORDON TOWNSEND Area I 13 1 3 2 2 3 2
DR OAKLEY Area IV 152 8 32 43 40 17 8 4
EMILY FOLLENSBEE Area IV 84 6 8 9 17 6 14 10 7 3 4
NEXUS/TRUST TREATMENT/PROJECT TRU Area II 22 2 5 15
WEST VIEW SECONDARY Area I 71 1 2 7 26 35
WILLIAM ROPER HULL Area V 108 1 1 4 5 6 6 11 13 15 17 11 18
WOOD'S HOMES Area I 62 1 1 1 7 4 10 19 7 12
YOUNG ADULT PROGRAM Area I 45 1 7 11 7 19
TOTAL UNIQUE SETTINGS 729 - 29 21 25 40 58 73 70 52 37 52 70 66 136
HOME EDUCATION Windsor Park 249 18 25 32 40 27 31 23 22 23 3 2 3
CBe-LEARN* 458 3 15 26 46 62 306
CHINOOK LEARNING SERVICES* 2,211 4 6 2201
SUB-TOTAL 2,918 - - 18 25 32 40 27 31 26 37 49 53 70 2,510 *includes students 20 years old and older
TOTAL ENROLMENT 119,147 178 9,154 9,961 9,844 9,766 9,132 8,604 8,278 8,002 7,834 7,709 8,534 8,917 13,234
2016‐2017 School Enrolment Report Attachment II
Alternative Programs and Schools
K 1 2 3 4 5 6 7 8 9 10 11 12 Total
Alice Jamieson Girls' Academy 27 45 60 53 59 54 298
Stanley Jones School 27 45 60 53 59 54 298
All ‐ Boys School 14 21 28 30 43 26 15 177
Sir James Lougheed School 14 21 28 30 43 26 15 177
Arts‐Centred Learning 117 171 255 253 254 116 117 116 1,399
James Fowler High School 74 96 102 272
Lord Beaverbrook High School 42 21 14 77
Sir John Franklin School 28 54 103 103 108 396
Willow PA School 89 117 152 150 146 654
Chinese (Mandarin) Bilingual 163 175 155 153 107 91 51 44 33 26 998
Colonel Irvine School 67 43 44 33 26 213
Highwood School 68 75 69 81 80 373
Marion Carson School 47 52 47 32 178
Midnapore School 48 48 39 40 27 24 8 234
French Immersion (Early & Late) 701 852 780 766 644 540 483 784 726 650 599 521 531 8,577
Banff Trail School 45 73 66 58 62 63 50 417
Bishop Pinkham School 65 109 133 87 394
Bob Edwards School 19 41 44 42 146
Branton School 260 237 225 722
Chinook PA School 36 56 47 52 52 31 37 311
Dr. E.P. Scarlett High School 111 86 94 291
Elboya School 43 37 83 43 49 255
Fairview School 85 82 99 93 80 439
Georges P. Vanier School 73 74 79 226
Harold Panabaker School 23 27 88 73 65 276
Hidden Valley School 50 66 64 55 235
Janet Johnstone School 47 61 49 39 31 227
King George School 104 102 81 79 70 76 52 564
Lester B. Pearson High School 35 30 38 103
Mayland Heights School 54 59 56 59 50 25 303
Rosscarrock School 83 83
Sam Livingston School 98 107 106 104 74 489
Sundance School 63 92 76 72 58 22 27 410
Valley Creek School 52 40 34 31 29 23 209
Varsity Acres School 74 79 92 84 83 81 53 546
Western Canada High School 178 156 138 472
Westgate School 87 88 81 69 51 376
William Aberhart High School 275 249 261 785
William Reid School 47 70 55 83 43 298
German Bilingual 23 24 27 22 16 8 8 128
Bowcroft School 23 24 27 22 16 8 8 128
Juno Beach Academy 5 5 5 15
Juno Beach Academy 5 5 5 15
Medicine Wheel 15 15
Valley View School 15 15
Montessori 167 213 176 166 140 74 68 1,004
Captain John Palliser School 40 64 60 43 45 18 17 287
Killarney School 66 71 67 60 42 30 29 365
Lake Bonavista School 61 78 49 63 53 26 22 352
Piitoayis Aboriginal Family School 29 25 27 24 24 26 17 172
Piitoayis Family School 29 25 27 24 24 26 17 172

Science School 111 115 110 117 158 106 117 139 138 123 1,234
Langevin School 42 51 47 54 77 53 57 86 86 80 633
Louis Riel School 69 64 63 63 81 53 60 53 52 43 601
Spanish Bilingual 393 493 460 445 361 318 282 230 218 191 116 103 70 3,680
Bishop Pinkham School 35 41 24 100
Canyon Meadows School 70 75 73 76 106 400
Collingwood School 77 100 82 95 80 77 511
Dalhousie School 73 78 73 85 115 92 516
Dr. E.P. Scarlett High School 41 37 21 99
Eugene Coste School 59 94 58 45 256
Robert Warren School 94 77 58 63 53 345
Rosscarrock School 44 62 106
Senator Patrick Burns School 162 137 114 114 527
W.O. Mitchell School 70 84 101 86 341
Westgate School 73 58 60 55 43 289
William Aberhart High School 75 66 49 190
Traditional Learning Centre 612 654 669 671 665 691 690 662 563 433 151 6,461
Annie Gale School 58 62 63 42 225
Balmoral School 125 130 150 108 102 615
Brentwood School 99 116 132 116 128 104 695
Chief Justice Milvain School 49 50 50 51 51 50 301
Chris Akkerman School 103 108 103 103 104 104 625
Colonel Irvine School 99 89 85 87 44 404
Colonel Sanders‐TLC 98 102 101 98 399
Crescent Heights High School 76 76
Dr. J.K. Mulloy School 95 100 96 94 92 477
Fairview School 109 99 98 102 91 499
Glamorgan School 82 74 75 96 89 100 82 58 28 23 707
Henry Wise Wood High School 75 75
Le Roi Daniels School 103 108 111 110 103 535
Sir Wilfrid Laurier School 120 130 99 67 416
Thomas B. Riley School 112 79 76 64 331
Thorncliffe School 81 81
Grand Total 2,228 2,572 2,432 2,394 2,185 2,042 1,962 2,167 1,990 1,731 836 746 873 24,158

2016-2017 School Enrolment Report Attachment III
Area School PROGRAM# of
ClassesI Arbour Lake Learning & Literacy (L&L) 2I Bowness Paced Learning Program (PLP) 1I Brentwood Communication, Sensory and Social Interaction (CSSI) 1I Captain John Palliser Learning & Literacy (L&L II) 1I F E Osborne Paced Learning Program (PLP) 1I F.E. Osborne Mental Health - AIM 2I H.D. Cartwright Attitude, Community Competence, Elements (of Academic Curriculum), Social Skills (ACCESS) 1I H.D. Cartwright Learning & Literacy (L&L) 2I Hawkwood Bridges 1I Marion Carson Communication, Sensory and Social Interaction (CSSI) 1I Ranchlands Paced Learning Program (PLP) 1I Robert Thirsk Adapted Learning Program (ALP) 1I Robert Thirsk Paced Learning Program (PLP) 1I Sir Winston Churchill Mental Health - Class 1I Terrace Road Early Development Centre 4I Terrace Road Paced Learning Program (PLP) 1I Thomas B. Riley Adapted Learning Program (ALP) 1I Thomas B. Riley Paced Learning Program (PLP) 1I University Communication, Sensory and Social Interaction (CSSI) 2I West Dalhousie Social Knowledge, Independent Living and Language (SKILL I/II) 1II Banff Trail Learning & Literacy (L&L II) 1II Briar Hill Mental Health 1II Buchanan Social Knowledge, Independent Living and Language (SKILL I/II) 2II Buchanan Teaching of Attitude, Social Skills and Communication (TASC) 1II Buffalo Rubbing Stone Social Knowledge, Independent Living and Language (SKILL I/II) 1II Buffalo Rubbing Stone Teaching of Attitude, Social Skills and Communication (TASC) 1II Cambrian Heights Paced Learning Program (PLP) 1II Capitol Hill Bridges 1II Capitol Hill Teaching of Attitude, Social Skills and Communication (TASC) 1II Children's Village Early Development Centre (Full Day) 1II Colonel Macleod Bridges 1II Coventry Hills Early Development Centre 2II Crescent Heights High Bridges (HIP) 1II Georges P. Vanier Learning & Literacy (L&L) 2II Hillhurst Gifted and Talented Education (GATE) 6II Huntington Hills Learning & Literacy (L&L II) 2II James Fowler High Literacy, English & Academic Development (LEAD) 3II James Fowler High Paced Learning Program (PLP) 2II Kenneth D. Taylor Communication, Sensory and Social Interaction (CSSI) 2II Langevin Attitude, Community Competence, Elements (of Academic Curriculum), Social Skills (ACCESS) 1II Mayland Heights Communication, Sensory and Social Interaction (CSSI) 1II North Haven Bridges 1II North Haven Early Development Centre 4II North Haven Paced Learning Program (PLP) 1II Nose Creek Autism Spectrum Disorder (ASD) cluster 1II Nose Creek Paced Learning Program (PLP) 2II Queen Elizabeth Deaf and Hard of Hearing (Total Communication) 1II Queen Elizabeth High Deaf and Hard of Hearing (III/IV) 4II Queen Elizabeth High Gifted and Talented Education (GATE III) 10II Queen Elizabeth High Gifted and Talented Education (GATE IV) 5Ii Queen Elizabeth High Mental Health - Transitions 1II Queen Elizabeth High Returning Grade 12's 1II Simons Valley Social Knowledge, Independent Living and Language (SKILL I/II) 1II Sir John A. Macdonald Learning & Literacy (L&L) 2II Sir John A. Macdonald Paced Learning Program (PLP) 1II Sir John A. Macdonald Teaching of Attitude, Social Skills and Communication (TASC) 1II Sir John Franklin Communication, Sensory and Social Interaction (CSSI) 1II Sir John Franklin Literacy, English & Academic Development (LEAD) 4II Stanley Jones Deaf and Hard of Hearing (Aural) 6II William Aberhart High Adapted Learning Program (ALP) 1II William Aberhart High Attitude, Community Competence, Elements (of Academic Curriculum), Social Skills (ACCESS) 1
CALGARY BOARD OF EDUCATIONCOMPLEX LEARNING CLASSES 2016-2017
2016-2017 School Enrolment Report Attachment III
Area School PROGRAM# of
Classes
CALGARY BOARD OF EDUCATIONCOMPLEX LEARNING CLASSES 2016-2017
III Aboriginal Learning Centre Early Development Centre 2III Annie Gale Learning & Literacy (L&L) 2III Annie Gale Paced Learning Program (PLP) 1III Bob Edwards Mental Health 1III Cappy Smart Literacy, English & Academic Development (LEAD) 2III Cappy Smart Social Knowledge, Independent Living and Language (SKILL I/II) 2III Cecil Swanson Social Knowledge, Independent Living and Language (SKILL I/II) 2III Clarence Sansom Adapted Learning Program (ALP) 1III Clarence Sansom Attitude, Community Competence, Elements (of Academic Curriculum), Social Skills (ACCESS) 1III Clarence Sansom Literacy, English & Academic Development (LEAD) 2III Crossing Park Learning & Literacy (L&L) 3III Douglas Harkness Early Development Centre 2III Dr. Gladys M. Egbert Paced Learning Program (PLP) 2III Dr. Gordon Higgins Paced Learning Program (PLP) 2III Erin Woods Bridges 2III Ernest Morrow Literacy, English & Academic Development (LEAD) 1III Ernest Morrow Paced Learning Program (PLP) 3III Falconridge Early Development Centre 2III Forest Lawn High Literacy, English & Academic Development (LEAD) 4III Forest Lawn High Mental Health - Class 2III Forest Lawn High Paced Learning Program (PLP) 2III G. W. Skene Social Knowledge, Independent Living and Language (SKILL I/II) 1III Hugh A. Bennett Teaching of Attitude, Social Skills and Communication (TASC) 1III Ian Bazalgette Bridges 2III Jack James High Paced Learning Program (PLP) 1III James Short Memorial Early Development Centre 4III Keeler Communication, Sensory and Social Interaction (CSSI) 1III Keeler Literacy, English & Academic Development (LEAD) 3III Lester B. Pearson High Adapted Learning Program (ALP) 1III Lester B. Pearson High Attitude, Community Competence, Elements (of Academic Curriculum), Social Skills (ACCESS) 1III Monterey Park Communication, Sensory and Social Interaction (CSSI) 2III Nelson Mandela High Paced Learning Program (PLP) 1III O.S. Geiger Paced Learning Program (PLP) 1III Patrick Airlie Early Development Centre 2III Penbrooke Meadows Literacy, English & Academic Development (LEAD) 4III Pineridge Communication, Sensory and Social Interaction (CSSI) 2III Radisson Park Autism Spectrum Disorder (ASD) cluster 1III Roland Michener Paced Learning Program (PLP) 1III Rundle Bridges 2III Sir Wilfrid Laurier Learning & Literacy (L&L) 1III Ted Harrison Communication, Sensory and Social Interaction (CSSI) 1III Terry Fox Bridges 1III Terry Fox Literacy, English & Academic Development (LEAD) 3III West Dover Social Knowledge, Independent Living and Language (SKILL I/II) 1III West Dover Teaching of Attitude, Social Skills and Communication (TASC) 1IV AE Cross Paced Learning Program (PLP) 2IV Alternative High HERA 1IV Bishop Pinkham Communication, Sensory and Social Interaction (CSSI) 1IV Cbe-Learn Bridges 1IV Central Memorial High Communication, Sensory and Social Interaction (CSSI) 1IV Central Memorial High Teaching of Attitude, Social Skills and Communication (TASC) 3IV Earl Grey Learning & Literacy (L&L II) 1IV Ernest Manning High Paced Learning Program (PLP) 2IV Jennie Elliott Teaching of Attitude, Social Skills and Communication (TASC) 1IV Mount Royal Attitude, Community Competence, Elements (of Academic Curriculum), Social Skills (ACCESS) 1IV Mount Royal Teaching of Attitude, Social Skills and Communication (TASC) 1IV Richmond Bridges 1IV Riverbend MH 1IV Rosscarrock Paced Learning Program (PLP) 1IV Sherwood Bridges 1IV Sunalta Autism Spectrum Disorder (ASD) cluster 1

2016-2017 School Enrolment Report Attachment III
Area School PROGRAM# of
Classes
CALGARY BOARD OF EDUCATIONCOMPLEX LEARNING CLASSES 2016-2017
IV Sunalta Bridges 1IV Vincent Massey Learning & Literacy (L&L) 2IV Vincent Massey Literacy, English & Academic Development (LEAD) 1IV Western Canada Mental Health - Class 1IV Wildwood Social Knowledge, Independent Living and Language (SKILL I/II) 2V Andrew Sibbald Mental Health 1V Auburn Bay Social Knowledge, Independent Living and Language (SKILL I/II) 1V Braeside Bridges 1V Centenial High Mental Health - Class 1V Centenial High Paced Learning Program (PLP) 1V Chinook Park Communication, Sensory and Social Interaction (CSSI) 2V Copperfield Autism Spectrum Disorder (ASD) cluster 1V Douglasdale Communication, Sensory and Social Interaction (CSSI) 2V Douglasdale Social Knowledge, Independent Living and Language (SKILL I/II) 1V Dr. Marthan Cohen Autism Spectrum Disorder (ASD) cluster 2V Ethel M. Johnson Learning & Literacy (L&L II) 2V Ethel M. Johnson Paced Learning Program (PLP) 2V Ethel M. Johnson Social Knowledge, Independent Living and Language (SKILL I/II) 2V Harold Panabaker Learning & Literacy (L&L) 2V Haultain Memorial Early Development Centre 4V Henry Wise Wood Autism Spectrum Disorder (ASD) cluster 1V Henry Wise Wood High Attitude, Community Competence, Elements (of Academic Curriculum), Social Skills (ACCESS) 2V Henry Wise Wood High Gifted and Talented Education (GATE) 10V Henry Wise Wood High Literacy, English & Academic Development (LEAD) 2V Henry Wise Wood High Paced Learning Program (PLP) 1V John Ware Mental Health 1V Lord Beaverbrook High Adapted Learning Program (ALP) 2V Lord Beaverbrook High Mental Health - Class 1V Lord Beaverbrook High Returning Grade 12's (located at Dr. Norman Bethune) 1V Louis Riel Gifted and Talented Education (GATE II) 8V Louis Riel Gifted and Talented Education (GATE III) 3V McKenzie Highland Learning & Literacy (L&L) 2V Midsun Adapted Learning Program (ALP) 1V Midsun Attitude, Community Competence, Elements (of Academic Curriculum), Social Skills (ACCESS) 1V Mountain Park Mental Health 1V Nellie McClung Social Knowledge, Independent Living and Language (SKILL I/II) 1V New Brighton Teaching of Attitude, Social Skills and Communication (TASC) 1V Nickle Bridges 2V Nickle Learning & Literacy (L&L) 2V Prince of Wales Bridges 1V Samuel W. Shaw Paced Learning Program (PLP) 2V Somerset Teaching of Attitude, Social Skills and Communication (TASC) 1V Wilma Hansen Paced Learning Program (PLP) 1V Woodbine Early Development Centre 2V Woodman Communication, Sensory and Social Interaction (CSSI) 1
Total 293

2016-2017 School Enrolment Report Attachment IV
Enrolment in classes for students with Complex Learning Needs (excludes Unique Settings)
Pre-K 0 1 2 3 4 5 6 7 8 9 10 11 12 Total
ACCESS 15 13 15 10 13 15 81
Clarence Sansom School 4 3 3 10
H.D. Cartwright School 2 4 2 8
Henry Wise Wood High School 6 3 6 15
Langevin School 5 4 1 10
Lester B. Pearson High School 3 4 4 11
MidSun School 3 1 5 9
Mount Royal School 1 1 4 6
William Aberhart High School 1 6 5 12
ALP - Adapted Learning Program 12 12 11 12 22 12 81
Clarence Sansom School 4 3 5 12
Lester B. Pearson High School 6 3 9
Lord Beaverbrook High School 8 6 3 17
MidSun School 5 5 3 13
Robert Thirsk High School 3 6 1 10
Thomas B. Riley School 3 4 3 10
William Aberhart High School 1 4 5 10
ASD Cluster 1 9 5 4 4 1 5 6 2 0 5 4 46
Copperfield School 5 2 3 10
Dr. Martha Cohen School 3 1 5 1 10
Henry Wise Wood High School 5 4 9
Nose Creek School 5 2 7
Radisson Park School 1 2 1 1 1 6
Sunalta School 2 2 4
Bridges 3 6 22 18 16 17 11 25 9 9 6 1 143
Braeside School 2 2 2 6
Capitol Hill School 1 6 1 8
Cbe-Learn 9 6 1 16
Colonel Macleod School 3 7 2 12
Erin Woods School 1 4 5 3 13
Hawkwood School 3 2 3 8
Ian Bazalgette School 1 2 7 2 12
Nickle School 2 2 4 4 12
North Haven School 3 3 2 8
Prince Of Wales School 1 3 1 2 7
Richmond School 2 3 2 7
Rundle School 1 6 1 5 13
Sherwood School 2 4 1 7
Sunalta School 1 1 5 1 1 9
Terry Fox School 2 3 5

2016-2017 School Enrolment Report Attachment IV
Enrolment in classes for students with Complex Learning Needs (excludes Unique Settings)
Pre-K 0 1 2 3 4 5 6 7 8 9 10 11 12 Total
CSSI 23 15 20 11 16 3 9 6 4 2 1 3 113
Bishop Pinkham School 2 1 2 5
Brentwood School 1 1 1 4 7
Central Memorial High School 2 1 3 6
Chinook Park School 4 3 2 2 1 12
Douglasdale School 3 2 2 2 9
Keeler School 4 2 6
Kenneth D. Taylor 5 1 5 11
Marion Carson School 1 1 1 1 3 7
Mayland Heights School 1 4 5
Monterey Park School 6 3 1 1 11
Pineridge School 1 2 5 1 1 10
Sir John Franklin School 1 2 1 1 5
Ted Harrison School 1 2 1 4
University School 1 2 3 2 1 9
Woodman School 4 2 6
DHH- (Deaf and Hard of Hearing) 6 8 8 11 12 6 11 4 4 7 5 6 88
Queen Elizabeth School 2 2 2 1 7
Queen Elizabeth High School 11 3 3 7 5 6 35
Stanley Jones School 6 8 6 9 10 5 1 1 46
Early Development Centre 178 178
Coventry Hills School 20 20
Douglas Harkness School 17 17
Falconridge School 20 20
Haultain Memorial School 24 24
James Short Memorial School 21 21
North Haven School 24 24
Patrick Airlie School 15 15
Terrace Road School 24 24
Woodbine School 13 13
Elem MH Programs - Transitions 1 2 5 3 6 4 21
Andrew Sibbald School 1 2 3
Briar Hill School 1 6 4 11
Riverbend School 1 1 3 2 7
GATE 54 100 80 115 117 114 36 50 60 726
Henry Wise Wood High School 18 35 41 94
Hillhurst School 39 51 34 124
Louis Riel School 15 49 46 45 61 57 273
Queen Elizabeth High School 70 56 57 18 15 19 235
Hera 1 1 1 1 2 6
Alternative High School 1 1 1 1 2 6

2016-2017 School Enrolment Report Attachment IV
Enrolment in classes for students with Complex Learning Needs (excludes Unique Settings)
Pre-K 0 1 2 3 4 5 6 7 8 9 10 11 12 Total
High-School Integration Program (HIP) 2 1 6 9
Crescent Heights High School 2 1 6 9
L&L 1 24 39 60 92 86 81 383
Annie Gale School 6 9 6 21
Arbour Lake School 10 10 11 31
Banff Trail School 1 3 8 5 17
Captain John Palliser School 3 3 9 15
Crossing Park School 5 14 12 9 40
Earl Grey School 5 3 5 13
Ethel M. Johnson School 8 9 10 27
Georges P. Vanier School 9 10 7 26
H.D. Cartwright School 11 10 9 30
Harold Panabaker School 8 9 10 27
Huntington Hills School 5 6 7 18
McKenzie Highlands School 5 10 8 23
Nickle School 6 10 12 28
Sir John A. Macdonald School 12 8 9 29
Sir Wilfrid Laurier School 8 8
Vincent Massey School 10 11 9 30
LEAD 1 0 1 4 23 66 10 35 33 41 37 27 55 333
Cappy Smart School 3 3 13 19
Clarence Sansom School 14 2 8 24
Ernest Morrow School 3 8 8 6 25
Forest Lawn High School 14 11 19 44
Henry Wise Wood High School 6 6 20 32
James Fowler High School 17 10 16 43
Keeler School 9 14 23
Penbrooke Meadows School 1 1 1 11 17 31
Sir John Franklin School 22 7 7 7 11 54
Terry Fox School 2 10 11 23
Vincent Massey School 4 6 5 15
MH Programs - Transitions/AIM 17 15 28 5 5 4 79
Bob Edwards School 3 3 1 5 12
F.E. Osborne School 3 5 13 21
John Ware School 5 4 4 13
Mountain Park School 1 1 5 2 2 11
Queen Elizabeth High School 1 3 4 5 5 4 22

2016-2017 School Enrolment Report Attachment IV
Enrolment in classes for students with Complex Learning Needs (excludes Unique Settings)
Pre-K 0 1 2 3 4 5 6 7 8 9 10 11 12 Total
PLP 35 47 48 70 69 75 59 67 67 537
A. E. Cross School 8 7 8 23
Annie Gale School 1 4 9 14
Bowness High School 3 4 7 14
Cambrian Heights School 4 5 3 12
Centennial High School 3 6 9 18
Dr. Gladys McKelvie Egbert School 6 4 8 10 28
Dr. Gordon Higgins School 7 7 14 28
Ernest Manning High School 8 11 7 26
Ernest Morrow School 7 15 4 11 37
Ethel M. Johnson School 9 4 11 24
F.E. Osborne School 6 3 3 12
Forest Lawn High School 12 15 9 36
Henry Wise Wood High School 4 5 6 15
Jack James High School 10 10
James Fowler High School 11 11 13 35
Nelson Mandela High School 15 9 24
North Haven School 5 5 10
Nose Creek School 4 6 2 6 7 1 26
O.S. Geiger School 2 2 8 12
Ranchlands School 3 3 2 8
Robert Thirsk High School 3 6 6 15
Roland Michener School 3 9 12
Rosscarrock School 4 2 5 11
Samuel W. Shaw School 4 1 8 10 7 30
Sir John A. Macdonald School 5 5 2 12
Terrace Road School 1 7 3 11
Thomas B. Riley School 4 7 2 13
Wilma Hansen School 6 7 8 21
Returning Grade 12 Program 19 19
Lord Beaverbrook High School (Located at Dr. Norman Bethune) 11 11
Queen Elizabeth High School 8 8

2016-2017 School Enrolment Report Attachment IV
Enrolment in classes for students with Complex Learning Needs (excludes Unique Settings)
Pre-K 0 1 2 3 4 5 6 7 8 9 10 11 12 Total
SKILL 22 13 31 24 28 18 136
Auburn Bay School 1 2 1 3 7
Buchanan School 3 3 3 4 3 16
Buffalo Rubbing Stone School 4 3 7
Cappy Smart School 4 1 8 13
Cecil Swanson School 4 1 1 1 5 4 16
Douglasdale School 2 2 1 2 7
Ethel M. Johnson School 3 1 1 3 8 16
G.W. Skene School 6 1 7
Nellie McClung School 3 2 1 1 7
Simons Valley School 2 2 3 1 8
West Dalhousie School 1 3 2 1 1 8
West Dover School 1 2 5 8
Wildwood School 2 2 2 3 5 2 16
TASC 23 9 2 3 7 4 1 4 5 4 4 8 74
Buchanan School 4 1 1 6
Buffalo Rubbing Stone School 6 1 7
Capitol Hill School 3 1 3 7
Central Memorial High School 4 4 8 16
Hugh A. Bennett School 3 1 1 5
Jennie Elliott School 3 2 1 6
Mount Royal School 3 2 5
New Brighton School 5 5
Sir John A. Macdonald School 1 1 3 5
Somerset School 1 2 1 1 5
West Dover School 1 3 3 7
The Class 0 0 0 0 0 26 26 33 85
Centennial High School 2 5 7 14
Forest Lawn High School 11 5 6 22
Lord Beaverbrook High School 4 5 5 14
Sir Winston Churchill High School 6 7 5 18
Western Canada High School 3 4 10 17
Grand Total 178 1 79 63 98 210 341 251 393 391 390 210 233 295 3,138

Attachment V
i. New schools provincial capacity needs to be confirmed by Alberta Infrastructure
ii. Capacity of the school, including the number of modulars
iii. The provincial utilization rate of each school building includes lease exemptions as of September 1 of the current year (Assumes approval of exemptions by Alberta Infrastructure)
iv. 2016 provincial capacity is based on the new formula for calculating school capacity
v. Rated Room Capacity = # of regular classrooms x 25 student spaces + CTS classrooms x 20 student spaces
vi. Weighted Enrolment = (Total Kindergarten divided by 2) + (Grades 1-12 enrolment) + (Special Education at 3:1)
vii. Utilization Rate = Weighted Enrolment divided by Provincial Capacity
Rated Room
2016 Capacity
2015 2016 2016 2016 2016 RATED Difference
WEIGHTED WEIGHTED PROVINCIAL # Of PROVINCIAL # OF RATED RM ROOM Rated Rm vs.
SCHOOL ENROLMENT ENROLMENT CAPACITY Modulars % UTILIZ. CLASSRM CAPACITY % UTILIZ. Prov. Capacity
AREA I
ARBOUR LAKE 948 929 847 8 110% 37 915 102% 68
BELVEDERE PARKWAY 329 281 471 0 60% 28 700 40% 229
BOWCROFT 219 259 455 0 57% 21 525 49% 70
BOWNESS 808 821 1513 0 54% 57 1365 60% -148
BRENTWOOD 606 673 771 0 87% 30 750 90% -21
CAPTAIN JOHN PALLISER 636 618 622 0 99% 24 600 103% -22
CITADEL 432 438 456 8 96% 20 500 88% 44
DALHOUSIE 545 484 625 4 77% 25 625 77% 0
DR E W COFFIN 190 178 218 1 82% 8 200 89% -18
EDGEMONT 697 697 650 14 107% 28 700 100% 50
ERIC HARVIE - 320 600 - 53% 24 600 53% -
F E OSBORNE 432 513 792 0 65% 30 735 70% -57
H D CARTWRIGHT 435 424 571 2 74% 23 565 75% -6
HAMPTONS (THE) 207 194 240 4 81% 11 275 70% 35
HAWKWOOD 612 612 641 0 95% 27 675 91% 34
MARION CARSON 477 513 593 3 87% 24 600 86% 7
RANCHLANDS 404 444 499 8 89% 20 500 89% 1
ROBERT THIRSK 1,500 1,378 1527 0 90% 53 1305 106% -222
ROYAL OAK 512 457 537 10 85% 22 550 83% 13
SCENIC ACRES 130 136 183 8 74% 8 200 68% 17
SILVER SPRINGS 215 221 277 1 80% 12 300 74% 23
SIMON FRASER 735 399 794 6 50% 28 690 58% -104
SIR WINSTON CHURCHILL 2,214 2,311 2007 6 115% 79 1905 121% -102
TERRACE ROAD 150 166 286 0 58% 14 350 47% 64
THOMAS B RILEY 633 560 628 0 89% 22 540 104% -88
TOM BAINES 708 691 814 1 85% 30 740 93% -74
TUSCANY 601 466 647 14 72% 28 700 67% 53
TWELVE MILE COULEE 981 839 895 16 94% 36 885 95% -10
UNIVERSITY 371 402 537 0 75% 20 500 80% -37
VARSITY ACRES 536 521 628 3 83% 25 625 83% -3
W O MITCHELL 360 425 452 8 94% 19 475 89% 23
WEST DALHOUSIE 353 353 328 6 108% 15 375 94% 47
WILLIAM D PRATT - 622 900 8 69% 38 900 69% -
AREA I - TOTAL 17,971 18,341 22,004 139 83% 886 21,870 84% -134
AREA II
ALEX MUNRO 389 269 451 0 60% 20 500 54% 49
BALMORAL 617 615 547 0 112% 23 575 107% 28
BANFF TRAIL 407 403 456 0 88% 18 450 89% -6
BEDDINGTON HEIGHTS 424 435 507 8 86% 19 475 91% -32
BELFAST 255 245 285 1 86% 11 275 89% -10
BRANTON 731 744 831 6 90% 34 835 89% 4
BRIAR HILL 238 261 278 0 94% 14 350 74% 72
BUCHANAN 183 226 243 0 93% 10 250 90% 7
BUFFALO RUBBING STONE - 433 600 6 72% 24 600 72% -
CAMBRIAN HEIGHTS 393 256 429 0 60% 16 400 64% -29
CAPITOL HILL 329 353 362 0 97% 15 375 94% 13
CAPTAIN NICHOLA GODDARD 977 856 895 16 96% 36 885 97% -10
CATHERINE N GUNN 384 381 458 0 83% 20 500 76% 42
COLLINGWOOD 469 479 562 0 85% 22 550 87% -12
COLONEL IRVINE 689 761 757 0 101% 32 780 98% 23
2016 - 2017 SCHOOL ENROLMENT REPORT - School Capacity and Utilization
Attachment V
i. New schools provincial capacity needs to be confirmed by Alberta Infrastructure
ii. Capacity of the school, including the number of modulars
iii. The provincial utilization rate of each school building includes lease exemptions as of September 1 of the current year (Assumes approval of exemptions by Alberta Infrastructure)
iv. 2016 provincial capacity is based on the new formula for calculating school capacity
v. Rated Room Capacity = # of regular classrooms x 25 student spaces + CTS classrooms x 20 student spaces
vi. Weighted Enrolment = (Total Kindergarten divided by 2) + (Grades 1-12 enrolment) + (Special Education at 3:1)
vii. Utilization Rate = Weighted Enrolment divided by Provincial Capacity
Rated Room
2016 Capacity
2015 2016 2016 2016 2016 RATED Difference
WEIGHTED WEIGHTED PROVINCIAL # Of PROVINCIAL # OF RATED RM ROOM Rated Rm vs.
SCHOOL ENROLMENT ENROLMENT CAPACITY Modulars % UTILIZ. CLASSRM CAPACITY % UTILIZ. Prov. Capacity
2016 - 2017 SCHOOL ENROLMENT REPORT - School Capacity and Utilization
COLONEL MACLEOD 671 181 732 4 25% 28 690 26% -42
COLONEL SANDERS (TLC) 359 399 363 0 110% 15 375 106% 12
COVENTRY HILLS 577 553 621 13 89% 27 675 82% 54
CRESCENT HEIGHTS 2,085 1,752 2345 0 75% 85 2025 87% -320
DR J K MULLOY 417 436 496 0 88% 20 500 87% 4
GEORGES P VANIER 527 540 653 0 83% 24 590 92% -63
HIDDEN VALLEY 440 426 523 10 81% 22 550 77% 27
HIGHWOOD 362 339 364 0 93% 16 400 85% 36
HILLHURST 311 298 336 0 89% 12 300 99% -36
HUNTINGTON HILLS 231 241 365 0 66% 15 375 64% 10
JAMES FOWLER 1,650 1,056 1953 0 54% 77 1835 58% -118
JOHN G DIEFENBAKER 1,513 1,515 1480 4 102% 54 1330 114% -150
KENNETH D TAYLOR - 329 600 12 55% 24 600 55% -
KING GEORGE 476 518 647 0 80% 26 650 80% 3
LANGEVIN 661 655 648 0 101% 26 640 102% -8
LOUISE DEAN 217 201 184 0 109% 11 265 76% 81
MAYLAND HEIGHTS 441 457 552 0 83% 21 525 87% -27
MOUNT VIEW 160 183 188 0 97% 8 200 91% 12
NORTH HAVEN 421 355 452 0 79% 19 475 75% 23
NOSE CREEK 868 961 895 16 107% 36 885 109% -10
PANORAMA HILLS 590 544 572 10 95% 24 600 91% 28
QUEEN ELIZABETH 324 336 403 2 83% 15 375 90% -28
QUEEN ELIZABETH JR/SR 1,015 1,142 1375 0 83% 55 1345 85% -30
ROSEDALE 268 260 259 2 100% 11 275 95% 16
ROSEMONT 199 219 242 0 90% 10 250 88% 8
SENATOR PATRICK BURNS 566 627 862 0 73% 34 830 76% -32
SIMONS VALLEY 702 704 694 12 101% 28 700 101% 6
SIR JOHN A MACDONALD 706 643 921 4 70% 36 880 73% -41
SIR JOHN FRANKLIN 556 535 570 0 94% 25 615 87% 45
STANLEY JONES (incl. Alice Jamieson Girls') 584 585 581 0 101% 24 600 98% 19
SUNNYSIDE 145 146 165 0 88% 7 175 83% 10
THORNCLIFFE 235 196 231 0 85% 10 250 78% 19
VALLEY CREEK 766 756 856 12 88% 34 840 90% -16
VISTA HEIGHTS 164 169 224 0 75% 10 250 68% 26
WILLIAM ABERHART 1,605 1,563 1753 4 89% 63 1545 101% -208
AREA II - TOTAL 27,290 26,531 31,766 142 84% 1,266 31,215 85% -551
AREA III
ABBEYDALE 312 321 403 6 80% 18 450 71% 47
ANNIE FOOTE 436 541 510 9 106% 21 525 103% 15
ANNIE GALE 561 634 617 8 103% 26 640 99% 23
BOB EDWARDS 436 386 598 0 65% 26 640 60% 42
CAPPY SMART 221 229 380 4 60% 16 400 57% 20
CECIL SWANSON 428 474 443 6 107% 18 450 105% 7
CHIEF JUSTICE MILVAIN 512 496 535 10 93% 22 550 90% 15
CHRIS AKKERMAN 579 576 527 6 109% 23 575 100% 48
CLARENCE SANSOM 496 516 768 8 67% 28 690 75% -78
COLONEL J F SCOTT 498 499 474 8 105% 20 500 100% 26
CROSSING PARK 1,104 1,129 990 15 114% 43 1065 106% 75
DOUGLAS HARKNESS 282 274 335 2 82% 14 350 78% 15
DR GLADYS M EGBERT 417 462 538 4 86% 22 530 87% -8
DR GORDON HIGGINS 506 533 686 8 78% 24 590 90% -96

Attachment V
i. New schools provincial capacity needs to be confirmed by Alberta Infrastructure
ii. Capacity of the school, including the number of modulars
iii. The provincial utilization rate of each school building includes lease exemptions as of September 1 of the current year (Assumes approval of exemptions by Alberta Infrastructure)
iv. 2016 provincial capacity is based on the new formula for calculating school capacity
v. Rated Room Capacity = # of regular classrooms x 25 student spaces + CTS classrooms x 20 student spaces
vi. Weighted Enrolment = (Total Kindergarten divided by 2) + (Grades 1-12 enrolment) + (Special Education at 3:1)
vii. Utilization Rate = Weighted Enrolment divided by Provincial Capacity
Rated Room
2016 Capacity
2015 2016 2016 2016 2016 RATED Difference
WEIGHTED WEIGHTED PROVINCIAL # Of PROVINCIAL # OF RATED RM ROOM Rated Rm vs.
SCHOOL ENROLMENT ENROLMENT CAPACITY Modulars % UTILIZ. CLASSRM CAPACITY % UTILIZ. Prov. Capacity
2016 - 2017 SCHOOL ENROLMENT REPORT - School Capacity and Utilization
ERIN WOODS 384 413 482 8 86% 20 500 83% 18
ERNEST MORROW 847 800 870 0 92% 35 860 93% -10
FALCONRIDGE 527 491 576 12 85% 24 600 82% 24
FOREST LAWN 1,535 1,509 2133 0 71% 87 2095 72% -38
G W SKENE 223 220 328 2 67% 14 350 63% 22
GRANT MACEWAN 603 597 578 12 103% 24 600 100% 22
GUY WEADICK 424 462 430 6 107% 18 450 103% 20
HUGH A BENNETT - 380 600 - 63% 24 600 63% -
IAN BAZALGETTE 553 539 652 0 83% 26 635 85% -17
JACK JAMES 741 676 863 0 78% 37 835 81% -28
JAMES SHORT MEMORIAL 299 295 471 1 63% 21 525 56% 54
KEELER 323 337 609 0 55% 24 600 56% -9
LESTER B PEARSON 1,740 1,712 1732 0 99% 63 1540 111% -192
MARLBOROUGH 200 216 297 2 73% 20 300 72% 3
MONTEREY PARK 574 549 644 17 85% 27 675 81% 31
NELSON MANDELA - 1,240 1899 0 65% 72 1800 69% -99
O S GEIGER 420 437 511 9 85% 21 525 83% 14
PATRICK AIRLIE 188 238 252 0 94% 11 275 87% 23
PENBROOKE MEADOWS 227 232 378 0 61% 16 400 58% 22
PETER LOUGHEED - 490 900 8 54% 38 900 54% -
PINERIDGE 300 306 457 6 67% 18 450 68% -7
RADISSON PARK 339 301 388 2 78% 16 400 75% 12
ROLAND MICHENER 232 226 263 0 86% 11 275 82% 12
RUNDLE 582 534 536 10 100% 21 525 102% -11
SADDLE RIDGE 674 537 585 12 92% 24 600 90% 15
SIR WILFRID LAURIER 454 438 522 0 84% 21 515 85% -7
TARADALE 623 628 627 10 100% 26 650 97% 23
TED HARRISON 776 794 895 16 89% 36 885 90% -10
TERRY FOX 591 517 762 0 68% 29 725 71% -37
VALLEY VIEW 283 278 588 0 47% 25 625 44% 37
WEST DOVER 289 314 448 0 70% 20 500 63% 52
AREA III - TOTAL 21,732 23,771 29,080 227 82% 1,190 29,170 81% 90
AREA IV
A E CROSS 563 579 878 0 66% 38 930 62% 52
ALEXANDER FERGUSON 252 266 255 0 104% 10 250 106% -5
ALL BOYS @ Sir James Lougheed 200 230 232 0 99% 9 225 102% -7
ALTADORE 384 415 370 0 112% 14 350 119% -20
ALTERNATIVE HIGH 239 283 270 0 105% 13 325 87% 55
BANTING AND BEST 218 217 248 2 88% 11 275 79% 27
BATTALION PARK 678 679 678 13 100% 29 725 94% 47
BISHOP PINKHAM 652 631 713 0 88% 30 740 85% 27
CENTRAL MEMORIAL 1,292 1,224 2012 0 61% 75 1820 67% -192
COLONEL WALKER (incl Piitoaysis) 269 319 603 1 53% 23 575 55% -28
CONNAUGHT 334 334 399 0 84% 16 400 84% 1
DR ROBERTA BONDAR - 254 600 - 42% 24 600 42% -
EARL GREY 213 212 330 0 64% 14 350 60% 20
ELBOW PARK 155 183 289 10 63% 10 250 73% -39
ELBOYA 613 648 639 0 101% 30 740 88% 101
ERNEST MANNING 1,793 1,845 1652 0 112% 72 1780 104% 128
GLAMORGAN 632 668 697 2 96% 29 725 92% 28
GLENBROOK 311 314 395 0 79% 16 400 78% 5
Attachment V
i. New schools provincial capacity needs to be confirmed by Alberta Infrastructure
ii. Capacity of the school, including the number of modulars
iii. The provincial utilization rate of each school building includes lease exemptions as of September 1 of the current year (Assumes approval of exemptions by Alberta Infrastructure)
iv. 2016 provincial capacity is based on the new formula for calculating school capacity
v. Rated Room Capacity = # of regular classrooms x 25 student spaces + CTS classrooms x 20 student spaces
vi. Weighted Enrolment = (Total Kindergarten divided by 2) + (Grades 1-12 enrolment) + (Special Education at 3:1)
vii. Utilization Rate = Weighted Enrolment divided by Provincial Capacity
Rated Room
2016 Capacity
2015 2016 2016 2016 2016 RATED Difference
WEIGHTED WEIGHTED PROVINCIAL # Of PROVINCIAL # OF RATED RM ROOM Rated Rm vs.
SCHOOL ENROLMENT ENROLMENT CAPACITY Modulars % UTILIZ. CLASSRM CAPACITY % UTILIZ. Prov. Capacity
2016 - 2017 SCHOOL ENROLMENT REPORT - School Capacity and Utilization
GLENDALE 231 239 304 0 79% 13 325 74% 21
JENNIE ELLIOTT 588 593 701 0 85% 27 675 88% -26
KILLARNEY 332 350 373 0 94% 15 375 93% 2
MOUNT ROYAL 254 286 435 0 66% 16 390 73% -45
OLYMPIC HEIGHTS 716 629 671 14 94% 28 700 90% 29
RAMSAY 98 110 160 0 68% 13 150 73% -10
RICHMOND 199 208 257 0 81% 14 350 59% 93
RIDEAU PARK 414 409 473 0 86% 20 490 83% 17
RIVERBEND 408 431 486 6 89% 21 525 82% 39
ROSSCARROCK 291 335 416 0 81% 18 450 74% 34
SHERWOOD 487 499 722 0 69% 32 780 64% 58
SUNALTA 326 320 390 0 82% 17 425 75% 35
VINCENT MASSEY 823 733 937 0 78% 35 855 86% -82
WEST RIDGE - 332 900 - 37% 36 900 37% -
WEST SPRINGS 567 480 584 12 82% 24 600 80% 16
WESTERN CANADA 2,123 2,159 2128 0 101% 87 2080 104% -48
WESTGATE 704 673 727 0 93% 29 725 93% -2
WILDWOOD 569 466 557 0 84% 22 550 85% -7
WILLIAM REID 268 277 273 4 101% 12 300 92% 27
AREA IV - TOTAL 18,189 18,824 22,754 64 83% 942 23,105 81% 351
AREA V
ACADIA 504 220 546 0 40% 21 525 42% -21
ANDREW SIBBALD 491 145 445 0 32% 20 500 29% 55
AUBURN BAY - 491 600 6 82% 24 600 82% -
BRAESIDE 245 254 548 0 46% 22 550 46% 2
BRIDLEWOOD 593 586 591 12 99% 24 600 98% 9
CANYON MEADOWS 414 375 546 0 69% 21 525 71% -21
CEDARBRAE 262 257 272 0 94% 12 300 86% 28
CENTENNIAL 1,960 1,962 1526 0 129% 68 1660 118% 134
CHAPARRAL 566 512 473 8 108% 20 500 102% 27
CHINOOK PARK 533 530 731 0 72% 29 725 73% -6
COPPERFIELD - 399 600 12 67% 24 600 67% -
CRANSTON 658 529 587 12 90% 24 600 88% 13
DAVID THOMPSON 705 354 680 0 52% 28 680 52% 0
DEER RUN 353 361 434 6 83% 18 450 80% 16
DOUGLASDALE 406 417 481 11 87% 21 525 79% 44
DR E P SCARLETT 1,740 1,768 1669 0 106% 65 1560 113% -109
DR GEORGE STANLEY - 521 900 - 58% 36 900 58% -
DR MARTHA COHEN - 432 900 - 48% 36 900 48% -
ETHEL M JOHNSON 523 515 527 0 98% 20 500 103% -27
EUGENE COSTE 155 239 525 0 45% 24 600 40% 75
EVERGREEN 570 596 584 12 102% 24 600 99% 16
FAIRVIEW 911 948 964 0 98% 41 940 101% -24
FISH CREEK 641 714 626 0 114% 27 650 110% 24
HAROLD PANABAKER 470 502 592 4 85% 25 615 82% 23
HAULTAIN MEMORIAL 243 232 293 0 79% 12 300 77% 7
HAYSBORO 185 182 299 0 61% 12 300 61% 1
HENRY WISE WOOD 1,432 1,387 2144 0 65% 75 1845 75% -299
JANET JOHNSTONE 513 505 508 8 99% 21 500 101% -8
JOHN WARE 458 418 603 1 69% 23 565 74% -38
JUNO BEACH @ Dr. Norman Bethune 64 17 418 0 4% 17 425 4% 7

Attachment V
i. New schools provincial capacity needs to be confirmed by Alberta Infrastructure
ii. Capacity of the school, including the number of modulars
iii. The provincial utilization rate of each school building includes lease exemptions as of September 1 of the current year (Assumes approval of exemptions by Alberta Infrastructure)
iv. 2016 provincial capacity is based on the new formula for calculating school capacity
v. Rated Room Capacity = # of regular classrooms x 25 student spaces + CTS classrooms x 20 student spaces
vi. Weighted Enrolment = (Total Kindergarten divided by 2) + (Grades 1-12 enrolment) + (Special Education at 3:1)
vii. Utilization Rate = Weighted Enrolment divided by Provincial Capacity
Rated Room
2016 Capacity
2015 2016 2016 2016 2016 RATED Difference
WEIGHTED WEIGHTED PROVINCIAL # Of PROVINCIAL # OF RATED RM ROOM Rated Rm vs.
SCHOOL ENROLMENT ENROLMENT CAPACITY Modulars % UTILIZ. CLASSRM CAPACITY % UTILIZ. Prov. Capacity
2016 - 2017 SCHOOL ENROLMENT REPORT - School Capacity and Utilization
LAKE BONAVISTA 330 338 395 2 85% 16 400 84% 5
LE ROI DANIELS 495 486 563 2 86% 23 575 84% 12
LORD BEAVERBROOK 2,064 2,032 2630 0 77% 98 2345 87% -285
LOUIS RIEL 890 910 867 4 105% 37 915 99% 48
MAPLE RIDGE 437 151 423 0 36% 18 450 34% 27
MCKENZIE HIGHLANDS - 289 900 - 32% 36 900 32% -
MCKENZIE LAKE 493 464 617 2 75% 25 625 74% 8
MCKENZIE TOWNE 623 628 644 8 98% 27 675 93% 31
MIDNAPORE 437 481 543 12 88% 23 575 84% 32
MIDSUN 895 902 951 2 95% 35 865 104% -86
MOUNTAIN PARK 881 880 813 16 108% 36 890 99% 77
NELLIE McCLUNG 377 424 516 0 82% 20 500 85% -16
NEW BRIGHTON - 438 600 12 73% 24 600 73% -
NICKLE 744 669 720 3 93% 31 755 89% 35
PRINCE OF WALES 400 361 372 4 97% 17 425 85% 53
R T ALDERMAN 655 244 826 1 30% 33 815 30% -11
ROBERT WARREN 321 353 555 4 64% 25 615 57% 60
SAM LIVINGSTON 454 446 558 7 80% 24 600 74% 42
SAMUEL W. SHAW 870 889 914 16 97% 39 965 92% 51
SOMERSET 317 295 355 4 83% 15 375 79% 20
SUNDANCE 465 466 500 8 93% 21 500 93% 0
WILLOW PARK 702 694 723 0 96% 30 745 93% 22
WILMA HANSEN 335 344 674 8 51% 26 640 54% -34
WOODBINE 391 368 432 7 85% 19 475 77% 43
WOODLANDS 283 291 402 4 72% 16 400 73% -2
WOODMAN 659 719 839 0 86% 35 855 84% 16
AREA V - TOTAL 30,106 30,920 38,944 218 79% 1,583 39,020 79% 76
GRAND TOTALS 115,287 118,386 144,548 790 82% 5,867 144,380 82% -168

Prepared by: Planning and Transportation November 2016 Subject to Review and Update
Attachment VI

2016 - 2017 Leased Space in Operating Schools | Listed by CBE Area
(includes both full-time and part-time leases)
ATTACHMENT VII
Area School Name Lessee NameLease Area
(Square Metres)
I Belvedere Parkway School Kids Love Bowness Ltd. 181
I Belvedere Parkway School Connect Society 350.6
I Bowcroft School Families Matter Society of Calgary 176.9
I Bowcroft School RIEL Institute for Education & Learning 87.3
I Captain John Palliser School Pre-K Ed Services O/a Captain John Palliser Out-of-School Care 346
I Dr. E.W. Coffin School Millennium Kidz N Kare Ltd. 224.4
I F.E. Osborne School Calgary Board of Education Retired Employees Association 79.7
I Hawkwood School Ranchlands Children Come First Association 387.2
I Marion Carson School Pre-Kindergarten Educational Services 85.5
I Marion Carson School Seeds of S.P.I.C.E Early Learning Centre Inc. *NEW* 358.4
I Terrace Road School 1439723 Alberta Ltd O/a Summit Kids 74.9
I Terrace Road School University Heights Nursery School Association 74.4
I University School 1439723 Alberta Ltd O/a Summit Kids 546.3
I University School Alberta Science Network 60
I W.O. Mitchell School 1439723 Alberta Ltd O/a Summit Kids 374
I West Dalhousie School Dalhousie Community Association 348.5
II Banff Trail School Ranchlands Children Come First Association 332.8
II Beddington Heights School 1677939 Alberta Inc. O/a Adventures Child Care *NEW* 396.8
II Belfast School Student Care Inc. O/a Belfast Student Care 269.8
II Briar Hill School Hounsfield Heights-Briar Hill Community Playschool 83.7
II Briar Hill School Society of Briar Hill Children's Programs 363.1
II Buchanan School Ranchlands Children Come First Association 57.8
II Buffalo Rubbing Stone School Thornhill Child Care Society *NEW* 458.3
II Cambrian Heights School Ranchlands Children Come First Association 270.9
II Cambrian Heights School Renfrew Educational Services 85.4
II Cambrian Heights School Alberta Health Services 326.6
II Capitol Hill School Adventurers School Age Care Ltd. 364.2
II Colonel Sanders School Student Care Inc. O/a Northmount Student Care 253.9
II Coventry Hills School Topp Kids Child Care Centre 226.5
II Dr. J.K. Mulloy School Society of Briar Hill Children's Programs *NEW* 358.6
II Highwood School Ranchlands Children Come First Association 357.2
II Huntington Hills School 1439723 Alberta Ltd O/a Summit Kids 224.1
II Kenneth D. Taylor School Ranchlands Children Come First Association *NEW* 455.8
II King George School Pleasant Heights After School Care Association 333.1
II Louise Dean (Kensington) School Catholic Family Service of Calgary 580.2
II Mayland Heights School Society of Briar Hill Children's Programs 112.5
II Mount View School Churchill Park Family Care Society 145
II North Haven School 1439723 Alberta Ltd O/a Summit Kids 403.2
II Panorama Hills School Pleasant Heights After School Care Association 387.6
II Queen Elizabeth School Adventurers School Age Care Ltd. 264.7
II Queen Elizabeth High School Adventurers School Age Care Ltd. 46.7
II Rosemont School Rosemont Community Childcare 125.1
II Stanley Jones School 1677939 Alberta Inc. O/a Adventures Child Care *NEW* 374.3
II Sunnyside School Pre-Kindergarten Educational Services 104.2
II Sunnyside School Pre-K Educational Services O/a Sunnyside Out-of-School Care 109.6
III Abbeydale School RIEL Institute for Education & Learning 107.1
III Colonel J. Fred Scott School Immigrant Services Calgary 75.6
III Marlborough School 1677939 Alberta Inc. O/a Adventures Child Care 357.3
III O.S. Geiger School Immigrant Services Calgary 75.9
III Rundle School 1677939 Alberta Inc. O/a Adventures Child Care *NEW* 206.7
III Taradale School Student Care Inc. o/a Taradale Student Care 201
III Valley View School Metis Calgary Family Services 82.3
IV Alexander Ferguson School Alexander Ferguson Elementary School Society 255
IV All Boys School (Sir James Lougheed) SchoolCalgary Child's Play Inc. 263
IV Altadore School Peter Pan Daycare Inc. 262.6
IV Battalion Park School Kidzinc School Care Society of Alberta 201
IV Colonel Walker School Pre-Kindergarten Educational Services 77
IV Connaught School Churchill Park Family Care Society 222.1
IV Dr. Carl Safran Centre School EducationMatters 75
IV Earl Grey School Thumbelina Nursery School Society 88.5
IV Earl Grey School Earl Grey Out of School Care 77.1
IV Glamorgan School Maple Roots Inc. 361.4
IV Glenbrook School Glenbrook Community Preschool 72.7
IV Glenbrook School Calgary Child's Play Inc. 68.3
IV Glendale School Calgary Child's Play Inc. o/a Quality Care 140.7
IV Jennie Elliott School Student Care Inc. O/a Jennie Elliott Student Care 411.3
IV Killarney School Kidzinc School Care Society of Alberta 255.3
IV Ramsay School Calgary Catholic Immigration Society 68.1
Prepared By: Real Estat and Leasing

2016 - 2017 Leased Space in Operating Schools | Listed by CBE Area
(includes both full-time and part-time leases)
ATTACHMENT VII
Area School Name Lessee NameLease Area
(Square Metres)
IV Ramsay School Janus Academy Society 483.8
IV Richmond School Richmond Child Care Association 324.2
IV Rideau Park School 1439723 Alberta Ltd O/a Summit Kids 153.9
IV Rosscarrock School Calgary Child's Play Inc. 263.9
IV Sunalta School Student Care Inc. O/a Sunalta Student Care 181.8
IV Sunalta School Scarboro Community Association Preschool 91.6
IV Viscount Bennett School Alberta Computers for Schools 204.1
IV Wildwood School Kidzinc School Care Society of Alberta 275.3
IV William Reid School Seeds of S.P.I.C.E Early Learning Centre Inc. 254.8
V Acadia School 1677939 Alberta Inc. O/a Adventures Child Care 182.8
V Andrew Sibbald School 1133491 Alberta Ltd. o/a The Adventures 357.1
V Auburn Bay School Seeds of S.P.I.C.E Early Learning Centre Inc. *NEW* 457.8
V Braeside School Pre-Kindergarten Educational Services 79.3
V Chaparral School Juvenescence Child Development Centre Ltd. 436.6
V Chinook Park School Adventurers School Age Care Ltd. 352.5
V Copperfield School Topp Kids Child Care Centre *NEW* 458.2
V Cranston School Juvenescence Child Development Centre Ltd. *NEW* 440
V Douglasdale School A Step Ahead - Child Development Services 71.8
V Ethel M. Johnson School 1677939 Alberta Inc. O/a Adventures Child Care 358.4
V Eugene Coste School Calgary Child's Play Inc. 274.2
V Evergreen School Topp Kids Child Care Centre 220.8
V Haysboro School Maple Roots Inc. 59.8
V Janet Johnstone School Creations Child Care 243.8
V Kingsland School G.R.I.T. Calgary Society 95.3
V Kingsland School Boys and Girls Clubs of Calgary 83.9
V Lake Bonavista School 1133491 Alberta Ltd. o/a The Adventures 226.2
V Maple Ridge School Topp Kids Child Care Centre 232.6
V McKenzie Towne School 1133491 Alberta Ltd. o/a The Adventures 226.9
V Midnapore School Mid-Sun Community Association o/a Mid-Sun Child Care 157.8
V Nellie McClung School 1439723 Alberta Ltd O/a Summit Kids 324.3
V New Brighton School 1st Class - After Class *NEW* 458.2
V Prince Of Wales School Topp Kids Child Care Centre 230.6
V Sam Livingston School 1133491 Alberta Ltd. o/a The Adventures 369.3
V Sundance School Children Can Succeed Inc. 226.8
Area I: 3,755
Area II: 7,872
Area III: 1,106
Area IV: 5,133
Area V: 6,625
Total Square Metres Leased: 24,490
Prepared By: Real Estat and Leasing

2016 - 2017 Lease of Surplus School Facilities | Listed by CBE Area
ATTACHMENT VIII
Area School Name Lessee NameLease Area
(Square Metres)I Belvedere Parkway Bungalow Thornhill Child Care Society 373
I Montgomery School Foundations for the Future Charter Academy 6,442
I Parkdale School Westmount Charter School 4,395
I Sir William Van Horne High School Westmount Charter School 9,670
II Greenview School Foundations for the Future Charter Academy 4,669
III Mountain View School Almadina School Society 3,846
IV Bel-Aire School Calgary Girls' School Society 1,252
IV Clem Gardner School Connect Charter School Society 7,107
IV Glenmeadows School Calgary Arts Academy Society 2,875
IV Knob Hill Calgary Arts Academy Society 2,271
IV Lakeview School Calgary Girls' School Society 3,594
IV Ogden School Almadina School Society 4,888
IV Spruce Cliff School Calgary Quest Children's Society 2,388
V Alice M. Curtis School Foundations for the Future Charter Academy 3,442
V Andrew Davison School Foundations for the Future Charter Academy 4,309
V Southwood School Foundations for the Future Charter Academy 4,192
Area I: 20,880
Area II: 4,669
Area III: 3,846
Area IV: 24,374
Area V: 11,943
Total Square Metres Leased: 65,712
Prepared By: Real Estate and Leasing

!(
!(!(
")
") ")
")
")")
")
_̂
_̂ _̂
_̂_̂
_̂_̂
_̂
_̂_̂
_̂ _̂
_̂
I
IV
IIIII
V
EFV
SAD
RSN
COP
FPK
NPK
02C
10C
CNSSGL
ST2
STD
SOV
SKR
LMR
MOP
CLI
RIV
CHN
TEM
BRA
MON
HAR
OGDKEL
PEN
CRM01I
SHS
MPK
RUN
ERI
PIN
HIW
EVE
HIL
GDL
WBN
DNW
MCT
HID
TAR
VAL
ASP
ROX
BRE
13I
SDC
YKV
SOM
FAL
MDH
PKH
NHV
SSD
CAP
NHU
ING
EAG
DNE
LPK
STR
CHR
TUX
EPK
HORNAW
GPI
SRI
HIF
FVI OSH
ESH
WES
MCI
PEG
SUN
FRA
CIA
GTI
WIN
SET
CHK
MEA
FLN
WIL
PKD
RMT
MPL
AUB
CPF
LEG
ABB
ABP
S23SFH
SAW
ST3
FLI
AYB
EFIVAF
SKE
BUR
GBP
DBC
SKW
BLM
SHN
MAH
SPR
PKL
CAS
KIN
DAL
PAL
ALB
NGM
QPKCHW
CED
PUM
CGR
CHA
POI
RAM
MRLWSP
MAN
14V
SVO
BRI
NEB
MAL
WAL
SNABRD
LKV
VIS
GLAEYA
WND
WHI
MAC
SIL
SCE
BOW
01B
DRG
HOU
BNF
STA
UND
RYV
TUS
MNI
FHI
SHI
ST1
MOR
DIS
MERMLI
DRN
BYV
WLD
MLR
REN
ACA
COU CSC
03I
03S
10A
RICKIL
RUT
ERL
MRT
NOL
COA
DIA
THO
ROC
FHT
HAY
DOV
13H
13E
02B
13F
02A
SHG
ALTGAWCUR
03V
02F
03H
02E
12J
SSWSCA
SOC
BNK
10B
GAG
12B
13G
13B
COL
QLD
WOO
OAK
MAF
SOW
RDL
KCA
APP
12H
09K
13C
02K
12A
14U
09N
12F
01D
12C
05C
09H
WGT
EVN
PAN
03D
GPK
09D
GRV
GRI
ST4
ARB
RAN
CIT
HAW
06A
03W
COV
CAR
LIV
ROY
01G
13A 13D
12I
01F
05B
HPK
BLN
HUN
DNC
MID
CHV
CRE
LKB DDG
VAR
SAN
SGH
UMR
EDG
RED
BED
UNI
PAT
RIDSIG
CAM
BRT
WHL
RCK
CAN
FAI
BEL
HAM
02L
SPH
01H
01C
SHW
COR
CRA
EAU
MCK
MIS
GBK
GRE
UOC
0 4.5 92.25Kilometres
1:173,692
Student Population Change (by Community)Sep 30, 2015 to Sep 30, 2016 .
Prepared by: Planning & Transportation NAD 1983 3TM 114
Date: November 18, 2016Map: 15-16 Student Population Change.mxd
Student Population ChangeSep 30, 2015 - Sep 30, 2016
> 200 Students100 to 199 Students21 to 99 Students20 to -19 Students-20 to -85 StudentsNo Data
Recently Completed and Future Schools_̂ Schools Opening in the 16/17 School Year
") Approved Schools Opening in the 17/18 or 18/19 School Year
!( Unique Settings & Replacement Schools Opening in the 16/17 School Year
Attachment IX
Attachment X
1 attachment x ‐complex learning definitions rev nov 2016
Complex Learning Definitions
ACCESS - Attitude, Community Competence, Elements of Academic Curriculum, Social
Skills Grades 7-12 Attitude, Community Competence, Elements (of Academic Curriculum), Social Skills
(ACCESS) classes offer intensive supports and services to students in grades 7-12 who are diagnosed with moderate cognitive (intellectual) or developmental disabilities. The goal of the ACCESS program is to prepare students for transition to adult life in the community. ACCESS teachers recognize students’ unique sensory and learning needs. They work with their students on functional academic and living skills. These include communication, community awareness and appropriate social interaction, pre-vocational (work) skills, and assisting students to be as independent as possible in their home, school, and community environment. A modified curriculum is implemented based on the individual needs of each student. Instruction may be individual or in small groups and includes the use of assistive technology and augmentative communication systems. Inclusion within community school classes and activities occurs as appropriate. Class size may range from 9-11 students in each class along with program staff.
ALP - Adapted Learning Program Grades 7 – 12
The Adapted Learning Program (ALP) is for students in grades 7-12 who have moderate cognitive (intellectual) disabilities. The goal is to enable each student to function as independently as possible in home, school, and community settings. ALP teachers work with their students to develop communication, social, functional living, literacy, and numeracy skills. Pre-vocational and vocational opportunities (work experience) are also supported. A modified curriculum is implemented based on the individual needs of each student. Instruction includes individual and small group activities and the use of assistive technologies. ALP provides opportunities to be included in the community school through complementary courses (options), clubs, sports, and special events. Class size may range from 11 - 13 students in each class along with program staff. Vecova is a society providing services to individuals with disabilities. They are contracted to support students in ALP classes at the high school level with Supported Work Study as part of the vocational programming.
AIM –Covered under The Class
ASD Cluster – Autism Spectrum Disorder Cluster Program Programming for students with Autism Spectrum Disorder
The ASD Cluster offers inclusive learning environments for students with a diagnosis of high functioning Autism Spectrum Disorder (ASD). Students are fully integrated into typical classrooms with same age peers. The purpose of the ASD Cluster is to address academic, social, communication, behavior, emotional regulation, organizational, and self-management learning needs. The goal is to teach students the skills they need to be able to function as independently as possible and to enable them to succeed within their community school. The ASD Cluster has a Program Teacher that teams with students’ classroom teachers. Together they plan and implement curriculum modifications and instructional accommodations, individualized and personalized for each student. The Program Teacher may work directly with small groups or individual students to address specific learning needs.

Attachment X
2 attachment x ‐complex learning definitions rev nov 2016
Bridges – Elementary and Junior High Students
Bridges offers a specialized setting for students from elementary to high school. Students are identified with diagnoses that present as severe externalizing behaviours which severely impact their success in a traditional program. The purpose of the Bridges Class is to assist each student to achieve academic success, self-regulation skills, and personalized lifelong health and wellness skills and strategies through flexible programming. The emphasis of specialized instruction is on establishing safety, building relationships, teaching self-regulation strategies, problem solving strategies, social skills development and academic engagement. Curriculum modifications and instructional accommodations are implemented based on the individual needs of each student. Solid communication between the school, parents and other service providers is a cornerstone for success. Supported transitions progressing toward partial or full integration into their school’s regular community program and/or the workplace are additional goals. Students in the Bridges Class are part of the school community and participate in school events and larger class settings as they develop and practice new skills. Each class is typically staffed with a teacher and support worker. A CBE psychologist and a school/family liaison are assigned to support the Bridges Class. Each class typically ranges from 8 to 12 students, depending on grade level and complexity.
High School Integration Class – high school students
The High School Integration Class (HIP) is a high school class designed to support students who have behavioural challenges which interfere with their success. One of the primary components of HIP is supported integration into the typical classrooms with the end goal being successful high school completion. Integration is determined on an individual strength-based system and is designed to both respect and challenge each student’s abilities. The students in the class receive personal support, academic support, personalized programming and customized scheduling. Instructional accommodations and curriculum modifications/adaptions are provided as needed.
CSSI - Communication, Sensory, Social Interaction Grade 1-12 Communication, Sensory and Social Interaction (CSSI) classes offer unique learning
environments which provide intensive supports and services to students in grades 1 – 12 who have been diagnosed with Autism Spectrum Disorders (ASD) and who have moderate to severe cognitive (intellectual) developmental disabilities. The purpose of CSSI is to develop students’ abilities to be as independent as possible in their home, school, and community environments. CSSI teachers recognize students’ unique sensory and learning needs. They work with their students on functional academic and living skills, communication skills and appropriate social interactions. A modified curriculum is used. Teachers base their instruction on the individual needs of each student, with a specific focus on sensory regulation. Instructional techniques may include individual and small group instruction and the use of assistive technology and augmentative communication systems. Inclusion in activities and events within the school community is provided where appropriate. CSSI classes typically have six students. Program staff includes one full time teacher and two full time education assistants, depending upon the complexity of the needs of the individual students. DHH - Deaf & Hard of Hearing The Calgary Board of Education provides a continuum of services for students who are Deaf of Hard of Hearing (DHH). The Deaf and Hard of Hearing Program supports students who are DHH in their community schools, or in congregated settings through a Bilingual (American Sign Language and English) Approach, Aural/Oral Approach, or sign supported speech.
Attachment X
3 attachment x ‐complex learning definitions rev nov 2016
DHH Congregated Programs Each DHH classroom is directly supported by a Teacher of the Deaf and Hard of Hearing, or Special Education Teacher, and has access to an education assistant or educational interpreter, as needed. Typical class size ranges from 6 to 10 students. The ratio of students to staff varies depending on grade level and complexity of student needs. Integration opportunities in other classrooms, curriculum modifications, instructional accommodations, and learning technologies are personalized based on the needs of each student. Outside agency service providers may also be utilized where necessary and appropriate. The programs are supported by a multidisciplinary team that may include: an Educational Audiologist, Speech Language Pathologist, Psychologist, Occupational Therapist and Physical Therapist. Stanley Jones, Aural/Oral Approach, Grades 1-6 This program emphasizes the use of speech, residual hearing, visual English in the form of sign supported speech, speech reading and the use of written English. The primary program goal is developing skills in listening and spoken language, reading and writing, and self-advocacy. Language is taught directly and intentionally throughout all subject areas, using a variety of techniques, including assistive technology. Students in this program have hearing aids or cochlear implants and/or use personal FM sound systems. Students have access to the mandated Alberta Education curriculum that is personalized to their learning needs and have the opportunity for integration into other classrooms where appropriate. This program is recommended for families who have expressed a preference for their children to learn through aural methods of input (listening to English) and oral expression (speaking). Queen Elizabeth Elementary School, Bi-lingual Approach – ASL and English, Grades 1-6 This program emphasizes the use of American Sign Language (ASL) for language learning. The primary program goal is to optimize students’ communication abilities in ASL in conjunction with literacy and numeracy skills. These students benefit from direct support in developing expressive/receptive language skills, including English language instruction through reading and writing. Personal FM systems are available for those students who have hearing aids or cochlear implants. Depending on the personalized learning needs of individual students, strategies for developing spoken English and listening skills are both determined and directed by an Alberta Health Services’ Speech Language Pathologist. Students are exposed to Deaf culture and participate with their hearing peers in select educational opportunities and social activities within the school. This program is recommended for families whose children require ASL to communicate or have expressed a preference for their children to learn through direct instruction in ASL. Queen Elizabeth Junior/Senior High School, Grades 7-12 Communication and instruction is through American Sign Language, spoken/written English, or sign supported speech based on student needs. The primary program goal is to optimize students’ academic achievement, communication abilities, and personal development. Students in this program may have hearing aids and/or cochlear implants and have the option to use personal FM systems. A combination of congregated DHH, co-enrolment, and/or integrated environments is available. Students may participate in bi-cultural learning experiences through educational opportunities and activities in the congregated classrooms and throughout the school. The students who have attended the DHH Programs at Queen Elizabeth Elementary or Stanley Jones Elementary typically feed into the junior high DHH Program. DHH in Community Schools Strategists for the DHH support the school learning team in relation to the use of assistive technology, IPP development, accommodations and teaching strategies. Strategists also work directly with DHH students to support independence with amplification and technology, and to address auditory skill development, literacy and language development, self-advocacy, social/emotional development and transitions.

Attachment X
4 attachment x ‐complex learning definitions rev nov 2016
Educational Audiologist Community Schools and Congregated Settings FM and DM (Digital Modulation) systems are provided and/or supported by the Educational Audiologist. Support includes: 1) monitoring, troubleshooting and repair 2) verifying FM/DM characteristics to ensure that the FM/DM systems and hearing aids/cochlear implants work properly together 3) building capacity of teachers through in-services about hearing loss, using assistive technology, and classroom acoustics and 4) building capacity of strategists, teachers, education assistants, and students to develop monitoring and troubleshooting skills.
EDC ‐ Early Development Centre Calgary Board of Education Early Development Centres (EDC) – Early Intervention Preschool Programs for Children Identified With Special Needs Aged 2 Years 8 Months to 4 Years 5 Months Old. The Calgary Board of Education (CBE) Early Development Centres (EDC) provides a multitude of supports within the classroom environment. Funding from Alberta Education, combined with services provided by the CBE, enhance the opportunities to access support, personnel, and resources for children identified with a moderate or severe diagnosis of a disability or delay. The classroom teacher is the centre of the child’s Learning Team and works collaboratively with a Multidisciplinary Team to support the learning experiences. The Multidisciplinary Team consists of an Education Assistant or Early Childhood Practitioner, Early Learning Strategist, Speech-Language Pathologist, Occupational Therapist, Physical Therapist, Music Therapist and Family Orientated Programming Facilitators. Additional Supports may include Psychologists, Behaviour Analysts/Behaviour Consultants and School Family Liaison. In the EDC classroom, children interact and learn through a personalized play-based program in a responsive learning environment. Each child’s strengths are built upon to support their development and successful participation in preschool. The CBE recognizes the importance of early intervention. This belief is reflected in the level of supports and services provided to our youngest learners in their EDC programs. GATE – Gifted and Talented Education In GATE, the goal is to support academic and personal development, encouraging self-understanding and the achievement of individual potential. GATE programming allows gifted learners to work collaboratively in classes of like-minded peers for their academic studies. Students may progress at a faster pace through the regular curriculum (Alberta Education Programs of Study). They are provided with frequent opportunities to apply higher level thinking skills and diverse problem solving strategies to real world topics. There are opportunities to explore areas of particular interest through independent research. GATE students in junior high and high school have the same choices of complementary courses (options) as other students of the school. They are typically active in school wide activities and extracurricular programs. At the high school level GATE programming may also include courses selected from the Advanced Placement (AP) and International Baccalaureate (IB) programs. Class sizes are typically between 16 and 27 depending upon the grade level and the complexity of the needs of the individual students. Hera
Hera is a partnership between the Calgary Board of Education and the Boys and Girls Club of Calgary. It provides school and community based support to at-risk girls ages 13-17 who are

Attachment X
5 attachment x ‐complex learning definitions rev nov 2016
vulnerable to sexual exploitation. Students attend Hera voluntarily. There may be substance abuse with associated risks. The goal of Hera is to help each young woman to move forward in a positive direction. Staff members teach skills, knowledge, and competencies so each student can remove herself from risk. Hera provides supported transition to community school and/or work experience settings. All aspects of the program are grounded in trauma-informed practice. Instruction focuses on core academics and experiential learning. Customized services from the Boys and Girls Club may include in-home family support, therapy, mentoring, Youthwork and/or Community Resource Connections. These may be offered outside of school hours. The class is staffed with a teacher and a behaviour support worker. A psychologist also supports the team in addressing the students’ current academic and emotional needs. Typically, the class size is 8- 10 students depending upon the complexity of the needs of the individual students.
L&L – Learning and Literacy Grades 4- 9
The L&L class is for students identified with learning disabilities in Division II and III. The goal of L&L class is to assist each student in gaining skills, knowledge, and competencies to reach their academic, social, and emotional potential. The service delivery model within the L&L class is a fully blended classroom model with an emphasis on developing literacy skills (reading and writing) within classroom instruction. The model of service delivery allows for team teaching using Universal Design for Learning as the basis of curriculum planning and delivery. Inclusive learning technologies, curriculum design, accommodations, and all key components for students with learning disabilities are implemented based on the individual needs of each student.
LEAD – Literacy, English and Academic Development
The LEAD class provides intensive supports and services for students and families who have been identified as English Language Learners with backgrounds of Limited Formal Schooling. The ultimate programming goal of the LEAD class is to provide sheltered, trauma-sensitive, short- term language, academic and cultural instruction to enable students to transition into community classes. Instructional programming focusses on intensive oral English language development, basic literacy, numeracy, and cultural and social adjustment.
LEAD is offered for students in Grades 4-12. Students remain in LEAD classes for a maximum of twenty months after which they are assessed for their readiness to transition to ESL programming in their community school. Students are expected to progress three to five grade levels in that time-frame. PLP - Paced Learning Program Grade 4-12
Paced Learning Program (PLP) classes are for students in grades 4 – 12 who have been
identified with mild or moderate cognitive (intellectual) developmental disabilities. PLP teachers provide instruction and learning opportunities that help students function as independently as possible at home, in the community, and in the workplace. Curriculum modifications and instructional accommodations are implemented based on each student’s strengths and needs. At the elementary level, the modified curriculum includes an emphasis on basic literacy, numeracy, daily living, communication, and problem solving skills. At the secondary level programming includes a focus on functional life and work skills such as time-management, self-advocacy, citizenship, community involvement and recreation. PLP programming also provides pre- vocational and vocational (work) opportunities. As well, it provides students with opportunities for inclusion in complementary courses (options), clubs, sports, and special events within the community school. Class size may range from 11-13 students in each class along with program staff.

Attachment X
6 attachment x ‐complex learning definitions rev nov 2016
SKILL - Social Knowledge, Independent Living and Language Grades 1-6 Social Knowledge, Independent Living and Language (SKILL) classes offer intensive
supports and services to students in Grades 1-6 who have been diagnosed with moderate cognitive (intellectual) developmental disabilities. The goal of the SKILL class is to teach students to be able to function as independently as possible in their home and community. SKILL teachers recognize their students’ unique sensory and learning needs. They work with them on functional living skills, including communication, appropriate social interactions, and being as independent as possible in their home, school, and community environments. A modified curriculum is implemented based on the individual needs of each student. Instructional accommodations may include the use of assistive technology, augmentative communication systems, and individual and small group instruction. Opportunities for inclusion with the rest of the school community are provided wherever appropriate. Class size may range from 9-11 students in each class along with program staff.
TASC - Teaching of Attitude, Social Skills and Communication Grade 1-12
Teaching of Attitude, Social Skills, and Communication (TASC) classes are designed to provide intensive supports and services for students in Grades 1-12 who have moderate to severe cognitive (intellectual) and developmental disabilities. The goal of the TASC class is to support students to be able to function as independently as possible in their home, school and community environments. TASC programming teaches students functional academic and living skills, communication skills, appropriate social interactions, and addresses the students’ unique sensory needs. . A modified curriculum is implemented based on the individual needs of each student. Instructional accommodations may include the use of assistive technology, augmentative communication systems, individual and small group instruction. Opportunities for inclusion both within the school and the community are provided as appropriate. A TASC class typically has up to 6 students and is staffed with one teacher and two full time educational assistants. The Class (Grades 4-12) The Class offers a specialized setting for students from elementary to high school. Students are identified with diagnoses that present as severe internalizing behaviours which severely impact their success in a traditional program. All students are receiving therapeutic and/or medical treatment outside of school or have recently completed treatment and their service provider remains involved. Solid communication between the school, parent and other service providers is a cornerstone for success. The purpose of The Class is to assist each student to achieve academic success and to develop personalized lifelong health and wellness skills and strategies through flexible programming. The emphasis of specialized instruction is on understanding the continuum of mental health, establishing safety, building relationships, teaching self-regulation strategies, problem solving strategies, and mental health literacy. Supported transitions progressing toward partial or full integration into their school’s regular community program and/or the workplace are additional goals. The Class is staffed with a teacher and a behaviour support worker. A CBE psychologist and a school/family liaison are assigned to support The Class. There are typically 8 to 14 students in The Class, depending on grade level and complexity. Transitions Class (Grade 4-12) Transitions is offered in collaboration with Wood’s Homes (Wood’s) and Alberta Health Services (AHS). It is for students in grades 1-12 who are not able to attend or to benefit from other programs due to significant internalizing mental health disorders which severely impact their ability to access school engagement and/or programming. Students may or may not have identified diagnoses. Transitions students need significant support to ‘bridge’ into a school

Attachment X
7 attachment x ‐complex learning definitions rev nov 2016
setting. The goal is to identify and address barriers to mental wellness, school engagement and success. AHS and Wood’s staff plays important roles in providing therapeutic programming and connecting students and families to medical, mental health, and community supports. Mental health curriculum, numeracy, and literacy, are starting points for personalizing learning, practicing re-engagement and school readiness skills. Academic programming is personalized based on individual student needs and readiness. Program staff use a strength based, trauma-informed framework to guide programming, starting from where the student and family begin. Connection to, and integration with, other students in the school is planned based on the individual needs of each student. Calgary Board of Education staff includes one full-time teacher and one full-time behaviour support worker. AHS provides a mental health therapist and Wood’s provides a family support worker. There are typically 6 to 10 students in a Transitions class depending on the grade levels and complexity of the students Returning Grade 12’s The Returning Grade 12 program is offered to students who are below the age of 19 years as of September 1st of any given school year. This program is a partnership between the Calgary Board of Education and Vecova Centre for Disability Services and Research with the main focus being transitioning students to adulthood. The purpose of the program is to provide classroom / school pre-vocational programming through vocational bins, school jobs, volunteer opportunities as well as portfolio and resume development, travel training, supported work study and the development of life and community outings that will support the continued growth of communication and social skills. The goal is to have students finish with support work, recreational / leisure opportunities or paid employment.