2013 recreational boating statistics
TRANSCRIPT
COMDTPUB P16754.27U.S. Department of Homeland SecurityU.S. Coast GuardOffice of Auxiliary and Boating Safety
Introduction & Executive Summary
Recreational Boating Statistics 2013 3
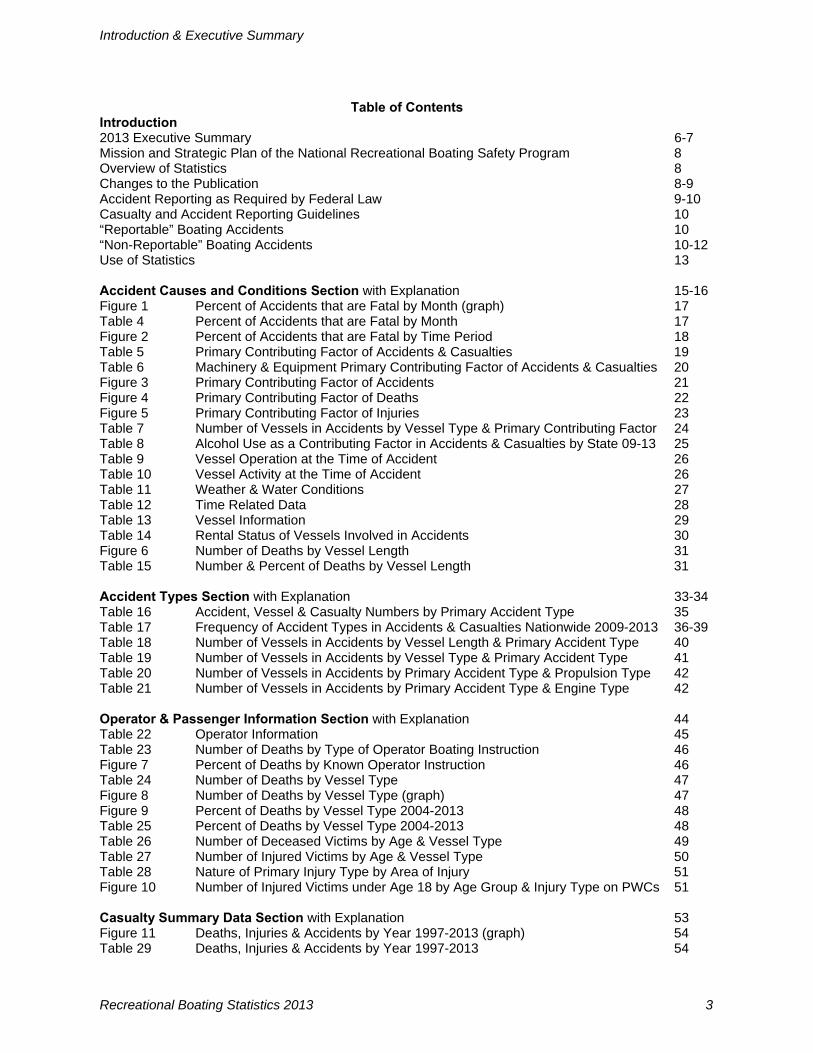
Table of Contents Introduction 2013 Executive Summary 6-7 Mission and Strategic Plan of the National Recreational Boating Safety Program 8 Overview of Statistics 8 Changes to the Publication 8-9 Accident Reporting as Required by Federal Law 9-10 Casualty and Accident Reporting Guidelines 10 “Reportable” Boating Accidents 10 “Non-Reportable” Boating Accidents 10-12 Use of Statistics 13 Accident Causes and Conditions Section with Explanation 15-16 Figure 1 Percent of Accidents that are Fatal by Month (graph) 17 Table 4 Percent of Accidents that are Fatal by Month 17 Figure 2 Percent of Accidents that are Fatal by Time Period 18 Table 5 Primary Contributing Factor of Accidents & Casualties 19 Table 6 Machinery & Equipment Primary Contributing Factor of Accidents & Casualties 20 Figure 3 Primary Contributing Factor of Accidents 21 Figure 4 Primary Contributing Factor of Deaths 22 Figure 5 Primary Contributing Factor of Injuries 23 Table 7 Number of Vessels in Accidents by Vessel Type & Primary Contributing Factor 24 Table 8 Alcohol Use as a Contributing Factor in Accidents & Casualties by State 09-13 25 Table 9 Vessel Operation at the Time of Accident 26 Table 10 Vessel Activity at the Time of Accident 26 Table 11 Weather & Water Conditions 27 Table 12 Time Related Data 28 Table 13 Vessel Information 29 Table 14 Rental Status of Vessels Involved in Accidents 30 Figure 6 Number of Deaths by Vessel Length 31 Table 15 Number & Percent of Deaths by Vessel Length 31 Accident Types Section with Explanation 33-34 Table 16 Accident, Vessel & Casualty Numbers by Primary Accident Type 35 Table 17 Frequency of Accident Types in Accidents & Casualties Nationwide 2009-2013 36-39 Table 18 Number of Vessels in Accidents by Vessel Length & Primary Accident Type 40 Table 19 Number of Vessels in Accidents by Vessel Type & Primary Accident Type 41 Table 20 Number of Vessels in Accidents by Primary Accident Type & Propulsion Type 42 Table 21 Number of Vessels in Accidents by Primary Accident Type & Engine Type 42 Operator & Passenger Information Section with Explanation 44 Table 22 Operator Information 45 Table 23 Number of Deaths by Type of Operator Boating Instruction 46 Figure 7 Percent of Deaths by Known Operator Instruction 46 Table 24 Number of Deaths by Vessel Type 47 Figure 8 Number of Deaths by Vessel Type (graph) 47 Figure 9 Percent of Deaths by Vessel Type 2004-2013 48 Table 25 Percent of Deaths by Vessel Type 2004-2013 48 Table 26 Number of Deceased Victims by Age & Vessel Type 49 Table 27 Number of Injured Victims by Age & Vessel Type 50 Table 28 Nature of Primary Injury Type by Area of Injury 51 Figure 10 Number of Injured Victims under Age 18 by Age Group & Injury Type on PWCs 51 Casualty Summary Data Section with Explanation 53 Figure 11 Deaths, Injuries & Accidents by Year 1997-2013 (graph) 54 Table 29 Deaths, Injuries & Accidents by Year 1997-2013 54
Introduction & Executive Summary
Recreational Boating Statistics 2013 4
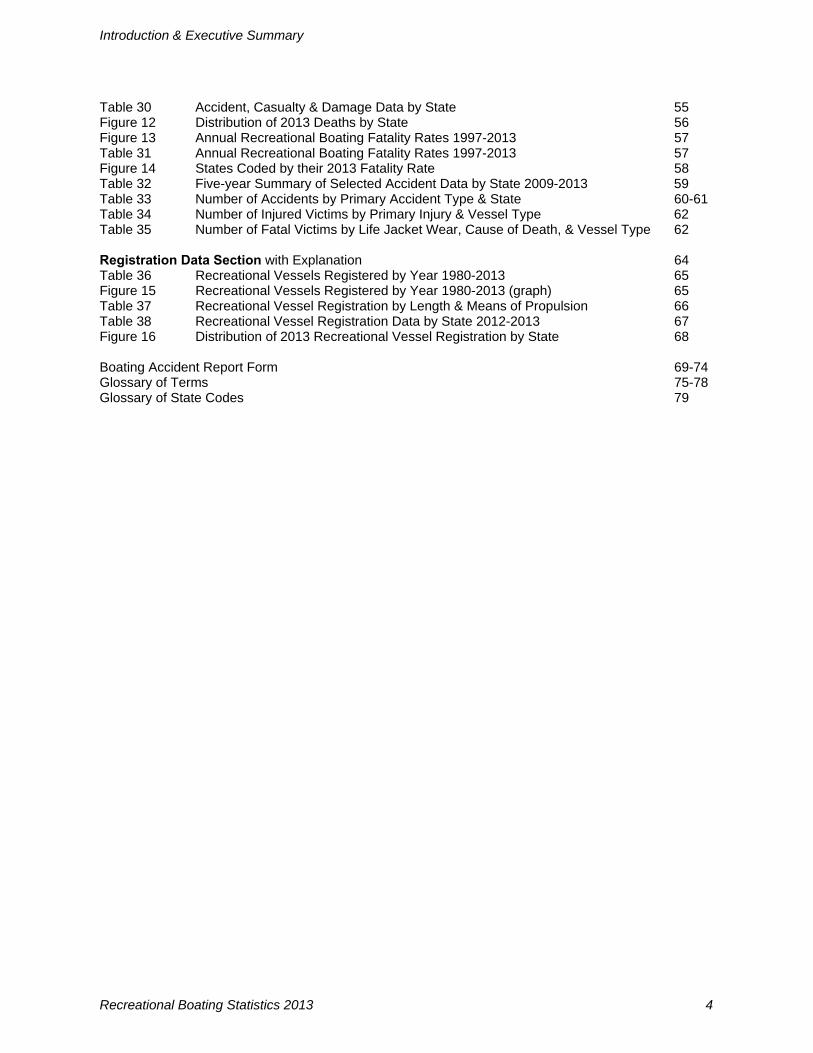
Table 30 Accident, Casualty & Damage Data by State 55 Figure 12 Distribution of 2013 Deaths by State 56 Figure 13 Annual Recreational Boating Fatality Rates 1997-2013 57 Table 31 Annual Recreational Boating Fatality Rates 1997-2013 57 Figure 14 States Coded by their 2013 Fatality Rate 58 Table 32 Five-year Summary of Selected Accident Data by State 2009-2013 59 Table 33 Number of Accidents by Primary Accident Type & State 60-61 Table 34 Number of Injured Victims by Primary Injury & Vessel Type 62 Table 35 Number of Fatal Victims by Life Jacket Wear, Cause of Death, & Vessel Type 62 Registration Data Section with Explanation 64 Table 36 Recreational Vessels Registered by Year 1980-2013 65 Figure 15 Recreational Vessels Registered by Year 1980-2013 (graph) 65 Table 37 Recreational Vessel Registration by Length & Means of Propulsion 66 Table 38 Recreational Vessel Registration Data by State 2012-2013 67 Figure 16 Distribution of 2013 Recreational Vessel Registration by State 68 Boating Accident Report Form 69-74 Glossary of Terms 75-78 Glossary of State Codes 79
Introduction & Executive Summary
Recreational Boating Statistics 2013 5
List of Tables
Table 1 2013 Executive Summary 7 Table 2 News Media Accidents and Casualties 8 Table 3 Non-Reportable Scenarios with their Casualty Count 12 Table 4 Percent of Accidents that are Fatal by Month 17 Table 5 Primary Contributing Factor of Accidents & Casualties 19 Table 6 Machinery & Equipment Primary Contributing Factor of Accidents & Casualties 20 Table 7 Number of Vessels in Accidents by Vessel Type & Primary Contributing Factor 24 Table 8 Alcohol Use as a Contributing Factor in Accidents & Casualties by State 09-13 25 Table 9 Vessel Operation at the Time of Accident 26 Table 10 Vessel Activity at the Time of Accident 26 Table 11 Weather & Water Conditions 27 Table 12 Time Related Data 28 Table 13 Vessel Information 29 Table 14 Rental Status of Vessels Involved in Accidents 30 Table 15 Number and Percent of Deaths by Vessel Length 31 Table 16 Accident, Vessel & Casualty Numbers by Primary Accident Type 35 Table 17 Frequency of Accident Types in Accidents & Casualties Nationwide 2009-2013 36-39 Table 18 Number of Vessels in Accidents by Vessel Length & Primary Accident Type 40 Table 19 Number of Vessels in Accidents by Vessel Type & Primary Accident Type 41 Table 20 Number of Vessels in Accidents by Primary Accident Type & Propulsion Type 42 Table 21 Number of Vessels in Accidents by Primary Accident Type & Engine Type 42 Table 22 Operator Information 45 Table 23 Number of Deaths by Type of Operator Boating Instruction 46 Table 24 Number of Deaths by Vessel Type 47 Table 25 Percent of Deaths by Vessel Type 2004-2013 48 Table 26 Number of Deceased Victims by Age & Vessel Type 49 Table 27 Number of Injured Victims by Age & Vessel Type 50 Table 28 Nature of Primary Injury Type by Area of Injury 51 Table 29 Deaths, Injuries & Accidents by Year 1997-2013 54 Table 30 Accident, Casualty & Damage Data by State 55 Table 31 Annual Recreational Boating Fatality Rates 1997-2013 57 Table 32 Five-year Summary of Selected Accident Data by State 2009-2013 59 Table 33 Number of Accidents by Primary Accident Type & State 60-61 Table 34 Number of Injured Victims by Primary Injury & Vessel Type 62 Table 35 Number of Fatal Victims by Life Jacket Wear, Cause of Death & Vessel Type 62 Table 36 Recreational Vessels Registered by Year 1980-2013 65 Table 36 Recreational Vessel Registration by Length & Means of Propulsion 66 Table 38 Recreational Vessel Registration Data by State 2012-2013 67
List of Figures
Figure 1 Percent of Accidents that are Fatal by Month 17 Figure 2 Percent of Accidents that are Fatal by Time Period 18 Figure 3 Primary Contributing Factor of Accidents 21 Figure 4 Primary Contributing Factor of Deaths 22 Figure 5 Primary Contributing Factor of Injuries 23 Figure 6 Number of Deaths by Vessel Length 31 Figure 7 Percent of Deaths by Known Operator Instruction 46 Figure 8 Number of Deaths by Vessel Type 47 Figure 9 Percent of Deaths by Vessel Type 2004-2013 48 Figure 10 Number of Injured Victims under Age 18 by Age Group & Injury Type on PWCs 51 Figure 11 Deaths, Injuries & Accidents by Year 1997-2013 54 Figure 12 Distribution of 2013 Deaths by State 56 Figure 13 Annual Recreational Boating Fatality Rates 1997-2013 57 Figure 14 States Coded by their 2013 Fatality Rate 58 Figure 15 Recreational Vessels Registered by Year 1990-2013 65 Figure 16 Distribution of 2013 Recreational Vessel Registration by State 68
Introduction & Executive Summary
Recreational Boating Statistics 2013 6
2013 EXECUTIVE SUMMARY
In 2013, the Coast Guard counted 4,062 accidents that involved 560 deaths, 2,620
injuries, and approximately $39 million dollars of damage to property as a result of recreational boating accidents.
The fatality rate was 4.7 deaths per 100,000 registered recreational vessels.
This rate represents a 13% decrease from last year’s fatality rate of 5.4 deaths per 100,000 registered recreational vessels.
Compared to 2012, the number of accidents decreased 10%, the number of
deaths decreased 14%, and the number of injuries decreased 12.7%. Where cause of death was known, seventy-seven (77) percent of fatal boating
accident victims drowned. Of those drowning victims with reported life jacket usage, eighty-four (84) percent were not wearing a life jacket.
Where instruction was known, twenty (20) percent of deaths occurred on boats where
the operator had received boating safety instruction. Only thirteen (13) percent of deaths occurred on vessels where the operator had received boating safety instruction from a course provider offering a course meeting the U.S. Coast Guard-recognized national standards.
Eight out of every ten boaters who drowned were using vessels less than 21 feet in
length. Operator inattention, improper lookout, operator inexperience, excessive speed, and
machinery failure rank as the top five primary contributing factors in accidents. Alcohol use is the leading known contributing factor in fatal boating accidents; where
the primary cause was known, it was listed as the leading factor in 16% of deaths. Twenty-two children under age thirteen lost their lives while boating in 2013. Eight
children or approximately thirty-six (36) percent of the children who died in 2013 died from drowning. Five children or 62.5% of those who drowned were not wearing a life jacket as required by state and federal law.
Where data was known, the most common types of vessels involved in reported
accidents were open motorboats (46%), personal watercraft (18%), and cabin motor-boats (17%).
The 11,993,067 recreational vessels registered by the states in 2013 represent a
0.9% decrease from last year when 12,101,936 recreational vessels were registered.
Introduction & Executive Summary
Recreational Boating Statistics 2013 7
Table 1 ▪ 2013 EXECUTIVE SUMMARY
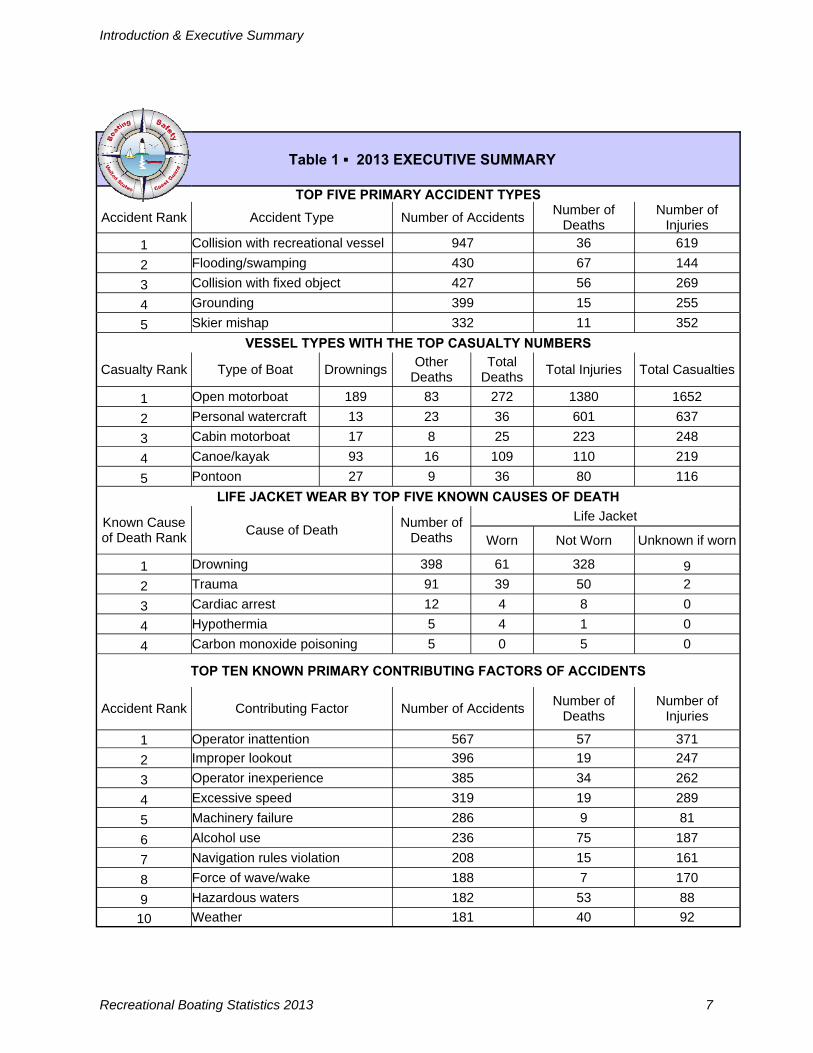
TOP FIVE PRIMARY ACCIDENT TYPES
Accident Rank Accident Type Number of Accidents Number of
Deaths Number of
Injuries
1 Collision with recreational vessel 947 36 619
2 Flooding/swamping 430 67 144
3 Collision with fixed object 427 56 269
4 Grounding 399 15 255
5 Skier mishap 332 11 352
VESSEL TYPES WITH THE TOP CASUALTY NUMBERS
Casualty Rank Type of Boat Drownings Other
Deaths Total
Deaths Total Injuries Total Casualties
1 Open motorboat 189 83 272 1380 1652
2 Personal watercraft 13 23 36 601 637
3 Cabin motorboat 17 8 25 223 248
4 Canoe/kayak 93 16 109 110 219
5 Pontoon 27 9 36 80 116
LIFE JACKET WEAR BY TOP FIVE KNOWN CAUSES OF DEATH
Known Cause of Death Rank
Cause of Death Number of
Deaths
Life Jacket
Worn Not Worn Unknown if worn
1 Drowning 398 61 328 9
2 Trauma 91 39 50 2
3 Cardiac arrest 12 4 8 0
4 Hypothermia 5 4 1 0
4 Carbon monoxide poisoning 5 0 5 0
TOP TEN KNOWN PRIMARY CONTRIBUTING FACTORS OF ACCIDENTS
Accident Rank Contributing Factor Number of Accidents Number of
Deaths Number of
Injuries
1 Operator inattention 567 57 371
2 Improper lookout 396 19 247
3 Operator inexperience 385 34 262
4 Excessive speed 319 19 289
5 Machinery failure 286 9 81
6 Alcohol use 236 75 187
7 Navigation rules violation 208 15 161
8 Force of wave/wake 188 7 170
9 Hazardous waters 182 53 88
10 Weather 181 40 92
Introduction & Executive Summary
Recreational Boating Statistics 2013 8
Mission and Strategic Plan of the National Recreational Boating Safety Program The mission of the National Recreational Boating Safety (RBS) Program is “to ensure the public has a safe, secure, and enjoyable recreational boating experience by implementing programs that minimize the loss of life, personal injury, and property damage while cooperating with environmental and national security efforts”. The Strategic Plan of the National Recreational Boating Safety Program delineates the Program’s eleven objectives to reduce casualties which include 1) tracking and increasing the number of educated boaters; 2) delivering effective boating safety messages to target audiences; 3) increasing the number of on-the-water boating instruction recipients; 4) studying and increasing life jacket wear rates; 5) increas-ing boater knowledge of and compliance with navigation rules; 6) decreasing boating under the influ-ence; 7) decreasing the number of defective vessels; 8) increasing boater compliance with vessel car-riage requirements; 9) increasing the accuracy and reporting rates of reportable accidents; 10) conduct-ing research and development of boating safety initiatives; and 11) measuring the effectiveness of non-profit organization grant projects. To that end, the data in this report is used in many Strategic Plan measurements. Contributing factor data is used to measure navigation rules compliance outlined in Objective 5. Alcohol use as a contribut-ing factor is used to measure boating under the influence in Objective 6. Data collection as a whole is focused upon in Objective 9, Accident Reporting. Further, data is used for research endeavors outlined in Objective 10. To view the Strategic Plan of the Program, please visit the Office’s website at http://www.uscgboating.org. Overview of Statistics This report contains statistics on registered recreational vessels and boating accidents during calendar year 2013. Data used to compile the recreational boating accident statistics come from three sources:
Boating Accident Report (BAR) data forwarded to the Coast Guard by states with an ap-proved casualty reporting system; and
Reports of Coast Guard investigations of fatal boating accidents that occurred on waters
under Federal jurisdiction. Recreational boating accident investigation data are used if sub-mitted to the Coast Guard and are relied on as much as possible to provide accurate acci-dent statistics. In the absence of investigation data, information is collected from the acci-dent reports filed by boat operators; and
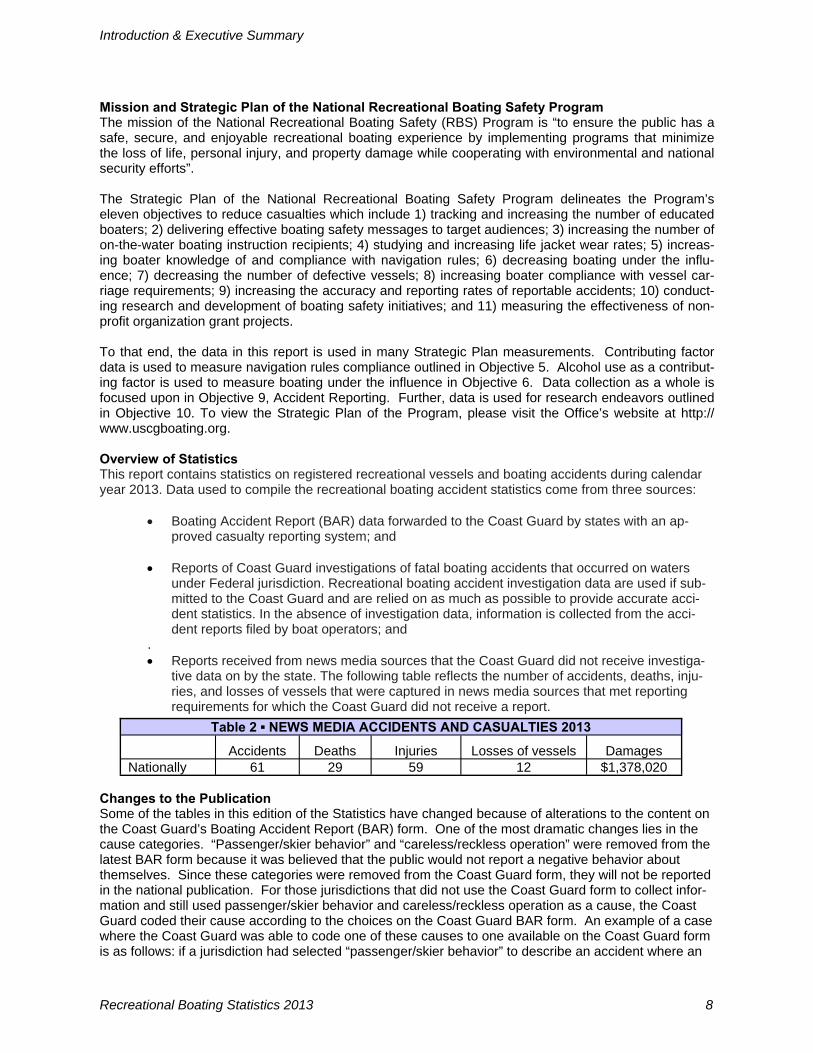
. Reports received from news media sources that the Coast Guard did not receive investiga-
tive data on by the state. The following table reflects the number of accidents, deaths, inju-ries, and losses of vessels that were captured in news media sources that met reporting requirements for which the Coast Guard did not receive a report.
Changes to the Publication Some of the tables in this edition of the Statistics have changed because of alterations to the content on the Coast Guard’s Boating Accident Report (BAR) form. One of the most dramatic changes lies in the cause categories. “Passenger/skier behavior” and “careless/reckless operation” were removed from the latest BAR form because it was believed that the public would not report a negative behavior about themselves. Since these categories were removed from the Coast Guard form, they will not be reported in the national publication. For those jurisdictions that did not use the Coast Guard form to collect infor-mation and still used passenger/skier behavior and careless/reckless operation as a cause, the Coast Guard coded their cause according to the choices on the Coast Guard BAR form. An example of a case where the Coast Guard was able to code one of these causes to one available on the Coast Guard form is as follows: if a jurisdiction had selected “passenger/skier behavior” to describe an accident where an
Table 2 ▪ NEWS MEDIA ACCIDENTS AND CASUALTIES 2013
Accidents Deaths Injuries Losses of vessels Nationally 61 29 59 12
Damages $1,378,020
Introduction & Executive Summary
Recreational Boating Statistics 2013 9
occupant stood up in a canoe which led to the capsizing of the vessel, the Coast Guard coded this cause as “improper loading” instead of “passenger/skier behavior”. An example of a case where the Coast Guard was not able to code one of these causes to a cause available on the Coast Guard form is as follows: a passenger on a vessel became injured while jumping out of a vessel while it was in motion. In this case, the Coast Guard coded the accident as “other” and captured “passenger/skier behavior” in the “other accident cause” category. “Careless/reckless operation” was likewise coded such that when applicable, it was coded as “Rules of the Road”. In other cases, the cause was coded as “other”. Other changes include a graph that was added on page 18 to reflect the percent of accidents that are fatal by time of day. A graph and table were added on page 48 to reflect the percent of deaths attributed to each vessel type for years 2004-2013. A graph was added on page 51 to reflect the number of in-jured victims under age 18 by age group and injury type on personal watercraft. A graph and table were modified on page 57 to reflect the motorized fatality rate by year. A table was modified on page 67 to provide fatality rates by state. The boating accident report form on pages (69-74) of this report was re-vised in September 2011 to reflect the addition of a privacy statement and instructions, as well as a field for the date of birth of the operator and injured victim. Finally, four of the statistics in the Executive Summary were changed to remove the records where val-ues were unknown. This new calculation method affects the fourth, fifth, eighth, and tenth bullet points. To find information on the number of “unknown” cases excluded, please reference Tables 35 (on page 62), 22 (on page 45), 5 (on page 19), and 7 (on page 24) respectively. Accident Reporting as Required by Federal Law Under federal regulations (33 CFR Part 173; Subpart C – Casualty and Accident Reporting) the operator of any numbered vessel that was not required to be inspected or a vessel that was operated for recrea-tional purposes is required to file a BAR when, as a result of an occurrence that involves the vessel or its equipment: 1. A person dies; or 2. A person disappears from the vessel under circumstances that indicate death or injury; or 3. A person is injured and requires medical treatment beyond first aid; or 4. Damage to vessels and other property totals $2,000 or more; or 5. There is a complete loss of any vessel. If the above conditions are met, the federal regulations state that the operator or owner must report their accident to a state reporting authority, abbreviated in this publication as “state”. The reporting authority can be either the state where the accident occurred, the state in which the vessel was numbered, or, if the vessel does not have a number, the state where the vessel was principally used. The owner must submit the report if the operator is deceased or unable to make the report. The regulations also state the acceptable length of time in which the accident report must be submitted to the reporting authority. Boat operators or owners must submit: 1. Accident reports within 48 hours of an occurrence if: a. A person dies within 24 hours of the occurrence; or b. A person requires medical treatment beyond first aid; or c. A person disappears from the vessel.
2. Accident reports within 10 days of an occurrence if there is damage to the vessel/property only.
The minimum reporting requirements are set by Federal regulation, but states are allowed to have more stringent requirements. For example, some states have a lower threshold for reporting damage to ves-sels and other property. Federal Regulations (33 CFR 174.121) require accident report data to be forwarded to Coast Guard Headquarters within 30 days of receipt by a state.
Introduction & Executive Summary
Recreational Boating Statistics 2013 10
The statistics in this publication cover boating accidents reported on waters of joint federal and state ju-risdiction, exclusive state jurisdiction, sole federal jurisdiction, and some private waters. Most states use BAR forms that are similar to the Coast Guard form. A copy of the Coast Guard BAR form used for this report is on pages 69-74. Casualty and Accident Reporting Guidelines Casualty and accident reporting applies to each “vessel” used by its operator for recreational purposes or vessels that are required to be numbered and are not subject to inspection. This publication reflects watercraft that have been deemed a “vessel.” Terms used to describe the vari-ous types of watercraft are: airboat, auxiliary sailboat, cabin motorboat, canoe, houseboat, inflatable boat, kayak, open motorboat, personal watercraft, pontoon, raft, rowboat, sailboat, and stand up paddle-board. Reports received involving watercraft that have not been determined to be “vessels” to date, such as single unmodified innertubes, have not been included in the statistics in the main body of this report. “Reportable” Boating Accidents A vessel is considered to be involved in a “boating accident” whenever a death, missing person, per-sonal injury, property damage, or total vessel loss results from the vessel's operation, construction, sea-worthiness, equipment, or machinery. The following are examples of accident types that are used in this report: Grounding, capsizing, sinking, or flooding/swamping Falls in or overboard a vessel Persons ejected from a vessel Fire or explosions that occur while underway and while anchored, moored or docked if the fire re-
sulted from the vessel or vessel equipment. Water-skiing or other mishap involving a towable device Collision with another vessel or object Striking a submerged object A person struck by a vessel, propeller, propulsion unit, or steering machinery Carbon monoxide exposure Electrocution due to stray current related to a vessel Casualties while swimming from a vessel that is not anchored, moored, or docked Casualties where natural causes served as a contributing factor in the death of an individual but the
determined cause of death was drowning Casualties from natural phenomena such as interaction with marine life (i.e. leaping sturgeon
causes casualty to person) and interaction with nature (i.e. mountain side falls onto vessel causing casualties)
Casualties where a person falls off an anchored vessel Casualties that result when a person departs an anchored, disabled vessel to make repairs, such as
unfouling an anchor or cleaning out the intake of a jet-propelled vessel “Non-Reportable” Boating Accidents Not every occurrence involving a vessel is considered within the scope of the National Recreational Boating Safety Program. The following occurrences involving a vessel may be required to be reported to the state, but for statistical purposes are excluded from this report and are considered “non-reportable” boating accidents: A person dies, is injured, or is missing as a result of self-inflicted wounds, alcohol poisoning, gun-
shot wounds, or the ingestion of drugs, controlled substances, or poison A person dies, is injured, or is missing as a result of assault by another person or persons while
aboard a vessel A person dies or is injured from natural causes while aboard a vessel where the vessel did not con-

Introduction & Executive Summary
Recreational Boating Statistics 2013 11
tribute to the casualty A person dies, is injured, or is missing as a result of jumping, diving, or swimming for pleasure from
an anchored, moored, or docked vessel A person dies, is injured, or is missing as a result of swimming to retrieve an object or a vessel that
is adrift from its mooring or dock, having departed from a place of inherent safety, such as the shore or pier
Property damage occurs or a person dies, is injured, or is missing while preparing a vessel for launching or retrieving and the vessel is not on the water and capable / ready for its intended use
Property damage occurs or a person dies, is injured, or is missing as a result of a fire on shore or a pier that spreads to a vessel or vessels
Property damage occurs to a docked or moored vessel or a person dies, is injured, or is missing from such a vessel as a result of storms, or unusual tidal or sea conditions; and when a vessel gets underway in those conditions in an attempt to rescue persons or vessels
Property damage occurs to a docked or moored vessel due to lack of maintenance on the vessel or the structure to which it was moored
Property damage occurs to a docked or moored vessel due to theft or vandalism Property damage occurs to, a person dies or is injured on, or a person is missing from a non-
propelled residential platform or other watercraft used primarily as a residence that is not underway Casualties that result from falls from or on docked vessels or vessels that are moored to a perma-
nent structure Casualties that result from a person climbing aboard an anchored vessel from the water or swim-
ming near an anchored vessel (unless the casualty was related to carbon monoxide exposure or stray electric current)
Fire or explosions on anchored, docked, or moored boats where the cause of the fire was not attrib-uted to the vessel or vessel equipment
Casualty or damage that results when the vehicle used for trailering the vessel fails Casualties or damage that occur during accidents that only involve watercraft that have not been
deemed a vessel Casualties or damage that occur when the only vessel(s) involved are being used solely for govern-
mental, commercial, or criminal activity Casualties or damage that occur when the only vessel(s) involved are not required to be numbered
and are being used exclusively for racing (exclusion in 33 CFR 173.13(a)) Casualties or damage that occur when the only vessel(s) involved are foreign vessels and thus not
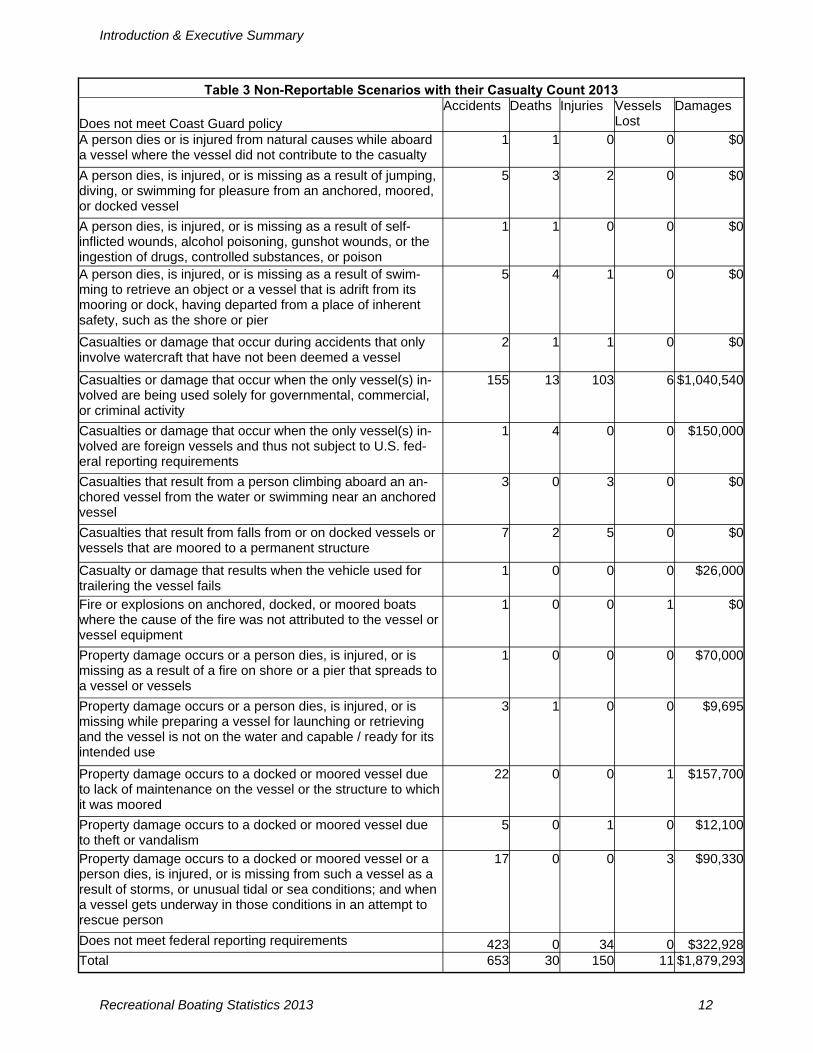
subject to U.S. federal reporting requirements A list of “non-reportable” scenarios and their associated casualty counts can be found in Table 3.
Introduction & Executive Summary
Recreational Boating Statistics 2013 12
Table 3 Non-Reportable Scenarios with their Casualty Count 2013
Does not meet Coast Guard policy Accidents Deaths Injuries Vessels
Lost Damages
A person dies or is injured from natural causes while aboard a vessel where the vessel did not contribute to the casualty
1 1 0 0 $0
A person dies, is injured, or is missing as a result of jumping, diving, or swimming for pleasure from an anchored, moored, or docked vessel
5 3 2 0 $0
A person dies, is injured, or is missing as a result of self-inflicted wounds, alcohol poisoning, gunshot wounds, or the ingestion of drugs, controlled substances, or poison
1 1 0 0 $0
A person dies, is injured, or is missing as a result of swim-ming to retrieve an object or a vessel that is adrift from its mooring or dock, having departed from a place of inherent safety, such as the shore or pier
5 4 1 0 $0
Casualties or damage that occur during accidents that only involve watercraft that have not been deemed a vessel
2 1 1 0 $0
Casualties or damage that occur when the only vessel(s) in-volved are being used solely for governmental, commercial, or criminal activity
155 13 103 6 $1,040,540
Casualties or damage that occur when the only vessel(s) in-volved are foreign vessels and thus not subject to U.S. fed-eral reporting requirements
1 4 0 0 $150,000
Casualties that result from a person climbing aboard an an-chored vessel from the water or swimming near an anchored vessel
3 0 3 0 $0
Casualties that result from falls from or on docked vessels or vessels that are moored to a permanent structure
7 2 5 0 $0
Casualty or damage that results when the vehicle used for trailering the vessel fails
1 0 0 0 $26,000
Fire or explosions on anchored, docked, or moored boats where the cause of the fire was not attributed to the vessel or vessel equipment
1 0 0 1 $0
Property damage occurs or a person dies, is injured, or is missing as a result of a fire on shore or a pier that spreads to a vessel or vessels
1 0 0 0 $70,000
Property damage occurs or a person dies, is injured, or is missing while preparing a vessel for launching or retrieving and the vessel is not on the water and capable / ready for its intended use
3 1 0 0 $9,695
Property damage occurs to a docked or moored vessel due to lack of maintenance on the vessel or the structure to which it was moored
22 0 0 1 $157,700
Property damage occurs to a docked or moored vessel due to theft or vandalism
5 0 1 0 $12,100
Property damage occurs to a docked or moored vessel or a person dies, is injured, or is missing from such a vessel as a result of storms, or unusual tidal or sea conditions; and when a vessel gets underway in those conditions in an attempt to rescue person
17 0 0 3 $90,330
Does not meet federal reporting requirements 423 0 34 0 $322,928 Total 653 30 150 11 $1,879,293
Introduction & Executive Summary
Recreational Boating Statistics 2013 13
Use of Statistics Following are some important points that users of these statistics need to be aware of: 1. An approved casualty reporting system does not include every accident involving a vessel that is be-ing used for recreational purposes. Some accidents are not in the system because they are not required to be reported. Many accidents are not reported because boaters are not aware of the accident reporting regulations or fail to comply with such regulations. In an attempt to make sure all fatal boating accidents are captured by the casualty reporting system and required data are input into the Boating Accident Report Database (BARD) System, the Coast Guard notifies and provides information from its Marine Information for Safety and Law Enforcement (MISLE) system to state Boating Law Administrators (BLAs) of fatal accidents that occurred in their state. The Coast Guard also sends news media stories to state BLAs on fatal and non-fatal boating accidents that occur in their state to capture accidents that may have been missed. 2. Federal regulations do not require the reporting of accidents on private waters where states have no jurisdiction. Reports of accidents on such waters are included in this report when received by the Coast Guard if they satisfy the other requirements for inclusion. 3. Non-fatal accidents cannot be assumed to have occurred in numbers proportional to the reported sta-tistics because the act of reporting an accident is not a random sampling of accidents in the statistical sense. Rather, selection is based on the ability and willingness of those involved to file a report. 4. The fluctuations in non-fatal accident statistics from year to year may be caused by factors other than the change in the total number of recreational boating accidents. A small change in the low reporting rate may cause a relatively large change in the statistics. The statistics in this publication are based on accident data submitted by reporting states as of April 8, 2014 with subsequent updates as information is reviewed and standardized. This publication covers only accidents meeting the aforementioned reporting requirements.
Accident Causes & Conditions

Accident Causes & Conditions
Recreational Boating Statistics 2013 15
Explanation of Accident Causes and Conditions Section
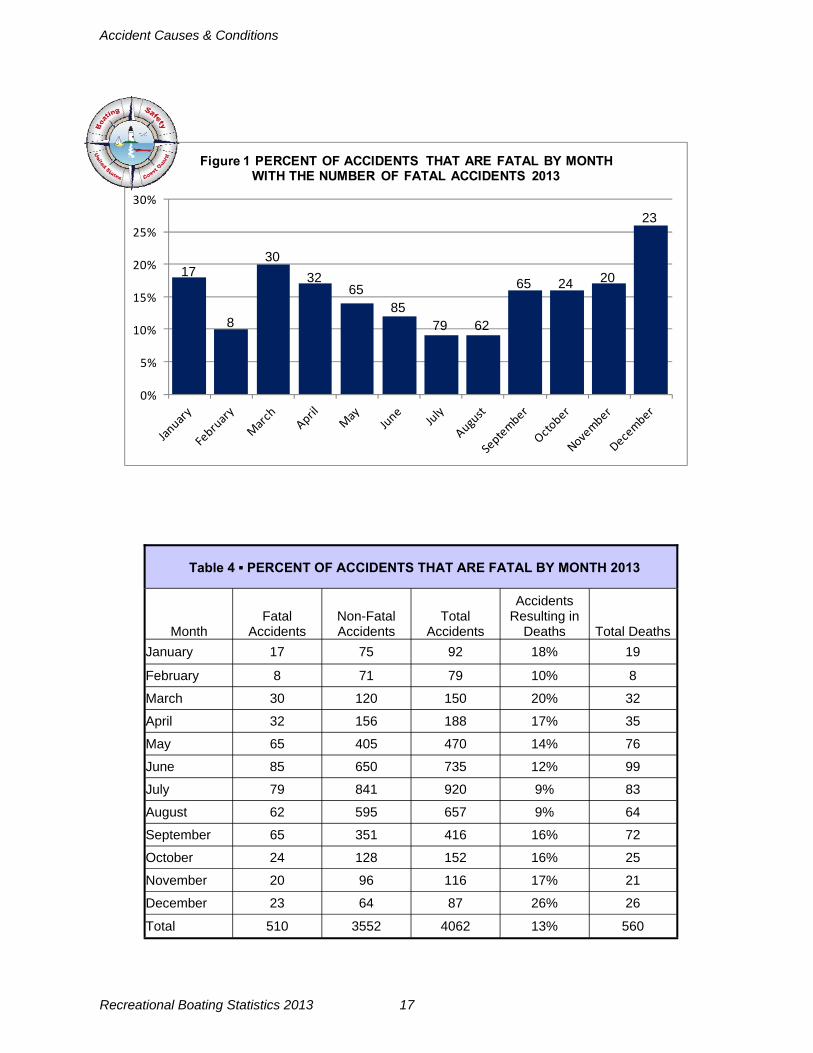
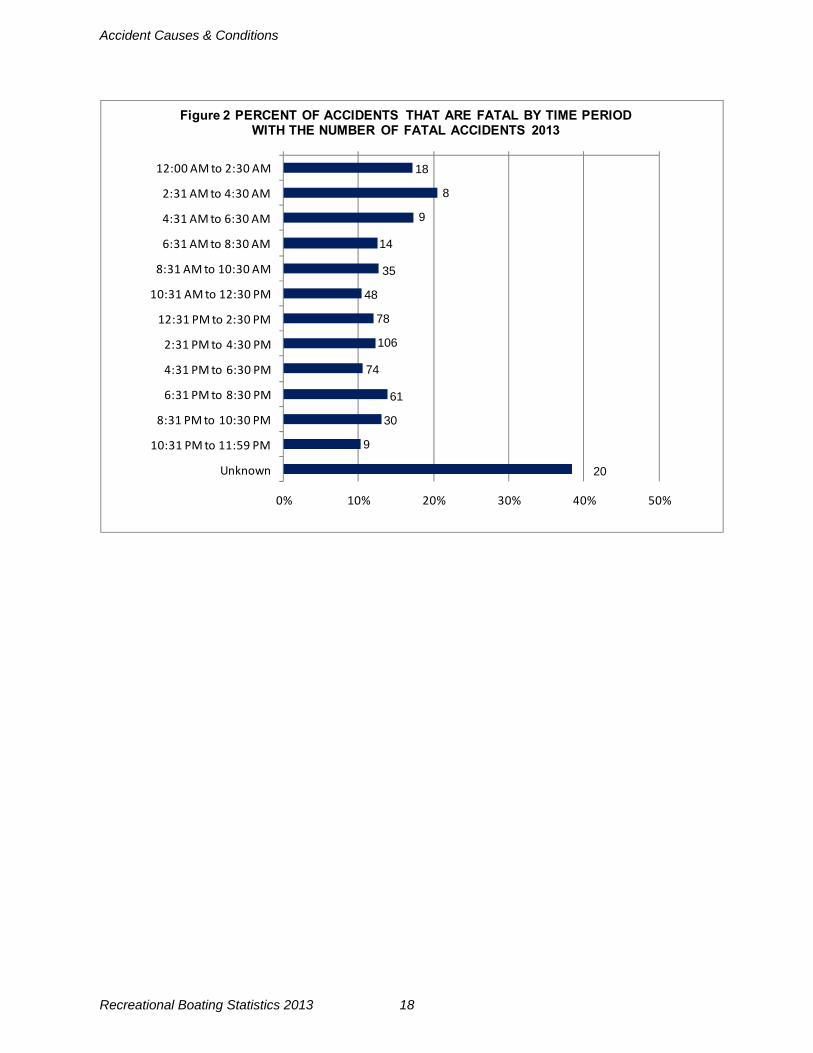
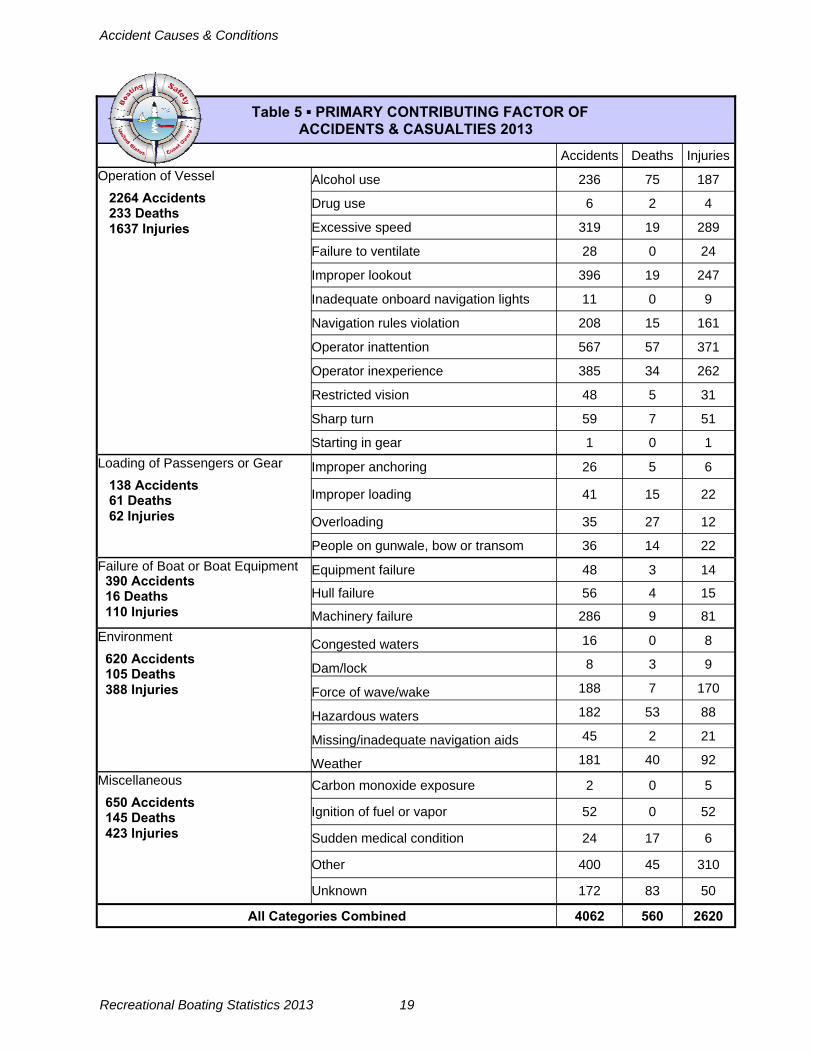
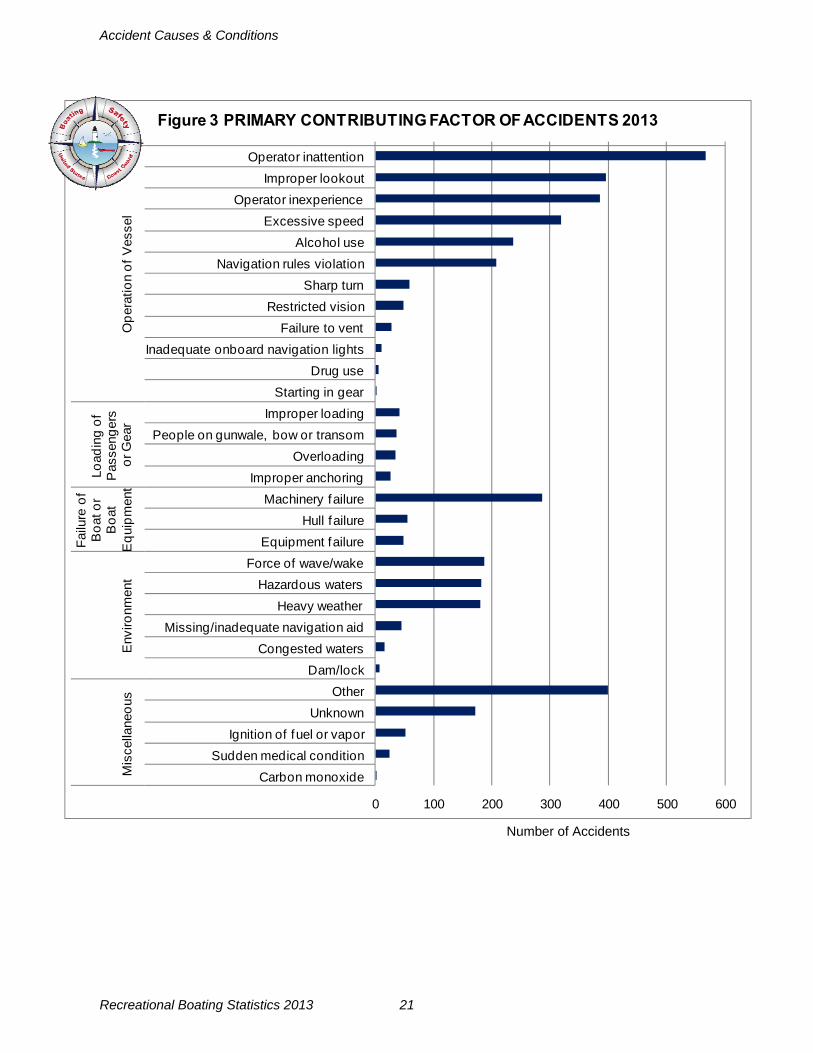
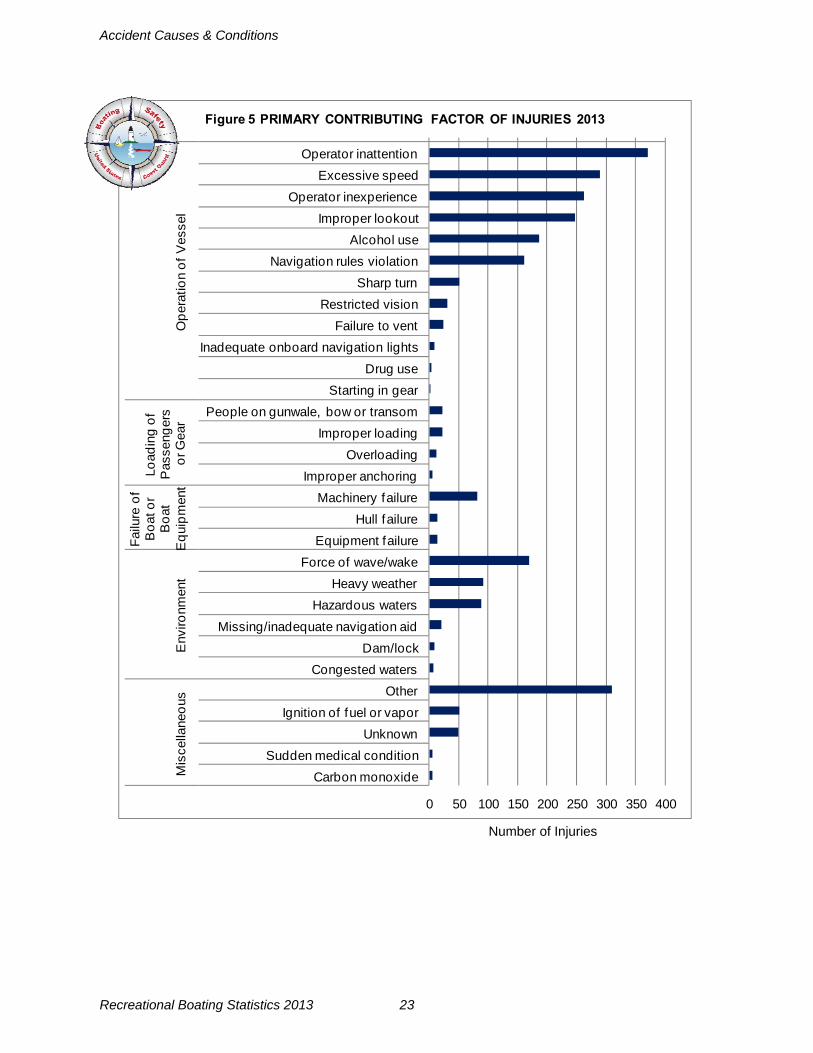
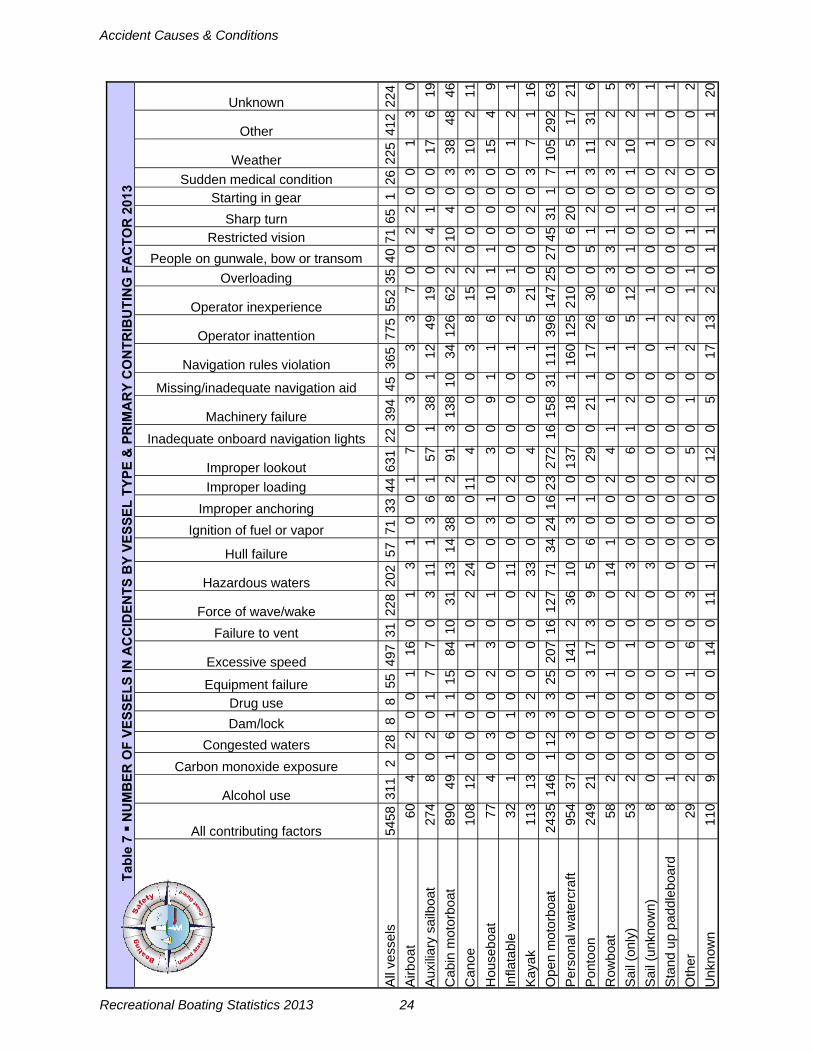
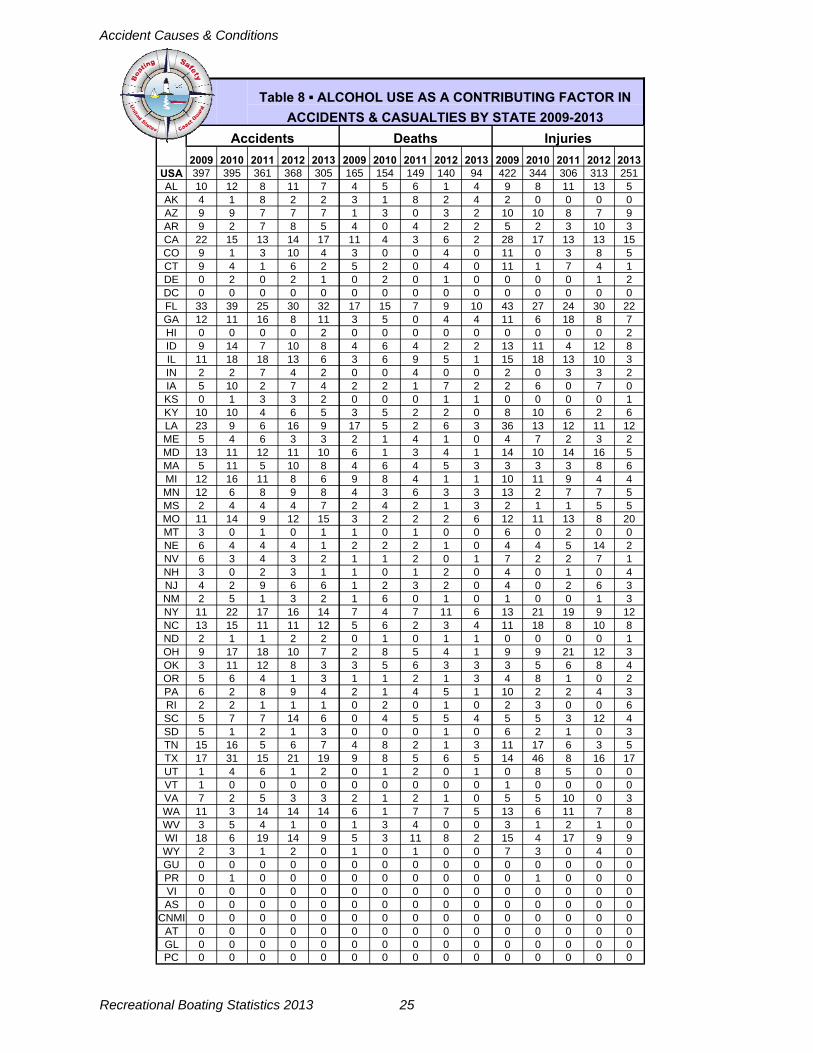
The following eighteen tables and figures focus on the causes of accidents with a special focus on alco-hol use, the operation and activity at the time of accident, weather and water conditions, vessel informa-tion, and the time of accidents. Percent of Accidents that are Fatal by Month (Figure 1 & Table 4, Page 17) This table provides information about total accidents, fatal accidents, non-fatal accidents, and deaths. The figure focuses on the percent of fatal accidents by month. As a background note, fatal accidents are accidents that involve at least one death. For example, a fatal accident could be a capsizing that resulted in three deaths. It was an accident that had at least one death. Percent of Accidents that are Fatal by Time Period (Figure 2, Page 18) This table reflects the percentage of accidents that are fatal by time period. The two categories in which accidents are more frequently fatal span the hours between midnight and 4:30am. Primary Contributing Factor of Accidents & Casualties (Table 5, Page 19) The "contributing factors" of an accident are the causes of the accident. In the Coast Guard's national accident reporting database, there are allowances for up to four causes. This table reflects the first cause listed for all accidents, deaths, and injuries nationwide. For the purposes of displaying information in a simplified manner, the Coast Guard divided the contribut-ing factor categories into five larger categories: operation of vessel, loading of passengers or gear, fail-ure of vessel or vessel equipment, environment, and miscellaneous. These five categories are situated in the leftmost column of the table and have the total number of accidents, deaths, and injuries associ-ated with each category under the category name. Machinery & Equipment Primary Contributing Factor of Accidents & Casualties (Table 6, Page 20) This table reflects the number of accidents, deaths, and injuries where machinery or equipment failure was listed as a first cause of the accident. The table also delineates the different types of failure that were listed. Primary Contributing Factor of Accidents (Figure 3, Page 21) This figure reflects the first cause of accidents for all accidents nationwide. Primary Contributing Factor of Deaths (Figure 4, Page 22) This figure reflects the first cause listed for all deaths. Primary Contributing Factor of Injuries (Figure 5, Page 23) This figure reflects the first cause listed for all injuries. Number of Vessels in Accidents by Vessel Type & Primary Contributing Factor (Table 7, Page 24) This table looks at the number of vessels involved in accidents by vessel type and the primary cause of the accident. Alcohol Use as a Contributing Factor in Accidents & Casualties by State 2009-2013 (Table 8, Page 25) This table reflects a tally of all four causes of accidents listed for all national accidents, deaths, and inju-ries. This table lists accidents where alcohol use by the vessel’s occupants was listed as a direct or indirect cause of the accident. There are other cases in the national database where alcohol use is listed as being involved in the accident but it was not determined to be a cause of the accident.

Accident Causes & Conditions
Recreational Boating Statistics 2013 16
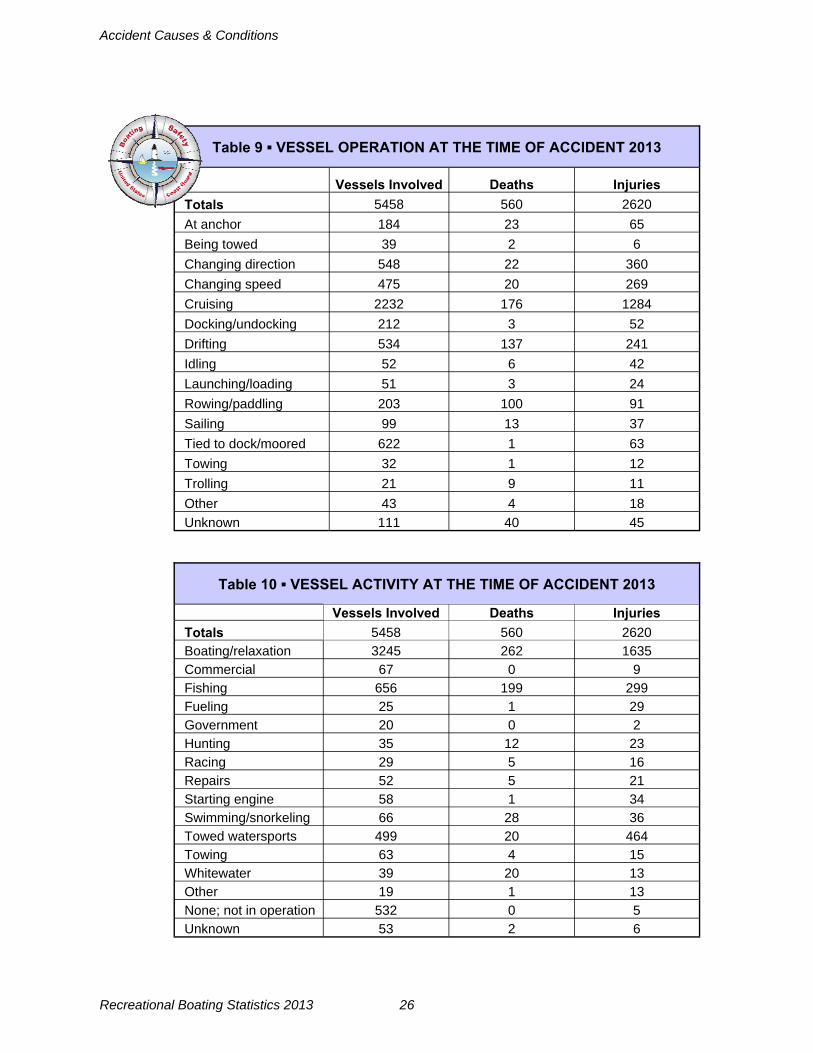
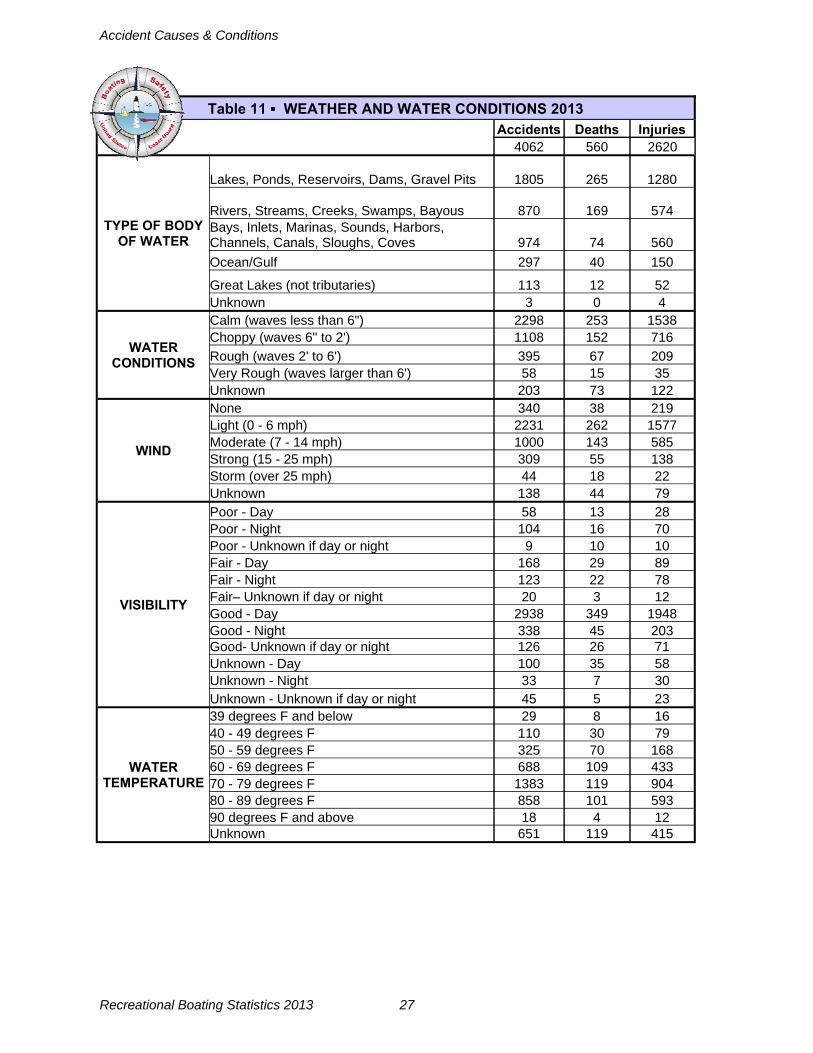
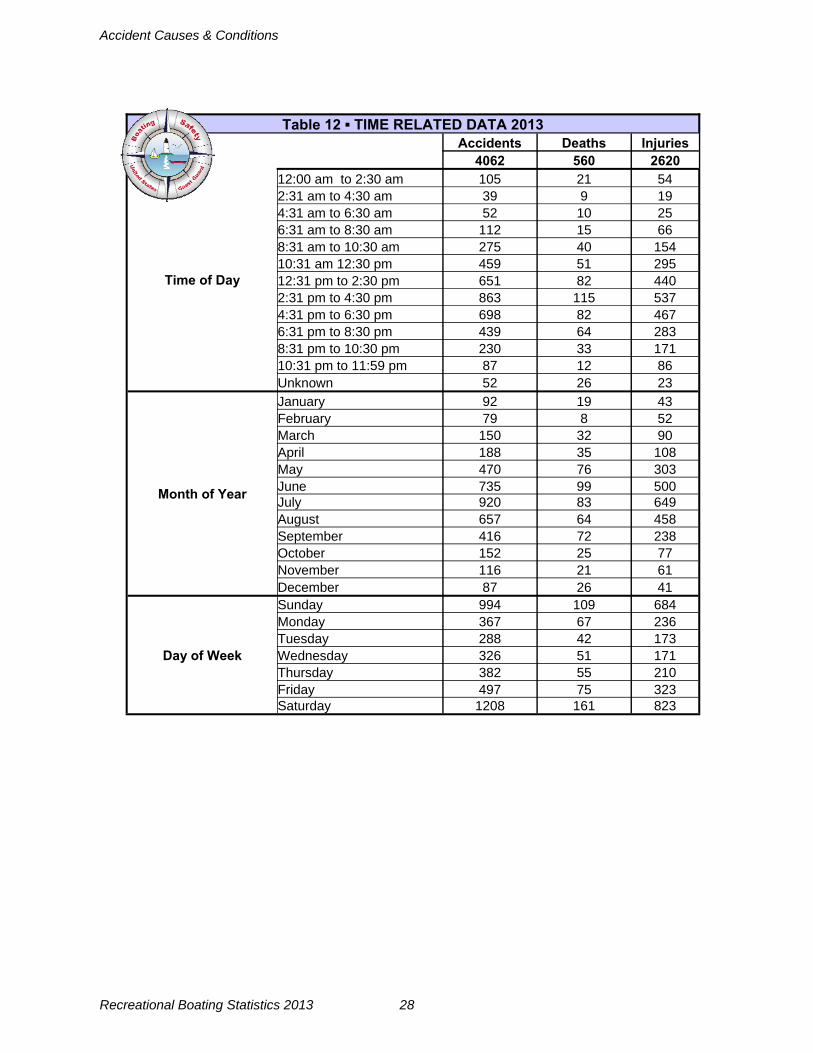
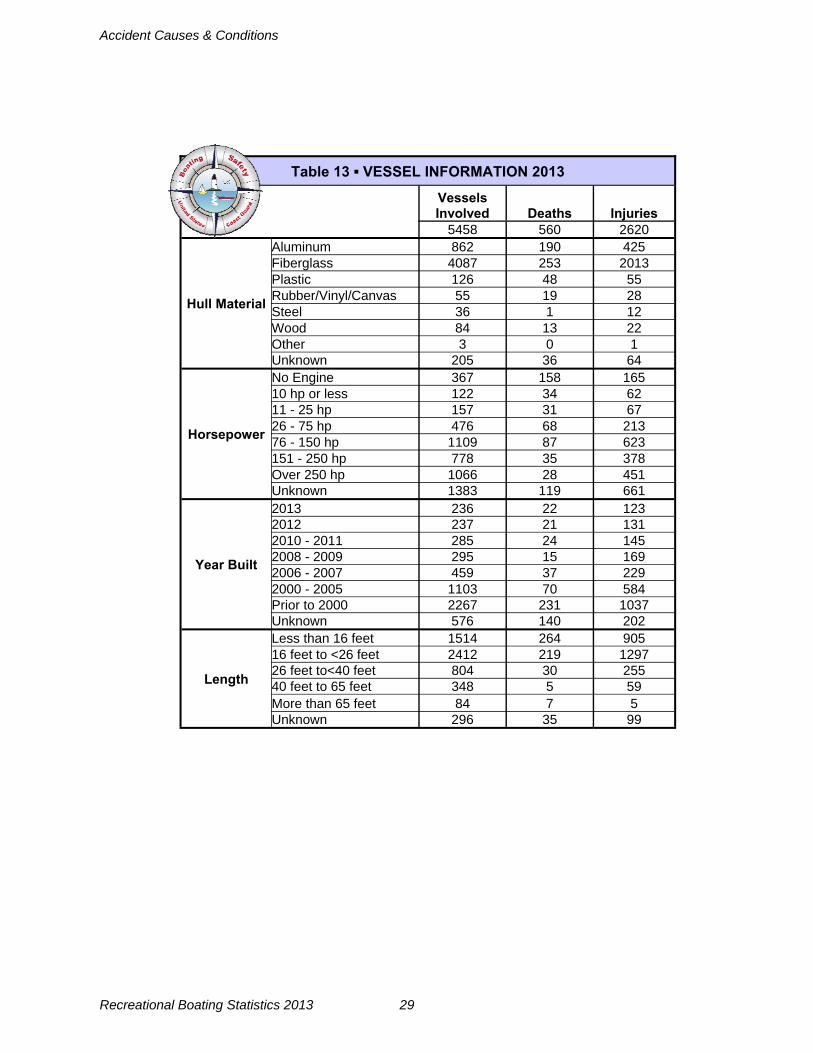
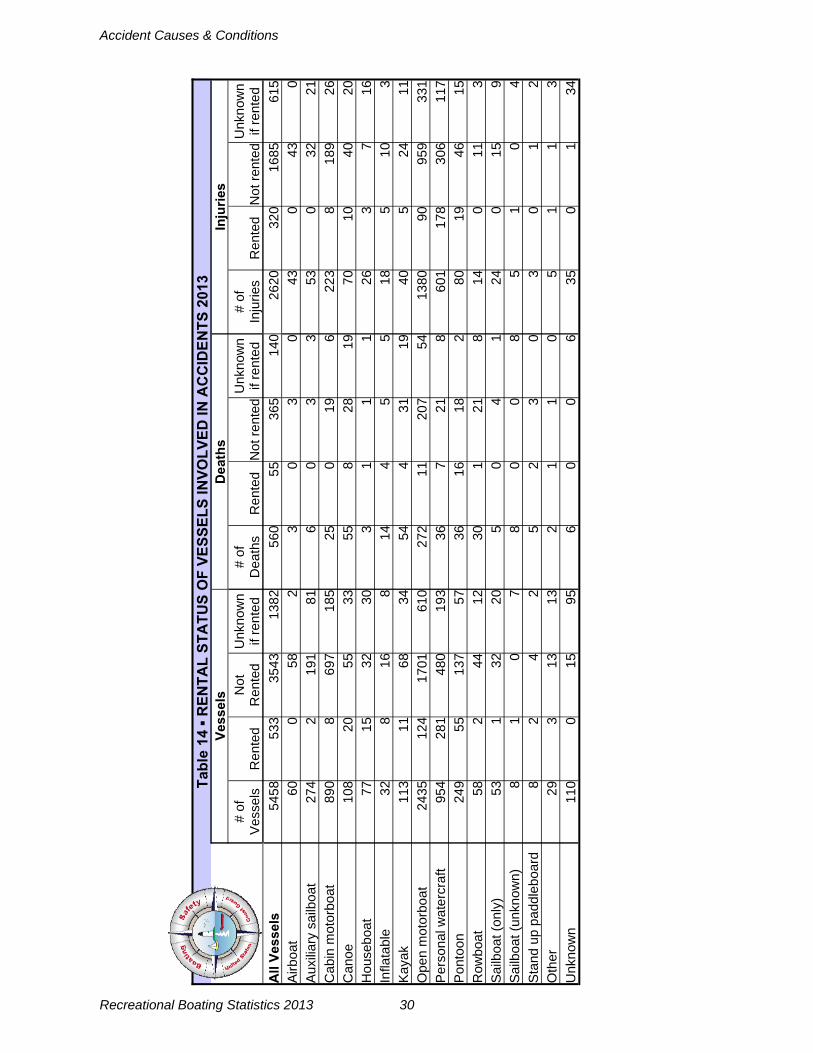
Vessel Operation at the Time of Accident (Table 9, Page 26) This table focuses on the vessel operation at the time of the accident. The table lists information about the number of vessels involved, the resulting number of deaths, and the resulting number of injuries. Vessel Activity at the Time of Accident (Table 10, Page 26) This table examines the vessel and victim activity at the time of the accident. The table provides infor-mation about the number of vessels involved, the resulting number of deaths, and the resulting number of injuries. Weather & Water Conditions (Table 11, Page 27) This table documents some of the environmental characteristics of accidents. It focuses on accidents, deaths and injuries by type of body of water, water conditions, wind level, visibility, and water tempera-ture. Time Related Data (Table 12, Page 28) These three sections independently examine time-related information for accidents, deaths, and injuries. The top section documents the number of accidents, deaths and injuries that occurred during a time frame. The middle section documents the number of accidents, deaths, and injuries that occurred dur-ing a given month. Finally, the bottom section documents the number of accidents, deaths, and injuries that occurred during a given day of the week. Each section examines the national data separately and should not be combined to draw conclusions. For instance, one cannot use them to deduce that the majority of accidents occur from 2:31 pm-4:30 pm in July on the weekends. However, you could deduce that 2:31 pm-4:30 pm was the time frame with the highest number of accidents. Furthermore, the month with the highest number of accidents was July. Finally, the two days of the week with the greatest number of accidents were Saturday and Sunday. Vessel Information (Table 13, Page 29) This table documents some of the characteristics of vessels involved in accidents. It provides informa-tion about the number of accidents, deaths, and injuries by horsepower, year built, length, and hull mate-rial. Rental Status of Vessels Involved in Accidents (Table 14, Page 30) This table examines whether a vessel involved in an accident was rented. It also provides information on whether deaths and injuries occurred on rented vessels. Number & Percent of Deaths by Vessel Length (Figure 6 & Table 15, Page 31) This table focuses on the number of deaths by vessel length. Deaths are categorized into drownings and non-drownings. The table also provides a percentage of all deaths that were caused by drowning.
Accident Causes & Conditions
Recreational Boating Statistics 2013 17
0%
5%
10%
15%
20%
25%
30%
Figure 1 PERCENT OF ACCIDENTS THAT ARE FATAL BY MONTH WITH THE NUMBER OF FATAL ACCIDENTS 2013
Month Fatal
Accidents Non-Fatal Accidents
Total Accidents
Accidents Resulting in
Deaths Total Deaths
January 17 75 92 18% 19
February 8 71 79 10% 8
March 30 120 150 20% 32
April 32 156 188 17% 35
May 65 405 470 14% 76
June 85 650 735 12% 99
July 79 841 920 9% 83
August 62 595 657 9% 64
September 65 351 416 16% 72
October 24 128 152 16% 25
November 20 96 116 17% 21
December 23 64 87 26% 26
Total 510 3552 4062 13% 560
Table 4 ▪ PERCENT OF ACCIDENTS THAT ARE FATAL BY MONTH 2013
17
8
30
32 65
85 79 62
65 24 20
23
Accident Causes & Conditions
Recreational Boating Statistics 2013 18
0% 10% 20% 30% 40% 50%
12:00 AM to 2:30 AM
2:31 AM to 4:30 AM
4:31 AM to 6:30 AM
6:31 AM to 8:30 AM
8:31 AM to 10:30 AM
10:31 AM to 12:30 PM
12:31 PM to 2:30 PM
2:31 PM to 4:30 PM
4:31 PM to 6:30 PM
6:31 PM to 8:30 PM
8:31 PM to 10:30 PM
10:31 PM to 11:59 PM
Unknown
Figure 2 PERCENT OF ACCIDENTS THAT ARE FATAL BY TIME PERIOD WITH THE NUMBER OF FATAL ACCIDENTS 2013
18
8
9
14
35
48
78
106
74
61
30
9
20
Accident Causes & Conditions
Recreational Boating Statistics 2013 19
2264 Accidents 233 Deaths 1637 Injuries
138 Accidents 61 Deaths 62 Injuries
390 Accidents 16 Deaths 110 Injuries
620 Accidents 105 Deaths 388 Injuries
650 Accidents 145 Deaths 423 Injuries
Table 5 ▪ PRIMARY CONTRIBUTING FACTOR OF ACCIDENTS & CASUALTIES 2013
Accidents Deaths Injuries
Operation of Vessel Alcohol use 236 75 187
Drug use 6 2 4
Excessive speed 319 19 289
Failure to ventilate 28 0 24
Improper lookout 396 19 247
Inadequate onboard navigation lights 11 0 9
Navigation rules violation 208 15 161
Operator inattention 567 57 371
Operator inexperience 385 34 262
Restricted vision 48 5 31
Sharp turn 59 7 51
Starting in gear 1 0 1
Loading of Passengers or Gear Improper anchoring 26 5 6
Improper loading 41 15 22
Overloading 35 27 12
People on gunwale, bow or transom 36 14 22
Failure of Boat or Boat Equipment Equipment failure 48 3 14
Hull failure 56 4 15
Machinery failure 286 9 81
Environment Congested waters 16 0 8
Dam/lock 8 3 9
Force of wave/wake 188 7 170
Hazardous waters 182 53 88
Missing/inadequate navigation aids 45 2 21
Weather 181 40 92
Miscellaneous Carbon monoxide exposure 2 0 5
Ignition of fuel or vapor 52 0 52
Sudden medical condition 24 17 6
Other 400 45 310
Unknown 172 83 50
All Categories Combined 4062 560 2620
Accident Causes & Conditions
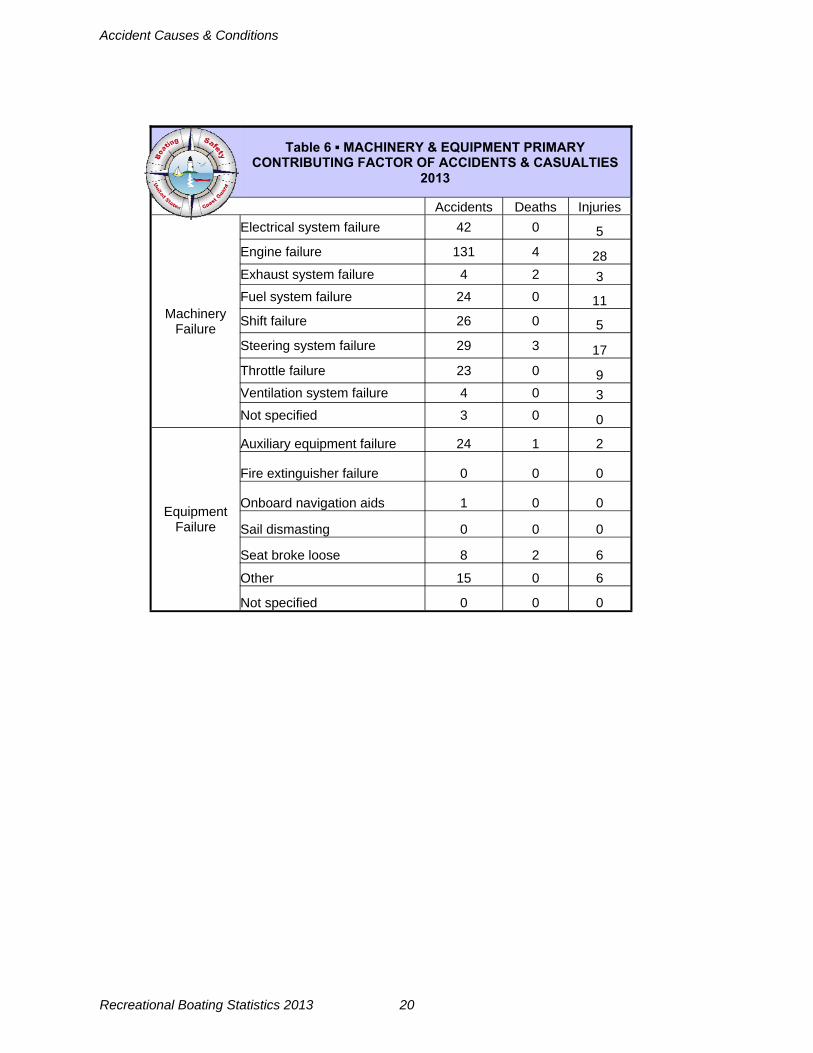
Recreational Boating Statistics 2013 20
Table 6 ▪ MACHINERY & EQUIPMENT PRIMARY CONTRIBUTING FACTOR OF ACCIDENTS & CASUALTIES
2013
Accidents Deaths Injuries
Machinery Failure
Electrical system failure 42 0 5
Engine failure 131 4 28 Exhaust system failure 4 2 3
Fuel system failure 24 0 11
Shift failure 26 0 5
Steering system failure 29 3 17
Throttle failure 23 0 9 Ventilation system failure 4 0 3
Not specified 3 0 0
Equipment Failure
Auxiliary equipment failure 24 1 2
Onboard navigation aids 1 0 0
Sail dismasting 0 0 0
Seat broke loose 8 2 6
Other 15 0 6
Not specified 0 0 0
Fire extinguisher failure 0 0 0
Accident Causes & Conditions
Recreational Boating Statistics 2013 21
0 100 200 300 400 500 600
Operator inattention
Improper lookout
Operator inexperience
Excessive speed
Alcohol use
Navigation rules violation
Sharp turn
Restricted vision
Failure to vent
Inadequate onboard navigation lights
Drug use
Starting in gear
Improper loading
People on gunwale, bow or transom
Overloading
Improper anchoring
Machinery failure
Hull failure
Equipment failure
Force of wave/wake
Hazardous waters
Heavy weather
Missing/inadequate navigation aid
Congested waters
Dam/lock
Other
Unknown
Ignition of fuel or vapor
Sudden medical condition
Carbon monoxide
Op
erat
ion
of
Ves
sel
Load
ing
of
Pas
seng
ers
or G
ear
Fai
lure
of
Bo
at o
r B
oat
E
qui
pm
ent
Env
ironm
ent
Mis
cella
neo
usFigure 3 PRIMARY CONTRIBUTING FACTOR OF ACCIDENTS 2013
Number of Accidents

Accident Causes & Conditions
Recreational Boating Statistics 2013 22
0 10 20 30 40 50 60 70 80 90
Alcohol use
Operator inattention
Operator inexperience
Excessive speed
Improper lookout
Navigation rules violation
Sharp turn
Restricted vision
Drug use
Failure to vent
Inadequate onboard navigation lights
Starting in gear
Overloading
Improper loading
People on gunwale, bow or transom
Improper anchoring
Machinery failure
Hull failure
Equipment failure
Hazardous waters
Heavy weather
Force of wave/wake
Dam/lock
Missing/inadequate navigation aid
Congested waters
Unknown
Other
Sudden medical condition
Carbon monoxide
Ignition of fuel or vapor
Op
erat
ion
of
Ves
sel
Load
ing
of
Pas
seng
ers
or G
ear
Fai
lure
of
Bo
at o
r B
oat
E
qui
pm
ent
Env
ironm
ent
Mis
cella
neo
us
Figure 4 PRIMARY CONTRIBUTING FACTOR OF DEATHS 2013
Number of Deaths
Accident Causes & Conditions
Recreational Boating Statistics 2013 23
0 50 100 150 200 250 300 350 400
Operator inattention
Excessive speed
Operator inexperience
Improper lookout
Alcohol use
Navigation rules violation
Sharp turn
Restricted vision
Failure to vent
Inadequate onboard navigation lights
Drug use
Starting in gear
People on gunwale, bow or transom
Improper loading
Overloading
Improper anchoring
Machinery failure
Hull failure
Equipment failure
Force of wave/wake
Heavy weather
Hazardous waters
Missing/inadequate navigation aid
Dam/lock
Congested waters
Other
Ignition of fuel or vapor
Unknown
Sudden medical condition
Carbon monoxide
Op
erat
ion
of
Ves
sel
Load
ing
of
Pas
seng
ers
or G
ear
Fai
lure
of
Bo
at o
r B
oat
E
qui
pm
ent
Env
ironm
ent
Mis
cella
neo
us
Figure 5 PRIMARY CONTRIBUTING FACTOR OF INJURIES 2013
Number of Injuries
Accident Causes & Conditions
Recreational Boating Statistics 2013 24
Tab
le 7
N
UM
BE
R O
F V
ES
SE
LS
IN A
CC
IDE
NT
S B
Y V
ES
SE
L T
YP
E &
PR
IMA
RY
CO
NT
RIB
UT
ING
FA
CT
OR
201
3
All contributing factors
Alcohol use
Carbon monoxide exposure
Congested waters
Dam/lock
Drug use Equipment failure
Excessive speed
Failure to vent
Force of wave/wake
Hazardous waters
Hull failure
Ignition of fuel or vapor
Improper anchoring
Improper loading
Improper lookout
Inadequate onboard navigation lights
Machinery failure
Missing/inadequate navigation aid
Navigation rules violation
Operator inattention
Operator inexperience
Overloading
People on gunwale, bow or transom
Restricted vision Sharp turn
Starting in gear Sudden medical condition
Weather
Other
Unknown
All
vess
els
5458
311
2
28
8 8
55 4
97 3
1 22
8 20
2 57
71
33
44 6
31 2
2 39
4 45
365
775
552
35
40 7
1 65
1
26 2
25 4
12 2
24
Airb
oat
60
4 0
2 0
0 1
16
0 1
3 1
0 0
1 7
0 3
0 3
3 7
0 0
2 2
0 0
1 3
0
Aux
iliar
y sa
ilboa
t 27
4 8
0 2
0 1
7 7
0 3
11
1 3
6 1
57
1 38
1
12
49
19
0 0
4 1
0 0
17
6 19
Cab
in m
otor
boat
89
0 49
1
6 1
1 15
84
10
31
13
14 3
8 8
2 91
3
138
10
34 1
26
62
2 2
10
4 0
3 38
48
46
Can
oe
108
12
0 0
0 0
0 1
0 2
24
0 0
0 11
4
0 0
0 3
8 15
2
0 0
0 0
3 10
2
11
Hou
sebo
at
77
4 0
3 0
0 2
3 0
1 0
0 3
1 0
3 0
9 1
1 6
10
1 1
0 0
0 0
15
4 9
Infla
tabl
e 32
1
0 0
1 0
0 0
0 0
11
0 0
0 2
0 0
0 0
1 2
9 1
0 0
0 0
0 1
2 1
Kay
ak
113
13
0 0
3 2
0 0
0 2
33
0 0
0 0
4 0
0 0
1 5
21
0 0
0 2
0 3
7 1
16
Ope
n m
otor
boat
24
35 1
46
1 12
3
3 25
207
16
127
71
34 2
4 16
23
272
16 1
58
31 1
11 3
96 1
47 2
5 27
45
31
1 7
105
292
63
Per
sona
l wat
ercr
aft
954
37
0 3
0 0
0 14
1 2
36
10
0 3
1 0
137
0 18
1
160
125
210
0 0
6 20
0
1 5
17
21
Pon
toon
24
9 21
0
0 0
1 3
17
3 9
5 6
0 1
0 29
0
21
1 17
26
30
0
5 1
2 0
3 11
31
6
Row
boat
58
2
0 0
0 0
1 0
0 0
14
1 0
0 2
4 1
1 0
1 6
6 3
3 1
0 0
3 2
2 5
Sai
l (on
ly)
53
2 0
0 0
0 0
1 0
2 3
0 0
0 0
6 1
2 0
1 5
12
0 1
0 1
0 1
10
2 3
Sai
l (un
know
n)
8 0
0 0
0 0
0 0
0 0
3 0
0 0
0 0
0 0
0 0
1 1
0 0
0 0
0 0
1 1
1
Sta
nd u
p pa
ddle
boar
d 8
1 0
0 0
0 0
0 0
0 0
0 0
0 0
0 0
0 0
1 2
0 0
0 0
1 0
2 0
0 1
Oth
er
29
2 0
0 0
0 1
6 0
3 0
0 0
0 2
5 0
1 0
2 2
1 1
0 1
0 0
0 0
0 2
Unk
now
n 11
0 9
0 0
0 0
0 14
0
11
1 0
0 0
0 12
0
5 0
17
13
2 0
1 1
1 0
0 2
1 20
Accident Causes & Conditions
Recreational Boating Statistics 2013 25
Table 8 ▪ ALCOHOL USE AS A CONTRIBUTING FACTOR IN
ACCIDENTS & CASUALTIES BY STATE 2009-2013
Accidents Deaths Injuries
2009 2010 2011 2012 2013 2009 2010 2011 2012 2013 2009 2010 2011 2012 2013 USA 397 395 361 368 305 165 154 149 140 94 422 344 306 313 251 AL 10 12 8 11 7 4 5 6 1 4 9 8 11 13 5 AK 4 1 8 2 2 3 1 8 2 4 2 0 0 0 0 AZ 9 9 7 7 7 1 3 0 3 2 10 10 8 7 9 AR 9 2 7 8 5 4 0 4 2 2 5 2 3 10 3 CA 22 15 13 14 17 11 4 3 6 2 28 17 13 13 15 CO 9 1 3 10 4 3 0 0 4 0 11 0 3 8 5 CT 9 4 1 6 2 5 2 0 4 0 11 1 7 4 1 DE 0 2 0 2 1 0 2 0 1 0 0 0 0 1 2 DC 0 0 0 0 0 0 0 0 0 0 0 0 0 0 0 FL 33 39 25 30 32 17 15 7 9 10 43 27 24 30 22 GA 12 11 16 8 11 3 5 0 4 4 11 6 18 8 7 HI 0 0 0 0 2 0 0 0 0 0 0 0 0 0 2 ID 9 14 7 10 8 4 6 4 2 2 13 11 4 12 8 IL 11 18 18 13 6 3 6 9 5 1 15 18 13 10 3 IN 2 2 7 4 2 0 0 4 0 0 2 0 3 3 2 IA 5 10 2 7 4 2 2 1 7 2 2 6 0 7 0 KS 0 1 3 3 2 0 0 0 1 1 0 0 0 0 1 KY 10 10 4 6 5 3 5 2 2 0 8 10 6 2 6 LA 23 9 6 16 9 17 5 2 6 3 36 13 12 11 12 ME 5 4 6 3 3 2 1 4 1 0 4 7 2 3 2 MD 13 11 12 11 10 6 1 3 4 1 14 10 14 16 5 MA 5 11 5 10 8 4 6 4 5 3 3 3 3 8 6 MI 12 16 11 8 6 9 8 4 1 1 10 11 9 4 4 MN 12 6 8 9 8 4 3 6 3 3 13 2 7 7 5 MS 2 4 4 4 7 2 4 2 1 3 2 1 1 5 5 MO 11 14 9 12 15 3 2 2 2 6 12 11 13 8 20 MT 3 0 1 0 1 1 0 1 0 0 6 0 2 0 0 NE 6 4 4 4 1 2 2 2 1 0 4 4 5 14 2 NV 6 3 4 3 2 1 1 2 0 1 7 2 2 7 1 NH 3 0 2 3 1 1 0 1 2 0 4 0 1 0 4 NJ 4 2 9 6 6 1 2 3 2 0 4 0 2 6 3 NM 2 5 1 3 2 1 6 0 1 0 1 0 0 1 3 NY 11 22 17 16 14 7 4 7 11 6 13 21 19 9 12 NC 13 15 11 11 12 5 6 2 3 4 11 18 8 10 8 ND 2 1 1 2 2 0 1 0 1 1 0 0 0 0 1 OH 9 17 18 10 7 2 8 5 4 1 9 9 21 12 3 OK 3 11 12 8 3 3 5 6 3 3 3 5 6 8 4 OR 5 6 4 1 3 1 1 2 1 3 4 8 1 0 2 PA 6 2 8 9 4 2 1 4 5 1 10 2 2 4 3 RI 2 2 1 1 1 0 2 0 1 0 2 3 0 0 6 SC 5 7 7 14 6 0 4 5 5 4 5 5 3 12 4 SD 5 1 2 1 3 0 0 0 1 0 6 2 1 0 3 TN 15 16 5 6 7 4 8 2 1 3 11 17 6 3 5 TX 17 31 15 21 19 9 8 5 6 5 14 46 8 16 17 UT 1 4 6 1 2 0 1 2 0 1 0 8 5 0 0 VT 1 0 0 0 0 0 0 0 0 0 1 0 0 0 0 VA 7 2 5 3 3 2 1 2 1 0 5 5 10 0 3 WA 11 3 14 14 14 6 1 7 7 5 13 6 11 7 8 WV 3 5 4 1 0 1 3 4 0 0 3 1 2 1 0 WI 18 6 19 14 9 5 3 11 8 2 15 4 17 9 9 WY 2 3 1 2 0 1 0 1 0 0 7 3 0 4 0 GU 0 0 0 0 0 0 0 0 0 0 0 0 0 0 0 PR 0 1 0 0 0 0 0 0 0 0 0 1 0 0 0 VI 0 0 0 0 0 0 0 0 0 0 0 0 0 0 0 AS 0 0 0 0 0 0 0 0 0 0 0 0 0 0 0
CNMI 0 0 0 0 0 0 0 0 0 0 0 0 0 0 0 AT 0 0 0 0 0 0 0 0 0 0 0 0 0 0 0 GL 0 0 0 0 0 0 0 0 0 0 0 0 0 0 0 PC 0 0 0 0 0 0 0 0 0 0 0 0 0 0 0
Accident Causes & Conditions
Recreational Boating Statistics 2013 26
Table 9 ▪ VESSEL OPERATION AT THE TIME OF ACCIDENT 2013
Vessels Involved Deaths Injuries
Totals 5458 560 2620
At anchor 184 23 65
Being towed 39 2 6
Changing direction 548 22 360
Changing speed 475 20 269
Cruising 2232 176 1284
Docking/undocking 212 3 52
Drifting 534 137 241
Launching/loading 51 3 24
Rowing/paddling 203 100 91
Sailing 99 13 37
Tied to dock/moored 622 1 63
Towing 32 1 12
Other 43 4 18
Unknown 111 40 45
Idling 52 6 42
Trolling 21 9 11
Table 10 ▪ VESSEL ACTIVITY AT THE TIME OF ACCIDENT 2013
Vessels Involved Deaths Injuries
Totals 5458 560 2620 Boating/relaxation 3245 262 1635 Commercial 67 0 9 Fishing 656 199 299 Fueling 25 1 29
Hunting 35 12 23
Racing 29 5 16 Repairs 52 5 21 Starting engine 58 1 34 Swimming/snorkeling 66 28 36 Towed watersports 499 20 464 Towing 63 4 15 Whitewater 39 20 13 Other 19 1 13
None; not in operation 532 0 5 Unknown 53 2 6
Government 20 0 2
Accident Causes & Conditions
Recreational Boating Statistics 2013 27
Table 11 ▪ WEATHER AND WATER CONDITIONS 2013
Accidents Deaths Injuries 4062 560 2620
TYPE OF BODY OF WATER
Lakes, Ponds, Reservoirs, Dams, Gravel Pits 1805 265 1280
Rivers, Streams, Creeks, Swamps, Bayous 870 169 574 Bays, Inlets, Marinas, Sounds, Harbors, Channels, Canals, Sloughs, Coves 974 74 560
Ocean/Gulf 297 40 150
Great Lakes (not tributaries) 113 12 52 Unknown 3 0 4
WATER CONDITIONS
Calm (waves less than 6") 2298 253 1538 Choppy (waves 6" to 2') 1108 152 716
Rough (waves 2' to 6') 395 67 209 Very Rough (waves larger than 6') 58 15 35 Unknown 203 73 122
WIND
None 340 38 219 Light (0 - 6 mph) 2231 262 1577 Moderate (7 - 14 mph) 1000 143 585 Strong (15 - 25 mph) 309 55 138 Storm (over 25 mph) 44 18 22 Unknown 138 44 79
VISIBILITY
Poor - Day 58 13 28 Poor - Night 104 16 70 Poor - Unknown if day or night 9 10 10 Fair - Day 168 29 89 Fair - Night 123 22 78
Good - Day 2938 349 1948 Good - Night 338 45 203 Good- Unknown if day or night 126 26 71 Unknown - Day 100 35 58 Unknown - Night 33 7 30 Unknown - Unknown if day or night 45 5 23
WATER TEMPERATURE
39 degrees F and below 29 8 16 40 - 49 degrees F 110 30 79 50 - 59 degrees F 325 70 168 60 - 69 degrees F 688 109 433 70 - 79 degrees F 1383 119 904 80 - 89 degrees F 858 101 593 90 degrees F and above 18 4 12 Unknown 651 119 415
Fair– Unknown if day or night 20 3 12
Accident Causes & Conditions
Recreational Boating Statistics 2013 28
Table 12 ▪ TIME RELATED DATA 2013 Accidents Deaths Injuries
4062 560 2620
Time of Day
12:00 am to 2:30 am 105 21 54 2:31 am to 4:30 am 39 9 19 4:31 am to 6:30 am 52 10 25 6:31 am to 8:30 am 112 15 66 8:31 am to 10:30 am 275 40 154 10:31 am 12:30 pm 459 51 295 12:31 pm to 2:30 pm 651 82 440 2:31 pm to 4:30 pm 863 115 537 4:31 pm to 6:30 pm 698 82 467 6:31 pm to 8:30 pm 439 64 283 8:31 pm to 10:30 pm 230 33 171 10:31 pm to 11:59 pm 87 12 86 Unknown 52 26 23
Month of Year
January 92 19 43 February 79 8 52 March 150 32 90 April 188 35 108 May 470 76 303 June 735 99 500 July 920 83 649 August 657 64 458 September 416 72 238 October 152 25 77 November 116 21 61 December 87 26 41
Day of Week
Sunday 994 109 684 Monday 367 67 236 Tuesday 288 42 173 Wednesday 326 51 171 Thursday 382 55 210 Friday 497 75 323 Saturday 1208 161 823
Accident Causes & Conditions
Recreational Boating Statistics 2013 29
Table 13 ▪ VESSEL INFORMATION 2013
Vessels Involved Deaths Injuries
5458 560 2620
Hull Material
Aluminum 862 190 425 Fiberglass 4087 253 2013 Plastic 126 48 55 Rubber/Vinyl/Canvas 55 19 28 Steel 36 1 12 Wood 84 13 22 Other 3 0 1 Unknown 205 36 64
Horsepower
No Engine 367 158 165 10 hp or less 122 34 62 11 - 25 hp 157 31 67 26 - 75 hp 476 68 213 76 - 150 hp 1109 87 623 151 - 250 hp 778 35 378 Over 250 hp 1066 28 451 Unknown 1383 119 661
Year Built
2013 236 22 123 2012 237 21 131 2010 - 2011 285 24 145 2008 - 2009 295 15 169 2006 - 2007 459 37 229 2000 - 2005 1103 70 584 Prior to 2000 2267 231 1037 Unknown 576 140 202
Length
Less than 16 feet 1514 264 905 16 feet to <26 feet 2412 219 1297 26 feet to<40 feet 804 30 255 40 feet to 65 feet 348 5 59 More than 65 feet 84 7 5 Unknown 296 35 99
Accident Causes & Conditions
Recreational Boating Statistics 2013 30
Tab
le 1
4 ▪
RE
NT
AL
ST
AT
US
OF
VE
SS
EL
S I
NV
OL
VE
D I
N A
CC
IDE
NT
S 2
013
V
esse
ls
Dea
ths
In
juri
es
#
of
Ves
sels
R
ente
d
Not
R
ente
d U
nkno
wn
if re
nted
#
of
Dea
ths
Ren
ted
N
ot r
ente
d U
nkno
wn
if re
nted
#
of
Inju
ries
Ren
ted
N
ot r
ente
d U
nkno
wn
if re
nted
All
Ves
sels
54
58
533
3543
13
82
560
55
365
140
2620
32
0 16
85
615
Airb
oat
60
0 58
2
3 0
3 0
43
0 43
0
Aux
iliar
y sa
ilboa
t 27
4 2
191
81
6 0
3 3
53
0 32
21
Cab
in m
otor
boat
89
0 8
697
185
25
0 19
6
223
8 18
9 26
C
anoe
10
8 20
55
33
55
8
28
19
70
10
40
20
Hou
sebo
at
77
15
32
30
3 1
1 1
26
3 7
16
Infla
tabl
e
32
8 16
8
14
4 5
5 18
5
10
3 K
ayak
11
3 11
68
34
54
4
31
19
40
5 24
11
O
pen
mot
orbo
at
2435
12
4 17
01
610
272
11
207
54
1380
90
95
9 33
1 P
erso
nal w
ater
craf
t 95
4 28
1 48
0 19
3 36
7
21
8 60
1 17
8 30
6 11
7 P
onto
on
249
55
137
57
36
16
18
2 80
19
46
15
Row
boat
58
2
44
12
30
1 21
8
14
0 11
3
Sai
lboa
t (on
ly)
53
1 32
20
5
0 4
1 24
0
15
9 S
ailb
oat (
unkn
own)
8
1 0
7 8
0 0
8 5
1 0
4
Oth
er
29
3 13
13
2
1 1
0 5
1 1
3
Unk
now
n
110
0 15
95
6
0 0
6 35
0
1 34
Sta
nd u
p pa
ddle
boar
d 8
2 4
2 5
2 3
0 3
0 1
2

Accident Causes & Conditions
Recreational Boating Statistics 2013 31
Table 15 ▪ NUMBER & PERCENT OF DEATHS BY VESSEL LENGTH 2013
Length Drownings Deaths by Causes
other than Drowning Total Deaths Percent of Deaths
from Drowning <16' 209 55 264 79% 16-<26' 146 73 219 67% 26-<40' 18 12 30 60% 40-<65' 1 4 5 20% >65' 7 0 7 100% Unknown 17 18 35 49% Total 398 162 560 71%
0
50
100
150
200
250
300
Figure 6 NUMBER OF DEATHS BY VESSEL LENGTH 2013
Deaths by Causes other than Drowning
Drownings

Accident Types
Accident Types
Recreational Boating Statistics 2013 33
Explanation of Accident Types Section
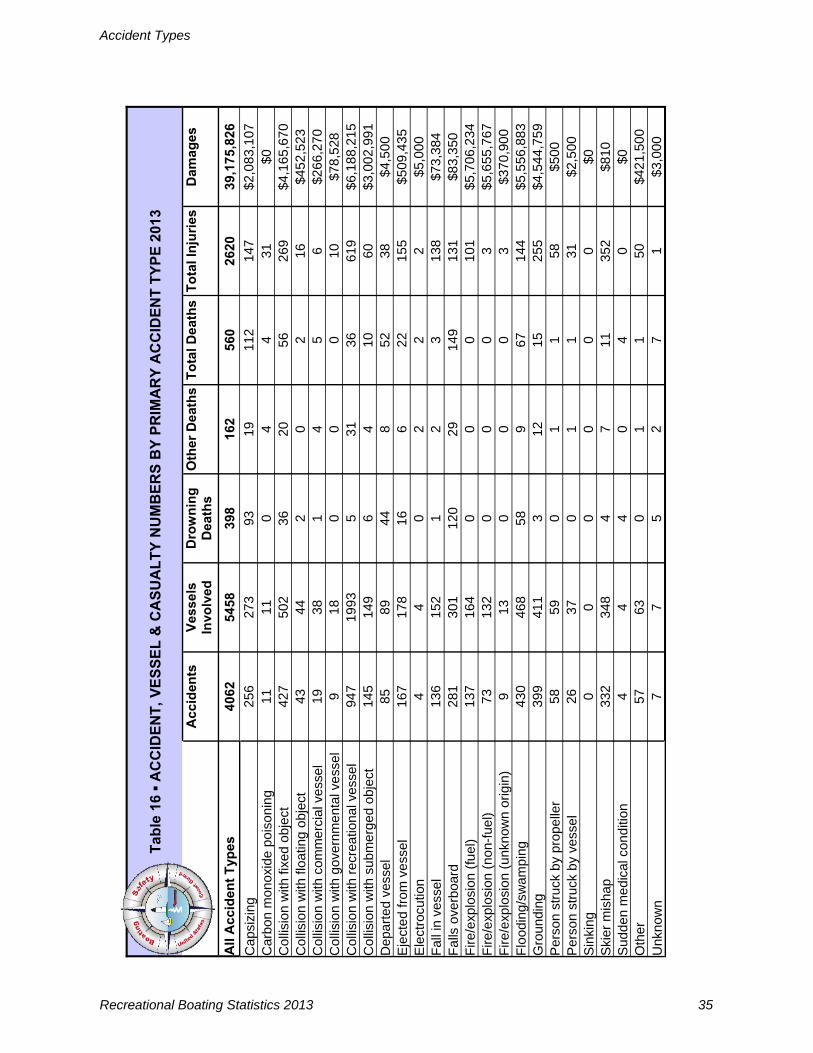
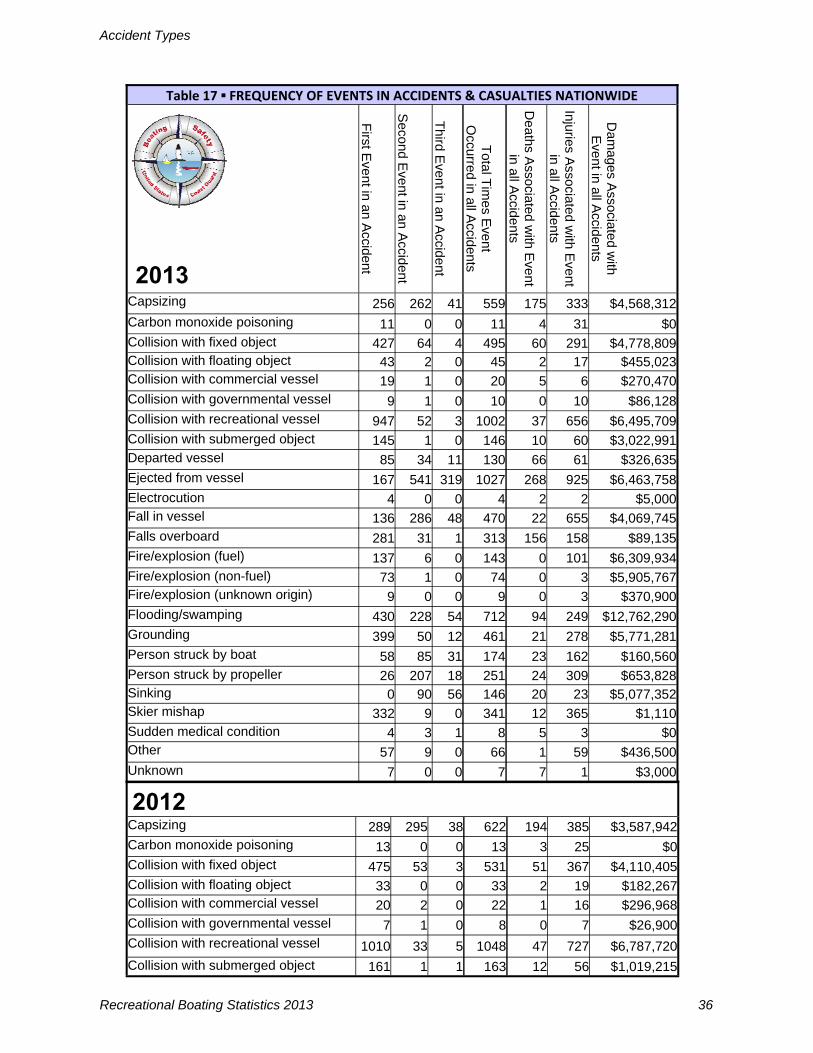
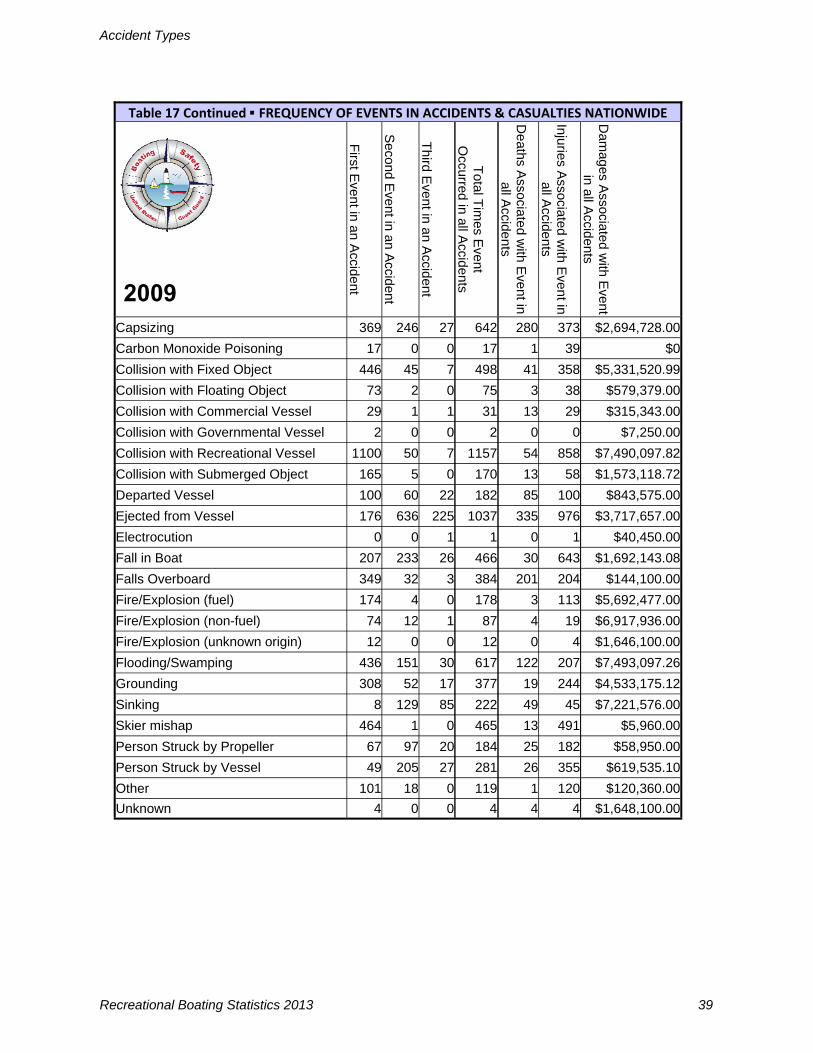
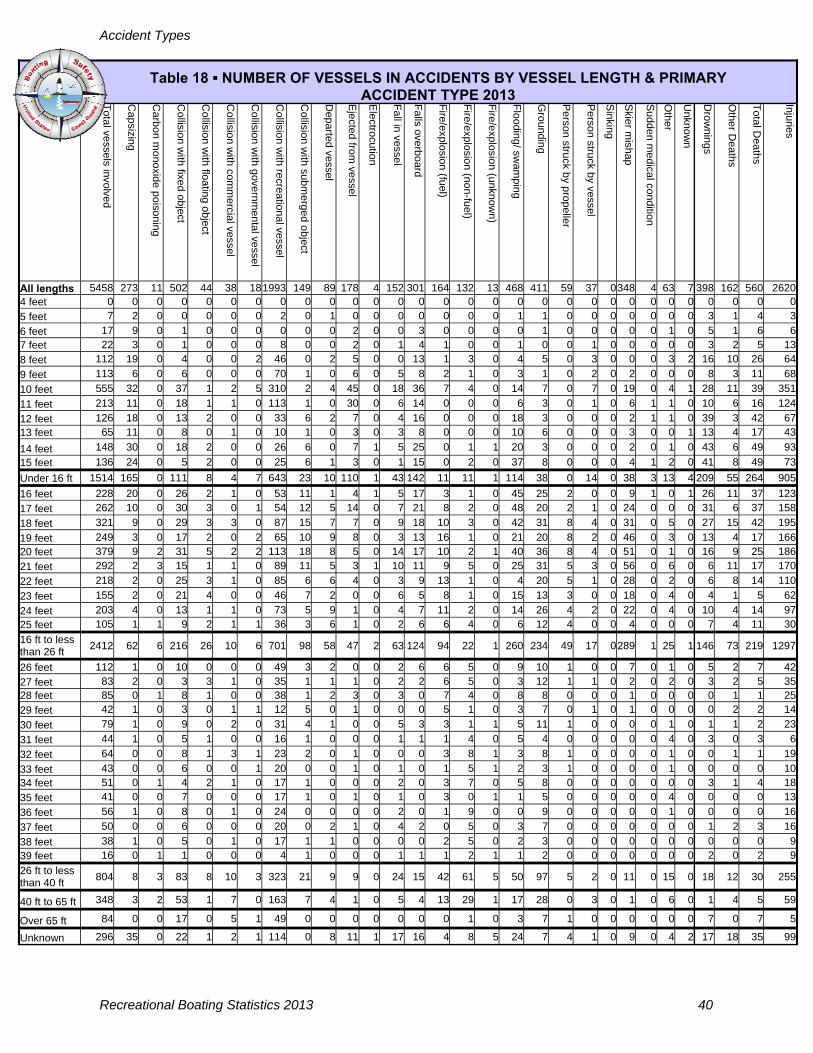
The following section contains six tables that examine data related to the events, called accident types, in accidents. The tables focus on these events and present information by state, vessel type, vessel length, engine type, and propulsion. In the Coast Guard's national database, there are four fields that can be used to define the series of events in an accident. By events, we mean the series of occurrences that passed during an accident. If a wave broke over a vessel causing it to take on water, capsize, and eject its occupant, the Coast Guard would categorize this accident by three events. First, there was a flooding/swamping. Then, there was a capsizing. Third, there was an ejection. With the exception of one table, the tables and figures in this report focus only on the first event in the sequence. The rationale for providing only the first accident type is to keep the tables simplistic; if we added the second, third, and fourth events in the boating sequence, our accident, casualty, and damage totals would not match up because they would be double-counting the accidents, casualties, and dam-ages for cases that had more than one event. Accident, Vessel & Casualty Numbers by Primary Accident Type (Table 16, Page 35) This table focuses on the first event in a boating accident and provides information on the number of accidents, vessels, and casualties attributed to that first event. The deaths section is also separated by the categories drownings and non-drownings. Five-year Summary of Frequency of Events in Accidents & Casualties Nationwide 2009-2013 (Table 17, Pages 36-39) As mentioned in the introductory paragraph, there are four fields that can be used to define the series of events in an accident. This table focuses on the first three events in an accident and the number of casualties associated with each event. The Coast Guard leaves out the fourth because it is not a stan-dardized field. Using the example in the opening paragraphs, the flooding/swamping would fall under the intersection of the column "First Event in an Accident" and the row "Flooding/swamping”. The capsizing would be marked under the column "Second Event in an Accident" and the row "Capsizing". Finally, the ejection would be marked under the column "Third Event in an Accident" and the row "Ejected from Vessel”. This table focuses on the frequency that these events occurred nationally and the total number of deaths that were associated with each accident type. If we turn back to our example and focus on deaths as a result of flooding/swamping, we see that there were 430 accidents where flooding/swamping was the first event in the boating accident. There were 67 deaths associated with this first event type. However, there were other accidents that involved a flooding/swamping as a second or third occurrence. There were 228 accidents and 16 deaths associated with flooding/swamping as a second event and 54 acci-dents and 11 deaths associated with flooding/swamping as a third event. All combined, you get the sixth column of the table that looks at how many deaths were associated with an event that occurred either as the first, second, or third occurrence in an accident. Please note that in this table deaths are not separated by first, second and third event. In the example, there were 712 accidents and 94 deaths associated with flooding/swamping as a first, second or third event. This table can be difficult to understand, especially when the reader is under the expectation that the tallies of the casualty columns will equal the numbers published at the front of this report that reference the number of reportable accidents and deaths. Number of Vessels in Accidents by Vessel Length & Primary Accident Type (Table 18, Page 40) This table displays the types of accidents by the length of vessel. The table lists vessel length by foot for vessels of lengths 4 ft-39 ft. After 39 ft, information is categorized in ranges. This table also provides information about the number of casualties and vessels associated by length of vessel.

Accident Types
Recreational Boating Statistics 2013 34
Number of Vessels in Accidents by Vessel Type & Primary Accident Type (Table 19, Page 41) This table examines the first event of a boating accident for all vessels involved in an accident. It also provides information about the casualties associated with each vessel type. Number of Vessels in Accidents by Primary Accident Type & Propulsion Type (Table 20, Page 42) This table provides information about the number of vessels involved in accidents by primary accident type and propulsion. Number of Vessels in Accidents by Primary Accident Type & Engine Type (Table 21, Page 42) This table provides information about the number of casualties and vessels associated by engine and primary accident type. This table focuses on vessels propelled by a propeller.
Accident Types
Recreational Boating Statistics 2013 35
Acc
iden
ts
Ves
sels
In
volv
ed
Dro
wn
ing
D
eath
s O
ther
Dea
ths
To
tal D
eath
s T
ota
l In
juri
es
Dam
ages
All
Acc
iden
t T
ypes
40
62
5458
39
8 16
2 56
0 26
20
39,1
75,8
26
Cap
sizi
ng
256
273
93
19
112
147
$2,0
83,1
07
Car
bon
mon
oxid
e po
ison
ing
11
11
0 4
4 31
$0
C
ollis
ion
with
fixe
d ob
ject
42
7 50
2 36
20
56
26
9 $4
,165
,670
C
ollis
ion
with
floa
ting
obje
ct
43
44
2 0
2 16
$4
52,5
23
Col
lisio
n w
ith c
omm
erci
al v
esse
l 19
38
1
4 5
6 $2
66,2
70
Col
lisio
n w
ith g
over
nmen
tal v
esse
l 9
18
0 0
0 10
$7
8,52
8 C
ollis
ion
with
rec
reat
iona
l ves
sel
947
1993
5
31
36
619
$6,1
88,2
15
Col
lisio
n w
ith s
ubm
erge
d ob
ject
14
5 14
9 6
4 10
60
$3
,002
,991
D
epar
ted
vess
el
85
89
44
8 52
38
$4
,500
E
ject
ed fr
om v
esse
l 16
7 17
8 16
6
22
155
$509
,435
E
lect
rocu
tion
4 4
0 2
2 2
$5,0
00
Fal
l in
vess
el
136
152
1 2
3 13
8 $7
3,38
4 F
alls
ove
rboa
rd
281
301
120
29
149
131
$83,
350
Fire
/exp
losi
on (
fuel
) 13
7 16
4 0
0 0
101
$5,7
06,2
34
Fire
/exp
losi
on (
non-
fuel
) 73
13
2 0
0 0
3 $5
,655
,767
F
ire/e
xplo
sion
(un
know
n or
igin
) 9
13
0 0
0 3
$370
,900
F
lood
ing/
swam
ping
43
0 46
8 58
9
67
144
$5,5
56,8
83
Gro
undi
ng
399
411
3 12
15
25
5 $4
,544
,759
P
erso
n st
ruck
by
prop
elle
r 58
59
0
1 1
58
$500
P
erso
n st
ruck
by
vess
el
26
37
0 1
1 31
$2
,500
S
inki
ng
0 0
0 0
0 0
$0
Sud
den
med
ical
con
ditio
n 4
4 4
0 4
0 $0
O
ther
57
63
0
1 1
50
$421
,500
U
nkno
wn
7 7
5 2
7 1
$3,0
00
Tab
le 1
6 ▪
AC
CID
EN
T,
VE
SS
EL
& C
AS
UA
LT
Y N
UM
BE
RS
BY
PR
IMA
RY
AC
CID
EN
T T
YP
E 2
013
Ski
er m
isha
p
332
348
4 7
11
352
$810
Accident Types
Recreational Boating Statistics 2013 36
Table 17 ▪ FREQUENCY OF EVENTS IN ACCIDENTS & CASUALTIES NATIONWIDE
First E
vent in an Accident
Second E
vent in an Accident
Third E
vent in an Accident
Total T
imes E
vent O
ccurred in all Accidents
Deaths A
ssociated with E
vent in all A
ccidents
Injuries Associated w
ith Event
in all Accidents
Dam
ages Associated w
ith E
vent in all Accidents
Capsizing 256 262 41 559 175 333 $4,568,312 Carbon monoxide poisoning 11 0 0 11 4 31 $0 Collision with fixed object 427 64 4 495 60 291 $4,778,809 Collision with floating object 43 2 0 45 2 17 $455,023 Collision with commercial vessel 19 1 0 20 5 6 $270,470 Collision with governmental vessel 9 1 0 10 0 10 $86,128 Collision with recreational vessel 947 52 3 1002 37 656 $6,495,709 Collision with submerged object 145 1 0 146 10 60 $3,022,991 Departed vessel 85 34 11 130 66 61 $326,635 Ejected from vessel 167 541 319 1027 268 925 $6,463,758 Electrocution 4 0 0 4 2 2 $5,000 Fall in vessel 136 286 48 470 22 655 $4,069,745 Falls overboard 281 31 1 313 156 158 $89,135 Fire/explosion (fuel) 137 6 0 143 0 101 $6,309,934 Fire/explosion (non-fuel) 73 1 0 74 0 3 $5,905,767 Fire/explosion (unknown origin) 9 0 0 9 0 3 $370,900 Flooding/swamping 430 228 54 712 94 249 $12,762,290 Grounding 399 50 12 461 21 278 $5,771,281 Person struck by boat 58 85 31 174 23 162 $160,560 Person struck by propeller 26 207 18 251 24 309 $653,828 Sinking 0 90 56 146 20 23 $5,077,352 Skier mishap 332 9 0 341 12 365 $1,110
Other 57 9 0 66 1 59 $436,500 Unknown 7 0 0 7 7 1 $3,000
Sudden medical condition 4 3 1 8 5 3 $0
2013
2012
Capsizing 289 295 38 622 194 385 $3,587,942 Carbon monoxide poisoning 13 0 0 13 3 25 $0 Collision with fixed object 475 53 3 531 51 367 $4,110,405 Collision with floating object 33 0 0 33 2 19 $182,267 Collision with commercial vessel 20 2 0 22 1 16 $296,968 Collision with governmental vessel 7 1 0 8 0 7 $26,900 Collision with recreational vessel 1010 33 5 1048 47 727 $6,787,720
Collision with submerged object 161 1 1 163 12 56 $1,019,215

Accident Types
Recreational Boating Statistics 2013 37
Table 17 Continued ▪ FREQUENCY OF EVENTS IN ACCIDENTS & CASUALTIES NATIONWIDE
First E
vent in an Accident
Second E
vent in an Accident
Third E
vent in an Accident
Total T
imes E
vent O
ccurred in all Accidents
Deaths A
ssociated with E
vent in all A
ccidents
Injuries Associated w
ith Event
in all Accidents
Dam
ages Associated w
ith E
vent in all Accidents
Fall in vessel 190 295 61 546 34 776 $2,588,780 Falls overboard 331 28 1 360 210 183 $201,491 Fire/explosion (fuel) 157 9 1 167 5 99 $2,979,827 Fire/explosion (non-fuel) 96 3 0 99 0 7 $9,929,520 Fire/explosion (unknown origin) 11 0 0 11 2 0 $940,500 Flooding/swamping 509 220 50 779 101 301 $11,888,553 Grounding 422 58 16 496 26 286 $7,811,552 Person struck by boat 37 215 18 270 30 319 $741,967 Person struck by propeller 55 99 27 181 19 187 $125,099 Sinking 0 130 61 191 28 64 $5,622,918 Skier mishap 387 19 0 406 20 414 $6,773 Sudden medical condition 2 0 0 2 1 1 $0 Other 53 4 0 57 4 48 $71,775
Ejected from vessel 151 618 316 1085 269 1018 $5,120,544 Electrocution 1 0 0 1 2 6 $0
Departed vessel 104 40 5 149 96 77 $113,749
Unknown 1 0 0 1 1 0 $0
2011
Capsizing 316 271 41 628 249 381 $3,131,990
Collision with Fixed Object 460 47 6 513 59 406 $4,928,304 Collision with Floating Object 42 0 1 43 4 15 $579,330 Collision with Commercial Vessel 25 1 0 26 1 23 $575,665
Collision with Recreational Vessel 1002 48 4 1054 41 691 $6,575,400 Collision with Submerged Object 196 2 0 198 19 71 $2,134,076 Departure from Vessel 115 38 4 157 97 69 $71,515 Ejected from Vessel 222 597 308 1127 354 1072 $4,593,528 Electrocution 2 0 0 2 0 2 $0 Fall in Vessel 196 274 51 521 40 735 $3,164,234 Falls Overboard 359 30 1 390 213 182 $147,764 Fire/Explosion (fuel) 135 2 0 137 5 99 $3,349,516 Fire/Explosion (non-fuel) 72 1 0 73 1 8 $24,142,289 Fire/Explosion (unknown origin) 11 0 0 11 1 2 $1,059,368 Flooding/Swamping 501 185 29 715 111 246 $11,118,756
Carbon Monoxide Poisoning 7 0 0 7 3 14 $0
Collision with Governmental Vessel 4 1 0 5 1 3 $13,000
2012 continued

Accident Types
Recreational Boating Statistics 2013 38
2010
Table 17 Continued ▪ FREQUENCY OF EVENTS IN ACCIDENTS & CASUALTIES NATIONWIDE
First E
vent in an Accident
Second E
vent in an Accident
Third E
vent in an Accident
Total T
imes E
vent O
ccurred in all Accidents
Deaths A
ssociated with E
vent in all A
ccidents
Injuries Associated w
ith Event
in all Accidents
Dam
ages Associated w
ith E
vent in all Accidents
Capsizing 335 225 27 587 238 346 $3,125,976
Carbon Monoxide Poisoning 12 2 0 14 6 24 $15,750 Collision with Fixed Object 456 42 3 501 40 346 $4,275,598 Collision with Floating Object 52 0 0 52 8 27 $438,259 Collision with Commercial Vessel 29 2 0 31 8 22 $653,226 Collision with Governmental Vessel 8 1 0 9 0 4 $46,567 Collision with Recreational Vessel 1088 43 1 1132 68 769 $7,550,040 Collision with Submerged Object 169 1 0 170 8 43 $2,179,935 Departure from Vessel 100 39 3 142 85 65 $483,635 Ejected from Vessel 240 594 270 1104 310 1018 $6,046,912 Electrocution 4 0 1 5 2 8 $0 Fall in Vessel 207 341 45 593 29 866 $3,203,432 Falls Overboard 291 13 1 305 165 154 $139,335 Fire/Explosion (fuel) 159 2 0 161 2 92 $4,587,022 Fire/Explosion (non-fuel) 81 2 1 84 0 12 $6,428,251 Fire/Explosion (unknown origin) 6 0 0 6 0 0 $749,079 Flooding 448 155 31 634 94 236 $9,961,999 Grounding 309 47 15 371 20 236 $4,184,050 Person Struck by Propeller 49 114 16 179 27 178 $109,985 Person Struck by Vessel 31 221 19 271 32 325 $700,418 Sinking 2 108 40 150 28 45 $4,563,582 Skier Mishap 447 4 0 451 16 476 $42,045 Other 80 7 1 88 8 79 $90,125
Grounding 338 36 16 390 24 224 $5,301,218
Person Struck by Propeller 57 124 16 197 35 192 $91,412
Person Struck by Vessel 36 226 21 283 35 342 $545,642
Sinking 0 122 46 168 34 51 $4,079,266
Skier Mishap 436 4 0 440 14 461 $8,700
Sudden Medical Condition 2 0 0 2 1 1 0
Other 53 4 0 57 1 52 $64,350
Unknown 1 0 0 1 0 1 $0
Unknown 1 0 0 1 0 0 $0
2011 continued
Accident Types
Recreational Boating Statistics 2013 39
Table 17 Continued ▪ FREQUENCY OF EVENTS IN ACCIDENTS & CASUALTIES NATIONWIDE
First E
vent in an Accident
Second E
vent in an Accident
Third E
vent in an Accident
Total T
imes E
vent O
ccurred in all Accidents
Deaths A
ssociated with E
vent in all A
ccidents
Injuries Associated w
ith Event in
all Accidents
Dam
ages Associated w
ith Event
in all Accidents
Capsizing 369 246 27 642 280 373 $2,694,728.00
Carbon Monoxide Poisoning 17 0 0 17 1 39 $0
Collision with Fixed Object 446 45 7 498 41 358 $5,331,520.99
Collision with Floating Object 73 2 0 75 3 38 $579,379.00
Collision with Commercial Vessel 29 1 1 31 13 29 $315,343.00
Collision with Governmental Vessel 2 0 0 2 0 0 $7,250.00
Collision with Recreational Vessel 1100 50 7 1157 54 858 $7,490,097.82
Collision with Submerged Object 165 5 0 170 13 58 $1,573,118.72
Departed Vessel 100 60 22 182 85 100 $843,575.00
Ejected from Vessel 176 636 225 1037 335 976 $3,717,657.00
Electrocution 0 0 1 1 0 1 $40,450.00
Fall in Boat 207 233 26 466 30 643 $1,692,143.08
Falls Overboard 349 32 3 384 201 204 $144,100.00
Fire/Explosion (fuel) 174 4 0 178 3 113 $5,692,477.00
Fire/Explosion (non-fuel) 74 12 1 87 4 19 $6,917,936.00
Fire/Explosion (unknown origin) 12 0 0 12 0 4 $1,646,100.00
Flooding/Swamping 436 151 30 617 122 207 $7,493,097.26
Grounding 308 52 17 377 19 244 $4,533,175.12
Sinking 8 129 85 222 49 45 $7,221,576.00
Skier mishap 464 1 0 465 13 491 $5,960.00
Person Struck by Propeller 67 97 20 184 25 182 $58,950.00
Person Struck by Vessel 49 205 27 281 26 355 $619,535.10
Other 101 18 0 119 1 120 $120,360.00
Unknown 4 0 0 4 4 4 $1,648,100.00
2009
Accident Types
Recreational Boating Statistics 2013 40
Table 18 ▪ NUMBER OF VESSELS IN ACCIDENTS BY VESSEL LENGTH & PRIMARY
ACCIDENT TYPE 2013
Total vessels involved
Capsizing
Carbon m
onoxide poisoning
Collision w
ith fixed object
Collision w
ith floating object
Collision w
ith comm
ercial vessel
Collision w
ith governmental vessel
Collision w
ith recreational vessel
Departed
vessel
Ejected from
vessel
Electrocution
Fall in
vesse
l
Falls overboard
Fire/e
xplo
sion
(fue
l)
Fire/explosion (n
on-fuel)
Fire/explosion (u
nknown)
Flooding/ sw
amp
ing
Grou
nding
Person struck b
y propeller
Pe
rson
struck by ve
ssel
Sinking
Skier m
ishap
Other
Unkno
wn
Dro
wnings
Other D
eaths
Total D
eaths
Injuries
All lengths 5458 273 11 502 44 38 18 1993 89 178 4 152 301 164 132 13 468 411 59 37 0 348 63 7 398 162 560 2620 4 feet 0 0 0 0 0 0 0 0 0 0 0 0 0 0 0 0 0 0 0 0 0 0 0 0 0 0 0 0
5 feet 7 2 0 0 0 0 0 2 1 0 0 0 0 0 0 0 1 1 0 0 0 0 0 0 3 1 4 3
6 feet 17 9 0 1 0 0 0 0 0 2 0 0 3 0 0 0 0 1 0 0 0 0 1 0 5 1 6 6 7 feet 22 3 0 1 0 0 0 8 0 2 0 1 4 1 0 0 1 0 0 1 0 0 0 0 3 2 5 13
8 feet 112 19 0 4 0 0 2 46 2 5 0 0 13 1 3 0 4 5 0 3 0 0 3 2 16 10 26 64
9 feet 113 6 0 6 0 0 0 70 0 6 0 5 8 2 1 0 3 1 0 2 0 2 0 0 8 3 11 68
10 feet 555 32 0 37 1 2 5 310 4 45 0 18 36 7 4 0 14 7 0 7 0 19 4 1 28 11 39 351
11 feet 213 11 0 18 1 1 0 113 0 30 0 6 14 0 0 0 6 3 0 1 0 6 1 0 10 6 16 124
12 feet 126 18 0 13 2 0 0 33 2 7 0 4 16 0 0 0 18 3 0 0 0 2 1 0 39 3 42 67 13 feet 65 11 0 8 0 1 0 10 0 3 0 3 8 0 0 0 10 6 0 0 0 3 0 1 13 4 17 43
14 feet 148 30 0 18 2 0 0 26 0 7 1 5 25 0 1 1 20 3 0 0 0 2 1 0 43 6 49 93
15 feet 136 24 0 5 2 0 0 25 1 3 0 1 15 0 2 0 37 8 0 0 0 4 2 0 41 8 49 73
Under 16 ft 1514 165 0 111 8 4 7 643 10 110 1 43 142 11 11 1 114 38 0 14 0 38 13 4 209 55 264 905
16 feet 228 20 0 26 2 1 0 53 1 4 1 5 17 3 1 0 45 25 2 0 0 9 0 1 26 11 37 123
17 feet 262 10 0 30 3 0 1 54 5 14 0 7 21 8 2 0 48 20 2 1 0 24 0 0 31 6 37 158
18 feet 321 9 0 29 3 3 0 87 7 7 0 9 18 10 3 0 42 31 8 4 0 31 5 0 27 15 42 195
19 feet 249 3 0 17 2 0 2 65 9 8 0 3 13 16 1 0 21 20 8 2 0 46 3 0 13 4 17 166 20 feet 379 9 2 31 5 2 2 113 8 5 0 14 17 10 2 1 40 36 8 4 0 51 1 0 16 9 25 186
21 feet 292 2 3 15 1 1 0 89 5 3 1 10 11 9 5 0 25 31 5 3 0 56 6 0 6 11 17 170
22 feet 218 2 0 25 3 1 0 85 6 4 0 3 9 13 1 0 4 20 5 1 0 28 2 0 6 8 14 110
23 feet 155 2 0 21 4 0 0 46 2 0 0 6 5 8 1 0 15 13 3 0 0 18 4 0 4 1 5 62
24 feet 203 4 0 13 1 1 0 73 9 1 0 4 7 11 2 0 14 26 4 2 0 22 4 0 10 4 14 97 25 feet 105 1 1 9 2 1 1 36 6 1 0 2 6 6 4 0 6 12 4 0 0 4 0 0 7 4 11 30
16 ft to less than 26 ft
2412 62 6 216 26 10 6 701 58 47 2 63 124 94 22 1 260 234 49 17 0 289 25 1 146 73 219 1297
26 feet 112 1 0 10 0 0 0 49 2 0 0 2 6 6 5 0 9 10 1 0 0 7 1 0 5 2 7 42
27 feet 83 2 0 3 3 1 0 35 1 1 0 2 2 6 5 0 3 12 1 1 0 2 2 0 3 2 5 35 28 feet 85 0 1 8 1 0 0 38 2 3 0 3 0 7 4 0 8 8 0 0 0 1 0 0 0 1 1 25
29 feet 42 1 0 3 0 1 1 12 0 1 0 0 0 5 1 0 3 7 0 1 0 1 0 0 0 2 2 14
30 feet 79 1 0 9 0 2 0 31 1 0 0 5 3 3 1 1 5 11 1 0 0 0 1 0 1 1 2 23
31 feet 44 1 0 5 1 0 0 16 0 0 0 1 1 1 4 0 5 4 0 0 0 0 4 0 3 0 3 6
32 feet 64 0 0 8 1 3 1 23 0 1 0 0 0 3 8 1 3 8 1 0 0 0 1 0 0 1 1 19
33 feet 43 0 0 6 0 0 1 20 0 1 0 1 0 1 5 1 2 3 1 0 0 0 1 0 0 0 0 10 34 feet 51 0 1 4 2 1 0 17 0 0 0 2 0 3 7 0 5 8 0 0 0 0 0 0 3 1 4 18
35 feet 41 0 0 7 0 0 0 17 0 1 0 1 0 3 0 1 1 5 0 0 0 0 4 0 0 0 0 13
36 feet 56 1 0 8 0 1 0 24 0 0 0 2 0 1 9 0 0 9 0 0 0 0 1 0 0 0 0 16
37 feet 50 0 0 6 0 0 0 20 2 1 0 4 2 0 5 0 3 7 0 0 0 0 0 0 1 2 3 16
38 feet 38 1 0 5 0 1 0 17 1 0 0 0 0 2 5 0 2 3 0 0 0 0 0 0 0 0 0 9 39 feet 16 0 1 1 0 0 0 4 0 0 0 1 1 1 2 1 1 2 0 0 0 0 0 0 2 0 2 9
26 ft to less than 40 ft
804 8 3 83 8 10 3 323 9 9 0 24 15 42 61 5 50 97 5 2 0 11 15 0 18 12 30 255
40 ft to 65 ft 348 3 2 53 1 7 0 163 4 1 0 5 4 13 29 1 17 28 0 3 0 1 6 0 1 4 5 59
Over 65 ft 84 0 0 17 0 5 1 49 0 0 0 0 0 0 1 0 3 7 1 0 0 0 0 0 7 0 7 5
Unknown 296 35 0 22 1 2 1 114 8 11 1 17 16 4 8 5 24 7 4 1 0 9 4 2 17 18 35 99
Collision w
ith submerged o
bject
149 0 0 0 0 0 1 2 1 6 1
6
6
23
11 12 15 10 18 11
6 7 5 3
98
3 1 1 5 4 1 2 0 1 1 0 0 1 1
21
7
0
0
Sudden m
edical condition
4 0 0 0 0 0 0 0 1 1 0
0
1
3
1 0 0 0 0 0 0 0 0 0
1
0 0 0 0 0 0 0 0 0 0 0 0 0 0
0
0
0
0

Accident Types
Recreational Boating Statistics 2013 41
Tab
le 1
9 ▪
NU
MB
ER
OF
VE
SS
EL
S IN
AC
CID
EN
TS
BY
VE
SS
EL
TY
PE
& P
RIM
AR
Y A
CC
IDE
NT
TY
PE
WIT
H
NU
MB
ER
OF
CA
SU
AL
TIE
S B
Y C
AS
UA
LT
Y T
YP
E &
VE
SS
EL
TY
PE
201
3
All accident types
Capsizing
Carbon monoxide exposure
Collision with fixed object
Collision with floating object
Collision with commercial vessel
Collision with governmental vessel
Collision with recreational vessel
Collision with submerged object
Departed vessel
Ejected from vessel
Electrocution
Fall in vessel
Falls overboard
Fire/explosion (fuel)
Fire/explosion (non-fuel)
Fire/explosion (unknown origin)
Flooding/swamping
Grounding
Person struck by propeller
Person struck by vessel
Sinking
Skier mishap
Other Unknown
Drownings
Deaths by causes other than drowning
Total deaths
Injuries
All
vess
els
5458
27
3 11
502
44
38
18
199
3 14
9 89
178
4
152
301
164
132
13
468
411
59
37
0 34
8 63
7
398
162
560
2620
Airb
oat
60
1 0
8 0
2 0
19
4 0
0 0
2 1
0 0
0 13
9
0 0
0 0
1 0
3 0
3 43
Aux
iliar
y sa
ilboa
t 27
4 5
0 32
1
3 0
139
1 0
1 0
5 8
4 5
4 7
49
0 1
0 0
9 0
3 3
6 53
Cab
in m
otor
boat
89
0 10
3
104
10
13
2 34
8 29
8
7 0
24
11
58
76
3 64
90
5
2 0
13
10
0 17
8
25
223
Can
oe
108
63
0 15
1
0 0
6 0
2 1
1 0
5 0
0 0
13
1 0
0 0
0 0
0 48
7
55
70
Hou
sebo
at
77
0 2
6 0
0 1
37
1 3
0 0
2 2
2 11
0
6 2
0 0
0 0
2 0
1 2
3 26
Infla
tabl
e 32
13
0
6 0
0 0
0 0
1 1
0 1
6 0
0 0
0 2
0 1
0 0
1 0
10
4 14
18
Kay
ak
113
55
0 14
1
0 0
8 1
2 5
0 0
17
0 0
0 4
0 0
0 0
0 2
3 45
9
54
40
Ope
n m
otor
boat
24
35
70
6 21
1 26
11
8
665
104
40
66
3 74
142
74
22
1
318
220
47
16
0 28
3 24
2
189
83 2
72 1
380
Per
sona
l wat
ercr
aft
954
16
0 59
2
3 7
573
3 7
92
0 33
54
12
9
0 11
18
0
13
0 33
7
2 13
23
36
60
1
Pon
toon
24
9 4
0 23
1
0 0
104
5 24
1
0 2
26
14
3 0
9 8
4 3
0 17
1
0 27
9
36
80
Row
boat
58
11
0
11
2 0
0 8
0 1
1 0
0 11
0
1 0
7 3
0 0
0 0
1 0
26
4 30
14
Sai
lboa
t (on
ly)
53
9 0
3 0
0 0
23
1 0
0 0
0 6
0 1
0 2
5 0
0 0
0 3
0 2
3 5
24
Sai
lboa
t (un
know
n)
8 0
0 0
0 0
0 0
0 1
0 0
0 2
0 0
0 3
1 0
0 0
0 1
0 7
1 8
5
Oth
er
29
2 0
5 0
5 0
12
0 0
0 0
0 0
0 0
0 4
0 0
0 0
0 1
0 2
0 2
5
Unk
now
n 11
0 14
0
5 0
1 0
49
0 0
3 0
9 4
0 4
5 7
3 3
1 0
2 0
0 0
6 6
35
Sudden medical condition 4 0 0 0 0 0 0 1 2 0 0 1 0 0 0 0
Sta
nd u
p
padd
lebo
ard
8 0
0 0
0 0
0 2
0 0
0 0
0 6
0 0
0 0
0 0
0 0
0 0
0 0
5 0
5 3
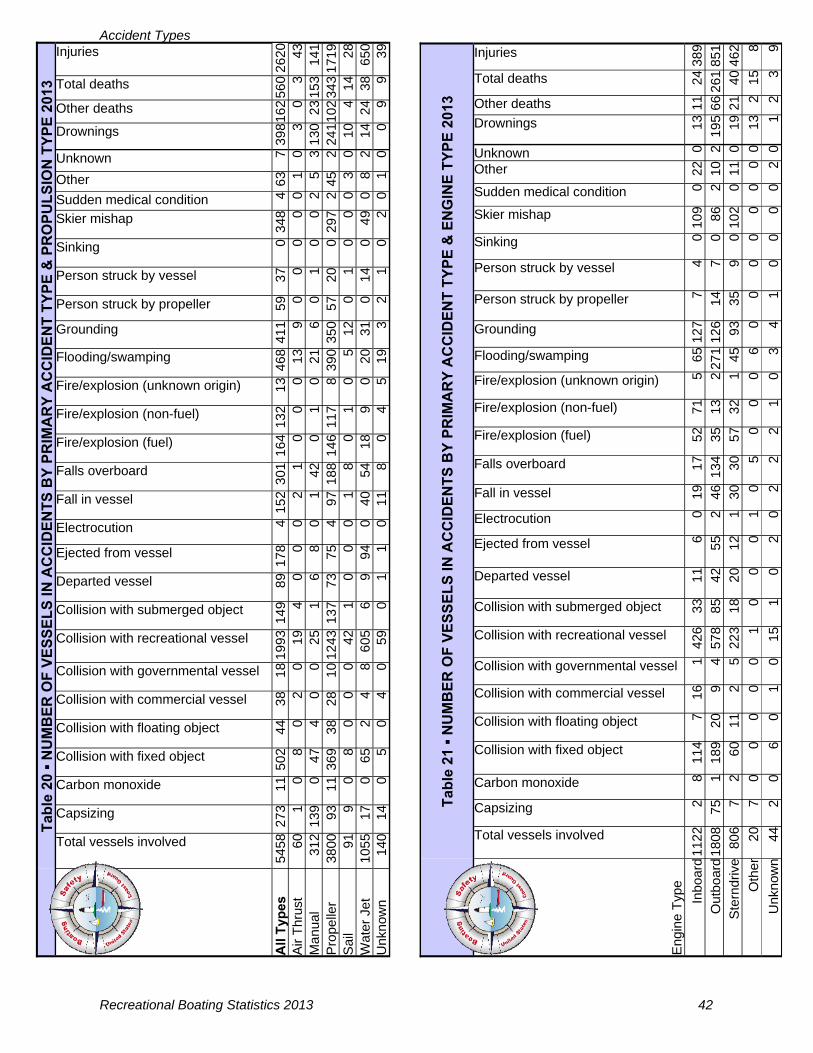
Accident Types
Recreational Boating Statistics 2013 42
T
able
20 ▪
NU
MB
ER
OF
VE
SS
EL
S IN
AC
CID
EN
TS
BY
PR
IMA
RY
AC
CID
EN
T T
YP
E &
PR
OP
UL
SIO
N T
YP
E 2
013
Total vessels involved
Capsizing
Carbon monoxide
Collision with fixed object
Collision with floating object
Collision with commercial vessel
Collision with governmental vessel
Collision with recreational vessel
Collision with submerged object
Departed vessel
Ejected from vessel
Electrocution
Fall in vessel
Falls overboard
Fire/explosion (fuel)
Fire/explosion (non-fuel)
Fire/explosion (unknown origin)
Flooding/swamping
Grounding
Person struck by propeller
Person struck by vessel
Sinking
Skier mishap
Sudden medical condition
Unknown
Drownings
Other deaths
Total deaths
Injuries
All
Typ
es
5458
273
11
502
44
38
18
199
3 14
9 89
178
4
152
301
164
132
13 4
68 4
11
59
37
0 34
8 4
7 39
8 16
2 56
0 26
20
Air
Thr
ust
60
1 0
8 0
2 0
19
4 0
0 0
2 1
0 0
0 13
9
0 0
0 0
0 0
3 0
3 43
M
anua
l 31
2 13
9 0
47
4 0
0 25
1
6 8
0 1
42
0 1
0 21
6
0 1
0 0
2 3
130
23 1
53
141
Pro
pelle
r 38
00
93
11 3
69
38
28
10 1
243
137
73
75
4 97
188
146
117
8
390
350
57
20
0 29
7 2
2 24
1 10
2 34
3 17
19
Sai
l 91
9
0 8
0 0
0 42
1
0 0
0 1
8 0
1 0
5 12
0
1 0
0 0
0 10
4
14
28
Wat
er J
et
1055
17
0
65
2 4
8 60
5 6
9 94
0
40
54
18
9 0
20
31
0 14
0
49
0 2
14
24
38
650
Unk
now
n 14
0 14
0
5 0
4 0
59
0 1
1 0
11
8 0
4 5
19
3 2
1 0
2 0
0 0
9 9
39
Other 63 1 5 45 3 8 1
T
able
21 ▪
NU
MB
ER
OF
VE
SS
EL
S IN
AC
CID
EN
TS
BY
PR
IMA
RY
AC
CID
EN
T T
YP
E &
EN
GIN
E T
YP
E 2
013
Eng
ine
Typ
e
Total vessels involved
Capsizing
Carbon monoxide
Collision with fixed object
Collision with floating object
Collision with commercial vessel
Collision with governmental vessel
Collision with recreational vessel
Collision with submerged object
Departed vessel
Ejected from vessel
Electrocution
Fall in vessel
Falls overboard
Fire/explosion (fuel)
Fire/explosion (non-fuel)
Fire/explosion (unknown origin)
Flooding/swamping
Grounding
Person struck by propeller
Person struck by vessel
Sinking
Skier mishap
Other Unknown
Drownings
Other deaths
Total deaths
Injuries
Inbo
ard
1122
2
8 11
4 7
16
1 42
6 33
11
6
0 19
17
52
71
5
65 1
27
7 4
0 10
9 22
0
13 1
1 24
389
O
utbo
ard
1808
75
1
189
20
9 4
578
85
42
55
2 46
134
35
13
2
271
126
14
7 0
86
10
2 19
5 66
261
851
Ste
rndr
ive
806
7
2 60
11
2
5 22
3 18
20
12
1
30
30
57
32
1 45
93
35
9
0 10
2 11
0
19 2
1 40
462
Unk
now
n 44
2
0 6
0 1
0 15
1
0 2
0 2
2 2
1 0
3 4
1 0
0 0
2 0
1 2
3 9
Sudden medical condition 0 2 0 0
Oth
er
20
7 0
0 0
0 0
1 0
0 0
1 0
5 0
0 0
6 0
0 0
0 0
0 0
0 13
2
15
8
Operator & Passenger Information
Operator & Passenger Information
Recreational Boating Statistics 2013 44
Explanation of Operator & Passenger Information Section
The following section contains eleven tables and figures that examine data relating to the operators and passengers in accidents. Information is displayed by age, boating safety instruction, type of injury, and cause of death. Operator Information (Table 22, Page 45) This table provides information about the operator. Information covers a variety of topics including age, boating operation hours experience, number of people onboard the vessel, and the boating safety in-struction level of the operator. Examples of “other” boating safety instruction include licenses issued from the Coast Guard, military training, police academy training, rental operator training, commercially-available courses, and camp training. Informal training signifies that the operator did not receive instruction in a formal classroom setting but rather learned from experience. Number of Deaths by Type of Operator Boating Instruction (Table 23 & Figure 7, Page 46) This table and accompanying figure focus on boating safety instruction for those operators who had a person die on their vessel. The table and figure both focus on instruction provided by the U.S. Coast Guard Auxiliary, U.S. Power Squadrons, American Red Cross, and State sources. The figure examines only deaths where the operator instruction was known. Number of Deaths by Vessel Type (Table 24 & Figure 8, Page 47) This table documents deaths by vessel type with a focus on drownings. It also provides the percentage of deaths by drowning by type of vessel. Percentage of Deaths by Vessel Type 2004-2013 (Figure 9 & Table 25, Page 48) This table and accompanying figure focus on the percentage of deaths that occurred on each vessel type for the past ten years. The figure may be interpreted by measuring the upper and lower bounds of the color-coded vessel type to obtain the percentage of deaths attributed to that vessel type within the year. Please note that the percentages in the table have been rounded up. Number of Deceased Victims by Age & Vessel Type (Table 26, Page 49) This table documents the age of fatal accident victims by vessel type. It also delineates the number of drownings, non-drownings, and total deaths by age. Number of Injured Victims by Age & Vessel Type (Table 27, Page 50) This table documents the age of injured victims by vessel type. Nature of Primary Injury Type by Area of Injury (Table 28, Page 51) This table focuses on the nature and area of the primary injury of injured victims. Number of Injured Victims under Age 18 by Age Group and Injury Type on Personal Watercraft(Figure 10, Page 51) This table focuses on the number of injured victims from personal watercraft for specific age groups and by type of injury.
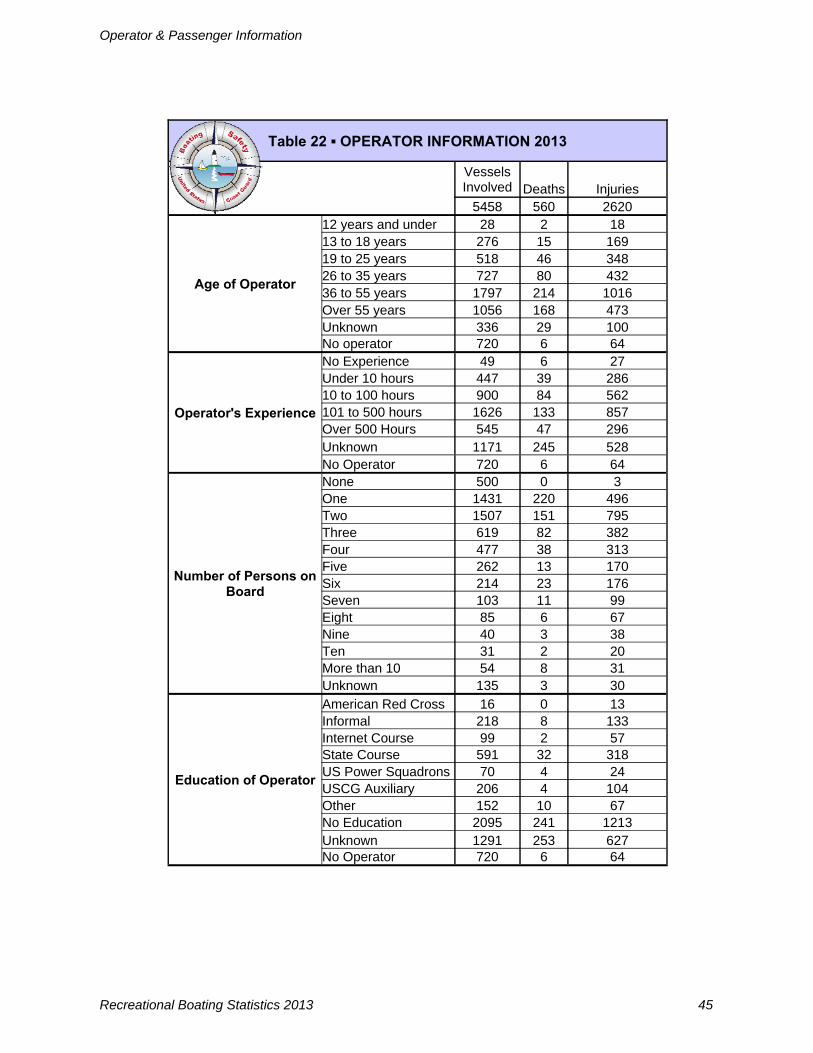
Operator & Passenger Information
Recreational Boating Statistics 2013 45
Table 22 ▪ OPERATOR INFORMATION 2013
Vessels Involved Deaths Injuries
5458 560 2620
Age of Operator
12 years and under 28 2 18 13 to 18 years 276 15 169 19 to 25 years 518 46 348 26 to 35 years 727 80 432 36 to 55 years 1797 214 1016 Over 55 years 1056 168 473
No operator 720 6 64
Operator's Experience
No Experience 49 6 27 Under 10 hours 447 39 286 10 to 100 hours 900 84 562 101 to 500 hours 1626 133 857 Over 500 Hours 545 47 296
No Operator 720 6 64
Number of Persons on Board
None 500 0 3 One 1431 220 496 Two 1507 151 795 Three 619 82 382 Four 477 38 313 Five 262 13 170 Six 214 23 176 Seven 103 11 99 Eight 85 6 67 Nine 40 3 38 Ten 31 2 20 More than 10 54 8 31 Unknown 135 3 30
Education of Operator
American Red Cross 16 0 13 Informal 218 8 133
State Course 591 32 318 US Power Squadrons 70 4 24 USCG Auxiliary 206 4 104 Other 152 10 67 No Education 2095 241 1213 Unknown 1291 253 627
Unknown 1171 245 528
Internet Course 99 2 57
No Operator 720 6 64
Unknown 336 29 100
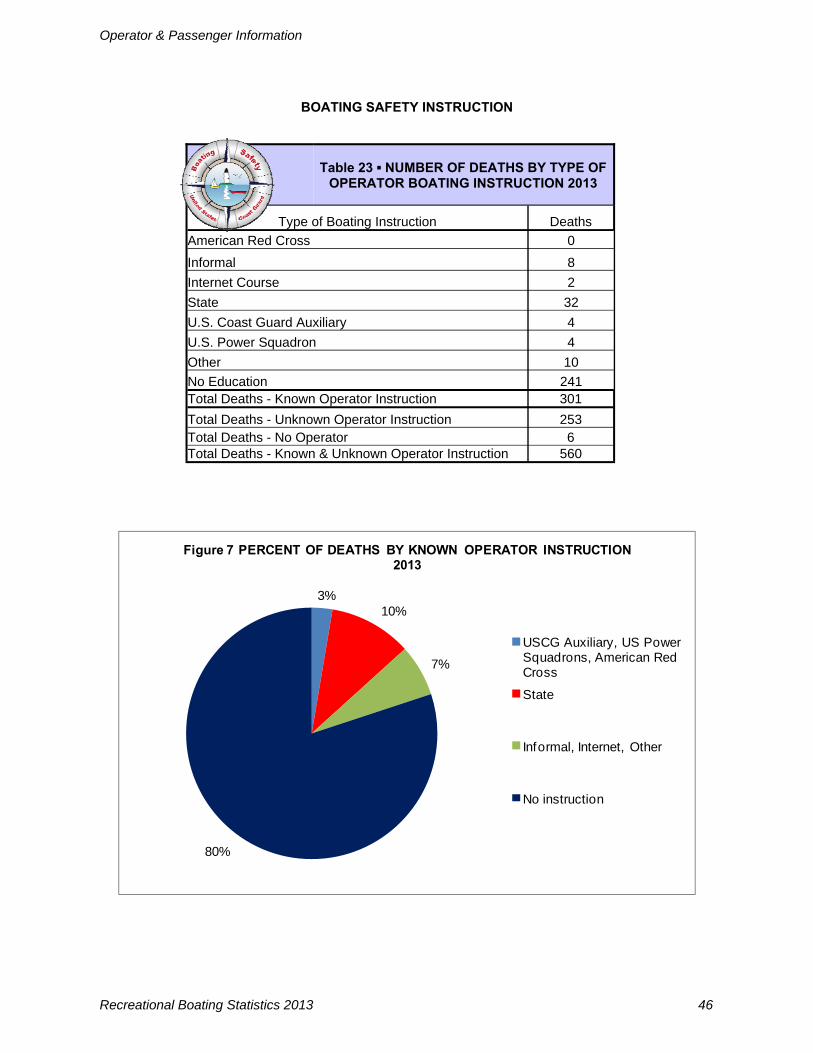
Operator & Passenger Information
Recreational Boating Statistics 2013 46
Table 23 ▪ NUMBER OF DEATHS BY TYPE OF OPERATOR BOATING INSTRUCTION 2013
Type of Boating Instruction Deaths
American Red Cross 0
Informal 8
Internet Course 2
State 32
U.S. Coast Guard Auxiliary 4
U.S. Power Squadron 4
Other 10
No Education 241 Total Deaths - Known Operator Instruction 301
Total Deaths - Unknown Operator Instruction 253
Total Deaths - Known & Unknown Operator Instruction 560 Total Deaths - No Operator 6
BOATING SAFETY INSTRUCTION
3%10%
7%
80%
Figure 7 PERCENT OF DEATHS BY KNOWN OPERATOR INSTRUCTION 2013
USCG Auxiliary, US Power Squadrons, American Red Cross
State
Informal, Internet, Other
No instruction

Operator & Passenger Information
Recreational Boating Statistics 2013 47
Table 24 ▪ NUMBER OF DEATHS BY VESSEL TYPE 2013
Boat Type Drownings Deaths by Causes
other than Drowning Total Deaths
Percentage of Deaths from
Drowning
Airboat 3 0 3 100%
Auxiliary Sailboat 3 3 6 50%
Cabin Motorboat 17 8 25 68%
Canoe 48 7 55 87%
Houseboat 1 2 3 33%
Inflatable 10 4 14 71%
Kayak 45 9 54 83%
Open Motorboat 189 83 272 69%
Personal Watercraft 13 23 36 36%
Pontoon 27 9 36 75%
Rowboat 26 4 30 87%
Sailboat (only) 2 3 5 40%
Sailboat (unknown) 7 1 8 88%
Unknown 0 6 6 0% Total 398 162 560 71%
Other 2 0 2 100% Stand up paddleboard 5 0 5 100%
0
50
100
150
200
250
300
Figure 8 NUMBER OF DEATHS BY VESSEL TYPE 2013
Deaths by Causes other than Drowning
Drownings
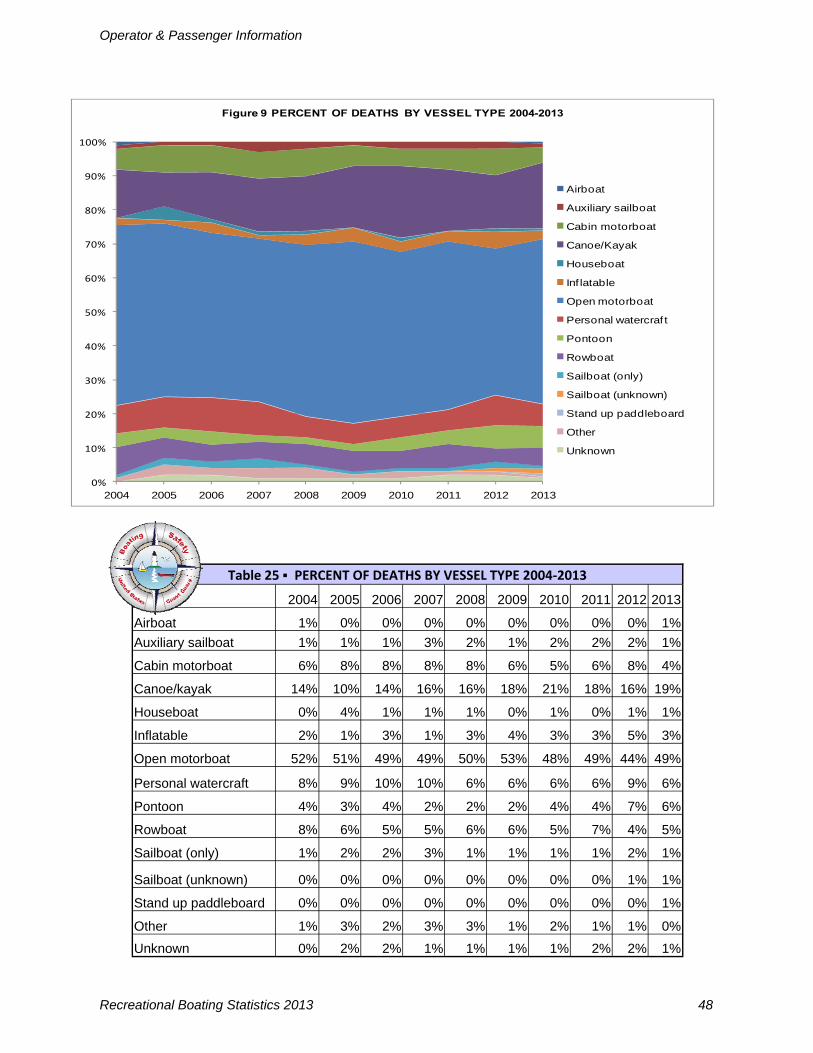
Operator & Passenger Information
Recreational Boating Statistics 2013 48
Table 25 ▪ PERCENT OF DEATHS BY VESSEL TYPE 2004‐2013
2004 2005 2006 2007 2008 2009 2010 2011 2012 2013
Airboat 1% 0% 0% 0% 0% 0% 0% 0% 0% 1%
Auxiliary sailboat 1% 1% 1% 3% 2% 1% 2% 2% 2% 1%
Cabin motorboat 6% 8% 8% 8% 8% 6% 5% 6% 8% 4%
Canoe/kayak 14% 10% 14% 16% 16% 18% 21% 18% 16% 19%
Houseboat 0% 4% 1% 1% 1% 0% 1% 0% 1% 1%
Inflatable 2% 1% 3% 1% 3% 4% 3% 3% 5% 3%
Open motorboat 52% 51% 49% 49% 50% 53% 48% 49% 44% 49%
Personal watercraft 8% 9% 10% 10% 6% 6% 6% 6% 9% 6%
Pontoon 4% 3% 4% 2% 2% 2% 4% 4% 7% 6%
Rowboat 8% 6% 5% 5% 6% 6% 5% 7% 4% 5%
Sailboat (only) 1% 2% 2% 3% 1% 1% 1% 1% 2% 1%
Sailboat (unknown) 0% 0% 0% 0% 0% 0% 0% 0% 1% 1%
Stand up paddleboard 0% 0% 0% 0% 0% 0% 0% 0% 0% 1%
Other 1% 3% 2% 3% 3% 1% 2% 1% 1% 0%
Unknown 0% 2% 2% 1% 1% 1% 1% 2% 2% 1%
0%
10%
20%
30%
40%
50%
60%
70%
80%
90%
100%
2004 2005 2006 2007 2008 2009 2010 2011 2012 2013
Figure 9 PERCENT OF DEATHS BY VESSEL TYPE 2004-2013
Airboat
Auxiliary sailboat
Cabin motorboat
Canoe/Kayak
Houseboat
Inf latable
Open motorboat
Personal watercraf t
Pontoon
Rowboat
Sailboat (only)
Sailboat (unknown)
Stand up paddleboard
Other
Unknown
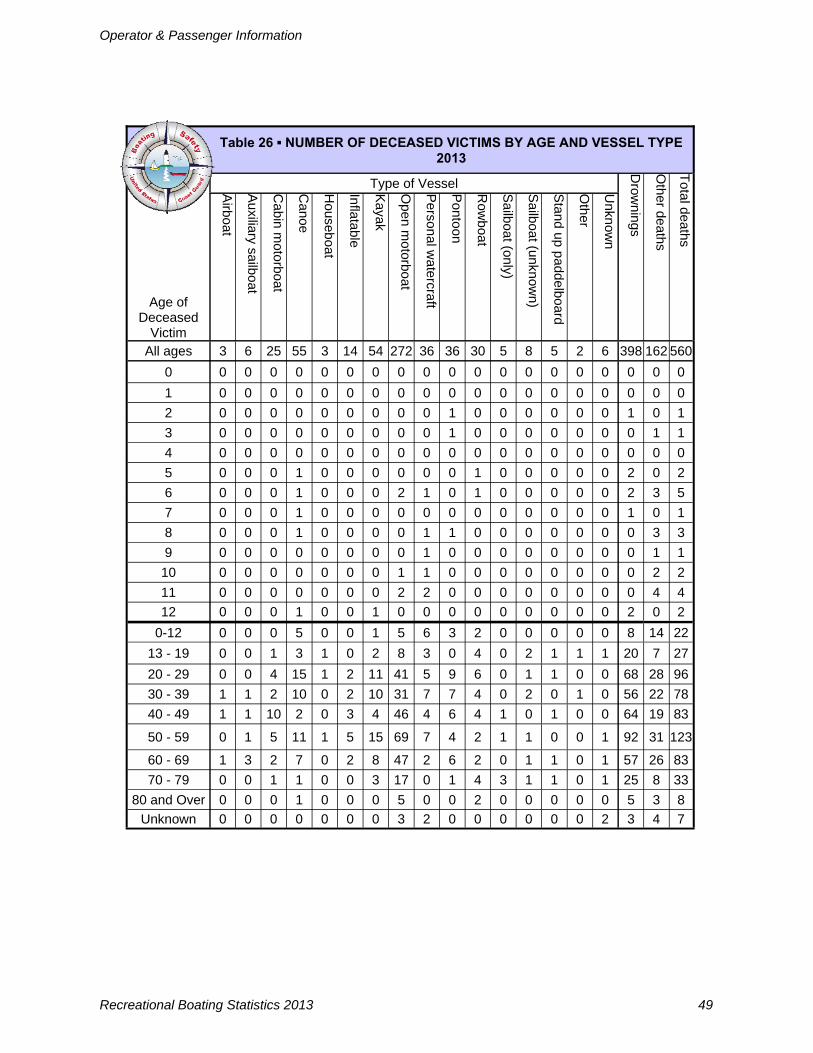
Operator & Passenger Information
Recreational Boating Statistics 2013 49
Table 26 ▪ NUMBER OF DECEASED VICTIMS BY AGE AND VESSEL TYPE 2013
Age of Deceased
Victim
Type of Vessel D
rownings
Other deaths
Total deaths
Airboat
Auxiliary sailboat
Cabin m
otorboat
Canoe
Houseboat
Inflatable
Kayak
Open m
otorboat
Personal w
atercraft
Pontoon
Row
boat
Sailboat (only)
Other
Unknow
n
All ages 3 6 25 55 3 14 54 272 36 36 30 5 2 6 398 162 560
0 0 0 0 0 0 0 0 0 0 0 0 0 0 0 0 0 0
1 0 0 0 0 0 0 0 0 0 0 0 0 0 0 0 0 0
2 0 0 0 0 0 0 0 0 0 1 0 0 0 0 1 0 1
3 0 0 0 0 0 0 0 0 0 1 0 0 0 0 0 1 1
4 0 0 0 0 0 0 0 0 0 0 0 0 0 0 0 0 0
5 0 0 0 1 0 0 0 0 0 0 1 0 0 0 2 0 2
6 0 0 0 1 0 0 0 2 1 0 1 0 0 0 2 3 5
7 0 0 0 1 0 0 0 0 0 0 0 0 0 0 1 0 1
8 0 0 0 1 0 0 0 0 1 1 0 0 0 0 0 3 3
9 0 0 0 0 0 0 0 0 1 0 0 0 0 0 0 1 1
10 0 0 0 0 0 0 0 1 1 0 0 0 0 0 0 2 2
11 0 0 0 0 0 0 0 2 2 0 0 0 0 0 0 4 4
12 0 0 0 1 0 0 1 0 0 0 0 0 0 0 2 0 2
0-12 0 0 0 5 0 0 1 5 6 3 2 0 0 0 8 14 22
13 - 19 0 0 1 3 1 0 2 8 3 0 4 0 1 1 20 7 27
20 - 29 0 0 4 15 1 2 11 41 5 9 6 0 0 0 68 28 96
30 - 39 1 1 2 10 0 2 10 31 7 7 4 0 1 0 56 22 78
40 - 49 1 1 10 2 0 3 4 46 4 6 4 1 0 0 64 19 83
50 - 59 0 1 5 11 1 5 15 69 7 4 2 1 0 1 92 31 123
60 - 69 1 3 2 7 0 2 8 47 2 6 2 0 0 1 57 26 83
70 - 79 0 0 1 1 0 0 3 17 0 1 4 3 0 1 25 8 33
80 and Over 0 0 0 1 0 0 0 5 0 0 2 0 0 0 5 3 8
Unknown 0 0 0 0 0 0 0 3 2 0 0 0 0 2 3 4 7
Sailboat (unknow
n)
8
0
0
0
0
0
0
0
0
0
0
0
0
0
0
2
1
2
0
1
1
1
0
0
Stand up paddelboard
5
0
0
0
0
0
0
0
0
0
0
0
0
0
0
1
1
0
1
0
1
1
0
0

Operator & Passenger Information
Recreational Boating Statistics 2013 50
Table 27 ▪ NUMBER OF INJURED VICTIMS BY AGE AND VESSEL TYPE 2013
Age of Injured Victim
Total injuries
Airboat
Auxiliary sailboat
Cabin m
otorboat
Canoe
Houseboat
Inflatable
Kayak
Open m
otorboat
Personal w
atercraft
Pontoon
Row
boat
Sailboat (only)
Other
Unknow
n
All ages 2620 43 53 223 70 26 18 40 1380 601 80 14 24 5 35 0 1 0 0 0 0 0 0 0 1 0 0 0 0 0 0 1 1 0 0 0 1 0 0 0 0 0 0 0 0 0 0 2 2 0 0 0 0 0 0 0 2 0 0 0 0 0 0 3 4 0 0 0 0 0 0 0 3 0 0 00 1 0 0 4 8 0 0 0 1 0 0 0 5 1 0 0 0 0 1 5 8 1 0 0 0 0 0 1 4 1 0 0 1 0 0 6 11 0 0 0 0 0 0 0 6 2 2 1 0 0 0 7 18 0 0 0 0 0 0 0 11 5 2 0 0 0 0 8 15 0 0 0 0 0 0 0 7 4 3 0 0 0 1 9 19 0 0 4 0 0 0 0 5 9 0 0 1 0 0 10 29 0 0 2 0 3 1 0 14 9 0 0 0 0 0 11 27 0 0 1 1 1 0 0 11 10 0 0 3 0 0 12 37 0 0 2 0 0 1 0 22 11 1 0 0 0 0
0 - 12 180 1 0 9 3 4 2 1 91 52 8 1 6 0 2 13 - 19 409 1 1 15 7 8 4 4 204 149 11 2 1 0 2 20 - 29 538 6 2 24 23 0 4 6 280 168 18 0 2 2 3 30 - 39 377 6 6 33 13 5 2 9 201 90 8 1 1 1 0 40 - 49 371 6 12 46 13 7 2 7 192 70 9 1 4 0 0 50 - 59 326 12 12 54 4 0 2 6 173 41 10 4 4 1 2 60 - 69 197 3 8 18 3 0 2 1 135 11 9 2 3 1 1 70 - 79 66 5 3 9 1 1 0 1 41 0 2 2 0 0 1
80 and Over 22 2 3 4 0 0 0 0 10 0 2 1 0 0 0 Unknown 134 1 6 11 3 1 0 5 53 20 3 0 3 0 24
Sailboat (unknow
n)
5 0 0 0 0 0 0 0 0 0 0 0 0 0 0 0 0 0 1 1 0 0 0 3
Stand up paddleboard
3 0 0 0 0 0 0 0 0 0 0 0 0 0 0 0 0 1 1 0 0 0 0 1

Operator & Passenger Information
Recreational Boating Statistics 2013 51
Table 28 ▪ NATURE OF PRIMARY INJURY TYPE BY AREA OF INJURY 2013
All Areas Arm Body Foot Hand Head Leg Neck Trunk Other Unknown
All primary injury types 2620 240 327 117 114 620 536 79 434 0 153
Amputation 28 2 0 2 19 0 5 0 0 0 0
Broken bone 451 66 0 33 22 58 164 7 87 0 14
Burn 88 8 15 4 8 8 28 2 2 0 13
Carbon monoxide 31 0 31 0 0 0 0 0 0 0 0
Concussion 259 0 0 0 0 259 0 0 0 0 0
Dislocation 70 48 0 1 3 1 15 0 1 0 1
Electric shock 0 0 0 0 0 0 0 0 0 0 0
Hypothermia 225 0 225 0 0 0 0 0 0 0 0
Internal organ injury 127 5 6 0 1 1 3 1 105 0 5
Laceration 618 47 2 43 42 233 181 4 36 0 30
Scrape/bruise 369 39 31 11 13 57 100 9 74 0 35
Shock 11 0 11 0 0 0 0 0 0 0 0
Spinal cord Injury 43 0 0 0 0 0 0 7 36 0 0
Sprain/strain 239 22 6 21 6 2 39 49 90 0 4
Other 0 0 0 0 0 0 0 0 0 0 0
Unknown 61 3 0 2 0 1 1 0 3 0 51
0
5
10
15
20
25
Figure 10 NUMBER OF INJURED VICTIMS UNDER AGE 18 BY AGE GROUP AND INJURY TYPE ON PERSONAL WATERCRAFT 2013
Ages 0-4
Ages 5-9
Ages 10-14
Ages 15-17
Casualty Data
Casualty Data
Recreational Boating Statistics 2013 53
Explanation of Casualty Data Section
This section contains eleven tables and figures that examine data relating to the victims in boating acci-dents. The following pages focus on historical casualty information, casualty-vessel information, and state-specific casualty information. Deaths, Injuries & Accidents by Year 1997-2013 (Figure 11 & Table 29, Page 54) This figure and table document the number of accidents and casualties from 1997-2013. Accident, Casualty & Damage Data by State (Table 30, Page 55) This table provides accident, casualty, and damage information by state for the year 2013. Accidents are broken down into three levels of severity– fatal accidents, non-fatal injury accidents, and property damage only accidents. This table also provides the number of casualties and property damage by state. Distribution of Recreational Boating Deaths by State (Figure 12, Page 56) This figure provides the percentage that each state contributed to the national death count. So, for in-stance, Michigan had 21 deaths. Out of the total national death count of 560, Michigan contributed 3.8% ((21/560) * 100) of deaths to the national count. Please note that percentages have been rounded. Annual Recreational Boating Fatality Rates 1997-2013 (Figure 13 & Table 31, Page 57) This table and accompanying figure provide two fatality rates for years 1997-2013. The fatality rate is calculated by dividing the number of fatalities by the total national vessel registration. The Coast Guard then multiplied by a factor of 100,000 to arrive at the number of deaths per 100,000 registered vessels. One fatality rate takes into account all fatalities and all recreational registration data collected. The sec-ond fatality rate takes into account only fatalities that occurred on motorized vessels and only motorized recreational vessels registered. States Coded by their 2013 Fatality Rate (Figure 14, Page 58) This figure displays states that are color-coded depending on their fatality rate which is expressed as the number of deaths that occurred in that state per 100,000 vessels that that state registered. It is impor-tant to note that not all states register the same types of vessels which could skew the fatality rates pro-vided. Please see Table 38, Recreational Registration Data by State 2012-2013 to view the Scope of each state’s registration system. Five-year Summary of Selected Accident Data by State 2009-2013 (Table 32, Page 59) This table examines the number of accidents, fatal accidents, and fatalities by state for years 2009-2013. Number of Accidents by Primary Accident Type & State (Table 33, Page 60-61) This table documents the first accident event by state. It also provides information about the total num-ber of accidents and casualties by state. Number of Injured Victims by Primary Injury & Vessel Type (Table 34, Page 62) This table displays the number of injured victims by primary injury and vessel type. Number of Fatal Victims by Life Jacket Wear, Cause of Death, & Vessel Type (Table 35, Page 62) This table displays the number of fatal victims by vessel type and cause of death. The table also pro-vides information on whether the deceased victim was wearing a life jacket.
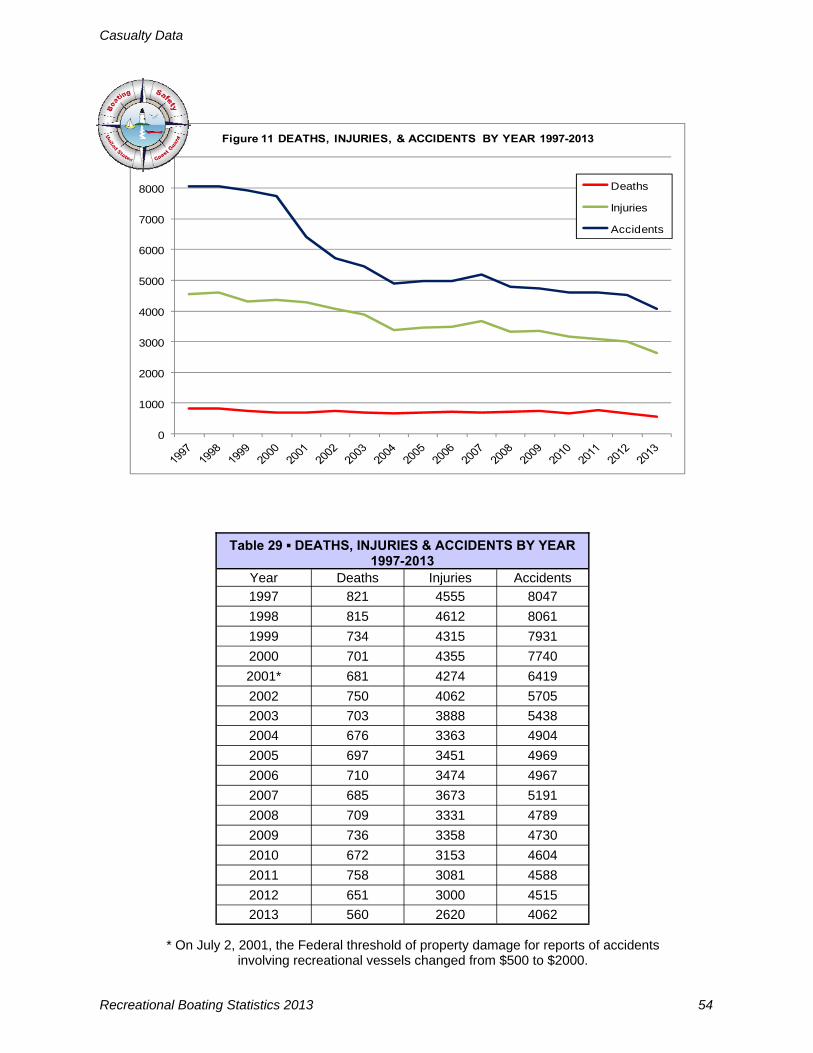
Casualty Data
Recreational Boating Statistics 2013 54
0
1000
2000
3000
4000
5000
6000
7000
8000
9000
Figure 11 DEATHS, INJURIES, & ACCIDENTS BY YEAR 1997-2013
Deaths
Injuries
Accidents
* On July 2, 2001, the Federal threshold of property damage for reports of accidents involving recreational vessels changed from $500 to $2000.
Table 29 ▪ DEATHS, INJURIES & ACCIDENTS BY YEAR 1997-2013
Year Deaths Injuries Accidents
1997 821 4555 8047
1998 815 4612 8061
1999 734 4315 7931
2000 701 4355 7740
2001* 681 4274 6419
2002 750 4062 5705
2003 703 3888 5438
2004 676 3363 4904
2005 697 3451 4969
2006 710 3474 4967
2007 685 3673 5191
2008 709 3331 4789
2009 736 3358 4730
2010 672 3153 4604
2011 758 3081 4588
2013 560 2620 4062
2012 651 3000 4515

Casualty Data
Recreational Boating Statistics 2013 55
Table 30 ▪ ACCIDENT, CASUALTY & DAMAGE DATA BY STATE 2013
Number of Accidents Persons Involved
Total Fatal Non-Fatal Injury Property Damage Deaths Injured Damages Totals 4062 510 1907 1645 560 2620 $39,175,826
AK 18 7 6 5 10 12 $195,000
AL 62 10 26 26 10 46 $1,319,016
AR 56 13 21 22 15 27 $206,600
AZ 95 9 62 24 9 84 $348,259
CA 426 34 206 186 37 277 $2,244,460
CO 32 2 24 6 2 30 $27,407
CT 35 1 13 21 1 18 $1,813,784
DE 8 0 4 4 0 5 $28,500
DC 5 0 2 3 0 2 $41,750
FL 685 51 295 339 58 406 $9,490,497
GA 92 15 55 22 16 73 $443,549
HI 14 4 4 6 4 6 $217,200
IA 24 3 15 6 3 17 $60,600
ID 42 5 24 13 5 31 $169,050
IL 59 8 24 27 9 38 $380,559
IN 44 4 25 15 5 31 $129,071
KS 24 5 8 11 5 9 $51,745
KY 31 4 16 11 5 19 $977,850
LA 96 15 57 24 15 92 $601,310
MA 83 12 33 38 12 47 $813,970
MD 110 13 62 35 14 77 $713,016
ME 54 3 29 22 4 35 $400,396
MI 92 19 36 37 21 47 $322,207
MN 75 10 37 28 12 47 $958,061
MO 111 16 59 36 16 86 $1,036,819
MS 41 12 20 9 13 31 $257,325
MT 16 6 5 5 6 10 $56,700
NC 139 14 70 55 16 90 $754,480
ND 5 2 3 0 2 3 $0
NE 25 0 19 6 0 24 $37,750
NH 40 1 19 20 1 23 $140,297
NJ 123 8 49 66 8 60 $151,590
NM 16 2 7 7 2 11 $86,097
NV 48 5 20 23 5 41 $388,030
NY 180 15 79 86 18 113 $2,699,367
OH 108 13 30 65 13 41 $1,412,163
OK 42 8 17 17 9 25 $458,800
OR 59 12 25 22 12 37 $453,925
PA 71 16 35 20 17 42 $132,623
RI 42 1 13 28 1 20 $935,476
SC 104 26 43 35 27 59 $710,700
SD 10 1 4 5 1 6 $36,300
TN 119 17 58 44 20 75 $2,373,362
TX 146 28 71 47 31 106 $976,580
UT 76 10 47 19 12 52 $111,873
VA 64 10 33 21 11 44 $720,195
VT 2 1 0 1 1 2 $100,000
WA 94 17 39 38 17 51 $983,840
WI 79 12 44 23 12 59 $847,905
WV 16 3 8 5 3 20 $59,587
WY 6 0 4 2 0 9 $9,845
AS 0 0 0 0 0 0 $0 GU 1 1 0 0 1 0 $12,790
CNMI 0 0 0 0 0 0 $0
PR 2 2 0 0 2 1 $0
VI 0 0 0 0 0 0 $0
Atlantic Ocean* 10 3 1 6 4 1 $712,190
Gulf of Mexico* 3 0 1 2 0 2 $551,975
Pacific Ocean* 2 1 0 1 7 0 $13,385 *1997 was the first year statistics were compiled for accidents that occurred three or more miles offshore in the Atlantic Ocean and Pacific Ocean and nine or more miles in the Gulf of Mexico. NJ
did not submit property damage estimates to boats. However, NJ noted that accidents submitted to the Coast Guard that did not have an injury or death were considered to have $2000 or more in damages. The Coast Guard adjusted NJ's property damages to boats such that each accident without an injury or death had $2000 damages.

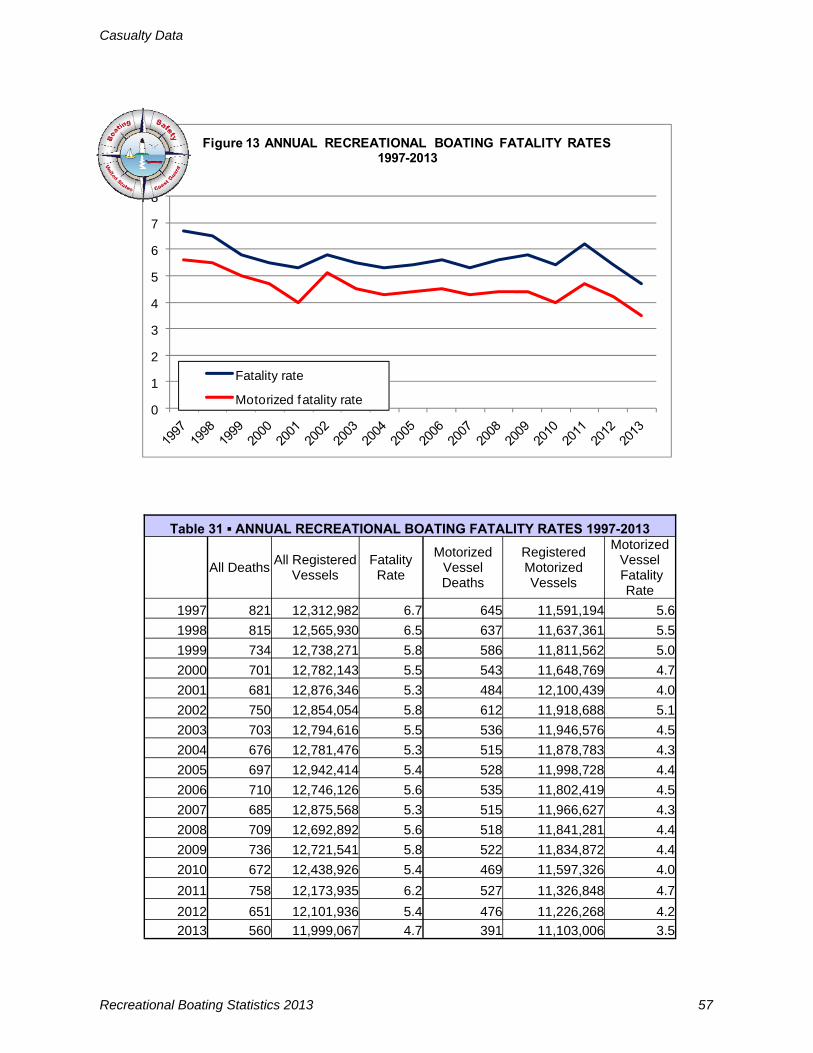
Casualty Data
Recreational Boating Statistics 2013 57
0
1
2
3
4
5
6
7
8
Figure 13 ANNUAL RECREATIONAL BOATING FATALITY RATES 1997-2013
Fatality rate
Motorized fatality rate
Table 31 ▪ ANNUAL RECREATIONAL BOATING FATALITY RATES 1997-2013
All Deaths All Registered
Vessels Fatality
Rate
Motorized Vessel Deaths
Registered Motorized Vessels
Motorized Vessel Fatality
Rate
1997 821 12,312,982 6.7 645 11,591,194 5.6
1998 815 12,565,930 6.5 637 11,637,361 5.5
1999 734 12,738,271 5.8 586 11,811,562 5.0
2000 701 12,782,143 5.5 543 11,648,769 4.7
2001 681 12,876,346 5.3 484 12,100,439 4.0
2002 750 12,854,054 5.8 612 11,918,688 5.1
2003 703 12,794,616 5.5 536 11,946,576 4.5
2004 676 12,781,476 5.3 515 11,878,783 4.3
2005 697 12,942,414 5.4 528 11,998,728 4.4
2006 710 12,746,126 5.6 535 11,802,419 4.5
2007 685 12,875,568 5.3 515 11,966,627 4.3
2008 709 12,692,892 5.6 518 11,841,281 4.4
2009 736 12,721,541 5.8 522 11,834,872 4.4
2010 672 12,438,926 5.4 469 11,597,326 4.0
2011 758 12,173,935 6.2 527 11,326,848 4.7
2013 560 11,999,067 4.7 391 11,103,006 3.5
2012 651 12,101,936 5.4 476 11,226,268 4.2
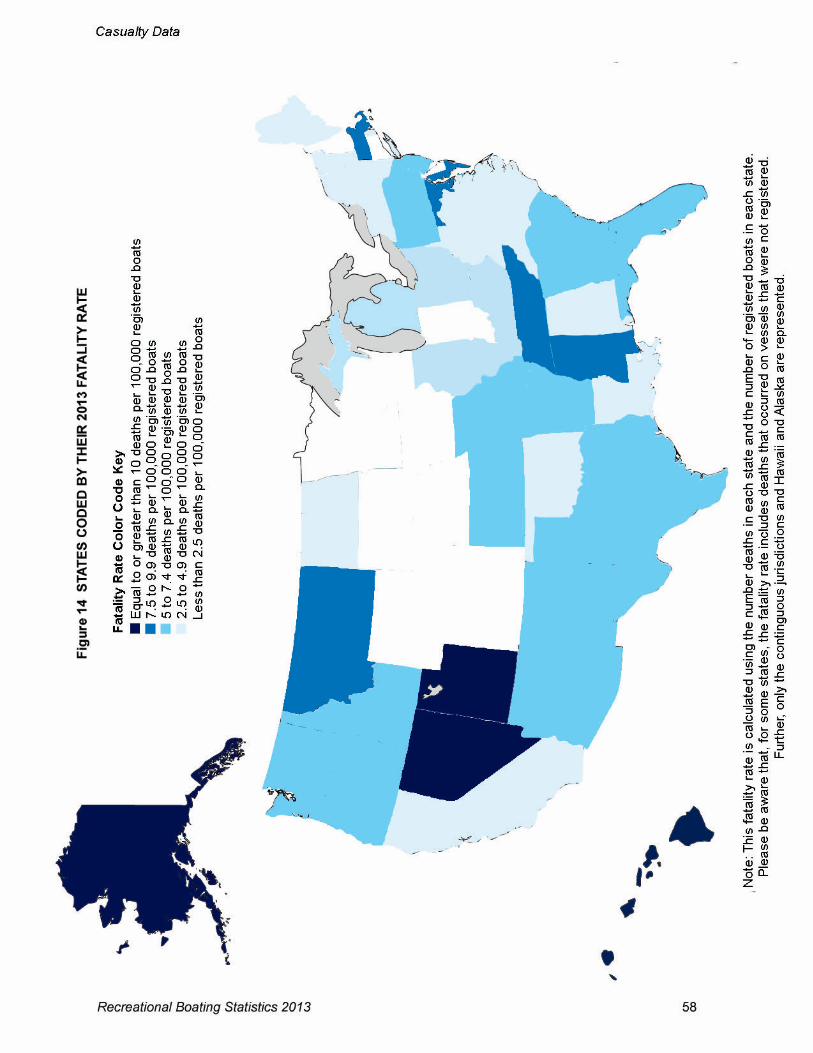
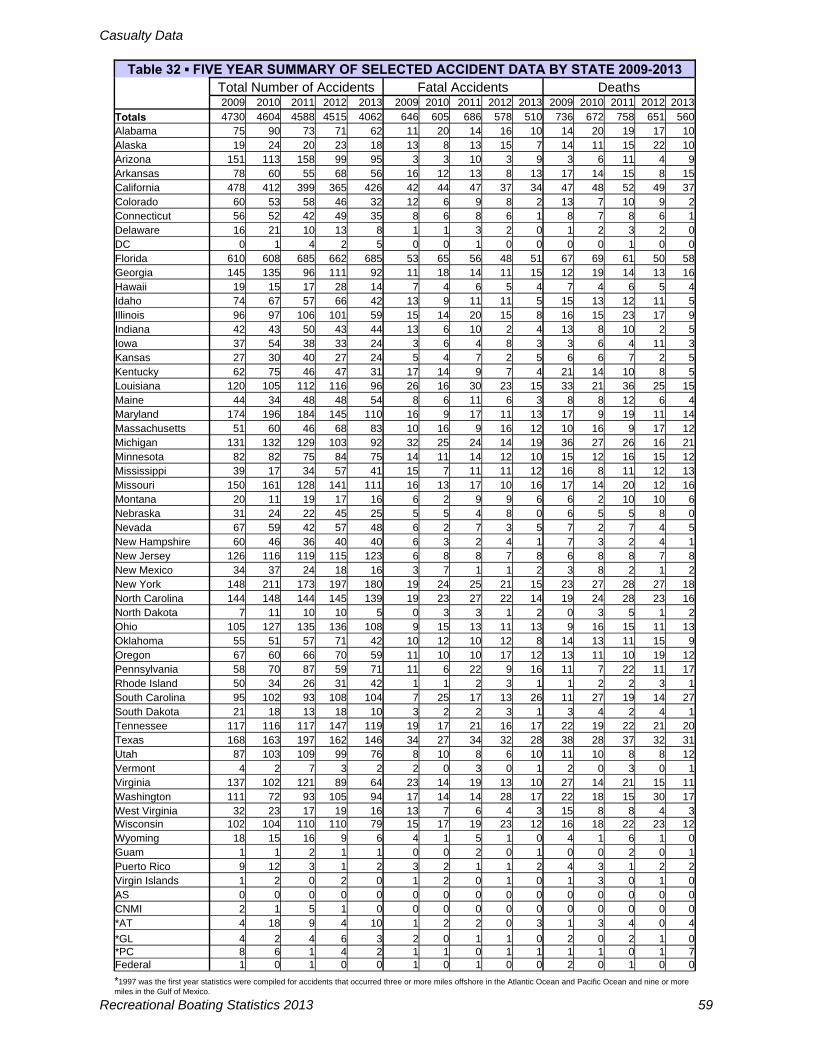
Casualty Data
Recreational Boating Statistics 2013 59
Table 32 ▪ FIVE YEAR SUMMARY OF SELECTED ACCIDENT DATA BY STATE 2009-2013 Total Number of Accidents Fatal Accidents Deaths 2009 2010 2011 2012 2013 2009 2010 2011 2012 2013 2009 2010 2011 2012 2013
Totals 4730 4604 4588 4515 4062 646 605 686 578 510 736 672 758 651 560 Alabama 75 90 73 71 62 11 20 14 16 10 14 20 19 17 10 Alaska 19 24 20 23 18 13 8 13 15 7 14 11 15 22 10 Arizona 151 113 158 99 95 3 3 10 3 9 3 6 11 4 9 Arkansas 78 60 55 68 56 16 12 13 8 13 17 14 15 8 15 California 478 412 399 365 426 42 44 47 37 34 47 48 52 49 37 Colorado 60 53 58 46 32 12 6 9 8 2 13 7 10 9 2 Connecticut 56 52 42 49 35 8 6 8 6 1 8 7 8 6 1 Delaware 16 21 10 13 8 1 1 3 2 0 1 2 3 2 0 DC 0 1 4 2 5 0 0 1 0 0 0 0 1 0 0 Florida 610 608 685 662 685 53 65 56 48 51 67 69 61 50 58 Georgia 145 135 96 111 92 11 18 14 11 15 12 19 14 13 16 Hawaii 19 15 17 28 14 7 4 6 5 4 7 4 6 5 4 Idaho 74 67 57 66 42 13 9 11 11 5 15 13 12 11 5 Illinois 96 97 106 101 59 15 14 20 15 8 16 15 23 17 9 Indiana 42 43 50 43 44 13 6 10 2 4 13 8 10 2 5 Iowa 37 54 38 33 24 3 6 4 8 3 3 6 4 11 3 Kansas 27 30 40 27 24 5 4 7 2 5 6 6 7 2 5 Kentucky 62 75 46 47 31 17 14 9 7 4 21 14 10 8 5 Louisiana 120 105 112 116 96 26 16 30 23 15 33 21 36 25 15 Maine 44 34 48 48 54 8 6 11 6 3 8 8 12 6 4 Maryland 174 196 184 145 110 16 9 17 11 13 17 9 19 11 14 Massachusetts 51 60 46 68 83 10 16 9 16 12 10 16 9 17 12 Michigan 131 132 129 103 92 32 25 24 14 19 36 27 26 16 21 Minnesota 82 82 75 84 75 14 11 14 12 10 15 12 16 15 12 Mississippi 39 17 34 57 41 15 7 11 11 12 16 8 11 12 13 Missouri 150 161 128 141 111 16 13 17 10 16 17 14 20 12 16 Montana 20 11 19 17 16 6 2 9 9 6 6 2 10 10 6 Nebraska 31 24 22 45 25 5 5 4 8 0 6 5 5 8 0 Nevada 67 59 42 57 48 6 2 7 3 5 7 2 7 4 5 New Hampshire 60 46 36 40 40 6 3 2 4 1 7 3 2 4 1 New Jersey 126 116 119 115 123 6 8 8 7 8 6 8 8 7 8 New Mexico 34 37 24 18 16 3 7 1 1 2 3 8 2 1 2 New York 148 211 173 197 180 19 24 25 21 15 23 27 28 27 18 North Carolina 144 148 144 145 139 19 23 27 22 14 19 24 28 23 16 North Dakota 7 11 10 10 5 0 3 3 1 2 0 3 5 1 2 Ohio 105 127 135 136 108 9 15 13 11 13 9 16 15 11 13 Oklahoma 55 51 57 71 42 10 12 10 12 8 14 13 11 15 9 Oregon 67 60 66 70 59 11 10 10 17 12 13 11 10 19 12 Pennsylvania 58 70 87 59 71 11 6 22 9 16 11 7 22 11 17 Rhode Island 50 34 26 31 42 1 1 2 3 1 1 2 2 3 1 South Carolina 95 102 93 108 104 7 25 17 13 26 11 27 19 14 27 South Dakota 21 18 13 18 10 3 2 2 3 1 3 4 2 4 1 Tennessee 117 116 117 147 119 19 17 21 16 17 22 19 22 21 20 Texas 168 163 197 162 146 34 27 34 32 28 38 28 37 32 31 Utah 87 103 109 99 76 8 10 8 6 10 11 10 8 8 12 Vermont 4 2 7 3 2 2 0 3 0 1 2 0 3 0 1 Virginia 137 102 121 89 64 23 14 19 13 10 27 14 21 15 11 Washington 111 72 93 105 94 17 14 14 28 17 22 18 15 30 17 West Virginia 32 23 17 19 16 13 7 6 4 3 15 8 8 4 3 Wisconsin 102 104 110 110 79 15 17 19 23 12 16 18 22 23 12 Wyoming 18 15 16 9 6 4 1 5 1 0 4 1 6 1 0 Guam 1 1 2 1 1 0 0 2 0 1 0 0 2 0 1 Puerto Rico 9 12 3 1 2 3 2 1 1 2 4 3 1 2 2 Virgin Islands 1 2 0 2 0 1 2 0 1 0 1 3 0 1 0 AS 0 0 0 0 0 0 0 0 0 0 0 0 0 0 0 CNMI 2 1 5 1 0 0 0 0 0 0 0 0 0 0 0 *AT 4 18 9 4 10 1 2 2 0 3 1 3 4 0 4
*GL 4 2 4 6 3 2 0 1 1 0 2 0 2 1 0 *PC 8 6 1 4 2 1 1 0 1 1 1 1 0 1 7
*1997 was the first year statistics were compiled for accidents that occurred three or more miles offshore in the Atlantic Ocean and Pacific Ocean and nine or more miles in the Gulf of Mexico.
Federal 1 0 1 0 0 1 0 1 0 0 2 0 1 0 0
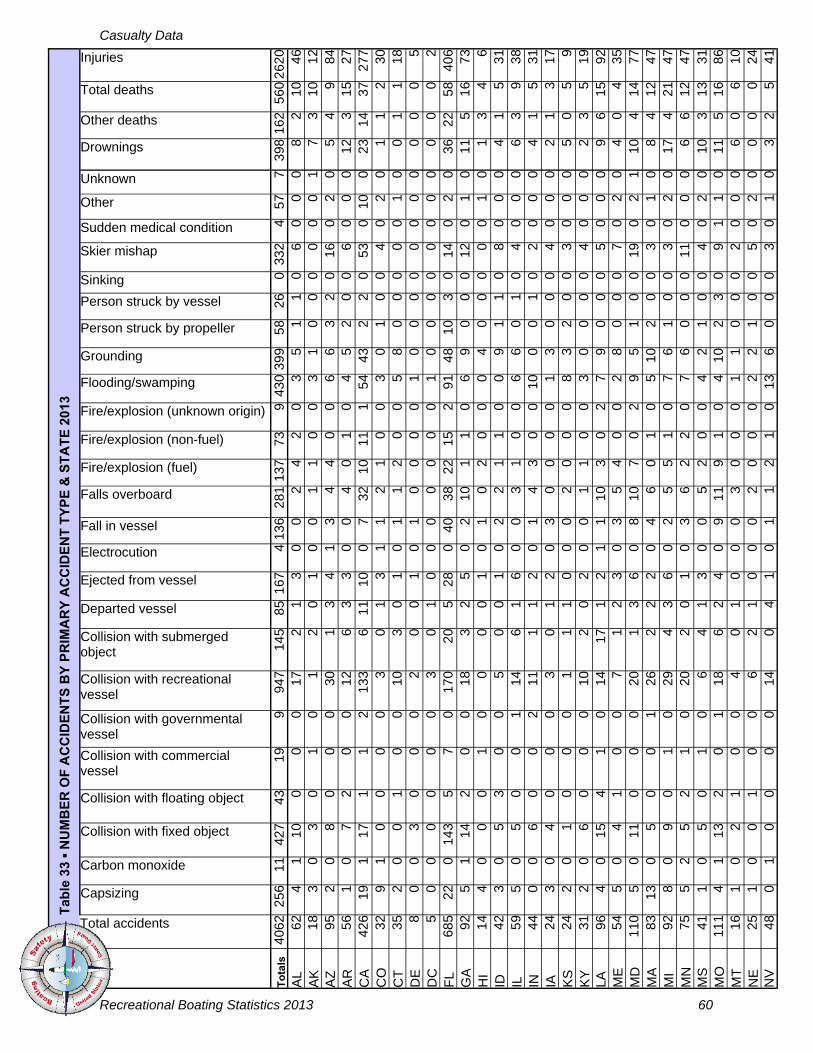
Casualty Data
Recreational Boating Statistics 2013 60
Tab
le 3
3 ▪
NU
MB
ER
OF
AC
CID
EN
TS
BY
PR
IMA
RY
AC
CID
EN
T T
YP
E &
ST
AT
E 2
013
Total accidents
Capsizing
Carbon monoxide
Collision with fixed object
Collision with floating object
Collision with commercial vessel
Collision with governmental vessel
Collision with recreational vessel
Collision with submerged object
Departed vessel
Ejected from vessel
Electrocution
Fall in vessel
Falls overboard
Fire/explosion (fuel)
Fire/explosion (non-fuel)
Fire/explosion (unknown origin)
Flooding/swamping
Grounding
Person struck by propeller
Person struck by vessel
Sinking
Skier mishap
Other
Unknown
Drownings
Other deaths
Total deaths
Injuries
To
tals
40
62
256
11
427
43
19
9 94
7 14
5 85
167
4
136
281
137
73
9 43
0 39
9 58
26
0
332
57
7 39
8 16
2 56
0 26
20
AL
62
4
1 10
0
0 0
17
2 1
3 0
0 2
4 2
0 3
5 1
1 0
6 0
0 8
2 10
46
A
K
18
3 0
3 0
1 0
1 2
0 1
0 0
1 1
0 0
3 1
0 0
0 0
0 1
7 3
10
12
AZ
95
2
0 8
0 0
0 30
1
3 4
1 3
4 4
0 0
6 6
3 2
0 16
2
0 5
4 9
84
AR
56
1
0 7
2 0
0 12
6
3 3
0 0
4 0
1 0
4 5
2 0
0 6
0 0
12
3 15
27
C
A
426
19
1 17
1
1 2
133
6 11
10
0
7 32
10
11
1
54
43
2 2
0 53
10
0
23
14
37
277
CO
32
9
1 0
0 0
0 3
0 1
3 1
1 2
1 0
0 3
0 1
0 0
4 2
0 1
1 2
30
CT
35
2
0 0
1 0
0 10
3
0 1
0 1
1 2
0 0
5 8
0 0
0 0
1 0
0 1
1 18
D
E
8 0
0 3
0 0
0 2
0 0
1 0
1 0
0 0
0 1
0 0
0 0
0 0
0 0
0 0
5 D
C
5 0
0 0
0 0
0 3
0 1
0 0
0 0
0 0
0 1
0 0
0 0
0 0
0 0
0 0
2 F
L 68
5 22
0
143
5 7
0 17
0 20
5
28
0 40
38
22
15
2
91
48
10
3 0
14
2 0
36
22
58
406
GA
92
5
1 14
2
0 0
18
3 2
5 0
2 10
1
1 0
6 9
0 0
0 12
1
0 11
5
16
73
HI
14
4 0
0 0
1 0
0 0
0 1
0 1
0 2
0 0
0 4
0 0
0 0
1 0
1 3
4 6
ID
42
3 0
5 3
0 0
5 0
0 1
0 2
2 1
1 0
0 9
1 1
0 8
0 0
4 1
5 31
IL
59
5
0 5
0 0
1 14
6
1 6
0 0
3 1
0 0
6 6
0 1
0 4
0 0
6 3
9 38
IN
44
0
0 6
0 0
2 11
1
1 2
0 1
4 3
0 0
10
0 0
1 0
2 0
0 4
1 5
31
IA
24
3 0
4 0
0 0
3 0
1 2
0 3
0 0
0 0
1 3
0 0
0 4
0 0
2 1
3 17
K
S
24
2 0
1 0
0 0
1 1
1 0
0 0
2 0
0 0
8 3
2 0
0 3
0 0
5 0
5 9
KY
31
2
0 6
0 0
0 10
2
0 2
0 0
1 1
0 0
3 0
0 0
0 4
0 0
2 3
5 19
LA
96
4
0 15
4
1 0
14
17
1 2
1 1
10
3 0
2 7
9 0
0 0
5 0
0 9
6 15
92
M
E
54
5 0
4 1
0 0
7 1
2 3
0 3
5 4
0 0
2 8
0 0
0 7
2 0
4 0
4 35
M
D
110
5 0
11
0 0
0 20
1
3 6
0 8
10
7 0
2 9
5 1
0 0
19
2 1
10
4 14
77
M
A
83
13
0 5
0 0
1 26
2
2 2
0 4
6 0
1 0
5 10
2
0 0
3 1
0 8
4 12
47
M
I 92
8
0 9
0 1
0 29
4
3 6
0 2
5 5
1 0
7 6
1 0
0 3
2 0
17
4 21
47
M
N
75
5 2
5 2
1 0
20
2 0
1 0
3 6
2 2
0 7
6 0
0 0
11
0 0
6 6
12
47
MS
41
1
0 5
0 1
0 6
4 1
3 0
0 5
2 0
0 4
2 1
0 0
4 2
0 10
3
13
31
MO
11
1 4
1 13
2
0 1
18
6 2
4 0
9 11
9
1 0
4 10
2
3 0
9 1
0 11
5
16
86
MT
16
1
0 2
1 0
0 4
0 1
0 0
0 3
0 0
0 1
1 0
0 0
2 0
0 6
0 6
10
NE
25
1
0 0
1 0
0 6
2 1
0 0
0 2
0 0
0 2
2 1
0 0
5 2
0 0
0 0
24
NV
48
0
1 0
0 0
0 14
0
4 1
0 1
1 2
1 0
13
6 0
0 0
3 1
0 3
2 5
41
Sudden medical condition 4 0 0 0 0 0 0 0 0 0 0 0 0 0 0 0 0 0 0 0 0 0 0 0 0 0 1 0 0 0
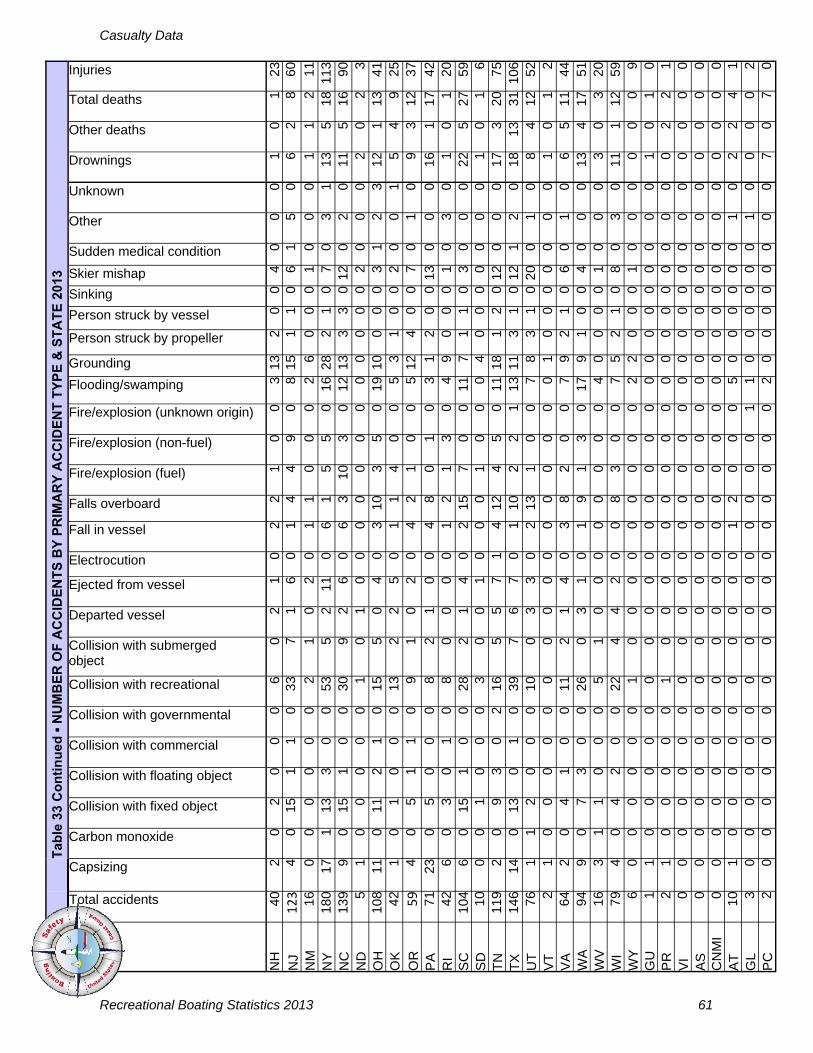
Casualty Data
Recreational Boating Statistics 2013 61
T
able
33
Co
nti
nu
ed ▪
NU
MB
ER
OF
AC
CID
EN
TS
BY
PR
IMA
RY
AC
CID
EN
T T
YP
E &
ST
AT
E 2
013
Total accidents
Capsizing
Carbon monoxide
Collision with fixed object
Collision with floating object
Collision with commercial
Collision with governmental
Collision with recreational
Collision with submerged object
Departed vessel
Ejected from vessel
Electrocution
Fall in vessel
Falls overboard
Fire/explosion (fuel)
Fire/explosion (non-fuel)
Fire/explosion (unknown origin)
Flooding/swamping
Grounding
Person struck by propeller
Person struck by vessel
Sinking
Skier mishap
Sudden medical condition
Other
Unknown
Drownings
Other deaths
Total deaths
Injuries
NH
40
2
0 2
0 0
0 6
0 2
1 0
2 2
1 0
0 3
13
2 0
0 4
0 0
0 1
0 1
23
NJ
123
4 0
15
1 1
0 33
7
1 6
0 1
4 4
9 0
8 15
1
1 0
6 1
5 0
6 2
8 60
NM
16
0
0 0
0 0
0 2
1 0
2 0
1 1
0 0
0 2
6 0
0 0
1 0
0 0
1 1
2 11
N
Y
180
17
1 13
3
0 0
53
5 2
11
0 6
1 5
5 0
16 2
8 2
1 0
7 0
3 1
13
5 18
113
N
C
139
9 0
15
1 0
0 30
9
2 6
0 6
3 10
3
0 12
13
3 3
0 12
0
2 0
11
5 16
90
N
D
5 1
0 0
0 0
0 1
0 1
0 0
0 0
0 0
0 0
0 0
0 0
2 0
0 0
2 0
2 3
OH
10
8 11
0
11
2 1
0 15
5
0 4
0 3
10
3 5
0 19
10
0 0
0 3
1 2
3 12
1
13
41
OK
42
1
0 1
0 0
0 13
2
2 5
0 1
1 4
0 0
5 3
1 0
0 2
0 0
1 5
4 9
25
OR
59
4 0
5 1
1 0
9 1
0 2
0 4
2 1
0 0
5 12
4
0 0
7 0
1 0
9 3
12
37
PA
71
23
0
5 0
0 0
8 2
1 0
0 4
8 0
1 0
3 1
2 0
0 13
0
0 0
16
1 17
42
R
I 42
6
0 3
0 1
0 8
0 0
0 0
1 2
1 3
0 4
9 0
0 0
1 0
3 0
1 0
1 20
S
C
104
6 0
15
1 0
0 28
2
1 4
0 2
15
7 0
0 11
7
1 1
0 3
0 0
0 22
5
27
59
SD
10
0
0 1
0 0
0 3
0 0
1 0
0 0
1 0
0 0
4 0
0 0
0 0
0 0
1 0
1 6
TN
11
9 2
0 9
3 0
2 16
5
5 7
1 4
12
4 5
0 11
18
1 2
0 12
0
0 0
17
3 20
75
T
X
146
14
0 13
0
1 0
39
7 6
7 0
1 10
2
2 1
13 1
1 3
1 0
12
1 2
0 18
13
31
106
U
T
76
1 1
2 0
0 0
10
0 3
3 0
2 13
1
0 0
7 8
3 1
0 20
0
1 0
8 4
12
52
VT
2
1 0
0 0
0 0
0 0
0 0
0 0
0 0
0 0
0 1
0 0
0 0
0 0
0 1
0 1
2 V
A
64
2 0
4 1
0 0
11
2 1
4 0
3 8
2 0
0 7
9 2
1 0
6 0
1 0
6 5
11
44
WA
94
9
0 7
3 0
0 26
0
3 1
0 1
9 1
3 0
17
9 1
0 0
4 0
0 0
13
4 17
51
W
V
16
3 1
1 0
0 0
5 1
0 0
0 0
0 0
0 0
4 0
0 0
0 1
0 0
0 3
0 3
20
WI
79
4 0
4 2
0 0
22
4 4
2 0
0 8
3 0
0 7
5 2
1 0
8 0
3 0
11
1 12
59
W
Y
6 0
0 0
0 0
0 1
0 0
0 0
0 0
0 0
0 2
2 0
0 0
1 0
0 0
0 0
0 9
GU
1
1 0
0 0
0 0
0 0
0 0
0 0
0 0
0 0
0 0
0 0
0 0
0 0
0 1
0 1
0 P
R
2 1
0 0
0 0
0 1
0 0
0 0
0 0
0 0
0 0
0 0
0 0
0 0
0 0
0 2
2 1
VI
0 0
0 0
0 0
0 0
0 0
0 0
0 0
0 0
0 0
0 0
0 0
0 0
0 0
0 0
0 0
AS
0
0 0
0 0
0 0
0 0
0 0
0 0
0 0
0 0
0 0
0 0
0 0
0 0
0 0
0 0
0 C
NM
I 0
0 0
0 0
0 0
0 0
0 0
0 0
0 0
0 0
0 0
0 0
0 0
0 0
0 0
0 0
0 A
T
10
1 0
0 0
0 0
0 0
0 0
0 1
2 0
0 0
5 0
0 0
0 0
0 1
0 2
2 4
1 G
L 3
0 0
0 0
0 0
0 0
0 0
0 0
0 0
0 1
1 0
0 0
0 0
0 1
0 0
0 0
2 P
C
2 0
0 0
0 0
0 0
0 0
0 0
0 0
0 0
0 2
0 0
0 0
0 0
0 0
7 0
7 0

Casualty Data
Recreational Boating Statistics 2013 62
Table 35 ▪ NUMBER OF FATAL VICTIMS BY LIFE JACKET WEAR, CAUSE OF DEATH & VESSEL TYPE 2013
Cause of Death
Life jacket worn?
Num
ber of deaths
Airboat
Auxiliary sailboat
Cabin
motorboat
Canoe
Houseboat
Inflatable
Kayak
Open
Personal
watercraft
Pontoon
Row
boat
Sailboat (only)
Sailboat (unknow
n)
Stand up
paddleboard
Other
Unknow
n
Carbon monoxide No 5 0 0 2 0 1 0 0 2 0 0 0 0 0 0 0 0 Cardiac arrest Yes 4 0 0 0 2 0 2 0 0 0 0 0 0 0 0 0 0 Cardiac arrest No 8 0 0 0 1 0 0 0 4 0 2 1 0 0 0 0 0 Drowning Yes 61 0 0 2 7 0 3 21 16 5 2 4 1 0 0 0 0 Drowning No 328 3 3 15 41 1 7 24 172 7 25 22 1 0 5 2 0 Drowning Unknown 9 0 0 0 0 0 0 0 1 1 0 0 0 7 0 0 0
Hypothermia Yes 4 0 1 0 1 0 0 1 0 0 0 1 0 0 0 0 0 Hypothermia No 1 0 0 0 0 0 0 0 1 0 0 0 0 0 0 0 0 Other Yes 3 0 0 0 0 0 0 0 1 1 0 0 1 0 0 0 0 Other No 1 0 0 0 0 0 1 0 0 0 0 0 0 0 0 0 0 Trauma Yes 39 0 0 1 0 0 0 1 15 19 3 0 0 0 0 0 0 Trauma No 50 0 0 3 1 0 0 1 39 1 4 0 1 0 0 0 0 Trauma Unknown 2 0 0 0 0 0 0 0 0 2 0 0 0 0 0 0 0
Unknown Yes 1 0 0 0 0 0 0 0 1 0 0 0 0 0 0 0 0 Unknown No 33 0 1 2 2 1 1 4 19 0 0 2 1 0 0 0 0 Unknown Unknown 11 0 1 0 0 0 0 2 1 0 0 0 0 1 0 0 6
All Causes 560 3 6 25 55 3 14 54 272 36 36 30 5 8 5 2 6
Table 34 ▪ NUMBER OF INJURED VICTIMS BY PRIMARY INJURY & VESSEL TYPE 2013
Primary Injury
Num
ber of injuries
Airboat
Auxiliary
sailboat
Cabin
motorboat
Canoe
Houseboat
Inflatable
Kayak
Open
motorboat
Personal
watercraft
Pontoon
Row
boat
Sailboat (only)
Other
Unknow
n
Amputation 28 0 1 4 0 1 0 0 12 5 3 1 0 0 1 Broken bone 451 15 3 33 1 4 1 3 221 150 15 1 0 0 2 Burns 88 1 2 41 0 1 0 0 39 2 1 0 0 0 1 Carbon monoxide 31 0 0 6 0 18 0 0 7 0 0 0 0 0 0 Concussion 259 2 4 16 1 0 1 2 147 73 7 0 6 0 0 Dislocation 70 1 1 2 2 0 1 2 43 14 2 0 2 0 0
Hypothermia 225 0 13 2 46 0 8 16 109 7 4 7 8 0 2 Internal organ injury 127 1 3 14 5 0 2 2 50 37 7 3 0 0 2 Laceration 618 14 12 50 6 1 3 7 362 129 21 1 4 0 6 Scrape/bruise 369 6 8 29 6 0 2 2 197 103 11 0 2 3 0
Spinal cord injury 43 1 0 5 0 0 0 0 29 6 1 0 0 1 0 Sprain/strain 239 2 4 19 3 1 0 4 137 60 7 1 1 0 0 Other 0 0 0 0 0 0 0 0 0 0 0 0 0 0 0 Unknown 61 0 2 2 0 0 0 2 20 12 1 0 0 1 21 All Injuries 2620 43 53 223 70 26 18 40 1380 601 80 14 24 5 35
Electric shock 0 0 0 0 0 0 0 0 0 0 0 0 0 0 0
Shock 11 0 0 0 0 0 0 0 7 3 0 0 1 0 0
Sailboat
(unknown)
0 0 0 0 0 0 0 3 1 1 0 0 0 0 0 0 5
Stand up
0 2 0 0 0 0 0 0 0 1 0 0 0 0 0 0 3
Registration Data
Registration Data
Recreational Boating Statistics 2013 64
Explanation of Registration Data Section
The following section contains fives tables and figures that examine boat registration information. Reg-istered vessels are those vessels that are required to be recorded by a state, which includes numbered vessels and other forms of registration. Not all states have the same registration requirements. While some states may only register vessels with a motor, others may register sailboats, canoes, kayaks, and rowboats in addition to those vessels with a motor. Recreational Vessel Registration by Year 1980-2013 (Table 36 & Figure 15, Page 65) This table provides information about recreational vessel registration for each year from 1980-2013. The accompanying figure displays a trend line from 1980-2013.
Recreational Vessel Registration by Length & Means of Propulsion (Table 37, Page 66) The top section of the table provides tallies for the number of mechanically-propelled vessels, the num-ber of manually-propelled vessels, and a summation of these two categories. The middle section of the table documents mechanically-propelled vessel registration by length category and engine type. The bottom section of the table focuses on manually-propelled vessels. Registration Data by State 2012-2013 (Table 38, Page 67) This table examines recreational vessel registration, deaths, and fatality rates by state for years 2013 and 2012. The fatality rate is calculated by dividing the number of fatalities by the total vessel registra-tion. The Coast Guard then multiplied by a factor of 100,000 to arrive at the number of deaths per 100,000 registered vessels. This table also specifies the scope of the state’s registration program. Distribution of 2013 Recreational Vessel Registration by State (Figure 16, Page 68) This figure provides the percentage that each state contributed to national registration figures. So, for instance, California registered 820,490 vessels. Out of the total national registration of 11,993,067, Cali-fornia contributed 6.8% ((820,490/11,993,067) * 100) of registered vessels. Please note that percent-ages have been rounded.
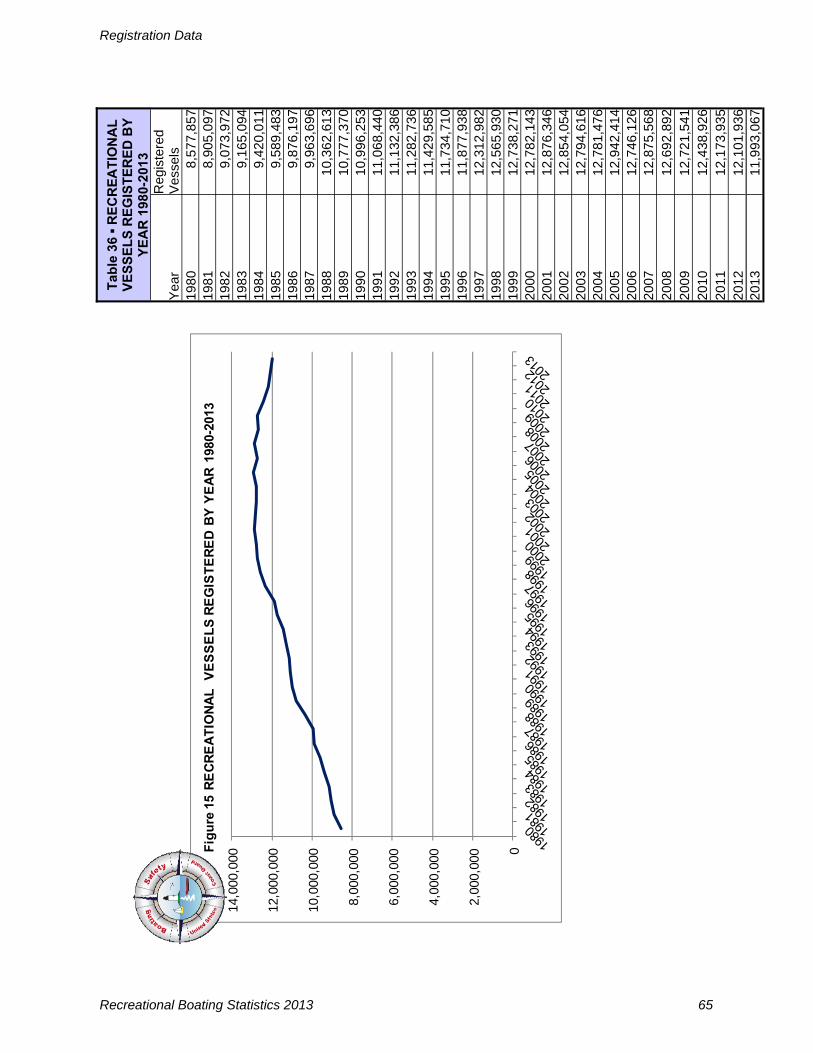
Registration Data
Recreational Boating Statistics 2013 65
0
2,00
0,00
0
4,00
0,00
0
6,00
0,00
0
8,00
0,00
0
10,0
00,0
00
12,0
00,0
00
14,0
00,0
00
Fig
ure
15
RE
CR
EA
TIO
NA
L
VE
SS
EL
S R
EG
IST
ER
ED
BY
YE
AR
198
0-20
13
Tab
le 3
6 ▪
RE
CR
EA
TIO
NA
L
VE
SS
EL
S R
EG
IST
ER
ED
BY
Y
EA
R 1
980-
2013
Yea
r R
egis
tere
d V
esse
ls
1980
8,
577,
857
1981
8,
905,
097
1982
9,
073,
972
1983
9,
165,
094
1984
9,
420,
011
1985
9,
589,
483
1986
9,
876,
197
1987
9,
963,
696
1988
10
,362
,613
19
89
10,7
77,3
70
1990
10
,996
,253
19
91
11,0
68,4
40
1992
11
,132
,386
19
93
11,2
82,7
36
1994
11
,429
,585
19
95
11,7
34,7
10
1996
11
,877
,938
19
97
12,3
12,9
82
1998
12
,565
,930
19
99
12,7
38,2
71
2000
12
,782
,143
20
01
12,8
76,3
46
2002
12
,854
,054
20
03
12,7
94,6
16
2004
12
,781
,476
20
05
12,9
42,4
14
2006
12
,746
,126
20
07
12,8
75,5
68
2008
12
,692
,892
20
09
12,7
21,5
41
2011
12
,173
,935
20
10
12,4
38,9
26
2013
11
,993
,067
20
12
12,1
01,9
36
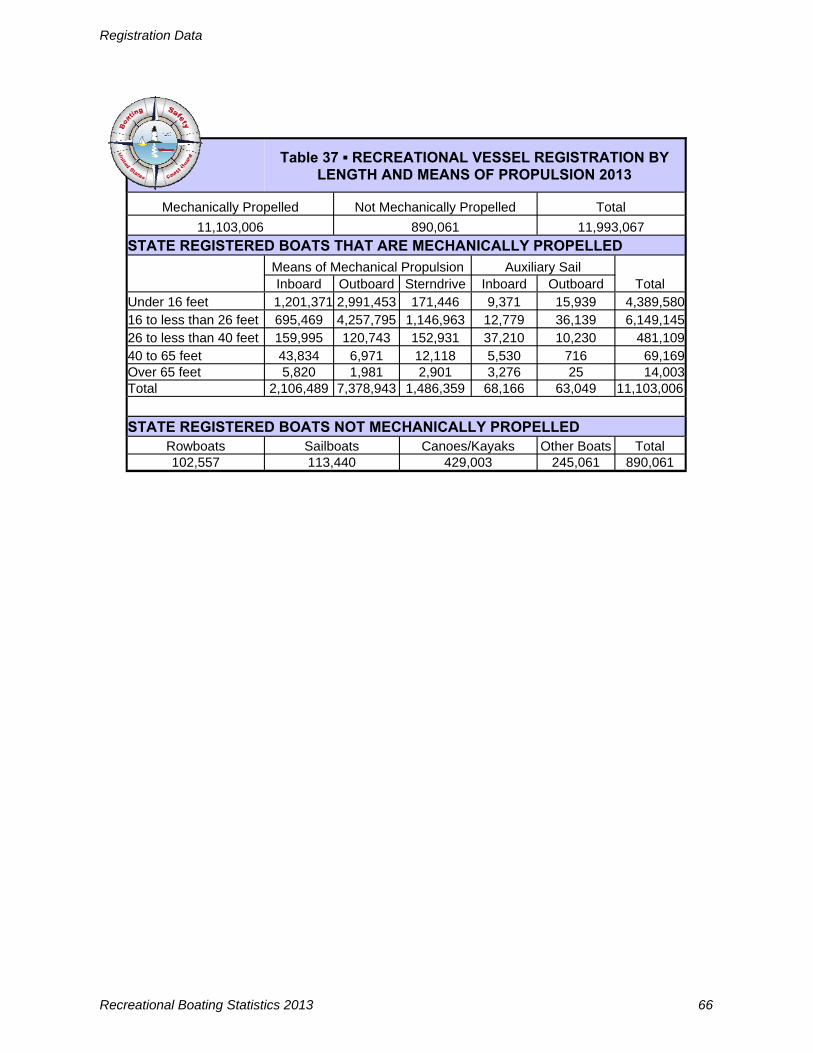
Registration Data
Recreational Boating Statistics 2013 66
Table 37 ▪ RECREATIONAL VESSEL REGISTRATION BY
LENGTH AND MEANS OF PROPULSION 2013
Mechanically Propelled Not Mechanically Propelled Total
11,103,006 890,061 11,993,067
STATE REGISTERED BOATS THAT ARE MECHANICALLY PROPELLED
Means of Mechanical Propulsion Auxiliary Sail
Total Inboard Outboard Sterndrive Inboard Outboard Under 16 feet 1,201,371 2,991,453 171,446 9,371 15,939 4,389,580 16 to less than 26 feet 695,469 4,257,795 1,146,963 12,779 36,139 6,149,145 26 to less than 40 feet 159,995 120,743 152,931 37,210 10,230 481,109 40 to 65 feet 43,834 6,971 12,118 5,530 716 69,169 Over 65 feet 5,820 1,981 2,901 3,276 25 14,003 Total 2,106,489 7,378,943 1,486,359 68,166 63,049 11,103,006
STATE REGISTERED BOATS NOT MECHANICALLY PROPELLED Rowboats Sailboats Canoes/Kayaks Other Boats Total 102,557 113,440 429,003 245,061 890,061
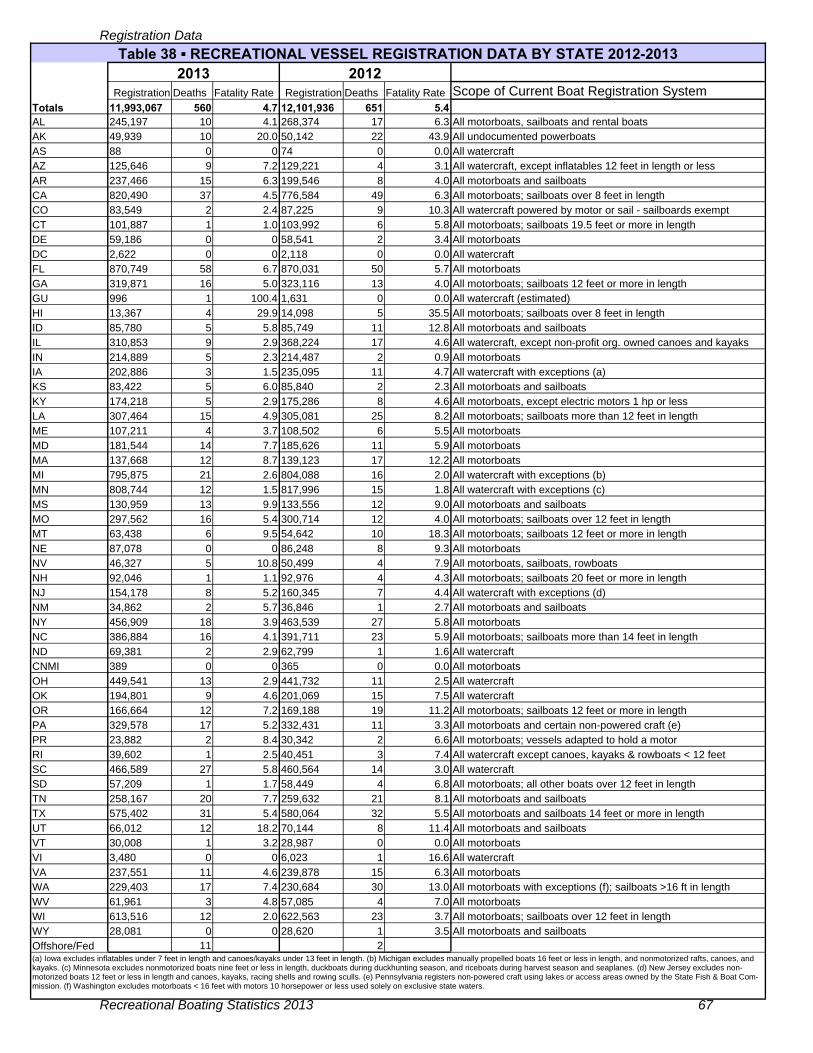
Registration Data
Recreational Boating Statistics 2013 67
Table 38 ▪ RECREATIONAL VESSEL REGISTRATION DATA BY STATE 2012-2013 2013 2012
Registration Deaths Fatality Rate Registration Deaths Fatality Rate Scope of Current Boat Registration System Totals 11,993,067 560 4.7 12,101,936 651 5.4 AL 245,197 10 4.1 268,374 17 6.3 All motorboats, sailboats and rental boats AK 49,939 10 20.0 50,142 22 43.9 All undocumented powerboats AS 88 0 0 74 0 0.0 All watercraft AZ 125,646 9 7.2 129,221 4 3.1 All watercraft, except inflatables 12 feet in length or less AR 237,466 15 6.3 199,546 8 4.0 All motorboats and sailboats CA 820,490 37 4.5 776,584 49 6.3 All motorboats; sailboats over 8 feet in length CO 83,549 2 2.4 87,225 9 10.3 All watercraft powered by motor or sail - sailboards exempt CT 101,887 1 1.0 103,992 6 5.8 All motorboats; sailboats 19.5 feet or more in length DE 59,186 0 0 58,541 2 3.4 All motorboats DC 2,622 0 0 2,118 0 0.0 All watercraft FL 870,749 58 6.7 870,031 50 5.7 All motorboats GA 319,871 16 5.0 323,116 13 4.0 All motorboats; sailboats 12 feet or more in length GU 996 1 100.4 1,631 0 0.0 All watercraft (estimated) HI 13,367 4 29.9 14,098 5 35.5 All motorboats; sailboats over 8 feet in length ID 85,780 5 5.8 85,749 11 12.8 All motorboats and sailboats IL 310,853 9 2.9 368,224 17 4.6 All watercraft, except non-profit org. owned canoes and kayaks IN 214,889 5 2.3 214,487 2 0.9 All motorboats IA 202,886 3 1.5 235,095 11 4.7 All watercraft with exceptions (a) KS 83,422 5 6.0 85,840 2 2.3 All motorboats and sailboats KY 174,218 5 2.9 175,286 8 4.6 All motorboats, except electric motors 1 hp or less LA 307,464 15 4.9 305,081 25 8.2 All motorboats; sailboats more than 12 feet in length ME 107,211 4 3.7 108,502 6 5.5 All motorboats MD 181,544 14 7.7 185,626 11 5.9 All motorboats MA 137,668 12 8.7 139,123 17 12.2 All motorboats MI 795,875 21 2.6 804,088 16 2.0 All watercraft with exceptions (b) MN 808,744 12 1.5 817,996 15 1.8 All watercraft with exceptions (c) MS 130,959 13 9.9 133,556 12 9.0 All motorboats and sailboats MO 297,562 16 5.4 300,714 12 4.0 All motorboats; sailboats over 12 feet in length MT 63,438 6 9.5 54,642 10 18.3 All motorboats; sailboats 12 feet or more in length NE 87,078 0 0 86,248 8 9.3 All motorboats NV 46,327 5 10.8 50,499 4 7.9 All motorboats, sailboats, rowboats NH 92,046 1 1.1 92,976 4 4.3 All motorboats; sailboats 20 feet or more in length NJ 154,178 8 5.2 160,345 7 4.4 All watercraft with exceptions (d) NM 34,862 2 5.7 36,846 1 2.7 All motorboats and sailboats NY 456,909 18 3.9 463,539 27 5.8 All motorboats NC 386,884 16 4.1 391,711 23 5.9 All motorboats; sailboats more than 14 feet in length ND 69,381 2 2.9 62,799 1 1.6 All watercraft CNMI 389 0 0 365 0 0.0 All motorboats OH 449,541 13 2.9 441,732 11 2.5 All watercraft OK 194,801 9 4.6 201,069 15 7.5 All watercraft OR 166,664 12 7.2 169,188 19 11.2 All motorboats; sailboats 12 feet or more in length PA 329,578 17 5.2 332,431 11 3.3 All motorboats and certain non-powered craft (e) PR 23,882 2 8.4 30,342 2 6.6 All motorboats; vessels adapted to hold a motor RI 39,602 1 2.5 40,451 3 7.4 All watercraft except canoes, kayaks & rowboats < 12 feet SC 466,589 27 5.8 460,564 14 3.0 All watercraft SD 57,209 1 1.7 58,449 4 6.8 All motorboats; all other boats over 12 feet in length TN 258,167 20 7.7 259,632 21 8.1 All motorboats and sailboats TX 575,402 31 5.4 580,064 32 5.5 All motorboats and sailboats 14 feet or more in length UT 66,012 12 18.2 70,144 8 11.4 All motorboats and sailboats VT 30,008 1 3.2 28,987 0 0.0 All motorboats VI 3,480 0 0 6,023 1 16.6 All watercraft VA 237,551 11 4.6 239,878 15 6.3 All motorboats WA 229,403 17 7.4 230,684 30 13.0 All motorboats with exceptions (f); sailboats >16 ft in length WV 61,961 3 4.8 57,085 4 7.0 All motorboats WI 613,516 12 2.0 622,563 23 3.7 All motorboats; sailboats over 12 feet in length WY 28,081 0 0 28,620 1 3.5 All motorboats and sailboats Offshore/Fed 11 2 (a) Iowa excludes inflatables under 7 feet in length and canoes/kayaks under 13 feet in length. (b) Michigan excludes manually propelled boats 16 feet or less in length, and nonmotorized rafts, canoes, and kayaks. (c) Minnesota excludes nonmotorized boats nine feet or less in length, duckboats during duckhunting season, and riceboats during harvest season and seaplanes. (d) New Jersey excludes non-motorized boats 12 feet or less in length and canoes, kayaks, racing shells and rowing sculls. (e) Pennsylvania registers non-powered craft using lakes or access areas owned by the State Fish & Boat Com-mission. (f) Washington excludes motorboats < 16 feet with motors 10 horsepower or less used solely on exclusive state waters.


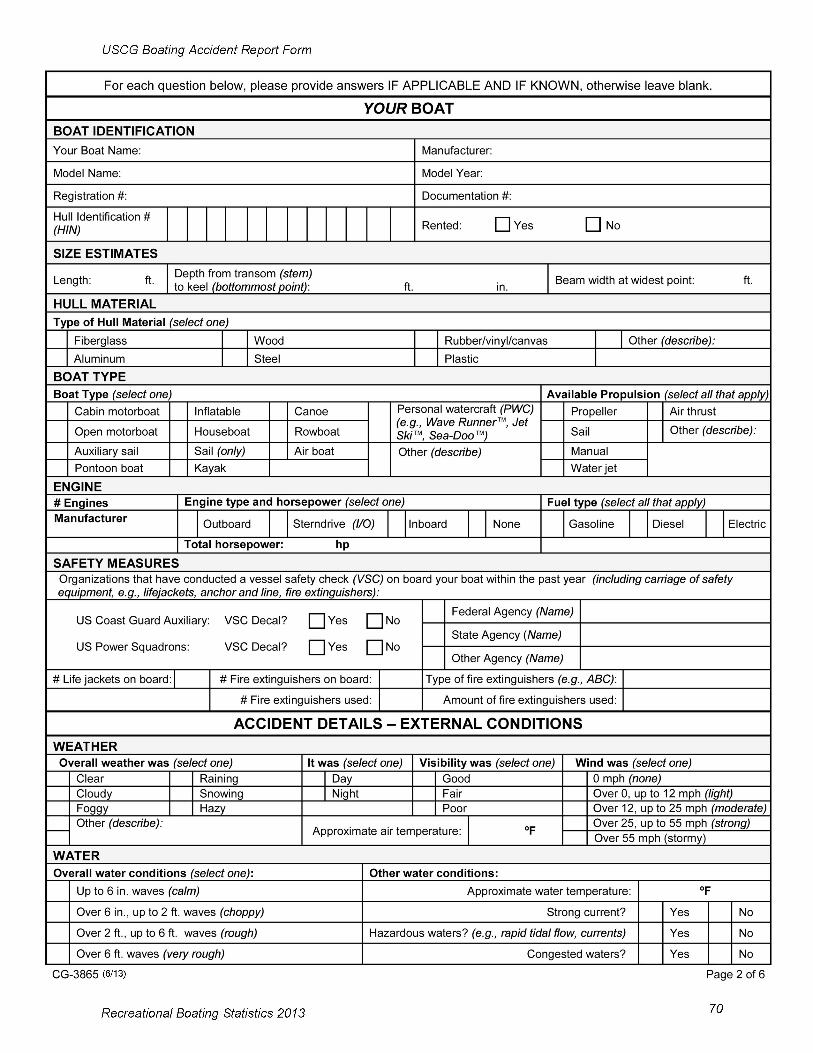
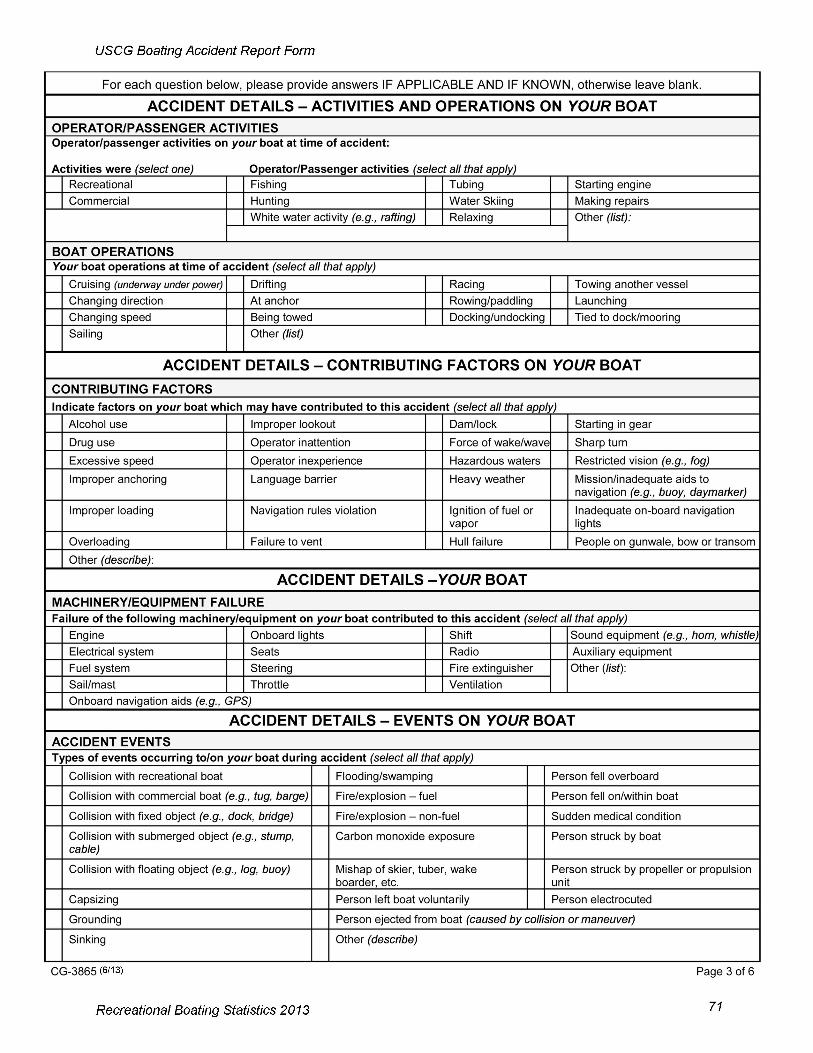
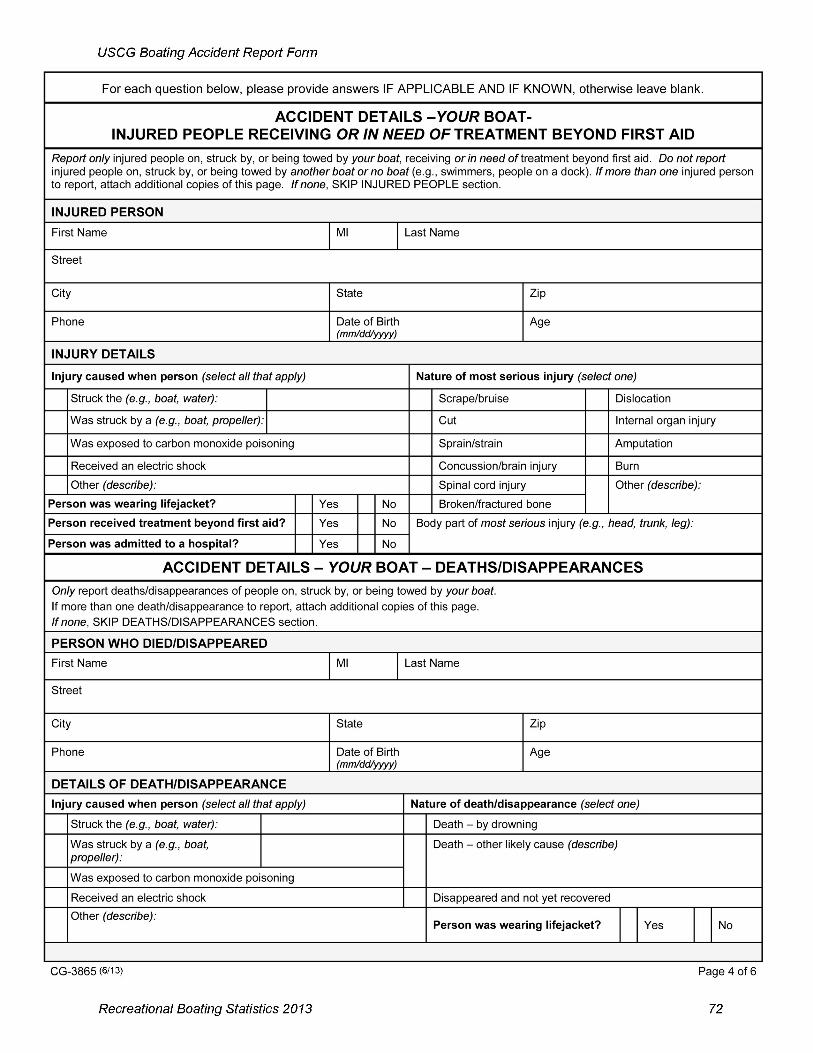

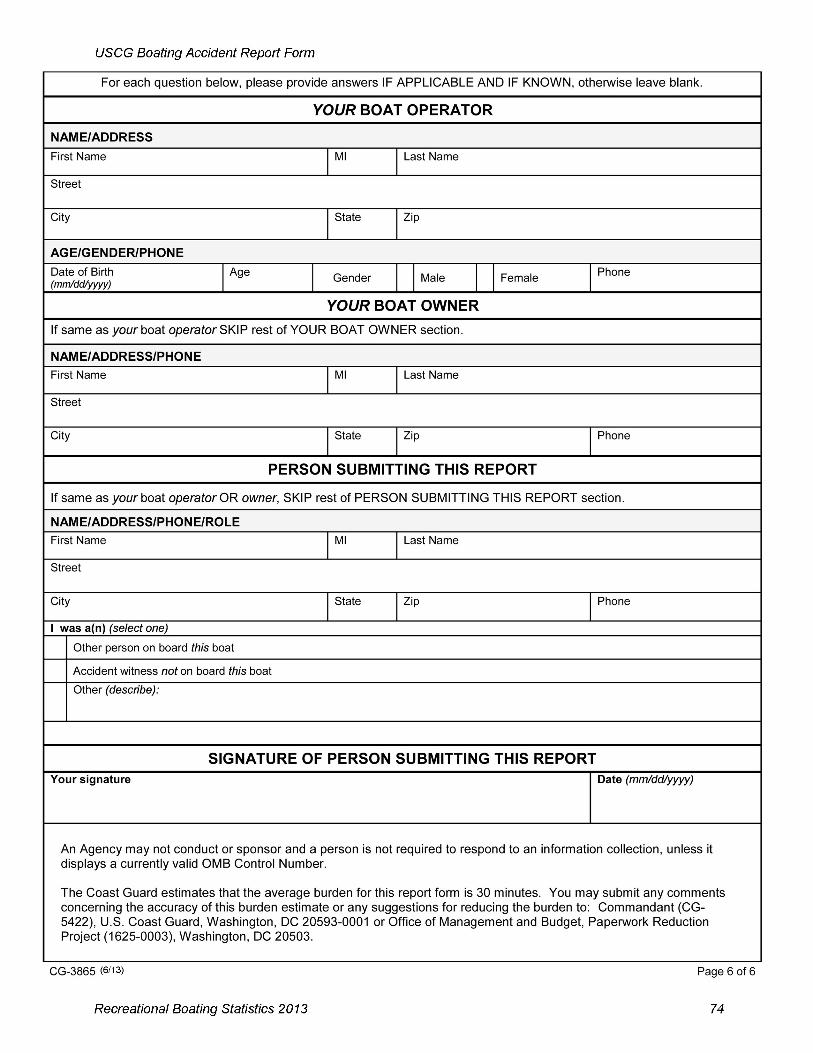
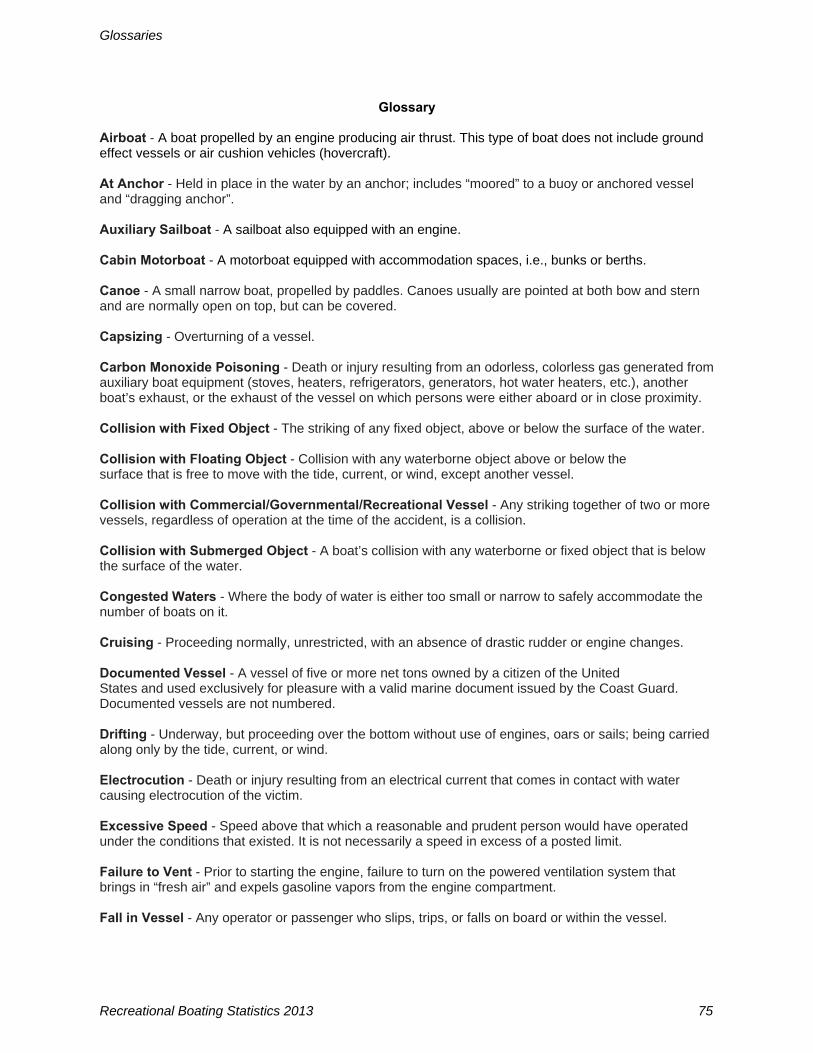
Glossaries
Recreational Boating Statistics 2013 75
Glossary Airboat - A boat propelled by an engine producing air thrust. This type of boat does not include ground effect vessels or air cushion vehicles (hovercraft). At Anchor - Held in place in the water by an anchor; includes “moored” to a buoy or anchored vessel and “dragging anchor”. Auxiliary Sailboat - A sailboat also equipped with an engine. Cabin Motorboat - A motorboat equipped with accommodation spaces, i.e., bunks or berths. Canoe - A small narrow boat, propelled by paddles. Canoes usually are pointed at both bow and stern and are normally open on top, but can be covered. Capsizing - Overturning of a vessel. Carbon Monoxide Poisoning - Death or injury resulting from an odorless, colorless gas generated from auxiliary boat equipment (stoves, heaters, refrigerators, generators, hot water heaters, etc.), another boat’s exhaust, or the exhaust of the vessel on which persons were either aboard or in close proximity. Collision with Fixed Object - The striking of any fixed object, above or below the surface of the water. Collision with Floating Object - Collision with any waterborne object above or below the surface that is free to move with the tide, current, or wind, except another vessel. Collision with Commercial/Governmental/Recreational Vessel - Any striking together of two or more vessels, regardless of operation at the time of the accident, is a collision. Collision with Submerged Object - A boat’s collision with any waterborne or fixed object that is below the surface of the water. Congested Waters - Where the body of water is either too small or narrow to safely accommodate the number of boats on it. Cruising - Proceeding normally, unrestricted, with an absence of drastic rudder or engine changes. Documented Vessel - A vessel of five or more net tons owned by a citizen of the United States and used exclusively for pleasure with a valid marine document issued by the Coast Guard. Documented vessels are not numbered. Drifting - Underway, but proceeding over the bottom without use of engines, oars or sails; being carried along only by the tide, current, or wind. Electrocution - Death or injury resulting from an electrical current that comes in contact with water causing electrocution of the victim. Excessive Speed - Speed above that which a reasonable and prudent person would have operated under the conditions that existed. It is not necessarily a speed in excess of a posted limit. Failure to Vent - Prior to starting the engine, failure to turn on the powered ventilation system that brings in “fresh air” and expels gasoline vapors from the engine compartment. Fall in Vessel - Any operator or passenger who slips, trips, or falls on board or within the vessel.

Glossaries
Recreational Boating Statistics 2013 76
Falls Overboard - Any operator or passenger who falls off of the vessel. Fiberglass (plastic) hull - Hulls of fiber-reinforced plastic. The laminate consists of two basic components, the reinforcing material (glass filaments) and the plastic or resin in which it is embed-ded. Fire/Explosion (fuel) - Accidental combustion of vessel fuel, liquids, including their vapors, or other substances such as wood. Fire/Explosion (other) - Accidental burning or explosion of any material onboard except vessel fuels or their vapors. Flooding/Swamping - Filling with water, regardless of method of ingress, but retaining sufficient buoyancy to remain on the surface. Force of Wave/Wake - The track in the water of a moving boat; commonly used for the disturbance of the water (waves) resulting from the passage of the boat’s hull. Fueling - Any stage of the fueling operation; primarily concerned with introduction of explosive or combustible vapors or liquids on board. Grounding - Running aground of a vessel, striking or pounding on rocks, reefs, or shoals; stranding. Hazardous Waters - Rapid tidal flows (the vertical movement of water) and/or currents (the horizontal flow of water) resulting in hazardous conditions in which to operate a boat. Houseboat - A motorized vessel designed primarily with accommodation spaces with little or no fore-deck or cockpit, with low freeboard and with a low length to beam ratio. Hull Failure - Defect or failure of the structural body of a vessel (i.e., hull material, design, or construc-tion) not including superstructure, masts, or rigging. Ignition of Spilled Fuel or Vapor - Accidental combustion of vessel fuel, liquids, and/or their vapors. Improper Anchoring - Where a boat is either in the process of being anchored incorrectly or incorrectly held in place in the water by an anchor. Improper Loading - Loading, including weight shifting, of the vessel causing instability, limited maneuverability, or dangerously reduced freeboard. Improper Lookout - No proper watch; the failure of the operator to perceive danger because no one was serving as lookout, or the person so serving failed in that regard. Every vessel shall at all times maintain a proper look-out by sight and hearing as well as by all available means appropriate in the pre-vailing circumstances and conditions so as to make a full appraisal of the situation and of the risk of col-lision. Inflatable - A vessel constructed with its sides and bow made of flexible tubes containing pressurized gas. On smaller inflatables, the floor and hull beneath it is often flexible. Kayak - A small boat with a cockpit that is propelled by a double-bladed paddle by a sitting paddler. Inadequate On-board Navigation Lights - Insufficient and/or improper lights shown by a boat that indi-cate course, position, and occupation, such as fishing or towing. Machinery Failure - Defect and/or failure in the machinery or material, design or construction, or com-
Glossaries
Recreational Boating Statistics 2013 77
ponents installed by the manufacturer involved in the mechanical propulsion of the boat (e.g., engine, transmission, fuel system, electric system, and steering system). Missing or Inadequate Navigation Aids - The absence of or ineffective presence of navigation aids. Motorboat - Any vessel equipped with propulsion machinery. Numbered vessel - An undocumented vessel numbered by a state with an approved numbering system under Chapter 123 of title 46, U.S.C. Open Motorboat - Craft of open construction specifically built for operating with a motor, including boats canopied or fitted with temporary partial shelters. Operator Inattention - Failure on the part of the operator to pay attention to the vessel, its occupants, or the environment in which the vessel is operating. Operator Inexperience - Lack of practical experience or knowledge in operating a vessel or, more par-ticularly, the vessel involved in the accident. Outboard - An engine not permanently affixed to the structure of the craft, regardless of the method or location used to mount the engine, e.g., motor wells, “kicker pits”, motor pockets, etc. Overloading - Excessive loading of the vessel causing instability, limited maneuverability, dangerously reduced freeboard, etc. People on Gunwale, Bow or Transom - Standing/Sitting on the upper edge of the side of a boat, usu-ally on a small projection above the deck; and/or standing/sitting on the most forward part of the boat; and/or standing/sitting on the back of the boat. Person Struck by Vessel - A person is struck by a boat. Person Struck by Propeller - A person is struck by the propeller, propulsion unit, or steering machin-ery. Personal Watercraft - Craft designed to be operated by a person or persons sitting, standing or kneel-ing on the craft rather than within the confines of a hull. Pontoon Boat - A boat consisting of a rigid structure connecting at least two parallel fore (front) and aft (back) rigid sealed buoyancy chambers. Restricted Vision - A vessel operator's vision is said to be restricted when it is limited by a vessel's bow high trim, or by glare, sunlight, bright lights, a dirty windshield, spray, a canopy top, etc. Rowboat - A open boat propelled by one or more persons using oars. Rules of the Road Infraction - Violation of the statutory and regulatory rules governing the navigation of vessels. Sailboat (only) - Any boat whose sole source of propulsion is the natural element (i.e., wind) or a boat designed or intended to be propelled primarily by sail, regardless of size or type. Sharp Turn - An immediate or abrupt change in the boat’s course of direction. Sinking - Losing enough buoyancy to settle below the surface of the water.
Glossaries
Recreational Boating Statistics 2013 78
Skier Mishap - Skier mishap is defined by persons (1) falling off their water-skis, (2) striking a fixed or submerged object, or by (3) becoming entangled or struck by the tow line. Also includes mishaps involv-ing inner-tubes and other devices on which a person can be towed behind a boat. Starting in Gear - The boat’s engine is started with the transmission in forward or reverse. Steel hull - Hulls of sheet steel or steel alloy, not those with steel ribs and wood, canvas, or plastic hull coverings. Sterndrive - An inboard/outboard engine system, with the engine inside the hull connected to an exter-nal lower unit containing a propeller. Steering is achieved by turning the lower unit. Sudden Medical Condition - An incident where a person on a vessel experiences an unexpected medi-cal condition. Towing - Engaged in towing any vessel or object, other than a person. Weather - As a contributing factor of an accident, “Weather” is supposed to signify a stormy or windy condition, usually connoting rough or high seas and dangerous operating conditions. Wood Hull - Hulls of plywood, molded plywood, wood planking, or any other wood fiber in its natural consistency, including those of wooden construction that have been “sheathed” with fiberglass or sheet metal.
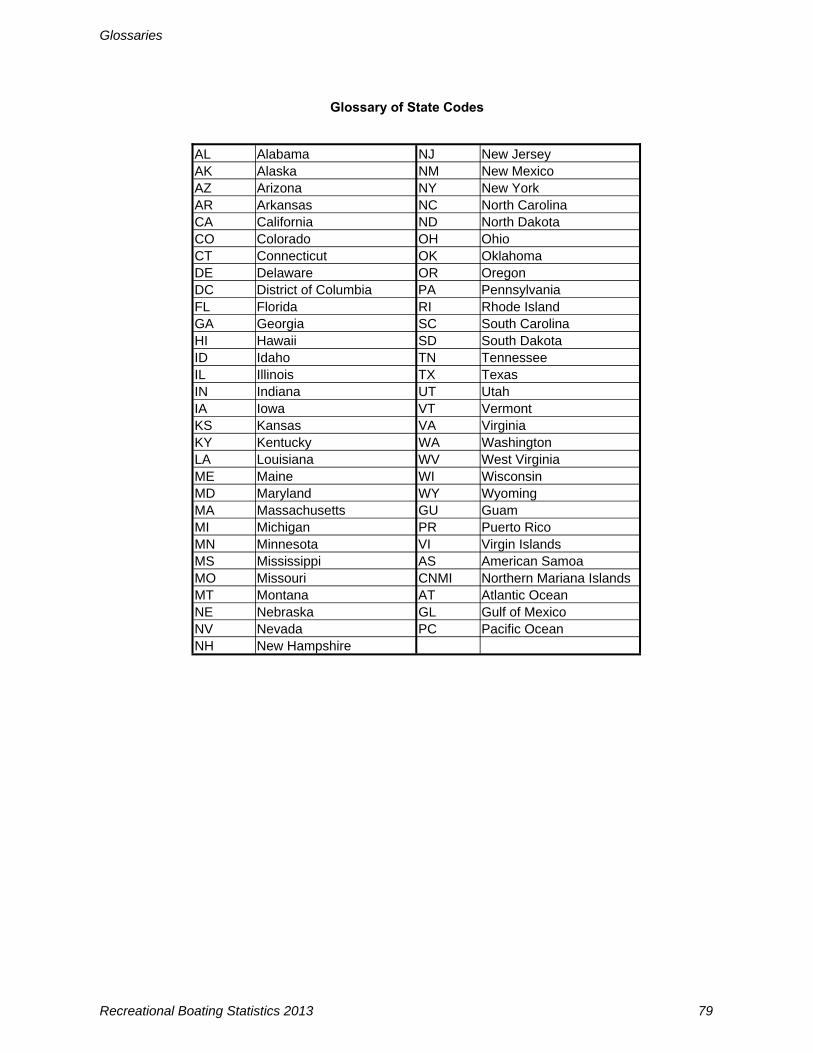
Glossaries
Recreational Boating Statistics 2013 79
Glossary of State Codes
AL Alabama NJ New Jersey AK Alaska NM New Mexico AZ Arizona NY New York AR Arkansas NC North Carolina CA California ND North Dakota CO Colorado OH Ohio CT Connecticut OK Oklahoma DE Delaware OR Oregon DC District of Columbia PA Pennsylvania FL Florida RI Rhode Island GA Georgia SC South Carolina HI Hawaii SD South Dakota ID Idaho TN Tennessee IL Illinois TX Texas IN Indiana UT Utah IA Iowa VT Vermont KS Kansas VA Virginia KY Kentucky WA Washington LA Louisiana WV West Virginia ME Maine WI Wisconsin MD Maryland WY Wyoming MA Massachusetts GU Guam MI Michigan PR Puerto Rico MN Minnesota VI Virgin Islands MS Mississippi AS American Samoa MO Missouri CNMI Northern Mariana Islands MT Montana AT Atlantic Ocean NE Nebraska GL Gulf of Mexico NV Nevada PC Pacific Ocean NH New Hampshire