2009 star interpreting and using results august 2009 webcast
TRANSCRIPT

2009 STAR2009 STARInterpreting and Using Interpreting and Using
ResultsResultsAugust 2009
Webcast

August 2009 Post-Test Workshop2
ObjectivesObjectives
Workshop participants will be able to:
• Describe the purposes of STAR reports
• Interpret STAR results
• Explain key statistics
• Compare and contrast types of reports
• Identify proper uses of reports
Handout (HO) 1
August 2009 Post-Test Workshop3
AgendaAgenda
• What’s New?• Results and Statistical Analysis• Using Results• Summary and Internet Reports• Data CDs• Individual Student Reports• Teacher Reports• Early Assessment Program
HO 1

August 2009 Post-Test Workshop4
What’s New in 2009What’s New in 2009
• CMA reports– Scale score, performance levels for grades 3–
5 – Percent correct for grades 6–8– Writing scores for grades 4 and 7
• CAPA new cut scores for all including scale scores for science
• STS reports– Scale score, performance levels for grades 2–
4 – Percent correct for grades 5–11
• Data CD: two files only
HO 2–3

August 2009 Post-Test Workshop5
Results: Results: Purposes of STAR ReportsPurposes of STAR Reports
• Report progress of students toward proficiency on the state’s academic content standards
• Notify where improvement needed– To help students’ achievement– To improve educational programs
• Provide data for state and federal accountability programs
HO 4

August 2009 Post-Test Workshop6
Results: Results: Performance Levels Performance Levels
• State Goal: All students score at proficient or higher
• CAPA Proficient: 35 or higher scale score
• 350 or higher scale score– All CST– STS, grades 2–4– CMA, grades 3–5
HO 4

August 2009 Post-Test Workshop7
Results: Results: Other Performance LevelsOther Performance Levels
• Advanced• Basic Cut Score
– CAPA: 30– CST: 300 – CMA, grades 3–5: 300– STS, grades 2–4: 300
• Below basic• Far below basic• Cut points vary for
advanced and below basic by – Subject– Grade
HO 4

August 2009 Post-Test Workshop8
Results: Scale ScoresResults: Scale Scores
• Scale scores allow same score to mean same thing across test versions within grade and content area
• Scale score ranges by program:– CST, CMA (grades 3–5), STS (grades 2–4):
150–600 for each grade and subject– CAPA: 15–60 for each level and subject
HO 5

August 2009 Post-Test Workshop9
Results: Equating Results: Equating
• Psychometric procedure
• Adjusts for test difficulty
• Additional information in the CST Technical Report on the CDE Web site
HO 5

August 2009 Post-Test Workshop10
Results: Reporting ClustersResults: Reporting Clusters(Content Areas)(Content Areas)
• Three to six clusters for each subject
• May be useful as indicators of individual or group strengths and weaknesses
• But… Reporting clusters should be interpreted with caution
HO 6–7

August 2009 Post-Test Workshop11
Results: Cluster Percent Correct Results: Cluster Percent Correct Available for 2009Available for 2009
• CST: all• CMA:
– Grades 3–5– Grade 7: Writing only
• STS– Grades 2–4– Grades 5–7, but no comparison with
proficient students statewide

August 2009 Post-Test Workshop12
Results: Reporting ClusterResults: Reporting ClusterCautionsCautions
• Based on small numbers of items; therefore, may not be reliable or generalizable
• NOT equated from year to year
• Should not compare reporting cluster percent correct from year to year
HO 6–7
August 2009 Post-Test Workshop13
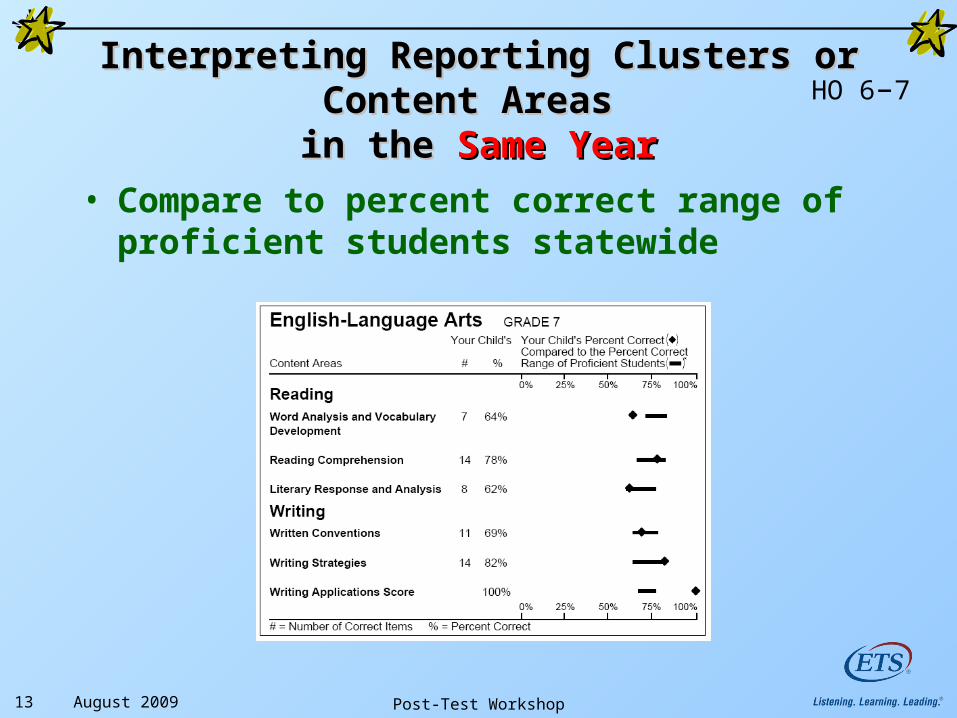
Interpreting Reporting Clusters or Interpreting Reporting Clusters or Content Areas Content Areas
in the in the Same YearSame Year• Compare to percent correct range of
proficient students statewide
HO 6–7
August 2009 Post-Test Workshop14
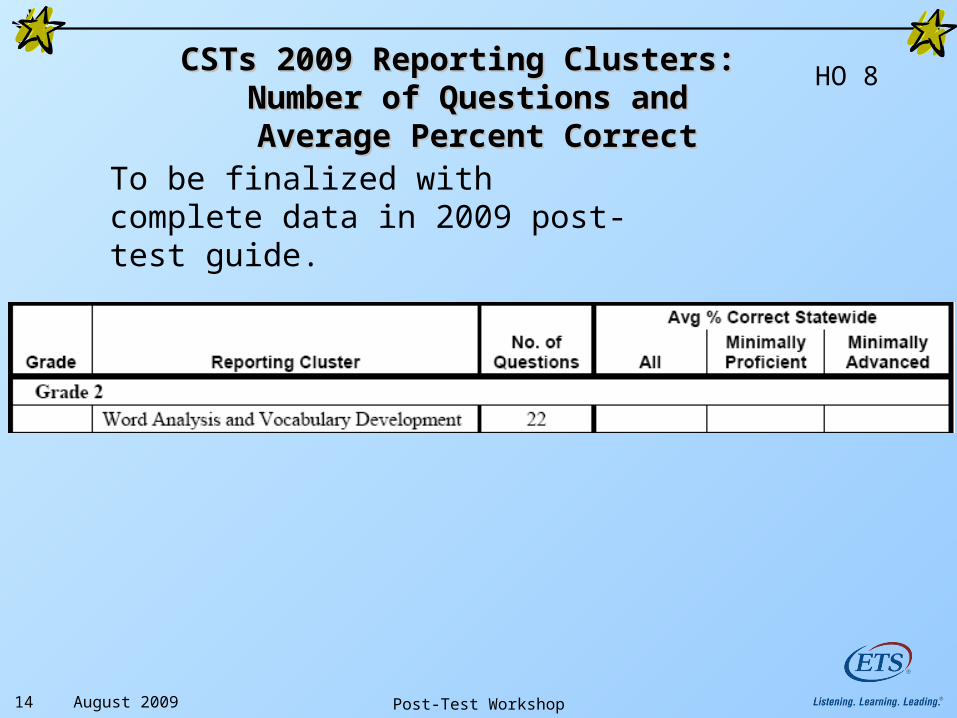
CSTs 2009 Reporting Clusters: CSTs 2009 Reporting Clusters: Number of Questions and Number of Questions and Average Percent CorrectAverage Percent Correct
To be finalized with complete data in 2009 post-test guide.
HO 8

August 2009 Post-Test Workshop15
ExamplesExamples—Interpreting Reporting —Interpreting Reporting Clusters for CST for Geometry Clusters for CST for Geometry

August 2009 Post-Test Workshop16
Using ResultsUsing Results
• For instructional decisions with other data• Used in Academic Performance Index (API)
calculations: CSTs, CAPA, CMA (grades 3–5 only)
• Used in adequate yearly progress (AYP) calculations, ELA and mathematics: – Grades 2–8 CSTs– Grades 3–5 CMA– Grades 2–8 and 10 CAPA

August 2009 Post-Test Workshop17
Year-to-Year ComparisonsYear-to-Year ComparisonsDoDo Compare CSTs: Compare CSTs:
Same Grade and Same Content AreaSame Grade and Same Content Area
• Mean scale score – Same content and grade, varying years
• Percent in each performance level– Same content by grade across years
• e.g., 2008 ELA grade 10 with 2009 ELA grade 10
HO 9

August 2009 Post-Test Workshop18
Year-to-Year ComparisonsYear-to-Year ComparisonsDoDo Compare CSTs: Compare CSTs:
Percent Proficient and AdvancedPercent Proficient and Advanced
• Percentage of students scoring at PROFICIENT and above– For a given grade and subject, e.g., Percent
proficient and above for grade 3 math in 2008 and 2009
– For a given subject and aggregated grades, e.g., Percent proficient and above for grades 2– 6 mathematics in 2008 and 2009
– Across grades and a subject, e.g., Percent proficient and above in all courses and all grades
HO 9

August 2009 Post-Test Workshop19
Year-to-Year ComparisonsYear-to-Year ComparisonsDON’TDON’T Compare Compare
• Individual scale scores or statistics based on scale scores for different grades or content areas– Subjects by grade are independently scaled – Different content standards are measured in
different grades• Cohorts across grades• Across tests• CAPA, CMA, STS to previous years
HO 9

August 2009 Post-Test Workshop20
ExampleExample—Using CST Results to —Using CST Results to Compare Grade Results from Year to Compare Grade Results from Year to
YearYear2008 CST for ELA
2009 CST for ELA
Grade % Prof or Above
% Prof or Above
Difference
Grade 2 31% 35% 4%
Grade 3 33% 33% 0%
Grade 4 29% 31% 2%
Grade 5 34% 32% -2%
Grade 6 31% 32% 1%
All Grades
32% 33% 1%
August 2009 Post-Test Workshop21
Aggregate (Summary) ReportsAggregate (Summary) Reports
• What are they?– Student Master List Summary– Student Master List Summary EOC– Subgroup Summary
• Report Emphasis: California Standards Tests (CSTs) – Criterion-referenced tests– Progress is measured in percent of students
scoring proficient and advanced

August 2009 Post-Test Workshop22
Student Master List SummaryStudent Master List Summary
• By grade
• CSTs, CMA, CAPA, and STS
• Lists subjects
• % and # at each performance level
• Mean scale score (CST, CAPA, CMA grades 3–5, STS grades 2–4)
• Reporting cluster: mean percent correct (CST, CMA grades 3–5, STS grades 2–7)
HO 10

August 2009 Post-Test Workshop23
Student Master List SummaryStudent Master List SummaryGrade 7 SampleGrade 7 Sample
HO 10

August 2009 Post-Test Workshop24
Student Master List SummaryStudent Master List SummaryBasic StatisticsBasic Statistics
HO 10

August 2009 Post-Test Workshop25
• All CST, CMA, CAPA, and STS multiple-choice answer documents submitted as scorable
• Minus- Documents marked as “Student
enrolled after the first day of testing and was given this test”
Who Counts? Who Counts? Number EnrolledNumber Enrolled HO 10

August 2009 Post-Test Workshop26
Who Counts? Number TestedWho Counts? Number Tested
• All CST, CMA, CAPA, STS answer documents with one or more answers
• Plus– Z = Tested but marked no answers
• Not included– A = Students absent– E = Not tested due to significant medical
emergency– P = Parent/guardian exemptions– T = Enrolled first day, not tested, tested at
previous school– Students with inconsistent grades– Non English learners who took STS
HO 10

August 2009 Post-Test Workshop27
Who Counts? Number and Who Counts? Number and Percent Valid ScoresPercent Valid Scores
• Number Valid Scores– For the subject, number of students tested at grade level who
received a score for the test (that is, a scale score or percent correct).
• Percent Valid Scores– For the subject, number of valid scores
divided by the number of students tested.– Not included:
Incomplete tests Modified tests Non-English learners who took the STS Unknown EOC mathematics (except grade 7 math) or science
tests Inconsistent grades
HO 10
August 2009 Post-Test Workshop28
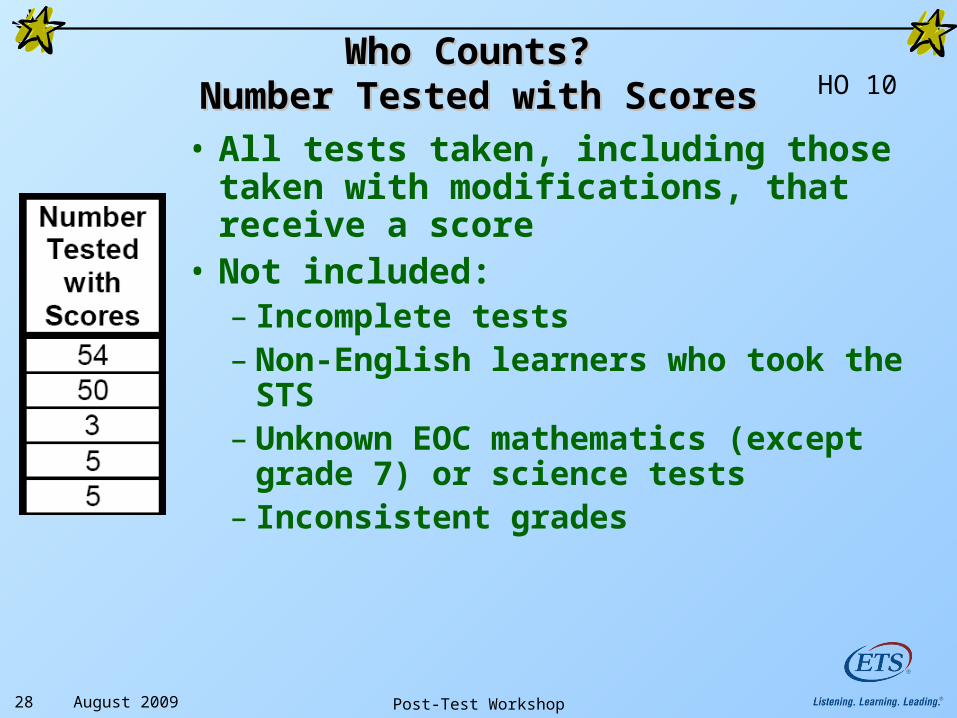
Who Counts? Who Counts? Number Tested with ScoresNumber Tested with Scores• All tests taken, including those taken
with modifications, that receive a score
• Not included:– Incomplete tests– Non-English learners who took the STS– Unknown EOC mathematics (except
grade 7) or science tests– Inconsistent grades
HO 10

August 2009 Post-Test Workshop29
Who Counts? Who Counts? Performance LevelsPerformance Levels
• All CSTs, CAPA
• CMA Grades 3–5
• STS Grades 2–4
• Advanced, proficient, basic, below basic– All valid scores falling in the performance level
• Far below basic– All valid scores falling in the performance level – CSTs taken with modifications (in aggregate
reporting and accountability only)
HO 10

August 2009 Post-Test Workshop30
Student Master List SummaryStudent Master List SummaryPerformance LevelsPerformance Levels
HO 10

August 2009 Post-Test Workshop31
Student Master List SummaryStudent Master List SummaryReporting ClustersReporting Clusters
Compare to:
Average percent correct range for students statewide who scored proficient on the total test
HO 10

August 2009 Post-Test Workshop32
Student Master List Summary:Student Master List Summary:WritingWriting
B = BlankC = Copied promptI = IllegibleL = Language other than
English
R = RefusalT = Off TopicW = Wrong prompt
(Prompt from an earlier administration)
HO 10

August 2009 Post-Test Workshop33
Student Master List Summary: Student Master List Summary: End-of-Course (EOC) CST and STSEnd-of-Course (EOC) CST and STS
• By subject• Lists each grade eligible to take test • Math (Grades 7–11)
– CST General Math, Algebra I, Geometry, etc.– STS Algebra I and Geometry
• CST Science (Grades 9–11)– Earth Science, Biology, Chemistry, etc.
• CST History–Social Science (Grades 9–11)– World History
• Same statistics as grade-level Student Master List Summary
HO 11

August 2009 Post-Test Workshop34
Student Master List Summary Student Master List Summary End-of-Course, Biology End-of-Course, Biology
HO 11

August 2009 Post-Test Workshop35
Subgroup Summary:Subgroup Summary:CSTs, CMA, CAPA, and STSCSTs, CMA, CAPA, and STS
• Disability status– Based on Disability Status for CST, CMA, STS– CAPA: each disability code
• If missing, correct with demographic data corrections
• Economic Status– Based on NSLP eligibility and
parent education level• Gender• English proficiency• Primary ethnicity• Ethnicity for Economic Status (only for CSTs, CMA
grades 3–5, and CAPA)

August 2009 Post-Test Workshop36
Subgroup Summary: Subgroup Summary: Ethnicity for Economic Status Ethnicity for Economic Status
HO 12

August 2009 Post-Test Workshop37
Subgroup Summary: Subgroup Summary: Ethnicity for Economic StatusEthnicity for Economic Status
HO 12
Example: Economically Example: Economically disadvantaged for each ethnicitydisadvantaged for each ethnicity

August 2009 Post-Test Workshop38
Subgroup Summary: Subgroup Summary: Ethnicity for Economically DisadvantagedEthnicity for Economically Disadvantaged
HO 12

Break — Break — 10 minutes10 minutes
August 2009 Post-Test Workshop40
Internet ReportsInternet Reports
• Summaries based on same data as paper reports: CSTs, CMA, CAPA, STS
• Available to the public online for school, district, county, and state
• More subgroups than paper reports– Parent education– Special program participation
• Access from http://star.cde.ca.gov

August 2009 Post-Test Workshop41
Internet Reports:Internet Reports:Available ReportsAvailable Reports• CSTs
– Mean scale scores– Percents by
performance levels• CST Summary
– Percent proficient and advanced
• CMA– Grades 3–5: mean
scale scores, percents by performance levels
– Grades 6-8: average percent correct
• CAPA– Mean scale scores – Percents by
performance levels• STS
– Grades 2–4: mean scale scores, percents by performance levels
– Grades 5-11: average percent correct
August 2009 Post-Test Workshop42
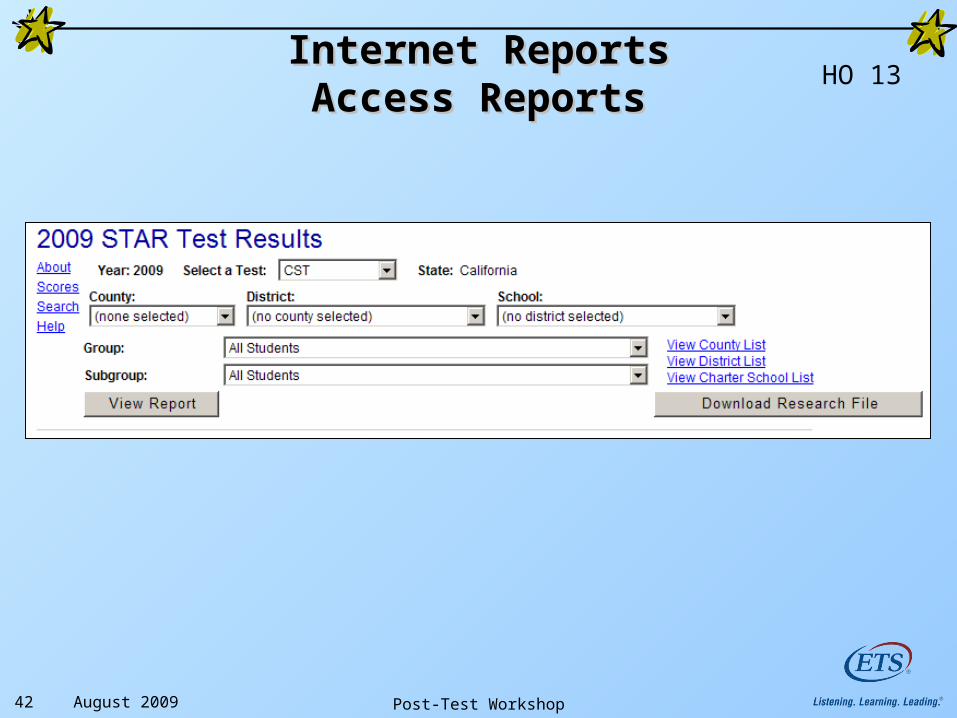
Internet ReportsInternet ReportsAccess ReportsAccess Reports
HO 13

August 2009 Post-Test Workshop43
Internet Reports:Internet Reports:CST SampleCST Sample HO 13

August 2009 Post-Test Workshop44
Internet Reports:Internet Reports:CST Summary SampleCST Summary Sample
HO 14

August 2009 Post-Test Workshop45
Internet Reports: CMAInternet Reports: CMA HO 14

August 2009 Post-Test Workshop46
Internet Reports: STSInternet Reports: STSHO 15
CAPA on HO 16

August 2009 Post-Test Workshop47
Data CDsData CDs• What are they?
– Lists of information from answer documents and scores of every student in district
– In .txt format: wraps
• What are they used for?– Searching for specific data– Creating unique reports– Verifying paper reports
• What else is needed?– Text editor – or Desktop application– or Student Information System
HO 18

August 2009 Post-Test Workshop48
View of DataView of Data
• As .txt, word wrap on
• With text editor, word wrap off
HO 18

August 2009 Post-Test Workshop49
Organization of DataOrganization of Data•Two files:
– Demographics, special conditions, and test scores
– Accommodations, modifications, English Learners, and irregularities
•Data Layout = guide to location of data on files
– Position
– Number of characters
– Whether numeric or alpha
HO 18

August 2009 Post-Test Workshop50
Data Layout SampleData Layout Sample HO 18

August 2009 Post-Test Workshop51
Individual ReportsIndividual Reports• STAR Student Record Label
– Adhesive label to affix to student’s permanent school record
• STAR Student Master List– Alphabetical list of students and their scores– Tests listed in order within grade
• CSTs• CMA• CAPA • STS
• STAR Student Report: individual’s scores– 2 two-sided color copies for each test– For parents/guardians

August 2009 Post-Test Workshop52
Student Record Label Grade 10 Sample:Student Record Label Grade 10 Sample:Student Name and Identification Student Name and Identification HO 19

August 2009 Post-Test Workshop53
Student Record Label:Student Record Label:CST for Grade 10 Results CST for Grade 10 Results
HO 19

August 2009 Post-Test Workshop54
Student Master List:Student Master List:CSTs/CMA for Grade 3 SampleCSTs/CMA for Grade 3 Sample HO 20

August 2009 Post-Test Workshop55
Student Master List:Student Master List:CSTs/CMA for Grade 3 SampleCSTs/CMA for Grade 3 Sample HO 20

August 2009 Post-Test Workshop56
Student Report:Student Report:CST for Grade 10 SampleCST for Grade 10 Sample HO 21–22

August 2009 Post-Test Workshop57
Student Report:Student Report:CST for Grade 10 SampleCST for Grade 10 Sample HO 21

August 2009 Post-Test Workshop58
Student Report:Student Report:CSTs for Grade 10 SampleCSTs for Grade 10 Sample
♦= Percent correct obtained by the student on the reporting cluster/content area
▬▬▬ = Range of percent correct scores on the reporting cluster for students statewide who scored proficient on that test
HO 22
Student nameon back

August 2009 Post-Test Workshop59
Student Report:Student Report:CST for Grade 11 CST for Grade 11
with EAP Results Samplewith EAP Results SampleHO 23
Label the location of the EAP report on HO 23.

August 2009 Post-Test Workshop60
CMA Grade 7 Report BackCMA Grade 7 Report Back HO 24
Label the location of the CMA Writing Application results on HO 24.

August 2009 Post-Test Workshop61
Explain to ParentsExplain to ParentsScale Score Scale Score Average % correct cluster Average % correct cluster
score x 600score x 600
• Reporting Clusters not comparable– Different difficulty
– Varying number of questions
– Average % correct of clusters % correct of total scale score
• Scale scores– Use conversion tables and other statistical
techniques
– Equating allows scores to have similar meaning (e.g., 350 = lowest score for CSTs proficient)

August 2009 Post-Test Workshop62
Other Student ReportsOther Student Reports• CMA
– Performance levels grades 3–5 – Percent correct grades 6–8– Back, “About the CMA,” – Back, cluster reporting grades 3–5 and grade 7 writing
• CAPA – Back, “About the CAPA”
• STS – In Spanish– Performance levels and scale scores reported for grades
2–4– Percent correct for entire test for grades 5–11– Back, cluster percent correct for grades 2–7– Back, how to use report
HO 24–26

August 2009 Post-Test Workshop63
Unmatched ReportUnmatched Report
• Grades 4 and 7– Unmatched Multiple-Choice Report
• CST multiple-choice score but no writing score• CMA Multiple-choice score but no writing score
– Unmatched Writing Report• Writing score but no CST multiple-choice score• Writing score but no CMA multiple-choice
score– Students receive 2 reports if writing score not
matched to multiple-choice score
HO 28

August 2009 Post-Test Workshop64
Unmatched Report:Unmatched Report: HO 28

August 2009 Post-Test Workshop65
California Reports for TeachersCalifornia Reports for Teachers
• Summary of results for previous year’s class(es)• Two types of summary reports:
– By grade level (e.g., grade 11 ELA) or course (e.g., Algebra I) for all schools
– By teacher name or group name (e.g., GATE) if on Pre-ID or SGID (latter takes precedence)
• Separate reports for:– CST ELA– CST Mathematics
• Not available for:– CST science or history–social science– CMA – CAPA– STS
August 2009 Post-Test Workshop66
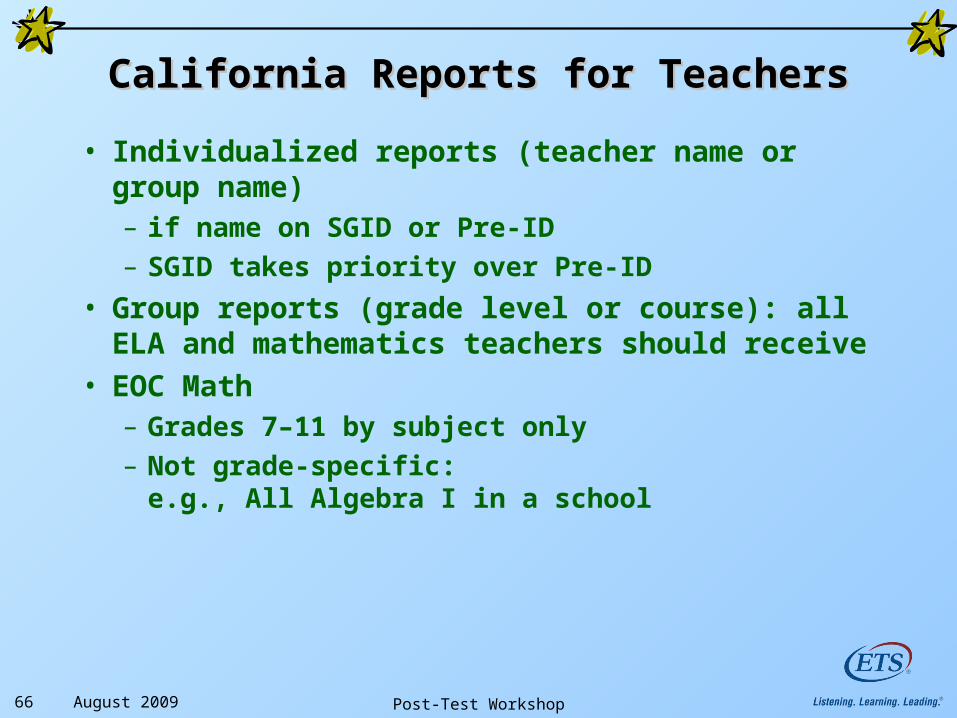
California Reports for TeachersCalifornia Reports for Teachers
• Individualized reports (teacher name or group name)– if name on SGID or Pre-ID– SGID takes priority over Pre-ID
• Group reports (grade level or course): all ELA and mathematics teachers should receive
• EOC Math– Grades 7–11 by subject only– Not grade-specific:
e.g., All Algebra I in a school

August 2009 Post-Test Workshop67
Report for Teachers:Report for Teachers:Grade 4 SampleGrade 4 Sample
HO 29–30

August 2009 Post-Test Workshop68
Report for Teachers:Report for Teachers:2009 Performance2009 Performance
By Reporting ClustersBy Reporting Clusters
Reporting clusters defined and focus suggested under this section.
HO 29

August 2009 Post-Test Workshop69
California Report for Teachers:California Report for Teachers:Cluster ReportingCluster Reporting
• For each reporting cluster, the average percent correct achieved by:– Statewide students– District students– Your students– Proficient range
• Definition of symbols = Average % correct for teacher’s students
▬▬▬ = Average % correct range for students statewide who scored proficient on that test
HO 29

August 2009 Post-Test Workshop70
California Report for Teachers:California Report for Teachers:BackBack
• School % at each performance level by subgroups
• % Proficient and above– 2008 vs. 2009– School, district, state– By subgroup
• Resources
HO 30

August 2009 Post-Test Workshop71
SummarySummary
• Do’s and Don’ts – Do compare mean scale score, percent at performance
levels within same grade, same content area– Don’t compare mean scale scores across grades,
content area• Summary reports• Data CDs• Individual reports• Teacher reports• Quiz answers• Evaluations

August 2009 Post-Test Workshop72
For more information see:For more information see:• http://www.cde.ca.gov/ta/tg/sr/• http://www.star.cde.ca.gov• http://www.startest.org/ • STAR Technical Assistance Center
800-955-2954• Data CD Webcast:
http://webcast.sdcoe.net/ets052709a/index.htm• CDE Accountability
– [email protected] – 916-319-0863

To contact CDETo contact CDE
• CDE STAR office: 916-445-8765– English–Language Arts tests, including writing: Jamie
Contreras, [email protected], 916-319-0353– Mathematics tests: Jane Liang, [email protected],
916-322-1854– History–Social Science tests: Nicole Jespersen,
[email protected], 916-319-0364– CAPA, CMA: Don Killmer, [email protected], 916-
319-0350– STS: Dianna Gutierrez, [email protected], 916-
319-0337
August 2009 Post-Test Workshop73