12 matu the demographic transition
TRANSCRIPT

The Demographic Transition
To be able to explain the DTM and explain why countries are in different
stages.

What happens to Birth and Death rates as countries get richer?
Natural
increase %
Birth rate
Per 1000
Death rate
per 1000
IMR per
1000
Life expec.
Years
Total
fertility rate
Pop.
Density per
sq km
World 1.2 21 9 52 2.7 49
MEDCs 0.1 11 10 6 1.6 27
LEDCs 1.5 23 8 57 2.9 65
Africa 2.4 38 14 86 5.0 31
N. America 0.6 14 8 6 2.0 15
Latin
America
1.5 21 6 24 2.5 28
Asia 1.2 19 7 48 2.4 126
Europe -0.1 10 11 6 1.5 32
Oceania 1.0 18 7 27 2.1 4
68
77
66
53
73
68
77
75
75

Population growth in perspective….World Population Clock: 7 Billion People -
Worldometers
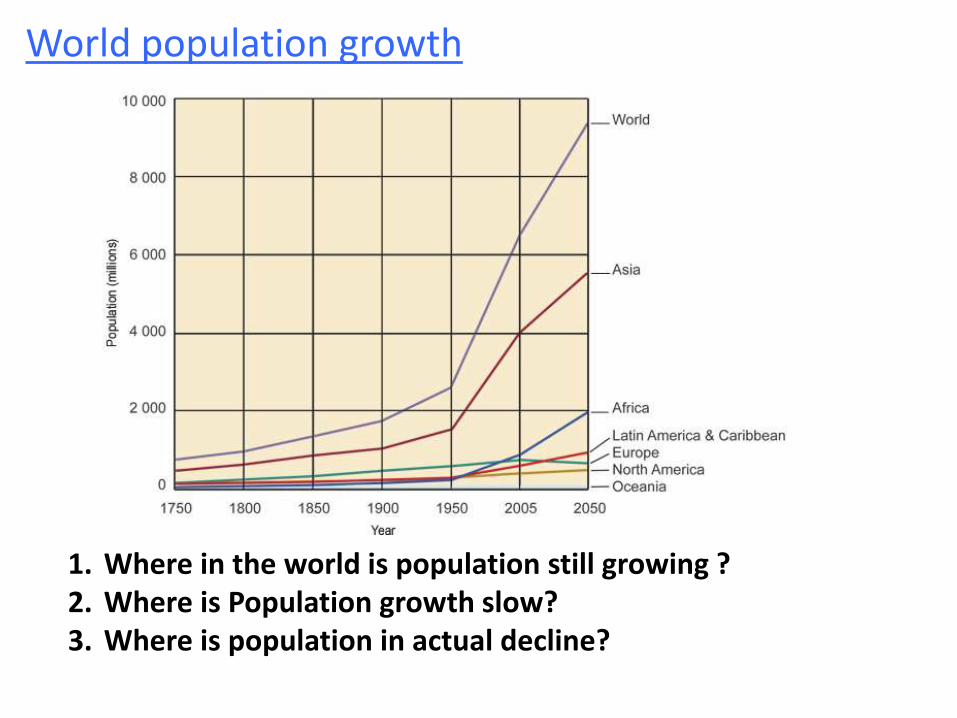
World population growth
1. Where in the world is population still growing ? 2. Where is Population growth slow? 3. Where is population in actual decline?

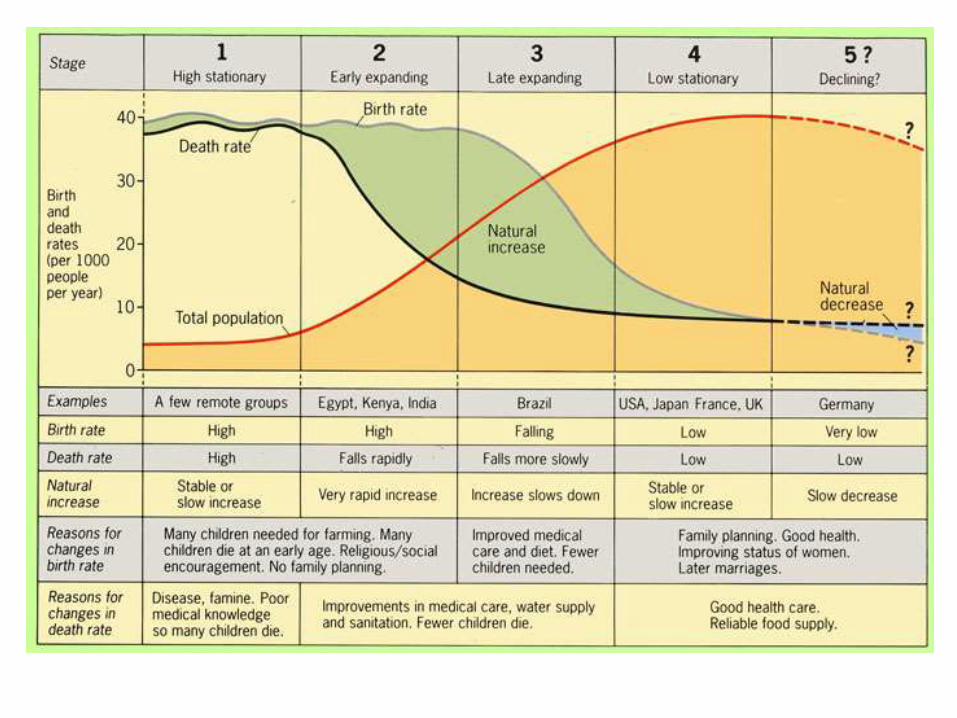
The Demographic Transition
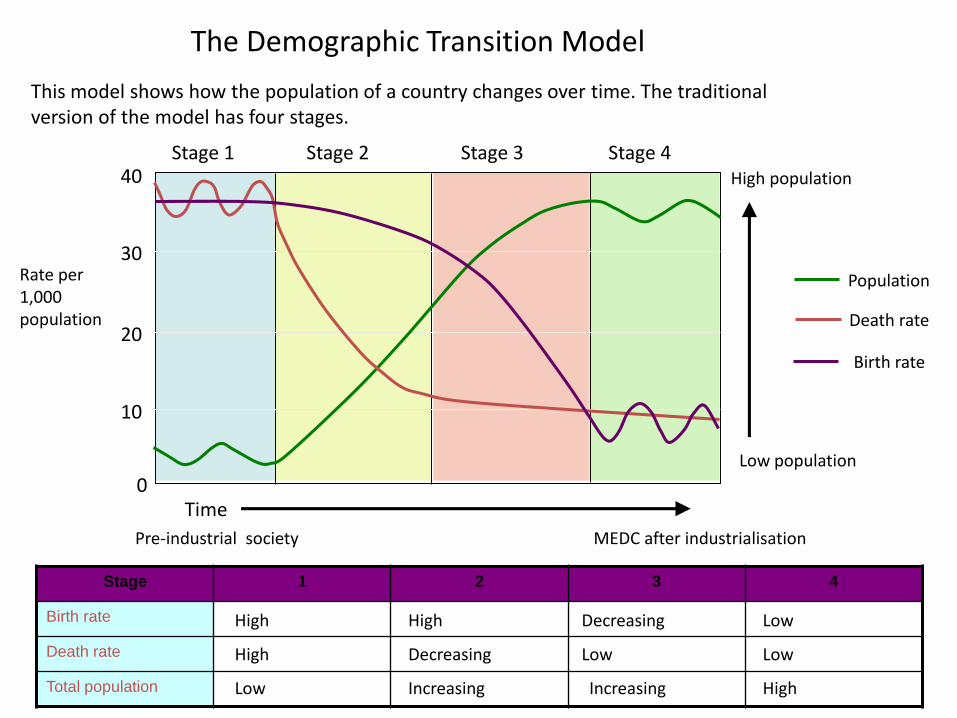
The Demographic Transition Model
This model shows how the population of a country changes over time. The traditional version of the model has four stages.
Low population
High population
Pre-industrial society MEDC after industrialisation
10
20
30
40
0
Rate per1,000 population
Stage 1 Stage 2 Stage 3 Stage 4
Time
Population
Death rate
Birth rate
Stage 1 2 3 4
Birth rate
Death rate
Total population
High
High
Increasing High
Decreasing
Low
Low
DecreasingHigh
Low
IncreasingLow

15
65
Age
Population structure and the DTM
0
10
20
30
40
Rat
e p
er 1
,00
0 p
op
ula
tio
n
Low population
High population
Time
Stage 1 Stage 2 Stage 3 Stage 4
Stage 1 expanding Stage 2 expanding Stage 3 stationary Stage 4 contracting
High birth rate; rapid fall in each upward age group due to high death rates; short life expectancy
High birth rate; fall in death rate as more living in middle age; slightly longer life expectancy.
Declining birth rate; low death rate; more people living to old age.
Low birth rate; low death rate; high dependency ratio; longer life expectancy
male
female
Percentage
Population
Death rate
Birth rate

The Use of the Demographic Transition Model
Fill the gap: Afghanistan, birth, country, death, fall, first, Lanka, model, people, predict, quickly, rates, time, total, useful.
The demographic transition ___________ (DTM) shows birth and ___________ rates as well as the total population growth ___________. It suggests how these figures change over ___________. Therefore, it shows that a ___________ with a high ___________ rate and a high death rate has a small total population such as ___________. In the future the model shows that both birth rates and death rates will probably ___________, but as the death rate falls ___________ the total population will grow very ___________ during these stages. Countries like Sri ___________ are growing very quickly. The DTM is ___________ as it lets governments ___________ what will happen to their populations. It shows that if measures are taken to reduce birth rates then the ___________ population will not grow as quickly.

Is there a stage 5?
It has been suggested that countries where birth rates fall below death rates to give a declining population may form stage 5.
Most of these are in Europe
Country Birth rate (/000) Death rate
(/000)
Hungary 10 13
Germany 8 10
Belarus 9 14
The UK's population is expected to start declining by 2021.
The fifth stage of the DTM

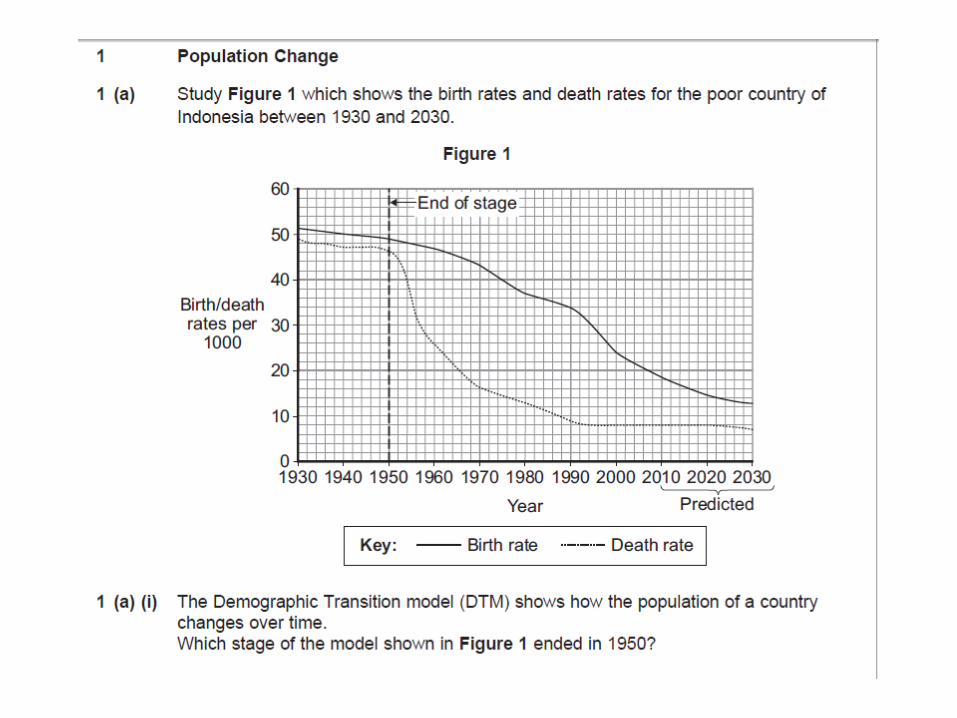
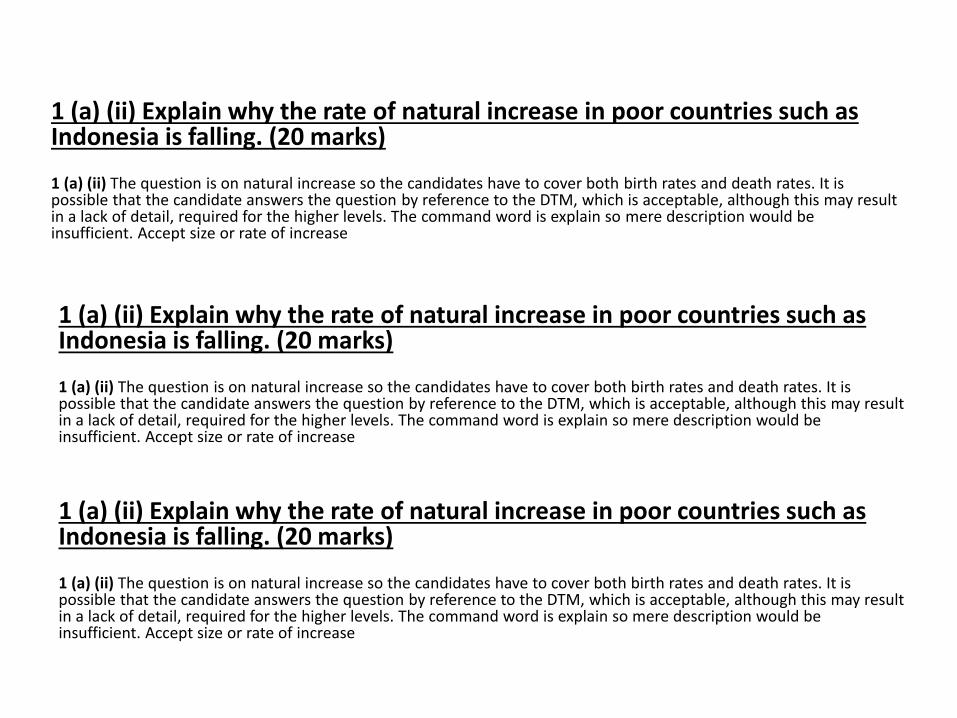
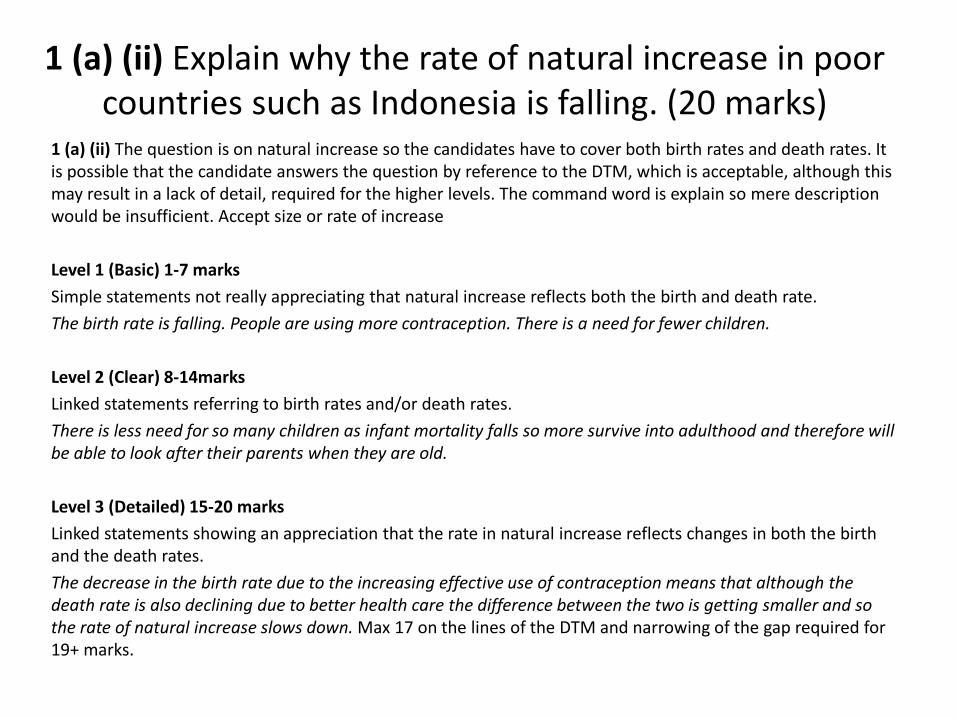
1 (a) (ii) Explain why the rate of natural increase in poor countries such as Indonesia is falling. (20 marks)
1 (a) (ii) The question is on natural increase so the candidates have to cover both birth rates and death rates. It is possible that the candidate answers the question by reference to the DTM, which is acceptable, although this may result in a lack of detail, required for the higher levels. The command word is explain so mere description would be insufficient. Accept size or rate of increase
Level 1 (Basic) 1-7 marks
Simple statements not really appreciating that natural increase reflects both the birth and death rate.
The birth rate is falling. People are using more contraception. There is a need for fewer children.
Level 2 (Clear) 8-14marks
Linked statements referring to birth rates and/or death rates.
There is less need for so many children as infant mortality falls so more survive into adulthood and therefore will be able to look after their parents when they are old.
Level 3 (Detailed) 15-20 marks
Linked statements showing an appreciation that the rate in natural increase reflects changes in both the birth and the death rates.
The decrease in the birth rate due to the increasing effective use of contraception means that although the death rate is also declining due to better health care the difference between the two is getting smaller and so the rate of natural increase slows down. Max 17 on the lines of the DTM and narrowing of the gap required for 19+ marks.