1 supplemental data 2 - dm5migu4zj3pb.cloudfront.net · p1 p4 p5 p8 supplemental figure 1....
TRANSCRIPT

1
Supplemental data 1
2
Inventory of Supplemental Items 3
4
Supplemental Items include 7 Supplemental Figures, Supplemental Methods and 5 5
Supplemental Tables. 6
(1) Supplemental Figure 1 is related to Figure 2. 7
(2) Supplemental Figure 2 is related to Figure 3B. 8
(3) Supplemental Figure 3 is related to Figure 3D. 9
(4) Supplemental Figure 4 is related to Figure 3, D and E. 10
(5) Supplemental Figure 5 is related to Figure 6A. 11
(6) Supplemental Figure 6 is related to Figure 6C. 12
(7) Supplemental Figure 7 is related to Figure 7, A-C. 13
(8) Supplemental Table 1 is related to Figure 2A. 14
(9) Supplemental Table 2 is related to Figure 2A. 15
(10) Supplemental Table 3 is related to Figure 2B. 16
(11) Supplemental Table 4 is related to Figure 2B. 17
(12) Supplemental Table 5 is related to Supplemental Figure 5. 18
+/+ +/- +/+ +/- +/+ +/- +/+ +/-
13
5.3
23 1719
8.57.7 11
kbp kbp kbp kbp
1 2 3 4 5 6 7 8
5’ probe 3’ probe 5’ probe 3’ probe
Paip2a Paip2b
A B
C D
P1 P2 P3 P4 P5 P6 P7 P8
WT locus
2 3 4BamHIKpnI
BamHIKpnI
23 kbp13 kbp
5’ probe 3’ probe
WT locus
3 4EcoRVKpnI
EcoRVKpnI
19 kbp17 kbp
5’ probe 3’ probe
5.3 kbp
8.5 kbp
7.7 kbp
11 kbp
5’ probe 3’ probe 5’ probe 3’ probe
Paip2a KO locus
4BamHIKpnI
BamHIKpnI
BamHIKpnI
Paip2b KO locus
EcoRVKpnI
EcoRVKpnI
EcoRVKpnI
4
P1 P4 P5 P8
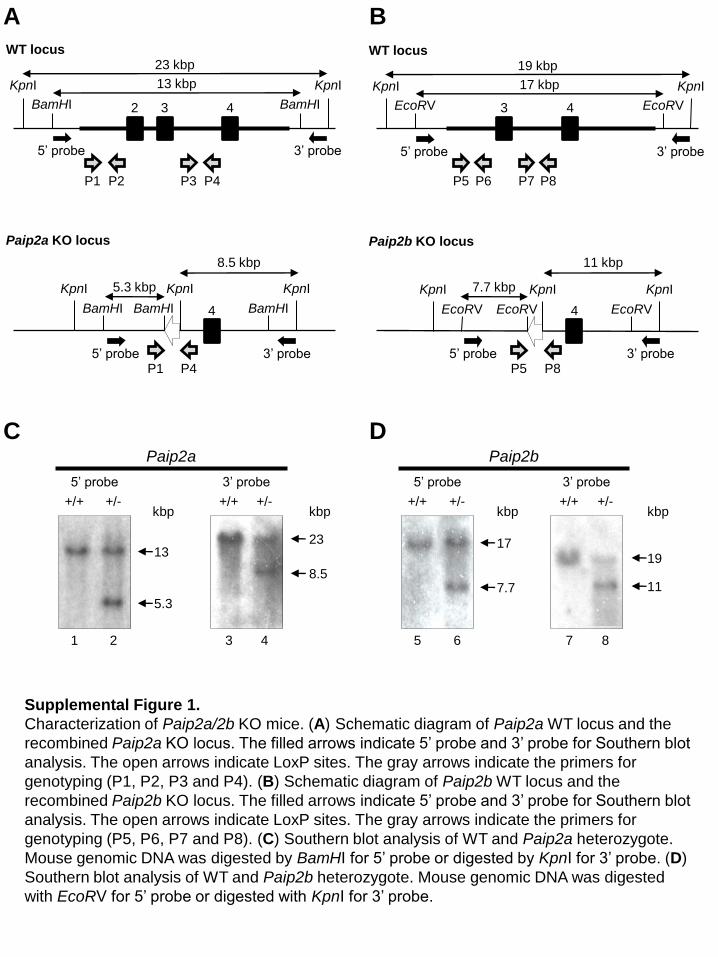
Supplemental Figure 1.
Characterization of Paip2a/2b KO mice. (A) Schematic diagram of Paip2a WT locus and the recombined Paip2a KO locus. The filled arrows indicate 5’ probe and 3’ probe for Southern blot
analysis. The open arrows indicate LoxP sites. The gray arrows indicate the primers for genotyping (P1, P2, P3 and P4). (B) Schematic diagram of Paip2b WT locus and the recombined Paip2b KO locus. The filled arrows indicate 5’ probe and 3’ probe for Southern blot
analysis. The open arrows indicate LoxP sites. The gray arrows indicate the primers for genotyping (P5, P6, P7 and P8). (C) Southern blot analysis of WT and Paip2a heterozygote. Mouse genomic DNA was digested by BamHI for 5’ probe or digested by KpnI for 3’ probe. (D) Southern blot analysis of WT and Paip2b heterozygote. Mouse genomic DNA was digested with EcoRV for 5’ probe or digested with KpnI for 3’ probe.

0
0.04
0.08
0.12
0.16
Wei
ght (
g)
*
*
Test
is
S. V
.
Pro
stat
e
Epi
didy
mis
WTPaip2a/2b DKO
Supplemental Figure 2.
Organ weight of reproductive tissues. S.V., seminal vesicle.

Supplemental Figure 3.Histology of testes from WT (A) and Paip2a/2b DKO (B) mice at stages IX, X and XII using hematoxylin staining. Arrows point at elongating spermatids. Arrowheads in Paip2a/2b DKO show aberrant sperm retained in the epithelium of the seminiferous tubule at stage VII and later stages. Scale bar indicates 25 μm.
IX
IX XIIX
XIIX
A
B
A
B
C
D
CaudaVII XII
CaudaVII XII
CaudaVII XII
CaudaVII XII
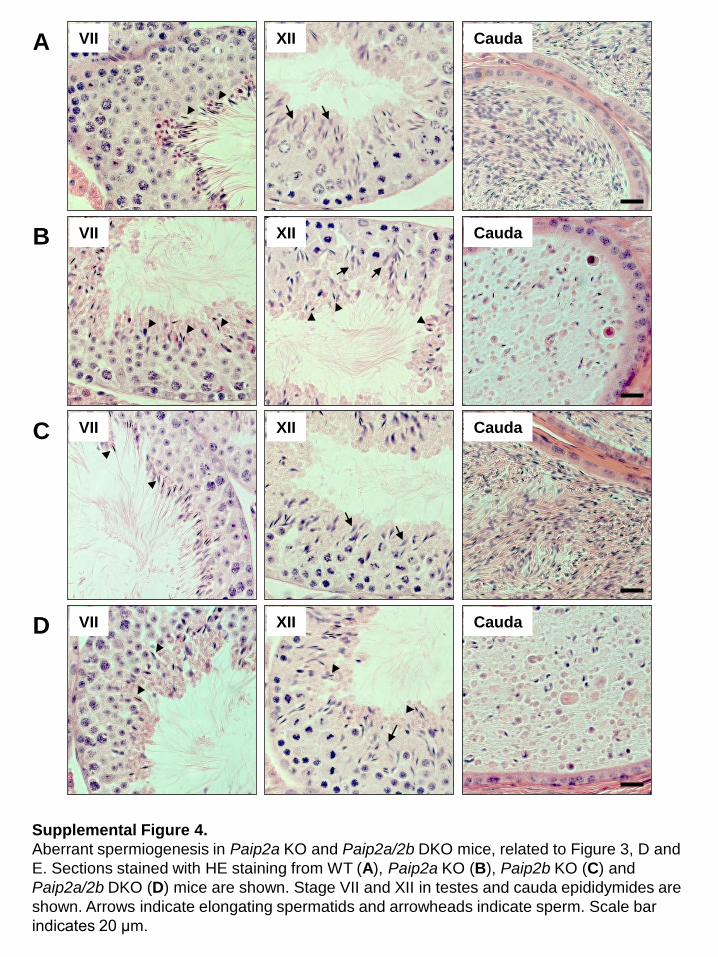
Supplemental Figure 4.
Aberrant spermiogenesis in Paip2a KO and Paip2a/2b DKO mice, related to Figure 3, D and E. Sections stained with HE staining from WT (A), Paip2a KO (B), Paip2b KO (C) and Paip2a/2b DKO (D) mice are shown. Stage VII and XII in testes and cauda epididymides are shown. Arrows indicate elongating spermatids and arrowheads indicate sperm. Scale bar indicates 20 μm.

Supplemental Figure 5.
Relative expression levels of Prm1, Tp1 and Tp2 mRNAs in WT (white) and Paip2a/2b DKO (gray) mice. Testicular RNA was extracted and reverse-transcribed. The resultant cDNA was used for real-time PCR. Values indicate the relative mRNA levels in Paip2a/2b DKO mice compared with those in WT mice, which were set as 1. Values are mean±SEM of 4 mice. No statistical difference in Prm1, Tp1 and Tp2
mRNA levels was observed in Paip2a/2b DKO mice compared with WT mice.
0
0.2
0.4
0.6
0.8
1.0
1.2
mR
NA
leve
l (%
of W
T)
WTPaip2a/2b DKO
Prm1 Tp2 Tp1
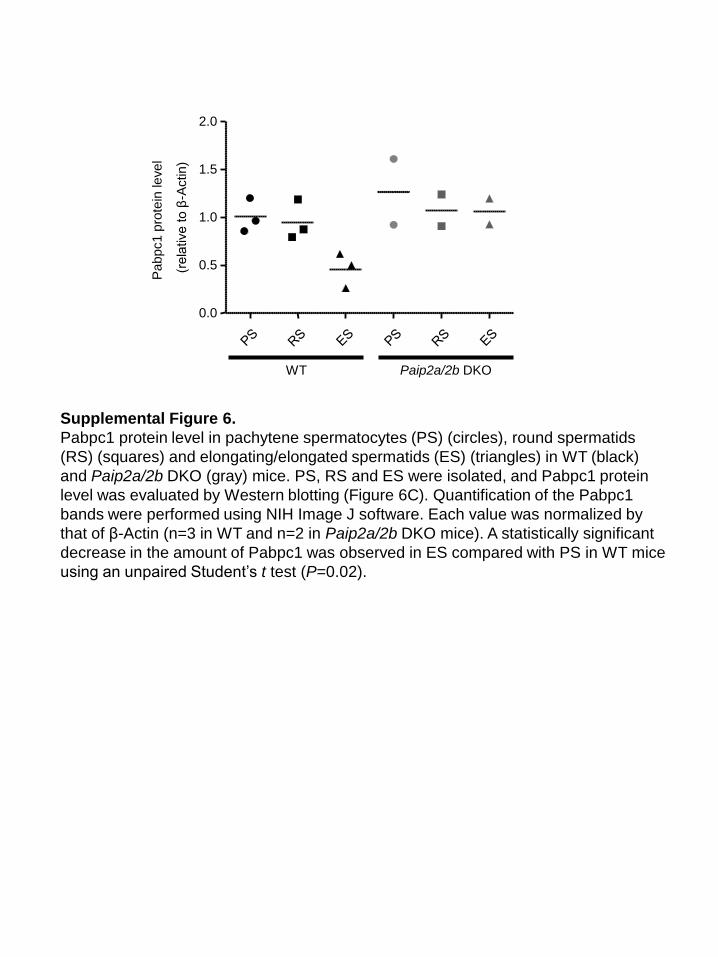
Supplemental Figure 6.
Pabpc1 protein level in pachytene spermatocytes (PS) (circles), round spermatids (RS) (squares) and elongating/elongated spermatids (ES) (triangles) in WT (black) and Paip2a/2b DKO (gray) mice. PS, RS and ES were isolated, and Pabpc1 protein level was evaluated by Western blotting (Figure 6C). Quantification of the Pabpc1 bands were performed using NIH Image J software. Each value was normalized by that of β-Actin (n=3 in WT and n=2 in Paip2a/2b DKO mice). A statistically significant decrease in the amount of Pabpc1 was observed in ES compared with PS in WT mice using an unpaired Student’s t test (P=0.02).
0.0
0.5
1.0
1.5
2.0
WT Paip2a/2b DKO
Pabp
c1 p
rote
in le
vel
(rela
tive t
o β
-Act
in)

A B
β-Actin
Pabp
1 2 3 4
1 2
Con
trol
Pabp
-dep
lete
d m7GDP
PABP
+- +-eIF4F
PABP
eIF4E
Supplemental Figure 7.
Pabp depletion of Krebs-2 extract and non-specific binding of recombinant PABP to mRNA, related to Figure 7, A-C. (A) For the removal of Pabp, Krebs-2 cell extract was incubated with GST-PAIP2A protein immobilized onto glutathione-Sepharose beads. For control Krebs-2 extract, GST alone was used. Pabp depletion was confirmed by Western blot analysis. β-Actin was used as a loading control. (B) eIF4F purified from RRL (35 μg/ml) and
recombinant PABP (10 μg/ml) were incubated with the 32P-cap-labeled Luc(A98) mRNA for chemical crosslinking assay. m7GDP (1 mM) was added as indicated. eIF4E exhibits specific cross-linking to the cap structure (lanes 1 and 2), while PABP does not (lanes 3 and 4).

1
Supplemental Tables 1
2
Supplemental Table 1. 3
PCR primers for Paip2a. 4
Primer Sequence
Paip2a 5’ Fwd 5’-GAGGCATGCAGCAAGTGTAGTTTG-3’
Paip2a 5’ Rev 5’-ACTAGAGCCTCTCCTTTCTGACCT-3’
Paip2a 3’ Fwd 5’-GTATTCTCAGCCTGGTGGTGCTAA-3’
Paip2a 3’ Rev 5’-CAGGCATTCCTGAAGTGGATCAGA-3’
Paip2a P1 5’-GGAAAACAACCCACTCAGGAAAATC-3’
Paip2a P2 5’-GTTCCAGGACAGCTGAGGCTATACA-3’
Paip2a P3 5’-GGCTGCCCTAGAATTTGTGGTAATC-3’
Paip2a P4 5’-TAATCAAGGCATTGAGTTGCAGGTT-3’
5
6
2
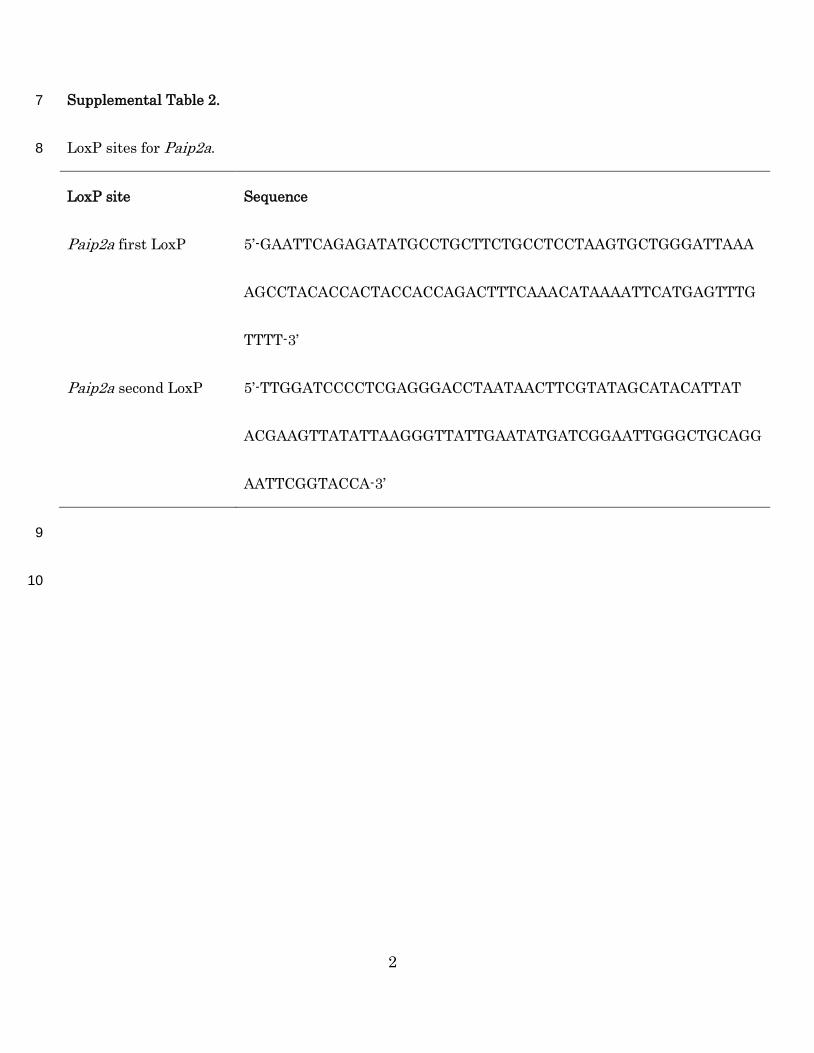
Supplemental Table 2. 7
LoxP sites for Paip2a. 8
LoxP site Sequence
Paip2a first LoxP 5’-GAATTCAGAGATATGCCTGCTTCTGCCTCCTAAGTGCTGGGATTAAA
AGCCTACACCACTACCACCAGACTTTCAAACATAAAATTCATGAGTTTG
TTTT-3’
Paip2a second LoxP 5’-TTGGATCCCCTCGAGGGACCTAATAACTTCGTATAGCATACATTAT
ACGAAGTTATATTAAGGGTTATTGAATATGATCGGAATTGGGCTGCAGG
AATTCGGTACCA-3’
9
10

3
Supplemental Table 3. 11
PCR primers for Paip2b. 12
Primer Sequence
Paip2b 5’ Fwd 5’-CTGTTGTGGCATGGCTGACATCAT-3’
Paip2b 5’ Rev 5’-TCTGCTAGAGATTCCAGCTCCTTG-3’
Paip2b 3’ Fwd 5’-AGAGAGATGAAGGTGCAGGCAAAC-3’
Paip2b 3’ Rev 5’-AGGGTCCCTACTTCACATCAGCAT-3’
Paip2b P5 5’-GCATGGCATACACTCATACAGATGC-3’
Paip2b P6 5’-AAGAATTGAGAGGAATGGGACTTGG-3’
Paip2b P7 5’-CATCTGTGGGTCTCTGTCTTCCCTA-3’
Paip2b P8 5’-GTGGATGTCAGATGACAACTTGTGG-3’
13
14
4
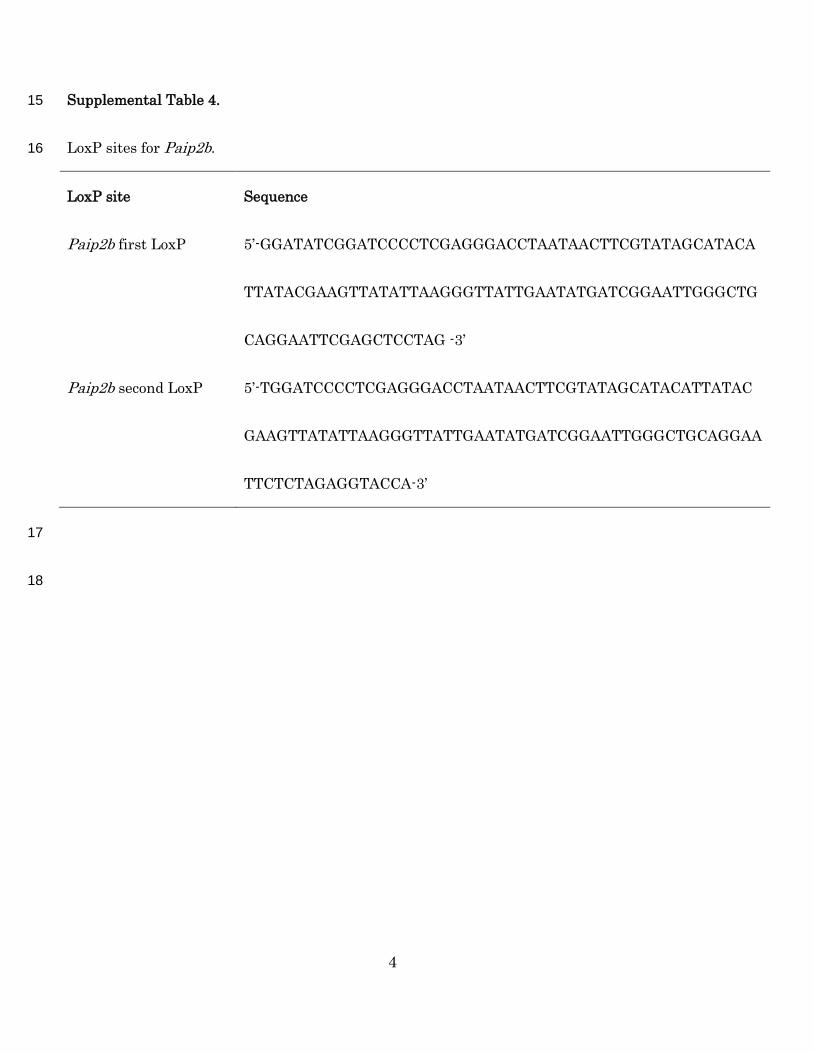
Supplemental Table 4. 15
LoxP sites for Paip2b. 16
LoxP site Sequence
Paip2b first LoxP 5’-GGATATCGGATCCCCTCGAGGGACCTAATAACTTCGTATAGCATACA
TTATACGAAGTTATATTAAGGGTTATTGAATATGATCGGAATTGGGCTG
CAGGAATTCGAGCTCCTAG -3’
Paip2b second LoxP 5’-TGGATCCCCTCGAGGGACCTAATAACTTCGTATAGCATACATTATAC
GAAGTTATATTAAGGGTTATTGAATATGATCGGAATTGGGCTGCAGGAA
TTCTCTAGAGGTACCA-3’
17
18

5
Supplemental Methods 19
Real-time PCR. Testicular RNA was extracted using TRIZOL Reagent (Invitrogen) and 20
reverse-transcribed by SuperScript III RT (Invitrogen), following the manufacturer’s instruction. 21
The resultant cDNA was used for real-time PCR using the gene specific primers for mouse Prm1, 22
Tp1, Tp2 (Supplemental Table 5). The SYBR Green PCR Master Mix (Applied Biosystems) was 23
used for real-time PCR using the first-strand cDNA as a template, and real-time PCR was 24
performed in triplicate. The Gapdh mRNA level in each sample was determined to normalize the 25
differences of total RNA amount. Values indicate the relative mRNA levels in Paip2a/2b DKO 26
mice compared with those in WT mice, which were set as 1. 27
28
29

6
Supplemental Table 5. 30
PCR primers for real-time PCR. 31
Primer Sequence
Prm1 Fwd 5’- TCACAGGTTGGCTGGCTCGAC-3’
Prm1 Rev 5’- GCATCGCCTCCTCCGTCTGC-3’
Tp1 Fwd 5’- CCGAGCTCCTCACAAGGGCG -3’
Tp1 Rev 5’- CCTCATGCTCCTGCCCCGTG -3’
Tp2 Fwd 5’- GTGCACCTGCAGCCACCACT-3’
Tp2 Rev 5’- TTTCCGCCTCCTGACGGCCT-3’
32