supplemental table 1. primers used for rt-pcr analysis of...
TRANSCRIPT

Supplemental Table 1. Primers used for RT-PCR analysis of inflammatory cytokines
Gene Primer Sequence
IL-1α Forward primer 5’-CAAGATGGCCAAAGTTCGTGAC-3' Reverse primer 5’-GTCTCATGAAGTGAGCCATAGC-3’
IL-1β Forward primer 5’-ATGGCAACTGTTCCTGAACTCAACT-3’ Reverse primer 5’-CAGGACAGGTATAGATTCTTTCCTTT-3’
IL-6 Forward primer 5’-AGGATACCACTCCCAACAGACCT-3’ Reverse primer 5’-CAAGTGCATCATCGTTGTTCATAC-3’
TNF-α Forward primer 5’-TTCTGTCTACTGAACTTCGGGGTGATCGGTCC-3’ Reverse primer 5’-GTATGAGATAGCAAATCGGCTGACGGTGTGGG-3’
ICAM-1 Forward primer 5’-GGCATTGTTCTCTAATGTCTCCG-3’ Reverse primer 5’-CCGCTCAGAAGAACCACCTTGG-3’
VCAM-1 Forward primer 5’-TACTCCCGTCATTGAGGATATTGG-3’ Reverse primer 5’-CTCCTTCACACACATAGACTCC-3’

1
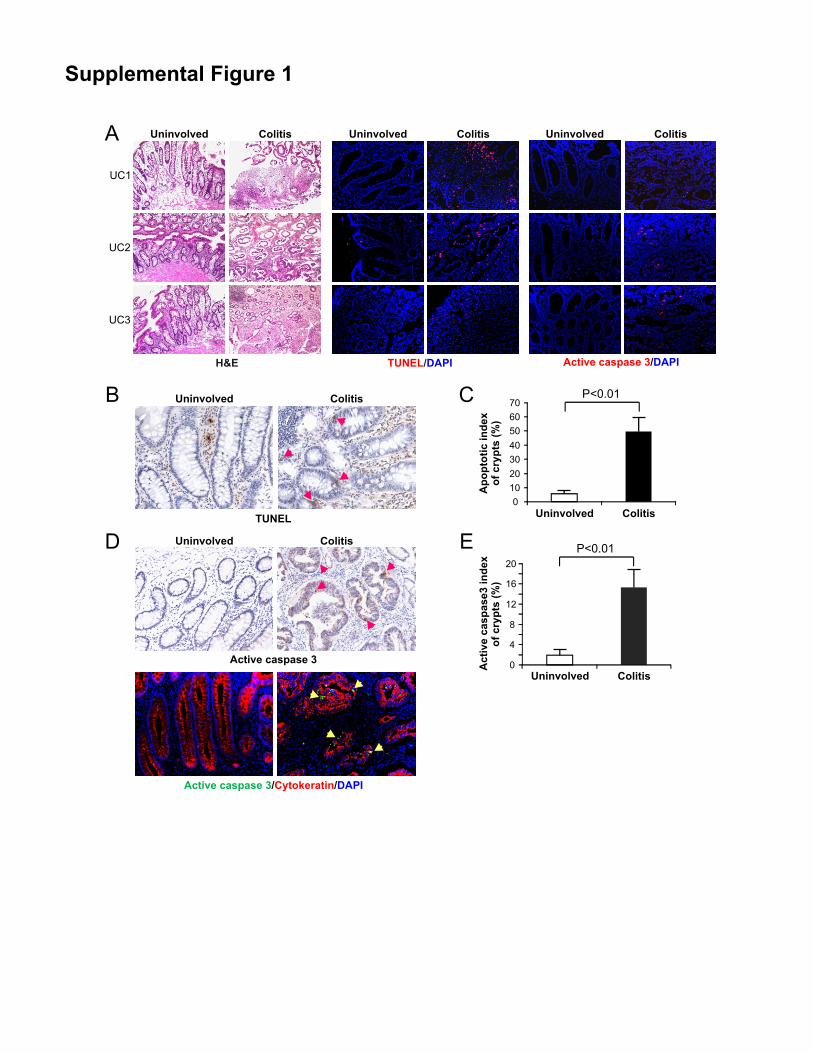
Supplemental Figure 1
Apoptosis and caspase activation in human ulcerative colitis tissues. (A) H&E (left panel),
TUNEL (red, middle panel), and active caspase 3 (red, right panel) staining of 3 matched pairs of
uninvolved colonic and colitis tissues (200×). (B) TUNEL (brown) staining of a matched pair of
uninvolved colonic and colitis tissues (400×). Arrows indicate example TUNEL positive cells.
(C) Apoptotic index of the crypts of uninvolved colonic and colitis tissues was determined by
counting TUNEL signals in 100 randomly selected crypts following TUNEL staining as in (B).
Values were means ± SD (n = 6 in each group). (D) Caspase 3 activation in a matched pair of
uninvolved colonic and colitis tissues was detected by active caspase 3 (brown) immunostaining
(upper panel; 400×), and active caspase 3 (green) and cytokeratin (red) double staining (lower
panel; 400×). Arrows indicate example active caspase 3 positive, or active caspase 3 and
cytokeratin double positive cells. (E) Active caspase 3 index of crypts of uninvolved colonic and
colitis tissues from UC patients was determined by counting active caspase 3 signals in 20
randomly selected crypts following active caspase 3 staining as in (D). Values were means ± SD
(n = 3 in each group).
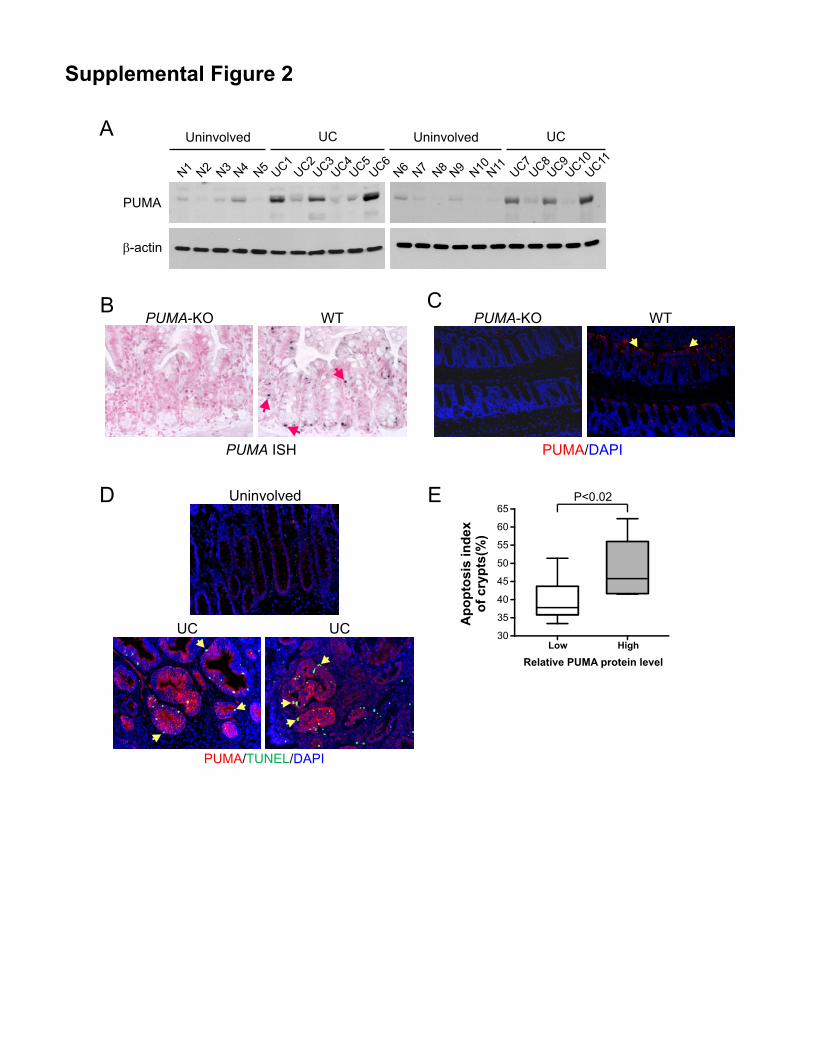
Supplemental Figure 2
PUMA induction and apoptosis in human ulcerative colitis tissues. (A) PUMA protein
expression in 11 uninvolved colonic tissues (N1-N11) and 11 ulcerative colitis (UC1-UC11)
tissues was analyzed by Western blotting. (B) A control for PUMA RNA in situ hybridization
(ISH). PUMA expression (dark dots) was analyzed by ISH in colonic tissues from WT and
PUMA-KO mice at 4 hr after exposure to -irradiation at 15 Gy (400×). Arrows indicate
example PUMA-expressing cells. (C) A control for PUMA immunostaining. PUMA expression
2
in colonic tissues from WT and PUMA-KO mice was analyzed by immunostaining (200×).
Arrows indicate example cells with basal PUMA expression. (D) PUMA (red) and TUNEL
(green) double staining of an uninvolved and 2 UC tissues (400×). Arrows indicate example
PUMA and TUNEL double positive cells. (E) Correlation between PUMA expression
determined by Western blotting and apoptosis levels analyzed by TUNEL staining in colitis
tissues from UC patients. Values were means ± SD (n = 9 in each group).
Supplemental Figure 3
Induction of PUMA in mice following DSS or TNBS treatment. WT and PUMA-KO mice were
treated with 5% DSS for 7 days, or 100 mg/kg of TNBS for 3 days, to induce colitis. (A) PUMA
(red) staining of colonic tissues from the treated mice (200×). A section from untreated PUMA-
KO mice was used as the control for staining specificity. (B) PUMA (red) and cytokeratin
(green) double staining of colonic tissues from the treated mice (200×).
Supplemental Figure 4
Induction of PUMA in colonic epithelial cells and expression of other Bcl-2 family members in
colonic mucosa of DSS- and TNBS-treated mice. WT mice were treated with 5% DSS for 7
days, or 100 mg/kg of TNBS for 3 days, to induce colitis. (A) Colonic epithelial cells were
isolated from colonic mucosa of the treated mice as described in the Methods. The isolated
epithelial cells were verified by immunostaining for EpCAM (green), an epithelial marker. (B)
Western blot analysis of the indicated proteins in colonic epithelial cells isolated as in (A). (C)
Western blot analysis of Bcl-2 family members in the colonic mucosa of DSS- or TNBS-treated

3
mice. In (B) and (C), relative expression of each sample normalized to the loading control -
actin is indicated, with that of the untreated animal arbitrarily set as 1.0.
Supplemental Figure 5
DSS-induced colonic damage in WT and PUMA-KO mice. (A) H&E staining of colonic tissues
from WT and PUMA-KO mice treated with 5% DSS for 1 or 3 days (200×). (B) Histological
scores of the treated mice were determined following H&E staining as in (A). Values were
means ± SD (n = 3 in each group). (C) Myeloperoxidase (MPO) activities in colonic mucosa
from WT and PUMA-KO mice treated with 5% DSS for 7 days were measured as described in
the Methods.
Supplemental Figure 6
Apoptosis in colonic tissues from WT and PUMA-KO mice treated with 5% DSS or 100 mg/kg
of TNBS. (A) DNA fragmentation in the mice treated with DSS for 7 days was quantified by
diphenylamine reaction as described in the Methods. Values were means ± SD (n = 3 in each
group). (B) Apoptotic index in the mice treated with DSS for 1 or 3 days was determined by
counting TUNEL signals in 100 randomly selected crypts following TUNEL staining. Values
were means ± SD (n = 3 mice in each group). (C) TUNEL (green) and cytokeratin (red) double
staining of colonic tissues from the mice treated with DSS for 3 days (400×). Arrows indicate
example TUNEL and cytokeratin double positive cells. (D) Caspase 3 activity was measured
using colonic mucosa extracts from the mice treated with DSS for 7 days. Values were means ±
SD (n = 6 mice in each group). (E) TUNEL (green) and cytokeratin (red) double staining of

4
colonic tissues from the mice treated with 100 mg/kg TNBS for 3 days (400×). Arrows indicate
example TUNEL and cytokeratin double positive cells.
Supplemental Figure 7
TNBS-induced inflammation in WT and PUMA-KO mice. WT and PUMA-KO mice were
treated with 100 mg/kg of TNBS for 3 days to induce colitis. (A) Expression of the indicated
inflammatory cytokines in the treated mice was analyzed by real time RT-PCR. * P<0.02
compared to the untreated control. (B) Myeloperoxidase (MPO) activities in colonic mucosa of
the treated mice were measured as described in the Methods. Values were means ± SD (n = 3 in
each group).
Supplemental Figure 8
DSS-induced colonic damage and apoptosis in WT and p53-KO mice. WT and p53-KO mice
treated with 5% DSS for 7 days. Colonic damage and apoptosis were analyzed. (A) Methylene
blue staining of colonic tissues from the DSS-treated mice with arrows indicating ulcers. (B)
Colonic ulcers were counted following methylene blue staining as in (A). (C) H&E staining of
colonic tissues from the control and DSS-treated mice (200×). (D) TUNEL staining of colonic
tissues from the control and DSS-treated mice (200×). (E) Analysis of caspase 3 activation after
DSS treatment by Western blotting. (F) Measurement of caspase 3 activities in the intestinal
mucosa extracts from the DSS-treated mice. Values in (B) and (F) were means ± SD (n = 6 mice
in each group).
Supplemental Figure 9

5
TNBS-induced colonic damage and apoptosis in WT and p53-KO mice. WT and p53-KO mice
treated with 100 mg/kg of TNBS for 3 days. Colonic damage and apoptosis were analyzed. (A)
H&E staining of colonic tissues from the control and TNBS-treated mice (200×). (B) TUNEL
staining of colonic tissues from the control and TNBS-treated mice (200×). (C) Apoptotic index
was determined by counting TUNEL signals in 100 randomly selected crypts following TUNEL
staining as in (B). Values were means ± SD (n = 6 in each group).
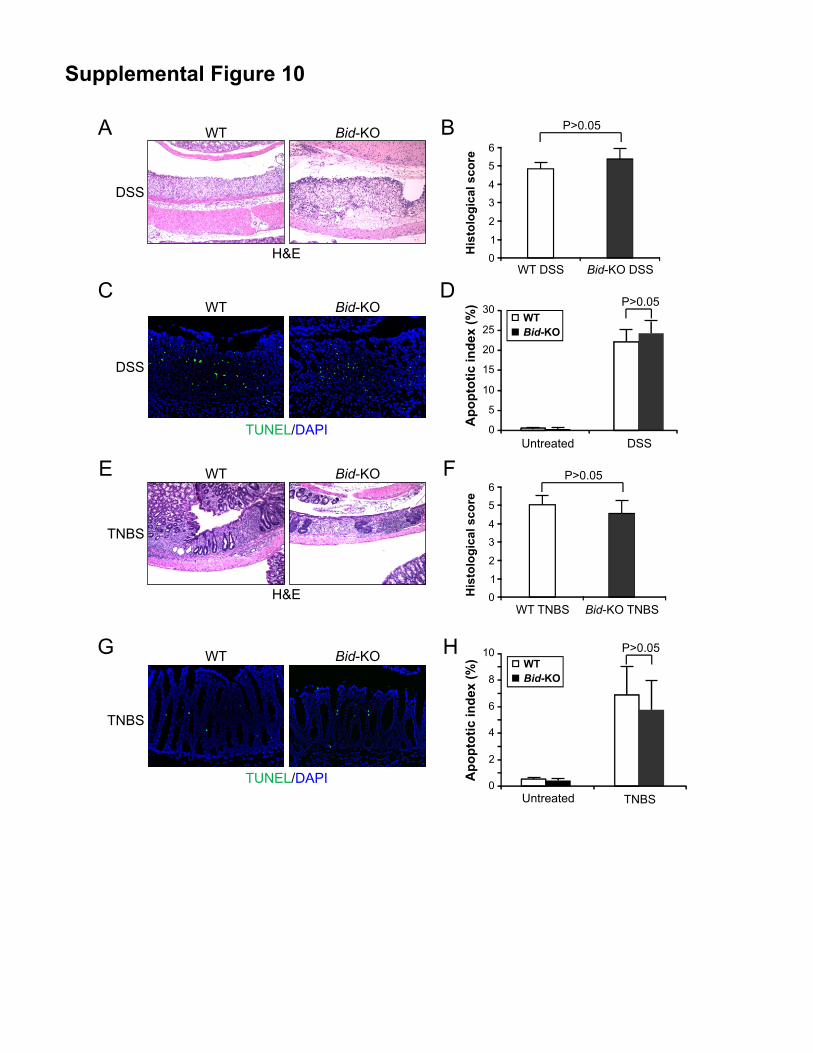
Supplemental Figure 10
Bid-independent colitis induced by DSS or TNBS. WT and Bid-KO mice were treated with 5%
DSS for 7 days, or 100 mg/kg of TNBS for 5 days, to induce colitis. (A) H&E staining of
colonic tissues from the DSS-treated mice (200×). (B) Histological damage after DSS treatment
was scored following H&E staining as in (A). (C) TUNEL (green) staining of colonic tissues
from the DSS-treated mice (400×). Arrows indicate example TUNEL-positive cells. (D)
Apoptotic index was determined by counting TUNEL signals in 100 randomly selected crypts
following TUNEL staining as in (C). (E) H&E staining of colonic tissues from the TNBS-
treated mice (200×). (F) Histological damage after TNBS treatment was scored following H&E
staining as in (E). (G) TUNEL (green) staining of colonic tissues from the TNBS-treated mice
(400×). Arrows indicate example TUNEL-positive cells. (H) Apoptotic index was determined
by counting TUNEL signals in 100 randomly selected crypts following TUNEL staining as in
(G). Values in (B), (D), (F) and (H) were means ± SD (n = 3 mice in each group).
Supplemental Figure 11

6
Effects of the TNF antibody infliximib on DSS-induced colitis. WT mice were treated with 5%
DSS, alone or in combination with 10 mg/kg of the TNF antibody infliximib for 7 days. (A)
Real time RT-PCR analysis of PUMA mRNA expression in colonic mucosa of the treated mice.
(B) H&E staining of colonic tissues from the treated mice (200×). (C) Colonic ulcers were
counted following methylene blue staining. Values in (A) and (C) were means ± SD (n = 3 in
each group).
Supplemental Figure 12
Effects of the TNF antibody infliximib on TNBS-induced colitis. WT mice were treated with
100 mg/kg of TNBS, alone or in combination with 10 mg/kg of the TNF antibody infliximib for
3 days. (A) H&E staining of colonic tissues from the treated mice (200×). (B) TUNEL (brown)
staining of colonic tissues from the treated mice (200×). (C) Apoptotic index was calculated by
counting TUNEL signals in 100 randomly selected crypts following TUNEL staining as in (B).
Values were means ± SD (n = 3 in each group).
Supplemental Figure 13
Effects of the TNF inhibitor pentoxifylline on DSS-induced colitis. WT mice were treated with
5% DSS, alone or in combination with 200 mg/kg of the TNF inhibitor pentoxifylline (PTX).
(A) Real time RT-PCR analysis of PUMA mRNA expression in colonic mucosa of the mice
treated for 24 hr. Values were means ± SD (n = 3 in each group). (B) Western blot analysis of
PUMA expression in colonic mucosa of the mice treated for 24 hr. (C) Disease activity index in
the mice treated with DSS with or without PTX was measured at indicated time points. * P<0.01
compared to DSS alone (two-way ANOVA). (D) Methylene blue staining of colonic tissues

7
from the mice treated for 7 days, with the arrow indicating an ulcer (200×). (E) Colonic ulcers
were counted following methylene blue staining as in (D). (F) H&E staining of colonic tissues
from the mice treated for 7 days (200×). (G) Histological damage in colonic tissues from the
mice treated for 7 days was scored following H&E staining as in (F). (H) TUNEL staining (red)
of colonic tissues from the mice treated for 7 days. (I) Apoptotic index was calculated by
counting TUNEL signals in 100 randomly selected crypts. Values in (C), (E), (G) and (I) were
means ± SD (n = 5 in each group).
Supplemental Figure 14
Effects of the TNF inhibitor pentoxifylline on TNBS-induced colitis. WT mice were treated
with 100 mg/kg of TNBS, alone or in combination with 200 mg/kg of the TNF- inhibitor
pentoxifylline (PTX). (A) Western blot analysis of the indicted proteins in colonic mucosa from
the mice treated for 24 hr. (B) H&E staining of colonic tissues from the mice treated for 3 days
(200×). (C) Histological damage in the mice treated with TNBS with or without PTX for 3 days
was quantified following H&E staining as in (B). (D) TUNEL (brown) staining of colonic
tissues from the mice treated for 3 days. Arrows indicate example TUNEL-positive cells. (E)
Apoptotic index in the mice treated as indicated for 3 days was calculated by counting TUNEL
signal in 100 randomly selected crypts. Values in (C) and (E) were means ± SD (n = 3 in each
group).