1. living in rural areas: percentage to - international …. women living in rural areas: percentage...
TRANSCRIPT

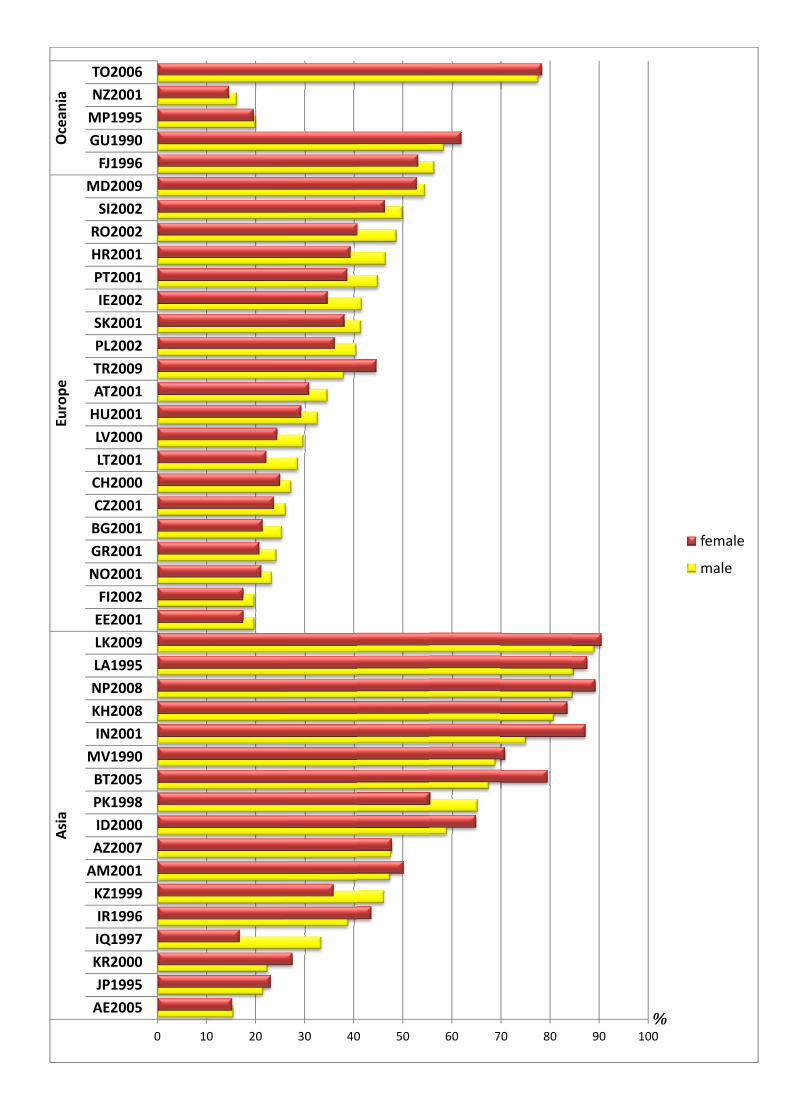
1. Women Living in Rural Areas: Percentage Employed Compared to Unemployed 52 developing countries − most recent year
Source: ILO Special Dataset on Rural Labour Statistics, February 2011
Analysis: Women who live in rural areas have a higher probability of being employed than of being unemployed, as compared to women living in urban areas. This is especially the case in Sub-Saharan Africa and in many countries in Asia. In Latin America and the Caribbean, even though more women work in urban areas, rural employment still plays an important role in providing jobs for women in the region. Probable reasons for this higher probability are that women living in rural areas have to provide a living for their families and therefore cannot afford to be unemployed. They must undertake work activities, mainly in the agricultural sector, in addition to the unpaid service work they also provide to their households. The majority of jobs in the rural areas and in agriculture are likely to be lacking in some elements regarding decent and productive work. The labour force situation of women in rural areas for the 52 developing countries for which data are available compares the percentage of employed women living in rural areas and the percentage of unemployed women living in rural areas in a scatter plot. The diagonal line in this chart represents a perfectly identical representation of female employment as of female unemployment (as currently defined and measured for the labour force). The majority of the country observations fall below the identical line. This means that the greater the distance from the line, the bigger the disparity between urban and rural areas in that country. The chart also shows that there are large variations in the magnitude of rural employment or unemployment to total employment or unemployment. As can be seen, the range goes from 5 percent up to close to 90 percent of total employment in rural areas.
Women’s employment status does not account for (domestic) unpaid household service work they also perform, which would be included in a measure of work statistics. Such household tasks not shared co-responsibly by men, taken together with women’s growing agricultural responsibilities and the feminization of farming that has become a major trend with male migration, HIV AIDS, etc. leave little time for women’s participation in rural business activities, which would provide additional income and resources.
Identical representation within employment as in unemployment.

Traditional and legal regulations concerning property rights and property use in rural areas affect the differences in intra-household distribution of goods and income; differences in rights and responsibilities, wage structures, etc. These factors and women’s status in employment (a bulk of contributing (unpaid) family workers) render harsher the inequalities facing women with regard to rural enterprise development, although their capacity for rural business activities and their potential as rural entrepreneurs is apparent in their roles in households, coping with the multiplicity of tasks and duties performed. Taking managerial and economic decisions, planning and ensuring their implementation, are all operations similar to those required of business entrepreneurs that should enable women to obtain decent work and to take their active part in the mainstream economy.
See also: http://www.ilo.org/stat/lang‐‐en/index.htm
ILO Department of Statistics Updated August 2011

(Con
ILO
Africa
America
2.
ntinent, coun
Departmen
GA1993
BW2005
TD1993
MA1994
NA2001
EG2001
ZW1992
MU2000
GH2000
BJ2002
ZM2000
RW2002
TZ2001
UG2002
UY1996
CL2002
VE1990
BR2008
CA2001
US1990
CO2008
EC2008
PA2008
DO2007
SV2007
CR2008
BO2006
PY2008
MX2008
NI2007
BZ1991
GT2004
HN2007
LC2001
Africa
America
Share of
ntry, latest y
nt of Statist
0 10
3
5
3
4
1
1
2
0
0
2
0
2
1
2
6
2
0
8
1
0
8
8
8
7
7
8
6
8
8
7
1
4
7
1
f Rural Em
year) ISO Coun
tics, Februa
0 20
mployme
ntry Code: http
ary 2011
30 40
ent in Tot
p://www.iso.o
0 50
tal Emplo
org/iso/english_
60 70
oyment, b
_country_nam
80
by Sex
es_and_code_
90 100
_elements#s.. (
1/2
female
male
%
%)
e
Asia
Europe
Ocean
ia
AE2005JP1995KR2000IQ1997IR1996KZ1999AM2001AZ2007ID2000PK1998BT2005MV1990IN2001KH2008NP2008LA1995LK2009EE2001FI2002
NO2001GR2001BG2001CZ2001CH2000LT2001LV2000HU2001AT2001TR2009PL2002SK2001IE2002PT2001HR2001RO2002SI2002
MD2009FJ1996
GU1990MP1995NZ2001TO2006
0 10 20 30 400 50 60 70 80 90 1100
fem
ma
%
male
ale

Afr
ISO BJ: GA: NoteAge Age
ILO
1
1
2
2
3
3
4
4
5
55
rica
Two‐letter CBENIN GABON
es: 0‐14 = 10‐14:65‐69 = 65+:
Departmen
0%
5%
10%
15%
20%
25%
30%
35%
40%
5%
0%
5%
3. R
Country Cod
GA1993, NAGA1993, NA1
nt of Statist
Rural Unava
es:
1991, ZM1991991.
tics, Februa
nemployailable c
GH: GHANA: NAM
0, ZW1992.
ary 2011
yment Rcountries
NA MIBIA
Rates, bys, lat
y Age Grtest year
ZM: ZW:
roup r
ZAMBIA ZIMBABW
(%)
WE
BJ2
GA
GH
NA
ZM
ZW
2002
A1993
H2000
A1991
M1990
W1992

Am
ISO CA: CL: NoteChileUnitUrugVene
ILO
10
15
20
25
30
35
40
45
merica
Two‐letter C CANADA CHILE
es: e: 15‐24, 25‐3ed States: 16guay: age 12‐ezuela: age 1
Departmen
0%
5%
0%
5%
0%
5%
0%
5%
0%
5%
4. R
Country Cod
34, 35‐44, 45‐6‐19; 25‐54; 5514 not include2‐14 not inclu
nt of Statist
Rural Unav
es:
54, 55‐64 and5‐64; and 65+ed uded; 55‐59 =
tics, Februa
nemployvailable c
LC: SAINTUS: UNIT
d 65+ +
55+
ary 2011
yment Rcountrie
T LUCIA TED STATES
Rates, bys, lat
y Age Grtest year
UY: VE: V
roup r
URUGUAY VENEZUELA
(%)
A
CA2
CL2
LC2
US1
UY1
VE1
2001
002
001
1990
1996
1990

As
ISO AMID: IQ: NoteArmIrak:Iran:KoreKazaLao: Mald
ILO
5
5
6
6
7
sia
Two‐letter C: ARMENIAINDONESIAIRAK
es: enia, Indones 6‐9 and 10‐1: 10‐14 not inea: 70‐75 = 70akhstan: 65; 6 10‐14 not incdives: 12‐14 n
Departmen
0%
5%
10%
15%
20%
25%
30%
35%
40%
45%
50%
55%
60%
65%
70%
5. R
Country CodA A
ia: 65‐69 = 6514 not includencluded 0+ 66‐72 and 73+cluded; 70‐75not included;
nt of Statist
Rural Unava
es:
5+ ed; 65‐69 = 65
+ 5 = 70+ 65‐69 = 65+
tics, Februa
nemployailable c
IR: IRANJP: JAPANKR: KORE
5+
ary 2011
yment Rcountries
N EA, REP. OF
Rates, bys, lat
F
y Age Grtest year
KZ: LA: MV:
MV199
JP
roup r (%
KAZAKHSTALAO PEOPL MALDIVES
90
P1995
AM2001
%)
AN LE'S DEM. RS
MV1
LA19
KR20
JP19
IR19
ID20
AM2
IQ19
KZ19
REP.
1990
995
000
95
96
00
2001
997
999

Eur
ISO AT: BG: CH: FI: FGR: NoteBulgNorw
ILO
44556677
rope
Two‐letter CAUSTRIA BULGARIA SWITZERLAFINLAND GREECE
es: aria, Romaniaway: age 15‐1
Departmen
0%5%
10%15%20%25%30%35%40%45%50%55%60%65%70%5%
6. R
Country Cod
ND
a: 0‐14 not in19 = 16‐19
nt of Statist
Rural Unava
es:
cluded
tics, Februa
nemployailable c
HR: CROATHU: HUNGIE: IRELANLT: LITHUALV: LATVIA
ary 2011
yment Rcountries
TIA GARY ND ANIA A
Rates, bys, lat
y Age Grtest year
NO: PL: PPT: PRO: SK: S
roup r
NORWAY POLAND PORTUGAL ROMANIA SLOVAKIA
(%)
NO20
CH20
AT20
HU20
FI200
PT20
IE200
RO20
LT200
LV20
PL200
GR20
HR20
SK20
BG20
001
000
001
001
02
01
02
002
01
00
02
001
001
01
001

Oce
ISO FJ: FNZ: ILO
eania
Two‐letter CFIJI NEW ZEALA
Departmen
0%
2%
4%
6%
8%
10%
12%
14%
16%
7. R
Country Cod
AND
nt of Statist
Rural Unava
es:
tics, Februa
nemployailable c
ary 2011
yment Rcountries
Rates, bys, lat
y Age Grtest year
roup r (%)
FJ19
NZ2
996
2001