1 finance school of management chapter 3: interpreting financial statements objective contrast...
TRANSCRIPT
1
FinanceFinance School of Management School of Management
Chapter 3: Interpreting Chapter 3: Interpreting Financial StatementsFinancial Statements
ObjectiveContrast Economic and
Accounting ModelsValue of Accounting
Information
2
FinanceFinance School of Management School of Management
Chapter 3 ContentsChapter 3 Contents
Review of Financial Statements
Market Values v. Book Values
Accounting v. Economic Measures of Income
Return on Shareholders v. Return on Equity
Analysis Using Financial Ratios
The Relation Among Ratios
Limitations of Ratio Analysis
Purpose and Process of Financial Planning
Managing Working Capital
3
FinanceFinance School of Management School of Management
Review of Financial StatementsReview of Financial Statements
Financial Statements– Provide information (clues) to the owners &
creditors of a firm about the current status and past performance.
– Provide a convenient way for owners & creditors to set performance targets & to impose restrictions on the managers of the firm.
– Provide a convenient templates for financial planning.
4
FinanceFinance School of Management School of Management
The Balance SheetThe Balance Sheet
Summarizing a firm’s assets (what it owns), liabilities (what it owes), and net worth (owners’ equity) at a moment in time.– Amounts measured at historical values (acquisition
cost) and historical exchange rates.
– Prepared according to GAAP (Generally Accepted Accounting Principles).
– Exchange-listed companies must comply with SEC (Securities and Exchange Commission) rules.
5
FinanceFinance School of Management School of Management
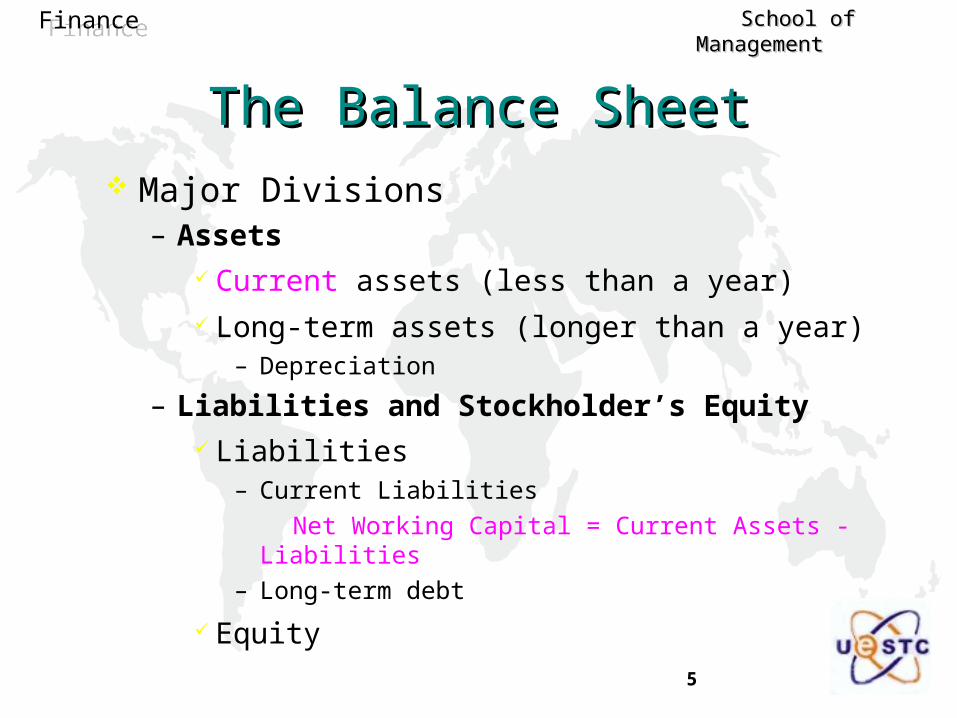
Major Divisions– Assets
Current assets (less than a year) Long-term assets (longer than a year)
– Depreciation
– Liabilities and Stockholder’s Equity Liabilities
– Current Liabilities
Net Working Capital = Current Assets - Liabilities
– Long-term debt
Equity
The Balance SheetThe Balance Sheet

6
FinanceFinance School of Management School of ManagementGPC Balance Sheet at Dec 31, 2xx1
2xx12xx0
200.0 187.2
Market PricePer Share
2xx0 ChangeAssetsCash & mkt'ble secs 100.0 120.0 20.0 Receivables 50.0 60.0 10.0 Inventories 150.0 180.0 30.0 *Current assets 300.0 360.0 60.0
Pp&e 400.0 490.0 90.0 Acc depreciation (100.0) (130.0) (30.0) *Net pp&e 300.0 360.0 60.0
**Total Assets 600.0 720.0 120.0
Liabilities & EquityAccounts payable 60.0 72.0 12.0 Short-term debt 90.0 184.6 94.6 *Current liabilities 150.0 256.6 106.6
Long-term debt 150.0 150.0 - **Total liabilities 300.0 406.6 106.6
Paid-in capital 200.0 200.0 - Retained earnings 100.0 113.4 13.4 *Shareholders equ 300.0 313.4 13.4
Liab + Shareholder 600.0 720.0 120.0
2xx1
7
FinanceFinance School of Management School of Management
The Income StatementThe Income Statement
Summarizing the profitability of a company during a time period.– the difference of revenues and expenses
– also to be called the statement of the earnings or the statement of profit and loss
8
FinanceFinance School of Management School of Management
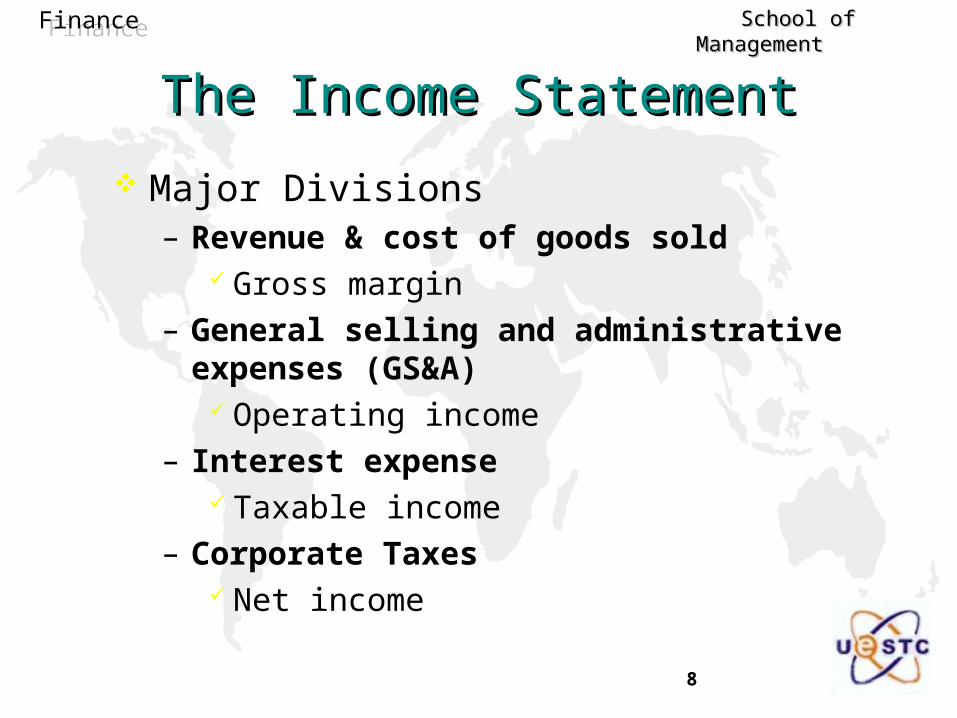
Major Divisions– Revenue & cost of goods sold
Gross margin
– General selling and administrative expenses (GS&A)
Operating income
– Interest expense Taxable income
– Corporate Taxes Net income
The Income StatementThe Income Statement
9
FinanceFinance School of Management School of Management
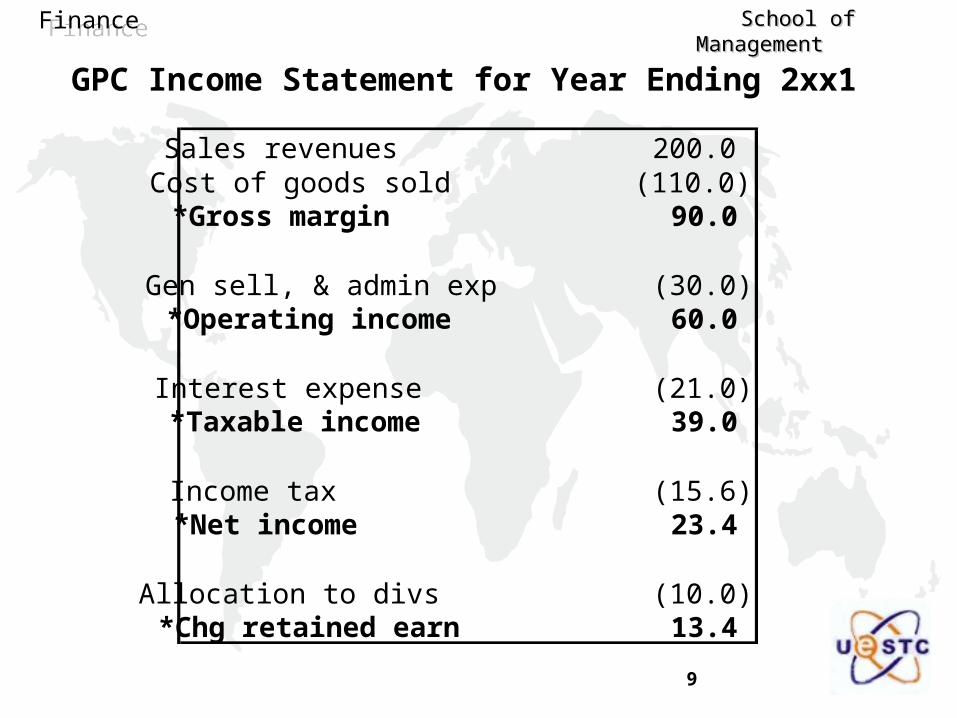
GPC Income Statement for Year Ending 2xx1
Sales revenues 200.0 Cost of goods sold (110.0) *Gross margin 90.0
Gen sell, & admin exp (30.0) *Operating income 60.0
Interest expense (21.0) *Taxable income 39.0
Income tax (15.6) *Net income 23.4
Allocation to divs (10.0) *Chg retained earn 13.4
10
FinanceFinance School of Management School of Management
It is important to remember– Retained earnings are not added to the cash
balance of the firm, but are added to shareholder’s equity.
– Accounts show historical values, not market values.
The Income StatementThe Income Statement
11
FinanceFinance School of Management School of Management
The Cash-Flow StatementThe Cash-Flow Statement
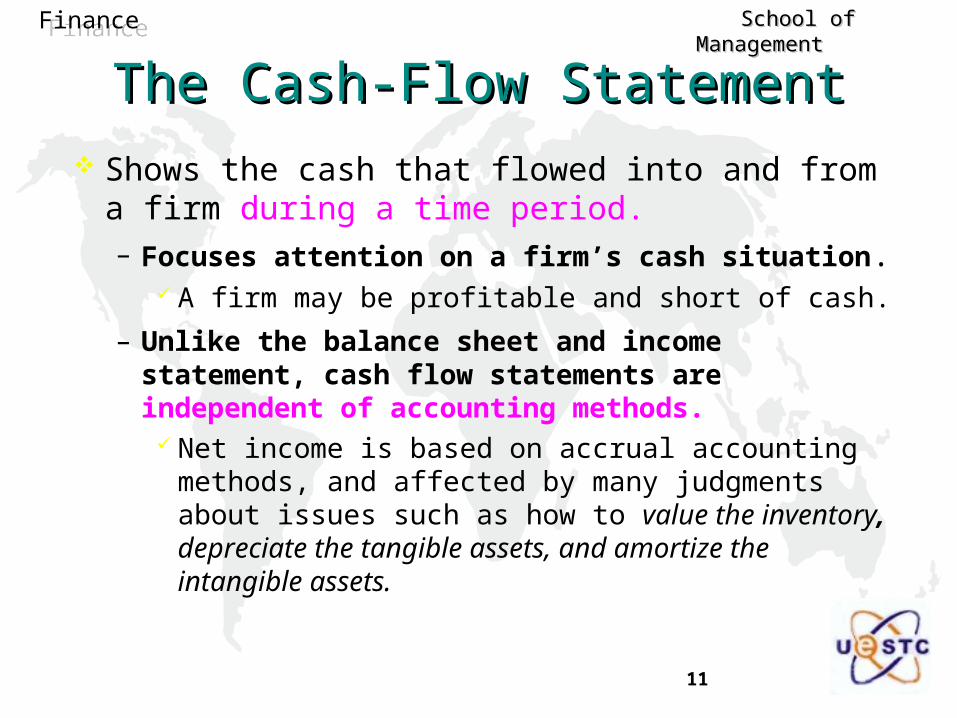
Shows the cash that flowed into and from a firm during a time period.– Focuses attention on a firm’s cash situation.
A firm may be profitable and short of cash.
– Unlike the balance sheet and income statement, cash flow statements are independent of accounting methods.
Net income is based on accrual accounting methods, and affected by many judgments about issues such as how to value the inventory, depreciate the tangible assets, and amortize the intangible assets.
12
FinanceFinance School of Management School of Management
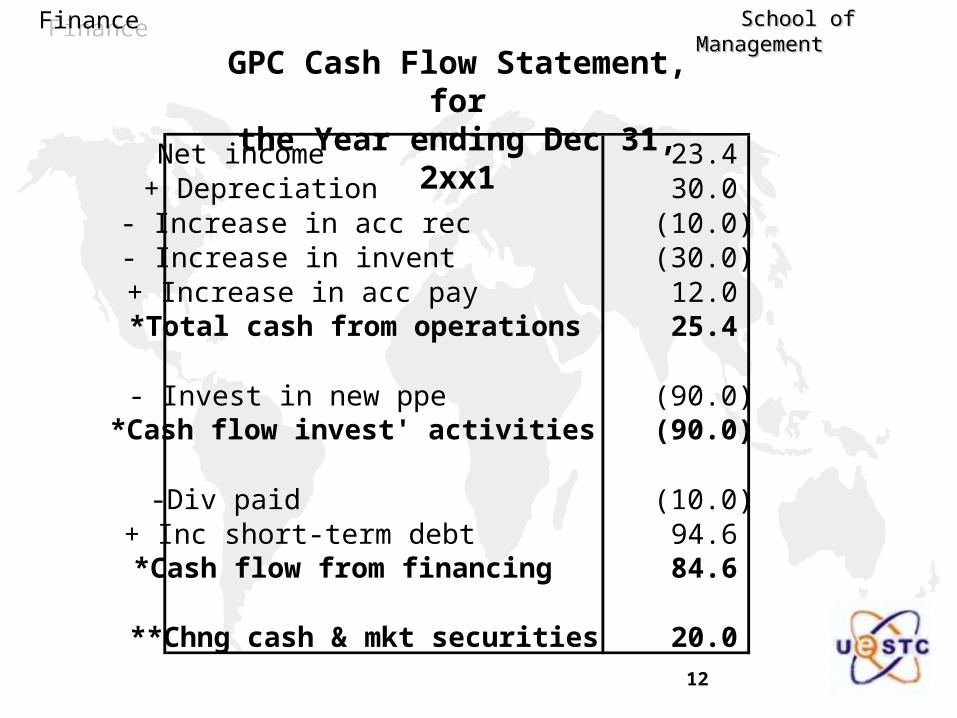
GPC Cash Flow Statement, forthe Year ending Dec 31, 2xx1
Net income 23.4 + Depreciation 30.0 - Increase in acc rec (10.0) - Increase in invent (30.0) + Increase in acc pay 12.0 *Total cash from operations 25.4
- Invest in new ppe (90.0) *Cash flow invest' activities (90.0)
-Div paid (10.0) + Inc short-term debt 94.6 *Cash flow from financing 84.6
**Chng cash & mkt securities 20.0
13
FinanceFinance School of Management School of Management
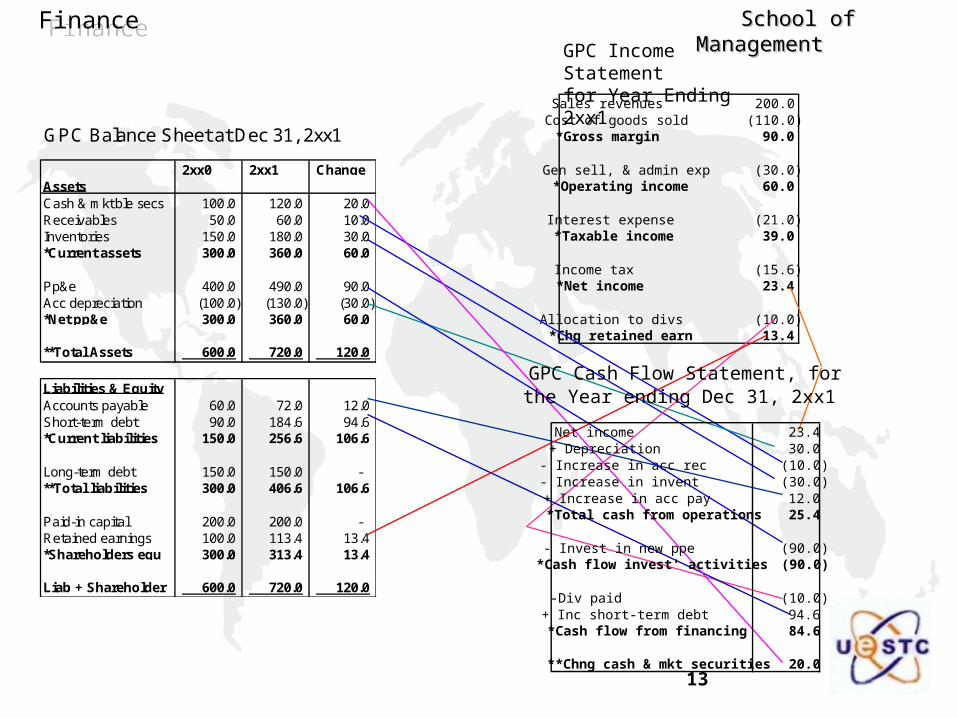
GPC Balance Sheet at Dec 31, 2xx1
2xx0 2xx1 ChangeAssetsCash & mkt'ble secs 100.0 120.0 20.0 Receivables 50.0 60.0 10.0 Inventories 150.0 180.0 30.0 *Current assets 300.0 360.0 60.0
Pp&e 400.0 490.0 90.0 Acc depreciation (100.0) (130.0) (30.0) *Net pp&e 300.0 360.0 60.0
**Total Assets 600.0 720.0 120.0
Liabilities & EquityAccounts payable 60.0 72.0 12.0 Short-term debt 90.0 184.6 94.6 *Current liabilities 150.0 256.6 106.6
Long-term debt 150.0 150.0 - **Total liabilities 300.0 406.6 106.6
Paid-in capital 200.0 200.0 - Retained earnings 100.0 113.4 13.4 *Shareholders equ 300.0 313.4 13.4
Liab + Shareholder 600.0 720.0 120.0
GPC Income Statement for Year Ending 2xx1
Sales revenues 200.0 Cost of goods sold (110.0) *Gross margin 90.0
Gen sell, & admin exp (30.0) *Operating income 60.0
Interest expense (21.0) *Taxable income 39.0
Income tax (15.6) *Net income 23.4
Allocation to divs (10.0) *Chg retained earn 13.4
GPC Cash Flow Statement, forthe Year ending Dec 31, 2xx1
Net income 23.4 + Depreciation 30.0 - Increase in acc rec (10.0) - Increase in invent (30.0) + Increase in acc pay 12.0 *Total cash from operations 25.4
- Invest in new ppe (90.0) *Cash flow invest' activities (90.0)
-Div paid (10.0) + Inc short-term debt 94.6 *Cash flow from financing 84.6
**Chng cash & mkt securities 20.0
14
FinanceFinance School of Management School of Management
Notes on Financial StatementsNotes on Financial Statements
More information relevant to understanding the true financial condition of the company in the notes to the financial statements.
–An explanation of accounting methods used
–Greater details regarding certain assets or liabilities
–Information regarding the equity structure of the firm
–Documentation of changes in operations
–Off-balance-sheet items
15
FinanceFinance School of Management School of Management
Market Values v. Book ValuesMarket Values v. Book Values
Book value: the official accounting values of assets and shareholders’ equity
Two reasons why the market price of a company’s stock does not equal its book value
–The book value does not include all of a firm’s assets and liabilities.
–The assets and liabilities included on a firm’s official balance sheet are valued at original acquisition cost less depreciation, rather than at current market value.
16
FinanceFinance School of Management School of Management
The accounting balance sheet often omits some economically significant assets.– Intangible assets: a good reputation, a knowledge base
– Goodwill: the difference between the acquisition price and the book value when a firm is acquired
The accounting balance sheet also omits some economically significant liabilities.– Contingent liabilities: costly lawsuits
Market Values v. Book ValuesMarket Values v. Book Values
17
FinanceFinance School of Management School of Management
IBM’s equipment for shell molding– Purchased for $3.9 million 3 years ago
– The book value at $2.6 million after 3 years depreciation
– The market value has fallen to $1.2 million because of technological change in the manufacture of computer shells.
Inventory of copper to be used in the manufacturing process of heating furnaces– You paid $29,000 at the beginning of the year.
– The market value has risen to $60,000.
For decision-making purposes, the correct value to use is the market value, whenever available.– Marking to market
Which is Relevant for Financial Decision-MakingWhich is Relevant for Financial Decision-Making
18
FinanceFinance School of Management School of Management
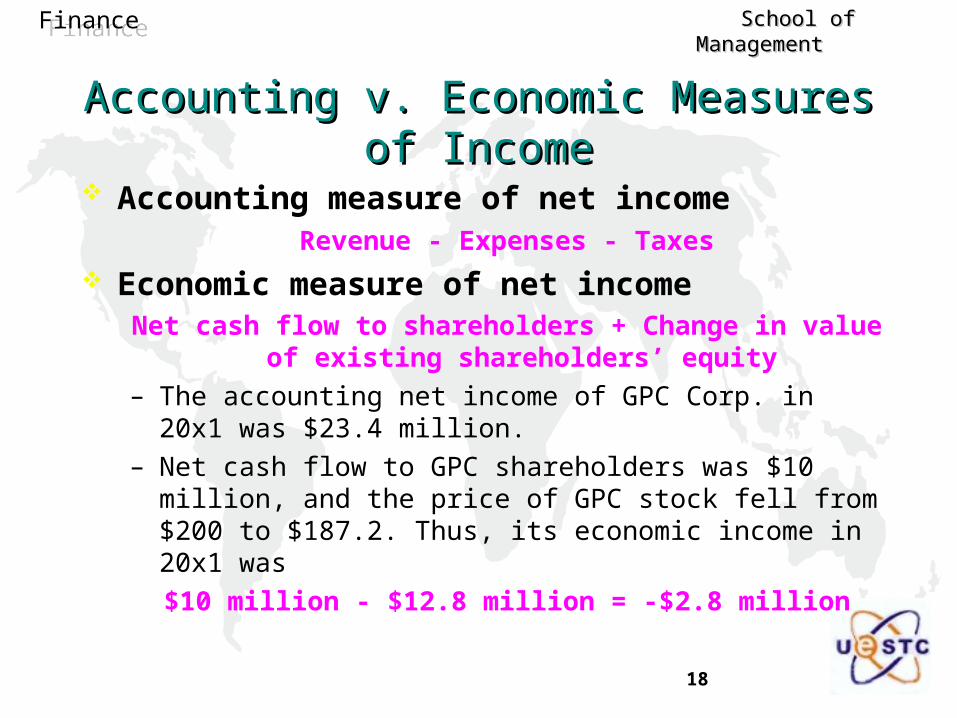
Accounting measure of net income Revenue - Expenses - Taxes
Economic measure of net income Net cash flow to shareholders + Change in value of existing
shareholders’ equity
– The accounting net income of GPC Corp. in 20x1 was $23.4 million.
– Net cash flow to GPC shareholders was $10 million, and the price of GPC stock fell from $200 to $187.2. Thus, its economic income in 20x1 was
$10 million - $12.8 million = -$2.8 million
Accounting v. Economic Measures of IncomeAccounting v. Economic Measures of Income
19
FinanceFinance School of Management School of Management
Returns to Shareholders v. Return on EquityReturns to Shareholders v. Return on Equity
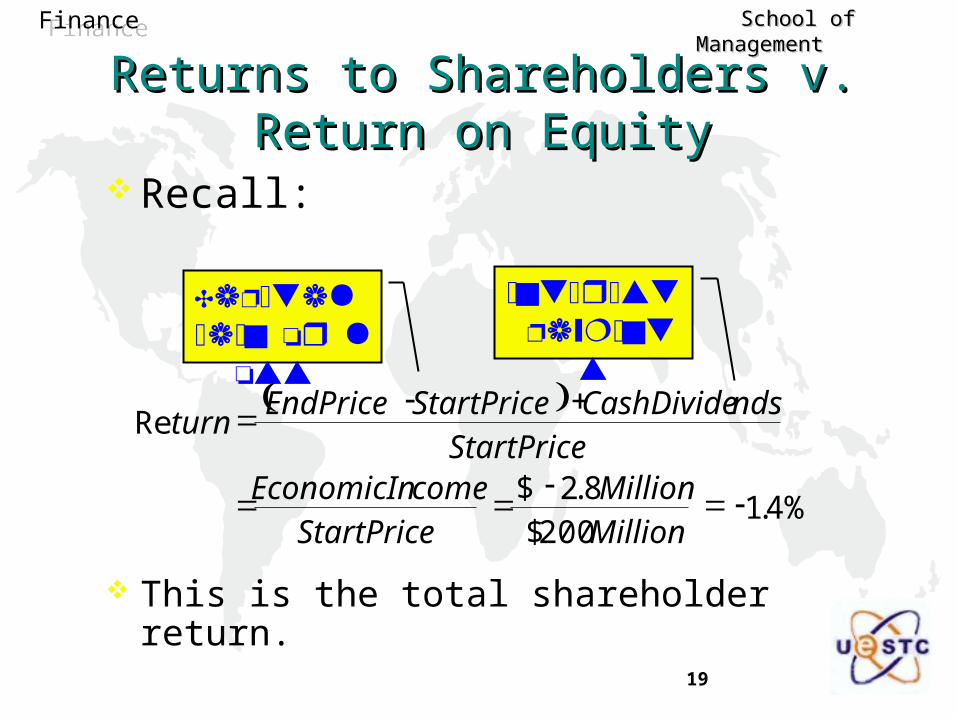
Recall:
This is the total shareholder return.
4%.1200$
8.2$
Re
MillionMillion
StartPricecomeEconomicIn
StartPricendsCashDivideStartPriceEndPrice
turn
20
FinanceFinance School of Management School of Management
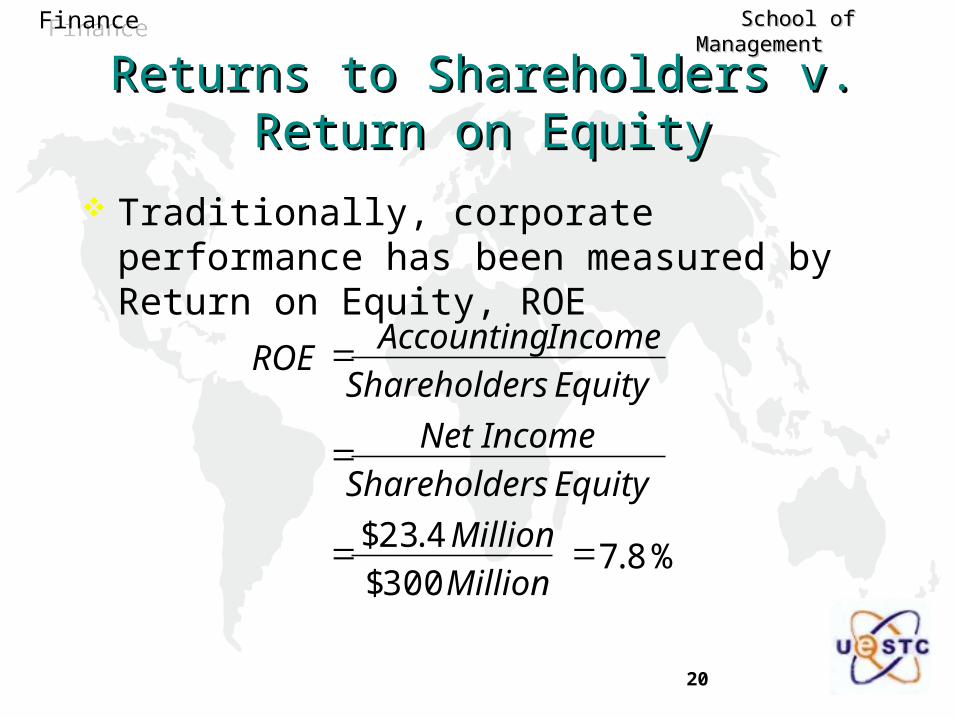
Traditionally, corporate performance has been measured by Return on Equity, ROE
%8.7300$
4.23$
Million
Million
EquityShareholders
Net Income
EquityShareholders
IncomeAccountingROE
Returns to Shareholders v. Return on EquityReturns to Shareholders v. Return on Equity
21
FinanceFinance School of Management School of Management
Analysis Using Financial RatiosAnalysis Using Financial Ratios
Despite the differences between accounting and economic financial principle, a firm’s published statements can often offer some clues about its financial condition and provide insights into its past performance that may be relevant for the future.
22
FinanceFinance School of Management School of Management
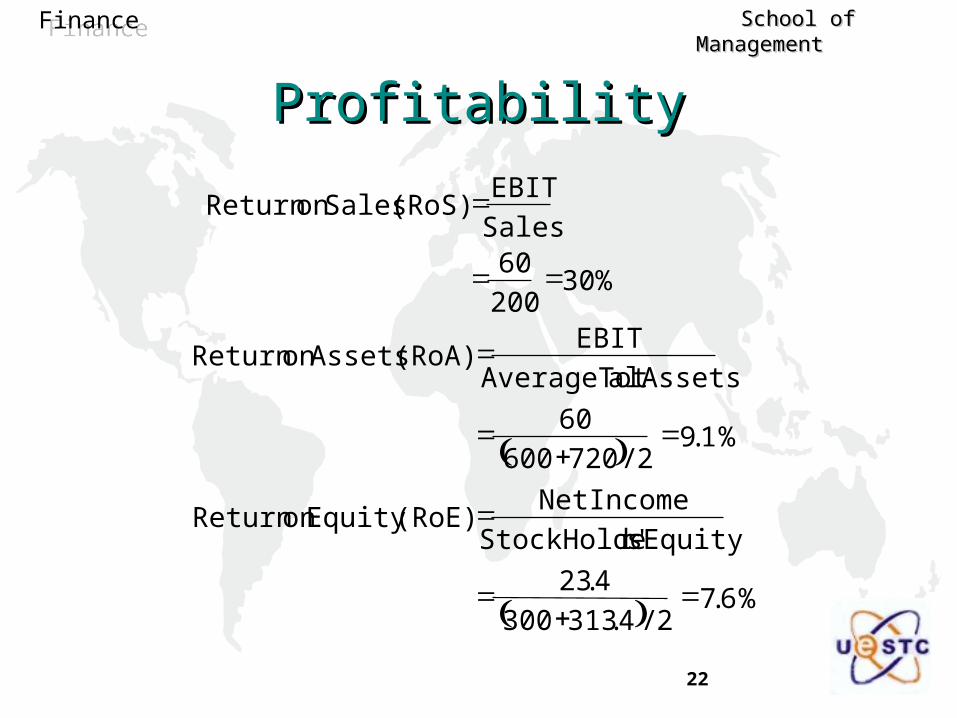
ProfitabilityProfitability
%6.72/4.313300
4.23
sEquityr'StockHolde
NetIncome (RoE)Equity on Return
%1.92/720600
60
alAssetsAverageTot
EBIT (RoA) Assetson Return
%30200
60Sales
EBIT (RoS) Saleson Return
23
FinanceFinance School of Management School of Management
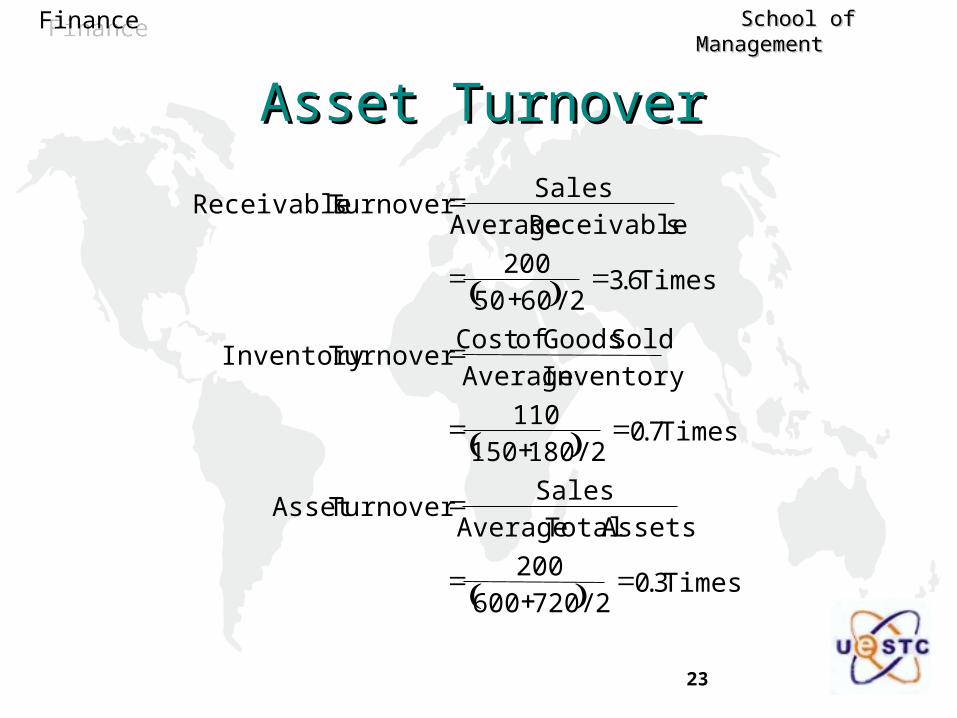
Asset TurnoverAsset Turnover
Times 3.02/720600
200
Assets Total Average
Sales Turnover Asset
Times 7.02/180150
110
Inventory Average
Sold Goods ofCost Turnover Inventory
Times 6.32/6050
200
sReceivable Average
Sales Turnover sReceivable
24
FinanceFinance School of Management School of Management
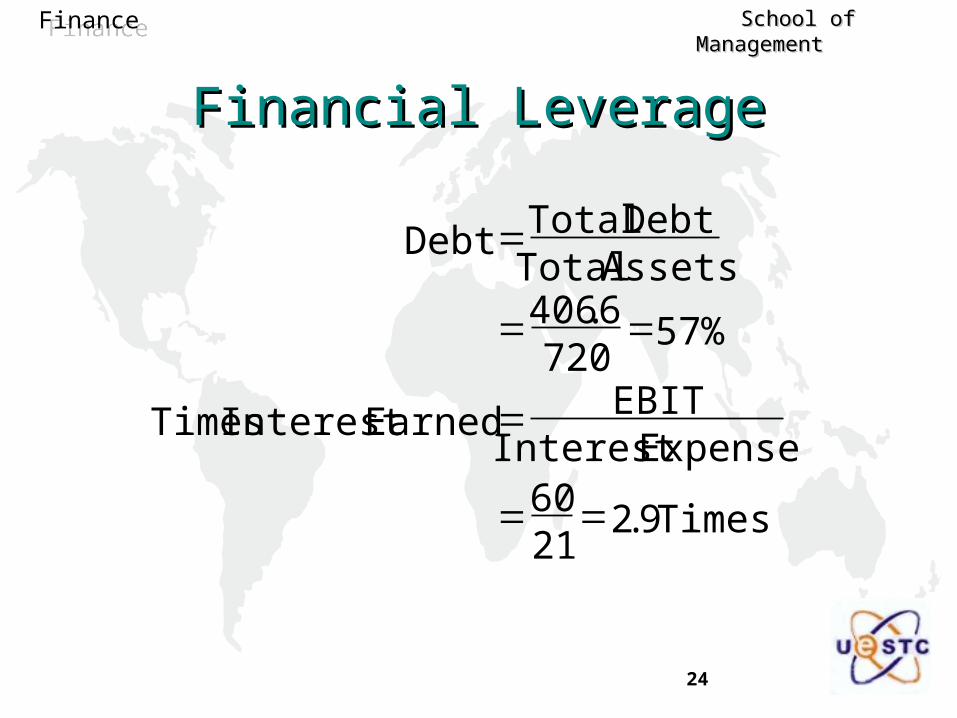
Financial LeverageFinancial Leverage
Times 9.22160
ExpenseInterest EBIT Earned Interest Times
%57720
6.406Assets TotalDebt Total Debt
25
FinanceFinance School of Management School of Management
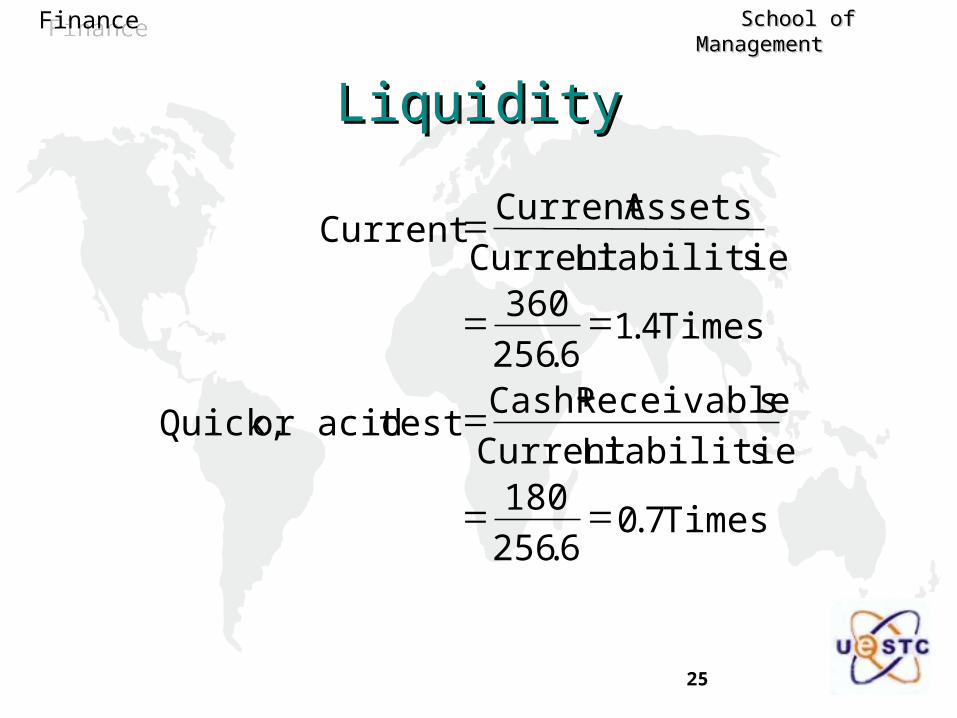
LiquidityLiquidity
Times 7.06.256
180sLiabilitieCurrent
sReceivableCash testor acid Quick,
Times 4.16.256
360sLiabilitieCurrent
AssetsCurrent Current
26
FinanceFinance School of Management School of Management
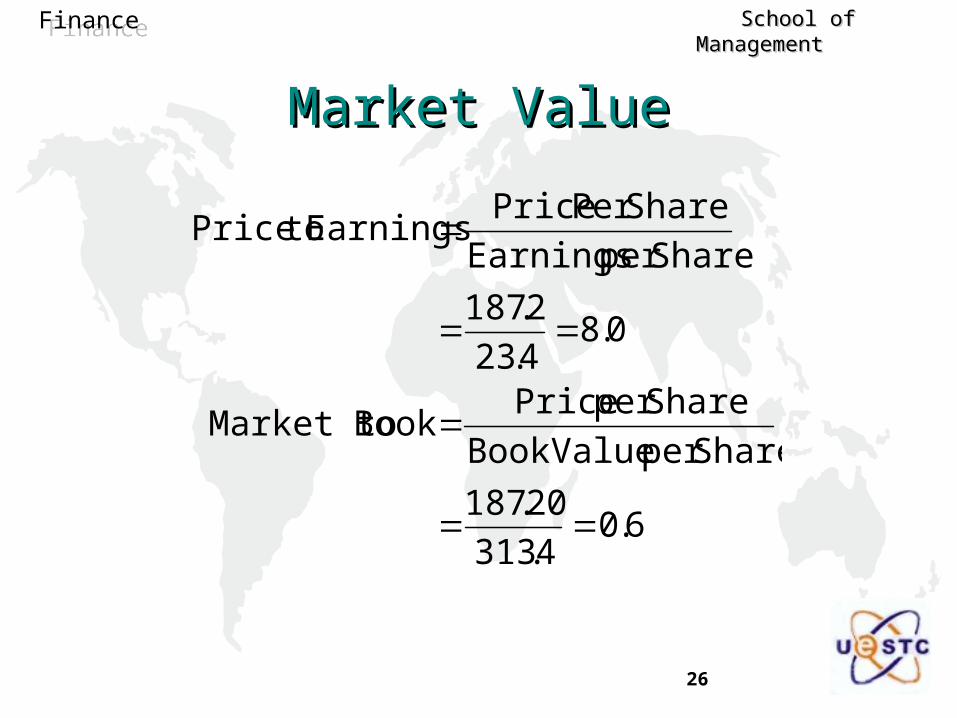
Market ValueMarket Value
6.04.313
20.187
Shareper ValueBook
Shareper Price Book Market to
0.84.23
2.187
Shareper Earnings
SharePer Price Earnings toPrice

27
FinanceFinance School of Management School of Management
Ratio ComparisonsRatio Comparisons Establish Your Perspective
– Shareholder
– Employee, Management, or Union
– Creditor
– Predator, Customer, Supplier, Competitor, Trade Association
Benchmarks– Other companies’ ratios
– The firm’s historical ratios
– Data extracted from financial markets
28
FinanceFinance School of Management School of Management
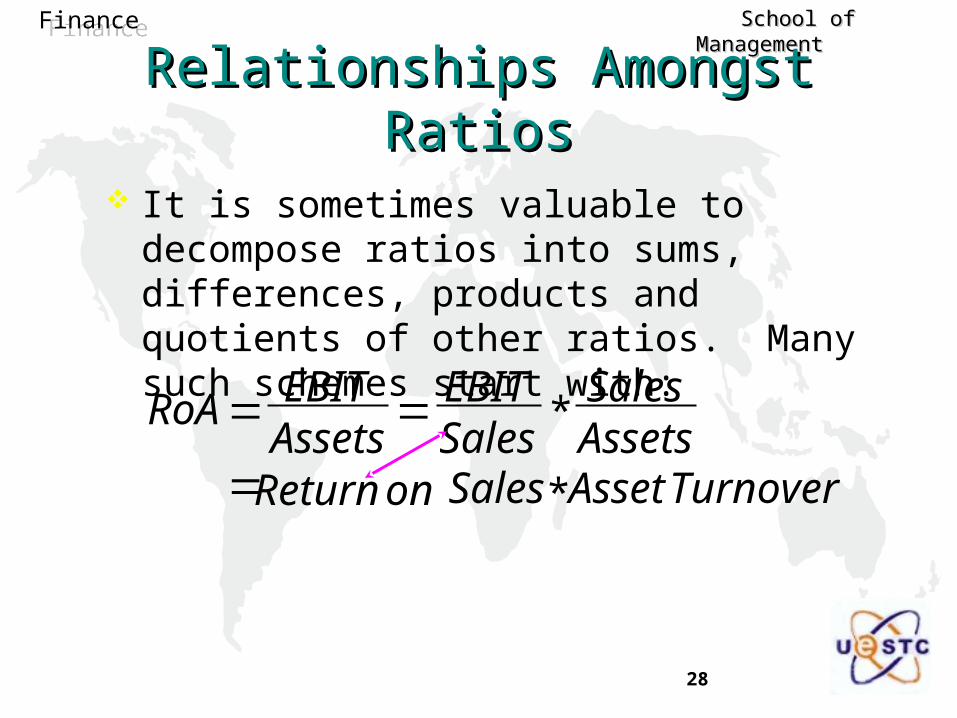
Relationships Amongst RatiosRelationships Amongst Ratios
It is sometimes valuable to decompose ratios into sums, differences, products and quotients of other ratios. Many such schemes start with:
TurnoverAsset *Saleson Return
*
AssetsSales
SalesEBIT
AssetsEBITRoA
29
FinanceFinance School of Management School of Management
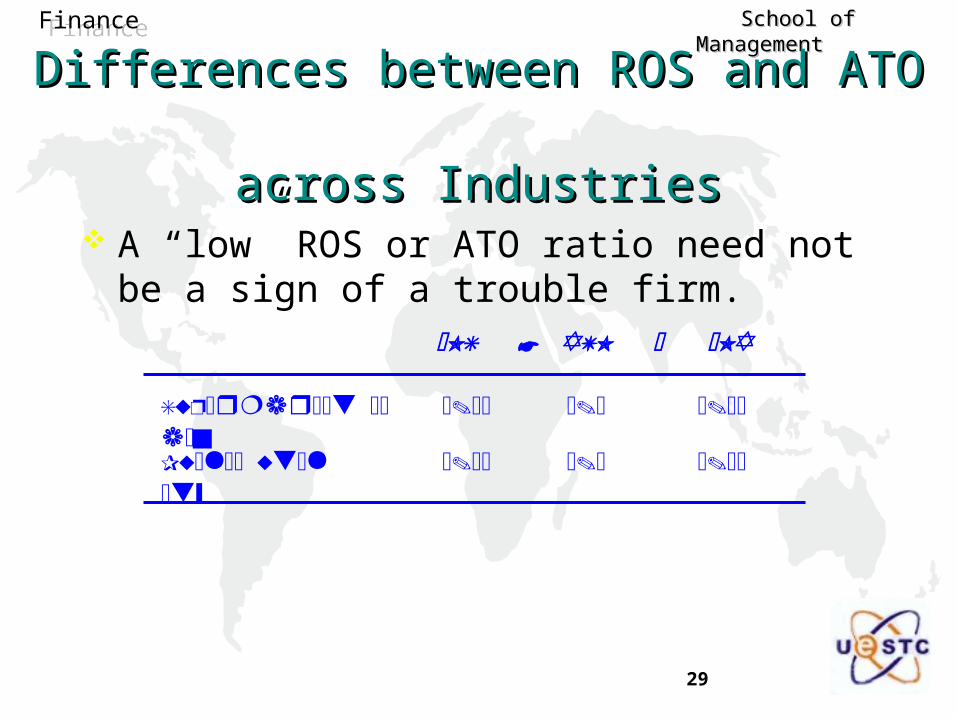
Differences between ROS and ATO Differences between ROS and ATO across Industriesacross Industries
A “low” ROS or ATO ratio need not be a sign of a trouble firm.
30
FinanceFinance School of Management School of Management
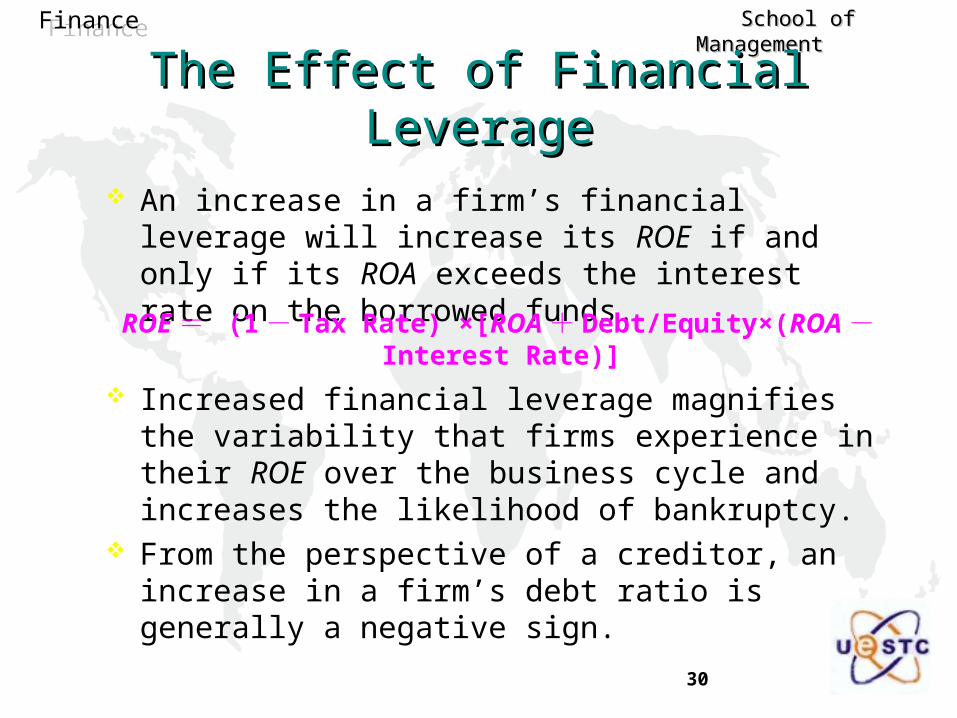
The Effect of Financial LeverageThe Effect of Financial Leverage
An increase in a firm’s financial leverage will increase its ROE if and only if its ROA exceeds the interest rate on the borrowed funds.
Increased financial leverage magnifies the variability that firms experience in their ROE over the business cycle and increases the likelihood of bankruptcy.
From the perspective of a creditor, an increase in a firm’s debt ratio is generally a negative sign.
ROE = (1 - Tax Rate) ×[ROA + Debt/Equity×(ROA - Interest Rate)]
31
FinanceFinance School of Management School of Management
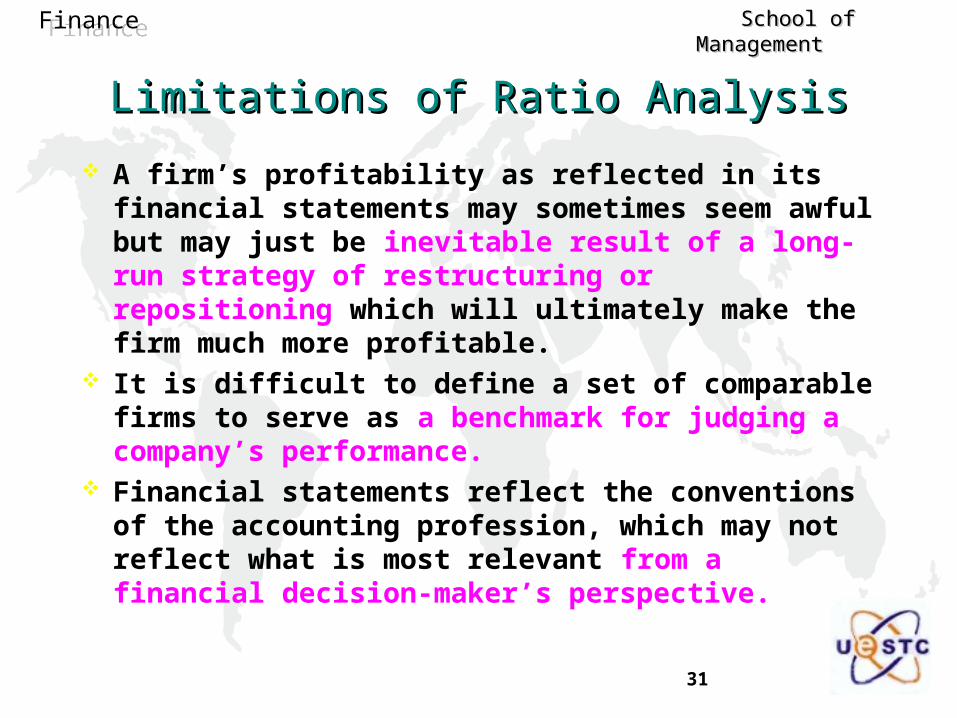
A firm’s profitability as reflected in its financial statements may sometimes seem awful but may just be inevitable result of a long-run strategy of restructuring or repositioning which will ultimately make the firm much more profitable.
It is difficult to define a set of comparable firms to serve as a benchmark for judging a company’s performance.
Financial statements reflect the conventions of the accounting profession, which may not reflect what is most relevant from a financial decision-maker’s perspective.
Limitations of Ratio AnalysisLimitations of Ratio Analysis
32
FinanceFinance School of Management School of Management
The Financial Planning ProcessThe Financial Planning Process
Financial Planning is a dynamic process following a cycle of – making plans,
– implementing them, and
– revising them in the light of actual results.
Strategic plans Planning horizon
33
FinanceFinance School of Management School of Management
Steps of Financial Planning ProcessSteps of Financial Planning Process
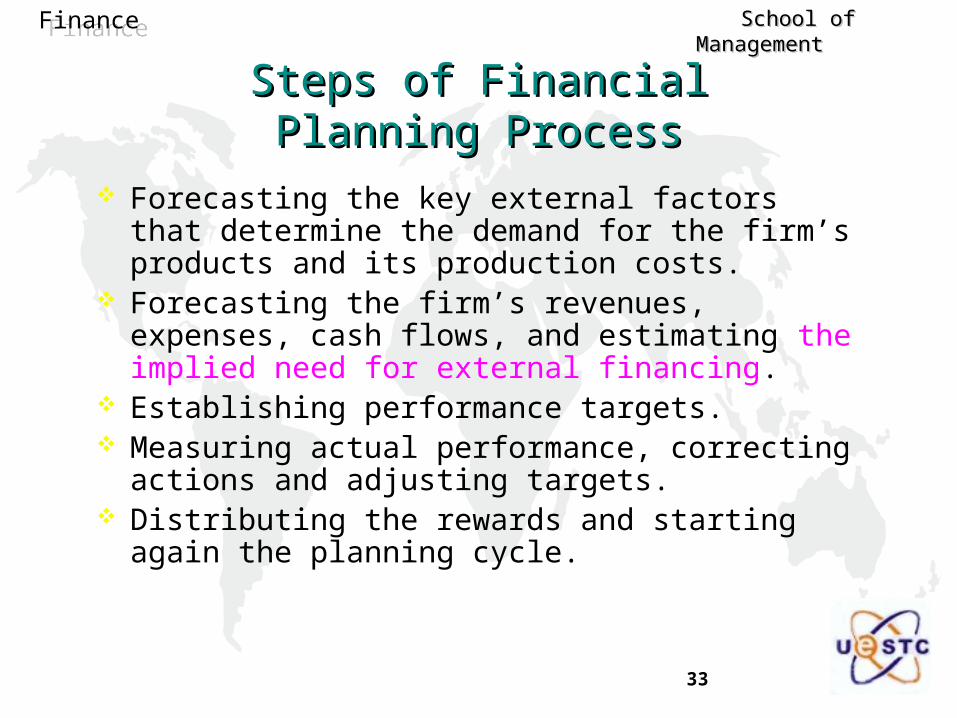
Forecasting the key external factors that determine the demand for the firm’s products and its production costs.
Forecasting the firm’s revenues, expenses, cash flows, and estimating the implied need for external financing.
Establishing performance targets. Measuring actual performance, correcting actions and
adjusting targets. Distributing the rewards and starting again the planning
cycle.
34
FinanceFinance School of Management School of Management
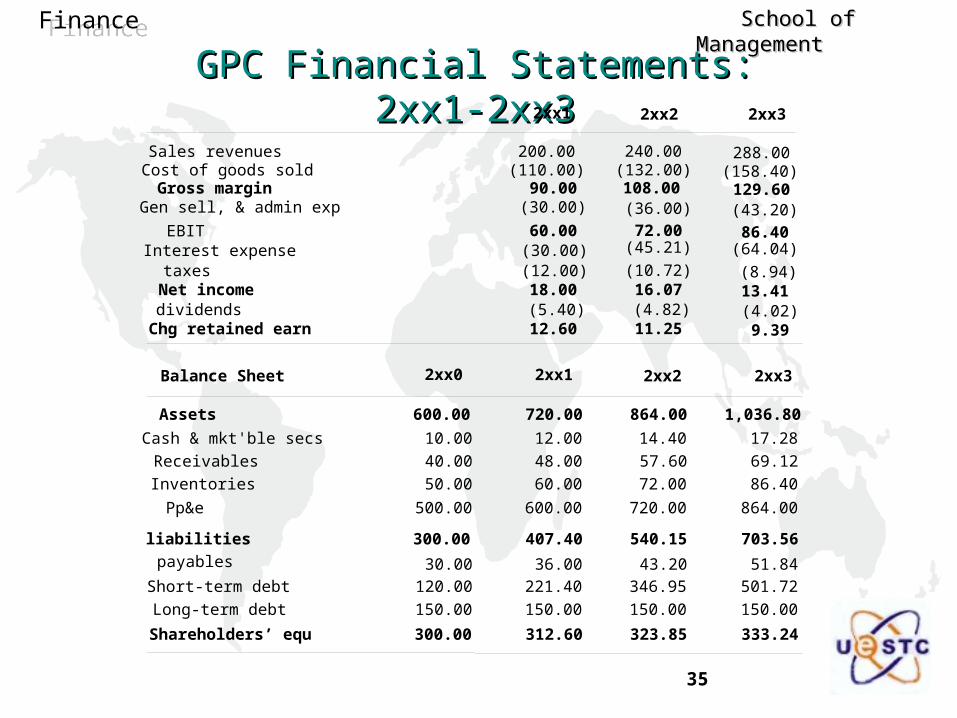
An Illustration: GPCAn Illustration: GPC
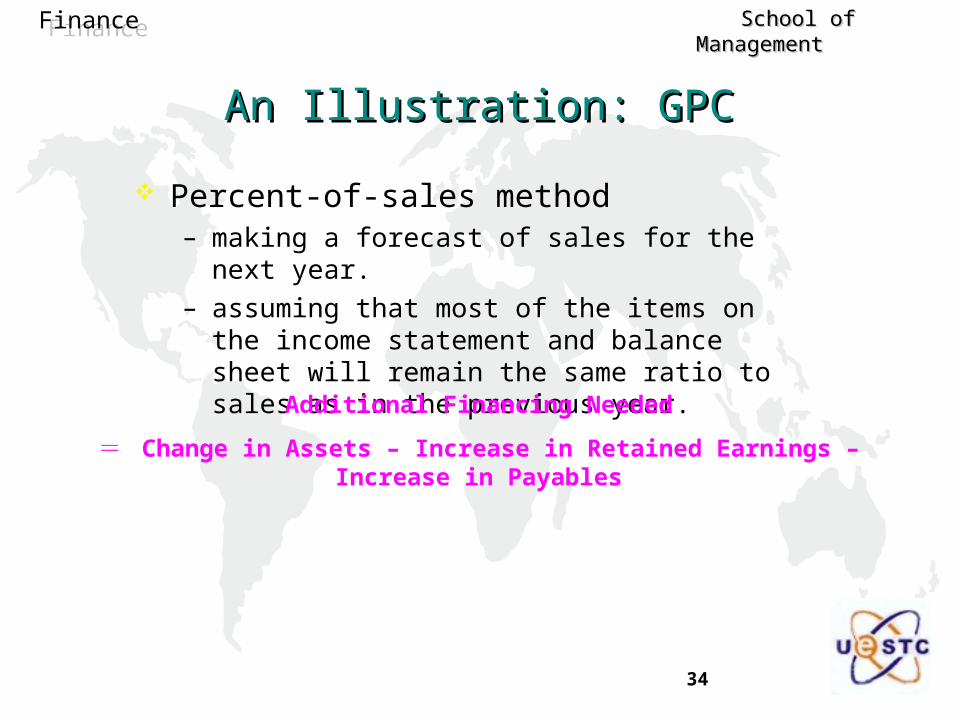
Percent-of-sales method – making a forecast of sales for the next year.
– assuming that most of the items on the income statement and balance sheet will remain the same ratio to sales as in the previous year.
Additional Financing Needed
= Change in Assets – Increase in Retained Earnings – Increase in Payables
35
FinanceFinance School of Management School of Management
GPC Financial Statements: 2xx1-2xx3GPC Financial Statements: 2xx1-2xx3
2xx0 2xx1
Cash & mkt'ble secs 10.00 12.00
Receivables 40.00 48.00
Inventories 50.00 60.00
Pp&e 500.00 600.00
Assets 600.00 720.00
payables 30.00 36.00
Short-term debt 120.00 221.40
Long-term debt 150.00 150.00
liabilities 300.00 407.40
Shareholders’ equ 300.00 312.60
14.40
57.60
72.00
720.00
864.00
43.20
346.95
150.00
540.15
323.85
2xx2
17.28
69.12
86.40
864.00
1,036.80
51.84
501.72
150.00
703.56
333.24
2xx3Balance Sheet
Sales revenuesCost of goods soldGross marginGen sell, & admin exp
EBITInterest expensetaxesNet incomedividendsChg retained earn
200.00(110.00)
90.00(30.00)
60.00(30.00)(12.00)18.00(5.40)12.60
240.00(132.00)108.00(36.00)
72.00(45.21)
(10.72)16.07(4.82)11.25
288.00(158.40)129.60(43.20)
86.40(64.04)
(8.94)13.41(4.02)9.39
2xx1 2xx2 2xx3
36
FinanceFinance School of Management School of Management
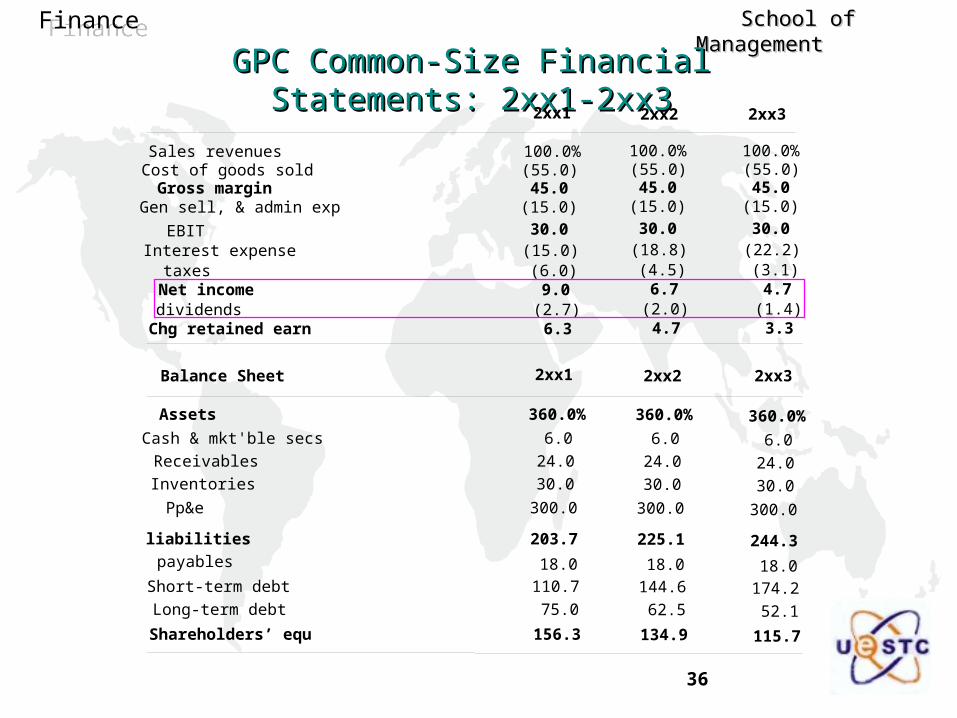
GPC Common-Size Financial Statements: 2xx1-2xx3GPC Common-Size Financial Statements: 2xx1-2xx3
2xx1
Cash & mkt'ble secs 6.0
Receivables 24.0
Inventories 30.0
Pp&e 300.0
Assets 360.0%
payables 18.0
Short-term debt 110.7
Long-term debt 75.0
liabilities 203.7
Shareholders’ equ 156.3
2xx2 2xx3Balance Sheet
Sales revenuesCost of goods soldGross marginGen sell, & admin exp
EBITInterest expensetaxesNet incomedividendsChg retained earn
100.0%(55.0)45.0
(15.0)
30.0(15.0)(6.0)9.0
(2.7)6.3
2xx1 2xx2 2xx3
100.0%(55.0)45.0
(15.0)
30.0(18.8)(4.5)6.7
(2.0)4.7
100.0%(55.0)45.0
(15.0)
30.0(22.2)(3.1)4.7
(1.4)3.3
6.0
24.0
30.0
300.0
360.0%
18.0
144.6
62.5
225.1
134.9
6.0
24.0
30.0
300.0
360.0%
18.0
174.2
52.1
244.3
115.7
37
FinanceFinance School of Management School of Management
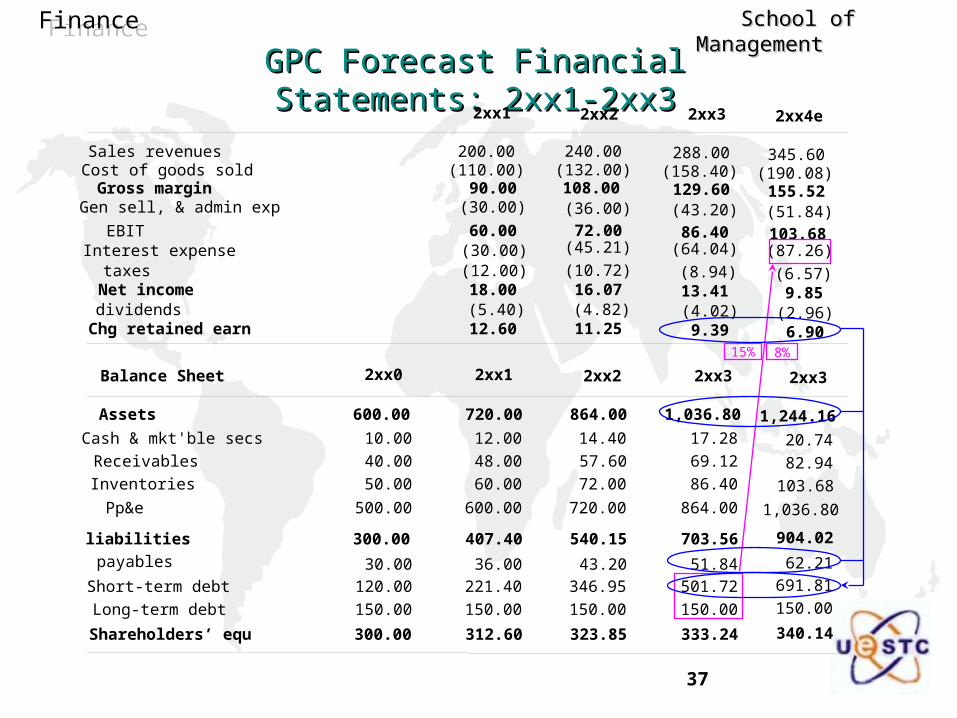
GPC Forecast Financial Statements: 2xx1-2xx3GPC Forecast Financial Statements: 2xx1-2xx3
2xx0 2xx1
Cash & mkt'ble secs 10.00 12.00
Receivables 40.00 48.00
Inventories 50.00 60.00
Pp&e 500.00 600.00
Assets 600.00 720.00
payables 30.00 36.00
Short-term debt 120.00 221.40
Long-term debt 150.00 150.00
liabilities 300.00 407.40
Shareholders’ equ 300.00 312.60
14.40
57.60
72.00
720.00
864.00
43.20
346.95
150.00
540.15
323.85
2xx2
17.28
69.12
86.40
864.00
1,036.80
51.84
501.72
150.00
703.56
333.24
2xx3Balance Sheet
Sales revenuesCost of goods soldGross marginGen sell, & admin exp
EBITInterest expensetaxesNet incomedividendsChg retained earn
200.00(110.00)
90.00(30.00)
60.00(30.00)(12.00)18.00(5.40)12.60
240.00(132.00)108.00(36.00)
72.00(45.21)
(10.72)16.07(4.82)11.25
288.00(158.40)129.60(43.20)
86.40(64.04)
(8.94)13.41(4.02)9.39
2xx1 2xx2 2xx3
20.74
82.94
103.68
1,036.80
1,244.16
62.21
691.81
150.00
904.02
340.14
2xx3
345.60(190.08)155.52(51.84)
103.68(87.26)
(6.57)9.85
(2.96)6.90
2xx4e
15% 8%
38
FinanceFinance School of Management School of Management
Sustainable Growth RateSustainable Growth Rate Assumptions:
– The firm will not issue any new equity shares, so that growth in equity capital occurs only through the retention of earnings.
– The firm will not increase its ratio of debt to equity, so that external debt financing will grow at the same rate as equity grows through retained earnings.
Sustainable Growth Rate = Earings Retention Rate × ROE
Implications: – The maximum sustainable growth rate is equal to the firm’s ROE.
– If a firm tries to grow faster than this rate, it will have to issue new shares and/or increase its debt.
39
FinanceFinance School of Management School of Management
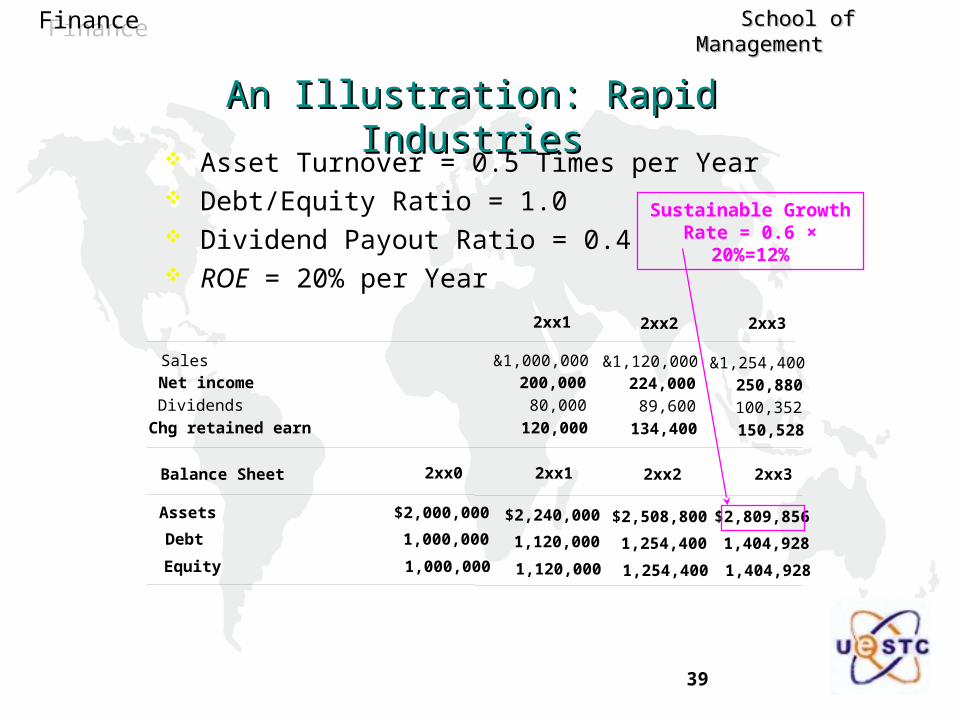
An Illustration: Rapid IndustriesAn Illustration: Rapid Industries
2xx0 2xx1
Assets $2,000,000
Debt 1,000,000
Equity 1,000,000
2xx2 2xx3Balance Sheet
Sales
Net income
Dividends
Chg retained earn
&1,000,000
200,000
80,000
120,000
2xx1 2xx2 2xx3
&1,120,000
224,000
89,600
134,400
&1,254,400
250,880
100,352
150,528
$2,240,000
1,120,000
1,120,000
$2,508,800
1,254,400
1,254,400
$2,809,856
1,404,928
1,404,928
Asset Turnover = 0.5 Times per Year Debt/Equity Ratio = 1.0 Dividend Payout Ratio = 0.4 ROE = 20% per Year
Sustainable Growth Rate = 0.6 × 20%=12%
40
FinanceFinance School of Management School of Management
In most cases cash must be paid out to cover expenses before any cash is collected from the sale of the firm’s products.– If a firm’s need for working capital is permanent rather than seasonal,
it usually seeks long-term financing for it.
– Seasonal financing needs are met through short-term financing arrangements.
The main principle of efficient working capital management – To minimize the amount of the firm’s investment in nonearning assets
such as receivables and inventories.
– To maximize the use of “free” credit such as prepayments by customers, accrued wages, and accounts payable.
Working Capital ManagementWorking Capital Management
41
FinanceFinance School of Management School of Management
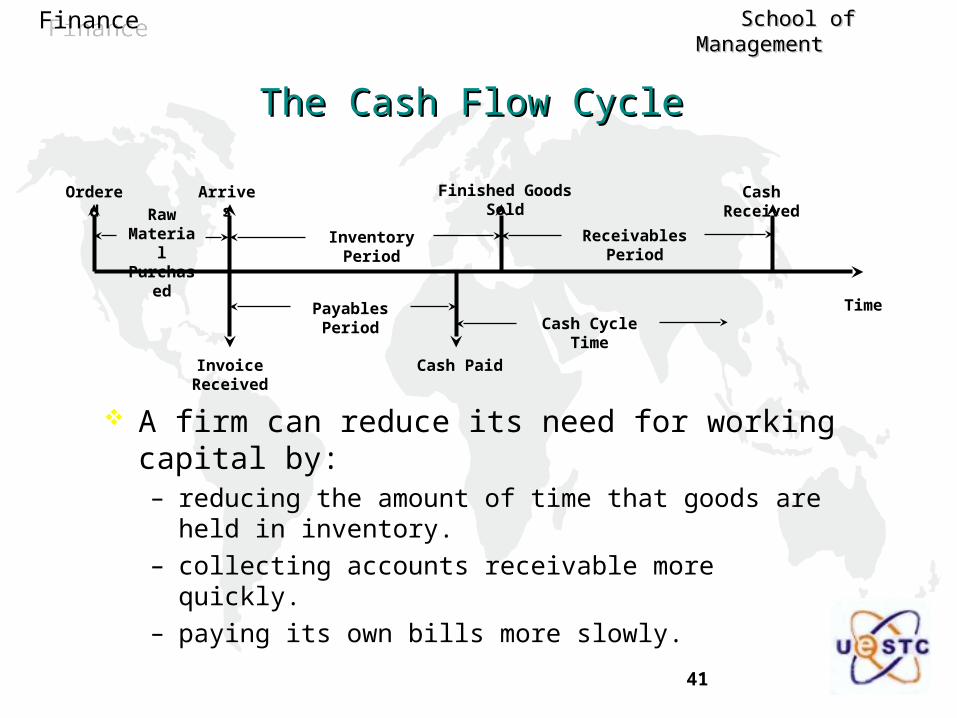
The Cash Flow CycleThe Cash Flow Cycle
Time
Ordered Arrives Finished Goods Sold Cash Received
Invoice Received Cash Paid
Payables Period
Inventory Period Receivables PeriodRaw
Material Purchased
Cash Cycle Time
A firm can reduce its need for working capital by: – reducing the amount of time that goods are held in inventory.
– collecting accounts receivable more quickly.
– paying its own bills more slowly.