1 electrophoresis - separationsnow.com ·...
TRANSCRIPT
9
1.0General
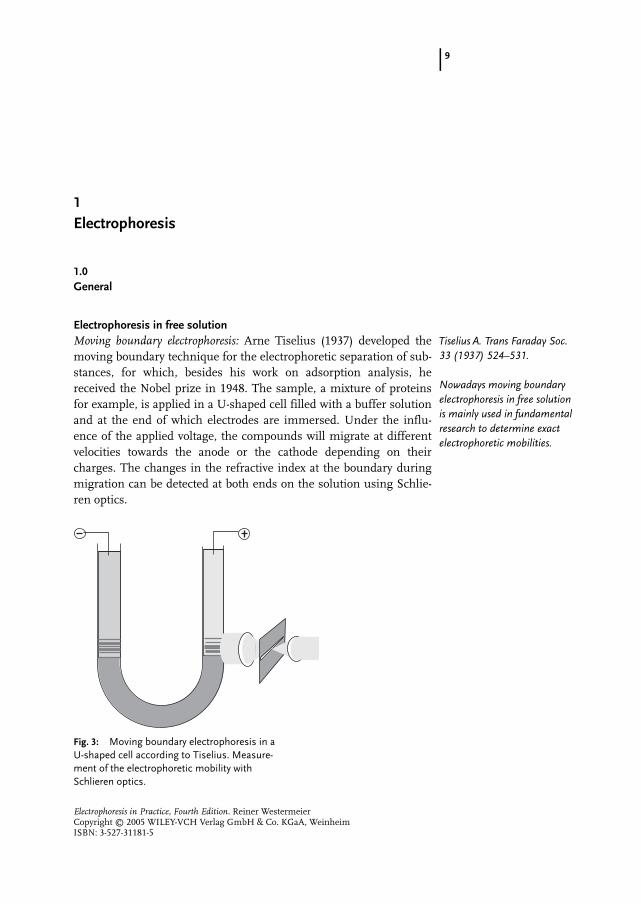
Electrophoresis in free solutionMoving boundary electrophoresis: Arne Tiselius (1937) developed themoving boundary technique for the electrophoretic separation of sub-stances, for which, besides his work on adsorption analysis, hereceived the Nobel prize in 1948. The sample, a mixture of proteinsfor example, is applied in a U-shaped cell filled with a buffer solutionand at the end of which electrodes are immersed. Under the influ-ence of the applied voltage, the compounds will migrate at differentvelocities towards the anode or the cathode depending on theircharges. The changes in the refractive index at the boundary duringmigration can be detected at both ends on the solution using Schlie-ren optics.
1
Electrophoresis
Fig. 3: Moving boundary electrophoresis in aU-shaped cell according to Tiselius. Measure-ment of the electrophoretic mobility withSchlieren optics.
Electrophoresis in Practice, Fourth Edition. Reiner WestermeierCopyright - 2005 WILEY-VCH Verlag GmbH & Co. KGaA, WeinheimISBN: 3-527-31181-5
Tiselius A. Trans Faraday Soc.33 (1937) 524–531.
Nowadays moving boundaryelectrophoresis in free solutionis mainly used in fundamentalresearch to determine exactelectrophoretic mobilities.
1 Electrophoresis
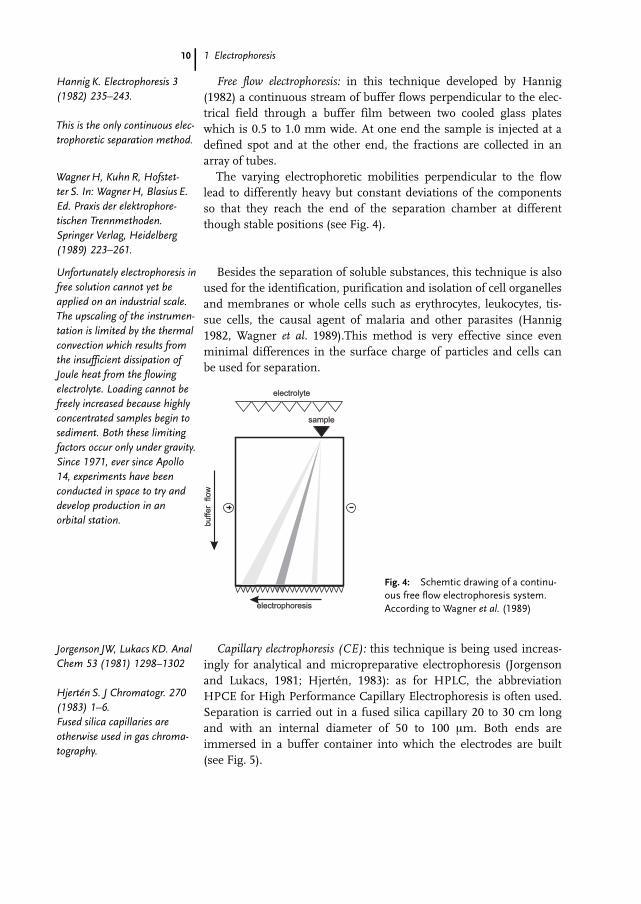
Free flow electrophoresis: in this technique developed by Hannig(1982) a continuous stream of buffer flows perpendicular to the elec-trical field through a buffer film between two cooled glass plateswhich is 0.5 to 1.0 mm wide. At one end the sample is injected at adefined spot and at the other end, the fractions are collected in anarray of tubes.The varying electrophoretic mobilities perpendicular to the flow
lead to differently heavy but constant deviations of the componentsso that they reach the end of the separation chamber at differentthough stable positions (see Fig. 4).
Besides the separation of soluble substances, this technique is alsoused for the identification, purification and isolation of cell organellesand membranes or whole cells such as erythrocytes, leukocytes, tis-sue cells, the causal agent of malaria and other parasites (Hannig1982, Wagner et al. 1989).This method is very effective since evenminimal differences in the surface charge of particles and cells canbe used for separation.
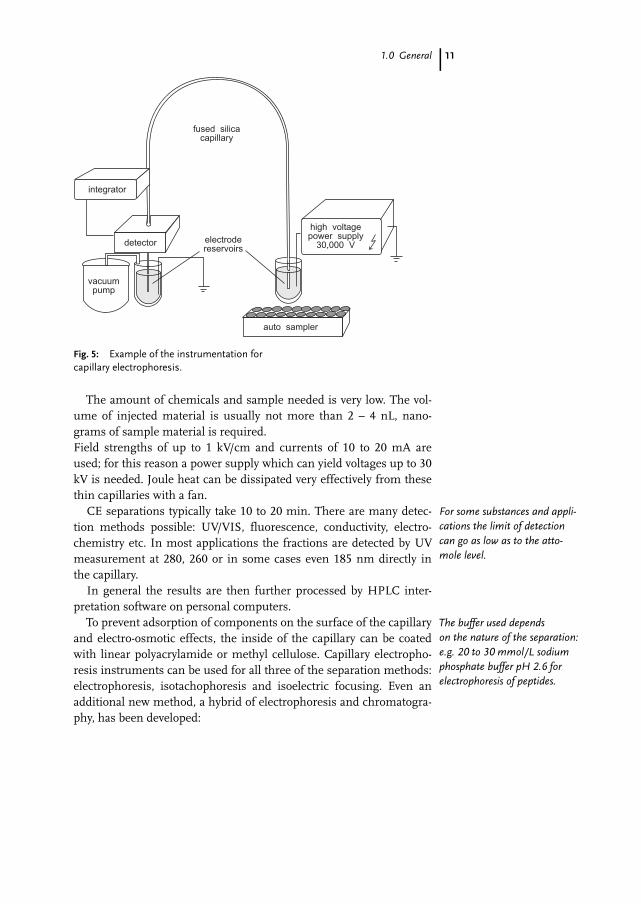
Capillary electrophoresis (CE): this technique is being used increas-ingly for analytical and micropreparative electrophoresis (Jorgensonand Lukacs, 1981; Hjert@n, 1983): as for HPLC, the abbreviationHPCE for High Performance Capillary Electrophoresis is often used.Separation is carried out in a fused silica capillary 20 to 30 cm longand with an internal diameter of 50 to 100 lm. Both ends areimmersed in a buffer container into which the electrodes are built(see Fig. 5).
10
sample
electrolyte
electrophoresis
buffer
flow
Fig. 4: Schemtic drawing of a continu-ous free flow electrophoresis system.According to Wagner et al. (1989)
Hannig K. Electrophoresis 3(1982) 235–243.
This is the only continuous elec-trophoretic separation method.
WagnerH, Kuhn R, Hofstet-ter S. In: WagnerH, Blasius E.Ed. Praxis der elektrophore-tischen Trennmethoden.Springer Verlag, Heidelberg(1989) 223–261.
Unfortunately electrophoresis infree solution cannot yet beapplied on an industrial scale.The upscaling of the instrumen-tation is limited by the thermalconvection which results fromthe insufficient dissipation ofJoule heat from the flowingelectrolyte. Loading cannot befreely increased because highlyconcentrated samples begin tosediment. Both these limitingfactors occur only under gravity.Since 1971, ever since Apollo14, experiments have beenconducted in space to try anddevelop production in anorbital station.
Jorgenson JW, Lukacs KD. AnalChem 53 (1981) 1298–1302
Hjert=n S. J Chromatogr. 270(1983) 1–6.Fused silica capillaries areotherwise used in gas chroma-tography.
1.0 General
The amount of chemicals and sample needed is very low. The vol-ume of injected material is usually not more than 2 – 4 nL, nano-grams of sample material is required.Field strengths of up to 1 kV/cm and currents of 10 to 20 mA areused; for this reason a power supply which can yield voltages up to 30kV is needed. Joule heat can be dissipated very effectively from thesethin capillaries with a fan.CE separations typically take 10 to 20 min. There are many detec-
tion methods possible: UV/VIS, fluorescence, conductivity, electro-chemistry etc. In most applications the fractions are detected by UVmeasurement at 280, 260 or in some cases even 185 nm directly inthe capillary.In general the results are then further processed by HPLC inter-
pretation software on personal computers.To prevent adsorption of components on the surface of the capillary
and electro-osmotic effects, the inside of the capillary can be coatedwith linear polyacrylamide or methyl cellulose. Capillary electropho-resis instruments can be used for all three of the separation methods:electrophoresis, isotachophoresis and isoelectric focusing. Even anadditional new method, a hybrid of electrophoresis and chromatogra-phy, has been developed:
11
high voltagepower supply
30,000 Vdetector
integrator
electrodereservoirs
fused silicacapillary
auto sampler
vacuumpump
Fig. 5: Example of the instrumentation forcapillary electrophoresis.
For some substances and appli-cations the limit of detectioncan go as low as to the atto-mole level.
The buffer used dependson the nature of the separation:e.g. 20 to 30 mmol/L sodiumphosphate buffer pH 2.6 forelectrophoresis of peptides.
1 Electrophoresis
Micellar electrokinetic chromatography (MEKC) introduced by Terabeet al. (1984). It is the only electrophoretic method, which can separateneutral as well as charged compounds. Surfactants are used at con-centrations over the the critical micelle concentration. The chargedmicelles migrate in the opposite direction to the electro-osmotic flowcreated by the capillary wall. The electro-osmotic counter-flow is fast-er than the migration of the micelles. During migration, the micellesinteract with the sample compounds in a chromatographic mannerthrough both hydrophobic and electrostatic interactions.It hasbecome one of the most widely used CE methods. More details onthis method are found in a review by Terabe et al. (1994).One great advantage of capillary electrophoresis lies in its automa-
tion. Every step can be controlled by semiautomatic or full automaticinstrumentation. An autosampler is a standard part of this equip-ment.Another advantage is the possibility of linking with other analytical
instruments either before electrophoresis: HPLC/HPCE or after:HPCE/MS.For preparative separations a fraction collector is attached to the
UV detector. The identification of the individual substances is doneby the relative mobility or the molecular weight, or else the collectedfractions are analyzed.
For molecular weight separations of proteins, peptides,and nucleicacids capillaries filled with linear (non crosslinked) polyacrylamidegel are used (Cohen et al. 1987).The most successful application of capillary electrophoresis is the
separation of DNA fragments. Because of the possibility of automa-tion and the repeated use of a high number of capillaries in parallel,this technique is ideal for high throughput DNA sequencing. It hadbeen predicted, that the complete knowledge of the human genomewould be available in the year 2005. But the introduction of the newmulti-capillary sequencers has speeded up the Human Genome Pro-ject considerably.
Electrophoresis in supporting media
Compact material such as paper, films or gels are used. So as tomonitor the progress of the separation and to recognize the end ofthe run, dyes with a high electrophoretic mobility are applied togetherwith the sample.For separation of proteins in anodal direction Bromophenol Blue,
Xylenecyanol or Orange G are used, in the cathodal direction Bromo-cresol Green, Pyronine or Methylene Blue.
12
Terabe S, Otsuka K, Ichikawa K,Tsuchiya A, Ando T. AnalChem.64 (1984) 111–113Terabe S, ChenN, Otsuka K. InChrambach A, DunnM,Radola BJ. Eds. Advances inElectrophoresis 7. VCHWeinheim (1994) 87–153.
However, the investment forsuch an instrument is by farhigher compared to a gel elec-trophoresis equipment.
In contrast to Reversed PhaseChromatography proteins arenot damaged during HPCEand, in addition, the resolutionis better.
Cohen AS, Karger BL. J Chro-matogr. 397 (1987) 409–417.
See also page 27
The instructions in the secondpart are limited to electrophor-esis in supporting media sincethese techniques only requireminimal equipment.

1.0 General
Detection of the separated zones can either be done directly in themedium by positive staining with Coomassie blue or silver, negativestaining with zinc-imidazole, spraying with specific reagents, enzymesubstrate coupling reactions, immuno precipitation, autoradiography,fluorography, or indirectly by immunoprinting or blotting methods.A comprehensive survey on enzyme staining methods has been pub-lished by Rothe (1994).
Paper and thin-layer electrophoresis: These methods have mostlybeen abandoned in profit of gel electrophoresis, because of improvedseparation and the higher loading capacity of agarose and polyacryl-amide gels. Electrophoretic separations on thin-layer silica gel plateslinked to buffer tanks are only carried out for the analysis of polysac-charides of high molecular weight and lipopolysaccharides, whichwould obstruct the pores of the gels (Scherz, 1990).Cellulose acetate membrane electrophoresis: cellulose acetate mem-
branes have large pores and therefore hardly exert any sieving effecton proteins (Kohn, 1957). This means that these electrophoretic sepa-rations are entirely based on charge density.The matrix exerts little effect on diffusion so that the separated
zones are relatively wide while the resolution and limit of detectionare low. On the other hand they are easy to handle and separationand staining are rapid. The cellulose acetate strips are suspended inthe tank of a horizontal apparatus, so that both ends dip in the buffer;no cooling is necessary during separation. This technique is widelyused for routine clinical analysis and related applications for the anal-ysis of serum or isoenzymes.
Gel electrophoresis
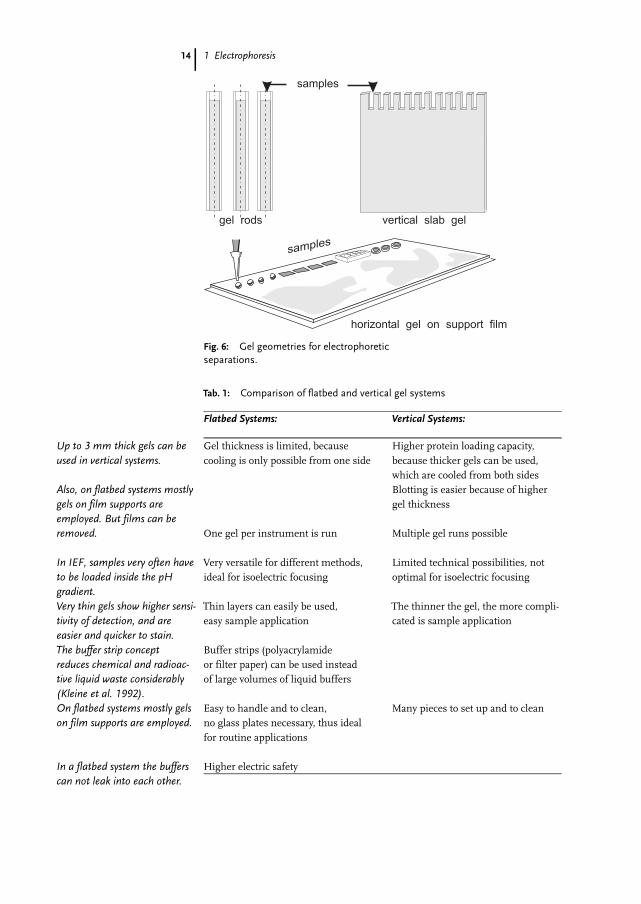
The gel: The gel matrix should have adjustable and regular poresizes, be chemically inert and not exhibit electroendosmosis. Verticalcylindrical gel rods or plates as well as horizontal gel slabs areemployed, the latter being usually cast on to stable support film tofacilitate handling (Fig. 6).The use of gel rods has become very rare, because of the compli-
cated handling and difficult pattern comparison. Slab gels for verticaland flatbed systems can be easily polymerized in the laboratory, butprefabricated gels of many different types are available from varioussuppliers. An overview over the features, benefits and drawbacks ofvertical and horizontal slab gel systems is given in Table 1.
13
Blotting: transfer to immobi-lizing membranes followed bystaining or specific ligandbinding.
RotheG. Electrophoresis ofenzymes. Springer Verlag,Berlin, (1994).
ScherzH. Electrophoresis 11(1990) 18–22.
Kohn J. Nature 180 (1957)986-988.
Because the resolution andreproducibility of separations inagarose and polyacrylamidegels are better, cellulose acetatemembranes are more andmore often replaced by gelelectrophoresis.
The most instructions in thesecond part are describinghorizontal gels on supportfilms since these can be usedfor all applications and withuniversally applicableequipment.
1 Electrophoresis
Tab. 1: Comparison of flatbed and vertical gel systems
Flatbed Systems: Vertical Systems:
Gel thickness is limited, becausecooling is only possible from one side
Higher protein loading capacity,because thicker gels can be used,which are cooled from both sidesBlotting is easier because of highergel thickness
One gel per instrument is run Multiple gel runs possible
Very versatile for different methods,ideal for isoelectric focusing
Limited technical possibilities, notoptimal for isoelectric focusing
Thin layers can easily be used,easy sample application
The thinner the gel, the more compli-cated is sample application
Buffer strips (polyacrylamideor filter paper) can be used insteadof large volumes of liquid buffers
Easy to handle and to clean,no glass plates necessary, thus idealfor routine applications
Many pieces to set up and to clean
Higher electric safety
14
samples
samples
gel rods vertical slab gel
horizontal gel on support film
Fig. 6: Gel geometries for electrophoreticseparations.
Up to 3 mm thick gels can beused in vertical systems.
Also, on flatbed systems mostlygels on film supports areemployed. But films can beremoved.
In IEF, samples very often haveto be loaded inside the pHgradient.Very thin gels show higher sensi-tivity of detection, and areeasier and quicker to stain.The buffer strip conceptreduces chemical and radioac-tive liquid waste considerably(Kleine et al. 1992).On flatbed systems mostly gelson film supports are employed.
In a flatbed system the bufferscan not leak into each other.
1.0 General
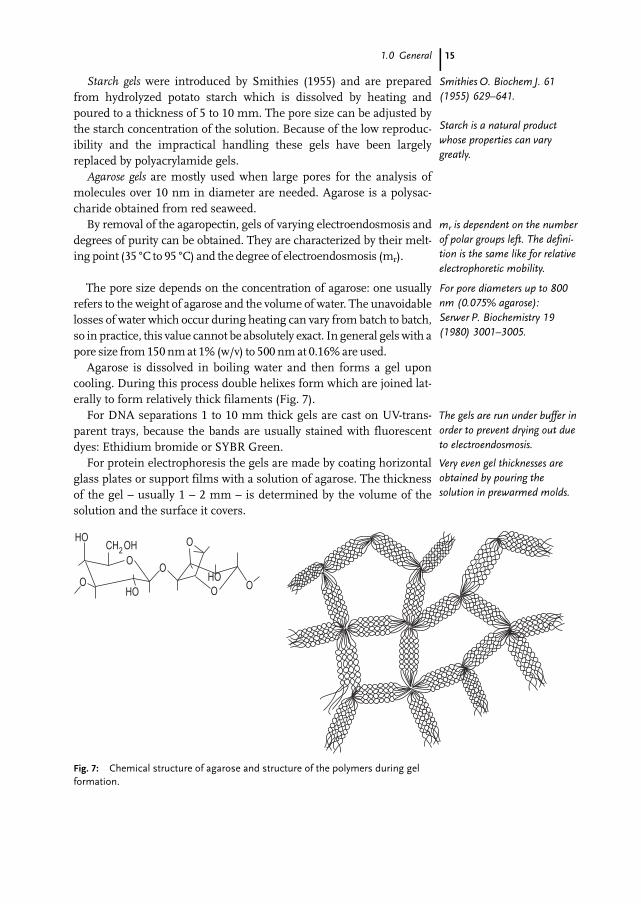
Starch gels were introduced by Smithies (1955) and are preparedfrom hydrolyzed potato starch which is dissolved by heating andpoured to a thickness of 5 to 10 mm. The pore size can be adjusted bythe starch concentration of the solution. Because of the low reproduc-ibility and the impractical handling these gels have been largelyreplaced by polyacrylamide gels.Agarose gels are mostly used when large pores for the analysis of
molecules over 10 nm in diameter are needed. Agarose is a polysac-charide obtained from red seaweed.By removal of the agaropectin, gels of varying electroendosmosis and
degrees of purity can be obtained. They are characterized by their melt-ing point (35 IC to 95 IC) and the degree of electroendosmosis (mr).
The pore size depends on the concentration of agarose: one usuallyrefers to the weight of agarose and the volume of water. The unavoidablelosses of water which occur during heating can vary from batch to batch,so in practice, this value cannot be absolutely exact. In general gels with apore size from150nmat 1% (w/v) to 500 nmat 0.16% are used.Agarose is dissolved in boiling water and then forms a gel upon
cooling. During this process double helixes form which are joined lat-erally to form relatively thick filaments (Fig. 7).For DNA separations 1 to 10 mm thick gels are cast on UV-trans-
parent trays, because the bands are usually stained with fluorescentdyes: Ethidium bromide or SYBR Green.For protein electrophoresis the gels are made by coating horizontal
glass plates or support films with a solution of agarose. The thicknessof the gel – usually 1 – 2 mm – is determined by the volume of thesolution and the surface it covers.
15
HO
HO
CH OH2
HO
OO
O
OO
O
Fig. 7: Chemical structure of agarose and structure of the polymers during gelformation.
Smithies O. Biochem J. 61(1955) 629–641.
Starch is a natural productwhose properties can varygreatly.
mr is dependent on the numberof polar groups left. The defini-tion is the same like for relativeelectrophoretic mobility.
For pore diameters up to 800nm (0.075% agarose):Serwer P. Biochemistry 19(1980) 3001–3005.
The gels are run under buffer inorder to prevent drying out dueto electroendosmosis.
Very even gel thicknesses areobtained by pouring thesolution in prewarmed molds.
1 Electrophoresis
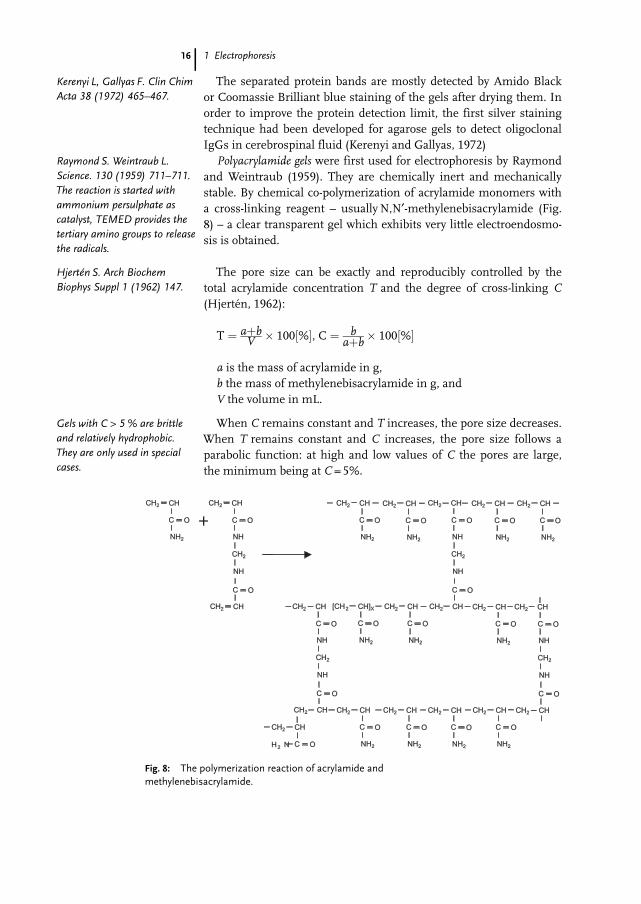
The separated protein bands are mostly detected by Amido Blackor Coomassie Brilliant blue staining of the gels after drying them. Inorder to improve the protein detection limit, the first silver stainingtechnique had been developed for agarose gels to detect oligoclonalIgGs in cerebrospinal fluid (Kerenyi and Gallyas, 1972)Polyacrylamide gels were first used for electrophoresis by Raymond
and Weintraub (1959). They are chemically inert and mechanicallystable. By chemical co-polymerization of acrylamide monomers witha cross-linking reagent – usually N,N¢-methylenebisacrylamide (Fig.8) – a clear transparent gel which exhibits very little electroendosmo-sis is obtained.
The pore size can be exactly and reproducibly controlled by thetotal acrylamide concentration T and the degree of cross-linking C(Hjert@n, 1962):
T ¼ aþbV � 100 %½ �, C ¼ baþb� 100 %½ �
a is the mass of acrylamide in g,b the mass of methylenebisacrylamide in g, andV the volume in mL.
When C remains constant and T increases, the pore size decreases.When T remains constant and C increases, the pore size follows aparabolic function: at high and low values of C the pores are large,the minimum being at C = 5%.
16
CH2
NH2
CH
C O
CH2 CH
CH2
NH2
CH
C O
CH2
NH2
CH
C O
CH2
NH2
CH
C O
CH2
NH2
CH
C O
CH2
NH2
CH
C O
C O
CH2
NH2
CH
C O
CH2
NH2
CH
C O
CH2
NH2
CH
C O
CH2
NH2
CH
C O
CH2
NH2
CH
C O
[CH2 X
NH2
CH]
C O
CH2
CH2
CH2
NH
NH
CH
CH
C O
C O
CH2
CH2
CH2
NH
NH
CH
CH
C O
C O
H N2
CH2
CH2
CH2
NH
NH
CH
CH
C O
C O
CH2
CH2
CH2
NH
NH
CH
CH
C O
C O
Fig. 8: The polymerization reaction of acrylamide andmethylenebisacrylamide.
Kerenyi L, Gallyas F. Clin ChimActa 38 (1972) 465–467.
Raymond S. Weintraub L.Science. 130 (1959) 711–711.The reaction is started withammonium persulphate ascatalyst, TEMED provides thetertiary amino groups to releasethe radicals.
Hjert=n S. Arch BiochemBiophys Suppl 1 (1962) 147.
Gels with C > 5 % are brittleand relatively hydrophobic.They are only used in specialcases.
1.1 Electrophoresis in non-restrictive gels
Besides methylenebisacrylamide a number of other cross-linkingreagents exist, they have been listed and compared by Righetti(1983). N,N¢-Bisacryloylcystamine is mentioned here, it possesses adisulfide bond which can be cleaved by thiol reagents. Because ofthis, it is possible to solubilize the gel matrix after electrophoresis.Polymerization should take place under an inert atmosphere since
oxygen can act as a free radical trap. The polymerization is tempera-ture dependent: to prevent incomplete polymerization the tempera-ture should be maintained above 20 IC.To minimize oxygen absorption gels are usually polymerized in
vertical casting chambers: cylindrical gels in glass tubes and flat gelsin moulds formed by two glass plates sealed together around theedges.For electrophoresis in vertical systems the gel in glass rods or cas-
settes are placed into the buffer tanks, and are in direct contact withthe electrode buffers. Gels for flatbed systems are polymerized on asupport and removed from the mould before use.For sample application wells are formed at the upper edge of the
gel during polymerization (see Fig. 6). These are made by insertion ofa sample comb between the glass plates. In horizontal gels, samplewells are not always necessary; the samples can be applied directly onthe surface with strips of filter paper or silicone rubber.The various gel electrophoresis methods can be divided into those
in restrictive and non-restrictive media. Restrictive gels work againstdiffusion so the zones are more distinctly separated and betterresolved than in non-restrictive gels. The limit of detection is thusincreased.
1.1Electrophoresis in non-restrictive gels
For these techniques the frictional resistance of the gel is kept negli-gibly low so that the electrophoretic mobility depends only on the netcharge of the sample molecule. Horizontal agarose gels are used forhigh molecular weight samples such as proteins or enzymes andpolyacrylamide gels for low molecular weight peptides or polyphe-nols.
1.1.1Agarose gel electrophoresis
Zone electrophoresis
Agarose gels with concentrations of 0.7 to 1% are often used in clin-ical laboratories for the analysis of serum proteins. The separation
17
Righetti PG. Isoelectricfocusing: theory, methodologyand applications. ElsevierBiomedical Press, Amsterdam(1983).
The monomers are toxic andshould be handled with precau-tion.
With horizontal casting oxygenintake is increased. That mustbe compensated by a higheramount of catalyst, oftenleading to problems duringseparation.
In homogeneous buffersystems, narrow sample slotson the surface of horizontal gelsare also important to obtaingood results.
In restrictive gels, the moleculesize has a major influence onthe result of the separation.
1 Electrophoresis
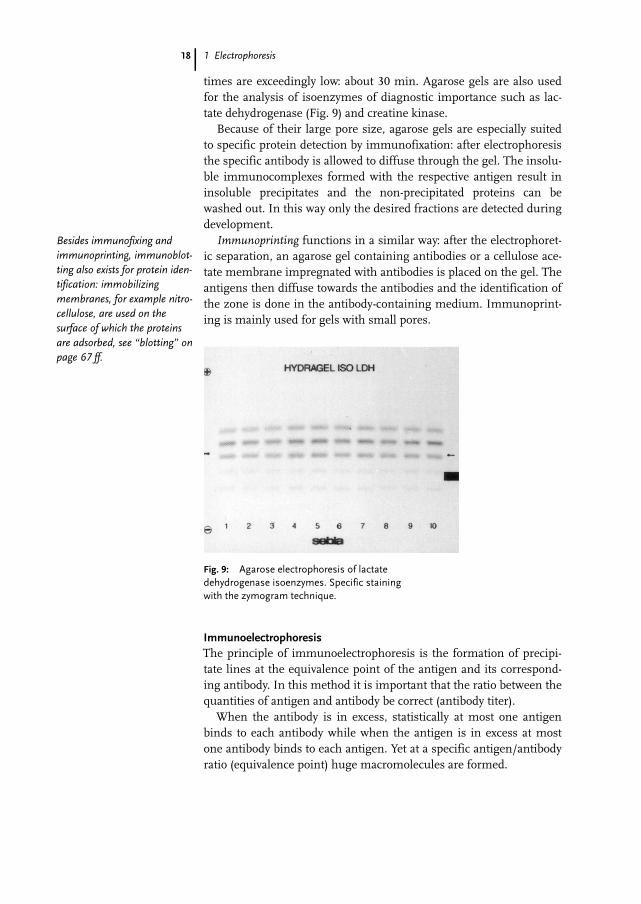
times are exceedingly low: about 30 min. Agarose gels are also usedfor the analysis of isoenzymes of diagnostic importance such as lac-tate dehydrogenase (Fig. 9) and creatine kinase.Because of their large pore size, agarose gels are especially suited
to specific protein detection by immunofixation: after electrophoresisthe specific antibody is allowed to diffuse through the gel. The insolu-ble immunocomplexes formed with the respective antigen result ininsoluble precipitates and the non-precipitated proteins can bewashed out. In this way only the desired fractions are detected duringdevelopment.Immunoprinting functions in a similar way: after the electrophoret-
ic separation, an agarose gel containing antibodies or a cellulose ace-tate membrane impregnated with antibodies is placed on the gel. Theantigens then diffuse towards the antibodies and the identification ofthe zone is done in the antibody-containing medium. Immunoprint-ing is mainly used for gels with small pores.
ImmunoelectrophoresisThe principle of immunoelectrophoresis is the formation of precipi-tate lines at the equivalence point of the antigen and its correspond-ing antibody. In this method it is important that the ratio between thequantities of antigen and antibody be correct (antibody titer).When the antibody is in excess, statistically at most one antigen
binds to each antibody while when the antigen is in excess at mostone antibody binds to each antigen. Yet at a specific antigen/antibodyratio (equivalence point) huge macromolecules are formed.
18
Fig. 9: Agarose electrophoresis of lactatedehydrogenase isoenzymes. Specific stainingwith the zymogram technique.
Besides immunofixing andimmunoprinting, immunoblot-ting also exists for protein iden-tification: immobilizingmembranes, for example nitro-cellulose, are used on thesurface of which the proteinsare adsorbed, see “blotting” onpage 67 ff.
1.1 Electrophoresis in non-restrictive gels
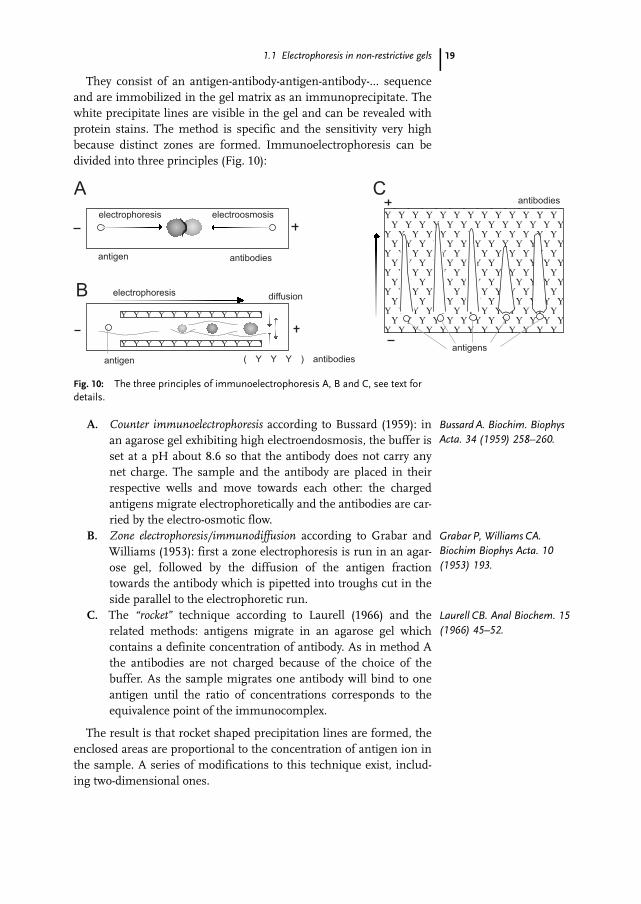
They consist of an antigen-antibody-antigen-antibody-... sequenceand are immobilized in the gel matrix as an immunoprecipitate. Thewhite precipitate lines are visible in the gel and can be revealed withprotein stains. The method is specific and the sensitivity very highbecause distinct zones are formed. Immunoelectrophoresis can bedivided into three principles (Fig. 10):
A. Counter immunoelectrophoresis according to Bussard (1959): inan agarose gel exhibiting high electroendosmosis, the buffer isset at a pH about 8.6 so that the antibody does not carry anynet charge. The sample and the antibody are placed in theirrespective wells and move towards each other: the chargedantigens migrate electrophoretically and the antibodies are car-ried by the electro-osmotic flow.
B. Zone electrophoresis/immunodiffusion according to Grabar andWilliams (1953): first a zone electrophoresis is run in an agar-ose gel, followed by the diffusion of the antigen fractiontowards the antibody which is pipetted into troughs cut in theside parallel to the electrophoretic run.
C. The “rocket” technique according to Laurell (1966) and therelated methods: antigens migrate in an agarose gel whichcontains a definite concentration of antibody. As in method Athe antibodies are not charged because of the choice of thebuffer. As the sample migrates one antibody will bind to oneantigen until the ratio of concentrations corresponds to theequivalence point of the immunocomplex.
The result is that rocket shaped precipitation lines are formed, theenclosed areas are proportional to the concentration of antigen ion inthe sample. A series of modifications to this technique exist, includ-ing two-dimensional ones.
19
electrophoresis
electrophoresis
electroosmosis
diffusion
antigen
antigen
antibodies
antibodies
( Y Y Y ) antibodies
Y Y Y Y Y Y Y Y Y Y Y Y
Y Y Y Y Y Y Y Y Y Y Y Y
A
B
C
Y Y Y Y Y Y Y Y Y Y Y Y Y
YY
YY
YY
YY
YY
YY
YY
YY
YY
YY
YY
YY
YY
YY
YY
YY
YY
YY
YY
YY
YY
YY
YY
YY
YY
YY
YY
YY
YY
YY
YY
YY
YY
YY
YY
YY
YY
YY
YY
YY
YY
YY
YY
YY
YY
YY
YY
YY
YY
YY
YY
YY
YY
YY
YY
YY
YY
YY
YY
YY
YY
YY
YY
YY
YY
YY
YY
YY
YY
YY
YY
YY
YY
YY
YY
YY
YY
YY
Y Y Y Y Y Y Y Y Y Y Y Y Y
antigens
Fig. 10: The three principles of immunoelectrophoresis A, B and C, see text fordetails.
Bussard A. Biochim. BiophysActa. 34 (1959) 258–260.
Grabar P, Williams CA.Biochim Biophys Acta. 10(1953) 193.
Laurell CB. Anal Biochem. 15(1966) 45–52.

1 Electrophoresis
Affinity electrophoresisThis is a method related to immunoelectrophoresis which is based onthe interactions between various macromolecules for example lectin-glycoprotein, enzyme-substrate and enzyme-inhibitor complexes(Bøg-Hansen and Hau, 1981)All the techniques known from immunoelectrophoresis can be
employed. For example, specific binding lectin collected worldwidefrom plant seeds are examined with line affinity electrophoresis. Inthis way carbohydrate changes in glycoproteins during different bio-logical processes can be identified. In Fig. 11 an application of affinityelectrophoresis to differentiate between alkaline phosphatase of liverand bone is shown.
1.1.2Polyacrylamide gel electrophoresis of low molecular weight substances
Since low molecular weight fractions cannot be chemically fixed inthe matrix, horizontal ultra-thin layer polyacrylamide gels on filmsupports are used. Those are dried at 100 IC immediately after elec-trophoresis and then sprayed with specific reagents. With this meth-od for example, dyes with molecular weights of approximately 500Da* can be separated.
20
Fig. 11: Affinity electrophoresis of isoenzymesof alkaline phosphatase from the liver and thebones. The wheat germ agglutinin specificallybinds the bone fraction which is recognizableas a characteristic band close to the applica-tion point. Alkaline phosphatase staining.
Bøg-Hansen TC, Hau J. JChrom Library. 18 B (1981)219–252.
See method 1*According to the guide-linesof the SI, the use of the termDalton for 1.6601 J 10–27 kgis no longer recommended.However it is still a currentunit in biochemistry.
1.2 Electrophoresis in restrictive gels
1.2Electrophoresis in restrictive gels
1.2.1The Ferguson plot
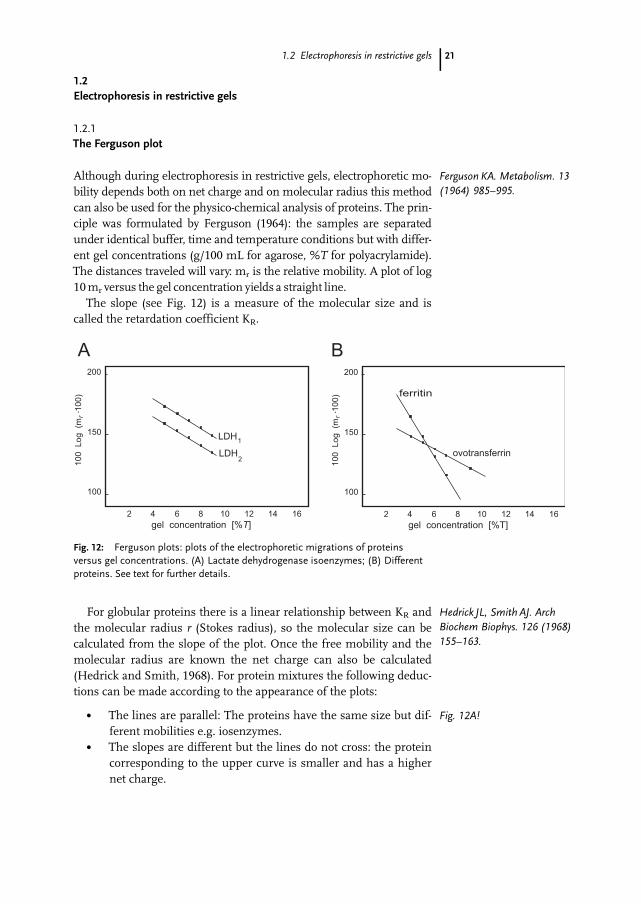
Although during electrophoresis in restrictive gels, electrophoretic mo-bility depends both on net charge and on molecular radius this methodcan also be used for the physico-chemical analysis of proteins. The prin-ciple was formulated by Ferguson (1964): the samples are separatedunder identical buffer, time and temperature conditions but with differ-ent gel concentrations (g/100 mL for agarose, %T for polyacrylamide).The distances traveled will vary: mr is the relative mobility. A plot of log10mr versus the gel concentration yields a straight line.The slope (see Fig. 12) is a measure of the molecular size and is
called the retardation coefficient KR.
For globular proteins there is a linear relationship between KR andthe molecular radius r (Stokes radius), so the molecular size can becalculated from the slope of the plot. Once the free mobility and themolecular radius are known the net charge can also be calculated(Hedrick and Smith, 1968). For protein mixtures the following deduc-tions can be made according to the appearance of the plots:
. The lines are parallel: The proteins have the same size but dif-ferent mobilities e.g. iosenzymes.
. The slopes are different but the lines do not cross: the proteincorresponding to the upper curve is smaller and has a highernet charge.
21
200
150
100
100Log(m
100)
r
2 4 6 8 10 12 14 16
gel concentration [% ]T
LDH
LDH
1
2
200
150
100
100Log(m
100)
r
2 4 6 8 10 12 14 16
gel concentration [%T]
ferritin
ovotransferrin
BA
Fig. 12: Ferguson plots: plots of the electrophoretic migrations of proteinsversus gel concentrations. (A) Lactate dehydrogenase isoenzymes; (B) Differentproteins. See text for further details.
Ferguson KA. Metabolism. 13(1964) 985–995.
Hedrick JL, Smith AJ. ArchBiochem Biophys. 126 (1968)155–163.
Fig. 12A!
1 Electrophoresis
. The lines cross beyond T=2%: the larger protein has the highercharge density and intercepts the y-axis at a higher value.
. Several lines cross at a point where T< 2%: these are obviouslythe various polymers of one protein.
1.2.2Agarose gel electrophoresis
ProteinsSince highly concentrated agarose gels above 1% (1g/100 mL agarosein water) are cloudy and the electro-osmotic flow is high, agarose gelsare only used for the separation of very high molecular weight pro-teins or protein aggregates. Since agarose gels do not contain cata-lysts which can influence the buffer system, they have also been usedto develop a series of multiphasic discontinuous buffer systems(Jovin et al. 1970).
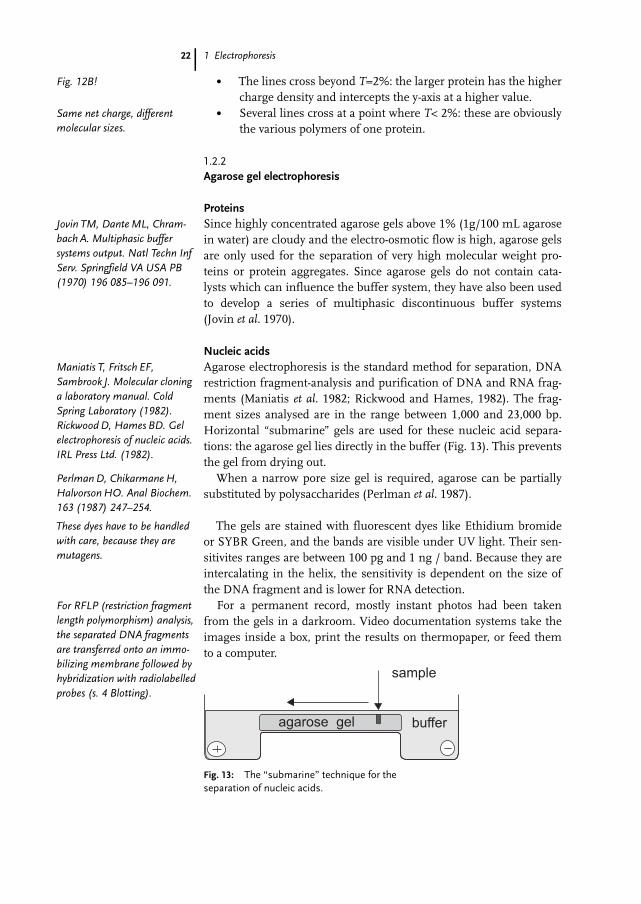
Nucleic acidsAgarose electrophoresis is the standard method for separation, DNArestriction fragment-analysis and purification of DNA and RNA frag-ments (Maniatis et al. 1982; Rickwood and Hames, 1982). The frag-ment sizes analysed are in the range between 1,000 and 23,000 bp.Horizontal “submarine” gels are used for these nucleic acid separa-tions: the agarose gel lies directly in the buffer (Fig. 13). This preventsthe gel from drying out.When a narrow pore size gel is required, agarose can be partially
substituted by polysaccharides (Perlman et al. 1987).
The gels are stained with fluorescent dyes like Ethidium bromideor SYBR Green, and the bands are visible under UV light. Their sen-sitivites ranges are between 100 pg and 1 ng / band. Because they areintercalating in the helix, the sensitivity is dependent on the size ofthe DNA fragment and is lower for RNA detection.For a permanent record, mostly instant photos had been taken
from the gels in a darkroom. Video documentation systems take theimages inside a box, print the results on thermopaper, or feed themto a computer.
22
agarose gel
sample
buffer
Fig. 13: The “submarine” technique for theseparation of nucleic acids.
Fig. 12B!
Same net charge, differentmolecular sizes.
Jovin TM, DanteML, Chram-bach A. Multiphasic buffersystems output. Natl Techn InfServ. Springfield VA USA PB(1970) 196 085–196 091.
Maniatis T, Fritsch EF,Sambrook J. Molecular cloninga laboratory manual. ColdSpring Laboratory (1982).RickwoodD, Hames BD. Gelelectrophoresis of nucleic acids.IRL Press Ltd. (1982).
PerlmanD, ChikarmaneH,HalvorsonHO. Anal Biochem.163 (1987) 247–254.
These dyes have to be handledwith care, because they aremutagens.
For RFLP (restriction fragmentlength polymorphism) analysis,the separated DNA fragmentsare transferred onto an immo-bilizing membrane followed byhybridization with radiolabelledprobes (s. 4 Blotting).
1.2 Electrophoresis in restrictive gels
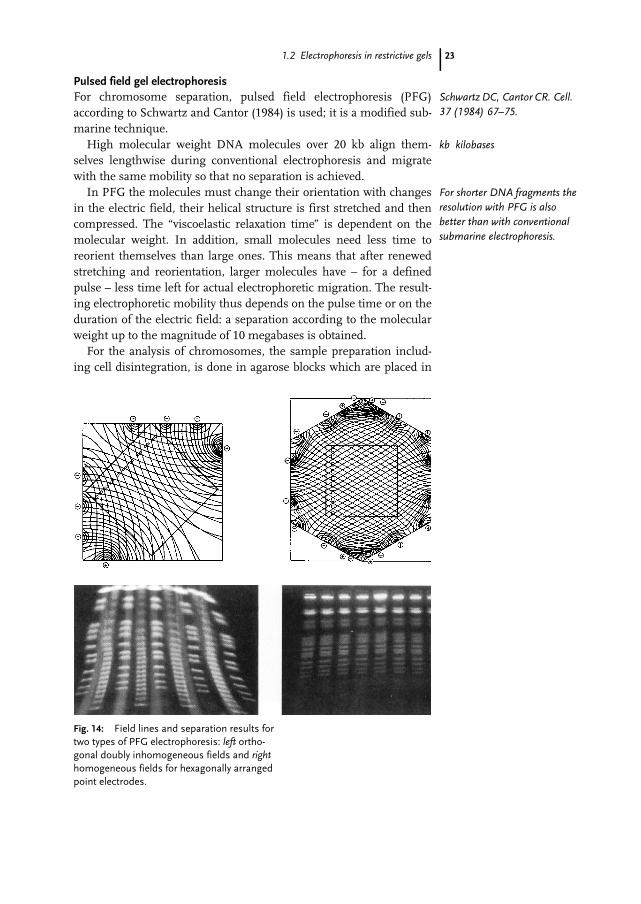
Pulsed field gel electrophoresisFor chromosome separation, pulsed field electrophoresis (PFG)according to Schwartz and Cantor (1984) is used; it is a modified sub-marine technique.High molecular weight DNA molecules over 20 kb align them-
selves lengthwise during conventional electrophoresis and migratewith the same mobility so that no separation is achieved.In PFG the molecules must change their orientation with changes
in the electric field, their helical structure is first stretched and thencompressed. The “viscoelastic relaxation time” is dependent on themolecular weight. In addition, small molecules need less time toreorient themselves than large ones. This means that after renewedstretching and reorientation, larger molecules have – for a definedpulse – less time left for actual electrophoretic migration. The result-ing electrophoretic mobility thus depends on the pulse time or on theduration of the electric field: a separation according to the molecularweight up to the magnitude of 10 megabases is obtained.For the analysis of chromosomes, the sample preparation includ-
ing cell disintegration, is done in agarose blocks which are placed in
23
Fig. 14: Field lines and separation results fortwo types of PFG electrophoresis: left ortho-gonal doubly inhomogeneous fields and righthomogeneous fields for hexagonally arrangedpoint electrodes.
Schwartz DC, Cantor CR. Cell.37 (1984) 67–75.
kb kilobases
For shorter DNA fragments theresolution with PFG is alsobetter than with conventionalsubmarine electrophoresis.
1 Electrophoresis
the pre-formed sample pockets. These molecules would be broken bythe shear forces. 1.0 to 1.5% agarose gels are used for the separation.The electric fields should have an angle of at least 110I relative to
the sample. This is obtained for example by an inhomogeneous fieldwith point electrodes mounted on orthogonal rails or in hexagonalconfiguration. The pulse time is of 1 s to 90 min for these techniques,depending on the length of the DNA molecules to be separated.Large molecules are better separated when the pulse time is long,small molecules needs short pulse times. The separations can lastseveral days.Fig. 14 shows the field lines for an orthogonal configuration with
an inhomogeneous field and for an hexagonal configuration with ahomogeneous field as well as the corresponding separations.Pulsed field gel electrophoresis is mainly employed for research,
but it has also found its place in routine analysis for bacterial taxon-omy.
1.2.3Polyacrylamide gel electrophoresis of nucleic acids
DNA sequencing
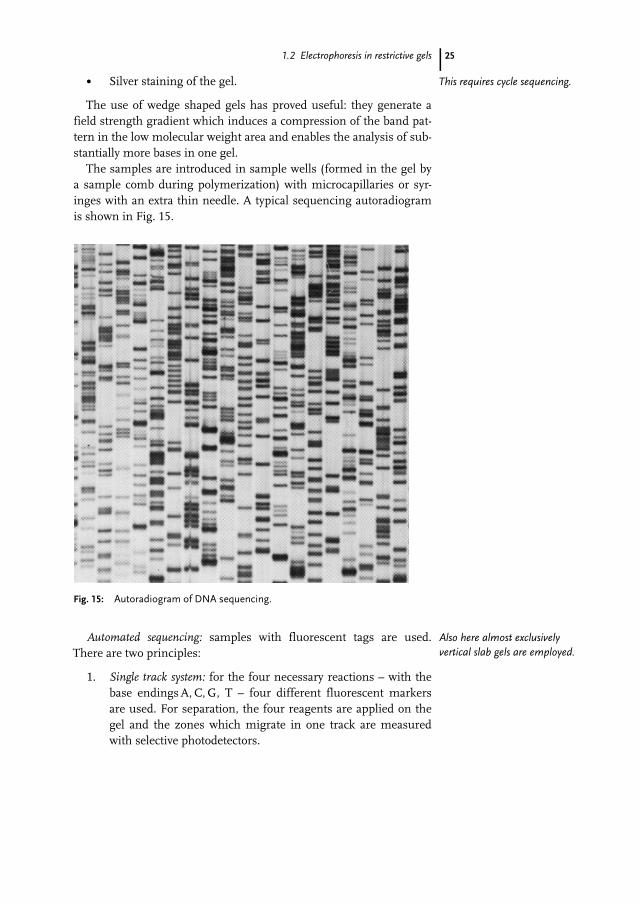
In the DNA sequencing methods according to Sanger and Coulson(1975) or Maxam and Gilbert (1977), the last step is electrophoresis ina polyacrylamide gel under denaturing conditions. The four reactions– containing variously long fragments of the DNA strand to be ana-lyzed, each terminating with a specific base – are separated onebeside the other. Determination of the order of the bands in thesefour lanes from the bottom to the top of the gel yields the basesequence, that is, the genetic information.Tris-borate EDTA (TBE) buffer is used. To completely denature the
molecule, the process is usually carried out at a temperature over50 IC and in the presence of urea. Irregular heat distribution resultsin the “smiling” effect, when the bands are turned up at the ends. Forthis reason, it has proved effective to prewarm the gels with thermo-plates independent from the electric field.Manual sequencing: in the manual technique the bands are mostly
revealed by autoradiography. Nucleotides or primers labelled with 32Por 35S are used. The gels are usually thinner than 0.4 mm since theymust be dried for autoradiography.Alternative nonradioactive detection methods have been devel-
oped:
. Chromogenic or chemiluminescent detection on a membraneafter the separated DNA fragments have been transferredfrom the gel.
24
There are in addition other fieldgeometries:Field Inversion (FI) electro-phoresis: the electric field ispulsed back and forth in onedirection.Transverse Alternating Fieldelectrophoresis (TAFE): The gelis mounted vertically in anaquarium-like tank and thefield is pulsed back and forthbetween electrode pairsmounted on the top and thebottom of both sides of the gel.
Sanger F, Coulson AR. J MolBiol. 94 (1975) 441–448.MaxamAM, GilbertW. ProcNatl AcadSci USA. 74 (1977)560–564.
Smiling effect: When thetemperature in the middle ofthe gel is higher than at theedges the DNA fragmentsmigrate faster.
In practice, vertical gel slabsare used, which are – in mostcases – heated by the electricfield. An aluminum platebehind one of the glass platesdistributes the heat evenly.
This requires biotinylated orfluorescent primers, nucleotidesor probes.
1.2 Electrophoresis in restrictive gels
. Silver staining of the gel.
The use of wedge shaped gels has proved useful: they generate afield strength gradient which induces a compression of the band pat-tern in the low molecular weight area and enables the analysis of sub-stantially more bases in one gel.The samples are introduced in sample wells (formed in the gel by
a sample comb during polymerization) with microcapillaries or syr-inges with an extra thin needle. A typical sequencing autoradiogramis shown in Fig. 15.
Automated sequencing: samples with fluorescent tags are used.There are two principles:
1. Single track system: for the four necessary reactions – with thebase endingsA, C,G, T – four different fluorescent markersare used. For separation, the four reagents are applied on thegel and the zones which migrate in one track are measuredwith selective photodetectors.
25
Fig. 15: Autoradiogram of DNA sequencing.
This requires cycle sequencing.
Also here almost exclusivelyvertical slab gels are employed.
1 Electrophoresis
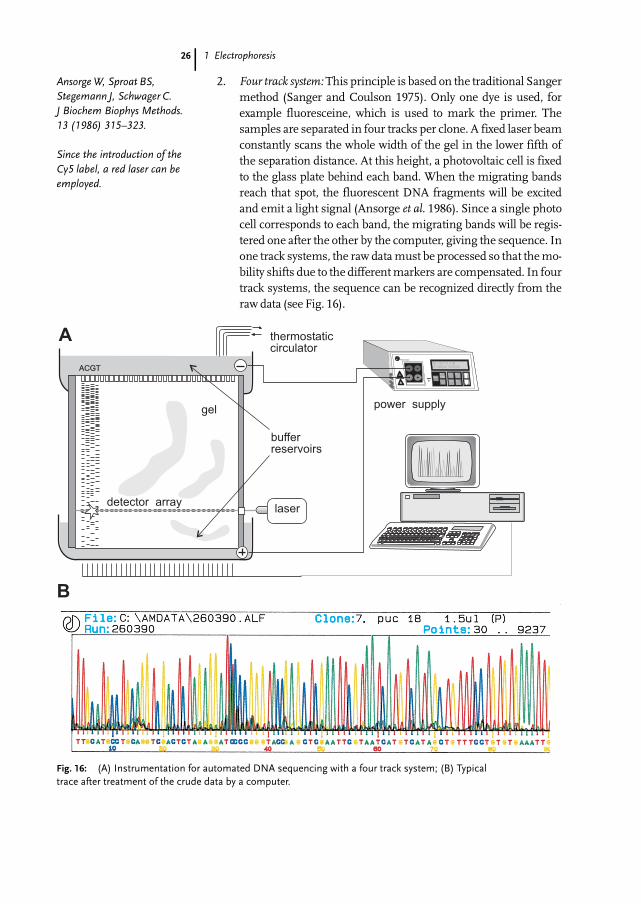
2. Four track system:This principle is based on the traditional Sangermethod (Sanger and Coulson 1975). Only one dye is used, forexample fluoresceine, which is used to mark the primer. Thesamples are separated in four tracks per clone. A fixed laser beamconstantly scans the whole width of the gel in the lower fifth ofthe separation distance. At this height, a photovoltaic cell is fixedto the glass plate behind each band. When the migrating bandsreach that spot, the fluorescent DNA fragments will be excitedand emit a light signal (Ansorge et al. 1986). Since a single photocell corresponds to each band, the migrating bands will be regis-tered one after the other by the computer, giving the sequence. Inone track systems, the raw datamust be processed so that themo-bility shifts due to the differentmarkers are compensated. In fourtrack systems, the sequence can be recognized directly from theraw data (see Fig. 16).
26
STARTDANGER
HIGH VOLTAGEDANGER
HIGH VOLTAGE
!
Phase V mA W h:m Vh MAH1 of 3 1500 050.0 030 01:04 000110 000
help
F
STOP
1
ESC
2
0
laser
ACGT
gel
detector array
power supply
thermostaticcirculator
bufferreservoirs
A
B
Fig. 16: (A) Instrumentation for automated DNA sequencing with a four track system; (B) Typicaltrace after treatment of the crude data by a computer.
AnsorgeW, Sproat BS,Stegemann J, Schwager C.J Biochem Biophys Methods.13 (1986) 315–323.
Since the introduction of theCy5 label, a red laser can beemployed.

1.2 Electrophoresis in restrictive gels
Automated sequencing has many advantages over the manualtechnique:
. Since fluorescent markers are used, the use of radioactivity inthe laboratory can be avoided.
. Neither extensive treatment of the gel after separation nortime-consuming autoradiography are necessary.
. The laborious reading of the bands becomes unnecessary.
. The sequences are directly fed into the computer.
. The reactions labelled with the fluorescent label can easily bekept for a long time, so that the separation can be repeatedlater in case of doubt.
. The high sensitivity of fluorescent labelling also allows thesequencing of cosmids and lambda DNA as well as the prod-ucts of the polymerase chain reaction PCRQ*). In additionrestriction analyses can be carried out.
This “on-line electrophoresis” setup can also be employed for var-ious DNA typing methods.For high throughput genome sequencing, multi-capillary instru-
ments have replaced the slabgel technique. The capillaries are usuallyfilled with linear – non-crosslinked – polyacrylamide. The entire pro-cedure, including sample application is automated.
DNA typingMany new techniques and applications have recently been developed inthis field. Because those are almost exclusively based on PCRQ technolo-gy, the size range of the DNA fragments to be analysed lies between 50and 1,500 bp. In this range the sensitivity and resolution of agarose elec-trophoresis with Ethidium bromide staining is coming to its limits,because the gel pores are too large for proper sieving and the intercalat-ing fluorescent dyes aremuch less sensitive than for larger fragments.
PAGE and silver staining:
The use polyacrylamide gels leads to much sharper bands and higherresolution; with subsequent silver staining a sensitivity of 15 pg perband can be achieved (Bassam et al. 1991). Vertical and horizontalslab gels can be used. Whereas in agarose electrophoresis the mobili-ties of DNA fragments are solely proportional to their sizes, the bandpositions in polyacrylamide gels are partly influenced by the basesequence as well. A and T rich fragments migrate slower than others.Silver stained DNA bands can be directly reamplified after scratch-
ing them out of the gel without intermediate purification. About 20 %of the DNA molecules of a band remain undestroyed by the silverstaining procedure. They are locked inside the stained band, thusDNA fragments do not contaminate the gel surface during staining.
27
No need for isotope laboratory.
*) The PCR process is coveredbyU.S. patents 4,683,195 and4,683,302 owned by Hoffman-La Roche Inc. Use of the PCRprocess requires a license.
Those are the biggest and mostexpensive electrophoresis instru-ments existing.
Amplification of fragmentslarger than 1,500 bp is possible,however, with a lot of problemswith reproduciblity.
BassamBJ, Caetano-Annol-l=s G, Gresshoff PM. AnalBiochem. 196 (1991) 80–83.Silver staining of DNA is mucheasier than of proteins, becausefixation is very easy.
Reamplification of DNAworks only, when silver stainingtechniques specially designedfor DNA detection areemployed.
1 Electrophoresis
Horizontal (flatbed) electrophoresis
Flatbed polyacrylamide systems have a number of advantages overthe vertical ones when ultrathin gels polymerized on support filmsare used (GRrg et al. 1980): simple handling, easy use of ready-madegels and buffer strips instead of large buffer volumes; good coolingefficiency and temperature control; possibility of washing, drying andrehydrating the gels; possibility of automation.
Amplified ribosomal DNA restriction analysis (ARDRA)
Fragments of ribosomal DNA with polymorphic restriction sites of anorganism are amplified with a primer pair and subsequently digestedwith a restriction enzyme. After gel electrophoresis and silver stain-ing, species specific pattern are obtained.
Random amplified polymorphic DNA (RAPD)
This method is applied for rapid detections of DNA polymorphismsof a wide variety of organisms: bacteria, fungi, plants, and animals.One single short oligonucleotide primer (10mer) of arbitrarysequence is used to amplify fragments of the genomic DNA (Welshand McClelland, 1990; Williams et al. 1990). The low stringencyannealing conditions lead to an amplification of a set of multipleDNA fragments of different sizes. Berg et al. (1984) have found a se-ries of primers, which allow a very good differentiation of microor-ganisms. When optimized and uniform PCR conditions areemployed, specific and reproducible band patterns are achieved.
A modification using 5mer primers is called DNA amplificationfingerprinting (DAF) and has been introduced by Caetano-Annoll@set al. (1991).RAPD samples can be run on agarose gels with Ethidium bromide
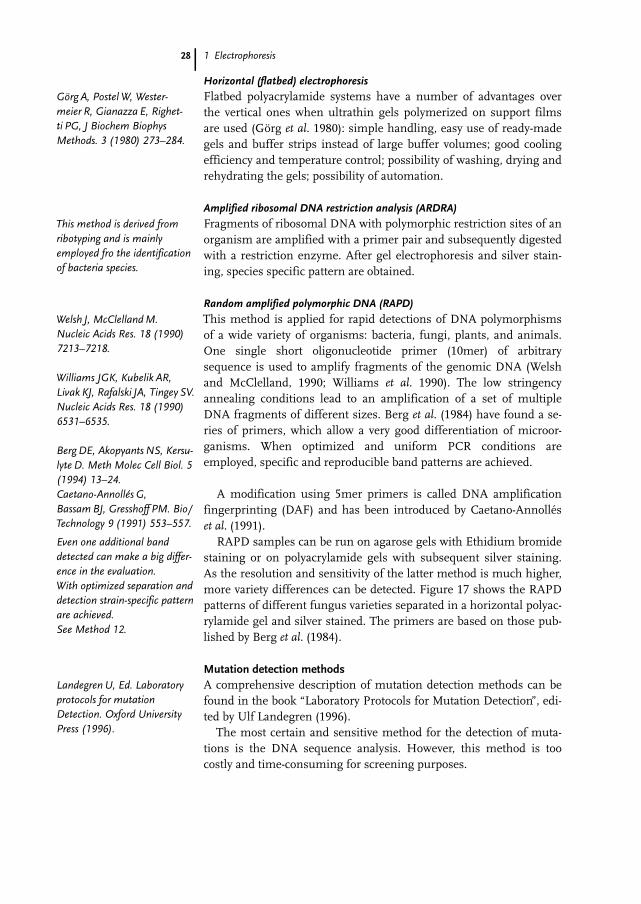
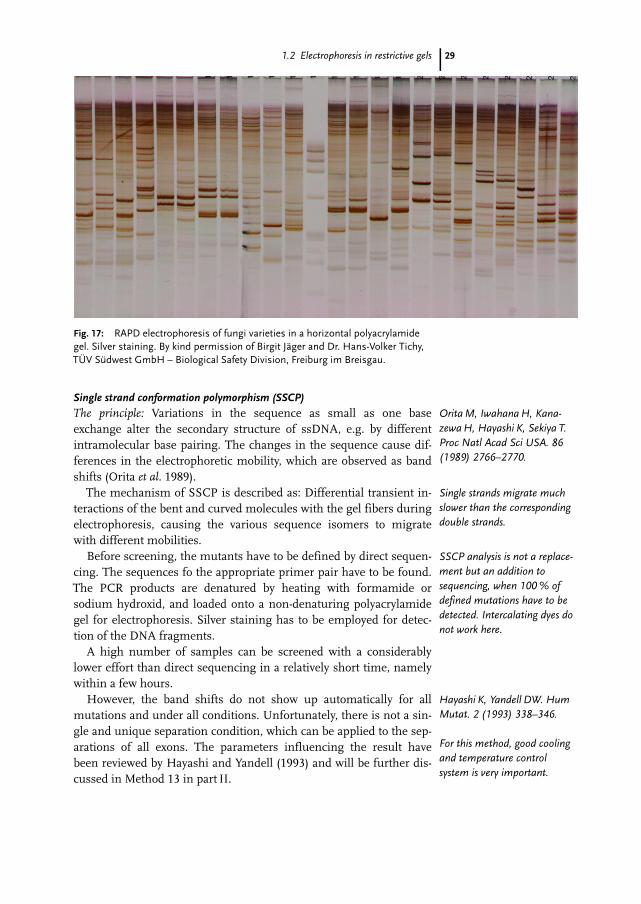
staining or on polyacrylamide gels with subsequent silver staining.As the resolution and sensitivity of the latter method is much higher,more variety differences can be detected. Figure 17 shows the RAPDpatterns of different fungus varieties separated in a horizontal polyac-rylamide gel and silver stained. The primers are based on those pub-lished by Berg et al. (1984).
Mutation detection methodsA comprehensive description of mutation detection methods can befound in the book “Laboratory Protocols for Mutation Detection”, edi-ted by Ulf Landegren (1996).The most certain and sensitive method for the detection of muta-
tions is the DNA sequence analysis. However, this method is toocostly and time-consuming for screening purposes.
28
GLrg A, PostelW, Wester-meier R, Gianazza E, Righet-ti PG, J Biochem BiophysMethods. 3 (1980) 273–284.
This method is derived fromribotyping and is mainlyemployed fro the identificationof bacteria species.
Welsh J, McClellandM.Nucleic Acids Res. 18 (1990)7213–7218.
Williams JGK, Kubelik AR,Livak KJ, Rafalski JA, Tingey SV.Nucleic Acids Res. 18 (1990)6531–6535.
Berg DE, Akopyants NS, Kersu-lyte D. Meth Molec Cell Biol. 5(1994) 13–24.Caetano-Annoll=s G,BassamBJ, Gresshoff PM. Bio/Technology 9 (1991) 553–557.
Even one additional banddetected can make a big differ-ence in the evaluation.With optimized separation anddetection strain-specific patternare achieved.See Method 12.
Landegren U, Ed. Laboratoryprotocols for mutationDetection. Oxford UniversityPress (1996).
1.2 Electrophoresis in restrictive gels
Single strand conformation polymorphism (SSCP)
The principle: Variations in the sequence as small as one baseexchange alter the secondary structure of ssDNA, e.g. by differentintramolecular base pairing. The changes in the sequence cause dif-ferences in the electrophoretic mobility, which are observed as bandshifts (Orita et al. 1989).The mechanism of SSCP is described as: Differential transient in-
teractions of the bent and curved molecules with the gel fibers duringelectrophoresis, causing the various sequence isomers to migratewith different mobilities.Before screening, the mutants have to be defined by direct sequen-
cing. The sequences fo the appropriate primer pair have to be found.The PCR products are denatured by heating with formamide orsodium hydroxid, and loaded onto a non-denaturing polyacrylamidegel for electrophoresis. Silver staining has to be employed for detec-tion of the DNA fragments.A high number of samples can be screened with a considerably
lower effort than direct sequencing in a relatively short time, namelywithin a few hours.However, the band shifts do not show up automatically for all
mutations and under all conditions. Unfortunately, there is not a sin-gle and unique separation condition, which can be applied to the sep-arations of all exons. The parameters influencing the result havebeen reviewed by Hayashi and Yandell (1993) and will be further dis-cussed in Method 13 in part II.
29
Fig. 17: RAPD electrophoresis of fungi varieties in a horizontal polyacrylamidegel. Silver staining. By kind permission of Birgit J:ger and Dr. Hans-Volker Tichy,T=V S>dwest GmbH – Biological Safety Division, Freiburg im Breisgau.
OritaM, IwahanaH, Kana-zewaH, Hayashi K, Sekiya T.Proc Natl Acad Sci USA. 86(1989) 2766–2770.
Single strands migrate muchslower than the correspondingdouble strands.
SSCP analysis is not a replace-ment but an addition tosequencing, when 100 % ofdefined mutations have to bedetected. Intercalating dyes donot work here.
Hayashi K, Yandell DW. HumMutat. 2 (1993) 338–346.
For this method, good coolingand temperature controlsystem is very important.
1 Electrophoresis
SSCP of the mitochondrial cytochrome b gene is also employed fordifferentiation of animal species. Rehbein et al. (1995) have used themethod for the identification of the species in canned tuna.
Heteroduplex and DSCP
Single base substitutions can also be detected by heating the mixturesamplified wild type and mutant DNA and run the resulting heterodu-plexes on a native polyacrylamide gel electrophoresis (Keen et al.1991; White et al. 1992). The mobilities of heteroduplexes lie betweenthe mobilities of the corresponding homoduplexes and singlestrands. Different mutations cause different mobility shifts of hetero-duplexes. The bands can be detected with Ethidiumbromide or withsilver staining.Sometimes the technique is also called DSCP (double strand con-
formation polymorphism) (Barros et al. 1992). But it should not beforgotten, that also homoduplexes can show band shifts in native gelsdue to the influence of the contents of A andT.For DNA diagnosis, DNA point mutations can quickly be revealed
with the Primer Mismatch process in combination with electrophore-sis of the amplification products in horizontal polyacrylamide gels(Dockhorn-Dworniczak et al., 1990).
Denaturing gradient gel electrophoresis (DGGE) and constant denaturing gel
electrophoresis (CDGE)
With DGGE single base exchanges in segments of DNA can bedetected with almost 100 % efficiency. The principle of DGGE isbased on the different electrophoretic mobilities of partially dena-tured molecules caused by differences in DNA melting (Fischer andLerman, 1983).With a denaturant gradient perpendicular to the electrophoresis
direction, the region of a point mutation can be identified. Denatur-ant gradients parallel to the electrophoresis runs are better for screen-ing applications.
Constant denaturing gel electrophoresis (CDGE) is employed forscreening, when the denaturant concentration of differential meltingof a DNA segment has been detected with DGGE. Figure 18 is a sche-matic representation of perpendicular and parallel DGGE. As DGGEis not very easy to perform, it is only employed, when the techniquesother than sequence analysis fail in detecting a mutation.
30
RehbeinH, Mackie IM,Pryde S, Gonzales-Sotelo C,Perez-Martin R, Quintero J,Rey-MendezM. Inf. Fisch-wirtsch. 42 (1995) 209–212.
Keen JD, Lester D,Inglehearn C, Curtis A,Bhattacharya. Trends Genet.7 (1991) 5.
WhiteMB, CarvalhoM,Derse D, O’Brien SJ, DeanM.Genomics 12 (1992) 301–306.
Barros F, Carracedo A,VictoriaML, Rodriguez-CalvoMS. Electrophoresis 12(1991) 1041–1045.
Dockhorn-Dworniczak B,Aulekla-Acholz C,Dworniczak B. Pharmacia LKBOffprint A37 (1990).
Fischer SG, Lerman LS. ProcNatl Acad Sci. 60 (1983)1579-1583.
Typically the 100 % denaturantsolution contains 6 to 7 mol/Lurea and 20 to 40 % form-amide. The gels are run attemperatures between 40 PCand 60 PC.
The practical aspects and thegradient casting technique aredescribed in method 14.

1.2 Electrophoresis in restrictive gels
Temperature gradient gel electrophoresis (TGGE)
Temperature gradient gel electrophoresis resolves homo- and hetero-duplexes according to their thermal stabilities (Riesner et al. 1989). Inthis technique, denaturing gels are run on a plate with a cold (15 IC)side at the cathode and a hot side (60 IC) at the anode. The method iswell suitable for screening purposes. Suttorp et al. (1996) havedescribed how to change a standard horizontal electrophoretic cham-ber into a TGGE device.
Single Nucleotide Polymorphism (SNP) analysis
According to estimations, one single nucleotide (SNP) occursapproximately in every 100–300 bases of the human genome. Singlenucleotide polymorphisms are present in both the coding and non-coding regions. The SNPs found in the coding regions of the genomeare interesting for clinical research, because they may be indicatorsfor the different responses of different patients to drug treatment andother factors. High-throughput systems are preferably employed, likethe multi-capillary electrophoresis instruments used for DNAsequencing.
Denaturing PAGE of microsatellitesDenaturing gels provide a very high resolving power, thus they arevery useful for separating of microsatellites with very short repeatsdown to 2 bp. Because the Taq-polymerase used in PCR adds an addi-
31
Perpendicular Gradient Parallel Gradient
gradient 100 %denaturant
100 %denaturant
100 % denaturant100 % denaturant
0 %0 %0 %0 %
ele
ctr
ophore
sis
ssDNA
dsDNA
wild typewild type
mutant
partially moltendsDNA
partially moltendsDNA
Fig. 18: Schematic representation of typical results of a perpendicular and aparallel DGGE.
Riesner D, Steger G, Wiese U,WulfertM, HeibeyM, Henco K.Electrophoresis 10 (1989)377–389.SuttorpM, von Neuhoff N,TiemannM, Dreger P,Schaub J, LLfferH,Parwaresch R, SchmitzN.Electrophoresis 17 (1996)672–677.
It is not always necessary toapply completely denaturingconditons on the gel: 7 mol/Lurea in the gel and 25 PCseparation temperature areoften sufficient.
1 Electrophoresis
tional A to the 3¢-end of a part of the single strands, double bands arefrequently seen after silver staining of denaturing gels.When labelling techniques like radioactivity or fluorescence are
employed, only one of the primer pair is marked to avoid visualiza-tion of the duplets.
Native PAGE of mini- and microsatellitesVariable number of tandem repeats (VNTR) and short tandemrepeats (STR) analysis are used in forensic laboratories: They are per-formed in denaturing and in non-denaturing gels. In both cases, theassignment of alleles with well-defined (sequenced) allelic ladders ofthe respective VNTR or STR locus, which are run in the same gel,proved to be the most reliable method (Puers et al. 1993; MRller et al.1994).
However, additionally to the regular types with length variations,there are sequence variants existing in some STR loci, which can onlybe identified by sequencing the fragments or running them on non-denaturing polyacrylamide gels. In order to achieve adequate resolu-tion in native gels, long separation distances or special gel media andbuffer systems have to be used (Schickle, 1996).
Differential Display PCR ElectrophoresisThis is a method to screen the total amount of cDNAs coming fromthe messenger RNA-pool of specific cell lines. The purpose is to dis-play only the active genes besides the total amount of ca. 1 Milliongenes of a cell.
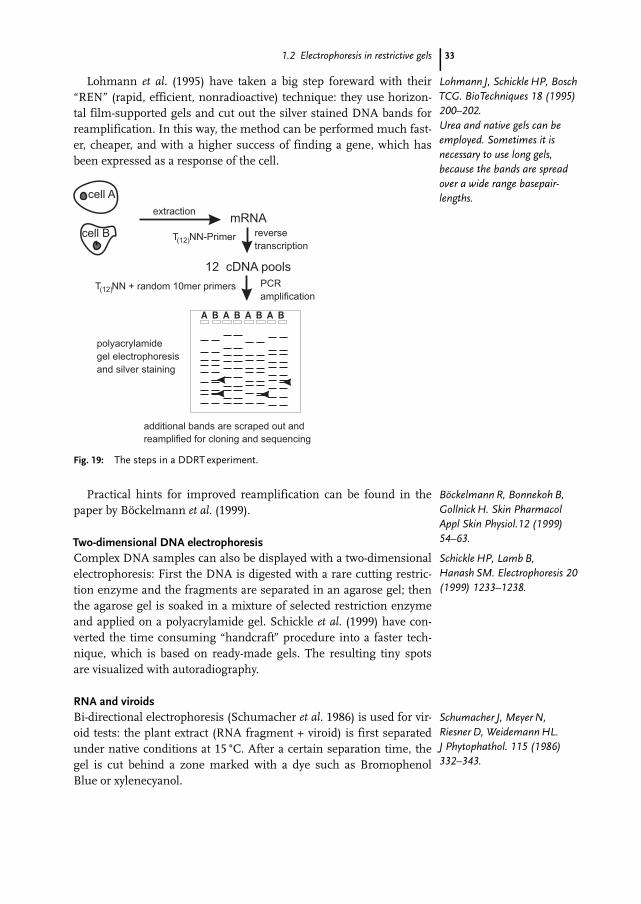
The method “DDRT” (Differential display reverse transcription)has been introduced by Liang and Pardee (1992) and improved byBauer et al. (1993). The mRNA from the original cell and the stimu-lated cell are processed in parallel. Extracted mRNA is reverse tran-scribed with oligo-dT-NN anchor primers. The resulting 12 cDNApools are amplified with the respective oligo-dT primer and a set ofarbitrary 10mer primers. After high resolution electrophoresis of theamplification products, those additional bands, which have beenexpressed by the stimulated cell, are cut out and reamplified for clon-ing and sequencing (see Fig. 19). The original technique employesautoradiography for the detection of the bands.
32
Instructions for denaturing elec-trophoresis are found inmethod 14.
MLller A, Wiegand P,GrQschowC, Seuchter SA,BaurMP, Brinkmann B. Int JLeg Med 106 (1994) 183–189.
Puers C, HammondHA,Jin L, Caskey CT, Schumm JW.Am J Hum Genet 53 (1993)953–958.
SchickleHP. GIT Laborme-dizin. 19 (1996) 228–231.
With new special gel mediafragments differing by 2 bp(in the size range of 100to 200 bp) can be resolvedin a 10 cm long gel undernative conditions.
Not only cell regulation anddifferentiation can be moni-tored, but also miscontrolledcells can be visualized in cancerresearch.
Liang, P, Pardee AB. Science257 (1992) 967–971.
Bauer D, MQller H, Reich J,Riedel H, Ahrenkiel V,Warthoe P, StraussM. NucleicAcid Res. 21 (1993)4272–4280.
The additional bands areidentified on the developedX-ray film; after cutting ahole in this position the filmis matched with the gel again,the band is scratched out.
1.2 Electrophoresis in restrictive gels
Lohmann et al. (1995) have taken a big step foreward with their“REN” (rapid, efficient, nonradioactive) technique: they use horizon-tal film-supported gels and cut out the silver stained DNA bands forreamplification. In this way, the method can be performed much fast-er, cheaper, and with a higher success of finding a gene, which hasbeen expressed as a response of the cell.
Practical hints for improved reamplification can be found in thepaper by BRckelmann et al. (1999).
Two-dimensional DNA electrophoresisComplex DNA samples can also be displayed with a two-dimensionalelectrophoresis: First the DNA is digested with a rare cutting restric-tion enzyme and the fragments are separated in an agarose gel; thenthe agarose gel is soaked in a mixture of selected restriction enzymeand applied on a polyacrylamide gel. Schickle et al. (1999) have con-verted the time consuming “handcraft” procedure into a faster tech-nique, which is based on ready-made gels. The resulting tiny spotsare visualized with autoradiography.
RNA and viroidsBi-directional electrophoresis (Schumacher et al. 1986) is used for vir-oid tests: the plant extract (RNA fragment + viroid) is first separatedunder native conditions at 15 IC. After a certain separation time, thegel is cut behind a zone marked with a dye such as BromophenolBlue or xylenecyanol.
33
cell A
reverse
transcription
extraction
A B A B A B A B
polyacrylamide
gel electrophoresis
and silver staining
PCR
amplification
mRNA
12 cDNA pools
additional bands are scraped out and
reamplified for cloning and sequencing
T NN + random 10mer primers(12)
T NN-Primer(12)cell B
Fig. 19: The steps in a DDRTexperiment.
Lohmann J, SchickleHP, BoschTCG. BioTechniques 18 (1995)200–202.Urea and native gels can beemployed. Sometimes it isnecessary to use long gels,because the bands are spreadover a wide range basepair-lengths.
BLckelmann R, Bonnekoh B,GollnickH. Skin PharmacolAppl Skin Physiol.12 (1999)54–63.
SchickleHP, LambB,Hanash SM. Electrophoresis 20(1999) 1233–1238.
Schumacher J, MeyerN,Riesner D, WeidemannHL.J Phytophathol. 115 (1986)332–343.

1 Electrophoresis
An electrophoretic separation under denaturing conditions is carriedout. The viroid forms a ring which cannot migrate. The RNA frag-ments which migrate more slowly during the first native separation,do not lose their mobility at 50 IC and migrate out of the gel. If a vir-oid is present, only one band is found when the gel is stained. Theposition of the viroid in the gel depends on its kind. Several new vir-oids have been discovered in this way.
1.2.4Polyacrylamide gel electrophoresis of proteins
For analytical PAGE of proteins, the trend is to go from cylindricalgels to flat and thinner ones. Because of the development of moresensitive staining methods such as silver staining for example, verysmall quantities of concentrated sample solution can be applied forthe detection of trace amounts of proteins.The advantages of thinner gels are:
. faster separation
. better defined bands
. faster staining
. better staining efficiency, higher sensitivity
Disc electrophoresisDiscontinuous electrophoresis according to Ornstein (1964) andDavis (1964) solves two problems of protein electrophoresis: it pre-vents aggregation and precipitation of proteins during the entry fromliquid sample into the gel matrix, and promotes the formation of welldefined bands. The discontinuity is based on four parameters (seeFig. 20):
. the gel structure
. the pH value of the buffer
. the ionic strength of the buffer
. the nature of the ions in the gel and in the electrode buffer
The gel is divided into two areas: resolving and stacking gel. Theresolving gel with small pores contains 0.375 mol/L Tris-HCL bufferpH 8.8, the stacking gel with large pores contains 0.125 mol/L Tris-HCL pH 6.8.The electrode buffer contains only glycine, the gel only Cl– ions.
Glycine has a pI 6.7, it has almost no net charge at pH 6.8: the pH ofthe stacking gel. Thus glycine has a low mobility.
34
The gel contains 4 mol/L urea.The molecules are denatured,that is unfolded by the combi-nation of urea and elevatedtemperature. For practicalreasons this method is onlycarried out in horizontalsystems.
Ornstein L. Ann NY Acad Sci.121 (1964) 321–349.Davis BJ. Ann NY Acad Sci.121 (1964) 404–427.See also page 45:Isotachophoresis
Glycine is used because it isvery hydrophilic and does notbind to proteins.
1.2 Electrophoresis in restrictive gels
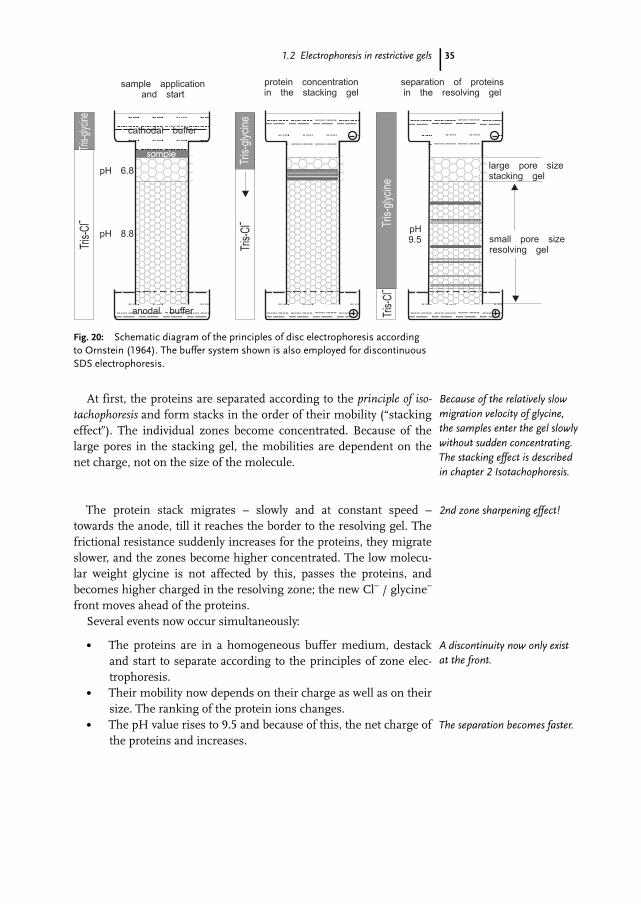
At first, the proteins are separated according to the principle of iso-tachophoresis and form stacks in the order of their mobility (“stackingeffect”). The individual zones become concentrated. Because of thelarge pores in the stacking gel, the mobilities are dependent on thenet charge, not on the size of the molecule.
The protein stack migrates – slowly and at constant speed –towards the anode, till it reaches the border to the resolving gel. Thefrictional resistance suddenly increases for the proteins, they migrateslower, and the zones become higher concentrated. The low molecu-lar weight glycine is not affected by this, passes the proteins, andbecomes higher charged in the resolving zone; the new Cl– / glycine–
front moves ahead of the proteins.Several events now occur simultaneously:
. The proteins are in a homogeneous buffer medium, destackand start to separate according to the principles of zone elec-trophoresis.
. Their mobility now depends on their charge as well as on theirsize. The ranking of the protein ions changes.
. The pH value rises to 9.5 and because of this, the net charge ofthe proteins and increases.
35
b b b b bbbbbbbbbbbbbbbbbbbbbbbbbbbbbbbbbbbbbbbbbbbbbbbbbbbbbbbbbbbbbbbbbbbbbbbbbbbbbbb b b b b b
d d d d ddddddddddddddddddddddddddddddddddddddddddddddddddddddddddddddddddddddddddddddd d d d d d
a a a a aaaaaaaaaaaaaaaaaaaaaaaaaaaaaaaaaaaaaaaaaaaaaaaaaaaaaaaaaaaaaaaaaaaaaaaaaaaaaaa a a a a a
c c c c ccccccccccccccccccccccccccccccccccccccccccccccccccccccccccccccccccccccccccccccc c c c c cb b b bbbbbbbbbb b b b
d d d dddddddddd d d d
a a a aaaaaaaaaa a a a
c c c cccccccccc c c c
Tris-
glyc
ine
b b b b bbbbbbbbbbbbbbbbbbbbbbbbbbbbbbbbbbbbbbbbbbbbbbbbbbbbbbbbbbbbbbbbbbbbbbbbbbbbbbb b b b b b
d d d d ddddddddddddddddddddddddddddddddddddddddddddddddddddddddddddddddddddddddddddddd d d d d d
a a a a aaaaaaaaaaaaaaaaaaaaaaaaaaaaaaaaaaaaaaaaaaaaaaaaaaaaaaaaaaaaaaaaaaaaaaaaaaaaaaa a a a a a
c c c c ccccccccccccccccccccccccccccccccccccccccccccccccccccccccccccccccccccccccccccccc c c c c cb b b bbbbbbbbbb b b b
d d d dddddddddd d d d
a a a aaaaaaaaaa a a a
c c c cccccccccc c c c
b b b b bbbbbbbbbbbbbbbbbbbbbbbbbbbbbbbbbbbbbbbbbbbbbbbbbbbbbbbbbbbbbbbbbbbbbbbbbbbbbbb b b b b b
d d d d ddddddddddddddddddddddddddddddddddddddddddddddddddddddddddddddddddddddddddddddd d d d d d
a a a a aaaaaaaaaaaaaaaaaaaaaaaaaaaaaaaaaaaaaaaaaaaaaaaaaaaaaaaaaaaaaaaaaaaaaaaaaaaaaaa a a a a a
c c c c ccccccccccccccccccccccccccccccccccccccccccccccccccccccccccccccccccccccccccccccc c c c c cb b b bbbbbbbbb
b b b b
d d d dddddddddd d d d
a a a aaaaaaaaaa a a a
c c c cccccccccc c c c
cathodal buffer
sample applicationand start
protein concentrationin the stacking gel
separation of proteinsin the resolving gel
large pore sizestacking gel
small pore sizeresolving gel
pH 6.8
pH 8.8pH9.5
anodal buffer
sample
Tris
-Cl
Tris
-Cl
Tris
-Cl
Tris
-gly
cine
Tris
-gly
cine
Fig. 20: Schematic diagram of the principles of disc electrophoresis accordingto Ornstein (1964). The buffer system shown is also employed for discontinuousSDS electrophoresis.
Because of the relatively slowmigration velocity of glycine,the samples enter the gel slowlywithout sudden concentrating.The stacking effect is describedin chapter 2 Isotachophoresis.
2nd zone sharpening effect!
A discontinuity now only existat the front.
The separation becomes faster.
1 Electrophoresis
Disc electrophoresis affords high resolution and good band defini-tion. In the example cited above, proteins with pIs higher than pH6.8 migrate in the direction of the cathode and are lost. Another buff-er system must be chosen to separate these proteins. A selection canbe found in the works of Maurer (1968) and Jovin (1970). Alterna-tively SDS can be added to the gel and running buffer to in order tohave all proteins negatively charged.The stacking gels is only cast onto the resolving gel just before elec-
trophoresis because, when the complete gel is left standing for a longtime the ions diffuse towards one another.
Gradient gel electrophoresisBy continuously changing the acrylamide concentration in the poly-merization solution, a pore gradient gel is obtained. Gradient gelshave a zone sharpening effect and can be used to determine the mo-lecular diameter of proteins in their native state (Rothe and Purkhan-baba, 1982).When the acrylamide concentration and cross-linking are high
enough in the small pore area, the protein molecules can be driven toan end point, where they are trapped in the tight gel matrix. Since thespeed of migration of the individual protein molecules depends ontheir charge, the electrophoresis must be carried out long enough sothat the molecule with the lowest net charge also reaches its endpoint.There are various ways of making gels with linear or exponential
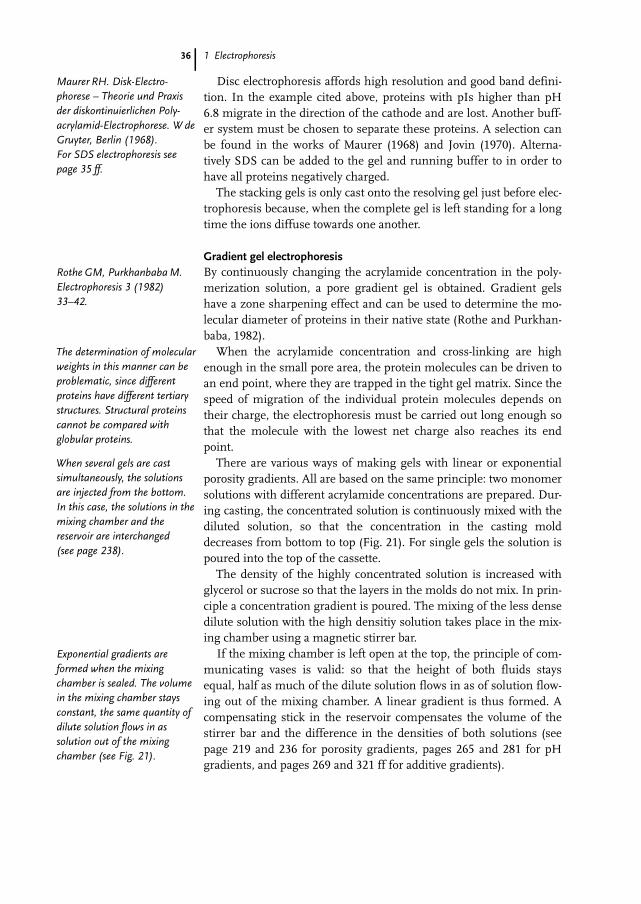
porosity gradients. All are based on the same principle: two monomersolutions with different acrylamide concentrations are prepared. Dur-ing casting, the concentrated solution is continuously mixed with thediluted solution, so that the concentration in the casting molddecreases from bottom to top (Fig. 21). For single gels the solution ispoured into the top of the cassette.The density of the highly concentrated solution is increased with
glycerol or sucrose so that the layers in the molds do not mix. In prin-ciple a concentration gradient is poured. The mixing of the less densedilute solution with the high densitiy solution takes place in the mix-ing chamber using a magnetic stirrer bar.If the mixing chamber is left open at the top, the principle of com-
municating vases is valid: so that the height of both fluids staysequal, half as much of the dilute solution flows in as of solution flow-ing out of the mixing chamber. A linear gradient is thus formed. Acompensating stick in the reservoir compensates the volume of thestirrer bar and the difference in the densities of both solutions (seepage 219 and 236 for porosity gradients, pages 265 and 281 for pHgradients, and pages 269 and 321 ff for additive gradients).
36
Maurer RH. Disk-Electro-phorese – Theorie und Praxisder diskontinuierlichen Poly-acrylamid-Electrophorese. W deGruyter, Berlin (1968).For SDS electrophoresis seepage 35 ff.
RotheGM, PurkhanbabaM.Electrophoresis 3 (1982)33–42.
The determination of molecularweights in this manner can beproblematic, since differentproteins have different tertiarystructures. Structural proteinscannot be compared withglobular proteins.
When several gels are castsimultaneously, the solutionsare injected from the bottom.In this case, the solutions in themixing chamber and thereservoir are interchanged(see page 238).
Exponential gradients areformed when the mixingchamber is sealed. The volumein the mixing chamber staysconstant, the same quantity ofdilute solution flows in assolution out of the mixingchamber (see Fig. 21).
1.2 Electrophoresis in restrictive gels
SDS electrophoresisSDS electrophoresis – SDS being the abbreviation for sodium dodecylsulphate – which was introduced by Shapiro et al. (1967) separatesexclusively according to molecular weight. By loading with the anion-ic detergent SDS, the charge of the proteins is so well masked thatanionic micelles with a constant net charge per mass unit result: 1.4g SDS per g protein.In addition, the tertiary and secondary structures are cancelled
because of the disruption of the hydrogen bonds and unfolding of themolecules.Disulfide bonds between cysteine residues can only be cleaved by a
reducing thiol agent such as 2-mercaptoethanol or dithiothreitol. TheSH groups are often protected by a subsequent alkylation with iodoa-cetamide, iodoacetic acid or vinylpyridine (Lane, 1978).The unfolded amino acid chains, bound to SDS, form ellipsoids
with identical central axes. During electrophoresis in restrictive poly-acrylamide gels containing 0.1% SDS there is a linear relationshipbetween the logarithm of the molecular weight and the relative dis-tance of migration of the SDS-polypeptide micelle.
37
reservoirmixing chamber
plug
magnetic bar
Fig. 21: Casting of an exponential gradient gelwith a gradient maker. The stirrer bar is rotatedwith a magnetic stirrer (not shown).
Shapiro AL, ViTuela E,Maizel JV. Biochem BiophysRes Commun. 28 (1967)815–822.
Thus there is no influence of theshape of the protein on therunning condition.
Lane LC. Anal Biochem. 86(1978) 655–664.
This linear relationship is onlyvalid for a certain interval,which is determined by theratio of the molecular size tothe pore diameter.
1 Electrophoresis
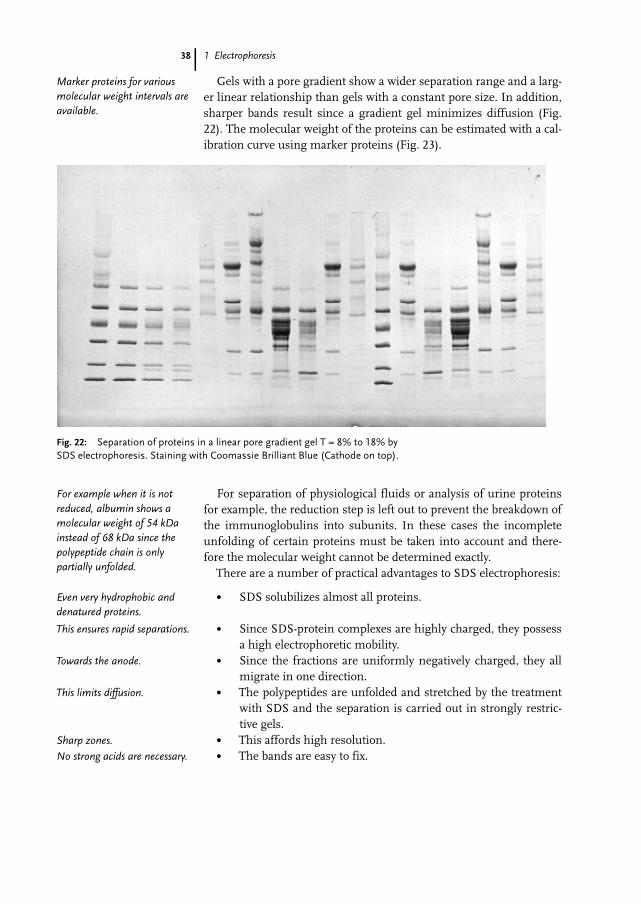
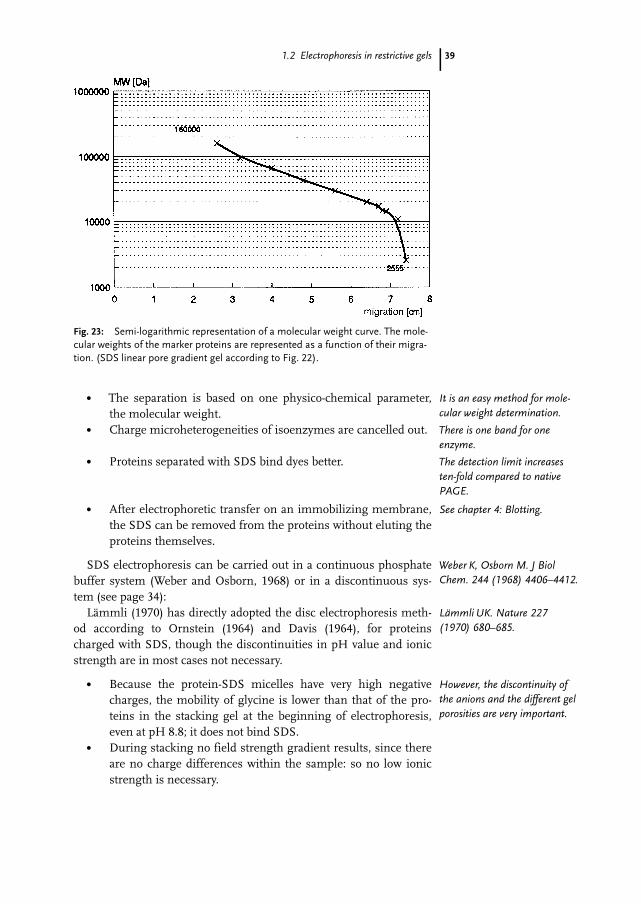
Gels with a pore gradient show a wider separation range and a larg-er linear relationship than gels with a constant pore size. In addition,sharper bands result since a gradient gel minimizes diffusion (Fig.22). The molecular weight of the proteins can be estimated with a cal-ibration curve using marker proteins (Fig. 23).
For separation of physiological fluids or analysis of urine proteinsfor example, the reduction step is left out to prevent the breakdown ofthe immunoglobulins into subunits. In these cases the incompleteunfolding of certain proteins must be taken into account and there-fore the molecular weight cannot be determined exactly.There are a number of practical advantages to SDS electrophoresis:
. SDS solubilizes almost all proteins.
. Since SDS-protein complexes are highly charged, they possessa high electrophoretic mobility.
. Since the fractions are uniformly negatively charged, they allmigrate in one direction.
. The polypeptides are unfolded and stretched by the treatmentwith SDS and the separation is carried out in strongly restric-tive gels.
. This affords high resolution.
. The bands are easy to fix.
38
Fig. 22: Separation of proteins in a linear pore gradient gel T = 8% to 18% bySDS electrophoresis. Staining with Coomassie Brilliant Blue (Cathode on top).
Marker proteins for variousmolecular weight intervals areavailable.
For example when it is notreduced, albumin shows amolecular weight of 54 kDainstead of 68 kDa since thepolypeptide chain is onlypartially unfolded.
Even very hydrophobic anddenatured proteins.
This ensures rapid separations.
Towards the anode.
This limits diffusion.
Sharp zones.
No strong acids are necessary.
1.2 Electrophoresis in restrictive gels
. The separation is based on one physico-chemical parameter,the molecular weight.
. Charge microheterogeneities of isoenzymes are cancelled out.
. Proteins separated with SDS bind dyes better.
. After electrophoretic transfer on an immobilizing membrane,the SDS can be removed from the proteins without eluting theproteins themselves.
SDS electrophoresis can be carried out in a continuous phosphatebuffer system (Weber and Osborn, 1968) or in a discontinuous sys-tem (see page 34):LTmmli (1970) has directly adopted the disc electrophoresis meth-
od according to Ornstein (1964) and Davis (1964), for proteinscharged with SDS, though the discontinuities in pH value and ionicstrength are in most cases not necessary.
. Because the protein-SDS micelles have very high negativecharges, the mobility of glycine is lower than that of the pro-teins in the stacking gel at the beginning of electrophoresis,even at pH 8.8; it does not bind SDS.
. During stacking no field strength gradient results, since thereare no charge differences within the sample: so no low ionicstrength is necessary.
39
Fig. 23: Semi-logarithmic representation of a molecular weight curve. The mole-cular weights of the marker proteins are represented as a function of their migra-tion. (SDS linear pore gradient gel according to Fig. 22).
It is an easy method for mole-cular weight determination.
There is one band for oneenzyme.
The detection limit increasesten-fold compared to nativePAGE.
See chapter 4: Blotting.
Weber K, Osborn M. J BiolChem. 244 (1968) 4406–4412.
LUmmli UK. Nature 227(1970) 680–685.
However, the discontinuity ofthe anions and the different gelporosities are very important.
1 Electrophoresis
This means that SDS disc electrophoresis gels can be cast in onestep: Glycerol is added to the resolving gel and then the stacking gel,which contains the same buffer but no glycerol, is directly cast on topof it. In addition, the run time is shorter since the separation startsmore quickly.
Since there are no diffusion problems between the stacking andthe resolving gel buffers with these gels, they can be stored longerthan conventional disc gels. Yet their shelflife is limited by the highpH value of the gel buffer, since, after about 10 days, the polyacrylam-ide matrix starts to hydrolyse.Long shelflife gels: Tris-acetate buffer with a pH of 6.7 has proven to
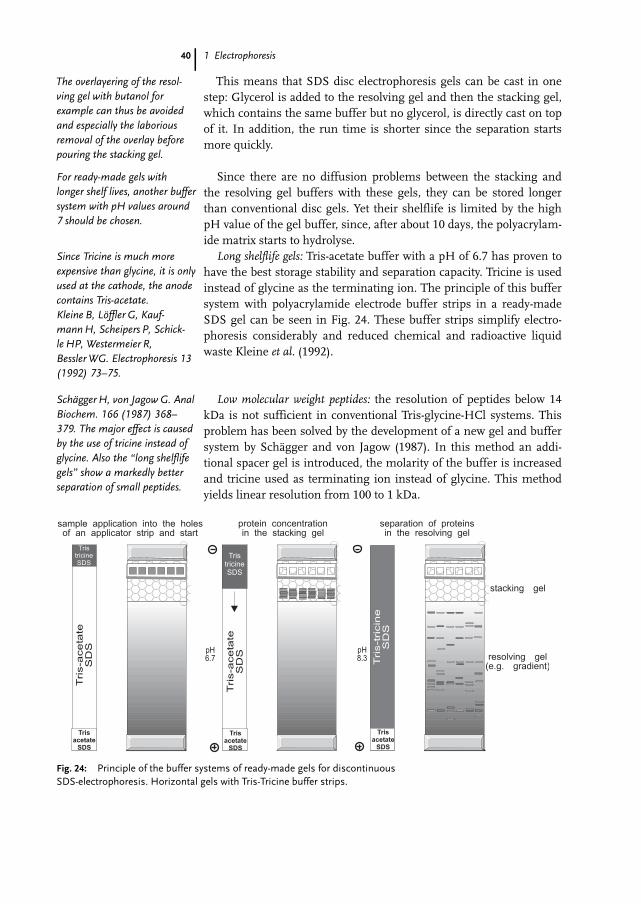
have the best storage stability and separation capacity. Tricine is usedinstead of glycine as the terminating ion. The principle of this buffersystem with polyacrylamide electrode buffer strips in a ready-madeSDS gel can be seen in Fig. 24. These buffer strips simplify electro-phoresis considerably and reduced chemical and radioactive liquidwaste Kleine et al. (1992).
Low molecular weight peptides: the resolution of peptides below 14kDa is not sufficient in conventional Tris-glycine-HCl systems. Thisproblem has been solved by the development of a new gel and buffersystem by SchTgger and von Jagow (1987). In this method an addi-tional spacer gel is introduced, the molarity of the buffer is increasedand tricine used as terminating ion instead of glycine. This methodyields linear resolution from 100 to 1 kDa.
40
b b b b bbbbbbbbbbbbbbbbbbbbbbbbbbbbbbb
d d d d ddddddddddddddddddddddddddddddd
a a a a aaaaaaaaaaaaaaaaaaaaaaaaaaaaaaa
c c c c ccccccccccccccccccccccccccccccc
pH6.7
pH8.3
b b b b bbbbbbbbbbbbbbbbbbbbbbbbbbbbbbb
d d d d ddddddddddddddddddddddddddddddd
a a a a aaaaaaaaaaaaaaaaaaaaaaaaaaaaaaa
c c c c ccccccccccccccccccccccccccccccc
Tris-t
ricin
eS
DS
b b b b bbbbbbbbbbbbbbbbbbbbbbbbbbbbbbb
d d d d ddddddddddddddddddddddddddddddd
a a a a aaaaaaaaaaaaaaaaaaaaaaaaaaaaaaa
c c c c ccccccccccccccccccccccccccccccc
Tris-a
ceta
teS
DS
Tris-a
ceta
teS
DS
sample application into the holesof an applicator strip and start
protein concentrationin the stacking gel
separation of proteinsin the resolving gel
stacking gel
resolving gel(e.g. gradient)
TristricineSDS
Tris
acetate
SDS
Tris
acetate
SDS
Tris
acetate
SDS
TristricineSDS
Fig. 24: Principle of the buffer systems of ready-made gels for discontinuousSDS-electrophoresis. Horizontal gels with Tris-Tricine buffer strips.
The overlayering of the resol-ving gel with butanol forexample can thus be avoidedand especially the laboriousremoval of the overlay beforepouring the stacking gel.
For ready-made gels withlonger shelf lives, another buffersystem with pH values around7 should be chosen.
Since Tricine is much moreexpensive than glycine, it is onlyused at the cathode, the anodecontains Tris-acetate.Kleine B, LLffler G, Kauf-mannH, Scheipers P, Schick-leHP, Westermeier R,BesslerWG. Electrophoresis 13(1992) 73–75.
SchUggerH, von JagowG. AnalBiochem. 166 (1987) 368–379. The major effect is causedby the use of tricine instead ofglycine. Also the “long shelflifegels” show a markedly betterseparation of small peptides.

1.2 Electrophoresis in restrictive gels
Glycoproteins migrate too slowly in SDS electrophoresis, since thesugar moiety does not bind SDS. When a Tris-borate-EDTA buffer isused, the sugar moieties are also negatively charged, so the speed ofmigration increases (Poduslo, 1981).
Blue Native ElectrophoresisMembrane proteins: When membrane proteins are solubilized withnonionic detergents, these detergents would interfere with the SDS.SchTgger and von Jagow (1991) have developed “Blue Native electro-phoresis” of membrane protein complexes to solve this problem:In a vertical chamber Coomassie Blue G-250 is added to the catho-
dal buffer in a native polyacrylamide gel electrophoresis.During the run the dye competes with the nonionic detergent and
binds to the membrane proteins and complexes and charges themnegatively analogous to SDS. All these protein-dye complexes migratetowards the anode, also basic proteins. They are soluble in detergent-free solution, and – as the negatively charged protein surfaces repeleach other – aggregation between proteins is minimized.
The separation lanes of individual samples can be cut out from thepolyacrylamide slab and applied directly on SDS polyacrylamide gelfor a separation into a second dimension. In presence of SDS thecomplexes are dissolved and the partners of the respective complexesare displayed in the gel. The procedure has been described in detail(H. SchTgger, 1994).
Cationic detergent electrophoresisStrongly acidic proteins do not bind SDS and very basic nucleopro-teins behave abnormally in SDS gels. The alternative is to use cationicdetergents, for instance cetyltrimethylammonium bromide (CTAB),in an acidic medium at pH 3 to 5 (Eley et al. 1979). This allows a sepa-ration according to the molecular weight in the direction of the cath-ode. This cationic detergent also causes less damage to the proteinthan SDS, so CTAB electrophoresis can be used as a form of nativeelectrophoresis (Atin et al. 1985). See also next page.
Rehydrated polyacrylamide gels:In washed gels the SDS Tris-HCl / Tris-glycine buffer system showspoor results. However good results are obtained with the Tris-ace-tate / Tris-tricine system.
In this method, the gel is rehydrated in Tris-acetate pH 8.0 using ahorizontal tray. If, for highly concentrated protein samples, a disconti-nuity in pHandmolarity between stacking and resolving gel is required,the stacking zone can be selectively equilibrated in a higher diluted Tris-acetate buffer pH5.6 using a vertical chamber (see page 228).
41
Poduslo JF. Anal Biochem. 114(1981) 131–139.The use of gradient gels is alsobeneficial for better MW esti-mations.
SchUggerH, von JagowG.Anal Biochem. 199 (1991)223–231.
The membrane proteins andcomplexes can be isolated inenzymatically active form.The gels do not need to bestained, because the proteinsand complexes migrate as bluebands.
SchUggerH. Chapter 4:Nativeelectrophoresis. In: A Practicalguide tomembrane proteinPurification (Von JagowG,SchUggerH, eds.) AcademicPress, New York (1994) 81–103.
EleyMH, Burns PC, Kanna-pell CC, Campbell PS. AnalBiochem. 92 (1979) 411–419.
Atin DT, Shapira R, Kinka-de JM. Anal Biochem. 145(1985) 170–176.
The performance of SDS buffersystems are obviously highlyinfluenced by catalysts and / ormonomers of acrylamide.
This procedure of washing,drying, rehydration and equii-bration can only be performedwith gels polymerized on carrierfilms, which are used in hori-zontal systems.
1 Electrophoresis
Native electrophoresis in amphoteric buffers: the polymerization cata-lysts can be washed out of the polyacrylamide gels on support filmsused in horizontal systems with deionized water. By equilibrationwith amphoteric buffers such as HEPES, MES or MOPS for example,there is a wide spectrum for electrophoresis under native conditions.This method proved to be particularly useful for acidic electrophoresisof basic hydrophobic barley hordeins (Hsam et al. 1993) and basicfish sarcoplasmic proteins (Rehbein, 1995).
Two-dimensional electrophoresis techniquesSeveral aims are pursued by the combination of two different electro-phoretic methods:
. Proteins separated by electrophoresis are then identified bycrossed immunoelectrophoresis.
. A complex protein mixture is first separated by zone electro-phoresis and then further purified by IEF, or vice versa (Alt-land and Hackler, 1984).
. Hydrophobic proteins, such as membrane-bound proteins, areseparated first in an acidic gel at pH 2.1 in presence of the cat-ionic detergent 16-BAC, followed by an SDS electrophoresis(Langen et al. 2000). As the separation patterns in 16-BAC andin SDS differ substantially, a decent resolution is obtained.
. Membrane protein complexes are first separated by Bluenative electrophoresis (see above) and then separated withSDS PAGE for the display and identification of complex part-ners.
. Highly heterogeneous mixtures of proteins such as cell lysatesor tissue extracts should be completely fractionated into indi-vidual proteins so as to obtain an overall picture of the proteincomposition and to enable location of individual proteins.
For these techniques, the first-dimensional runs are carried out inindividual gel rods or strips and loaded onto the second-dimensionalgels.
High resolution 2-D electrophoresis: This method had been intro-duced by O’Farrell (1975). The sample is denatured with a lysis buff-er, the first dimension is isoelectric focusing in presence of 8 or 9molar urea and a non-ionic detergent. SDS electrophoresis is run asthe second dimension. In Fig. 25 the principle of the traditional 2-Delectrophoresis methodology is shown.
42
The ionic catalysts APS andTEMED would destabilize thesebuffer systems, see method 4,pages 175 and following.Hsam SLK, SchickleHP,Westermeier R, Zeller FJ. Brau-wissenschaft 3 (1993) 86–94.RehbeinH. Electrophoresis 16(1995) 820–822.
Altland K, Hackler R. In:Neuhoff V, Ed. Electrophoresis’84. Verlag Chemie, Weinheim(1984) 362–378.
LangenH, TakWcs B, Evers S,Berndt P, Lahm H-W, Wipf B,Gray C, FountoulakisM.Electrophoresis 21 (2000) 411–429.
The highest resolution isobtained by first separatingaccording to the isoelectricpoints, the second dimensionaccording to the moleculemass.A flat-bed gel can also be cutinto strips after the first separa-tion and transferred onto thesecond gel.
O’Farrell PH. J Biol Chem. 250(1975) 4007–4021.
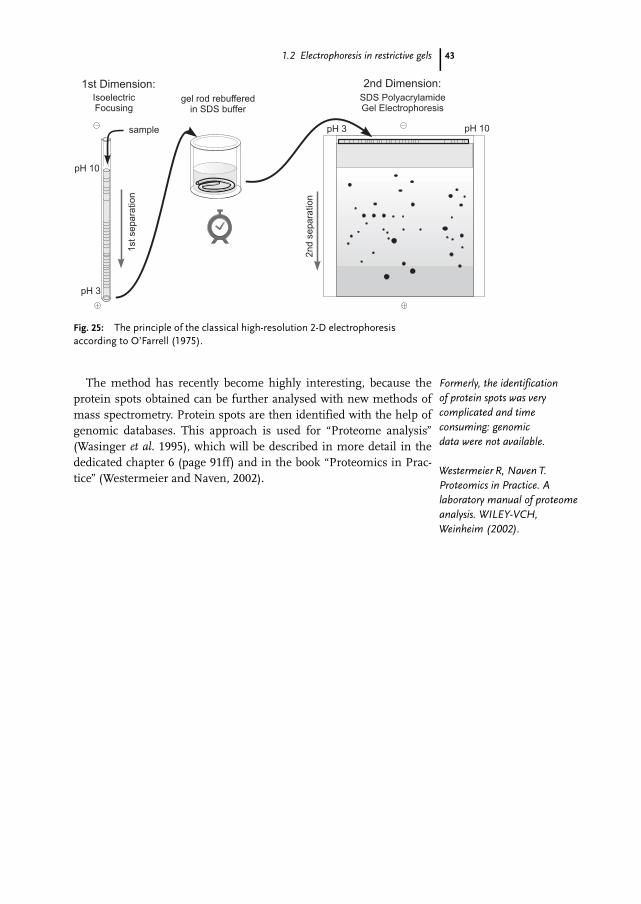
1.2 Electrophoresis in restrictive gels
The method has recently become highly interesting, because theprotein spots obtained can be further analysed with new methods ofmass spectrometry. Protein spots are then identified with the help ofgenomic databases. This approach is used for “Proteome analysis”(Wasinger et al. 1995), which will be described in more detail in thededicated chapter 6 (page 91ff) and in the book “Proteomics in Prac-tice” (Westermeier and Naven, 2002).
43
sample
gel rod rebufferedin SDS buffer
1stsepara
tion
pH 10
pH 10
pH 3
pH 3
2nd
separa
tion
IsoelectricFocusing
1st Dimension: 2nd Dimension:
SDS PolyacrylamideGel Electrophoresis
Fig. 25: The principle of the classical high-resolution 2-D electrophoresisaccording to O’Farrell (1975).
Formerly, the identificationof protein spots was verycomplicated and timeconsuming: genomicdata were not available.
Westermeier R, Naven T.Proteomics in Practice. Alaboratory manual of proteomeanalysis. WILEY-VCH,Weinheim (2002).
