1 capcoa health impacts of air pollution on communities september 19-20, 2007 9:10 - 10:35 current...
TRANSCRIPT

1
CAPCOA Health Impacts of Air Pollution on Communities
September 19-20, 2007
9:10 - 10:35 Current Paradigms: Strengths and Limitations--
1. Source Category Regulations2. Air Toxics “Hot Spots” Information and Assessment
Act & Risk Reduction Program3. New Source Review for Air Toxics
Chris Halm (916) [email protected]

2
Outline
1. AB 2588 Air Toxics “Hot Spots” Program– Overview
– Health Risk Assessment (HARP)
– Public Notification and Risk Reduction
– Relationship to Statewide Regulations
2. Community Health Air Pollution Information System (CHAPIS)
3. Air Quality Maps (AQMIS)
4. Environmental Justice

3
AB 2588 Air Toxics “Hot Spots” Program
• “Hot Spots” addresses health risk posed by air toxics from facility to nearby receptors
• Applies to stationary sources like refineries, power plants, dry cleaners, and gas stations
• Implemented by local air districts– ARB adopts emission inventory guidelines
– OEHHA develops risk assessment guidelines

4
The “Hot Spots” Process
• Local air district identifies facility as subject to “Hot Spots”
• Facility estimates annual air toxic emissions– Local air district reviews emissions data
– Facilities are prioritized into risk categories
• Facility with potential risk conducts health risk assessment– District and OEHHA review risk assessment
– Emissions and risk data sent to ARB

5
HARP: Risk Assessment Software

6
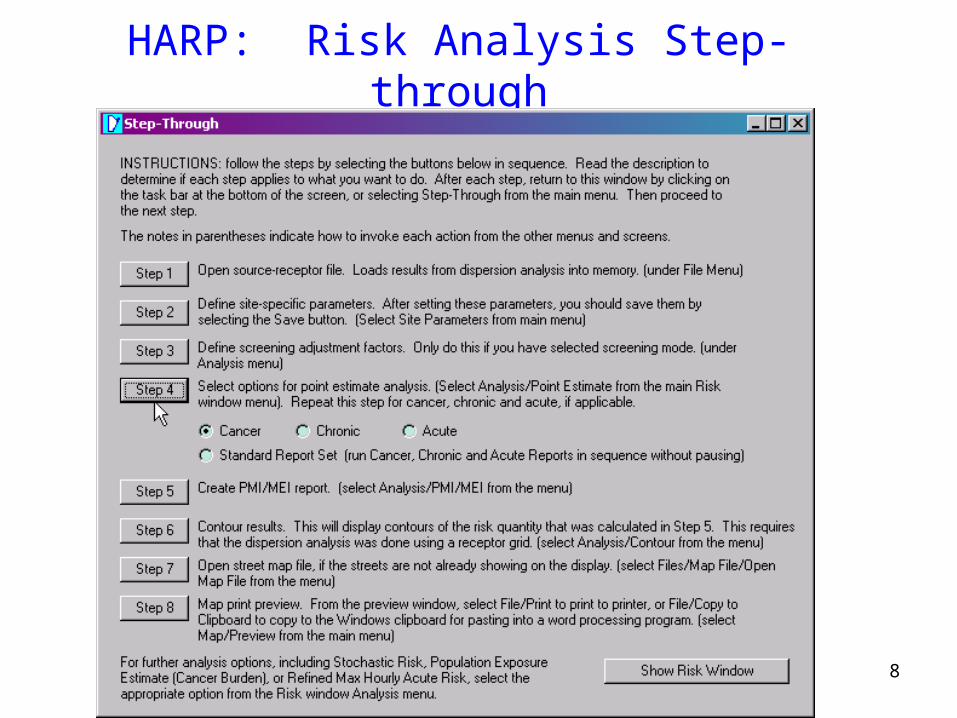
The Hotspots Analysis and Reporting Program (HARP) is a Tool to …
• Create and manage facility emissions data
• Perform air dispersion modeling and risk analyses– New On-RAMP allows AERMOD and CALPUFF
dispersion modeling results to be used
• Make reports and maps
• And... it’s free!

7
HARP: Facility and Emissions Module
8
HARP: Risk Analysis Step-through

9
HARP: Risk Window and Map
Risk contours show health risk posed by
facility in community.
Risk contours show health risk posed by
facility in community.

10
Public Notification and Risk Reduction
• Facilities required to send letters notifying neighbors of significant risks
• Most facilities voluntarily reduce risk to avoid public notification if at all possible
• Facility has up to 5 years to reduce risk
• Risk communication is very difficult– What does a risk of 10 per million mean?

11
Recent Amendments to “Hot Spots”
• Risk from stationary diesel engine emissions now included in Program– Even after State regulation established hour limits for
each engine, “Hot Spots” needed as a backstop to ensure residual risk from all engines at facility is acceptable
– Portable diesel engines subject in 2010, but only if likely to pose a significant risk
• New substances and health values added

12
Relationship Between “Hot Spots” and Statewide Regulations
• AB 2588 was landmark right-to-know law
• Lessons learned from “Hot Spots” used to develop statewide regulations (perc dry cleaners and chrome platers)
• Statewide regulation usually more cost- effective than individual facility evaluations
• Regulations able to address future risks from new sources

13
“Hot Spots” Can’t Do Everything
• Cumulative risk from multiple facilities is not addressed
• On-site mobile sources generally not included, but risk can be significant
• Only requires risk reduction, not emission reductions – No neighbors... no significant risk... no controls required
– Tall stack... toxics are diluted... fewer controls required
....Questions?

14
CHAPIS Emissions
Maps
AQMIS Air Quality
Maps

15
CHAPIS (Community Health Air Pollution Information System)
• Maps location of emissions sources
• Includes mobile sources, consumer products, and industrial/commercial facilities
• Multiyear effort, collaboration with districts

16
CHAPIS: Pick an Area of Interest – by Zip, County, Air District or Region

17
Pick a pollutant, then zoom in

18
ABC Company (12345)
Hover over triangle - shows facility name

19
Link to ARB’s inventory for detailed emissions
ABC COMPANY INC.ABC COMPANY INC.

20
Compare Toxics with Other Facilities
21
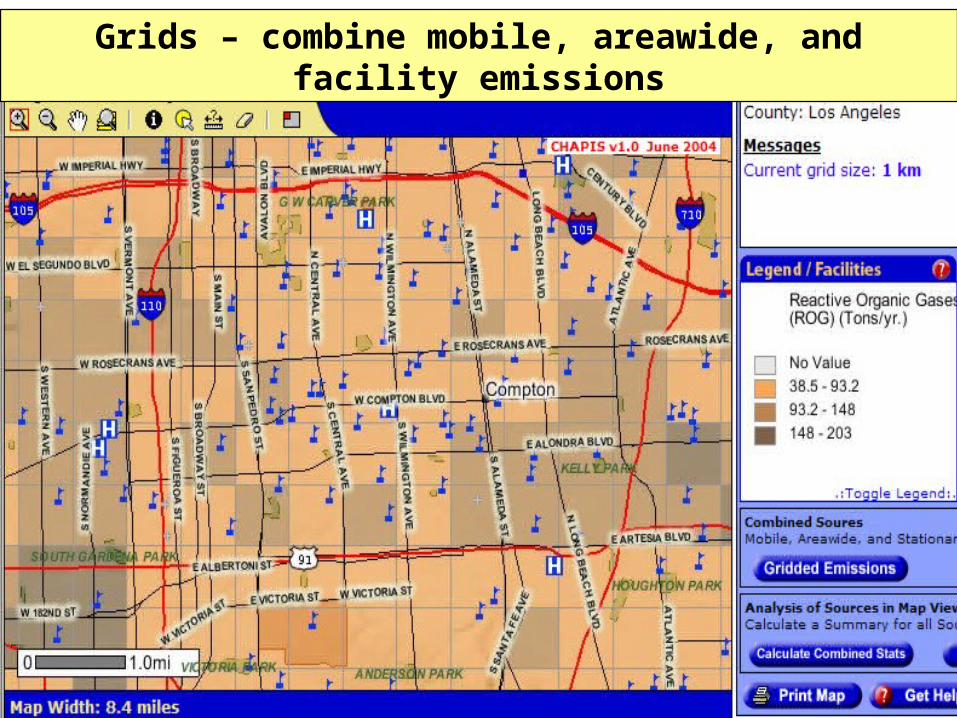
Grids – combine mobile, areawide, and facility emissions

22
ABCD Company
GHT Company
XYZ Company
Summarize emissions( graph and facility list )

23
CHAPIS has links to Air Monitoring Data

24
Air Quality and MeteorologicalInformation System (AQMIS)
• Provides “real time” and historical data from 200 ARB and district air monitoring sites
• Key pollutants are ozone and particulate matter

25
AQMIS - Ozone and PM Trends

26
Ambient Air Toxic Trends

27
Environmental Justice

28
Environmental Justice
• “Fair treatment of all people...”
• ARB’s EJ Policies require EJ to be considered in all decisions– Next is Climate Change and EJ impacts
• Focus on cumulative risk
• Local land-use decisions always key factor

29
Multimedia Maps for Special Projects
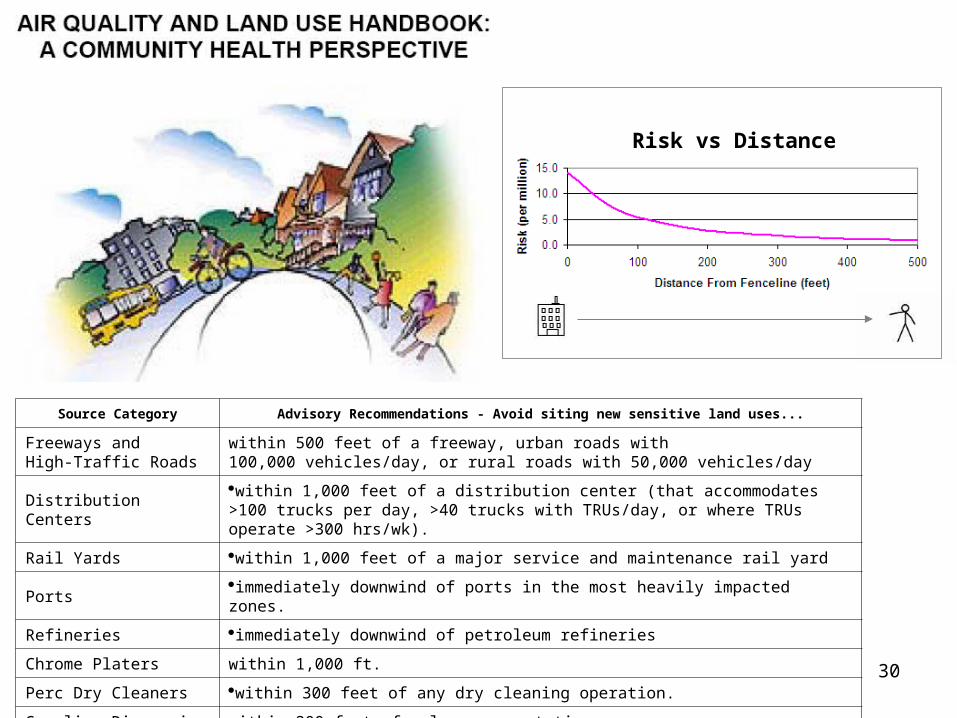
30
Risk vs Distance
Source Category Advisory Recommendations - Avoid siting new sensitive land uses...
Freeways and High-Traffic Roads
within 500 feet of a freeway, urban roads with 100,000 vehicles/day, or rural roads with 50,000 vehicles/day
Distribution Centerswithin 1,000 feet of a distribution center (that accommodates >100 trucks per day, >40 trucks with TRUs/day, or where TRUs operate >300 hrs/wk).
Rail Yards within 1,000 feet of a major service and maintenance rail yard
Ports immediately downwind of ports in the most heavily impacted zones.
Refineries immediately downwind of petroleum refineries
Chrome Platers within 1,000 ft.
Perc Dry Cleaners within 300 feet of any dry cleaning operation.
Gasoline Dispensing Facilities
within 300 feet of a large gas station

31
Links
• http://www.arb.ca.gov/ab2588/9-19-07.ppt (today’s presentation)
• http://www.arb.ca.gov/ch/handbook.pdf (air quality handbook)
• http://www.arb.ca.gov/ch/ppgEnglish2005.pdf (public participation)
• http://www.arb.ca.gov/ch/programs/complaint.htm (complaint resolution)
• http://www.arb.ca.gov/ch/chapis1/chapis1.htm (emissions maps)
• http://www.arb.ca.gov/toxics/harp/harp.htm (risk assessment software)
• http://www.arb.ca.gov/ch/public_participation.htm (public participation guidebook)
• http://www.arb.ca.gov/aqd/aqdpage.htm (ambient toxics data)
• http://www.arb.ca.gov/ab2588/ab2588.htm (AB 2588 “Hot Spots”)
• http://www.arb.ca.gov/app/emsinv/facinfo/facinfo.php (toxics data)
• http://www.arb.ca.gov/app/emsinv/t25cat/display.php (top 25 sources)
• http://www.arb.ca.gov/aqd/aqinfo.htm (air quality data)
• http://www.arb.ca.gov/toxics/cti/hlthrisk/hlthrisk.htm (ASPEN maps)
• http://www.arb.ca.gov/ch/espanol.htm (Spanish docs)
• http://www.arb.ca.gov/ch/Draft_Wilmington_ChERRP_Multimedia_11_05.pdf (map)