1 1 2 3 4 for submission to the geomicrobiology section of applied
TRANSCRIPT
1
1
2
3
4
For submission to the Geomicrobiology section of Applied and Environmental Microbiology: 5
6
Bacterial communities associated with subsurface geochemical processes in continental serpentinite 7
springs 8
9
Running title: Subsurface serpentinite-associated bacteria 10
11
William J. Brazelton1#, Penny L. Morrill2, Natalie Szponar2, and Matthew O. Schrenk1 12
13
1Dept. of Biology, East Carolina University, Greenville, NC, USA 14
2Dept. of Earth Sciences, Memorial University of Newfoundland, St. John's, NL, Canada 15
16
# Corresponding author email: [email protected] 17
18
19
Copyright © 2013, American Society for Microbiology. All Rights Reserved.Appl. Environ. Microbiol. doi:10.1128/AEM.00330-13 AEM Accepts, published online ahead of print on 12 April 2013
on March 27, 2018 by guest
http://aem.asm
.org/D
ownloaded from
2
Abstract 20
Reactions associated with the geochemical process of serpentinization can generate copious quantities of 21
hydrogen and low molecular weight organic carbon compounds, which may provide energy and nutrients to 22
sustain subsurface microbial communities independent of the photosynthetically-supported surface biosphere. 23
Previous microbial ecology studies have tested this hypothesis in deep-sea hydrothermal vents such as the Lost 24
City hydrothermal field. This study applied similar methods, including molecular fingerprinting and tag 25
sequencing of the 16S rRNA gene, to ultra-basic continental springs emanating from serpentinizing ultramafic 26
rocks. These molecular surveys were linked with geochemical measurements of the fluids in an interdisciplinary 27
approach designed to distinguish potential subsurface organisms from those derived from surface habitats. The 28
betaproteobacterial genus Hydrogenophaga was identified as a likely inhabitant of transition zones where 29
hydrogen-enriched subsurface fluids mix with oxygenated surface water. The Firmicutes genus Erysipelothrix 30
was most strongly correlated with geochemical factors indicative of subsurface fluids and was identified as the 31
most likely inhabitant of a serpentinization-powered subsurface biosphere. Both of these taxa have been 32
identified in multiple hydrogen-enriched subsurface habitats worldwide, and the results of this study contribute 33
to an emerging biogeographic pattern in which Betaproteobacteria occur in near-surface mixing zones and 34
Firmicutes are present in deeper, anoxic subsurface habitats. 35
36
37
Introduction 38
Subsurface habitats are estimated to host a large proportion of Earth's biomass (1–3), but the diversity, activity, 39
and viability of subsurface organisms are largely unconstrained (4). Generalizations about subsurface habitats 40
are further complicated by their wide range of geological, physical, chemical, and biological characteristics. 41
Some subsurface habitats appear to host mostly dead or dormant organisms, while others provide sources of 42
energy and nutrients that could potentially support active subsurface communities (5–7). 43
44
One potential source of biologically available energy for subsurface organisms is serpentinization: the aqueous 45
on March 27, 2018 by guest
http://aem.asm
.org/D
ownloaded from
3
alteration of iron minerals (from olivine to serpentine) which results in the release of hydrogen gas (H2) and 46
organic carbon (particularly methane with lesser amounts of larger hydrocarbons; (8)). It occurs wherever 47
groundwater interacts with peridotite (iron-rich rocks formed in the mantle), including sites of active 48
serpentinization on all of the world’s continents and throughout much of the seafloor. Nevertheless, 49
microbiologists have only recently begun to investigate serpentinite habitats. 50
51
Because serpentinization represents a widespread and long-lasting subsurface source of geochemical energy and 52
organic carbon, it has the potential to support vigorously active, self-sufficient subsurface ecosystems that may 53
not require energy or nutrients from the photosynthetic surface biosphere. At the same time, serpentinization-54
associated processes create unusual and biologically challenging conditions (e.g. high pH, unavailable inorganic 55
carbon, few electron acceptors) that are likely to constrain the genetic and metabolic diversity of serpentinite-56
associated microbial communities. Initial studies of microbial communities at the Lost City hydrothermal field 57
are consistent with these hypotheses (9–12), but additional work is required to evaluate the global potential of 58
serpentinite-powered subsurface life. 59
60
Ultra-basic continental serpentinite springs offer a distinct and complementary test for the potential of 61
serpentinite-hosted ecosystems. Ultra-basic serpentinite springs exposed on land indicate the presence of 62
underlying geochemical (and potential biogeochemical) activity in the subsurface and have the advantage of 63
providing access to subsurface materials without need for drilling or other invasive or destructive sampling 64
methods. Consequently, serpentinite springs can serve as natural windows into the continental subsurface in the 65
same manner in which deep-sea hydrothermal vents are used as windows into the marine subsurface (13, 14). As 66
with deep-sea hydrothermal fluids, however, the interpretation of microbiological data from serpentinite springs 67
is complicated by the mixing of subsurface and surface fluids. The presence of genetic material in a serpentinite 68
spring does not constitute convincing evidence that the genetic material represents a subsurface organism that is 69
solely supported from serpentinization-associated reactions. An integrated biogeochemical approach designed to 70
distinguish subsurface and surface biogeochemical signals is required to identify bona fide subsurface 71
on March 27, 2018 by guest
http://aem.asm
.org/D
ownloaded from
4
organisms. 72
73
Herein we report on such a study of microbial communities associated with serpentinite springs of the 74
Tablelands Ophiolite, Newfoundland, Canada(15). Ultramafic rocks of the Tablelands Ophiolite (also known as 75
the Bay of Islands Ophiolite) were uplifted from the Iapetus Ocean and obducted onto the continental margin of 76
Laurentia approximately 485 million years ago. Serpentinization remains evident today in the form of highly 77
reducing, ultra-basic springs at several sites (15). This study examines the fluids discharging from these springs 78
for evidence that they contain microorganisms flushed from subsurface habitats where they were likely to have 79
been supported by the products of serpentinization-associated processes. Of the many taxa observed in the 80
springs, we identify one lineage of Firmicutes, most closely related to genus Erysipelothrix, as the most likely 81
inhabitant of the serpentinite subsurface. 82
83
Materials and Methods 84
Site Description 85
The Tablelands Ophiolite ultra-basic serpentinite springs are located within Gros Morne National Park, 86
Newfoundland, Canada (N49º27'59”, W57º57'29”).Five springs (Winter House Canyon 1 = WHC1; Winter 87
House Canyon 2 = WHC2; Winter House Canyon 75 = WHC75; Tablelands East = TLE, and Wallace Brook = 88
WB) and one 'background' surface freshwater site (Winter House Brook = WHB) were sampled for this study at 89
three time points: June 2010, August 2010, and June 2011 (abbreviated in tables and figures as 2010J, 2010A, 90
and 2011J). The WHC springs and WHB are located within ~10 m of each other. WHC75 is located ~75 m 91
south of the WHC springs and WHB. TLE and WB are 2 km and 6 km west, respectively, of the WHC springs 92
(see Szponar et al. (15) for a map and further descriptions). The WHC2 spring forms a shallow pool (~40 cm 93
deep and 126 cm wide) that includes three sampling sites (WHC2A, WHC2B, and WHC2C). WHC2A and 94
WHC2B exhibited the most extreme pH and Eh measurements at every time point and represent putative sources 95
of subsurface ultra-basic fluid. WHC2C receives surface runoff and therefore represents a likely mixing site 96
between subsurface and surface fluids. 97
on March 27, 2018 by guest
http://aem.asm
.org/D
ownloaded from

5
98
Aqueous geochemistry 99
The general aqueous geochemistry of the springs discharging from the Tablelands Ophiolite was described by 100
Szponar et al.(15). In short, ultra-basic (pH ≥11) and reducing groundwater springs (WHC1 and WHC2) 101
discharge from hydrated peridotite along the base of Winterhouse Canyon. Moderately basic (pH ~ 10.5) and 102
oxidizing springs (TLE and WB) were located on the east facing slope of the Tablelands Massif and Wallace 103
Brook. All of the spring waters are exposed to the atmosphere post discharge and may mix with overland flow. 104
The groundwater discharging from WHC1 could be isolated from overland flow and collected immediately upon 105
its discharge due to its higher elevation and very small pool size. Thus the water collected from WHC1 provided 106
the best available proxy for the ultra-basic reducing groundwater end-member. WHC1 consistently had the 107
highest pH (12.2 ±0.2), Cl-, Br-, and Ca2+ concentrations (479 ± 37 mg/L, 1.1 ± 0.06 mg/L, 144± 0.5 mg/L, 108
respectively) (15). Using a conservative mixing model, Szponar et al. were able to estimate the relative fraction 109
of ultra-basic groundwater (fUB) contributing to the water sample collected at each spring location. In short, the 110
aqueous concentrations of conservative tracers Cl- and Br- in each fluid sample were positively correlated (r2=1), 111
suggesting that within each pool there was conservative mixing between the two end-member waters (i.e. ultra-112
basic groundwater and surface water). The relative fraction of ultra-basic groundwater (fUB) at each sampling site 113
was calculated using a 2-component mixing model: 114
[Cl-]sample = fUB×[Cl-]UB + (1-fUB)×[Cl-]brook 115
where [Cl-]sample, [Cl-]UB, [Cl-]brook are the concentrations of chloride ions in the sampling locations of interest 116
(WHC2A, WHC2B, WHC2C, etc.), the ultra-basic groundwater end member (WHC1), and the brook end 117
member (WHB), respectively. The geochemistry suggests that the WHB surface water and WHC1 spring water 118
were the best proxies attainable to represent the surface water and ultra-basic groundwater, respectively. Since 119
WHB potentially receives a small amount of discharge from the ultra-basic springs, fUB represents the relative 120
mixing between the freshwater and ultra basic groundwater. This model can be used to predict the spring water 121
concentrations of geochemical parameters solely due to physical mixing between the two water sources. 122
Concentrations of geochemical parameters that are not well described by this model indicate that one or more 123
on March 27, 2018 by guest
http://aem.asm
.org/D
ownloaded from
6
processes, in addition to physical mixing (i.e. chemical, and/or biological reactions), are occurring and affecting 124
the parameter’s concentrations. 125
126
Fluid sample collection 127
Fluids were collected via sterile syringes or peristaltic pumping (Masterflex E/S portable sampler, Cole-Parmer, 128
Vernon Hills, IL) through cleaned and flushed Masterflex C-Flex tubing. Samples for DNA analyses were 129
filtered through 0.2 µm Sterivex (Millipore, Billerica, MA) filter cartridges inline with the peristaltic pumping 130
and therefore simultaneous to sample collection. When practical, replicate filters were collected sequentially 131
from the same site. At the WHC2 pool, chemical and biological measurements of collected samples were highly 132
sensitive to minor variations in the placement of the sampling intake due to strong chemical gradients between 133
the bottom and the top of the pool. Therefore, on-site readings of pH (IQ Scientific Instruments GLP series 134
IQ180G) and Eh (Oakton Testr10) were monitored before, during, and after sampling, and any changes were 135
recorded so that each subsample for chemical and biological analyses could be correlated to the appropriate 136
readings. Eh readings were corrected for the standard Ag/AgCl-electrode (200 mV). DNA extracted from the 137
August 2010 sample from WHC2B (i.e. WHC2B-2010A) and the June 2010 sample from TLE (i.e. TLE-2010J) 138
was previously used in metagenomic analyses published in (16). WHC1 was sampled for chemical 139
measurements, but collection of enough material for DNA analyses was not practical due to the extremely slow 140
discharge rate. 141
142
Fluids (50 mL per replicate sample; numbers of replicates noted in Table 1) were preserved in the field for cell 143
abundance enumeration at a final concentration of 3.7% formaldehyde and stored at 4ºC. In the laboratory, 144
preserved fluids (5 – 20 mL each) were filtered through a 0.2 µm filter, and DAPI-stained cells were counted 145
with an Olympus BX61 spinning disk epifluorescence confocal microscope according to previously published 146
protocols (17, 18). At least 30 fields containing between 10-30 cells/field were counted for each sample and used 147
to calculate the average cell concentrations. The error reported in Table 1 reflects the standard error of the mean 148
cell numbers for each sample. 149
on March 27, 2018 by guest
http://aem.asm
.org/D
ownloaded from
7
150
DNA Extraction 151
Sterivex filters were stored on wet ice in the field, frozen in liquid nitrogen as soon as possible (in many cases 152
immediately and in others a few hours later), transported on dry ice, and stored at -80ºC until DNA extraction, 153
which was conducted according to the protocol described in (19, 20). DNA extracts were purified with QiaAmp 154
(Qiagen, Hilden, Germany) columns according to the manufacturer's instructions for purification of genomic 155
DNA. 156
157
16S rRNA tag sequencing 158
Two separate datasets of 16S rRNA amplicon (tag) sequences were generated at two sequencing centers. 159
Pyrosequencing (Roche Titanium platform) of bacterial 16S rRNA amplicons was conducted on six of the 160
samples as part of the Census of Deep Life (CoDL), an initiative of the Deep Carbon Observatory 161
(dco.gl.ciw.edu) performed at the Marine Biological Laboratory (Woods Hole, MA). This method produces 162
~450 bp reads targeting the 16S rRNA V4-V6 regions (E. coli reference positions 518-1064). Additional CoDL 163
amplification and sequencing methods were published by (21) and are available at the VAMPS website: 164
http://vamps.mbl.edu/resources/primers.php. All sequences for these six samples are publicly available in the 165
VAMPS database (http://vamps.mbl.edu) under project code DCO_BRZ and in the NCBI SRA under project 166
accession number SRP019046. Amplification, sequencing, data processing, chimera detection, and taxonomic 167
classification procedures at the Josephine Bay Paul Center (Marine Biological Laboratory, Woods Hole, MA) 168
have been previously described (20, 22, 23). 169
170
Three samples, two of which were also included in the six CoDL samples, were sequenced by the DOE Joint 171
Genome Institute (JGI) with an Illumina MiSeq as described in (24). This method produces paired reads of ~250 172
bp each targeting the 16S rRNA V4 region (E. coli reference positions 533-786). After automated paired-end 173
assembly, quality filtering, and chimera detection by the JGI, reads were further screened with Btrim (25) to 174
remove all sequences less than 250 bp and to trim the remaining sequences so that their qual scores average ≥30 175
on March 27, 2018 by guest
http://aem.asm
.org/D
ownloaded from
8
over a 15 bp sliding window. These data are available in the NCBI SRA under project accession number 176
SRP######. 177
178
For alpha diversity analyses and taxonomic classification, the CoDL and JGI datasets were processed separately 179
but identically. In each case, sequences were aligned to a SILVA reference alignment (derived from 180
SSURefv102 obtained Nov 2012 from http://www.mothur.org/wiki/Silva_reference_files) as described in (26). 181
Taxonomic classification was performed in mothur with the SILVA taxonomy outline (27). Sequences were 182
clustered into operational taxonomic units (OTUs) at a 3% distance threshold with the cluster.split command 183
using the average neighbor method in mothur(28). Numbers of OTUs reported in Table 1 reflect subsampling all 184
CoDL and JGI datasets down to the size of the smallest dataset (6277 reads for CoDL; 6305 reads for JGI). Prior 185
to generating OTUs for beta diversity analyses (examining shared OTUs), all sequences from both datasets were 186
merged and trimmed to the region where the CoDL (V4-V6 regions) and JGI (V4 region) sequences overlap. 187
188
16S rRNA Phylogeny 189
Phylogenetic analyses were performed on the two most common CoDL tag sequences as an independent 190
measure of their taxonomic affiliation (in addition to the automated classification described above). Reference 191
sequences were obtained from the ribosomal database project (29). References and tag sequences were aligned 192
with the SINA web server (30). A maximum-likelihood reference phylogeny of full-length 16S rRNA 193
sequences (i.e. without CoDL tag sequences) was computed with RAxML(31). The short tag sequences were 194
then placed next to their most likely neighbor in the reference phylogeny using the evolutionary placement 195
algorithm (32) implemented in RAxML version 7.4.2. This approach to identifying the phylogenetic context of a 196
short sequence is more conservative than inferring a new phylogeny that treats the new short sequence on the 197
same basis as the previously published full-length sequences. 198
199
Molecular Fingerprinting via TRFLP 200
TRFLP (terminal restriction fragment length polymorphism) analysis utilized the same V4-V6 primers as used 201
on March 27, 2018 by guest
http://aem.asm
.org/D
ownloaded from

9
for the CoDL tag sequencing: 518F=CCAGCAGCYGCGGTAAN; 1046R=[6-202
FAM]CGACARCCATGCANCACCT. PCR amplification reactions for TRFLP were performed with 0.05 - 2ng 203
of template DNA, 0.25 μM of each primer, 0.2 mM of each dNTP, 1× GoTaq Reaction Buffer, and 1 U of 204
GoTaq DNA polymerase (Promega, Madison, WI). We empirically determined that 34 PCR cycles is optimal for 205
TRFLP because it increases detection of rare fragments without significantly altering the relative abundance of 206
common fragments (data not shown), and this is consistent with our previous work (33). At least 4 replicate 207
reactions for each sample were pooled and purified with QiaQuick (Qiagen, Hilden, Germany) columns. For 208
each sample, 100-200 ng of purified amplicons were digested separately with 5 U HaeIII, MspI, or RsaI (New 209
England Biolabs, Ipswich, MA) overnight at 37ºC. Digests were precipitated in ethanol with ammonium acetate 210
and resuspended in 5 μLformamide. Fragment sizing was performed with a 3130 Genetic Analyzer (Applied 211
Biosystems, Foster City, CA) ,BigDyeTerminator v3.1 chemistry, and the GeneScan 600 LIZ size standard at the 212
East Carolina University Genomics Core Facility. 213
214
GeneMapper (Applied Biosystems) was used to generate data files in ABI format of fragment sizes using the 215
minimal peak detection threshold (1 RFU), as recommended in the documentation for fragment clustering 216
software by Abdo et al. ((34). The scripts 'AutomaticProgR.pl' and 'FilteringandBinning.r' were downloaded 217
from the authors' website (http://www.ibest.uidaho.edu/tools/trflp_stats) and used to identify peaks from noise 218
and cluster peak sizes according to (34) with the only modification being that we analyzed peak height, not area. 219
After clustering, all peaks <60 bp were deleted from all samples because many fragments of this size appeared to 220
be PCR or digestion artifacts. We tested for correlation between the final number of terminal restriction fragment 221
clusters for each sample and the total peak height for each sample in order to assess whether variability in 222
loading and detection of DNA influenced the apparent fragment diversity, as recommended by (35). No 223
correlation was detected, and outliers were removed from analysis or repeated until data quality was comparable 224
to other samples. 225
226
Because the TRFLP data was generated with the same 16S rRNA primers as used for the CoDL tag sequences, 227
on March 27, 2018 by guest
http://aem.asm
.org/D
ownloaded from
10
we were able to assign taxonomy to fragment sizes by linking them with the CoDL sequences. If the predicted 228
fragment sizes of a CoDL sequence for each of the three restriction enzymes matched the corresponding 229
fragment sizes in the observed TRFLP data, then the taxonomic assignment for that CoDL tag sequence was 230
applied to the matching set of fragment sizes. Only two matching digests were required if the predicted fragment 231
size was outside the TRFLP analysis window (60-600 bp). Predicted and observed sizes often differed by 1-5 bp 232
due to inherent variability in the electrophoretic mobility of DNA fragments, but the difference was consistent 233
for each restriction enzyme in a matching set. 234
235
Statistical Calculations 236
The Sorensen index of community similarity was calculated in Primer 6 (Primer-E, http://www.primer-e.com) 237
for each pair of samples according to their shared presence/absence of TRFLP fragment clusters. Sorensen 238
similarities were calculated separately for each of the three restriction enzyme digests and then averaged. The 239
average Sorensen similarity for each pair of samples was imported into Primer 6 and subjected to the Cluster 240
function (36) to generate the final dendrogram of averaged community similarities. To obtain a measure of the 241
overall goodness of fit of the dendrogram, the cophenetic correlation was calculated between the similarity 242
values at which samples were clustered and the underlying similarity matrix. The significance of each similarity 243
cluster in the resulting dendrogram was tested with the SIMPROF (similarity profile) test within Primer 6, which 244
is a permutation test of the null hypothesis that a set of samples do not differ from each other in multivariate 245
structure (36). 246
247
Our network association analysis was based on that of (37), although our study did not attempt detection of time-248
lagged correlations by local similarity analysis, as in that study. Pairwise Pearson correlations were computed 249
with the 'rcor.test' function in the R package 'ltm' (38) from a matrix containing environmental data for each 250
sample and the relative abundance of each fragment cluster in each sample. To adjust for multiple tests, the false 251
discovery rate (q value) was also computed for the distribution of Pearson p values. Only those pairwise 252
correlations with p < 0.05 and q < 0.05 were included in subsequent analyses. Networks of significant 253
on March 27, 2018 by guest
http://aem.asm
.org/D
ownloaded from
11
correlations were visualized in Cytoscape v2.8.3 (39). 254
255
256
Results 257
Fluid Chemistry 258
Fluid chemistry data from Tablelands springs were previously reported in (15); this report includes data from 259
additional samples and provides time point-specific measurements. This study focuses on the fraction of ultra-260
basic end-member (fUB) as the most important variable for assessing the amount of mixing between subsurface 261
and surface fluids, as described by Szponar et al. (15). The extremely high pH (10.5 – 12.6) of the springs in this 262
study is consistent with active serpentinization, which is known to generate ultra-basic fluids. However, pH 263
values cannot be used to quantitatively determine the contribution of ultra-basic groundwater to each sampling 264
site as hydrogen ions are highly reactive and are not conservative tracers for mixing. Therefore, Szponar et al. 265
determined fUB values for each sample with a 2-component mixing model using chlorine as the conservative 266
tracer in which the surface freshwater stream WHB was defined as the freshwater end-member (fUB = 0) and 267
the spring WHC1 defined as the ultra-basic end-member (fUB = 1). Unfortunately, the extremely slow discharge 268
rate of WHC1 did not allow collection of sufficient material for DNA extraction. WHC2A consistently had the 269
highest fraction of ultra-basic water (fUB=0.80-1). WHC2B was the next-most ultra-basic (fUB = 0.53 – 0.75), 270
and samples from the mixing site WHC2C were moderately ultra-basic (fUB = 0.15 – 0.32). Samples from the 271
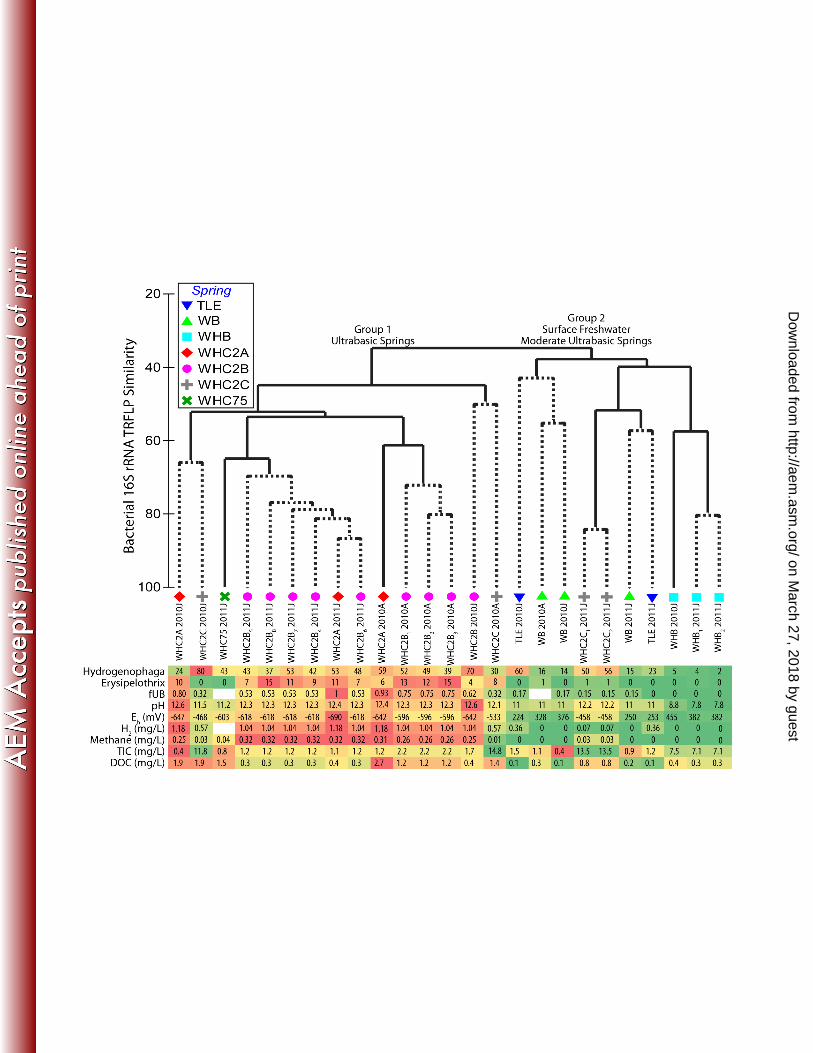
TLE and WB springs were much closer to the freshwater end-member (0 – 0.17), but it must also be noted that 272
they were not well represented by the mixing model (15). These springs are located 2-6 km from the other 273
sampling sites (i.e. WHC1, WHC2, and WHB), so they may represent mixing of ultra-basic and/or freshwater 274
end-members with slightly different chemistries compared to WHB and WHC1. 275
276
Chemical characteristics of each sample are provided in Table 1. As expected, water samples with high pH 277
values have the greatest fraction of ultra-basic water (fUB), but fUB more clearly distinguishes the high pH 278
springs from each other. A sample from TLE, for example, was pH 10.8 but had a fUB of 0, indicating that this 279
on March 27, 2018 by guest
http://aem.asm
.org/D
ownloaded from
12
fluid maintained its high pH despite little or no contribution from subsurface fluids. This result is consistent with 280
the lack of any detectable H2 or methane and with the measurement of highly oxidized reduction potentials (Eh = 281
253 mV) at this spring. In general, the samples with the highest fUB values also had the highest H2 and methane 282
concentrations. WHC2A-2011J (fUB = 1) had the most H2 (1.18 mg/L) and methane (0.32 mg/L), while the 283
mixing site WHC2C (fUB = 0.15 – 0.32) exhibited much lower values (H2 = 0.07 – 0.57 mg/L; methane = 0.01 – 284
0.03 mg/L). Reduction potential (Eh) also appeared to track fUB, with the most reducing (-642 to -690 mV) fluid 285
at WHC2A and somewhat less reducing (-468 to -533 mV) fluids in the mixing site WHC2C. 286
287
As expected, total inorganic carbon (TIC) and dissolved organic carbon (DOC) were not tightly linked with fUB 288
because these compounds are affected by additional processes (physical, biological, and chemical) other than 289
physical mixing of the two end-member waters. For example, total inorganic carbon (TIC) was approximately 1-290
2 mg/L for all springs except for WHC2C (11.8 – 14.8 mg/L) and the surface freshwater end-member WHB (7.1 291
– 7.5 mg/L). The carbon-13 isotopic signatures of TIC (Table 1) at WHC2C are intermediate between the 292
freshwater end-member (WHB) and the most ultrabasic springs (WHC2A and WHC2B), indicating that 293
WHC2C represents a mixing site between ultra-basic and freshwater end-members. Therefore, the high TIC 294
concentrations at WHC2C may indicate a stimulation of biological respiration and consequent production of 295
inorganic carbon. Concentrations of DOC are also relatively high at WHC2C compared to WHB, consistent with 296
the interpretation of stimulated biological production at this site. DOC measurements at WHC2A and WHC2B 297
are highly variable between time points, and these fluctuations do not seem to track other parameters. 298
299
Microbial Cell Abundance 300
The most ultra-basic springs contained the highest cell densities (up to 2.2 × 10⁵ cells mL-1) measured in this 301
study (Table 1). The 2011 samples (n = 17) from WHC2A, WHC2B, WHC2C, and WHC75 contained 302
significantly greater (p < 10-7, Student's t-test) cell densities than the 2011 freshwater end-member (WHB; 5.1 ± 303
1.3 × 10⁴ cells mL-1), suggesting that the ultra-basic fluids are stimulating microbial growth above background 304
levels. Interestingly, the moderate springs WB and TLE had significantly fewer cells than WHB (as few as 4 × 305
on March 27, 2018 by guest
http://aem.asm
.org/D
ownloaded from
13
103 cells mL-1). This result may reflect the biological challenges at the high pH of these moderate springs (pH 306
10.5 – 10.9) without the benefit of highly reducing compounds such as H2 and methane that are present in the 307
most ultra-basic and more densely-populated springs. 308
309
16S rRNA Diversity 310
Bacterial diversity was estimated by molecular fingerprinting (TRFLP: terminal restriction fragment length 311
polymorphism) and next-generation tag sequencing of the 16S rRNA gene. The freshwater end-member (WHB) 312
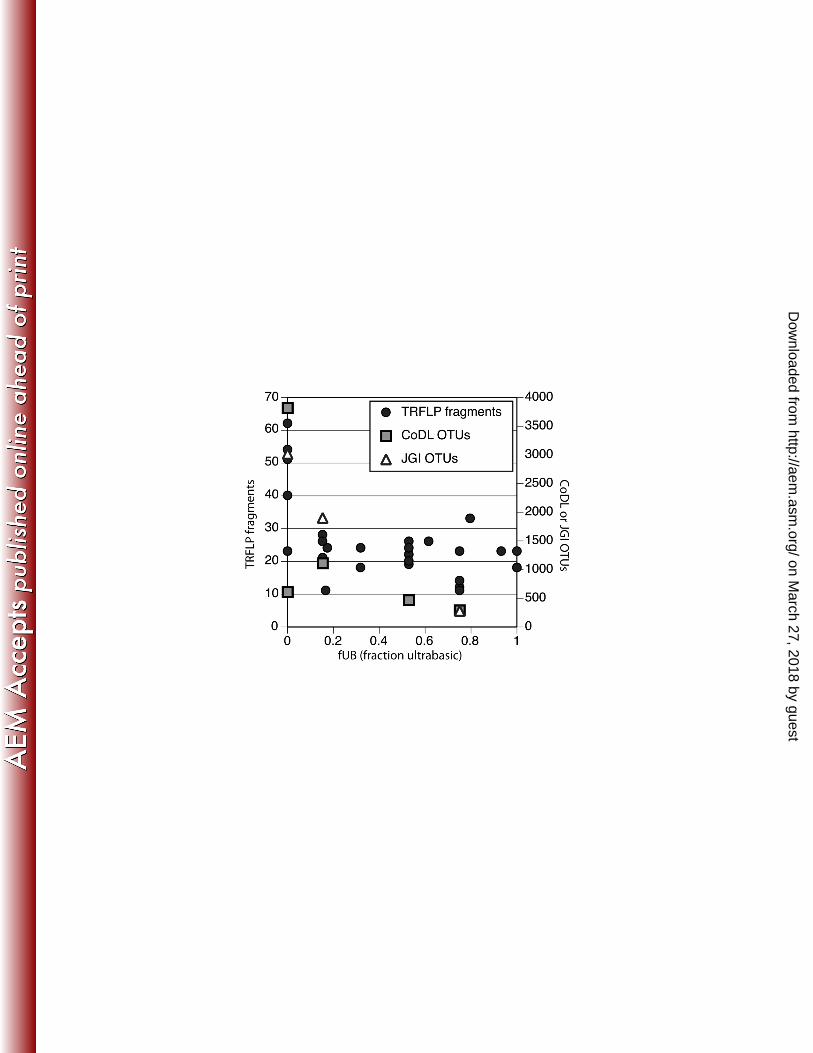
had more TRFLP fragment clusters than any of the ultra-basic springs (Table 1), but TRFLP did not resolve any 313
fUB-correlated differences among ultra-basic springs (Figure 1). Numbers of TRFLP fragment clusters is a 314
rough approximation of species-level diversity of the 16S rRNA gene. Numbers of 16S rRNA OTUs 315
(operational taxonomic units) generated by next-generation tag sequencing is a more robust and exhaustive 316
measure of species-level diversity, but these data are available for fewer samples. Both the CoDL (Census of 317
Deep Life) and JGI (Joint Genome Institute) tag sequence datasets are consistent with the TRFLP results 318
(Figure 1). The freshwater end-member WHB yielded the most OTUs, and the fluid sample in each dataset with 319
the highest (most ultra-basic) fUB value (WHC2B) had the fewest OTUs (Table 1). Rarefaction analysis of 320
these data also points to WHB as the most diverse and high-fUB samples as the least diverse (Figure S1). 321
322
Community Composition 323
Community compositions of the fluids (measured by the presence/absence of TRFLP fragment clusters) 324
generally reflect their geochemical characteristics. The community similarity dendrogram in Figure 2 illustrates 325
two main sample groupings: one group of the most ultra-basic springs (WHC2A and WHC2B) and another 326
group with the freshwater end-member (WHB) and moderately ultra-basic springs (TLE, WB). The cophenetic 327
correlation was 0.88, indicating a good fit between the dendrogram clusters and the underlying similarity values 328
between each sample. When replicate samples from the same site were available (indicated by subscripted 329
numbers in the sample labels of Figure 2), the replicates showed high similarity (70-84%) to each other and 330
supported the significance of the sample groupings. 331
on March 27, 2018 by guest
http://aem.asm
.org/D
ownloaded from
14
332
Exceptions and outliers to this overall pattern are also evident. The three samples from the mixing site WHC2C 333
are found in both main groups and exhibit little similarity to each other or to any of the other samples. Such high 334
variability in the bacterial community may reflect a highly variable mixing site. This variability, however, is not 335
reflected in the geochemical characteristics of this site: fUB, pH, Eh, methane, and TIC all appear to be 336
remarkably consistent over time at WHC2C (Table 1, Figure 2). Although the lower fUB of WHC2C-2011J 337
compared to that of WHC2C-2010A and WHC2C-2010J may partially explain its anomalous bacterial 338
community composition, the latter two samples have almost identical fUB values but very little similarity 339
between their bacterial communities. 340
341
The June 2010 samples from WHC2A and WHC2B also appear to have anomalous community compositions 342
compared to other samples from the same springs. The fUB, pH, Eh, H2, and methane values for these samples 343
were indistinguishable from other WHC2A and WHC2B samples, but their community compositions were most 344
similar to samples from the WHC2C mixing site (Figure 2). Therefore these sites may have experienced more 345
heterogeneity in their bacterial community compositions during the time of sampling than would be expected 346
from their geochemical characteristics. Furthermore, it is always possible that these differences reflect 347
environmental parameters that were not measured in this study. 348
349
Taxonomic Diversity 350
The TRFLP-based community composition data are further informed by taxonomic classification of 16S rRNA 351
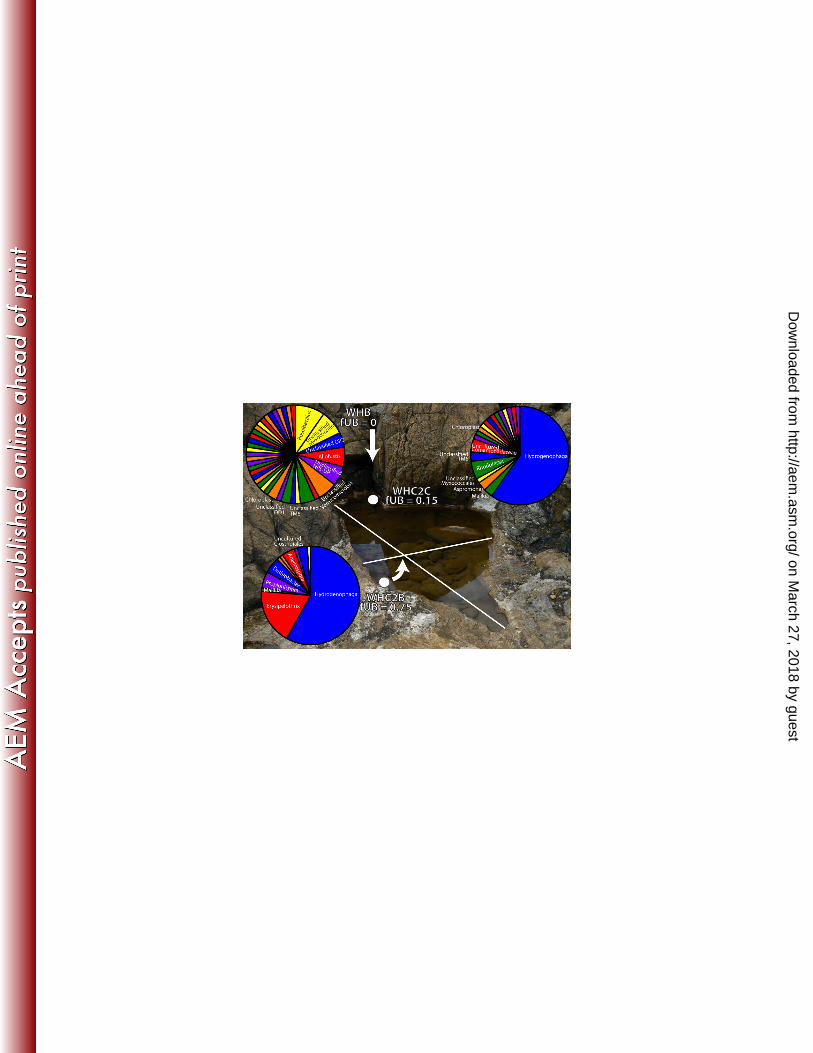
tag sequences from a few of the samples. The pie charts in Figure 3 display the proportion of tag sequences 352
assigned to each genus for three of the samples representing one example of an ultra-basic spring, the freshwater 353
end-member, and a mixing site. The most ultra-basic spring sample from which we were able to generate tag 354
sequences (WHC2B-2010A, fUB=0.75) was dominated by two genera: Hydrogenophaga (class 355
Betaproteobacteria, order Burkholderiales, family Comamonadaceae) and Erysipelothrix(class Erysipelotrichi, 356
order Erysipelotrichales, family Erysipelotrichaceae). Only 134 genera were assigned to the 19,930 sequences in 357
on March 27, 2018 by guest
http://aem.asm
.org/D
ownloaded from
15
WHC2B-2010, and 6 genera accounted for 89% of the sequences. 358
359
Hydrogenophaga also appeared relatively abundant in the mixing site (WHC2C-2011J), but sequences assigned 360
to genus Erysipelothrix comprised only 0.15% of this sample. Hydrogenophaga comprised only 0.09% of the 361
freshwater end-member WHB-2011J (pH = 7.8, fUB = 0), and Erysipelothrix was completely absent. WHB 362
exhibited much more evenness than the ultra-basic spring (Figure 3), and its most abundant taxa were nearly 363
completely absent in WHC2B-2010A. In the moderate spring WB-2011J (pH = 10.8, fUB = 0.15), 364
Hydrogenophaga represented 6% of all sequences, and Erysipelothrix was represented by a single sequencing 365
read (0.02% of the total). In another moderate spring, TLE-2011J (pH = 10.8, fUB = 0), Hydrogenophaga 366
represented 11% of total sequences, and Erysipelothrix was completely absent (Table S1 in supplemental 367
material). 368
369
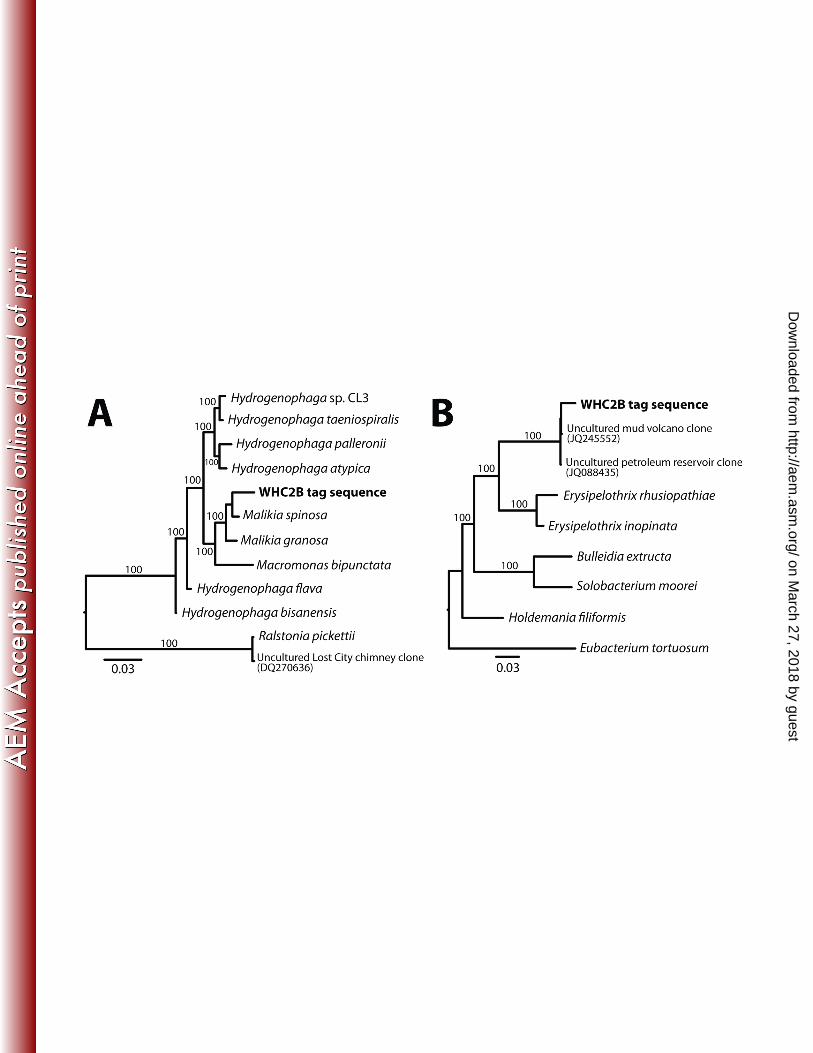
Bootstrap support for the automated classification of the most common Hydrogenophaga sequence was very 370
strong (97%). Independent phylogenetic analysis was consistent with this classification, although the closest 371
neighbors identified by evolutionary placement were members of the genus Malikia (Figure 4A). In our 372
phylogeny, however, this genus was not distinct from genus Hydrogenophaga. To our knowledge, Spring et al. 373
(40) have published the only phylogeny of Malikia, and those authors noted that Malikia formed a distinct 374
lineage only in phylogenetic reconstructions that included all known members of the Comamonadaceae family. 375
For convenience and clarity in this report, we will refer to these tag sequences as Hydrogenophaga. To our 376
knowledge, no characterized Hydrogenophaga or Malikia isolates are capable of growth above pH 9, but growth 377
of an uncharacterized Hydrogenophaga strain has been observed in pH 12 groundwater (41). 378
379
Classification of tag sequences as Erysipelothrix was very weak (<50%), and >60% bootstrap support was only 380
available for these sequences at the phylum level. Evolutionary placement of the most common Erysipelothrix 381
CoDL tag sequence onto a reference phylogeny indicated two environmental clones, one from a pH 8.4 mud 382
volcano (42) and one from a pH 8-9 oil well (43), as its closest neighbors (Figure 4B). The most similar 383
on March 27, 2018 by guest
http://aem.asm
.org/D
ownloaded from
16
cultivated isolates to these sequences belong to genus Erysipelothrix, so both automated taxonomic classification 384
and our phylogenetic analysis indicate this genus as the best taxonomic assignment for these tag sequences. It is 385
possible, however, that future work with these organisms may reveal that they form a novel genus. 386
387
In addition to comparing taxonomic assignments, we also directly examined the distribution of tag sequence 388
OTUs among samples independent of taxonomic classification. These results (Table S1 and Figure S2 in the 389
supplemental material) highlighted the composite nature of the mixing site (WHC2C-2011J), which shared 390
28% of its sequences with the most ultra-basic spring (WHC2B-2010A) and 15% of its sequences with the 391
freshwater end-member (WHB). In contrast, WHC2B-2010A shared very few OTUs with WHB-2011J. The 392
subset of sequences shared by all three samples (12 OTUs comprising 65%, 47%, and 1% of sequences in 393
WHC2B-2010A, WHC2C-2011J, and WHB-2011J, respectively) was surprisingly large, and this is due to the 394
dominance of Hydrogenophaga in the two ultra-basic samples and its minor representation in WHB-2011J. 395
396
The TRFLP and tag sequencing analyses employed in this study used Bacteria-specific primers, and neither 397
analysis was expected to detect Archaea. Attempts to amplify archaeal 16S rRNA genes have been unsuccessful 398
in our laboratory, and very few archaeal sequences were identified in the previously published metagenomic 399
study of Tablelands springs (16). 400
401
Biogeochemical correlations 402
We tested for Pearson correlations among geochemical factors and the distribution of individual bacterial types 403
as measured by the relative abundance of their corresponding TRFLP fragment clusters in each sample. The tag 404
sequence data was not informative for this correlation analysis due to the small number of samples for which 405
that data was available. The TRFLP data was available for more samples (and replicate samples), and the 406
relative abundance of the Hydrogenophaga and Erysipelothrix TRFLP fragment clusters were strongly 407
correlated to the relative abundance of the corresponding tag sequence OTUs in the same samples (Pearson r > 408
0.9, p < 0.002). Therefore, biogeochemical correlations were tested with relative abundances of TRFLP 409
on March 27, 2018 by guest
http://aem.asm
.org/D
ownloaded from

17
fragment clusters, consistent with the practice of other researchers with similar datasets (e.g. 37). 410
411
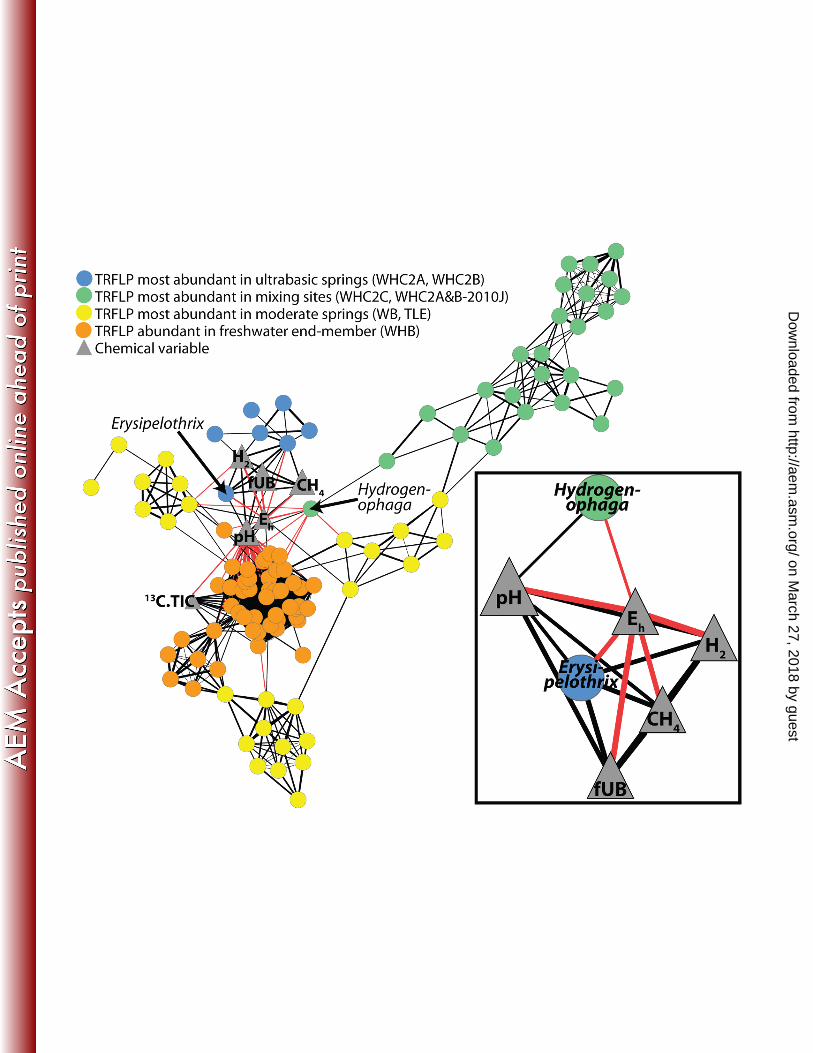
Statistically significant (p<0.05 and q<0.05) correlations are visualized as a network in Figure 5. By linking 412
predicted restriction fragment sizes of the tag sequences with the observed restriction fragment sizes in the 413
TRFLP profiles, we were able to assign taxonomy to many of the TRFLP fragment clusters, including those 414
corresponding to Hydrogenophaga and Erysipelothrix. 415
416
The overview of the network highlights co-occurrence patterns distinguishing the few ultra-basic-enriched 417
bacteria from those mostly present in mixing sites, moderate springs, or the freshwater end-member. 418
Interestingly, bacteria that were most abundant in the mixing sites or the moderate springs were not strongly 419
correlated with any of the geochemical variables. Most of these bacteria formed co-occurrence sub-networks that 420
are only indirectly linked to Eh and pH via their co-occurrence with Hydrogenophaga. 421
422
Interestingly, the fragment cluster corresponding to Erysipelothrix was the only one with significant correlations 423
to all of the geochemical variables expected to indicate subsurface fluid (Figure 5 inset): pH (r = 0.70, p = 424
0.005, q = 0.01); Eh (r = 0.81, p = 0.0004, q = 0.002); fUB (r = 0.83, p = 0.0002, q = 0.001); methane (r = 0.81, p 425
= 0.004, q = 0.002), and hydrogen (r = 0.78, p = 0.001, q = 0.004). Six additional fragment clusters were, strictly 426
speaking, most abundant in the ultra-basic springs, but even so, they were only present in very low abundance in 427
those samples. Corresponding tag sequences could not be identified for these rare fragment sizes, so taxonomic 428
assignments are not available. These results (Figure 5) provide further statistical support for the initial, 429
qualitative interpretation from the community composition data (Figures 2-3) that of all the taxa identified in 430
these samples, Erysipelothrix is most strongly linked to ultra-basic (and potentially subsurface) fluids. 431
432
Discussion 433
Serpentinite springs are potential windows into the subsurface biosphere that offer the advantages of convenient 434
sampling (e.g. no deep sea submersibles required) and pristine environmental conditions (e.g. no drilling 435
on March 27, 2018 by guest
http://aem.asm
.org/D
ownloaded from
18
required). Because photosynthetic processes at the Earth’s surface can swamp any signal from the subsurface 436
biosphere, it is necessary to tightly integrate microbiological and geochemical analyses and to carefully interpret 437
the presence of genetic material in the context of environmental measurements. Our analysis of the correlations 438
among eight geochemical variables, >5000 16S rRNA OTUs, and molecular fingerprinting (TRFLP) profiles of 439
17 serpentinite spring samples identified two main taxa as potentially important indicators of a serpentinization-440
influenced subsurface biosphere: Hydrogenophaga and Erysipelothrix. 441
442
The Hydrogenophaga 16S rRNA sequence that dominates the Tablelands ultra-basic springs matches that found 443
in previously published metagenomic data from the same site (16). The Hydrogenophaga-associated 444
metagenomic data include genes involved in carbon fixation via RuBisCO and in the aerobic oxidation of 445
hydrogen and carbon monoxide. Characterized Hydrogenophaga species are known to be facultatively 446
autotrophic; i.e. they oxidize hydrogen to power carbon fixation only when organic carbon is unavailable (44, 447
45). They are also aerobes or facultative anaerobes (45). 448
449
This prior knowledge is consistent with data from the present study that indicate a role for Hydrogenophaga in 450
oxic-anoxic transition zones in Tablelands springs. Their relative abundance is correlated with high pH and low 451
Eh (conditions which can be achieved in near-surface environments), but they are not correlated with indicators 452
of subsurface sources: H2, methane, or the fraction of ultra-basic water (fUB). Furthermore, they do not have 453
significant co-occurrence patterns with taxa that are enriched in the most ultra-basic springs, but they do co-454
occur with taxa that are most abundant in mixing sites, moderate springs, and the freshwater end-member 455
(Figure 5). In future studies, more quantitative analyses should be employed to estimate the absolute numbers of 456
Hydrogenophaga cells and their activities under various environmental conditions, but all currently available 457
information points to these organisms occupying transition zones where hydrogen-enriched, ultra-basic 458
subsurface fluids mix with oxygenated surface freshwater. Therefore, Hydrogenophaga in the Tablelands 459
springs appear to be surface indicators of underlying subsurface geochemical processes that produce hydrogen-460
enriched, ultra-basic fluids. 461
on March 27, 2018 by guest
http://aem.asm
.org/D
ownloaded from
19
462
In contrast to Hydrogenophaga, the Erysipelothrix sequences identified in the most ultra-basic Tablelands 463
springs are strongly correlated with all of the available geochemical factors that are indicative of ultra-basic, 464
anoxic subsurface fluids (Figure 5 inset). Previously published metagenomic data from this same site featured 465
many diverse hydrogenase-encoding sequences affiliated with Clostridia and Erysipelotrichi(16). The Clostridia 466
and Erysipelotrichi are sister classes within phylum Firmicutes, and the taxonomic binning and phylogenetic 467
analyses in the previous metagenomics study could not distinguish them. Therefore, many of the Clostridia-468
related metagenomics sequences in (16), including some of the hydrogenases, probably correspond to the 469
Erysipelothrix 16S rRNA sequences presented here. 470
471
The most common Erysipelothrix tag sequence is 98-99% similar over its length (450 bp) to environmental 472
sequences from a terrestrial mud volcano (42) and a terrestrial oil well (43) in China. Interestingly, both of these 473
studies of subsurface habitats also detected Hydrogenophaga. In the mud volcano study, Erysipelothrix was only 474
detected in sediments 23 cm below the surface of the bubbling pool, where it formed 1% of the clone library 475
(supplementary information in (42)). Hydrogenophaga, in contrast, was absent at 23 cm, but it was the second-476
most common taxon (11% of the clone library) in shallower sediments, 7 cm below the surface (Figure 4 in 477
(42)). These Hydrogenophaga clones are ~95% similar to the Hydrogenophaga tag sequence that dominates the 478
Tablelands springs. 479
480
Hydrogenophaga are also found within hydrogen-enriched deep boreholes in Finland (46) and South Africa 481
(47). Erysipelothrix-related sequences have also been detected in the Finland borehole, but Clostridia are much 482
more abundant in that environment. Clostridia also dominate deep fluids in the South Africa boreholes, where 483
Hydrogenophaga are also more common in shallower fluids (47). Therefore, Hydrogenophaga appear to be 484
cosmopolitan inhabitants of hydrogen-enriched shallow subsurface environments, supporting the interpretation 485
of this study that Hydrogenophaga are near-surface indicators of hydrogen-producing reactions in the underlying 486
subsurface. Furthermore, all of these hydrogen-enriched environments also feature abundant Clostridia and/or 487
on March 27, 2018 by guest
http://aem.asm
.org/D
ownloaded from
20
Erysipelotrichi in deeper, more anoxic zones than where Hydrogenophaga appear to thrive in the same locations. 488
489
Clostridia 16S rRNA sequences, including the same Desulfotomaculum genus that dominates deep borehole 490
fluids in South Africa (47), are also abundant in the best-characterized marine site of active serpentinization, the 491
Lost City hydrothermal field (33, 48). Hydrogenophaga appear to be absent in Lost City, but Ralstonia, a sister 492
genus within family Comamonadaceae, is present. Lost City chimneys also contain abundant hydrogenases that 493
are similar to those found in both Hydrogenophaga- and Clostridia/Erysipelothrix-related metagenomic 494
sequences from the Tablelands (16). Therefore, organisms related to the Comamonadaceae family and the 495
Clostridia/Erysipelotrichi classes appear to be cosmopolitan in hydrogen-enriched subsurface environments at 496
both marine and continental settings. 497
498
Although the in situ activities of Hydrogenophaga in these environments remain to be demonstrated 499
experimentally, all of the available data indicate that they are most likely aerobic (or facultatively anaerobic) 500
hydrogen-oxidizing chemolithoautotrophs. The biogeochemical roles of the Clostridia/Erysipelotrichi, however, 501
are less clear. The most common Clostridia in the South Africa deep boreholes are expected to be hydrogen-502
oxidizing sulfate-reducers (49), but the Tablelands metagenomic data does not support this interpretation for the 503
Erysipelothrix in Tablelands springs (16). Instead, the presence of many fermentation-associated hydrogenases 504
in that study suggested the possibility that these organisms could be utilizing organic compounds, and some of 505
these organic compounds may be generated de novo by subsurface serpentinization-associated reactions (8, 10, 506
50). 507
508
The interdisciplinary approach of the present study provides additional support for Erysipelothrix as a bona fide 509
denizen of the subsurface biosphere, but its physiology remains unclear. One possibility that should be addressed 510
in future studies is that Clostridia/Erysipelotrichi sequences dominate low-diversity fluids because of their 511
ability to tolerate extreme conditions (perhaps aided by spore formation) but not necessarily thrive in them. This 512
possibility is somewhat contradictory to the observation that the Erysipelothrix phylotype is most abundant in 513
on March 27, 2018 by guest
http://aem.asm
.org/D
ownloaded from
21
springs that have greater cell densities than found in surface waters (Table 1), suggesting that serpentinization-514
associated subsurface processes are indeed stimulating its growth. Of course, this hypothesis should be tested by 515
future studies exploring the physiology of these organisms. 516
517
All other bacteria detected in these springs are probably derived from the freshwater end-member or, like 518
Hydrogenophaga, inhabit transition zones where they may utilize serpentinization-associated products but are 519
dependent on surface sources of energy or nutrients. Identification of the few subsurface-associated organisms 520
from the many bacterial taxa detected in these springs required the biogeochemical correlation analyses made 521
possible by the integrated, interdisciplinary approach of this study. 522
523
In summary, this study contributes to the emerging biogeographic trend that organisms related to the 524
Comamonadaceae family co-occur with the Clostridia/Erysipelotrichi classes and that the hydrogen-oxidizing, 525
chemolithoautrophic Comamonadaceae inhabit shallower zones than inhabited by the most likely anaerobic 526
Clostridia/Erysipelotrichi. Further insight into the biogeochemical roles of these organisms will require careful 527
coordination and integration of a variety of biogeochemical measurements to distinguish subsurface signals from 528
the photosynthetic surface biosphere. Our application of this approach in the present study is intended to 529
demonstrate the advantages and challenges of applying this approach to natural, serpentinite springs. 530
531
Acknowledgements 532
We acknowledge tremendous support and teamwork in the field from Mark Wilson, Candice Ratley, Chris Earle, 533
Amanda Rietze, and Heidi Kavanagh. We also thank Katrina Twing for technical assistance and helpful 534
discussions. The CoDL data were made possible by the Deep Carbon Observatory’s Census of Deep Life 535
supported by the Alfred P. Sloan Foundation. Pyrosequencing was performed at the Marine Biological 536
Laboratory (Woods Hole, MA, USA), and we are grateful for the assistance of Mitch Sogin, Susan Huse, Joseph 537
Vineis, Andrew Voorhis, Sharon Grim, and Hilary Morrison at MBL. The JGI data were generated as part of the 538
DOE JGI Community Sequencing Program (CSP-671, supported by the Office of Science of the U.S. Department of 539
on March 27, 2018 by guest
http://aem.asm
.org/D
ownloaded from
22
Energy under Contract No. DE-AC02-05CH11231). 540
541
Funding was provided by the NASA Astrobiology Institute through the Carnegie Institution for Science (CAN-542
5) to MOS and a NASA Postdoctoral Fellowship to WJB. The geochemical component of this study was 543
supported in part by grants from the Canadian Space Agency (CSA) Canadian Analogue Research Network 544
(CARN) and CSA’s Field Investigations, Natural Sciences and Engineering Research Council (NSERC) 545
Discovery Grant awarded to PLM, and an NSERC Alexander Graham Bell Canada Graduate Scholarship 546
awarded to NS. 547
548
549
References 550
1. Whitman WB, Coleman DC, Wiebe WJ. 1998. Prokaryotes: the unseen majority. Proc. Natl. Acad. Sci. 551
U.S.A. 95:6578–6583. 552
2. Edwards KJ, Becker K, Colwell F. 2012. The deep, dark energy biosphere: intraterrestrial life on earth. 553
Annu. Rev. Earth Planet. Sci. 40:551–568. 554
3. Kallmeyer J, Pockalny R, Adhikari RR, Smith DC, D’Hondt S. 2012. Global distribution of microbial 555
abundance and biomass in subseafloor sediment.Proc. Natl. Acad. Sci. U.S.A. 109:16213–6. 556
4. Colwell FS, D'Hondt, S. 2013. Nature and extent of the deep biosphere. Rev. Mineral. Geochem. 75:547-557
574. 558
5. Edwards KJ, Fisher AT, Wheat CG. 2012. The deep subsurface biosphere in igneous ocean crust: frontier 559
habitats for microbiological exploration. Front. Microbiol. 3:8. doi:10.3389/fmicb.2012.00008. 560
6. Nealson KH, Inagaki F, Takai K. 2005. Hydrogen-driven subsurface lithoautotrophic microbial ecosystems 561
(SLiMEs): do they exist and why should we care? Trends Microbiol. 13:9. 562
doi:10.1016/j.tim.2005.07.010. 563
7. Orcutt BN, Sylvan JB, KnabNJ, Edwards KJ. 2011. Microbial ecology of the dark ocean above, at, and 564
on March 27, 2018 by guest
http://aem.asm
.org/D
ownloaded from
23
below the seafloor. Microbiol. Mol. Biol. Rev. 75:361–422. 565
8. Proskurowski G, Lilley MD, Seewald JS, Fruh-Green GL, Olson EJ, Lupton JE, Sylva SP, Kelley DS. 566
2008. Abiogenic hydrocarbon production at Lost City hydrothermal field. Science 319:604–607. 567
9. Brazelton WJ, Mehta MP, Kelley DS, Baross JA. 2011. Physiological differentiation within a single-568
species biofilm fueled by serpentinization. mBio2:4. doi:10.1128/mBio.00127-11. 569
10. Lang SQ, Früh-Green GL, Bernasconi SM, Lilley MD, Proskurowski G, Méhay S, Butterfield D a. 570
2012. Microbial utilization of abiogenic carbon and hydrogen in a serpentinite-hosted system.Geochim. 571
Cosmochim. Acta92:82–99. 572
11. Schrenk MO, Kelley DS, Bolton SA, Baross JA. 2004. Low archaeal diversity linked to subseafloor 573
geochemical processes at the Lost City Hydrothermal Field, Mid-Atlantic Ridge. Environ. Microbiol. 574
6:1086–1095. 575
12. Kelley DS, Karson JA, Fru GL, Yoerger DR, Shank TM, Butterfield DA, Hayes JM, Schrenk MO, 576
Olson EJ, Proskurowski G, Jakuba M, Bradley A, Larson B, Ludwig K, Glickson D, Buckman K, 577
Bradley AS, Brazelton WJ, Roe K, Bernasconi SM, Elend MJ, Lilley MD, Baross JA, Summons 578
RE, Sylva SP. 2005. A serpentinite-hosted ecosystem: the Lost City hydrothermal field. Science 579
307:1428–1434. 580
13. Deming JW, Baross JA. 1993. Deep-sea smokers: windows to a subsurface biosphere? Geochim. 581
Cosmochim. Acta57:3219–30. 582
14. Schrenk MO, Huber JA, Edwards KJ. 2010. Microbial provinces in the subseafloor. Annu. Rev. Mar. Sci. 583
2:279–304. 584
15. Szponar N, Brazelton WJ, Schrenk MO, Bower DM, Steele A, Morrill PL. In press. Geochemistry of a 585
continental site of serpentinization, the Tablelands Ophiolite, Gros Morne National Park: a Mars 586
analogue. Icarus. 587
16. Brazelton WJ, Nelson B, Schrenk MO. 2012. Metagenomic evidence for H2 oxidation and H2 production 588
on March 27, 2018 by guest
http://aem.asm
.org/D
ownloaded from
24
by serpentinite-hosted subsurface microbial communities. Front. Microbiol. 2:268. 589
doi:10.3389/fmicb.2011.00268. 590
17. Schrenk MO, Kelley DS, Delaney JR, Baross JA. 2003. Incidence and diversity of microorganisms within 591
the walls of an active deep-sea sulfide chimney. Appl. Environ. Microbiol. 69:3580–3592. 592
18. Hobbie JE, Daley RJ, Jasper S. 1977. Use of nuclepore filters for counting bacteria by fluorescence 593
microscopy. Appl. Environ. Microbiol. 33:1225. 594
19. Huber JA, Butterfield DA, Baross JA. 2002. Temporal changes in archaeal diversity and chemistry in a 595
mid-ocean ridge subseafloor habitat. Appl. Environ. Microbiol. 68:1585–1594. 596
20. Sogin ML, Morrison HG, Huber JA, Mark Welch D, Huse SM, Neal PR, Arrieta JM, Herndl GJ. 597
2006. Microbial diversity in the deep sea and the underexplored “rare biosphere”. Proc. Natl. Acad. Sci. 598
U.S.A. 103:12115–12120. 599
21. ThórMarteinsson V, Rúnarsson A, Stefánsson A, Thorsteinsson T, Jóhannesson T, Magnússon SH, 600
Reynisson E, Einarsson B, Wade N, Morrison HG, Gaidos E. 2012. Microbial communities in the 601
subglacial waters of the Vatnajökull ice cap, Iceland. ISME J. 7:427-437. 602
22. Huse SM, Dethlefsen L, Huber JA, Welch DM, Relman DA, Sogin ML. 2008. Exploring microbial 603
diversity and taxonomy using SSU rRNA hypervariable tag sequencing. PLoS Genet. 4:e1000255. 604
23. Huse SM, Welch DM, Morrison HG, Sogin ML. 2010. Ironing out the wrinkles in the rare biosphere 605
through improved OTU clustering. Environ. Microbiol. 12:1889–98. 606
24. Caporaso JG, Lauber CL, Walters WA, Berg-lyons D, Lozupone CA, Turnbaugh PJ, Fierer N, Knight 607
R. 2010. Global patterns of 16S rRNA diversity at a depth of millions of sequences per sample. Proc. 608
Natl. Acad. Sci. U.S.A. 108:4516-4522. 609
25. Kong Y. 2011. Btrim: a fast, lightweight adapter and quality trimming program for next-generation 610
sequencing technologies. Genomics. 98:152–3. 611
26. Schloss PD, Westcott SL. 2011. Assessing and improving methods used in operational taxonomic unit-612
on March 27, 2018 by guest
http://aem.asm
.org/D
ownloaded from
25
based approaches for 16S rRNA gene sequence analysis. Appl. Environ. Microbiol. 77:3219–26. 613
27. Pruesse E, Quast C, Knittel K, Fuchs BM, Ludwig W, Peplies J, Glöckner FO. 2007. SILVA: a 614
comprehensive online resource for quality checked and aligned ribosomal RNA sequence data 615
compatible with ARB. Nucleic Acids Res. 35:7188–96. 616
28. Schloss PD, Westcott SL, Ryabin T, Hall JR, Hartmann M, Hollister EB, Lesniewski RA, Oakley BB, 617
Parks DH, Robinson CJ, Sahl JW, Stres B, Thallinger GG, Horn DJ Van, Weber CF. 2009. 618
Introducing mothur: open-source, platform-independent, community-supported software for describing 619
and comparing microbial communities. Appl. Env. Microbiol. 75:7537–7541. 620
29. Cole JR, Wang Q, Cardenas E, Fish J, Chai B, Farris RJ, Kulam-Syed-Mohideen AS, McGarrell DM, 621
Marsh T, Garrity GM, Tiedje JM. 2009. The Ribosomal Database Project: improved alignments and 622
new tools for rRNA analysis. Nucleic Acids Res. 37:D141–5. 623
30. Pruesse E, Peplies J, Glöckner FO. 2012. SINA: accurate high-throughput multiple sequence alignment of 624
ribosomal RNA genes. Bioinformatics. 28:1823–9. 625
31. Stamatakis A. 2006. RAxML-VI-HPC: maximum likelihood-based phylogenetic analyses with thousands of 626
taxa and mixed models. Bioinformatics. 22:2688–90. 627
32. Berger SA, Krompass D, Stamatakis A. 2011. Performance, accuracy, and web server for evolutionary 628
placement of short sequence reads under maximum likelihood. Syst. Biol. 60:291–302. 629
33. Brazelton WJ, Schrenk MO, Kelley DS, Baross JA. 2006. Methane- and sulfur-metabolizing microbial 630
communities dominate the Lost City hydrothermal field ecosystem. Appl. Environ. Microbiol. 72:6257–631
6270. 632
34. Abdo Z, Schüette UME, Bent SJ, Williams CJ, Forney LJ, Joyce P. 2006. Statistical methods for 633
characterizing diversity of microbial communities by analysis of terminal restriction fragment length 634
polymorphisms of 16S rRNA genes. Environ. Microbiol. 8:929–938. 635
35. Osborne CA, Rees GN, Bernstein Y, Janssen PH. 2006. New threshold and confidence estimates for 636
on March 27, 2018 by guest
http://aem.asm
.org/D
ownloaded from

26
terminal restriction fragment length polymorphism analysis of complex bacterial communities. Appl. 637
Environ. Microbiol. 72:1270–1278. 638
36. Clarke KR. 1993. Non-parametric multivariate analyses of changes in community structure.Austral Ecol. 639
18:117–143. 640
37. Fuhrman J, Steele J. 2008. Community structure of marine bacterioplankton: patterns, networks, and 641
relationships to function. Aquat. Microb. Ecol. 53:69–81. 642
38. Rizopoulos D. 2006. ltm: an R package for latent variable modeling. J. Stat. Softw. 17:5. 643
39. Shannon P, Markiel A, Ozier O, Baliga NS, Wang JT, Ramage D, Amin N, Schwikowski B, Ideker T. 644
2003. Cytoscape: a software environment for integrated models of biomolecular interaction networks. 645
Genome Res. 13:2498–504. 646
40. Spring S, Wagner M, Schumann P, Kämpfer P. 2005. Malikiagranosa gen. nov., sp. nov., a novel 647
polyhydroxyalkanoate- and polyphosphate-accumulating bacterium isolated from activated sludge, and 648
reclassification of Pseudomonas spinosa as Malikiaspinosa comb. nov. Int. J. Syst. Evol. Microbiol. 649
55:621–9. 650
41. Roadcap GS, Sanford RA, Jin Q, Pardinas JR, Bethke CM. 2006. Extremely alkaline (pH >12) ground 651
water hosts diverse microbial community. Ground Water 44:511-517. 652
42. Cheng T-W, Chang Y-H, Tang S-L, Tseng C-H, Chiang P-W, Chang K-T, Sun C-H, Chen Y-G, Kuo 653
H-C, Wang C-H, Chu P-H, Song S-R, Wang P-L, Lin L-H. 2012. Metabolic stratification driven by 654
surface and subsurface interactions in a terrestrial mud volcano. ISME J. 6:2280–90. 655
43. Tang Y-Q, Li Y, Zhao J-Y, Chi C-Q, Huang L-X, Dong H-P, Wu X-L. 2012. Microbial communities in 656
long-term, water-flooded petroleum reservoirs with different in situ temperatures in the Huabei Oilfield, 657
China.PLoS One. 7:e33535. 658
44. Schwartz E, Voigt B, Zühlke D, Pohlmann A, Lenz O, Albrecht D, Schwarze A, Kohlmann Y, Krause 659
C, Hecker M, Friedrich B. 2009. A proteomic view of the facultativelychemolithoautotrophic lifestyle 660
on March 27, 2018 by guest
http://aem.asm
.org/D
ownloaded from
27
of Ralstoniaeutropha H16. Proteomics. 9:5132–42. 661
45. Willems a., Busse J, Goor M, Pot B, Falsen E, Jantzen E, Hoste B, Gillis M, Kersters K, Auling G, De 662
Ley J. 1989. Hydrogenophaga, a new genus of hydrogen-oxidizing bacteria that includes 663
Hydrogenophagaflava comb.nov. (formerlyPseudomonas flava), Hydrogenophagapalleronii (formerly 664
Pseudomonas palleronii), Hydrogenophagapseudoflava(formerly Pseudomonas pseudoflava and 665
“Pseudomonas carboxydoflava”), and Hydrogenophagataeniospiralis (formerly Pseudomonas 666
taeniospiralis). Int. J. Syst. Bacteriol. 39:319–333. 667
46. Itävaara M, Nyyssönen M, Kapanen A, Nousiainen A, Ahonen L, Kukkonen I. 2011. Characterization 668
of bacterial diversity to a depth of 1500 m in the Outokumpu deep borehole, Fennoscandian Shield. 669
FEMS Microbiol. Ecol. 77:295–309. 670
47. Moser DP, Gihring TM, Brockman FJ, Fredrickson JK, Balkwill DL, Dollhopf ME, Lollar BS, Pratt 671
LM, Boice E, Southam G, Wanger G, Baker BJ, Pfiffner SM, Lin L, Onstott TC. 2005. 672
Desulfotomaculum and Methanobacterium spp. dominate a 4- to 5-kilometer-deep fault. Appl. Environ. 673
Microbiol. 71:8773–8783. 674
48. Brazelton WJ, Ludwig KA, Sogin ML, Andreishcheva EN, Kelley DS, Shen C-C, Edwards RL,Baross 675
JA. 2010. Archaea and bacteria with surprising microdiversity show shifts in dominance over 1000-year 676
time scales in hydrothermal chimneys. Proc. Nat. Acad. Sci. U.S.A. 107:1612–1617. 677
49. Chivian D, Brodie EL, Alm EJ, Culley DE, Dehal PS, DeSantisTZ, Gihring TM, Lapidus A, Lin L-H, 678
Lowry SR, Moser DP, Richardson PM, Southam G, Wanger G, Pratt LM, Andersen GL, Hazen 679
TC, Brockman FJ, Arkin AP, Onstott TC. 2008. Environmental genomics reveals a single-species 680
ecosystem deep within Earth. Science. 322:275–8. 681
50. Schrenk MO, Brazelton WJ, Lang SQ. 2013. Serpentinization, carbon and deep life.Rev. Mineral. 682
Geochem. 75:575-606. 683
684
on March 27, 2018 by guest
http://aem.asm
.org/D
ownloaded from
28
Figure captions 685
Table 1. Biogeochemical characteristics of each sample collected from Tablelands serpentinite springs and 686
surface freshwater (WHB). 687
688
Figure 1. Bacterial diversity of Tablelands serpentinite springs decreases with greater fractions of ultra-basic 689
water (fUB). The freshwater end-member (fUB = 0) has the highest number of TRFLP (terminal restriction 690
fragment length polymorphism) fragment clusters and operational taxonomic units (OTUs) produced by the 691
Census of Deep Life (CoDL) and Joint Genome Institute (JGI) tag sequencing projects. The most ultra-basic 692
spring for which tag sequences were available yielded the fewest OTUs. 693
694
Figure 2. The dendrogram illustrates bacterial community similarity (as measured by the presence/absence of 695
TRFLP fragment clusters) among samples collected from Tablelands serpentinite springs and surface freshwater. 696
Dotted lines represent samples that could not be distinguished by a SIMPROF test. Subscripted numbers indicate 697
replicate samples from the same spring. The abundance of Hydrogenophaga and Erysipelothrix in the 698
underlying table reflect the percent relative abundance of the corresponding TRFLP fragment cluster in each 699
sample. Color-coding of the table is an arbitrary visual aid to identify the highest and lowest numbers for each 700
variable. Sample names and associated geochemical characteristics correspond to Table 1. 701
702
Figure 3. Proportions of each genus in representative samples of an ultra-basic spring (WHC2B), a mixing site 703
(WHC2C), and surface freshwater (WHB).White dots indicate sampling locations for WHC2B and WHC2C. 704
The sampling location for WHB is located approximately 10 m upstream from the pool depicted in this 705
photograph. Arrows indicate subsurface fluid exiting from WHC2B and surface freshwater entering the pool at 706
WHC2C from upstream. The white lines indicate the width (~1 m) and length (~3 m) of the pool. Results in this 707
figure are derived from JGI 16S rRNA tag sequencing. A full taxonomic summary is provided in Table S1 in the 708
supplemental material. 709
710
on March 27, 2018 by guest
http://aem.asm
.org/D
ownloaded from
29
Figure 4. Maximum-likelihood phylogenetic trees of A) Hydrogenophaga- and B) Erysipelothrix-related 16S 711
rRNA sequences. For each tree, the representative tag sequence was placed next to its most likely neighbor in 712
the reference phylogeny of nearly full-length sequences using the evolutionary placement algorithm (32). Each 713
tree represents the best topology after 20 maximum-likelihood references, and all nodes in the reference 714
phylogeny received 100% bootstrap support. 715
716
Figure 5. Association network of the relative abundance of TRFLP fragment clusters and geochemical variables. 717
Each circle is a TRFLP fragment cluster, and its color corresponds to the type of sample in which its relative 718
abundance was greatest (see figure legend). Positive correlations are black lines; negative correlations are red 719
lines; and the width of each line is proportional to the r value. All correlations with p < 0.05 and q < 0.05 are 720
shown. The inset shows geochemical correlations only for Hydrogenophaga and Erysipelothrix, which were 721
identified by linking observed TRFLP fragment sizes to predicted restriction sizes of tag sequences. For clarity, 722
taxonomic assignments for other TRFLP fragment clusters are not shown. The six blue circles other than 723
Erysipelothrix represent unidentified TRFLP fragment clusters, which do not constitute more than 3% of the 724
total TRFLP signal in any sample. 725 on March 27, 2018 by guest
http://aem.asm
.org/D
ownloaded from
1
Figure captions 1
Table 1. Biogeochemical characteristics of each sample collected from Tablelands serpentinite springs and 2
surface freshwater (WHB). 3
4
Figure 1. Bacterial diversity of Tablelands serpentinite springs decreases with greater fractions of ultra-basic 5
water (fUB). The freshwater end-member (fUB = 0) has the highest number of TRFLP (terminal restriction 6
fragment length polymorphism) fragment clusters and operational taxonomic units (OTUs) produced by the 7
Census of Deep Life (CoDL) and Joint Genome Institute (JGI) tag sequencing projects. The most ultra-basic 8
spring for which tag sequences were available yielded the fewest OTUs. 9
10
Figure 2. The dendrogram illustrates bacterial community similarity (as measured by the presence/absence of 11
TRFLP fragment clusters) among samples collected from Tablelands serpentinite springs and surface freshwater. 12
Dotted lines represent samples that could not be distinguished by a SIMPROF test. Subscripted numbers indicate 13
replicate samples from the same spring. The abundance of Hydrogenophaga and Erysipelothrix in the underlying 14
table reflect the percent relative abundance of the corresponding TRFLP fragment cluster in each sample. Color-15
coding of the table is an arbitrary visual aid to identify the highest and lowest numbers for each variable. Sample 16
names and associated geochemical characteristics correspond to Table 1. 17
18
Figure 3. Proportions of each genus in representative samples of an ultra-basic spring (WHC2B), a mixing site 19
(WHC2C), and surface freshwater (WHB).White dots indicate sampling locations for WHC2B and WHC2C. 20
The sampling location for WHB is located approximately 10 m upstream from the pool depicted in this 21
photograph. Arrows indicate subsurface fluid exiting from WHC2B and surface freshwater entering the pool at 22
WHC2C from upstream. The white lines indicate the width (~1 m) and length (~3 m) of the pool. Results in this 23
figure are derived from JGI 16S rRNA tag sequencing. A full taxonomic summary is provided in Table S1 in the 24
supplemental material. 25
26
on March 27, 2018 by guest
http://aem.asm
.org/D
ownloaded from
2
Figure 4. Maximum-likelihood phylogenetic trees of A) Hydrogenophaga- and B) Erysipelothrix-related 16S 27
rRNA sequences. For each tree, the representative tag sequence was placed next to its most likely neighbor in the 28
reference phylogeny of nearly full-length sequences using the evolutionary placement algorithm (32). Each tree 29
represents the best topology after 20 maximum-likelihood references, and all nodes in the reference phylogeny 30
received 100% bootstrap support. 31
32
Figure 5. Association network of the relative abundance of TRFLP fragment clusters and geochemical variables. 33
Each circle is a TRFLP fragment cluster, and its color corresponds to the type of sample in which its relative 34
abundance was greatest (see figure legend). Positive correlations are black lines; negative correlations are red 35
lines; and the width of each line is proportional to the r value. All correlations with p < 0.05 and q < 0.05 are 36
shown. The inset shows geochemical correlations only for Hydrogenophaga and Erysipelothrix, which were 37
identified by linking observed TRFLP fragment sizes to predicted restriction sizes of tag sequences. For clarity, 38
taxonomic assignments for other TRFLP fragment clusters are not shown. The six blue circles other than 39
Erysipelothrix represent unidentified TRFLP fragment clusters, which do not constitute more than 3% of the 40
total TRFLP signal in any sample. 41
42
on March 27, 2018 by guest
http://aem.asm
.org/D
ownloaded from
Spring Date fUB pH Eh
(mV) H2
(mg/L) CH4
(mg/L) TIC
(mg/L)
13C-TIC (per mil)
DOC (mg/L)
Cells (x 104 mL-1) TRFLP
fragments CoDL OTUs
JGI OTUs
WB 2010J 0.173 10.5 376 0 0 0.42 nd 0.1 0.4 ± 0.06 (n=2) 24 nd nd
WB 2010A nd 10.91 328 0 0 1.07 -16.5 0.32 2.2 30 nd nd
WB 2011J 0.153 10.76 250 0 0 0.9 -20.7 0.15 1.3 ± 0.2 (n=2) 21 1108 nd
TLE 2010J 0.166 10.5 224 nd 0 1.49 -10 0.06 1.3 ± 0.4 (n=5) 11 nd nd
TLE 2011J 0.000 10.81 253 nd 0 1.2 -15.5 0.12 2.4 ± 1.1 (n=3) 23 606 nd
WHB 2010J 0.000 8.77 455 0 0 7.47 -1.1 0.44 nd 40 nd nd
WHB 2011J 0.000 7.82 382 0 0 7.1 -2.1 0.3 5.1 ± 1.3 (n=4) 62 3816 3017
WHC2A 2010J 0.796 12.57 -647 0.75 0.25 0.39 nd 1.93 5.3 33 nd nd
WHC2A 2010A 0.931 12.4 -642 0.69 0.31 1.17 -19.2 2.67 8.3 ± 0.8 (n=4) 23 nd nd
WHC2A 2011J 1.000 12.36 -690 1.18 0.32 1.1 -14.7 0.35 17.6 ± 4.5 (n=4) 23 nd nd
WHC2B 2010J 0.615 12.63 -642 0.73 0.25 1.73 -13 0.44 17.4 ± 1.7 (n=3) 26 nd nd
WHC2B 2010A 0.750 12.31 -596 0.47 0.26 2.16 -17.3 1.15 8.0 ± 1.1 (n=3) 12 287 279
WHC2B 2011J 0.529 12.28 -618 1.04 0.32 1.2 -17.6 0.29 22.1 ± 3.6 (n=7) 22 464 nd
WHC2C 2010J 0.318 11.5 -468 0.57 0.03 11.75 -11.5 1.93 5.6 ± 3.8 (n=2) 18 nd nd
WHC2C 2010A 0.319 12.06 -533 nd 0.01 14.78 -12.6 1.37 40.2 24 nd nd
WHC2C 2011J 0.153 12.21 -458 0.07 0.03 13.5 -11.8 0.84 18.7 ± 1.5 (n=3) 28 nd 1899
WHC75 2011J nd 11.2 -603 0.32 0.04 0.76 -11.7 1.54 7.3 ± 0.5 (n=3) 25 815 nd
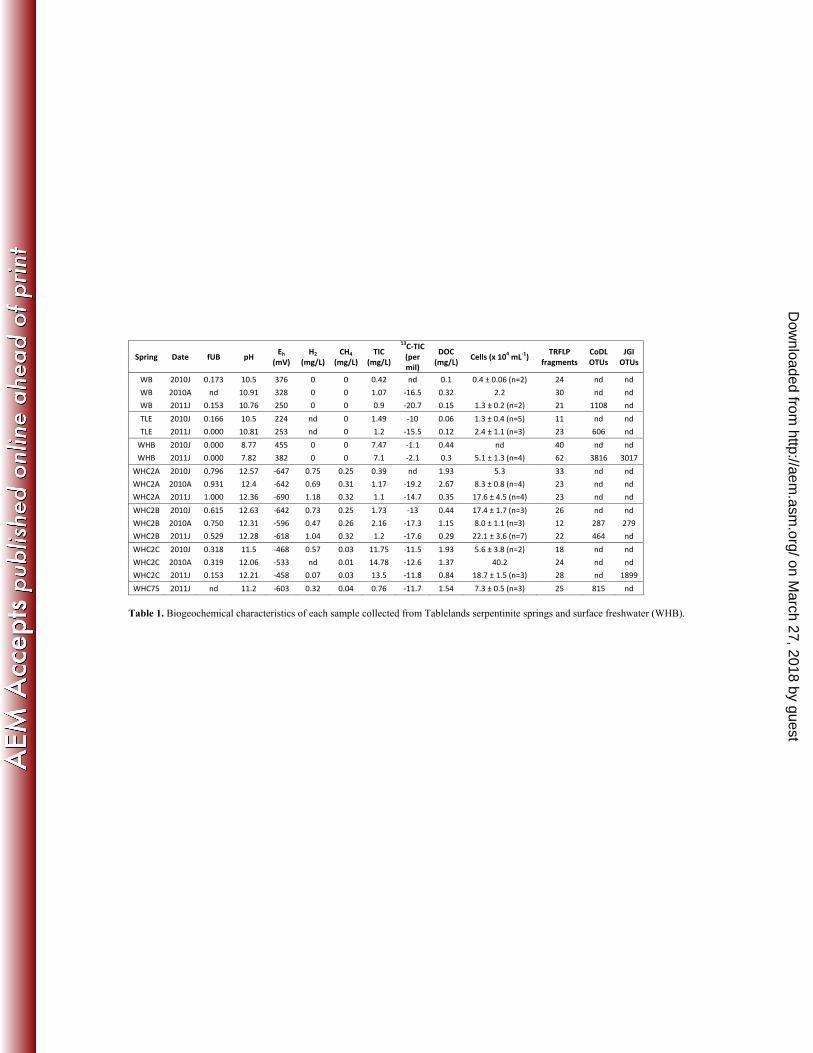
Table 1. Biogeochemical characteristics of each sample collected from Tablelands serpentinite springs and surface freshwater (WHB).
on March 27, 2018 by guest
http://aem.asm
.org/D
ownloaded from